The Volvo Group 2006 By creating value for our customers ...
170
The Volvo Group 2006 By creating value for our customers, we create value for our shareholders
-
Upload
khangminh22 -
Category
Documents
-
view
0 -
download
0
Transcript of The Volvo Group 2006 By creating value for our customers ...

The V
olvo
Gro
up 2
00
6w
ww
.volvo.com
The Volvo Group 2006
By creating value for our customers, we create value for our shareholders
A global group 2 Organization 4 Volvo in society 6 Vision, mission and values 8 Market overview 10 CEO comment 12 Our customers’ needs govern our strategy… 13 1. Profitable growth 14 2. Innovation and product development 15 3. Highest quality in implementation 16 Financial strategy 18 Leading supplier of commercial transport solutions 20 Volvo 3P – Development and synergies 24 Volvo Powertrain - Uniform power 28 Long-term strategy in Asia 30 The share
Sustainable development 32 Introduction 35 Environmental responsibility 40 Social responsibility
Board of Directors’ Report 46 Significant events 50 Financial performance 52 Financial position 54 Cash-flow statement 56 Risk management 59 Business areas 60 Mack Trucks 62 Renault Trucks 64 Volvo Trucks 66 Trucks 68 Buses 70 Construction Equipment 72 Volvo Penta 74 Volvo Aero 76 Financial Services
Corporate Governance Report 78 Report 82 Group Management 84 Board of Directors and auditors
Financial information 87 Income statements 88 Balance sheets 89 Changes in shareholders’ equity 90 Cash-flow statements 91 Notes to the consolidated financial statements 138 Parent Company AB Volvo 152 Proposed disposition of unappropriated earnings 153 Audit Report for AB Volvo 154 Eleven-year summary 162 Customer offering Flap Definitions Annual General Meeting
This report contains “forward-looking statements.” Such statements reflect management’s current expectations with respect to certain future events and potential financial performance. Although the Company believes that the expectations reflected in such forward looking statements are reasonable, no assurance can be given that such expectations will prove to have been correct. Such statements are subject to risk and uncertainties and such future events and financial performance could differ materially from those set out in the forward looking statements as a result of, among other factors, (i) changes in economic, market and competitive conditions, (ii) success of business and operating initiatives, (iii) changes in the regulatory environment and other government actions, (iv) fluctuations in exchange rates and (v) business risk management.
This report does not imply that the company has undertaken to revise these forward-looking statements, beyond what is required under the company’s registration contract with the Stockholm Stock Exchange if and when circumstances arise that will lead to changes compared to the date when these statements were provided.
The Volvo Group’s formal financial reports are presented on pages 46-77 and 86-152 in the printed version and has been audited by the company’s auditors.
The Volvo Group is one of the leading suppliers of commercial
transport solutions providing products such as trucks,
buses, construction equipment, drive systems for marine
and industrial applications as well as aircraft engine compo-
nents. The Volvo Group also offers its customers
fi nancial services.
The Group has about 83,000 employees, production facilities
in 18 countries, and sales activities in some 180 countries.
During 2006 Volvo Group sales rose 7% to SEK 248 billion,
with earnings per share advancing 25% to SEK 40.20. The
share is listed on the Stockholm Stock Exchange and on
NASDAQ in the US.
Information about IFRS
As of January 1, 2005, AB Volvo complies with International Financial Reporting Standards (IFRS),
previously known as IAS, as adopted by the European Union. Figures for the corresponding peri-
ods in 2004 have been restated according to IFRS. In the financial information on pages 1 to 77
Volvo Financial Services is reported in accordance with the equity method. Reporting in accor-
dance with IAS 1 begins with Financial information on page 86.

North America South America Europe Asia Rest of world
Net sales, SEK M 73,657 12,533 129,613 19,610 12,722 Percentage of the Volvo Group’s sales, % 30 5 52 8 5
Production facilities ■ Mack Trucks Macungie, New River Valley (US) Las Tejerias (VE) Brisbane (AU) ■ Renault Trucks Blainville, Bourg-en-Bresse, Limoges (FR), Villaverde (ES) ■ Volvo Trucks New River Valley (US) Curitiba (BR) Göteborg, Umeå (SE), Gent (BE) Bangalore (IN), Jinan* (CN) Durban (ZA), Brisbane (AU) ■ Buses St Claire, St Eustache (CA), Mexico City (MX) Curitiba (BR) Borås, Säffle, Uddevalla (SE), Tammerfors, Åbo (FI), Wroclaw (PL) Bangalore (IN), Shanghai*, Xian* (CN) Durban (ZA) ■ Construction Equipment Asheville (US), Goderich (CA) Pederneiras (BR) Arvika, Braås, Eskilstuna, Hallsberg (SE), Konz-Könen (DE), Belley (FR), Wroclaw (PL) Changwon (KR), Shanghai (CN), Linyi* (CN) ■ Volvo Penta Lexington (US) Göteborg, Vara (SE) Wuxi* (CN) ■ Volvo Aero Boca Raton, Newington (US) Bromma, Trollhättan (SE), Kongsberg (NO) ■ Volvo Powertrain Hagerstown (US) Curitiba (BR) Köping, Skövde (SE), Vénissieux (FR)
North America South America Europe Asia Rest of world
Net sales, SEK M 73,657 12,533 129,613 19,610 12,722 Percentage of the Volvo Group’s sales, % 30 5 52 8 5
Mack Trucks Macungie, New River Valley (US) Las Tejerias (VE) Brisbane (AU) Renault Trucks Blainville, Bourg-en-Bresse, Limoges (FR), Villaverde (ES)
A global group
* Ownership ≥ 50%
Volvo Group customers are active in more than
180 countries worldwide, mainly in Europe and
North America as well as to a considerable
extent in Asia. Group sales of products and
services are conducted through wholly owned
and independent dealers. The global service
network handles customer demand for spare
parts and other services.
During 2006, the Group’s workforce rose to
83,187 employees in 58 countries. The majority
of employees are based in Sweden, France and
the US.
A key feature of the Volvo Group’s growth
strategy is to increase its presence in emerging
markets, primarily in Asia and Eastern Europe.
During 2006, the Group increased its sales in
Eastern Europe by 41%. Volvo implemented
investments in Asia during 2006 in Japan and
China. These provided a platform for increased
sales and in the long term are expected to con-
tribute to the Group’s growth target.
2006 73.7 SEK bn
2000 38.2 SEK bn
2006 129.6 SEK bn
2000 66.3 SEK bn
2006 19.6 SEK bn
2000 8.7 SEK bn
2006 12.7 SEK bn
2000 3.4 SEK bn
2006 12.5 SEK bn
2000 4.7 SEK bn
Net sales 2006
Net sales 2000

North America South America Europe Asia Rest of world
Net sales, SEK M 73,657 12,533 129,613 19,610 12,722 Percentage of the Volvo Group’s sales, % 30 5 52 8 5
Production facilities ■ Mack Trucks Macungie, New River Valley (US) Las Tejerias (VE) Brisbane (AU) ■ Renault Trucks Blainville, Bourg-en-Bresse, Limoges (FR), Villaverde (ES) ■ Volvo Trucks New River Valley (US) Curitiba (BR) Göteborg, Umeå (SE), Gent (BE) Bangalore (IN), Jinan* (CN) Durban (ZA), Brisbane (AU) ■ Buses St Claire, St Eustache (CA), Mexico City (MX) Curitiba (BR) Borås, Säffle, Uddevalla (SE), Tammerfors, Åbo (FI), Wroclaw (PL) Bangalore (IN), Shanghai*, Xian* (CN) Durban (ZA) ■ Construction Equipment Asheville (US), Goderich (CA) Pederneiras (BR) Arvika, Braås, Eskilstuna, Hallsberg (SE), Konz-Könen (DE), Belley (FR), Wroclaw (PL) Changwon (KR), Shanghai (CN), Linyi* (CN) ■ Volvo Penta Lexington (US) Göteborg, Vara (SE) Wuxi* (CN) ■ Volvo Aero Boca Raton, Newington (US) Bromma, Trollhättan (SE), Kongsberg (NO) ■ Volvo Powertrain Hagerstown (US) Curitiba (BR) Köping, Skövde (SE), Vénissieux (FR)
North America South America Europe Asia Rest of world
Net sales, SEK M 73,657 12,533 129,613 19,610 12,722 Percentage of the Volvo Group’s sales, % 30 5 52 8 5
Mack Trucks Macungie, New River Valley (US) Las Tejerias (VE) Brisbane (AU) Renault Trucks Blainville, Bourg-en-Bresse, Limoges (FR), Villaverde (ES)
A global group
* Ownership ≥ 50%
Volvo Group customers are active in more than
180 countries worldwide, mainly in Europe and
North America as well as to a considerable
extent in Asia. Group sales of products and
services are conducted through wholly owned
and independent dealers. The global service
network handles customer demand for spare
parts and other services.
During 2006, the Group’s workforce rose to
83,187 employees in 58 countries. The majority
of employees are based in Sweden, France and
the US.
A key feature of the Volvo Group’s growth
strategy is to increase its presence in emerging
markets, primarily in Asia and Eastern Europe.
During 2006, the Group increased its sales in
Eastern Europe by 41%. Volvo implemented
investments in Asia during 2006 in Japan and
China. These provided a platform for increased
sales and in the long term are expected to con-
tribute to the Group’s growth target.
2006 73.7 SEK bn
2000 38.2 SEK bn
2006 129.6 SEK bn
2000 66.3 SEK bn
2006 19.6 SEK bn
2000 8.7 SEK bn
2006 12.7 SEK bn
2000 3.4 SEK bn
2006 12.5 SEK bn
2000 4.7 SEK bn
Net sales 2006
Net sales 2000

The Volvo Group 2006
Additional improvements in profi tability
Record number of product innovations
Acquisitions to strengthen market position in Asia
Strong sales growth. Net sales up 7% to SEK 248,135 M (231,191).
Continuing favorable earnings trend. Earnings for the year rose 25% to SEK 16,318 M (13,108) and the return on shareholders’ equity increased to 19.6% (17.8).
Major investments in R&D programs for the next generation of engines and products to ensure future competitiveness.
Consolidation of the Group’s presence in Asia as a result of the purchase of shares in Nissan Diesel and an agreement to purchase shares in Lingong, a Chinese manufacturer of construction equipment.
Earnings per share rose by 25% to SEK 40.20 (32.22).
Proposed dividend of SEK 25.00 per share and an extraordinary payment through a 6:1 share split in which the sixth share will be redeemed by AB Volvo for an amount of SEK 25 per share.
Key ratios 2004 2005 2006
Net sales, SEK M 202,171 231,191 248,135
Operating income, M1 13,859 18,153 22,111
Adjustment of goodwill – – (1,712)
Revaluation of shares 820 – –
Operating income, SEK M 14,679 18,153 20,399
Operating margin, % 7.3 7.9 8.2
Income after financial items, SEK M 13,036 18,016 20,299
Income for the period, SEK M 9,907 13,108 16,318
Earnings per share, SEK 23.58 32.22 40.20
Dividend per share, SEK 12.50 16.75 25.00 2
Extraordinary payment per share, SEK – – 25.00 3
Return on shareholders’ equity, % 13.9 17.8 19.6
1 Excluding revaluation of shares in Scania AB and Henlys Group Plc in 2004 and excluding adjustment of goodwill in 2006.
2 Proposed dividend 2006.
3 According to the Board’s proposal.
A global group 2006 1

Organization
Volvo Trucksmanufactures medium-heavy to heavy trucks for long-haul, regional transport, and construc-tion operations.
Renault Trucksoffers many types of vehicles from light trucks for delivery to heavy trucks for long haulage.
Mack Trucksmanufactures heavy-duty trucks primarily for construction, refuse and and heavy regional transports.
Business areasSome 75 percent of the Group’s workforce of about 83,000 employees is employed in the eight product-related business areas. Linked to these companies are a number of business units that supply components and services to support the Group’s business areas globally. This organizational config-uration permits companies to work closely with their custom-ers and efficiently utilize Group-wide resources.
Percentage of the Volvo Group’s net sales, %
Percentage of the Volvo Group’s operating income, %
Position on world market
Business unitsThe task of the business units is to develop and sup-ply components, services and support for the Group’s business areas. The major business units are Volvo Powertrain, Volvo IT, Volvo Parts and Volvo 3P.
Volvo 3P2,872
Volvo Powertrain8,274
Volvo Parts3,575
Volvo Technology403
Volvo Logistics1,004
Volvo Information Technology 4,663
In total, the Volvo Group is Europe’s largest and the world’s second larg-est manufacturer of heavy trucks.
35,180Number of employees
Volvo 3P is responsible for product planning, product development and for purchasing for the Group’s truck operations.
Volvo Powertrain coordinates Volvo Group’s powertrain operations and supplies the Group’s business areas with integrated powertrain systems comprising diesel engines, transmission sys-tems and axles.
Volvo Parts supplies services to support the aftermarket for business areas within the Group.
Volvo Technology develops new technologies and business solutions for the Group companies.
Volvo Logistics develops and manages logistics solutions for the automotive and aerospace industries worldwide.
Volvo Information Technology supplies IT solutions for industrial and commercial processes within and outside the Group.
2 A global group 2006

Buseshas a product range comprising city and intercity buses, coaches and chassis.
Volvo Pentaprovides engines and power systems for leis-ure and commercial craft, as well as for industrial applications such as gensets and water pumps.
Volvo Aerooffers components for aircraft engines and space applications, plus a wide range of services for the aerospace indus-try.
Financial Servicesconducts operations in customer and dealer financing.
Construction Equipmentmanufactures equipment for construction applica-tions and related indus-tries.
Volvo Buses is one of the world’s largest pro-ducers of buses.
Volvo Construction Equipment is the world’s largest manufacturer of dumpers and one of the world’s largest manufac-turers of wheel loaders, excavation equipment, motor graders and com-pact construction equipment.
Volvo Penta is the world’s largest producer of diesel engines for leisure boats.
Volvo Aero holds a lead-ing position as an inde-pendent producer, with engine components in about 90% of all large commercial aircraft delivered in 2006.
Financial Services coop-erates closely with the other business areas to strengthen the Group’s competitiveness.
7,762 11,049 1,652 3,505 1,139
A global group 2006 3

Volvo in society
The Volvo Group is one of the world’s leading
suppliers of commercial transport solutions.
Our trucks, buses, construction equipment,
marine and industrial drive systems and com-
ponents and services for the aviation sector are
important parts of the world’s transportation
networks, which are in operation 24 hours a
day, every day, throughout the year.
A truck must be capable of fulfilling important transpor-tation services 24 hours a day. It is a link in the distribu-tion chain, ensuring that society is provided with every-thing that is needed during the working day. That’s why Volvo Group trucks are an everyday sight as they go about their distribution services in urban traffic.
The demands placed on trucks and truck transports are high, regardless of whether they apply to heavy truck-driving operations in remote forest areas, or long-dis-tance transportation of fast-moving consumer goods. High efficiency and low costs are vital factors, while safety, ergonomics and environmental considerations are also assigned top priority.
4 A global group 2006

Demands for availability and rapid transports are increasing continuously. Volvo Aero’s many years of experience and leading-edge competencies in the field of aircraft engine components enable its customers to focus on their own core businesses – namely to provide optimally effective transport services.
Volvo Construction Equipment’s yellow machines are used in work conducted in the most demanding environments and at every conceivable type of construction site – ranging from new highways, bridges and shopping malls to ditch digging and the transportation of materials in areas where there sim-ply are no roads. These machines are also used within the forest industry and the materials handling sector.
Volvo Penta is best known for its boat engines and marine drive systems. But the company also delivers drive systems for a wide range of other applications, such as generator units for use at airports and hospitals, irrigation plants and engines for use in forklift and ware-house trucks.
A global group 2006 5

Vision, mission and values
Volvo Group’s mission
Our vision
Our values
By creating value for our customers, we create value for our shareholders.
We use our expertise to create transport-related products and services of superior
quality, safety and environmental care for demanding customers in selected segments.
We work with energy, passion and respect for the individual.
The Volvo Group’s vision is to be valued as the world’s leading supplier of commercial
transport solutions.
The Volvo Group views its corporate culture as a unique asset, since it is diffi cult for
competitors to copy. By applying and strengthening the expertise and culture we
have built up over the years, we can achieve our vision.
Quality, safety and environmental care are the values that form the Volvo Group’s
common base and are important components of our corporate culture. The values
have a long tradition and permeate our organization, our products and our way of
working. Our goal is to maintain a leading position in these areas.
6 A global group 2006

Quality
Quality is an expression of our goal to offer reli-
able products and services. In all aspects of our
operations, from product development and
production, to delivery and customer support,
the focus shall be on customers’ needs and
expectations. Our goal is to exceed their expect-
ations. With a customer focus based on every-
one’s commitment and participation, combined
with a process culture, our aim is to be number
one in customer satisfaction. This is based on a
culture in which all employees are responsive
and aware of what must be accomplished to be
the best business partner.
Safety
Safety is concerned with how our products are
used in society. We have had a leading position
in issues regarding safety for a long time; our
goal is to maintain this position. A focus on
safety is an integral part of our product devel-
opment work. Our employees are highly aware
of safety issues, and the knowledge gained
from our internal crash investigations is applied
in product development. Our goal is to reduce
the risk of accidents and mitigate the conse-
quences of any accidents that may occur, as
well as to improve safety and the work environ-
ment for the drivers of our vehicles and equip-
ment.
Environmental care
We believe that it is self-evident that our prod-
ucts and our operations shall have the lowest
possible adverse impact on the environment.
We are working to further improve energy effi-
ciency and to reduce emissions in all aspects of
our business, with particular focus on the use of
our products. Our goal is that the Volvo Group
shall be ranked as a leader in environmental
care. To achieve this goal, we strive for a holistic
view, continuous improvement, technical devel-
opment and efficient resource utilization.
A global group 2006 7

Market overview
Global economic trend
The global economy continues to register solid growth. In recent years,
global GDP growth has ranged from 4 percent to 5 percent, the highest
level since the 1970s. The positive trend is evident in most global regions
but is particularly noticeable in China, Eastern Europe and other emerging
markets.
Nowadays, these growth markets account for a substantial share of the
world economy and represent an increasingly integral part of the global
production system with their extensive trade. Their share of overall global
exports is currently 40 percent, compared with 20 percent in the 1970s.
Transport requirements
Social developments worldwide are fuelling an expansion in trade, locally as
well as among regions and continents. The growth in trade is creating higher
transport requirements, both for goods and people.
Transport vehicle requirements are cyclical but the industry has an under-
lying growth rate of about 4 percent annually in mature markets over a busi-
ness cycle. In growth regions such as Asia and Eastern Europe, the growth
rate is considerably higher.
Commodity prices
Rapid growth in global economy has resulted in high demand for energy. Oil
prices have risen sharply in recent years, with a peak price of USD 75 per
barrel in summer 2006. Prices levels have fallen since then, reaching about
USD 59 per barrel at year-end 2006. While at the same time that there is a
high demand for energy, the supply is limited, due partly to the political
unrest in the Middle East, which affects prices. The prices of raw material
to industry, such as metals and rubber, also rose during the year.
Fuel costs are a significant part of the operating cost for many of Volvo
Group’s customers. Generally, Volvo Group customers have proven skillful in
offsetting fuel costs.
053.33.23.92.51.62.71.41.70.80.9
060302 04
USA
Europe
Annual GDP growth.
Source: Consensus Economics
Growth in USA and Europe, % Growth in Asia and China, %
055.04.85.14.63.6
10.610.210.110.09.1
060302 04
Asia
China
Annual GDP growth.
Source: Consensus Economics
8 A global group 2006

An industry in flux
The transport industry is moving through a process of change in which
increasingly stringent environmental standards are a major driving force.
Substantial investments are required for R&D programs involving new tech-
nologies to reduce emissions from vehicles and for the development of
alternative fuels and drivelines. To meet these challenges, consolidation is
in progress among manufacturers through mergers and acquisitions.
In mature markets in the US and Europe, consolidation in the truck indus-
try has been in progress over a number of decades and has made substan-
tial progress. In other regions or sectors – such as Asia or the construction
industry – the pressure to consolidate is expected to increase.
Meanwhile, new competitors have emerged as major regional players in
growth markets with the aim of becoming global players. Restructuring
creates the potential for the Volvo Group to further strengthen its positions
in each business area by means of acquisitions.
Growth markets
The Volvo Group’s goal is to be the world’s leading supplier of commercial
transport solutions. Volvo currently has well-established positions in the
European and North American markets. However, the most rapid growth is
occurring in regions in which the Group had very limited operations ten or 15
years ago. The Volvo Group plans to expand in these markets – in Asia, for
example.
China and India are examples of markets that are already considerably
large and will prove even more important for the Volvo Group’s future growth.
In addition, Eastern European markets are showing steep growth and the
Group is well positioned to capitalize on expansion in these markets.
Heavy truck registrations, > 16 tons Three strong markets, heavy trucks
05 060302 04
Europe
North America
295277255229229349308249178180
Vehicles, thousands
Consolidation – European truck manufactures
MercedesVolvoGräf u .StiftLanciaScaniaFordBMCHenschelWillemeSeddonGuySteyrCommerAtkinson
Dennis UnicSaurerFiatLeylandKruppÖAFBerlietBussingDAFMagirusBernaOMERF
AstraHotchkissBarreirosBernardBedfordSaviemPegasoFTFDodgeMANFoden
Volvo Group
DaimlerChrysler
Paccar
MAN
Scania
Iveco
1966 2006
A global group 2006 9

CEO comment
2006 was an exam year for our strategy. A new generation of
products would be on the market, developed and produced in a
new industrial structure. The new engines would have to meet
the dramatically more stringent emission standards in Europe, the
US and Japan. As we had anticipated, it was an industrious year
– and a great success. 2006 was a record year.
Challenging assignment
>>> Already at the acquistion of Renault Trucks
and Mack six years ago, we knew that the road
ahead was going to be challenging. We faced
the integration of thousands of employees into
new units, changing from three different pro-
duction systems for engines to one common
system, shrinking the engine families from 18
to two and coordinating the truck companies’
purchasing, product planning and product
development in a new unit. In addition, the units
for IT, logistics and spare parts were assigned
to take a Group-wide lead for coordination
within their areas. All these actions were aimed
at gaining maximum benefit from the technical
resources and our combined volumes.
We also had aggressive plans to strengthen
and expand the dealer network to provide bet-
ter service to customers and advance our pos-
itions on new markets.
New and more efficient structure
Accordingly, there were many reasons for con-
cern at the beginning of 2006. We had never
previously implemented such a comprehensive
product renewal. We phased in new production
systems at the same time as we phased out the
old. This was in a booming business climate,
with plants operating at peak capacity.
Concurrently, we put time and resources into
the investments in Asia and Eastern Europe.
Naturally, we are very proud that we suc-
ceeded in realizing our plans. In all significant
respects, we carried out the changeovers as
scheduled and although they increased costs
temporarily our new products rolled out in a
proper manner. The Group is now well consoli-
dated and our own as well as independent deal-
ers have a highly positive development.
Successful products
The solid order bookings at the end of 2006
and beginning of 2007 demonstrate the
strength of the new product generation. The
diesel engines are leading in fuel efficiency
and provide competitive advantages for all of
the Group’s vehicles and equipment. As a result
of the more efficient structure, we have been
able to free up resources to develop more
customer-adapted variants, which further
strengthen positions. As a result of the
increased benefits for the customer, we have
been able to price our vehicles, equipment and
services at the right levels.
Group-wide production
The changes implemented are not solely sig-
nificant structurally, but also important for the
internal transfer of know-how. Increased coor-
dination and common technical solutions have
resulted in improved quality. Step by step we
are developing a Group-wide production
method based on standardization, best prac-
tice and a common corporate culture.
Raised financial targets
Since the changes yield effects in the form of a
structurally higher profitability, the Board
decided to raise the Group’s financial targets.
We are now aiming at an average operating
margin of more than 7 percent over a business
cycle, adding also another, currently, one per-
centage point from the financing operations.
The growth target of 10 percent annually is
retained.
Aggressive strategy for growth
The strategy to reach the growth target is to
grow geographically and at the same time
broaden our offering to customers. We expect
organic growth of 5–6 percent and to obtain
the remaining percent through acquisitions. In
line with this, the Board has sought a distinct
balance between the need for financial free-
dom of action for long-term value growth and
an attractive level for annual share dividends.
Geographically, we are targeting the fast-
growing economies in Eastern Europe and Asia.
The economies in Eastern Europe are in a
very dynamic phase and new transport patterns
are being established. For many years we have
been active in this region extending the dealer
network and services. This is now bearing fruit.
The nearly 40 percent sales increase during
2006 is evidence that we are taking a share of
the rapid economic growth.
Major potential in Asia
Since the quality and emissions standards in
countries such as China and India are still rela-
tively low, the challenge in these countries is
greater. Pricing is different and local manufac-
turing is a necessity for competing with domes-
tic producers. However, in the long term we see
the greatest potential for growth in Asia.
A favorable sign for the environment and our
development is China’s ambition to establish
more stringent emission standards.
In general, we foresee an increasing global
harmonization of technical as well as environ-
mental demands, which strengthens our pos-
ition since we have gone further than the com-
petition in developing a global product program.
10 A global group 2006

With investments in India and China, we aim to
share in their growing economies, in the man-
ner that we are now experiencing in Eastern
Europe.
New phase in Asia
In order to strengthen our position in Asia, we
have taken several steps of significant strate-
gic importance. Within the truck segment, we
established a strategic alliance with Japanese
Nissan Diesel. To start with, we acquired a 19
percent holding in Nissan Diesel and in Fe -
bruary, 2007, we made a public offer for the
whole company.
Nissan Diesel holds a solid position in Japan
and the rest of Asia. A merger would give
advantages within product development and
purchasing as well as within the production of
engines and drivelines. Gains also arise in that
the companies are given access to each other’s
dealer and service networks.
The cooperation with Nissan Diesel has also
resulted in more in-depth discussions about
future coordination with China’s largest truck
manufacturer, Dongfeng Motors.
In China we have also entered an exciting
new phase through the purchase of 70 percent
of the Chinese wheel loader manufacturer
Lingong. As the first foreign manufacturer of
construction equipment, we gain a base with a
nationwide dealer network in China.
Broader offering to
customers
Parallel with investments on new markets, we
are increasing efforts to expand our offering of
services, accessories and spare parts. We view
this as our greatest possibility to create long-
term growth in established markets. In this
respect, we are working with intensifying coop-
eration with customers to develop broader
business solutions. Customer financing is an
important component in this respect and for
expansion in markets with a less developed
credit system.
An important part of our strategy for
increased profitability is the growth of ser-
vices, accessories and spare parts.
New technology for a better
environment
As a vehicle manufacturer, we have
major responsibility for the en -
vironment and to contribute to a
sustainable society. We view this
responsibility with the greatest
seriousness. We have set very
high goals to reduce energy con-
sumption in production and to
make more of our plants carbon -
di oxide neutral. In the midst of this tough
period I have described, we have also inten-
sified the development of alternative drive-
lines to reduce fuel consumption and the
emission of greenhouse gases. Among
other activities, we presented our fuel-
efficient hybrid technology in 2006, which
we plan to have in production in 2009.
Successful integration work
I wish to thank all employees for an excel-
lent job. In my opinion, and that of the Board, we
have succeeded well with the difficult task of
integrating new companies and implementing
structural changes. This is thanks to our hard
work each day in an organization that has per-
formed in a disciplined and motivated manner.
2007 will be an exciting year during which
we will have the entire new product generation
on the market and take new strides in the
expansion eastward.
Leif Johansson
President and CEO
A global group 2006 11

Our customers’ needs govern our strategy…
The Volvo Group’s customers mainly conduct transport-related operations.
They impose rigorous requirements on both products and services. In a
competitive market, customer satisfaction is a key factor, since it assures
future sales and is essential for healthy profitability.
Developing and broadening cooperation with customers
Close cooperation with customers is decisive for enabling the Volvo Group
to better understand their needs and meet their expectations with the right
products and services.
Quality in the Volvo Group’s offering is also linked to how customers are
treated and how services are performed. While product characteristics and
quality are of key importance, it is above all the people in the Volvo Group,
and their skills, values, attitudes and conduct, which create success.
The Group must constantly be able to offer customers the solutions that
are best commercially for their operations. At the same time, customers’
experience of the brands should be consistent and in line with the Group’s
basic values. This applies both within the Group and at dealerships.
Accordingly, the Volvo Group works continuously to develop its dealership
network with the aim of further improving its service to customers.
Building strong relations with key customers
The Volvo Group strives to forge closer relations with key customers. There
are several advantages; the Group can support customers’ growth even
more effectively than before, while simultaneously helping to broaden the
offering of products and services to existing customers. In this way, the
Volvo Group can benefit from its broad range of products and services and
establish synergies with key customers.
The foremost argument for Coca-Cola in selecting Volvo in the early ‘90s was the extensive Volvo ser-vice network. Volvo still has the most widespread service network of all foreign truck manufacturers operating on the Russian market today.
12 A global group 2006

Profitable growth
Since 2001, the Volvo Group has had an average annual growth rate of
7 percent, which has been achieved through both organic growth and acqui-
sitions. The Volvo Group’s objective is to continue growing with focus on
profitability. The growth target is 10 percent annually over a business cycle,
which will be achieved through organic growth and through acquisitions at
approximately equal proportions.
Expanding geographic coverage and product offering
The Volvo Group holds established positions in markets in Europe and North
America. Today, however, the most rapid growth is occurring in markets
where the Group had very little business only ten to 15 years ago. In growth
markets, a stronger position and increased market shares are to be achieved
by attracting new customers and through strategic alliances. The Group is
making large investments in the dealer and service networks and concur-
rently carrying out a number of acquisitions. The aim is for markets outside
Europe and North America, such as India, Japan, China and Russia, to
account for a substantial portion of the Group’s total sales in the long term.
The aim in established markets is for an expanded customer offering,
with an increased proportion of sales in the aftermarket and a high propor-
tion of services to contribute to achieving the growth target. Strong brands
increase customers’ trust and create loyalty to the Group’s products and
services, thereby supporting profitable long-term growth.
Activities during a business cycle
The sectors in which the Volvo Group operates are exposed to economic
fluctuations. The Volvo Group endeavors to actively handle both upswings
and downturns in each sector to achieve better profitability. The strategy of
developing aftermarket services and growing in new markets enables the
Group to achieve a more favorable balance between all the phases of a busi-
ness cycle.
10%Volvo’s aim is to grow by 10 per-cent annually. Growth will be achieved organically as well as through acquisitions.
1
A global group 2006 13

Innovation and product development
Renewal and concept development
Development of innovative technology is the key to success for new genera-
tions of products, and to maintaining market-leading positions in the future.
Efforts are constantly under way within the Group to improve the per-
formance of products and thereby strengthen competitiveness. At the
same time, research looking even further into the future is conducted in
order to achieve new technical breakthroughs.
The Volvo Group cooperates worldwide with a large number of external
partners in projects and forums that allow experience to be exchanged and
contact to be made with cutting-edge technologies and innovations. The
Volvo Group will continue to actively exchange information with many differ-
ent players, such as universities, research institutes, customers, suppliers
and government authorities.
Providing a complete, customer-oriented offering
For a global organization such as the Volvo Group, product planning must
ensure that the right products with the right specifications are offered in the
right markets. Accordingly, products typically offer an extensive range of
customer adaptations. Product adaptation supports the distinctive features
of each brand and its competitive advantages as seen from the customer’s
perspective.
Improving fuel efficiency and increasing the use
of alternative fuels
It is a major challenge to create a sustainable society that does not jeop-
ardize the environment for future generations. The Volvo Group is a driving
force within the transport industry in such areas as energy and the environ-
ment. This undertaking seeks to attain a gradual transition from fossil fuels,
such as oil and natural gas, to fuels from renewable sources and hybrid drive
systems.
Product development has to be based on requirements from the customers. Volvo CE invites se l-ected customers at an early stage when new products are to be designed. Customers give the company valuable feedback on what needs they have and what features should be included in coming products.
2
14 A global group 2006

Highest quality in implementation
Enhancing productivity and cost-efficiency
The Volvo Group strives to continuously optimize cost-efficiency and pro-
ductivity in all parts of its operations. This contributes to increased profit-
ability and improves the Group’s capacity to handle economic fluctuations.
Part of the internal cost-efficiency work involves reducing production
costs and the costs for sales and administration. Product costs must be
constantly scrutinized and kept to a minimum to generate competitiveness
without compromising on quality.
The Volvo Group strives to be characterized by the highest quality. Getting
it right from the start increases customer satisfaction, keeps costs down
and saves time and energy.
The Volvo Group plans to continue with the introduction of the Volvo
Production System (VPS), which was designed to establish common pro-
duction processes throughout the Group. VPS increases flexibility and effi-
ciency in the industrial organization. It is also expected that VPS will create
value for customers through improved quality, more reliable deliveries and
reduced costs.
Execution in focus
A key competitive advantage in the commercial transport sector is the
capacity to be efficient and suited to purpose. The Volvo Group’s capacity to
handle development projects, combined with its ability to rapidly introduce
processes for new ways of working, contributes to improved results.
Maintaining expertise
The Volvo Group is growing in new geographic markets and developing new
technology, as well as meeting a number of demographic challenges. It is
therefore vital to develop the appropriate expertise to assure the Group’s
future competitiveness.
Diversity is a commercial driving force and a source of international com-
petitiveness and hence profitability. The Volvo Group is increasing its efforts
to benefit from the strength that stems from diversity in terms of gender,
age, ethnic background and education, among other areas.
The quality of leadership is another key success factor for the Volvo
Group’s capacity to generate future business.
We work continuously with our processes with the aim to increase quality and to optimize manufac-turing.
3
A global group 2006 15

Financial strategyNew financial targets – Structurally higher profitability, stronger cash flow and lower risk
Volvo’s Board of Directors believes that the Volvo Group currently has structurally
higher profitability, stronger cash flow and lower risk. Consequently, in September
2006 the Board decided to revise the company’s financial targets. The three
financial targets cover growth, profitability and capital structure.
Focus on commercial transport
solutions
The streamlining of the Volvo Group, which
commenced with the sale of passenger car
operations in 1999 and continued in the form
of a number of successful acquisitions, has
created a strong group with a renewed focus on
commercial vehicles and equipment. A new
organization featuring business units with
Group-wide responsibility for engines and
product development, purchasing and product
planning has fuelled in-house efficiency pro-
grams and ensured the realization of the con-
siderable potential synergies. These targeted
efforts have created business areas that indi-
vidually have strong positions in their particular
markets, while simultaneously capitalizing fully
on the potential offered for coordination and
cooperation deriving from the dramatically
higher volumes of engines and other products.
Overall, the Volvo Group’s new composition
has led to structurally higher margins and
stronger cash-flow. Higher earnings have led
to a sharp increase in dividends in recent years,
while also creating resources that have been
used for product development, geographic
expansion and other developments. In turn,
this has resulted in geographic and product
diversification that has also reduced risk in the
company. Moreover, the Volvo Group’s strong -
er focus on aftermarket operations, which are
less sensitive to economic trends has contrib-
uted to reducing risk.
Financial strategy
The purpose of Volvo’s long-term financial
strategy is to ensure the best use of Group
funds in providing shareholders with a favor-
able return and offering creditors reliable
security.
However, a prerequisite for the long-term
competitive development of the company is
the availability of sufficient financial resources
to secure investments and active participation
in industry consolidation worldwide, thereby
maintaining a strategically competitive pos-
ition in all business areas.
The Volvo Group’s financial resources will
be used for investments, acquisitions and a
competitive dividend with a stable and long-
term development. Any surplus capital will be
transferred to the shareholders.
New financial targets
• Growth in net sales should increase by at
least 10 percent annually.
• Operating margin should exceed 7 percent
for for the Group’s industrial operations over
the business cycle.
• Net debt should be a maximum of 40 percent
of shareholders’ equity.
The growth target of 10 percent annually will be
achieved through organic growth and through
acquisitions at approximately equal propor-
tions.
The Volvo Group’s new profitability target is
that operating margin is to exceed 7 percent
annually over a business cycle. The target cov-
ers all Group operations, except Financial
Services, which currently contributes approxi-
mately one additional percentage point.
The Volvo Group’s capital is intended primar-
ily for the financing of acquisitions, and for
maintaining a high level of financial flexibility,
any surplus capital will then be transferred to
Volvo’s shareholders. The limiting level of net
debt to a maximum of 40 percent should mainly
be regarded as a reserve that can be used in
the event of a major acquisition.
The financial resources of the Group must
be used as efficiently as possible to ensure and
further strengthen the profitability within the
16 A global group 2006

Net sales growth1, % Operating margin1, %
7.905
8.92
061.602
0
7
5
1.403
7.304
Growth
Volvo Group’s growth target is that net
sales should increase by a minimum 10%
annually. This objective will be achieved
through organic growth and acquisitions.
Net sales rose 7% in 2006. During the
period 2002–2006, the average growth
rate – excluding divested operations – was
7% annually.
Operating margin
The Volvo Group’s new profitability target is
that operating margin is to exceed 7%
annually over a business cycle.
The operating margin for 2006 was
8.9%. The average annual operating mar-
gin for the Volvo Group was 5.4% from
2002 to 2006. The previous target for the
operating margin was 5% to 7% over a
business cycle, including the operations of
Financial Services.
Capital structure
The capital structure target was changed
from a net debt of a maximum 30% of
shareholders’ equity to a maximum 40% of
shareholders’ equity.
As of December 31, 2006, the Volvo
Group had a net financial position corre-
sponding to 28.3% of shareholders’ equity.
1 Years 2004, 2005 and 2006 are reported in accordance with IFRS and 2002 and 2003 in accordance with pre-vailing Swedish GAAP. See Note 1 and 3.
2 Excluding adjustment of goodwill.
Group and thereby securing the return of equity
to the shareholders. This is particularly impor-
tant since the Volvo Group operates in a cycli-
cal industry, which is also in a consolidation
process in which costs will be increased for
integrating acquired operations.
Financial Services
The target for Financial Services is a return on
shareholders’ equity of 12–15 percent and an
equity ratio of 10–12 percent. At the end
of 2006 total assets in Financial Services
amounted to approximately SEK 84 billion and
the equity ratio was 11.5 percent.
Long-term credit rating
The purpose of Volvo’s capital structure is to
balance expectations from the stock markets
and other financial stakeholders. Each year,
Volvo meets with credit rating institutes to dis-
cuss the lender’s view of the company and to
assess the Group’s future ability to repay loans
that mature. The Group’s goal is to maintain
good credit ratings as a base for favorable
financing of certain operations through loans.
Volvo has received an A3 credit rating from
Moody’s Investor Services. The long-term A3
credit rating provides access to additional
sources of financing and improved access to
the financial market. A3 is among the highest
credit ratings in the transport and automotive
industry and one of the highest among Nordic
industrial companies.
1405
706
(2)02
0
10
(1)03
1604
23.705
28.306
(7.7)02
(3.3)03
25.804
40
20
−20
−40
0
Net financial position as percentage of shareholders’ equity1,%
A global group 2006 17

Leading supplier of commercial transport solutions
The Volvo Group’s mission includes “using our combined
exp ertise to create transport-related products and services of
superior quality, safety and environmental care for demanding
customers in selected segments.”
Through constant development and improve-
ment of products and services, the Group’s
competitiveness is strengthened at the same
time as value is created for customers, thereby
helping to create future value for shareholders.
It is not enough to manufacture and sell
high-quality products to realize the Volvo
Group’s vision of being the world leader in
commercial transport solutions. Many custom-
ers expect complete transport solutions, which
creates a need to be able to offer various ser-
vices, accessories and spare parts to support
key products.
Vehicles and equipment
The Volvo Group is the world’s largest manu-
facturer of heavy-duty diesel engines for com-
mercial use and also a significant manufacturer
of drivelines for heavy vehicles. The Group has
manufacturing, research and development
facilities for drivelines on three continents and
its products are offered in more than 180 mar-
kets around the world.
Drivelines are designed so that they can be
adapted a large number of applications in most
of the Group’s products. Diesel engines are
used in trucks, buses and construction equip-
ment as well as in boats and industrial applica-
tions such as, for example, generator sets.
The strongest driving force to development
of drivelines is customers’ needs and requests.
The new Renault Midlum and Renault Premium Distribution
New Renault Midlum and Renault Premium Distri–bution vehicles were launched in 2006. These latest models feature the new 5- and 7-liter engines (Renault Midlum) as well as 7- and 11-liter engines (Renault Premium Distribution), which comply with Euro 4 emission requirements. Certain models are also prepared for the Euro 5 standard, which will come into effect in 2009.
World premier for Volvo 7700
The new version of the Volvo 7700 city bus was unveiled in June 2006. The major innovation in the Volvo 7700 is the switch from a 7-liter to a 9-liter engine, which is available in both diesel and gas ver-sions. As a result of Volvo selecting SCR catalyzer technology, Volvo Buses can now offer customers an engine that meets both the Euro 4 and Euro 5 stand-ards, while also cutting fuel consumption.
Volvo Group’s hybrid technology for heavy vehicles and machinery
At the beginning of the year, the Volvo Group pre-sented a new, efficient hybrid solution for heavy vehicles. The Volvo Group’s hybrid technology offers the largest fuel savings on stretches involving con-siderable braking and acceleration, as in the case of city buses, city distribution operations, refuse appli-cations and construction work. Fuel savings are up to 35% in these applications.
Products
18 A global group 2006

Services
Volvo Trucks has in the recent years developed its retail network in Europe through the wholly-owned Volvo Truck Centers. This is an important part of the company’s strategy to work closer with the customers and hereby be able to be more efficient when it comes to distribution, service and marketing.
Accessories
Customers are offered a wide range of accessories. Volvo’s wheel loader, for example, can be fitted with a number of different tools to help with various tasks.
Financing
Financial solutions are vital to the Volvo Group. The customer offering includes traditional financial ser-vices such as installment contracts, operating and financial leasing and dealer financing.
Accessories, spare parts
and services
Today, soft products account for a significant
share of the Group’s total sales and is expected
to grow further in the years ahead.
Products that feature reliability, durability, driv-
ability and fuel economy help to increase cus-
tomers’ profitability and productivity. The
Group’s goal is to exceed customer expecta-
tions at a lower price than the competitors.
Accessories, spare parts and
services
The Volvo Group’s vision is to be the world
leader of commercial transport solutions.
Most transports require, in addition to the
vehicle, a number of accessories or services to
carry out specific transport assignments in the
best way. This is where the Volvo Group’s wide
selection of accessories, spare parts and ser-
vices, or soft products, enter the picture.
This selection of services includes a range of
financing solutions, rental services, used trucks,
service contracts and IT services.
Because the accessories, spare parts and
services businesses predominately belong to
the aftermarket, these serve to balance fluctu-
ation in the economy. By increasing the selec-
tion of soft products, the Group’s profitability is
increased throughout the entire business
cycle.
The strategy of increasing sales of accessor-
ies, spare parts and services is also important
for reaching the Volvo Group’s profitability and
growth targets, particularly in mature markets.
A global group 2006 19

However, crucial to our success is that we must successfully continue developing the intellectual capital and stimulate exchange of thoughts and ideas. Torbjörn Holmström, President, Volvo 3P
INTERVIEW
20 A global group 2006

The Volvo 3P business unit has contributed
strongly to the improved profitability in recent
years within the Volvo Group in general and the
truck units in particular. Despite this, Volvo 3P
is unknown to most people outside the Group.
Volvo 3P combines development
In a newspaper, Volvo 3P was described
as probably the most unknown business
unit of the Volvo Group. And Torbjörn
Holmström, who has been the President
of Volvo 3P since 2003, has no objec-
tions to that. “Volvo Trucks, Renault
Trucks and Mack Trucks are natur-
ally the ones that should be vis-
ible externally, but it could be
said that we are the cement or even
the soul in the collaboration between the three
truck brands,” says Torbjörn.
Volvo 3P is namely responsible for several
significant areas, which are not always visible to
customers, shareholders or other stakehold-
ers, but which are significantly important to the
Group’s profitability. The areas of responsibility
&DEVELOPMENT SYNERGIES
Torbjörn Holmström
Torbjörn Holmström, born in 1955, has been the President of Volvo 3P since 2003. Between 1999 and 2003, he was an executive at Volvo Powertrain. During the first two years, he was responsible for transmission development and the last two years for driveline development. He has held other executive positions at Volvo Powertrain and was responsible for drivelines at Volvo do Brasil. Torbjörn Holmström received an engineering degree from Chalmers University of Technology in 1979.
Volvo 3P in brief
Volvo 3P is a business unit responsible for product planning, product development and purchasing for the three truck companies, Volvo Trucks, Mack Trucks and Renault Trucks.
The business unit has 2,872 employees and offices in Gothenburg (Sweden), Lyon (France), Allentown and Greensboro (USA), Curitiba (Brazil), Bangalore (India), Shanghai (China) and Brisbane (Australia).
are summarized in the three ps: product plan-
ning, product development and purchasing.
And, it stretches over the entire Volvo Group’s
global truck operations.
The mission is to produce synergies and
industrial efficiency. In daily numbers, this
means that Volvo 3P must produce improved
products at lower costs than in the past. And,
there is a great deal of cost savings to be made.
Each year, Volvo 3P and Volvo Powertrain make
purchases for nearly SEK 70 billion and the
Volvo Group invests about SEK 8 billion in
research and development.
“The Volvo Group saved a total of SEK 3.8
billion already two years after the acquisitions
of Renault Trucks and Mack Trucks. With regard
to Volvo 3P, profits to date were primarily from
purchasing, but we estimate that jointly with
Volvo Powertrain we will contribute a similar
amount in 2006 and 2007, as the new trucks
are introduced. The new trucks contain several
more components and systems that were
developed and purchased jointly,” explains
Torbjörn Holmström.
A global group 2006 21

INTERVIEW
&&DEVELOPMENT
SYNERGIES&SYNERGIES&further, due to the fact that the Volvo Group has
such a high volume of important components
that major suppliers want to cooperate and are
offering excellent conditions. And, the volumes
are likely to increase, since the Volvo Group and
Nissan Diesel have commenced purchasing
cooperation.
Global organization
Volvo 3P’s head office and global development
center is located in bright, airy premises adja-
cent to the Volvo Trucks plant in Lundby,
Göteborg, but the organization is global with
more than 2,900 employees and 600 consult-
ants in eight offices on five continents.
“It is important to be established in close prox-
imity to truck operations,” stresses Torbjörn
Holmström. He believes that it is also crucial
that information and knowledge are exchanged
freely between the various countries.
“We have taken the best expertise in terms
of development of various truck types from the
three truck companies and important ingredi-
ents such as quality and cost efficiency and
learned from each other.”
And, the one thing he would like to specific-
ally highlight is the company culture, in which
nothing is regarded as an obstacle, but instead
assistance and support is provided to each
other to jointly create solutions that contribute
to strengthening the position of the Volvo
Group.
What are the major challenges facing Volvo
3P?
“The simple response would be to point to all
the products that are being developed and that
will comply with future demands in terms of
environmental laws. Today, jointly with Volvo
Powertrain, we look at what must be delivered
between 2010 and 2013. However, crucial to
our success is that we must successfully con-
tinue developing the intellectual capital and
stimulate exchange of thoughts and ideas,”
says Torbjörn Holmström.
horizon. This is to ensure that the Group has the
correct products in the long term and to coord–
inate technology and components between
truck brands.
“We implement rolling eight-year plans for
products and a ten-year plan for technology
development. But the plans are not written in
stone, they are adapted each year to changes
in the Volvo Group and the environment. There
is a list of what the Group would like to imple-
ment and it is a question of distributing re-
sources to the correct projects,” says Torbjörn
Holmström.
Bulk purchasing generates lower costs
To date, purchasing is the area in which coordi-
nation gains have been most significant. The
Volvo Group has considerable size and pur-
chasing power when negotiating purchasing
contracts with suppliers. In the past year, the
focus was on the significant increases in the
prices of raw materials such as steel and other
metals, rubber and plastic.
Torbjörn Holmström feels that by implement-
ing global purchasing and larger volumes, price
increases were handled in a satisfactory man-
ner. He also stated that in the past years pur-
chasing was concentrated to fewer strategic
suppliers.
An increased portion of joint technology and
components also means positive effects in
terms of purchasing, in which one selected
supplier receives increased volume base, which
results in lower production costs and improved
coverage of development costs.
“We have reduced the number of suppliers
from 2,500 to around 1,500. We have also
reduced purchasing costs, and my opinion is
that we are just as effective as those companies
that are regarded as the strongest purchasers
in the market”, says Torbjörn Holmström.
Are there any gains left in purchasing?
Torbjörn Holmström believes that there are
possibilities to improve purchasing conditions
Efficient product development
In terms of the number of employees, product
development is Volvo 3P’s largest area. Nearly
2,300 employees work in close collaboration
with the three truck brands and Volvo
Powertrain. Volvo 3P concentrates on chassis,
cabs and electrical systems, while Volvo
Powertrain works on the driveline, meaning the
engine, gearbox and the rear axle.
The work is based on common architecture
and shared technology between the truck
companies. This offers many advantages.
Resources such as expertise, time and capital
can be combined to produce a joint solution to
a difficult technical problem, instead of distrib-
uting resources for three different alternatives.
This strengthens the motivation to invest
resources in developing optimum solutions for
each truck model based on the customer’s
requirements.
“A truck contains a large number of compon-
ents that are common in all trucks and this
applies to the driveline as well as the work we
do. This produces improved quality and lower
costs, which is advantageous to our customers.
Development resources are also released to
develop truck models that are even more opti-
mized for different types of transports, by
adapting solutions to each brand core seg-
ment. It is vital to remember that Volvo 3P is
there to strengthen each brand, not to dilute it,”
says Torbjörn Holmström.
This is why there are distinct definitions for
the souls of the different brands, in terms of
appearance, cabs, interior fittings, engines and
driving performance. A truck from Volvo must
naturally feel like a Volvo just as there are dis-
tinct vehicles from Renault Trucks and Mack
Trucks.
Product planning for the future
When product development is about producing
the correct products for launching within one or
a few years, product planning has a long-range
22 A global group 2006

Increased coordination creates resources
for the Group’s truck brands to develop
customized solutions.
A global group 2006 23

INTERVIEW
UNIFORMPOWER
Volvo Powertrain in brief
Volvo Powertrain is the world’s largest producer of heavy diesel engines in the 9–18 liter classes. The business unit coordinates Volvo’s powertrain operations and supplies the Volvo Group’s business areas with integrated powertrain systems comprising diesel engines, transmissions and driveshafts.
Volvo Powertrain has 8,274 employees, including 5,677 in production and 2,597 in product de vel-opment and administration.
It was a hectic year for Volvo Powertrain. The
strategies and plans that were adopted after
the acquisition of Renault Trucks and Mack
Trucks were followed through.
Volvo Powertrain – the Group’s engine
The Group now has common engine platforms
that fulfill the latest environmental require-
ments, a more focused research and develop-
ment program, more efficient production and a
more focused supplier structure.
“If Volvo 3P is the soul in the cooperation
between the business areas, then we are the
heart,” says Lars-Göran Moberg, President of
Volvo Powertrain. “Our task is to ensure that
good drivelines are available for Volvo Trucks,
Mack Trucks, Renault Trucks, Buses,
Construction Equipment and Volvo Penta.”
It sounds self-evident when Lars-Göran
Moberg says it, but it is no small undertaking to
be the driveline supplier for the Volvo Group,
24 A global group 2006

UNIFORMPOWER
Volvo Powertrain in brief
Volvo Powertrain is the world’s largest producer of heavy diesel engines in the 9–18 liter classes. The business unit coordinates Volvo’s powertrain operations and supplies the Volvo Group’s business areas with integrated powertrain systems comprising diesel engines, transmissions and driveshafts.
Volvo Powertrain has 8,274 employees, including 5,677 in production and 2,597 in product de vel-opment and administration.
Jessica Sandström, who is in charge of ongoing
hybrid-development projects at Volvo Powertrain,
talks to Lars-Göran Moberg, President.
A global group 2006 25

INTERVIEW UNIFORMPOWER
the world’s second largest company in its sec-
tor. Similarly, it was no small task to reorganize
the entire operation, while simultaneously
delivering annual volumes amounting to
200,000 engines and 80,000 gearboxes.
“We are the world’s largest producer of heavy
diesel engines, from 9 liters up to 18 liters. Our
aim is to lead development in terms of perform-
ance, quality and environmental characteris-
tics, and to deliver our products at competitive
prices, ” explains Lars-Göran Moberg.
The driveline, which consists of the engine,
gearbox and the driveshaft or driveshafts, is
often described as the heart of a vehicle. Volvo
Powertrain is responsible for the development
and production of heavy engines, gearboxes
and driveshafts. The business unit is also
responsible for ensuring that the Volvo Group is
supplied with medium-heavy engines, which
come from partner company Deutz, in which
the Volvo Group holds 7 percent interest.
Powertrain is also a substantial manufac-
turer of heavy gearboxes in-house, with pro-
duction in Köping, Sweden and Hagerstown,
Maryland, in the US. Extensive efforts have also
been made in this area to standardize develop-
ment, purchasing and manufacturing, while
concurrently broadening the customer offer-
ing. Since its introduction in 2002, Volvo’s
internally produced AMT gearbox has grown
rapidly in volume at the cost of manual gear-
boxes. In practice, it is the industry standard in
Europe and was recently launched in North
America.
Common engine platforms
To date, increased volumes have been the driv-
ing force for profitability at Volvo Powertrain.
The decision to work toward two platforms is
aimed at further strengthening the business
area in the future, although the strategy gave
rise to costs during 2006 for both the new and
the old generation of engines, since both were
being produced in parallel for a while.
“We see considerable advantages in the
increased volumes and the concentration to
two platforms regarding costs for quality and
delivery precision,” says Lars-Göran Moberg.
The new platforms will further increase
economies of scale, since the Volvo Group
works with a common architecture and shared
technology. But Lars-Göran Moberg empha-
sizes that, despite this, the range of choices for
customers is larger than before.
The Volvo Group’s engine offering is one of
the broadest in the market, and engines are
adapted to the size of vehicles, what type of
transport work they will be doing, as well as the
environment in which the product is to operate.
“We develop and produce engines with differ-
ent characteristics, but based on common archi-
tecture and shared technology. The truck brands
will always retain their distinctive brand identity,
and the same applies to the engines. The most
important point for the customers is that we
produce drivelines that are optimized for the
transport work to be done by the specific ve -
hicle, combined with lower fuel consumption
and better operating characteristics. As a result
of the common engine strategy, Volvo Con-
struction Equipment and Volvo Penta also have
a solid competitive advantage with regards to
forthcoming emissions standards,” says Lars-
Göran Moberg.
Several advantages
The Volvo Group’s structure, with a common
business unit for the development, production
and purchase of drivelines, has several advan-
tages. Volvo Powertrain has concentrated its
expertise in research and development to spe-
cialized units in Sweden, France, the US and
Brazil. The division of labor is clear and there is
extensive cooperation between the units. The
joint focus on a platform creates synergies and
resources that help to improve the driveline’s
performance and cost-efficiency.
The production structure has also been
overhauled. Previously there were three differ-
ent industrial systems. Now there is a single
common system designed to achieve econ-
omies of scale, high quality and delivery reli-
ability, within which the four sister plants in
Göteborg, Lyon, Hagerstown and Curitiba sup-
ply their local markets with heavy engines and
heavy gearboxes.
Volvo Powertrain has also concentrated its
Lars-Göran Moberg
Lars-Göran Moberg, born 1943, holds a Masters degree in Engineering and has been President of Volvo Powertrain since 2001. He is also Board Chairman of Volvo 3P and Volvo Technol ogy and Technical Director of AB Volvo. He has worked for Volvo since 1995 and has been a member of Volvo’s Group Executive Committee since 2001.
purchasing – from nearly 700 suppliers a few
years ago to slightly more than 80 today. Those
that have been selected now have the capacity
to participate more actively in the development
process.
“It should also be borne in mind that we
implemented all these changes and develop-
ment projects at the same time as we were inte-
grating three formerly separate powertrain div-
isions,” says Lars-Göran Moberg. “Today, we
are a global organization with a coordinated
industrial structure, a common supplier struc-
ture and common platforms. Now we must make
sure that we get the maximum out of the new
product range and the new industrial system.”
Emissions requirements one
of the challenges
Lars-Göran Moberg identifies tougher emis-
sions legislation and changed customer re -
quirements as future challenges.
Lower fuel consumption is becoming in-
creasingly important both from an environmen-
tal viewpoint and from a commercial perspec-
tive, with fuel accounting for an increasingly
large proportion of operating costs. There are
several key steps along the way toward cleaner
engines for trucks and buses. The Euro 4 stand-
ard was introduced in October 2006, and Euro 5
is planned for 2009. On January 1, 2007, the
US’07 standard came into force in the US. The
standard drastically reduces emissions levels
compared with only a year ago. A final step
towards near zero emissions will be taken when
US’10 and Euro 6 will come into force in 2010
and 2012/2013 respectively, according to plan. 26 A global group 2006

In 2001, the Volvo Group had 18 different
engine platforms ranging from 4 liters to 16
liters. The company knew that environmental
requirements would become increasingly
tough, but not what technology was the best
choice to meet the new requirements. Since it
was impractical to develop new technology for
18 different platforms, the Volvo Group decided
to concentrate on two platforms to meet the
legal requirements contained in US’10 and
18 2Euro 6 standards, and to introduce the most
ad vanc ed technology possible to enhance qual-
ity, operating economy, fuel efficiency and per-
formance.
Today, the Group has two engine platforms: a
heavy one developed and produced by Volvo
Powertrain, and a medium-heavy one devel-
oped and produced in cooperation with Deutz.
Volvo Powertrain’s platform concept has
successfully been implemented for heavy gear-
boxes and axles.
Common engine platforms
Common strengthCreate synergies Utilize synergies Results Advantages
Large base volume Broad product offering and optimal investments
Large volumes of components Low product cost
Common architecture Advanced engine development
Shared technology Enhanced quality, fewer item numbers and higher efficiency
Common suppliers Lower costs and higher efficiency
Common architecture and shared technology
More stringent emissions regulations are
also gradually being introduced for off-
road vehicles and marine applications. For
off-road vehicles the Tier 3 regulations are cur-
rently being introduced and the next major step
will be Tier 4, which comes into effect in 2011.
Alternative fuels and drivelines
The Volvo Group is working on parallel pro-
grams to meet environmental requirements
and reduce the need for fossil fuels. One pro-
gram aims to make engines run more efficiently
on today’s fuels, while another is focusing on
finding alternative fuels. It is not a major prob-
lem to optimize diesel engines to operate on
other fuels. Rather, the problem is to produce
sufficient volumes of fuel and to distribute it. A
third program is focusing on alternative drive-
lines to complement diesel engines – hybrid
drivelines, for example.
“We have made considerable progress in
hybrid technology, and during 2006 we pre-
sented a hybrid solution for heavy vehicles that
gives fuel savings of up to 35 percent,” says
Jessica Sandström, in charge of ongoing hybrid-
development projects at Volvo Powertrain.
The new hybrid solution could be on the mar-
ket as early as 2009.
“Development is proceeding rapidly and we
are positioned to capitalize on all the advan-
tages that come from being a truly global com-
pany with world-leading technology and pro-
cesses,” says Lars-Göran Moberg.
A global group 2006 27

INTERVIEW
Dongfeng
LONG-TERM STRATEGY
IN ASIA
28 A global group 2006

Nissan Diesel
Volvo Group
Dongfeng
LONG-TERM STRATEGY
AcquisitionsThe Volvo Group has experience of acquiring companies in Southeast Asia and developing them into strong parts of the Group’s global organi-zation. The construction-machine division of South Korean company Samsung Heavy Indu–stries was purchased in 1998 and its name changed to Volvo Construction Equipment Korea Ltd. Its operations are mostly concerned with the production of excavators. Since the acquisition, the company has developed favorably, with an increased rate of product renewal, rising volumes and improved profitability.
1998 2006
Number of employees 1,565 1,443
Net sales, SEK M 2,028 9,395
Profitability, SEK M Loss 765
Long-term strategy in Asia
During the past few years, the Volvo Group has
taken several steps forward in its Asian strat-
egy, whereby the Volvo Group’s aim is to make
Asia one of its core markets in the future, in the
same way as Europe and North America are
core markets today.
During 2006, AB Volvo purchased a holding
in Japanese truck producer Nissan Diesel and
in February 2007, presented a public offer for
the whole company. The holding in Nissan
Diesel opened up for the discussions on a pos-
sible investment in Chinese Dongfeng Motor,
which manufactures heavy and medium-duty
commercial vehicles. In 2006, the Volvo Group
also decided to establish a partnership to pro-
duce bus bodies in India, and in January 2007,
closed the acquisition of a 70-percent interest
petition increases, Chinese companies will
increasingly wish to make maximum use of
their vehicles over a larger part of the day.
Higher quality, better operating characteristics
and lower fuel consumption will then become
key parameters, and these areas are in which
the Volvo Group’s strength lies.
While the main focus is often on China when
growth in Asia is discussed, there are naturally
other markets in the region that are of consid-
erable interest to Volvo, such as India, Thailand,
Malaysia, South Korea and Japan.
Public offer for Nissan Diesel
During the year, AB Volvo acquired 19 percent
of the shares in Nissan Diesel from Nissan
Motors and in February 2007, presented a pub-
lic offer for the remaining shares in the com-
pany. Nissan Diesel has staged a very strong
recovery during the past few years and is today
a profitable and attractive company with an
established position in the truck sector in
Southeast Asia.
Nissan Diesel’s and the Volvo Group’s prod-
ucts and geographic coverage complement
each other, and the deal paves the way for
cooperation in the areas of components, pro-
duction, sales and aftermarket, as well as cre-
ating opportunities for joint development of
engines and gearboxes.
China’s largest truck producer
Dongfeng Motor Co Ltd. is China’s largest truck
producer, with annual production of some
170,000 trucks. Dongfeng Motor Co Ltd. is in
equal parts owned by car manufacturer Nissan
Motors and Dongfeng Motor Group.
In the beginning of 2007, AB Volvo, Nissan
Motors and Dongfeng Motor Group deepened
discussions on how the commercial-vehicle
operations best can be developed. At that time,
a non-binding framework agreement was
signed with the intention of AB Volvo to invest
in the heavy and medium-duty commercial
vehicle and engine business.
“If handled properly, the opportunities that
could open up for us are enormous. To be a
global company, it is simply essential to have
production and growing sales in Asia,” says
Jorma Halonen.
in the Chinese wheel loader
producer Lingong.
“These are important
steps in our strategy to
strengthen our presence in
Asia,” says Jorma Halonen,
Executive Vice President and
Deputy CEO with specific respon-
sibility for the Group’s expansion
in Asia. “Behind us, we have the
successful acquisition of what
is now Volvo’s excavator oper-
ation in South Korea, and we
have previously made explor-
atory moves in China and else-
where, but now it feels as if we have
gained a real foothold in Asia.”
Huge market with rapid growth
There is intense activity, accompanied by
extremely high growth figures, in the Asian
economies. And these are in no way small mar-
kets – of the approximately one million heavy
trucks sold each year in the world market, Asia
accounts for one third, and China alone for one
fourth.
In China, signs of economic growth are vis-
ible in most parts of the country and include
construction of infrastructure, such as roads
and railways, and buildings for offices or hous-
ing. As an example, China had 35,000 kilo-
meters of expressway in 2006 and this figure is
set to double by 2010. Many of the highways
have six or eight lanes. By way of comparison,
Europe has approximately 54,000 kilometers
of expressway and the US 85,000 kilometers.
“Half of the world’s population lives in Asia,
and that’s where growth is largest,” says Jorma
Halonen. “For that reason, among others, this is
a market where we must naturally be more
active than previously.”
However, it needs to be borne in mind that
the major portion of the trucks, buses and con-
struction equipment currently sold there are
domestically produced, and that vehicles con-
forming to Western European or North
American standards have had difficulty com-
peting. The price differential has been far too
large – at least so far. But Jorma Halonen
points out that as the economy grows and com-
Jorma Halonen & Tony Helsham
Jorma Halonen in conversation with Tony Helsham during a Group Executive Committee meeting in November 2006.
A global group 2006 29

The share
Trading in Volvo A shares on the Stockholm
Stock Exchange increased by 43% compared
with 2005 and the share price rose by 33%. At
year-end, the share price for the A share was
SEK 486.00. The highest price paid was SEK
493.00 on November 15, 2006, which is the
highest price paid for Volvo A shares up until
the end of 2006.
Trading in Volvo B shares on the Stockholm
Stock Exchange increased by 19% compared
with 2005. The share price rose by 25% and
was SEK 471.50 per share at year-end. The
highest price paid was SEK 478.50 on
November 15, 2006, which is the highest price
paid for Volvo B shares up until the end of
2006.
On NASDAQ, the volume of trading in the
Volvo share fell by 28%, while the share price
rose by 40%. At year-end, the share price was
USD 68.75 (SEK 472.50).
In 2006, a total of 673 (558) million Volvo
shares were traded on the Stockholm Stock
Exchange, corresponding to a daily average
of 2.7 (2.2) million shares traded. At year-end
2006, Volvo’s market capitalization totaled
SEK 193 billion (150).
The Volvo Group’s strategy has resulted in structurally higher
profi tability, a lower risk level and a stronger cash fl ow. Combined,
these have resulted in increased shareholder value.
Additional information concerning the Volvo
share is presented in the 11-year summary on
page 158.
Dividend
The objective of Volvo’s dividend policy is that
the long-term total return to shareholders
should exceed the average for the industry.
Historically, dividends on Volvo shares have
risen steadily. The Volvo share’s total return, that
is, the share’s value development plus reinvested
dividends, has amounted to an average of 49%
per year since 2002. This can be compared
with the average total return for the Stockholm
Stock Exchange in its entirety, which during the
same period, was 16%, according to SIX.
For fiscal year 2006, the Board of Directors
proposes that the shareholders at the Annual
General Meeting approve an ordinary dividend
of SEK 25 per share and an extraordinary pay-
ment through a 6:1 share split in which the
sixth share will be redeemed by AB Volvo for an
amount of SEK 25 per share. The share split
reduces the value of each trading block and
should make trading easier for shareholders
with smaller holdings.
Total return, Volvo B
Earnings1 per share
Dividend per share
0532.2
0640.2
030.7
023.3
0423.6
16.75 25.08.08.0 12.5
Extraordinary payment
25.0
1 Years 2004, 2005 and 2006 are reported in accord-ance with IFRS and 2002 and 2003 in accordance with prevailing Swedish GAAP. See Note 1 and 3.
Earnings and cash dividend per share
B Share (incl. re-invested dividends)
SIX Return index
Index 100 = Share price VolvoB Share, January 1, 2002.
Source: Findata Direkt
02 03 04 05 06
50
100
150
200
250
300
350
>>> The Volvo share is listed on the Stockholm
Stock Exchange in Sweden and on the
NASDAQ exchange in the US. Volvo A and
Volvo B shares are traded on the Stockholm
Stock Exchange and a trading block consists of
100 shares each. One Volvo A share entitles
the holder
to one vote
at Annual
General Meetings and one Volvo B share enti-
tles the holder to one tenth of a vote. Dividends
are the same for both classes of shares. Since
1985, a program for American Depositary
Receipts (ADRs) has existed in the United
States. Each ADR represents one Volvo B
share.
The Volvo Share is included in a large num-
ber of indexes that are compiled by Dow
Jones, FTSE, S&P, the OMX Nordic Exchange
and Affärsvärlden, among others.
Positive trend for the share
In general, the trend on the world’s leading
stock exchanges was positive in 2006. On the
Stockholm Stock Exchange, OMXS index rose
by 23.6%.
30 A global group 2006

Communication with the shareholders
Dialog with the shareholders is important for
Volvo. In addition to the Annual General Meeting
and a number of larger activities aimed at profes-
sional investors, private shareholders and stock
market analysts, the relationship between Volvo
and the stock market is maintained through such
events as press and telephone conferences in
conjunction with the publication of interim
reports, investor meetings and visits, as well as
road shows in Europe, the US and Asia.
Through a separate website at www.volvo.com,
it is possible for shareholders and other stake-
holders to view and download financial reports
for the past ten years and search for informa-
Share capital, December 31, 2006
Registered number of shares 1 425,684,044 of which, Series A shares 2 135,520,326 of which, Series B shares 3 290,163,718 Quota value, SEK 6 Share capital, SEK M 2,554 Number of shareholders 183,735 Private persons 175,298 Legal entities 8,437
1 Following the repurchase of the Group’s own shares, the number of outstanding shares was 404,798,590.
2 Series A shares carry one vote each.
3 Series B shares carry one tenth of a vote each.
Sweden 47%
France 21%
USA 13%
United Kingdom 8%
Switzerland 2%
Others 9%
1 Share of capital, registered shares.
Ownership by country 1, %
Non-Swedish owners 53%
Savings funds 10%
Pension funds and insurance companies 16%
Swedish private shareholders 11%
Others 10%
1 Share of capital, registered shares.
Ownership categories 1, %
The largest shareholders in AB Volvo, December 31, 20061
Voting rights, %2
Renault SA 21.3 SHB 6.5 SEB Fonder/Trygg Försäkring 5.5 Violet Partners LP 5.3 Andra AP-fonden 5.0
1 Following the repurchase of its own shares, AB Volvo held 4.9% of the Company´s shares on December 31, 2006.
2 Based on all registered shares.
Credit rating at December 31, 2006
Short term Long term
Moody’s P-2 stable A3 stable Standard & Poor A2 stable Not rated
More details on the Volvo share are provided on page 158 Volvo share statistics.
tion concerning the share, insider trading in
Volvo, earnings estimates and statistics for
truck deliveries. It is also possible to access
information concerning the Group’s gover-
nance, including information about the Annual
General Meeting, the Board of Directors, Group
Management and other areas that are regu-
lated in the “Swedish Code of Corporate
Governance”. This website also offers share-
holders to personally determine the informa-
tion to be received from Volvo.
02 03 04 05 06
0
Source: Stockholm Stock Exchange
100
200
300
Volvo B MSCI-Europe Index AFGX
Price trend, Volvo Series B shares, SEK
A global group 2006 31

The Volvo Group’s missionThe Volvo Group’s mission is to create value for
its shareholders by creating value for its cus-
tomers. Volvo sees sustainable development,
both in environmental and social terms, as a
vital prerequisite for long-term profitability and
increased customer and shareholder value.
The Volvo Group has a strong impact on the
communities in which it operates. The Group’s
companies are major employers as well as pro-
viding work for a large number of subcontract-
ors. The Volvo Group aims to be a strong part-
ner for entrepreneurs, suppliers and other
players in the community and a good employer
for its employees. The Volvo Group aims to pro-
mote prosperity and sustainable development.
The basis of our sustainability effortsThe Volvo Group strives to conduct responsible
business based on its Code of Conduct, core
values and established guidelines. The Volvo
Group’s Code of Conduct and corporate values
– quality, safety and environment care – form
the basis of the company’s sustainability
efforts.
The Volvo Group’s Code of Conduct
The Volvo Group’s Code of Conduct was
adopted in 2003 and underscores the prin-
ciples by which the Group conducts its relations
with employees, business partners and other
stakeholders. It applies to all employees of the
Volvo Group and to the members of the Board
of Directors.
Suppliers, dealers, consultants and other
business partners are also encouraged to fol-
low these principles. The Code of Conduct is
applied in assessing both current and potential
suppliers.
The Volvo Group’s managers are responsible
for informing their respective organisations
about the content of the Code of Conduct and
Sustainable development
“As a vehicle manufacturer we have major
responsibility for the environment and to con-
tribute to a sustainable society. We view this
responsibility with the greatest seriousness.”
Leif Johansson
.
Long tradition of reporting
AB Volvo published its first environmental report in 1990. Sustainability
efforts have been included in the Group’s annual report since 2002. The
purpose of the sustainability report is to present the Volvo Group’s short-
and long-term sustainability efforts. The sustainability report is based on
the relevant parts of the Sustainability Reporting Guidelines elaborated by
the Global Reporting Initiative and issued in 2006. Unless otherwise
stated, the information relates to the entire Volvo Group.
Key ratios for sustainabillity
2004 2005 2006
Net sales, SEK M 202,171 231,191 248,135 Income after financial items, SEK M 13,036 18,016 20,299 Dividend, SEK M 5,055 6,775 10,120 Number of employees 81,078 81,856 83,187 of which women, % 16 17 17 Total absence due to illness of regular working hours in the Group’s Swedish companies, % n/a 5.2 4.7 Energy consumption, MWh/SEK M 13,3 11,6 10,5 Water consumption, m3/SEK M 42,2 32,1 30,6 Hazardous waste, kg/SEK M 122,1 102,0 108,8 Solvent emissions, kg/SEK M 10,3 8,5 8,3
32 Sustainable development 2006

Volvo Group supports UN’s Global CompactSince 2001, the Volvo Group has supported the UN’s Global Compact and the Treaty’s ten prin-ciples, which are based on the UN’s Universal Declaration of Human Rights, the UN Convention Against Corruption, the conventions of the International Labor Organization (ILO) on basic principles and rights in working life and the Rio Declaration on the Environment and Develop-ment.
The Global Compact was instituted to pro-mote responsible business enterprise worldwide. By supporting the Global Compact, the Volvo Group commits itself to implementing and inte-grating ten principles regarding human rights, working conditions and the environment in its operations. For more information, see www.unglobalcompact.org.
Environmental care is one of Volvo’s corpor-
ate values, along with quality and safety. As
one of the world’s largest manufacturers of
heavy vehicles, the Volvo Group has a heavy
responsibility for reducing its products’ envir-
onmental impact. If the Group succeeds in
this, it helps strengthen both its own and its
customers’ competitiveness, while at the same
time contributing to positive social develop-
ment.
Well-established,
widespread organization
The Volvo Group applies an ISO 14001-certi-
fied environmental management system. As far
as possible, the same methods are used for
sustainability reporting as for financial reporting.
All the Group’s business areas and business
units have their own quality, safety and environ-
mental managers. These issues are integrated
into the daily routines and are a normal aspect
of operational responsibility. The Volvo Group
applies integrated routines for process
improvement and product development. These
routines include review meetings with clear
goals for quality, safety and environmental per-
formance, which must be achieved before
product development projects can continue to
the next stage.
At Group level, these efforts are coordinated
by a council for each of the corporate values:
Quality, Safety and Care for the Environment.
These councils are made up of the Quality,
Safety and Environmental managers from each
business area and business unit. They support
the executive management and Board of
Directors in quality, safety and environmental
matters and act as an advisory body in Group-
wide issues.
The Group Executive Committee has ultim-
ate responsibility for sustainability efforts.
Jan-Eric Sundgren is the Group Executive
Committee member responsible for these
issues.
Quality-driven organization
The Volvo Group is a customer- and quality-
driven organization. Its products are often cru-
cial to its customers’ success and must there-
fore meet the highest possible stan dards. The
goal is to be the leader in the industry and to
achie ve the highest customer satisfaction.
The conditions for reliability and customer
benefit are already established at the product
design and development stage. The Group’s
quality concept is
based on customer
needs. By measuring
customer satisfac-
tion, the company
ensures that it
focuses on the right
things, and the results
are taken into account
in the ongoing improvement efforts.
Everyone in the organization is responsible
for day-to-day quality work. All units within the
Group have action plans for continuous
improvements. Most of the Volvo Group’s
employees work in operations covered by ISO
9001:2000 certified quality management sys-
tems.
The Volvo Group also imposes rigorous
demands on its subcontractors, who are con-
tinuously evaluated. Among other elements,
for encouraging employees to report any behav-
ior that is non-compliant with its principles.
The Code of Conduct is based on the UN
Global Compact and it offers guidelines re-
garding legislation, business partner relations,
accounting and reporting, conflicts of interest,
political involvement and stakeholder commu-
nications.
The Volvo Group has a reporting system for
behavior that may be non-compliant with the
Code of Conduct. Employees who in good faith
report actual or suspected violations may not
be discriminated against or otherwise penal-
ized. All persons handling such reports are
sworn to confidentiality.
With regard to environmental management,
the Volvo Group aims to rationalize resources
and applies the cautionary principle. The Group
routinely checks that its environmental efforts
are aligned with environmental targets.
With regard to human rights and working con-
ditions, the Volvo Group supports and respects
the protection of internationally proclaimed
human rights and works to ensure that the
Group is not complicit in human rights abuses.
Corporate values applied from the start
Everything that the Volvo Group does is driven
by an uncompromising focus on quality. Product
and service offerings should be of the highest
quality in order to provide optimum customer
value. This quality commitment requires con-
sistent working methods to be adopted
throughout the organization.
“Cars are driven by people. This means that
safety is – and must always be – the basic prin-
ciple behind everything the Volvo Group does.”
This quote is by Gustaf Larson, one of Volvo’s
founders. Right from the start, Volvo has had a
solid reputation for safety. Over the years, the
Volvo safety concept has evolved to encom-
pass safety in an increasingly broad context.
High safety standards are the basis of efficient
transport.
Sustainable development 2006 33

subcontractors must have an explicitly stated
target of delivering faultless products and ser-
vices as well as established quality manage-
ment systems, a focus on continuous improve-
ments and a holistic view of product life cycle.
Active dialog with stakeholders
The Volvo Group strives for an open dialog with
stakeholders at many different levels and in
many different contexts, and aims to communi-
cate clearly and honestly with the surrounding
world. Representatives of the Group participate
in seminars, networks and conferences with
the aim of facilitating dialogue with society as a
whole.
The main points of contact with customers
are the sales and service organizations, which
Qualified for the Dow Jones sustainability index for the fifth consecutive yearAB Volvo has qualified once again for the Dow Jones Sustainability World Index of globally lead-ing companies in the area of long-term sustain-able development. Volvo is one of the few Swedish companies to rank on both the Dow Jones Sustainability World Index (DJSI World) and the Dow Jones STOXX Sustainability Index (DJSI STOXX).
For the fifth consecutive year, AB Volvo has been included in DJSI World thanks to the Group’s sustainability efforts in economic, envir-onmental and social issues. This means that AB Volvo ranks among the top 10% of companies worldwide in terms of combining financial profit with environmental and social responsibility. AB Volvo gained particularly high ratings for environ-mental care and corporate governance. AB Volvo is one of only five Swedish com panies listed on DJSI World.
For the third consecutive year, AB Volvo is also included in DJSI STOXX, an index of lead-ing European companies in the area of long-term sustainable development.
deal with customers on a daily basis. The
Group’s partners and distributors also play an
important role in this respect. Other important
forums are customer satisfaction and quality
surveys and focus groups with customers in
areas such as product development.
The Volvo Group presents its interim reports
and financial statements to the media, analysts
and investors. In addition, representatives of
the Group meet various financial market play-
ers during the year. Interest has increased in
investing in Volvo’s shares as well as in the
Group’s sustainability efforts – particularly from
environmental and ethical funds. The Volvo
Group has enjoyed high sustainability ratings in
several surveys including the Dow Jones
Sustainability Index and Global 100.
Dialog with employees primarily takes place
during day-to-day work, but also within formal-
ized structures such as individual performance
appraisal interviews, department meetings and
staff surveys. All Volvo employees can send
questions directly to the Group CEO via the
intranet.
The Volvo Group aims to maintain an open
dialog to keep society informed about the
Group’s activities and future plans. The Group
collaborates extensively with universities and
colleges worldwide.
Volvo Group noted for its environ-mental responsibility The Volvo Group is top among Swedish compan-ies with regard to responsibility for the environ-ment, according to the Climate Index 2006 sur-vey. For the tenth consecutive year, insurance company Folksam has collected information about the environmental and climate-related operations of major Swedish corporations. The survey encompasses emissions from production as well as the results of the company’s pro-envir-onmental work with regard to cargo transport, buildings and premises, product design and busi-ness travel. The index is a collation of the com-pany’s overall emissions, undertaken climate measures and the quality of the way it pres-ents and publicizes its emissions. Some 270 Swedish stock exchange-listed companies were surveyed. Combined they account for 95 percent of the total carbon dioxide emissions in Sweden. The Volvo Group’s total points give it a leading position in the “best in class” group in Climate Index 2006.
34 Sustainable development 2006

ational responsibility. All production facilities
have environmental coordinators. Issues relat-
ing to emission levels, fuel consumption and
choice of materials are handled by the develop-
ment departments in the respective business
areas and the Group-wide development units.
Every business area has an environmental
manager. The Volvo Group also has internal
consultants with specialized expertise in areas
such as chemicals, life cycle assessments,
environmental audits and environmental pro-
tection.
Environmental targets The Group’s environmental targets are used
for follow-up purposes throughout the organi-
zation and are closely linked to its business
plans. The Volvo Group’s environmental targets
can be summarized in the following environ-
mental challenges.
The challenges facing production are:
• Reducing energy consumption by 50% per
produced unit by 2008 compared with 2003
• Doubling the use of carbon-dioxide neutral
energy by 2008 compared with 2003
• Terminating all use of oil and coal for the heat-
ing of facilities.
Challenges regarding product use:
• Achieving high fuel efficiency and low emis-
sions throughout product life cycles
• Measuring against the best
• Consistently carrying out activities to become
the industry leader
• Producing environmental data for follow-up
and communication for each new product
developed
• Implementing a strategy for tomorrow’s fuels
• Including alternative fuels and alternative
drivelines in product plans.
In productionVolvo Group has production facilities on every
continent, ranging from state-of-the-art, highly
automated factories to small-scale produc-
tion.
Regardless of size and location, all produc-
tion units must meet the Group’s minimum
requirements for environmental performance.
These requirements include guidelines for
chemical use, energy consumption, air and
water emissions, waste management, environ-
mental organization and improvement efforts.
If local laws and regulations are more compre-
hensive than the Group’s requirements, they
must be followed. Most factories meet the
requirements by a wide margin and are show-
ing constant improvement.
Regular environmental audits
Since 1989, Volvo has been carrying out envir-
onmental audits to ensure that all the plants
comply with the Group’s environmental policy.
The Volvo Group has insurance coverage for
environmentally related damage to its immedi-
ate surroundings, for instance in the event of
unexpected emissions. Newly acquired com-
panies and properties are subjected to due
diligence examinations which, in addition to
financial and legal aspects, also examine envir-
onmental factors and risks.
Environmental management systemVolvo’s Group-wide environmental policy is one
of the primary instruments for guiding Volvo’s
environmental efforts. This policy forms the
basis for the Group’s environmental manage-
ment system, strategies and targets, reviews
and measures.
The environmental policy states that the
Volvo Group’s environmental program shall be
characterised by a holistic view, continuous
improvement, technical development and effi-
cient use of resources. The policy is in turn bro-
ken down into strategies and targets for the
organization.
An environmental management system is a
tool for monitoring an organization’s specific
environmental impact. The Volvo Group’s first
system was certified in 1995. There are also
environmental management systems for other
parts of the value chain, such as product devel-
opment and marketing. At the end of 2006,
99% of the employees in the Group’s produc-
tion units were working according to certified
environmental management systems, primarily
ISO 14001:2004.
The environmental policy states a commit-
ment to expanding the Group’s environmental
program to include collaboration partners, for
instance suppliers and distributors. Environ-
mental demands on suppliers were introduced
in 1996 and are used as an integrated part of
the evaluation of suppliers and for follow-up of
various purchasing organizations.
Responsibility for environmental work at
production facilities is a normal aspect of oper-
Environmental responsibility
Environmental management is a cornerstone of the Volvo Group’s sustainable develop-
ment efforts. Environmental care is also one of the Group’s corporate values. Volvo’s
environmental work is long-term and methodical and has two clear targets: reducing
envir onmental impact from production, and reducing environmental impact from product
use.
During 2007 windpower plants will be built adjacent to the Volvo Trucks plants in Gent and Göteborg.
Sustainable development 2006 35

Activities requiring a permit
All the Volvo Group’s production facilities have
the requisite envir onmental permits. In Sweden,
there are 16 facilities that require permits.
These permits encompass waste, noise and
emissions into the air, ground and water. One
Swedish environmental permit was renewed
in 2006, and four permits are due for renewal
in 2007.
Environmental care right from the start
The Volvo Group manufactures a
large number of products with
varying environmental impact.
Whatever the product, environmental care is
considered right from
the product develop-
ment stage. Life cycle
analyses provide a
complete picture of
the Group’s products’
environmental impact
throughout their life-
span, from raw material
to waste.
Life cycle analyses of the Group’s products
show that almost 90% of their total environ-
mental impact from carbon-dioxide and other
emissions from fossil fuel combustion occur
during their use.
Environmental declarations are produced to
describe the environmental impact from some
of the Group’s key products. These declar ations
consist of three parts: production, use and
Volvo Construction Equipment decided to
invest SEK 150 M in a new paintshop at its facil-
ity in Hallsberg. The new paintshop will lead to
better quality, higher capacity, reduced costs
and many environmental improvements. Solv-
ent emissions will be halved, greenhouse emis-
sions will be dramatically reduced through
lower fuel consumption, and considerably less
waste will be generated. The new paintshop will
have its own treatment plant, which will more
than halve the discharge of water to the munic-
ipal treatment plant despite increased produc-
tion volume.
Volvo Trucks’ cab factory in Umeå imple-
mented further environmental initiatives during
the year. For instance, plastic parts will be
painted in a new paintshop to reduce the total
environmental load. This initiative will cost SEK
scrapping. The basic principle is that each new
product must cause less environmental impact
than the product it replaces, which
sets rigorous environmental requirements for
the development of new products.
The “Production” section describes aspects
such as energy consumption, emissions and
waste, while the “Use” section provides details
of fuel consumption, emissions and the use of
spare parts. The third section deals with scrap-
ping. The Group’s products are recoverable to a
large extent. For instance, up to 95% of some
trucks can be recovered. Recovered materials
are also used in production.
Environmentally adapted production
Environmental protection and respon-
sible utilization of natural resources are
obvious aspects of all production. During
the year, Volvo Trucks decided to make
its automotive facility in Gent carbon-
dioxide neutral. Today, the facility is pri-
marily heated with natural gas. Three
windpower plants and a new biofuel
plant, that will be carbon-dioxide neutral, will
be built adjacent to the facility to provide it
with electricity and heating. In 2005, Volvo
Trucks launched its first carbon-dioxide neutral
facility in Tuve, Göteborg. In Göteborg and in
Gent long-term agreements on delivery have
been made with the respective energy supplier,
who will invest in the windpower plant. Volvo
Trucks’ facility in Umeå will also be made car-
bon-dioxide neutral, and the aim is for more
production facilities to follow suit.
Hazardous wasteWater consumption
2.705
2.606
2.603
2.6
Energy, TWh
Energy/net sales MWh/SEK M
Energy consumption/net sales has been reduced by 9% in 2006.
022.7
11.6 10.514.914.5 13.4
047.405
7.606
8.603
9.2
Water, Mm3
Water/net sales m3/SEK M
Water consumption/net sales has been reduced by 5% in 2006.
028.5
32.1 30.649.152.0 42.2
0423.605
27.006
21.603
20.5
k ton
Waste/net sales kg/SEK M
Hazardous waste/net sales has increased by 7% in 2006.
0224.7
102 109124116 123
04
Volvo’s new diesel engines are leading in terms of fuel efficiency.
Energy consumption
36 Sustainable development 2006

In order to improve air quality, gov-
ernments in many countries are making
increasingly stringent demands for the
reduction of emissions, primarily nitro-
gen oxides and particulates. New,
stricter emission laws were introduced
in the EU on October 1, 2006 and in the
USA on January 1, 2007 for trucks and
buses. Even stricter requirements will be intro-
duced in a few years’ time. To meet these
requirements, the Volvo Group is continuously
developing new engine technology to minimise
fuel consumption and emissions. The primary
focus of this development work is on diesel
engines.
One of the most
im portant environmen-
tal issues is climate
change, which affects
all aspects of society.
The way in which cli-
mate issues are hand-
led will impact strongly
on glob al development.
Rising carbon dioxide
levels in the atmosphere are primarily caused
by the combustion of fossil fuels from oil, coal
and natural gas. The transport sector is
responsible for roughly 25% of fossil fuel con-
sumption, and for 25% of carbon dioxide emis-
sions. Road traffic is responsible for approxi-
mately 15%.
Climate change and access to energy
sources may strongly affect the Volvo Group. It
is therefore vital to prepare for the use of fuels
138 M and is the second stage in a total invest-
ment of SEK 650 M in the paintshop. The
investment will improve quality, cost and envir-
onmental performance.
The Volvo Group’s activities generate trans-
portation to and from production facilities. The
Group’s logistics managers regularly review
these flows and continuously make improve-
ments to considerably cut the amount of trans-
portation and facilitate a significant reduction
in total environmental impact. To assess the
environmental impact, Volvo Logistics has
developed a system for calculating environ-
mental load.
The existence of polluted land on properties
owned by the Volvo Group is cataloged every
year. This pollution generally has historic
origins. In 2006, cleaning-up activities were
conducted on six properties.
During 2006 there were no significant envir-
onmental incidents and there were no environ-
mental disputes.
For detailed environmental information about
the Volvo Group’s facilities, see page 161.
During useThe greatest environmental impact caused by
the Volvo Group’s products occurs during use.
The Volvo Group primarily uses diesel
engines in its products due to their high energy
efficiency and low emissions.
Improved fuel efficiency is a
highly effective way of reducing
carbon-dioxide emissions and cutting costs
for customers.
Solvent emission
1.905
2.006
2.003
1.9
Emissions, k ton
Emission/net sales kg/SEK M
Solvent emissions/net sales has been reduced by 2% in 2006.
022.1
8.5 8.311.210.7 10.3
04 2000
0
20
60
40
80
120
100
Emissions from highway transports in the EU.
1995 2006
CO
VOC
NOx
Bensen
CO2
SO2
PM-diesel
Source: ACEA
Sharply reduced emissions
Sustainable development 2006 37

other than crude oil. These efforts focus largely
on the development of new drivelines, energy
efficiency and alternative fuels.
Tomorrow’s transport solutions
The Volvo Group is well prepared to meet future
environmental and energy challenges. Signifi-
cant resources are invested in ongoing efforts
to improve the fuel efficiency of diesel engines
and thereby cut fuel consumption. In addition to
benefiting the envi-
ronment, this also
improves custom-
ers’ profits since
fuel represents a
sizeable share of their costs.
Meanwhile, the Volvo Group must continue
its work to adapt diesel engines for various
alternative fuels and develop new drivelines, for
instance through hybrid technology for heavy
vehicles.
Increasingly efficient engines
Since 1980, the fuel consumption
of Volvo’s trucks has dropped by
30% at the same time as the engines have
become cleaner. Over the past 30 years, diesel
engines have seen a hundredfold reduction of
regulated emissions.
Further important strides were taken in
2006. The Volvo Group presented a completely
new engine family to meet the stricter environ-
mental requirements introduced in North
America on January 1, 2007. The Volvo Group
was among the first truck manufacturers to
have its engines approved according to US’07
by the US Environmental Protection Agency.
The US has a highly ambitious plan for
reducing emissions from heavy traffic. Starting
from 2007, the proportion of nitrogen oxide
and particulates will be reduced by 50% and
90% respectively in new engines. Emission
requirements in the US will become even
stricter in 2010.
In Europe, the Group’s heavy engines meet
the stricter Euro 4 emission requirements that
took effect on October 1, 2006. Meanwhile,
Volvo has developed an engine that already
meets the new requirements to take effect in
2009. Since April 2006, a refuse truck has
been in use with a D13 engine that meets Euro
5 requirements – three years before these
requirements come into force. This is the
Group’s first delivery of a Euro 5 product.
Alternative fuels
A diesel engine is a
highly effective energy
converter and can run
on various fuels such as synthetic diesel and
DME (dimethyl ether). Diesel engines provide
the basis for various types of hybrids with elec-
tric motors, batteries and fuel cells. The Volvo
Group is a leader of this development.
In 2006, the Swedish National Energy
Administration awarded AB Volvo a grant of
SEK 62 M for the development of third-genera-
tion DME engines for heavy vehicles between
2006 and 2010. The project will generate
automotive technology for a major field test of
DME-powered trucks, which is scheduled for
2009 and 2010. The Volvo Group is also invest-
ing heavily in the project.
Other interesting renewable fuels are biodie-
sel (FAME, Fatty Acid Methyl Esters) and bio-
gas. FAME works splendidly in low-blends with
conventional diesel fuel. Minor adjustments of
the engines will make them run on 100 %
biodiesel. Biogas emits minimal amounts of
particulates, nitrogen oxides, carbon-dioxide
and the level of noise in the vehicle is also lower.
This makes biogas particularly suitable for
vehicles in city traffic.
All heavy trucks and buses registered in EU coun-tries from October 1, 2006, onwards must meet Euro 4 requirements. An engine that meets Euro 3 requirements differs significantly from a Euro 4-compliant engine in terms of its exhaust gas emissions. Emissions of nitrogen oxide (NOx) must be cut from 5 to 3.5 g/kWh, a decrease of 30%. Particulate emissions (PM) must drop from 0.1 to 0.02 g/kWh, a reduction of 80%. Euro 5, which takes effect on October1, 2009, will reduce NOx emission levels by half compared to Euro 4.
US 10, 2010
US 07, 2007
0.16
0.14
0.12
0.10
0.08
0.06
0.04
0.02
0.00
Particles g/KWh
NOx g/KWh
0 1 2 3 4 5 6 7 8
Euro 2, 1996
Euro 3, 2002
Euro 4, 2006
Euro 5, 2009
US 02, 2002
Emission standards for trucks and buses
Nitrogen oxide and particulate emissions have fallen by about 60% since 1996. When Tier 3 was introduced, Volvo Construction Equipment launched products equipped with the new V-ACT technology (Volvo Advanced Combustion Technology), which minimizes emissions by adjusting the combustion process in the engine. Nitrogen oxide and particulate emissions will decline by a further 90% by 2014 compared with today’s Tier 3 level.
Emission standards for construction equipment
Engine Power: 130-225 KWParticles g/KWh
Tier 4B, 2014Tier 4A, 2011
0.6
0.5
0.4
0.3
0.2
0.1
0
NOx, g/kWh80 1 2 3 4 5 6 7 9
Tier 1, 1996
Tier 2, 2002Tier 3, 2006
Both Europe and North America are introducing increasingly strict emissions laws.
38 Sustainable development 2006

Hybrid technology
for heavy vehicles
In March, the Volvo
Group presented a
hybrid solution capa-
ble of producing up
to 35% energy savings in heavy vehicles. This
solution offers the highest fuel savings in situ-
ations in which the driver frequently brakes and
accelerates, for instance in urban bus trans-
port, urban distribution operations, refuse-col-
lection duties and construction operations.
Furthermore, the vehicle’s maintenance costs
can be lowered through reduced wear on the
brake system. The diesel engine in the hybrid
solution can also be powered by biofuels to
achieve carbon-dioxide neutral transport.
The Volvo Group is also involved in develop-
ing a new type of battery, Effpower, based on
the proven lead-acid tech-
nology used in today’s
starter batteries. The new
technology doubles the bat-
teries’ power output and their production cost
can be considerably reduced compared with
other available alternatives. Effpower can make
electric hybrids even more cost-effective.
More information
Visit www.volvo.com for more
information about Volvo’s environmental efforts:
policies, environmental information on products
and production, emission laws and educational
material.
Cross-section of a particulate trap. Using particulate traps is one way of reducing emissions of particu-lates.
Volvo’s Environmental Prize
awarded to three pioneers in
marine ecosystems
Volvo’s Environmental Prize for 2006 was
awarded to three distinguished scientists for
their research regarding human impact on
global fishing waters and marine environ-
ments.
The researchers, Professor Ray Hilborn of
the University of Washington in Seattle and
Professors Daniel Pauly and Carl Walters of
the University of British Columbia in Vancouver,
won the prize for developing analysis tools that
monitor the rapidly changing threats to marine
ecosystems.
Volvo’s Environmental Prize was introduced
in 1988 to support and acknowledge environ-
mental research and development, and has
become one of the world’s most prestigious
environmental awards.
The prize money of SEK
1.5 M is aw arded by
the Foundation
of The Volvo Environmental Prize.
1980 1985 1990 1995 2000 2005 2010
0Source: Volvo
10
20
30
40
50
Development of fuel consumption, Volvo truck model FH12, 40 tons.
Decreased fuel consumption, l/100 km
The Volvo Group’s engines are becoming increasingly fuel efficient.
Internal Environmental Prize awarded to
Volvo Trucks North America
The Volvo Group’s Internal Environmental Prize
was awarded to a group of employees at Volvo
Trucks North America for several environment-
enhancing initiatives at the truck plant in New
River Valley, Virginia.
The winning team comprised Stephen
Pierett, Michael Kijak, Frank Stanley, Channon
Maycock, Danny Arnold and Thomas Newcomb.
Thanks to the team’s efforts, the water used for
testing operations was reduced by half between
2003 and 2005 and a system for recycling pro-
cess water was installed. Through automatic
lighting, automation and control of the build-
ing’s heating and cooling system, energy con-
Sustainable development 2006 39

sumption per produced truck dropped by over
60% between 2001 and 2005. Through
increased waste separation and a recycling
program, the quantity of deposited waste was
halved between 2000 and 2005, while recy-
cling increased by over 75%. The investments
in the project paid off in less than three years,
and the long-term savings are estimated at
around SEK 11 M per year.
Thanks to its dramatic reduction of green-
house emissions, the New River Valley factory
is among the leading vehicle factories in the so-
called Climate Leader program instituted by
the American EPA environmental agency to
reduce carbon-dioxide emissions. Emissions
dropped by 27% per produced truck in 2003–
2004.
Environmental Prize awarded to Volvo
Powertrain North America
Volvo Powertrain in Hagerstown, Maryland, in
the US was awarded a prize by the organiza -
tion Businesses for the Bay for outstanding
environmental efforts. Volvo Powertrain in
Hagerstown manufactures engines for Mack
Trucks and Volvo Trucks in North America.
Businesses for the Bay works to protect and
preserve the environment around Chesapeake
Bay in Maryland on America’s east coast. Volvo
Powertrain has implemented several positive
environmental measures at its factory and has
won the prize for “Outstanding Achievement for
Pollution Prevention at a Large Facility”.
Volvo Powertrain has carried out numerous
environmental initiatives for sustainable devel-
opment. These include introducing a new, more
efficient heating system that can operate on
non-fossil fuels. All leakage water from produc-
tion processes is cleaned and recycled at the
factory, for instance as cooling water. The
building’s lighting and insulation systems have
been upgraded to maximize energy efficiency.
Social responsibility
The Volvo Group aims to be a good citizen that complies with laws
and regulations and generally acts responsibly and respectfully.
The Volvo Group promotes equal opportunities, fairness and diver-
sity. Employees should be offered stimulating work in a healthy, safe
environment.
The Group’s employees and their knowledge and competence are a crucial prerequisite in achieving the corporate vision.
their own skills. By putting words into action,
focusing on implementation and carrying out
necessary changes faster than the competi-
tion, the Volvo Group aims to secure long-term
success.
The employees’ working conditions
Achieving success on individual markets
requires extensive knowledge of the conditions
prevailing on that market. It takes a long time to
build up this knowledge and experience, so it is
vital that the composition of management and
other employees throughout the world reflects
the societies in which
they operate. At all the
larger facilities, the
majority of the manag-
ers and employees are
from the country or
region in question.
All employees have access via the intranet to
guidelines regarding HR policies, values,
recruitment and employment, salaries and
benefits, employee appraisal sessions and
competence development.
The policy for wages, salaries and remunera-
tions is based on the Group’s basic values and
principles as formulated in The Volvo Way. They
support the Group’s efforts to realize its visions
and business goals.
Wages, salaries and remunerations should
contribute to Volvo’s image as an attractive
company. Behavior in line with the Company’s
Volvo as an employerThe Volvo Group’s vision is to be regarded as a
globally leading supplier of commercial trans-
port solutions. The Group’s employees and
their knowledge and competence are a crucial
prerequisite in achieving this vision. The Group
aims to be the first-choice employer of both
current and future employees.
The Group had 83,187 employees at the end
of 2006. Each employee is part of a team and is
expected to participate actively in the Group’s
development, change process and future. To
support this aim, an environment character-
ized by energy,
passion and res-
pect for individuals
is required.
Corporate
culture a determining factor
The ability to develop a competitive corporate
culture is of critical long-term importance to
the Group’s profitability. Unlike technologies,
strategies, structures and business models, a
corporate culture is unique and difficult for
competitors to copy.
The Volvo Group’s values and culture are
outlined in the book entitled “The Volvo Way”,
whose principles guide both managers and
employees in their daily work.
The Volvo Way is based on the conviction
that all employees have the ability and desire to
improve operations and, by so doing, to develop
40 Sustainable development 2006

Volvo do Brasil voted best employer For the consecutive year, Volvo do Brasil was voted the best employer in the Brazilian transport sector. The poll was conducted by business magazines Exame and Você S/A. Volvo also achieved the highest work enjoyment rating among major companies and was named the company with the best occupational health ser-vices. Volvo also ranked highly in the categories of Identity, which measures the company’s val-ues, products and visions, Personal Development, and Work Satisfaction and Motivation. 150 com-panies in 20 different industries participated in the survey.
Award for health-enhancing projectThe ergonomics team at Mack’s Macungie facil-ity recently received the newly instituted Volvo Group Health and Wellbeing Award at a cere-mony in Allentown PA, in the US. Craig Souders, Greg Mikols and Dave Peirson have been work-ing since 2002 to improve ergonomics at the Macungie facility.
This work has lead to a dramatic reduction in the number of muscular strain injuries – from around 200 to just over 10 injuries. The team won first prize for “contributing to a substantial rise in the standard of ergonomics efforts, which may provide great inspiration to other companies in the Volvo family”.
The Volvo Group Health and Well-being Award 2006 is a newly instituted award designed to recognize and reward health improvement proj-ects in the Group.
In recent years, the Volvo Group has placed increased emphasis on health and on sickness absenteeism.
Reduced sickness absenteeism can improve
the quality of life of the individuals concerned
and also help cut costs for the Volvo Group.
These efforts encompass workplace ergo-
nomics, health risks and how to prevent them,
various support programs, health examinations
and health issues in connection with work-
related travel and stationing abroad.
Continuous competence development
Competence development is a continuous pro-
cess that is supported by an internal training
organization. This organization offers em-
ployees a wide
range of cour-
ses and train-
ing programs in
such areas as
diversity and culture, leadership development,
project work, business understanding, eco-
nomics, technology, personal development,
communication, IT and languages. All courses
are designed to help achieve the Group’s busi-
ness targets.
It is the shared responsibility of managers
and employees to ensure that each team has
the necessary skills, expertise and resources
to become successful. Each employee should
attend an annual performance appraisal inter-
view with his or her immediate supervisor.
Leaders throughout the organization are
expected to involve their teams in the decision-
making process and subsequently focus on
execution. Customer focus, open dialog, feed-
back and personal commitment are key prin-
ciples in The Volvo Way, aimed at aligning
Group strategies and objectives with daily
teamwork. Objectives and goals are estab-
lished for each unit, department and work team
and to a large extent also for employees them-
selves during the individual performance
appraisal interviews.
Future leaders
A so-called Leadership Supply Process is used
to secure access to future leaders. The aim is to
identify, develop and retain employees with a
talent for leadership in a systematic, transpar-
ent manner, in order to secure access to quali-
fied, motivated leaders in key positions at all
levels.
The Leadership Supply Process is linked to
the Group’s strategy process. Its starting point
is the annual Performance Development
Appraisal process, where leaders and employ-
ees meet to discuss the employee’s perfor-
mance during the year in relation to the agreed
targets, personal competence, future potential
and other issues. The appraisals also offer
employees an opportunity to clarify and obtain
feedback on their professional ambitions.
At the next stage, the leadership teams are
used at all levels to link the discussion regard-
ing strategy and business to the competence
required to meet the company’s business tar-
gets and to the employees’ current compe-
tence. The employees’ performance, future
potential, competence development and career
development are also discussed.
values is rewarded. Extra efforts, qualifications
and responsible attitudes are valued highly.
Other highly valued attributes are innovation,
internal mobility, international work and, par-
ticularly, strong leadership. The principles gov-
erning wages, salaries and remunerations
should be clear and familiar to everyone.
Wages and salaries should be individual and
differentiated, and should be based on the
same grounds for all employees. Wages and
salaries should:
• reflect the task’s level of difficulty and the
employee’s performance
• be clearly linked to the
company’s business and
results
• stimulate a desire for
competence development
leading to new or broader duties
• encourage cooperation and knowledge
sharing
• be market-linked.
Work environment
The Volvo Group works to promote a creative,
healthy and energizing work environment with-
out health hazards, a positive environment that
helps make the company more profitable and
attractive. Work environment efforts include
examining, implementing and following up
activities in order to prevent illness and acci-
dents and achieve a healthy work environment.
Improving the work environment should be a
natural part of the daily routines.
As part of Volvo’s work environment efforts,
more and more of the Group’s operations are
being certified in accordance with OHSAS
18001, the international standard for work
environment management systems. This sys-
tem is a tool for checking work environment
risks and making any necessary improvements,
which in turn are subsequently followed up.
Preventative health care and
rehabilitation
In recent years, increased emphasis has been
placed on health and on sickness absenteeism.
Sustainable development 2006 41

Key figures
2004 2005 2006
Number of employees at year-end 81,078 81,856 83,187 Share of women, % 16 17 17 Share of women, Board members, % 15 10 11 Share of women, Presidents and other senior executives, % 16 16 15
Absence due to illness in the Group’s Swedish companiesTotal absence due to illness of regular working hours, % 5.2 4.7 of which continuous sick leave for 60 days or more, % 51.4 49.6 Absence due to illness (as percentage of regular working hours) by gender Men, % 4.9 4.4 Women, % 6.7 5.7 Absence due to illness (as percentage of regular working hours) by age 29 years or younger, % 4.8 4.1 30–49 years, % 4.9 4.7 50 years or older, % 6.2 5.1
Greater diversity – a strategic goal
Among other items, the Volvo Group’s Code of
Conduct prescribes that the Group must sup-
port human rights and that no employee must
be discriminated against on grounds of gender,
race, religion, age, disability, sexual inclinations,
nationality, political conviction, trade union
membership, social or ethnic origin.
One of the Group’s strategic goals is to raise
awareness about and capitalize on the diversity
that exists throughout the organization. For an
international group with global operations, it is
essential that the organization actively reflects
its customers and understands the conditions
prevailing in local markets, different cul-
tures and future employees’ require-
ments. Diversity generates creativity, which in
turn leads to innovation, a prerequisite for suc-
cess.
There are various diversity networks within
the Volvo Group, and several units have diver-
sity managers responsible for promoting ongo-
ing improvement in this area.
Volvo Group Attitude Survey
The Volvo Group Attitude Survey is an annual
Group-wide survey documenting employee
attitudes toward their work and what improve-
ments are required. The results of the survey
are compiled and discussed within each team
to identify key improvement areas.
The proportion of satisfied employees has
steadily improved in recent years. In 2006, the
Fredrik Lindvall, assembling the RM12 engine at Volvo Aero in
Trollhättan, Sweden.
42 Sustainable development 2006

Number of satisfied employees
8305
8406
7703
7402
8104
Sweden 33%
Europe, excl. Sweden 36%
North America 18%
South America 5%
Asia 5%
Other 3%
Geographic distribution of employees, %
SponsorshipSport and culture have been the focus of the Volvo Group’s sponsorship since the 1970s. The activities that the Volvo Group chooses to spon-sor have points of reference with our customer groups. The aim of this sponsorship is to intensify our customer relations and strengthen the Volvo Group’s brands. Volvo currently has six long-term sponsorship commitments: the Volvo Ocean Race, the Volvo Masters golf tournaments in Europe and Asia, Volvo China Open, the Göteborg Symphony Orchestra, the Göteborg Opera and the Nobel Museum in Stockholm. In addition, Renault Trucks sponsors the Olympique Lyonnais football team.
share of satisfied employees was 84%, com-
pared with 83% the year before, 81% in 2004
and 77% in 2003. Other key indicators monitor
how well each manager involves and communi-
cates with his or her team members, provides
feedback on performance and contributes to
resolving conflicts.
Cooperation with trade
union organizations
The right to be a trade union member and the
right to negotiate collective agreements are
respected throughout the Volvo Group. In
Europe, the Volvo European Works Council was
formed in 1996 to create a forum for dialog
between the employer and employees. Volvo
European Dialog is a forum in which employer
and employee representatives meet once a
year. The Chairman is the Volvo Group’s
President Leif Johansson. In addition to this
forum, the employee representatives have two
meetings per year. Representatives of various
production units outside the EU are invited to
attend one of these meetings every two years.
About fifteen non-European employees
attended such a meeting
in Lyon in 2006.
The Volvo Group was
not involved in any labor
market conflicts in 2006.
It sometimes be comes necessary to restruc-
ture parts of the Volvo Group’s operations, for
instance to meet market requirements.
Restructuring is always carried out in compli-
ance with the laws, rules and practices that
apply in the relevant
country.The Volvo Group aims to function as an active partner in society.
Sustainable development 2006 43

Volvo Group in societyThe Volvo Group is extensively involved in social
issues, which are important because the Group
is a major employer in many communities and is
active in areas of considerable public interest.
The Group’s social involvement is based on
issues such as safety and environmental care.
The Volvo Group aims to function as an active
partner in society and to contribute in various
ways to positive social development in cooper-
ation with local authorities, voluntary organiza-
tions and private citizens.
The Volvo Group respects suppliers’ and
customers’ right to integrity and privacy and fol-
lows prevailing laws, regulations and recog-
nized industrial standards for marketing, PR
and sponsorship. No known transgressions
occurred in these areas during the year.
The Volvo Group does not contribute funds
to political parties or religious organizations.
The Volvo Group has occasionally engaged
in discussions about providing funding for vari-
ous infrastructure projects. So far, the Group
has decided against providing such funding.
Human rights
The Volvo Group’s Code of Conduct regulates
the company’s views on human rights, which
are based on the UN declarations. The Volvo
Group tolerates no form of child labor or forced
labor, and works for equal rights, fairness and
diversity. The minimum age for employment is
the age at which compulsory schooling ends.
The Volvo Group’s business partners are also
expected to follow these principles, regardless
of where in the world they operate.
Training on the Code of Conduct
The Volvo Group has well-established, strong,
valuable brands. It is vitally important for the
Volvo Group to familiarize all employees with
the Group’s Code of Conduct and ensure that
they follow its principles.
The Volvo Group has approximately 6,500
managers worldwide. Of these, 5,358 have
received training on the Code of Conduct. One
of the steps involves online training, which is
available in eleven languages. This online train-
ing was rated as good or excellent by 5,347
managers. The training also encompassed the
Volvo Group’s website and press articles. Some
88% of the managers responded that they had
asked their staff to report behavior that violated
the principles in the Code of Conduct. Further
training will be organized for the approximately
1,300 people who have not yet reported how
they work with the Code of Conduct. The man-
agers are responsible for ensuring that the
other employees are familiar with the Code of
Conduct’s content. A full 74% of employees
report that they have received information on
the Code of Conduct.
In November 2006, an online training pro-
gram on corruption was launched for all man-
agers, 5,491 of whom had completed the train-
ing by year-end. All salaried employees will
receive this training in 2007.
Cooperation in trade associations
The Volvo Group is a member of several employ-
ers’ organizations including the Confederation
of Swedish Enterprise (Svenskt Näringsliv),
and trade associations including the Euro -
pean Automobile Manufacturers Association
(ACEA).
The Volvo Group also works together with
the European Commission to improve legisla-
tion for the control of emissions from vehicles
that are in use and are required to comply with
the emission standards in Euro 4 and the com-
ing Euro 5.
The Volvo Group is involved in various auto-
motive research programs in Sweden, France,
the US and other countries. One example is
Green Car, an initiative for advanced automo-
tive technology focusing on environment and
growth for a sustainable society.
Collaboration with universities
and colleges
Sharing knowledge with other stakeholders is
one of the principal objectives of the Volvo
Group’s projects and partnerships, as
exemplified by the Future Urban
Transport Foundation, in
which the company
exchanges knowledge
with universities and
research insti-
44 Sustainable development 2006

tutes regarding future transport in urban areas.
The Group also collaborates extensively with
universities and colleges in many countries and
has initiated several projects of social interest.
The Volvo Group participates in many dif-
ferent projects at local, national and
global level, some of which are
described on the Volvo Group’s
website, www.volvo.com.
Leaders in safetyThe increasing number of
vehicles on the roads, com-
bined with increasingly high
traffic speeds, raises safety
requirements for both driv-
ers and vehicles. For the
Volvo Group, safety is about
how its products are used in
society. The company works consis-
tently to minimize the risk and conse-
quences of accidents, and to improve
drivers’ safety and work environment.
The program’s first focal point is accident
prevention. Human errors or misjudgements
are decisive or strongly contributory causes of
most traffic accidents, a fact that reflects the
importance of preventative safety characteris-
tics such as good visibility, driving qualities and
brakes. The human factor is also the most com-
mon cause of accidents involving construction
equipment.
The second focal point is injury prevention.
The Volvo Group is a leader in designing ve-
hicles that protect the driver and passengers in
the event of a collision. Safety solutions include
rollover-tested cabs and bodies, frontal colli-
sion protection, deformation zones, seat belts,
deformable fittings and airbags. Seat belts are
by far the most important safety feature.
From an early stage, the Volvo Group has
worked on improving safety for other road-
users. A large proportion of accidents between
trucks and passen-
ger cars involve fron-
tal collisions. As
early as 1996, the
company introduced
the Front Underrun Protection System to pre-
vent passenger cars from becoming wedged
beneath trucks in a frontal collision. This pro-
tection system has been fitted as standard to
Volvo trucks in the EU since 2001, and in 2003
the protection system became a legal require-
ment in EU countries. Accident investigations
show that the Front Underrun Protection
System substantially reduces injuries.
The Volvo Accident Research Team
During the year, the Volvo Group and Volvo Car
Corporation launched a joint Traffic Accident
Research Center in China. Through on-site
traffic accident research, Volvo builds know-
ledge to help develop safer vehicles and also
hopes to contribute to better road traffic safety
in the world’s most populated country.
The Volvo Group has the automotive indus-
try’s most advanced traffic accident research.
With a center in Göteborg since the early 1970
and local research activities in the US, the
Group has built up a unique databank with
detailed information about nearly 40,000 acci-
dents involving over 50,000 drivers and pas-
sengers.
Many of the safety systems introduced in
trucks and buses over the years originate from
data collected from real accidents by the Traffic
Accident Research Team. Some examples are
the deformable steering column, the Front
Underrun Protection System (FUPS) and the
Electronic Stability Program (ESP). Volvo
Buses aims to install ESP in tourist buses and
seat belts in all its vehicles by 2010.
Seat belt reminder becomes standard
in Volvo trucks
To further increase safety for truck drivers,
Volvo Trucks is introducing an acoustic seat
belt reminder as standard in all vehicles on the
European market.
Statistics show that
most drivers killed or
injured in traffic acci-
dents were not using
seat belts. According to
the research results compiled by Volvo Trucks’
Traffic Accident Research Team, seat belts are
highly effective in at least 60% of traffic acci-
dents and could help save a great many lives
each year if used correctly.
Volvo offers breathalyzer equipment
for ferries stopping in Sweden
The Volvo Group offers shipping companies
the opportunity to equip ferries stopping in
Sweden with special breathalyzer equipment
free of charge. The idea is to allow truck and
bus drivers using the ferries to voluntarily check
whether they are within Swedish alcohol limits.
Since October 1, 2006, all Stena Line ferries
calling at Swedish ports have been equipped
with breathalyzers.
Safer workplaces as Volvo Construction Equipment invests in safety helmetsConstruction sites are among the worksites with the highest accident rates. To address this prob-lem, Volvo Construction Equipment initiated a campaign for improved construction site safety in 2006. Volvo Construction Equipment has developed a safety program in which safety prob-lems are tackled at three levels: people, machin-ery and workplace. Volvo’s protective helmets will be the most visible element of a broad initiative to improve health and safety for construction workers.
The Volvo Group works consis-tently to minimise the risk and consequences of accidents.
Sustainable development 2006 45

Cooperations and acquisitionsAB Volvo became major
shareholder in Nissan Diesel
On February 20, 2007,
Volvo made a public
offer to acquire the
Japanese truck man-
ufacturer Nissan
Diesel. The offer,
which is supported by Nissan Diesel’s Board of
Directors, means that Volvo offers JPY 540 in
cash per share and the total value of Volvo’s
offer amounts to SEK 7.5 billion. Volvo already
owns a 19% holding in Nissan Diesel and pref-
erence shares which can be converted to an
additional 27.5%, after full dilution.
Volvo’s offer for Nissan Diesel represents a
premium of 32% based on the average prices
during the past three months. The offer is open
through March 23 and is not conditional upon a
lowest level of acceptance, but is dependent on
the necessary approvals from the anti-trust
authorities. Volvo anticipates that payment can
be made for acquired shares on or about March
29, 2007. If the offer for Nissan Diesel is imple-
mented, Volvo will have paid a total of SEK 13
billion for all shares, corresponding to JPY 469
per share.
In 2005, Nissan Diesel sold approximately
42,000 trucks and buses. In Japan, Nissan Diesel
holds a market share of about 24% in heavy
trucks and 15% in the medium-heavy segment.
“Nissan Diesel’s products and know-how
represent a valuable complement to the
Group’s truck business. Nissan Diesel
holds a solid position in Japan and the rest
of Asia where the Volvo Group foresees
substantial growth potential.” Leif Johansson
Significant eventsThe Volvo Group 2006
The year 2006 was eventful, with extensive
product launches and major changes in the
industrial system, particularly toward the end
of the year. Despite this, we posted the best
year in history, in terms of sales and earnings.
Net sales1, SEK billion
05
231.2
06248.1
03
174.8
02177.1
04202.2
Operating income1, SEK billion
05
18.2
0622.1
03
2.5
022.8
0414.7 2
In the Board of Directors’ Report through page 85, Financial Services is reported in accordance with the equity method.
1 As from 2004 figures are reported in accordance with IFRS. Previous years are reported in accordance with the then prevailing Swedish GAAP. See note 1 and 3.
2 Excluding adjustment of goodwill.
Board of Directors’ Report
46 Board of Directors’ Report 2006

Sales in 2005 amounted to about SEK 32.5
billion. The company has 8,900 employees.
The study of coordination possibilities car-
ried out jointly by Volvo and Nissan Diesel iden-
tified synergies over five years of about EUR
200 M annually, slightly more than SEK 1.8 bil-
lion. The major portion of the integration gains
is as a result of increased purchasing volumes,
but positive effects also arise within product
development, engines and drivelines. Other
gains arise in that the companies have access
to each other’s dealer and service networks,
primarily in Asia but also in other parts of the
world.
Volvo assesses that the net interest-bearing
debt in Nissan Diesel in accordance with IFRS
amounts to about SEK 7.5 billion. Accordingly,
at full consolidation Volvo’s net financial pos-
ition, including the purchase consideration, will
decline by SEK 15 billion.
In March 2006, Volvo acquired 40 million
shares in Nissan Diesel, corresponding to 13%
of the votes and capital. In September of the
same year, Volvo increased its ownership to
58.2 million shares corresponding to 19% of
votes and capital. At the same time, Volvo pur-
chased all 57.5 million preference shares in the
company that through 2014 can be converted
in stages and which in 2014, after full conver-
sion, can provide Volvo with 46.5% of the votes
and capital in the company, after full dilution.
The acquisition strengthens the Volvo
Group’s Asian strategy and is intended to pro-
vide the Group with access to Nissan Diesel’s
dealer and service network in Japan and
Southeast Asia, and create a further industrial
cooperation with Nissan Diesel in such areas as
engines and transmissions.
AB Volvo, Nissan Motor and Dongfeng
Group, intend, together with Chinese authori-
ties, to evaluate how to best develop Dongfeng
Motor Co Ltd’s commercial vehicle business.
Dongfeng Motor Co. Ltd is jointly owned by
Nissan Motor and Dongfeng Group.
Agreement between Renault Trucks
and the GAZ Group
On June 19, Renault Trucks signed a frame-
work agreement granting the GAZ Group of
Russia to manufacture the Renault dCi 11
engine under license. The engines will be man-
ufactured for the Russian market and the CIS
states (Commonwealth of Independent States).
GAZ Group is a Russian automotive group with
operations that include the manufacturing of
trucks, buses, construction equipment and
cars, and the aim is to use Renault Trucks’
engines in the various vehicles. The agreement
includes the purchase of certain manufactur-
ing machinery and the possibility of using the
tooling as well as training.
Volvo plans bus body cooperation in India
Volvo Bus Corpora-
tion and the Indian
company Jaico Auto-
mobiles have reach-
ed an agreement to
start a joint company
in India for production of bus bodies based on
Volvo Buses’ body technology. Volvo Buses will
be the majority owner with a 70% stake in the
new company, which plans to build a new plant
with a capacity of 1,000 bus bodies per year.
The bus bodies will primarily be used for Volvo
buses and coaches in the Indian market, but
the new company will also investigate possibili-
ties to export buses to other Volvo markets.
Jaico Automobiles is a company in the Azad
Group, which carries out body building produc-
tion in Bangalore and Jaipur.
Volvo Construction Equipment
invests in China
In 2006, Volvo
Construction Equip-
ment (Volvo CE)
signed an agreement
covering an equity
investment of 70% in
Shandong Lingong Construction Machinery
Co. China is the world’s largest market for
wheel loaders. The total market in 2005 was
approximately 110,000 units. Lingong is the
fourth largest producer of wheel loaders in
China with a comprehensive dealer network
throughout the country. In addition to 16 differ-
ent models of wheel loaders, Lingong also has
a smaller range of backhoe loaders, road rollers
and excavators. Lingong has around 1,800
employees and in 2005 posted sales of SEK
2 billlion.
In January 2007, it was announced that all
necessary regulatory approvals for the equity
investment of 70% in Lingong were received
and the deal is now closed. Volvo CE has
invested RMB 328 M, corresponding to slightly
more than SEK 300 M, in exchange for 70% of
the equity in Lingong. In 2005 Lingong’s oper-
ating income was RMB 10 M on revenue of
RMB 2 billion. The deal has no material impact
on Volvo’s financial position.
Strategic decision on closure of Volvo
Aero’s operations in Bromma
In November, it was announced that Volvo Aero
had initiated codetermination negotiations with
the trade unions relating to the closure of Volvo
Aero Engine Services (VAES) in Bromma,
which conducts overhaul of large aircraft
engines. In recent years, the volumes of the
engines overhauled in Bromma, the JT8D and
JT9D, have declined sharply. Among other
actions, VAES has tried to offset the declining
volumes through complementing operations
with a third engine type, the PW4000, but vol-
umes have not reached the levels required. The
company has investigated other possibilities,
but all attempts have failed.
VAES in Bromma employs 456 persons, 145
salaried employees and 311 skilled workers. In
accordance with the strategic decision, the
operations will be gradually phased out during
2007. Costs for a closure are estimated to SEK
258 M.
Board of Directors’ Report 2006 47

Dongfeng Motor Group, Nissan Motor
and AB Volvo deepen discussions on
possible future cooperation
In January 2007, it was announced that
Dongfeng Motor Group Company Limited
(DFG), Nissan Motor and AB Volvo is deepen-
ing discussions on a possible AB Volvo invest-
ment in the heavy and medium-duty commer-
cial vehicle business currently included in
Dongfeng Motor Co, Ltd (DFL) – the Chinese
joint venture between DFG and Nissan Motor.
Nissan Motor will focus on passenger cars
and light commercial vehicles and has divested
its holding in Nissan Diesel to AB Volvo.
Subsequently, DFG, Nissan Motor and AB Volvo
initiated discussions at the end of 2006 with the
Chinese authorities on the future possible co-
operation of the parties. DFG intends to estab-
lish more competitive alliances with Nissan and
AB Volvo respectively, in order for all parties to
achieve the best development in their special-
ized field.
To move forward on this issue, DFG, Nissan
Motor, DFL and AB Volvo also have signed a
non-binding framework agreement with the
intention of AB Volvo to invest in the heavy and
medium-duty commercial vehicle business and
future engine business, while Nissan Motor
remains committed to the long-term coopera-
tion with DFG regarding passenger vehicles and
the light commercial business. Any future defini-
tive agreement regarding such a transaction will
be subject to approval by Chinese authorities.
Renault Trucks in agreement with Nissan
Motor regarding distribution of light
trucks
Renault Trucks announced in January 2007
that it had signed a distribution agreement cov-
ering the Renault Maxity light-duty vehicle with
the manufacturer Nissan Motor. An agreement
in principle was signed in February 2006.
Renault Maxity is a cab-over-engine light-duty
vehicle developed and produced for Renault
Trucks by Nissan Motor. Sales by Renault
Trucks’ dealers will begin in March 2007.
Renault Maxity complements Renault Trucks’
existing range of light trucks, comprising
Renault Master and Renault Mascott, and is
produced in a range of weight classes from 2.8
to 4.5 tons, with three engine alternatives.
Company informationAnnual General Meeting of AB Volvo
At the Annual General Meeting of AB Volvo
held on April 5, 2006, the Board’s proposal to
pay a dividend to the shareholders of SEK
16.75 per share, a total of about SEK 6,775 M,
was approved.
Per-Olof Eriksson, Tom Hedelius, Leif
Johansson, Louis Schweitzer and Finn
Johnsson were re-elected members of the
Board of AB Volvo and Ying Yeh, Philippe Klein
and Peter Bijur were newly elected. Finn
Johnsson was elected Board Chairman.
The Meeting resolved to establish a share-
based incentive program during the second
quarter of 2006 for senior executives in the
Volvo Group. The program mainly involves that
a maximum of 518,000 Series B shares in the
Company could be allotted to a maximum of
240 senior executives, including members of
the Group Executive Committee, during the
first six months of 2007. The allotment shall
depend on the degree of fulfillment of certain
financial goals for the 2006 fiscal year, which
have been set by the Board. For more informa-
tion on share-based incentive programs see
note 34 pages 127 to 129.
Volvo Board decided on new
financial targets
AB Volvo’s Board
of Directors has de-
cide d to adopt new
financial targets for
the company. The
decision is based on
the Board’s assessment that Volvo today has a
structurally higher profitability, stronger cash
flow and a different risk profile. The Board
focuses on three external financial targets cov-
ering growth, operating margin and capital
structure.
The previous target for operating margin
was 5-7% over a business cycle, including the
operations within Volvo Financial Services. The
new target for operating margin is more than
7% over a business cycle and includes all oper-
ations within the Group except Volvo Financial
Services, which currently contributes approxi-
mately another 1 percentage point. The
restricting ratio for net debt to equity has also
been increased from 30% of shareholders’
equity to 40% of shareholders’ equity. With
regard to the Group’s growth target, the Board
has chosen to retain the target of an annual
growth of at least 10%.
Reversal of reserve for tax receivables
yields positive earnings effect
AB Volvo has decid-
ed to reverse a valu-
ation reserve for
deferred tax receiv-
ables in the Mack
Trucks Inc. subsid-
iary. The decision is based on the fact that Volvo
assesses that the company has a long-term
higher profitability. Reporting of the deferred
tax receivables reduced tax expenses in the
income statement in the third quarter by SEK
2,048 M. In accordance with prevailing
accounting rules, Volvo is adjusting goodwill by
SEK 1,712 M, which affects operating income
adversely. The combined earnings effect for
the third quarter was a positive SEK 336 M.
48 Board of Directors’ Report 2006

New productsVolvo Group premiered hybrid
technology for heavy vehicles
In the beginning of
March, Volvo Group
presented a new, effi-
cient hybrid solution
for heavy vehicles.
The Volvo Group’s
hybrid concept provides maximum fuel-saving
effects on routes with frequent braking and
accelerations, for example, city bus traffic, city
distribution, refuse collection and construction
work. Calculations indicate that fuel savings
can amount to 35% in these applications.
Volvo Trucks launched new models for
the North American market
In March, Volvo Trucks
announced a broad-
ening of its product
program on the North
American truck mar-
ket with the launch of
two models with new cab variants for the pres-
tige segment, the Volvo VT830 and Volvo
VN730. Both models are intended primarily for
owner operators. The newly launched cab mod-
els offer the same interior roominess, and the
lower roof provides better aerodynamics and
correspondingly improved fuel economy for
rigs with low trailers, such as tankers.
Volvo Trucks broadens its business with
new, cleaner trucks for distribution
Volvo Trucks is aiming to reach a broader clien-
tele outside of the heavy, long-haul segment. In
May, Volvo Trucks presented two completely
new distribution trucks – the Volvo FL and the
Volvo FE. At the same time, a new business
concept was introduced for distribution ser-
vices in urban environments.
The Volvo FL and Volvo FE are cleaner, quie-
ter and safer, which is important for distribution
customers who operate primarily in urban
areas. Both models meet the environmental
requirements according to Euro 4 and Euro 5.
The latter legal requirement does not take
effect until 2009.
The Volvo FL and Volvo FE are intended for a
wider category of customers who do not pri-
marily have transport as their main line of busi-
ness. For this reason, Volvo Trucks have devel-
oped an entirely new business concept that
enables the customer to quickly and easily pur-
chase a key-ready truck with a body, rear lift,
and a number of support services, such as a
service contract.
Launch of new versions of Renault
Midlum and Renault Premium
Distribution
Renault Trucks has
launched new ver-
sions of the Renault
Midlum and Renault
Premium Distribution
targeted for distribu-
tion applications. Among other features, the new
vehicles are equipped with completely new cabs,
chassis and drivelines.
Renault Trucks has placed heavy emphasis on
reducing fuel consumption, and the new trucks
are equipped with the new 5- and 7-liter (Renault
Midlum) and 7- and 11-liter (Renault Premium
Distribution) engines. The new generation of
engines meets the Euro 4 emission standard
that becomes effective October 1, 2006. Certain
models are also prepared for the Euro 5 stand-
ard, which becomes effective in 2009.
World premiere for new Volvo 7700
city bus
In June, Volvo Buses
premiered the new
version of the Volvo
7700 city bus. The
Volvo 7700 is avail-
able as a 12-meter
bus for up to 95 passengers and as an 18-
meter articulated bus with space for up to 150
passengers. An important feature is the shift
from a 7-liter engine to Volvo’s new 9-liter
engine, available in diesel and gas versions,
that meets the Euro 4 emission standard. Due
to Volvo choosing SCR (Selective Catalytic
Reduction) technology, the company can
already offer its customers an engine that also
meets the proposed Euro 5 emission standard
that does not become effective until 2009.
Renault Trucks launches new version
of lightweight truck
In January 2007, Renault Trucks announced
the launch of a new version of Renault Mascott.
The new Renault Mascott is equipped with a
new gearbox, new driveshaft and new engine.
Two engine alternatives are available, 130 hp or
150 hp, which meet the European Euro 4 emis-
sions standard. In addition, the Renault Mascott
features a new, effective brake system that pro-
vides the shortest braking distance in the light-
weight truck segment. The Renault Mascott is
one of Renault Trucks best sellers in its seg-
ment, with nearly 15,000 vehicles sold during
2006. Deliveries of the newest version are
expected to start at mid-year 2007.
Mack Trucks launches new truck in
construction segment
Mack Trucks, Inc. is launching a new truck
model in the construction segment, the
TerraPro Cabover. Mack holds a leading posi-
tion in the US as a supplier of trucks in this seg-
ment. The model is a further development of
Mack’s popular MR series and is adapted spe-
cially for handling concrete pumping. The new
model offers customers a new driver environ-
ment including an ergonomic seat, spacious
driver cab, effective climate-control system,
easily accessible instrument and control panel
and substantial storage space. Major emphasis
was placed on reducing noise levels and the
vibrations that arise during work operations.
TerraPro Cabover is equipped with an 11-liter
MP7, available in the 325 to 405 hp classes, or
the 13-liter MP8 engine, available in the 415 to
485 hp classes. Both engines are approved in
accordance with EPA 07.
New wheel loader launched
During the fourth quarter Volvo CE launched its
largest wheel loader ever, the new L350F
replacing the 330E model. The L350F is
equipped with Volvos 16 liter engine and with
its improved performance it is a very good bun-
dle with the biggest haulers A35 and A40.
Board of Directors’ Report 2006 49

Financial performance
2006 was a successful year, net sales rose 7% to SEK 248 bil-
lion, income for the period increased by 24% to SEK 16 billion
and basic earnings per share rose to SEK 40.20 (32.22).
Net sales
Net sales in 2006 amounted to SEK 248,135
M (231,191), an increase of 7% compared with
a year earlier. Adjusted for changes in currency
rates, net sales rose 8%.
Net sales for the Group’s truck operations
amounted to SEK 166,306 M, which adjusted
for changed exchange rates corresponded to
an increase of 7%. The increase was attribut-
able to higher sales, primarily in North America,
Europe and Other markets. Demand in North
America was driven by the fact that customers
chose to buy trucks before the new emission
legislation came into force by January 1 2007
and also increased transport needs. In Europe,
demand rose from an already historically high
level. In all of Europe there is an increased need
for transports and especially between the
Western and Eastern parts of Europe, which
means an increased need for heavy trucks. The
strongest development is happening in Eastern
Europe, where new member countries of the EU
contribute substantially. Also countries outside
the EU in Eastern Europe are developing favor-
ably. In total, Volvo delivered 219,931 trucks in
2006, 3% more than in the preceding year.
Net sales within Buses rose 2% compared
with 2005. Adjusted for currency effects the
increase was 2%. As a result of a broadened
production range and improved market shares
in a rising world market, net sales in Construc-
tion Equipment increased by 17%. Adjusted for
currency ef fects the increase was 17%. Volvo
Penta succeeded in offsetting the reduction in
deliveries of industrial engines to China through
growing on other markets. Net sales rose 7% in
2006, or 8% adjusted for currency changes.
The recovery in the aerospace industry affected
Volvo Aero positively and net sales increased
by 7%. Adjusted for changes in currency rates,
the increase was 7%.
Strong economic growth combined with a
major need to replace ageing fleets of trucks
and construction equipment contributed to an
increase of 10% in net sales in North America.
Net sales in Europe was 10%, but growth rate
varied substantially between the Eastern part
of Europe, where net sales increased by 41%,
and the Western part, where net sales in -
creased by 7%. Net sales in South America
were up 5% as a consequence of the in -
creased sales of mainly trucks and construc-
tion equipment.
Operating income
Operating income in 2006 increased 12% to
SEK 20,399 M (18,153). An adjustment of
goodwill in the Trucks business area had a
negative impact on operating income of SEK
1,712 M. Excluding the goodwill adjustment
operating income rose by 22% compared to
2005. The improvement is the result mainly of
improved product and market mix and higher
prices on new products with increased cus-
tomer value.
Operating income for Trucks improved and
amounted to SEK 14,369 M (11,717), exclud-
ing adjustment of goodwill of a negative SEK
1,712 M. The increase was 23% compared to
2005. The improved result is attributable pri-
marily to North America, where Mack Trucks
and Volvo Trucks increased profitability
through a favorable price realization and
increased volumes. In Europe, Volvo Trucks
Net sales by market areaSEK M 2004 2005 2006 %1
Western Europe 102,498 106,479 113,569 7Eastern Europe 10,556 11,401 16,044 41North America 52,426 67,233 73,657 10South America 6,949 11,901 12,533 5Asia 20,699 22,598 19,610 (13)Other markets 9,043 11,579 12,722 10VolvoGroup 202,171 231,191 248,135 7
1 Percentage change pertains to 2006/2005.
Operating income (loss) by business area SEK M 2004 2005 2006
Trucks 8,992 11,717 14,369Buses 253 470 633Construction Equipment 1,898 2,752 3,888Volvo Penta 940 943 1,002Volvo Aero 403 836 345Financial Services 1,365 2,033 2,301Other 8 (598) (427)Operating income 1 13,859 18,153 22,111
Revaluation of shares 820 – –Goodwill adjustment – – (1,712)Operating income 14,679 18,153 20,399
1 Excluding revaluation of shares in Scania AB and Henlys Group Plc, 2004, and excluding goodwill adjustment in 2006.
Net sales by business area SEK M 2004 2005 2006 %1
Trucks 136,879 155,396 166,306 7Buses 12,722 16,589 16,856 2Construction Equipment 29,360 34,816 40,564 17Volvo Penta 9,057 9,776 10,485 7Volvo Aero 6,925 7,538 8,048 7Other 7,228 7,076 5,876 (17)VolvoGroup 2 202,171 231,191 248,135 7
1 Percentage change pertains to 2006/2005. 2 Adjusted for changes in currency rates, net sales
increased by 8%.
Operating net flow per currencySEK M 2004 2005 2006
USD 13,100 18,300 17,700EUR 6,700 9,300 14,100GBP 4,200 5,200 5,700CAD 2,800 3,300 2,700Other currencies 9,300 11,100 10,800Total 36,100 47,200 51,000
50 Board of Directors’ Report 2006

Consolidated income statements 1
SEK M 2004 2005 2006
Net sales 202,171 231,191 248,135Cost of sales (158,453) (180,823) (192,242)Gross income 43,718 50,368 55,893
Research and development expenses (7,614) (7,557) (8,354)Selling expenses (18,317) (19,616) (19,999)Administrative expenses (5,310) (6,147) (6,352)Other operating income and expenses 7 (397) (3,292)Income from Financial Services 1 1,365 2,033 2,301Income from investments in associated companies 2 (568) 61Income from other investments 828 37 141Operating income 2 14,679 18,153 20,399
Interest income and similar credits 993 816 897Interest expenses and similar charges (1,426) (1,134) (816)Other financial income and expenses 3 (1,210) 181 (181)Income after financial items 13,036 18,016 20,299
Income taxes (3,129) (4,908) (3,981)Income for the period 4 9,907 13,108 16,318
4 Attributable to: Equity holders of the parent company 9,867 13,054 16,268Minority 40 54 50 9,907 13,108 16,318
Earnings per share, SEK 23.58 32.22 40.20
1 Financial Services reported in accordance with the equity method.2 2006 includes an adjustment of goodwill of SEK (1,712) M.3 2004 includes a write-down relating to the holding in Henlys Group Plc of SEK 1,196 M.
Impact of exchange rates on operating incomeCompared with preceding year, SEK bn Net sales1 (0.1)Cost of sales (0.5)Research and development expenses 0.0Selling and administrative expenses 0.0Other operating income and expenses (0.4)Income from investments in shares 0.0Total effect of changes in exchange rates on operating income (1.0)
1 Group sales are reported at average spot rates and the effects of currency hedges are reported among ”Other operating income and expenses”.
continued to improve its earnings while profit-
ability for Renault Trucks’ operations in Europe
declined somewhat.
Operating income in Buses continued to
improve as a result of the restructuring imple-
mented earlier. Operating income for full-year
2006 was SEK 633 M, an increase of 35%.
Through strong cost control and increased vol-
umes, Volvo Construction Equipment con-
tinued to improve its profitability. Operating
income rose by 41% to SEK 3,888 M in 2006.
Volvo Penta maintained its high profitability
during 2006 and at the same time implemented
aggressive investments in product develop-
ment and substantial marketing efforts to cap-
italize on the new and competitive product
portfolio. Operating income increased by 6%
and amounted to SEK 1,002 M.
As an effect of the recovery in the aerospace
industry, volumes rose for Volvo Aero. In
November, the decision was taken to phase out
maintenance operations in Bromma, which had
reported loss for many years. Earnings were
negatively affected in an amount of SEK 258 M
for discontinuation costs. Operating income for
2006 decreased to SEK 345 M compared to
SEK 836 M for 2005.
The operating income includes a positive
effect of SEK 357 M as a consequence of the
Brazilian Supreme Court’s decision to rule in
AB Volvo’s favor in an export credits dispute. In
addition, costs of SEK 258 M relating to the
decision in principle on closure of Volvo Aero’s
operations in Bromma, Sweden, SEK 100 M
from capacity adjustments in North America
and approximately SEK 1,100 M related to
costs for the changeover in the industrial sys-
tems and production starts of new engines and
trucks primarily in Renault Trucks. The operat-
ing income for 2005 included costs of approxi-
mately SEK 500 for product launches and pro-
duction starts, costs amounting to SEK 653 M
related to Volvo’s holdings in Peach County
Holding Inc. (bus manufacturer Blue Bird) and
a capital gain from the sale of Celero Support
amounting to approximately SEK 430 M.
Change in operating income SEK bn
Operating income 2005 18.2Higher volumes and improvement of gross margins 5.8Higher income from Financial Services 0.5Changes in currency exchange rates (1.0)Lower capitalization of development costs (0.6)Higher research and development expenditures (0.2)Higher selling and administrative expenses (0.6)Adjustment of Goodwill in subsidiary Mack Trucks (1.7)Restructuring costs Volvo Aero, Bromma (0.3)Outcome of dispute regarding export credits in Brasil 0.4Other (0.1) Operating income 2006 20.4
Operating margin% 2004 2005 2006
Trucks 6.6 7.5 8.6 Buses 2.0 2.8 3.8 Construction Equipment 6.5 7.9 9.6 Volvo Penta 10.4 9.6 9.6 Volvo Aero 5.8 11.1 4.3 Volvo Group 1 6.9 7.9 8.9 Volvo Group 7.3 7.9 8.2
1 Excluding revaluation of shares in Scania AB and Henlys Group Plc, and excluding goodwill adjust-ment in 2006.
7.605
8.406
6.803
5.9
Research and development costs, SEK bn
Research and development costs, % of net sales
027.6
3.3 3.43.93.3 3.8
04
Research and development costs1
1 Years 2004, 2005 and 2006 are reported in accord-ance with IFRS and 2002 and 2003 in accordance with Swedish GAAP. See Note 1 and 3.
Board of Directors’ Report 2006 51

Financial position
The Board of Directors proposes an ordinary dividend of
SEK 25 per share and an extraordinary payment through
a 6:1 share split where the sixth share will be redeemed
by AB Volvo for an amount of SEK 25 per share.
Balance sheet
Total assets in the Volvo Group amounted to
SEK 258.4 billion at December 31, 2006, an
increase of SEK 1.2 billion compared with
year-end 2005. The Group’s total goodwill
amounted to SEK 8.8 billion, reported under
intangible assets. This amount includes an
adjustment of SEK 1.7 billion that was made in
accordance with prevailing accounting rules
in conjunction with the release by AB Volvo of
a valuation reserve for deferred tax receiv-
ables of SEK 2.0 billion in the subsidiary Mack
Trucks Inc. Investments in development costs
amounted to SEK 2.9 billion in 2006, resulting
in a net capitalization amounting to SEK 1.3 bil-
lion, the net value of development costs as of
December 31, 2006 was to SEK 8.2 billion.
The Volvo Group’s assets in operational
leasing remained largely unchanged compared
with December 31, 2005. Sales with buyback
agreements are reported under this item in the
balance sheet, resulting in revenues from a
sale being allocated during the length of a con-
tract as if it were a leasing agreement.
Shares and participations increased during
the year by SEK 5.5 billion through AB Volvo’s
acquisition of shares in Nissan Diesel from
Nissan Motor. In total, AB Volvo owns 19% of
the shares in the company. In addition, AB Volvo
has acquired all 57.5 million preferential shares
in Nissan Diesel from Nissan Motor and
Japanese banks. Combined, these items cor-
respond, after conversion, to 46.5% of the
shares in Nissan Diesel.
The net value of assets and liabilities related
to pensions and similar obligations amounted
to SEK 6.7 billion on December 31, 2006, a
Change in net financial position, excl Financial Services SEK bn
December 31, 2005 18.7
Cash flow from operating activities 21.9Investments in fixed assets and leasing assets, net (9.3)Operating cash flow, 12.6 Investments and divestments of shares, net (5.8) Acquired and divested operations 0.6 Change in provision for post-employment benefits 3.3Dividend paid to AB Volvo’s shareholders (6.8) Currency effect 1.0 Other 1.1 Total change 6.0 December 31, 2006 24.7
Impact of exchange rates
on operating income
The impact on operating income from currency
movements was negative by approximately
SEK 1 billion compared with 2005. The prime
reason being the declining US dollar during
2006.
Financial net
The net interest income for 2006 amounted to
SEK 81 M compared to a net interest expense
of SEK 318 M for the preceding year. The
improvement is primarily a result of higher
short-term interest rates in Sweden and lower
cost for the pension liability due to lower pen-
sion liabilities as a result of capital injections to
the Group’s pension foundations.
Other financial income and expenses were
negatively impacted by marked-to-market
revaluation of derivatives used for hedging of
the customer finance portfolio. The negative
revaluation impact was SEK 61 M during 2006
and was a result of declining long-term interest
rates in the US and Canada during the second
half of 2006. During 2005 the revaluation
impact was positive amounting to SEK 251 M.
Income taxes
The income tax expense for 2006 was SEK
3,981 M corresponding to a tax rate of 20%.
During the third quarter of 2006 AB Volvo
reported a tax income of SEK 2,048 M due to
the reversal of a valuation allowance for tax
receivables in Mack Trucks Inc. During 2005
the income tax expense amounted to SEK
4,908 M and a tax rate of 27%.
Income for the period
Income for the period amounted to SEK
16,318 M (13,108) corresponding to a basic
earnings per share of SEK 40.20 (32.22). The
return on shareholders’ equity was 19.6%
(17.8%).
reduction of SEK 4.8 billion compared with the
preceding year. Prepaid pensions amounted to
SEK 2.0 billion, an increase of SEK 1.5 billion
compared with year-end 2005, and were
related to the Volvo Group’s operations in the
US and the UK. A reduction in Post-employ-
ment benefits was primarily the result of
exchange-rate differences and payments
towards pension plans made during the year.
Post-employment benefits valued at SEK 2.9
billion were reported outside of AB Volvo’s bal-
ance sheet, which remained largely unchanged
compared with a year earlier.
The value of the Volvo Group’s inventory
remained largely unchanged on December 31,
2006, compared with the corresponding period
in the preceding year. During the year, finished
products declined by SEK 1.2 billion, while
production and other materials rose by SEK
1.5 billion.
52 Board of Directors’ Report 2006

Net financial positionSEK M 2004 2005 2006
Long-term interest-bearing receivables 1,797 1,399 3,463 Short-term interest bearing receivables 10,330 6,292 9,751 Non-current assets held for sale, interest-bearing – – 5 Marketable securities 25,839 28,662 20,324 Cash and bank 8,789 7,385 9,583 Total financial assets 46,755 43,738 43,126
Provision for post employment benefits (14,677) (11,966) (8,661) Loans (13,968) (13,097) (9,779) Liabilities associated with assets held for sale, interest-bearings – – (7)Total financial debt (28,645) (25,063) (18,447)
Net financial position 18,110 18,675 24,679
Marketable securities in real estate financial
institutions fell by SEK 12.9 billion during 2006,
which to some degree was offset by an increase
of SEK 6.6 billion in placements in banks and
financial institutions. In total, marketable secur-
ities fell by SEK 8.5 billion during 2006, among
others the result of amortization of loans.
During the same period, cash and cash equiva-
lents increased by SEK 2.6 billion. Exchange-
rate differences resulted in a decline in assets
of SEK 14.5 billion, which primarily affected
receivables in customer financing operations,
inventories and other receivables.
Shareholders’ equity at December 31, 2006
amounted to SEK 87.2 billion, corresponding to
an equity ratio of 43.5%, excluding Financial
Services. Changes in shareholders’ equity for
the period are specified on page 89. The
Group’s net financial assets at the same date
amounted to SEK 24.7 billion, corresponding to
28.3% of shareholders’ equity. Changes in net
financial position are specified in the accom-
panying table.
The Volvo Group’s loans fell during 2006 by
SEK 7.9 billion. The decline was due to a reduc-
tion in bond loans and other loans.
Total contingent liabilities at December 31,
2006, amounted to SEK 7.7 billion, a reduction
of SEK 0.2 billion compared with December 31,
2005.
Consolidated balance sheets Volvo Group, excl December 31 Financial Services1 Financial Services Total Volvo GroupSEK M 2004 2005 2006 2004 2005 2006 2004 2005 2006
Assets
Intangible assets 17,570 20,348 19,054 42 73 62 17,612 20,421 19,117Property, plant and equipment 27,260 31,330 30,493 3,891 3,738 3,886 31,151 35,068 34,379Assets under operating leases 8,477 10,260 11,822 773 700 279 19,534 20,839 20,501Shares and participations 10,116 10,357 16,565 193 28 29 2,003 751 6,890Long-term customer-financing receivables 147 725 582 33,887 39,083 39,276 25,187 31,184 32,089Long-term interest-bearing receivables 1,797 1,399 3,463 5 60 60 1,741 1,433 3,150Other long-term receivables 6,492 7,242 7,723 212 271 393 6,100 7,026 7,913Inventories 28,291 33,583 33,893 307 342 318 28,598 33,937 34,211Short-term customer-financing receivables 83 652 611 29,531 38,907 36,979 26,006 33,282 32,653Short-term interest-bearing receivables 10,330 6,292 9,751 0 0 0 1,643 464 966Other short-term receivables 30,043 36,750 35,612 1,628 1,607 1,564 29,647 35,855 34,654Non-current assets held for sale 2 – – 805 – – – – – 805Marketable securities 25,839 28,662 20,324 116 172 18 25,955 28,834 20,342Cash and cash equivalents 8,789 7,385 9,583 914 868 1,238 8,791 8,113 10,757Total assets 175,234 194,985 200,281 71,499 85,849 84,102 223,968 257,207 258,427
Shareholders’ equity and liabilities
Shareholders’ equity 3 70,155 78,760 87,188 8,306 9,634 9,703 70,155 78,760 87,188Provisions for post-employment benefits 14,677 11,966 8,661 26 20 31 14,703 11,986 8,692Other provisions 14,115 17,164 19,385 845 1,264 1,321 14,993 18,556 20,970Loans 13,968 13,097 9,779 57,860 69,993 67,991 61,807 74,885 66,957Liabilities associated with assets held for sale 4 – – 280 – – – – – 280Other liabilities 62,319 73,998 74,988 4,462 4,938 5,056 62,310 73,020 74,340Shareholders’ equity and liabilities 175,234 194,985 200,281 71,499 85,849 84,102 223,968 257,207 258,427
Shareholders’ equity and minority interests as percentage of total assets 40.0 40.4 43.5 11.6 11.2 11.5 31.3 30.6 33.7
1 Financial Services reported in accordance with the equity method.
2 Of which, interest-bearing SEK 5 M (–; –).
3 Of which, minority interests SEK 284 M (260; 229).4 Of which, interest-bearing SEK 7 M (–; –).
Board of Directors’ Report 2006 53

Cash-flow statement
Operating cash fl ow, excluding Financial Services, increased to
SEK 12.6 billion in 2006 compared with 6.8 billion in 2005.
During the year, transfers were made to pension foundations
of SEK 3.3 billion (4.4).
ment of production sites within Renault Trucks
including the move from Villaverde to Bourg-
en-Bresse. Trucks’ capital expenditures also
included investments related to the new emis-
sion standards Euro4 and US’07, the final stage
of the modification in the Hagerstown plant for
engines and transmissions in North America
and also investments related to new products.
Investments within Construction Equipment
increased to SEK 1.7 billion from SEK 0.9 bil-
lion. The main part of the investments refer to
capacity increases and a new generation of
Excavators, the C-series. The investments
within Volvo Aero increased during 2006 to
SEK 1.0 billion from SEK 0.8 billion. A major
part of those investments refers to entrance
fees for phase two of the new GEnx engine in
cooperation with General Electrics. In
Trollhättan, Sweden, an extensive renewal of
FMS cells has been completed. The invest-
ments in Buses remains at the level of SEK 0.3
billion and were mainly related to the new gen-
eration of engines, and a new product program.
The level of investments remains in Volvo Penta
with SEK 0.2 billion and consist mainly of
capacity increasing investments and a new
paint shop in the Vara plant in Sweden.
Approved future capital expenditures in
property, plant and equipment amounted to
SEK 6.8 billion (7.8).
Investments in leasing assets amounted to
SEK 0.5 billion (0.3).
Cash flow
Operating cash flow, excluding Financial
Services, amounted to SEK 12.6 billion. The
positive development during 2006 was mainly
related to an increase in earnings. During the
year transfers were made to pension founda-
tions, which is reported in the item ”Change in
working capital”, in the amount of SEK 3.3
billion.
Operating cash flow within Financial Ser-
vices was a negative SEK 1.8 billion in 2005
(negative 4.4) as a result of continued growth
in the credit portfolio.
Investments
Investments in fixed assets during 2006,
excluding Financial Services, amounted to SEK
9.7 billion (9.9). Capital expenditures in Trucks
amounted to SEK 6.0 billion (6.7). The invest-
ments within Trucks were made in a new top
coat line for cabs in Umeå, Sweden, increasing
the number of Volvo Truck Centers (mainly in
Europe), energy saving investments in the
Macungie-plant in North America and develop-
Future capital expenditures, approved1 SEK bn
Trucks 4.8Buses 0.1Construction Equipment 0.7Volvo Penta 0.2Volvo Aero 0.5Other 0.5Total 6.8
1 In property, plant and equipment.
Condensed cash-flow statements, Financial Services SEK bn 2004 2005 2006
Cash flow from operating activities (2.5) (4.2) (1.4)Net investments (3.0) (0.2) (0.4)Operating cash flow (5.5) (4.4) (1.8)
0510.2
0610.2
035.9
026.4
047.5
4.4 4.13.43.6 3.7
Capital expenditures, SEK bn
Capital expenditures, % of net sales
Capital expenditures 1, excluding Financial Services
Self-financing ratio 1, excluding Financial Services, %
1 Years 2004, 2005 and 2006 are reported in accordance with IFRS and 2002 and 2003 in accordance with Swedish GAAP. See Note 1 and 3.
05173
06235
03243
02196
04268
Cash-flow from operating activities divided by net investments in fixed assets and leasing assets.
1 Years 2004, 2005 and 2006 are reported in accordance with IFRS and 2002 and 2003 in accordance with Swedish GAAP. See Note 1 and 3.
54 Board of Directors’ Report 2006

Acquisitions and divestments
In 2006 investments were made in Nissan
Diesel and in Deutz. As a consequence invest-
ments in shares and participation had a nega-
tive impact on cashflow of SEK 5.8 billion
(positive 0.3) in 2006.
Acquired and divested companies had a
positive effect on cash flow SEK 0.5 billion
(0.7).
Financing and dividend
Net borrowings decreased cash and cash
equivalents by SEK 2.6 billion during 2006.
The new borrowing during the year, mainly
through the issue of bonds, contributed SEK
69.3 billion. Amortization for the year amounted
to SEK 72.2 billion. In 2005, net borrowings
increased cash and cash equivalents by SEK
3.6 billion.
An ordinary dividend amounting to SEK 6.8
billion, corresponding to SEK 16.75 per share,
was paid to AB Volvo’s shareholders during the
year.
Change in liquid funds
The Group’s liquid funds increased by SEK 2.6
billion during the year amounting to SEK 10.8
billion at December 31, 2006.
Consolidated cash-flow statementsSEK bn 2004 2005 2006
Operating income 13.3 16.1 18.1 Depreciation and amortization 7.1 7.3 10.0 Other non-cash items (0.6) 0.2 0.6 Change in working capital (1.4) (5.6) (3.1) Financial items and income taxes paid (0.2) (1.9) (3.7) Cash flow from operating activities 18.2 16.1 21.9
Investing activities
Investments in fixed assets (7.2) (9.9) (9.7) Investment in leasing assets (0.3) (0.3) (0.5) Disposals of fixed assets and leasing assets 0.7 0.9 0.9 Operating cash flow excluding Financial Services 11.4 6.8 12.6 Operating cash flow, Financial Services (5.5) (4.4) (1.8)
Operating cash flow, Eliminations 0.0 (0.6) (0.7) Operating cash flow, Volvo Group total 5.9 1.8 10.1
Investments and divestments of shares, net 15.1 0.3 (5.8) Acquired and divested operations, net (0.1) 0.7 0.5 Interest-bearing receivables including marketable securities, net (6.4) (1.3) 7.7 Cash flow after net investments 14.5 1.5 12.5
Financing activities
Change in other loans, net (8.8) 3.6 (2.6) Repurchase of own shares (2.5) (1.8) –Dividend to AB Volvo’s shareholders (3.4) (5.1) (6.8) Other 0.0 0.0 0.0 Change in cash and cash equivalents excl translation differences (0.2) (1.8) 3.1
Translation differences on cash and cash equivalents (0.2) 1.1 (0.5) Change in cash and cash equivalents (0.4) (0.7) 2.6
Board of Directors’ Report 2006 55

Risk management – an important part of our operationAll business operations involve risk – managed risk-taking is a
condition of maintaining a sustained favorable profi tability.
involves adjusting production capacity and
operating expenses.
Intense competition
Continued consolidation in the industry is
expected to create fewer but stronger com-
petitors. Volvo’s products face substantial
competition, which may have a significant
impact on the prices Volvo receives for its prod-
ucts and on the Group’s future sales volume.
Our major competitors are DaimlerChrysler,
Paccar, Navistar, MAN, Scania, Caterpillar,
Komatsu, Cummins and Brunswick. In recent
years, new competitors have emerged in Asia,
particularly in China. These new competitors
are mainly active in their domestic markets, but
are expected to increase their presence in
other parts of the world.
Our brands are well-known and strong in
many parts of the world. For the Volvo Group, it
is important that all brands in the Group are
developed and supported. Strong brands com-
bined with an attractive product portfolio make
it possible for Volvo to be competitive.
Prices for commercial vehicles
may change
The prices of commercial vehicles have, at
times, changed considerably in certain markets
over a short period. This instability is caused by
several factors, such as short-term variations in
demand, shortages of certain component
products, uncertainty regarding underlying
economic conditions, changes in import regu-
lations, excess inventory and increased com-
petition. Overcapacity within the industry can
occur if there is an economic downturn in the
Group’s major markets or worldwide, potentially
leading to increased price pressure.
The financial result of the business depends
on our ability to quickly react to changes in
demand and particularly to adapt production
levels, reduce production and operating
expenses, and deliver competitive new prod-
ucts and services.
The commercial vehicles industry
is subject to extensive government
regulation
Regulations regarding exhaust emission levels,
noise, safety and levels of pollutants from pro-
duction plants are extensive within the industry.
These regulations are subject to change, often
making them more restrictive. The costs to
comply with these regulations can be signifi-
cant for the commercial vehicles industry.
Most of the regulatory challenges regarding
products relate to reduced engine emissions.
The Volvo Group is a significant player in the
commercial vehicle industry and the world’s
largest producer of heavy-duty diesel engines.
The product development capacity within the
Volvo Group is well consolidated to be able to
focus resources for research and development
to meet tougher emission regulations. Future
product regulations are well known, provided
that they are not changed and the product
development strategy is well tuned to the intro-
duction of new regulations. The new regula-
tions regarding product emissions are strin-
gent, but our current assessment is that they
are manageable for the Volvo Group.
Volvo has had production facilities in numer-
ous countries worldwide for many years. A
worldwide production standard for environ-
mental performance has been introduced,
enabling production plants to achieve best
industry standard.
>>> Risk may be due to events in the world and
can effect a given industry or market. Risk can
be specific to a single company. At Volvo we
work daily to identify, measure and manage risk
– in some cases we can influence the likelihood
that a risk-related event will occur. In cases in
which such events are beyond our control, we
strive to minimize the consequences.
We have chosen to classify the risks to which
the Volvo Group is exposed into three main cat-
egories: External-related risk, Financial risk
and Operational risk.
External-related riskThe commercial vehicles industry
is cyclical
Historically, the Volvo Group’s markets have
undergone significant changes in demand as
the general economic environment has fluctu-
ated. Investments in infrastructure, major
industrial projects, mining and housing con-
struction all impact the Group’s operations,
since its products are central to these sectors.
Economic trends in Europe and North America
are particularly important for the Volvo Group,
since a significant portion of the Group’s net
sales are generated in these markets.
The cyclical demand for the Group’s prod-
ucts has, at times, restricted, and may in the
future temporarily restrict, the ability of the
Volvo Group to manufacture and deliver orders
in a timely manner. A prolonged delay in the
Group’s ability to deliver ordered products on a
timely basis at a time when its competitors are
not experiencing the same difficulty could
adversely affect the Group’s market shares.
To cope with the peaks and troughs in
demand, we need to act appropriately in the
various stages of the business cycle. This
56 Board of Directors’ Report 2006

Risk management – an important part of our operation
Financial riskIn its operations, the Volvo Group is exposed to
various types of financial risks. Groupwide
policies, which are updated and decided upon
annually, form the basis of each Group com-
pany’s management of these risks. The object-
ives of the Group’s policies for management of
financial risks are to optimize the Group’s capi-
tal costs by utilizing economies of scale, to
minimize negative effects on income as a
result of changes in currency or interest rates,
to optimize risk exposure and to clarify areas
of responsibility within the Group’s finance
and treasury activities. Monitoring and control
that established policies are adhered to is
conducted continuously centrally and at
each Group company. Most of the Volvo
Group’s financial transactions are carried out
through Volvo’s in-house bank, Volvo Treasury,
which conducts its operations within estab-
lished risk mandates and limits. Credit risks
are mainly managed by the different business
areas.
The nature of the various financial risks and
objectives and policies for the management of
these risks is described in detail in Notes 36
and 37 on pages 131-137. Volvo’s accounting
policies for financial instruments are described
in Note 1. Various aspects of financial risk are
described separately in the following para-
graphs. The overall impact on a company’s
competitiveness is also affected however by
how various macro-economic factors interact.
Currency-related risk
Approximately 90% of the net sales of the
Volvo Group are in countries other than Sweden.
Changes in exchange rates have a direct impact
on the Volvo Group’s operating income, bal-
ance sheet and cash flow, as well as an indirect
impact on Volvo’s competitiveness, which over
time affects the Group’s earnings. Currency-
associated risk as applies to Volvo’s business
operations relates to changes in the value of
contracted and expected future payment flows
(commercial currency exposure), changes in
the value of loans and investments (financial
currency exposure) and changes in the value of
assets and liabilities of foreign subsidiaries
(currency exposure of shareholders’ equity). In
addition, currency movements can affect
Volvo’s pricing of products sold and materials
purchased in foreign currencies as well as
those of its competitors, which may be affected
differently by such movements. Since Volvo
has substantial manufacturing operations in
Sweden and generates a substantial portion
of its revenues in currencies other than the
Swedish krona, Volvo’s earnings in Swedish
kronor could be adversely affected short-term
by an appreciation of the Swedish krona against
other currencies.
The objective of the Volvo Group’s currency
risk management is to minimize the short-term
negative effects of exchange-rate fluctuations
on the Group’s earnings and financial position.
The Volvo Group employs forward contracts
and currency options to hedge the value of
future payment flows in foreign currencies.
Interest-related risk
Interest-related risk include risks that changes
in interest rates will impact the Group’s income
and cash flow (cash flow risks) or the fair value
of financial assets and liabilities (price risks).
Interest-rate risk can be minimized through
“matching” of the fixed interest terms of finan-
cial assets and liabilities. Interest rate swaps
are used to adjust the fixed interest terms of
the Group’s financial assets and liabilities.
Currency rate swaps make it possible to loan
from different markets in foreign currencies
without assuming currency-associated risk.
Volvo also holds standardized futures and for-
ward rate agreements. The majority of these
contracts are used to ensure interest rate lev-
els for short-term loaning or investment.
Market risk from investments in shares
or similar instruments
The Volvo Group is indirectly exposed to market
risks from shares and other similar instruments
as a result of managed capital transferred to
independent pension plans being partly
invested in instruments of these types.
Credit-related risk
Volvo’s extension of credit is governed by
Group-wide policies and rules for classifying
customers. Efforts are made to ensure that
the credit portfolio is reasonably diversified
among different customer categories and
industries. Credit-associated risk is managed
by actively monitoring credit, routines for follow
up and in certain cases repossession of mater-
ials. Additionally, continuous and necessary
reserves are monitored in cases involving
uncertain receivables. An important part of
the Group’s credit risk is related to how the
financial assets of the Group have been placed.
The majority are placed in Swedish Goverment
bonds and interest-bearing bonds issued by
real estate financial institutions.
Liquidity risk
Volvo ensures its financial preparedness by
always maintaining a certain portion of rev-
enues in liquid assets. A healthy balance
between short-and long-term borrowing and
access to credit in the form of credit facilities
are used to hedge long-term financial needs.
Operational riskThe Volvo Group’s profitability depends
on successful new products
The Volvo Group’s long-term profitability
depends on the Company’s ability to success-
fully launch and market its new products.
Product life cycles continue to shorten, putting
increased focus on the success of the Group’s
product development. It is highly important to
meet and exceed customer expectations to be
Board of Directors’ Report 2006 57

“Nova Bus”. AB Volvo owns or otherwise has
rights to a number of patents and brands that
refer to the products the Company manufac-
tures. These patents and brands, acquired over
a number of years, have been valuable as the
Volvo Group’s operations expanded and may
continue to be valuable in the future. Volvo does
not consider that any of the Group’s operations
are heavily dependent on any single patent or
group of patents.
Through Volvo Trademark Holding AB, AB
Volvo and Volvo Car Coporation jointly own the
brand ”Volvo”. AB Volvo has the exclusive right
to use the ”Volvo” name and trademark for its
products and services. Similarly, Volvo
Personvagnar AB has the exclusive right to use
the name and trademark ”Volvo” for its prod-
ucts and services. To protect these rights and
avoid any weakening of the brand, AB Volvo and
Volvo Personvagnar AB jointly introduced a
control function to govern the use of the brand
name and to prevent others from taking unfair
advantage of it.
Similar control functions apply to the use of
the “Mack” brand name, which is owned by AB
Volvo. The Volvo Group’s rights to use the
”Renault” brand are restricted to the truck
industry only and are regulated by a license
from Renault SA, which owns the “Renault”
brand.
Complaints and legal actions by custom-
ers and other third parties
The Volvo Group could be the target of com-
plaints and legal actions initiated by customers,
employees and other third parties alleging
health, environmental, safety or business
related issues, or failure to comply with applic-
able legislation and regulations. Even if such
disputes were to be resolved successfully,
without having adverse financial conse-
quences, they could negatively impact the
Group’s reputation and take up finance and
management resources that could be used for
other purposes.
Volvo continuously reviews its manufactur-
ing and administrative processes with the aim
of ensuring that Volvo products and operations
meet applicable legal and other regulatory
requirements. Volvo also has insurance cover-
age in certain areas, for example product liabil-
ity, business interruption and property.
Risk related to human capital
A decisive factor for the realization of the Volvo
Group’s vision is our employees and their
knowledge and competence. Future develop-
ment depends on the company’s ability to
maintain its position as an attractive employer.
To this end, we strive for a work environment in
which energy, passion and respect for the indi-
vidual are guiding principles. Every year a
Group-wide survey is conducted, according to
which the number of satisfied employees is
continually increasing.
competitive in established markets and to be
able to expand into additional markets and/or
product segments.
Many of our products take a long time to
develop from initial idea to finished product. It
is important to involve customers in the early
stages of the development process to ensure
the success of new products. It is just as import-
ant to be at the forefront in the research and
development of new technologies that are
import ant to the development of successful
products.
The Volvo Group relies on suppliers
Volvo purchases raw materials, parts and com-
ponents from numerous outside suppliers. A
significant part of the Group’s requirements for
raw materials and supplies is filled by single-
source suppliers. The effects of delivery inter-
ruptions vary depending on the item or compon-
ent. Certain items are standard throughout the
industry, whereas others are internally devel-
oped and require unique tools that are time-
consuming to replace. A supplier’s inability to
deliver could have negative consequences for
production at certain Volvo Group manufac-
turing sites.
The Volvo Group’s costs for raw materials and
components can vary significantly over a busi-
ness cycle. Cost variations may be caused by
changes in world market prices for raw materials
or by an inability of our suppliers to deliver.
The companies in the Volvo Group and their
suppliers work closely together to manage
material flows by monitoring suppliers’ financial
stability, quality-control systems and produc-
tion flexibility.
Volvo Group is reliant on the proper
protection and maintenance of its
intangible assets
The Volvo Group’s products are primarily sold
under the brand names “Volvo”, “Volvo Penta”,
“Volvo Aero”, “Renault”, “Mack”, “Prévost” and
58 Board of Directors’ Report 2006

Trucks 67%
Buses 7%
Construction Equipment 16%
Volvo Penta 4%
Volvo Aero 3%
Other 3%
Percentage of Group’s net sales
Percentage of Group’s operating income
Trucks 62%
Buses 3%
Construction Equipment 19%
Volvo Penta 5%
Volvo Aero 2%
Financial Services 11%
Business areas
“We are now seeing increasingly distinct
advantages of the Group being well struc-
tured, with effectively coordinated units in
which we gain from the combined volumes
within purchasing, manufacturing and busi-
ness support functions. The year 2007 will
be exciting, particularly since we will roll out
the entire new product generation on the
markets and take new steps in the expansion
eastward.”
Leif Johansson
Business areas 2006 59

Mack Trucks– building America
While contributing to the creation of some noted US icons such
as the Hoover Dam, the Empire State Building and the US high-
way system, Mack Trucks simultaneously built its reputation as a
leading construction vehicle. The Mack Granite truck continues to
bolster this reputation on a daily basis.
During 2006, nearly one in every three heavy-duty construction trucks sold in the US carried the Mack Granite name, and more than 55,000 Granite trucks have been put to work in North America since its introduction in 2001.
trucks have been put to work in North America
since its introduction in 2001.
The new Granite MP series, which meets the
stringent exhaust-emission requirements
scheduled to come into effect in 2007 is hall-
marked by the same customer satisfaction. The
initial customer response to the new truck and
its new Mack MP7 engine was highly positive.
As one customer noted:
“We immediately put the new truck to work in
transporting sand some 400 miles each day on
highways and small roads. There were no prob-
lems whatsoever. I wouldn’t hesitate to buy sev-
eral more trucks like this.”
Whether it involves the transport of sand,
snow, cement or entire houses, the Granite
continues to build Mack’s legendary reputation
in terms of toughness, reliability and high value.
Production
Manufacturing operations at the Macungie
plant reached record levels in summer 2006,
with output reaching 107 construction vehicles
daily. Higher demand was partly due to pur-
chases ahead of the introduction of emission
regulations in January 2007. The production of
Mack’s long-distance trucks also increased
at New River Valley, but manufacturing was
negatively impacted by the capacity limits of
suppliers in delivering key components.
Plans were announced in the fourth quarter
to downsize the workforce in the North
American production facilities. This move was
part of preparations ahead of an anticipated
>>> During 2006, citizens in Clarksville,
Maryland wanted to rescue a 130-year-old
building from demolition by moving it to a new
site. The relocation company commenced
operations with the nighttime relocation of the
150-ton load through hilly terrain; however,
during the move, the transport vehicle broke an
axle while driving over the soft surface. Luckily,
the company was able to deploy a newly
acquired Mack Granite to complete the move
without any problems.
This is a striking example of the Granite’s
capacity to exceed the high-quality perform-
ance set by its famous predecessors – and
meet the ambitious expectations imposed by
current Mack customers.
During the past five years since its introduc-
tion, the Mack Granite has become the most
sold construction vehicle in the US. The Granite
combines Mack’s renowned strength and
stamina with new features such as an operator-
friendly cab, top-class maneuverability and
cabin visibility as well as industry-leading elec-
tronics that can be readily tailored to suit cus-
tomer requirements.
The Granite is now the primary choice for
application areas ranging from snow plowing in
British Columbia to the transport of cement for
the rebuilding program along the US Gulf Coast
following Hurricane Katrina, as well as thou-
sands of other assignments. During 2006,
nearly one in every three heavy-duty construc-
tion trucks sold in the US carried the Mack
Granite name, and more than 55,000 Granite
decline in demand in conjunction with new
emission regulations. The reduction of the
workforce by 450 employees at the Macungie
plant takes place during the fourth quarter of
2006 and first quarter of 2007.
Product introductions
In 2006, the most rapid and comprehensive
product renewal in Mack’s 106-year history
continued, as the company brought to market
its new highway application tractor, redesigned
construction application offering, and new
engine technology designed to meet the strin-
gent US’07 emissions regulations.
The Pinnacle model highway tractor and the
Granite model straight truck each feature
entirely new driver environments based on
extensive research of customer preferences
and ergonomics – with more belly and leg room,
easier-to-read instrument displays, and more
storage among the improvements.
The new models are designed around the
new MackPower (MP) engine technology, intro-
duced in response to US’07 and featuring mul-
tiple displacements to match the varying de -
mands of the Mack customer base. The MP 7
engine is an 11-liter offering with horsepower
ranging from 325 to 405, which was introduced
during 2006 and which met the emission regu-
lations then in force. The 13-liter, 415–485 hp
MP 8 engine – available only in a US’07 compli-
ant version – was re leased to customers follow-
ing the January 2007 implementation of the
new emissions regulations.
60 Business areas 2006

• Strong market acceptance of new Pinnacle and Granite models.
• Complete vehicle range prepared for change-over to new US’07-compliant engines.
• Hybrid Mack Granite model delivered to U.S. Air Force as part of joint development program.
• Strategic enhancement of dealer network – particularly in Western regions of the US – continued; dealers continued to invest in new and existing facilities.
Ambitions 2006
• Manage the challenges throughout oper-ations arising from the market cycle, while maintaining profitability and cost control.
• Continue working with the completion of Mack Trucks’ product renewal.
• Continue the development of the North American dealer network to strengthen sales, customer support and aftermarket services.
• Continuing growth in Mack Trucks’ inter-national operations.
• Successful introductions and production change-overs.
• Introduce engines in all trucks that meet future emissions standards in Europe and US.
• Maintain high pace of activity in the development of alternative drivelines.
• Further development of dealer network.
Outcome 2006 Ambitions 2007
Number of trucks producedMack Trucks 2005 2006
Mack CH / CHN 3,786 3,880Mack CL 364 584Mack Vision 9,403 8,394Mack Granite 16,568 17,019Mack Pinnacle – 1,076Mack LE 1,238 937Mack MR 3,325 3,901Mack DM 365 1Other 1,149 976Total 36,198 36,768
Number of trucks deliveredMack Trucks 2005 2006
North America 32,346 32,793 South America 2,503 2,628 Asia 121 75 Other markets 1,252 1,342 Total 36,222 36,838
Also in early 2007, Mack introduced the
US’07 compliant version of its popular low-
cab-over-engine models for the refuse and
concrete industry.
Mack offered its concrete customers an
important safety improvement in 2006 with
the introduction of the Mack Road Stability
Advantage (RSA) system for concrete mixers.
De signed to reduce the potential for rollover
incidents and enhance profitability, the full
electronic stability system is the first of its kind
in the vocational segment of the heavy-duty
truck market in North America. In addition to
making RSA available to concrete mixer cus-
tomers, Mack also announced in 2006 that it
was making the system standard on all of its
highway tractors.
Aftermarket services
During 2006, a number of new product pro-
grams were launched through which Mack
Trucks – in cooperation with transport compa-
nies – provides support and assistance regard-
ing the availability of spare parts and service.
These include MV Preferred and Mack Credit
Card offerings, which simplify the purchase of
spare parts and service repairs, while simultan-
eously providing customers with tools for
reporting, monitoring and controlling costs.
Dealer network
In addition to the optimal development of in-
house operations, the distribution network
continues to be improved to be able to manage
variations in economic conditions. Since 2001,
Mack Trucks’ independent dealers have jointly
invested more than USD 50 M, or approximately
SEK 370 M, in new facilities, modernization and
extension of existing facilities and retraining
programs for sales personnel. Combined with
the extended offering of accessories and ser-
vices, these improvements permit dealers to
raise sales of aftermarket products and services
and boost the level of absorption throughout the
network. This will dampen the effects of the
expected significant decline in sales of new
trucks during the first half of 2007.
Business areas 2006 61

Renault Trucks– committed to customer success
Renault Trucks maintains close relations with customers and
has expert insight into their operations. The Renault truck
brand is based on three core values: innovation, effi ciency and
customer care.
the added value they offer their customers
everyday.
Renault Trucks focuses on attaining high
quality throughout the service network. Product
quality is unrivalled and maintained by means
of consistent enhancement programs.
The advantages of the fully renewed range, a
consolidated network and the development of
services has been noted by customers and
reflected in higher sales. The company also
seeks to grow through partnerships and by
building on these in an effort to attain competi-
tive advantages and achieve sustainable profit-
ability by adapting to changes in business con-
ditions.
Renault Trucks’ special brand shows clearly
the products’ features, their value and com-
petitive advantages, as well as the corporate
culture and personality. It ensures that Renault
Trucks retains its unique identity in the Group. It
helps the company to strengthen customer
loyalty, as well as creating emotional sentiment
and added value.
Innovation
Renault Trucks’ solutions match the needs and
the diverse expectations of professional users.
In the transport, construction, environmental
services, trade and self employed sectors,
Renault Trucks can offer each and every cus-
tomer a made-to-measure solution which is
adapted to the specific requirements of their
vehicle management.
>>> Customer satisfaction, the development
of services, growth and competitiveness are
the cornerstones of Renault Trucks’ strategic
vision: its objectives include the continued
deployment of quality transport solutions
according to the key precepts of reliability,
economy, comfort and innovation. Renault
Trucks is one of the market leaders in Europe
and its rapid international development is now
opening up real opportunities for growth.
The Renault Trucks product range meets the
needs of its customers by offering: reduced
fuel consumption, constantly improved reliabil-
ity, a wide range of services with firm commit-
ments, easy maintenance products, oper -
ational mobility and safety in its trucks.
Renault Trucks is committed to the profit-
able growth of its business. For the wider com-
munity, Renault Trucks contributes a vital ser-
vice to the whole economy: road transport.
Striving to be a citizen-friendly brand, it is con-
stantly launching products which are more
environmentally friendly and which contribute
to sustainable and responsible industrial devel-
opment.
In the Volvo Group, Renault Trucks seeks to
develop its market shares and profitability using
proprietary values, products and services.
The phrase “Committed to customer suc-
cess” expresses the moral contract between
Renault Trucks and its customers, which
reflects how the company’s employees view
their work and how they do it. They are proud of
For Renault Trucks, being innovative means simplify-ing driving, simplifying transport operations and sim-plifying the work of its customers.
Renault Trucks seek to apply innovatory
technology to help people in their everyday
activities with improvements made to help driv-
ers and transport companies work better.
For Renault Trucks, being innovative means
simplifying driving, simplifying transport oper-
ations and simplifying the work of its custom-
ers. Renault Trucks is committed to designing
and proposing ever more reliable, more sober,
safer, more aesthetic, more customer adapted,
more environmentally-friendly and more com-
fortable – a substantial challenge which is met
by the passionate dedication of Renault Trucks
employees.
Product renewal
Renault Trucks is a high-profile specialist in
four segments: City Distribution, Regional
Distribution, Construction Transport and Long-
Distance Transport. In 2006, Renault com-
pleted the renewal of all products, a program
that met with enthusiastic customer response.
This program commenced just three years ago
with the Renault Master, and subsequently
with the Mascott in 2004 (City Distribution),
and then with Magnum and Premium Route
(Long-Distance Transport) in 2005 and finally
with Midlum, Premium Distribution (Distribu-
tion) as well as Lander and Kerax (Construc-
tion) during 2006.
The past year also marked the introduction
of the Euro 4 standard and incentive for Euro 5,
62 Business areas 2006

Number of trucks producedRenault Trucks 2005 2006
Renault Mascott 12,461 14,953Renault Kerax 8,800 9,732Renault Midlum 15,484 12,696Renault Premium Distribution 6,663 6,473Renault Premium Route 12,328 16,780Renault Magnum 8,208 7,000 Total 63,944 67,634
while at the same time the sale of certain ver-
sions were terminated.
During early 2007, this was followed by the
introduction of a completely new vehicle –
Renault Maxity – as a complement to Renault
Trucks’ light truck range, as well as the new
Mascott.
Customer service
Today, many transport businesses face the
pres sures of deadlines, and their profitability
cannot tolerate either delays or unplanned
standstills. The Renault Trucks’ network and its
Service Commitment ensure optimal mobility
for the customers’ vehicles. The mission is
clearly-defined: making a diagnosis in under an
hour, proposing a relay tractor and completion
of works in under two hours once started.
In the event of breakdown on the road, the
assistance program Renault Trucks 24/24
guarantees to dispatch a repairer in response
to a simple phone call. The repairer’s job is to
help the driver to continue en route as quickly
as possible.
Production
Renault Trucks’ deliveries and productivity
were affected negatively by extensive produc-
tion changes in the industrial system in con-
junction with the introduction of new truck
models and engines. During the fourth quarter,
phasing out of the Renault Kerax plant in
Villaverde was completed. Assembly of Renault
Trucks’ heavy truck program was thus concen-
trated to the plant in Bourg-en-Bresse. The
current focus is on improving productivity and
ensuring delivery capacity to meet the strong
demand. In January 2007, Renault Trucks
signed an agreement with Nissan Motor
regarding distribution of the light truck Renault
Maxity, which will be manufactured by Nissan
Motor.
Ambitions 2006 Outcome 2006 Ambitions 2007
• Truck product offer completely renewed.
• Heavy-duty truck assembly transferred to Bourg-en-Bresse.
• Euro 4 engines were introduced during the year.
• A reduction cost program has been launched.
• The Service Quality improvement program is showing positive results.
• Achieve the Service Quality program.
• Improve brand image based on the new product portfolio and quality achievements.
• Harvest the benefits of the totally renewed range.
• Launch successfully the new Renault Maxity.
• Develop soft products sales.
• Implement cost reduction plan.
• Secure the product cost-reduction plan.
• Successful introductions and production change-overs.
• Introduce engines in all trucks that meet future emissions standards in Europe and US.
• Maintain high pace of activity in the devel-opment of alternative drivelines.
• Further development of dealer network.
Number of trucks deliveredRenault Trucks 2005 2006
Western Europe 55,526 58,063Eastern Europe 5,462 7,126North America 477 561South America 1,022 1,078Asia 7,907 5,241Other markets 4,067 5,505Total 74,461 77,574
Business areas 2006 63

Volvo Trucks– developing transport solutions
>>> A common cut flower has a “vase life” of
about one week. This means that it loses
around 15% in value in just one day. “It is
import ant to be quick, real quick,” says Piet
Visser before jumping into the cab of his brand
new Volvo FH.
Piet works as a driver for flower export com-
pany Hilverda De Boer, which transports fresh
flowers from flower auctions in Amsterdam to
customers throughout Europe.
Volvo Trucks supplies complete transporta-
tion solutions to professional and commercial
customers in more than 130 countries world-
wide. The largest markets are Europe and
North America.
The company has a complete product offer-
ing of medium to heavy trucks with a strong
global network of 3,000 service operations. In
2006, Volvo Trucks sold more than 105,000
trucks worldwide, which is a record amount in
the company’s history.
Driving progress within the area of transpor-
tation is a central and strategic goal. This
includes everything from creating new con-
cepts and ideas that are based on customers’
requirements and benefits to society.
Trucks are not profitable. Drivers are. No one
knows this better than Volvo Truck’s custom-
ers. Around the clock, goods, reputation and
profits are literally in the hands of the drivers.
Volvo Trucks has a very strong global pos-
ition, particularly with regard to long-distance
Every second, day and night, a truck arrives with its cargo. Trans-
portation is one of the vital areas in today’s society and a result
of the needs of modern man. Volvo Trucks’ objective is to meet
these needs.
traffic. The trucks have a solid reputation as
reliable, durable, safe and cost efficient – dur-
ing their entire useful life.
Volvo’s trucks are part of a very sensitive and
refined chain of logistic events, in which unfore-
seen stops signify major problems. This applies
to such everyday commodities as food and
flowers but also for the transportation of, for
example, coffee beans from plantations in
Brazil.
“When we began transporting coffee two
years ago, we invested in five brand new Volvo
FH’s,” says Orley de Oliviera Souza, Transrodan
in Brazil. Our customers demand just-in-time
collection and delivery and we needed reliable
vehicles. Stand stills and delays would be dev-
astating.”
Product renewal within Volvo Trucks has
been intensive in recent years. Volvo Trucks has
invested a total of more than SEK 9 billion in
product renewal and product improvement
over the past five years.
The 2006 fiscal year was characterized by
continued launching of new products following
an intensive 2005 when the new Volvo FH and
Volvo FM were introduced in Europe, Volvo VT
in North America and a modification of Volvo
VM in Brazil.
First out in 2006 was an upgraded version of
the flagship, Volvo FH16. It is equipped with a
new 16-liter engine with up to 660 hp, which
makes it the world’s most powerful mass-pro-
duced truck.
Piet Visser works as a driver for flower export com-pany Hilverda De Boer, which transports fresh flow-ers from flower auctions in Amsterdam to customers throughout Europe.
The corresponding flagship for the US mar-
ket is the Volvo VT series, which was launched
in 2005. With its 625 hp, the Volvo VT is the
most powerful truck in the US. During the year,
the product program was further developed
and the offering broadened to include more
cab variations, such as a mid-roof cab, to satisfy
more customer segments.
In terms of environment, Volvo Trucks is con-
tinuing developments within the truck sector.
The new engine program not only complies
with the new environmental legislation in
Europe, but also has considerably lower fuel
consumption than its predecessors.
On January 1, 2007, new emission regula-
tions were introduced in the US. In order to
meet these regulations, Volvo Trucks launched
a completely new engine program for the North
American market. Volvo I-Shift was also pre-
sented to US customers, which is the first auto-
matic Volvo gearbox to be introduced in North
America.
During 2006, the Volvo FL and Volvo FE
were also introduced in Europe and are aimed
at a broader category of distribution customers,
for example, tradesmen, fruit traders and bak-
ers. For the benefit of these customers, Volvo
Trucks has developed a completely new busi-
ness concept, which facilitates the rapid and
simple purchase of key-in-hand trucks equipped
with bodies, tail lift and all types of support ser-
vices, for example, service contracts.
64 Business areas 2006

• New products were well received in the market.
• Good fuel economy in the new engine program.
• Hybrid concept for heavy truck presented.
• Continued development of dealer network with twelve new workshops in Europe.
Ambitions 2006
• Manage the expected sharp decrease in demand in North America.
• Ensure production capacity for a continued strong European market.
• Continue developing customer relations in line with the implemented dealer strategy.
• Stronger focus on communicating the company’s core values.
• Successful introductions and production change-overs.
• Introduce engines in all trucks that meet future emissions standards in Europe and US.
• Maintain high pace of activity in the development of alternative drivelines.
• Further development of dealer network.
Outcome 2006 Ambitions 2007
Production
In 2006 the number of trucks manufactured
increased, compared with 2005, 106,884
(104,515). In Europe, 56,023 units (48,644)
were manufactured, which was an increase
of 15%.
In the US, manufacturing rose by 16% to
37,281 (32,256), while in Brazil there was a
decline of 1% to 8,286 (8,330).
In conjunction with the introduction of the
new Volvo FH and Volvo FM trucks in 2005,
fewer trucks were manufactured at the begin-
ning of 2006 due to change-over in production
of the new trucks, which resulted in lower deliv-
ery rate, compared with 2005. However, the
loss was recovered during the last few months
of the year and total manufacturing was at the
same level as in 2005.
In the US, manufacturing has been at a high
level and in early 2007 Volvo vehicles and
Mack highway vehicles built at the New River
Valley plant were combined in the same pro-
duction line.
Number of trucks produced Volvo Trucks 2005 2006
Volvo FH 42,951 41,302Volvo VN, VT and VHD 32,256 37,281Volvo FM9, 10, and 12 20,102 20,704Volvo FL 5,052 4,799Volvo NH 2,312 556Volvo VM 1,842 2,242Total 104,515 106,884
Number of trucks deliveredVolvo Trucks 2005 2006
Western Europe 35,560 39,011Eastern Europe 7,073 10,217North America 32,151 37,145South America 7,723 7,940Asia 17,678 7,501Other markets 3,511 3,705 Total 103,696 105,519
In August 2006, the new plant was opened
in Durban, South Africa, at which Volvo FM and
Volvo FH trucks will be assembled.
In Umeå, 58,000 cabs were manufactured
in 2006, which has nearly doubled since 1993
and was a new record.
In 2006 Volvo Trucks announced its inten-
tion to make all production units in Europe car-
bon-dioxide neutral. In 2005 Volvo presented
the initiative to make the truck plant in Tuve,
Göteborg, carbon-dioxide neutral. The invest-
ments also comprise energy deliveries from
windpower plants.
Business areas 2006 65

05 06166.3
0302118.8 136.9
117.0 155.4
04
Operating income1,2, SEK bn
057.5
068.6
033.4
021.0
046.6
Total market
>>> The number of trucks sold reached record
levels primarily in Europe and North America,
exceeding the previous all-time-highs reported
in 2005. Demand in Europe seems to be con-
tinuing on this positive trend. Particularly note-
worthy in this respect is that the new EU mem-
bers in Eastern Europe are reporting sharp
increases in truck sales.
Developments in Asia in 2006 point to favor-
able economic growth in several markets, with
major markets such as China and India report-
ing rising sales of heavy trucks.
In Brazil truck sales declined i.a. due to such
factors as a strong domestic currency in rela-
tion to the USD, resulting in problems for key
agricultural exports.
In 2006 the total market in Europe 27 in -
creased by 7%, amounting to 295,038
(276,822) vehicles, whereof Western Europe
Net sales 1, SEK bn Operating margin1,2, %
Trucks – strong demand in 2006
The global market for heavy trucks remained at a very high level
in 2006 as a result of strong economic conditions that have
favored road transport operations in recent years.
grew by 4% and the new EU countries advan-
cing a full 34%. Moreover, in Russia the number
of imported trucks increased by approximately
90%.
In North America, the overall market for
heavy trucks (class 8) in 2006 rose 13% to
348,866 (307,973), with the USA reporting
growth of 12% to 284,008 vehicles (252,792).
The Brazilian market retreated 9% to 39,873
vehicles in 2006. Among the major markets in
Asia, Japan grew 6%, China 29% and India
41%. In the Middle East, however, the overall
market fell 50%, due largely to the decline in
Iran, which fell by a full 94%.
Market shares
In 2006, Volvo Trucks’ market share in Europe
27 was 14.2% a decrease by 0.1 percentage
point compared to 2005. The decline was
mainly due to lower market shares in the UK,
05 060302 041.2 4.0 9.0 11.7 14.4
partly offset by an increase in Italy and France.
Renault Trucks’ market share in Europe was
10.6% for heavy trucks (10.7). In the medium
heavy truck segment (10–16 tons) the market
share was 15.3% (15.8) for Renault Trucks and
3.8% (5.3) for Volvo Trucks. The development
in Volvo Trucks was mainly due to lower deliver-
ies in conjunction with production change-over
for the new distribution trucks.
In Russia, Volvo Trucks’ import share was
25.6%.
In North America Mack’s market share
declined by 0.4 percentage points to 9.2%,
mainly due to a combination of factors related
to product renewal activities, supply issues
associated with record volumes and regional
softening in certain market segments. Volvo
Trucks’ market share in North America rose 0.3
percentage points to 10.2%.
1 Years 2004, 2005 and 2006 are reported in accordance with IFRS and 2002 and 2003 in accordance with Swedish GAAP. See Note 1 and 3.
2 Excluding adjustment of goodwill.
In all of Europe there is an increased need for trans-ports and especially between the Western and Eastern parts of Europe, which means an increased need for heavy trucks.
Net sales as percentage of Volvo Group’s sales
67%
66 Business areas 2006

Net sales per market 2004 2005 2006
Europe 77,431 79,706 88,323North America 35,154 46,129 50,605South America 5,223 7,657 9,213Asia 12,378 13,551 8,975Other markets 6,693 8,353 9,190Total 136,879 155,396 166,306
Market shares in Europe1 Market shares in North America1
Volvo Trucks
RenaultTrucks
05 06060514.3% 14.2% 10.6%10.7%
Volvo Trucks
MackTrucks
9.9% 10.2% 9.2%9.6%05 060605
Number of vehicles delivered 2004 2005 2006
Western Europe 90,746 91,087 97,074Eastern Europe 11,920 12,535 17,343North America 49,273 64,974 70,499South America 9,190 11,248 11,646Asia 24,881 25,706 12,817Other markets 7,209 8,829 10,552Total 193,219 214,379 219,931
1 In heavy trucks segment (class 8).
During the same period in Brazil, Volvo
Trucks’ market share advanced 1.7 percentage
points to 15.3%.
Earnings
Net sales for the Group’s truck operations
amounted to SEK 166,306 M, which adjusted
for changed exchange rates corresponded to
an increase of 7%. The increase was attribut-
able to higher sales, primarily in Europe, North
America and South America.
Demand in North America was driven by
favourable market conditions in the US, which
resulted in increased need for transports. In
addition customers chose to buy trucks before
the new emission legislation came into force by
January 1, 2007. In all of Europe there is an
increased need for transports and especially
between the Western and Eastern parts of
Europe, which means an increased need for
heavy trucks. The strongest development is
happening in Eastern Europe, where new
member countries of the EU contribute sub-
stantially. Countries outside the EU in Eastern
Europe are also developing favourably. Demand
for transports in these countries, and thereby
demand for heavy trucks, is expected to be con-
tinuously strong during 2007. In total, Volvo
delivered 219,931 trucks in 2006, 3% more
than in the preceding year.
Operating income for Trucks improved and
amounted to SEK 14,369 M (11,717). Excluding an
adjustment of goodwill of a negative SEK 1,712 M
the increase was 23% compared to 2005.
The improved result is attributable primarily to
North America, where Mack Trucks and Volvo
Trucks increased profitability through a favor-
able price realization and increased volumes. In
Europe, Volvo Trucks continued to improve its
earnings while profitability for Renault Trucks’
operations in Europe declined somewhat.
1 In heavy trucks segment.
Business areas 2006 67

Buses– new product program increases the customer’s productivity
senger satisfaction. During 2006, the Volvo
9700 and Volvo 9900 were launched with a
new exterior design and with a broad range of
interior design options. Volvo Bus was also first
in the bus world to introduce front underrun
protection that reduces the risk of injuries to
drivers and passengers in an automobile in a
frontal collision with a bus.
The 7700 city bus was also redesigned and
equipped with a new 9-liter engine, which pro-
vides for more comfortable and efficient driving
in city traffic.
During the year, Volvo Buses introduced its
first city bus in India. The city of Bangalore pur-
chased 50 modern, air-conditioned city buses
with low entry.
Volvo Buses’ subsidiary in Canada, Nova Bus,
launched an articulated version of its city bus
Nova LFS during the year.
Nearing peak of business cycle
The total global bus market remained at a high
level in most parts of the world in 2006, but
there are signs that globally the business cycle
in the bus industry is now nearing its peak and
will soon turn downward. However, economic
growth in Asia remains strong and bus sales
continue to rise in many countries.
Calculating lifecycle costs
The trend toward larger bus operators contin-
ues. They are focusing increasingly on lifecycle
costs. Which increases the demand for fuel
economy, quality and aftermarket services.
Regional authorities place high demand with
regard to the environmental impact of buses.
As a result, an increasing number of bus manu-
facturers are conducting research and devel-
oping buses with alternative drivelines and for
alternative fuels.
>>> With today’s high fuel prices, Volvo Buses’
customers’ focus is on fuel consumption. Volvo
has chosen the SCR (Selective Catalytic
Reduction) technology to meet the new emis-
sions standards, primarily because fuel con-
sumption is then lower. Combined with
improvements in gearboxes and drive shafts,
fuel costs are reduced for customers.
Volvo Buses is a leader in environmentally
sound engines. Already today, customers can
purchase Volvo engines meeting emissions
standards that are not proposed to become
effective until 2009. In addition, a new gas
engine with very low emission levels was
released during the year, an engine that can
operate on biogas from renewable energy
sources.
In the coach segment, a stylish exterior and
interior design of the bus is important for pas-
Net sales as percentage of Volvo Group sales
New modern design, new safety solutions and effi cient drivelines
with reduced fuel consumption. Volvo Buses renewed much of its
product range in 2006, a product portfolio that helps customers
to increase their productivity.
Operating margin1,2, %
2.805
3.806
(0.7)02
(3.0)03
2.004
0
New Volvo 9700 provides Volvo Buses’ customers the conditions to improve productivity.
Net sales1, SEK bn
05 0616.9
030214.0 12.0 12.7 16.6
04
Operating income (loss)1,2, SEK M
05 060302 04(94) (361) 253 470 633
0
1 Years 2004, 2005 and 2006 are reported in accordance with IFRS and 2002 and 2003 in accordance with Swedish GAAP. See Note 1 and 3.
2 Excluding write-down of shares in Henlys Group 2003 and 2004.
7%
68 Business areas 2006

• The improvement program resulted in increases efficiency in sales and the indus-trial system globally.
• Production processes have been simplified and result in shorter production times.
• All new engines for Euro 4/Euro 5 are in production.
• Nearly 100 of Volvo Trucks’ service centers in Europe were selected to also be able to provide service for the buses’ bodies.
Ambitions 2006
• Continue the implementation of the earn-ings-improvement program within Volvo Buses.
• Shorten lead times from order to invoicing.
• Further strengthen positions in China and India.
• All employees shall be involved in the Operational Development program.
High deliveries in China
Volvo delivered 10,360 buses and bus chassis
(10,675) in 2006. Higher sales were reported
mainly in North America, South America and
Asia. During the year, 1,300 of an order for
2,000 midi-buses were delivered to Shanghai
in China.
Volvo Buses market shares were strength-
ened in, for example, Mexico, China and North
America. In contrast, the business area lost
market shares in Europe, due mostly to
intense price competition. However, Volvo
Buses is still the market leader in the Nordic
region and the UK.
Improved earnings
Net sales in 2006 were largely unchanged
compared with a year earlier, SEK 16,856 M
(16,589).
Operating income rose from SEK 470 M to
SEK 633 M . Among other factors, the stronger
earnings are attributable to better product and
market mixes and increased cost awareness
resulting in more efficient production methods
as well as increased use of components that
are common with Volvo Trucks. Operating
income included a positive effect of SEK 47 M
following settlement of a dispute regarding
export credits in Brazil.
New body plant in India
Volvo produced 10,440 buses and bus chassis
(10,406) in 2006. The company decided during
the year to start a joint-venture company in
India that will build a plant in the country for
production of bus bodies, primarily for the
Indian market.
• Continue the implementation of the earnings-improvement program.
• A reduction in product costs through such measures as increased standardization and enhancement of the production process.
• Renewal of the engine program to meet the requirements of Euro 4 and Euro 5.
• Improved customer service through expanded cooperation with dealers and service centers.
Outcome 2006 Ambitions 2007
Number of vehicles delivered 2004 2005 2006
Western Europe 3,073 3,385 3,246Eastern Europe 344 338 324North America 1,388 1,546 1,741South America 624 2,297 1,170Asia 2,341 2,554 3,349Other markets 462 555 530Total 8,232 10,675 10,360
Net sales per market Mkr 2004 2005 2006
Europe 6,948 7,142 7,509North America 2,960 4,247 4,910South America 521 2,641 1,537Asia 1,632 1,612 2,003Other markets 661 947 897Total 12,722 16,589 16,856
Business areas 2006 69

Construction Equipment– increased sales and enhanced profitability
Growing total market
Market conditions were once again favorable in
2006. The total market for Volvo CE’s product
segments rose by 10%. The market declined by
4% in North America and rose by 11% in
Europe, while other markets rose by 21%. The
growth was attributable to overall positive busi-
ness conditions for the industry.
Public and private investments in infrastruc-
tural projects contributed to the sales increase
for heavy construction machines. The North
American market for heavy construction
machines grew by 3%, while the European
market increased by 15%. Other markets rose
22%.
During 2006, the total market for compact
construction equipment increased by 6%,
compared with the preceding year. The North
American market decreased by 8% while the
European market rose by 9%, and other mar-
kets grew by 20%.
>>> In addition to the actual equipment, Volvo
CE offers such services as financing, spare
parts, used equipment, renovated spare parts
and equipment, service agreements, tools and
the opportunity to rent machinery and equip-
ment.
As a result of the renewed and expanded
product offering, new customer segments are
reached. The recently launched excavators for
demolition and forest work are excellent ex-
amples of how the company is approaching
additional market segments.
Volvo CE’s products and services are offered
in more than 125 countries worldwide through
proprietary or independent dealerships.
Rental is the segment of the industry that is
growing fastest, and Volvo CE currently has
nearly 135 rental outlets, primarily in North
America and Europe.
Volvo Construction Equipment has grown considerably in recent
years. Customers from all parts of the world have shown their
appreciation of Volvo CE’s comprehensive investments in new
products and the company can currently offer one of the most
modern product ranges in the industry.
The new L350F is Volvo’s largest wheel loader so far.
Net sales as percentage of Volvo Group sales Net sales1, SEK bn Operating income1, SEK bn Operating margin1, %
05 0640.6
030221.0 29.423.2 34.8
04 057.9
069.6
033.9
021.9
046.5
05 060302 040.4 0.9 1.9 2.8 3.9
1 Years 2004, 2005 and 2006 are reported in accordance with IFRS and 2002 and 2003 in accordance with prevailing Swedish GAAP. See Note 1 and 3.
Industry trend
The trend in the global industry for construction
equipment has been highly intensive in recent
years. Suppliers, manufacturers and dealers
are working hard to satisfy very high customer
demands. In certain cases, this resulted in a
shortage of components and raw materials,
such as tires and steel, leading in turn to long
delivery times.
More stringent rules regarding exhaust
emissions and noise, combined with lower fuel
consumption and reduced operating expenses,
have forced the industry to invest more in
research and development in these areas. For
many types of machines, the cost of fuel
accounts for one third of the annual operating
expenses, although it can be as high as 50%
for certain machines.
16%
70 Business areas 2006

• Increased production volumes in Korea, China and Germany.
• Rental and after-market services increased by 111% and 13%, respectively.
• The cost of sales and administration was kept on a constant level in spite of increased activity level.
• All Volvo Construction Equipment dealers are participating in the “Partnership Development Program”.
• Product launches in new segments, such as demolition and forest work.
Ambitions 2006
• Continued development of the excavator business.
• Penetration of the domestic market for wheel loaders in China.
• Continued upgrade of the industrial system to satisfy customer demand.
• Focused strategy for India and Russia.
• Growth within services.
• Continued focus on tools in order to reach new segments and customers.
• Further develop excavator business.
• Capitalize on investments made in Korea, China and Germany.
• Continue to focus on the after-market and on rental operations, as well as reduce expenses for sales and administration.
• Continue the dealer development program.
• New products and services for new seg-ments and customers.
Outcome 2006 Ambitions 2007
Net sales per marketSEK M 2004 2005 2006
Europe 13,453 15,524 18,759North America 8,601 10,337 11,280South America 922 1,238 1,358 Asia 4,961 5,717 6,903 Other markets 1,423 2,000 2,264Total 29,360 34,816 40,564
intense competition. Lingong, which had a
share of 11% of the Chinese market for wheel
loaders in 2005, is a technologically advanced
company with very modern production plants.
Products
Products launched in 2006 included the
L350F, a new wheel loader. Equipped with a
16-liter Volvo diesel engine, the L350F is the
largest wheel loader in Volvo’s history, which
means that the company can approach new
customer segments.
capacity utilization and good control of selling
and administrative expenses, as well as to
active price management.
Acquisitions
In September 2006, Volvo CE announced its
intention to acquire the equivalent of 70% of
the shares in Shandong Lingong Construction
Machinery CO (Lingong), a major Chinese manu-
facturer of construction equipment with an
extensive network of dealers in China. The
acquisition was finalized in January 2007.
China is the world’s second largest market
for construction equipment and the world’s
largest market for wheel loaders. The Chinese
market is expected to grow additionally, and
Volvo CE intends to participate actively in this
growth.
Since Lingong was founded in 1972, the
company has established a position as one of
the leading players in a market subject to
Increased deliveries
Volvo Construction Equipment increased deliv-
eries in 2006. For example, Volvo’s deliveries of
excavators rose by 20%. The high deliveries
were the result of new products and improved
distribution. The number of machines sold dur-
ing 2006 increased by 11% to a record level
of more than 37,000 units.
Strong earnings trend
Volvo CE’s net sales rose by 17% to SEK
40,564 M (34,816). Adjusted for exchange-
rate effects, the increase was 17%. The in -
crease was attributable mainly to higher vol-
umes, improved distribution and an
advantageous product and market mix.
Operating income improved by 41% during
the year to SEK 3,888 M (2,752), representing
an operating margin of 9.6% (7.9). The earn-
ings and margin improvements were due to the
advantageous product and market mix, high
Business areas 2006 71

Volvo Penta – innovative tradition
can reduce installation times by up to 75 percent
compared with traditional straight shafts, which
fac ili tates more efficient production. At the same
time, the boat builder can offer the end customer
a quieter and cleaner boat, with up to 30 per-
cent lower fuel consumption as well as signifi-
cantly improved performance and maneuver-
ability.
Volvo Penta works in the same fashion with
its industrial engine customers. By creating
customer benefits, such as shorter installation
times, improved fuel economy, environmental
features and performance backed by global
service support, Volvo Penta contributes to
enhanced competitiveness for customers, such
as Kalmar Industries and Atlas Copco.
Strong market in Europe
The total European market for marine as well as
industrial engines was strong in 2006. The
total market for marine engines weakened in
North America, while demand for industrial
engines was more stable. The total market in
Asia remained weak, due primarily to the low
demand for diesel gensets in China. In contrast,
the development on markets in other parts of
the world was positive, for example, Turkey and
South Africa.
New market shares
Volvo Penta continued to capture market
shares in most areas of its operations, particu-
larly the inboard market, in which the volumes
for Volvo Penta IPS increased steadily. At year-
end, there were slightly more than 100 boat
models from the world’s largest boat builders
with the new drive system.
In the industrial engine segment, diesel-
powered gensets are the predominantly most
important product for Volvo Penta, which dur-
ing the year strengthened its global market
shares in this segment.
>>> Volvo Penta has written marine history
through a number of pioneering innovations,
such as the Aquamatic drive and the counter-
rotating Duoprop propellers, both of which are
among the marine industry’s most important
innovations in history.
In recent years, Volvo Penta IPS, the drive
system with forward-facing propellers, and the
joystick, are recognized in the same fashion as
radical innovations in the way to propel boats.
Creates competitive advantages
The IPS system is a clear example of how prod-
uct development contributes to creating com-
petitive advantages for Volvo Penta’s custom-
ers, for example, such world-leading boat
builders as Bavaria, Beneteau/Jeanneau,
Cranchi, Sessa Marine, Azimut, Tiara, Four
Winns, Mustang and Intermarine.
By installing the IPS system, boat builders
Volvo Penta was founded in 1907 in conjunction with the production
of the fi rst marine engine, B1. Pentaverken soon became an estab-
lished engine manufacturer, which in 1927 delivered the engine
to Volvo’s fi rst passenger car. Volvo acquired Pentaverken in 1935
and Volvo Penta has been part of the Volvo Group since then.
With forward-facing propellers and steerable drive units, Volvo Penta IPS represents an entirely new concept in the marine industry.
Net sales as percentage of Volvo Group sales Net sales1, SEK bn Operating income1, SEK M Operating margin1, %
05 0610.5
03027.7 9.17.6 9.8
04 059.6
069.6
039.1
028.4
0410.4
05 061,002
0302647 940695 943
041 Years 2004, 2005 and 2006 are reported in accordance with IFRS and 2002 and 2003 in accordance with Swedish GAAP. See Note 1 and 3.
4%
72 Business areas 2006

Financial development
Volvo Penta’s financial development through-
out the current decade is characterized by
sales growth and high profitability. This trend
continued in 2006. Sales of SEK 10,485 M and
operating income of SEK 1,002 M are the high-
est ever in Volvo Penta’s history. Operating mar-
gin for the full year amounted to 9.6% (9.6).
Capacity increase in Vara
To meet the increased demand for the own-
developed D4 and D6 marine engines, SEK
100 M was invested in the Vara plant, which
resulted in increased capacity to about 18,000
engines annually. During the past five years,
Volvo Penta has invested about SEK 800 M in
the Vara plant, which more than doubled pro-
duction and the number of employees.
Electronics improves boating life
In recent years, Volvo Penta has moved to the
forefront to introduce electronics into the
marine industry. End customers benefit
through customer value in the form of cleaner
and quieter engines and better performance
while at the same time boat builders can
enhance the efficiency of their production.
Electronics also facilitate a new type of func-
tionality, for example Volvo Penta’s new joystick
that makes docking of boats significantly eas-
ier and safer. Volvo Penta is the only company in
the leisure boat industry that can currently offer
this function.
Growth in industrial engines
Today, Volvo Penta sells about 20,000 engines
annually for industrial applications and, conse-
quently, contributes to substantial diesel
engine synergies in the Volvo Group. Volvo
Penta is now focusing on benefiting from the
Group’s new generation of diesel engines for
further growth in the industrial engine busi-
ness. This will occur partly through strong
growth in the core segment, diesel-powered
gensets, as well as through a broader customer
base within various types of mobile applica-
tions, such as terminal forklifts, stone crushers
and compressors.
• Successively shorter lead times. Decision on increased capacity in Vara plant.
• Improved operating income and strong operating margin.
• Strengthened market shares in inboard seg-ment.
Ambitions 2006
• Increased growth and strong focus on profitability.
• Broadened customer base in industrial engines.
• Delivery precision and shortened lead times in production.
• Ensure more efficient production and logistics solutions for Volvo Penta customers.
• Ongoing focus on cost control and positive cash flow.
• Ensure the launch of the Volvo Penta IPS enjoys continuing success.
Outcome 2006 Ambitions 2007
Net sales per marketSEK M 2004 2005 2006
Europe 4,907 5,102 5,822North America 2,500 2,832 2,815South America 142 208 221Asia 1,324 1,427 1,359Other markets 184 207 268Total 9,057 9,776 10,485
Business areas 2006 73

Volvo Aero – skilled business partner
Many important milestones
Volvo Aero is in the midst of an expansive period
with many new production start-ups for aircraft
engine components. During 2006, some 20
new production starts were initiated, the larg-
est number ever in a single year. The company
has invested heavily in research and product
development and in a modern machine park.
Development continued during the year on
the GEnx engine, the single, largest investment
in Volvo Aero’s history. At the beginning of the
year, it was clear that Volvo Aero would be pro-
ducing six different components for the GEnx
engine. The first ground tests of the engine
were carried out in March, with successful
results and on schedule.
Volvo Aero has also continued working with
assuming a role in the new engine programs
that in a few years will be installed on aircraft
replacing the popular Airbus 320 and Boeing
737. It was also finalized during the year that
Volvo Aero will be involved in demonstrating
technology in the US engine manufacturer
Pratt & Whitney’s new geared turbofan engine.
This new cooperation is a first strategic step
toward positioning Volvo Aero for the future in
this important market segment.
Through the acquisition of Aero-Craft, based
in Newington, Connecticut, in December 2004,
the specialized product portfolio was expanded
with fan cases. A number of contracts for fan
cases have been signed, for example for engines
such as the GEnx, Trent 1000 and GE90.
Building commenced in 2006 for the expansion
of Aero-Craft’s plant in Newington.
Volvo Aero Services signed a five-year agree-
ment with Emirates Airlines that gives the com-
pany exclusive rights to sell Emirates entire sur-
plus spare parts inventory for aircraft and aircraft
engines. In conjunction with this, Volvo Aero
Services will open a distribution center for spare
parts in Dubai. Volvo Parts will handle the logis-
tics service, as assigned by Volvo Aero Services.
Specialized competence
>>> Lightweight design is one of Volvo Aero’s
strengths and has a major impact on fuel con-
sumption and, consequently, the environment,
an aspect that is highly in focus in the aero-
space industry today.
Through applying Volvo Aero’s expertise in
lightweight structures, simulation and newly
patented production methods, engine manu-
facturers can reduce lead times for complete
engine development, while at the same time
engines becomes quieter and lighter. The
results are reduced costs and lower weight,
two decisive parameters for future aircraft
engines. Reduced weight means lower fuel
consumption and, consequently, the emission
of carbon-dioxide and nitrogen oxide.
The technologies are based on successful
synergies between the commercial and military
businesses and with space, in which Volvo Aero
plays an important role in the European space
industry.
Volvo Aero offers its customers and partners responsibility for the
development and manufacture of advanced engine components
for aircraft and space rockets. Volvo Aero’s technologies, includ-
ing a world-leading role in lightweight structures which is an
expertise that is increasingly in demand in the aerospace industry
and which contributes to Volvo Aero’s greater involvement in new
aircraft engines.
Market fundamentals remained strong in 2006. World airline passenger traffic increased by 4.5% in 2006.
Net sales as percentage of Volvo Group sales Net sales1, SEK bn Operating income (loss)1, SEK M Operating margin1, %
05 068.0
03028.8 6.98.0 7.5
04 0511.1
064.3
03(0.5)
02
0
0.1045.8
05 060302
0
045 (44) 403 836 345
1 Years 2004, 2005 and 2006 are reported in accord-ance with IFRS and 2002 and 2003 in accordance with Swedish GAAP. See Note 1 and 3.
3%
74 Business areas 2006

• The challenges were met, on time, technically and at budget.
• Delivery target fulfilled
• Ambition partially achieved, but continued dialog with politicians and authorities are required to come to a longer-term solution.
• Goal partially fulfilled, but profitability still unsatisfactory. This was one of the reasons why Volvo Aero decided to close the engine overhaul operations in Bromma.
• Further develop Volvo Aero’s technology offering, to ensure a role in future engine programs.
• Fulfill commitment in the development and manufacture of the new GEnx engine.
• Expand Volvo Aero’s component business.
• Increase volumes and improve profitability in the aftermarket.
• Meet challenges in design and manu-facturing, particularly regarding the new GEnx engine.
• Continue precision delivery of engine com-ponents without losing focus on costs.
• New development assignments for the RM12 Gripen engine.
• Increase after-market volumes and profit-ability.
Outcome 2006 Ambitions 2007Ambitions 2006
Net sales per market SEK M 2004 2005 2006
Europe 3,179 3,406 3,613North America 3,127 3,612 3,815South America 138 168 173Asia 400 284 356Other markets 81 68 91Total 6,925 7,538 8,048
Market
Market fundamentals remained strong in 2006.
World airline passenger traffic increased by
4.5% in 2006. Traffic growth varied between
world regions, with airlines in Europe and the
Asia-Pacific region experiencing the strongest
rates of traffic growth during the year, followed
by carriers in the US. The year 2006 was also
another record-breaking load factor year.
The year 2007 is expected to be the first
profitable year for the airline industry since
2000. However, the International Air Transport
Association (IATA) states that airlines must
continue keep load factors high by carefully
managing capacity and by finding further effi-
ciency gains to achieve the USD 2.5 billion
industry profit projected for 2007.
Order bookings for large commercial jets
reached record levels and the total number of
orders at the end of December for new aircraft
was 4,988, corresponding to more than five
year’s volumes at the current rate. The order
intake at 1,882 large commercial aircraft in
2006 was a decrease of 12% compared to
2005, but still among the strongest in modern
time. Airbus and Boeing have delivered 832
aircraft, up 25% compared with the year-earlier
period. The current production up-cycle is
expected to continue to rise driven by the siz-
able backlog and the anticipated return to air-
line industry profitability.
Earnings
Volvo Aero’s net sales rose by 7% in 2006 to
SEK 8,048 M (7,538). The sales increase is
attributable mainly to higher volumes, primarily
in the engine component production.
Operating income amounted to SEK 345 M
(836). The decline in earnings is due among
other reasons to continued profitability prob-
lems in the aftermarket business. This was also
one of the reasons why Volvo Aero in November
made the strategic decision to close the engine
overhaul operations in Bromma, Sweden.
Earnings were negatively affected to the extent
of SEK 258 M for discontinuation costs.
Development in the engine component busi-
ness remained strong, with increased produc-
tion volumes and higher sales volumes for new
spare parts. The positive trend was offset partly
by many production start-ups of new engine
components, which had a negative impact on
capacity utilization in the production plants.
Higher raw material prices also affected earn-
ings negatively.
The operating margin decreased to 4.3%
(11.1).
Business areas 2006 75

Financial Services– essential to the overall offering
Market growth
Commercial Focus (CF), the strategic initiative
launched in 2005, made it possible for Financial
Services to better capitalize on existing growth
possibilities. The CF initiative is a centralized
business strategy that was formed to provide
high quality financial solutions by utilizing
knowledge and experience from local and
international business teams. The goals are to
integrate Financial Services’ activities more
closely with the sales processes of the busi-
ness areas, enhance the depth and breadth of
the product offering and develop the supply of
services to key accounts.
Within the Danafjord real estate unit, a num-
ber of projects were started aimed at meeting
the Volvo Group’s growing need for office
premises and lighter duty properties. For ex-
>>> At its heart, a successful finance company
is about relationships. Financial Services finds
this to be true in each of its nearly 60 markets.
Thus the year 2006 was characterized by
intense efforts to align Financial Services more
closely with its customers’ operations. For
example, new customer finance companies
were started or approved in the emerging mar-
kets of China, Hungary and Slovakia. In Europe,
a new regional structure to improve synergies,
transparency and availability was introduced.
The US sales organization was strengthened
and restructured based on product categories.
At the end of 2006, management of the real
estate and banking operations was transferred
to AB Volvo, which meant that the business
area is solely a financial service operation from
2007.
Financial solutions are vital to the Volvo Group. They increase
customer satisfaction, competitive benefi ts, profi tability and
growth. Financial Services offers traditional fi nancial services
such as installment contracts, operating and fi nancial leasing and
dealer fi nancing. In many markets, insurance and rental services
and other offerings are also available.
Ragnesands Bus company chooses Volvo Financial Services to fulfill its financing and service agreement needs.
Credit portfolio, net1, SEK bn
Operating income1, SEK M
Return on share-holders’ equity1, %
05 0676.7
030261.3 64.360.1 78.8
04 0515.3
0615.5
039.8
024.8
0411.1
05 062,301
0302490 1,365926 2,033
04
Market penetration2, %
0521.7
0619.7
0323.6
0218.8
0422.4
2 Share of business financed by Financial Services in markets where financial services are offered.
Penetration by business area2, %
VolvoCE
VolvoTrucks
RenaultTrucks
Buses MackTrucks
34 30 28 24 16 15 13 12
2005
2006
11 10
ample, investments were made in a new head
office for Volvo 3P and Volvo Powertrain, both
in Lundby, Göteborg. Non-strategic properties
were divested or prepared for divestment dur-
ing the year. The occupancy rate at the end of
2006 was 99.7% (99.9), and 49% (52) of the
leases was to external tenants and 89% (81) of
the leases extends for five years or more.
Volvo Treasury, the Group’s internal bank,
coordinates the Group’s global funding strategy
and financial infrastructure. It is also respon-
sible for the management of all interest-bear-
ing assets and liabilities and the execution of
foreign exchange transactions. Volvo Treasury
experienced strong earnings in 2006, with
significant value creation in management of
assets and in foreign exchange transactions.
1 Years 2004, 2005 and 2006 are reported in accordance with IFRS and 2002 and 2003 in accordance with Swedish GAAP. See Note 1 and 3.
76 Business areas 2006

Strong results
Operating income amounted to SEK 2,301 M,
an increase of 13% from SEK 2,033 M in 2005.
Return on equity of 15.5% (15.3) and an equity
ratio at year-end of 11.5% (11.2) is within the
framework set for Financial Services. All
regions within customer finance improved per-
formance compared with the preceeding year.
During the year, Financial Services efficiently
handled risks in each individual product line
while generating a reasonable return. Reduced
interest margins caused by rising interest rates
were dealt with successfully.
In 2006, the market was characterized by
excess liquidity and strong competition from
other creditors, which increased the challenge
for Financial Services to achieve set goals in
terms of volume and penetration targets.
During 2006, the volume of new financing
amounted to SEK 35.3 billion, which was an
increase of more than SEK 2.2 billion, com-
pared with 2005. On December 31, 2006, total
assets amounted to SEK 84 billion (86), of
which SEK 77 billion was attributable to the
credit portfolio. Adjusted for the effects of for-
eign exchange movements, the credit portfolio
increased by 5.3% (9.6) during the year.
Write-offs in 2006 amounted to SEK 259
M, corresponding to a record low level to an
annualized ratio of 0.33% (0.40). On December
31, 2006, total credit reserves amounted to
SEK 1,578 M (1,751), giving a credit-reserve
ratio at year-end of 2.01% (2.17). In seeking
growth, Financial Services will not compromize
its underwriting criteria.
Condensed income statement SEK M 2004 2005 2006
Net sales 9,598 7,549 8,969Income after financial items 1,365 2,033 2,301
Income taxes –430 –609 –756Income for the period 935 1,424 1,545
Distribution of credit portfolio, net % 2004 2005 2006
Operational leasing1 20 1 0Financial leasing1 25 40 40Installment contracts 38 41 42Dealer financing 16 17 17Other customer credits 1 1 1
1 The change in 2005 pertains to the impact of IFRS leasing classification.
• Opened finance company in China, Hungary and Slovakia.
• Focus on interest margins and risk management.
• Financing at very low cost and strong liquidity.
• Improve customer satisfaction.
• Enhance employee recruitment, develop-ment and retention activities.
• Execute on market growth plus fee income opportunities.
• Use better technology and processes to improve productivity and customer service.
• Continued to sharpen risk management activities.
• Expand customer finance operations in growth markets.
• Closely monitor and adapt operations to economic conditions.
• Maintain low costs for funding the Group’s operations.
Outcome 2006 Ambitions 2007Ambitions 2006
Volvo Trucks 48%
Mack Trucks 9%
Volvo CE 22%
Other 1%
Buses 5%
Renault Trucks 15%
Credit portfolio by business area, %
Business areas 2006 77

Corporate bodies in
corporate governance
>>> The governance and control of the Volvo
Group is carried out through a number of cor-
porate bodies. At General Meetings, the share-
holders exercise their voting rights with regard,
for example, to the composition of the Board of
Directors of AB Volvo and election of external
auditors. An Election Committee proposes
candidates to serve as Board members, Board
Chairman and external auditors. The Board is
responsible for the Group’s long-term develop-
ment and strategy as well as controlling and
evaluating the company’s operations. In add-
ition, the Board appoints the President of AB
Volvo, who is also the Chief Executive Officer
(CEO). The duties of the Board are partly exer-
cised through its Audit Committee and its
Remuneration Committee. The CEO is in
charge of the daily management of the Group in
accordance with guidelines and instructions
provided by the Board.
The CEO is in charge of the daily management
of the Group through primarily two different
organs, the Group Executive Committee and
the business areas Boards of Directors. The
Group Executive Committee comprises those
who report directly to the CEO. At 2006 year-
end, there were 17 Group Executive Committee
members including the CEO and comprised
Presidents of the Group’s eight business areas
as well as President of Volvo Powertrain busi-
ness unit, who is also the Technical Director
for the Volvo Group. The Group Executive
Committee also includes the Executive Vice
President, who is also the Deputy CEO, Chief
Financial Officer and Heads of the Group’s
staff units. Meetings, which are led by the CEO,
deal with Group-wide issues and issues affect-
ing more than one business area, and supply
information concerning the Group’s perfor-
mance. The CEO or the Deputy CEO is the
Chairman of the Board for the Boards of all
business areas and these comprise mainly of
other members of the Group Executive
Committee. The Boards of the business areas
effect control and follow-ups of business areas’
financial development, business plans and
goals as well as make decisions regarding, for
example, investments.
Swedish Code of Corporate Governance
Volvo applies the Swedish Code of Corporate
Governance (“the Code”).
Between January 1, 2006 and December
31, 2006 Volvo did not deviate from any of the
Code’s regulations that were applicable during
this period, with the exception of paragraph
4.2.1. The exception is that Tom Hedelius is
member of the remuneration committe even
though he is not, according to the Code, inde-
pendent in relation to the company and the
company management.
This corporate governance report has not
been reviewed by the company’s auditors.
Nor have the company’s auditors reviewed the
Board’s report concerning the organization
of internal control with regard to financial
reporting.
Election Committee
The Election Committee is the shareholders’
body responsible for submitting to the Annual
General Meeting the names of candidates to
serve as Chairman and other members of the
Board, the fees to be paid distributed among
the Chairman, other members of the Board and
any remuneration for work on the Board’s com-
mittees. In the years in which election of aud-
itors for Volvo shall be held, the Election
Committee presents proposals for election of
auditors and audit fees to be paid based on the
preparations carried out by Volvo’s Audit
Committee.
In conjunction with the Election Committee
proposing candidates for Chairman and the
other members of the Board, the Election
Committee shall comment on whether those
persons who are proposed are to be con-
sidered as independent in relation to the com-
pany and company management as well as to
large shareholders in the company. The Election
Committee’s proposal shall be presented to
Volvo in sufficient time to be able to be included
in the notice of the Annual General Meeting
and at the same time on Volvo’s web site.
The Election Committee, which was ap point-
ed at Volvo’s Annual General Meeting in 2006,
comprised Volvo’s Chairman Finn Johnsson,
Eva Halvarsson, representing the Second Swe d-
ish National Pension Fund, Björn Lind, repre-
senting SEB Funds, Curt Källströmer, repre-
Corporate Governance
During 2006, the Board
focused specifi cally on
issues pertaining to the
Volvo Group’s strategy with
regard to Asia. The Board
has also decided to renew
the fi nancial targets for the
Volvo Group.
The Board at a visit to the Volvo Truck plant in Gent.
78 Corporate Governance 2006

The Board’s composition and atten-dance at meetings January 1, 2006 to December 31, 2006. Remu- Audit neration Board Committee Committee
Finn Johnsson 8 4 Per-Olof Eriksson 8 4 Tom Hedelius 8 4Leif Johansson 8 Louis Schweitzer 7 4Philippe Klein1 5 Ying Yeh1 4 3 Peter Bijur1 4 3 Ken Whipple2 3 1 Haruko Fukuda2 2 1 Patrick Faure2 1 Olle Ludvigsson, employee representative 8 Johnny Rönnkvist, employee representative 8 Martin Linder, employee representative 7 Total number of meetings 8 4 4
1 Elected to the Board at the 2006 Annual General Meeting.
2 Resigned from the Board in conjunction with the 2006 Annual General Meeting.
senting Svenska Handelsbanken and Thierry
Moulonguet, representing Renault SA. The
Election Committee internally selected Curt
Källströmer as Chairman. The work of the
Election Committee is governed by the in-
structions approved by the Volvo Annual
General Meeting in 2006. In November, 2006
Lars Förberg representing Violet Partners LP,
became member instead of Eva Halvarsson.
Violet Partners LP replaced the Second
Swedish National Pension Fund as the fourth
largest shareholder, by votes, in Volvo. Eva
Halvarsson was at the same time co-opted
onto the Election Committee.
The Election Committee’s proposal for the
2007 Annual General Meeting will be provided
on Volvo’s website.
The Board
In 2006, AB Volvo’s Board of Directors con-
sisted of eight members elected by the Annual
General Meeting. In addition, the Board had
three members and two deputy members
appointed by employee organizations. The CEO,
Leif Johansson, was a member of the Board.
During 2006, six regular meetings and two
extraordinary meetings were held.
The Board has adopted work procedures for
its activities that contain rules pertaining to the
distribution of work between the Board mem-
bers, the number of Board meetings, matters to
be handled at regular meetings of the Board
and duties incumbent on the Chairman. In add-
ition thereto, the work procedures contain
directives concerning the tasks of the Audit
Committee and the Remuneration Committee
respectively. The Board has also issued written
instructions specifying when and how informa-
tion required to evaluate the company’s and
Group’s financial position should be reported to
the Board as well as the distribution of duties
between the Board and the President and in
what circumstances the Executive Vice Presi-
dent and Deputy CEO is to substitute for the
CEO.
The Annual General Meeting decides on the
fees to be paid to the Board members elected
by the shareholders. The Annual General
Meeting held on April 5, 2006 approved a total
fee to the Board, for the time until the end of the
next Annual General Meeting, of SEK
4,775,000 to be distributed among the Board
Members according to the following. The
Chairman of the Board receives a fee of SEK
1,350,000 and the remaining members a total
of SEK 2,700,000 to be distributed among the
members as the Board decides. In addition, the
Chairman of Audit Committee shall receive
SEK 250,000 and the other two members of
the Audit Committee SEK 125,000 each and
the members of the Remuneration Committee
SEK 75,000 each.
During the year, the Board reviewed the
business plans and strategies for the various
businesses in the Volvo Group. In addition
thereto, the Board reviewed the financial pos-
itions of AB Volvo and the Volvo Group on a
regular basis and acted in order to ascertain
that there are efficient systems in order to fol-
low-up and control the business and financial
position of the Volvo Group. In connection
therewith, the Audit Committee is responsible
for preparing for the Board’s work through
quality assurance of the company’s financial
reporting through reviewing the interim reports
and the annual report. The Board has met with
the company’s auditors during 2006. The
Board has continuously evaluated the perform-
ance of the CEO.
During 2006, the Board focused specifically
on issues pertaining to the Volvo Group’s strat-
egy with regard to Asia and thereby decided to
acquire shares in Nissan Diesel Motor Co Ltd
and on initiating discussions on the commercial
operation Dongfeng Motor Co Ltd. During the
year, the Board also discussed and decided to
renew the financial goals for the Volvo Group.
In addition, the Board also dealt regularly with
matters involving other divestments, acquisi-
tions and the establishment of new operations,
and matters related to investments in product
renewal and product development in the
Group’s business areas.
The Board’s work is mainly performed
through Board meetings and through meetings
in the respective committees of the Board. In
addition thereto, the chairman of the Board is in
regular contact with the CEO in order to dis-
cuss on-going business and to ensure that the
decisions taken by the Board are executed. An
account of each Board member’s age, educa-
tion, main professional experience, other board
memberships, ownership of shares in Volvo and
the years of membership on the Volvo Board is
presented on pages 84 and 85.
During 2006, the Board performed its yearly
evaluation of the Board’s work. The Chairman
has informed the Election Committee on the
result of the evaluation.
Independence requirements
The Board of Directors of Volvo must meet
independence requirements pursuant to the
rules of the Stockholm Stock Exchange, the
Code and NASDAQ’s regulations, as well as
the Sarbanes-Oxley Act (SOX). Below follows a
short description of the rules of the Stockholm
Stock Exchange and the Code. The independ-
ence requirements mainly mean that only one
person from the company’s management may
be a member of the Board, that a majority of the
Board shall be independent of the company
and the company management and that at
least two of the members that are independent
from the company and the company’s manage-
ment shall also be independent of the com-
pany’s major shareholders. In addition, the
Corporate Governance 2006 79

Code demands that a majority of the members
in the Audit Committee shall be independent of
the company and that at least one member
shall be independent of the company’s major
shareholders. With regard to the Remuneration
Committee, the Code sets the requirement that
members of the Remuneration Committee,
with the exception of the Board chairman if a
member of the Remuneration Committee, shall
be independent of the company and company
management.
Considering the above demands regarding
the Board’s independence, the Election
Committee has reported to the company the
following understanding about the independ-
ence from the company and the company man-
agement as well as the company’s largest
shareholders with regard to the Board mem-
bers who were elected at the Annual General
Meeting in 2006:
Finn Johnsson, Peter Bijur, Philippe Klein,
Louis Schweitzer and Ying Yeh are all independ-
ent from the company and company manage-
ment.
Leif Johansson, as Volvo’s CEO, is not inde-
pendent of the company and company man-
agement.
Tom Hedelius and Per-Olof Eriksson have
been members of the Board of Volvo since
January 19, 1994. Accordingly, they have been
members for more than 12 years and conse-
quently, in accordance with the Code, are not to
be considered independent of the company
and company management.
Philippe Klein and Louis Schweitzer are
employee and Chairman of the Board respect-
ively of Renault SA and represent Renault SA
on the company’s Board of Directors. Since
Renault SA controls more than 10% of the
shares and votes in Volvo, these persons may
not, pursuant to the Code, be considered as
independent in relation to one of the company’s
major shareholders.
Audit Committee
In December 2002, the Board established an
Audit Committee primarily for the purpose of
overseeing the accounting and financial report-
ing processes and the audit of the financial
statements. The Audit Committee is responsi-
ble for preparing the Board’s work through
quality assurance of the company’s financial
reporting through reviewing the interim reports
and the annual report. In addition, the Audit
Committee’s task is to establish guidelines
specifying what other services than audit the
company may procure from the company’s
auditors and to provide guidelines for and deci-
sions on transactions with companies and per-
sons closely associated with Volvo. The Audit
Committee is also responsible for evaluating
the internal and external auditors’ work as well
as to provide the Election Committee with the
results of the evaluation and to assist in prepar-
ing proposals for auditors.
Up to the 2006 Annual General Meeting, the
Audit Committee comprised Board members
Haruko Fakuda, Ken Whipple and Per-Olof
Eriksson, Chairman. After the Annual General
Meeting in 2006, the Audit Committee com-
prised Board members Peter Bijur, Ying Yeh
and Per-Olof Eriksson, Chairman. During 2006
the Audit Committee held three regular meet-
ings and one extraordinary meeting.
The Audit Committee met with the external
auditors and Head of Internal Audit at the ordin-
ary meetings. The Audit Committee has also
met with the external auditors without the pres-
ence of the company management.
Remuneration Committee
In April 2003, the Board established a
Remuneration Committee primarily for the pur-
pose of preparing and deciding on issues relat-
ing to remuneration to senior executives in the
Group. The duties of the Committee include
presenting recommendations for resolution by
the Board regarding terms of employment and
remuneration for the President and Executive
Vice President of AB Volvo, principles for remu-
neration, including pensions and severance
payment for other members of the Group
Executive Committee, and principles for vari-
able salary systems, share-based incentive
programs, pensions and severance payment
for other senior executives in the Group. In
addition, the Remuneration Committee decides
the individual terms of employment for the
other members of the Group Executive
Committee in accordance with the principles
established by the Board.
In 2006, the Remuneration Committee com-
prised Board members Tom Hedelius, Louis
Schweitzer and Finn Johnsson, Chairman. The
Remuneration Committee held four meetings
during the year.
Group Executive Committee
An account of their respective age, education,
Board memberships, ownership of shares in
Volvo, and year of joining Volvo for the CEO
and each member of the Group Executive
Committee is presented on pages 82 and 83.
External auditing
Volvo’s auditors are elected by the Annual
General Meeting, for a period of three or four
years. The current auditors were elected at the
2003 Annual General Meeting and the next
election of auditors will be at the 2007 Annual
General Meeting. Volvo’s auditor is Pricewater-
houseCoopers AB (“PwC”). Two PwC partners,
Göran Tidström and Olov Karlsson, are respon-
sible for the audit of Volvo. Göran Tidström is
the Lead Partner.
The Auditors report their findings to the
shareholders through the audit report, which
they present to the Annual General Meeting of
the shareholders. In addition, the auditors
report detailed findings from their review to the
Audit Committee and, once a year, to the full
Board of Directors.
In addition to the audit, PwC also provides
certain services to Volvo. In 2006 such ser-
vices included advice on the company’s
extended procedures for testing and reporting
of internal controls, in accordance with SOX,
Section 404, which is mandatory for the first
time in 2006. PwC also provides tax advice and
other audit-related services to Volvo. When
PwC is retained to provide services other than
the audit, it is done in accordance with rules
decided by the Audit Committee pertaining to
pre-approval of the nature of the services and
the fees. Volvo believes that the provision of the
additional services does not jeopardize PwC’s
independence.
For more detailed information concerning
auditor’s fees see Note 35 of the notes to the
consolidated financial statements.
80 Corporate Governance 2006

The organization of the internal
control over financial reporting
Volvo has had internal control processes for a
long time.
Volvo applies internal control principles
introduced by the Committee of Sponsoring
Organizations of the Treadway Commission
(COSO). The COSO principles consists of five
interrelated components where a number of
objectives have to be met in each component.
The components are: control environment, risk
assessment, control activities, information and
communication and monitoring.
Volvo has an internal audit function of which
the main responsibility is to ensure adherence
to the internal control system that the company
applies. The Head of Internal Audit reports
directly to the CEO and CFO and has a dotted
reporting line to the Audit Committee of the
Board of Directors.
During 2005 and 2006, Volvo continued its
efforts that were initiated in 2004 in terms of
reviewing and documenting relevant processes
for the purpose of ensuring that the internal
control of the financial reporting functioned
satisfactorily and was well documented. In
2006, the work was finalized and the relevant
processes were tested.
Since AB Volvo’s Series B shares are regis-
tered with the Securities & Exchange Commis-
sion (SEC) in the US, Volvo must comply with
Sarbanes-Oxley Act (SOX). SOX section 404
requires that Volvo submit a report from Volvo’s
CEO and CFO regarding Volvo’s internal con-
trol over the financial reporting, in conjunction
with the presentation of the US Annual Report,
Form 20F, for 2006. The report, which is part of
the Form 20F, will include a statement regard-
ing the outcome of the company’s evaluation of
the effectiveness of the internal control over
the financial reporting for the 2006 year-end.
The report will also include a statement from
the CEO and CFO on whether the internal con-
trol over the financial reporting is effective or
not, and a statement on which internal control
system that was used to evaluate the effective-
ness. If any material weaknesses in the internal
control of the financial reporting are identified
these will be described in the report. PwC will
submit an auditor’s statement pertaining to the
internal control of the financial reporting.
The intention is to publish the Form 20F in
May 2007.
Disclosure Committee
A Disclosure Committee was established in
2004. The Committee contributes to ensuring
that Volvo fulfills its obligations according to
applicable legislation as well as to listing rules to
timely disclose to the financial market all mater-
ial information that affects the share price.
The Committee comprises the heads of the
departments, Corporate Finance, Internal Audit,
Investor Relations, Corporate Legal, Business
Control and Financial Reporting.
Principles for remuneration and other
employment terms for the Group
Executive Committee
The Annual General Meeting of 2006 decided
upon principles for remuneration and other
employment terms for the members of Volvo’s
Group Executive Committee (“Remuneration
Policy”) in accordance with Section 4.2.2 of the
Code. The proposed principles for remuner-
ation and other employment terms can be sum-
marized as follows.
The guiding principle is that remuneration
and other employment terms for company man-
agement shall be competitive to ensure that
Volvo can attract and retain skilled persons in
the Group Executive Committee. The fixed sal-
ary may be competitive and reflect the individu-
al’s area of responsibility and performance. In
addition to the fixed salary a variable salary may
be paid. A variable salary may amount to a max-
imum of 50% of the fixed annual salary and be
based on the Volvo Group’s and/or the execu-
tive’s Group company’s fulfillment of certain
improvement goals. The improvement goals are
decided by the Board of AB Volvo and may be
related, for example, to operating income or cash
flow. In addition to fixed and variable salary, nor-
mally other customary benefits, such as com-
pany car and company healthcare are provided.
In individual cases, housing and other benefits
are provided. In addition to pension benefits
provided by law and collective bargaining agree-
ments, the members of the Group Executive
Committee domiciled in Sweden are offered a
defined-contribution pension whereby the
amount of the individual’s pension comprises
the premium paid and any return. In individual
cases, other pension solutions may be con-
sidered. Members of the Group Executive
Committee domiciled outside Sweden are
offered pension solutions that are competitive
in the country in which the person is domiciled.
With regard to notice of termination of employ-
ment for members of the Group Executive
Committee domiciled in Sweden, the notifica-
tion period is 12 months if the company termin-
ates the employment and six months if the
individual terminates employment. In addition,
the employee is entitled to a severance pay of 12
months’ salary if Volvo terminates employment.
In individual cases, other principles for notifica-
tion periods and severance pay may be con-
sidered. Those members who are domiciled
outside Sweden are offered terms in this
respect that are competitive in the country in
which the person is domiciled.
A more detailed account of remuneration to
the President and principles for the remuner-
ation to other senior executives is presented in
Note 34 to the consolidated financial state-
ments.
At the 2007 Annual General Meeting, the
Board has decided to propose renewed guide-
lines for remunerations to executives. The pro-
posal will be available on Volvo’s website.
Outstanding share- and share-price-
related incentive programs
An account of outstanding share- and share-
price related incentive program is provided in
Note 34 to the consolidated financial state-
ments.
The Board at a visit to Volvo Construction Equipment in Shanghai.
Corporate Governance 2006 81

Group Management
Leif JohanssonPresident and CEOBorn 1951. Master of Engineering. President of AB Volvo and Chief Executive Officer of the Volvo Group since 1997. With Volvo since 1997. Board member: Bristol-Myers Squibb Company, Svenska Cellulosa Aktiebolaget SCA, Confederation of Swedish Enterprise and The Association of Swedish Engineering Industries. Member of the Royal Swedish Academy of Engineering Sciences. Member of Volvo Board since 1997. Holdings in Volvo, own and related parties: 50,562 Volvo shares, includ-ing 43,538 Series B shares and 50,000 employee stock options.
Staffan JuforsPresident of Volvo Truck CorporationBorn 1951. Master of Business Administration. President of Volvo Truck Corporation since 2004. President of AB Volvo Penta 1998–2004. Member of Group Executive Committee since 1998. With Volvo since 1975. Board member: EBP AB. Holdings in Volvo: 4,208 shares, including 3,054 Series B shares.
Salvatore L MauroPresident of Volvo Financial ServicesBorn 1960. Bachelor of Science in Accounting. President of Volvo Financial Services since 2001. President of Volvo Car Finance Europe 1999–2001. Member of Group Executive Committee since 2001. With Volvo since 1985.Holdings in Volvo: 1,003 American Depositary Receipts (ADRs).
Jorma HalonenExecutive Vice President and Deputy CEOBorn 1948. Bachelor of Science in Economics. Executive Vice President of AB Volvo and Deputy CEO of the Volvo Group since 2004. President of Volvo Truck Corporation 2001–2004. Prior to that various positions at Scania 1990–2001. Member of Group Executive Committee since 2002. With Volvo since 2001. Vice Chairman: Nissan Diesel. Holdings in Volvo: 4,000 Series B shares and 25,000 employee stock options.
Tony HelshamPresident of Volvo Construction EquipmentBorn 1954. Bachelor of Engineering. President of Volvo Construction Equipment since 2000. President and CEO of Euclid Hitachi Heavy Equipment 1995–1998. President of Volvo Construction Equipment Korea 1998–2000. Member of Group Executive Committee since 2000. With Volvo since 1985. Holdings in Volvo: None.
Olof PerssonPresident of Volvo Aero CorporationBorn 1964. Bachelor of Business Administration. President of Volvo Aero Corporation since 2006. Member of Group Executive Committee since July 1 2006. With Volvo since 2006. Board member: Bombardier Transportation Sweden AB. Holdings in Volvo: None.
Håkan KarlssonPresident of Volvo Bus CorporationBorn 1961. Master of Engineering. President of Volvo Bus Corporation and Member of Group Executive Committee since 2003. President of Volvo Logistics 2000–2003. With Volvo since 1986. Holdings in Volvo: 4,442 shares, including 4,175 Series B shares.
Göran GummesonPresident of Volvo PentaBorn 1947. President of Volvo Penta since November 1, 2004. Has held various positions at Volvo Penta since 1991, head of Volvo Penta’s European operations 1998–2004. Member of Group Executive Committee since 2004. With Volvo since 1991. Holdings in Volvo: 6,439 Series B shares.
Paul ViknerPresident of Mack Trucks, Inc.Born 1949. Bachelor of Arts. President of Mack Trucks, Inc. since 2001. Executive Vice President of Sales and Marketing, Mack Trucks, Inc. 1996–2001. Previously at Iveco Trucks North America and Isuzu Trucks North America 1972–1994. Member of Group Executive Committee since 2004. With Volvo since 2001. Holdings in Volvo: 2,000 Series B shares.
Stefano ChmielewskiPresident of Renault TrucksBorn 1952. MA Master of Science Electronics/Automation. President of Renault Trucks since 2003. Member of Volvo Group Executive Committee since 2003. With Volvo since 2001. Holdings in Volvo: None.
82 Corporate Governance 2006

Per LöjdquistSenior Vice PresidentBorn 1949. Senior Vice President of AB Volvo. Member of Group Executive Committee since 1997, responsible for Corporate Communica-tions and Public Affairs. With Volvo since 1973. Board member: West Sweden Chamber of Commerce and Industry and Nilörngruppen AB. Holdings in Volvo: 8,463 shares, including 5,289 Series B shares.
Fred BodinSenior Vice PresidentBorn 1947. Bachelor of Laws. President of Volvo Aero Corporation 1997–2006. General Counsel of Volvo Group 1988–1997. Member of Group Executive Committee since 1993. With Volvo since 1981. Holdings in Volvo: None.
Stefan JohnssonSenior Vice PresidentBorn 1959. Master of Business Administration. Senior Vice President of AB Volvo responsible for business units and human resources. Member of Group Executive Committee since 1998. Senior Vice President of AB Volvo and CFO for the Volvo Group, 1998–2005. President of Volvo Group Finance Sweden 1994–1998. With Volvo since 1987. Board member: Stiftelsen Chalmers Tekniska Högskola. Holdings in Volvo: 4,075 shares including 4,000 Series B shares.
Lars-Göran MobergPresident of Volvo PowertrainBorn 1943. Master of Engineering. President of Volvo Powertrain since 2001. Member of Group Executive Committee since 2001. With Volvo since 1995. Holdings in Volvo: 9,858 shares including 9,652 Series B shares and 25,000 employee stock options.
Eva PerssonSenior Vice PresidentBorn 1953. Master of Laws. Senior Vice President of AB Volvo and General Counsel of the Volvo Group. Member of Group Executive Committee since 1997, responsible for legal, tax and security matters. With Volvo since 1988. Secretary to the Board of Volvo since 1997. Board member: Handelsbanken Region Väst, Second Swedish National Pension Fund. Member of the Swedish Industry and Commerce Stock Exchange Committee. Holdings in Volvo: 500 shares, including 248 Series B shares.
Pär ÖstbergSenior Vice PresidentBorn 1962. Master of Business Administration. Senior Vice President of AB Volvo and CFO of the Volvo Group since 2005. Member of the Group Executive Committee since 2005, responsible for finance, strategy and business development. Pär Östberg has held various senior positions in the financial areas in the Volvo Group since 1990, most recently as Senior Vice President and CFO of Renault Trucks. Holdings in Volvo: 1,000 Series B shares.
Changes in Group Executive Committee Michel Gigou, member of the Group Executive Committee since 2002, retired on April 30, 2006. Within the Group Executive Committee, Michel Gigou’s responsibilities included Volvo’s operations in China, a responsibility that was assumed by Jorma Halonen.
During 2006, Volvo’s Group Executive Committee was expanded through the addition of Jan-Eric Sundgren, former President of Chalmers
University of Technology. Jan-Eric Sundgren’s responsibilities include contacts with public author-ities, universities and colleges. He also focuses on technological and research-related matters within the Volvo Group and has Group-wide responsibility for environmental and safety issues.
Olof Persson became President of Volvo Aero on July 1, 2006. As from this date he is also a mem-ber of the Volvo Group Executive Committee. He
succeeded Fred Bodin, who retired on February 20, 2007. Before he took on his position within the Volvo Group, Olof Persson was President of the Canadian aircraft and train manufacturer Bombardier’s Mainline and Metro division for trains and subways.
Jan-Eric SundgrenSenior Vice PresidentBorn 1951. Master of Engineering, PhD in solid state Physics, Professor in materials science. Member of Group Executive Committee since August 1 2006, responsible for Public & Environmental Affairs. With Volvo since 2006.Board member: Lindholmen Science Park AB, Meritea AB. Member of the Royal Swedish Academy of Engineering Sciences. Holdings in Volvo: None.
Corporate Governance 2006 83

Board of Directors and Auditors
Tom HedeliusMember of the Remuneration CommitteeBorn 1939, Master of Business Administration, Hon. Dr. of Economics. Board Chairman: AB Industrivärden, Bergman & Beving AB and Anders Sandrews Stiftelse. Honorary Chairman: Svenska Handelsbanken. Vice Chairman: Addtech AB and Lagercrantz Group AB and Jan Wallanders och Tom Hedelius stiftelse. Board member: Svenska Cellulosa Aktiebolaget SCA and Lundbergs AB. Member of Volvo Board since 1994. Holdings in Volvo, own and related par-ties: 2,693 shares, including 693 Series B shares.
Principal work experience: AB Industrikredit; numerous positions with Svenska Handelsbanken (Credit Director, Executive Vice President, President and CEO, Chairman).
Ying Yeh Member of the Audit Committee Born 1948, BA, Literature & International Relations. President and Chairman of Kodak North Asia Region. Member of the Volvo Board since 2006. Holdings in Volvo: None.
Principal work experience: Journalist NBC, New York. Numerous positions with the U S Government Foreign Service in Burma, Hong Kong, Taiwan and Beijing. Various positions with Eastman Kodak in China.
Finn JohnssonChairman of the Board,Chairman of the Remuneration CommitteeBorn 1946, Master of Business Administration. Board Chairman: Luvata Oy, Thomas Concrete Group AB, Unomedical A/S, KappAhl AB and City Airline. Board member: Skanska AB and AB Industrivärden. Member of Volvo Board since 1998. Chairman since February 2004. Holdings in Volvo: 4,000 shares including 2,000 Series B shares.
Principal work experience: Machine Division at Swedish Match; President Arenco Machine Co., USA; President Swedish Match Europe and Swedish Match Asia; President Tarkett AB; Executive Vice President Stora AB; President Industri AB Euroc; President United Destillers, UK; CEO of Mölnlycke Health Care AB.
Leif JohanssonBorn 1951, Master of Engineering. President of AB Volvo and Chief Executive Officer of the Volvo Group since 1997. Member of Volvo Board since 1997. Board member: Bristol-Myers Squibb Company, Svenska Cellulosa Aktiebolaget SCA, Confederation of Swedish Enterprise and The Association of Swedish Engineering Industries. Member of the Royal Swedish Academy of Engineering Sciences.Holdings in Volvo, own and related parties: 50,562 shares, including 43,538 Series B shares and 50,000 employee stock options.
Principal work experience: Project consultant Indevo; Assistant to President Centro Maskin Morgårdshammar; President Husqvarna Motorcyklar; Division Manager Office Machines Facit Sweden; President Facit; Division Manager AB Electrolux Major Appliances; Division President AB Electrolux Major Appliances; Executive Vice President AB Electrolux; President AB Electrolux; CEO Electrolux Group.
Philippe KleinBorn 1957. Senior Vice President, CEO’s Office Renault S A and member of the Renault Management Committee. Member of the Volvo Board since 2006. Holdings in Volvo: None.
Principal work experience: Various positions within Renault (Engineer; Senior Manager, Engine Development and Tuning; Director, Process Quality Department in Vehicle Engineering; Vice President, Industrial System Performance Department); Vice President, CEO’s Office at Nissan.
Peter BijurMember of the Audit CommitteeBorn 1942, MBA Marketing, BA Political Science.Board member: Gulfmark Offshore Inc. Member of the Volvo Board since 2006. Holdings in Volvo: None.
Principal work experience: Numerous positions with Texaco Inc, retired as Chairman and Chief Executive Officer in 2001.
Board members elected by the Annual General Meeting
Per-Olof ErikssonChairman of the Audit CommitteeBorn 1938, Master of Engineering, Hon. Dr. of Technology. Board Chairman: Callans Trä AB, Odlander, Fredriksson & Co and Cross Country Systems AB. Board member: Assa Abloy AB, Elkem AS, Investment AB Öresund, KTH Holding AB, Senea AB and Södersjukhuset AB. Member of the Royal Swedish Academy of Engineering Sciences. Member of Volvo Board since 1994. Holdings in Volvo, own and related parties: 6,200 Series A shares.
Principal work experience: Engineer Uddeholms AB; numerous positions with Sandvik Group (in Sweden, Germany and the UK), President and CEO Seco Tools AB; President and CEO Sandvik AB.
Louis SchweitzerMember of the Remuneration CommitteeBorn 1942. Bachelor of Laws. Board Chairman: Renault, AstraZeneca Plc. Board member: Electricité de France, BNP-Paribas, Véolia and L Oréal. Member of Volvo Board since 2001. Holdings in Volvo: 2,000 Series B shares. Principal work experience: Official at French Budget Department; Chief of Staff of Mr Laurent Fabius (Minister of Budget, then Minister for Industry and Research, and Prime Minister), Chairman, French Commission for Equality (since 2005); numerous pos-itions with Renault SA (Chief Financial Officer and Executive Vice President Finance and Planning, President and Chief Operating Officer, Chairman and Chief Executive Officer).
84 Corporate Governance 2006

Olle LudvigssonBorn 1948. Employee representative. With Volvo since 1968. Deputy member of Volvo Board 1983–1988; member since 1988. Holdings in Volvo: 155 shares, including 105 Series B shares.
Berth ThulinBorn 1951. Employee representative. With Volvo since 1975. Deputy member of Volvo Board since 1999.Holdings in Volvo: 100 Series B shares.
Johnny RönnkvistBorn 1947. Employee representative. With Volvo since 1965. Member of Volvo Board since 1999. Holdings in Volvo: 285 shares, including 50 Series B shares.
Martin LinderBorn 1973. Employee representative. With Volvo since 1994. Member of Volvo Board since 2004. Holdings in Volvo: None.
AuditorsPricewaterhouseCoopers AB
Göran TidströmAuthorized Public Accountant. Lead Partner.
Auditor since 2006.
Other assignments: Auditor of Securitas, Telia Sonera och Trelleborg. Chairman of the Board of EFRAG (European Financial Reporting Group) and Board member of IFAC (International Federation of Accountants).
Born 1946.
Margareta ÖhlinBorn 1947. Employee representative. With Volvo since 1983. Deputy member of Volvo Board since 2005. Holdings in Volvo: None.
Secretary to the BoardEva PerssonBorn 1953, Master of Laws. Senior Vice President of AB Volvo and General Counsel of the Volvo Group. Secretary to the Volvo Board since 1997. Holdings in Volvo: 500 shares, including 248 Series B shares.
Board members and deputies appointed by employee organisations
Olov KarlssonAuthorized Public Accountant. Partner.
Auditor since 1998.
Other assignments: Auditor of Pergo AB and Trelleborg AB.
Born 1949.
Corporate Governance 2006 85

The Volvo Group
Financial information 2006
87 Consolidated income statements
88 Consolidated balance sheets
89 Changes in consolidated Shareholders’ equity
90 Consolidated cash-flow statements
91 Notes to consolidated financial statements
138 Parent Company AB Volvo
149 AB Volvo’s holding of shares
152 Proposed disposition of unappropriated earnings
153 Audit report for AB Volvo
154 Eleven-year summary
p. Note The Volvo Group 91 1 Accounting principles
96 2 Key sources of estimation uncertainty
97 3 Transition to IFRS
104 4 Acquisition and divestments of shares in subsidiaries
105 5 Joint ventures
106 6 Associated companies
106 7 Segment reporting
108 8 Other operating income and expenses
109 9 Income from investments in associated companies
109 10 Income from other investments
109 11 Other fi nancial income and expenses
110 12 Income taxes
111 13 Minority interests
111 14 Intangible and tangible assets
114 15 Shares and participations115 16 Long-term customer-fi nancing receivables
116 17 Other long-term receivables
116 18 Inventories116 19 Short-term customer-fi nancing receivables
116 20 Other short-term receivables
117 21 Marketable securities
117 22 Cash and cash equivalents
117 23 Shareholders’ equity
119 24 Provisions for post-employment benefi ts
123 25 Other provisions
123 26 Non-current liabilities
124 27 Current liabilities
125 28 Assets pledged
125 29 Contingent liabilities
126 30 Cash fl ow
126 31 Leasing
127 32 Transactions with related parties
127 33 Government grants
127 34 Personnel
131 35 Fees to the auditors
131 36 Goals and policies in fi nancial risk management
133 37 Financial instruments
p. Note Parent Company142 1 Accounting principles
142 2 Administrative expenses
143 3 Other operating income and expenses
143 4 Income from investments in Group companies
143 5 Income from investments in associated companies
143 6 Income from other investments
143 7 Interest income and expenses
143 8 Other fi nancial income and expenses
143 9 Allocations
144 10 Income taxes
144 11 Intangible and tangible assets
145 12 Investments in shares and participations
146 13 Other short-term receivables
146 14 Short-term investments in Group companies
146 15 Untaxed reserves146 16 Provisions for pensions
147 17 Non-current liabilities
147 18 Other current liabilities
147 19 Contingent liabilities
147 20 Cash fl ow
148 21 Financial risks and instruments
148 22 Personnel
86 Financial information 2006

Consolidated income statements
SEK M 2004 2005 2006
Net sales Note 7 211,076 240,559 258,835Cost of sales (164,170) (186,662) (199,054)Gross income 46,906 53,897 59,781
Research and development expenses Note 7 (7,614) (7,557) (8,354)Selling expenses (19,369) (20,778) (21,213)Administrative expenses (5,483) (6,301) (6,551)Other operating income and expenses Note 8 (618) (588) (3,466)Income from investments in associated companies Note 7, 9 27 (557) 61Income from other investments Note 10 830 37 141Operating income Note 7 14,679 18,153 20,399
Interest income and similar credits 821 654 666Interest expenses and similar charges (1,254) (972) (585)Other fi nancial income and expenses Note 11 (1,210) 181 (181)Income after fi nancial items 13,036 18,016 20,299
Income taxes Note 12 (3,129) (4,908) (3,981)Income for the period 9,907 13,108 16,318
Attributable to:Equity holders of the parent company 9,867 13,054 16,268Minority interests Note 13 40 54 50 9,907 13,108 16,318
Basic earnings per share, SEK Note 23 23.58 32.22 40.20Diluted earnings per share, SEK Note 23 23.55 32.16 40.17
Financial information 2006 87

88 Financial information 2006
The Volvo Group
Consolidated balance sheets
SEK M December 31, 2004 December 31, 2005 December 31, 2006
Assets Non-current assetsIntangible assets Note 14 17,612 20,421 19,117Tangible assets Note 14 Property, plant and equipment 29,764 33,997 33,269 Investment property 1,387 1,071 1,110 Assets under operating leases 19,534 50,685 20,839 55,907 20,501 54,880 Financial assets Associated companies Note 15 913 195 5,794 Other shares and participations Note 15 1,090 556 1,096 Long-term customer-fi nancing receivables Note 16 25,187 31,184 32,089 Deferred tax assets Note 12 5,078 5,332 6,663 Other long-term receivables Note 17 2,763 35,031 3,127 40,394 4,400 50,042Total non-current assets 103,328 116,722 124,039
Current assets Inventories Note 18 28,598 33,937 34,211Short-term receivables Customer-fi nancing receivables Note 19 26,006 33,282 32,653 Current tax assets 1,426 855 1,221 Other receivables Note 20 29,864 57,296 35,464 69,601 34,399 68,273 Non-current assets held for sale Note 4 – – 805Marketable securities Note 21 25,955 28,834 20,342Cash and cash equivalents Note 22 8,791 8,113 10,757Total current assets 120,640 140,485 134,388Total assets 223,968 257,207 258,427
Shareholders’ equity and liabilitiesShareholders’ equity Note 23 Share capital 2,649 2,554 2,554 Additional contributed capital – – – Reserves (71) 2,924 1,664 Retained earnings 57,481 59,968 66,418 Income for the period 9,867 13,054 16,268 Equity attributable to the equity holders of the parent company 69,926 78,500 86,904 Minority interests 229 260 284 Total shareholders’ equity 70,155 78,760 87,188
Non-current provisions Provisions for post-employment benefi ts Note 24 14,703 11,986 8,692 Provisions for deferred taxes Note 12 515 2,265 4,422 Other non-current provisions Note 25 7,296 22,514 7,012 21,263 6,750 19,864 Non-current liabilities Note 26 Bond loans 27,612 27,570 23,179 Other loans 12,799 15,985 15,530 Other long-term liabilities 4,653 45,064 5,339 48,894 6,748 45,457 Current provisions Note 25 7,182 9,279 9,799
Current liabilities Note 27 Loans 21,396 31,330 28,247 Liabilities associated with assets held for sale Note 4 – – 280 Trade payables 30,813 35,693 38,080 Current tax liabilities 1,753 1,726 1,801 Other current liabilities 25,091 79,053 30,262 99,011 27,711 96,119Total shareholders’ equity and liabilities 223,968 257,207 258,427
Assets pledged Note 28 3,046 3,255 1,960Contingent liabilities Note 29 9,189 7,850 7,726
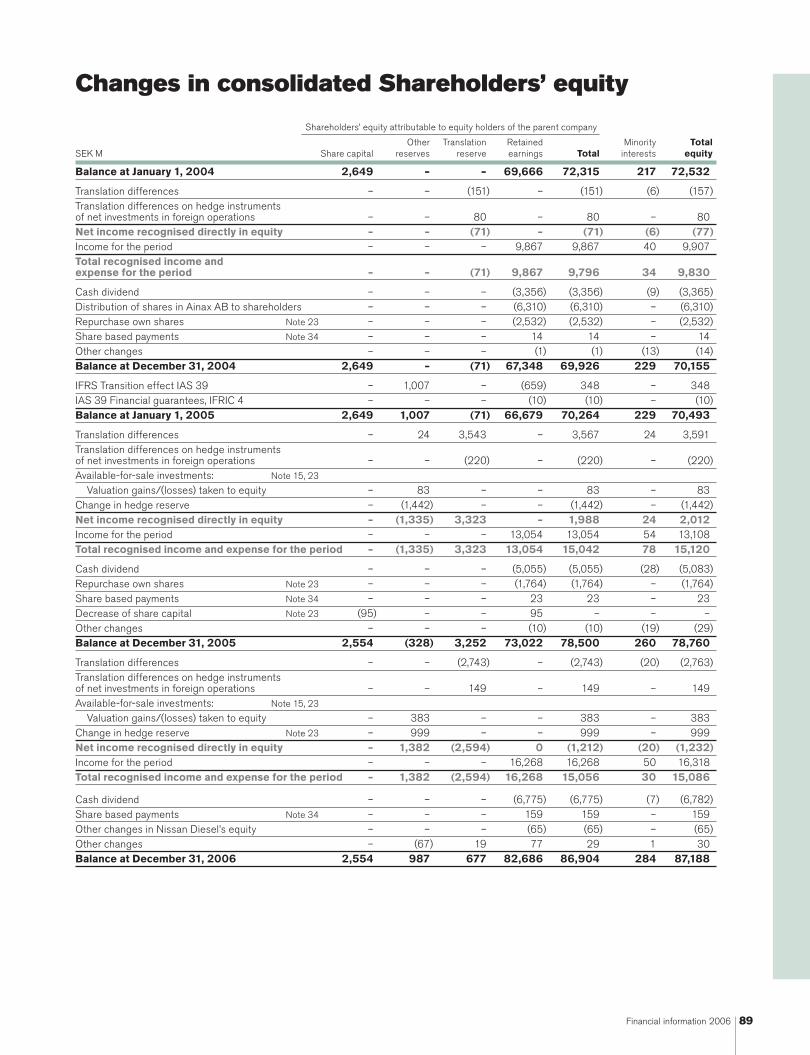
Changes in consolidated Shareholders’ equity
Shareholders’ equity attributable to equity holders of the parent company
Other Translation Retained Minority TotalSEK M Share capital reserves reserve earnings Total interests equity
Balance at January 1, 2004 2,649 – – 69,666 72,315 217 72,532
Translation differences – – (151) – (151) (6) (157)Translation differences on hedge instruments of net investments in foreign operations – – 80 – 80 – 80Net income recognised directly in equity – – (71) – (71) (6) (77)Income for the period – – – 9,867 9,867 40 9,907Total recognised income and expense for the period – – (71) 9,867 9,796 34 9,830
Cash dividend – – – (3,356) (3,356) (9) (3,365)Distribution of shares in Ainax AB to shareholders – – – (6,310) (6,310) – (6,310)Repurchase own shares Note 23 – – – (2,532) (2,532) – (2,532)Share based payments Note 34 – – – 14 14 – 14Other changes – – – (1) (1) (13) (14)Balance at December 31, 2004 2,649 – (71) 67,348 69,926 229 70,155
IFRS Transition effect IAS 39 – 1,007 – (659) 348 – 348IAS 39 Financial guarantees, IFRIC 4 – – – (10) (10) – (10)Balance at January 1, 2005 2,649 1,007 (71) 66,679 70,264 229 70,493
Translation differences – 24 3,543 – 3,567 24 3,591Translation differences on hedge instruments of net investments in foreign operations – – (220) – (220) – (220)Available-for-sale investments: Note 15, 23 Valuation gains/(losses) taken to equity – 83 – – 83 – 83Change in hedge reserve – (1,442) – – (1,442) – (1,442)Net income recognised directly in equity – (1,335) 3,323 – 1,988 24 2,012Income for the period – – – 13,054 13,054 54 13,108Total recognised income and expense for the period – (1,335) 3,323 13,054 15,042 78 15,120
Cash dividend – – – (5,055) (5,055) (28) (5,083)Repurchase own shares Note 23 – – – (1,764) (1,764) – (1,764)Share based payments Note 34 – – – 23 23 – 23Decrease of share capital Note 23 (95) – – 95 – – –Other changes – – – (10) (10) (19) (29)Balance at December 31, 2005 2,554 (328) 3,252 73,022 78,500 260 78,760
Translation differences – – (2,743) – (2,743) (20) (2,763)Translation differences on hedge instruments of net investments in foreign operations – – 149 – 149 – 149Available-for-sale investments: Note 15, 23 Valuation gains/(losses) taken to equity – 383 – – 383 – 383Change in hedge reserve Note 23 – 999 – – 999 – 999Net income recognised directly in equity – 1,382 (2,594) 0 (1,212) (20) (1,232)Income for the period – – – 16,268 16,268 50 16,318Total recognised income and expense for the period – 1,382 (2,594) 16,268 15,056 30 15,086
Cash dividend – – – (6,775) (6,775) (7) (6,782)Share based payments Note 34 – – – 159 159 – 159Other changes in Nissan Diesel’s equity – – – (65) (65) – (65)Other changes – (67) 19 77 29 1 30Balance at December 31, 2006 2,554 987 677 82,686 86,904 284 87,188
Financial information 2006 89

90 Financial information 2006
The Volvo Group
The effects of major acquisitions and divestments of subsidiaries in each year have been excluded from other changes for the balance sheet items in the cash-fl ow statement. The effects of currency
movements in translation of foreign Group companies have also been excluded since these effects do not affect cash fl ow. Cash and cash equivalents include cash and bank balances.
Consolidated cash-flow statements
SEK M 2004 2005 2006
Operating activities Operating income 14,679 18,153 20,399Depreciation and amortization Note 14 10,003 9,894 12,384Other items not affecting cash Note 30 (30) 413 652Changes in working capital: (Increase)/decrease in receivables (4,017) (1,253) (475) (Increase)/decrease in customer fi nance receivables Note 30 (7,382) (7,773) (5,188) (Increase)/decrease in inventories (2,243) (2,438) (3,111) Increase/(decrease) in liabilities and provisions 4,797 (983) 1,106Interest and similar items received 1,047 2,430 737Interest and similar items paid (335) (2,341) (585)Other fi nancial items (25) (70) (29)Income taxes paid (1,194) (2,023) (4,388)Cash fl ow from operating activities 15,300 14,009 21,502
Investing activities Investments in fi xed assets (7,405) (10,271) (9,969)Investments in leasing assets (4,360) (4,549) (4,611)Disposals of fi xed assets and leasing assets 2,444 2,646 3,240Shares and participations, net Note 30 15,064 336 (5,817)Acquired and divested subsidiaries and other business units, net Note 4, 30 (141) 650 510Interest-bearing receivables including marketable securities (6,413) (811) (1,359) (12,547) 7,650 (8,997)Cash fl ow after net investments 14,489 1,462 12,505
Financing activities Increase/(decrease) in bond loans and other loans Note 30 (8,840) 3,564 (2,609)Cash dividend to AB Volvo shareholders’ (3,356) (5,055) (6,775)Repurchase of own shares (2,532) (1,764) –Dividends to minority shareholders (9) (28) (7)Other 38 (14,699) 15 (3,268) 35 (9,356)Change in cash and cash equivalents, excluding translation differences (210) (1,806) 3,149
Translation difference on cash and cash equivalents (205) 1,128 (505)Change in cash and cash equivalents (415) (678) 2,644
Cash and cash equivalents, January 1 Note 22 9,206 8,791 8,113Cash and cash equivalents, December 31 Note 22 8,791 8,113 10,757

Amounts in SEK M unless otherwise specifi ed. The amounts within parentheses refer to the preceding years, 2005 and 2004.
The consolidated fi nancial statements for AB Volvo and its subsidiar-ies have been prepared in accordance with International Financial Reporting Standards (IFRS) issued by the International Accounting Standards Board (IASB), as adopted by the EU. Those portions of IFRS not adopted by the EU have no material effect on this report. This annual report is prepared in accordance with IAS 1 Presenta-tion of Financial Statements and in accordance with the Swedish Companies Act. In addition, RR30 Supplementary Rules for Groups, was applied, issued by the Swedish Financial Accounting Standards Council.
In the preparation of these fi nancial statements, the company management has made certain estimates and assumptions that affect the value of assets and liabilities as well as contingent liabil-ities at the balance sheet date. Reported amounts for income and expenses in the reporting period are also affected. The actual future outcome of certain transactions may differ from the estimated out-come when these fi nancial statements were issued. Any such differ-ences will affect the fi nancial statements for future fi scal periods.
Changes of accounting principles Effective in 2005 Volvo has applied International Financial Reporting Standards (IFRS) in its fi nancial reporting. In accordance with the IFRS transition rules in IFRS 1, Volvo applies retroactive application from the IFRS transition date at January 1, 2004. The general rule is that restatement of fi nancial reporting for periods after the transition date should be made as if IFRS has been applied historically. All comparison fi gures from 2004, in tables and the notes, have been restated. There are certain exceptions from the general rule of which the most signifi cant for Volvo are:
– IAS 39 Financial instruments: Recognition and measurement which is applicable from January 1, 2005.
– Non-amortization of intangible assets with indefi nite useful lives (e.g. goodwill) in accordance with IFRS 1 should be applied retro-actively only from the transition date January 1, 2004.
The transition from Swedish GAAP to IFRS was made according to a regulation applicable to all listed companies within the European Union as of 2005. Refer to Note 3, Transition to IFRS for a more detailed overview of the transition.
Refer to the 2004 Annual Report for a description of the previous Swedish accounting principles applied by Volvo.
New accounting principles in 2005The following IFRS standards were applied as of 2005, in accord-ance with the respective standards transition rules or in accordance with IFRS 1, IAS 39: Financial Instruments: Recognition and Meas-urement, and IFRS 5, Non-Current Assets Held for Sale and Discon-tinued Operations. Neither of these standards requires retroactive reporting. Accordingly, the comparison year 2004 is not restated with regard to these standards. Volvo decided to early adopt the amended IAS 39 regarding hedging of commercial cash fl ows, relat-ing to intra-group forecasted transactions, from January 1, 2005.
New accounting principles in 2006As of 2006, applies the updated standard IAS 21, Effects of Changes in Foreign Exchange Rates, which does not have any sig-nifi cant effect on Volvo’s fi nancial position. With regard to applica-tion of IFRIC 4, Determining whether an arrangement contains a lease, and the supplement to IAS 39, Financial Instruments: Recog-
nition and Measurement, pertaining to fi nancial guarantee contracts, the comparison year is restated. The effect on Volvo’s shareholders’ equity amounts to a negative SEK 10 M on the opening balance for 2005 and a positive SEK 2 M for the income for the 2005 period. IFRIC 5 Rights to interests arising from Decommissioning, Restor-ation and Environmental Rehabilitation Funds, IFRIC 6 Liabilities arising from participating in a Specifi c Market – Waste Electrical and Electronic Equipment, have not affected Volvo’s fi nancial position signifi cantly. New accounting principles 2007In preparing the consolidated accounts at December 31, 2006, a number of standards and interpretations were published but have as yet not become effective. The following is a preliminary assessment of the effect implementation of these standards and statements could have on the Volvo Group’s fi nancial statements.
IAS 1 supplement – Presentation of Financial statements: Information about capitalThe supplement became effective on January 1, 2007. At this time, it is assessed that this supplement results in increased supplementary information, including defi nition of capital, capital structure and pol-icies for management of capital.
IFRS 7 Financial Instruments: DisclosureThe standard became effective as of January 1, 2007. It is assessed that for the Volvo Group this standard requires further provision of supplementary disclosures in the form of risk analysis linked to the Group’s fi nancial instruments.
IFRS 8 Operating segments*The standard becomes effective on January 1, 2009 and applies for the fi scal years beginning on that date. The standard addresses the distribution of the company’s operations in different segments. In accordance with the standard, the company shall adopt an approach based on the internal reporting structure and determine the report-able segments based on this structure. Volvo does not expect the adoption of IFRS 8 to result in any change in the number of segments.
IFRIC 7 Applying the Restatement Approach under IAS 29 Financial reporting in Hyperinfl ationary EconomiesThe interpretation became effective on March 1, 2006 and applies to fi scal years beginning after March 1, 2006. The Group currently does not have operations in any countries in which the transition to high-infl ation accounting applies.
IFRIC 8 Scope of IFRS 2The interpretation became effective on May 1, 2006 and applies to fi scal years beginning after May 1, 2006. In accordance with IFRS 8, the rules in IFRS 2 apply to goods and services received in exchange for own equity instruments even if these goods or serv-ices, partly or wholly, cannot be identifi ed specifi cally, This statement is not expected to be applicable to the Group since transactions of this type does not occur.
IFRIC 9 Reassessment of Embedded DerivativesThe interpretation became effective on June 1, 2006 and applies to
Notes to consolidated financial statements
Note 1 Accounting principles
*These standards/interpretations have not been adopted by the EU at this time.
Financial information 2006 91

92 Financial information 2006
The Volvo Group
Notes to consolidated financial statements
Exchange rates Average rate Year-end rate Country Currency 2004 2005 2006 2004 2005 2006
Brasil BRL 2.5388 3.0947 3.3927 2.5125 3.4215 3.2190Canada CAD 5.6495 6.1864 6.5096 5.4635 6.8435 5.9235Denmark DKK 1.2285 1.2471 1.2420 1.2126 1.2651 1.2146Euro EUR 9.1408 9.2943 9.2649 9.0163 9.4393 9.0593Great Britain GBP 13.4515 13.5849 13.5822 12.7163 13.7388 13.4938Japan JPY 0.0680 0.0679 0.0635 0.0638 0.0679 0.0579Norway NOK 1.0926 1.1611 1.1516 1.0890 1.1770 1.0955South Korea KRW 0.0065 0.0073 0.0077 0.0064 0.0079 0.0074United States USD 7.3655 7.4791 7.3791 6.6138 7.9538 6.8738
fi scal years beginning after June 1, 2006. The statement is a clarifi -cation of IAS 39 regarding embedded derivatives, mainly with regard to assessment of embedded derivatives as a result of market condi-tions changing.
IFRIC 10 Interim Financial Reporting and ImpairmentThe interpretation became effective on November 1, 2006 and applies to fi scal years beginning after that date. The interpretation concludes that where an entity has recognized an impairment loss in an interim period, that impairment may not be reversed in subse-quent interim fi nancial statements or in annual fi nancial statements. The Group will apply IFRIC 10 as of January 1, 2007, but this is not expected to have any impact on the Group’s fi nancial statements.
IFRIC 11 IFRS 2 Group and Treasury Share TransactionsThe interpretation becomes effective on March 1, 2007 and applies to fi scal years beginning after that date. The interpretation clarifi es treatment regarding classifi cation of share-based payments in which the company repurchases shares to settle its undertaking and reporting of options programs in subsidiaries that apply IFRS. The Group will apply IFRIC 11 as of January 1, 2008, but this is not expected to have any impact on the Group’s fi nancial statements. IFRIC 12 Service Concession ArrangementsThe interpretation becomes effective on January 1, 2008 and applies to fi scal years beginning after that date. IFRIC 12 addresses arrangements in which a private company shall establish an infra-structure to provide public service for a specifi ed period. The com-pany is paid for this service during the term of the contract. The Group will apply IFRIC 12 as of January 1, 2008, but this is not expected to have any impact on the Group’s fi nancial statements.
Consolidated fi nancial statementsThe consolidated fi nancial statements comprise the Parent Com-pany, subsidiaries, joint ventures and associated companies. Subsid-iaries are defi ned as companies in which Volvo holds more than 50% of the voting rights or in which Volvo otherwise has a controlling interest. Joint ventures are companies over which Volvo has joint control together with one or more external parties. Associated com-panies are companies in which Volvo has a signifi cant infl uence, which is normally when Volvo’s holding equals to at least 20% but less than 50% of the voting rights.
The consolidated fi nancial statement have been prepared in accordance with the principles set forth in IAS 27, Consolidated and Separate Financial Statements. Accordingly, intra-Group transactions and gains on transactions with associated companies are eliminated.
All business combinations are accounted for in accordance with the purchase method. Volvo applies IFRS 3, Business Combinations for acquisitions after January 1, 2004, in accordance with the IFRS 1
transition rules. Volvo decided not to restate prior acquisitions. Volvo values acquired identifi able assets, tangible and intangible, and liab ilities at fair value. Surplus amounts compared with the purchase consideration are reported as goodwill. Any lesser amount, so-called negative goodwill, is reported in the income statement.
Companies that have been divested are included in the consoli-dated fi nancial statements up to and including the date of divest-ment. Companies acquired during the year are consolidated as of the date of acquisition.
Joint ventures are reported by use of the proportionate method of consolidation.
Holdings in associated companies are reported in accordance with the equity method. The Group’s share of reported income in such companies is included in the consolidated income statement in Income from investments in associated com panies, reduced in appro-priate cases by depreciation of surplus values and the effect of apply-ing different accounting principles. Income from associated com-panies are included in operating income due to that the investments are of operating nature.
For practical reasons, most of the associated companies are included in the consolidated accounts with a certain time lag, nor-mally one quarter. Dividends from associated companies are not included in consolidated income. In the consolidated balance sheet, the book value of shareholdings in associated companies is affected by Volvo’s share of the company’s net income, reduced by depreci-ation of surplus values and by the amount of dividends received.
Translation to Swedish kronor when consolidating companies using foreign currencies AB Volvo’s functional currency is the Swedish krona. All reporting in group companies for group purposes is made in the currency where the company has the majority of their revenues and expenses; nor-mally the currency of the country where the company is located. AB Volvo’s and The Volvo Group’s reporting currency is Swedish kronor. In preparing the consolidated fi nancial statements, all items in the income statements of foreign subsidiaries and joint ventures (except subsidiaries in highly infl ationary economies) are translated to Swed-ish kronor at the average exchange rates during the year (average rate). All balance sheet items are translated at exchange rates at the respective year-ends (year-end rate). The differences in consolidated shareholders’ equity arising as a result of variations between year-end exchange rates are charged or credited directly to shareholders’ equity as a separate component.
The accumulated translation difference related to a certain sub-sidiary, joint venture or associated company is reversed to income as a part of the gain/loss arising from the divestment or liquidation of such a company.
IAS 29, Financial Reporting in Hyperinfl ationary Economies, is applied to fi nancial statements of subsidiaries operating in highly infl ationary economies. Volvo applies reporting based on historical

value. Translation differences are charged against earnings for the year. Currently, Volvo has no subsidiaries with a functional currency that could be considered a hyperinfl ationary currency.
Receivables and liabilities in foreign currencyIn the individual Group companies as well as in the consolidated accounts, receivables and liabilities in foreign currency are valued at period-end exchange rates. Translation differences on operating assets and liabilities are recognized in operating income, while trans-lation differences arising in fi nancial assets and liabilities are charged to other fi nancial income and expenses.
Currency swap contracts are reported at fair value, unrealized gains on exchange rates are reported as short term receivables and unrealized losses on exchange rates are reported as short term liabilities.
Exchange rate differences on loans and other fi nancial instru-ments in foreign currency, which are used to hedge net assets in for-eign subsidiaries and associated companies, are offset against translation differences in the shareholders’ equity of the respective companies.
Exchange rate gains and losses on payments during the year and on the valuation of assets and liabilities in foreign currencies at year-end are credited to, or charged against, income in the year they arise. The more important exchange rates applied are shown above.
Net sales and revenue recognitionThe Group’s reported net sales pertain mainly to revenues from sales of goods and services. Net sales are reduced by the value of discounts granted and by returns.
Income from the sale of goods is recognized when signifi cant risks and rewards of ownership have been transferred to external parties, normally when the goods are delivered to the customers. If, however, the sale of goods is combined with a buy-back agreement or a residual value guarantee, the sale is accounted for as an operat-ing lease transaction if signifi cant risks of the goods are retained in Volvo. Income from the sale of workshop services is recognized when the service is provided. Rental revenues and interest income in conjunction with fi nancial leasing or installment contracts are recog-nized during the underlying contract period. Revenue for mainte-nance contracts are recognized according to how costs associated with the contracts are distributed during the contract period.
Interest income is recognized on a continuous basis and dividend income when it is received.
Leasing – Volvo as the lessorLeasing contracts are defi ned in two categories, operational and fi nancial, depending on the contract’s fi nancial implications. Oper-ational leasing contracts are reported as non-current assets in Assets in operational leases. Income from operational leasing is reported equally distributed over the leasing period. Straight-line depreciation is applied to these assets in accordance with the terms of the under-taking and the deprecation amount is adjusted to correspond to the estimated realizable value when the undertaking expires. Assessed impairments are charged in the income statement. The product’s assessed realizable value at expiration of the undertaking is reviewed continually on an individual basis.
Financial leasing agreements are reported as Non-current respective Short-term receivables in the customer fi nancing oper-ations. Income from fi nancial leasing contracts is distributed between interest income and amortization of the receivable in the customer fi nancing operations.
In accordance with IAS 14, Segment reporting, operational leasing contracts should be reclassifi ed to fi nancial in the segment reporting of Volvo Financial Services if the residual value in these contracts is
guaranteed to Volvo Financial Services by another Volvo business area. In the Volvo Group’s consolidated balance sheet, these leasing agreements are still reported as operating leases. Reclassifi cation from operational to fi nancial leasing contract also affects the income statement with regards to sales and depreciation. Volvo Financial Service’s sales are reduced as a result of the reclassifi cation as well as depreciation, which affect cash fl ow from operating activities. However, the Volvo consolidated balance sheet and income state-ment still recognizes leasing contracts as operational and, accord-ingly, reports higher sales and depreciation.
Investments in other companiesVolvo accounts for all investments in companies, except if these investments are classifi ed as associated companies in accordance with IAS 39, Financial Instruments: Recognition and Measurement. Companies listed on a fi nancial exchange should be reported in the balance sheet to market value. Under IAS 39, unrealized gains and losses attributable to the change in market value of investments are reported in a separate component of shareholders’ equity except when the decline in value is signifi cant or other than temporary. If the value decline is considered other than temporary, the value should be written down through the income statement. IAS 39 is applied by Volvo as of January 1, 2005 and the difference in valuation com-pared with Swedish GAAP and the 2004 accounting principles is that all such investments have been carried at their cost of acquisi-tion unless there has been a permanent decrease in value. The dif-ference between the valuation at December 31, 2004 and January 1, 2005 is reported in shareholders’ equity. Unlisted shares, for which a reliable fair value can not be determined, should be reported at a historical cost reduced in appropriate cases by write-downs.
Reporting of fi nancial assets and liabilitiesVolvo reports marketable securities in accordance with IAS 39 based on classifi cation of these assets into a category valued at fair value through profi t and loss.
As of January 1, 2005, Volvo applies IAS 39, regarding the time that fi nancial assets should be derecognized from the balance sheet. This occurs when substantially all risks and rewards have been transferred to an external party. Corresponding principles are applied regarding fi nancial assets in Volvo’s segment reporting. Under Swedish GAAP, for the 2004 comparison year, fi nancial assets should be derecognized at settlement or if the ownership of the fi nancial assets had been transferred to an external party.
Financial liabilities are reported at historical value reduced by amortization. Transaction cost in connection with raising fi nancial liabilities are amortized over the fi nancial loan’s duration as a fi nan-cial expense.
ReceivablesAccounts receivables are initially recognized at fair value, normally equal with the nominal amount. In cases in which the payment terms exceed one year, the receivable is carried at its discounted present value. Provisions for doubtful receivables are made on a current basis after an assessment of whether the customer’s ability to pay has changed.
Hedge accounting In accordance with IAS 39, which is applied by Volvo as of January 1, 2005, certain fi nancial instruments shall be reported at fair value in the balance sheet. In order to apply hedge accounting, the follow-ing criteria must be met: the position being hedged is identifi ed and exposed to market value movements, for instance related to exchange-rate or interest-rate movements, the purpose of the loan/instrument is to serve as a hedge and the hedging effectively pro-
Financial information 2006 93

94 Financial information 2006
The Volvo Group
Notes to consolidated financial statements
tects the underlying position against changes in the fair value. Financial instruments used for the purpose of hedging future cur-rency fl ows are accounted for as hedges if the currency fl ows are considered highly probable to occur.
– For fi nancial instruments used to hedge forecasted internal commercial cash fl ows and forecasted electricity consumption, the fair value is debited or credited to a separate component of equity to the extent the requirements for cash-fl ow hedge accounting are ful-fi lled. To the extent that the requirements are not met, the unrealized gain or loss will be charged to income statement. Gains and losses on hedges are reported at the same time that the gains and losses arise on the items hedged and are recognized in consolidated share-holders’ equity.
– For fi nancial instruments used to hedge interest and currency risks on loans, Volvo previously applied through and including 2004 hedge accounting in accordance with Swedish GAAP. The differ-ence between the carrying value according to Swedish GAAP and the fair value according to IFRS as of January 1, 2005, was charged against the income statement over the remaining time of the hedged instrument. Under the more complex rules in IAS 39, Volvo has cho-sen not to apply hedge accounting. The difference between carrying values reported under Swedish GAAP and fair values to be reported under IFRS pertains to unrealized interest-rate gains and losses attributable to the period between the reporting date and maturity dates of the derivatives. The unrealized gains and losses will be charged to the fi nancial net in the income statement.
– Volvo applies hedge accounting for certain net investments in foreign operations. The current result for such hedges is reported in a separate component in shareholders’ equity. In the event of a divestment, the accumulated result from the hedge is recognized in the income statement.
Research and development expenses Volvo applies IAS 38, Intangible Assets, for reporting of research and development expenses. In accordance with this accounting rec-ommendation, expenditures for development of new products, pro-duction systems and software shall be reported as intangible assets if such expenditures with a high degree of certainty will result in future fi nancial benefi ts for the company. The acquisition value for such intangible assets shall be amortized over the estimated useful life of the assets. The rules means that high demands are estab-lished in order for these development expenditures to be reported as assets. For example, it must be possible to prove the technical func-tionality of a new product or software prior to this development being reported as an asset. In normal cases, this means that expenditures are capitalized only during the industrialization phase of a product development project. Other research and development expenses are charged to income as incurred.
Depreciation, amortization and impairments of tangible and intangible non-current assets Volvo applies historical costs for valuation of intangible and tangible assets. Loan expenses during the acquisition period for a non-cur-rent asset are expenses. Depreciation is based on the historical cost of the assets, adjusted in appropriate cases by write-downs, and estimated useful lives.
Depreciation periodsCapitalized type-specifi c tools 2 to 8 years Operational leases 3 to 5 years Machinery 5 to 20 years Buildings and Investment property 25 to 50 years Land improvements 20 years Product and software development 3 to 8 years
In connection with its participation in aircraft engine projects with other companies, Volvo Aero in certain cases pays an entrance fee. These entrance fees are capitalized as an intangible asset and amortized over 5 to 10 years.
Information regarding estimated value of investment property is based on discounted cash fl ow projections. The estimation is per-formed by the Group’s Real Estate business unit. The required return is based on current property market conditions for comparable prop-erties in comparable locations.
Goodwill is reported as intangible non-current assets with inde f-inite useful life. Annually, testing is carried out to determine any impairment through calculation of the asset’s recovery value. If the calculated recovery value is less than the carrying value, a write down is made to the asset’s recovery value.
Similarly, impairment testing is carried out at the closing date if there is any indication that a non-current asset has declined in value.
Leasing – Volvo as the lesseeVolvo evaluates leasing contracts in accordance with IAS 17, Leases. In those cases in which the fi nancial risk and benefi ts that are related to ownership, so called fi nance lease, are in signifi cant respects held by Volvo, Volvo reports the asset and related obliga-tion in the balance sheet at the lower of the leased asset’s fair value or the present value of minimum lease payments. The future leasing fees are reported as loans. The lease asset is depreciated in accord-ance with Volvo’s policy for the respective non-current asset. The lease payments when made are allocated between amortization and interest expenses. If the leasing contract is considered to be a so called operational lease the income statement is charged over the lease contract’s lifetime.
Non-current assets held for sale and discontinued operations Volvo applies IFRS 5, Non-current Assets Held for Sale and Discon-tinued Operations as of 2005. Processes are continuously ongoing regarding the sale of assets or groups of assets at minor values. In cases in which the criteria for being classifi ed as a non-current asset held for sale are fulfi lled and the asset or group of assets is other than of minor value, the asset or group of assets and the related liabilities are reported on a separate line in the balance sheet. The asset or group of assets are tested for impairment and valued at fair value after deduction for selling expenses if impaired.
Inventories Inventories are stated at the lower of cost, in accordance with the fi rst-in, fi rst-out method (FIFO), or net realizable value. The historical value is based on the standard cost method, including costs for all direct manufacturing expenses and the apportionable share of the capacity and other related manufacturing costs. The standard costs is tested regularly and adjustment is made based on current condi-tions. Costs for research and development, selling, administration and fi nancial expenses are not included. Net realizable value is cal-culated as the selling price less costs attributable to the sale.
Share-based payments Volvo applies IFRS 2, Share-based Payments for the new share-based incentive program adopted at the Annual General Meetings in 2004, 2005 and 2006. IFRS 2 distinguishes “cash-settled” and “equity-set-tled”, in Volvo case, shares, components of share-based payments. The Volvo program include both a cash-settled and an equity-settled part. The value of the equity-settled payments is determined at the grant-date, recognized as an expense during the vesting period and credited to equity. The fair value is calculated according to share price reduced by dividend connected to the share before the allotment. The

additional social costs are reported as a liability, revalued at each bal-ance sheet date in accordance with URA 46, issued by the Swedish Financial Accounting Standards Council’s Emergency Issue Task Force. The cash settled payment is revalued at each balance sheet day and is reported as an expense during the vesting period and as a short term liability. An assessment whether the terms of payment will be fulfi lled is made continuously. If the assessment changes, the expense will be adjusted. The equity-settled part was earlier account ed for at fair value and provided for as an accrued expense over the vest-ing period with a ”true-up” each reporting date.
Pensions and similar obligations (Postemployment benefi ts)Volvo applies IAS 19, Employee Benefi ts, for pensions and similar obligations. In accordance with IAS 19, actuarial calculations should be made for all defi ned-benefi t plans in order to determine the present value of obligations for benefi ts vested by its current and former employees. The actuarial calculations are prepared annually and are based upon actuarial assumptions that are determined close to the balance sheet date each year. Changes in the present value of obligations due to revised actuarial assumptions are treated as actu-arial gains or losses which are amortized over the employees’ aver-age remaining service period to the extent these exceed the corridor value for each plan. Deviations between expected return on plan assets and actual return are treated as actuarial gains or losses. Provisions for post-employment benefi ts in Volvo’s balance sheet correspond to the present value of obligations at year-end, less fair value of plan assets, unrecognized actuarial gains or losses and unrecognized unvested past service costs.
In accordance with the IFRS transition rules, the carrying amount of the liability is determined at January 1, 2004 in accordance with IAS 19 and the actuarial gains and losses set at zero. As a supple-ment to IAS 19, Volvo applies URA 43 in accordance with the recommendation from the Swedish Financial Accounting Standards Council in calculating the Swedish pension liabilities.
For defi ned contribution plans premiums are expensed as incurred.
Provisions for residual value risks Residual value risks are attributable to operational leasing contracts and sales transactions combined with buy-back agreements or residual value guarantees. Residual value risks are the risks that Volvo in the future would have to dispose used products at a loss if the price development of these products is worse than what was expected when the contracts were entered. Provisions for residual value risks are made on a continuing basis based upon estimations of the used products’ future net realizable values. The estimations of future net realizable values are made with consideration of current prices, expected future price development, expected inventory turn-over period and expected variable and fi xed selling expenses. If the residual value risks are pertaining to products that are reported as tangible assets in Volvo’s balance sheet, these risks are refl ected by depreciation or write-down of the carrying value of these assets. If the residual value risks are pertaining to products, which are not reported as assets in Volvo’s balance sheet, these risks are refl ected under the line item short-term provisions.
Warranty expenses Estimated costs for product warranties are charged to operating expenses when the products are sold. Estimated costs include both expected contractual warranty obligations as well as expected good-will warranty obligations. Estimated costs are determined based upon historical statistics with consideration of known changes in product quality, repair costs or similar. Costs for campaigns in con-
nection with specifi c quality problems are charged to operating expenses when the campaign is decided and announced.
Restructuring costs Restructuring costs are reported as a separate line item in the income statement if they relate to a considerable change of the Group structure. Other restructuring costs are included in Other operating income and expenses. A provision for decided restructur-ing measures is reported when a detailed plan for the implementa-tion of the measures is complete and when this plan is communi-cated to those who are affected.
Deferred taxes, allocations and untaxed reserves Tax legislation in Sweden and other countries sometimes contains rules other than those identifi ed with generally accepted accounting principles, and which pertain to the timing of taxation and measure-ment of certain commercial transactions. Deferred taxes are pro-vided for on differences that arise between the taxable value and reported value of assets and liabilities (temporary differences) as well as on tax-loss carryforwards. However, with regards to the valu-ation of deferred tax assets, that is, the value of future tax reduc-tions, these items are recognized provided that it is probable that the amounts can be utilized against future taxable income.
Deferred taxes on temporary differences on participations in sub-sidiaries and associated companies are only reported when it is probable that the difference will be recovered in the near future.
Tax laws in Sweden and certain other countries allow companies to defer payment of taxes through allocations to untaxed reserves. These items are treated as temporary differences in the consolidat ed balance sheet, that is, a split is made between deferred tax liability and equity capital (restricted reserves). In the consolidated income statement an allocation to, or withdrawal from, untaxed reserves is divided between deferred taxes and net income for the year.
Cash-fl ow statementThe cash-fl ow statement is prepared in accordance with IAS 7, Cash Flow Statement, indirect method. The cash-fl ow statements of for-eign Group companies are translated at the average rate. Changes in Group structure, acquisitions and divestments, are reported net, excluding cash and cash equivalents, in the item Acquisition and divestment of subsidiaries and other business units and are included in Cash Flow from Investing Activities. The reported operating cash fl ow for 2005 was affected by the adoption of IAS 39. The adjusted opening value at January 1, 2005 was used in calculating cash fl ow.
Cash and cash equivalents include cash, bank balances and parts of Marketable Securities, which date of maturity are within three months at the time for investment. Marketable Securities comprise interest-bearing securities, the majority of which with terms exceed-ing three years. However, these securities have high liquidity and can easily be converted to cash. In accordance with IAS 7, certain invest-ment in marketable securities are excluded from the defi nition of cash and cash equivalents in the cash-fl ow statement if the date of maturity of such instruments is later than three months after the investment was made.
Earnings per shareEarnings per share is calculated as the income for the period attrib-uted to the shareholders of the parent company, divided with the aver-age number of outstanding shares per reporting period. To calculate the diluted earnings per share, the average number of shares is adjusted with the value of the share based incentive program and employee stock option program recalculated to number of shares.
Financial information 2006 95

96 Financial information 2006
The Volvo Group
Note 2 Key sources of estimation uncertainty
Key sources of estimation uncertainty Volvo’s signifi cant accounting principles are set out in note 1, Accounting Principles and conform to IFRS as adopted by the EU. The preparation of Volvo’s Consolidated Financial Statements requires the use of estimates, judgements and assumptions that affect the reported amounts of assets, liabilities and provisions at the date of the fi nancial statements and the reported amounts of sales and expenses during the periods presented. In preparing these fi nancial statements, Volvo’s management has made its best esti-mates and judgements of certain amounts included in the fi nancial statements, giving due consideration to materiality. The application of these accounting principles involves the exercise of judgement and use of assumptions as future uncertainties and, as a result, actual results could differ from these estimates. In accordance with IAS 1, preparers are required to provide additional disclosure of accounting principles in which estimates, judgments and assump-tions are particularly sensitive and which, if actual results are differ-ent, may have a material impact on the fi nancial statements. The accounting principles applied by Volvo that are deemed to meet these criteria are discussed below:
Impairment of goodwill, other intangible assets and other non-current assetsProperty, plant and equipment, intangible assets, other than good-will, and certain other non-current assets are amortized and depreci-ated over their useful lives. Useful lives are based on management’s estimates of the period that the assets will generate revenue. If, at the date of the fi nancial statements, there is any indication that a tangible or intangible non-current asset has been impaired, the recoverable amount of the asset should be estimated. The recover-able amount is the higher of the asset’s net selling price and its value in use, estimated with reference to management’s projections of future cash fl ows. If the recoverable amount of the asset is less than the carrying amount, an impairment loss is recognized and the carrying amount of the asset is reduced to the recoverable amount. Determination of the recoverable amount is based upon manage-ment’s projections of future cash fl ows, which are generally made by use of internal business plans or forecasts. While management believes that estimates of future cash fl ows are reasonable, different assumptions regarding such cash fl ows could materially affect our valuations. Intangible and tangible non-current assets amounted to 73,997 whereof 8,849 represents goodwill. For Goodwill and certain other intangible assets with indefi nite life-time an annual impairment review is performed at the year-end closing. Such an impairment review will require management to determine the fair value of Volvo’s cash generating units, reporting units for US GAAP purposes, on the basis of projected cash fl ows and internal business plans and fore-casts. Volvo has since 2002 performed a simliar impairment review in accordance with US GAAP. No impairment charges were required for the period 2002–2006.
Residual value risksIn the course of its operations, Volvo is exposed to residual value risks through operating lease agreements and sales combined with repurchase agreements. The products, primarily trucks, for which Volvo has a residual value commitment, are generally recognized in the balance sheet as assets under operating leases. Depreciation expenses for these products are charged on a straight-line basis
over the term of the commitment in amounts required to reduce the value of the product to its estimated net realizable value at the end of the commitment. Estimated impairment losses are immediately charged to income. The estimated net realizable value of the prod-ucts at the end of the residual value commitments is monitored indi-vidually on a continuing basis. In monitoring estimated net realizable value of each product under a residual value commitment, manage-ment makes consideration of current price-level of the used product model, value of options, mileage, condition, future price deterioration due to expected change of market conditions, alternative distribution channels, inventory lead-time, repair and reconditioning costs, handling costs and overhead costs in the used product divisions. Provisions for residual value risk amount to 781.
Revenue recognition Revenue from the sale of goods is recognized when signifi cant risks and rewards of ownership have been transferred to external parties, normally when the goods are delivered to the customers. If, however, the sale of goods is combined with a buy-back agreement or a re sidual value guarantee, the sale is accounted for as an operating lease transaction under the condition that signifi cant risks of the goods are retained by Volvo. In certain cases Volvo enters into a buy-back agreement or residual value guarantee after Volvo sold the product to an independent party or in combination with an undertak-ing from the customer that in the event of a buy-back to purchase a new Volvo product. In such cases, there may be a question of judge-ment regarding whether or not signifi cant risks and rewards of ownership have been transferred to the customer. If it is determined that such an assessment was incorrect, Volvo’s reported revenue and income for the period will decline and instead be distributed over several reporting periods.
Deferred taxesUnder IFRS, deferred taxes are recognized for temporary differ-ences, which arise between the taxable value and reported value of assets and liabilities as well as for unutilized tax-loss carryforwards. Volvo records valuation allowances against deferred tax assets where management does not expect such assets to be realized based upon current forecasts. In the event that actual results differ from these estimates or management adjusts these estimates in future periods, changes in the valuation allowance may need to be done that could materially impact our fi nancial position and the income for the period. At December 31, 2006, a valuation allowance of 213 was established for the value of deferred tax assets. Net of this valuation allowance, deferred tax assets net of 10,069 were recognized in the Group’s balance sheet.
Inventory obsolescenceInventories are reported at the lower of historical cost, in accordance with the fi rst-in, fi rst-out method (FIFO), and net realizable value. The estimated net realizable value includes management consideration of out-dated articles, over-stocking, physical damages, inventory-lead-time, handling and other selling costs. If the estimated net real-izable value is lower than historical cost, a valuation allowance is established for inventory obsolescence. The total inventory value, net from inventory obsolescence allowance, is per December 31, 2006, 34,211.
Notes to consolidated financial statements

Credit loss reservesThe establishment of credit loss reserves on customer fi nancing receivables is dependent on estimates including assumptions regarding past dues, repossession rates and the recovery rate on the underlying collateral. At December 31, 2006, the total credit loss reserves in Volvo Financial Services amounted to 2.01% of the total credit portfolio, SEK 77 billions.
Pensions and other post-employment benefi tsProvisions and costs for post-employment benefi ts, i.e. mainly pen-sions and health-care benefi ts, are dependent on assumptions used by actuaries in calculating such amounts. The appropriate assump-tions and actuarial calculations are made separately for each popu-lation in the respective countries of Volvo’s operations. The assump-tions include discount rates, health care cost trends rates, infl ation, salary growth, long-term return on plan assets, retirement rates, mortality rates and other factors. Discount rate assumptions are based on long-term high quality corporate bond and government bond yields available at year-end. Health care cost trend assump-tions are developed based on historical cost data, the near-term out-look, and an assessment of likely long-term trends. Infl ation assump-tions are based on an evaluation of external market indicators. The salary growth assumptions refl ect the long-term actual experience, the near-term outlook and assumed infl ation. Retirement and mortal-ity rates are based primarily on offi cially available mortality statistics. We review our actuarial assumptions on an annual basis and make modifi cations to them when it is deemed appropriate to do so. Actual results that differ from management’s assumptions are accumulated and amortized over future periods and, therefore, generally affect the recognized expense and recorded provisions in such future periods. See Note 24 for more information regarding costs and assumptions for post-employment benefi ts. At December 31, 2006 net provisions for post-employment benefi ts amounted to 6,651.
Product warranty costsEstimated costs for product warranties are charged to cost of sales when the products are sold. Estimated warranty costs include con-tractual warranty and goodwill warranty (warranty cover in excess of contractual warranty or campaigns which is accepted as a matter of policy or normal practice in order to maintain a good business rela-
tion with the customer). Warranty provisions are estimated with con-sideration of historical claims statistics, the warranty period, the average time-lag between faults occurring and claims to the com-pany and anticipated changes in quality indexes. Differences between actual warranty claims and the estimated claims generally affect the recognized expense and provisions in future periods. Refunds from suppliers, that decrease Volvo’s warranty costs, are recognized to the extent these are considered to be virtually certain. At December 31, 2006 warranty cost provisions amounted to 8.411.
Legal proceedingsVolvo only recognizes liabilities in the accounts where Volvo has a present obligation from a past event, a transfer of economic benefi ts is probable and Volvo can make a reliable estimate of the size of the amount. In instances such as these, a provision is calculated and recognized in the balance sheet. In instances where these criteria are not met, a contingent liability may be disclosed in the notes to the accounts. A contingent liability will be disclosed when a possible obligation has arisen but its existence will only be confi rmed by future events not wholly within Volvo’s control or in circumstances where an obligating event has occurred but it is not possible to quantify the size or likelihood of that obligation crystallizing. Realiza-tion of any contingent liabilities not currently recognized or disclosed in the fi nancial statements could have a material effect on Volvo’s fi nancial condition. Volvo regularly reviews signifi cant outstanding legal cases following developments in the legal proceedings in order to assess the need for provisions in our fi nancial statements. Among the factors that Volvo considers in making decisions on provisions are the nature of the litigation, claim or assessment, the legal proc-esses and potential level of damages in the jurisdiction in which the litigation, claim or assessment has been brought, the progress of the case (including progress after the date of the fi nancial statements but before those statements are issued), the opinions or views of legal counsel and other advisers, experience in similar cases, and any decision of Volvo’s management as to how Volvo intends to respond to the litigation, claim or assessment. To the extent the determinations at any time do not refl ect subsequent developments or the eventual outcome of any claim, our future fi nancial statements may be materially affected, with an adverse impact upon our results of operation, fi nancial position and liquidity.
Note 3 Transition to IFRS
This note is included in the 2006 year’s annual report for the read-ers convenience and describes the transition made in 2005 to IFRS.
Reporting in accordance with IFRS as from 2005 The Volvo Group’s fi nancial reporting is up to 2004 prepared in accordance with generally accepted accounting principles in Sweden (“Swedish GAAP”). Effective from 2005, all listed companies within the European Union (“the EU”) are required to prepare their consoli-dated fi nancial reporting in accordance with International Financial Reporting Standards (“IFRS”), as adopted by the EU. The purpose of the presentations on the following pages is to describe and explain the expected impact on Volvo’s fi nancial reporting as a consequence of transition to IFRS. Volvo Group’s previous accounting principles are described in Note 1 of the 2004 Annual Report. The presenta-tion below focuses on the areas in which the transition to IFRS resulted in a change in accounting principles for Volvo.
Restatements and transition effects In accordance with the IFRS transition rules (IFRS 1), Volvo applies
IFRS as of January 1, 2005, with retroactive application from the IFRS transition date at January 1, 2004. The general rule is that restatement of fi nancial reporting for periods after the transition date should be made as if IFRS has been applied historically. There are certain exceptions from the general rule of which the most sig-nifi cant for Volvo are:
– IAS 39 Financial instruments: Recognition and measurement which can be applied from January 1, 2005.
– Non-amortization of intangible assets with indefi nite useful lives (e.g. goodwill) in accordance with IFRS should be applied retro-actively only from the transition date January 1, 2004.
– IFRS 3 Business Combinations which can be applied from January 1, 2004, without restatements of previous acquisitions.
– IFRS 2 Share-based payments are applied for share-based pay-ments granted after November 7, 2002.
The enclosed income statements and other specifi cations prepared in accordance with IFRS therefore include restatements and transi-tion effects as follows:
Financial information 2006 97

98 Financial information 2006
The Volvo Group
Notes to consolidated financial statements
Capitalization and amortization of development costs Effective on January 1, 2001, Volvo adopted the accounting stand-ard RR 15 “Intangible Assets” under Swedish GAAP. According to this accounting standard, expenditures relating to development of new and existing products and software should be capitalized and amortized over their estimated useful life. According to the transition rules for RR 15, no retroactive application was permitted. According to the transition rules for IFRS, the accounting standard IAS 38, Intangible Assets, which is mainly similar to RR 15 regarding the accounting for development costs, should be applied retroactively for development costs incurred prior to 2001. The restatements and transition effects attributable to this accounting change therefore pertains to retroactive capitalization and amortization of develop-ment costs incurred prior to 2001.
Minority interests In accordance with IFRS, minority interests are presented as a sep-arate component of Shareholders’ equity and is included in the income for the period in the income statement.
Non-amortization of intangible assets with indefi nite useful livesAccording to Swedish GAAP, all intangible assets have been amort-ized over their estimated useful lives. In accordance with IFRS, intangible assets considered to have indefi nite useful lives should not be amortized. Such assets should rather be subject to an annual impairment test. Volvo has determined that intangible assets with indefi nite useful lives include only goodwill. Volvo has chosen not to apply IFRS 3, retroactively in accodance with the IFRS transition rules. The restatements and transition effects attributable to this accounting change therefore pertain to reversal of goodwill amort-ization charged to the income statement under Swedish GAAP for 2004 and a corresponding increase of the carrying value of goodwill at December 31, 2004, adjusted for currency translation differences.
Employee benefi tsEffective on January 1, 2003, Volvo adopted RR 29 “Employee bene-fi ts” under Swedish GAAP. RR 29 is similar to the IFRS accounting standard IAS 19. The only difference between Swedish GAAP and IFRS relates to the date of transition. In accordance with the transi-tion rules of RR 29, actuarial gains and losses arising prior to Janu-ary 1, 2003, were set to zero and charged to equity as of the transi-tion date. In accordance with the IFRS transition rules, actuarial gains and losses arising prior to January 1, 2004, could be set to zero and charged to equity as of the transition date. The transition effects attributable to the accounting change therefore pertain to recognizing actuarial gains and losses that have arisen between January 1, 2003 and January 1, 2004. Volvo has applied URA 43 according to the statement from the Swedish Financial Accounting Standards Council in calculating the Swedish pension liabilities, in addition to IAS 19.
Investments in other companiesVolvo accounts for all investments in companies, except if these investments are classifi ed as associated companies in accordance with IAS 39, Financial Instruments: Recognition and Measurement. Companies listed on a fi nancial exchange should be reported in the balance sheet to market value. Under Swedish GAAP such invest-ments have been carried at their cost of acquisition unless there has been a permanent decrease in value. Under IAS 39, unrealized gains and losses attributable to the fair value of investments are reported in a separate component of shareholders’ equity except when a decline in value is other than temporary. The transition effect on
January 1, 2005, attributable to this accounting change is mainly related to Volvo’s investment in Deutz AG.
Fair value of derivative instruments In accordance with IAS 39, which is applied by Volvo as of January 1, 2005, all derivative fi nancial instruments should be reported in the balance sheet at fair value. The difference between IAS 39 and accounting principles applied for derivative fi nancial instruments under Swedish GAAP is dependent on the use of the derivative instruments: – Derivative fi nancial instruments used for hedging of forecasted
commercial cash-fl ows and forecasted electricity consumption:
Under Swedish GAAP Volvo has applied hedge accounting for the main part of these derivatives and these instruments have conse-quently not been reported in the balance sheet (“Off-balance sheet instruments”). Gains and losses on these contracts have been charged to the income statement at the time of maturity of the spe-cifi c contracts. Under IFRS, the fair value of outstanding derivative instruments is debited or credited to a separate component of equity to the extent the requirements for cash-fl ow hedge accounting are fulfi lled. To the extent that the requirements are not met, the unreal-ized gain or loss is charged to the income statement.– Derivative fi nancial instruments used for hedging of interest-rate
risks and currency-rate risks on loans:
Under Swedish GAAP Volvo has applied hedge accounting for these derivatives and the carrying value of such derivatives has therefore corresponded to currency-rate and interest-rate gains and losses accruable up to the reporting date. Under the more complex rules in IAS 39 Volvo has chosen not to apply hedge accounting for interest rate contracts. The difference between carrying values reported under Swedish GAAP and fair values to be reported under IFRS per-tains to unrealized interest rate gains and losses attributable to the period between the reporting date and maturity dates of the deriva-tives. The difference should be charged to income over the hedged instrument’s remaining time to maturity. The unrealized gains and losses will be charged to the fi nancial net in the income statement.
Derecognition of fi nancial assets In accordance with IAS 39, which is applied by Volvo as of January 1, 2005, fi nancial assets should be derecognized from the balance sheet when substantially all risks and rewards have been transferred to an external party. Under Swedish GAAP, fi nancial assets should be derecognized at settlement or if the ownership of the fi nancial assets has been transferred to an external party. The transition effect on January 1, 2005, attributable to this accounting change is mainly related to certain dealer fi nancing arrangements for which Volvo has retained components of credit risk. Such credit risk com-mitments have under Swedish GAAP been reported as contingent liabilities. This has mainly affected the segment reporting and to a less extent Volvo’s consolidated balance sheet.
Consolidation of temporary investments Under Swedish GAAP, temporary investments in subsidiaries should not be consolidated. Under IFRS, all subsidiaries should be consoli-dated. Restatements and transition effects relating to this account-ing change pertains mainly to Volvo’s investment in the LB Smith distribution business. This operation was acquired in May 2003 and at December 31, 2004, the major part of this operation had been divested. The 2004 income statement is restated with the parts of LB Smith that have been divested during the year. The remaining part, still owned by Volvo, has been consolidated in full according to Swedish GAAP in the fourth quarter of 2004.

IFRS 2 Share-based Payments Volvo has decided that the “new share-based incentive program” adopted at the 2004 Annual General Meeting is covered by IFRS 2 Share-based payments. The impact, however, was limited. The IFRS 2 distinguishes between “cash-settled” and “equity-settled” compo-nents of share-based payments, in Volvo cases, shares. The Volvo program include both a cash-settled and an equity-settled part. The equity-settled part was earlier accounted for at fair value and pro-vided for as an accrued expense over the vesting period with a “true up” each reporting date. According to IFRS 2 the fair value is deter-mined at the grant-date, recognized as an expense during the vest-ing period and credited to equity. Additional social costs are reported as a liability and is revalued at each balance sheet day in accordance with URA 46.
IFRS 5 Non-Current Asset Held for Sale and Discontinued Operations IFRS 5 is applied prospectively from January 1, 2005, according to IFRS 1. Volvo had not identifi ed any non-current assets that could be classifi ed held for sales and which would have had material impact on the balance sheet as of December 31, 2004, and no effect has been identifi ed in the 2004 income statement. Discontinued oper-ations pertain to signifi cant operations, such as operating segments, comprising one or more cash-generating units. The rules for discon-tinued operations have not been applicable for Volvo during 2004 and 2005.
Other transition rules according to IFRS 1 and IFRS standards In applying IFRS, Volvo had the possibility to chose to measure prop-erty, plant and equipment at fair value. Volvo has chosen not to use this possibility but continue the present valuation of property, plant and equipment at historical cost less accumulated depreciation. The same treatment is also used for investment properties. IFRS 1 pro-vides an option how to treat the effects of Changes in Foreign Exchange Rates, according to IAS 21. A fi rst time adopter of IFRS could set the cumulative translation difference to zero for foreign operations. Volvo has chosen this possibility and set the translation difference to zero at January 1, 2004. Assumptions made under pre-vious GAAP shall not be changed under the transition to IFRS unless there is objective evidence that those were in error. Volvo has made no changes in assumptions in the preparation of comparative
information prepared in accordance with IFRS. According to SIC 12, Special Purpose Entities should be consolidated as from January 1, 2004. Volvo has not identifi ed any such Special Purpose Entities.
Defi nition of cash and cash equivalents in presentation of cash-fl ow statements Under Swedish GAAP, all investments in marketable debt securities have been included in the defi nition of cash and cash equivalents for the purpose of the cash-fl ow statement. In accordance with Volvo’s fi nancial risk policy, all such securities should fulfi ll requirements regarding low risk and high liquidity. Under IFRS, investments in mar-ketable securities are excluded from the defi nition of cash and cash equivalents for the purpose of the cash-fl ow statement if these instruments have maturity dates beyond three months from the date of investment. In the 2004 closing no marketable securities were defi ned as cash equivalents according to IFRS. Classifi cation of cash and cash equivalents in the cash-fl ow statement does not affect Volvo’s net fi nancial position.
In the transition to IFRS the following reclassifi cation is done in the cash fl ow statement. Customer fi nance receivables, net, are reported within Cash fl ow from operating activities, instead of as previously being reported as Cash fl ow from investing activities. Cash fl ow related to customer fi nancing operations arises mainly within Financial Services (VFS). Changes in customer fi nan cing are currently reported in Volvo’s cash-fl ow statement with VFS consoli-dated in accordance with the equity method as changes in working capital, since Volvo’s operations excluding VFS do not have any sig-nifi cant customer fi nancing operations. Changes in customer fi nanc-ing operations are reported on a separate line in Volvo’s cash-fl ow statement including VFS. Volvo’s reported Operating Cash-fl ow is not affected by the reclassifi cation.
Classifi cation of leasing contracts in segment reporting of Financial Services In accordance with IFRS, operating lease contracts with end-cus-tomers are in segment reporting for Financial Services reported as fi nancial leasing contracts if the residual value in these contracts is guaranteed to Financial Services by another Volvo business area. In the Volvo Group’s consolidated balance sheet, these leasing agree-ments are still reported as assets under operating lease. In compari-son with the 2004 closing approximately SEK 12 billion is reclassi-fi ed to fi nancial leases from operating leases in the Financial Services segment reporting.
Cash-fl ow statement According to previous presentation Presentation according to IFRS SEK billion 2004 2005 2004 2005
Operating activities Operating income 14.7 18.2 14.7 18.2Depreciation and amortization 10.0 9.9 10.0 9.9Other non-cash items (0.1) 0.4 (0.1) 0.4Change in working capital (1.4) (4.7) (1.4) (4.7)Customer Finance receivables, net (7.4) (7.8)Financial items and income taxes (0.5) (2.0) (0.5) (2.0)Cash fl ow from operating activities 22.7 21.8 15.3 14.0
Investing activities Investments in fi xed assets (7.4) (10.3) (7.4) (10.3)Investment in leasing vehicles (4.4) (4.5) (4.4) (4.5)Disposal of fi xed assets and leasing vehicles 2.4 2.6 2.4 2.6Customer Finance receivables, net (7.4) (7.8) Operating cash fl ow 5.9 1.8 5.9 1.8
Financial information 2006 99

100 Financial information 2006
The Volvo Group
Notes to consolidated financial statements
Consolidated balance sheets Volvo Group exclDecember 31, 2004 Financial Services 1 Financial Services Volvo Group total 2 Dec 31 IFRS ad- Dec 31 Dec 31 IFRS ad- Dec 31 Dec 31 IFRS ad- Dec 31SEK M 2004 justments 2004 2004 justments 2004 2004 justments 2004
Assets Intangible assets 16,564 1,006 17,570 42 42 16,606 1,006 17,612Property, plant and equipment 27,260 27,260 3,891 3,891 31,151 31,151Assets under operating leases 8,477 8,477 12,817 (12,044) 773 19,534 19,534Shares and participations 10,116 10,116 193 193 2,003 2,003Long-term customer fi nance receivables 147 147 25,200 8,687 33,887 25,187 25,187Long-term interest-bearing receivables 1,797 1,797 5 5 1,741 1,741Other long-term receivables 6,426 66 6,492 212 212 6,034 66 6,100Inventories 28,291 28,291 307 307 28,598 28,598Short-term customer fi nance receivables 83 83 26,207 3,324 29,531 26,006 26,006Short-term interest bearing receivables 10,330 10,330 0 0 1,643 1,643Other short-term receivables 30,043 30,043 1,628 1,628 29,647 29,647Marketable securities 25,839 25,839 116 116 25,955 25,955Cash and cash equivalent 8,789 8,789 914 914 8,791 8,791Total assets 174,162 1,072 175,234 71,532 (33) 71,499 222,896 1,072 223,968
Shareholders’ equity and liabilities Shareholders’ equity 69,409 746 70,155 8,306 8,306 69,409 746 70,155Minority interests 229 (229) – 0 – 229 (229) –Provisions for post-employment benefi ts 14,129 548 14,677 26 26 14,155 548 14,703Other provisions 14,020 95 14,115 878 (33) 845 14,898 95 14,993Loans 13,968 13,968 57,860 57,860 61,807 61,807Other liabilities 62,407 (88) 62,319 4,462 4,462 62,398 (88) 62,310Shareholders’ equity and liabilities 174,162 1,072 175,234 71,532 (33) 71,499 222,896 1,072 223,968
Financial position December 31, 2004Updated, taking into account, all differences between Swedish GAAP and IFRS except IAS 39 Financial instruments: Recognition and measurement and IFRS 5, Non-Current Assets Held for Sale and Discontinued Operations. The fi rst column is the closing balance
per December 31, 2004 according to Swedish GAAP. The impact of IFRS is shown as IFRS adjustment and the third column shows the adjusted closing balance December 31, 2004, according to IFRS. This balance has been opening balance for the 2005 reporting.
1 Financial Services reported in accordance with the equity method. 2 The Volvo Group total column is presented in accordance with IFRS and
equals the consolidated balance sheet presented on page 53. The two pro-ceeding columns do not total the Volvo Group total due to (i) reclassifi cation
of lease contracts and (ii) eliminations of intra group balances. Certain lease contracts are accounted for as operating lease contracts in the Volvo Group total balance sheet where as they are accounted for as fi nance lease contracts in Financial Services stand alone.

Consolidated balance sheets Volvo Group exclJanuary 1, 2005 Financial Services 1 Financial Services Volvo Group total 2 Dec 31 IAS 39 Jan 1 Dec 31 IAS 39 Jan 1 Dec 31 IAS 39 Jan 1SEK M 2004 adjustments 2005 2004 adjustments 2005 2004 adjustments 2005
Assets Intangible assets 17,570 17,570 42 42 17,612 17,612Property, plant and equipment 27,260 27,260 3,891 3,891 31,151 31,151Assets under operating leases 8,477 8,477 773 773 19,534 19,534Shares and participations 10,116 (494) 9,622 193 193 2,003 (494) 1,509Long-term customer fi nance receivables 147 424 571 33,887 611 34,498 25,187 1,035 26,222Long-term interest-bearing receivables 1,797 1,797 5 5 1,741 1,741Other long-term receivables 6,492 985 7,477 212 212 6,100 988 7,088Inventories 28,291 28,291 307 307 28,598 28,598Short-term customer fi nance receivables 83 430 513 29,531 298 29,829 26,006 727 26,733Short-term interest bearing receivables 10,330 10,330 0 0 1,643 1,643Other short-term receivables 30,043 4,040 34,083 1,628 1,628 29,647 1,690 31,337Marketable securities 25,839 25,839 116 116 25,955 25,955Cash and cash equivalent 8,789 8,789 914 914 8,791 8,791Total assets 175,234 5,385 180,619 71,499 909 72,408 223,968 3,946 227,914
Shareholders’ equity and liabilities Shareholders’ equity 70,155 348 70,503 8,306 8,306 70,155 348 70,503Minority interests – – – – – –Provisions for post-employment benefi ts 14,677 14,677 26 26 14,703 14,703Other provisions 14,115 439 14,554 845 (6) 839 14,993 432 15,425Loans 13,968 3,340 17,308 57,860 915 58,775 61,807 1,908 63,715Other liabilities 62,319 1,258 63,577 4,462 4,462 62,310 1,258 63,568Shareholders’ equity and liabilities 175,234 5,385 180,619 71,499 909 72,408 223,968 3,946 227,914
Financial position January 1, 2005 Updated taking into account all differences between Swedish GAAP and IFRS including IAS 39 and IFRS 5. Impact of adopting IAS 39 is
charged to Equity according to IFRS 1 as of January 1, 2005. The IFRS balance including IAS 39 effects has been used as opening balance for cash fl ow calculation during 2005.
1 Financial Services reported in accordance with the equity method. 2 The Volvo Group total column is presented in accordance with IFRS and
equals the consolidated balance sheet presented on page 53. The two pro-ceeding columns do not total the Volvo Group total due to (i) reclassifi cation
of lease contracts and (ii) eliminations of intra group balances. Certain lease contracts are accounted for as operating lease contracts in the Volvo Group total balance sheet where as they are accounted for as fi nance lease contracts in Financial Services stand alone.
Financial information 2006 101

102 Financial information 2006
The Volvo Group
Notes to consolidated financial statements
Key operating ratios % of net sales IFRS Sw GAAP
Gross margin 21.6 21.5Research and development expenses 3.8 3.6Selling expenses 9.1 9.0Administrative expenses 2.6 2.6Operating margin 7.3 7.0
Net sales SEK M IFRS Sw GAAP
Trucks 136,879 136,879Buses 12,722 12,722Construction Equipment1 29,360 28,685Volvo Penta 9,057 9,057Volvo Aero 6,925 6,925Other 7,228 7,228Net sales 202,171 201,496
1 Consolidation of temporary investments, LB Smith, January–November.
Operating income SEK M IFRS Sw GAAP
Trucks 8,992 8,989Buses 253 185Construction Equipment 1,898 1,572Volvo Penta 940 937Volvo Aero 403 377Financial Services 1,365 1,365Other units 8 (45)Operating income1 13,859 13,380
Revaluation of shares 820 820Operating income (loss) 14,679 14,200
1 Excluding revaluation of shares in Scania AB and Henlys Group Plc.
Operating margins % IFRS Sw GAAP
Trucks 6.6 6.6Buses 2.0 1.5Construction Equipment 6.5 5.5Volvo Penta 10.4 10.3Volvo Aero 5.8 5.4Operating margin1 6.9 6.6Operating margin 7.3 7.0
1 Excluding revaluation of shares in Scania AB and Henlys Group Plc.
Consolidated income statements IFRS comparison 2004VFS reported according to the equity method
SEK M unless otherwise specifi ed IFRS Sw GAAP
Net sales 202,171 201,496Cost of sales (158,453) (158,231)Gross income 43,718 43,265
Research and development expenses (7,614) (7,233)Selling expenses (18,317) (18,048)Administrative expenses (5,310) (5,321)Other operating income and expenses 7 (658)Income from Financial Services 1,365 1,365Income from investments in associated companies 2 2Income from other investments 828 828Operating income 14,679 14,200 Interest income and similar credits 993 993Interest expenses and similar charges (1,426) (1,404)Other fi nancial income and expenses (1,210) (1,210)Income after fi nancial items 13,036 12,579
Minority interest – (40)Income taxes (3,129) (3,184)Income for the period 9,907 9,355* Attributable to:
Equity holders of the parent company 9,867 –Minority interest 40 –
9,907 –
Depreciation and amortization included above Depreciation Industrial and Commercial (5,540) (5,540)Financial Services (3,066) (3,066)Total Depreciation (8,606) (8,606)
Amortization Industrial and Commercial (1,333) (1,635)Financial Services (63) (63)Total Amortization (1,396) (1,698)
Basic earnings per share, SEK 23.58 22.35Diluted earnings per share, SEK 23.55 22.33Average number of shares, million 418.5 418.5

Summarized reconciliation of shareholders’ equity SEK M 040101 041231 050101
Equity under Swedish GAAP 72,420 69,409 69,409IFRS adjustments: Capitalization and amortization of intangible assets 722 340 340Minority interest 217 229 229Non-amortization of goodwill 0 665 665Post employee benefi ts (580) (473) (473)Investments in listed companies (494)Fair value gains and losses on derivatives for hedge of: - Commercial cash fl ow 1,195- Electricity contracts (25)Consolidation of temporary investments (152) – –Share based payments 0 14 14Deferred taxes on IFRS adjustments (96) (29) (358)Total adjustments to IFRS 112 746 1,094Equity under IFRS 72,532 70,155 70,503
Summarized reconciliation of net incomeSEK M 2004
Net income under Swedish GAAP 9,355IFRS adjustments: Capitalization and amortization of intangible assets (382)Minority interest 40Non-amortization of goodwill 684Post-employment benefi ts 13Consolidation of temporary investments 142Deferred taxes on IFRS adjustments 55Total adjustments to IFRS 552Income for the period under IFRS 9,907
Summarized reconciliation of net fi nancial positionSEK bn 2004
Volvo Group excl VFS Net fi nancial position at December 31, 2004 under Swedish GAAP 18.7
IFRS adjustments: Post-employment benefi ts (0.5)Derecognition of fi nancial assets (3.4)Total adjustments to IFRS (3.9)Net fi nancial position at January 1, 2005 under IFRS 14.8
Signifi cant differences between Swedish GAAP and IFRSThe most signifi cant differences between Swedish GAAP and IFRS for Volvo are further explained below in the Equity- and net income reconciliation:
Financial information 2006 103

104 Financial information 2006
The Volvo Group
Notes to consolidated financial statements
Prévost Car Inc.During the third quarter 2004 the North American bus manufacturer Prévost Car Inc. became a wholly owned subsidiary of Volvo Bus Corporation. As part of the restructuring of the bus manufacturer Henlys Group Plc, Volvo Group reached an agreement to acquire the remaining 50% of the shares. Prévost Car Inc. was a former 50/50 joint venture between Volvo and Henlys, reported in the Volvo Group accounts in accordance with the proportionate consolidation method. The purchase price was USD 83 M including two loans made available to Prévost Car Inc. by Henlys. Prévost Car Inc. con-tain the Prévost and Nova brands. Prévost manufactures coaches and bus shells for luxury mobile homes. Nova Bus manufactures city buses mainly for the Canadian market.
Axle manufacturingDuring the third quarter 2004 Volvo and ArvinMeritor signed a Stra-tegic Alliance Agreement for the supply of axels. As a consequence of the strategic alliance ArvinMeritor acquired the Volvo’s axle plant and foundry in Lyon, France.
The effects during 2006, 2005 and 2004 on the Volvo Group’s bal-ance sheet and cash fl ow statement in connection with the acquisi-tion of subsidiaries and other business units are specifi ed in the following table: 2004 2005 2006
Intangible assets (599) 20 0Property, plant and equipment 300 124 73Assets under operating lease 115 0 0Shares and participations (260) (80) 5Inventories 630 129 131Current receivables 958 257 91Cash and cash equivalents 180 42 8Other assets 62 3 0Minority interests (20) (45) 0Provisions (63) (4) (24)Loans (347) (115) (20)Liabilities (448) (203) (69)Acquired net assets 508 128 195
Cash and cash equivalents paid (508) (60) (167)
Cash and cash equivalents according to acquisition analysis 180 42 8Effect on Group cash and cash equivalents (328) (18) (159)
The effects during 2006, 2005 and 2004 includes wholly owned subsidiaries that previously were accounted for according to the equity method.
AB Volvo’s holding of shares in subsidiaries as of December 31, 2006 is shown in the table on pages 149–151, AB Volvo’s holding of shares. Signifi cant acquisitions, formations and divestments within the Group are listed below.
Shandong Lingong Construction Machinery Co.Volvo Construction Equipment (Volvo CE) has made an equity invest-ment of 70% in Shandong Lingong Construction Machinery Co. China is the world’s largest market for wheel loaders. The total mar-ket for 2005 was approximately 110,000 units. Lingong is the fourth largest producer of wheel loaders in China with a comprehensive dealer network throughout the country. In addition to 16 different models of wheel loaders, Lingong also has a smaller range of back-hoe loaders, road rollers and excavators.
In January 2007, it was announced that Volvo Construction Equip-ment (Volvo CE) had received all necessary regulatory approvals for an equity investment of 70% in Lingong and the deal is now closed. Volvo CE has invested RMB 328 M, corresponding to just over SEK 300 M, in exchange for 70% of the equity in Lingong. In 2005 Lin-gong’s operating income was RMB 10 M on revenue of RMB 2 B and had around 1,800 employees. The deal has no material impact on Volvo’s fi nancial position.
Celero Support ABIn November 2005 Volvo sold Celero Support AB to Coor Service Management for 680 before deduction for the company’s net debt. The sale resulted in a gain of about 430. Celero Support AB is a service company with operations that include various offi ce and workplace sevices as well as maintenance of industrial plants and properties. Celero Support had 1,100 employees and net sales of approximately 1.4 billion when sold.
PropertiesIn February 2005, Volvo Financial Services, via the Volvo Group’s real estate company, Danafjord AB, entered an agreement on the sale of two wholly owned companies, which own properties in Tors-landa and Kalmar valued at about 515. The sale yielded a capital gain of 188.
L.B. Smith (SABA Holding Inc.)On May 2, 2003 Volvo Construction Equipment purchased the assets amounting to USD 189 M associated with the Volvo distribu-tion business of L.B. Smith Inc. in the US. No goodwill or real estate was included in the deal. The major part of the dealerships was divested during 2004.
Renault V.I. and MackDuring the fourth quarter 2004 AB Volvo and Renault signed a set-tlement agreement regarding the disagreement the companies have had since 2001 pertaining to Volvo’s acquisition of Renault V.I./Mack and the value of certain of the acquired assets and certain warranty claims. The settlement, EUR 108 M has reduced the good-will amount pertaining to the acquisition of Renault V.I.
Note 4 Acquisition and divestments of shares in subsidiaries

Note 5 Joint ventures
Joint ventures are companies over which Volvo has joint control together with one or more external parties. Joint ventures are reported by applying the proportionate consolidation method, in accordance with IAS 31 Joint ventures. Group holdings of shares in joint ventures are listed below. Dec 31, 2006
Holding HoldingShares in Joint ventures percentage no of shares
Shanghai Sunwin Bus Corp., China 50 –Xian Silver Bus Corp., China 50 –
Volvo’s share of joint ventures’ income statements 2004 2005 2006
Net sales 492 345 630Operating income (27) (62) (9)Income after fi nancial items (32) (71) (17)Income of the period (34) (71) (17)
Volvo’s share of joint ventures’ balance sheets 2004 2005 2006
Non-current assets 100 117 99Current assets 394 386 359Total assets 494 503 458
Shareholders’ equity 228 207 168Provisions 6 1 2Long-term liabilities 0 0 3Current liabilities 260 295 285Total shareholders’ equity and liabilities 494 503 458
At the end of 2006 no guarantees were issued for the benefi t of joint ventures, neither by Volvo alone or jointly with other venturers. At the same date Volvo’s share of contingent liabilities issued by its joint ventures amounted to 0 (0; 6).
2004 2005 2006
Number of of which Number of of which Number of of whichAverage number of employees employees women, % employees women, % employees women, %
Shanghai Sunwin Bus Corp. 604 21 567 17 488 18Xian Silver Bus Corp. 252 12 243 14 258 15Total number of employees 856 18 810 16 746 17
The effects during 2006, 2005 and 2004 on the Volvo Group’s bal-ance sheet and cash fl ow statement in connection with the divest-ment of subsidiaries and other business units are specifi ed in the following table: 2004 2005 2006
Intangible assets – – (2)Property, plant and equipment (440) (519) (181)Assets under operating lease – – (369)Inventories (4) (41) (254)Other receivables 181 (334) (416)Cash and cash equivalents – (114) (128)Provisions 94 (12) 84Other liabilities 50 888 723Divested net assets (119) (132) (543)
Cash and cash equivalents received 187 782 797Cash and cash equivalents, divested companies – (114) (128)Effect on Group cash and cash equivalents 187 668 669
Non-Current Assets Held for SaleVolvo Aero Engine Services (VAES)During the fourth quarter 2006 a strategic decision on closure of Volvo Aero’s operations in Bromma was decided. In November, it was
announced that Volvo Aero had initiated codetermination negoti-ations with the trade unions relating to the closure of Volvo Aero Engine Services (VAES) in Bromma, which conducts overhaul of large aircraft engines. In recent years, the volumes of the engines overhauled in Bromma have declined sharply. In accordance with the strategic decision, the operations will be gradually phased out during 2007. Costs for a closure are estimated to 258. The assets and lia-bilities in the table adjoined are listed to a net realizable value.
Non-Current Assets Heldfor Sale1 2004 2005 2006
Tangible assets – – 56Financial assets – – 22Inventories – – 480Short-term recievables – – 247Total assets – – 805
Provision for post-employment benefi ts – – 7Other provisions – – 20Current liabilities – – 253Total shareholders equity and liabilities – – 280
1 Assets and liabilities do not balance since the table only display the assets and liabilities in Volvo Aero Engine Services held for sale.
Financial information 2006 105

106 Financial information 2006
The Volvo Group
Reporting by business segmentThe Volvo Group’s operations are organized in eight business areas: Volvo Trucks, Renault Trucks, Mack Trucks, Buses, Construction Equipment, Volvo Penta, Volvo Aero and Financial Services. In add-ition to the eight business areas, there are other operations consist-ing mainly of business units that are designed to support the business areas’ operations. The business units include Volvo Powertrain, Volvo 3P, Volvo IT, Volvo Logistics and Volvo Parts.
Each business area, except for Financial Services, has total responsibility for its operating income, operating capital and operat-ing cash fl ow. The Financial Services business area has responsibil-ity for its net income and total balance sheet within certain restric-tions and principles that are established centrally. The supervision and coordination of treasury and tax matters is organized centrally to obtain the benefi ts of a Group-wide approach. The legal structure of the Volvo Group is based on optimal handling of treasury, tax and administrative matters and, accordingly, differs from the operating structure.
The business units are designated to support the business areas and are therefore not reportable business segments. In Volvo’s external fi nancial reporting, the fi nancial results within the business units Powertrain and Parts are distributed to the respective business segments. As the three truck brands share product development,
production and other activities in business units such as Volvo 3P and Volvo Powertrain and also share certain infrastructure in distri-bution such as dealers, the truck brands are reported as one busi-ness segment.
Net sales 2004 2005 2006
Trucks 136,879 155,396 166,306Buses 12,722 16,589 16,856Construction Equipment 29,360 34,816 40,564Volvo Penta 9,057 9,776 10,485Volvo Aero 6,925 7,538 8,048Other and eliminations 7,228 7,076 5,876Volvo Group excl Financial Services 202,171 231,191 248,135
Financial Services 9,598 7,549 8,969Eliminations (693) 1,819 1,731Volvo Group total 211,076 240,559 258,835
The above sales fi gures include internal sales in the following amounts:
Notes to consolidated financial statements
Note 7 Segment reporting
Note 6Associated companies
The following table presents summarized fi nancial information for the associated companies partly owned by Volvo. Volvo consolidate
the associated companies according to the equity method. For more information about Volvo’s shareholding, see notes 9 and 15.
2006 NissanIncome statement data 2004 2005 Diesel1 Other Total
Net sales 5,750 7,133 15,488 7,245 22,733Cost of operations (5,575) (6,914) (14,874) (7,167) (22,041)Financial income and expense (10) (16) (22) (21) (43)Income before taxes 165 203 592 57 649
Income taxes (8) (19) (310) (17) (327)Income of the period 157 184 282 40 322 Dec 31 Dec 31 Dec 31 Dec 31 Dec 31Balance sheet data 2004 2005 2006 2006 2006
Property, plant and equipment, net 2,099 792 10,292 1,093 11,385Other non-current assets 88 15 7,984 11 7,995Current assets 9,637 9,270 10,666 7,494 18,160Total Assets 11,824 10,077 28,942 8,598 37,540
Shareholders’ equity 981 688 8,334 996 9,330Provisions 87 55 591 47 638Long-term liabilities 1,132 171 7,921 206 8,127Current liabilities 9,624 9,163 12,096 7,349 19,445Total Shareholders’ equity and liabilities 11,824 10,077 28,942 8,598 37,540
1 Since the acquisition in March, the holding is reported as an associated company, since Volvo believes that substantial infl uence exists. Volvo reports its share in earnings of Nissan Diesel with a time-lag of one quarter.
The table above refers to September 30, 2006, which is when Nissan Diesel was consolidated by Volvo. Nissan Diesel’s fi scal year is April 1–March 31.

Net sales to Group companies 2004 2005 2006
Trucks 690 752 933Buses 377 102 96Construction Equipment 162 127 134Volvo Penta 27 42 24Volvo Aero 43 82 86Other 9,440 10,589 10,788Eliminations (10,739) (11,694) (12,061)Total excl Financial Services 0 0 0
Financial Services 693 755 814Eliminations (693) (755) (814)Total net sales to Group companies 0 0 0
Internal sales between business areas are generally made at stand-ard cost of sales, including calculated interest and product improve-ment expenses. Internal sales from service companies are generally made at market prices.
Operating income 2004 2005 2006
Trucks 8,992 11,717 12,657Buses 158 470 633Construction Equipment 1,898 2,752 3,888Volvo Penta 940 943 1,002Volvo Aero 403 836 345Financial Services 1,365 2,033 2,301Other 923 (598) (427)Volvo Group total 14,679 18,153 20,399
Operating income in 2004 included reversal of write-down of shares in Scania AB of 915, which was reported in Other and write-down of shares in Henlys Group Plc of 95, which was reported in Buses. Operating income in 2006 includes adjustment of goodwill of (1,712), which was reported in Trucks.
Depreciation and amortization 2004 2005 2006
Trucks 5,306 5,307 7,820Buses 219 249 281Construction Equipment 627 658 802Volvo Penta 122 224 205Volvo Aero 391 366 363Other 220 88 23Total excl Financial Services 6,885 6,892 9,494
Financial Services 3,117 429 344Reclassifi cation Group versus segment Financial Services – 2,573 2,545Volvo Group total 1 10,002 9,894 12,383
1 Of which write-down 80 (72; 244).
Research and development expenses 2004 2005 2006
Trucks 5,491 5,200 5,872Buses 484 569 603Construction Equipment 1,033 1,083 1,008Volvo Penta 311 413 445Volvo Aero 209 225 288Other 86 67 138Volvo Group total 7,614 7,557 8,354
Income from investments in associated companies 2004 2005 2006
Trucks 13 (6) 23Buses 1 7 10Construction Equipment – 0 0Volvo Penta – 0 0Volvo Aero (1) 68 8Other (11) (637) 19Volvo Group excl Financial Services 2 (568) 60
Financial Services 25 11 1Volvo Group total 27 (557) 61
Total assets 2004 2005 2006
Operating assets, excluding Financial Services: 1 Trucks 71,439 83,973 89,188Buses 8,017 10,499 9,646Construction Equipment 16,858 21,437 24,040Volvo Penta 3,242 3,700 3,931Volvo Aero 8,695 10,118 10,102Other 3,881 2,938 644Total operating assets excluding Financial Services 112,132 132,665 137,551
Interest-bearing fi nancial assets 46,312 43,939 43,126Tax receivables 6,259 5,986 7,476Total assets in Financial Services 71,499 85,849 84,102Other and eliminations (12,234) (11,232) (13,828)Volvo Group total 223,968 257,207 258,427
1 Defi ned as Total assets less Interest-bearing fi nancial assets and Tax receivables.
Total shareholders’ equity and liabilities 2004 2005 2006
Operating liabilities, excluding Financial Services:1 Trucks 55,105 62,743 65,586Buses 3,324 4,728 4,565Construction Equipment 6,602 9,350 11,177Volvo Penta 1,620 1,820 2,111Volvo Aero 3,695 4,622 4,186Other 2,788 2,793 956Total operating liabilities excluding Financial Services 73,134 86,056 88,581
Financial liabilities 28,402 24,670 18,446Tax liabilities 1,608 2,578 4,624Total liabilities in Financial Services 63,193 76,214 74,399Other and eliminations (12,524) (11,071) (14,811)Total liabilities 153,813 178,447 171,239
Shareholders’ equity 70,155 78,760 87,188Volvo Group total 223,968 257,207 258,427
1 Defi ned as Total liabilities less shareholders equity, fi nancial liabilities and tax liabilities.
Financial information 2006 107

108 Financial information 2006
The Volvo Group
Notes to consolidated financial statements
Investments in associated companies 2004 2005 2006
Trucks 37 47 5,498Buses 20 35 43Construction Equipment – – –Volvo Penta – – –Volvo Aero 37 3 1Financial Services 172 23 24Other 647 87 228Volvo Group total 913 195 5,794
Trucks 2006 includes investment in Nissan Diesel of SEK 5,445 M.
Capital expenditures 2004 2005 2006
Trucks 5,030 7,190 6,260Buses 176 250 263Construction Equipment 1,158 906 1,580Volvo Penta 297 243 248Volvo Aero 801 904 843Other 237 762 402Volvo Group excl Financial Services 7,699 10,255 9,596
Financial Services 4,784 386 999Reclassifi cation Group versus segment Financial Services – 4,210 3,439Volvo Group total 12,483 14,851 14,034
Reporting by geographical segment
Net sales 2004 2005 2006
Europe 119,077 124,023 138,342North America 54,769 69,743 74,928South America 7,338 12,479 13,159Asia 20,789 22,699 19,655Other markets 9,103 11,615 12,751Volvo Group total* 211,076 240,559 258,835
*of which: Sweden 14,606 15,334 13,805United States 45,926 59,254 61,793France 26,900 27,610 31,155
Total assets 2004 2005 2006
Sweden 79,578 86,865 81,173Europe excluding Sweden 77,909 86,530 91,163North America 48,165 60,846 58,444South America 6,526 10,131 10,766Asia 7,757 9,460 11,512Other markets 4,033 3,375 5,369Volvo Group total 223,968 257,207 258,427
Capital expenditures 2004 2005 2006
Sweden 3,690 5,935 3,970Europe excluding Sweden 6,305 5,770 7,395North America 1,835 2,451 1,851South America 247 296 280Asia 362 259 421Other markets 44 140 117Volvo Group total 12,483 14,851 14,034
Note 8 Other operating income and expenses
2004 2005 2006
Gains/losses on currency related forward and options contracts 828 (566) 481Exchange rate differences on trade receivables and payables (86) 481 (825)Gains/losses on divestment of group companies 69 697 286Change in allowances and write offs for doubtful receivables, customer fi nancing (545) (460) (189)Change in allowances, and write offs for doubtful receivables, other 37 (133) (273)Expenses for industrial relocation of Renault Trucks Villaverde plant in Spain (470) – –Expenses for closing Volvo Buses Heilbronn plant in Germany – (95) –Expenses for closing Volvo operations in Bromma, Sweden – – (258)Volvo profi t sharing program (200) (419) (444)Adjustment of goodwill in the subsidiary Mack Trucks – – (1,712)Other income and expenses (250) (93) (532)Total (618) (588) (3,466)

Note 10 Income from other investments
Dividends received 2004 2005 2006
Holdings of Volvo Technology Transfer1 – 11 –Other 11 2 2Subtotal 11 13 2
Revaluation and write downs of shares Scania AB 915 – –Henlys Group Plc (95) – –Holdings of Volvo Technology Transfer1 (13) – (7)Smith Land & Improvement (SABA Holding) (22) – –Other (8) (2) 11Subtotal 777 (2) 4
Gain (loss) on divestment of shares Holdings of Volvo Technology Transfer1 1 40 130Bilia AB 24 – –Other 17 (14) 5Subtotal 42 26 135Total 830 37 141
1 A Volvo venture-capital company.
Note 9 Income from investments in associated companies
Income/loss 2004 2005 2006
Nissan Diesel – – 39JV Fonderie Venissieux 5 9 (12)Aviation Lease Finance 27 6 –Thomas Hardie Commercials Ltd 8 5 3Merkavim Metal Works Ltd 1 4 10Peach County Holdings – (103) –Other companies (12) (1) 15Subtotal 29 (80) 55
Revaluation and write-down of shares Peach County Holding – (550) –Other companies (2) (2) (2)Subtotal (2) (552) (2)
Gains (losses) on sale of shares in associated companies Aviation Lease Finance – 71 –Other companies – 4 8Subtotal 0 75 8Total income (loss) from investments in associated companies 27 (557) 61
Income from investments in associated companies are specifi ed below:
Note 11Other fi nancial income and expenses
SEK M 2004 2005 2006
Financial instruments at fair value through profi t or loss – 251 (61)Exchange rate gains and losses on fi nancial assets and liabilites (1) (20) (52)Financial income and expenses related to taxes – 56 (22)Write-down pertaining to the restructuring of Henleys Group Plc (1,196) – –Costs for Treasury function, credit facilities, etc (13) (106) (46)Total (1,210) 181 (181)
Financial information 2006 109

110 Financial information 2006
The Volvo Group
Note 12 Income taxes
Income taxes were distributed as follows:
2004 2005 2006
Current taxes relating to the period (1,854) (2,568) (4,559)Adjustment of current taxes for prior periods 288 147 176Deferred taxes originated or reversed during the period (1,662) (2,933) (2,116)Recognition and derecognition of deferred tax assets 99 446 2,518Total income taxes (3,129) (4,908) (3,981)
Provisions have been made for estimated tax charges that may arise as a result of prior tax audits in the Volvo Group. Volvo evaluates tax processes on a regular basis and makes provisions for possible out-come when it is probable that Vovo will have to pay more taxes and when it is possible to make a reasonably assessment of the possible outcome. Tax claims for which no provision has been deemed neces-sary of approximately 983 (695; 1,433) were reported as contingent liabilities.
Deferred taxes relate to income taxes payable or recoverable in future periods in respect of taxable temporary differences, deduct-ible temporary differences, unused tax loss carryforwards or unused tax credit carryforwards. Deferred tax assets are recognized to the extent that it is probable that the amount can be utilized against future taxable income. At December 31, 2006, the valuation allow-ance attributable to deductible temporary differences, unused tax loss carryforwards and unused tax credit carryforwards for which no deferred tax asset was recognized amounted to 213 (2,972; 2,592).
Deferred taxes of 265 (negative 129; -) have at December 31, 2006, been accounted for as a direct reduction of equity. It is related to fair value of derivative instruments
At year-end 2006, the Group had unused tax loss carryforwards of about 5,900 (6,100; 10,100). These loss carryforwards expire according to the table below.Due date 2004 2005 2006
Within 1 year 200 400 500Within 2 years 700 500 100Within 3 years 600 100 100Within 4 years 300 300 0Within 5 years 200 100 200After 6 years 8,100 4,700 5,000Total 10,100 6,100 5,900
The Swedish corporate income tax rate is 28%. The table below shows the principal reasons for the difference between this rate and the Group’s tax rate, based on income after fi nancial items.
2004, % 2005, % 2006, %
Swedish corporate income tax rates 28 28 28Difference in tax rate in various countries 3 3 2Capital gains (3) (1) 0Other non-taxable income (3) (1) (1)Other non-deductible expenses 2 1 4Adjustment of current taxes for prior years (2) (1) (1)Recognition and derecognition of deferred tax assets (1) (2) (12)Other, net 0 0 0
Income tax rate for the Group 24 27 20
Reversal of reserve for deferred tax receivables During the third quarter, AB Volvo decided to reverse a valuation reserve for deferred tax receivables in the Mack Trucks subsidiary. The decision was based on the fact that Volvo assesses that the company has a long-term higher profi tability. Reporting of the deferred tax receivables reduced tax expenses in the income state-ment in the third quarter by 2,048. In accordance with prevailing accounting rules, Volvo adjusted goodwill by 1,712, which affected operating income adversely. The combined earnings effect for the third quarter was a positive 336.
Most of the valuation reserve for deferred tax receivables that was reported in Mack Trucks was attributable to the time of the acquisi-tion of Renault Trucks and Mack Trucks. In accordance with IAS 12, a reversal of valuation reserves attributable to an acquisition was adjusted against the earlier reported goodwill. In an acquisition, the acquired company’s assets and liabilities are valued at fair value. In the case that the purchase consideration exceeds the revalued net assets, goodwill is reported. Normally, a so-called acquisition bal-ance sheet is preliminary for 12 months during which period it may be changed in the case that another assessment is made in the net value of the assets. If a change occurs, a corresponding adjustment is made in goodwill. Changed assessments arising later are adjusted in the income statement but do not affect the goodwill value. An exception to this main rule is the case that a valuation reserve has been reported for deferred tax receivables. If such a valuation reserve is reversed at a later date, regardless of when in time, such a reversal shall be reported as if the deferred tax receivables value was reported at the time of the acquisition and that this value was included in the acquired company’s net assets. Consequently, this affects the original goodwill calculation. This means that in the item Other operating income and expenses, Volvo has reported an expense in the truck operations for the third quarter for adjustment of goodwill of 1,712. The Volvo Group’s earnings for the period were affected positively by 336.
Specifi cation of deferred tax assets and tax liabilities 2004 2005 2006
Deferred tax assets: Unused tax loss carryforwards 3,223 2,125 1,935 Other unused tax credits 259 295 248 Intercompany profi t in inventories 294 544 526 Valuation allowance for doubtful receivables 587 644 463 Provisions for warranties 966 1,449 1,357 Provision for residual value risks 544 576 398 Provisions for post-employment benefi ts 4,366 4,541 2,701 Provisions for restructuring measures 220 120 17 Fair value of derivative instruments: Change of hedge reserves – 224 3 Other deductible temporary differences 2,347 2,670 2,634Deferred tax assets before deduction for valuation allowance 12,806 13,188 10,282
Valuation allowance (2,592) (2,972) (213)Deferred tax assets after deduction for valuation allowance 10,214 10,216 10,069
Notes to consolidated financial statements

Financial information 2006 111
Note 13 Minority interests
Minority interests in income (loss) for the period and in shareholders’ equity consisted mainly of the minority interests in Volvo Aero Norge AS (22%), in Wuxi da Hao Power Co, Ltd (30%) and in Berliet Maroc S.A (30%).
Note 14 Intangible and tangible assets
Entrances fees, aircraft Product and Other Total engine software intangible intangibleIntangible assets, acquisition costs Goodwill1 programs development assets assets
Value in balance sheet 2004 10,321 2,758 8,585 1,734 23,398Value in balance sheet 2005 11,072 2,971 11,817 1,784 27,644Capital expenditures – 121 2,917 28 3,066Adjustment of goodwill (1,712) – – – (1,712)Sales/scrapping 0 (11) (203) (13) (227)Acquired and divested operations 3 0 0 0 (6) (6)Translation differences (420) 0 (257) (108) (785)Reclassifi cations and other (91) (168) 14 327 82Value in balance sheet 2006 8,849 2,913 14,288 2,012 28,062
Deferred tax liabilities: 2004 2005 2006
Accelerated depreciation on property, plant and equipment 2,047 2,347 2,514 Accelerated depreciation on leasing assets 815 1,297 1,226 LIFO valuation of inventories 160 217 182 Capitalized product and software development 1,445 1,970 2,113 Untaxed reserves 126 112 635 Fair value of derivative instruments: Change of hedge reserves – 95 268 Other taxable temporary differences 1,058 1,111 890Deferred tax liabilities 5,651 7,149 7,828Deferred tax assets, net 1 4,563 3,067 2,241
1 Deferred taxes are partially recognized in the balance sheet on a net basis after taking into account offsetting possibilities.
The cumulative amount of undistributed earnings in foreign subsid-iaries, which Volvo currently intends to indefi nitely reinvest outside of Sweden and upon which deferred income taxes have not been pro-vided is approximately 29 billion (17; 12) at year end. There are dif-ferent taxation rules depending on country, some which have no tax effect and some countries with withholding taxes. See note 36 how Volvo handles equity currency risk.
Entrances fees, aircraft Product and Other Total engine software intangible intangibleAccumulated depreciation and amortization Goodwill programs development assets assets
Value in balance sheet 2004 – 1,386 3,413 987 5,786Value in balance sheet 2005 – 1,437 4,690 1,096 7,223Depreciation and amortization – 128 1,584 138 1,850Write-downs – – 80 – 80Sales/scrapping – 0 (160) (12) (172)Acquired and divested operations 3 – 0 – (4) (4)Translation differences – 0 (72) (49) (121)Reclassifi cations and other – 164 (17) (58) 89Value in balance sheet 2006 – 1,729 6,105 1,111 8,945Net carrying value in balance sheet 2006 4 8,849 1,184 8,183 901 19,117

112 Financial information 2006
The Volvo Group
1 Includes on the date of IFRS adoption, acquisition costs of 14,184 and accumulated amortization of 3,863.
2 Machinery and equipment pertains mainly to production equipment. 3 Includes subsidiaries and joint ventures that previously were accounted for
according to the equity method.
4 Acquisition costs less accumulated depreciation, amortization and write-downs.
5 Of which is write-down 80 (72, 244).
Depreciation and amortization by type of asset 2004 2005 2006
Intangible assets 1,396 1,409 1,930Property, plant and equipment 4,182 4,370 4,494Assets under operating leases 4,425 4,115 4,247Depreciations excluding adjustment of goodwill 10,003 9,894 10,671Adjustment of goodwill – – 1,712Total 10,003 9,894 12,383
Capital expenditures by type of asset 2004 2005 2006
Intangible assets 2,287 3,473 3,066Property, plant and equipment 5,790 6,829 6,357Assets under operating leases 4,406 4,549 4,611Total 12,483 14,851 14,034
Capital expenditures for property, plant and equipment approved but not yet implemented at December 31, 2006, amounted to SEK 6.8 bil-lion (7.8).
Notes to consolidated financial statements
Construction in progress, Total Assets including property, under TotalAccumulated depreciation Land and land Machinery and advance plant and operating tangibleand amortization Buildings improvements equipment 2 payments equipment leases assets
Value in balance sheet 2004 6,732 441 24,557 – 31,730 11,465 43,195Value in balance sheet 2005 7,814 521 28,087 – 36,422 11,160 47,582Depreciation and amortization 5 704 46 3,744 – 4,494 4,247 8,741Sales/scrapping (498) (8) (1,976) – (2,482) (3,223) (5,705)Acquired and divested operations 3 (130) (9) (138) – (277) (224) (501)Translation differences (321) (31) (1,132) – (1,484) 168 (1,316)Reclassifi cations and other 23 8 (290) – (259) (2,474) (2,733)Value in balance sheet 2006 7,592 527 28,295 – 36,414 9,654 46,068Net carrying value in balance sheet 2006 4 10,992 3,920 16,399 3,068 34,379 20,501 54,880
Construction in progress, Total Assets including property, under TotalTangible assets, Land and land Machinery and advance plant and operating tangibleacquisition costs Buildings improvements equipment 2 payments equipment leases assets
Value in balance sheet 2004 16,928 3,988 39,530 2,435 62,881 30,999 93,880Value in balance sheet 2005 18,547 4,624 45,252 3,067 71,490 31,999 103,489Capital expenditures 1,031 175 3,941 1,210 6,357 4,611 10,968Sales/scrapping (483) (106) (2,618) 4 (3,203) (5,686) (8,889)Acquired and divested operations 3 (164) (3) (218) – (385) (593) (978)Translation differences (808) (201) (1,889) (164) (3,062) (1,202) (4,264)Reclassifi cations and other 461 (42) 226 (1,049) (404) 1,026 622Value in balance sheet 2006 18,584 4,447 44,694 3,068 70,793 30,155 100,948
“Reclassifi cations and other” mainly consist of “assets under operat-ing leases” related to legal sales transactions, where revenue is deferred and accounted for as operating lease revenue. Assets clas-sifi ed as inventory will, when the operating lease model is applied for revenue recognition, be classifi ed from “inventory” to “assets under operating leases”, when the legal sales transaction occurs. If the product is returned after the lease period, there will again be a
reclassifi cation from “assets under operating leases” to “inventory”. When a buy-back agreement has expired, but the related product is not returned, the acquisition cost and the accumulated depreciation are reversed in “reclassifi cation and other”, within the line item “assets under operating leases”. Some of the reclassifi cations within tangible assets relate to construction in progress, which are reclas-sifi ed to the respective category within property, plant and equipment.

Financial information 2006 113
Goodwill AB Volvo decided during the third quarter 2006 to reverse a valua-tion allowance for deferred tax receivables in the Mack Trucks subsidiary. The decision is based on the fact that Volvo assesses that the company has a long-term higher profi tability. Reporting of the deferred tax receivables reduced tax expenses in the income statement in the third quarter by 2,048. In accordance with prevail-ing accounting rules, Volvo adjusted goodwill by 1,712. The adjust-ment decreases book value of goodwill for the three truck brands with the same share that was used in the original allotment. The remaining deviation in book value compared to the previous year mainly consists of revaluation effects caused by differences in cur-rency rates.
Annually, in connection with the annual closing, or more frequently if required, Volvo’s operations are evaluated and compared with its carrying value in order to identify any impairment of goodwill assets. Volvo’s evaluation model is based on a discounted cash-fl ow model, with a forecast period of four years. Evaluation is made on cash-gen-erating units, identifi ed as Volvo’s operational areas or business areas. Goodwill assets are allocated to these cash generating units on the basis of anticipated future utility. The evaluation is based on management’s best judgment of the operations’ development. The basis for this judgment is long-term forecasts of the market’s growth, two to four percent, in relation to the development of Volvo’s operations. In the model, Volvo is expected to maintain stable capital effi ciency over time. The evaluation is made on nominal value and the general rate of infl ation, in line with the European target, is used. Volvo uses a discounting factor calculated to 12% before tax for 2006.
During 2006, the value of Volvo’s operations has exceeded the carrying value of goodwill for all operational areas, and accordingly, no impairment was recognized. For the specifi ed cash generating units Volvo has evaluated the value of goodwill with reasonable changed assumptions, negatively adjusted with one percentage point, where of no adjustment, individually, would have such a big effect that there would be an impairment.
Goodwill per Business Area 2005 2006
Volvo Trucks 4,096 3,129Renault Trucks 2,007 1,391Mack Trucks 982 592Buses 1,134 1,055Construction Equipment 2,480 2,329Other 373 353Total goodwill value 11,072 8,849
Investment propertyInvestment property is property owned for the purpose of obtaining rental income and/or appreciation in value. The acquisition cost of investment property was 1,633 (1,534; 1,859) at year-end. Capital expenditures during 2006 amounted to 81 (15; 20). Accumulated depreciation was 523 (463; 472) at year-end, whereof 55 (53; 68) during 2005. The estimated fair value of investment property was SEK 1,9 billion (1,9; 2,2) at year-end, based on the yield. The required return is based on current property market conditions for comparable properties in comparable locations. All investment prop-erties were leased out during the year. Net income for the year was affected by 281 (272; 332) in rental income from investment prop-erties and 50 (45; 66) in direct costs.

114 Financial information 2006
The Volvo Group
Notes to consolidated financial statements
Dec 31, 2004 Dec 31, 2005 Dec 31, 2006Group holdings of shares and Registration Percentage Carrying value Carrying value Carrying valueparticipations in non-Group companies number holding SEK M SEK M SEK M
Shares in associated companies, equity method of accounting Nissan Diesel – 19 – – 5,445Blue Chip Jet II HB, Sweden 969717–2105 50 – – 148Blue Chip Jet HB, Sweden 969639–1011 40 90 85 81Merkavim Metal Works Ltd, Israel – 27 20 26 34Diamond Finance Ltd, Great Britain – 40 – 23 24Thomas Hardie Commercials Ltd, Great Britain – 24 10 14 14Fonderie Venissieu, France – 49 15 21 23Quingdao Sunwin Bus Corp, China 21 – 9 9Arabian Vehicle & Truck Industry Ltd, Saudi Arabia – 25 9 9 9Peach County Holdings Inc, USA – 43 556 0 –Aviation Lease Finance, USA – 49 172 – –Småföretagarinvest AB (previously Arbustum Invest AB), Sweden – – 35 – –Other holdings 6 8 7Total shares and participations in associated companies in accordance with Group Balance Sheet 1 913 195 5,794
Shares and participations in other companies Deutz AG, Germany2 – 7 670 253 740Småföretagarinvest AB (previously Arbustum Invest AB), Sweden 556543–4247 17 – 32 14Other holdings 420 271 342Total shares and participations in other companies in accordance with Group Balance Sheet 1,090 556 1,096Total value of Group holdings of shares and participations in non-group companies 2,003 751 6,890
1 Volvo’s share of shareholders’ equity in associated companies (incl. equity in untaxed reserves) amounted to 5.794 (195; 913). Excess values amounted to 549 (0; 0).
2 Deutz AG is valued to market value as from January 1, 2005 according to IAS 39, more information note 1 Accounting principles and note 3 Effects of IFRS. The transition effect has been charged to equity.
Note 15 Shares and participations
The market values of Volvo’s holdings of shares and participations in listed companies as of December 31, 2006 are shown in the table below. As from 2005 shares in listed companies would be revaluated to current market value. The revaluation is booked to Equity and amounts to 392 (83; –).
Carrying value Market value
Nissan Diesel, common shares 1,952 1,341Nissan Diesel, preference shares 3,493 –Total holding in listed associated companies 5,445 1,341
Holding in non-listed associated companies 349 –Total holding in associated companies 5,794 1,341
Carrying value Market value
Deutz AG 740 740Total holdings in listed companies 740 740
Holdings in non-listed companies 1 356 –Total shares and participations in other companies 1,096 740
1 Unlisted shares, for which a reliable fair value cannot be determined, should be reported at the acquisition value reduced in appropriate cases by write-downs.
Nissan Diesel On March 21, AB Volvo acquired 40 million shares, corresponding to 13% of the shares, in the Japanese truck manufacturer Nissan Diesel from Nissan Motor for approximately SEK 1,5 billion, with an option on Nissan Motor’s remaining 6% within four years. During the third quarter, AB Volvo exercised its option to purchase an additional 6% of the shares in Nissan Diesel from Nissan Motor for approxi-
mately SEK 500 M. AB Volvo owned a total of 19% of the shares in the Japanese truck manufacturer at December 31, 2006. In addition, AB Volvo acquired all 57.5 million preference shares in Nissan Diesel from Nissan Motor and Japanese banks for a total of SEK 3.5 billion. The book value for the shares in Nissan Diesel was SEK 5.445 M at December 2006.

Financial information 2006 115
Note 16 Long-term customer-fi nancing receivables
2004 2005 2006
Installment credits 14,726 17,865 17,475Financial leasing 10,334 12,737 13,980Other receivables 127 582 634Total 25,187 31,184 32,089
Effective interest rate for Long-term customer fi nance receivables was 6.82% as per December 31, 2006.
Long-term customer fi nance receivables maturities 2008 14,2052009 9,6312010 5,4022011 1,9442012 or later 907Total 32,089
The holding is reported as an associated company, since Volvo believes that substantial infl uence exists. Executive Vice President of AB Volvo and Deputy CEO of the Volvo Group, Jorma Halonen, was appointed Vice Chairman of the Board of Directors of Nissan Diesel on June 28.
Volvo reports its share in earnings of Nissan Diesel with a time-lag of one quarter.
Please fi nd further information under Signifi cant events, page 47, regarding Volvo making a public offer for Nissan Diesel.
Deutz During 2006 Volvo has invested additionaly 95 in Deutz AG.
Peach County Holdings IncIn 2004, as a part of the restructuring of Henlys Group Plc, see note 11, the convertible debenture loan issued to Henlys was partly converted into shares in Peach County Holdings (owner of school
bus manufacturer Blue Bird). Volvo’s holding in Peach County Hold-ings Inc was 42,5%. During the fourth quarter of 2005 Volvo wrote down its shareholding in Peach County Holdings, Inc. by about 550. At December 31, 2005 Volvo held 42.5% of the US-based company. Since its reconstruction in the preceding year, Blue Bird has not developed well. The write-down was made as a consequence of Volvo’s decision not to participate in continued fi nancing efforts. After the write-down, the value is zero. In January 2006, Peach County Holdings entered into reconstruction proceedings (Chapter 11) and as a consequence of Volvo choosing not to participate in the continued reconstruction, Volvo’s shares in the company were can-celled.
Småföretagarinvest AB (previously Arbustum Invest AB)In 2005, Volvo’s holding in Småföretagarinvest AB decreased to 17% and the company is no longer considered as an associated company.
Changes in the Volvo Group’s holdings of shares and participations: 2004 2005 2006
Balance sheet, December 31, preceding year 22,206 2,003 751IFRS transition effect – (494) –Acquisitions and divestments, net (20,740) (268) 5,809Net of write-downs/revaluations 772 (552) (72)New issue of shares and shareholders’ contributions 45 28 45Share of income in associated companies 29 (80) 55Change in Group structure (280) (90) 0Fair value of shares – 83 392Translation differences (29) 159 (30)Dividends 0 (2) (3)Other 0 (36) (57)Balance sheet, December 31 2,003 751 6,890

116 Financial information 2006
The Volvo Group
Note 20 Other short-term receivables
2004 2005 2006
Accounts receivable 20,137 24,784 23,251Prepaid expenses and accrued income 2,514 2,502 2,263VAT receivables 1,561 1,933 2,280Loans to external parties 1,350 345 537Other fi nancial receivables 1 981 1,671 2,344Other receivables 3,321 4,229 3,724Total, after deduction of valuation allowances for doubtful accounts receivable 29,864 35,464 34,399
1 Market value fi nancial derivatives.
Notes to consolidated financial statements
Note 17 Other long-term receivables
2004 2005 2006
Other loans to external parties 720 348 300Prepaid pensions 364 524 2,041Other fi nancial receivables 672 1,514 1,394Other receivables 1,007 741 665Total 2,763 3,127 4,400
Note 19 Short-term customer-fi nancing receivables
2004 2005 2006
Installment credits 10,382 13,174 12,034Financial leasing 5,488 7,132 7,493Dealer fi nancing 8,850 12,067 11,703Other receivables 1,286 909 1,423Total 26,006 33,282 32,653
Effective interest rate for Short-term customer fi nance receivables was 6.59% as per December 31, 2006.
Note 18 Inventories
2004 2005 2006
Finished products 17,861 21,617 20,396Production materials, etc. 10,737 12,320 13,815Total 28,598 33,937 34,211
Inventories recognised as cost of sale during the period, 185,616 (172,567; 150,800).
Increase (decrease) in allowance for inventory obsolescence 2004 2005 2006
Balance sheet, December 31, preceding year 2,246 2,124 2,401Increase in allowance for inventory obsolescence charged to income 244 333 186Scrapping (226) (276) (169)Translation differences (85) 177 (130)Reclassifi cations, etc. (55) 43 (273)Balance sheet, December 31 2,124 2,401 2,015

Financial information 2006 117
Note 21 Marketable securities
Marketable securities consist mainly of interest-bearing securities, distributed as shown below:
2004 2005 2006
Government securities 6,354 4,226 2,169Banks and fi nancial institutions 371 464 7,101Real estate fi nancial institutions 19,220 24,020 11,072Other 10 124 –
Total 25,955 28,834 20,342
Note 22 Cash and cash equivalents
2004 2005 2006
Cash in banks 5,787 5,652 6,702Time deposits in banks 3,004 2,461 4,055Total 8,791 8,113 10,757
Note 23 Shareholders’ equity
The share capital of the Parent Company is divided into two series of shares: A and B. Both series carry the same rights, except that each Series A share carries the right to one vote and each Series B share carries the right to one tenth of a vote. The shares quota value is SEK 6.00.
Total share capital by year end 2004 amounted to 2,649 and was based on 441,520,885 registered shares. During 2005 share capital was reduced by 95 through cancellation without repayment of
3,084,619 Series A shares and 12,752,222 Series B shares. After reduction share capital amounts to 2,554 and is based on 425,684,044 registered shares.
Cash dividend decided by the Annual General Meeting 2006 was SEK 16.75 (12.50; 8.00) per share or total 6,775 (5,055; 3,356).
Unrestricted equity in the Parent Company at December 31, 2006 amounted to 39,345 (41,220; 44,075).
Change of valuation allowances for doubtful accounts receivable 2004 2005 2006
Balance sheet, December 31, preceding year 932 837 906Change of valuation allowance charged to income (30) 2 144Utilization of valuation allowance related to actual losses (174) (90) (108)Acquired and divested operations 1 9 45Translation differences 17 95 (39)Reclassifi cations, etc. 91 53 (9)Balance sheet, December 31 837 906 939

118 Financial information 2006
The Volvo Group
Notes to consolidated financial statements
Earnings per shareEarnings per share is calculated as income for the period, attribut-able to the Parent Company’s shareholders, divided by the Parent Company’s average number of shares outstanding for the fi scal year. Diluted earnings per share is calculated as income for the period attributable to the Parent Company’s shareholders divided by the average number of shares outstanding plus the average number of shares that would be issued as in effect of ongoing share-based incentive programs and employee stock option programs. If during the year there were potential shares redeemed or expired during the period, these are also included in the average number of shares used to calculate the earnings per share after dilution. To the extent that employee stock options are not fully earned, the average price of the share is adjusted.
The share-based incentive program creates a dilution effect when the non-market-based fi nancial goals are achieved for the fi scal year. Similarly, the employee stock option program creates a dilution effect by taking into account the difference between the exercise price and the share’s average market price to determine how many shares that are assumed to be issued without any payment. It is solely this number of shares that have an effect on the calculated diluted earnings. The number of shares that this value symbolizes is less than the total potential number of shares attributable to the employee stock option program.
Available forChange in other reserves Hedgereserve sale-reserve Total
Balance at January 1, 2006 (411) 83 (328)Fair value gains in year 2,583 – 2,583Tax on fair value gains (723) – (723)Transfers to income (1,122) – (1,122)Tax on transfers to income statement 314 – 314Change in fair value of commodity contracts (53) – (53)Fair value adjustments regarding holding in Deutz – 392 392Fair value adjustments regarding holding in Nissan Diesel – (9) (9)Other (67) – (67)Balance at December 31, 2006 521 466 987
2005 2006
Number of shares, December 31, in millions 404.5 404.8Average number of shares before dilution in millions 405.2 404.7Average number of shares after dilution in millions 405.9 405.0Average share price, SEK 319,11 391,94
Net income attributable to Parent Company shareholders 13,054 16,268Basic earnings per share 32.22 40.20Diluted earnings per share 32.16 40.17
Dilution effect, number of shares Share-based incentive program 166,250 72,583Employee stock option program 459,241 242,900Number of potential shares, December 31 625,491 315,483
The share-based incentive program is implemented if certain non-market based fi nancial goals are fulfi lled partly or wholly. The requirement for 2006 was met and creates a dilution effect amount-ing to 72,583 shares. The employee stock option program create a dilution effect amounting to 242,900 shares. In this case, the differ-ence between the exercise price and the share’s average value under the actual period has been taken into account. No other trans-actions have occurred that affected, or will have an effect on, the compilation of the reported share capital.
Information regarding shares 2004 2005 2006
Own Series A shares 7,075,246 4,145,627 4,145,627Own Series B shares 24,315,797 17,074,908 16,739,827Total own shares 31,391,043 21,220,535 20,885,454
Own shares in % of total registered shares 7,1 5,0 4,9
Outstanding Series A shares 131,529,699 131,374,699 131,374,699Outstanding Series B shares 278,600,143 273,088,810 273,423,891Total outstanding shares 410,129,842 404,463,509 404,798,590
Total registered Series A shares 138,604,945 135,520,326 135,520,326Total registered Series B shares 302,915,940 290,163,718 290,163,718Total registered shares 441,520,885 425,684,044 425,684,044
Average number of outstanding shares 418,528,078 405,242,037 404,663,051
Changes in outstanding Volvo shares Balance December 31, 2005 404,463,509Share-based incentive program 335,081 404,798,590
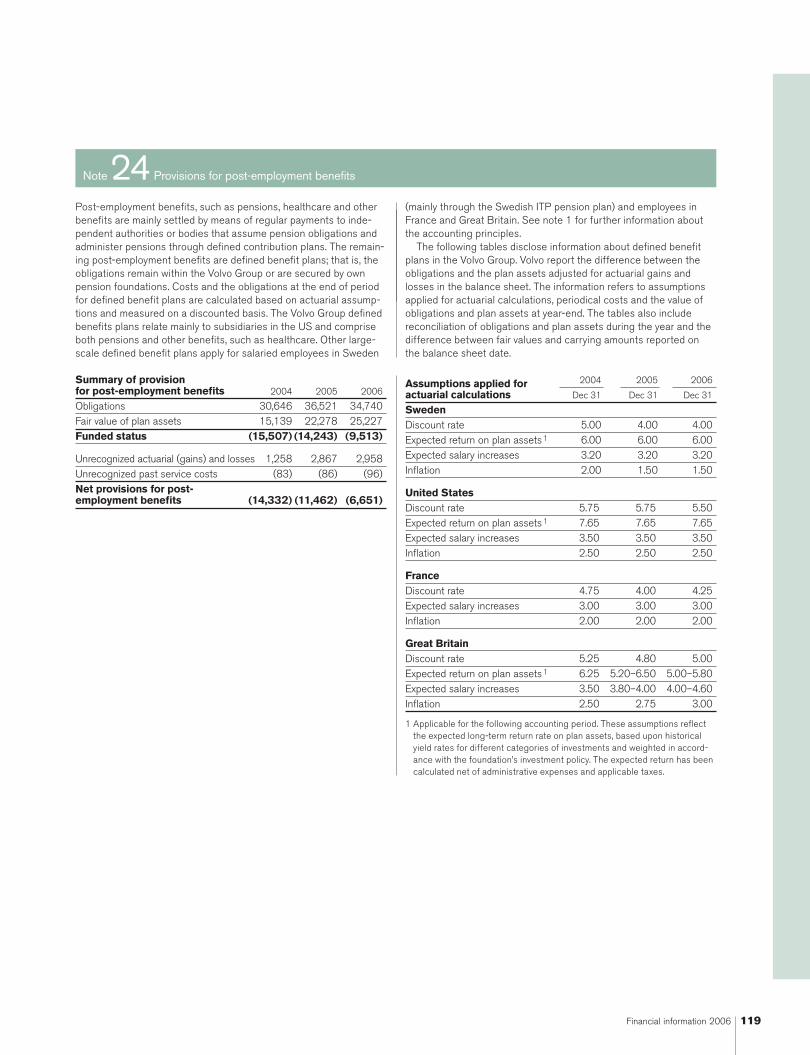
Financial information 2006 119
Note 24 Provisions for post-employment benefi ts
Post-employment benefi ts, such as pensions, healthcare and other benefi ts are mainly settled by means of regular payments to inde-pendent authorities or bodies that assume pension obligations and administer pensions through defi ned contribution plans. The remain-ing post-employment benefi ts are defi ned benefi t plans; that is, the obligations remain within the Volvo Group or are secured by own pension foundations. Costs and the obligations at the end of period for defi ned benefi t plans are calculated based on actuarial assump-tions and measured on a discounted basis. The Volvo Group defi ned benefi ts plans relate mainly to subsidiaries in the US and comprise both pensions and other benefi ts, such as healthcare. Other large-scale defi ned benefi t plans apply for salaried employees in Sweden
(mainly through the Swedish ITP pension plan) and employees in France and Great Britain. See note 1 for further information about the accounting principles.
The following tables disclose information about defi ned benefi t plans in the Volvo Group. Volvo report the difference between the obligations and the plan assets adjusted for actuarial gains and losses in the balance sheet. The information refers to assumptions applied for actuarial calculations, periodical costs and the value of obligations and plan assets at year-end. The tables also include reconciliation of obligations and plan assets during the year and the difference between fair values and carrying amounts reported on the balance sheet date.
Assumptions applied for 2004 2005 2006 actuarial calculations Dec 31 Dec 31 Dec 31
Sweden Discount rate 5.00 4.00 4.00Expected return on plan assets 1 6.00 6.00 6.00Expected salary increases 3.20 3.20 3.20Infl ation 2.00 1.50 1.50
United States Discount rate 5.75 5.75 5.50Expected return on plan assets 1 7.65 7.65 7.65Expected salary increases 3.50 3.50 3.50Infl ation 2.50 2.50 2.50
France Discount rate 4.75 4.00 4.25Expected salary increases 3.00 3.00 3.00Infl ation 2.00 2.00 2.00
Great Britain Discount rate 5.25 4.80 5.00Expected return on plan assets 1 6.25 5.20–6.50 5.00–5.80Expected salary increases 3.50 3.80–4.00 4.00–4.60Infl ation 2.50 2.75 3.00
1 Applicable for the following accounting period. These assumptions refl ect the expected long-term return rate on plan assets, based upon historical yield rates for different categories of investments and weighted in accord-ance with the foundation’s investment policy. The expected return has been calculated net of administrative expenses and applicable taxes.
Summary of provision for post-employment benefi ts 2004 2005 2006
Obligations 30,646 36,521 34,740Fair value of plan assets 15,139 22,278 25,227Funded status (15,507) (14,243) (9,513)
Unrecognized actuarial (gains) and losses 1,258 2,867 2,958Unrecognized past service costs (83) (86) (96)Net provisions for post-employment benefi ts (14,332) (11,462) (6,651)

120 Financial information 2006
The Volvo Group
Notes to consolidated financial statements
Pension costs 2004 2005 2006
Current year service costs 616 788 870Interest costs 1,306 1,315 1,285Expected return on plan assets (931) (1,133) (1,359)Actuarial gains and losses 1 (17) (107) 48Past service costs – Unvested 7 (4) (56)– Vested 38 (20) 0Curtailments and settlements (28) (362) (28)Termination benefi ts 729 124 135Pension costs for defi ned benefi t plans 1,720 601 895
Pension costs for defi ned contribution plans 2,681 3,135 2,844Total pension costs 4,401 3,736 3,739
1 For each plan, actuarial gains and losses are reported as income or expenses, when the accumulated amount exceeds the so called corridor. The income or expenses are then recognized over the expected average remaining service period of the employees.
Costs for post-employment benefi ts other than pensions 2004 2005 2006
Current year service costs 196 188 132Interest costs 349 323 348Expected return on plan assets (12) (15) (4)Actuarial gains and losses 1 6 1 1Past service costs – Unvested (1) (1) (9)– Vested 5 4 (17)Curtailments and settlements – – 3Termination benefi ts 47 24 8Total costs for post-employment benefi ts other than pensions 590 524 462
1 For each plan, actuarial gains and losses are reported as income or expenses, when the accumulated amount exceed the so called corridor. The income or expenses are then recognized over the expected average remaining service period of the employees.
An increase of one percentage point per year in healthcare costs would change the accumulated post-employment benefi t obligation as of December 31, 2006 by approximately 193, and the post-employment benefi t expense by approximately 18. A decrease of one percentage point would decrease the accumulated value of obliga-
tions by about 164 and reduce costs by approximately 15. Calcula-tions made as of December 31, 2006 show an annual increase of 10% in the weighted average per capita costs of covered healthcare benefi ts; it is assumed that the percentage will decline gradually to 5% and then remain at that level.
United Great US Sweden States France Britain Other OtherObligations in defi ned benefi t plans Pensions Pensions Pensions Pensions benefi ts plans Total
Obligations at January 1, 2004 5,332 10,707 2,333 2,986 6,278 1,595 29,231Acquisitions, divestments and other changes 140 – (85) 138 – – 193Current year service costs 176 206 19 82 193 136 812Interest costs 280 668 115 172 348 72 1,655Unvested past service costs – 3 (66) – – – (63)Vested past service costs (46) 66 – – – 22 42Termination benefi ts 88 – 205 – – 483 776Curtailments and settlements (35) (5) – – – 35 (5)Employee contributions – – – 30 – 1 31Actuarial (gains) and losses 573 683 74 215 364 39 1,948Exchange rate translation – (1,103) (19) (76) (576) 29 (1,745)Benefi ts paid (271) (704) (497) (101) (532) (124) (2,229)Obligations at December 31, 2004 6,237 10,521 2,079 3,446 6,075 2,288 30,646

Financial information 2006 121
United Great US Sweden States France Britain Other OtherObligations in defi ned benefi t plans Pensions Pensions Pensions Pensions benefi ts plans Total
Acquisitions, divestments and other changes (125) 81 – – 6 (1) (39)Current year service costs 203 304 37 80 184 169 977Interest costs 303 637 97 195 321 83 1,636Unvested past service costs – 3 – (12) – – (9)Vested past service costs (72) 44 – – 1 11 (16)Termination benefi ts 104 – – – – 44 148Curtailments and settlements (371) – – – – – (371)Employee contributions – – – 34 – (2) 32Actuarial (gains) and losses 810 281 (12) 714 (66) 151 1,878Exchange rate translation – 2,171 92 287 1,222 238 4,010Benefi ts paid (248) (763) (435) (109) (592) (224) (2,371)Obligations at December 31, 2005 6,841 13,279 1,858 4,635 7,151 2,757 36,521
of which Funded defi ned benefi t plans 6,342 12,962 – 4,135 3,772 1,744 28,955
Acquisitions, divestments and other changes (54) – 14 – (44) 301 217Current year service costs 248 246 41 103 104 190 932Interest costs 277 686 70 220 345 92 1,690Unvested past service costs – 6 2 – (8) – –Vested past service costs 4 – 8 – (17) 6 1Termination benefi ts 122 – – – – (2) 120Curtailments and settlements (146) (15) (4) – 1 (1) (165)Employee contributions – – – 33 – – 33Actuarial (gains) and losses 113 437 10 173 201 44 978Exchange rate translation – (1,844) (69) (86) (962) (213) (3,174)Benefi ts paid (263) (778) (359) (91) (572) (350) (2,413)Obligations at December 31, 2006 7,142 12,017 1,571 4,987 6,199 2,824 34,740
of which Funded defi ned benefi t plans 6,560 11,830 – 4,451 3,978 1,996 28,815
United Great US Sweden States France Britain Other OtherFair value of plan assets in funded plans Pensions Pensions Pensions Pensions benefi ts plans Total
Plan assets at January 1, 2004 3,592 6,727 – 2,254 111 1,062 13,746Acquisitions, divestments and other changes 129 15 – 114 – 18 276Expected return on plan assets 217 517 – 151 12 46 943Actuarial gains and (losses) 141 174 - 73 (10) 5 383Employer contributions – 1,153 – 83 106 105 1,447Employee contributions – – – 30 – 1 31Exchange rate translation – (730) – (55) (20) 1 (804)Benefi ts paid – (693) – (98) – (92) (883)Plan assets at December 31, 2004 4,079 7,163 – 2,552 199 1,146 15,139
Acquisitions, divestments and other changes (97) (35) – (13) – 4 (141)Expected return on plan assets 294 604 – 166 15 69 1,148Actuarial gains and (losses) 461 (65) - 271 (9) 15 673Employer contributions 1,188 2,225 – 906 18 103 4,440Employee contributions – – – 78 – 8 86Exchange rate translation – 1,577 – 220 37 147 1,981Benefi ts paid – (741) – (108) (70) (129) (1,048)Plan assets at December 31, 2005 5,925 10,728 – 4,072 190 1,363 22,278

122 Financial information 2006
The Volvo Group
Notes to consolidated financial statements
Plan assets by category 2006 %
Shares and participation, Volvo 51 0Shares and participations, other 12,709 51Bonds 10,076 40Property 313 1Liquid funds etc. 2,078 8 25,227 100
Actuarial gains and losses 2006
Experience-based adjustments in obligation (530)Experience-based adjustments in plan assets 717Effects of changes in actuarial assumptions (448)Actuarial gains and (losses), net (261)
United Great US Sweden States France Britain Other OtherFair value of plan assets in funded plans Pensions Pensions Pensions Pensions benefi ts plans Total
Acquisitions, divestments and other changes – – – – – 164 164Expected return on plan assets 347 753 – 204 4 55 1,363Actuarial gains and (losses) 233 323 - 94 3 64 717Employer contributions – 2,858 – 646 38 181 3,723Employee contributions – – – 33 – 2 35Exchange rate translation – (1,674) – (78) (24) (130) (1,906)Benefi ts paid (111) (762) – (91) (72) (111) (1,147)Plan assets at December 31, 2006 6,394 12,226 – 4,880 139 1,588 25,227
United Great US Sweden States France Britain Other OtherNet provisions for post-employment benefi ts Pensions Pensions Pensions Pensions benefi ts plans Total
Funded status at December 31, 2004 (2,158) (3,358) (2,079) (894) (5,876) (1,142) (15,507)Unrecognized actuarial (gains) and losses 456 277 69 162 240 54 1,258Unrecognized past service costs – 2 (66) (3) (9) (7) (83)Net provisions for post-employment benefi ts at December 31, 2004 (1,702) (3,079) (2,076) (735) (5,645) (1,095) (14,332)
whereof reported as Prepaid pensions and other assets 2 166 – – 133 70 371Provisions for post-employment benefi ts (1,704) (3,245) (2,076) (735) (5,778) (1,165) (14,703)
Funded status at December 31, 2005 (916) (2,551) (1,858) (563) (6,961) (1,394) (14,243)Unrecognized actuarial (gains) and losses 755 770 223 592 326 201 2,867Unrecognized past service costs – 3 (67) (12) (12) 2 (86)Net provisions for post-employment benefi ts at December 31, 2005 (161) (1,778) (1,702) 17 (6,647) (1,191) (11,462)
whereof reported as Prepaid pensions and other assets – 145 – 35 253 91 524Provisions for post-employment benefi ts (161) (1,923) (1,702) (18) (6,900) (1,282) (11,986)
Funded status at December 31, 2006 (748) 209 (1,571) (107) (6,060) (1,236) (9,513)Unrecognized actuarial (gains) and losses 626 798 224 649 412 249 2,958Unrecognized past service costs – 8 (25) – (71) (8) (96)Net provisions for post-employment benefi ts at December 31, 2006 (122) 1,015 (1,372) 542 (5,719) (995) (6,651)
whereof reported as Prepaid pensions and other assets – 1,412 – 542 87 – 2,041Provisions for post-employment benefi ts (122) (397) (1,372) – (5,806) (995) (8,692)

Financial information 2006 123
Note 26 Non-current liabilities
The listing below shows the Group’s non-current liabilities in which the largest loans are distributed by currency. Most are issued by Volvo Treasury AB. Information on loan terms is as of December 31,
2006. Volvo hedges foreign-exchange and interest-rate risks using derivative instruments. See Note 36.
Effective interest, Bond loans Actual interest rate, % rate, Dec 31, 2006, % 2004 2005 2006
GBP 2004/2006 5.18 – 1,905 – –SEK 1999–2006/2008–2011 2.50–5.20 3.77–7.27 4,798 4,931 8,973JPY 2001–2005/2008–2011 0.42–1.50 0.85–1.34 542 475 231CZK 2003–2005/2008–2010 2.69–4.50 2.88–3.19 380 400 389USD 1998–2006/2008 5.00–5.98 4.97–5.33 2,150 1,788 1,614EUR 1997–2006/2008–2011 3.56–6.12 2.49–4.10 17,546 19,928 11,623NOK 2006/2008 3.59 4.40 – – 329Other bond loans 291 48 20Total 27,612 27,570 23,179
Volvo’s pension foundation in Sweden was formed in 1996 to secure obligations relating to retirement pensions for salaried employees in Sweden in accordance with the ITP plan (a Swedish individual pen-sion plan). Plan assets amounting to 2,456 was contributed to the foundation at its formation, corresponding to the value of the pen-sion obligations at that time. Since its formation, net contributions of 1,420, whereof 0 during 2006, have been made to the foundation. The plan assets in Volvo’s Swedish pension foundation are invested in Swedish and foreign shares and mutual funds, and in interest-bearing securities, in accordance with a distribution that is deter-mined by the foundation’s Board of Directors. At December 31, 2006, the fair value of the foundation’s plan assets amounted to 6,394 (5,925; 4,079), of which 45% (58; 55) was invested in shares or mutual funds. At the same date, retirement pension obligations attributable to the ITP plan amounted to 6,560 (6,342; 5,366). Swedish companies can secure new pension obligations through balance sheet provisions or pension fund contributions. Furthermore, a credit insurance must be taken out for the value of the obligations. In addition to benefi ts relating to retirement pensions, the ITP plan also includes, for example, a collective family pension, which Volvo fi nances through insurance with the Alecta insurance company. According to an interpretation from the Swedish Financial Account-
ing Standards Council’s interpretations committee, this is a multi-employer defi ned benefi t plan. For fi scal year 2006, Volvo did not have access to information from Alecta that would have enabled this plan to be reported as a defi ned benefi t plan. Accordingly, the plan has been reported as a defi ned contribution plan. Alecta’s funding ratio is 143.1% (128.5; 128.0).
Volvo’s subsidiaries in the United States mainly secure their pen-sion obligations through transfer of funds to pension plans. At the end of 2006, the total value of pension obligations secured by pen-sion plans of this type amounted to 11,830 (12,962; 10,287). At the same point in time, the total value of the plan assets in these plans amounted to 12,226 (10,728; 7,163), of which 60% (60; 64) was invested in shares or mutual funds. The regulations for securing pen-sion obligations stipulate certain minimum levels concerning the ratio between the value of the plan assets and the value of the obli-gations. During 2006, Volvo contributed 2,858 (2,225; 1,153) to the pension plans in order to optimize Volvo’s capital structure.
During 2006 Volvo has made extra contributions to the pension-plans in Great Britain in the amount of 646 (906; 83).
In 2007, Volvo estimate to transfer an amount of not more than 1 billion Swedish kronor to pension plans.
Note 25 Other provisions
Value in Value in Provisions Acquired and Trans- Value in Whereof Whereof balance balance and divested lation Reclassi- balance due within due after sheet 2004 sheet 2005 reversals Utilization companies differences fi cations sheet 2006 12 months 12 months
Warranties 6,742 8,163 6,262 (5,789) (13) (530) 318 8,411 4,746 3,665Provisions in insurance operations 312 388 (26) – – – – 362 – 362Restructuring measures 571 372 174 (100) – (16) (1) 429 375 54Provisions for residual value risks 987 931 9 20 (22) (84) (73) 781 539 242Provisions for service contracts 1,512 1,623 394 (324) 4 (51) 31 1,677 928 749Other provisions 4,354 4,814 3,554 (3,588) (42) (382) 533 4,889 3,211 1,678Total 14,478 16,291 10,367 (9,781) (73) (1,063) 808 16,549 9,799 6,750

124 Financial information 2006
The Volvo Group
Notes to consolidated financial statements
Balance sheet amounts for Other current liabilities were as follows: 2004 2005 2006
Advances from customers 2,298 2,460 2,538Wages, salaries and withholding taxes 4,987 5,680 5,745VAT liabilities 1,193 1,351 1,292Accrued expenses and prepaid income 9,094 11,201 10,929Deferred leasing income 1,141 1,406 1,546Residual value liability 1,873 1,840 1,594Other fi nancial liabilities 642 1,762 814Other liabilities 3,863 4,562 3,253Total 25,091 30,262 27,711
Secured bank loans at year-end 2006 amounted to 157 (186; 194). The corresponding amount for other current liabilities was 1,294 (1,685; 1,578).
Note 27 Current liabilities
Balance sheet amounts for loans were as follows: 2004 2005 2006
Bank loans 4,267 5,204 4,475Other loans 1 17,129 26,126 23,772Total 21,396 31,330 28,247
1 Whereof fi nancial derivatives 147 (1,009; 612).
Bank loans include current maturities, 1,442 (2,243; 2,259), of long-term loans. Other loans include current maturities of long-term loans, 18,967 (18,983; 13,324), and commercial paper, 4,043 (5,413; 2,667).
Non-interest-bearing liabilities accounted for 67,591 (67,681; 57,657), or 70% (68; 73) of the Group’s total current liabilities.
Long-term loans mature as follows: 2008 18,3032009 8,9802010 5,6042011 4,4702012 6282013 or later 724Total 38,709
Of other long-term liabilities the majority will mature within fi ve years. At year-end 2006, credit facilities granted but not utilized and
which can be used without restrictions amounted to approximately SEK 23,2 billion (20,9; 19,1). Approximately SEK 22,8 billion of these facilities consisted of stand-by facilities for loans with varying maturities through the year 2013. A fee is normally charged for the unused portion of credit facilities and is reported in the income statement under other fi nancial income and expenses.
Actual interest rate, Effective interest, Other loans day of closing, % rate, Dec 31, 2006, % 2004 2005 2006
USD 1999–2005/2008–2011 4.07–5.75 4.98–5.23 5,360 6,193 4,466EUR 2003–2006/2008–2010 3.85–3.99 3.98–4.00 2,596 2,735 3,238GBP 2005–2006/2008–2010 5.62–5.67 5.43–5.47 1,269 1,859 1,048CAD 2002–2006/2008–2012 4.58–5.03 4.11–4.16 1,557 1,950 2,281MXN 2005/2010 7.54–7.91 7.37–7.38 – 835 693JPY 2006/2013 0.80 1.54 – – 654CHF 2006/2009–2011 2.22–2.24 2.63–2.80 – – 1,127Other loans 2.80-15.69 2,017 2,413 2,023Total other long-term loans 1 12,799 15,985 15,530Deferred leasing income 1,377 1,689 2,201Residual value liability 3,122 2,931 4,187Other long-term fi nancial liabilities - 476 123Other long-term liabilities 154 243 237Total 45,064 48,894 45,457
1 Whereof fi nancial derivatives 93 (394; 243).
Of the above long-term loans, 657 (1,501; 1,422) was secured.

Financial information 2006 125
Note 28 Assets pledged
2004 2005 2006
Property, plant and equipment – mortgages 205 593 310Assets under operating leases 1,665 1,700 609Chattel mortgages 374 350 367Receivables 319 360 576Inventories 13 16 –Cash, marketable securities 470 230 98Other assets pledged – 6 –Total 3,046 3,255 1,960
The liabilities for which the above assets were pledged amounted at year-end to 2,108 (3,372; 3,194).
Note 29 Contingent liabilities
2004 2005 2006
Credit guarantees – issued for associated companies 110 13 –– issued for customers and others 2,471 1,267 1,109Tax claims 1,433 695 983Other contingent liabilities 5,175 5,875 5,634Total 9,189 7,850 7,726
The reported amounts for contingent liabilities refl ect the Volvo Group’s risk exposure on a gross basis. The reported amounts have thus not been reduced because of counter guarantees received or other collaterals in cases where a legal offsetting right does not exist. At December 31, 2006, the estimated value of counter guar-antees received and other collaterals, for example the estimated net selling price of used products, amounted to 3,650 (4,479; 5,135).
Tax claims pertain to charges against the Volvo Group for which provisions are not considered necessary. Other contingent liabilities pertain mainly to residual value guarantees.
Legal proceedingsIn March 1999, an FH 12 Volvo truck was involved in a fi re in the Mont Blanc tunnel. The tunnel suffered considerable damage from the fi re, which continued for 50 hours. 39 people lost their lives in the fi re, and 34 vehicles were trapped in the tunnel. The Mont Blanc tunnel was re-opened for traffi c in 2002. An expert group was appointed by the Commercial Court in Nanterre, France, to investi-gate the cause of the fi re and the losses it caused. At present, it is not possible to anticipate the result of this on-going investigation or the result of other French legal actions in progress regarding the fi re. Following the closure in October 2003 of an investigation for potential criminal liability for the fi re, the trial for unintentional man-slaughter started in Bonneville (France) on 31st January, 2005 and lasted until late April 2005. The judgment was given on 27th July, 2005. Volvo Truck Corporation was one of 16 parties tried for unin-tentional manslaughter. Volvo Truck Corporation was acquitted and not required to pay any civil damages to the plaintiffs. Volvo Truck Corporation’s acquittal with regards to criminal charges is fi nal. Some of the plaintiffs have appealed the award of civil damages and those proceedings, hence, are ongoing. A claim was fi led with the Commercial Court in Nanterre by the insurance company employed
by the French tunnel operating company against certain Volvo Group companies and the trailer manufacturer in which compensation for the losses claimed to have been incurred by the tunnel operating company was demanded. The claimant requested that the Court postpone its decision until the expert group has submitted its report. The Court of Nanterre has since then declined jurisdiction in favor of the civil Court of Bonneville before which several other claims had been fi led in connection with this matter. As a result, the Court of Bonneville is likely ultimately to rule on all civil liability claims fi led in France against Volvo Group companies in connection with the Mont-Blanc tunnel fi re. Volvo Group companies are also involved in pro-ceedings regarding this matter before courts in Aosta and Turin (Italy) and Brussels (Belgium). Although the aggregate amount claimed is substantial, Volvo is unable presently to determine the ultimate outcome of the legal proceedings mentioned above, the only exception being the criminal charges mentioned above from which Volvo Truck Corporation has now been acquitted.
Between 1985 and 1995, Volvo Aero Norway A/S (“VAN”) and Snecma entered into several agreements relating to the supply by VAN of components for the Snecma CFM56 engine. These aircraft engine programs are long term agreements, with an expected term of not less than thirty years. In 2005, Snecma fi led a request for arbitration against VAN, requesting a declaratory award stating that Snecma is entitled to calculate VAN’s compensation under the agreements in other ways than the common and undisputed inter-pretation of the agreements during nearly twenty years of perform-ance. An award in Snecma’s favour would mean that the compensa-tion would be signifi cantly reduced. It is diffi cult to assess the magnitude of such a reduction of the concession levels since, instead of fi xed levels of payment, the levels of payment to VAN would be affected by the actual payments received by Snecma from its customers. VAN has no access to the commercial information needed to calculate the payment levels in such case. VAN has rejected Snecma’s claims. Arbitral hearings are expected to be fi nal-ized during the fi rst half of 2007.
Volvo has received a document subpoena from the United States Securities and Exchange Commission (the ”SEC”) in connection with the SEC’s investigation into the United Nations Oil For Food Pro-gram. Volvo is cooperating with this investigation. Volvo is also aware that the Swedish and French authorities are also separately investi-gating the Oil for Food program.

126 Financial information 2006
The Volvo Group
Notes to consolidated financial statements
Note 31 Leasing
Volvo as a leaseholder At December 31, 2006, future rental income from noncancellable fi nancial and operating leases (minimum leasing fees) amounted to 31,808 (34,406; 25,181). Future rental income is distributed as fol-lows:
Financial leases Operating leases
2007 8,725 3,9002008–2011 15,338 6,0912012 or later 281 344Total 24,344 10,335Allowance for uncollectible future rental income (425)Unearned rental income (2,446)Present value of future rental income related to noncancellable leases 21,473
Volvo as a lesseeAt December 31, 2006, future rental payments (minimum leasing fees) related to noncancellable leases amounted to 3,234 (4,396; 4,142).
Future rental payments are distributed as follows:
Financial leases Operating leases
2007 165 8412008–2011 186 1,5082012 or later 6 528Total 357 2,877
Rental expenses amounted to: 2004 2005 2006
Financial leases: Contingent rents (30) 0 0Operating leases: Contingent rents (27) (34) (38) Rental payments (910) (1,000) (1,468) Sublease payments 28 23 15Total (939) (1,011) (1,491)
Book value of assets subject to fi nance lease: 2004 2005 2006
Acquisition costs: Buildings 526 459 151Land and land improvements 66 75 72Machinery and equipment 236 198 114Assets under operating lease 1,065 875 888Total 1,893 1,607 1,225
Global actors like Volvo are occasionally involved in tax disputes of different proportions and in different stages. On a regular basis Volvo evaluates the exposure related to such disputes and, to the extent it is possible to reasonably estimate what the outcome will be, makes provisions when it is more likely than not that there will be additional tax to pay.
Volvo is involved in a number of other legal proceedings incidental to the normal conduct of its businesses. Volvo does not believe that any liabilities related to such proceedings are likely to be, in the aggregate, material to the fi nancial condition of the Volvo Group.
Note 30 Cash-fl ow
Other items not affecting cash pertain to risk provisions and losses related to doubtful receivables and customer-fi nancing receivables, 476 (602; 551), capital gains/losses on the sale of subsidiaries and other business units neg. 281 (neg. 717; pos. 95), unrealized exchange rate gains/losses on trade receivables and payables 143 (neg. 41; pos. 39), incentive program 258 write-down of shares in Peach County Holdings Inc in 2005 and in 2004 revaluation of shares in Scania AB and Henlys Group Plc amounting to – (550; neg. 820), provision for industrial relocation and contractual pension – (–; 530), IFRS transition effect – (–; neg. 177) and other 56 (21; neg. 58).
Net investments in customer-fi nancing receivables resulted in 2006 in a negative cash-fl ow of SEK 5.2 billion (7.8; 7.4). In this respect, liquid funds were reduced by SEK 26.0 billion (23.4; 19.4) pertaining to new investments in fi nancial leasing contracts and installment contracts.
Investments of shares and participations, net in 2006 amounted to a negativ cash-fl ow of SEK 5.8 billion (positive 0.3; positive 15.1), mainly related to the investment in Nissan Diesel. The net invest-ments in 2004 are mainly related to the sale of Volvo’s holding of B-shares in Scania.
Acquired and divested subsidiaries and other business units, net in 2006 amounted to SEK 0.5 billion (0.6; negative 0.1).
During 2006 interest-bearing receivables including marketable securities, net increased liquid funds by SEK 7.7 billion (decrease 1.3; decrease 6.4).
The change during the year in bonds and other loans decreased liquid funds by SEK 2.6 billion (increase 3.6; decrease 8.8). New borrowing during the year, mainly the issue of bond loans, provided SEK 69.3 billion (41.6; 19.1). Amortization during the year amounted to SEK 72.2 billion (33.4; 28.9).

Financial information 2006 127
Note 33 Government grants
During 2006, government grants amounting to 216 (173; 165) have been received, of which 141 (143; 137) has been accounted for in the income statement. The grants were mainly received from the European Commission and the Swedish government..
Note 34 Personnel
In accordance with a resolution adopted at the Annual General Meeting 2006, the fee paid to the Board of Directors was set at SEK 4,775,000, to be distributed among the members as follows: SEK 1,350,000 to the Chairman and a total of SEK 2,700,000 to the
other members; in addition, SEK 250,000 to the chairman of the Audit Committee and SEK 125,000 to other members of the Audit Committee and SEK 75,000 to each of the members of the Remu-neration Committee.
Fixed Variable Other Remuneration to senior executives, SEK salary salary benefi ts1 Pension4
Board Chairman 1,425,000 – – –CEO 11,354,968 5,527,560 2,067,434 14,625,220Other members of GEC 2 49,834,705 19,890,289 64,558,513 43,768,764Total remuneration and benefi ts 62,614,673 25,417,849 66,625,947 58,393,984Total costs3 80,243,527 32,494,979 85,581,958 70,140,948
1 Other benefi ts for the President and CEO includes SEK 1,460,000 related to allotted shares during 2006 and for other members of the GEC SEK 6,935,000 related to allotted shares and SEK 2,882,809 pertaining cash payments, for the GEC members not residing in Sweden, linked to the share-based incentive program. For GEC additional 49,432,538 is included for exercised employee stock options.
2 In addition to the CEO, the Group Executive Committee (GEC) comprised of 16 members at the end of the year.
3 Total costs for GEC include social fees on salaries and benefi ts, special pension tax and additional costs for other benefi ts. The cost for other bene-
fi ts includes cost earlier accounted for in previous years relating to the option and sharebased payment programs amounting to approximately SEK 60 M.
4 In the beginning of 2005 a previously announced one-time payment of SEK 34 M was made when Leif Johansson shifted over to a defi ned contribution based pension. SEK 20.8 M of this amount was reported as a cost in 2005, the remaining SEK 13.2 M is included above. For the time in 2006 after Leif Johansson’s became 55 years old have payments amounting to 1,425,220 for pension premiums been made.
Note 32 Transactions with related parties
The Volvo Group has transactions with some of its associated com-panies. The transactions consist mainly of sales of vehicles to deal-ers. Commercial terms and market prices apply for the supply of goods and services to/from associated companies.
2004 2005 2006
Sales to associated companies 279 381 156Purchase from associated companies 73 296 288Receivables from associated companies, Dec 31 174 206 40Liabilities to associated companies, Dec 31 70 65 39
Group holdings of shares in associated companies are presented in Note 15, Shares and participations.
The Volvo Group also has transactions with Renault SA and its sub-sidiaries. Sales to and purchases from Renault SA amounted to 336 (182; 277) and 4,031 (3,493; 3,242). Amounts due from and due to Renault SA amounted to 97 (57; 81) and 1,176 (762; 554) respect-ively, at December 31, 2006. The sales were mainly from Renault Trucks to Renault SA and consisted of components and spare parts. The purchases were mainly made by Renault Trucks from Renault SA and consisted mainly of light trucks. Renault Trucks has a license from Renault SA for the use of the trademark ”Renault”. During 2005, Renault Trucks received EUR 500,000 from Renault SA as compensation for a common development project.
During 2005, AB Volvo sold properties to market price to mem-bers in group management for an amount of 17. No similar trans-actions took place during 2006.
Accumulated depreciation: 2004 2005 2006
Buildings (56) (79) (49)Land and land improvements – – –Machinery and equipment (46) (39) (35)Assets under operating lease (518) (470) (609)Total (620) (588) (693)
Book value: 2004 2005 2006
Buildings 470 380 102Land and land improvements 66 75 72Machinery and equipment 190 159 79Assets under operating lease 547 405 279Total 1,273 1,019 532

128 Financial information 2006
The Volvo Group
Terms of employment of the CEOThe President and Chief Executive Offi cer, Leif Johansson, is en- titled to a fi xed annual salary. In addition, he may receive a variable salary based on operating income and cash fl ow up to a maximum of 50% of his fi xed annual salary. In 2006, the variable salary corres-ponded to 48.7% of the fi xed annual salary. Leif Johansson also participates in the Volvo Group long-term incentive program. In 2006, Leif Johansson received 4,000 shares, since the fi nancial goals for 2005 were achieved.
Leif Johansson’s pension benefi ts are a defi ned-contribution pen-sion, meaning that Leif Johansson’s pension will equal the sum of all premiums paid with the addition of possible return. A defi ned time for retirement does not exist. The pensionable salary consists of the current monthly salary times 12, Volvo’s internal value for company car, together with the average of the outcome of the variable salary, maximized to 50% of the salary, for the previous fi ve years. See point 4 above for premiums paid in 2006.
Leif Johansson has a six-month notice of termination on his own initiative and 12 months notice of termination from AB Volvo. Leif Johansson is not entitled to severance payments.
Variable salariesMembers of the Group Executive Committee and a number of senior executives receive variable salaries in addition to fi xed salaries. Variable salaries are in most cases based on the fulfi lment of certain improvement targets. The targets are decided by the Board of Direct-ors in AB Volvo and may relate to operating income and cash fl ow. A variable salary may amount to a maximum of 50% of the fi xed annual salary.
Severance paymentsThe employment contracts for members of the Group Executive Committee and certain other senior executives contain rules govern-ing severance payments when the company terminates the employ-ment. The rules provide that, when the company terminates the employment, an employee is entitled to severance pay equal to the employee’s monthly salary for a period of 12 or 24 month, depending on age at date of severance.
In agreements concluded after the spring of 1993, severance pay is reduced, in the event the employee gains employment during the severance period, in an amount equal to 75% of the income from new employment. In agreements concluded after the spring of 2004, severance pay is reduced by the full income from the new employ-ment. Furthermore, age limit at date of notice of termination is removed and an employee is, with few exceptions, entitled to sever-ance pay for a period of 12 months.
PensionsPrevious pension agreements for certain senior executives stipu-lated that early retirement could be obtained from the age of 60. The defi ned pension benefi ts are vested and earned gradually over the years up to the employee’s retirement age and are fully earned at age 60. During the period between ages of 60 and 65 the employee receives a pension equal to 70% of the pensionable salary.
Agreements for retirement at age 60 are no longer signed, and are instead replaced by a defi ned-contribution plan without a defi nite time for retirement. The premium constitutes 10% of the pension-able salary.
Earlier defi ned-benefi t pension plans, which entitled the employee to 50% of the pensionable salary after normal retirement age, have also been replaced by a defi ned-contribution plan. The premium constitutes of SEK 30,000 plus 20% of the pensionable salary over 30 income base amounts.
The pensionable salary consists of the current monthly salary times 12, Volvo’s internal value for company car, together with the average of the outcome of the variable salary, maximized to 50% of the salary, for the previous fi ve years.
Incentive programsVolvo currently has two different types of incentive programs for cer-tain senior executives outstanding, one program for employee stock options (exercised 2006/2008) and a share-based incentive pro-gram (allotment in 2007).
Employee stock options programThe period to exercise the employee stock options are ongoing as from May 2, 2006, up to and including May 1, 2008. The Volvo B share price, for options exercised during 2006, have in average been SEK 375 within a range from SEK 322 up to SEK 469.
Share-based incentive program In 2005 the Annual General Meeting approved a share-based incen-tive program for certain senior executives within the Volvo Group. Allotment of a value corresponding to 167,833 shares in the pro-gram was executed in April 2006 and was based on the fulfi llment of certain fi nancial goals determined by the Board for fi scal year 2005. The allotment was made from Volvo’s treasury stock, with 100,833, and cash payment corresponding to 67,000 shares. The share price at allotment was SEK 365. The total costs for the share-based incentive program 2005/2006 amounted to SEK 70 M, where of SEK 21 M during 2006 and SEK 49 M during 2005 and pertains to the costs for payments in shares and in cash. The Annual General Meeting in 2006 decided on a similar program for allotment in 2007. Allotment will be made in 2007 as certain fi nancial goals determined by the Board for fi scal year 2005 have been fulfi lled by the company. The cost for Volvo for the incentive program including social fees will be approximately SEK 248 M, since the price of the Volvo B shares at the grant date, excluding dividend of SEK 16.75 for 2006 and for 2007, was SEK 341.50 and the share price at December 31, 2006, was 471.50. The Annual General Meeting decided that Volvo’s own shares may be used for allotment in this program.
The Board of Directors intends to propose that the Annual Gen-eral Meeting approve a share-based incentive program for senior executives within the Volvo Group pertaining to the 2007 fi nancial year. The structure of the program corresponds to the programs approved by the Annual General Meetings in 2006. Accordingly, the program will result in the number of eligible senior executives (including members of Group Management) amounting to not more than to 240 persons and the maximum number of Volvo shares that may be allotted to 518,000, of which CEO Leif Johansson may receive a maximum of 8,000 shares and the other participants a maximum of 2,000–4,000 shares each. The number of shares to be allotted is proposed to depend upon the fulfi llment of certain fi nan-cial goals for the company, determined by the Board for the 2007 fi nancial year. Assuming the said goals are fulfi lled in full and that the Volvo share price is SEK 567 at implementation of the program, Volvo’s costs for the program, including social fees, will be about SEK 317 M. Another element of the proposal is that treasury shares held by AB Volvo may be used to fulfi l the company’s commitments in accordance with the program.
If the Annual General Meeting decides in accordance with the Board’s proposal of a 6-for-1 share split and an automatic redemp-tion procedure, the number of shares must be multiplied by fi ve. Those shareholders not residing in Sweden at the time of allotment of shares shall in lieu of shares receive a cash payment correspond-ing to the market value of the shares at the allotment date.
Notes to consolidated financial statements

Financial information 2006 129
Change in number of options per program Program Number of options 2000 2002
Dec 31, 2003 96,245 1,050,000Alloted – –Cancelled – (105,000)Exercised (96,245) –Dec 31, 2004 – 945,000Alloted –Cancelled (6,250)Exercised –Dec 31, 2005 938,750Alloted –Cancelled (5,000)Exercised (669,000)Dec 31, 2006 264,750
2003/2008 employeeFinancial instruments and shares stock options number Shares 1
Board Chairman – –CEO 50,000 8,000Other members of GEC 55,000 60,667Other senior executives 159,750 415,333Total 264,750 484,000
1 The table shows payments in cash with the corresponding value in shares. Of the total 484,000 shares, 267,667 shares and a cash-settlement corresponding to 216,333 shares will be granted.
Total number of outstanding options
Summary of Dec 31, Dec 31, Dec 31 Excercise Excercise Value/ Vesting,option programs Alloment date 2004 2005 2006 price period options years
Apr 28, 2000– 1998, call options 1 April 28, 2000 101,830 – – 302.12 Apr 27, 2005 55.75 n/a May 2, 2006– 2002, employee stock options 2 May 2, 2003 945,000 938,750 264,750 156.19 May 1, 2008 32.00 3
1 The options gives the holder the right to acquire one Series B Volvo share for each option held from a third party. The price of the options is based on market valuation by UBS Warburg. The options were fi nanced 50% by the company and 50% from the option holder’s variable salary.
2 In January 2000, a decision was made to implement a new incentive pro-gram for senior executives within the Volvo Group in the form of so-called employee stock options. The decision covers allotment of options for 2000, 2001 and 2002. The executives have not made any payment for the options. The employee stock options gives the holders the right to exercise their options or alternatively receive the difference between the actual price at that time and the exercise price determined at allotment. The theoretical value of the options at allotment was set using the Black & Scholes pricing model for options. For the options allotted in 2003, the Annual General
Meeting has decided that Volvo’s own shares may be used for the program. Recalculation has taken place of the exercise price and the number of shares each options entitles the option holder to acquire. The exercise price was previously SEK 163 per share and each option entitled the option holder to acquire one share. According to the terms and conditions of the option program, recalculation shall take place under certain circumstances such as extra dividends, issues of new shares and dividend of shares. At the AB Volvo Annual General Meeting in 2004, a decision was taken to distrib-ute shares in Ainax AB to Volvo’s shareholders. As a consequence hereof, a recalculation of the exercise price and the number of shares each option entitles the option holder to acquire has taken place. The new exercise price is SEK 156.19 per share and each option entitles the option holder to acquire 1.04363 Volvo B shares.
Cost for incentive programsChange in obligations related to the employee stock option pro-grams is recorded in the income statement. The cost for the employee stock option program amounted to SEK 58 M. The cost for the share-based incentive program 2005/2006 was SEK 21 M and for the share-based incentive program 2006/2007 SEK 166 M.
Total cost for the three programs was SEK 245 M for 2006 (192, 66). The cost for the incentive program includes both cash payments and costs for remuneration in shares, including social costs. At December 31, 2006, provision related to the employee stock option program and share-based incentive program amounted to SEK 219 M (277, 128).

130 Financial information 2006
The Volvo Group
2004 2005 2006 Wages, salaries of which of which of which and other Board and variable Other Board and variable Other Board and variable Otherremuneration, SEK M Presidents1 salaries employees Presidents1 salaries employees Presidents1 salaries employees
AB Volvo Sweden 33.4 11.6 106.3 42.8 9.8 97.9 33.4 11.2 170.8
Subsidaries Sweden 79.3 15.5 9,041.7 84.6 15.6 9,475.6 93.1 29.3 9,760.8Western Europe 442.3 10.9 8,905.3 436.0 6.3 9,267.6 442.0 8.0 9,380.7Eastern Europe 14.5 0.2 367.0 25.2 2.0 472.9 37.6 2.9 521.8North America 209.1 10.2 5,292.7 199.4 17.9 5,965.5 187.5 6.8 6,537.0South America 7.2 0.0 363.9 9.3 0.0 529.4 22.1 4.1 617.9Asia 49.9 0.7 724.9 58.9 1.0 957.2 56.7 1.7 1,053.7Other countries 12.7 0.0 394.5 26.7 0.0 467.5 28.6 0.9 481.7Group total 848.4 49.1 25,196.3 882.9 52.6 27,233.6 901.0 64.9 28,524.4
2004 2005 2006 Wages, salaries, other Wages, Wages, Wages, remuneration and salaries, Social of which salaries, Social of which salaries, Social of whichsocial costs, SEK M remunerations costs pens. costs remunerations costs pens. costs remunerations costs pens. costs
AB Volvo 2 139.7 80.7 48.7 140.7 78.6 46.7 204.2 141.6 104.9Subsidiaries 25,905.0 10,964.8 4,365.2 27,975.9 10,392.1 3,688.9 29,221.3 10,047.2 3.634,2Group total 3 26,044.7 11,045.5 4,413.9 28,116.6 10,470.7 3,735.6 29,425.5 10,188.8 3,739.1
1 Including current and former Board members, Presidents and Executive Vice Presidents.
2 The Parent Company’s pension costs, pertaining to Board members and Presidents are disclosed in Note 22 in the Parent Company.
3 Of the Group’s pension costs, 181.7 (125.5; 157.8) pertain to Board mem-bers and Presidents. The Group’s outstanding pension obligations to these individuals amount to 461.2 (573.8; 838.3).
The cost for non-monetary benefi ts in the Group amounted to 1,247.0 (1.055,9) of which 43.7 (47.6) to Board members and presi-dents.
The cost for non-monetary benefi ts in the Parent company amount to 10.1 (14.6) of which 1.3 (3.7) to Board members and presidents.
Notes to consolidated financial statements
2004 2005 2006 Number of of which Number of of which Number of of whichAverage number of employees employees women, % employees women, % employees women, %
AB Volvo Sweden 136 54 144 50 160 51
Subsidiaries Sweden 27,034 18 27,699 19 26,722 19Western Europe 26,325 14 25,894 14 26,380 15Eastern Europe 2,731 16 3,481 15 4,225 16North America 13,057 19 13,778 20 14,609 20South America 3,040 12 3,656 14 3,874 13Asia 4,114 16 4,273 15 4,075 15Other countries 1,759 11 2,259 12 2,255 12Group total 78,196 16 81,184 17 82,300 17
2004 2005 2006 Number at of which Number at of which Number at of whichBoard members and chief offi cers year-end women, % year-end women, % year end women, %
AB Volvo Board members 11 9 11 9 11 9CEO and GEC 17 6 17 6 17 6
Volvo Group Board members 1,017 15 1,010 10 939 11Presidents and other senior executives 1,276 16 1,305 16 1,422 15

Financial information 2006 131
Note 35 Fees to the auditors
Audit fees 2004 2005 2006
Audit fees to PricewaterhouseCoopers 78 78 130Audit fees to other audit fi rms 2 1 1Total 80 79 131
Other fees toPricewaterhouseCoopers Fees for audit related services 20 28 20Fees for tax services 16 17 14Total 36 45 34Fees and other remuneration to external auditors total 116 124 165
Auditing assignments involve examination of the annual report and fi nancial accounting and the administration by the Board and the President, other tasks related to the duties of a company auditor and consultation or other services that may result from observations noted during such examination or implementation of such other tasks. All other tasks are defi ned as other assignments.
Not 36 Goals and policies in fi nancial risk management
Apart from derivatives, Volvo’s fi nancial instruments consist of bank loans, fi nancial leasing contracts, accounts payable, accounts receiv-able, shares and participations, as well as cash and short-term investments.
The primary risks deriving from the handling of fi nancial instru-ments are interest-rate risk, currency risk, liquidity risk and credit risk. All of these risks are handled in accordance with an established fi nancial policy.
Interest-rate riskInterest-rate risk refers to the risk that changed interest-rate levels will affect consolidated earnings and cash fl ow (cash-fl ow risks) or the fair value of fi nancial assets and liabilities (price risks). Matching the interest-fi xing terms of fi nancial assets and liabilities reduces the exposure. Interest-rate swaps are used to change/infl uence the interest-fi xing term for the Group’s fi nancial assets and liabilities. Currency interest-rate swaps permit borrowing in foreign currencies from different markets without introducing currency risk. Volvo also has standardized interest-rate forward contracts (futures) and FRAs (forward-rate agreements). Most of these contracts are used to hedge interest-rate levels for short-term borrowing or investment.
Cash-fl ow risksThe effect of changed interest-rate levels on future currency and interest-rate fl ows refers mainly to the Group’s customer fi nancing operations and net fi nancial items. According to the Group’s policy, the degree of matching for interest-rate fi xing on borrowing and lending in the customer-fi nancing operations must exceed 80%. At year-end 2006, the degree of such matching was 100%. At year-end 2006, in addition to the assets in its customer-fi nancing oper-ations, Volvo’s interest-bearing assets consisted primarily of liquid assets invested in short-term interest-bearing securities. The object-ive is to achieve an interest-fi xing term of six months for the liquid assets in Volvo’s industrial operations through the use of derivatives. On December 31, 2006, after taking derivatives into account, the average interest on these assets was 3.5%. Apart from loans raised to fi nance the credit portfolio of the customer-fi nancing operations, at this same point in time, Volvo’s fi nancial liabilities consisted primar-ily of provisions for pensions and similar commitments. After taking derivatives into account, outstanding loans had interest terms corre-
sponding to an interest-rate fi xing term of six months and the aver-age interest at year-end amounted to 6.3%.
Price risksExposure to price risks as result of changed interest-rate levels refers to fi nancial assets and liabilities with a lower interest-rate fi xing term (fi xed interest). A comparison of the reported values and the fair val-ues of all of Volvo’s fi nancial assets and liabilities, as well as its derivatives, is given in Note 37, Financial instruments. After the tran-sition to IFRS 2005, the market values agree with the book values.
Assuming that the market interest rates for all currencies sud-denly rose by one percentage point (100 interest-rate points) over the interest-rate level on December 31, 2006, over a 12-month period, all other variables remaining unchanged, Volvo’s net interest income would be favorably impacted by 236. Assuming that the mar-ket interest rates for all currencies fell in a similar manner by one percentage point (100 interest-rate points) over the interest-rate level on December 31, 2006, over a 12-month period, all other vari-ables remaining unchanged, Volvo’s net interest income would be adversely impacted by a corresponding amount.
The following table shows the effect on earnings in Volvo’s key currencies that would result is the interest-rate level were to change by 1 percentage point.
SEK M Effect on earnings
SEK 314.9USD (1.0)EUR (17.1)CAD (9.2)JPY (8.8)KRW 13.1
It should be noted that the above sensitivity analysis is based on assumptions that rarely occur in reality. In reality, market interest rates usually do not rise or fall at any one point in time. Moreover, the sensitivity analysis also assumes a parallel shift in the yield curve and an identical effect of changed market interest rates on the inter-est-rates of both assets and liabilities. Consequently, the effect of actual interest-rate changes may deviate from the above analysis.

132 Financial information 2006
The Volvo Group
Notes to consolidated financial statements
The following table shows the reported values of the fi nancial assets as they mature. In all cases, these assets are exposed to an interest-rate risk.
Assets with Assets with Total fi nancialSEK M fi xed interest variable interest assets
2007 13,804 25,655 39,4592008–2009 75 1,523 1,5982010 and later 32 – 32 13,911 27,178 41,089
Excluding net receivable for pensions, SEK 2.032 M and interest-bearing assets held for sale, SEK 5 M.
Currency risksThe content of the reported balance sheet may be affected by changes in different exchange rates. Currency risks in Volvo’s oper-ations are related to changes in the value of contracted and expected future payment fl ows (commercial currency exposure), changes in the value of loans and investments (fi nancial currency exposure) and changes in the value of assets and liabilities in foreign subsidiaries (currency exposure of shareholders’ equity). The aim of Volvo’s cur-rency-risk management is to minimize, over the short term, negative effects on Volvo’s earnings and fi nancial position stemming from exchange-rate changes.
Commercial currency exposureIn order to hedge the value of future payment fl ows in foreign cur-rencies, Volvo uses forward contracts and currency options. Accord-ing to the Group’s currency policy, for each currency, 50–80% of the forecast net fl ow in the next six months is hedged and 30–60% for months seven to 12, while contracted fl ows after 12 months should normally not be hedged. A decision concerning changes in the Group’s currency policy has been made, effective 2007. For each currency, 75% of the forecast net fl ows for the coming six months are to be hedged and 50% for months seven to 12, while contracted fl ows after 12 months should normally be hedged. The nominal amount of all outstanding forward and option contracts amounted to SEK 57.2 billion at December 31, 2006. On the same date, the fair value of these contracts was positive in an amount of 764 (negative 732).
Assuming that at a certain time the Swedish krona appreciated by 10% against all foreign currencies, the fair value of outstanding con-tracts would amount to 3,252. If, instead, at a certain time the Swed-ish krona was devalued by 10%, the fair value of outstanding con-tracts would be negative in an amount of 1,724. In reality, currencies usually do not change in the same direction at any given time, so the actual effect of exchange-rate changes may differ from the above sensitivity analysis.
Financial currency exposureLoans and investments in the Group’s subsidiaries are done mainly through Volvo Treasury in local currencies, which minimizes individ-ual companies’ fi nancial currency exposure. Volvo Treasury uses vari-ous derivatives, in order to facilitate lending and borrowing in differ-ent currencies without increase the company’s own risk. The fi nancial net position of the Volvo Group is affected by exchange rate fl uctua-tions, since fi nancial assets and liabilities are distributed among Group companies that conduct their operations in different currencies.
Currency exposure of shareholders’ equityThe consolidated value of assets and liabilities in foreign subsidiar-ies is affected by current exchange rates in conjunction with transla-tion of assets and liabilities to Swedish kronor. To minimize currency exposure of shareholders’ capital, the size of shareholders’ equity in foreign subsidiaries is continuously optimized with respect to com-mercial and legal conditions. Currency hedging of shareholders’ equity may occur in cases where a foreign subsidiary is considered overcapitalized. Net assets in foreign subsidiaries and associated companies amounted at year-end 2006 to SEK 43.6 bn (33.7). Of this amount, SEK 3.6 bn (0.8) was currency-hedged through loans in foreign currencies. Out of the loans used as hedging instruments SEK 2.8 billion are due in 2010 and the remaining SEK 0.8 bllion in the need to undertake currency hedging relating to investments in associated companies and other companies is assessed on a case-by-case basis.
Credit risksVolvo’s credit provision is steered by Group-wide policies and cus-tomer-classifi cation rules. The credit portfolio should contain a sound distribution among different customer categories and indus-tries. The credit risks are managed through active credit monitoring, follow-up routines and, where applicable, product reclamation. More-over, regular monitoring ensures that the necessary provisions are made for uncertain receivables.
The credit portfolio of Volvo’s customer-fi nancing operations amounted at December 31, 2006, to approximately SEK 77 bn. The credit risk of this portfolio is distributed over a large number of retail customers and dealers. Collateral provided in the form of the fi nanced products. Credit provision aims for a balance between risk exposure and expected yield. The Volvo Group’s fi nancial assets are largely managed by Volvo Treasury and invested in the money and capital markets. All investments must meet the requirements of low credit risk and high liquidity. According to Volvo’s credit policy, coun-terparties for investments and derivative transactions should have a rating of A or better from one of the well-established credit rating institutions.
The use of derivatives involves a counterparty risk, in that a poten-tial gain will not be realized if the counterparty fails to fulfi ll its part of the contract. To reduce the exposure, master netting agreements are signed, wherever possible, with the counterparty in question. With future, counterparty risk exposure is limited through daily or monthly cash transfers corresponding to the value change of open contracts. The estimated gross exposure to counterparty risk relat-ing to futures, interest-rate swaps and interest-rate forward con-tracts, options and commodities contracts amounted at December 31, 2006, to 1,158 (891), 2,621 (2,468), 78 (51) and 25 (54).
Over and above the credit risk of derivatives, there is also credit risk in accounts receivable and receivables within Volvo’s sale fi nancing operations.
Liquidity risksVolvo assures itself of sound fi nancial preparedness by always keep-ing a certain percentage of its sales in liquid assets. A sound bal-ance between short- and long-term borrowing, as well as borrowing preparedness in the form of overdraft facilities, should cover long-term fi nancing needs.

Financial information 2006 133
Note 37 Financial instruments
The fi nancial assets treated within the framework of IAS 39 are clas-sifi ed either as
• fi nancial assets at fair value through profi t and loss• claims under a loan and receivables• investments held to maturity and• available-for-sale fi nancial assets
Transaction expenses are included in the asset’s fair value except in cases in which the change in value is recognized in the income statement. The transaction costs arising in conjunction with assum-ing fi nancial liabilities are amortized over the term of the loan as a fi nancial cost. Embedded derivatives are detached from the related main contract, if applicable. Contracts containing embedded deriva-tives are valued at fair value in the income statement if the contracts inherent risk and other characteristics indicate a close relation to the embedded derivative. Classifi cations made of fi nancial instruments are evaluated each quarter and, if necessary, the classifi cation is adjusted.
Purchases and sales of fi nancial assets and liabilities are recog-nized on the transaction date. A fi nancial asset is derecognized (extinguished) in the balance sheet when all signifi cant risks and benefi ts linked to the asset have been transferred to a third party.
The market value of assets is determined based on the market prices in such cases they exist. If market prices are unavailable, the fair value is determined for each asset using various valuation tech-niques.
Financial assets at fair value through profi t and lossA fi nancial asset recognized at fair value in the income statement is categorized as follows: Either (1) it is recognized with the fi nancial instruments or in accordance with (2) the so-called fair value option on initial recognition has been designated as such. For the fi rst cate-gory to apply, it is required that the asset is acquired with the main purpose of being sold in the near future and that it is part of a port-folio and there is a proven pattern of short-term capitalization of gains. All of Volvo’s fi nancial assts that are recognized at fair value in the income statement are in category 1.
Derivatives, included embedded derivatives detached from the host contract, are classifi ed as held-for-trading if the are part of an evidently effective hedge accounting or are a fi nancial guarantee. Gains and losses on these assets are recognized in the income statement.
A fi nancial contract containing one or more embedded derivatives is classifi ed in its entirety as a fi nancial asset whose value change is recognized in the income statement if not:
• the embedded derivative does not affect future cash fl ow attribut-able to the fi nancial asset.
• separation of the embedded instrument is required.
Short-term investments are valued at fair value and the changes in this value are recognized in the income statement. Short-term investments that mainly consist of interest-bearing fi nancial instru-ments are reported in Note 21.
Volvo classifi es fi nancial derivatives as fi nancial assets whose value changes are reported in the income statements if they evi-dently are not used in hedge accounting. All derivatives are reported in this note below.
Financial assets held to maturityHeld-to-maturity investments are assets with fi xed payments and term and that Volvo intends and is able to hold to maturity. After ini-tial valuation, these assets are valued at accrued acquisition value in accordance with the effective interest method, with adjustment for any impairment. Gains and losses are recognized in the income statement when assets are divested or impaired as well as in pace with the accrued interested being reported. At year end 2006 Volvo did not have any fi nancial instruments classifi ed in this category.
Claims under a loan and receivablesLoans and receivables are non-derivative fi nancial assets with fi xed or determinable payments, originated or acquired, that are not quoted in an active market. After initial recognition, loans and receiv-ables are valued at accrued acquisition value in accordance with the effective interest method. Gains and losses are recognized in the income statement when the loans or receivables are divested or impaired as well as in pace with the accrued interested being reported.
Accounts receivable are recognized initially at fair value, which normally corresponds to the nominal value. In the event that the pay-ment terms exceed one year, the receivable is recognized at the dis-counted present value. Provisions for doubtful receivables are made continuously after assessment of whether the customer’s payment capacity has changed.
Volvo reports different loans and receivables. Note 16, Long-term receivables in customer fi nancing operations presented mainly receivables related to installment purchases and fi nancial leasing. Note 17, Other long-term receivable, presents, among other items, Other loans to external parties. Note 19, Current receivables in cus-tomer fi nancing operations, presents installment purchases, fi nancial leasing and dealer fi nancing and Note 20, Other current receivables, is mainly accounts receivable.
Available-for-sale assetsThis category includes assets available for sales or those that have not been classifi ed in any of the other three categories. These assets are initially measured at fair value. Fair value changes are recognized directly in shareholders’ equity. The cumulative gain or loss that was recognized in equity is recognized in profi t or loss when an available-for-sale fi nancial asset is sold. Unrealized value declines are recog-nized in equity, if the decline is not considered temporary. If the value decline is signifi cant and has lasted for a longer period, the value impairment is recognized in the income statement. If the event caus-ing the impairment no longer exists, impairment can be reversed in the income statement if it does not involve an equity instrument.
Earned or paid interest attributable to these assets is recognized in the income statement as part of net fi nancial items in accordance with the effective interest method. Dividends received attributable to these assts are recognized in the income statement as Earnings from other shares and participations.
Volvo reports shares and participations in listed companies at market value on the balance-sheet date, with the exception of investments classed as associated companies and joint ventures. Companies listed on fi nancial marketplaces are reported at market value on the balance-sheet date. Holdings in unlisted companies for which a market value is unavailable, are recognized at acquisition value. Volvo classifi es these types of investments as assets available

134 Financial information 2006
The Volvo Group
Notes to consolidated financial statements
for sale. Note 15 Shares and participations lists Volvo’s holdings of shares and participations in listed companies.
ImpairmentsFinancial assets at fair value through profi t and loss Impairments do not need to be reported for this category of assets since they are continuously revalued at their fair value in the income statement.
Assets that are valued at amortized costVolvo conducts routine controls to ensure that the carrying value of assets valued at amortized cost, such as loans and receivables, has not decreased, which would result in an impairment loss reported in the income statement. Impairments consist of the difference between carrying value and current value of the estimated future payment fl ow attributable to the specifi c asset. Discounting of future cash fl ow is based on the effective rate used initially.
Initially, the impairment requirement shall be evaluated for each respective asset. If, based on objective grounds, it cannot be deter-mined that one or more assets are subject to an impairment loss, the assets are grouped in units based, for example, on similar credit risks to evaluate the impairment loss requirement collectively. Indi-vidually written down assets or assets written down during previous periods are not included when grouping assets for impairment test.
If the conditions for a completed impairment loss later prove to no longer be present, and that can be related to a specifi c event after the impairment event, the impairment loss is reversed in the income statement as long as the carrying value does not exceed the amort-ized cost at the time of the reversal.
When regard to accounts receivable, provisions shall be made when there is objective evidence that Volvo will not receive the full value of the receivable. They are excluded only when the receivable is deemed to be worthless and will not be obtained.
Assets available for saleIf an asset available for sale is to be impaired, it shall be effected by taking the difference between the asset’s acquisition value cost (adjusted for any accrued interest if it involves that type of asset) and its fair value. If it instead involves equity instruments such as shares, a completed impairment shall not be reversed in the income state-ment. On the other hand, impairments that have been made on debt instruments (interest-bearing instruments) shall in whole or part be reversed in the income statement, in those instances where an event that is proven to have occurred after the impairment was performed is identifi ed and impacts the valuation of that asset.
Hedge AccountingVolvo uses derivative fi nancial instruments, such as foreign exchange derivative contracts, forwards and futures and interest-
rate swaps, for hedging against interest-rate risks and currency-rate risks. Derivatives are initially valued at their fair value and revalued on subsequent occasions at their fair value in the income statement, if it can be proven that they have not been included in an effective hedging situation. Derivatives are accounted for as an asset when they have a positive value and as a liability when they have a nega-tive value. Profi ts and losses on derivatives that do not fulfi ll the requirements for hedge accounting are reported in the income statement. For 2006, SEK 10 M was accounted for in the statement regarding ineffective cash fl ow hedging. The following types of hedges can be utilized:
• A fair value hedge is used to hedge against exposure to changes in fair value of a recognized asset or liability or a previously unrecog-nized fi rm commitment.
• A cash fl ow hedge is used to hedge against exposure to variability in cash fl ows that is attributable to a particular risk associated with a recognized asset or liability or a highly probable forecast transac-tion in regards to a previously unrecognized fi rm commitment.
• A hedge of a net investment in a foreign operation.
In order for hedge accounting to be used, a number of criteria must be met: the position to be hedged shall be identifi ed and exposed to currency and interest rate fl uctuations, the purpose of the loan/instrument shall be to perform a hedge, and the hedge shall effectively protect the underlying position against changes in its value. Financial instruments utilized for the purpose of protecting future cash fl ows shall be considered a hedge if the fl ow is deemed very likely to occur.
In order to apply hedge accounting in accordance with IAS 39, hedge effectiveness must be within a range of 80% to 125%. When it comes to cash fl ow hedging, the effective portion of the hedge is reported against shareholders’ equity and the ineffectiveness against the income statement.
Financial instruments used for hedging of forecast commercial cash-fl ows and electricity consumption have been reported at fair value, which is debited or credited to a separate component of equity to the extent the requirements for cash-fl ow hedge accounting are fulfi lled. The fair value of derivatives is determined primarily by their market value. To the extent that the requirements for hedge account-ing are not met, any changes in value attributable to derivatives are immediately charged to the income statement. Gains and losses related to hedges are reported at the same time as the gains and losses on the items that are hedged effect the Group’s consolidated shareholders’ equity.
Volvo also applies hedge accounting for certain net investments in foreign operations. Current earnings from such hedging are reported in a separate portion of shareholders’ equity. At divestment, the accumulated earnings from the hedge are recognized in the income statement.

Financial information 2006 135
31 dec, 2004 31 dec, 2005 31 dec, 2006 Carying Fair Carying Fair Carying FairAssets value value value value value value
Financial assets at fair value through profi t and loss The Volvo Group’s outstanding currency risk contract – commercial exposure – – 560 560 1,074 1,074The Volvo Group’s outstanding raw materials contract – – 54 54 25 25The Volvo Group’s outstanding interest risk contract – fi nancial exposure – – 2,823 2,823 2,661 2,661 – – 3,437 3,437 3,760 3,760
Investments held to maturity – – – – – –
Loan receivables and accounts receivables Customer fi nancing receivables 51,193 51,948 64,466 65,365 64,742 64,832Loans to external parties and other interest-bearing receivables 2,098 2,126 680 643 840 840 53,291 54,074 65,146 66,008 65,582 65,672
Financial assets available for sale Shares and participations for which: a market value can be calculated 1 670 169 253 253 740 740a market value cannot be calculated 2 420 – 303 – 356 – 1,090 169 556 253 1,096 740Total 54,381 54,243 69,139 69,698 70,438 70,172
Liabilities Financial liabilities at fair value through profi t and loss The Volvo Group’s outstanding currency risk contract – commercial exposure – – 1,292 1,292 310 310The Volvo Group’s outstanding raw materials contract – – 11 11 47 47The Volvo Group’s outstanding interest risk contract - fi nancial exposure – – 2,675 2,675 820 820 – – 3,978 3,978 1,177 1,177
Financial liabilities valued at amortized cost Long-term bond loans and other loans 40,411 41,441 43,626 43,944 38,818 40,575Short-term bank loans and other loans 21,396 20,360 30,321 30,463 28,100 27,032 61,807 61,801 73,947 74,407 66,918 67,607Total 61,807 61,801 77,925 78,385 68,095 68,784
Derivative instruments 3 The Volvo Group’s outstanding currency risk contract – commercial exposure 176 1,371 – – – –The Volvo Group’s outstanding raw materials contract – –25 – – – –The Volvo Group’s outstanding interestrisk contract – fi nancial exposure 252 924 – – – –
1 Refers to Volvo’s ownership of Deutz AG valued to market value.2 Unlisted for which a reliable fair value can not be determined, are reported
at a historic cost. No single block of shares represents a signifi cant amount.
3 Effective 2005, fair value for derivative instruments is reported in accord-ance with IAS39. Fair values are in agreement with book values for these instruments.
4 Fair value for fi nancial instruments has been estimated in regards to inter-est risk.
Information regarding reported and fair valuesIn the table below, carrying values are compared with fair values of fi nancial instruments.

136 Financial information 2006
The Volvo Group
Notes to consolidated financial statements
Outstanding derivative instruments for dealing with currency and interest-rate risks related to fi nancial assets and liabilities to which hedge accounting is not applied 31 dec, 2004 31 dec, 2005 31 dec, 2006 Notional Carrying Fair Notional Carrying Fair Notional Carrying Fair amount value value amount value value amount value value
Interest-rate swaps – receivable position 76,667 1,659 2,919 101,483 2,348 2,348 92,651 2,412 2,412 – payable position 68,018 (1,585) (2,144) 116,824 (2,222) (2,222) 30,578 (598) (598)Forwards and futures – receivable position 47,156 168 168 29,090 120 120 114,886 209 209 – payable position 30,872 (182) (182) 27,001 (112) (112) 80,331 (197) (197)Foreign exchange derivative contracts – receivable position 17,120 286 286 18,619 355 355 8,077 124 124 – payable position 8,273 (82) (107) 14,474 (331) (331) 18,423 (124) (124)Options purchased – receivable position – – – – 0 0 – 21 21 – payable position 200 – (4) 502 (5) (5) 200 (4) (4)Options written – receivable position 133 0 0 0 0 0 603 3 3 – payable position 1,946 (12) (12) 822 (5) (5) 442 (5) (5)Total 252 924 148 148 1,841 1,841
Various categories of fi nancial instruments are treated separately as specifi ed in the notes above. Below is an accounting of derivative instruments and options.
Financial assets at fair value through profi t and loss
Changes in market value on the above instruments are reported in net fi nancial income, see Note 11, Other fi nancial income and expenses.
Outstanding forward contracts and option contracts for hedging of commercial currency risk, to which hedge accounting is applied 31 dec, 2004 31 dec, 2005 31 dec, 2006 Notional Carrying Fair Notional Carrying Fair Notional Carrying Fair amount value value amount value value amount value value
Foreign exchange derivative contracts – receivable position 26,203 264 1,775 37,754 536 536 28,930 1,034 1,034 – payable position 9,982 (88) (511) 36,980 (1,272) (1,272) 18,494 (304) (304)Options purchased – receivable position 2,831 – 112 4,769 51 51 5,423 54 54 – payable position – – – 3 (3) (3) – – –Options written – receivable position 233 – 0 – – – – – – – payable position 2,729 – (5) 4,142 (44) (44) 4,394 (20) (20)Subtotal 176 1,371 (732) (732) 764 764
Raw materials derivative contract – receivable position (10) – 7 394 54 54 94 25 25 – payable position 243 – (32) 71 (11) (11) (510) (47) (47)Total 176 1,346 (689) (689) 742 742
Out of the fi nancial instruments disclosed in the table above, contracts with a fair value of 754 has been used for hedge accounting.

Financial information 2006 137
Hedge accounting
Cash-fl ow hedgingDerivative fi nancial instruments used for hedging of forecasted com-mercial cash-fl ows and electricity consumption have, in accordance with IAS 39, been reported at fair value, which is debited or credited to a separate component of equity to the extent the requirements for
cash-fl ow hedge accounting are fulfi lled. To the extent that the requirements for hedge accounting are not met, any changes in value attributable to derivatives are immediately charged to the income statement. Gains and losses related to hedges are reported at the same time as the gains and losses on the items that are hedged effect the Group’s consolidated shareholders’ equity. The table in Note 23, Shareholders’ Equity shows how the currency risk reserve has changed during the year.
The Volvo Group’s outstanding forward contracts and options contracts for hedging of commercial currency risks Other Fair Currencies currencies value
Millions USD GBP EUR Net SEK
Due date 2007 amount 1,748 253 790 5,944Due date 2008 amount 184 – – –Due date 2009 amount 51 – – –Total 1,983 253 790 5,944
Average contract rate 7.29 13.43 9.15Fair value of outstanding forward contracts 598 7 39 120 764
The hedged amount of projected future fl ows for all periods are within the framework of Volvo’s currency policy.
Volvo tests all cash-fl ow hedges for effectiveness when they are entered into. Hedging is considered to be effective when the pro-jected future cash fl ow’s currency fl uctuation and maturity date coin-cide with those of the hedging instrument. The hedging relationship is regularly tested up until its maturity date. If the identifi ed relation-ships are no longer deemed effective, the currency fl uctuations on the hedging instrument from the last period the instrument was con-cidered effective are reported in the Group’s income statement. For 2006, Volvo reported 10 (neg. 3) in revenue related to the ineffec-tiveness of cash-fl ow hedging.
Hedging of forecasted electricity is considered to be effective when predetermined factors that affect electricity prices are in agreement with forecasts of future electricity consumption and des-ignated derivative instruments. No ineffective hedging of forecasted electricity consumption was identifi ed during 2006.
Hedging of currency and interest rate risks on loansIn regards to derivative fi nancial instruments used to hedge currency and interest rate risks on loans, Volvo has chosen, under the more complex rules in IAS 39, to not utilize hedge accounting. Unrealized profi ts and losses through the maturity date of the fi nancial instru-ments have been charged to net fi nancial income for these derivatives.
Hedging of net investments in foreign operations Volvo applies hedge accounting for certain net investments in foreign operations. Current earnings from such hedging shall be accounted for in a separate item within shareholders’ equity. A total of 63 in shareholders’ equity relating to hedging of net investments in foreign operations was reported in 2006. An amount of 37 was reported in earnings relating to concluded hedges.

Parent Company AB Volvo
Corporate registration number 556012-5790.
Board of Directors’ report
During the year, AB Volvo acquired 58.2 million shares, correspond-ing to 19% of the shares, in the Japanese truck manufacturer Nis-san Diesel. The investment amounted to approximately SEK 2.0 bil-lion. In addition, AB Volvo has acquired all 57.5 million preference shares in Nissan Diesel for a total amount of approximately SEK 3.5 billion.
Income from investments in Group companies includes dividends amounting to 399 (9,161; 101), Group contributions and transfer price adjustments, net of 8,721 (5,360; 5,673) and write-downs of shareholdings of 192 (8,420; 1,364). The redemption of all prefer-ence shares in VNA Holding resulted in a capital loss of 363 for the parent company.
The carrying value of shares and participations in Group compa-nies amounted to 40,419 (40,812; 40,393), of which 39,870 (40,298; 39,878) pertained to shares in wholly owned subsidiaries. The corresponding shareholders’ equity in the subsidiaries (including equity in untaxed reserves but excluding minority interests) amounted to 76,232 (67,804; 55,831).
Shares and participations in Non-Group companies included
5,642 (0; 0) in associated companies that are reported in accord-ance with the equity method in the consolidated accounts. The por-tion of shareholders’ equity in associated companies accruing to AB Volvo totaled 180 (85; 90). Shares and participations in associated companies include 19% of the shares in Nissan Diesel with a carry-ing value of 2,001. The market price of these shares amounted to 1,341 at year-end. Preference shares in Nissan Diesel with a carry-ing value of 3,493 are also included. Shares and participations in non-Group companies include listed shares in Deutz AG with a car-rying value of 740, corresponding to the quoted market price at year-end. The holding in Deutz AG is reported at market value as of January 1, 2005 in accordance with the application of the new accounting principle, IAS 39 Financial Instruments, from the same date. See also Note 1 Accounting principles.
Financial net debt amounted to 3,589 (assets 6,052; assets 5,541).
AB Volvo’s risk capital (shareholders’ equity plus untaxed reserves) amounted to 51,240 corresponding to 89% of total assets. The comparable fi gure at year-end 2005 was 92%.
SEK M 2004 2005 2006
Net sales 531 663 764Cost of sales (531) (663) (764)Gross income 0 0 0
Selling expenses – (56) (16)Administrative expenses Note 2 (471) (955) (621)Other operating income and expenses Note 3 5 7 5Income from investments in Group companies Note 4 4,409 6,620 8,565Income from investments in associated companies Note 5 (1) 0 7Income from other investments Note 6 851 (1) 0Operating income 4,793 5,615 7,940
Interest income and similar credits Note 7 294 114 56Interest expenses and similar charges Note 7 (238) (31) (67)Other fi nancial income and expenses Note 8 111 (108) 126Income after fi nancial items 4,960 5,590 8,055
Allocations Note 9 1,524 0 (2,000)Income taxes Note 10 (1,338) (1,230) (1,706)Income for the period 5,146 4,360 4,349
Parent Company AB Volvo
Income statements
138 Financial information 2006

SEK M December 31, 2004 December 31, 2005 December 31, 2006
Assets Non-current assets Rights Note 11 0 0 0 Property, plant and equipment Note 11 21 16 16Financial assets Shares and participations in Group companies Note 12 40,393 40,812 40,419 Other shares and participations Note 12 691 271 6,400 Deferred tax assets Note 10 987 198 197 Other long-term receivables 12 42,083 11 41,292 11 47,027Total non-current assets 42,104 41,308 47,043
Current assets Short-term receivables from Group companies 7,274 7,186 10,541 Other short-term receivables Note 13 1,143 114 89 Short-term investments in Group companies Note 14 6,558 7,047 – Cash and bank accounts 50 0 29Total current assets 15,025 14,347 10,659Total assets 57,129 55,655 57,702
Shareholders’ equity and liabilities Shareholders’ equity Restricted equity Share capital (425,684,044 shares, quota value SEK 6) 2,649 2,554 2,554 Statutory reserve 7,241 9,890 7,337 9,891 7,337 9,891 Unrestricted equity Non restricted reserves – 83 515 Retained earnings 38,929 36,777 34,481 Income for the period 5,146 44,075 4,360 41,220 4,349 39,345Total shareholders’ equity 53,965 51,111 49,236
Untaxed reserves Note 15 4 4 2,004
Provisions Provisions for pensions Note 16 419 200 185 Other provisions 2 421 71 271 31 216
Non-current liabilities Note 17 Liabilities to Group companies 6 6 6
Current liabilities Loans from Group companies 1,627 795 – Trade payables 58 64 72 Other liabilities to Group companies 749 2,505 5,757 Current tax liabilities Note 18 – 441 50 Other current liabilities 299 2,733 458 4,263 361 6,240Total shareholders’ equity and liabilities 57,129 55,655 57,702
Assets pledged – – –Contingent liabilities Note 19 120,738 133,595 126,276
Balance sheets
Financial information 2006 139

Restricted equity Unrestricted equity
Share Fair Total Share Statutory premium value Retained shareholders’SEK M capital reserve reserve reserve earnings Total equity
Balance at December 31, 2003 2,649 7,241 – – 50,878 50,878 60,768
Effect due to change of accounting principle – – – – 235 235 235Balance at January 1, 2004 2,649 7,241 – – 51,113 51,113 61,003
Cash dividend – – – – (3,356) (3,356) (3,356)Distribution of shares in Ainax AB to shareholders – – – – (6,310) (6,310) (6,310)Repurchase of own shares – – – – (2,532) (2,532) (2,532)Share based payments – – – – 14 14 14Income for the period – – – – 5,146 5,146 5,146Balance at December 31, 2004 2,649 7,241 – – 44,075 44,075 53,965
Effect due to change of accounting principle – – – – (501) (501) (501)Balance at January 1, 2005 2,649 7,241 – – 43,574 43,574 53,464
Decrease of share capital (95) – – – – – (95)Transfer to statutory reserve – 95 – – – – 95Cash dividend – – – – (5,055) (5,055) (5,055)Repurchase of own shares – – – – (1,764) (1,764) (1,764)Share based payments – 1 – – 22 22 23Revaluation of shares in listed companies – – – 83 – 83 83Income for the period – – – – 4,360 4,360 4,360Balance at December 31, 2005 2,554 7,337 – 83 41,137 41,220 51,111
Cash dividend – – – – (6,775) (6,775) (6,775)Share based payments – – 40 – 119 159 159Revaluation of shares in listed companies – – – 392 – 392 392Income for the period – – – – 4,349 4,349 4,349Balance at December 31, 2006 2,554 7,337 40 475 38,830 39,345 49,236
Changes in Shareholders’ equity
The distribution of share capital by class of shares is shown in Note 23 to the consolidated fi nancial statements. As of January 1, 2005, the Parent Company applies the Swedish Financial Accounting
Standards Council’s RR 32 Accounting for legal entities, with retro-active restatement from January 1, 2004. See Note 1 Accounting principles and note 3 Impact of IFRS for more information regarding the effects.
Parent Company AB Volvo
140 Financial information 2006

Financial information 2006 141
Cash-flow statements
SEK M 2004 2005 2006
Operating activities Operating income 4,793 5,615 7,940Depreciation and amortization 1 1 1Other items not affecting cash Note 20 (4,726) 1,222 (2,676)Changes in working capital: (Increase)/decrease in receivables 111 13 (155) Increase/(decrease) in liabilities and provisions (20) (40) (163)Interest and similar items received 282 272 325Interest and similar items paid (210) (220) (314)Other fi nancial items 32 26 21Income taxes paid/received 75 – (2,066)Cash fl ow from operating activities 338 6,889 2,913
Investing activities Investments in fi xed assets (2) 0 0 Disposals of fi xed assets 4 7 – Shares and participations in Group companies, net Note 20 (670) 348 (162) Shares and participations in non-Group companies, net Note 20 15,082 1 (5,737) Interest-bearing receivables including marketable securities, net Note 20 0 14,414 988 1,344 – (5,899)Cash fl ow after net investments 14,752 8,233 (2,986)
Financing activities Increase/(decrease) in loans Note 20 (3,180) (975) 2,743Cash dividend to AB Volvo shareholders (3,356) (5,055) (6,775)Repurchase of own shares (2,532) (9,068) (1,764) (7,794) – (4,032)Change in liquid funds 5,684 439 (7,018)
Liquid funds, January 1 924 6,608 7,047
Liquid funds, December 31 6,608 7,047 29
Liquid fundsLiquid funds include cash and bank balances and deposits at Volvo Treasury.

142 Financial information 2006
Parent Company AB Volvo
General information
Amounts in SEK M unless otherwise specifi ed. The amounts within parentheses refer to preceding year.
Intra-Group transactions Of the Parent Company’s net sales, 664 (567; 426) pertained to Group companies while purchases from Group companies amounted to 380 (356; 126).
Fees to auditors Fees and other remunerations paid to external auditors for the fi scal year of 2006 totaled 28 (31; 26), of which 20 (10; 13) for auditing, distributed between PricewaterhouseCoopers, 20 (10; 13) and others, 0 (0; 0), and 8 (21; 13) related to non-audit services from PricewaterhouseCoopers.
Note 1 Accounting principles
Note 2 Administrative expenses
Administrative expenses include depreciation of 1 (1; 1) of which 1 (1; 1) pertain to machinery and equipment and 0 (0; 0) to buildings.
Summarized reconciliation of shareholders’ equitySEK M 040101 041231 050101
Shareholders’ equity accordingto the Annual report of 2004 60,768 53,668 53,668Revaluation of loans 235 283 283Share-based payments – 14 14Investments in listed companies – – (501)Shareholders’ equity after change of account-ing principle 61,003 53,965 53,464
Summarized reconciliation of net incomeSEK M 2004
Income for the period according to the Annual report of 2004 5,098Revaluation of loans 66Deferred taxes (18)Income for the period after change of accounting principle 5,146
The accounting principles applied by Volvo are described in Note 1 to the consolidated fi nancial statements.
As of January 1, 2005, the Parent Company applies the Swedish Financial Accounting Standards Council’s RR 32:05 Accounting for legal entities, with retroactive restatement from January 1, 2004. The Standard means that legal entities whose securities on the clos-ing date are listed on a Swedish stock exchange or other authorized marketplace as main rule shall apply the IFRS/IAS as applied in the consolidated accounts. Comparison fi gures for 2004, in tables and the notes, were restated where applicable in the Annual report of 2005. IAS 39 Financial Instruments is applied by the Parent Com-pany as of January 1, 2005. The Parent Company also applies RR 32:06 with reference to the exception in the application of IAS 39 which concerns accounting and valuation of fi nancial contracts of guarantee in favour of subsidiaries and associated companies.
The Volvo Group has adopted IAS 19 Employee Benefi ts in its fi nancial reporting. The parent company is still applying the prin-ciples of FAR’s Recommendation No. 4 “Accounting of pension liabil-ities and pension costs” as in previous years. Consequently there are differences between the Volvo Group and the Parent Company in the accounting for defi ned-benefi t pension plans as well as in valua-tion of plan assets invested in the Volvo Pension Foundation.
The difference between depreciation according to plan and depreciation allowable for tax purposes is reported as accumulated additional depreciation, which is included in untaxed reserves. In the consolidated balance sheet a split is made between deferred tax liab-ility and equity capital.
Reporting of Group contributions is in accordance with a state-ment issued by a special committee of the Swedish Financial Accounting Standards Council. Group contributions are reported among Income from investments in Group companies.
For the Parent Company the most important impact of RR 32:05 has been in the following three areas:
Hedge accountingHedge accounting in a legal entity of net investments in foreign operations is not permitted according to RR 32:05. The Parent Com-pany has in previous years used a loan to hedge shares in a foreign subsidiary in the corresponding currency. This loan has been reported at historical rate and not been revaluated. According to IAS 21 loans in foreign currencies shall be reported at closing rate. The
transition effect on January 1, 2004, is reported in the shareholders’ equity whereas revaluation as of 2004 is recognized in the income statement.
Share-based PaymentsThe share-based incentive programs adopted at the Annual General Meeting as from 2004 are covered by IFRS 2 Share-based payments.
Investments in other companies In accordance with IAS 39, all investments in companies, except if these investments are classifi ed as associated companies, should be reported in the balance sheet at fair value. The transition effect on January 1, 2005, attributable to this accounting change is related to Volvo’s investment in Deutz AG.
A further description of the most important changes for the Par-ent Company by the application of RR 32:05 is found below in the tables of reconciliation of shareholders’ equity and net income.
Notes and comments

Financial information 2006 143
Note 9 Allocations
2004 2005 2006
Allocation to additional depreciation (1) 0 0Tax allocation reserves 1,525 – (2,000)Total 1,524 0 (2,000)
Note 7 Interest income and expenses
Interest income and similar credits amounting to 56 (114; 294), included interest in the amount of 56 (112; 289) from subsidiaries and interest expenses and similar charges totaling 67 (31; 238), included interest of 61 (31; 213) to subsidiaries.
In 2004 interest-rate swaps were included in interest income with 53 and in interest expenses with 112. As from 2005 these are dis-closed net and are included in interest expenses with 1 (3).
Note 5 Income from investments in associated companies
Income from associated companies that are reported in the Group accounts in accordance with the equity method amounted to 7 and pertains to a dividend from Nissan Diesel. The participation in Blue Chip Jet HB amounts to 0 (0; neg. 1).
Note 6 Income from other investments
In 2004 revaluation of shareholdings amounted to 820, whereof reversal of previous year’s write-down of Scania AB, 915 and write-
down of Henlys Group Plc, 95. Divestment of total shares in Bilia AB resulted in a capital gain of 28.
Note 4 Income from investments in Group companies
Of the income reported, 399 (9,161; 101) pertain to dividends from Group companies. Of the dividends, 300 pertain to anticipated divi-dend from Volvo Financial Services AB. The shares in Volvo Informa-tion Technology AB have been written down by 32 and the shares in Kommersiella Fordon Europa AB have been written down by 160. In 2005, the shares in Volvo Global Trucks AB were written down by 8,420.
Transfer price adjustments and Group contributions total a net of 8,721 (5,360; 5,673). The redemption of the preference shares in VNA Holdning Inc has resulted in a capital loss of 363. In 2005, the sale of total shares in Celero Support AB resulted in a capital gain of 518.
Note 3 Other operating income and expenses
Other operating income and expenses include profi t sharing payments to employees in the amount of 2 (1; 0).
Note 8 Other fi nancial income and expenses
Other fi nancial income and expenses include exchange rate differ-ences on loans, guarantee commissions from subsidiaries, costs for confi rmed credit facilities as well as costs of having Volvo shares registered on various stock exchanges. In 2004 repayment of inter-est and residual taxes regarding a judgement in the Administrative
court of appeal and expenses for distribution of the shares in Ainax AB to Volvo’s shareholders are included. Exchange differences on loans have been recounted for year 2004 due to new accounting principles. See Note 1 Accounting principles for more information.

144 Financial information 2006
Parent Company AB Volvo
Note 11Intangible and tangible assets
Value in Value in Value in balance sheet balance sheet Capital Sales/ balance sheet Acquisition cost 2004 2005 expenditures scrapping 2006
Rights 52 52 – – 52Total intangible assets 52 52 – – 52
Buildings 9 6 – 0 6Land and land improvements 4 3 – – 3Machinery and equipment 49 48 0 0 48Total tangible assets 62 57 0 0 57
Value in Value in Value in Net carryng balance sheet balance sheet Sales/ balance sheet value in balanceAccumulated depreciation 2004 2 2005 2 Depreciation 1 scrapping 2006 2 sheet 2006 3
Rights 52 52 – – 52 0Total intangible assets 52 52 – – 52 0
Buildings 1 1 0 0 1 5Land and land improvements – 0 0 – 0 3Machinery and equipment 40 40 1 (1) 40 8Total tangible assets 41 41 1 (1) 41 16
1 Including write-downs.2 Including accumulated write-downs.3 Acquisition value, less accumulated depreciation, amortization and write-
downs.
The assessed value of buildings was 3 (3; 5) and of land 2 (1; 2). Capital expenditures in tangible assets amounted to 0 (0; 2). Capital expenditures approved but not yet implemented at year-end 2006 amounted to 3 (0; 0).
The table below shows the principal reasons for the difference between the corporate income tax (28%) and the tax for the period.
2004 2005 2006
Income before taxes 6,484 5,590 6,055
Income tax according to applicable tax rate (28%) (1,815) (1,565) (1,695)Capital gains 184 149 (102)Non-taxable dividends 46 2,565 114Non-taxable revaluations of shareholdings (153) (2,358) (54)Other non-deductible expenses 26 (24) (15)Other non-taxable income 282 3 11Adjustment of current taxes for prior periods 92 – 35Income taxes for the period (1,338) (1,230) (1,706)
Specifi cation of deferred tax assets 2004 2005 2006
Tax-loss carryforwards 942 – –Valuation allowance for doubtful receivables 1 1 1Provision for post-employment benefi ts 154 177 196Other deductible temporary differences 0 20 –Other taxable temporary differences (110) – –Deferred tax assets 987 198 197
Note 10 Income taxes
2004 2005 2006
Current taxes 92 (331) (1,075)Deferred taxes (1,430) (899) (1)Total income taxes (1,338) (1,230) (1,706)
Current taxes were distributed as follows:
Current taxes 2004 2005 2006
Current taxes for the period – (331) (1,740)Adjustment of current taxes for prior periods 92 – 35Total current taxes 92 (331) (1,705)
Claims as a consequence of tax audit carried out previously for which provisions are not deemed necessary amount to – (–; 135). The amount is included in contingent liabilities.
Deferred taxes relate to estimated tax on the change in tax-loss carryforwards and temporary differences. Deferred tax assets are reported to the extent that it is probable that the amount can be utilized against future taxable income.
Deferred taxes related to change in tax-loss carryforwards amount to – (neg. 942; neg. 1,427) and to changes in other tempo-rary differences to neg. 1 (43; neg. 3). Income taxes of 110 regard-ing prior periods have been debited directly to equity in connection with change of accounting principle on January 1, 2004.
Notes to financial statements

Financial information 2006 145
Shares and participations in Group companiesDuring the fi rst quarter of 2006, 491 was transferred to the newly-formed company Volvo Automotive Finance (China) Ltd for the Volvo Group’s future customer-fi nancing activites in China.
Shareholders’ contributions were made with 34 to ZAO Volvo Vostok, with 300 to Volvo Information Technology AB and with 27 to Volvo Italia Spa.
The redemption of preference shares in VNA Holding Inc decreased the holding by 1,053.
Write-downs were carried out at year-end on the holdings in Volvo Information Technology AB, 32 and Kommersiella Fordon Europa AB, 160. 2005: All shares in Volvo Lastvagnar AB, 8,678, were received as dividend from Volvo Global Trucks AB, after which the shares in Volvo Global Trucks AB were written down by 8,420 and sold inter-company for book value.
The holding in the service company Celero Support AB with a book value of 25 was sold.
Shareholders’ contribution was made with 183 to Volvo Financial Services AB.2004: The remaining 2% of the shares in Kommersiella Fordon Europa AB was acquired for 28 by compulsory acquisition. The acquisition costs of the stockholding increased with 4 and at year-end the holding was written down by 643.
25% of the shares in VFS Servizi Financiari Spa was acquired inter-company for 101.
The holdings in seven dormant Group companies with a total book value of 82 were transferred internally within the Group.
Shareholders’ contributions were made to Alviva AB, 2 and to Celero Support AB, 10, whereupon the shareholdings were written down by the corresponding amounts.
Shareholders’ contributions were also made to Volvo Bussar AB, 18, to Volvo Global Trucks AB, 1 and to Volvo Financial Services AB, 345.
Write-downs were carried out at year-end on the holdings in Sotrof AB, 600, Volvo China Investment Co Ltd, 99 and Volvo Penta UK, 10.
Shares and participations in non-Group companies On March 21 2006, AB Volvo acquired 40 million shares, corres-ponding to 13% of the shares, in the Japanese truck manufacturer Nissan Diesel from Nissan Motor, with an option on Nissan Motor’s remaining 6% within four years. The purchase price amounted to 1,505. The holding is reported as an associated company, since Volvo believes that substantial infl uence exists.
During the third quarter, AB Volvo exercised its option to purchase an additional 6% of the shares in Nissan Diesel from Nissan Motor
for 496. AB Volvo now owns a total of 19% of the shares in Nissan Diesel. In addition, AB Volvo has acquired all 57.5 million preference shares in Nissan Diesel from Nissan Motor and Japanese banks for a total of 3,493. The purchase price for the preference shares has been added to the value and is reported as investments in associ-ated companies. The preference shares that Volvo has acquired may during the period 2008–2014 be converted to shares in install-ments. It is the intention of Volvo to convert the preference shares. After full conversion, the preference shares will represent 165.1 mil-lion shares that combined with the current holding of 19% will corres-pond to 46.5% of the votes and capital in Nissan Diesel. The total purchase consideration for 46.5% of the shares and votes in Nissan Diesel amounts to 5,494.
During the year, the newly-formed partnership Blue Chip Jet II HB has been capitalized with 148.
Henlys Group Plc has been liquidated during 2006. The holding has been fully written down since 2004.
As of January 1, 2005, the Parent Company applies IAS 39 Financial Instruments: Recognition and Measurement, and accord-ingly all investments in listed companies, except if these investments are classifi ed as associated companies, should be reported in the balance sheet at fair value. The revaluation of AB Volvo’s ownership in the listed company Deutz AG has increased the value by 392 dur-ing 2006. In addition, the holding has increased by 95 through con-version into shares. 2005: AB Volvo’s investment in Deutz AG was valuated to market value. The effect of this transition at January 1, 2005, amounted to negative 501, after which the value increased by 83 during the year. Also see Note 1 Accounting principles. 2004: Volvo’s holding of Scania B shares was sold to Deutsche Bank for an amount of 14,905. As a consequence of the divestment, the Scania holding was written down in the fourth quarter of 2003. The transaction was carried out as part of Volvo’s commitment to the European Commission to divest the Scania shares not later than April 23, 2004. After the sale Volvo owned 27.3 million A shares in Scania AB. The holding was revaluated to market value on April 15, resulting in an income of 915 in 2004. At the Annual General Meet-ing on April 16, 2004, the Board’s proposal to transfer all A shares in Scania to Ainax and thereafter to distribute the shares in Ainax to Volvo’s shareholders was approved. The value of the distribution of Ainax was 6,310. The shares in Ainax were distributed to Volvo’s shareholders on June 8, 2004.
During 2004 Volvo’s holding in Henlys Group Plc was fully written down and a write-down of 95 was thereby charged to the income statement.
The holding in Bilia AB with a book value of 25 was sold. The participations in Blue Chip Jet HB were written down by 1.
Group companies Non-Group companies 2004 2005 2006 2004 2005 2006
Balance December 31, previous year 41,329 40,393 40,812 813 691 271Transition effect on shares in listed companies – – – – (501) –Acquisitions/New issue of shares/Dividends 133 8,682 491 – – 5,737Divestments (81) (26) (1,053) (25) (2) –Shareholder contributions 376 183 361 – – –Write-downs (1,364) (8,420) (192) (97) 0 –Revaluation of shares in listed companies – – – 83 392Balance, December 31 40,393 40,812 40,419 691 271 6,400
Note 12 Investments in shares and participations
Holdings of shares and participations are specifi ed in AB Volvo’s holding of shares (pages 149–151). Changes in holdings of shares and participations are shown below.

146 Financial information 2006
Parent Company AB Volvo
The valuation allowance for doubtful receivables amounted to 5 (5; 5) at the end of the year.
Of other receivables in 2004, 979 pertained to a receivable from Renault SA. AB Volvo and Renault SA signed a settlement agree-ment regarding the disagreement the companies have had since 2001 pertaining to Volvo’s acqusition of Renault V.I. According to this settlement, Renault SA transferred EUR 108 M to AB Volvo on January 26, 2005.
Note 13 Other short-term receivables
2004 2005 2006
Accounts receivable 14 14 17Prepaid expenses and accrued income 135 72 35Other receivables 994 28 37Total 1,143 114 89
Note 14 Short-term investments in Group companies
Short-term investments in Group companies comprise deposits of – (7,047; 6,558) in Volvo Treasury.
Note 15 Untaxed reserves
Value in Value in Value inThe composition of, and changes balance sheet Allocations balance sheet Allocations balance sheetin, untaxed reserves 2004 2005 2005 2006 2006
Tax allocation reserve – – – 2,000 2,000Accumulated additional depreciation Land 3 – 3 – 3 Machinery and equipment 1 0 1 0 1Total 4 0 4 2,000 2,004
Note 16 Provisions for pensions
Provisions for pensions and similar benefi ts correspond to the actu-arially calculated value of obligations not insured with third parties or secured through transfers of funds to pension foundations. The amount of pensions falling due within one year is included. AB Volvo has insured the pension obligations with third parties. Of the amount reported, 0 (0; 26) pertains to contractual obligations within the framework of the PRI (Pension Registration Institute) system. The exchange in 2005 of defi ned-benefi t pension plans by defi ned-con-tribution plans for certain senior executives has resulted in a decrease of provisions for pensions. For further information see Note 34 to the consolidated fi nancial statements.
The Volvo Pension Foundation was formed in 1996. Plan assets amounting to 224 were contributed to the foundation at its forma-tion, corresponding to the value of the pension obligations at that time. Since its formation, net contributions of 25 have been made to the foundation.
AB Volvo’s pension costs amounted to 90 (93; 79).The accumulated benefi t obligation of all AB Volvo’s pension obli-
gations at year-end 2006 amounted to 576, which has been secured in part through provisions for pensions and in part through funds in pension foundations. Net asset value in the Pension Foundation, marked to market, accruing to AB Volvo was 71 higher than corre-sponding pension obligations.
Notes to financial statements

Financial information 2006 147
Note 18 Other current liabilities
2004 2005 2006
Wages, salaries and withholding taxes 53 59 72Other liabilities 156 279 136Accrued expenses and prepaid income 90 120 153Total 299 458 361
No collateral is provided for current liabilities. Other liabilities have been recalculated for year 2004 due to new accounting principles. See Note 1 Accounting principles for more information.
Note 19 Contingent liabilities
Of the contingent liabilities amounting to 126,276 (133,595; 120,738), 126,244 (133,462; 120,591) pertained to Group companies.
Guarantees for various credit programs are included in amounts corresponding to the credit limits. These guarantees amount to 120,612 (127,987; 115,266), of which guarantees on behalf of Group companies totaled 120,587 (127,982; 115,261).
At the end of each year, the utilized portion amounted to 62,194 (67,908; 53,142) including 62,162 (67,776; 53,130) pertaining to Group companies.
Note 20 Cash fl ow
Other items not affecting cash 2004 2005 2006
Revaluation of shareholdings 545 8,421 192Dividends, transfer price adjustments and Group contributions (5,273) (6,940) (3,296)Gain on sale of shares (27) (519) 363Other 29 260 65Total (4,726) 1,222 (2,676)
Further information is provided in Notes 4, 5 and 6.
Shares and participations in Group companies, net Investments (703) (197) (853)Disposals 33 545 691Net investments in shares and participations in Group companies (670) 348 (162)
Investments and sales of shares in Group companies are shown in Note 12.
Shares and participations in non-Group companies, net 2004 2005 2006
Investments – – (5,737)Disposals 15,082 1 0Net investments in shares and participations in non-Group companies 15,082 1 (5,737)
Sales of shares in Scania AB resulted 2004 in a positive cash fl ow of 15,029.
Other investments and sales of shares in Non-Group companies are presented in Note 12.
Interest-bearing receivables including marketable securities, net New loans granted 0 – –Amortization received – 988 –Change in interest-bearing receivables, net 0 988 –
Increase/decrease in loans New loans – – 3,433Amortization (3,180) (975) (690)Change in loans, net (3,180) (975) 2,743
Note 17 Non-current liabilities
Long-term debt matures as follows: 2012 or later 6Total 6

148 Financial information 2006
Parent Company AB Volvo
Note 21 Financial risks and instruments
Volvo’s accounting policies for fi nancial instruments are described in Note 1, Note 36 and Note 37 to the consolidated fi nancial state-ments. Hedging transactions in AB Volvo are carried out through Volvo Treasury AB. The Parent Company has used interest-rate swaps to hedge fi nancial liabilities of Group companies. Maturities of
these swaps are between 2007 and 2009. During 2004 AB Volvo has used forward exchange contracts for hedging of short-term receivable and liability regarding the amount of the settlement agreement between AB Volvo and Renault SA (See note 13). Maturi-ties of theese contracts were on January 26, 2005.
December 31, 2004 December 31, 2005 December 31, 2006 Notional Carrying Notional Carrying Notional Carrying amount value Fair value amount value Fair value amount value Fair value
Interest-rate swaps – payable position 4,563 (17) (17) – – – 5,430 (4) (4) – receivable position – – – 6,284 13 13 – – –Foreign exchange contracts – receivable position 1,942 13 13 – – – – – –
Note 22 Personnel
Wages, salaries and other remunerations amounted to 204 (141; 140). Social costs amounted to 142 (125; 111) of which pension costs, 105 (93; 79). Of these 32 (4; 53) pertained to Board mem-bers and Presidents. The Company’s outstanding pension obliga-tions to these individuals amounted to 141 (211; 400).
The number of employees at year-end was 176 (144; 144). Infor-mation on the average number of employees, wages, salaries and other remunerations including option programs as well as Board members and senior executives by gender is shown in Note 34 to the consolidated fi nancial statements.
Absence due to illness 2004 2005 2006
Total absence due to illness in percentage of regular working hours 2.2 2.1 1.4 of which, continuous sick leave for 60 days or more, % 70.9 64.6 44.0
Absence due to illness in percentage of regular working hours Men, % 0.8 1.2 0.8Women, % 3.6 3.0 2.1
29 years or younger, % 0.9 0.4 0.730–49 years, % 1.2 2.3 0.950 years or older, % 3.6 2.2 2.4
Outstanding derivative instruments for hedging of fi nancial currency risks and interest rate risks related to fi nancial assets and liabilities
Notes to financial statements

Financial information 2006 149
AB Volvo’s holding of shares
Nissan Diesel, Japan – 19 – 5,494Deutz AG, Germany – 7 253 740Blue Chip Jet II HB, Sweden 969717-2105 50 – 148Blue Chip Jet I HB, Sweden 969639-1011 40 0 0Other investments 18 18Total carrying value, Non-Group companies 271 6,400
1 Percentage fi gures refer to share capital as well as voting rights.
Dec 31, 2005 Dec 31, 2006AB Volvo’s holding of shares and Registration Percentage Carrying value, Carrying value,participations in major Group companies number holding SEK M SEK M
Volvo Lastvagnar AB, Sweden 556013-9700 100 8,678 8,678 Volvo Truck Center Sweden AB, Sweden 556072-7777 100 – – Volvo Finland AB, Finland – 100 – – Volvo Europe Finance NV, Belgium – 100 – – Volvo Europa Truck NV, Belgium – 100 – – VTC Holland NV, The Netherlands – 100 – – Volvo Otomotiv Turk Ltd STI, Turkey – 100 – – Volvo Trucks de Mexico, Mexico – 100 – – Volvo India Ltd, India – 100 – – Volvo Commercial Vehicles Australia Pty, Australia – 100 – –
Volvo Holding Sverige AB, Sweden 556539-9853 100 7,634 7,634 BRS Ltd, Great Britain 100 – – Mack Canada Inc, Canada – 100 – – Volvo Construction Equipment North America, Canada – 100 – – Volvo Polska Sp. O.O., Poland – 100 – – Volvo Southern Africa Pty Ltd, South Africa – 100 – – Volvo do Brasil Veiculos Ltda, Brasil – 100 – – Banco Volvo (Brasil) SA, Brasil – 100 – – Laponia Sudeste Ltda, Brasil – 100 – –
Volvo Holding France SA, France – 100 – – Volvo Trucks France SAS, France – 100 – – Volvo Compact Equipment SAS, France – 100 – – Volvo CE Europe SAS, France – 100 – – VFS Finance France SAS, France – 100 – – VFS Location France SAS, France – 100 – –
Dec 31, 2005 Dec 31, 2006AB Volvo’s holding of shares Registration Percentage Carrying value, Carrying value,and participations in non-Group companies number holding SEK M SEK M

150 Financial information 2006
Parent Company AB Volvo
Dec 31, 2005 Dec 31, 2006AB Volvo’s holding of shares Registration Percentage Carrying value, Carrying value,participations in major Group companies (cont.) number holding SEK M SEK M
Renault Trucks, France – 100 – – Renault Trucks UK Ltd, Great Britain – 100 – – Renault Trucks Deutschland GmbH, Germany – 100 – – Renault VI España SA, Spain – 100 – – Renault Trucks, España, Spain – 100 – – Renault Trucks Italia Spa, Italy – 100 – –
Mack Trucks Inc, USA – 100 3,225 3,225 Mack de Venezuela C.A., Venezuela – 100 – – Mack Trucks Australia Pty Ltd, Australia – 100 – –
Volvo Bussar AB, Sweden 556197-3826 100 1,877 1,877 Volvo Bussar Säffl e AB, Sweden 556058-3485 100 – – Volvo Bus Finland Oy, Finland – 100 – – Prévost Car Inc, Canada – 100 – –
Volvo Construction Equipment NV, The Netherlands – 100 2,582 2,582 Volvo Construction Equipment AB, Sweden 556021-9338 100 – – Volvo Maskin AS, Norway – 100 – – Volvo Construction Equipment Europe Ltd, Great Britain – 100 – – Volvo Construction Equipment Europe GmbH, Germany – 100 – – Volvo Compact Equipment GmbH & Co KG, Germany – 100 – – Volvo Motor Graders, Ltd, Canada – 100 – –
AB Volvo Penta, Sweden 556034-1330 100 421 421
Volvo Aero AB, Sweden 556029-0347 100 2,885 2,885 Volvo Aero Engine Services AB, Sweden 556328-9171 100 – – Volvo Aero Norge AS, Norway – 78 – –
VNA Holding Inc., USA – 100 3,510 2,456 Volvo Group North America Inc, USA – 100 – – Volvo Trucks Canada Inc., Canada – 100 – – Arrow Truck Sales Inc., USA – 100 – – Volvo Construction Equipment North America Inc., USA – 100 – – Volvo Penta of The Americas Inc., USA – 100 – – Volvo Aero Services LP, USA – 100 – – Volvo Commercial Finance LLC The Americas, USA – 100 – – VFS US LLC, USA – 100 – – Volvo Treasury North America, USA – 100 – – Volvo Treasury Canada Inc., Canada – 100 – –

Financial information 2006 151
Dec 31, 2005 Dec 31, 2006AB Volvo’s holding of shares Registration Percentage Carrying value, Carrying value,participations in major Group companies (cont.) number holding SEK M SEK M
Volvo Financial Services AB, Sweden 556000-5406 100 1,413 1,413 VFS International AB, Sweden 556316-6064 100 – – VFS Financial Services BV, The Netherlands – 100 – – VFS Financial Services (UK) Ltd, Great Britain – 100 – – VFS Deutschland GmbH, Germany – 100 – – VFS Financial Services Spain EFC, SA Spain – 100 – – VFS Canada Inc, Canada – 100 – –Volvo Treasury AB, Sweden 556135-4449 100 3,044 3,044 Volvo Treasury Asia Ltd, Singapore – 100 – –Sotrof AB, Sweden 556519-4494 100 1,388 1,388 Volvo Logistics AB, Sweden 556197-9732 100 – – Danafjord AB, Sweden 556006-8313 100 – –Volvo Group Finance Europe BV, The Netherlands – 100 1,003 1,003 Volvo Korea Holding AB, Sweden 556531-8572 100 – – Volvo Construction Equipment Korea Co Ltd, South Korea – 100 – –Volvo China Investment Co Ltd, China – 100 523 523 Shanghai Sunwin Bus Co, China 2 – 50 – – XIAN Silver Bus Co, China 2 – 50 – –Volvo Automotive Finance (China) Ltd, China – 100 – 491Volvo Truck & Bus Ltd, Great Britain 1 – 100 413 413Volvo Holding Mexico, Mexico – 100 388 388Volvo Technology Transfer AB, Sweden 556542-4370 100 361 361 Volvo Technology AB, Sverige 556542-4321 100 – –Volvo Powertrain AB, Sweden 556000-0753 100 348 348Volvo Information Technology AB, Sweden 556103-2698 100 8 276Volvo Parts AB, Sweden 556365-9746 100 200 200Volvo Group Insurance Försäkrings AB, Sweden 516401-8037 100 182 182Volvo Business Services AB, Sweden 556029-5197 100 107 107Volvo Danmark Holding AS, Denmark – 100 104 104VFS Servizi Financiari Spa, Italy 3 – 100 101 101Kommersiella Fordon Europa AB, Sweden 556049-3388 100 249 89Volvo Norge AS, Norway – 100 56 56Volvo Malaysia Sdn, Malaysia – 100 48 48ZAO Volvo Vostok, Russia 4 – 100 0 34Volvo Italia Spa, Italy – 100 0 27Rossareds Fastighets AB, Sweden 556009-1190 100 26 26Volvo Penta UK Ltd, Great Britain – 100 16 16Volvo East Asia (Pte) Ltd, Singapore – 100 9 9Volvo Automotive Holding BV, The Netherlands – 100 3 3Volvo Information Technology GB Ltd, Great Britain – 100 3 3Other holdings 7 8Total carrying value Group companies5 40,812 40,419
1 Total holding by VTC Holding and AB Volvo is 100%.2 Joint ventures, reported in accordance with the proportionate consolidation method in Volvo’s consolidated accounts. 3 Total holding by Volvo Italia and AB Volvo is 100%.4 Total holding by Volvo Trucks Deutschland and AB Volvo is 100%.5 AB Volvo’s share of shareholders’ equity in subsidiaries (including equity in untaxed reserves) was 76,232 (67,804).

152 Financial information 2006
Proposed disposition of unappropriated earnings
AB Volvo SEK M
Retained earnings 34,997Income for the period 4,349Total 39,345
The Board of Directors and the President propose that the above sum be disposed of as follows:
SEK M
To the shareholders, a dividend of SEK 25.00 per share 10,120To be carried forward 29,225Total 39,345
In view of the Board of Director’s proposal to the Annual General Meeting to be held 4 April 2007 to decide on the distribution of an ordinary dividend of SEK 25 and on an automatic redemption of shares, including a reduction of the share capital, and a reduction of retained earnings, for repayment to the shareholders in amount corresponding to SEK 25 per share, according to the Chapter 18 Section 4 and Chapter 20 Section 8 of the Swedish Company Act, the Board hereby makes the following statement.1
The proposed ordinary dividend and the proposed reduction of the share capital for repayment to the shareholders reduces the Company’s solvency from 85.3 percent to 77.4 percent and the Group’s, excluding Financial Services, solvency from 43.5 percent to 37.2 percent, calculated as per year end 2006. The Board of Directors considers this solvency to be satisfactory with regard to the business in which the Group is active.
According to the Board of Directors’ opinion, the proposed ordi-nary dividend and the proposed reduction of the share capital for repayment to the shareholders will not affect the Company’s or the Group’s ability to fulfi l their payment obligations and the Company and the Group are well prepared to handle both changes in the liquidity and unexpected events.
The Board of Directors is of the opinion that the Company and the Group have capacity to take future business risks as well as to bear contingent losses. The proposed ordinary dividend and the proposed reduction of the share capital for repayment to the shareholders will not negatively affect the Company’s and the Group’s ability to make further commercially justifi ed investments in accordance with the Board of Directors’ plans.
Göteborg, February 21, 2007
Finn Johnsson
Peter Bijur Per-Olof Eriksson
Tom Hedelius Leif Johansson Philippe Klein
Louis Schweitzer Ying Yeh
Martin Linder Olle Ludvigsson Johnny Rönnkvist
Our audit report was issued on February 21, 2007 PricewaterhouseCoopers AB Göran Tidström Olov Karlsson Authorized Public Accountant Authorized Public Accountant Lead Partner Partner
In addition to what has been stated above, the Board of Direc-tors has considered other known circumstances which may be of importance for the Company’s and the Group’s fi nancial position. In doing so, no circumstance has appeared that does not justify the proposed ordinary dividend and the proposed reduction of the share capital for repayment to the shareholders.
If the Annual General Meeting resolves in accordance with the Board of Directors’ proposals regarding ordinary dividend, reduc-tion of the share capital for repayment to the shareholders and bonus issue, SEK 18,680 M will remain of the Company’s non-restricted equity, calculated as per year end 2006.
The Board of Directors has the view that the Company’s and the Group’s shareholders’ equity will, after the proposed ordinary divi-dend and the proposed reduction of the share capital with repay-ment to the shareholders, be suffi cient in relation to the nature, scope and risks of the business.
Had the assets and liabilities not been estimated at their market value pursuant to Chapter 4, Section 14 of the Swedish Annual Accounts Act the company’s shareholders’ equity would have been SEK 475,922,222 less.
1 The Board members Martin Linder, Olle Ludvigsson and Johnny Rönnkvist opposed the Board of Directors’ proposals concerning dividends and redemption of shares due to their view that the proposed amounts were too high because the Company would need the capital for acquisitions and other investments an to secure the development of the Company in future downturns in the economy.
We hereby certify that, to the best of our knowledge, that– the annual accounts have been prepared in accordance with
good accounting practices for a stock market company; – the information is, an all material respects, consistent with the
actual conditions; and – nothing of material importance has been omitted that could
affect the fi nancial position of the company as presented in the annual report.2
2 This certifi cation, which has been provided in accordance with Section 3.6.2 of the Swedish Code of Corporate Governance, does not mean that the board of directors and the President of the Company assumes any further responsibility than what follows from the Swedish Companies Act (2005:551).

Financial information 2006 153
Audit report for AB Volvo
We have audited the annual accounts, the consolidated accounts, the accounting records and the administration of the Board of Directors and the President of AB Volvo for the year 2006. The annual accounts and the consolidated accounts of the Company is included on pages 46–47 and 86–152 of this document. The Board of Directors and the President are responsible for these accounts and the administration of the Company as well as for the application of the Annual Accounts Act when preparing the annual accounts and the application of international financial reporting standards IFRSs as adopted by the EU and the Annual Accounts Act when preparing the consolidated accounts. Our responsibility is to express an opinion on the annual accounts, the consolidated accounts and the administration, based on our audit.
We conducted our audit in accordance with generally accepted auditing standards in Sweden. Those standards require that we plan and perform the audit to obtain reasonable assurance that the annual accounts and the consolidated accounts are free of mater-ial misstatement. An audit includes examining, on a test basis, evi d ence supporting the amounts and disclosures in the accounts. An audit also includes assessing the accounting principles used and their application by the Board of Directors and the President, and significant estimates made by the Board of Directors and the President when preparing the annual accounts and consolidated accounts, as well as evaluating the overall presentation of informa-tion in the annual accounts and consolidated accounts. As a basis
Göteborg, February 21, 2007
PricewaterhouseCoopers AB Göran Tidström Olov Karlsson Authorized Public Accountant Authorized Public Accountant Lead Partner Partner
for our opinion concerning discharge from liability, we examined significant decisions, actions taken and circumstances of the Company in order to be able to determine the liability, if any, to the Company of any Board member, or the President. We also exam-ined whether any Board member or the President has, in any other way, acted in contravention of the Companies Act, the Annual Accounts Act, or the Company’s Articles of Association. We believe that our audit provides a reasonable basis for our opinion set out below.
The annual accounts and consolidated accounts have been pre-pared in accordance with the Annual Accounts Act and give a true and fair view of the Company’s financial position and results of operations in accordance with generally accepted accounting prin-ciples in Sweden. The consolidated accounts have been prepared in accordance with international financial reporting standards IFRSs as adopted by the EU and the Annual Accounts Act and give a true and fair view of the Group’s financial position and results of operations. The Board of Directors’ Report is consistent with the other parts of the annual accounts and the consolidated accounts.
We recommend to the general meeting of shareholders that the income statements and balance sheets of the Parent Company and the Group be adopted, that the profit of the Parent Company be dealt with in accordance with the proposal in the Board of Directors’ Report, and that the members of the Board of Directors and the President be discharged from liability for the financial year.

154 Financial information 2006
Eleven-year summary
Consolidated income statements SEK M 1996 1997 1998 1999 2000 2001 2002 2003 2004 2005 2006
Net sales 156,060 183,625 212,936 125,019 130,070 189,280 186,198 183,291 211,076 240,559 258,835
Cost of sales (121,249) (138,990) (163,876) (99,501) (104,548) (155,592) (151,569) (146,879) (164,170) (186,662) (199,054)
Gross income 34,811 44,635 49,060 25,518 25,522 33,688 34,629 36,412 46,906 53,897 59,781
Research and development expenses (8,271) (8,659) (10,104) (4,525) (4,876) (5,391) (5,869) (6,829) (7,614) (7,557) (8,354)
Selling expenses (14,895) (17,160) (19,042) (8,865) (10,140) (15,766) (16,604) (16,866) (19,369) (20,778) (21,213)
Administrative expenses (6,685) (7,018) (8,091) (4,791) (4,974) (6,709) (5,658) (5,467) (5,483) (6,301) (6,551)
Other operating income and expenses (1,087) (3,141) (2,634) (611) 622 (4,096) (4,152) (1,367) (618) (588) (3,466)
Income (loss) from investments in associated companies 314 2,929 444 567 444 50 182 200 27 (557) 61
Income from other investments 9,007 1,168 4,526 170 70 1,410 309 (3,579) 830 37 141
Income from divestment of subsidiaries – – – 26,695 – – – – – – –
Restructuring costs – – (2,331) – – (3,862) – – – – –
Operating income (loss) 13,194 12,754 11,828 34,158 6,668 (676) 2,837 2,504 14,679 18,153 20,399
Interest income and similar credits 4,530 3,197 1,268 1,812 1,588 1,275 1,217 1,096 821 654 666
Interest expenses and similar charges (3,114) (2,699) (1,315) (1,505) (1,845) (2,274) (1,840) (1,888) (1,254) (972) (585)
Other fi nancial income and expenses (407) (76) (162) 131 (165) (191) (201) (55) (1,210) 181 (181)
Income (loss) after fi nancial items 14,203 13,176 11,619 34,596 6,246 (1,866) 2,013 1,657 13,036 18,016 20,299
Income taxes (1,825) (2,583) (3,140) (2,270) (1,510) 326 (590) (1,334) (3,129) (4,908) (3,981)
Income (loss) for the period 12,378 10,593 8,479 32,326 4,736 (1,540) 1,423 323 9,907 13,108 16,318
Attributable to
Equity holders of the parent company 12,477 10,481 8,437 32,222 4,709 (1,467) 1,393 298 9,867 13,054 16,268
Minority interest (99) 112 42 104 27 (73) 30 25 40 54 50
12,378 10,593 8,479 32,326 4,736 (1,540) 1,423 323 9,907 13,108 16,318
Consolidated income statements with Financial Services reported in accordance with the equity method SEK M 1996 1997 1998 1999 2000 2001 2002 2003 2004 2005 2006
Net sales 150,425 178,531 205,712 116,382 120,392 180,615 177,080 174,768 202,171 231,191 248,135
Cost of sales (135,027) (158,077) (92,772) (97,131) (149,477) (145,453) (141,256) (158,453) (180,823) (192,242)
Gross income 43,504 47,635 23,610 23,261 31,138 31,627 33,512 43,718 50,368 55,893
Research and development expenses (8,659) (10,104) (4,525) (4,876) (5,391) (5,869) (6,829) (7,614) (7,557) (8,354)
Selling expenses (16,763) (18,468) (8,117) (9,285) (14,663) (15,393) (15,891) (18,317) (19,616) (19,999)
Administrative expenses (6,889) (7,950) (4,632) (4,651) (6,474) (5,464) (5,259) (5,310) (6,147) (6,352)
Other operating income and expenses (3,015) (2,515) (587) 309 (3,071) (2,989) (540) 7 (397) (3,292)
Income from Financial Services 375 681 1,066 1,499 325 490 926 1,365 2,033 2,301
Income (loss) from investments in associated companies 3,033 354 478 341 (86) 126 166 2 (568) 61
Income from other investments 1,168 4,526 170 70 1,408 309 (3,581) 828 37 141
Income from divestment of subsidiaries – – 26,695 – – – – – – –
Restructuring costs – (2,331) – – (3,862) – – – – –
Operating income (loss) 13,194 12,754 11,828 34,158 6,668 (676) 2,837 2,504 14,679 18,153 20,399
Eleven-year summary
The eleven-year summary presents each year in accordance with General Accepted Accounting Practice for that year. Earlier years are not restated when new accounting standards are applied. The years 1996–2003 are accounted for in accordance with Swedish GAAP for the respective year. As from 2004 the reporting is based on IFRS. The transition to IFRS is described in note 3.

Financial information 2006 155
Consolidated balance sheets SEK M 1996 1997 1998 1999 2000 2001 2002 2003 2004 2005 2006
Intangible assets 2,277 3,284 5,778 6,618 6,925 17,525 17,045 16,756 17,612 20,421 19,117
Property, plant and equipment 26,458 30,793 36,207 19,788 22,231 33,234 30,799 30,640 31,151 35,068 34,379
Assets under operating leases 4,968 13,501 22,285 12,337 14,216 27,101 23,525 21,201 19,534 20,839 20,501
Shares and participations 12,412 4,583 3,393 29,213 30,481 27,798 27,492 22,206 2,003 751 6,890
Inventories 23,148 27,993 32,128 21,438 23,551 31,075 28,305 26,459 28,598 33,937 34,211
Customer fi nancing receivables 15,552 32,304 46,798 34,313 41,791 48,784 46,998 46,002 51,193 64,466 64,742
Interest-bearing receivables 4,080 4,667 4,735 18,617 19,228 8,079 5,490 6,632 3,384 1,897 4,116
Other receivables 25,603 27,087 34,197 24,019 26,352 39,946 33,990 32,621 35,747 42,881 42,567
Non-current assets held for sale – – – – – – – – – – 805
Liquid funds 26,661 20,603 20,224 29,269 15,968 27,383 25,578 28,735 34,746 36,947 31,099
Assets 141,159 164,815 205,745 195,612 200,743 260,925 239,222 231,252 223,968 257,207 258,427
Shareholders’ equity 1 58,380 62,850 70,235 98,236 88,931 85,576 78,525 72,636 70,155 78,760 87,188
Provision for post employment benefi ts 3,150 3,296 2,936 2,130 2,632 14,647 16,236 15,288 14,703 11,986 8,692
Other provisions 14,988 19,657 25,187 14,832 14,941 18,427 16,721 15,048 14,993 18,556 20,970
Loans 31,886 41,217 64,230 53,345 66,233 81,568 72,437 74,092 61,807 74,885 66,957
Liabilities associated with assets held for sale – – – – – – – – – – 280
Other liabilities 32,755 37,795 43,157 27,069 28,006 60,707 55,303 54,188 62,310 73,020 74,340
Shareholders’ equity and liabilities 141,159 164,815 205,745 195,612 200,743 260,925 239,222 231,252 223,968 257,207 258,427
1 of which minority interests 504 899 860 544 593 391 247 216 229 260 284
Assets pledged 6,503 6,743 5,388 3,930 2,990 3,737 3,610 3,809 3,046 3,255 1,960
Contingent liabilities 6,188 5,406 6,737 6,666 6,789 10,441 9,334 9,611 9,189 7,850 7,726
Consolidated balance sheets with Financial Services reported in accordance with the equity method SEK M 1996 1997 1998 1999 2000 2001 2002 2003 2004 2005 2006
Intangible assets 2,258 3,262 5,692 6,518 6,781 17,366 16,919 16,662 17,570 20,348 19,054
Property, plant and equipment 24,720 28,755 33,944 17,318 19,652 30,370 27,789 27,248 27,260 31,330 30,493
Assets under operating leases 49 1,366 1,817 1,611 4,245 15,020 11,155 8,976 8,477 10,260 11,822
Shares and participations 16,359 9,894 11,744 35,296 37,366 35,145 34,750 30,022 10,116 10,357 16,565
Inventories 23,042 27,756 31,883 21,053 22,998 30,557 27,564 25,848 28,291 33,583 33,893
Customer fi nancing receivables 0 227 384 9 15 114 99 118 230 1,377 1,193
Interest bearing receivables 4,060 4,664 4,715 18,617 19,286 12,426 8,495 9,413 12,127 7,691 13,214
Other receivables 24,312 25,802 31,398 21,075 24,882 38,815 34,256 33,079 36,535 43,992 43,335
Non-current assets held for sale – – – – – – – – – – 805
Liquid funds 23,170 16,605 15,439 24,465 10,958 24,874 24,154 28,102 34,628 36,047 29,907
Assets 117,970 118,331 137,016 145,962 146,183 204,687 185,181 179,468 175,234 194,985 200,281
Shareholders’ equity 58,324 62,810 70,179 98,236 88,931 85,576 78,525 72,636 70,155 78,760 87,188
Provision for post-employment benefi ts 3,126 3,266 2,904 2,118 2,619 14,632 16,218 15,264 14,677 11,966 8,661
Other provisions 12,618 15,962 19,435 9,861 8,277 14,085 13,893 12,792 14,115 17,164 19,385
Loans 13,432 1,047 5,018 12,206 18,233 29,710 22,494 24,677 13,968 13,097 9,779
Liabilities associated with assets held for sale – – – – – – – – – – 280
Other liabilities 30,470 35,246 39,480 23,541 28,123 60,684 54,051 54,099 62,319 73,998 74,988
Shareholders’ equity and liabilities 117,970 118,331 137,016 145,962 146,183 204,687 185,181 179,468 175,234 194,985 200,281

156 Financial information 2006
Eleven-year summary
Consolidated cash-fl ow statements SEK bn 1996 1997 1998 1999 2000 2001 2002 2003 2004 2005 2006
Operating income 1 13.2 12.8 11.8 7.5 6.7 (0.7) 2.8 2.5 14.7 18.2 20.4
Depreciation and amortization 5.4 6.8 9.6 5.2 6.3 10.0 10.8 10.2 10.0 9.9 12.4
Other items not affecting cash 2 (3.5) (4.9) (0.3) (0.4) 0.5 2.0 4.9 (0.1) 0.4 0.7
Change in working capital 2 (11.2) 4.7 1.5 (1.0) (3.3) 6.4 1.0 0.4 (1.4) (4.7) (2.5)
Customer fi nancing receivables, net (4.8) (15.5) (12.8) (7.1) (4.5) (3.7) (5.7) (4.3) (7.4) (7.8) (5.2)
Financial items and income tax 2 (0.4) (2.0) (1.7) (1.3) (2.1) (1.3) (0.9) (0.5) (2.0) (4.3)
Cash fl ow from operating activities 2.6 4.9 3.2 2.6 3.5 10.4 9.6 12.8 15.3 14.0 21.5
Investments in fi xed assets (8.2) (9.9) (10.5) (4.9) (5.4) (8.1) (6.7) (6.0) (7.4) (10.3) (10.0)
Investments in leasing assets (3.9) (9.8) (12.7) (5.6) (5.7) (5.8) (5.2) (5.3) (4.4) (4.5) (4.6)
Disposals of fi xed assets and leasing assets 2.0 1.8 2.6 1.6 2.1 2.6 3.2 2.9 2.4 2.6 3.2
Shares and participations, net 14.1 10.7 5.5 (25.9) (1.6) 3.9 (0.1) (0.1) 15.1 0.3 (5.8)
Acquired and divested subsidiaries and other business units, net (0.9) (1.3) (5.6) 31.0 0.0 13.0 (0.2) 0.0 (0.1) 0.7 0.5
Interest-bearing receivables including marketable securities (7.7) 10.1 3.5 (16.9) 11.7 (3.7) (1.5) (2.0) (6.4) (1.3) 7.7
Cash fl ow after net investments (2.0) 6.5 (14.0) (18.1) 4.6 12.3 (0.9) 2.3 14.5 1.5 12.5
Increase (decrease) in loans 6.8 5.6 19.5 16.3 8.1 6.2 (0.1) 1.9 (8.8) 3.6 (2.6)
Repurchase of own shares – – – – (11.8) (8.3) – – (2.5) (1.8) –
Cash dividend to AB Volvo’s shareholders (1.9) (2.0) (2.2) (2.6) (3.1) (3.4) (3.4) (3.4) (3.4) (5.1) (6.8)
Other (5.0) (5.9) (0.2) (0.1) 0.0 0.1 0.1 0.1 0.0 0.0 0.0
Change in cash and cash equivalents excluding translation differences (2.1) 4.2 3.1 (4.5) (2.2) 6.9 (4.3) 0.9 (0.2) (1.8) 3.1
Translation differences on cash and cash equivalents (0.3) 0.3 0.3 (0.2) 0.3 0.6 (0.7) (0.6) (0.2) 1.1 (0.5)
Change in cash and cash equivalents (2.4) 4.5 3.4 (4.7) (1.9) 7.5 (5.0) 0.3 (0.4) (0.7) 2.6
1 1999, excluding gain on sale of Volvo Cars of SEK 26.7 billion. 2 Reported on a single line in 1996.
Operating cash fl ow excluding Financial Services SEK bn 1996 1997 1998 1999 2000 2001 2002 2003 2004 2005 2006
Operating income 12.8 12.4 11.1 6.4 5.2 (1.0) 2.3 1.6 13.3 16.1 18.1
Depreciation and amortization 4.4 5.0 6.4 3.1 3.8 7.0 7.8 7.2 7.1 7.3 10.0
Other items not affecting cash (4.0) (5.5) (0.5) (1.6) 0.0 1.0 4.1 (0.6) 0.2 0.6
Change in working capital (11.1) 3.7 0.4 (1.6) (3.0) 6.8 0.4 0.7 (1.4) (5.6) (3.1)
Financial items and income taxes (0.5) (2.3) (1.7) (0.8) (2.3) (1.1) (0.7) (0.2) (1.9) (3.7)
Cash fl ow from operating activities 6.1 16.6 10.1 5.7 3.6 10.5 10.4 12.9 18.2 16.1 21.9
Investments in fi xed assets (8.0) (9.5) (10.2) (4.7) (5.1) (7.7) (6.3) (5.8) (7.2) (9.9) (9.7)
Investments in leasing assets (0.8) (0.5) (0.9) (0.5) (0.6) (0.5) (0.1) (0.1) (0.3) (0.3) (0.5)
Disposals of fi xed assets and leasing assets 1.8 1.0 1.5 0.8 0.7 1.1 1.1 0.6 0.7 0.9 0.9
Operating cash fl ow (0.9) 7.6 0.5 1.3 (1.4) 3.4 5.1 7.6 11.4 6.8 12.6
Eleven-year summary

Financial information 2006 157
Exports from Sweden SEK M 1996 1997 1998 1999 2000 2001 2002 2003 2004 2005 2006
Volvo Group, total 54,589 58,569 64,401 52,719 46,251 50,394 52,730 49,300 62,653 71,133 80,517
Key ratios 1996 1997 1998 1999 2000 2001 2002 2003 2004 2005 2006
Gross margin % 1 22.3 24.4 23.2 20.3 19.3 17.2 17.9 19.2 21.6 21.8 22.5
Research and development expenses as percentage of net sales1 5.3 4.9 4.9 3.9 4.1 3.0 3.3 3.9 3.8 3.3 3.4
Selling expenses as percent of net sales1 9.5 9.4 9.0 7.0 7.7 8.1 8.7 9.1 9.1 8.5 8.1
Administration expenses as percentage of net sales1 4.3 3.9 3.9 4.0 3.9 3.6 3.1 3.0 2.6 2.7 2.6
Return on shareholders’ equity, % 23.7 17.2 13.0 34.9 5.0 neg 1.7 0.4 13.9 17.8 19.6
Interest coverage, times1s 5.5 5.8 9.6 23.1 4.5 neg 2.2 1.9 11.0 16.7 26.1
Self-fi nancing ratio, % 26 27 16 29 39 92 110 152 163 116 189
Self-fi nancing ratio excluding Financial Services, % 87 184 105 130 72 148 196 243 268 173 235
Net fi nancial position, SEK M 10,672 16,956 12,232 28,758 9,392 (7,042) (6,063) (2,426) 18,110 18,675 24,679
Net fi nancial position as percentage of shareholders’ equity and minority interests 18.3 27.0 17.4 29.3 10.6 (8.2) (7.7) (3.3) 25.8 23.7 28.3
Shareholders’ equity as percentage of total assets 41.4 38.1 34.1 50.2 44.3 32.8 32.8 31.4 31.3 30.6 33.7
Shareholders’ equity as percentage of total assets, excluding Financial Services 49.4 53.1 51.2 67.3 60.8 41.8 42.4 40.5 40.0 40.4 43.5
Shareholders’ equity excluding minorityinterest as percentage of total assets 41.0 37.6 33.7 49.9 44.0 32.6 32.7 31.3 31.2 30.5 33.6
1 1996 including Financial Services. As from 1997 Financial Services is accounted by the equity method.

158 Financial information 2006
Eleven-year summary
Data per share (adjusted for issues and splits)1
1996 1997 1998 1999 2000 2001 2002 2003 2004 2005 2006
Basic earnings, SEK 1 26.90 23.20 19.10 73.00 11.20 (3.50) 3.32 0.71 23.58 32.22 40.20
Cash dividend, SEK 4.30 5.00 6.00 7.00 8.00 8.00 8.00 8.00 12.50 16.75 25.00 9
Share price at year-end, SEK (B share) 151 213 186 220 156.50 176 142 220 263.50 374.50 471.50
Direct return, % (B share) 2 2.9 2.3 3.2 3.2 5.1 4.5 5.6 10.5 8 4.7 4.5 5.3
Effective return, % (B share) 3 30 46 (10) 22 (23) 17.6 (14.8) 71.2 25.5 48.5 39.2
Price/earnings ratio (B share) 4 6 9 9 3 14 neg 43 310 11.2 11.6 11.7
EBIT multiple 5 16 9 11 10 10 25 23 14 9.2 9.3 9.8
Payout ratio, % 6 16 22 31 10 71 neg 242 1,143 53 52 62
Shareholders’ equity, SEK 7 125 140 157 221 222 203 187 173 170 194 215
Return on shareholders’ equity 23.7 17.2 13.0 34.9 5.0 neg 1.7 0.4 13.9 17.8 19.6
VOLVO SHARE STATISTICS
Other share data 1996 1997 1998 1999 2000 2001 2002 2003 2004 2005 2006
Number of shareholders at year-end 176,800 225,500 210,600 238,000 230,000 214,000 211,000 208,500 202,300 195,442 183,735
Number of Series A shares outstanding at year-end, millions 142.2 138.6 138.6 138.6 124.7 131.7 131.7 131.7 131.5 131.4 131.4
Number of Series B shares outstanding at year-end, millions 321.4 302.9 302.9 302.9 272.6 287.8 287.8 287.8 278.6 273.1 273.4
Average number of outstanding shares, millions 463.6 452.5 441.5 441.5 421.7 422.4 419.4 419.4 418.5 405.2 404.7
Number of Series A shares traded in Stockholm during the year, millions 23.7 23.7 34.5 27.0 42.4 40.3 27.3 31.4 42.0 39.3 56.4
Number of Series B shares traded in Stockholm during the year, millions 316.4 362.7 371.3 479.6 391.2 344.4 349.4 404.8 498.0 518.7 617.0
Number of shares traded in ADR, NASDAQ during the year, millions 83.0 51.8 50.5 54.9 16.0 15.0 11.0 10.4 24.0 19.8 14.1
1 Effective in 1997, adjustment was made to conform with the Swedish Finan-cial Accounting Standard Council’s recommendation, RR9, Income Taxes. Basic earnings per share is calculated as income for the period divided by average number of shares outstanding. Reporting according to IFRS for 2004, 2005 and 2006.
2 Proposed dividend in SEK per share divided by share price at year-end.3 Share price at year-end, including proposed dividend during the year,
divided by share price at beginning of the year, (including redemption in 1997, distribution of one share of Swedish Match 1996, and 2006 includes a proposed share split 6:1 in which the sixth share will be redeemed by AB Volvo for an amount of SEK 25.00 per share).
4 Share price at year-end divided by basic earnings per share.5 Market value at year-end minus net fi nancial position and minority inter-
ests divided by operating income excluding restructuring costs and revalu-ation of shares.
6 Cash dividend divided by basic earnings per share. 7 Shareholders’ equity for shareholders in AB Volvo divided by number of
shares outstanding at year-end. 8 Including distribution of shares in Ainax equal to SEK 15.05 per Volvo
share in 2004.9 Proposed by the Board of Directors.
The largest shareholders in AB Volvo, December 31, 2006 1 Number % of Share
of shares total votes 2 capital, % 2
Renault SA 88,304,177 20.5 20.7
AMF Pension and Funds 17,874,900 4.1 4.2
Swedbank Robur fonder (savings funds) 11,098,720 2.7 2.6
Svenska Handelsbanken 3 10,458,864 6.3 2.5
SEB fonder (savings funds)/ Trygg Försäkring 10,245,452 5.3 2.4
Second Swedish National Pension Fund (AP2) 9,862,055 4.8 2.3
Violet Partners LP 8,340,336 5.1 2.0
Alecta (pension funds) 7,715,000 3.3 1.8
Svenska Handelsbanken/SPP fonder 7,442,092 1.1 1.7
AFA Försäkring 5,414,494 2.0 1.3
Total 176,756,000 55.3 41.5
Distribution of shares, December 31, 2006 Number % of Share of
Volvo shareholders of shareholders total votes 2 capital, %2
1–1,000 shares 174,038 5.5 6.3
1,001–10,000 shares 8,722 3.9 4.9
10,001–100,000 shares 704 3.4 5.0
100,001– 271 87.2 83.8
Total 183,735 100.0 100.0
1 Following the repurchase of its own shares, AB Volvo held 4.9% of the Company´s shares on Dec. 31, 2006.
2 Based on all registered shares.3 Svenska Handelsbanken comprises shares held by Svenska
Handelsbanken, Svenska Handelsbanken Pension Fund, Svenska Handelsbanken Personnel Foundation, Svenska Handelsbanken pensions-kassa and Oktogonen.
Eleven-year summary

Financial information 2006 159
Net sales1
SEK M 1996 1997 1998 1999 2000 2001 2002 2003 2004 2005 2006
Trucks Western Europe 21,244 22,280 27,837 30,006 30,415 60,841 61,406 63,097 68,664 70,567 75,157
Eastern Europe 1,721 2,274 3,089 2,265 3,158 5,526 6,424 7,004 8,767 9,139 13,166
North America 8,510 12,206 17,659 22,303 17,048 33,630 33,721 28,151 35,154 46,129 50,605
South America 2,759 3,832 3,777 2,190 3,111 3,993 3,277 3,464 5,223 7,657 9,213
Asia 2,577 2,410 2,047 2,010 3,432 4,659 5,919 9,206 12,378 13,551 8,975
Other markets 1,443 1,503 1,267 1,492 1,911 7,919 8,005 6,047 6,693 8,353 9,190
Total 38,254 44,505 55,676 60,266 59,075 116,568 118,752 116,969 136,879 155,396 166,306
Buses Western Europe 4,660 5,082 5,528 5,735 6,767 6,263 6,695 6,153 6,422 6,564 6,975
Eastern Europe 80 190 366 226 182 373 409 381 526 578 534
North America 1,575 2,314 5,574 6,871 7,723 6,847 3,838 2,984 2,960 4,247 4,910
South America 853 1,002 910 469 732 757 366 329 521 2,641 1,537
Asia 1,112 1,562 1,519 943 1,269 1,839 2,022 1,447 1,632 1,612 2,003
Other markets 247 432 389 469 514 596 705 684 661 947 897
Total 8,527 10,582 14,286 14,713 17,187 16,675 14,035 11,978 12,722 16,589 16,856
Construction Western Europe 7,163 7,836 9,557 9,901 10,029 10,326 10,383 11,576 12,443 14,213 16,871Equipment Eastern Europe 93 263 336 193 255 341 454 772 1,010 1,311 1,888
North America 3,385 5,680 6,548 5,725 5,823 6,145 5,667 5,428 8,601 10,337 11,280
South America 598 991 957 498 776 847 709 636 922 1,238 1,358
Asia 937 1,036 1,092 1,903 2,484 2,773 3,048 3,707 4,961 5,717 6,903
Other markets 628 847 882 662 626 703 751 1,035 1,423 2,000 2,264
Total 12,804 16,653 19,372 18,882 19,993 21,135 21,012 23,154 29,360 34,816 40,564
Volvo Penta Western Europe 2,048 2,219 2,725 2,986 3,204 3,789 3,846 4,081 4,723 4,845 5,459
Eastern Europe 2 34 23 26 30 38 99 108 184 257 363
North America 1,142 1,332 1,412 1,770 2,257 2,175 2,261 2,109 2,500 2,832 2,815
South America 109 136 153 134 160 213 127 146 142 208 221
Asia 486 643 476 692 794 988 1,141 947 1,324 1,427 1,359
Other markets 98 102 142 153 154 177 195 205 184 207 268
Total 3,885 4,466 4,931 5,761 6,599 7,380 7,669 7,596 9,057 9,776 10,485
Volvo Aero Western Europe 2,950 3,682 4,231 4,560 4,651 4,788 3,422 3,951 3,130 3,346 3,489
Eastern Europe 8 6 47 16 42 87 28 49 49 60 124
North America 1,071 3,066 3,502 4,557 5,040 5,841 4,573 3,301 3,127 3,612 3,815
South America 4 257 284 193 134 187 177 152 138 168 173
Asia 89 264 336 491 701 708 497 428 400 284 356
Other markets 21 201 184 136 145 173 140 149 81 68 91
Total 4,143 7,476 8,584 9,953 10,713 11,784 8,837 8,030 6,925 7,538 8,048
Other and eliminations 2,669 3,436 4,781 6,807 6,825 7,073 6,775 7,041 7,228 7,076 5,876
Net sales excl Financial Services 70,282 87,118 107,630 116,382 120,392 180,615 177,080 174,768 202,171 231,191 248,135
Financial Western Europe 5,384 4,461 5,465 6,300 6,240 5,314 5,573 5,604 6,114 4,213 7,091Services Eastern Europe 0 0 86 185 257 360 424 474 499 584 379
North America 54 509 1,152 1,620 2,626 3,216 3,344 2,542 2,432 2,036 799
South America 153 72 297 455 452 451 403 358 396 570 617
Asia 0 0 0 1 0 24 49 65 90 101 45
Other markets 44 52 224 76 103 130 132 110 67 45 38
Total 5,635 5,094 7,224 8,637 9,678 9,495 9,925 9,153 9,598 7,549 8,969
Eliminations – – – – – (830) (807) (630) (693) 1,819 1,731
Volvo Group excludingdivested operations 75,917 92,212 114,854 125,019 130,070 189,280 186,198 183,291 211,076 240,559 258,835
Cars 83,589 96,453 103,798 – – – – – – – –
Other divested operations and eliminations (3,446) (5,040) (5,716) – – – – – – – –
Volvo Group total 156,060 183,625 212,936 125,019 130,070 189,280 186,198 183,291 211,076 240,559 258,835
Effective in 1997, the Volvo Group’s accounting per market area refl ects geo-graphical defi nitions, based on an ISO standard. The fi gures for 1996 have been adjusted to conform with the new principle.
1 Net sales 1996–2001 have been restated in accordance with new organi-zation effective from 2002.
BUSINESS AREA STATISTICS

Eleven-year summary
Operating income SEK M 1996 8 1997 7 1998 6 1999 5 2000 2001 4 2002 2003 3 2004 2 2005 2006 1
Trucks 9 783 1,707 2,769 3,247 1,414 (2,066) 1,189 3,951 8,992 11,717 12,657
Buses 331 550 (37) 224 440 (916) (94) (790) 158 470 633
Construction Equipment 1,162 1,436 626 1,709 1,594 527 406 908 1,898 2,752 3,888
Volvo Penta (27) 181 (63) 314 484 658 647 695 940 943 1,002
Volvo Aero 153 472 527 584 621 653 5 (44) 403 836 345
Financial Services 244 375 681 1,066 1,499 325 490 926 1,365 2,033 2,301
Other 9,377 3,624 3,950 319 616 143 194 (3,142) 923 (598) (427)
Volvo Group excluding divested operations 12,023 8,345 8,453 7,463 6,668 (676) 2,837 2,504 14,679 18,153 20,399
Cars 1,080 4,409 3,375 26,695 – – – – – – –
Other divested operations 91 – – – – – – – – – –
Operating income (loss) Volvo Group 13,194 12,754 11,828 34,158 6,668 (676) 2,837 2,504 14,679 18,153 20,399
1 Operating income in 2006 includes adjustment of goodwill of (1,712), reported in Trucks.
2 Operating income in 2004 included reversal of write-down of shares in Scania AB of 915, reported in Other, and write-down of shares in Henlys Group Plc of 95, reported in Buses.
3 Operating income in 2003 included write-down of shares in Scania AB and Henlys Group Plc amounting to 4,030, of which 429 was reported in Buses (Henlys Group) and 3,601 was reported in Other (Scania AB).
4 Operating income in 2001 included restructuring costs mainly related to the integration of Mack Trucks and Renault Trucks of 3,862 of which 3,106 in Trucks, 392 in Buses and 364 in Construction Equipment.
5 Effective January 1, 1999, Volvo Cars was reported as a divested operation. The capital gain from the divestment was 26,695.
6 Restructuring costs in 1998 amounted to 1,650 of which 46 in Trucks, 422 in Buses, 910 in Construction Equipment and 158 in Volvo Penta. In addi-tion operating income included a capital gain from the sale of shares in Pharmacia UpJohn amounting to 4,452.
7 Operating income in 1997 included a capital gain from the sale of shares in Pripps Ringnes amounting to 3,027.
8 Operating income in 1996 included a capital gain from the sale of shares in Pharmacia UpJohn amounting to 7,766.
9 Refers to Volvo Trucks for 1996–2000.
Operating margin% 1996 1997 1998 1999 2000 2001 2002 2003 2004 2005 2006
Trucks 2.0 3.8 5.0 5.4 2.4 (1.8) 1.0 3.4 6.6 7.5 7.6
Buses 3.9 5.2 (0.3) 1.5 2.6 (5.5) (0.7) (6.6) 1.2 2.8 3.8
Construction Equipment 9.1 8.6 3.2 9.1 8.0 2.5 1.9 3.9 6.5 7.9 9.6
Volvo Penta (0.7) 4.1 (1.3) 5.5 7.3 8.9 8.4 9.1 10.4 9.6 9.6
Volvo Aero 3.7 6.3 6.1 5.9 5.8 5.5 0.1 (0.5) 5.8 11.1 4.3
Volvo Group excluding divested operations 17.1 9.6 7.9 6.4 5.5 (0.4) 1.6 1.4 7.3 7.9 8.2
Operating margin, total 8.8 7.1 5.7 29.3 5.5 (0.4) 1.6 1.4 7.3 7.9 8.2
Number of employees at year-end Number 1996 1997 1998 1999 2000 2001 2002 2003 2004 2005 2006
Trucks 20,860 22,090 22,560 23,330 24,320 44,180 43,470 46,900 49,450 50,240 49,900
Buses 3,750 4,220 8,690 8,860 9,060 6,230 6,660 6,680 7,700 7,710 7,760
Construction Equipment 7,300 8,550 9,680 8,900 8,830 7,780 8,410 9,280 9,930 10,290 11,050
Volvo Penta 1,420 1,400 1,490 1,400 1,480 1,370 1,410 1,440 1,580 1,560 1,650
Volvo Aero 3,740 4,170 3,990 4,550 4,240 4,040 3,660 3,440 3,350 3,460 3,510
Financial Services 560 710 860 1,160 1,220 1,080 1,060 1,060 1,100 1,070 1,140
Other 3,090 3,840 5,190 5,270 5,120 6,240 6,490 6,940 7,970 7,530 8,180
Volvo Group, excluding divested operations 40,720 44,980 52,460 53,470 54,270 70,920 71,160 75,740 81,080 81,860 83,190
Cars 29,600 27,920 27,360 – – – – – – – –
Other divested operations 10 – – – – – – – – – –
Volvo Group, total 70,330 72,900 79,820 53,470 54,270 70,920 71,160 75,740 81,080 81,860 83,190
Eleven-year summary
160 Financial information 2006

Financial information 2006 161
EmployeesNumber 1996 1997 1998 1999 2000 2001 2002 2003 2004 2005 2006
Sweden 43,330 43,650 43,900 24,840 25,030 24,350 25,420 26,380 28,530 27,070 27,830
Europe, excluding Sweden 15,290 16,100 17,880 11,900 12,320 27,800 27,130 29,120 28,930 29,650 30,070
North America 6,900 8,450 12,100 11,880 11,410 12,670 12,440 12,270 14,620 15,140 14,820
South America 2,130 2,000 1,980 1,930 2,100 2,090 2,020 2,640 3,110 3,690 3,890
Asia 2,260 1,720 3,340 2,480 2,570 2,550 2,590 3,710 4,130 4,210 4,420
Other markets 420 980 620 440 840 1,460 1,560 1,620 1,760 2,100 2,160
Volvo Group total 70,330 72,900 79,820 53,470 54,270 70,920 71,160 75,740 81,080 81,860 83,190
Delivered units Number 1996 1997 1998 1999 2000 2001 2002 2003 2004 2005 2006
Heavy trucks (>16 tons) 59,100 63,930 78,690 81,240 76,470 117,180 120,200 120,920 152,300 172,242 179,089
Medium-heavy trucks (7–15.9 tons) 4,580 5,050 4,590 3,850 5,360 17,310 16,220 15,870 18,800 18,643 14,695
Light trucks (<7 tons) 20,820 20,710 19,200 22,120 23,494 26,147
Total trucks 63,680 68,980 83,280 85,090 81,830 155,310 157,130 155,990 193,220 214,379 219,931
Buses and bus chassis 7,410 8,730 10,200 9,500 11,015 9,953 9,059 7,817 8,232 10,675 10,360
Environmental performance of Volvo production plants Absolute values related to net sales 2002 2003 2004 2005 2006
Energy consumption (GWh; MWh/SEK M) 2,564; 14.5 2,607; 14.9 2,695; 13.3 2,683; 11.6 2,612; 10.5
CO2 emissions (1,000 tons; tons/SEK M) 307; 1.7 298; 1.7 293; 1.5 292; 1.3 282; 11.4
Water consumption (1,000 m3; m3/SEK M) 9,202; 52.0 8,587; 49.1 8,495; 42.0 7,419; 32.1 7,596; 30.6
NOx emissions (tons; kilos/SEK M) 726; 4.1 570; 3.3 645; 3.2 672; 2.9 606; 2.4
Solvent emissions (tons; kilos/SEK M) 1,896; 10.7 1,965; 11.2 2,085; 10.3 1,960; 8.5 2,048; 8.3
Sulphur dioxide emissions (tons; kilos/SEK M) 173; 1.0 200; 1.1 184; 0.9 209; 0.9 69; 0.3
Hazardous waste (tons; kg/SEK M) 20,531; 116 21,613; 124 24,675; 122.1 23,590; 102 26,987; 108.8
Net sales, SEK bn 177.1 174.8 202.1 231.2 248.1
Number 1996 1997 1998 1999 2000 2001 2002 2003 2004 2005 2006
Trucks Total Europe 34,970 34,470 42,350 42,530 46,140 98,040 96,290 92,080 102,670 103,622 114,417
Western Europe 32,310 31,040 37,810 39,630 42,050 90,460 87,490 82,670 90,750 91,087 97,074
Eastern Europe 2,660 3,430 4,540 2,900 4,090 7,580 8,800 9,410 11,920 12,535 17,343
North America 16,850 20,900 29,310 34,300 23,610 34,650 36,510 34,760 49,270 64,974 70,499
South America 4,980 6,970 6,020 3,900 4,530 5,790 5,360 5,980 9,190 11,248 11,646
Asia 4,850 4,710 3,760 2,720 5,560 6,600 9,140 16,290 24,880 25,706 12,817
Other markets 2,030 1,930 1,840 1,640 1,990 10,230 9,830 6,880 7,210 8,829 10,552
Total 63,680 68,980 83,280 85,090 81,830 155,310 157,130 155,990 193,220 214,379 219,931
Buses Total Europe 3,840 4,190 3,860 3,630 3,994 3,115 3,413 3,087 3,417 3,723 3,570
Western Europe 3,770 4,030 3,580 3,430 3,870 2,899 3,076 2,782 3,073 3,385 3,246
Eastern Europe 70 160 280 200 124 216 337 305 344 338 324
North America 750 1,110 2,730 3,640 3,869 3,128 1,945 1,553 1,388 1,546 1,741
South America 1,460 1,350 1,510 710 980 1,009 495 369 624 2,297 1,170
Asia 1,060 1,410 1,650 1,000 1,659 2,209 2,639 2,227 2,341 2,554 3,349
Other markets 300 670 450 520 513 492 567 581 462 555 530
Total 7,410 8,730 10,200 9,500 11,015 9,953 9,059 7,817 8,232 10,675 10,360
Effective in 1997, The Volvo Group’s accounting per market area refl ects geographical defi nitions based on an ISO standard. The accounting for the year 1996 has been adjusted to conform with the new principle.

Customer offering
Marine and industrial applications
Volvo Penta manufactures engines and drive systems for marine applications, for both leisure and commercial craft, with an engine range of 10 to
2,000 hp. Volvo Penta also supplies industrial engines ranging from 75 kW to 600 kW for irrigation pumps, generator units and other application
areas.
Marine leisure Marine commercial Industrial engines
Trucks
All three brands in the Volvo Group’s truck operations have a unique and distinct brand-specific character and compete in certain markets.
Mack Trucks, Renault Trucks and Volvo Trucks offer customers a broad range of products and services for efficient and economic transports.
Long-haul City distributionRegional distribution Construction
Mac
k Tr
ucks
Ren
ault
Truc
ksVo
lvo
Truc
ks
Buses
Volvo Buses’ product line includes complete buses, bus chassis for city, intercity and coach traffic. The company has a total offering that, in addition
to buses, includes a global service network, efficient spare parts handling, service and repair contracts, financial services and traffic information
systems.
City buses Intercity buses Coaches Chassis
162 Customer offering 2006

Construction equipment
Volvo Construction Equipment develops, manufactures and markets equipment for construction and related industries. Its products are leaders in
many world markets, and include a comprehensive range of wheel loaders, hydraulic wheeled and crawler excavators, articulated haulers, motor
graders and a wide range of compact equipment.
Compact construction equipment Heavy construction equipment
Aerospace industry
Volvo Aero specializes in a number of highly advanced components for aircraft engines and space rockets. More than 90% of all new large commercial
aircraft are equipped with engine components from Volvo Aero, which is also responsible for the engines of the Swedish Air Force’s Gripen fighters.
Volvo Aero also has a substantial after-market.
Engine components Engine overhaul Space
Financial services
Financial Services contributes to create shareholder value through its customer and dealer financing activities, plus its treasury and real estate
operations. Providing cost effective and attractive financing solutions is essential in retaining existing customers and attracting new ones to the
Volvo Group.
Customer financing In-house bank Property management
Definitions
Basic earnings per share
Income for the period attributable to shareholders of the parent company
divided by the weighted average number of shares outstanding during
the period.
Capital expenditures
Capital expenditures include investments in property, plant and equip-
ment, intangible assets and assets under operating leases. Investments
in fixed assets included in the Group’s cash flow statement include only
capital expenditures that have reduced the Group’s liquid funds during
the year.
Cash-flow
Combined changes in the Group’s liquid funds during the fiscal year.
Changes inliquid funds are specified with reference to changes in ope-
rations, operating activities, changes depending on investments in
equipment, fixed assets etc and financing acitivites such as changes in
loans and investments.
Diluted earnings per share
Diluted earnings per share is calculated as income for the period attri-
butable to the Parent Company’s shareholders divided by the average
number of shares outstanding plus the average number of shares that
would be issued as an effect of ongoing share-based incentive programs
and employee stock option programs.
Equity ratio
Shareholders’ equity divided by total assets.
Interest coverage
Operating income plus interest income and similar credits divided by
interest expense and similar charges.
Joint ventures
Companies over which the Company has joint control together with one
or more external parties.
Net financial position
Cash and cash equivalents, marketable securities and interest-bearing
short- and long-term receivables reduced by short- and long-term inte-
rest-bearing loans and provisions for post-employment benefits. Net
debt in Financial Services is not included since the interest expense on
these liabilities is charged against operating income and does not affect
consolidated interest net.
Operating margin
Operating income divided by net sales.
Return on shareholders’ equity
Income for the period divided by average shareholders’ equity.
Self-financing ratio
Cash-flow from operating activities (see Cash-flow statement) divided
by net investments in fixed assets and leasing assets as defined in the
cash-flow statement.

AB
Vol
vo, I
nves
tor R
elat
ions
, 63
5 3
104
Annual General Meeting, April 4, 2007The Annual General Meeting of AB Volvo will be held in Göteborg in Lisebergshallen (entrance from Örgrytevägen) Wednesday April 4, 2007, at 3:00 p.m.
Notice Shareholders who wish to participate must: be recorded in the share register maintained by VPC AB (Swedish Central Securities Depository) not later than March 29, 2007, give notice of intention to attend not later than 12:00, Thursday, March 29, 2007.
• by telephone, +46 31 66 00 00 beginning March 5• by mail addressed to AB Volvo (publ), Legal Department, SE-405 08 Göteborg, Sweden • at Volvo’s website www.volvo.com
When giving notice, shareholders should state their: • name • personal number (registration number) • address and telephone number• name and personal number (registration number) of the proxy, if any• name(s) of any accompaning assistant(s)
Shareholders whose shares are held in the trust department of a bank or by a brokerage firm should request the shares to be temporarily registered in the shareholder’s name several banking days prior to March 29, 2007.
April 11, 2007 has been proposed as the record date for dividends, which are expected to be distributed on April 16, 2007.
Volvo’s Election CommitteeThe following persons are members of Volvo’s Election Committee: Curt Källströmer Chairman of the Election Committee, Svenska Handelsbanken Finn Johnsson Chairman of the Board Thierry Moulonguet Renault SA Björn Lind SEB funds Lars Förberg Violet Partners LP Eva Halvarsson1 Second Swedish National Pension Fund
1 Co-opted to the Election Committee
The Election Committee is responsible for submitting to the Annual General Meeting the names of candidates to serve as members of the Board of Directors and as auditors. The Committee also proposes the amount of the fees to be paid to the holders of these positions.
Preliminary publication dates
Form 20-F US GAAP 2006 May, 2007
Three months ended March 31, 2007 April 25, 2007
Six months ended June 30, 2007 July 25, 2007
Nine months ended September 30, 2007 October 24, 2007
Report on 2007 operations February, 2008
Annual Report 2007 March, 2008
The reports are available on www.volvo.com on date of publication and are also sent directly to all shareholders who have advised Volvo that they wish to receive financial information.
Historical and current time series reflecting the Volvo Group’s market information and share data are published regularly on www.volvo.com.
Contacts
Investor Relations: Christer Johansson +46 31-66 13 34Patrik Stenberg +46 31-66 13 36Joakim Wahlström +46 31-66 11 91John Hartwell +1 212 418 7432
Aktiebolaget Volvo (publ) 556012-5790 Investor Relations, VHK SE-405 08 Göteborg Tel +46 31-66 00 00
Fax +46 31-53 72 96 E-mail [email protected]
The V
olvo
Gro
up 2
00
6w
ww
.volvo.com