
ANALYTICAL APPROACH IN CREATING VALUE FOR FOREIGN ...
155
T.C. DOKUZ EYLÜL ÜNİVERSİTESİ SOSYAL BİLİMLER ENSTİTÜSÜ İNGİLİZCE İŞLETME ANABİLİM DALI İNGİLİZCE İŞLETME YÖNETİMİ PROGRAMI YÜKSEK LİSANS TEZİ ANALYTICAL APPROACH IN CREATING VALUE FOR FOREIGN CUSTOMERS OF TURKISH FIVE STAR HOTEL SERVICES: QUALITY FUNCTION DEPLOYMENT (QFD) MODEL Cristalina DANII Danışman Doç. Dr. Ayşe Gül BAYRAKTAROĞLU 2011
-
Upload
khangminh22 -
Category
Documents
-
view
1 -
download
0
Transcript of ANALYTICAL APPROACH IN CREATING VALUE FOR FOREIGN ...
T.C.
DOKUZ EYLÜL ÜNİVERSİTESİ
SOSYAL BİLİMLER ENSTİTÜSÜ
İNGİLİZCE İŞLETME ANABİLİM DALI
İNGİLİZCE İŞLETME YÖNETİMİ PROGRAMI
YÜKSEK LİSANS TEZİ
ANALYTICAL APPROACH IN CREATING VALUE
FOR FOREIGN CUSTOMERS OF TURKISH FIVE STAR
HOTEL SERVICES: QUALITY FUNCTION
DEPLOYMENT (QFD) MODEL
Cristalina DANII
Danışman
Doç. Dr. Ayşe Gül BAYRAKTARO ĞLU
2011
ii
iii
Yemin Metni
Yüksek Lisans Tezi olarak sunduğum “Analytical Approach in Creating
Value for Foreign Customers of Turkish Five Stars Hotel Services: Quality
Function Deployment (QFD) Model” adlı çalışmanın, tarafımdan, bilimsel ahlak ve
geleneklere aykırı düşecek bir yardıma başvurmaksızın yazıldığını ve yararlandığım
eserlerin kaynakçada gösterilenlerden oluştuğunu, bunlara atıf yapılarak
yararlanılmış olduğunu belirtir ve bunu onurumla doğrularım.
Tarih
..../..../.......
Cristalina DANII
İmza
iv
ÖZET
Yüksek Lisans Tezi
Beş Yıldızlı Türk Otel Hizmetlerinin Yabancı Mü şterilerine Değer
Yaratmasında Analitik bir Yakla şım: Kalite Fonksiyon Göçerimi (KFG)
Yöntemi
Cristalina DANII
Dokuz Eylül Üniversitesi Sosyal Bilimler Enstitüsü
İngilizce İşletme Anabilim Dalı Tezli Yüksek Lisans Programı
Günümüzde küreselleşme sonucunda işletmeler artan rekabetle karşı
karşıyadırlar. Bu koşullarda i şletmelerin hayatta kalabilmek için ürettikleri
ürünleri ya da sundukları hizmetleri müşterilerinin istek, ihtiyaç ve
beklentilerini kar şılayacak şekilde planlamaları ve tasarlamaları
gerekmektedir. Kalite Fonksiyon Göçerimi (KFG), firmaların müşterilerini
tanımalarına yardım eden, onların ihtiyaç ve beklentilerine en kısa sürede cevap
verebilen bir yöntemdir. Yöntemin temeli, Müşterilerin Sesini dinlemeye
dayanmaktadır. Bu özellik onu, standart kalite yöntemlerinden ayırmaktadır.
Bu çalışmanın amacı Kalite Fonksiyon Göçeriminin turizm otel
hizmetlerinde uygulamasını ortaya koymaktır. Bu amaç doğrultusunda
Antalya’daki otelcilik sektörünün öncü kurulu şlarından beş yıldızlı bir i şletme
seçilmiştir. Seçilen işletmede KFG süreci uygulanmaya çalışılmış ve bu şekilde
KFG sürecinin seçilen işletmedeki uygulanması incelenmiştir. Bu çalışmada
kullanılan bilgiler, anket ve odak grup çalışması yoluyla otel müşterilerinden
alınmıştır. Aynı zamanda otel yöneticilerinden bir KFG takımı
oluşturulmu ştur. Uygulamaya sırasıyla Ne, Nasıl, Ne ve Nasıl arasındaki
İlişkiler, Ne Kadar kısımlarının oluşturulmasıyla başlanmış ve sonuçta otelin
Kalite Evi ortaya çıkarılmı ştır.
Anahtar Kelimeler: Hizmet, Hizmet Kalitesi, Kalite Fonksiyon Göçerimi, Otelcilik
Sektörü, Kalite Evi
v
ABSTRACT
Master Thesis
Analytical Approach in Creating Value for Foreign Customers of Turkish Five
Stars Hotel Services: Quality Function Deployment (QFD) Model
Cristalina DANII
Dokuz Eylül University Institute of Social Sciences
Department of Business Administration Master Program (with Thesis)
Nowadays, companies are encountered with a strict competition, mainly
due to globalization. Therefore, in order to survive, companies have to plan and
design their products or services according to their customers’ requirements
and expectations. Quality Function Deployment (QFD) is the key instrument to
help companies understand their customers and offers the best solutions to
fulfill customers’ needs. The distinguishing element of the QFD model is to
listen to the Voice of Customers. Thus, it differs from other, standardized
quality measurement methods.
The purpose of this study is to reveal the importance of the QFD model
in the tourism service sector. One of the major five star hotels in Antalya was
chosen in order to analyze the application of the QFD process. The information
used in this study has been derived from questionnaires and focus group studies
with hotel guests. In addition, a QFD team was formed including hotel
managers. The practical implementation of the QFD model started with
specifying features of What, How, What and How Relationships and How Much
inputs and, as a result, a House of Quality for the Case Hotel was built.
Key words: Service, Service Quality, Quality Function Deployment, Hospitality
Industry, House of Quality
vi
CONTENTS
TEZ ONAY SAYFASI ..................................................................................................... ii
YEMIN METNI ................................................................................................................ ii
ÖZET................................................................................................................................. iv
ABSTRACT ....................................................................................................................... v
CONTENTS ...................................................................................................................... vi
ABBREVIATIONS ........................................................................................................... x
TABLES ........................................................................................................................... xi
FIGURES ................................................................................................................. xiii
APPENDIXES .......................................................................................................... xiv
INTRODUCTION ............................................................................................................. 1
CHAPTER I
SERVICES
1.1. IMPORTANCE AND DEFINITION OF SERVICES ............................................... 8
1.2. CHARACTERISTICS OF SERVICES .................................................................... 12
1.2.1. Intangibility ........................................................................................................ 12
1.2.2. Inseparability ...................................................................................................... 13
1.2.3. Variability .......................................................................................................... 14
1.2.4. Perishability ....................................................................................................... 15
1.2.5. Ownership .......................................................................................................... 15
1.3. SERVICES VERSUS PHYSICAL PRODUCTS ..................................................... 16
1.4. MARKETING MIX OF SERVICES ........................................................................ 18
1.4.1. Product ............................................................................................................... 19
1.4.2. Physical Evidence .............................................................................................. 19
1.4.3. Price ................................................................................................................... 20
1.4.4. Place ................................................................................................................... 20
1.4.5. People ................................................................................................................. 20
1.4.6. Promotion ........................................................................................................... 20
vii
1.4.7. Process ............................................................................................................... 21
1.5. DEVELOPMENT OF SERVICES IN WORLD ECONOMIES .............................. 21
1.6. INTERNATIONAL TRADE IN SERVICES ........................................................... 24
1.7. GENERAL OVERVIEW ON SERVICE SECTOR IN TURKEY........................... 27
1.7.1. Turkish Trade in Services and Its FDI Stocks to Other Countries ..................... 27
1.7.2. Turkish Tourism Industry as Substantial Part of Service Sector ....................... 29
CHAPTER II
QUALITY AND SERVICES
2.1. DEFINITION OF QUALITY ................................................................................... 33
2.2. TOTAL QUALITY MANAGEMENT ..................................................................... 36
2.3. ISO QUALITY STANDARDS................................................................................. 39
2.4. THE CONCEPT OF SERVICE QUALITY ............................................................. 42
2.5. SERVICE COMPONENTS INFLUENCING PERCEIVED SERVICE
QUALITY ................................................................................................................ 46
2.6. CUSTOMER EXPECTATIONS .............................................................................. 47
2.7. RELATIONSHIP BETWEEN CUSTOMER EXPECTATIONS,
PERCEPTIONS AND SATISFACTION ................................................................ 50
2.8. SERVICE QUALITY MEASUREMENT METHODS............................................ 52
2.8.1. SERVQUAL ...................................................................................................... 52
2.8.2. LODGSERV ...................................................................................................... 53
2.8.3. LODQUAL, HOLSERV AND HOTELQUAL ................................................. 53
2.8.4. SERVPERF ........................................................................................................ 54
2.8.5. DINESERV ........................................................................................................ 54
2.8.6. QUALITY FUNCTION DEPLOYMENT (QFD) ............................................. 54
CHAPTER III
QUALITY FUNCTION DEPLOYMENT
3.1. REASONS FOR AND BENEFITS OF USING QFD .............................................. 56
3.2. SOME IMPORTANT OBJECTIVES OF QFD ........................................................ 58
viii
3.3. QUALITY DIMENSION DEVELOPMENT ........................................................... 59
3.4. QFD METHODOLOGY ........................................................................................... 61
3.4.1. Customer Requirements ..................................................................................... 63
3.4.2. Customer Importance Ratings ............................................................................ 64
3.4.3. Customer Market Competitive Evaluations ....................................................... 64
3.4.4. Technical Specifications .................................................................................... 64
3.4.5. Relationship Matrix ............................................................................................ 64
3.4.6. Correlation Matrix .............................................................................................. 65
3.4.7. Performance Goals ............................................................................................. 65
3.4.8. Technical Difficulty Assessment ....................................................................... 65
3.4.9. Technical Competitive Evaluation ..................................................................... 65
3.4.10. Overall Importance Ratings ............................................................................. 66
3.5. STRENGTHS AND WEAKNESSES OF QFD ....................................................... 66
3.5.1. Strengths ............................................................................................................. 66
3.5.2. Weaknesses ........................................................................................................ 68
3.6. STUDIES ON QFD .................................................................................................. 69
CHAPTER IV
METHODOLOGY
4.1. RESEARCH ENVIRONMENT................................................................................ 74
4.2. RESEARCH METHODOLOGY .............................................................................. 76
4.2.1. Research Objectives ........................................................................................... 76
4.2.2. Research Hypotheses ......................................................................................... 77
4.2.3. Research Design ................................................................................................. 77
4.2.3.1. Voice of Customers ..................................................................................... 78
4.2.3.1.1. Determination of Customer Requirements .......................................... 78
4.2.3.1.2. Questionnaire Design ........................................................................... 82
4.2.3.1.3. The Sample........................................................................................... 82
4.2.3.1.4. Data Analysis Procedure ...................................................................... 83
4.2.3.2. The Activity of QFD Team ......................................................................... 84
4.2.3.2.1. Technical Specifications ...................................................................... 84
ix
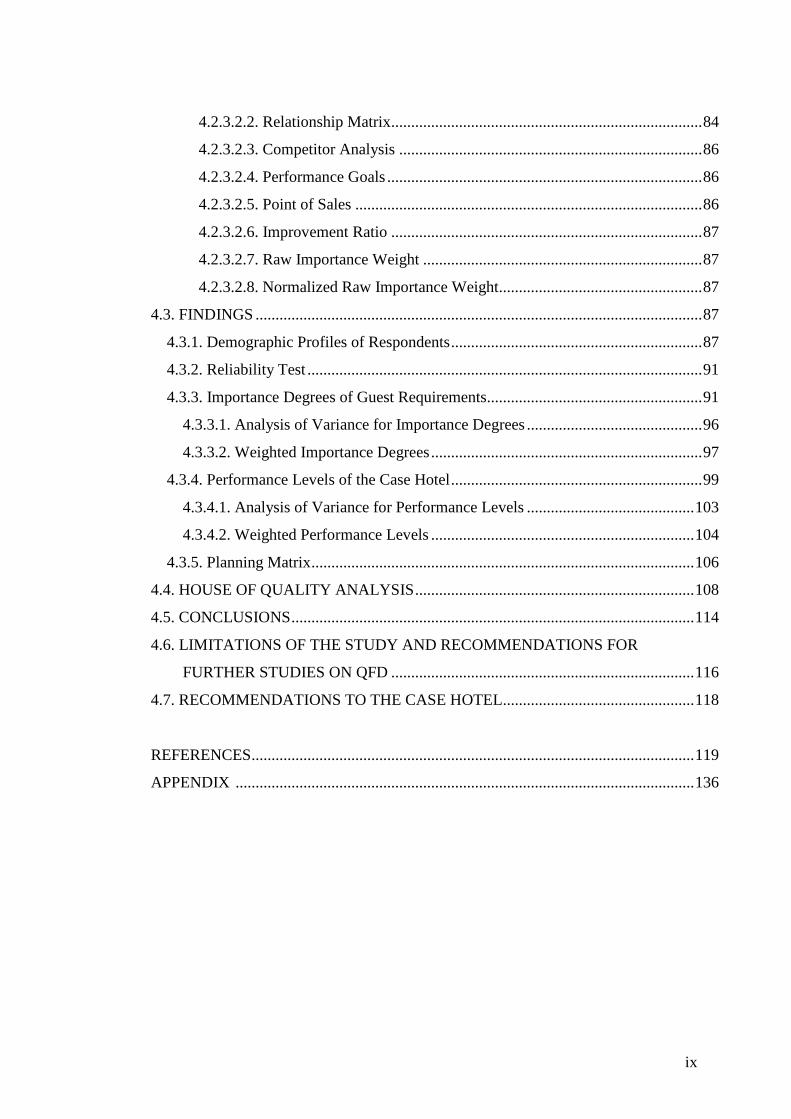
4.2.3.2.2. Relationship Matrix .............................................................................. 84
4.2.3.2.3. Competitor Analysis ............................................................................ 86
4.2.3.2.4. Performance Goals ............................................................................... 86
4.2.3.2.5. Point of Sales ....................................................................................... 86
4.2.3.2.6. Improvement Ratio .............................................................................. 87
4.2.3.2.7. Raw Importance Weight ...................................................................... 87
4.2.3.2.8. Normalized Raw Importance Weight................................................... 87
4.3. FINDINGS ................................................................................................................ 87
4.3.1. Demographic Profiles of Respondents ............................................................... 87
4.3.2. Reliability Test ................................................................................................... 91
4.3.3. Importance Degrees of Guest Requirements...................................................... 91
4.3.3.1. Analysis of Variance for Importance Degrees ............................................ 96
4.3.3.2. Weighted Importance Degrees .................................................................... 97
4.3.4. Performance Levels of the Case Hotel ............................................................... 99
4.3.4.1. Analysis of Variance for Performance Levels .......................................... 103
4.3.4.2. Weighted Performance Levels .................................................................. 104
4.3.5. Planning Matrix ................................................................................................ 106
4.4. HOUSE OF QUALITY ANALYSIS ...................................................................... 108
4.5. CONCLUSIONS ..................................................................................................... 114
4.6. LIMITATIONS OF THE STUDY AND RECOMMENDATIONS FOR
FURTHER STUDIES ON QFD ............................................................................ 116
4.7. RECOMMENDATIONS TO THE CASE HOTEL ................................................ 118
REFERENCES ............................................................................................................... 119
APPENDIX ................................................................................................................... 136
x
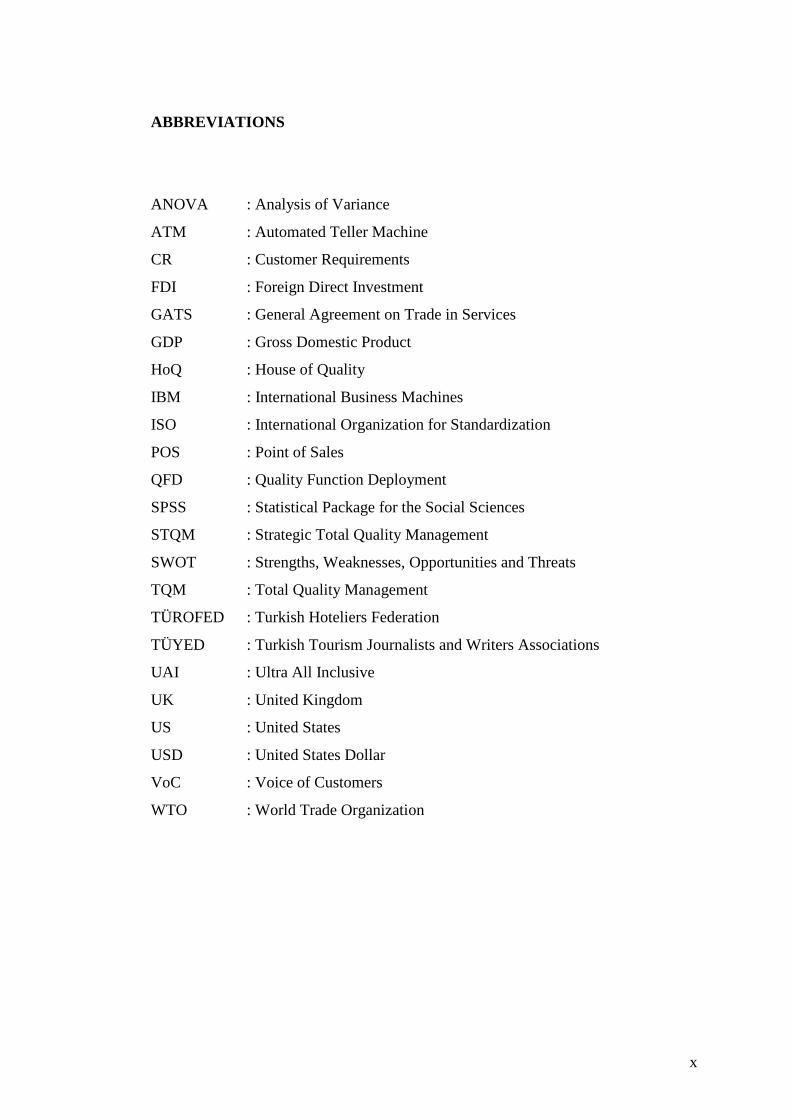
ABBREVIATIONS
ANOVA : Analysis of Variance
ATM : Automated Teller Machine
CR : Customer Requirements
FDI : Foreign Direct Investment
GATS : General Agreement on Trade in Services
GDP : Gross Domestic Product
HoQ : House of Quality
IBM : International Business Machines
ISO : International Organization for Standardization
POS : Point of Sales
QFD : Quality Function Deployment
SPSS : Statistical Package for the Social Sciences
STQM : Strategic Total Quality Management
SWOT : Strengths, Weaknesses, Opportunities and Threats
TQM : Total Quality Management
TÜROFED : Turkish Hoteliers Federation
TÜYED : Turkish Tourism Journalists and Writers Associations
UAI : Ultra All Inclusive
UK : United Kingdom
US : United States
USD : United States Dollar
VoC : Voice of Customers
WTO : World Trade Organization
xi
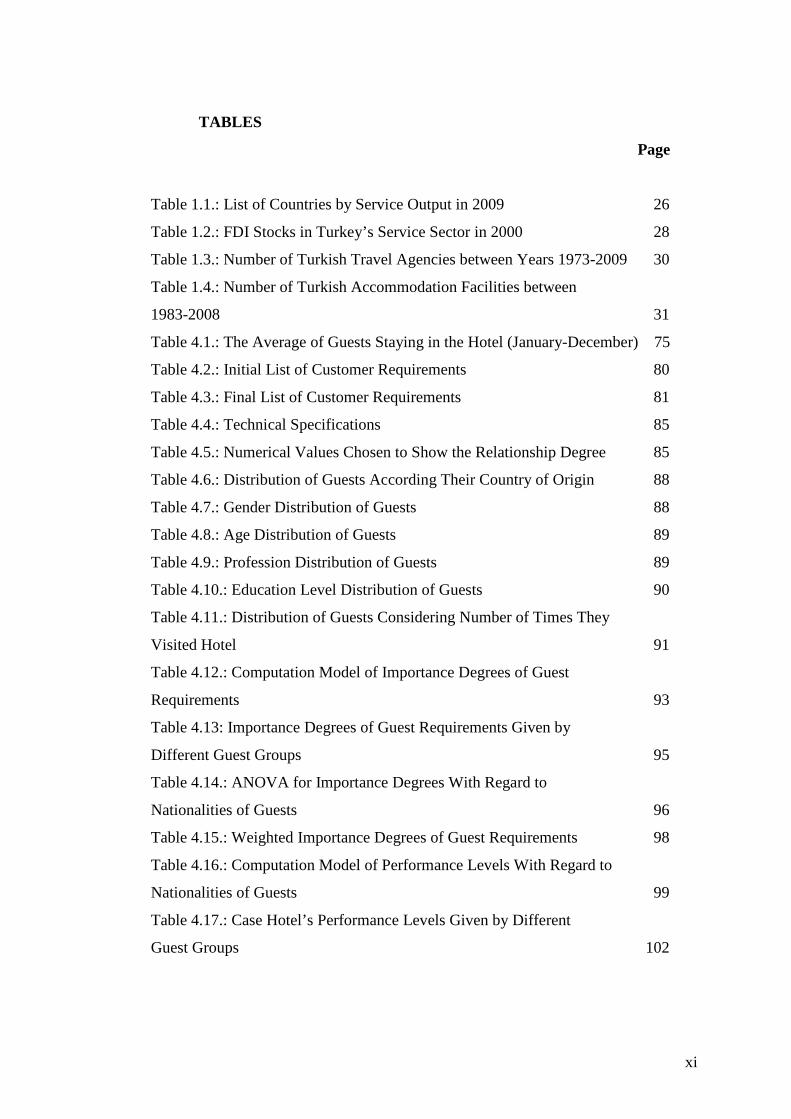
TABLES
Page
Table 1.1.: List of Countries by Service Output in 2009 26
Table 1.2.: FDI Stocks in Turkey’s Service Sector in 2000 28
Table 1.3.: Number of Turkish Travel Agencies between Years 1973-2009 30
Table 1.4.: Number of Turkish Accommodation Facilities between
1983-2008 31
Table 4.1.: The Average of Guests Staying in the Hotel (January-December) 75
Table 4.2.: Initial List of Customer Requirements 80
Table 4.3.: Final List of Customer Requirements 81
Table 4.4.: Technical Specifications 85
Table 4.5.: Numerical Values Chosen to Show the Relationship Degree 85
Table 4.6.: Distribution of Guests According Their Country of Origin 88
Table 4.7.: Gender Distribution of Guests 88
Table 4.8.: Age Distribution of Guests 89
Table 4.9.: Profession Distribution of Guests 89
Table 4.10.: Education Level Distribution of Guests 90
Table 4.11.: Distribution of Guests Considering Number of Times They
Visited Hotel 91
Table 4.12.: Computation Model of Importance Degrees of Guest
Requirements 93
Table 4.13: Importance Degrees of Guest Requirements Given by
Different Guest Groups 95
Table 4.14.: ANOVA for Importance Degrees With Regard to
Nationalities of Guests 96
Table 4.15.: Weighted Importance Degrees of Guest Requirements 98
Table 4.16.: Computation Model of Performance Levels With Regard to
Nationalities of Guests 99
Table 4.17.: Case Hotel’s Performance Levels Given by Different
Guest Groups 102

xii
Table 4.18.: ANOVA for Performance Levels With Regard to
Nationalities of Guests 103
Table 4.19.: Weighted Performance Levels of Guest Requirements 105
Table 4.20.: Case Hotel’s Planning Matrix 107
Table 4.21.: Case Hotel’s House of Quality 112

xiii
FIGURES
Page
Figure 3.1.: Schematic View of HoQ 62
Figure 3.2.: HoQ for Improvement of a Pizza 63

xiv
APPENDIXES
Page
APPENDIX I : Questionnaire 137
1
INTRODUCTION
Considering the fact that technologies are developing faster and faster from
year to year, the customer expectations are also increasing. It is very important when
marketers are able to guess all of these expectations in order to gain competitive
advantage. The competitiveness today does not rely only on the technology utilized,
but also on how successful the company is in integrating technology with managerial
capabilities. For getting a better result in this process, proposed products or services
must correspond to the customers’ wishes.
Especially in the industrialized nations, over the past three decades, the
service sector started to be the most dominant element of the economy. Also, since a
lot of studies specified that service quality is an important detail for success and
survival in actual competitive environment, the interest in service quality increased
impressively (Ghobadian et al., 1994). Despite the increasing importance of the
service sector and of the quality as a significant competitive factor, service quality
concepts are not well developed (Ghobadian et al., 1994). As service quality is a
vague concept, there are a lot of debates in literature related to this topic, about how
to conceptualize this phenomenon in a better way. Generally, definitions of service
quality proposed by researches concentrate on the idea that it is the outcome of the
comparison customers make between their expectations about a service and their
perceptions of the way the service has been performed (Booms and Lewis, 1983;
Grönroos, 1984; Parasuraman et al., 1988). These remarks bring to the conclusion
that service quality must be defined from the customer’s point of view. Thus, a lot of
studies concentrate on the question of how service quality is perceived by customers
and which is the way perceived service quality can be measured (Stauss and
Weinlich, 1997).
Service quality leads to customer loyalty and attraction of new customers,
positive word-of-mouth, employee satisfaction and commitment, agreeable
corporative image, reduced costs, and increasing in business performance (Berry et
al., 1989). Gryna and Juran (1993), has concluded that companies with perceived
2
high quality goods and services had higher market share, higher return on investment
and asset turnover than companies with perceived low quality. Thus, the most
important factor influencing the business performance is the quality of goods and
services offered by an organization, relative to its competitors.
As it was already specified, increasing economic pressures from competition,
governments and very fast developing technologies, forced companies to pay more
attention to quality of services they deliver. These perspectives conduct to some
alternative frameworks: SERVQUAL (Parasuraman et al., 1985; Zeithaml et al.,
1988) and SERVPERF (Cronin and Taylor, 1992). Even if these two models are used
a lot in quality measurement of services, some researchers consider that they are not
generic and several changes should be introduced in each of them (Carman, 1990;
Dabholkar et al., 2000; Finn and Lamb, 1991; Zhao et al., 2002). There are also other
alternatives in literature, like some modified versions of SERVQUAL and the
importance-performance paradigm suggested by James and Martilla (1997).
Traditional approaches to assure service quality often focus on work standards,
automation to eliminate people, or, in more developed organizations, Quality
Improvement Teams (QuITs) to empower employees to solve appeared problems
(Love, 1986).
Quality Function Deployment (QFD) model is quite different from traditional
quality systems, which aim to minimize the negative quality (such as poor service or
inconsistency). With those systems, the best that can be achieved is nothing wrong,
which is not enough in case all the players in the market are good. In addition, to
eliminate poor service, features like fun or luxury must conduct to maximizing
positive quality, because this creates value (Mazur, 1993).
Stuart and Tax (1996) argued that the features and assumptions of QFD are
extremely relevant to services and can effectively meet the needs of service design.
They accentuated several principles to support this idea:
3
• QFD provides a common focus for marketing, human resource management
and service operations in the organization and encourages the unified
approach which is very important in service design and delivery. A clearer
understanding of the service logic inside the organization is likely, with
everybody more conscious of the impact of their decision and actions on the
attributes of the service.
• QFD recognizes that service design and process management must be
customer led and that the attributes of the service must conform to customer
needs and wants. The causes of Gap 1 in the SERVQUAL model would be
addressed by QFD process and the service concept would be sensitive to
market factors.
• QFD accentuates the importance of the service encounter and moments of
truth. It specifies also the need to analyze each interaction in the service
process.
• The overview provided by QFD enables the “trade-offs” between features to
be studied and evaluated. For example, improving access to a site and
enhancing its amenities by attracting visitors who then impact on its
perceptual capacity and quality; or adding to the features of an airline service
with the risk to making more mistakes or standardizing, or speeding up the
delivery of a service but with the danger of making it less personal.
Mazur (1993) mentioned that QFD in services is based on a three-phase
process:
• Service planning (design requirements)
• Element planning (service process elements and service delivery
development)
• Operations planning (process control)
4
Thus, QFD has three important objectives for being applied in practice:
• It identifies the customers.
• It identifies the customers’ needs and wants.
• It identifies how to meet the customer requirements.
The purpose of this thesis is to show the importance of service quality in the
hospitality industry by using QFD method for providing better service to hotel’s
guests, based on guests’ points of view. The benefits of offering higher service
quality have influence on both: hotel sector and its customers. Competitive
advantages, management leadership, productivity improvement, work development,
reduced costs, increased economic profits, employees’ satisfaction and increased
working value, staff empowerment, customer satisfaction and customer loyalty are
some of the main points which can be reached by QFD elements used during this
research.
The hospitality industry, hotels included, will be not an exception in
implementing QFD model. This area employs thousands of people and generates
high revenues annually in value-added services. According to the fact that general
attributes are only an abstract overview and does not cover all industries completely,
Parasuraman et al. (1985) argue that in the hospitality industry, there are other
attributes that are of importance for service quality development. Many factors of
service quality are not standardized, some quality aspects such as “helpfulness”,
“friendliness” and “politeness” are likely to be interpreted differently depending on
each guest and therefore assessed subjectively. Another important aspect to be
considered is the seasonal factor of the hospitality industry where it is commonly
clustered around peak periods of the day or year, such as checkout time or holiday
season. These peaks make it more difficult to measure a consistent service quality
(Olsen, Sasser and Wyckoff, 1978).
According to von Friedrichs Grangsjo (2001), there are at least five factors that
describe and influence the tourism product:
5
• Tourism is dominated by services; this means that consumption occurs in
interaction with the suppliers of those services.
• Demand for tourism is significantly influenced by seasonal variations,
including climatic seasons and the time of vacations; a consequence of this is
that many staff members are hired for only short periods.
• The tourism industry consists of a mixture of private sector businesses and
public sector organizations; as a result, the industry operates within two
systems that have different requirements, rules, and form of control.
• The tourism industry is fragmented. It consists of many small companies
working in various business areas-including lodging, travel, food and leisure.
• Tourism consists of a number of ingredients experienced over time and it is
seldom the case than one actor has control over all components.
These factors mean that “tourism quality” is a complex concept. Hazlett and
Philip (1997) likened it to a puzzle that has many parts that must fit together
perfectly to satisfy the tourist. Nevertheless, despite the difficulties, satisfying the
tourism customer is important, not only because it leads to positive word-of-mouth
recommendation and repeat customers, but also because a lack of satisfaction leads
to complaints, and dealing with such complaints can be expensive, time consuming
and injurious to a destination’s reputation.
The term “experience” has become increasingly popular within tourism as
entertainment options have increased rapidly in number and variety. Bitner (1992)
and Mossberg (2003) have both related “experiences” to service quality. Bitner
(1992) used the expression “servicescape” to describe the customer’s overall
perception of services on offer, and Kumra (2008) developed this specific reference
to tourism in discussing so-called “experience areas”. According to Kumra (2008),
these “experience areas” can include several destinations over extended geographical
distances and quite long periods of time.
6
Quality is judged subjectively by consumers and therefore it is a difficult concept
to assess and measure. It is even more complicated in tourism experiences, because
“quality” in this setting includes many interactions with a variety of providers.
The hospitality industry has witnessed increasing competition for high service
quality and customer satisfaction. This is because customer retention through service
quality and satisfaction has become vital in such saturated markets as the lodging
industry. Today, the majority of hospitality firms are implementing one or two
corporate-wide quality management programs designed to improve service offerings
and market retention. For example Ritz-Carlton’s Total Quality Management
program has been widely recognized as a quality winner (Oliver and Rust, 1994),
while Sheraton initiated the Guest Satisfaction System to enhance customers’
lodging experience and boost return rates. It is also notable that, as a central part of
these industry wide efforts, a number of research paradigms such as SERVQUAL,
the expectancy-disconfirmation model, and LODGQUAL have been introduced into
the hospitality industry (Parasuraman et al., 1985).When today’s market conditions
as well as increasingly diversifying customer preferences are considered, the
importance of service quality and customer satisfaction is expected to grow further.
Despite these increased customer-oriented marketing efforts in the hospitality
industry, relatively little attention has been given to the process of service design.
Although most research programs have focused on measuring customers’ perceptions
of service quality and satisfaction, few have provided company-specific guidelines
for how to design services to meet the quality standards expected by customers. That
means, the extant service quality and satisfaction programs were developed primarily
as a tool to diagnose a company’s service performance and to understand consumer
purchase behavior, but they have not considered actively the intra-organizational
service development processes that can support the marketing initiatives of
hospitality firms.
With the help of QFD implementation, service design or development
processes should be emphasized in every service quality and satisfaction program in
hotel industry. Although the ongoing quality improvement programs can provide
7
hospitality managers with useful information about the company’s performance and
its customers, improvement in service quality and customer satisfaction cannot occur
unless the obtained information is successfully incorporated into subsequent service
deliveries.
The present study is composed by four chapters. The first chapter represents a
theoretical view of the service concept with its definitions given and its main
characteristics being analyzed. Marketing mix of services, the development of
service sector in the world and an overview of the service industry’s situation in
Turkey occupies also an important place of this chapter.
As quality of services represents an important point to be achieved when
offering services, the importance and definition of quality, ISO quality standards, the
concept of Total Quality Management and a brief analysis of some service quality
measurement methods have been highlighted in the second chapter.
The third chapter concentrates on explaining the Quality Function
Deployment Model as one of the most productive instruments in measuring the
quality of services. Methodology, results, and conclusions of the study are presented
in the last chapter.
8
CHAPTER I
SERVICES
1.1. IMPORTANCE AND DEFINITION OF SERVICES
Nowadays, the service sector occupies a very important position in the
economies of most countries. As incomes continue to rise, people’s needs become
less material and they begin to demand more services – in health, education,
entertainment, and many other areas. The traditional services that once represented
lodging, meal preparation, housecleaning and barber shops, have been impressively
supplemented by modern banking, insurance, computing, communication and
business services.
Johnston and Clark (2001) remark that every person, everyday, comes several
times in contact with different service operations. Day after day, more services are
produced and consumed. According to Brown and Swartz (1989), highly developed
economies can be characterized by an over proportional and strong growth of the
service sector. Evidence to this statement can be noticed by looking at the statistics
of different countries. In the recent years, there has been an increase in demand for
the services in technical, banking, tourism, medical and a lot of other industries. At
the same time, the manner in which services are made available to the final consumer
is changing. While private sector service companies are increasing their competitive
advantage, a further group of public services are beginning to experience the realities
of competitive markets for the first time.
One way to understand the structure of an economy is to compare the
country’s total output and employment with respect to its three main sectors:
agriculture, industry and services. Because of the fact that the service sector produces
intangible goods, producing services tends to require relatively less natural capital
and more human capital than producing agricultural or industrial goods. As a result,
all over the world the demand for most educated workers has grown imposing
countries to invest more in education – an overall benefit to their people. Another
9
benefit of the growing service sector is that by using fewer natural resources than
agriculture or industry, it puts less pressure on the local, regional and global
environment. According to Berry (1980), in formerly planned economies the service
sector was previously developed because governments controlled supply and failed
to respond to growing demand for services. In addition, many modern services which
play an important role in market economies (financial, business and real estate
services) were not needed under socialism. During the countries’ transition to market
economies, the service sectors have grown rapidly to meet previously unfulfilled
demand and needs. Growth of services in transition economies is particularly
important because it gives the permission to these economies to employ a share of
the educated labor force.
Service producers have to be absolutely sure that they are producing the right
services at the right places at the right time for the right price. In other words,
marketing within the service sector is more important than it has ever been. Catts et
al. (2006) specified some principal points about the importance of services in the
world:
• They contribute to the domestic growth (in 2003 contributed an average of 68
% of the global Gross Domestic Product - GDP).
• They are supporting the entire process of goods production by providing
value added inputs for competitive industrial development.
• They contribute to job creation (service activities have become important
creators of new jobs, for over 90 % new jobs globally).
• They contribute effectively to the process of poverty elimination.
Early economists paid little attention to services, considering them to be
totally unproductive, adding nothing valuable to an economy. Adam Smith (1977),
writing in the eighteenth century, distinguished between production that had a
10
tangible output – (such as manufacture or agriculture) and production for which there
was no tangible output. This remained the dominant attitude towards services until
the later part of the nineteenth century, when Alfred Marshall cited in Palmer (1994)
argued that a person providing a service was just as capable of giving utility to the
recipient as someone producing a tangible product. Indeed, Marshall recognized that
tangible products may not exist at all, without some special services performed in
order to produce them and to make them available to consumers.
Today, despite some old beliefs that the service sector is an insubstantial and
relatively inferior sector of the economy, considerable attention is paid to its direct
and indirect economic consequences. For organizations such as airlines, trains,
universities, car rental, health or government agencies, service forms the important
part of what they have to offer.
In 1981, Berry noted that from the beginning of goods marketing, services
established an area with specific needs and characteristics which demand a lot of
consideration. Services researchers always emphasized that services are not less
important than usual products and that they are central to marketing theory
(Grönroos, 1991; Lovelock, 1983).
There is argument about the extent to which services should be considered a
distinctive area of study in marketing. On the one hand, some have argued that a
service contains many important elements common to goods which make services
marketing no longer in use as a separate discipline. Thus, Levitt (1972:41) observed:
“there is no such thing as service industries. There are only industries where service
components are greater or less than those of other industries”.
On the other hand, many have pointed to the limitations of traditional
marketing principles when applied to the marketing of services. Berry (1980),
Grönroos (1978), Lovelock (1981), Rathmell (1974) and Shostack (1977) are among
the critics who have argued that the differences that exist between goods and services
11
mean that the marketing tools used for goods marketing cannot easily be translated to
services marketing.
Johnston and Clark (2001:92) noted that the word “service” has a great
richness and diversity of meaning. Levitt, (1981:25) specified that a service is “the
intangible equivalent of an economic good”. Kotler and Keller (2006:402), refers to
services as “any act of performance that one part can offer to another, that is
essentially intangible and does not result in the ownership of anything. Its production
may or may not be tied to a physical product”. A similar definition was stated by
Collins and Payne (1991:32), they insisted that “services are any primary or
complementary activity that does not directly produce a physical product – that is the
non-goods part of the transaction between customer and provider”. The definition of
service used by Palmer (1994:3) is “the production of an essentially intangible
benefit, either in its own right or as a significant element of a tangible product, which
through some form of exchange satisfies an identified consumer need”. This
definition recognizes that, in addition to the products which are a combination of
goods and services, some marketing activities do not easily fit on this scale at all.
Sower et al. (1999:54) visions considering the service definition could be
presented as follows: “a service is a set of singular and perishable benefits
• Delivered from the accountable service provider, mostly in close co-action
with his service suppliers;
• Generated by functions of technical systems and/or by distinct activities of
individuals, respectively;
• Commissioned according to the needs of his service consumers by the service
customer from the accountable service provider;
• Rendered individually to an authorized service consumer at his/her dedicated
trigger;
• Finally, consumed and utilized by the triggering service consumer for
executing his/her upcoming business or private activity”.
12
There has however, been no consistent definition of what constitutes a
service. In his study of the United States (US) service economy, Fuchs (1968), for
example, excluded transportation and communication arguing that they formed an
integral part of goods, while nowadays these are ones of important areas of service
industry. Stanton (1981) included activities such as entertainment and tourism, but
excluded delivery services and credit facilities, where these are essentially attached
to a tangible good offered for sale, while today these are considered the most
necessary and effective services all over the world.
1.2. CHARACTERISTICS OF SERVICES
“Pure” services have a number of distinctive characteristics which
differentiate them from goods and have implications for the manner in which they
are marketed. These can be described as intangibility, inseparability, variability,
perishability and the inability to own a service.
1.2.1. Intangibility
A pure service can not be assessed using any of the physical senses; it is an
abstraction which can not be directly examined before it is purchased. A prospective
purchaser of most goods is able to study them for physical integrity, aesthetic
appearance, taste, smell, etc. Many advertising claims relating to these tangible
properties can be verified by inspection prior to purchase. On the other hand, pure
services have no tangible properties which can be used by consumers to verify
advertising claims before the purchase is made. The intangible process characteristics
which define services, such as reliability, personal care, attentiveness of staff, their
friendliness, etc. can only be verified once a service has been purchased and
consumed.
Intangibility has a number of important marketing implications. The lack of
physical evidence that intangibility implies increases the level or uncertainty which a
consumer faces when choosing between competing services. An important part of
13
service marketing program will therefore involve reducing consumer uncertainty by
such means as adding physical evidence and the development of strong brands. Pure
goods and pure services tend to move in opposite directions in terms of their general
approach to the issue of tangibility. While service marketers seek to add tangible
evidence to their product, pure goods marketers often seek to augment their products
by adding intangible elements, such as after-sales service and improved distribution.
1.2.2. Inseparability
The production and consumption of a tangible good are two discrete
activities. Companies usually produce goods in one central location and then
transport them to the place where customers most want to buy them. In this way,
manufacturing companies can achieve economies of scale through centralized
production and have centralized quality-control checks. The manufacturer is also
able to make goods at a time which is convenient to itself, and then make them
available to customers at times which are convenient for them. Production and
consumption are said to be separable. On the other hand, the consumption of a
service is said to be inseparable from its means of production. Producer and
consumer must normally interact in order for the benefits of the service to be realized
(Zeithaml, 1981). Both must meet at a time and a place which is mutually convenient
in order that the producer can directly pass on service benefits. In the extreme case of
personal care services, the customer must be present during the entire production
process: a doctor cannot provide a service without the involvement of a patient. For
services, marketing becomes a means of facilitating complex producer-consumer
interaction, rather than being merely an exchange medium.
Inseparability occurs whether the producer is human, as in health-care
services, or a machine, as in the case of a bank Automated Teller Machine (ATM).
The service of the ATM machine can only be realized if the producer and consumer
interact. In some cases, it has been possible to separate service production and
consumption, especially where there is little need for personal contact.
14
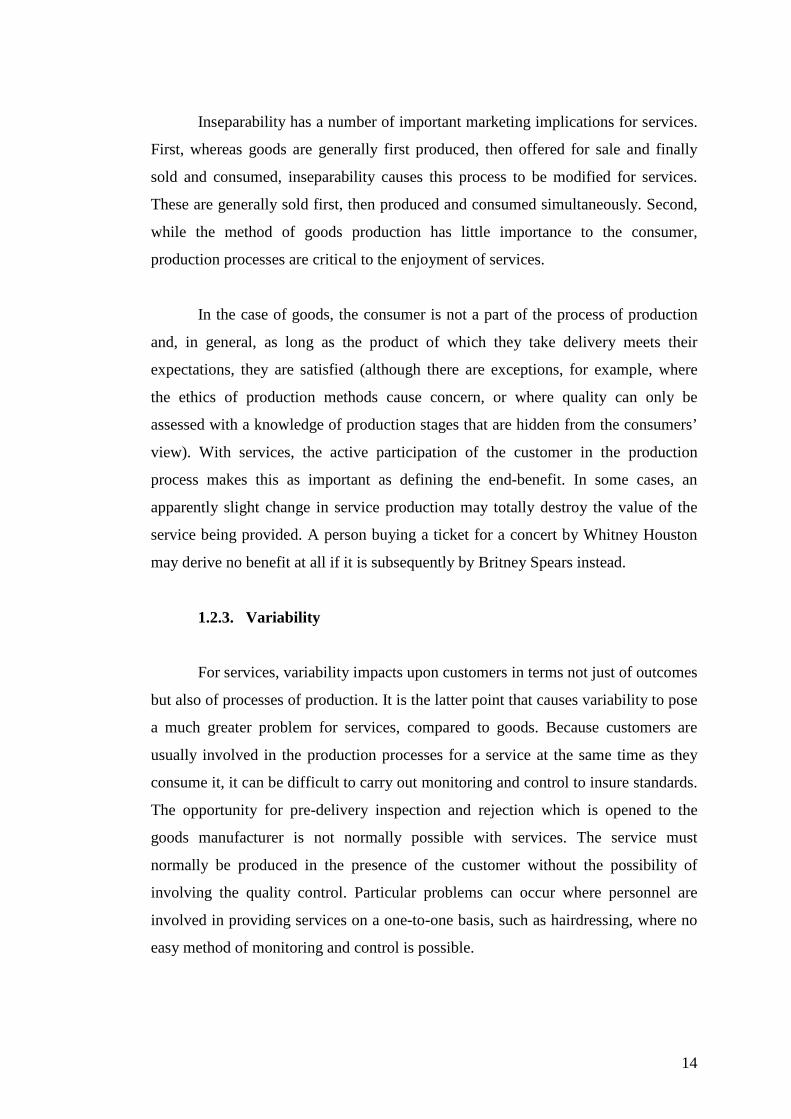
Inseparability has a number of important marketing implications for services.
First, whereas goods are generally first produced, then offered for sale and finally
sold and consumed, inseparability causes this process to be modified for services.
These are generally sold first, then produced and consumed simultaneously. Second,
while the method of goods production has little importance to the consumer,
production processes are critical to the enjoyment of services.
In the case of goods, the consumer is not a part of the process of production
and, in general, as long as the product of which they take delivery meets their
expectations, they are satisfied (although there are exceptions, for example, where
the ethics of production methods cause concern, or where quality can only be
assessed with a knowledge of production stages that are hidden from the consumers’
view). With services, the active participation of the customer in the production
process makes this as important as defining the end-benefit. In some cases, an
apparently slight change in service production may totally destroy the value of the
service being provided. A person buying a ticket for a concert by Whitney Houston
may derive no benefit at all if it is subsequently by Britney Spears instead.
1.2.3. Variability
For services, variability impacts upon customers in terms not just of outcomes
but also of processes of production. It is the latter point that causes variability to pose
a much greater problem for services, compared to goods. Because customers are
usually involved in the production processes for a service at the same time as they
consume it, it can be difficult to carry out monitoring and control to insure standards.
The opportunity for pre-delivery inspection and rejection which is opened to the
goods manufacturer is not normally possible with services. The service must
normally be produced in the presence of the customer without the possibility of
involving the quality control. Particular problems can occur where personnel are
involved in providing services on a one-to-one basis, such as hairdressing, where no
easy method of monitoring and control is possible.
15
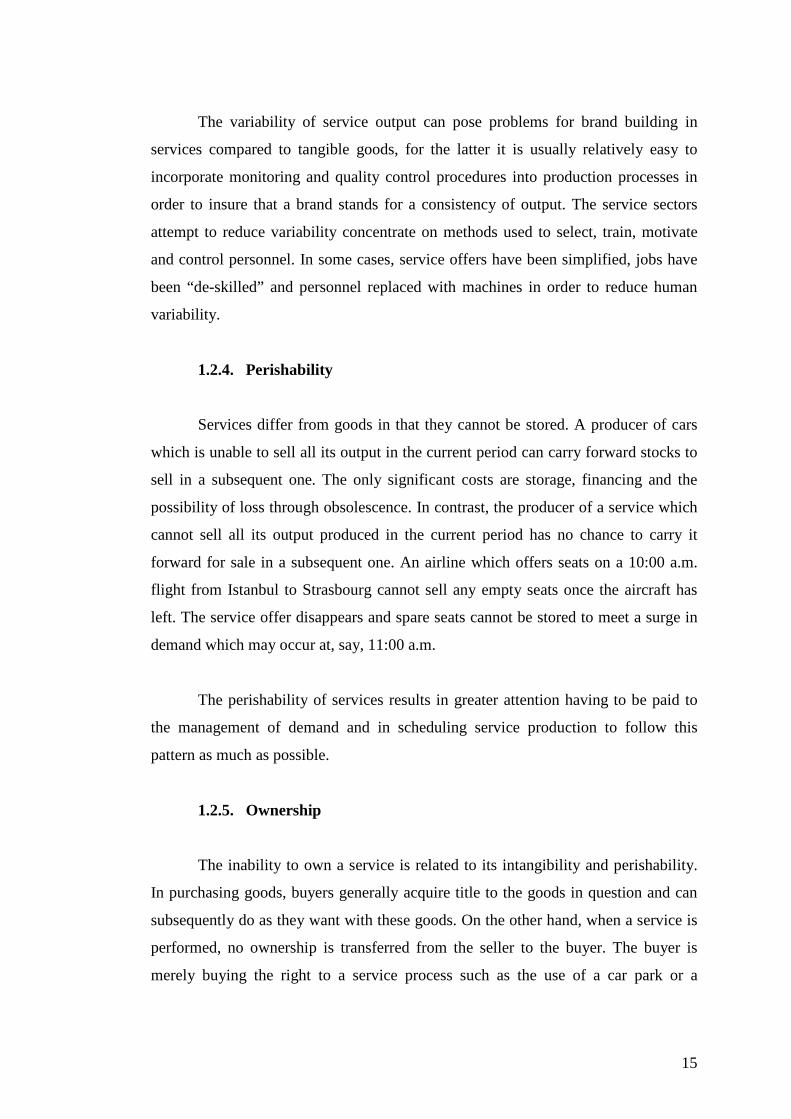
The variability of service output can pose problems for brand building in
services compared to tangible goods, for the latter it is usually relatively easy to
incorporate monitoring and quality control procedures into production processes in
order to insure that a brand stands for a consistency of output. The service sectors
attempt to reduce variability concentrate on methods used to select, train, motivate
and control personnel. In some cases, service offers have been simplified, jobs have
been “de-skilled” and personnel replaced with machines in order to reduce human
variability.
1.2.4. Perishability
Services differ from goods in that they cannot be stored. A producer of cars
which is unable to sell all its output in the current period can carry forward stocks to
sell in a subsequent one. The only significant costs are storage, financing and the
possibility of loss through obsolescence. In contrast, the producer of a service which
cannot sell all its output produced in the current period has no chance to carry it
forward for sale in a subsequent one. An airline which offers seats on a 10:00 a.m.
flight from Istanbul to Strasbourg cannot sell any empty seats once the aircraft has
left. The service offer disappears and spare seats cannot be stored to meet a surge in
demand which may occur at, say, 11:00 a.m.
The perishability of services results in greater attention having to be paid to
the management of demand and in scheduling service production to follow this
pattern as much as possible.
1.2.5. Ownership
The inability to own a service is related to its intangibility and perishability.
In purchasing goods, buyers generally acquire title to the goods in question and can
subsequently do as they want with these goods. On the other hand, when a service is
performed, no ownership is transferred from the seller to the buyer. The buyer is
merely buying the right to a service process such as the use of a car park or a
16
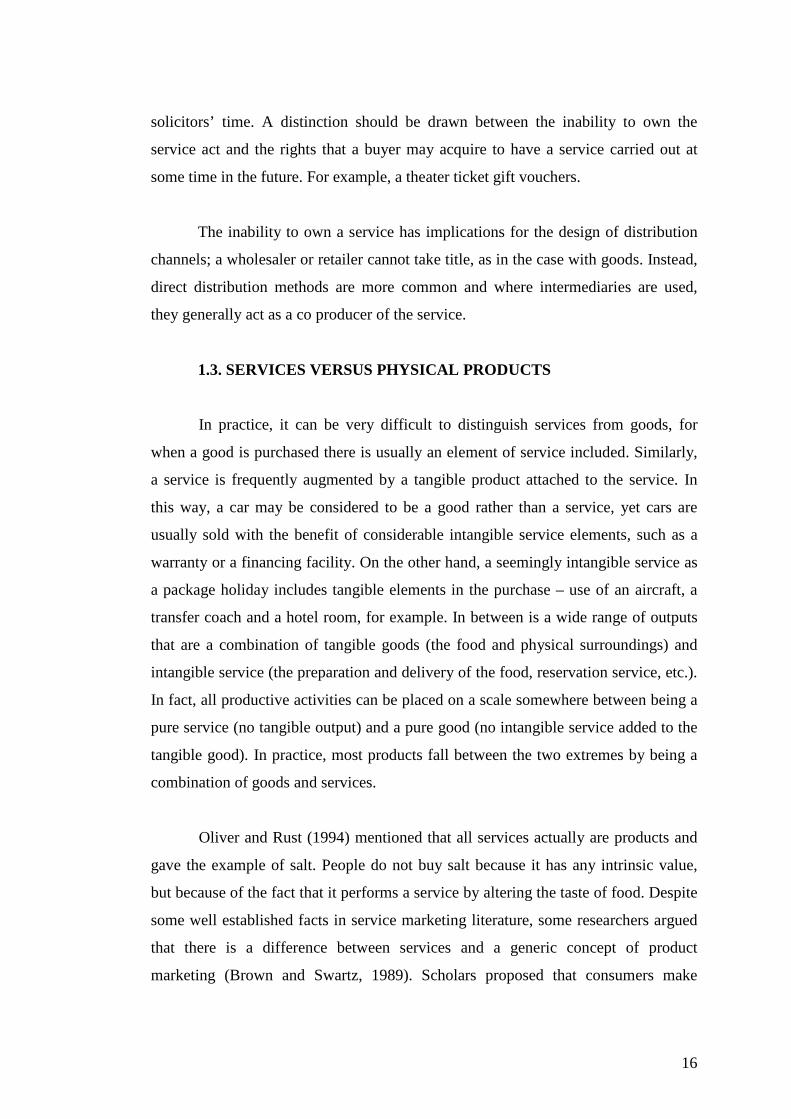
solicitors’ time. A distinction should be drawn between the inability to own the
service act and the rights that a buyer may acquire to have a service carried out at
some time in the future. For example, a theater ticket gift vouchers.
The inability to own a service has implications for the design of distribution
channels; a wholesaler or retailer cannot take title, as in the case with goods. Instead,
direct distribution methods are more common and where intermediaries are used,
they generally act as a co producer of the service.
1.3. SERVICES VERSUS PHYSICAL PRODUCTS
In practice, it can be very difficult to distinguish services from goods, for
when a good is purchased there is usually an element of service included. Similarly,
a service is frequently augmented by a tangible product attached to the service. In
this way, a car may be considered to be a good rather than a service, yet cars are
usually sold with the benefit of considerable intangible service elements, such as a
warranty or a financing facility. On the other hand, a seemingly intangible service as
a package holiday includes tangible elements in the purchase – use of an aircraft, a
transfer coach and a hotel room, for example. In between is a wide range of outputs
that are a combination of tangible goods (the food and physical surroundings) and
intangible service (the preparation and delivery of the food, reservation service, etc.).
In fact, all productive activities can be placed on a scale somewhere between being a
pure service (no tangible output) and a pure good (no intangible service added to the
tangible good). In practice, most products fall between the two extremes by being a
combination of goods and services.
Oliver and Rust (1994) mentioned that all services actually are products and
gave the example of salt. People do not buy salt because it has any intrinsic value,
but because of the fact that it performs a service by altering the taste of food. Despite
some well established facts in service marketing literature, some researchers argued
that there is a difference between services and a generic concept of product
marketing (Brown and Swartz, 1989). Scholars proposed that consumers make
17
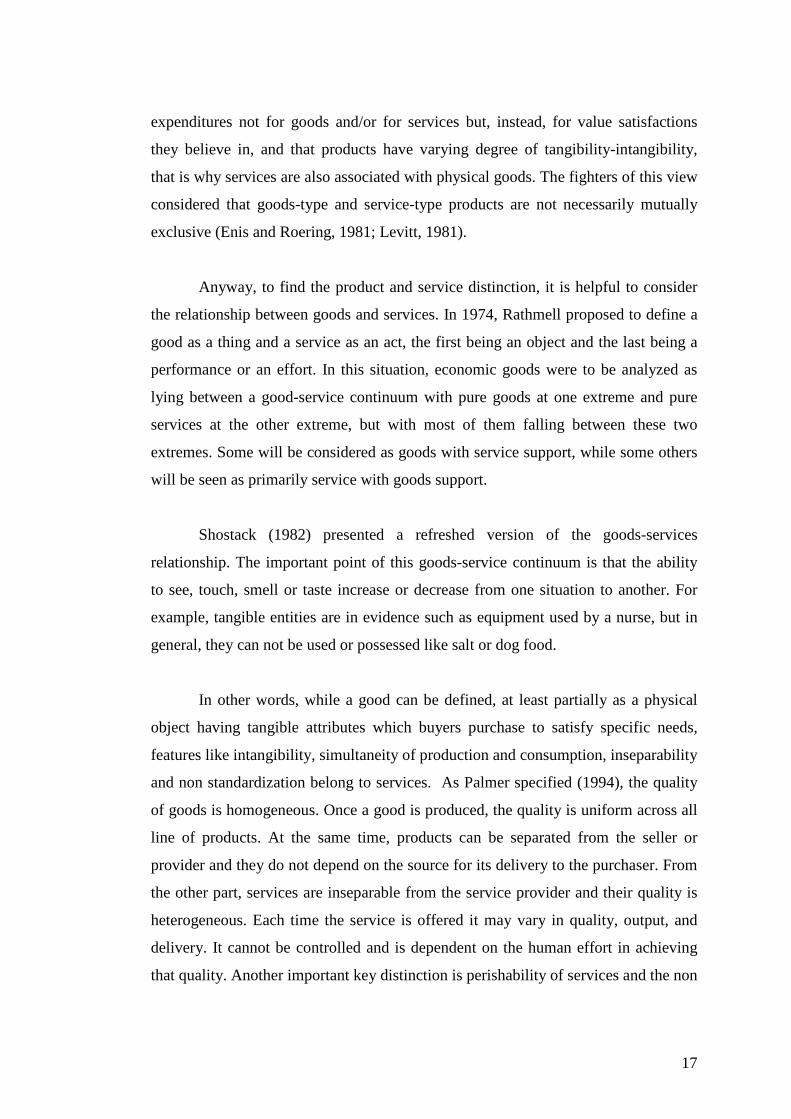
expenditures not for goods and/or for services but, instead, for value satisfactions
they believe in, and that products have varying degree of tangibility-intangibility,
that is why services are also associated with physical goods. The fighters of this view
considered that goods-type and service-type products are not necessarily mutually
exclusive (Enis and Roering, 1981; Levitt, 1981).
Anyway, to find the product and service distinction, it is helpful to consider
the relationship between goods and services. In 1974, Rathmell proposed to define a
good as a thing and a service as an act, the first being an object and the last being a
performance or an effort. In this situation, economic goods were to be analyzed as
lying between a good-service continuum with pure goods at one extreme and pure
services at the other extreme, but with most of them falling between these two
extremes. Some will be considered as goods with service support, while some others
will be seen as primarily service with goods support.
Shostack (1982) presented a refreshed version of the goods-services
relationship. The important point of this goods-service continuum is that the ability
to see, touch, smell or taste increase or decrease from one situation to another. For
example, tangible entities are in evidence such as equipment used by a nurse, but in
general, they can not be used or possessed like salt or dog food.
In other words, while a good can be defined, at least partially as a physical
object having tangible attributes which buyers purchase to satisfy specific needs,
features like intangibility, simultaneity of production and consumption, inseparability
and non standardization belong to services. As Palmer specified (1994), the quality
of goods is homogeneous. Once a good is produced, the quality is uniform across all
line of products. At the same time, products can be separated from the seller or
provider and they do not depend on the source for its delivery to the purchaser. From
the other part, services are inseparable from the service provider and their quality is
heterogeneous. Each time the service is offered it may vary in quality, output, and
delivery. It cannot be controlled and is dependent on the human effort in achieving
that quality. Another important key distinction is perishability of services and the non
18
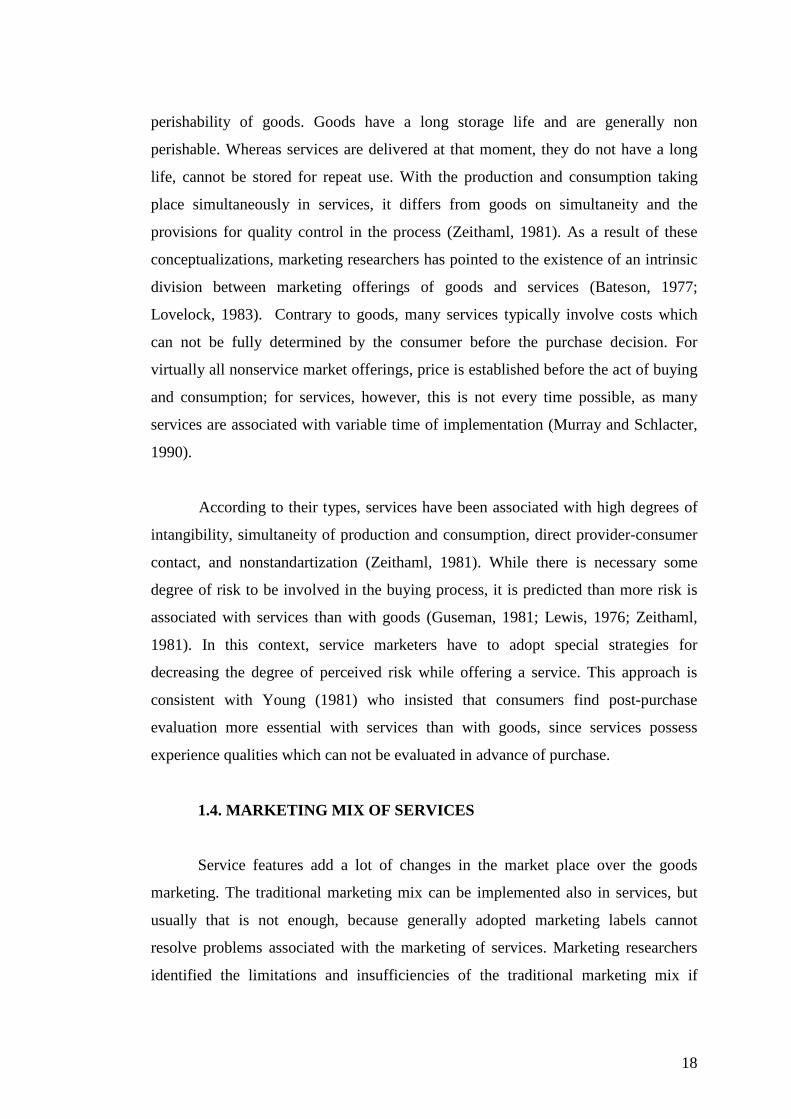
perishability of goods. Goods have a long storage life and are generally non
perishable. Whereas services are delivered at that moment, they do not have a long
life, cannot be stored for repeat use. With the production and consumption taking
place simultaneously in services, it differs from goods on simultaneity and the
provisions for quality control in the process (Zeithaml, 1981). As a result of these
conceptualizations, marketing researchers has pointed to the existence of an intrinsic
division between marketing offerings of goods and services (Bateson, 1977;
Lovelock, 1983). Contrary to goods, many services typically involve costs which
can not be fully determined by the consumer before the purchase decision. For
virtually all nonservice market offerings, price is established before the act of buying
and consumption; for services, however, this is not every time possible, as many
services are associated with variable time of implementation (Murray and Schlacter,
1990).
According to their types, services have been associated with high degrees of
intangibility, simultaneity of production and consumption, direct provider-consumer
contact, and nonstandartization (Zeithaml, 1981). While there is necessary some
degree of risk to be involved in the buying process, it is predicted than more risk is
associated with services than with goods (Guseman, 1981; Lewis, 1976; Zeithaml,
1981). In this context, service marketers have to adopt special strategies for
decreasing the degree of perceived risk while offering a service. This approach is
consistent with Young (1981) who insisted that consumers find post-purchase
evaluation more essential with services than with goods, since services possess
experience qualities which can not be evaluated in advance of purchase.
1.4. MARKETING MIX OF SERVICES
Service features add a lot of changes in the market place over the goods
marketing. The traditional marketing mix can be implemented also in services, but
usually that is not enough, because generally adopted marketing labels cannot
resolve problems associated with the marketing of services. Marketing researchers
identified the limitations and insufficiencies of the traditional marketing mix if
19
applied to services. Booms and Bitner (1981) suggested a seven P’s marketing model
for service using process. According to them, the marketing mix for service
organizations is:
• Product
• Physical evidence
• Price
• Place
• People
• Promotion
• Process
1.4.1. Product
As service is an intangible product, it consists of a various number of features
and benefits which can be related to specific target markets. That is there is a high
level of flexibility and opportunity to be introduced in designing a product offer.
1.4.2. Physical Evidence
As most services cannot be offered without the support of tangibles,
customers cannot see the service; they can only perceive the associations with
something tangible. After examining these associations, customers form an idea
about the service provider. So, a passenger transport organization’s promise of a safe,
comfortable and timely journey from one destination to another will be analyzed by
condition of transporting vehicle, seating facilities, the personality of the driver or
the way in which personnel behave to customers (Carman, 1990). All these physical
features are used by consumer as evidence to find out the performance of the service
provider.
20
1.4.3. Price
The pricing decision is critical in services too, as this component determines
the revenue of the firm. Consumer sensitivity to price will be higher according to
services than according to goods (Guseman, 1981). Thus, the pricing strategies for
services depend on value perceptions of various segments of people targeted by a
service organization.
1.4.4. Place
As services are intangible and inseparable, service firms cannot use the same
channel alternatives as in case of goods marketing. Due to the intangible character of
service, traditional wholesalers and retailers cannot be used. As services cannot be
stored or separated from their producers, retailing cannot be developed as a separated
activity in service marketing. Production, distribution and consumption will be used
as simultaneous activities in services.
1.4.5. People
Service organizations are people-oriented (Armstrong, 1991). Every
employee of the service organization is a marketing person involved in a marketing
activity. Whatever if an employee has a direct contact with the consumer or not, if he
was visible for consumer at least once, his behavior, activities and performance will
have a direct influence on consumer.
1.4.6. Promotion
Logically, consumers are co-producers in the service business. The quality of
service depends not only on the performance of the service provider, but also on the
performance of the consumer (Berry, Parasuraman and Zeithaml, 1990). Service
organizations have the responsibility to educate customers in order to make them use
a service efficiently. Thus, a very good prepared promotional program will help
21
service organizations to inform, persuade and train customers to improve their
experiences.
1.4.7. Process
Process is a functional activity to guarantee service availability and quality.
According to Minor et al. (2004), if the physical settings and all their functions are
well programmed, the efficiency of service process will increase. The management
process is to control the service encounters (interaction between personnel and
customers, customers and service environment, systems and other facilities)
efficiently. Grönroos (1991:10) has commented process as “interactive marketing
where moments of truth occur and the demand of process management is to improve
this moment of truth”.
The main objective of seven P’s in the service marketing is to achieve seven
distinctive goals. They have the mission to establish the relationship between
consumer needs and wants, consumer quality expectations, consumer perception,
consumer satisfaction, customer relationships, etc. Thus, service firms appear to
achieve a lot of success only when they organize the marketing mix in a dynamic
way and adaptable to varieties in the marketing environment.
1.5. DEVELOPMENT OF SERVICES IN WORLD ECONOMIES
With manufacturing slipping to less than 20% of GDP and the role of services
rising to more than 70% in some world countries, services are seen as playing a
principal role in economies. There is a considerable variation across world
economies in the extent to which they have experienced rapid development of high-
growth service industries. This has been influenced by major differences in
underlying policy conditions.
In the United States, there has been extensive restructuring of existing firms
which have reorganised their activities around their core competencies and
22
outsourced a wide range of service-related activities. Strong growth in Internet
related service providers has contributed to the rapid growth of an increasingly
sophisticated range of innovative service products. These developments have been
brought to a number of interrelated factors, including lightly regulated product
markets, efficient markets for corporate control, strong supply of venture capital and
a climate that is conducive to risk-taking and entrepreneurship. Strong growth in
services has also occurred in Canada and Australia, two countries with open
economies and relatively few regulatory barriers. In contrast, growth in services has
been slower in countries like Japan and Korea, where the business environment has
been less favourable to entry of newcomers (Palmer, 1994).
Services play a key role in world economies and are fast developping,
accounting for over 60% of total economic activity in most countries, and for more
than 70% in countries like Australia, Austria, Belgium, Canada, Czech Republic,
Denmark, Finland, France, Germany and Greece (Johnston and Clark, 2001). The
same authors specify that the most rapidly growing sectors in countries like Japan,
Korea, Mexico, Netherlands, Turkey, Switzerland, Italy, Spain and Portugal are
finance, insurance and real estate, business and tourism services. The relative
importance of transport and communication services in total services, on the other
hand, has generally fallen over the world, as has the share of the distribution sector.
The declines reflect saturated demand for some of these services, while relatively
rapid productivity growth in sectors such as communications has contributed to
changes in relative prices and reduced the share of these sectors in total output and
employment.
Strategic business services – which include computer software and
information processing services, research and development and technical services,
marketing services, business organisation services and human resource development
services – have shown rapid growth and strong employment generation in recent
years in European countries. Total turnover in these services is estimated to have
exceeded 1.1 trillion USD for European countries in 1995 (Sower et al., 1999). More
recent data from countries indicate that strong growth has continued since 1995,

23
thereby increasing the importance of these activities in world economies (Cattaneo et
al., 2010).
One of the key development and innovations has been in the field of
electronic commerce (e-commerce), which is providing new ways to conduct
business that will have beneficial effects on economic growth, productivity and
efficiency, jobs and consumer choice. According to Kotler and Keller (2006) it has
already affected the communications, finance and retail trade sectors of United States
and European countries (comprising together about 30% of GDP), but it also holds
promise in areas such as education, health and government (about 20% of GDP).
The diversity and continuos development of services is reflected in the
character of the labour force, which, as in manufacturing, ranges from relatively low-
skilled workers to highly skilled specialists. An analysis of employment growth by
skill level during the 1990s in Belgium, Australia, Greece, Canada, Denmark,
Germany and France shows that the growth rate for highly skilled white-collar
workers was higher than for other categories in all but one of the countries examined,
while growth in jobs for highly skilled blue-collar workers, on the other hand, was
generally relatively weak (Gale and Wood, 1994).
Trade in services has also a serious impact on develpoment of service
industries worldwide. It has been increasing in recent years, driven partly by the
globalisation of industry. Technological advances are also key to expanded trade, as
they have enhanced the ability of service providers to interface with foreign clients in
a time-sensitive, highly cost-effective manner. Development of a greater variety of
discrete “service-oriented” products (such as software and interactive databases that
can be easily accessed) has also been key as it has created an effective medium for
packaging and distributing storable knowledge and information (Kandampully,
2001).
24
1.6. INTERNATIONAL TRADE IN SERVICES
The scope of services presented in General Agreement on Trade in Services
(GATS) of the World Trade Organization (WTO) was represented by Cattaneo et al.
(2010) like:
• Business services
• Communication services
• Construction services
• Distribution services
• Educational services
• Environmental services
• Financial services
• Health-related and social services
• Tourism and travel related services
• Recreational, sporting and cultural services
• Transport services
• Other services not elsewhere included
The service sector is a key to economic growth, export competitiveness and
poverty reduction (Gershuny, 1978). Kandampully (2001) mentioned that from the
beginning of agreement with the WTO, US cross border services exports have grown
impressively, from $186 billion in 1994 to $338 billion in 2004. The US considered,
the world’s largest service exporter, exporting twice the value of commercial
services as the next big exporter, the United Kingdom (UK). As a share of world
commercial services exports in 2004, the US represented 15.2% and the UK 8.1%.
Other major service exporters include China (2.8% of the world total), Hong Kong
(2.6%), Canada (2.2%) and Korea (1.9%).
Considering Asian continent, since the early 1990s, the world has witnessed
the spectacular growth of the economies of China and India (averaging 10.2 and 6.2
% annually from 1992 to 2005, respectively). Associated with this growth has been
25
the dramatic development of the service sectors in the two big Asian countries. In
India, the service sector has become the dominant contributor to the Indian economy,
accounting for 54.2 % of GDP in 2004. In China, however, the service sector has live
behind the manufacturing sector, though its role in the economy improved slightly in
the last 15 years. From 1990 to 2004, the service sector as a proportion of China’s
GDP increased modestly from 34.3 % in 1990 to 40.7 % in 2004 (Catts, 2006).
Generally, it is considered that trade in services is an opportunity used only in
developed or developing countries, while less developed countries have nothing to
do with the service trading process. Oakland (2000) demonstrated that the
development level of a country has nothing to do with the trade of services and every
country, including the least developed one, can become a member of service trade
exporters and benefit from increased market opening.
The trade in services has grown faster than the trade in goods, and the share
of the trade in services in overall trade increased a lot in the last thirty years. In their
research, Cattaneo et al. (2010) specify that European Union together with United
States account for over 60 % of service exports in the world. The business service
exports of Brazil, China and India increased with 10 % every year in the last decade.
Within the trade in services, commercial services like communication services,
financial services, business or professional services are also widely and continuously
developing. According to the same source, nowadays, the service industry constitutes
72 % of the gross domestic product (GDP) in high-income countries, 53 % in
middle-income countries and 46 % in low-income countries. Table 1.1., represents a
list of countries by service output in 2009. It shows that European Union countries
occupies the leading place in delivering services by an output of 11,973,605 million
US dollars (USD), followed by United States with 10,963,075 million USD and
Japan with an output of 3,877,605 million, respectively. Countries like Brazil and
Spain seem to be less productive on this topic, followed by Canada which occupies
the last position in the presented list, with a service output of 952,972 million USD.
While being not developed, but still a developing country, Turkey is not included yet
in presented list, but it improves its economic performance impressively from year to
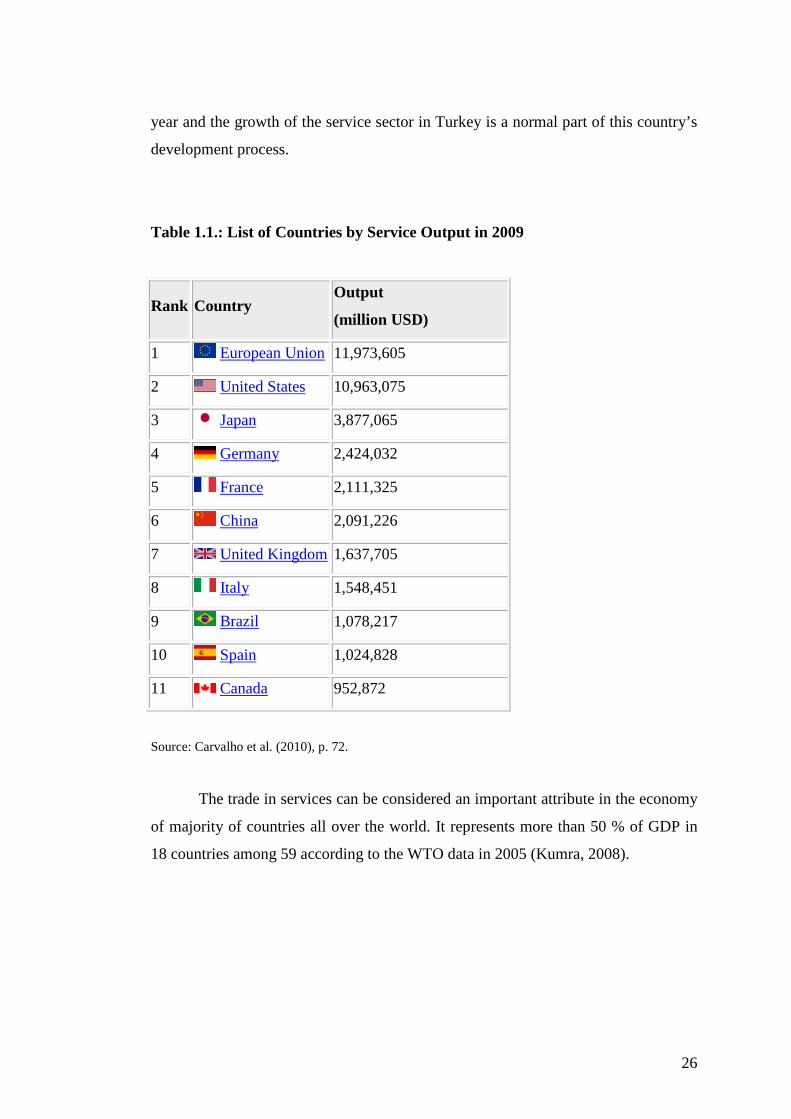
26
year and the growth of the service sector in Turkey is a normal part of this country’s
development process.
Table 1.1.: List of Countries by Service Output in 2009
Rank Country Output
(million USD)
1 European Union 11,973,605
2 United States 10,963,075
3 Japan 3,877,065
4 Germany 2,424,032
5 France 2,111,325
6 China 2,091,226
7 United Kingdom 1,637,705
8 Italy 1,548,451
9 Brazil 1,078,217
10 Spain 1,024,828
11 Canada 952,872
Source: Carvalho et al. (2010), p. 72.
The trade in services can be considered an important attribute in the economy
of majority of countries all over the world. It represents more than 50 % of GDP in
18 countries among 59 according to the WTO data in 2005 (Kumra, 2008).
27
1.7. GENERAL OVERVIEW ON SERVICE SECTOR IN TURKEY
1.7.1. Turkish Trade in Services and Its FDI Stocks to Other Countries
The service sector is becoming one of the most important contributors to the
GDP in the majority of countries all over the world. Anyway, the general level of
productivity in European or Asian countries cannot be compared with the high level
of productivity in US service industry. Minor et al. (2004) suggest that it is important
for all countries to focus on productivity improvement in the service sector in order
to get better results in developing their economic statement.
Turkey improves its economic performance impressively from year to year.
As the growth of the service sector is a normal part of a country’s development
process, Turkey does not represent an exception. The reasons for this trend are not
hard to define. As people’s income grows, they tend to spend a lower proportion on
food and clothing and a higher proportion on items provided by the service industry,
such as better housing, medical care, travel and amusements. Telecommunications,
transportations, finance and especially tourism seem to represent one of the most
important and developing services in Turkey.
During 2006-2007 foreign direct investment (FDI) flows increased, and
Turkey’s real GDP which represented 6.1 % in 2005, performed the growth rate of
7.4 % in 2006. Value added in services sector also increased by 6.1 % and this sector
was leading in the real GDP growth (Akbaba, 2006). In terms of industrial subsector
allocations, a majority of FDI inflows to Turkey are oriented to the service sector.
Huekman and Togan, (2005) noticed that by the end of 2000 over 57 % of total FDI
stocks in Turkey were directed to services, including three of the top five subsectors:
transport and communications, banking and other financial services, trade and
repairs. Table 1.2. illustrates the statistic data on FDI stocks in Turkey’s service
sector by year 2000. It can be observed that at this period services like transports,
storage and communications occupied the leading position in the countries service
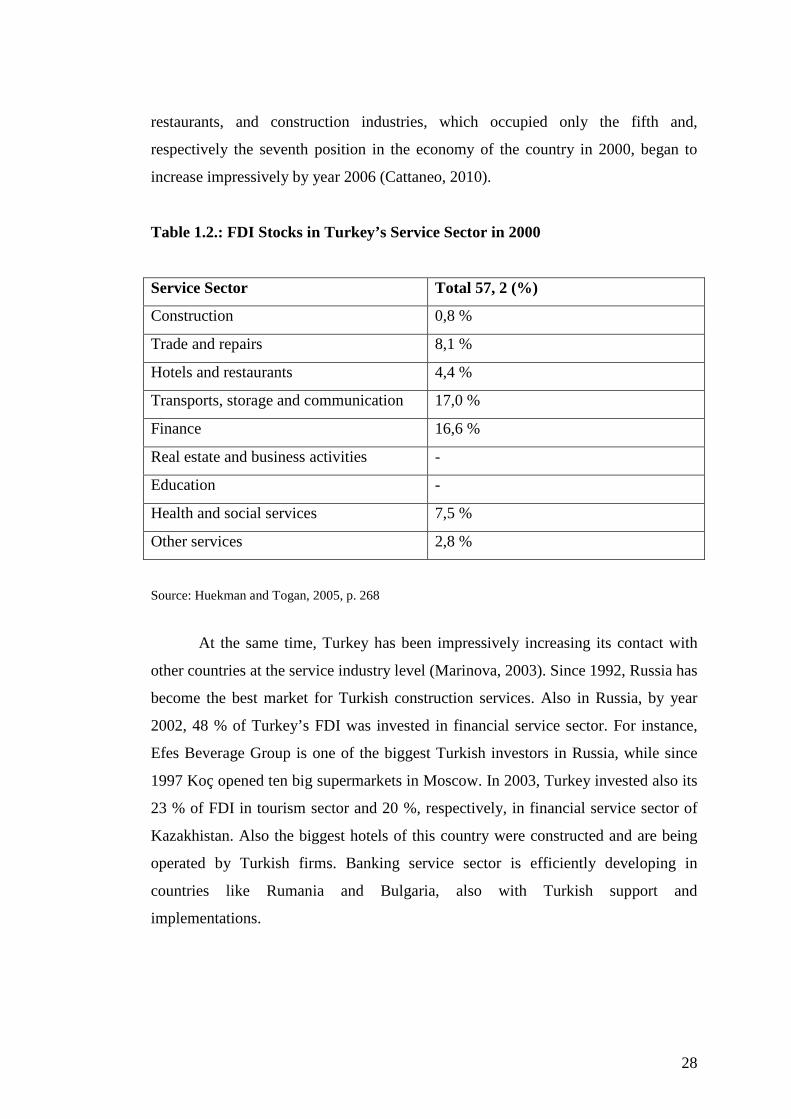
industry, followed by finance and, trade and repair services. Anyway, hotels and
28
restaurants, and construction industries, which occupied only the fifth and,
respectively the seventh position in the economy of the country in 2000, began to
increase impressively by year 2006 (Cattaneo, 2010).
Table 1.2.: FDI Stocks in Turkey’s Service Sector in 2000
Service Sector Total 57, 2 (%)
Construction 0,8 %
Trade and repairs 8,1 %
Hotels and restaurants 4,4 %
Transports, storage and communication 17,0 %
Finance 16,6 %
Real estate and business activities -
Education -
Health and social services 7,5 %
Other services 2,8 %
Source: Huekman and Togan, 2005, p. 268
At the same time, Turkey has been impressively increasing its contact with
other countries at the service industry level (Marinova, 2003). Since 1992, Russia has
become the best market for Turkish construction services. Also in Russia, by year
2002, 48 % of Turkey’s FDI was invested in financial service sector. For instance,
Efes Beverage Group is one of the biggest Turkish investors in Russia, while since
1997 Koç opened ten big supermarkets in Moscow. In 2003, Turkey invested also its
23 % of FDI in tourism sector and 20 %, respectively, in financial service sector of
Kazakhistan. Also the biggest hotels of this country were constructed and are being
operated by Turkish firms. Banking service sector is efficiently developing in
countries like Rumania and Bulgaria, also with Turkish support and
implementations.
29
Over the last two decades, Turkey has made considerable investments on its
infrastructure. This also includes transport infrastructure such as improvement,
modernization of airports and air terminals as well as construction of new ones. In
addition to the international airports in the main cities and resort destinations, Turkey
has domestic flights to all major cities and tourist centers. The highways
crisscrossing the entire country; regular comfortable bus services and coach tours
make travelling in Turkey easy and enjoyable. The transport infrastructure and the
efficiency of services as well as advanced communication network system meet all
necessary requirements.
1.7.2. Turkish Tourism Industry as Substantial Part of Service Sector
Tourism and the accommodation industry at present, including a range of
facilities from the top quality, super modern deluxe category hotels and holiday
complexes, boutique hotels to the affordable ones, represents one of the most
developed service subsectors in Turkey. Although city hotels, summer resort hotels
and holiday resorts constitute the greater part of the accommodation industry, there
are numerous ski, winter resort and spa hotels in various parts of the country. Most
high standard hotels and holiday resorts have a variety of recreation and
entertainment facilities. There are also a number of golf clubs in international
standards in various parts of the country.
Turkey has been recognized by WTO as a country of international reputation
for hosting the most important meetings and conventions of the world (Huekman and
Togan, 2005). World famous Turkish cuisine as well as international ones,
restaurants, bars, entertainment life, cultural activities can appeal to tourists from all
over the world.
Tourists are flocking to Turkey in increasing numbers. Records have been
increasing from day to day. There is a consensus depending on research findings that
the Turkish tourism will continue to grow at a higher rate than the European and the
world average. The future prospects in the long term seem also to be very bright.
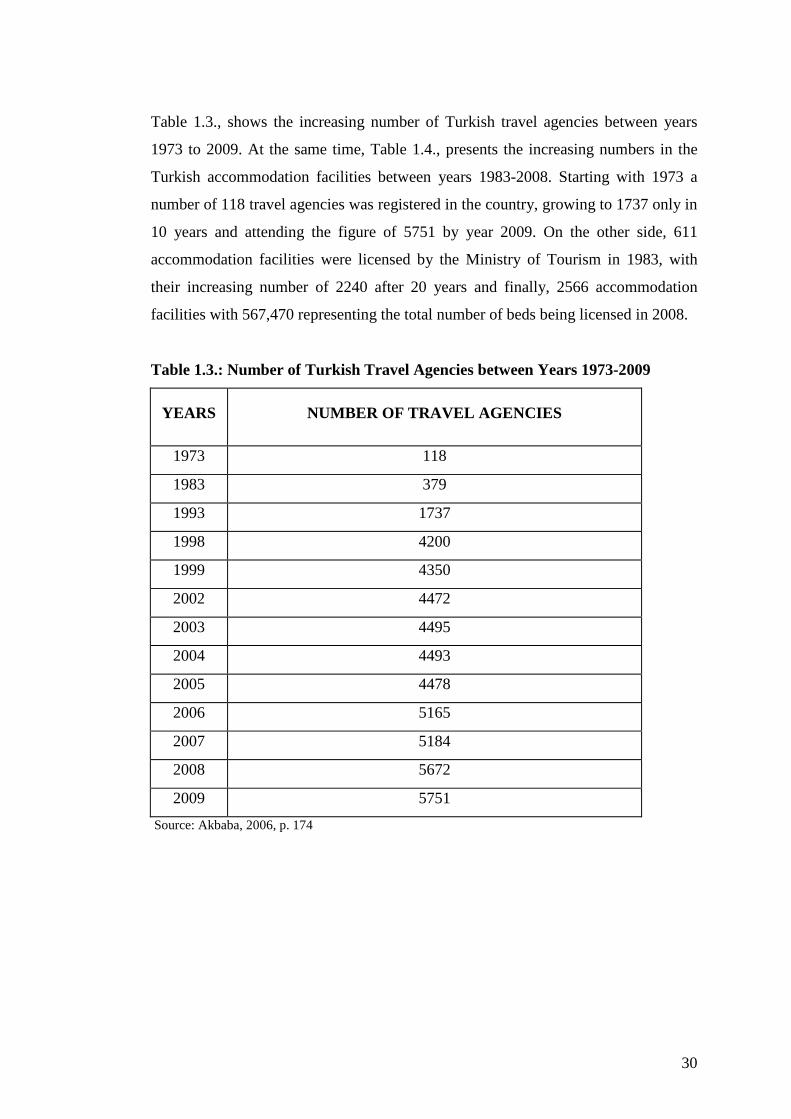
30
Table 1.3., shows the increasing number of Turkish travel agencies between years
1973 to 2009. At the same time, Table 1.4., presents the increasing numbers in the
Turkish accommodation facilities between years 1983-2008. Starting with 1973 a
number of 118 travel agencies was registered in the country, growing to 1737 only in
10 years and attending the figure of 5751 by year 2009. On the other side, 611
accommodation facilities were licensed by the Ministry of Tourism in 1983, with
their increasing number of 2240 after 20 years and finally, 2566 accommodation
facilities with 567,470 representing the total number of beds being licensed in 2008.
Table 1.3.: Number of Turkish Travel Agencies between Years 1973-2009
YEARS NUMBER OF TRAVEL AGENCIES
1973 118
1983 379
1993 1737
1998 4200
1999 4350
2002 4472
2003 4495
2004 4493
2005 4478
2006 5165
2007 5184
2008 5672
2009 5751
Source: Akbaba, 2006, p. 174
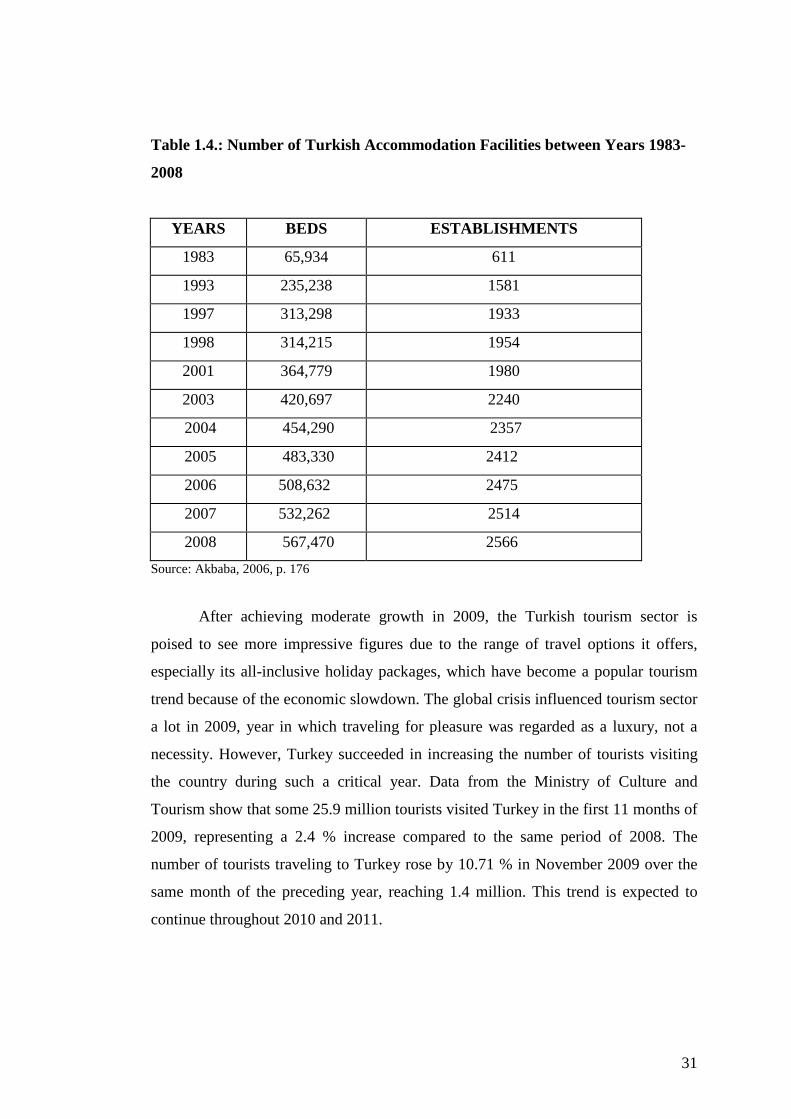
31
Table 1.4.: Number of Turkish Accommodation Facilities between Years 1983-
2008
YEARS BEDS ESTABLISHMENTS
1983 65,934 611
1993 235,238 1581
1997 313,298 1933
1998 314,215 1954
2001 364,779 1980
2003 420,697 2240
2004 454,290 2357
2005 483,330 2412
2006 508,632 2475
2007 532,262 2514
2008 567,470 2566
Source: Akbaba, 2006, p. 176
After achieving moderate growth in 2009, the Turkish tourism sector is
poised to see more impressive figures due to the range of travel options it offers,
especially its all-inclusive holiday packages, which have become a popular tourism
trend because of the economic slowdown. The global crisis influenced tourism sector
a lot in 2009, year in which traveling for pleasure was regarded as a luxury, not a
necessity. However, Turkey succeeded in increasing the number of tourists visiting
the country during such a critical year. Data from the Ministry of Culture and
Tourism show that some 25.9 million tourists visited Turkey in the first 11 months of
2009, representing a 2.4 % increase compared to the same period of 2008. The
number of tourists traveling to Turkey rose by 10.71 % in November 2009 over the
same month of the preceding year, reaching 1.4 million. This trend is expected to
continue throughout 2010 and 2011.
32
Tourism Journalists and Writers Association (TÜYED) Chairman Kerem
Köfteoğlu (“Zaman”, January 03rd 2010), attributed this upward trend to the high
number of all-inclusive holiday packages Turkey offers, which attract families with
children because of their affordable prices.
Ahmet Barut, the chairman of the Turkish Hoteliers Federation (TÜROFED),
according to the publication specified above, is seeing the performance of the sector
in the face of the crisis in year 2009 as pleasing, attributed this decline not to the
sector, but to financial problems in other countries. He insists that these rates should
be considered reasonable during times of crisis and the tourism sector had to
decrease its prices in 2009 due to the recession and tourists acting cautiously when
spending money. However, he states that the damage the tourism sector faced was
very low when compared to other sectors and that the Turkish tourism sector expects
to see 3 % growth in 2011.
33
CHAPTER II
QUALITY AND SERVICES
2.1. DEFINITION OF QUALITY
The “quality” concept is not new. From the very ancient times, people were
always interested in quality (Kandampully et al., 2001). People are preoccupied
about the food they eat, the quality of shelter they have, the quality of their
relationships and generally about the quality of their life. Gitlow et al. (1995) pointed
that the history of quality dates to the year 2000 BC. Discussions about quality were
initiated by Socrates, Plato, Aristotle, and other Greek philosophers (Kuei, 1995).
Nowadays, quality is an important tool through which an organization can achieve
the highest degree of competitive advantage (Madu, 2004). Quality approaches
helped leading firms like IBM, Xerox or Harley Davidson to survive in their
competitive environment. A big number of executives argue that the improvement of
service and product quality is the most critical challenge facing global businesses
(Zeithaml, 1990).
In today’s economy, competition is bigger than ever. These fact forces
companies to become more customer focused in their offerings. Every day, the
importance of quality increases more and more. Hence, quality wins over quantity.
The importance of quality in business and industry increases in a fast way due
to factors like competition, growing demand from customers for better quality,
increasing number of laws related to quality and the global economy. At the same
time, the cost of quality control accounts forms around 7-10 % of the total sales
revenues of manufacturers. Nowadays, the main objective of the companies is to
reduce this amount and to improve the quality of products and services (Deming,
1993).
Tuchman (1980: 38), argued that “quality means investment of the best skill
and effort possible to produce the finest and most admirable results possible.... You
34
do it well or you do it half-well”. From an other point of view, Feigenbaum
(1982:22) sustained that the notion of “value” had to be included in any quality
definition.
Crosby (1980:43) defines quality as “conformance to requirements”; Juran
defines it as “fitness to use” (1988:62); while Demings (1993:51) insisted that it is “a
predictable degree of uniformity and dependability at low cost and suited to market”.
Quality has been described also as “the single most important force leading to the
economic growth of companies in international markets” (Feigenbaum, 1982:23);
also defined as “conformance to specifications” (Gilmore, 1974:32; Levitt, 1981:43),
“loss avoidance” (Taguchi, cited in Ross, 1989:77), and “meeting and/or exceeding
customers’ expectations” (Grönroos, 1984:38; Parasuraman and Zeithaml, 1985:44).
By the 1950s, the role of product quality began to appear in economic theory.
Abbott (1955) argued that by focusing on price competition, economists ignored a
critical component of consumers’ decision on quality process. Both, price and quality
had to be considered in a competitive market. Abbot, as well as Feigenbaum
suggested that differentiation in levels of both, quality and price, or value, is
important in consumers’ decisions. Researchers Cronin and Taylor (1992) have
advanced the notion that purchasing decisions may be influenced by convenience,
availability, or price, as well as by judgments of quality.
Lovelock and Wirtz (2007) identifies five perspectives on quality:
• The transaction view of quality is synonymous with innate excellence which
is a mark of uncompromising standards and high achievement. This
viewpoint is often applied to the performance of visual arts. It is argued that
people learn to recognize quality only through the experience gained from
repeated exposure and managers or customers will also know quality when
they see it is not very helpful.
35
• The product-based approach sees quality as a precise and measurable
variable. Differences in quality, it is argued, reflect differences in the amount
of an ingredient or attribute possessed by the product or service. Because this
view is totally objective, it fails to account for differences in the tests, needs,
and preferences of individual customers or even entire market segments.
• User based definitions starts with the premise that quality lies in the eyes of
the beholder. These definitions equate quality with maximum satisfaction.
This subjective, demand oriented perspective recognizes that different
customers have different wants and needs.
• The manufacturing based approach is supply based and is concerned
primarily with engineering and manufacturing practices, quality is also
operation driven.
• Value based definitions define quality in terms of value and price. By
considering the tradeoff between perception and price, quality comes to be
defined as “affordable”.
The most common definition of quality remains the extent to which a product or
service meets and/or exceeds a customer’s expectations (Buzzell and Gale, 1987;
Grönroos, 1991; Zeithaml et al., 1990). This definition comes out from the services
marketing literature (Lovelock, 1981; Normann, 1984; Shostack, 1977; Zeithaml,
1981), where researchers argued that a conformance to specifications definition of
quality failed to address the unique characteristics of services.
Regardless of the time period or context in which quality is examined, the
concept had multiple and often some vague definitions and has been used to describe
a large diversity of phenomenons.
36
2.2. TOTAL QUALITY MANAGEMENT
The majority of quality problems have their origins not in the manufacturing
or operations areas of a company, but in the marketing, service, finance, personnel
and administration functions. That is why; quality must be involved in all of the
organization’s departments and accepted by all of its employees. Total Quality
Management (TQM) is “a way of managing to improve the effectiveness, efficiency,
flexibility and competitiveness of a business as a whole” (Oakland, 2000:72). It
involves the whole company getting organized and becoming committed to quality
with each department, each activity and each person, at each level. TQM recognizes
that for an organization to be truly effective, each of its parts must work smoothly
with the other parts, because every person and every activity affects and in turn is
affected by others. The techniques of TQM can be applied throughout a company, so
that people from different departments, with different priorities and abilities,
communicate and help each other.
W. Edwards Deming is considered the father of TQM. While his earlier
definitions regarded quality from the statistical point of view, later in his researches
he viewed quality from both, statistical and managerial perspectives (Emmanuel and
Kroll, 1998). He insisted that quality should be an organizational-wide effort and it is
the responsibility of everyone, with management playing the most important role.
TQM is “an organizational-wide quality program to continuously improve products
and services delivered to customers by developing supportive organizational culture
and implementing statistical and managerial tools” (Deming, 1993:17). This new
focus on quality can be differentiated from the classical analysis of quality concept,
where the responsibility for quality is supported by inspectors. With TQM, every
employee is an inspector of his or her own work. A more detailed view on this topic
was provided by Kuei (1995), who introduced Strategic Total Quality Management
(STQM) as reflection of the overall performance of a firm.
37
Deming (1986) adapted 14 principals for management in implementation of
TQM:
• Create constancy of purpose to achieve continuous improvement of products
and services and survival of the firm. This point accentuates the importance
of the leadership.
• Adopt a new management philosophy where management must respond to
challenge and lead through change. This philosophy insists on understanding
of a better way to manage people and processes.
• Cease dependence on inspection and build quality into the product. This
point argues that dependence on inspection support the production of low
quality, which conducts to the situation when the quantity is more important
than the quality.
• Cease the practice of awarding business contracts on the basis of price tag
alone. Often, a lower cost does not offer the best quality. Cost should be
related to value and quality of work.
• Continuously improve the system of production and service to improve
quality and productivity. There is a common goal or mission in the
organization and this cannot be achieved if every unit works by itself like a
separated island. The action of each unity or process affects quality.
• Institute training on the job. Employees need to be trained in order to know
how to use statistical charts, the skills needed to improve their work and to
understand their role in the process of improving quality within organization.
• Leadership of management and production workers to help people and
machines to do a better job. Leaders should participate and support quality
improvement, teamwork and reward innovation.
• Drive out fear to improve effectiveness. Every employee can participate
actively in finding problems and solutions without having fear.
• Breakdown barriers between departments and encourage teamwork. This
point refers to the fact that usually organizational problems come from
internal competition between different departments.
38
• Eliminate slogans, exhortations and targets from the workforce. It may lead
to emotional issues and may create other work-related problems.
• Eliminate work standards, management by objectives and numerical goals.
The use of numerical goals supports quantity rather than quality.
• Remove barriers that rob the hourly worker, people in management and
engineering their right to pride in workmanship. Later the term “pride” was
replaced with term “joy” (Gitlow et al., 1995).
• Institute educational and self-improvement programs. The workforce should
be open to changes in their working process through education and training.
• Act to accomplish the transformation. Top management must lead the quality
movement. When top management concentrates on quality, employees notice
that and adapt to this new style of management.
Juran’s (1988) approach to the total quality movement is almost similar to
Deming’s one. Juran’s contribution to this topic concentrates on two central areas:
• Cost of quality. In order to attract top managers’ interest to quality, they
should be communicated the language they understand – money.
• Quality trilogy. According to the author, quality management forms a
trilogy which consists of quality planning, quality control and quality
improvement.
� Quality planning – concentrates on need to recognize and
understand the customer group (including internal and external
customers). Their needs must be recognized in order to improve
quality.
� Quality control – sustains that a statistical control process should
be used to monitor the process in order to detect risk.
� Quality improvement – while quality control will only lead to
maintain a stable process, quality improvement will help
organization to break down the frontiers and to assess new levels
of quality.
39
Crosby (1980) recommended a more radical approach to managing quality.
He argued that managers must support zero defects and insisted on the fact that
quality is free, because savings from quality improvement will already represent the
investments on quality. He rationalized quality as satisfying customers’ needs and he
was against the use of statistical control. However, in his work “Management
Maturity Grids” (1980:44) he presents a five-stage process which can help managers
to achieve better quality:
• Uncertainty. There is no information about the cost of quality and the reasons
of the poor quality cannot be clearly defined.
• Awakening. Teams may be formed in order to fight with some major
problems in a short period of time.
• Enlightenment. An organized approach to solve quality problems is
developed with regular corrective action
• Wisdom. Management is more involved and actively participating in quality
activities. A preventive approach to quality problems is adopted.
• Certainty. Management sees quality as a part of the daily work program.
Quality is now necessary for corporate survival and growth.
2.3. ISO QUALITY STANDARDS
A list of quality standards has been introduced by the International
Organization for Standardization (ISO) based in Geneva, Switzerland. The big
majority of these quality standards are globally accepted. Such quality standards as
ISO 9000 and ISO 14 000 series gained a universal recognition. Standardization
helps guide economic policies worldwide and especially in newly industrializing and
developing countries. Standardization is important for businesses as it motivates
healthy competition, support innovations, brings world markets and needs
uniformity.
40
After standards like BS-5750 and CSA-Z299 which were widely used
especially in UK and Canada; by year 1986, the first editions of ISO 9000 standards,
that include ISO 9000, 9001, 9002, 9003 and 9004 were completed (Oakland, 2000).
In the early part of 1987, these standards were published and were adopted by ISO.
These series of standards establishes guidelines and principles to assess quality in
business processes. ISO 9000 is perhaps one of the most widely recognized standards
of quality. According to Palmer (1994), after ISO 9000 series were introduced, they
have been adopted by more than 100 countries as the international standards for
quality and tens of thousands of companies implemented these standards and are
certified according to them.
As Madu (2004) specifies, already in 1992 at least 51 countries adopted ISO
9000 without change (France, Germany, Italy, Portugal, Greece, Netherlands,
Finland, Sweden, US, Japan, etc.). Increasing numbers of companies are interested in
registration through ISO 9000. There is an increased interest in ISO 9000 as an
advantage to do business in integrated European markets.
Aquilano and Chase (2006) noticed that there are five parts of ISO 9000
standards:
• ISO 9001 – considered being the most highest level, it is the model for quality
assurance when there is need to conform to specified requirements in design,
procurement, production, installation and servicing.
• ISO 9002 – has fewer requirements than ISO 9001, it expects for
conformance to specified requirements only when the interest is in the stages
of procurement to production.
• ISO 9003 – deals only with conformance to specified requirements during
producing process.
• ISO 9000 and 9004 – deal with guidelines for use.
41
ISO 9000 standards are not static and pretend to be reviewed every 5 years in
order to be revised. Nowadays, a lot of major firms are ISO 9000 certificated. Stelzer
et al. (1996) illustrated some benefits from ISO 9000 registration:
• Customer/supplier partnering relationship – ISO 9000 standards help to
improve competitiveness, as customers become more receptive to the
company.
• Prevention pays – ISO 9000 standards help to cut quality cost.
• Documentation – documentation of quality program can serve as evidence to
customers of the firm’s quality progress.
• Training – employees gain better knowledge of the job and the quality
system.
• Customer focus – focus on customers’ needs increases.
• Competitiveness – ISO 9001 helps all the countries with trade barriers.
• Reduction in customer audits – reduction in number of costly and time-
consuming customer audits.
• Objective evidence of compliance – this ensures customers that an effective
quality program is in place.
• Reduction in inspection – time and money are saved as the number of
incoming inspections conducted by customers is reduced.
• Enhanced marketability – recognizing of logos and certificate numbers.
Hoyle (2005) insists that an important part in implementing ISO 9000 is the
SWOT analysis. A firm should find out and recognize its strengths, weaknesses,
opportunities and threats and how these affect the implementation of quality
standards. In this context, one of the most current strengths may arrive from the
existence of Total Quality Management programs which help to develop an
organizational culture that is supportive of quality and continuous improvement.
42
2.4. THE CONCEPT OF SERVICE QUALITY
According to Parasuraman et al. (1991), companies can get their competitive
advantage by using the technology for the purpose of enhancing service quality and
gathering market demand. Quality can have different meanings to different people
and generally, it deals with a person’s expectations and perceptions about how all of
these expectations are satisfied (Madu, 2004). For example, a customer at a bank
may have different expectations of the quality he/she receives. If the bank employee
behaves in a nice way and seems to be friendly, the customer may overlook such
factors like the time it took to provide the service and the errors that the employee
maybe committed while offering that service. And vice versa, if the employee
offered the service quickly but was unfriendly, the customer may not be happy with
the quality of service. This example shows the difficulty to achieve quality in a
service, because aspects of quality in service sector are intangible, indirect and
difficult to measure.
Considering tangible items or products, quality can be measured differently.
Garvin (1988) identified the product quality items which are presented bellow:
• Performance – deals with operational characteristics of the product or service
• Features – secondary characteristics
• Reliability – deals with consistency of performance over time
• Conformance – control if product meets its design specifications
• Durability – concerns the useful life of a product
• Serviceability – responsible for ease of repair or obtain service when needed
• Aesthetics – deals with sensory attributes of a product such as feel, sound,
look
• Perceived quality – deals with customers’ perception of quality
For decades, many researchers have developed a service perspective of
quality (Foutz and Thompson, 1998; Zeithaml et al., 1990). Chang (2008:314)
describes that the concept of service quality “should be generally approached from
43
the customers’ point of view because they may have different values, different
ground of assessment, and different circumstances”. Berry, Parasuraman and
Zeithaml (1994:5) mention that service quality is “an extrinsically perceived
attribution based on the customer’s experience about the service that the customer
perceived through the service encounter”. According to the work of Kumra
(2008:426), service quality is not only involved in the final product and service, but
also involved in the production and delivery process, thus employee involvement in
process redesign and commitment is important to produce final tourism products or
services.
Another research study on service quality is presented by Grönroos (2007)
who focuses on a model that represents a comparison between customer expectations
from a service and their experience of the service they have received before. This
model is named “total perceived service quality”. As he emphasizes on what
customer is really looking for and what they evaluate, the service quality concept is
based on two dimensions. The first dimension is the “technical quality” and this
dimension refers to the outcome, what is delivered or what the customer gets from
the service. The next dimension is the “functional quality” which refers to the
manner in which the service is delivered or how it is delivered. Both dimensions
affect the corporate image and the perception of quality in various ways. According
to total perceived service quality model, perceived quality of a service is not only
affected by the experiences of the quality dimensions that the consumer used for
evaluating whether quality is perceived as good, neutral, or bad. It is also affected by
the perceived quality of given service as well as the outcome of the evaluation
process.
Grönroos (1984:38) gives different definitions and one of them is “service
quality is conformance to specifications”. Services are performances and often they
are performed in the presence of the customer. Services have a nature of varying
from one firm to another and from one situation to another. It is also possible to
make a distinction between technical and functional service quality, technical quality
is connected to what is delivered and functional quality is connected to how it is
44
delivered. Another example is Kennedy and Young (1989:88) who describe service
quality in terms of “process quality” and “output quality”. Process quality is
evaluated during the service delivery and output quality is evaluated after the service
delivery.
In the study conducted by Grönroos (1984), 10 determinants of service
quality were identified:
• Reliability. That is connected to the consistency of performance and
dependability. Here it is determined if the company give the service in the
right way the first time and keeps to its promises.
• Responsiveness. This factor concerns to what extent the employees are
prepared to provide service. This involves factors such as mailing a
transaction slip immediately, calling a customer back in short time and giving
prompt service.
• Competence. Competence is connected the knowledge and skills of contact
personnel, operational support personnel (and also research capability) that
are needed for delivering the service.
• Access. This factor is connected to the approachability which means for
example if the operating hours are convenient, the location of the facilities are
convenient, the waiting times are short and also easy access by telephone.
• Courtesy. This factor involves politeness, respect, consideration, friendliness
of contact personnel (including receptionists, telephone operators and so on).
• Communication. This is about keeping the customer informed in a language
they can understand and also listen to the customer. The company may have
to make some adjustments in order to include foreign customers.
• Credibility. Factors such as trustworthiness, believability and honesty are
included. It means to the level the company has the customer’s best interest at
heart. Factors that affect the credibility are the company name, reputation,
personal characteristics and the degree to which the hard sell is connected to
interactions with customers.
45
• Security. Security means freedom from danger, risk or doubt. Factors
included are: physical safety, financial security and confidentiality.
• Understanding the customer. This is about making an effort to understand the
customer which involves learning about specific requirements, providing
individualized attention and recognizing also the regular customer.
• Tangibles. They include physical aspects of the service such as physical
facilities, appearance of personnel, tools or equipment that is used to provide
the service, physical representations or other customers in the service facility.
Grönroos (1984) mentioned that service quality is determined by the
customer’s perceptions which result from comparing expectations that the customer
have before receiving the service and the actual experience that the customer gets
from the service delivery. If the expectations are met, the service quality is described
as satisfactory. They can also be exceeded and than they are considered as more than
satisfactory. The evaluation depends on the service process and also the service
outcome. It is described that there exists two types of service quality: quality at the
level where the regular service is delivered and the quality level where expectations
or problems are handled.
While Chang (2008) supports the earlier line of thinking by Grönroos;
Parasuraman, Zeithaml, and Berry (1988) developed “The Gap Analysis Model”,
which is a well known model of service quality. This model shows an integrated
view of the consumer-company relationship. The main idea of the model is focused
on the premise that service quality is dependent on the size and direction of the five
gaps that can exist in the service delivery process:
• Gap 1: the gap between customer expectations and those perceived by
management to be the customer’s expectations
• Gap 2: the gap between management’s perception of consumer expectations
and the firm’s service quality specifications
• Gap 3: the gap between service quality specifications and service delivery
46
• Gap 4: the service delivery, external communication gap
• Gap 5: the perceived service quality gap, the difference between expected
and perceived service (Parasuraman et al., 1990)
The first four gaps are identified as functions of the way in which service is
delivered from the service provider to the customer, while gap number five is
connected to the customer and as such is considered to be the truth of service quality.
Lovelock and Wirtz (2007) describe that researchers argue that the nature of
service quality requires a distinctive approach to indentify and measure it. The
intangible, multifaceted nature of many services makes it harder to evaluate the
quality of a service compared to products. Because customers are often involved in
service production, a distinction needs to be drawn between the process of service
delivery and the actual output of the service which is called technical quality. Other
researchers suggest that the quality of service is the result of an evaluation process in
which customers compare their perceptions of service delivery with the expected
outcome.
2.5. SERVICE COMPONENTS INFLUENCING PERCEIVED
SERVICE QUALITY
Fiore and Kim (2007) present a conceptual framework that concerns the
influences on the consumption experience by environmental variables such as
physical elements of the service environment, individual variables, individual
attributes and person-environment variables or situations. The physical environment
has the possibility to provide ideas about the influence of customer perceptions on
the brand image. Bitner and Zeithaml (2000) argue that customers do perceive
quality in more than one way and they also have perceptions about multiple factors
when quality is assessed.
47
Baker et al. (2002) describe three components that influence the service
encounter elements. The first component is physical environment and includes for
example music, lightning and external and internal environmental design. The
second one is customer interactions with intangible and tangible elements in the
service environment and the periods when customers interact with physical facilities
and other tangible elements in the service environment. This second component is
connected to the relationship between the service employee and the customer and
behavior is a key determinant of how the service will be appreciated. The third
component is about how customers are influenced from the appearance, perceptions
and behavior of other customers. Baker and Cameron (1996), discusses that the
behavior of other customers affect perceptions and that makes it important for
service providers to be careful about the interaction between customers.
Lovelock and Wirtz (2007), analyze the concept of a service encounter by
explaining that it is a period of time during which the customer interacts directly with
the service provider. Some of these encounters are very brief and consist of just a
few steps. If you use a service that requires the customer to make a reservation this
first step might have been taken days or even weeks before the customer arrives at
the service facility. Service processes usually consist of a series of encounters, such
as your experience with a flight that consist of steps from making reservation to
checking in, taking the flight, and retrieving customer’s bags on arrival. Knowledge
of role and script theories can help people understand, design, and manage both
customer behavior and employee behavior during those encounters and to improve
efficiently the service quality.
2.6. CUSTOMER EXPECTATIONS
Ekinci (2002) argues that the term expectation in service quality literature has
different meanings for different authors. According to Tam (2005), it is important for
success in process of influencing customer satisfaction to understand how customer
expectations develop and analyze how they update, even if the term expectation is
vague and difficult to define. Kandampully et al. (2001) noticed that the management
48
of customer expectations is also an imperative concept in firms and companies for
further products and services designed to match and exceed those expectations.
Grönroos (2009) suggested that in order to increase long term quality, the
customer expectations should be focused, revealed, and calibrated. Also, the same
author developed the dynamic model of expectation describing that the quality of
professional services develops in a customer relationship over time. He classifies the
expectations into three distinguishable types which can be characterized in the
following way:
• Fuzzy expectations (vague expectations). Exist when customers expect a
service provider to solve a problem but do not have a clear understanding of
what should be done. For example, if thinking a hotel resort where the
customer spends its holiday, when the sand is hot and the customer intentions
to pass through from its sun bed in order to enter the sea, he becomes nervous
because of the sand which is burning his foots. He expects the hotel
management to solve this question and to decrease the temperature of the
sand under the sun, but he has no idea about how to do it.
• Explicit expectations (dominant expectations). They are clear in the
customer’s mind in advance of the service process. They can be divided into
realistic and unrealistic expectations. For example, when being very nervous
and acting in a very angry way, the customer is expecting the employees of
an organization to be calm, patient and to react appropriately in order to solve
the problem in the benefit of the customer.
• Implicit expectations (recessive expectations). Refer to element of a service
which is so obvious to customers that they do not consciously think about
them but take them for granted. Continuing the hotel resort topic, an example
of explicit expectations can be the fact that when arriving at the holiday
destination, customer expects to find a comfortable and clean room, a mini
bar in the room which is daily refilled with beverages, delicious food offered
three times per day and some other features which are considered like
“normal” and “should be” in the customer’s mind.
49
The author stated that an explicit service provider should understand fuzzy
expectations because these expectations still have impact on customer satisfaction
about quality and customers will be disappointed in case the service provider does
not fulfill it. The characteristics in fuzzy expectations are: “customers may feel that
there is a need for understanding what would fulfill this need or change their current
state in general, but they do not have a clear understanding of what would fulfill this
need or change in the current situation”. Grönroos, (2009:72) also states that
customers expect something more in addition to be done but they do not know
exactly what and how it should be done.
Concerning explicit expectations, Grönroos mentions that customers
normally presume that explicit expectations will be met and unrealistic expectations
might be exciting. Service providers have to help customers adjust these unrealistic
expectations into more realistic ones to ensure that a service delivery will meet
customer expectations. In this stage, service providers should be aware of the more
vague promise or “implied-in-fact” promise because it can form unrealistic explicit
expectations that lead customers to believe that services offered will include features
that in fact are not included. Beside explicit expectations, implicit expectations also
have to be fulfilled because they are apparent that customers are clearly expressed.
Such implicit services will become explicit if they are not fulfilled.
According to Lovelock and Wirtz (2007), understanding the expectations of
customers means to understand the process when customers evaluate service; when
customers compare their expectations with what they received from the supplier. In
case when expectations are met or even exceeded, customers believe that the service
has a high quality. Customer expectations vary depending on what kind of business
the service is connected to. Expectations also vary depending on different positioning
strategies of different service providers. Thirdly, the expectations are influenced by
previous experiences of the service provider, competing services in the same industry
or related services in different industries. If customers do not have any previous
experience they are more likely to base their expectations on word of mouth, news
stories or the marketing efforts of the company. One more thing to consider is that
50
customer expectations vary over time because they are influenced by advertising,
new technologies, service innovation, social trends, etc. (Kandampully et. al, 2001).
2.7. RELATIONSHIP BETWEEN CUSTOMER EXPECTATIONS,
PERCEPTIONS AND SATISFACTION
Baker et al. (2002); Bitner (1992); Minor et al. (2004) put forward that the
environment influences customer satisfaction. Lovelock and Wirtz (2007) discuss
how confirmation or disconfirmation of expectations is related to satisfaction and
delight. The terms “quality” and “satisfaction” are sometimes used interchangeably.
Some researchers believe, however, that perceived service quality is just one
component of customer satisfaction, which also reflects price/quality trade- offs, and
personal and situational factors.
Oliver (1997:56) mentions that customer satisfaction has a big research
tradition of more than three decades. He also gives a definition about customer
satisfaction: “a judgment that a product or service feature, or the product or service
itself, provides pleasurable consumption related fulfillment. Another definition from
Oliver (1997:58) is that customer satisfaction is “an overall emotional response to an
entire service experience for a specific service encounter after purchasing and
consumption”. In an earlier article, the same author discusses that satisfaction can be
understood as the discrepancy between expectations and perceptions. Differences are
to be expected between importance attributes but also segments. Ellis and Pizam
(1999:328) explain that customer satisfaction can be described as “a comparison
between performance and expectations”.
Oliver and Rust (1994:44) expand the definition and mention that customer
satisfaction is “an affective term” and they identify five different types of satisfaction
which are pleasure, relief, novelty and surprise. There are many definitions but
according to White and Yu (2005:415) one consensus that can be found is that the
construct includes either cognitive or affective responses and customer satisfaction
can be either product or service focused.
51
Ghobadian et al. (1994) confirmed once again in their studies the well known
fact that satisfied customers become repeat purchasers of a product or service and
provide positive word of mouth. That means that it is important to understand what
factors influence customer satisfaction in order to create good products or services.
Bitner and Zeithmal (2000) expands this discussion and describes that there is an
overwhelming interest in service quality and the reason for that is both, practitioners’
and researchers’ believe that quality is crucial for the success of any business
organization. The construct has great impact on customer satisfaction, repeat
purchase behavior and in the long run, also the profitability of the organization.
Bitner (1992) also mentions that if the service is affective, it has a direct and
immediate affect on the customer satisfaction.
Zhao et al. (2002) argue that customer satisfaction has become a major
contributor for enhancing a service company such as long term profitability,
customer loyalty, and customer retention. Thus, it is important to encourage the staff
to deliver the right service to the right people in reasonable time and showing good
manner. Satisfied customers may also give positive word of mouth and for that
reason attract new customers and create long term business profit.
Crosby (1980) suggests that in order to create customer satisfaction it is
important for the company managers to identify which product or service attributes
that can enhance customer satisfaction or delightfulness, than the performance can be
improved and it will also be possible to find out which attributes that are expected by
the customers (expected attributes can create dissatisfaction by their absence). Many
researchers argue that customer satisfaction has big impact on customer intentions to
repurchase (Brady and Cronin, 2000). The same researchers also confirmed that
satisfaction is an indicator of intentions to return to the supplier.
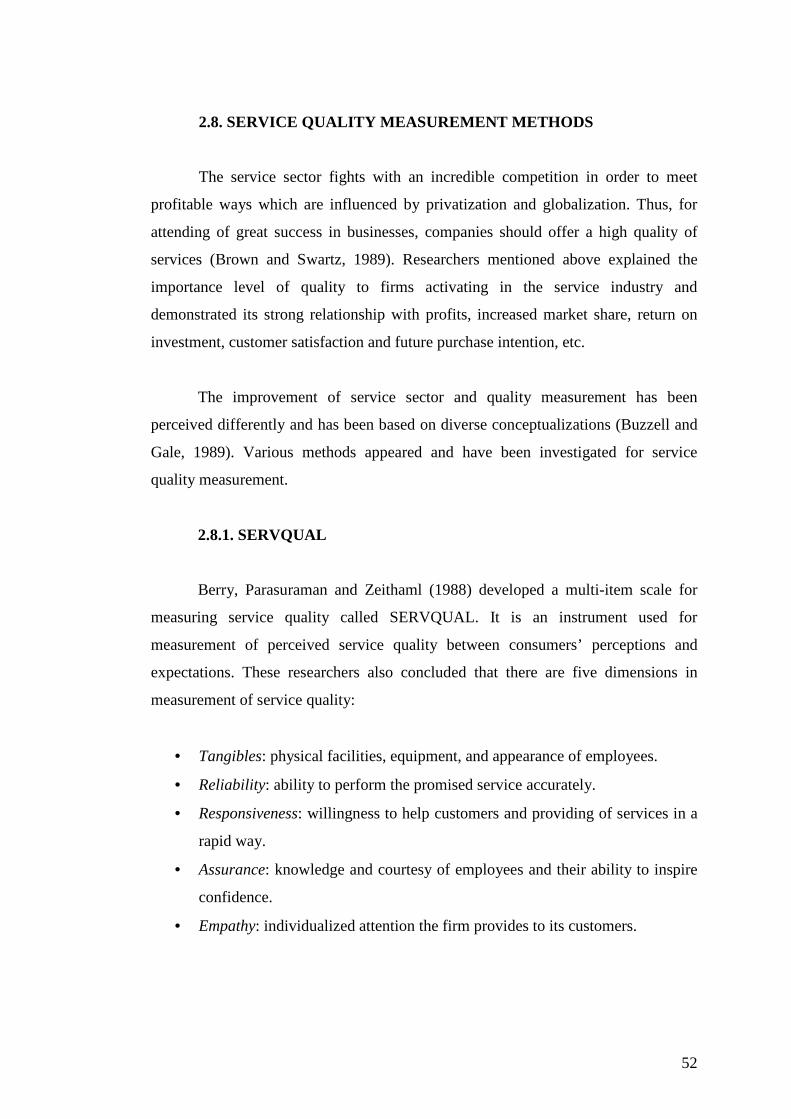
52
2.8. SERVICE QUALITY MEASUREMENT METHODS
The service sector fights with an incredible competition in order to meet
profitable ways which are influenced by privatization and globalization. Thus, for
attending of great success in businesses, companies should offer a high quality of
services (Brown and Swartz, 1989). Researchers mentioned above explained the
importance level of quality to firms activating in the service industry and
demonstrated its strong relationship with profits, increased market share, return on
investment, customer satisfaction and future purchase intention, etc.
The improvement of service sector and quality measurement has been
perceived differently and has been based on diverse conceptualizations (Buzzell and
Gale, 1989). Various methods appeared and have been investigated for service
quality measurement.
2.8.1. SERVQUAL
Berry, Parasuraman and Zeithaml (1988) developed a multi-item scale for
measuring service quality called SERVQUAL. It is an instrument used for
measurement of perceived service quality between consumers’ perceptions and
expectations. These researchers also concluded that there are five dimensions in
measurement of service quality:
• Tangibles: physical facilities, equipment, and appearance of employees.
• Reliability: ability to perform the promised service accurately.
• Responsiveness: willingness to help customers and providing of services in a
rapid way.
• Assurance: knowledge and courtesy of employees and their ability to inspire
confidence.
• Empathy: individualized attention the firm provides to its customers.
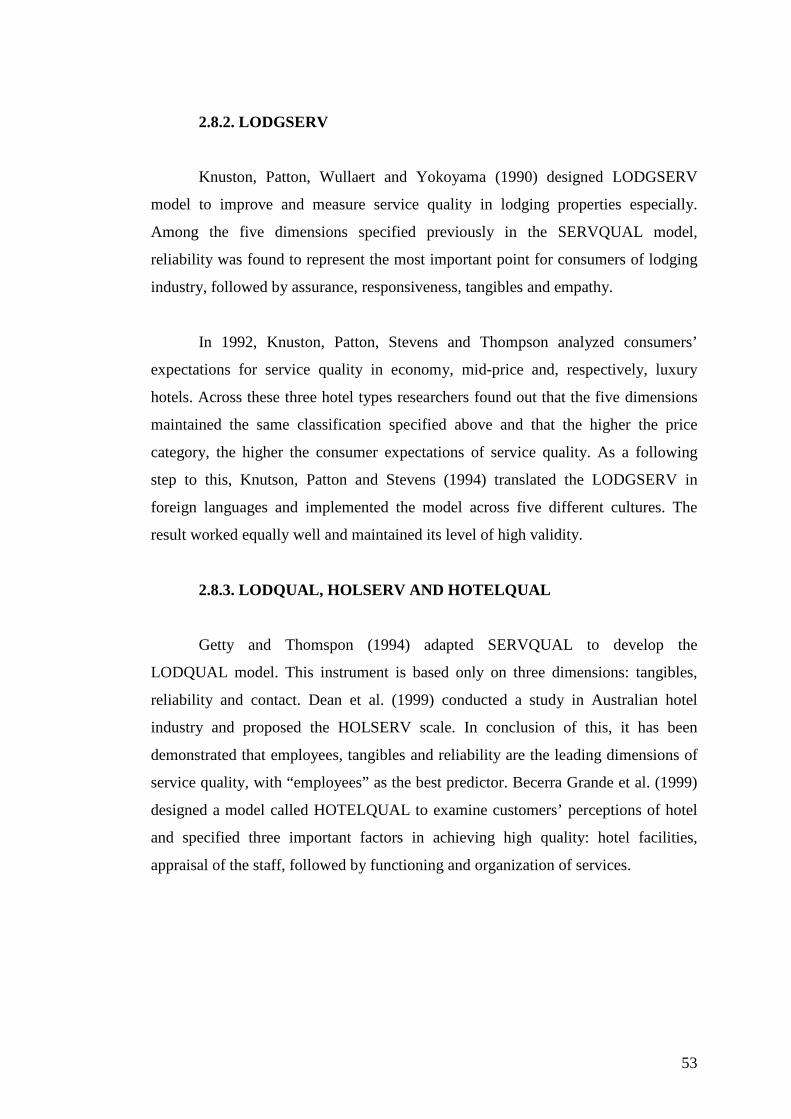
53
2.8.2. LODGSERV
Knuston, Patton, Wullaert and Yokoyama (1990) designed LODGSERV
model to improve and measure service quality in lodging properties especially.
Among the five dimensions specified previously in the SERVQUAL model,
reliability was found to represent the most important point for consumers of lodging
industry, followed by assurance, responsiveness, tangibles and empathy.
In 1992, Knuston, Patton, Stevens and Thompson analyzed consumers’
expectations for service quality in economy, mid-price and, respectively, luxury
hotels. Across these three hotel types researchers found out that the five dimensions
maintained the same classification specified above and that the higher the price
category, the higher the consumer expectations of service quality. As a following
step to this, Knutson, Patton and Stevens (1994) translated the LODGSERV in
foreign languages and implemented the model across five different cultures. The
result worked equally well and maintained its level of high validity.
2.8.3. LODQUAL, HOLSERV AND HOTELQUAL
Getty and Thomspon (1994) adapted SERVQUAL to develop the
LODQUAL model. This instrument is based only on three dimensions: tangibles,
reliability and contact. Dean et al. (1999) conducted a study in Australian hotel
industry and proposed the HOLSERV scale. In conclusion of this, it has been
demonstrated that employees, tangibles and reliability are the leading dimensions of
service quality, with “employees” as the best predictor. Becerra Grande et al. (1999)
designed a model called HOTELQUAL to examine customers’ perceptions of hotel
and specified three important factors in achieving high quality: hotel facilities,
appraisal of the staff, followed by functioning and organization of services.
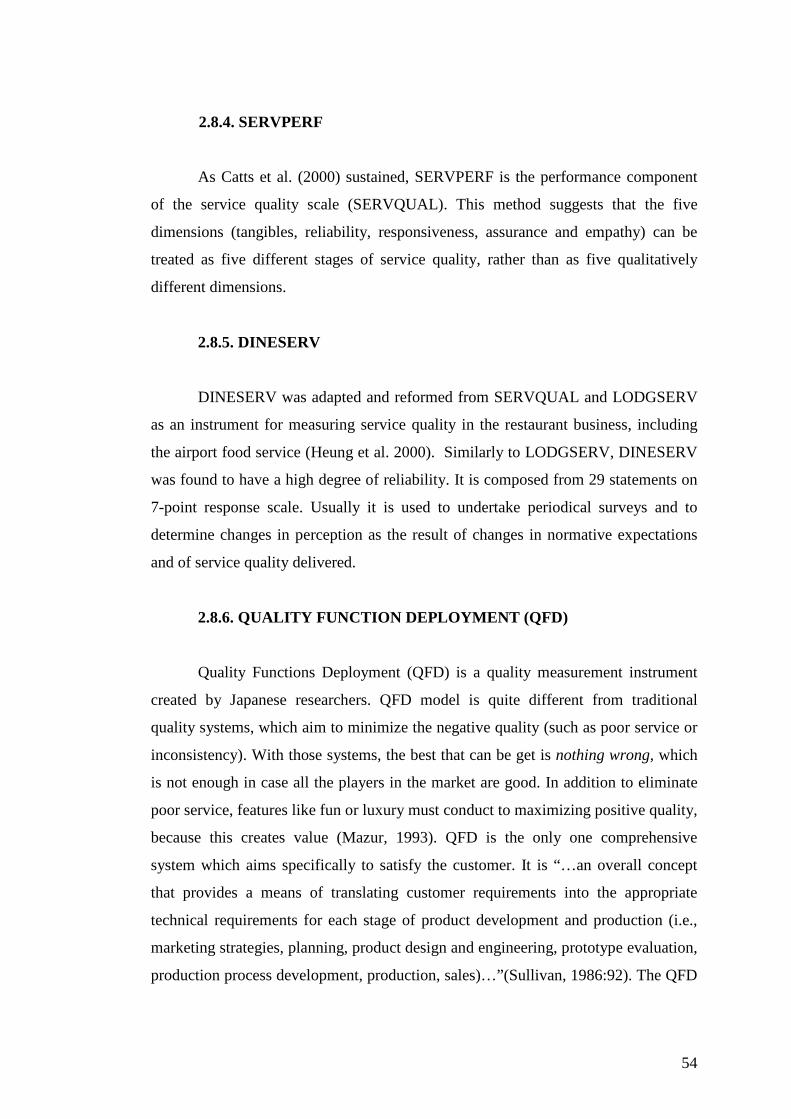
54
2.8.4. SERVPERF
As Catts et al. (2000) sustained, SERVPERF is the performance component
of the service quality scale (SERVQUAL). This method suggests that the five
dimensions (tangibles, reliability, responsiveness, assurance and empathy) can be
treated as five different stages of service quality, rather than as five qualitatively
different dimensions.
2.8.5. DINESERV
DINESERV was adapted and reformed from SERVQUAL and LODGSERV
as an instrument for measuring service quality in the restaurant business, including
the airport food service (Heung et al. 2000). Similarly to LODGSERV, DINESERV
was found to have a high degree of reliability. It is composed from 29 statements on
7-point response scale. Usually it is used to undertake periodical surveys and to
determine changes in perception as the result of changes in normative expectations
and of service quality delivered.
2.8.6. QUALITY FUNCTION DEPLOYMENT (QFD)
Quality Functions Deployment (QFD) is a quality measurement instrument
created by Japanese researchers. QFD model is quite different from traditional
quality systems, which aim to minimize the negative quality (such as poor service or
inconsistency). With those systems, the best that can be get is nothing wrong, which
is not enough in case all the players in the market are good. In addition to eliminate
poor service, features like fun or luxury must conduct to maximizing positive quality,
because this creates value (Mazur, 1993). QFD is the only one comprehensive
system which aims specifically to satisfy the customer. It is “…an overall concept
that provides a means of translating customer requirements into the appropriate
technical requirements for each stage of product development and production (i.e.,
marketing strategies, planning, product design and engineering, prototype evaluation,
production process development, production, sales)…”(Sullivan, 1986:92). The QFD

55
model concentrates on maximizing customer satisfaction. It focuses on delivering
value by seeking out both, spoken and unspoken needs, translating these into
actionable services, and communicating these through the organization. Then, QFD
gives the permission to customers to prioritize requirements they have, to explain the
firm which is its current situation comparative to its competitors and to direct firms
optimize those aspects of their services that will bring greatest competitive
advantage.
56
CHAPTER III
QUALITY FUNCTION DEPLOYMENT
3.1. REASONS FOR AND BENEFITS OF USING QFD
QFD is “a method for structured product planning and development that
enables a development team to specify clearly the customer’s wants and needs, and
then to evaluate each proposed product or service capability systematically in terms
of its impact on meeting those needs” (Cohen, 1995:21).
QFD has several names. In Japan, the original name for QFD is “hin shitsu, ki
nou, ten kai” (Emmanuel and Kroll, 1998). There are different translations of these
words, like “features mechanization evolution”, “quality function diffusion”, “quality
function deployment”. Other popular words which are used while meaning QFD are
“policy deployment”, “voice of the customer”, “house of quality”, “customer-driven
engineering”, “matrix product planning”.
The origins of QFD can be considered parallel to Mitsubishi’s Heavy
Industries Kobe shipyard in Japan in late 1960s, where QFD was used to facilitate
cross-functional product development process (Foutz and Thompson, 1998). A 1986
survey by the Japanese Union of Scientists and Engineers showed that more than half
of the companies surveyed were using QFD. Toyota Motor Company and its
suppliers are also among the big companies which largely applied QFD model
(Akao, 1997).
The increased competition in global market focused the attention of
international businesses on QFD. For example, QFD reached the US during the
quality revolution in 1980. Japanese companies gained competitive advantage in
businesses dominated once by US manufacturers (Emmanuel and Krol, 1998). Thus,
there was a big interest for top management to understand Japanese management
practices, especially in the area where these practices are related to quality of a
57
product. QFD became one of the important tools which helped managers understand
customers and integrate their requirements in production of goods and services.
Hales (1995) noted that product failures can be damaging for a company and
decrease it’s financial and human resources at the same time. They affirmed that
some companies which analyzed and were attentive to their customers’ needs have
achieved high profits; such as “light Coke”, “dry beer” or “smokeless cigarettes”.
Thus, in achieving success by implementing QFD, it is necessary not only to collect
information about customers’ requirements, but also to analyze this information and
translate its results to the design and manufacture of customer-driven products.
Services or products that customers do not want represent themselves in terms like
functionality, practicality, quality, cost, timing, etc. Authors insist on the fact that use
of QFD with target costing has strong relationship with the company’s customer-
focus level. QFD supports the fact that a product can be designed and produced to
meet the customers’ requirements. However, costs should be taken into consideration
in order to determine what the market is able to offer.
QFD has a lot of important benefits, especially in case of companies which
are interested in gaining competitive advantage, increasing market share and
improving productivity. Firms which adopted QFD assisted also to significant cost
reductions (Gale and Wood, 1994). Mazur (1993) specifies some important
advantages caused by QFD using are presented bellow:
• Reduction in cycle time is achieved. The product is introduced faster to the
market. Start-up costs are lower. Quality is improved.
• Products are produced at a lower cost because there are reductions in the
operational cost.
• QFD is applied in a cross-functional team context. All departments are
fighting for the same purpose.
• Information gathering is an ongoing process of QFD.
• Design and production efficiency is achieved by using QFD.
58
• Organizational harmony improves through formation of cross-functional
teams.
• Problems are easier to identify due to the data related to voice of customers.
• Market information gained by using QFD can be also used to determine
product price, quality and functionality.
• Increased competitiveness.
• Improved efficiency.
• Improved the employees’ psychological statement and their motivation.
3.2. SOME IMPORTANT OBJECTIVES OF QFD
As specified previously, QFD seems to be different from other traditional
quality measurement instruments and being preferred to use by a major number of
services organizations. Researchers mention continuously the advantages of this
model and underline its important objectives for being applied.
• To drive long-term improvements in the way new products are developed in
order to create value for customers (Raghunathan and Vonderembse, 1997)
• Identify the customer; determine what the customer wants; provide a way to
meet the customers’ desires (Motwani and Kathawala, 1994).
• Definition of the products characteristics, which meet the real needs of the
customers; gathering all of necessary information to set up the design of a
product or a service, without neglecting any point of view; supplying a
support to competitive benchmarking; preservation of coherence between the
planning and manufacturing processes of a product; provision of an audit trail
from the manufacturing floor back to customer demands; auto documenting
the project during its evolution (Zairi, 1995).
• Identify current performance measures that are closely linked to CR; identify
current performance measures that are redundant; identify new customer
oriented performance measures that are required; identify conflicts associated
with different performance measures; identify target values for customer
oriented performance measures; assess the degree of difficulty of achieving
the target value (s) for specific performance measures (Jagdev et al., 1997).
59
3.3. QUALITY DIMENSION DEVELOPMENT
“Quality dimension” has the same meaning with “customer requirements”
(Day, 1993). Customer requirements represent “the attributes or features of a product
or service that the customers consider important in order to achieve satisfaction”
(Evans and Lindsey, 1999:56). Actually, the customer can perceive a lot of different
features or attributes and these can be diversified from a product to another and from
a service to another. However, certain sectors have similar attributes. For example, in
auto industry or medical sector, safety attribute will always be important for the
customers. In the service sector, Kennedy and Young (1989) found out four common
attributes or quality dimensions as availability, responsiveness, convenience and
timeliness. Researchers of SERVQUAL model presented five attributes of service
quality as tangibles, reliability, responsiveness, assurance and empathy (Berry,
Parasuraman and Zeithaml, 1990). Anyway, these quality dimensions seem to be
specific to service organizations.
Madu (2004) argues that quality dimension relies on the cross-functional
teams and gives the following example in order to clarify the inter-departmental
work inside an organization by analyzing how needs of customers are satisfied. Thus,
if supposed manufacture process of a car, a sample of customers’ requirements
features may consist from:
• Operational – the ease of opening the car’s door; the length of time between
scheduled services
• Aesthetics – the size or shape of the car
• Availability of support – the availability of mechanical services
• Responsiveness – the time it takes to perform scheduled services
After organizing the features above, the cross-functional team can work with
specific quality dimensions which cover a list of customer requirements.
60
While talking about customer requirements, it is important to specify some of
the most important methods for collecting this data. According to Cohen (1995) there
are two basic types of this process:
• Reactive data can be found as customer complaints, compliments, feedback,
hotline data, product returns and/or warranty claims. This data is usually
negative and however difficult to hear, it typically represents significant
improvement opportunities. For example, it is likely that a customer
complaint occurs after the person experiences a product or service
dissatisfaction multiple times. Other unsatisfied customers may not announce
a complaint and just immediately switch to a competitor.
Proactive data, can be collected from customer interviews, surveys, focus
groups, observations, etc. :
� Interviews
A traditional collection method of customer requirements. This technique
is used to provide a specific customer point-of-view regarding product or
service issues, attributes and performance measures. It can be performed
by the organization directly to one customer or to a group of customers,
such as within a single customer segment.
� Surveys
This collection technique is used to measure the performance of a
product, service or attribute across an entire customer segment or group
of segments. It is recommended to have a minimum of 100 answered
questions per data subgroup to minimize the margin of error. When
developing the survey, it is important to determine the measurement scale
for answers, test the individual questions against the survey objectives,
and validate the questions through a pilot before launching it. These steps
will significantly improve the data collection success (Day, 1993).
� Focus Groups
This is where a group of 8 to 12 potential customers within the
demographic groups that the company wants to target meet in a room
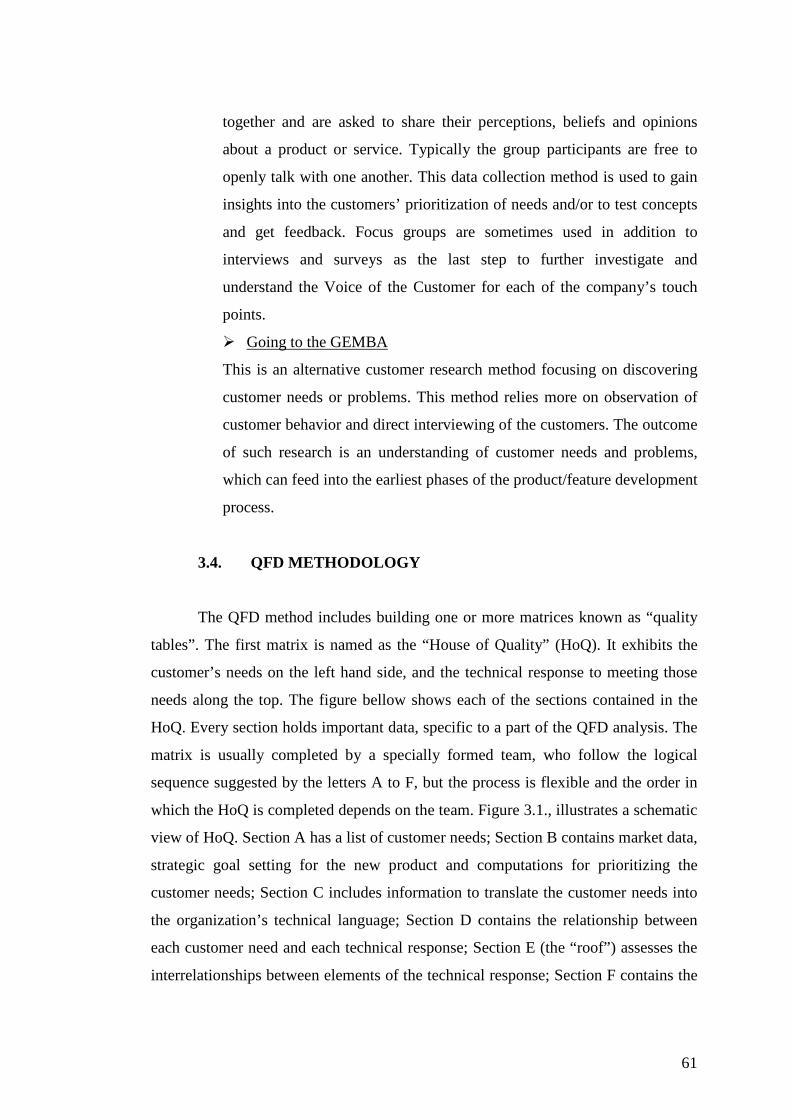
61
together and are asked to share their perceptions, beliefs and opinions
about a product or service. Typically the group participants are free to
openly talk with one another. This data collection method is used to gain
insights into the customers’ prioritization of needs and/or to test concepts
and get feedback. Focus groups are sometimes used in addition to
interviews and surveys as the last step to further investigate and
understand the Voice of the Customer for each of the company’s touch
points.
� Going to the GEMBA
This is an alternative customer research method focusing on discovering
customer needs or problems. This method relies more on observation of
customer behavior and direct interviewing of the customers. The outcome
of such research is an understanding of customer needs and problems,
which can feed into the earliest phases of the product/feature development
process.
3.4. QFD METHODOLOGY
The QFD method includes building one or more matrices known as “quality
tables”. The first matrix is named as the “House of Quality” (HoQ). It exhibits the
customer’s needs on the left hand side, and the technical response to meeting those
needs along the top. The figure bellow shows each of the sections contained in the
HoQ. Every section holds important data, specific to a part of the QFD analysis. The
matrix is usually completed by a specially formed team, who follow the logical
sequence suggested by the letters A to F, but the process is flexible and the order in
which the HoQ is completed depends on the team. Figure 3.1., illustrates a schematic
view of HoQ. Section A has a list of customer needs; Section B contains market data,
strategic goal setting for the new product and computations for prioritizing the
customer needs; Section C includes information to translate the customer needs into
the organization’s technical language; Section D contains the relationship between
each customer need and each technical response; Section E (the “roof”) assesses the
interrelationships between elements of the technical response; Section F contains the
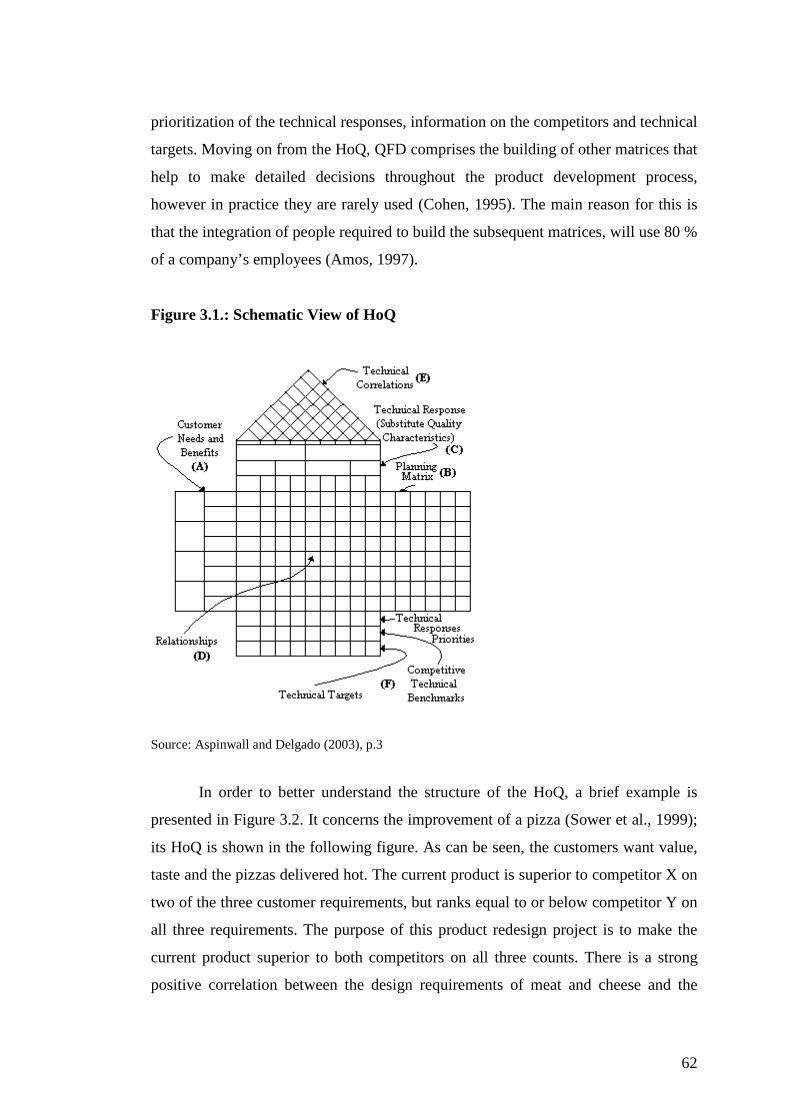
62
prioritization of the technical responses, information on the competitors and technical
targets. Moving on from the HoQ, QFD comprises the building of other matrices that
help to make detailed decisions throughout the product development process,
however in practice they are rarely used (Cohen, 1995). The main reason for this is
that the integration of people required to build the subsequent matrices, will use 80 %
of a company’s employees (Amos, 1997).
Figure 3.1.: Schematic View of HoQ
Source: Aspinwall and Delgado (2003), p.3
In order to better understand the structure of the HoQ, a brief example is
presented in Figure 3.2. It concerns the improvement of a pizza (Sower et al., 1999);
its HoQ is shown in the following figure. As can be seen, the customers want value,
taste and the pizzas delivered hot. The current product is superior to competitor X on
two of the three customer requirements, but ranks equal to or below competitor Y on
all three requirements. The purpose of this product redesign project is to make the
current product superior to both competitors on all three counts. There is a strong
positive correlation between the design requirements of meat and cheese and the
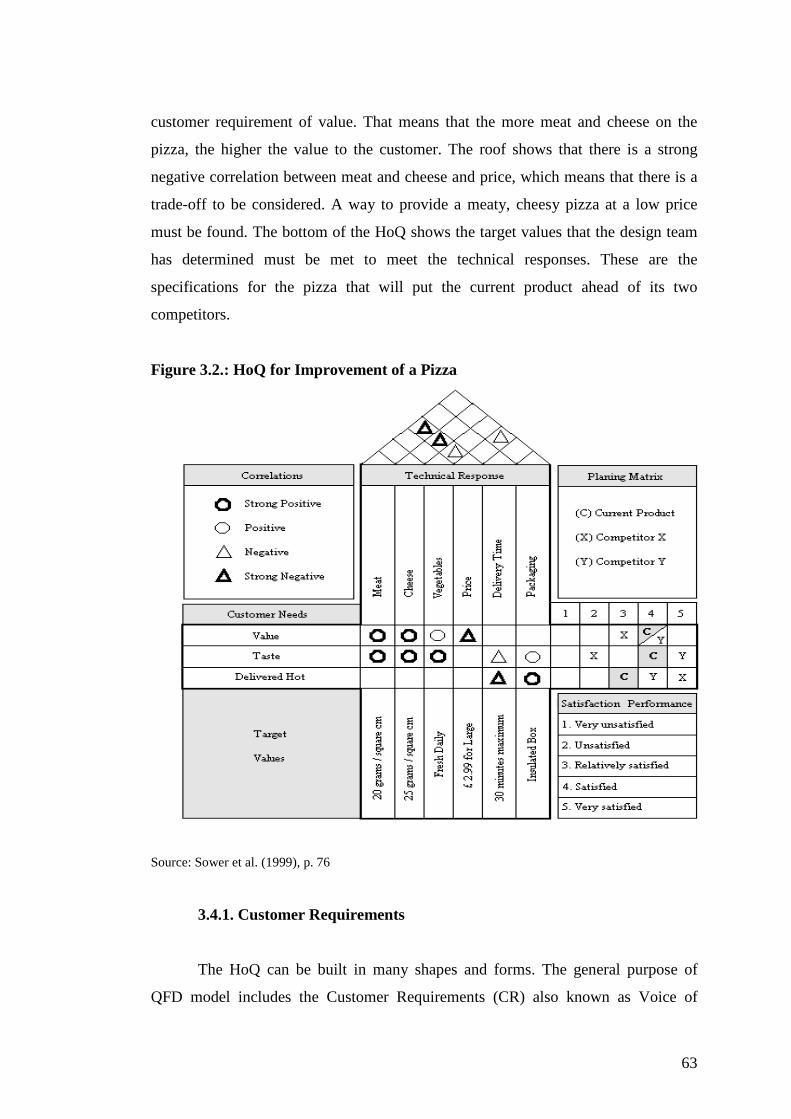
63
customer requirement of value. That means that the more meat and cheese on the
pizza, the higher the value to the customer. The roof shows that there is a strong
negative correlation between meat and cheese and price, which means that there is a
trade-off to be considered. A way to provide a meaty, cheesy pizza at a low price
must be found. The bottom of the HoQ shows the target values that the design team
has determined must be met to meet the technical responses. These are the
specifications for the pizza that will put the current product ahead of its two
competitors.
Figure 3.2.: HoQ for Improvement of a Pizza
Source: Sower et al. (1999), p. 76
3.4.1. Customer Requirements
The HoQ can be built in many shapes and forms. The general purpose of
QFD model includes the Customer Requirements (CR) also known as Voice of
64
Customers (VoC). They are the “whats” the customers want from the product to be
developed or service to be offered. They contain customer wishes, expectations and
requirements (Shahin, 2004).
3.4.2. Customer Importance Ratings
Once these “whats” are in place, the customer needs to provide numerical
ratings to these “whats” items in terms of their importance to the customer. A
numerical rating of 1 to 5 is often used, in which the number 5 represents the most
important and 1 the least important one.
3.4.3. Customer Market Competitive Evaluations
In this block, a comparison is made by the customer between a company’s
product/service and similar competitive products/services on the market. The
comparison results will help the developer position the product on the market as well
as finding out how the customer is satisfied now. For each product, the customer
gives 1 to 5 ratings against each CR, 5 being best satisfied and 1 the worst.
3.4.4. Technical Specifications
Technical specifications are to be built in a product/service with the intention
to satisfy CR. They are sometimes referred as “hows” because they are the answers
to CR: how can the requirements be addressed or satisfied. They are the engineers’
understanding in technical terms what customers really want. The technical
specifications must be quantifiable or measurable so that they can be used for design.
3.4.5. Relationship Matrix
Relationship matrix is used to maintain the relationship between CR and
design requirements. In other words, the matrix corresponds to the “whats” vs.
“hows”. It is the center part of HoQ and must be completed by technical team. A
65
weight of 1-3-9 or 1-3-5 is often used for internal representation of relationship, 1
being the weak and the biggest number showing the strong relationship.
3.4.6. Correlation Matrix
Correlation matrix is the triangular part in the HoQ – the “roof”. The
correlation matrix is used to identify which “hows” items support one another and
which are in conflict. Positive correlation helps identify “hows” items that are closely
related and avoid duplication of efforts. Negative correlation represents conditions
that will probably require trade-offs. The positive and negative ratings are usually
quantified using 2, 1, (-)1, and (-)2 ratings, with 2 being the two “hows” items
strongly supportive to each other and (-) 2 being conflictive ones. Sometimes only 1
and (-) 1 are used.
3.4.7. Performance Goals
Completed by technical team, these are the “how muchs” of the technical
“hows” items. They provide designers with specific technical guidance for what have
to be achieved as well as objectively measuring the progress. The goals have to be
quantified in order to be specific and measurable.
3.4.8. Technical Difficulty Assessment
Technical team conducts the assessment. It helps to establish the feasibility
and realization of each “hows” item. 1 to 5 ratings are used to quantify technical
difficulty with 5 being the most difficult and 1 being the easiest one.
3.4.9. Technical Competitive Evaluation
The technical competitive evaluation is used for comparing the new product
with competitor’s products to find out if these technical requirements are better or
66
worse than competitors’ ones. Again, 1 to 5 rating are used, with 5 being fully
realized each particular “hows” item and 1 being the worst realized.
3.4.10. Overall Importance Ratings
This is the final step for finishing the HoQ in its first phase. For each column,
sum all the row numbers each of which is equal to the production of relationship
rating and customer’s important rating. The results help identify critical product
requirements and assist in the trade-off decision making process.
3.5. STRENGTHS AND WEAKNESSES OF QFD
3.5.1. Strengths
The QFD process, when adopted carefully, offers numerous direct and
indirect benefits. Some of the salient benefits will be analyzed bellow. First, it
systematically interfaces external customer needs with a firm’s service generation
efforts. This point is particularly important in that many other service quality and
customer satisfaction programs concentrate mainly on the external market demand.
In this context, the QFD process can be an excellent tool to close simultaneously all
the “five service gaps” proposed in service quality model by Parasuraman et al.
(1985) and Zeithaml et al. (1988) (i.e., the Gaps Model). For example, service gaps
occur when management misperceives customer needs (Gap 1); when services are
misspecified (Gap 2); when services are misdelivered (Gap 3); when services are
miscommunicated (Gap 4); and when service performances do not meet the
customers’ expectations (Gap 5). Customer-defined importance of need attributes in
the beginning of QFD process minimizes Gap 1. Active participation and strong
cooperation required of functional managers in constructing the relationship matrix
contributes to the elimination of Gaps 2-4. Then, the closing of Gap 5 is one of the
ultimate goals of the whole QFD process in the long run.
67
Second, the QFD model offers a realistic opportunity to advance the
previously proposed models to remedy service problems. As a result of more than a
decade-long research program, Berry et al. (1994) found that delivering quality
service was in part a design challenge. They proposed “service mapping” as one of
the ways to improve service system design. Similarly, Shostack (1982) earlier
introduced “service blueprints” as a way to diagnose service delivery problems.
Nevertheless, these proposals did not include a specific instrumental method
for doing so. When added to service mapping and blueprinting techniques, the QFD
process is expected to provide management with more actions-oriented guidelines for
service design as well as a more holistic view of the service delivery and design
process.
Third, QFD also provides a structured method for proactively designing
quality into a process (Murgatroyd, 1993). Few research paradigms have suggested
specific guidelines for translating market demand into a service company’s
production process. This is particularly critical for service organizations with limited
resources. Therefore, an accurate translation of customer needs into company-
specific quality or service function deployment strategies is the first step for a
company seeking to maximize the output of limited resources. QFD assists
management in improving the process of service design with limited resources.
Fourth, the QFD process promotes not only effective communication but also
close cooperation among functional managers and business units. Strong team work
was emphasized by Berry et al. (1994) for service excellence. Because group
consensus on the assignments of numerical values throughout the house of quality is
essential, QFD participants are required to communicate extensively about both
customers’ needs and management requirements. This process is likely to help in
enhancing cross-functional relationships within a service organization, which is
essential for maintaining a healthy organization.
68
Another unique feature of QFD is its capability to deal with several key
competitors simultaneously. Assessments of key competitors with regard to the
capabilities of the company as well as the market demand may provide the company
with valuable strategic visions.
The QFD process also affords a great deal of flexibility in its application.
Although the QFD process may look complicated, companies need not attempt to
construct a house of quality for the entire organization from the beginning. QFD can
be applied to one or two focal functional areas first and companies may expand the
house by including other functional areas later. In the same way, a few strategic
customer needs may be a good starting point for building a house of quality and then,
additional needs can be incorporated periodically. In this way, management reserves
full control over the QFD process based on the company’s strategic intent.
3.5.2. Weaknesses
Despite the strong potential of QFD, several potential limitations must be
considered with future applications. First of all, QFD relies heavily on data obtained
from the customers through market research and from functional managers through
formal and informal discussions. Thus, inaccurate input data due to such reasons as
response bias, wrong research methods may provide unreliable guidelines for service
management.
Secondly, the entire QFD process may be a cumbersome procedure,
demanding excessive involvement from various functional units. Once established,
however, QFD becomes a baseline process; subsequent revisions and updates can be
done easily thereafter. In particular, when the house of quality is prepared with
spreadsheet programs, revisions and extensions are an easy task.
Finally, another limitation might be that the chart may quickly become too large
to handle. This problem may be solved by reducing the number of service attributes
69
and service design/management requirements to a smaller set of key items (Jeong
and Oh, 1998).
3.6. STUDIES ON QFD
Considering review of literature on quality, it has been found that the earliest
researches related to quality definitions and measurements were conducted in the
manufacturing sector. While systematic studies on quality started in the
manufacturing sector in the 1920s, researches on quality in services began to grow in
the late 1970s worldwide (Gummesson, 1991).
Zeithaml et al. (1990) sustain that service quality cannot be objectively
measured as can physical goods. The evaluation of quality for services is more
complicated than for products because of services’ characteristics of heterogeneity,
inseparability of production and consumption, perishability and intangibility (Frochot
and Hughes, 2000). These distinguishing features of services make difficult to define
and measure service quality.
The QFD model concentrates on maximizing customer satisfaction. It focuses
on delivering value by seeking out both, spoken and unspoken needs, translating
these into actionable services, and communicating these through the organization.
Then, QFD gives the permission to customers to prioritize requirements they have, to
explain the firm which is its current situation comparative to its competitors and to
direct firms optimize those aspects of their services that will bring greatest
competitive advantage.
Since being introduced by Shigeru Mizuno and Yoji Akao of the Tokio
Institute of Technology in the 1960s, QFD was analyzed and improved in a wide
variety of countries all over the world, like Japan, US, Australia, Belgium, Brazil,
Germany, Finland, China, Korea, Netherlands, Slovenia, Sweden, etc. Turkish
researchers also presented a big interest in analyzing the QFD process. A lot of
70
studies in various areas are conducted more or less in the majority of Turkey’s
institutes and universities.
The first two reported applications of QFD were in shipbuilding (Nishimura,
1972) and electronics (Akao, 1972) industries. The early applications of QFD were
concentrated on such industries as automobiles (Anderson, 1993; Dika, 1995),
electronics (Haavind, 1989; Williams, 1994) and software (Barnett and Raja, 1995).
Nowadays it will be hard to find an area of service industry in which QFD remains
not applied. As Chan and Wu (2002) specifies along its history, QFD model was
implemented in service domains like transportation and communication (Hendersson,
1994; Hales, 1995), accounting (Booth, 1995), banking (Ko and Lee, 2000),
engineering services (Pun et al. 2000), food distribution (Hines and Samuel, 1999),
hotels (Dube et al. 1999), retail (Nagendra and Osborne, 2000), technical library and
information services (Chin et al. 2001), wholesale (Keenan, 1996).
More than forty years have passed since Japanese academics and
industrialists began to formalize the QFD process due to its effectiveness in product
development and quality management. Starting with that period, many QFD process
applications and studies have been reported. Despite adaptations of the original
process to services, service applications of the QFD method remain limited. In Japan,
there are more than 1000 documented case studies on QFD model (Akao, 1997),
while Mazur (1997) reports only 136 documented applications worldwide for
implementation of QFD in services.
Yenginol (2000) conducted a doctoral thesis considering the importance of
QFD in frame of the TQM process. The author analyzed the general areas of QFD
implementation and the most important phases to pass through when applying this
model. The QFD instrument was used related to statistic courses at the Business
Faculty of Dokuz Eylül University and as conclusion of the study, the most
important points in the process of planning statistics courses were been specified.
71
Öter and Tütüncü (2001) analyzed QFD from a general point of view, while
being applying to the tourism sector. During their study, the authors focused
especially on the advantages and disadvantages of the model.
Kağnıcıoğlu (2002) presented an article related to the practical
implementation of QFD in product planning process. Points like what the marketing
advantages are for firms when using QFD and how important the customer
requirements are during product planning process were underlined during this study.
Güllü and Ulcay (2002) analyzed what the most important QFD mechanisms
are while talking about the product development process and presented a practical
implementation of the model inside a cable producing firm with explanation of the
interpretation of QFD results.
Akbaba’s research (2003) is related to using of QFD in the tourism sector
with all detailed description of the model. Researcher specified also historical facts
of the model and described how QFD was implemented in practice during different
periods of time. By the end of the study the author presented some important points
to be taken in consideration when using QFD inside the hospitality industry, with
specifying how to improve the hotel quality of services and the customers’
satisfaction through the application of the model.
The literature regarding the application of the QFD process in hotels,
particularly, or the hospitality industry, generally, is limited. The majority of studies
are limited to only a general description of how the QFD process must be
implemented. Despite of that, some studies on topic in question deserve to be taken
in consideration when analyzing the QFD model:
QFD method for customers requesting a hotel room was the essential topic
for Galanty and Kirk’s study in 1994. The framework of this study uses several
methodologies. QFD is extensively used in order to support the most important phase
of the framework. Kano’s model of customer requirements has been integrated in the
72
QFD structure by means of an original method developed by authors. Requirements
related to hygiene and comfort rooms are founded among the most important ones
when requesting the hotel’s accommodation. Delivery of such unexpected quality in
service or product, as “exciting quality”, could certainly catch the customer’s
attention. But for it to be effective, the baseline “expected quality” must be fulfilled.
This means rooms cleaned promptly, bathroom restocked, laundry returned on time,
and so forth – the tasks that are typically performed by the hotel’s housekeeping.
From other part, this study’s limitation is that it does not have the intention to
describe the service design and management totally. It focuses a lot on the transfer of
industrial methods and techniques to the service sector.
Stuart and Tax (1996) identified the potential of QFD process through the
House of Quality as an effective tool, both for the strategic service positioning level
and for the service quality delivery planning process at the tactical level. During all
their study, authors analyzed the adoption of QFD model while service design
process and presented case studies to gain additional insights into design challenges.
It was established also that adding more tangibility in the service encounter of a hotel
will reduce the risk of creation of a big gap between customer expectations and
perceptions.
In 1998, Haemoon and Miyoung developed a hypothetical QFD
implementation in the lodging industry in order to illustrate future applications in this
area. Authors demonstrated that QFD has more advantages and benefits when
compared with other, traditional service quality measurement approaches. Anyway,
they presented also the weaknesses of the model, some of them being the difficulty to
control all of the customer requirements when introducing data to be analyzed or the
difficulty to handle all the phases of building the House of Quality, while becoming
big enough, this instrument it is not so easy to be controlled.
Dube, Johnson and Renaghan (1999) analyzed a modified QFD approach for
extended-service transactions and empirical demonstration with luxury business
hotels. Researchers adapted the QFD model generally in context of the service
73
design process. Authors reported intangible benefits such as reduction in loneliness
and monotony, increased job enrichment and teamwork, better communication
between team members and between guests and team members, and stronger
customer-supplier relationship between housekeeping and laundry as being
important in providing better quality services.
Oke et al. (2008) showed the combined application of QFD and Pareto
Analysis to hotel services through a hotel case-study. The Pareto Analysis is applied
as a prioritization tool for the purpose of financial investment decision. This paper is
considered new and appears to be the first application of the Pareto related to QFD
principles in hotel services, and a new way of prioritization and quality improvement
in hotels systems. As a conclusion of this study, researchers specify that the
implementation of Pareto analysis results into increased customer patronage and
improved hotel profit margin.
74
CHAPTER IV
METHODOLOGY
4.1. RESEARCH ENVIRONMENT
This study has been conducted in a five star hotel in Antalya*. The hotel is
situated at the Lara Beach; 15 km to downtown Antalya and 11 km to the
international airport. It has its own, private, 230 m long sand beach. The Case Hotel
is a part of a resort which includes already four hotels in it and a project for building
a fifth hotel is implemented nowadays by this resort’s owners.
Case Hotel has 462 rooms in the main building, each of which has either a
sea or a mountain view. It has 385 standard rooms, 58 duplex family rooms, 11
standard family rooms, 2 rooms for handicap persons and 6 suits. All types of rooms
have a mini bar (refilled daily with soft drinks), direct telephone, information and
music channels, satellite TV channels, central air conditioning, toilet and bathroom,
hairdryer, safe, balcony, wireless internet, slippers and bathrobes. The hotel has one
main restaurant for breakfast, lunch and dinner with a capacity of 650 indoor and 155
outdoor seats, also 8 A la Carte Restaurants which offer Turkish, French, Mexican,
Japanese, Chinese, Italian foods, and a fish cuisine. There are 11 bars on the territory,
with a Turkish Topaz Teahouse included, where everybody can enjoy Turkish tea,
coffee or a water pipe.
The Case Hotel has three outdoor and one indoor swimming pool. A holiday
in this hotel can also be enjoyable by using the volleyball, basketball or three tennis
courts. There is also a SPA centre with a lot of procedures offered (aromatic, Thai
and peeling soap massages, facemasks, body masks, face peeling, etc.), two saunas
and a Turkish bath. Two fitness centers are also opened to guests who are interested
in. Animation works daily around the pool and evenings at the amphitheatre.
Children can be involved in different daily and evening activities at the Mini Club.
The payment acceptable in the hotel is cash, Visa, Master or Euro Cards. * Since the hotel management wanted its name not to be revealed, in this thesis, the hotel name is given as “Case Hotel”.
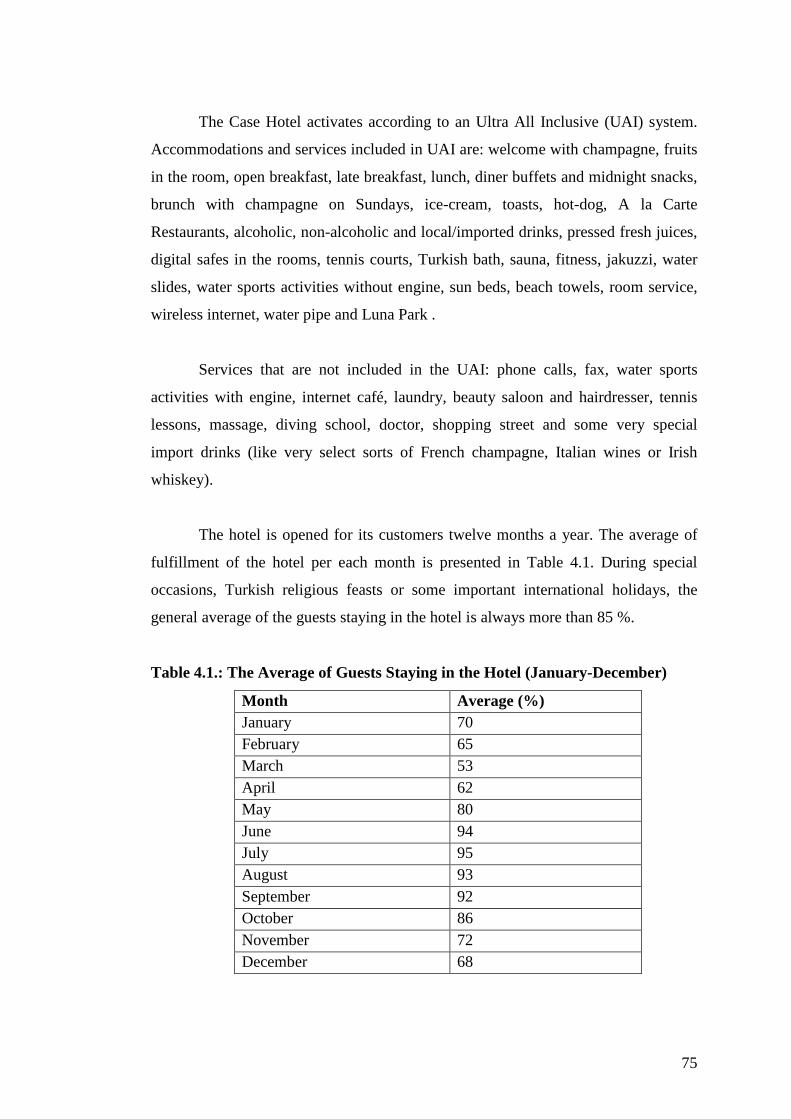
75
The Case Hotel activates according to an Ultra All Inclusive (UAI) system.
Accommodations and services included in UAI are: welcome with champagne, fruits
in the room, open breakfast, late breakfast, lunch, diner buffets and midnight snacks,
brunch with champagne on Sundays, ice-cream, toasts, hot-dog, A la Carte
Restaurants, alcoholic, non-alcoholic and local/imported drinks, pressed fresh juices,
digital safes in the rooms, tennis courts, Turkish bath, sauna, fitness, jakuzzi, water
slides, water sports activities without engine, sun beds, beach towels, room service,
wireless internet, water pipe and Luna Park .
Services that are not included in the UAI: phone calls, fax, water sports
activities with engine, internet café, laundry, beauty saloon and hairdresser, tennis
lessons, massage, diving school, doctor, shopping street and some very special
import drinks (like very select sorts of French champagne, Italian wines or Irish
whiskey).
The hotel is opened for its customers twelve months a year. The average of
fulfillment of the hotel per each month is presented in Table 4.1. During special
occasions, Turkish religious feasts or some important international holidays, the
general average of the guests staying in the hotel is always more than 85 %.
Table 4.1.: The Average of Guests Staying in the Hotel (January-December)
Month Average (%) January 70 February 65 March 53 April 62 May 80 June 94 July 95 August 93 September 92 October 86 November 72 December 68
76
Hotel customers’ nationalities are generally like 61 % German, 12 % Dutch,
11 % Russian, 5.6 % English, 4.8 % Turkish and 5.4 % people coming from
countries like France, Swiss, Austria, USA, Serbia, Rumania, Moldova,
Scandinavian Countries, etc.
Hotel possesses already an ISO 9000 certificate. At the moment when this
research was conducted there were 202 employees working in the hotel, including
the general manager and ten department managers.
4.2. RESEARCH METHODOLOGY
The research methodology to be used in this study in order to answer the
research questions was quantitative in nature. Elements of qualitative research like
observation, and focus group studies, were also implemented for accomplishment of
this work. According to Ghauri et al. (2002), three types of research can be identified;
these are: descriptive, exploratory and causal. Since this study aims at exploring the
foreign customers’ expectations from Turkish five star hotels and as long as a concrete
hotel case study is analyzed, a combination of exploratory and descriptive researches
was employed.
4.2.1. Research Objectives
The main objective of this research is to identify the most important foreign
customers’ expectations from a five star Turkish hotel. Besides that, the technical
specifications to be implemented in order to complete the customers’ needs, the
actual hotel performance, the situation of the hotel considering one of its main
competitors, and the changes in hotel’s point of sales are to be found out by the end
of this study. Considering some other studies conducted in the hospitality industry,
the QFD model will be implemented in accomplishment of this research as one of the
most important tools which helps managers understand customers and integrate their
requirements in service design.
77
4.2.2. Research Hypotheses
Besides the implementation of the QFD model, two hypotheses will be
formulated. Since needs and requirements of customers may be shaped by their
cultures, the study proposes that hotel guests coming from different countries might
have different requirements or perceptions/evaluations of the hotel performance.
Therefore, besides implementing QFD methodology, this study aims to find out
whether the importance degrees of requirements and hotel performance evaluations
differ with regard to different nationalities. Hence, the bellow hypotheses are formed:
H1: There is a difference in importance degrees of requirements between different
nationalities.
H2: There is a difference in evaluations of hotel performance between different
nationalities.
4.2.3. Research Design
The research design applied in accomplishment of this study is composed of
two sections. Section one represents the gathering of customer requirements and
focuses on the application of a questionnaire technique, while the second part is
related to a practical implementation of the QFD model. For the second phase of the
study a QFD team was formed in order to have a well-built QFD instrument. The
QFD team included ten employees of the hotel: General Manager, Front Office
Manager, House Keeping Manager, Food and Beverage Manager, Chief Cook,
Security Manager, Guest Relations Manager, Technical Services Manager, Sales
Manager and Human Resources Manager. The QFD meetings took place in a
conference room inside the hotel during four months.
78
4.2.3.1. Voice of Customers
4.2.3.1.1. Determination of Customer Requirements
Determination of customer requirements is an important step in the practical
application of the QFD model. Methods like interviews, observations, focus groups
and going to the GEMBA were used to identify the most important customer
requirements. While going to the GEMBA method (which represents a major part in
accomplishment of this study), nine different focus groups were organized, each of
them with nine representatives of the same nationality: German, Dutch, English,
Turkish, Russian, Rumanian, French, Swiss and Serbian. The decision to organize
nine different focus groups was due to the fact that people are expressing better
opinions by using their native language. At the same time, since the purpose of this
study is to determine the expectations of foreign tourists from Turkey’s five star
hotels, the Turkish focus group, was composed by Turkish people who was born,
educated, and actually live abroad. People invited to take part in the focus groups
were of different age, gender, marital status, profession, etc. – in order to understand
the needs of every segment when identifying requirements. The guests were asked to
explain and to discuss points like:
• Why they chose Turkey as a holiday destination
• What comes in their mind when they are thinking about UAI system
• What would they change in the hotel if they had this opportunity
• Which things are absolutely bad or negative in the hotel
• Which factors can motivate them to come back to the hotel
• Which factors can demotivate them to come back to the hotel
• What other things/services can be included in hotels offering UAI system in
order to satisfy guests more
Besides focus groups, the files of guests’ complaints collected by the Guest
Relations Department during the whole season have been analyzed and results from
this phase have been compared with the guests’ responses and reactions resulted
from focus group discussions. Generally, both were nearly the same. The results
79
from these phases are presented in Table 4.2. The table illustrates the initial list of 30
most underlined customer requirements.
As some of the requirements seemed to be similar to other requirements,
another group of nine guests, from different origins, speaking English fluently (as a
common language), was invited to categorize requirements. Each customer
requirement was written one by one on separate sheets of paper. The group members
discussed the similarities between presented requirements and grouped them. During
this process, the initial list of customer requirements has been reduced due to the fact
that some of the requirements were seen having the same meaning and related to the
same topic. For example, “hotel rooms should be absolutely clean” and “hotel
territory should be absolutely clean”, were evaluated as the overall cleanliness in the
hotel. Similarly, “food and beverages should be delicious and diversified” has been
added to the “food and beverages should be hygienic and high quality”. “All the
technical equipment should be clean and good working” has been associated to “all
the technical equipment should be new”, while “staff should know foreign
languages” has been seen as a part of “staff should be professional and experienced”.
At the same time, “guests should always find the competent person for solving a
problem” has been mixed with “services should be offered immediately and at the
right time”, accordingly, “children should feel safe in the Mini Club” has been seen
as a part of already existing “guests should feel safe in the hotel area” item. Another
common point has been found between “there should be no discrimination according
to guests’ origins” and “every procedure and service should be adapted in conformity
with different cultures”. The final list of customer requirements which have been
reduced to 23 is given in Table 4.3.
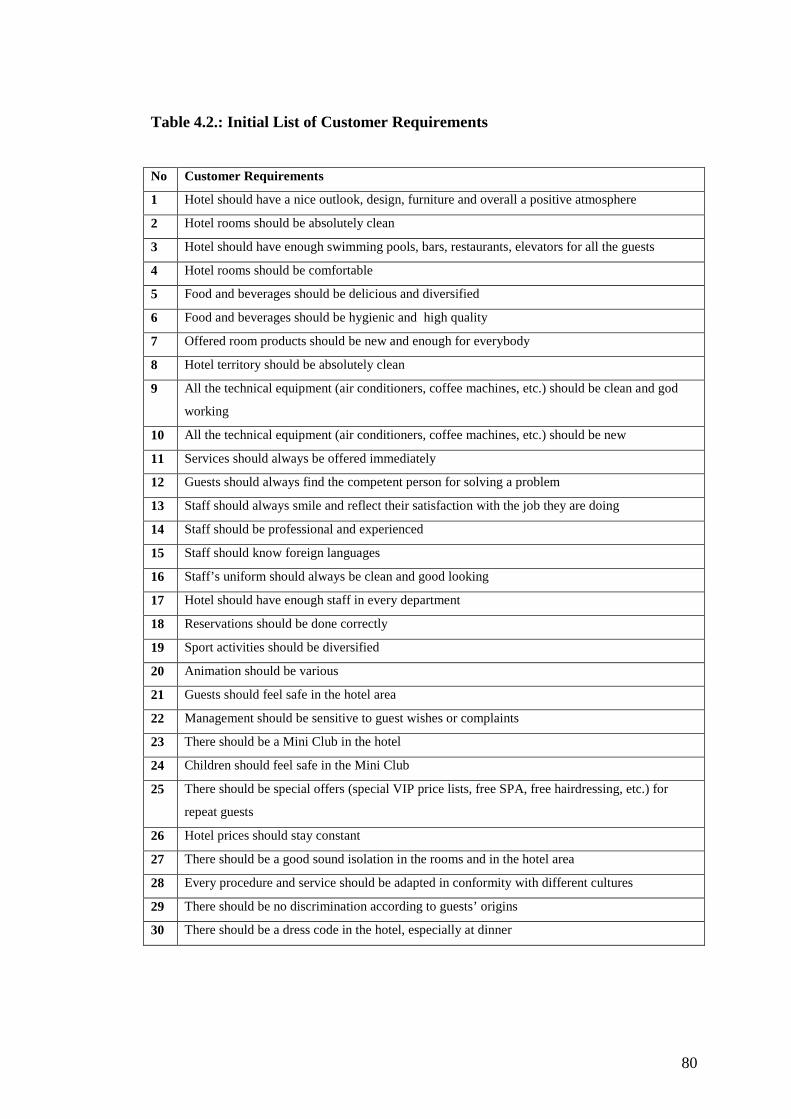
80
Table 4.2.: Initial List of Customer Requirements
No Customer Requirements
1 Hotel should have a nice outlook, design, furniture and overall a positive atmosphere
2 Hotel rooms should be absolutely clean
3 Hotel should have enough swimming pools, bars, restaurants, elevators for all the guests
4 Hotel rooms should be comfortable
5 Food and beverages should be delicious and diversified
6 Food and beverages should be hygienic and high quality
7 Offered room products should be new and enough for everybody
8 Hotel territory should be absolutely clean
9 All the technical equipment (air conditioners, coffee machines, etc.) should be clean and god
working
10 All the technical equipment (air conditioners, coffee machines, etc.) should be new
11 Services should always be offered immediately
12 Guests should always find the competent person for solving a problem
13 Staff should always smile and reflect their satisfaction with the job they are doing
14 Staff should be professional and experienced
15 Staff should know foreign languages
16 Staff’s uniform should always be clean and good looking
17 Hotel should have enough staff in every department
18 Reservations should be done correctly
19 Sport activities should be diversified
20 Animation should be various
21 Guests should feel safe in the hotel area
22 Management should be sensitive to guest wishes or complaints
23 There should be a Mini Club in the hotel
24 Children should feel safe in the Mini Club
25 There should be special offers (special VIP price lists, free SPA, free hairdressing, etc.) for
repeat guests
26 Hotel prices should stay constant
27 There should be a good sound isolation in the rooms and in the hotel area
28 Every procedure and service should be adapted in conformity with different cultures
29 There should be no discrimination according to guests’ origins
30 There should be a dress code in the hotel, especially at dinner
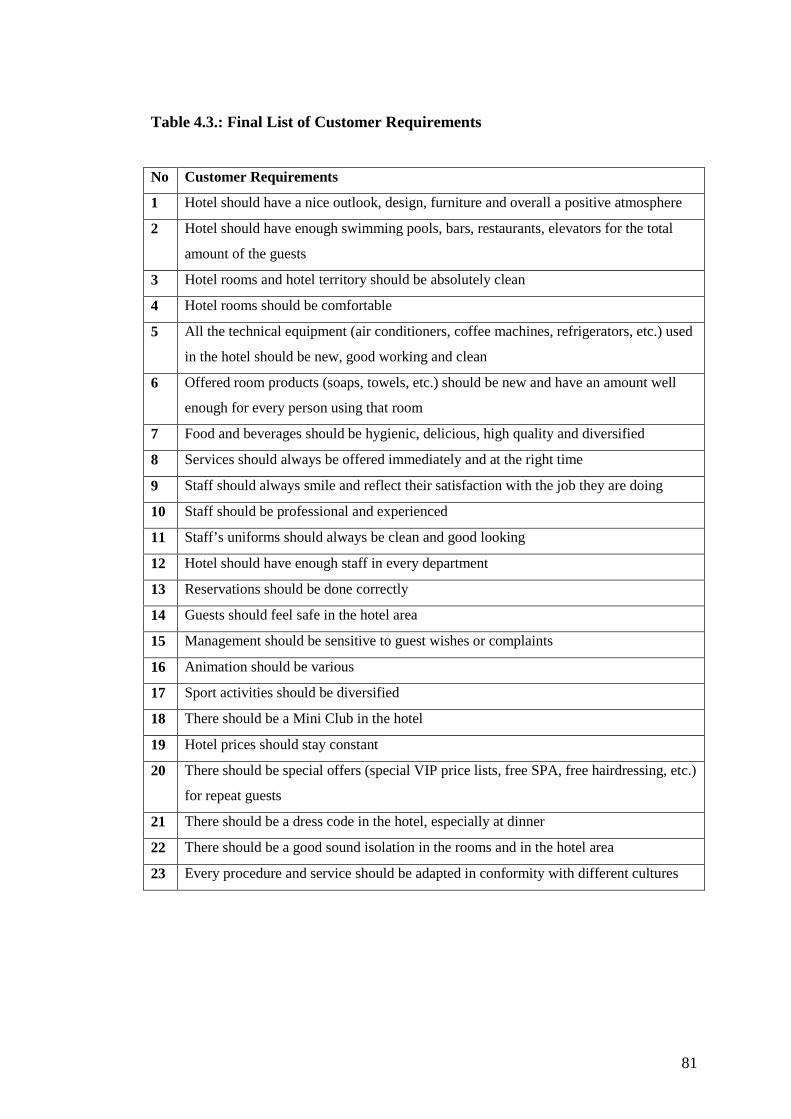
81
Table 4.3.: Final List of Customer Requirements
No Customer Requirements
1 Hotel should have a nice outlook, design, furniture and overall a positive atmosphere
2 Hotel should have enough swimming pools, bars, restaurants, elevators for the total
amount of the guests
3 Hotel rooms and hotel territory should be absolutely clean
4 Hotel rooms should be comfortable
5 All the technical equipment (air conditioners, coffee machines, refrigerators, etc.) used
in the hotel should be new, good working and clean
6 Offered room products (soaps, towels, etc.) should be new and have an amount well
enough for every person using that room
7 Food and beverages should be hygienic, delicious, high quality and diversified
8 Services should always be offered immediately and at the right time
9 Staff should always smile and reflect their satisfaction with the job they are doing
10 Staff should be professional and experienced
11 Staff’s uniforms should always be clean and good looking
12 Hotel should have enough staff in every department
13 Reservations should be done correctly
14 Guests should feel safe in the hotel area
15 Management should be sensitive to guest wishes or complaints
16 Animation should be various
17 Sport activities should be diversified
18 There should be a Mini Club in the hotel
19 Hotel prices should stay constant
20 There should be special offers (special VIP price lists, free SPA, free hairdressing, etc.)
for repeat guests
21 There should be a dress code in the hotel, especially at dinner
22 There should be a good sound isolation in the rooms and in the hotel area
23 Every procedure and service should be adapted in conformity with different cultures
82
4.2.3.1.2. Questionnaire Design
All of the customer requirements from the list illustrated in Table 4.3., were
introduced in the questionnaire form, presented to guests, as the questionnaire
technique was utilized and data were collected via questionnaires in accomplishment
of this study. The questionnaire used in this study was composed of two parts. Part
one presented questions considering information about country of origin, gender, age,
profession and education of respondents. In part two, participants were asked to
specify the importance degrees of the presented customer requirements. In addition,
the respondents were requested to mark the performance level of these requirements
in the hotel. In order to measure these, a 5-point Likert scale was used, 1-representing
“very unimportant” and 5-representing “very important”, for specifying the
importance degrees; 1-representing “very low” and 5-representing “very high” for
identification of the performance levels. The questionnaires were distributed in
English, German, Turkish and Russian languages. Dutch, Rumanian and Serbian
guests completed the questionnaires in English, while French and Swiss guests
answered at the German questionnaires due to the fact that their knowledge of German
language was specified by the guests their selves as being good. The procedure was
applied starting from October 2010 to mid January 2011.
4.2.3.1.3. The Sample
The population was comprised by people who come usually, to spend their
holiday in five star Turkish hotels. Convenience sample technique was applied for this
research as the selection of the sampling units was decided by the interviewer.
Convenience sampling is mostly used for researches for generating ideas, insights and
hypothesis. Also, this technique is considered least expensive and time consuming
technique (Malhotra, 2004:321). Since the guests to participate in the questionnaire
presented in this thesis were selected by the interviewer and due to the fact that two
hypotheses were formulated in order to answer some research questions, this sampling
technique was found appropriate for the accomplishment of this study.
83
Despite the fact that all types of guests seem to be important when
implementing a QFD model in the lodging industry (Stuart and Tax, 1996), the
matrices would be very extensive and difficult to handle when analyzing all of the
guests’ categories. Thus, in order to avoid that, guests which spent at least one night
in the Case Hotel and have been already at their check out point, were chosen as a
main customer segment to be analyzed.
In line with the previous studies, a sample size of approximately 250
respondents was determined in advance. The main reasons for determining this
sample size was based on several qualitative factors: the nature of the research,
number of variables, and the sample sizes used in similar studies. Since the nature of
this study is exploratory with descriptive elements, the sample size is typically small
to large (Malhotra, 2004:318). Average size of samples used in similar studies is 200
minimum, thus a sample size of 250 for this research was considered satisfactory. The
total capacity of the hotel at the moment when this research was conducted
represented 71 %.
From the total number of 250 questionnaires, 37 were not returned and 62
were not totally completed, which made them unusable for the research. In the end,
151 samples were obtained that were later used for the study.
4.2.3.1.4. Data Analysis Procedure
In order to achieve the purpose of this research, the customer requirements
were established while using methods like going to the GEMBA and focus group
studies. SPSS 16.0 version was used to help analyze the collected data after the
implementation of the questionnaire technique. The Cronbach’s alpha was used for
reliability analysis, while analysis of variance (ANOVA) was applied to asses the
difference across certain groups of respondents considering the importance degrees of
requirements and their performance levels in the hotel.
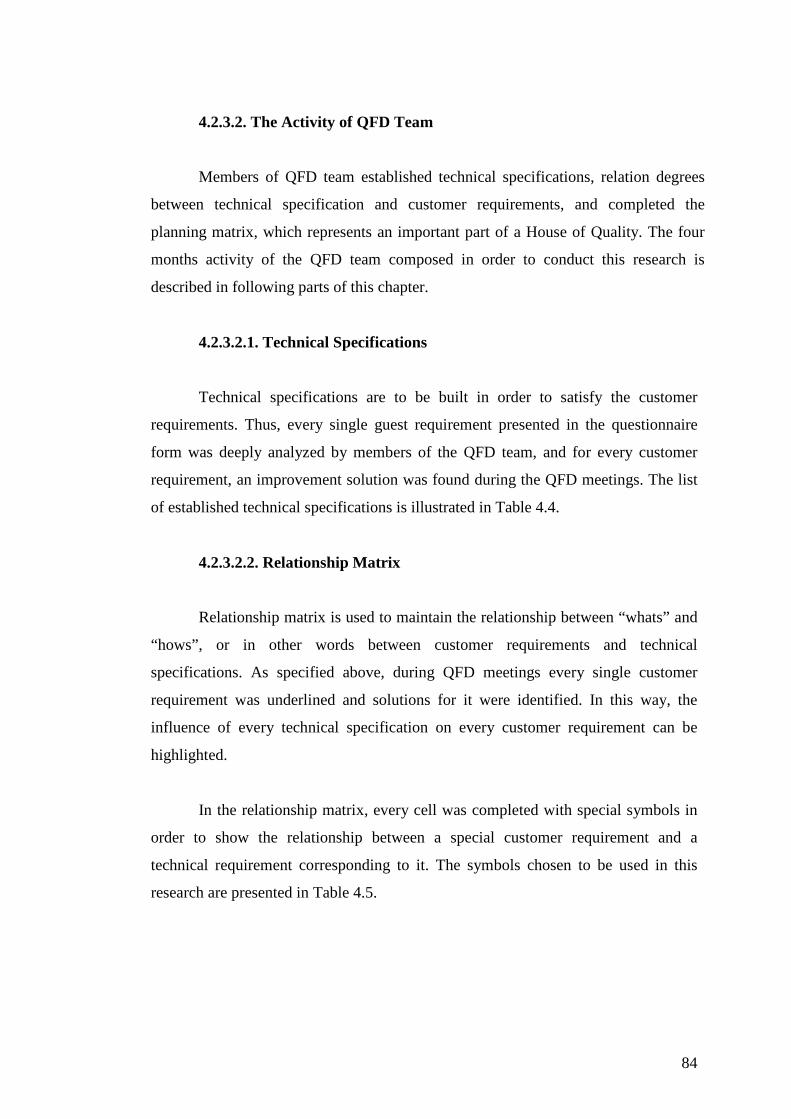
84
4.2.3.2. The Activity of QFD Team
Members of QFD team established technical specifications, relation degrees
between technical specification and customer requirements, and completed the
planning matrix, which represents an important part of a House of Quality. The four
months activity of the QFD team composed in order to conduct this research is
described in following parts of this chapter.
4.2.3.2.1. Technical Specifications
Technical specifications are to be built in order to satisfy the customer
requirements. Thus, every single guest requirement presented in the questionnaire
form was deeply analyzed by members of the QFD team, and for every customer
requirement, an improvement solution was found during the QFD meetings. The list
of established technical specifications is illustrated in Table 4.4.
4.2.3.2.2. Relationship Matrix
Relationship matrix is used to maintain the relationship between “whats” and
“hows”, or in other words between customer requirements and technical
specifications. As specified above, during QFD meetings every single customer
requirement was underlined and solutions for it were identified. In this way, the
influence of every technical specification on every customer requirement can be
highlighted.
In the relationship matrix, every cell was completed with special symbols in
order to show the relationship between a special customer requirement and a
technical requirement corresponding to it. The symbols chosen to be used in this
research are presented in Table 4.5.
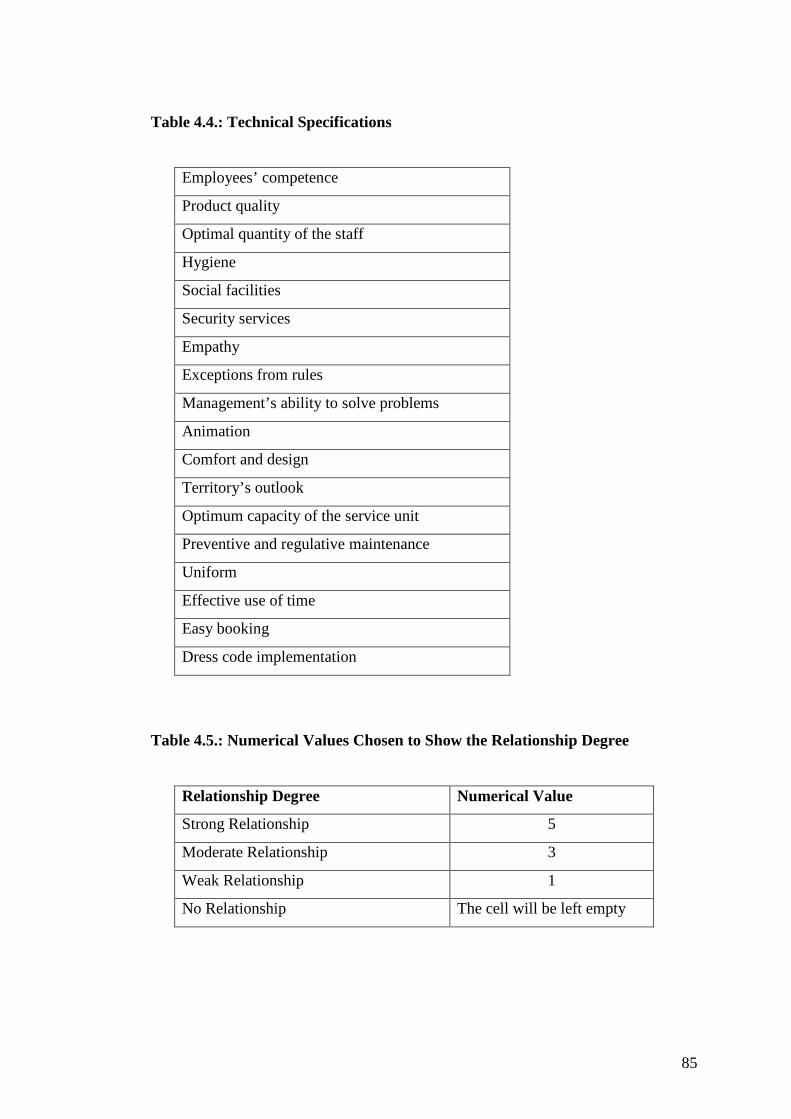
85
Table 4.4.: Technical Specifications
Employees’ competence
Product quality
Optimal quantity of the staff
Hygiene
Social facilities
Security services
Empathy
Exceptions from rules
Management’s ability to solve problems
Animation
Comfort and design
Territory’s outlook
Optimum capacity of the service unit
Preventive and regulative maintenance
Uniform
Effective use of time
Easy booking
Dress code implementation
Table 4.5.: Numerical Values Chosen to Show the Relationship Degree
Relationship Degree Numerical Value
Strong Relationship 5
Moderate Relationship 3
Weak Relationship 1
No Relationship The cell will be left empty
86
4.2.3.2.3. Competitor Analysis
Every guest requirement was analyzed from the point of view of a competitor
hotel’s activity. This mission has been also completed by members of the QFD team.
They chose a five star hotel activating in the same region, with approximately the
same room capacity and offering nearly the same UAI concept as Case Hotel, which
is considered the nearest competitor. These data have been presented in the
“Competitor” column inside the planning matrix. From understandable reasons, the
name of the competitor hotel was also not revealed.
4.2.3.2.4. Performance Goals
Members of QFD team also specified the major performance goals of the
organization according to every guest requirement. These results have been presented
in “Performance Goals” column inside the planning matrix. Finding this data has a
big importance for the relationship between points like employees, hardware and
financial resources of the organization. In other words, hotel managers decided at
what level they want to meet the requirements of the customers.
4.2.3.2.5. Point of Sales
The point of sales (POS) data was presented considering the fact that if there
is an improvement in the implementation or performance of a guest requirement,
than an improvement in sales will also occur. Results were established according to
hotel’s budget by QFD team and were also introduced in the planning matrix. The
points given for point of sales establishment were used as follows (Öter and Tütüncü,
2001):
1.50. A characteristic which influences the POS a lot.
1.20. A characteristic whose importance is moderate for the POS process.
1.00 A characteristic which has no influence on POS.
87
4.2.3.2.6. Improvement Ratio
Data in the “Improvement Ratio” column were computed by dividing
performance goals found for every guest requirement by the “Case Hotel
Performance” values. The improvement ratio is considered to have a big importance
when performing customers’ whishes and needs because it gives a quantitative
information on effort required to improve, but is relative to current performance level
(Akbaba, 2006).
4.2.3.2.7. Raw Importance Weight
Raw importance weight represents the relative importance of each need and it
was calculated during the QFD meetings by multiplying given importance ratings
specified by guests with improvement ratios and with POS values.
4.2.3.2.8. Normalized Raw Importance Weight
“Normalized raw weight gives an organizational importance to meet a need
that reflects sales and market priorities” (Chang, 2008:313). Data included in this
column of the planning matrix were presented in a percentage form and were
computed by the QFD team while dividing the raw importance weight for every
guest requirement to the total numerical value of the raw importance weight.
4.3. FINDINGS
4.3.1. Demographic Profiles of Respondents
Table 4.6., illustrates the gender distribution of respondents. When analyzing
these data a big majority of 58.9 % German guests can be observed, this is similar also
to the general nationality profile of hotel guests.
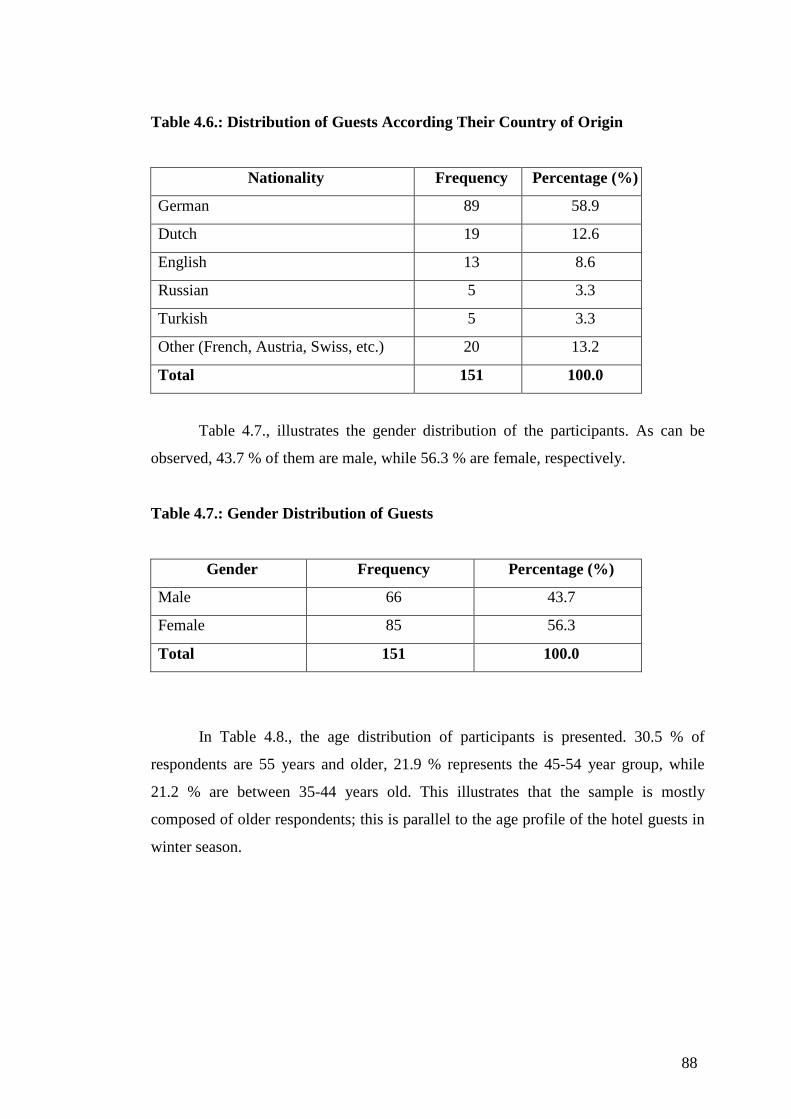
88
Table 4.6.: Distribution of Guests According Their Country of Origin
Nationality Frequency Percentage (%)
German 89 58.9
Dutch 19 12.6
English 13 8.6
Russian 5 3.3
Turkish 5 3.3
Other (French, Austria, Swiss, etc.) 20 13.2
Total 151 100.0
Table 4.7., illustrates the gender distribution of the participants. As can be
observed, 43.7 % of them are male, while 56.3 % are female, respectively.
Table 4.7.: Gender Distribution of Guests
Gender Frequency Percentage (%)
Male 66 43.7
Female 85 56.3
Total 151 100.0
In Table 4.8., the age distribution of participants is presented. 30.5 % of
respondents are 55 years and older, 21.9 % represents the 45-54 year group, while
21.2 % are between 35-44 years old. This illustrates that the sample is mostly
composed of older respondents; this is parallel to the age profile of the hotel guests in
winter season.
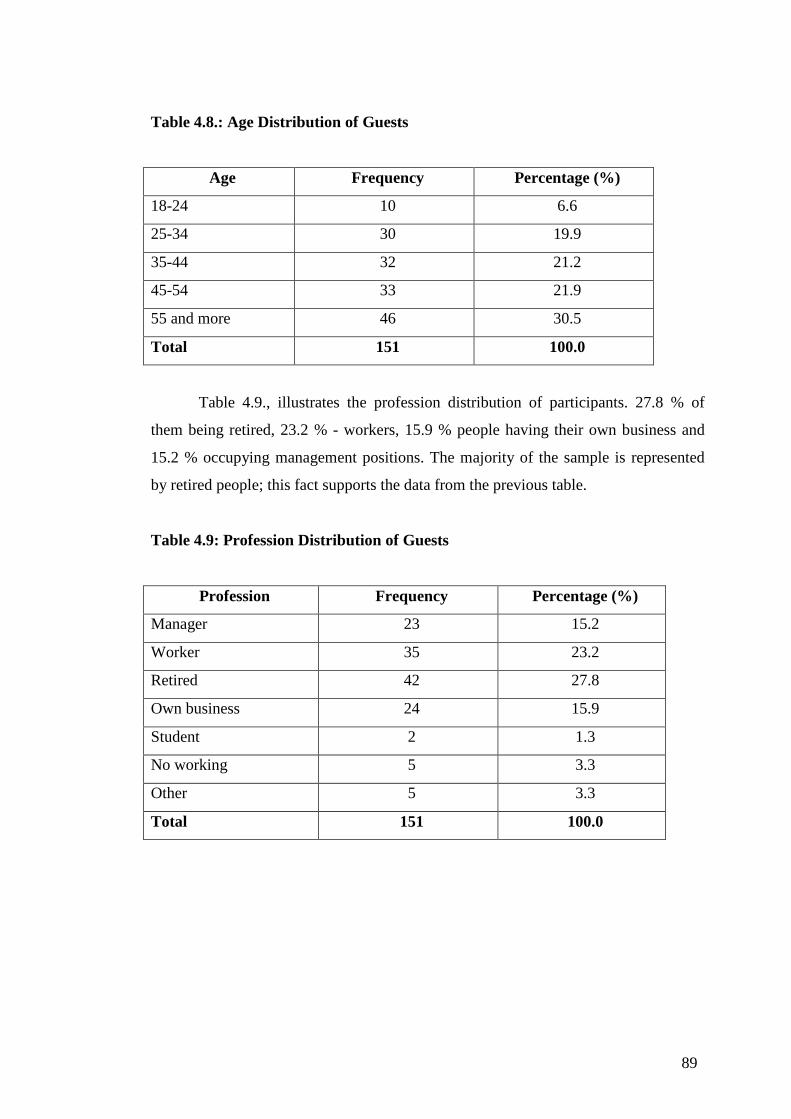
89
Table 4.8.: Age Distribution of Guests
Age Frequency Percentage (%)
18-24 10 6.6
25-34 30 19.9
35-44 32 21.2
45-54 33 21.9
55 and more 46 30.5
Total 151 100.0
Table 4.9., illustrates the profession distribution of participants. 27.8 % of
them being retired, 23.2 % - workers, 15.9 % people having their own business and
15.2 % occupying management positions. The majority of the sample is represented
by retired people; this fact supports the data from the previous table.
Table 4.9: Profession Distribution of Guests
Profession Frequency Percentage (%)
Manager 23 15.2
Worker 35 23.2
Retired 42 27.8
Own business 24 15.9
Student 2 1.3
No working 5 3.3
Other 5 3.3
Total 151 100.0
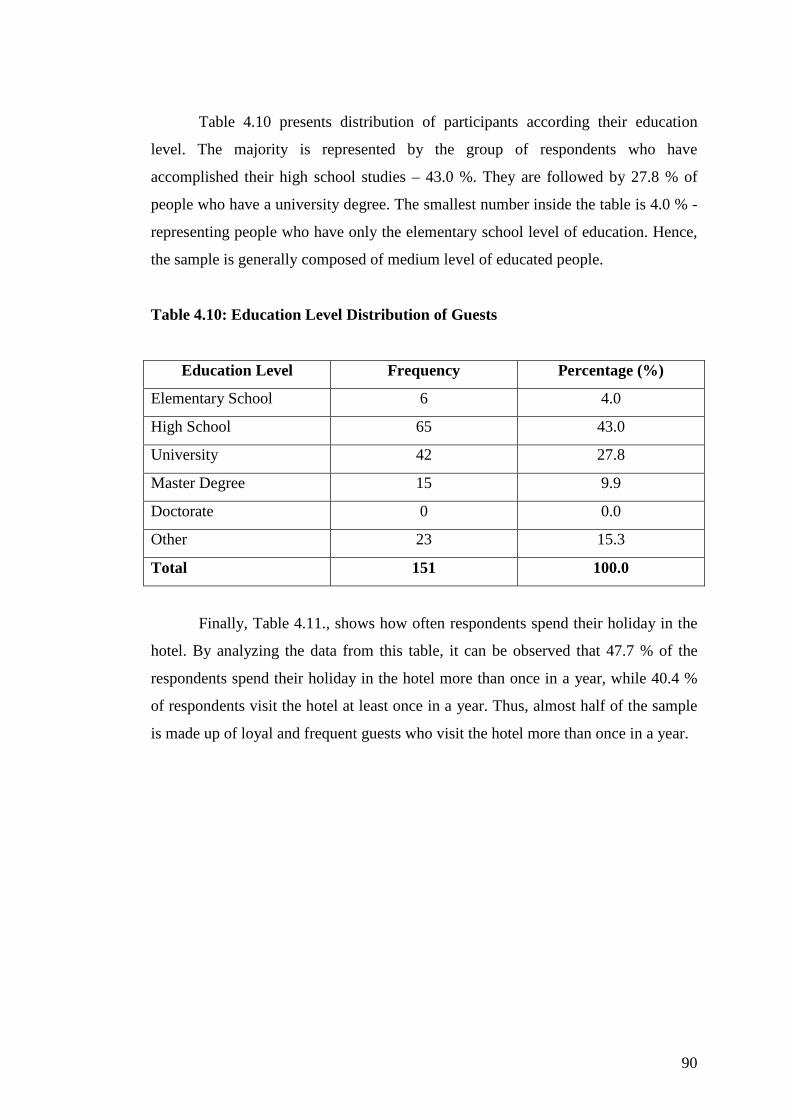
90
Table 4.10 presents distribution of participants according their education
level. The majority is represented by the group of respondents who have
accomplished their high school studies – 43.0 %. They are followed by 27.8 % of
people who have a university degree. The smallest number inside the table is 4.0 % -
representing people who have only the elementary school level of education. Hence,
the sample is generally composed of medium level of educated people.
Table 4.10: Education Level Distribution of Guests
Education Level Frequency Percentage (%)
Elementary School 6 4.0
High School 65 43.0
University 42 27.8
Master Degree 15 9.9
Doctorate 0 0.0
Other 23 15.3
Total 151 100.0
Finally, Table 4.11., shows how often respondents spend their holiday in the
hotel. By analyzing the data from this table, it can be observed that 47.7 % of the
respondents spend their holiday in the hotel more than once in a year, while 40.4 %
of respondents visit the hotel at least once in a year. Thus, almost half of the sample
is made up of loyal and frequent guests who visit the hotel more than once in a year.
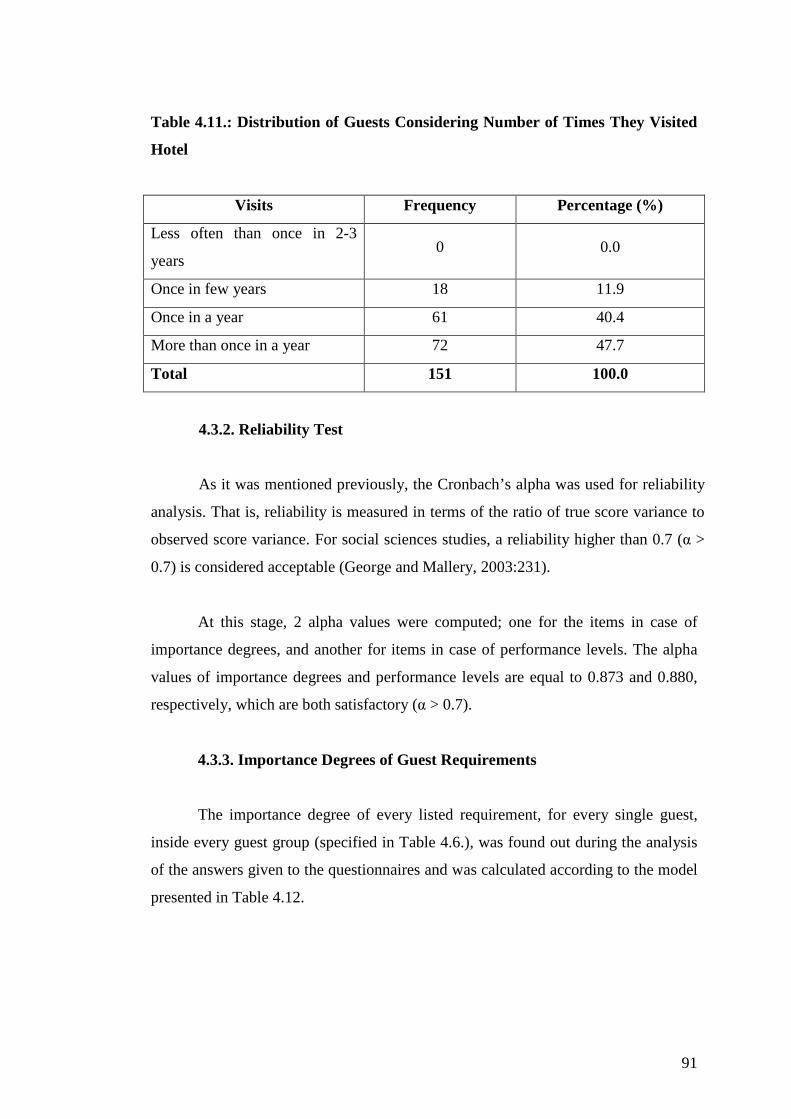
91
Table 4.11.: Distribution of Guests Considering Number of Times They Visited
Hotel
Visits Frequency Percentage (%)
Less often than once in 2-3
years 0 0.0
Once in few years 18 11.9
Once in a year 61 40.4
More than once in a year 72 47.7
Total 151 100.0
4.3.2. Reliability Test
As it was mentioned previously, the Cronbach’s alpha was used for reliability
analysis. That is, reliability is measured in terms of the ratio of true score variance to
observed score variance. For social sciences studies, a reliability higher than 0.7 (α >
0.7) is considered acceptable (George and Mallery, 2003:231).
At this stage, 2 alpha values were computed; one for the items in case of
importance degrees, and another for items in case of performance levels. The alpha
values of importance degrees and performance levels are equal to 0.873 and 0.880,
respectively, which are both satisfactory (α > 0.7).
4.3.3. Importance Degrees of Guest Requirements
The importance degree of every listed requirement, for every single guest,
inside every guest group (specified in Table 4.6.), was found out during the analysis
of the answers given to the questionnaires and was calculated according to the model
presented in Table 4.12.
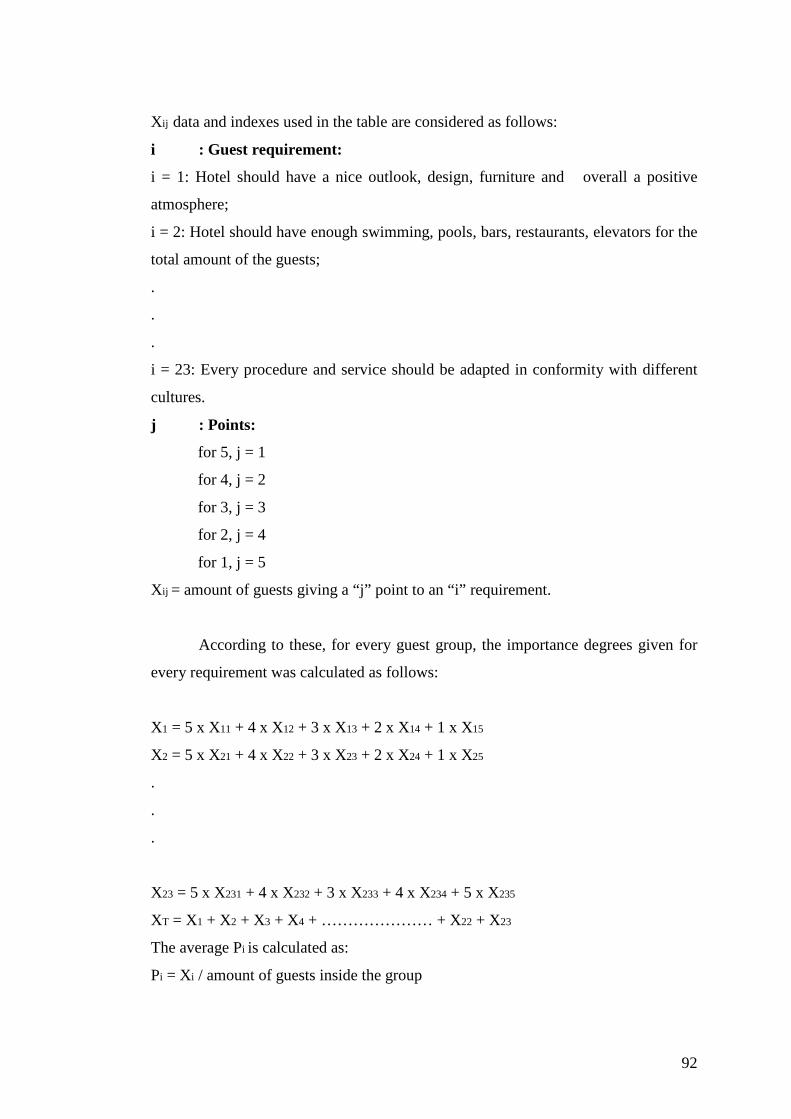
92
X ij data and indexes used in the table are considered as follows:
i : Guest requirement:
i = 1: Hotel should have a nice outlook, design, furniture and overall a positive
atmosphere;
i = 2: Hotel should have enough swimming, pools, bars, restaurants, elevators for the
total amount of the guests;
.
.
.
i = 23: Every procedure and service should be adapted in conformity with different
cultures.
j : Points:
for 5, j = 1
for 4, j = 2
for 3, j = 3
for 2, j = 4
for 1, j = 5
X ij = amount of guests giving a “j” point to an “i” requirement.
According to these, for every guest group, the importance degrees given for
every requirement was calculated as follows:
X1 = 5 x X11 + 4 x X12 + 3 x X13 + 2 x X14 + 1 x X15
X2 = 5 x X21 + 4 x X22 + 3 x X23 + 2 x X24 + 1 x X25
.
.
.
X23 = 5 x X231 + 4 x X232 + 3 x X233 + 4 x X234 + 5 x X235
XT = X1 + X2 + X3 + X4 + ………………… + X22 + X23
The average Pi is calculated as:
Pi = Xi / amount of guests inside the group
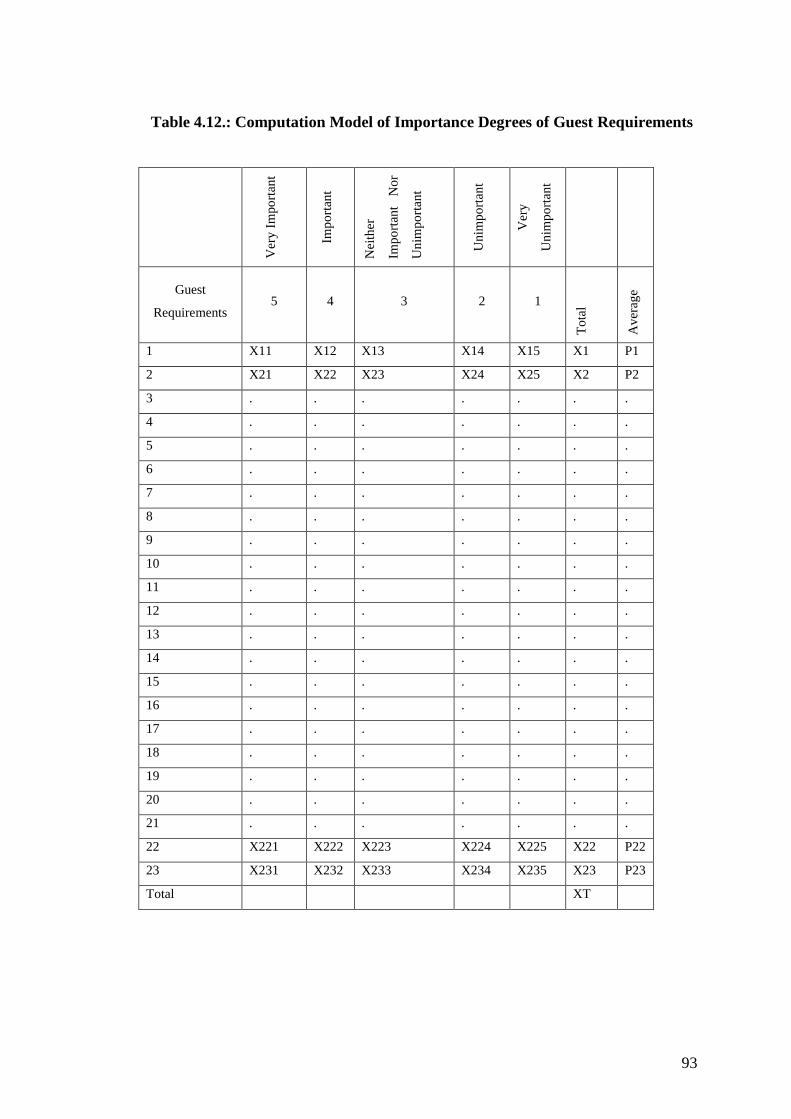
93
Table 4.12.: Computation Model of Importance Degrees of Guest Requirements
Ver
y Im
port
ant
Imp
ort
ant
Nei
ther
Imp
ort
ant
No
r
Un
imp
ort
ant
Un
imp
ort
ant
Ver
y
Un
imp
ort
ant
Guest
Requirements 5 4 3 2 1
To
tal
Ave
rag
e
1 X11 X12 X13 X14 X15 X1 P1
2 X21 X22 X23 X24 X25 X2 P2
3 . . . . . . .
4 . . . . . . .
5 . . . . . . .
6 . . . . . . .
7 . . . . . . .
8 . . . . . . .
9 . . . . . . .
10 . . . . . . .
11 . . . . . . .
12 . . . . . . .
13 . . . . . . .
14 . . . . . . .
15 . . . . . . .
16 . . . . . . .
17 . . . . . . .
18 . . . . . . .
19 . . . . . . .
20 . . . . . . .
21 . . . . . . .
22 X221 X222 X223 X224 X225 X22 P22
23 X231 X232 X233 X234 X235 X23 P23
Total XT
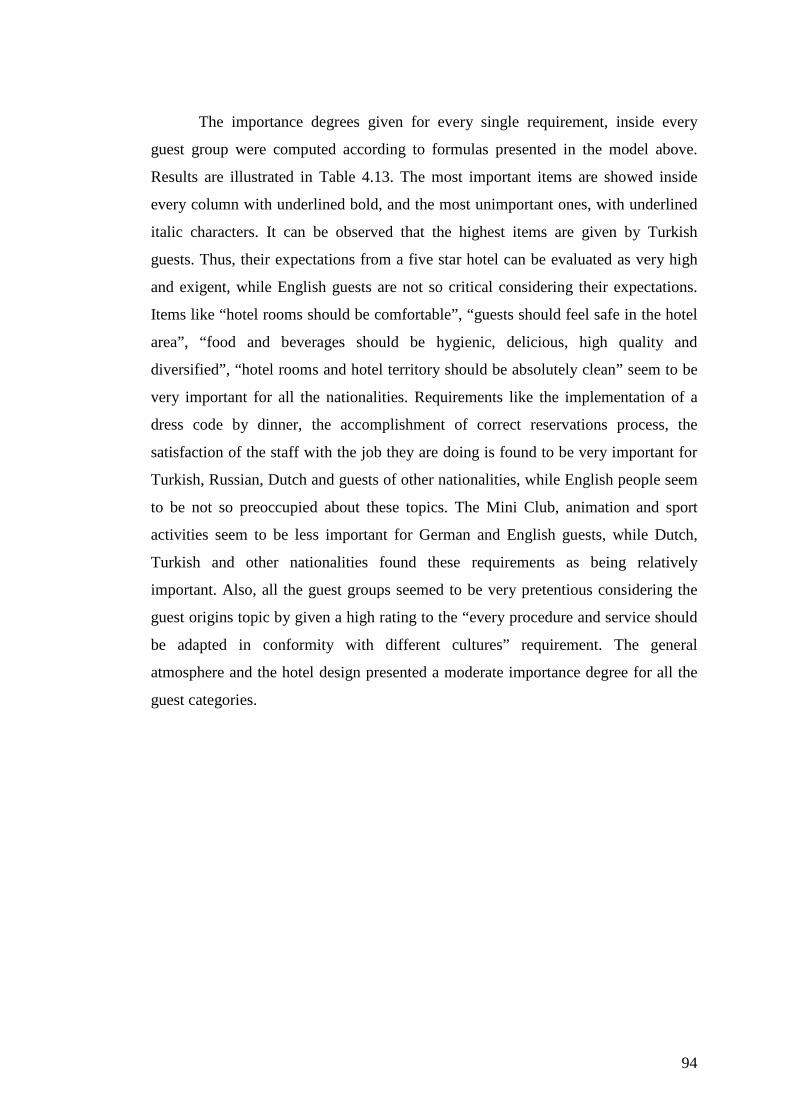
94
The importance degrees given for every single requirement, inside every
guest group were computed according to formulas presented in the model above.
Results are illustrated in Table 4.13. The most important items are showed inside
every column with underlined bold, and the most unimportant ones, with underlined
italic characters. It can be observed that the highest items are given by Turkish
guests. Thus, their expectations from a five star hotel can be evaluated as very high
and exigent, while English guests are not so critical considering their expectations.
Items like “hotel rooms should be comfortable”, “guests should feel safe in the hotel
area”, “food and beverages should be hygienic, delicious, high quality and
diversified”, “hotel rooms and hotel territory should be absolutely clean” seem to be
very important for all the nationalities. Requirements like the implementation of a
dress code by dinner, the accomplishment of correct reservations process, the
satisfaction of the staff with the job they are doing is found to be very important for
Turkish, Russian, Dutch and guests of other nationalities, while English people seem
to be not so preoccupied about these topics. The Mini Club, animation and sport
activities seem to be less important for German and English guests, while Dutch,
Turkish and other nationalities found these requirements as being relatively
important. Also, all the guest groups seemed to be very pretentious considering the
guest origins topic by given a high rating to the “every procedure and service should
be adapted in conformity with different cultures” requirement. The general
atmosphere and the hotel design presented a moderate importance degree for all the
guest categories.
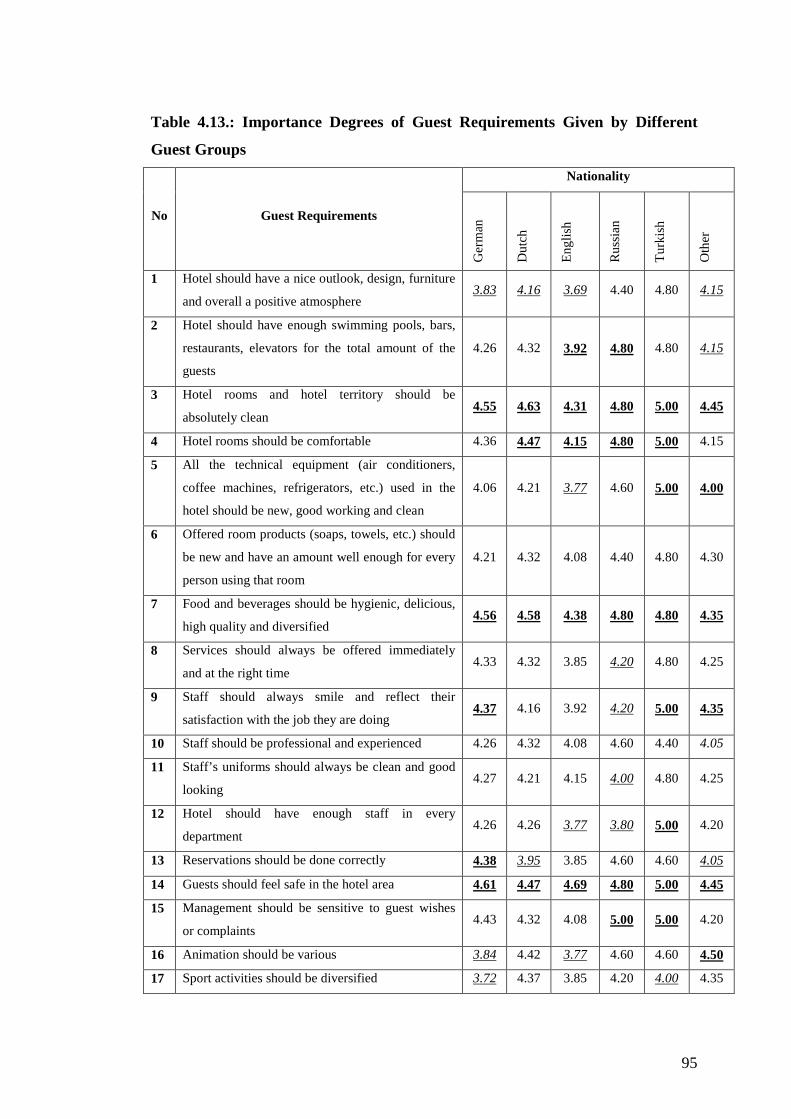
95
Table 4.13.: Importance Degrees of Guest Requirements Given by Different
Guest Groups
No Guest Requirements
Nationality
Ger
man
Du
tch
En
glis
h
Ru
ssia
n
Tu
rkis
h
Oth
er
1 Hotel should have a nice outlook, design, furniture
and overall a positive atmosphere 3.83 4.16 3.69 4.40 4.80 4.15
2 Hotel should have enough swimming pools, bars,
restaurants, elevators for the total amount of the
guests
4.26 4.32 3.92 4.80 4.80 4.15
3 Hotel rooms and hotel territory should be
absolutely clean 4.55 4.63 4.31 4.80 5.00 4.45
4 Hotel rooms should be comfortable 4.36 4.47 4.15 4.80 5.00 4.15
5 All the technical equipment (air conditioners,
coffee machines, refrigerators, etc.) used in the
hotel should be new, good working and clean
4.06 4.21 3.77 4.60 5.00 4.00
6 Offered room products (soaps, towels, etc.) should
be new and have an amount well enough for every
person using that room
4.21 4.32 4.08 4.40 4.80 4.30
7 Food and beverages should be hygienic, delicious,
high quality and diversified 4.56 4.58 4.38 4.80 4.80 4.35
8 Services should always be offered immediately
and at the right time 4.33 4.32 3.85 4.20 4.80 4.25
9 Staff should always smile and reflect their
satisfaction with the job they are doing 4.37 4.16 3.92 4.20 5.00 4.35
10 Staff should be professional and experienced 4.26 4.32 4.08 4.60 4.40 4.05
11 Staff’s uniforms should always be clean and good
looking 4.27 4.21 4.15 4.00 4.80 4.25
12 Hotel should have enough staff in every
department 4.26 4.26 3.77 3.80 5.00 4.20
13 Reservations should be done correctly 4.38 3.95 3.85 4.60 4.60 4.05
14 Guests should feel safe in the hotel area 4.61 4.47 4.69 4.80 5.00 4.45
15 Management should be sensitive to guest wishes
or complaints 4.43 4.32 4.08 5.00 5.00 4.20
16 Animation should be various 3.84 4.42 3.77 4.60 4.60 4.50
17 Sport activities should be diversified 3.72 4.37 3.85 4.20 4.00 4.35
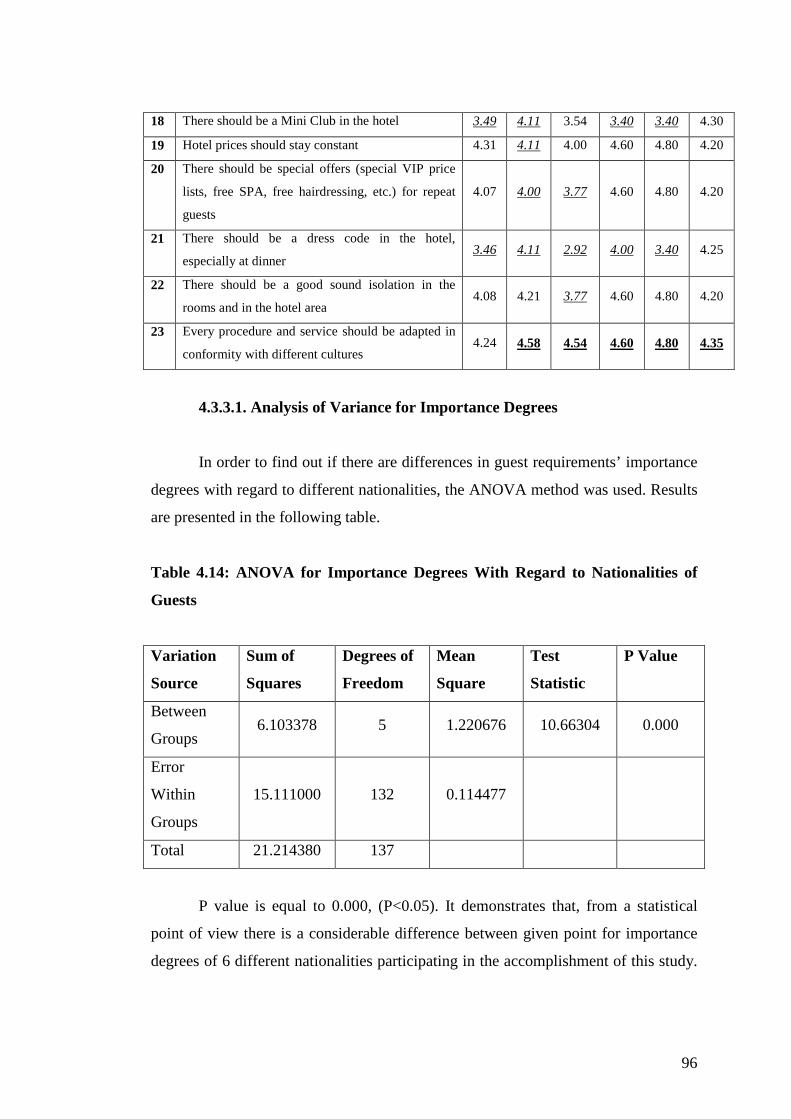
96
18 There should be a Mini Club in the hotel 3.49 4.11 3.54 3.40 3.40 4.30
19 Hotel prices should stay constant 4.31 4.11 4.00 4.60 4.80 4.20
20 There should be special offers (special VIP price
lists, free SPA, free hairdressing, etc.) for repeat
guests
4.07 4.00 3.77 4.60 4.80 4.20
21 There should be a dress code in the hotel,
especially at dinner 3.46 4.11 2.92 4.00 3.40 4.25
22 There should be a good sound isolation in the
rooms and in the hotel area 4.08 4.21 3.77 4.60 4.80 4.20
23 Every procedure and service should be adapted in
conformity with different cultures 4.24 4.58 4.54 4.60 4.80 4.35
4.3.3.1. Analysis of Variance for Importance Degrees
In order to find out if there are differences in guest requirements’ importance
degrees with regard to different nationalities, the ANOVA method was used. Results
are presented in the following table.
Table 4.14: ANOVA for Importance Degrees With Regard to Nationalities of
Guests
Variation
Source
Sum of
Squares
Degrees of
Freedom
Mean
Square
Test
Statistic
P Value
Between
Groups 6.103378 5 1.220676 10.66304 0.000
Error
Within
Groups
15.111000 132 0.114477
Total 21.214380 137
P value is equal to 0.000, (P<0.05). It demonstrates that, from a statistical
point of view there is a considerable difference between given point for importance
degrees of 6 different nationalities participating in the accomplishment of this study.
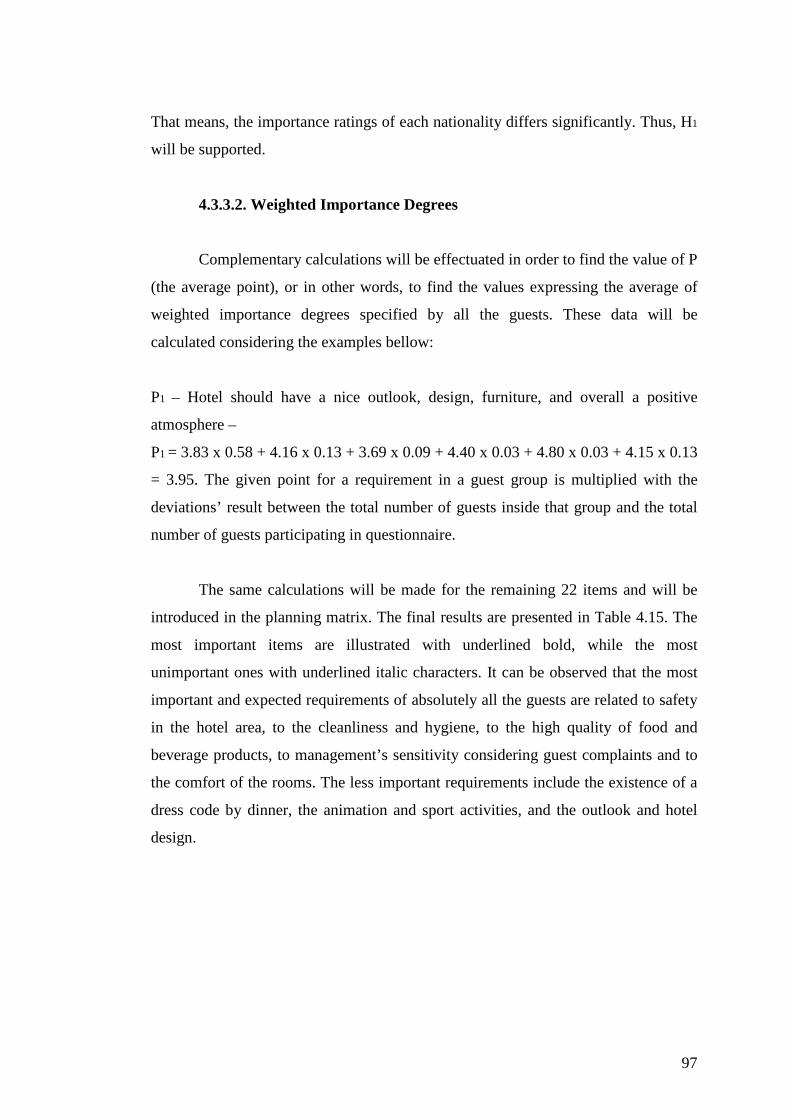
97
That means, the importance ratings of each nationality differs significantly. Thus, H1
will be supported.
4.3.3.2. Weighted Importance Degrees
Complementary calculations will be effectuated in order to find the value of P
(the average point), or in other words, to find the values expressing the average of
weighted importance degrees specified by all the guests. These data will be
calculated considering the examples bellow:
P1 – Hotel should have a nice outlook, design, furniture, and overall a positive
atmosphere –
P1 = 3.83 x 0.58 + 4.16 x 0.13 + 3.69 x 0.09 + 4.40 x 0.03 + 4.80 x 0.03 + 4.15 x 0.13
= 3.95. The given point for a requirement in a guest group is multiplied with the
deviations’ result between the total number of guests inside that group and the total
number of guests participating in questionnaire.
The same calculations will be made for the remaining 22 items and will be
introduced in the planning matrix. The final results are presented in Table 4.15. The
most important items are illustrated with underlined bold, while the most
unimportant ones with underlined italic characters. It can be observed that the most
important and expected requirements of absolutely all the guests are related to safety
in the hotel area, to the cleanliness and hygiene, to the high quality of food and
beverage products, to management’s sensitivity considering guest complaints and to
the comfort of the rooms. The less important requirements include the existence of a
dress code by dinner, the animation and sport activities, and the outlook and hotel
design.
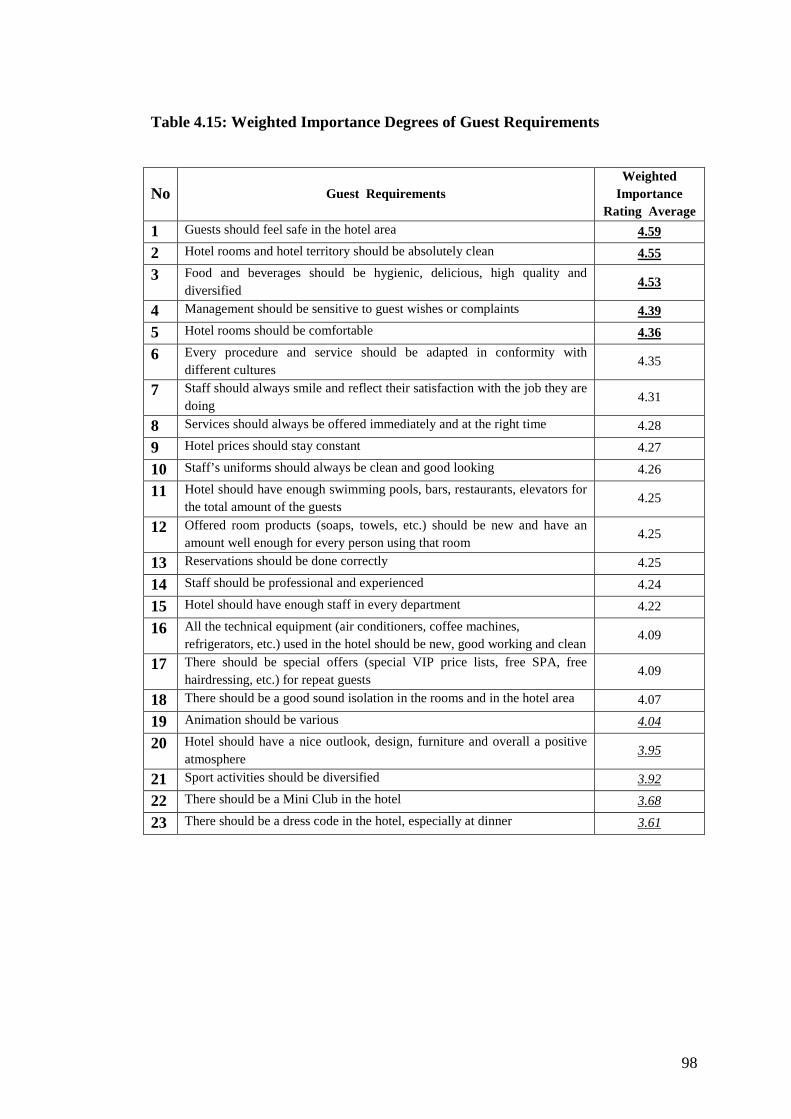
98
Table 4.15: Weighted Importance Degrees of Guest Requirements
No Guest Requirements Weighted
Importance Rating Average
1 Guests should feel safe in the hotel area 4.59
2 Hotel rooms and hotel territory should be absolutely clean 4.55
3 Food and beverages should be hygienic, delicious, high quality and diversified
4.53
4 Management should be sensitive to guest wishes or complaints 4.39
5 Hotel rooms should be comfortable 4.36
6 Every procedure and service should be adapted in conformity with different cultures
4.35
7 Staff should always smile and reflect their satisfaction with the job they are doing
4.31
8 Services should always be offered immediately and at the right time 4.28
9 Hotel prices should stay constant 4.27
10 Staff’s uniforms should always be clean and good looking 4.26
11 Hotel should have enough swimming pools, bars, restaurants, elevators for the total amount of the guests
4.25
12 Offered room products (soaps, towels, etc.) should be new and have an amount well enough for every person using that room
4.25
13 Reservations should be done correctly 4.25
14 Staff should be professional and experienced 4.24
15 Hotel should have enough staff in every department 4.22
16 All the technical equipment (air conditioners, coffee machines, refrigerators, etc.) used in the hotel should be new, good working and clean
4.09
17 There should be special offers (special VIP price lists, free SPA, free hairdressing, etc.) for repeat guests
4.09
18 There should be a good sound isolation in the rooms and in the hotel area 4.07
19 Animation should be various 4.04
20 Hotel should have a nice outlook, design, furniture and overall a positive atmosphere
3.95
21 Sport activities should be diversified 3.92
22 There should be a Mini Club in the hotel 3.68
23 There should be a dress code in the hotel, especially at dinner 3.61
99
4.3.4. Performance Levels of the Case Hotel
The performance level of every listed requirement, for every single guest,
inside every guest group (specified in Table 4.6.) was found out during the analysis
of the answers given to the questionnaires and was calculated according to the model
presented in Table 4.16.
Table 4.16.: Computation Model of Performance Levels of Guest Requirements
Ver
y H
igh
Hig
h
Mo
der
ate
Lo
w
Ver
y L
ow
Guest Requirements
5 4 3 2 1
To
tal
Ave
rag
e
1 X11 X12 X13 X14 X15 X1 P1 2 X21 X22 X23 X24 X25 X2 P2 3 . . . . . . . 4 . . . . . . . 5 . . . . . . . 6 . . . . . . . 7 . . . . . . . 8 . . . . . . . 9 . . . . . . . 10 . . . . . . . 11 . . . . . . . 12 . . . . . . . 13 . . . . . . . 14 . . . . . . . 15 . . . . . . . 16 . . . . . . . 17 . . . . . . . 18 . . . . . . . 19 . . . . . . . 20 . . . . . . . 21 . . . . . . . 22 X221 X222 X223 X224 X225 X22 P22 23 X231 X232 X233 X234 X235 X23 P23 Total XT
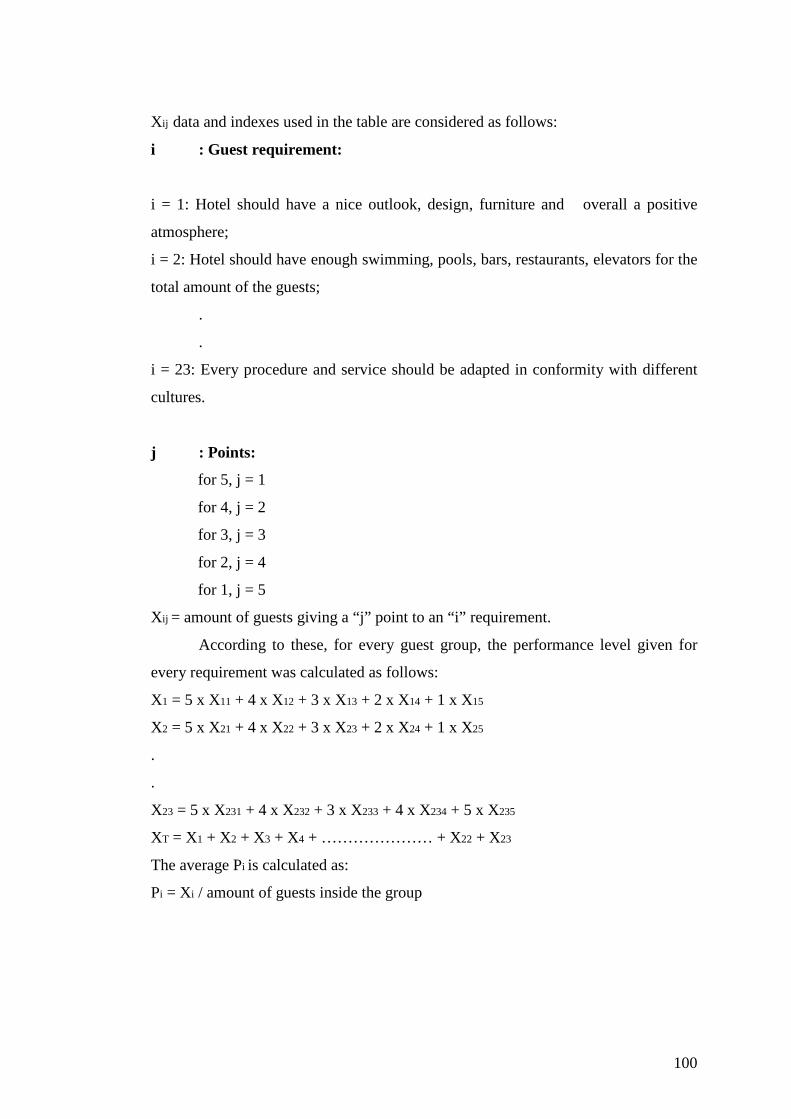
100
X ij data and indexes used in the table are considered as follows:
i : Guest requirement:
i = 1: Hotel should have a nice outlook, design, furniture and overall a positive
atmosphere;
i = 2: Hotel should have enough swimming, pools, bars, restaurants, elevators for the
total amount of the guests;
.
.
i = 23: Every procedure and service should be adapted in conformity with different
cultures.
j : Points:
for 5, j = 1
for 4, j = 2
for 3, j = 3
for 2, j = 4
for 1, j = 5
X ij = amount of guests giving a “j” point to an “i” requirement.
According to these, for every guest group, the performance level given for
every requirement was calculated as follows:
X1 = 5 x X11 + 4 x X12 + 3 x X13 + 2 x X14 + 1 x X15
X2 = 5 x X21 + 4 x X22 + 3 x X23 + 2 x X24 + 1 x X25
.
.
X23 = 5 x X231 + 4 x X232 + 3 x X233 + 4 x X234 + 5 x X235
XT = X1 + X2 + X3 + X4 + ………………… + X22 + X23
The average Pi is calculated as:
Pi = Xi / amount of guests inside the group
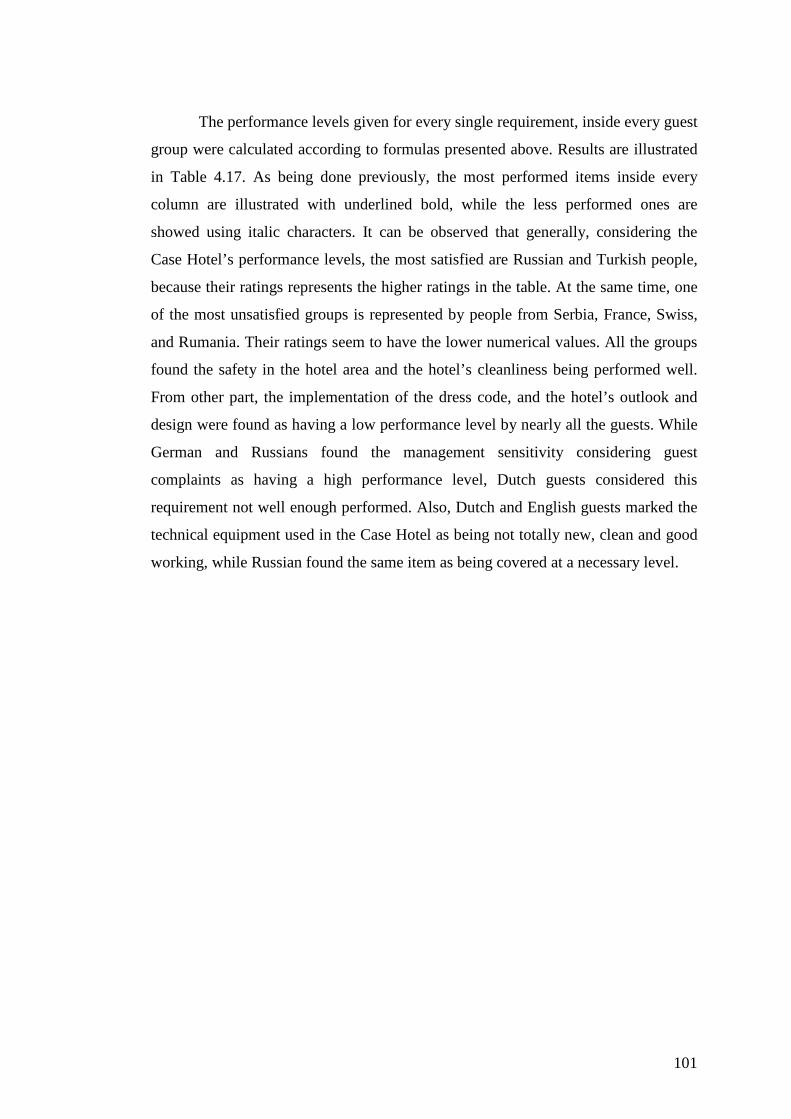
101
The performance levels given for every single requirement, inside every guest
group were calculated according to formulas presented above. Results are illustrated
in Table 4.17. As being done previously, the most performed items inside every
column are illustrated with underlined bold, while the less performed ones are
showed using italic characters. It can be observed that generally, considering the
Case Hotel’s performance levels, the most satisfied are Russian and Turkish people,
because their ratings represents the higher ratings in the table. At the same time, one
of the most unsatisfied groups is represented by people from Serbia, France, Swiss,
and Rumania. Their ratings seem to have the lower numerical values. All the groups
found the safety in the hotel area and the hotel’s cleanliness being performed well.
From other part, the implementation of the dress code, and the hotel’s outlook and
design were found as having a low performance level by nearly all the guests. While
German and Russians found the management sensitivity considering guest
complaints as having a high performance level, Dutch guests considered this
requirement not well enough performed. Also, Dutch and English guests marked the
technical equipment used in the Case Hotel as being not totally new, clean and good
working, while Russian found the same item as being covered at a necessary level.
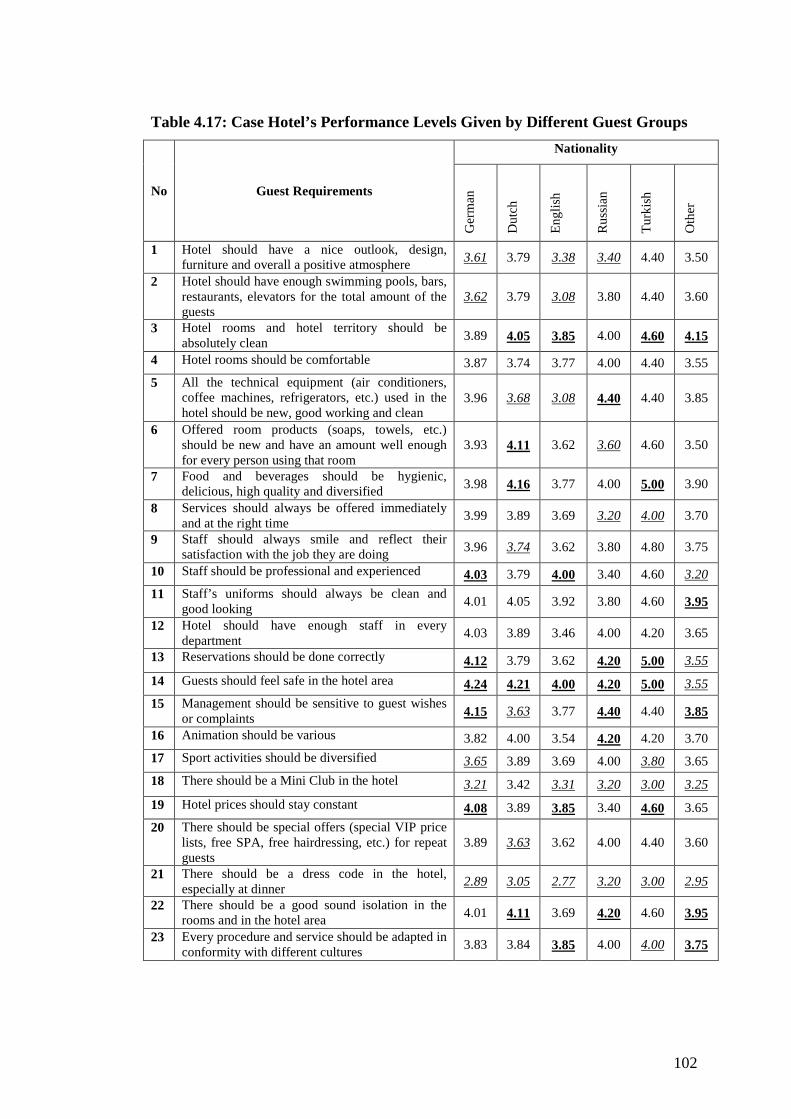
102
Table 4.17: Case Hotel’s Performance Levels Given by Different Guest Groups
No Guest Requirements
Nationality
Ger
man
Du
tch
En
glis
h
Ru
ssia
n
Tu
rkis
h
Oth
er
1 Hotel should have a nice outlook, design, furniture and overall a positive atmosphere 3.61 3.79 3.38 3.40 4.40 3.50
2 Hotel should have enough swimming pools, bars, restaurants, elevators for the total amount of the guests
3.62 3.79 3.08 3.80 4.40 3.60
3 Hotel rooms and hotel territory should be absolutely clean 3.89 4.05 3.85 4.00 4.60 4.15
4 Hotel rooms should be comfortable 3.87 3.74 3.77 4.00 4.40 3.55
5 All the technical equipment (air conditioners, coffee machines, refrigerators, etc.) used in the hotel should be new, good working and clean
3.96 3.68 3.08 4.40 4.40 3.85
6 Offered room products (soaps, towels, etc.) should be new and have an amount well enough for every person using that room
3.93 4.11 3.62 3.60 4.60 3.50
7 Food and beverages should be hygienic, delicious, high quality and diversified 3.98 4.16 3.77 4.00 5.00 3.90
8 Services should always be offered immediately and at the right time
3.99 3.89 3.69 3.20 4.00 3.70
9 Staff should always smile and reflect their satisfaction with the job they are doing 3.96 3.74 3.62 3.80 4.80 3.75
10 Staff should be professional and experienced 4.03 3.79 4.00 3.40 4.60 3.20
11 Staff’s uniforms should always be clean and good looking
4.01 4.05 3.92 3.80 4.60 3.95
12 Hotel should have enough staff in every department
4.03 3.89 3.46 4.00 4.20 3.65
13 Reservations should be done correctly 4.12 3.79 3.62 4.20 5.00 3.55
14 Guests should feel safe in the hotel area 4.24 4.21 4.00 4.20 5.00 3.55
15 Management should be sensitive to guest wishes or complaints 4.15 3.63 3.77 4.40 4.40 3.85
16 Animation should be various 3.82 4.00 3.54 4.20 4.20 3.70
17 Sport activities should be diversified 3.65 3.89 3.69 4.00 3.80 3.65
18 There should be a Mini Club in the hotel 3.21 3.42 3.31 3.20 3.00 3.25
19 Hotel prices should stay constant 4.08 3.89 3.85 3.40 4.60 3.65
20 There should be special offers (special VIP price lists, free SPA, free hairdressing, etc.) for repeat guests
3.89 3.63 3.62 4.00 4.40 3.60
21 There should be a dress code in the hotel, especially at dinner
2.89 3.05 2.77 3.20 3.00 2.95
22 There should be a good sound isolation in the rooms and in the hotel area 4.01 4.11 3.69 4.20 4.60 3.95
23 Every procedure and service should be adapted in conformity with different cultures
3.83 3.84 3.85 4.00 4.00 3.75
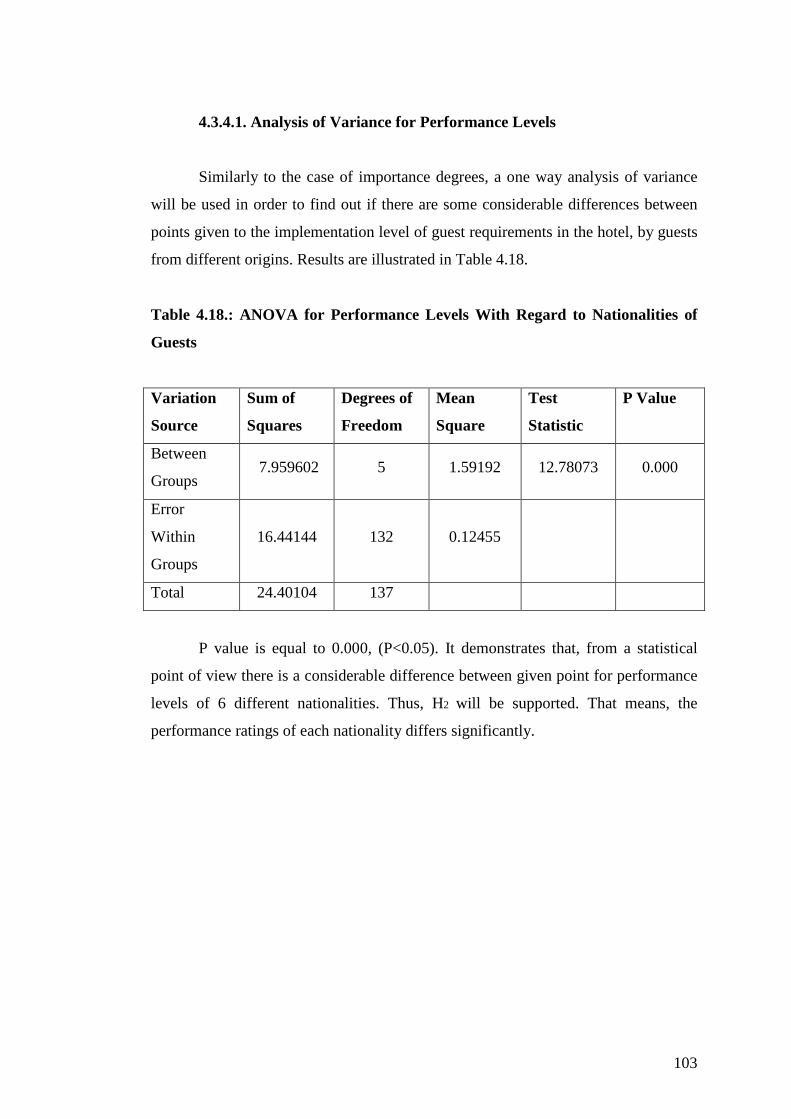
103
4.3.4.1. Analysis of Variance for Performance Levels
Similarly to the case of importance degrees, a one way analysis of variance
will be used in order to find out if there are some considerable differences between
points given to the implementation level of guest requirements in the hotel, by guests
from different origins. Results are illustrated in Table 4.18.
Table 4.18.: ANOVA for Performance Levels With Regard to Nationalities of
Guests
Variation
Source
Sum of
Squares
Degrees of
Freedom
Mean
Square
Test
Statistic
P Value
Between
Groups 7.959602 5 1.59192 12.78073 0.000
Error
Within
Groups
16.44144 132 0.12455
Total 24.40104 137
P value is equal to 0.000, (P<0.05). It demonstrates that, from a statistical
point of view there is a considerable difference between given point for performance
levels of 6 different nationalities. Thus, H2 will be supported. That means, the
performance ratings of each nationality differs significantly.

104
4.3.4.2. Weighted Performance Levels
Complementary calculations will be effectuated in order to find P’s value (the
average point), or the average of weighted performance levels among all the guest
nationalities:
P1 – Hotel should have a nice outlook, design, furniture, and overall a positive
atmosphere –
P1 = 3.61 x 0.58 + 3.79 x 0.13 + 3.38 x 0.09 + 3.40 x 0.03 + 4.40 x 0.03 + 3.50 x 0.13
= 3.61. The given point for a requirement in a guest group is multiplied with the
deviations’ result between the total number of guests inside the group and the total
number of guests participating in questionnaires. The same calculations will be
effectuated for the remaining 22 items and will be introduced in the planning matrix.
The final results are presented in Table 4.19. The most performed requirements are
illustrated with underlined bold, while the less covered ones are showed by use of
italic characters. While analyzing the table’s results it can be noticed that
requirements like “guests should feel safe in the hotel area”, “hotel rooms and hotel
territory should be absolutely clean”, “food and beverages should be hygienic,
delicious, high quality and diversified”, “management should be sensitive to guest
whishes or complaints”, are among the most well performed items in the Case Hotel
according to guests of all origins. Requirements considering the implementation of a
dress code by dinner, the existence of a Mini Club, the variety of animation programs
and sport activities and the hotel’s outlook and design are among the items to be
improved in the Case Hotel.
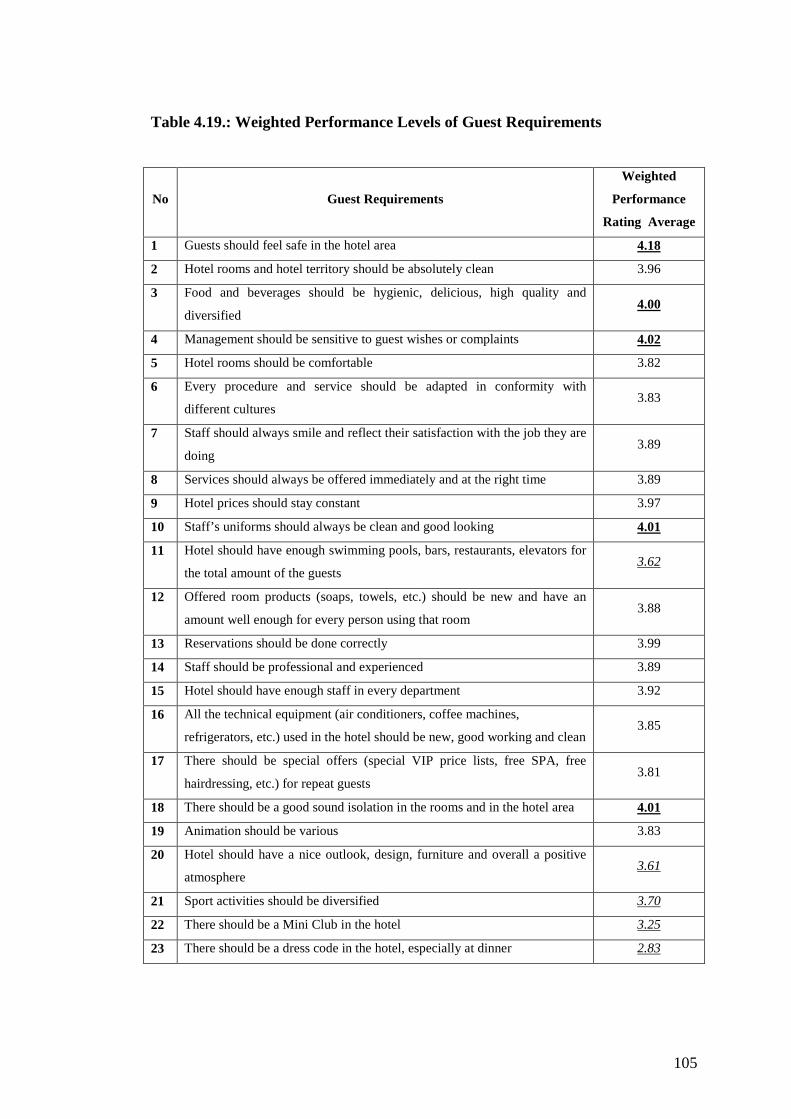
105
Table 4.19.: Weighted Performance Levels of Guest Requirements
No Guest Requirements
Weighted
Performance
Rating Average
1 Guests should feel safe in the hotel area 4.18
2 Hotel rooms and hotel territory should be absolutely clean 3.96
3 Food and beverages should be hygienic, delicious, high quality and
diversified 4.00
4 Management should be sensitive to guest wishes or complaints 4.02
5 Hotel rooms should be comfortable 3.82
6 Every procedure and service should be adapted in conformity with
different cultures 3.83
7 Staff should always smile and reflect their satisfaction with the job they are
doing 3.89
8 Services should always be offered immediately and at the right time 3.89
9 Hotel prices should stay constant 3.97
10 Staff’s uniforms should always be clean and good looking 4.01
11 Hotel should have enough swimming pools, bars, restaurants, elevators for
the total amount of the guests 3.62
12 Offered room products (soaps, towels, etc.) should be new and have an
amount well enough for every person using that room 3.88
13 Reservations should be done correctly 3.99
14 Staff should be professional and experienced 3.89
15 Hotel should have enough staff in every department 3.92
16 All the technical equipment (air conditioners, coffee machines,
refrigerators, etc.) used in the hotel should be new, good working and clean 3.85
17 There should be special offers (special VIP price lists, free SPA, free
hairdressing, etc.) for repeat guests 3.81
18 There should be a good sound isolation in the rooms and in the hotel area 4.01
19 Animation should be various 3.83
20 Hotel should have a nice outlook, design, furniture and overall a positive
atmosphere 3.61
21 Sport activities should be diversified 3.70
22 There should be a Mini Club in the hotel 3.25
23 There should be a dress code in the hotel, especially at dinner 2.83
106
4.3.5. Planning Matrix
With the help of Case Hotel’s guests and their active participation, the
importance degrees of guest requirements and their performance levels in the hotel
were identified. In addition, the members of the QFD team calculated values of the
hotel’s performance goals, improvement ratio, point of sales, situation of the
competitor, and the raw importance weight for every guest requirement. All of these
rates were introduced in the planning matrix. Results of this entire process can be
analyzed in Table 4.20. The detailed description of the most important numerical
values, their meanings and relationships between them will be given while analyzing
the whole House of Quality.
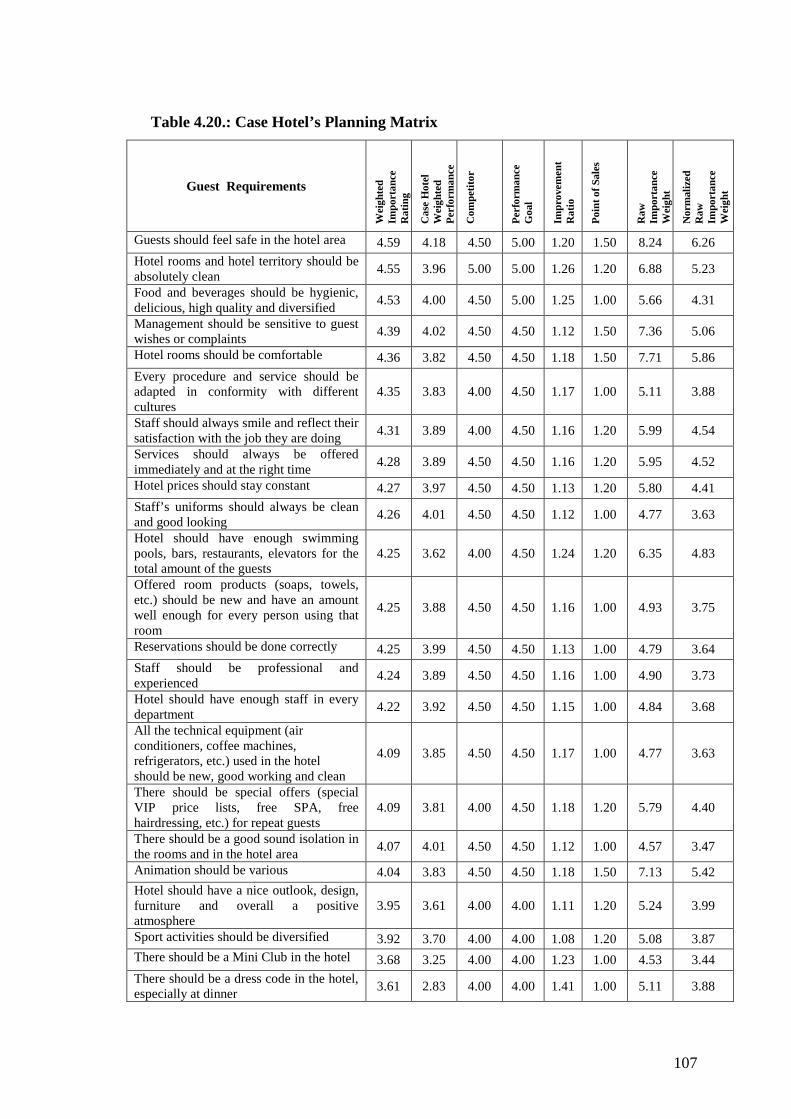
107
Table 4.20.: Case Hotel’s Planning Matrix
Guest Requirements
Wei
ghte
d Im
port
ance
R
atin
g
Cas
e H
otel
W
eigh
ted
Per
form
ance
Com
petit
or
Per
form
ance
G
oal
Impr
ovem
ent
Rat
io
Poi
nt o
f Sal
es
Raw
Im
port
ance
W
eigh
t
Nor
mal
ized
R
aw
Impo
rtan
ce
Wei
ght
Guests should feel safe in the hotel area 4.59 4.18 4.50 5.00 1.20 1.50 8.24 6.26
Hotel rooms and hotel territory should be absolutely clean
4.55 3.96 5.00 5.00 1.26 1.20 6.88 5.23
Food and beverages should be hygienic, delicious, high quality and diversified
4.53 4.00 4.50 5.00 1.25 1.00 5.66 4.31
Management should be sensitive to guest wishes or complaints
4.39 4.02 4.50 4.50 1.12 1.50 7.36 5.06
Hotel rooms should be comfortable 4.36 3.82 4.50 4.50 1.18 1.50 7.71 5.86
Every procedure and service should be adapted in conformity with different cultures
4.35 3.83 4.00 4.50 1.17 1.00 5.11 3.88
Staff should always smile and reflect their satisfaction with the job they are doing
4.31 3.89 4.00 4.50 1.16 1.20 5.99 4.54
Services should always be offered immediately and at the right time
4.28 3.89 4.50 4.50 1.16 1.20 5.95 4.52
Hotel prices should stay constant 4.27 3.97 4.50 4.50 1.13 1.20 5.80 4.41
Staff’s uniforms should always be clean and good looking
4.26 4.01 4.50 4.50 1.12 1.00 4.77 3.63
Hotel should have enough swimming pools, bars, restaurants, elevators for the total amount of the guests
4.25 3.62 4.00 4.50 1.24 1.20 6.35 4.83
Offered room products (soaps, towels, etc.) should be new and have an amount well enough for every person using that room
4.25 3.88 4.50 4.50 1.16 1.00 4.93 3.75
Reservations should be done correctly 4.25 3.99 4.50 4.50 1.13 1.00 4.79 3.64
Staff should be professional and experienced
4.24 3.89 4.50 4.50 1.16 1.00 4.90 3.73
Hotel should have enough staff in every department
4.22 3.92 4.50 4.50 1.15 1.00 4.84 3.68
All the technical equipment (air conditioners, coffee machines, refrigerators, etc.) used in the hotel should be new, good working and clean
4.09 3.85 4.50 4.50 1.17 1.00 4.77 3.63
There should be special offers (special VIP price lists, free SPA, free hairdressing, etc.) for repeat guests
4.09 3.81 4.00 4.50 1.18 1.20 5.79 4.40
There should be a good sound isolation in the rooms and in the hotel area
4.07 4.01 4.50 4.50 1.12 1.00 4.57 3.47
Animation should be various 4.04 3.83 4.50 4.50 1.18 1.50 7.13 5.42 Hotel should have a nice outlook, design, furniture and overall a positive atmosphere
3.95 3.61 4.00 4.00 1.11 1.20 5.24 3.99
Sport activities should be diversified 3.92 3.70 4.00 4.00 1.08 1.20 5.08 3.87 There should be a Mini Club in the hotel 3.68 3.25 4.00 4.00 1.23 1.00 4.53 3.44
There should be a dress code in the hotel, especially at dinner
3.61 2.83 4.00 4.00 1.41 1.00 5.11 3.88
108
4.4. HOUSE OF QUALITY ANALYSIS
In analyzing the HoQ, it is logical to start with its first phase completed –
customer requirements. Since this study was conducted in the frame of hospitality
industry the term “customer” was often replaced with the term “guest”. While
looking at the importance ratings of guest requirements inside the planning matrix it
is possible to understand which of the listed requirements are more important for
hotel guests. In this Case Hotel situation, it has been observed that “guests should
feel safe in the hotel area”, “hotel rooms and hotel territory should be absolutely
clean” and “food and beverages should be hygienic, delicious, high quality and
diversified” are among the most requested needs of this hotel guests. At the same
time the ability of “management to be sensitive to guest whishes or complaints” and
the comfort of hotel rooms were see as being also very important for people who
decide to spend a holiday at Case Hotel. Also, when looking at the results of the Case
Hotel performance, it can be understood that the safety of the guests in the hotel area,
the ability of hotel’s managers to be sensitive to guest whishes or complaints, the
cleanliness of the staff’s uniform and the high level of rooms and territory’s sound
isolation are among the well performed and good implemented requirements in the
hotel’s activity. From other part, when analyzing the same column, it can be
specified which guest requirements are not completely fulfilled or just partially
covered by the hotel. In this case, a dress code during the dinner time, the Mini Club
and generally, the animation and sport activities present the necessity to be
improved.
The competitor analysis gives the possibility to understand which details are
to be improved in the hotel’s activity. Also it gives the permission to establish the
hotel’s new performance goals. In Case Hotel, “staff should always smile and reflect
their satisfaction with the job they are doing”, “services should always be offered
immediately and at the right time”, “hotel’s prices should stay constant”, “hotel
should have a nice look, design, furniture and overall a positive atmosphere” are
some of the requirements to be better planned and met in the future.
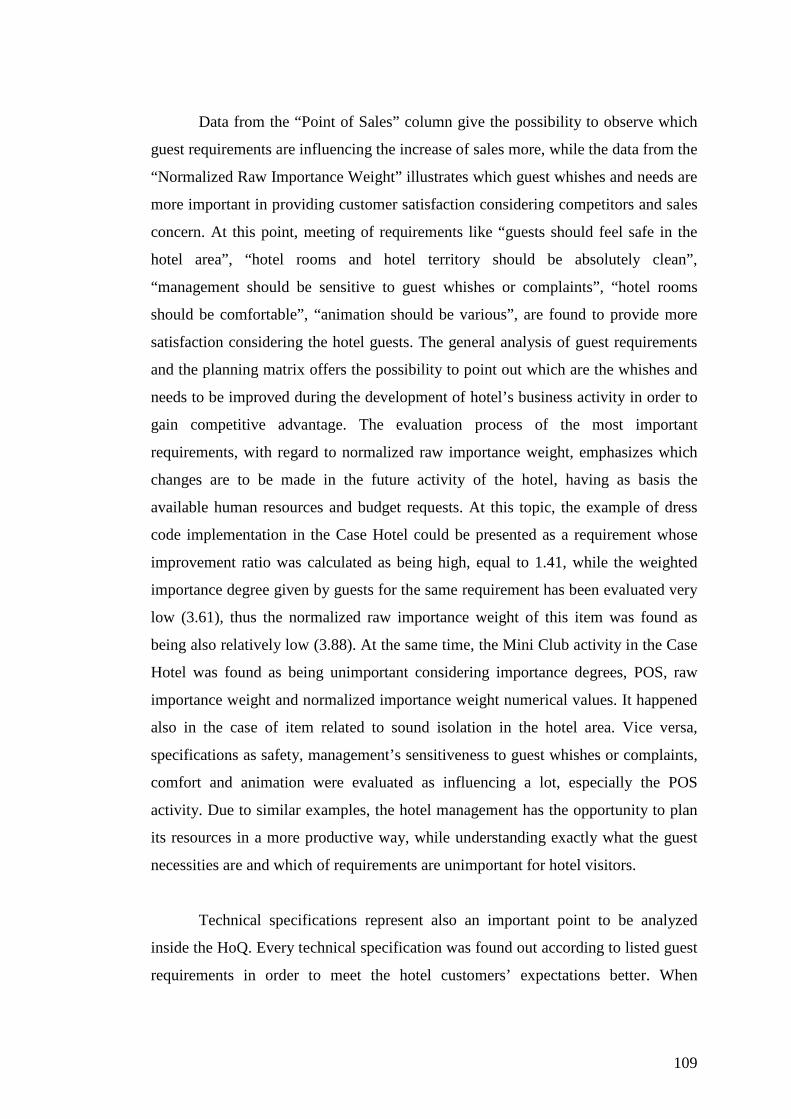
109
Data from the “Point of Sales” column give the possibility to observe which
guest requirements are influencing the increase of sales more, while the data from the
“Normalized Raw Importance Weight” illustrates which guest whishes and needs are
more important in providing customer satisfaction considering competitors and sales
concern. At this point, meeting of requirements like “guests should feel safe in the
hotel area”, “hotel rooms and hotel territory should be absolutely clean”,
“management should be sensitive to guest whishes or complaints”, “hotel rooms
should be comfortable”, “animation should be various”, are found to provide more
satisfaction considering the hotel guests. The general analysis of guest requirements
and the planning matrix offers the possibility to point out which are the whishes and
needs to be improved during the development of hotel’s business activity in order to
gain competitive advantage. The evaluation process of the most important
requirements, with regard to normalized raw importance weight, emphasizes which
changes are to be made in the future activity of the hotel, having as basis the
available human resources and budget requests. At this topic, the example of dress
code implementation in the Case Hotel could be presented as a requirement whose
improvement ratio was calculated as being high, equal to 1.41, while the weighted
importance degree given by guests for the same requirement has been evaluated very
low (3.61), thus the normalized raw importance weight of this item was found as
being also relatively low (3.88). At the same time, the Mini Club activity in the Case
Hotel was found as being unimportant considering importance degrees, POS, raw
importance weight and normalized importance weight numerical values. It happened
also in the case of item related to sound isolation in the hotel area. Vice versa,
specifications as safety, management’s sensitiveness to guest whishes or complaints,
comfort and animation were evaluated as influencing a lot, especially the POS
activity. Due to similar examples, the hotel management has the opportunity to plan
its resources in a more productive way, while understanding exactly what the guest
necessities are and which of requirements are unimportant for hotel visitors.
Technical specifications represent also an important point to be analyzed
inside the HoQ. Every technical specification was found out according to listed guest
requirements in order to meet the hotel customers’ expectations better. When
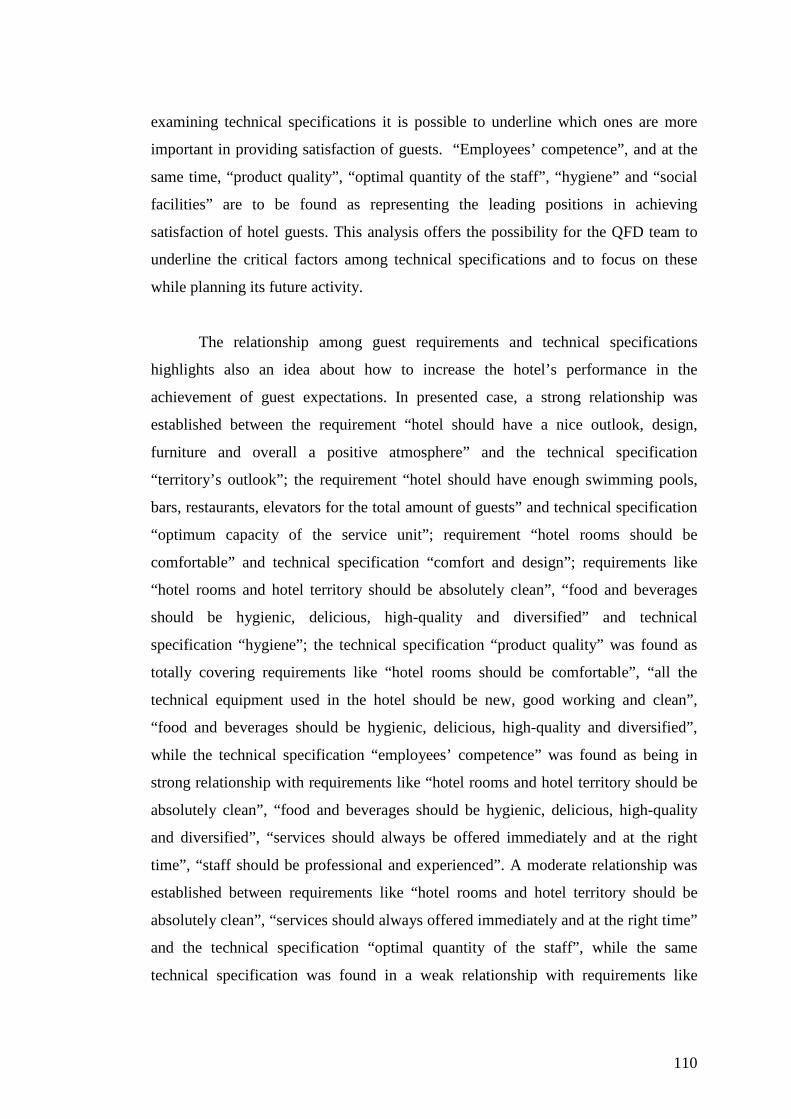
110
examining technical specifications it is possible to underline which ones are more
important in providing satisfaction of guests. “Employees’ competence”, and at the
same time, “product quality”, “optimal quantity of the staff”, “hygiene” and “social
facilities” are to be found as representing the leading positions in achieving
satisfaction of hotel guests. This analysis offers the possibility for the QFD team to
underline the critical factors among technical specifications and to focus on these
while planning its future activity.
The relationship among guest requirements and technical specifications
highlights also an idea about how to increase the hotel’s performance in the
achievement of guest expectations. In presented case, a strong relationship was
established between the requirement “hotel should have a nice outlook, design,
furniture and overall a positive atmosphere” and the technical specification
“territory’s outlook”; the requirement “hotel should have enough swimming pools,
bars, restaurants, elevators for the total amount of guests” and technical specification
“optimum capacity of the service unit”; requirement “hotel rooms should be
comfortable” and technical specification “comfort and design”; requirements like
“hotel rooms and hotel territory should be absolutely clean”, “food and beverages
should be hygienic, delicious, high-quality and diversified” and technical
specification “hygiene”; the technical specification “product quality” was found as
totally covering requirements like “hotel rooms should be comfortable”, “all the
technical equipment used in the hotel should be new, good working and clean”,
“food and beverages should be hygienic, delicious, high-quality and diversified”,
while the technical specification “employees’ competence” was found as being in
strong relationship with requirements like “hotel rooms and hotel territory should be
absolutely clean”, “food and beverages should be hygienic, delicious, high-quality
and diversified”, “services should always be offered immediately and at the right
time”, “staff should be professional and experienced”. A moderate relationship was
established between requirements like “hotel rooms and hotel territory should be
absolutely clean”, “services should always offered immediately and at the right time”
and the technical specification “optimal quantity of the staff”, while the same
technical specification was found in a weak relationship with requirements like

111
“reservations should be done correctly”, “staff should always smile and reflect their
satisfaction with the job they are doing” and “there should be special offers for repeat
guests”.
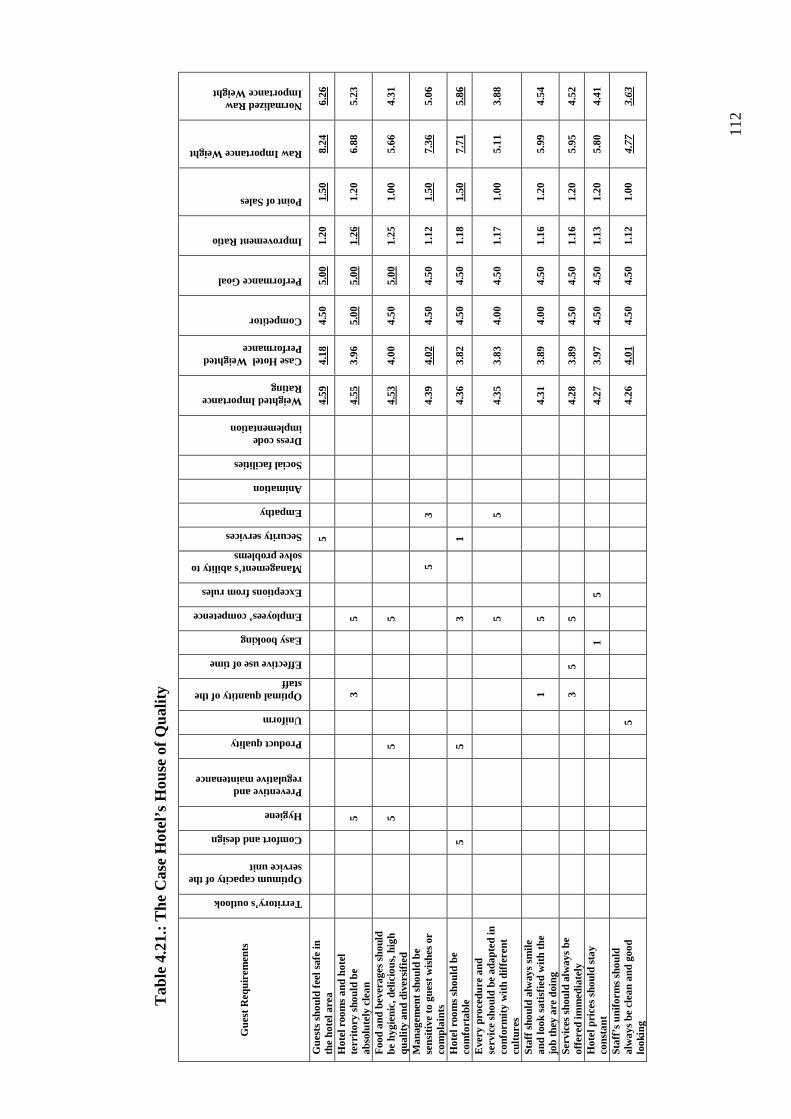
11
2
Tab
le 4
.21.
: The
Cas
e H
otel
’s H
ouse
of Q
ualit
y
Gue
st R
equi
rem
ents
Territory’s outlook
Optimum capacity of the service unit
Comfort and design
Hygiene
Preventive and regulative maintenance
Product quality
Uniform
Optimal quantity of the staff
Effective use of time
Easy booking
Employees’ competence
Exceptions from rules
Management’s ability to solve problems
Security services
Empathy
Animation
Social facilities
Dress code implementation
Weighted Importance Rating
Case Hotel Weighted Performance
Competitor
Performance Goal
Improvement Ratio
Point of Sales
Raw Importance Weight
Normalized Raw Importance Weight
Gue
sts
shou
ld fe
el s
afe
in
the
hote
l are
a
5
4.
59 4.
18
4.50
5.
00
1.20
1.
50
8.24
6.
26
Hot
el r
oom
s an
d ho
tel
terr
itory
sho
uld
be
abso
lute
ly c
lean
5
3
5
4.55
3.96
5.
00
5.00
1.
26
1.20
6.
88
5.23
Foo
d an
d be
vera
ges
shou
ld
be h
ygie
nic,
del
icio
us, h
igh
qual
ity a
nd d
iver
sifie
d
5
5
5
4.53
4.00
4.
50
5.00
1.25
1.
00
5.66
4.
31
Man
agem
ent s
houl
d be
se
nsiti
ve to
gue
st w
ishe
s or
co
mpl
aint
s
5
3
4.39
4.
02 4.
50
4.50
1.
12
1.50
7.36
5.
06
Hot
el r
oom
s sh
ould
be
com
fort
able
5
5
3
1
4.
36
3.82
4.
50
4.50
1.
18
1.50
7.
71
5.86
Eve
ry p
roce
dure
and
se
rvic
e sh
ould
be
adap
ted
in
conf
orm
ity w
ith d
iffer
ent
cultu
res
5
5
4.35
3.
83
4.00
4.
50
1.17
1.
00
5.1
1 3.
88
Sta
ff sh
ould
alw
ays
smile
an
d lo
ok s
atis
fied
with
the
job
they
are
doi
ng
1
5
4.31
3.
89
4.00
4.
50
1.16
1.
20
5.9
9 4.
54
Ser
vice
s sh
ould
alw
ays
be
offe
red
imm
edia
tely
3 5
5
4.
28
3.89
4.
50
4.50
1.
16
1.20
5.
95
4.52
Hot
el p
rices
sho
uld
stay
co
nsta
nt
1
5
4.27
3.
97
4.50
4.
50
1.13
1.
20
5.8
0 4.
41
Sta
ff’s
unifo
rms
shou
ld
alw
ays
be c
lean
and
goo
d lo
okin
g
5
4.26
4.
01 4.
50
4.50
1.
12
1.00
4.
77
3.63
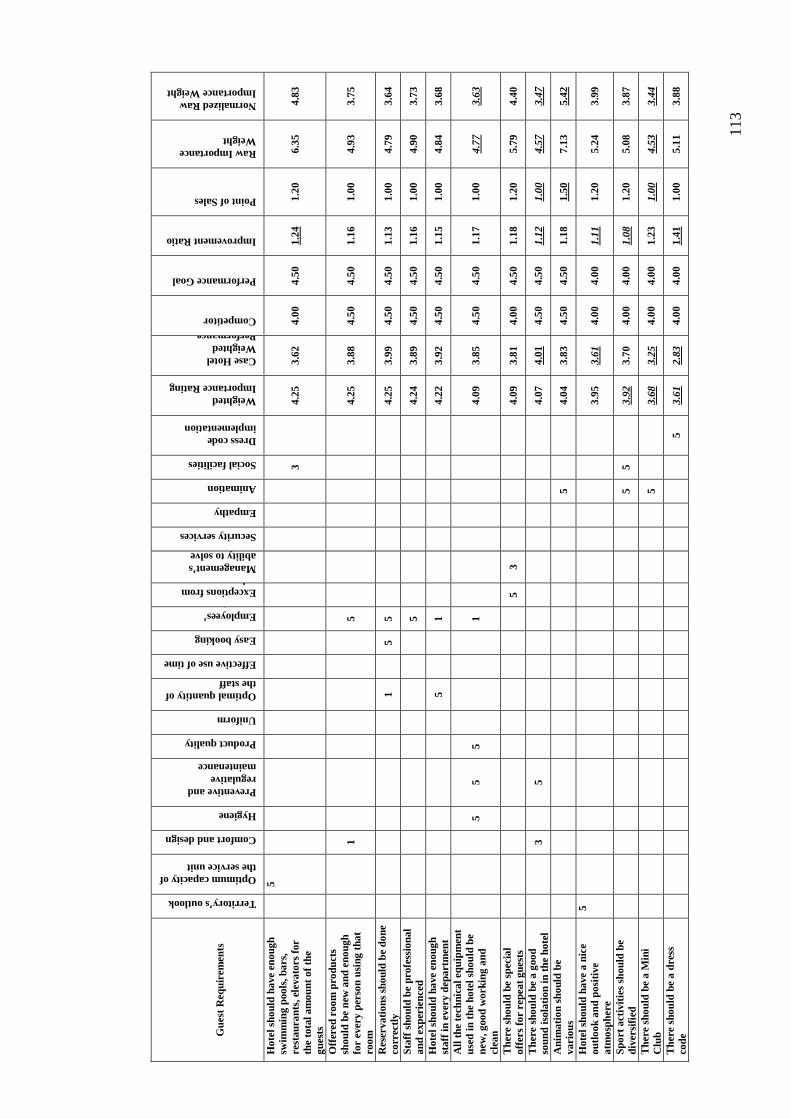
11
3
G
uest
Req
uire
men
ts
Territory’s outlook
Optimum capacity of the service unit
Comfort and design
Hygiene
Preventive and regulative maintenance
Product quality
Uniform
Optimal quantity of the staff
Effective use of time
Easy booking
Employees’ competence Exceptions from rules Management’s ability to solve
Security services
Empathy
Animation
Social facilities
Dress code implementation
Weighted Importance Rating
Case Hotel Weighted Performance Competitor
Performance Goal
Improvement Ratio
Point of Sales
Raw Importance Weight
Normalized Raw Importance Weight
Hot
el s
houl
d ha
ve e
noug
h sw
imm
ing
pool
s, b
ars,
re
stau
rant
s, e
leva
tors
for
the
tota
l am
ount
of t
he
gues
ts
5
3
4.25
3.
62
4.00
4.
50
1.24
1.20
6.
35
4.83
Offe
red
room
pro
duct
s sh
ould
be
new
and
eno
ugh
for
ever
y pe
rson
usi
ng th
at
room
1
5
4.25
3.
88
4.50
4.
50
1.16
1.
00
4.9
3 3.
75
Res
erva
tions
sho
uld
be d
one
corr
ectly
1
5 5
4.
25
3.99
4.
50
4.50
1.
13
1.00
4.
79
3.64
Sta
ff sh
ould
be
prof
essi
onal
an
d ex
perie
nced
5
4.
24
3.89
4.
50
4.50
1.
16
1.00
4.
90
3.73
Hot
el s
houl
d ha
ve e
noug
h st
aff i
n ev
ery
depa
rtm
ent
5
1
4.22
3.
92
4.50
4.
50
1.15
1.
00
4.8
4 3.
68
All
the
tech
nica
l equ
ipm
ent
used
in th
e ho
tel s
houl
d be
ne
w, g
ood
wor
king
and
cl
ean
5
5 5
1
4.09
3.
85
4.50
4.
50
1.17
1.
00
4.77
3.
63
The
re s
houl
d be
spe
cial
of
fers
for
repe
at g
uest
s
5 3
4.
09
3.81
4.
00
4.50
1.
18
1.20
5.
79
4.40
The
re s
houl
d be
a g
ood
soun
d is
olat
ion
in th
e ho
tel
3
5
4.07
4.
01 4.
50
4.50
1.
12
1.00
4.
57
3.47
Ani
mat
ion
shou
ld b
e va
rious
5
4.
04
3.83
4.
50
4.50
1.
18
1.50
7.
13
5.42
Hot
el s
houl
d ha
ve a
nic
e ou
tlook
and
pos
itive
at
mos
pher
e
5
3.95
3.
61
4.00
4.
00
1.11
1.
20
5.24
3.
99
Spo
rt a
ctiv
ities
sho
uld
be
dive
rsifi
ed
5
5
3.92
3.
70
4.00
4.
00
1.08
1.
20
5.08
3.
87
The
re s
houl
d be
a M
ini
Clu
b
5
3.
68
3.25
4.
00
4.00
1.
23
1.00
4.
53
3.44
The
re s
houl
d be
a d
ress
co
de
5
3.61
2.
83
4.00
4.
00
1.41
1.00
5.
11
3.88
114
4.5. CONCLUSIONS
Managing service quality has always been a target for most hospitality
organizations because it results in customer satisfaction that every organization
intends to accomplish. The more influence an organization has over its service
quality, the better it will have control over its customer satisfaction (Grönroos,
2009:82).
QFD is an instrument which has the characteristics to converse all functional
components inside an organization providing a product of service. It is carried out by
a large team in order to meet the most important customer whishes and needs.
Although QFD model is very detailed and structured, but at the same time flexible
and easy to be understood, it influences the organizational development a lot.
With the practical implementation of the QFD method, the customer
requirements can be understood better. It offers the possibility to listen to the Voice
of Customers and according to this to find new solutions in covering customer needs
and respectively, gain competitive advantage. With the right understanding of
customer needs, a customer-focused decision-making process can be planned in a
more productive way. A multi-functional team-work can design some problems
which can be prevented before they occur more. The QFD model offers also the
possibility to use time more efficiently. It influences the process of providing high
quality services, increasing the customer satisfaction, establishing a higher
organization’s image and influences sales in a positive way.
This study was undertaken to analyze the expectations of foreign tourists
from a five star hotel in Turkey. The purposes of this exploratory-descriptive
research were (a) to identify the most underlined requirements of guests of different
origins which come to spend their holiday in Turkish five star hotel; (b) to analyze a
concrete hotel in order to find out the importance degrees of presented requirements
established by this hotel guests; (c) to identify the performance levels of presented
requirements in the Case Hotel; (d) to implement the QFD model and to build a QFD
115
team in order to find out the most important technical specifications to be established
in order to meet the guest needs and which is the actual situation of the Case Hotel
considering one of its main competitors; (e) to identify new performance goals for
the organization and to calculate the improvement ratio, point of sales, raw
importance weights and normalized importance weights in order to provide a better
quality of services and to gain competitive advantage.
This study was conducted in a five star hotel in Antalya. Through methods
like going to the GEMBA, focus groups, observations, a list of customer
requirements was formulated in order to specify the importance degrees of these
requirements for the hotel guests and the performance levels of these requirements in
the hotel. A questionnaire technique was implemented.
The most important guest requirements were classified as “guests should feel
safe in the hotel area”, “hotel rooms and hotel territory should be absolutely clean”,
“food and beverages should be hygienic, delicious, high quality and diversified” and
“management should be sensitive to guest whishes or complaints. From other hand,
requirements like “there should be a dress code in the hotel, especially by dinner”
and “there should be a Mini Club in the hotel” were identify as less important for
hotel’s guests.
It was found that importance degrees and performance levels evaluations of
the customer requirements differ significantly with regard to nationality of the
guests. Turkish guests were found as being more exigent in their expectations
considering a five star hotel, while English guests seemed to be not so critical in their
whishes and needs. Also, Russian and Turkish guests have been observed to be more
satisfied with the performance levels of listed customer requirements in the Case
Hotel, while guests of other origins, like Serbian, Rumanian, French, Swiss, etc.
evaluated the majority of customer requirements as being not enough performed.
Since a QFD team was formed, some technical requirements were specified
in order to cover the guest wishes and needs. After a four months working process of
116
the QFD team, “comfort and design”, “employees’ competence”, “product quality”,
and “optimal quantity of the staff” were identified as most important technical
specifications. Results presented in the HoQ, illustrate that the technical specification
related to the hotel employees’ competence seem to have a strong relationship with a
lot of customer requirements. It means that the hotel management and the Human
Resources Department especially, should be more attentive and exigent while
acquiring people and future hotel employees. Also, some points to be focused on are
the hygiene and the quality of products used, items which can also improve a lot the
hotel’s future activity.
During the accomplishment of this study, it was also found out that customers
generally consider the way how the service employee or service provider performs
recovery efforts, how adaptable the service employee or service provider is, how
good the spontaneity is and how good the service employee or service provider is in
solving customer’s problems.
There were also some difficulties to be passed through while working on the
creation of the HoQ. It is not so easy to understand the guest requirements and to
establish the right technical specifications for them, that is why it caused long
discussions and debates inside the QFD team before coming to a common result. It
was also difficult to concentrate on the entire planning matrix and to manage it since
the number of columns began to grow.
4.6. LIMITATIONS OF THE STUDY AND RECOMMENDATIONS
FOR FURTHER STUDIES ON QFD
During this study many factors may have affected the results of this work.
First, this study was conducted at the end of the season, factor which can influence a
lot the results of the established hotel performance ratings. Since one of the hotel’s
strategies is to reduce the number of employees starting with October and until April
every year, it is logical that this fact influences the quality of offered services a lot
and affects generally the hotel’s performance level. At the same time, some small
117
construction works were held in some of the hotel areas and outside it, at the time
when this study was performed. This could influence respondents in their
evaluations.
Another limiting factor is the risk that respondents may not accurately answer
to the questionnaire or they may avoid giving information about their personal data,
or expressing their true positive or negative opinion, and instead giving neutral
responses. Respondents may also misunderstand some questions and thus give
answers that do not reflect their true opinion. In the same context, from the total
amount of 250 questionnaires offered to guests, an amount of 151 questionnaires to
be correctly fulfilled and analyzed can be considered a disadvantage.
The establishment of technical specifications and the process of identifying
the relationships between technical specifications and given guest requirements are
not an easy mission. It can often conduct to long discussions and serious debates
inside the QFD team, which can be also considered as being a limiting detail in
accomplishment of this study.
Finally, at the time when this research was conducted, the hotel management
was concentrated a lot on other project, including the building of a fifth hotel in their
resort, so logically, all the resources and budget were planned according to this. It
influenced a lot the establishment of performance goals of Case Hotel. This fact,
impede also the implementation of a more wide QFD model. That is why it can be
recommended for the further similar studies on QFD to analyze more extensive the
technical specifications and customers overall satisfaction, with establishment of a
Pareto diagram and with the computation of raw importance weight and normalized
raw importance weight for every single technical specification given in the planning
matrix. At the same time, establishment of a correlation matrix in the HoQ can be
recommended for further studies, as it could change or influence the final results.
118
4.7. RECOMMENDATIONS TO THE CASE HOTEL
As main recommendations to be specified, adding more tangibility in the
service encounter of the hotel will minimize the risk of having a big gap between
customer expectation and perception. Cultural aspect is another point that will
influence the performance of a quality service offered in Case Hotel. Also, having
detailed service blueprint for every service operation will help Case Hotel have more
control over service encounters and ensure service excellence. In the same context,
some changes should be introduced in the organizational culture in order to motivate
all Case Hotel’s departments to work as a well-built team in achievement of a
common goal and in accomplishment of a common mission. At the same time, the
Case Hotel’s Human Resources Department should be exigent enough in acquiring
experienced and professional employees. The Case Hotel management should be
attentive to the number of employees working in the hotel, while a right and
optimum capacity of the staff in the hotel area influence a lot the quality of offered
services. It would be also agreeable if there would be some activities performed for
the hotel employees’ in order to improve their work motivation. Finally, several
kinds of trainings will be also necessary for employees, such as: multicultural
training programs, language training programs and so on.
119
REFERENCES
Abbott, L. (1955), Quality and Competition. New York: Columbia University
Press.
Akao, Y. (1972). New Product Development and Quality Assurance Deployment
System in Japan. Standardization and Quality Control, 25, pp. 243-246.
Akao, Y. (1997). QFD: Past, Present and Future. Transactions of the Third
International Symposium on Quality Function Deployment, 1, pp. 14-23.
Akbaba, A. (2003). Quality Function Deployment in the Hospitality Industry.
Doctorate Thesis, Dokuz Eylül University, Institute of Social Sciences
(unpublished).
Akbaba, A. (2006). Measuring Service Quality in the Hotel Industry: A Study in a
Business Hotel in Turkey. International Journal of Hospitality Management, 25,
pp.170-192.
Amos, L. (1997). QFD in Theory and Practice. Unpublished Undergraduate
Research Project, University of Birmingham, UK.
Anderson, E. W., Fornell, C. and Lehmann, D. R. (1994). Customer Satisfaction,
Market Share and Profitability: Findings from Sweden. Journal of Marketing, 58(3),
pp. 53-66.
Anderson, R.E. (1993). QFD’s Role in Concurrent Engineering. Training and
Development, 47(6), pp. 49–54.
Aquilano, N. and Chase, R. (2006), Operations Management for Competitive
Advantage. Boston, Massachusetts: McGraw-Hill.
120
Armstrong, G. and Kotler, P. (1991), Principles of Marketing. 5th edition, New
Jersey: Prentice-Hall.
Aspinwall, E.M. and Delgado, D.J. (2003). QFD Methodology and Practical
Applications – A Review. Ninth Annual Postgraduate Research Symposium, School
of Engineering, University of Birmingham, pp.1-5.
Baker, M.J. and Cameron, E. (1996), Critical Success Factors in Destination
Marketing. Tourism and Hospitality Research, 8, pp. 79-97.
Baker, M.J., Parasuraman, A., Grewal, D. and Voss, G.B. (2002). The Influence of
Multiple Store Environment Cues on Perceived Merchandise Value and Patronage
Intentions. Journal of Marketing, 66(2), pp. 120-141.
Barnett, W.D. and Raja, M.K. (1995). Application of QFD to the Software
Development Process. International Journal of Quality and Reliability Management,
12(6), pp.24–42.
Bateson, J.E.G. (1977). Do We Need Service Marketing? Marketing Consumer
Services: New Insights, Report 77-115, Marketing Science Institute, Boston, MA.
Becerra Grande, A., Brinol Turnes, P., Falces Delgado, C. and Sierra Diez, B.
(1999). HOTELQUAL: An Approach of Service Quality Measurement in the
Lodging Industry. Studies on Tourism, 139, pp. 93-108.
Bednar, D.A. and Reeves, C.A. (1994). Defining Quality: Alternatives and
Implications. The Academy of Management Review, 19(3), pp. 419-445.
Berry, L.L. (1980). Services Marketing is Different. Journal of Business, May-June,
30(3), pp. 24-9.
121
Berry, L.L., Bennet, D.R. and Brown, C.V. (1989), Service Quality: A Profit Strategy
for Financial Institutions. Homewood, IL: Dow-Jones-Irwin.
Berry, L.L., Parasuraman, A. and Zeithaml, V.A. (1990), Delivering Quality
Services. New York: Free Press.
Berry, L.L., Parasuraman, A. and Zeithaml, V.A. (1994). The Nature and
Determinants of Customer Expectations of Service. Journal of the Academy of
Marketing Service, 12, pp. 1-12.
Bitner, M.J and Booms, B.H. (1981). Marketing Strategies and Organization
Structures for Service Firms. Marketing of Services, pp. 47-51.
Bitner, M.J. (1992). Evaluating Service Encounters: The Effects of Physical
Surroundings and Employee Responses. Journal of Marketing, 51, April, pp.69-82.
Bitner, M.J. and Zeithaml, V.A. (2000), Services Marketing: Integrating Customer
Focus across the Firm. New York: McGraw Hill.
Bitner, M.J., Booms, B.H., Tetreault, M.S. (1990). The Service Encounter:
Diagnosing Favorable and Unfavorable Incidents. Journal of Marketing, 54, January,
pp. 71-84.
Booms, B.H. and Lewis, R.C. (1983). The Marketing Aspects of Service Quality.
Marketing of Services, pp. 99-107.
Booth, R. (1995). Hitting the Target. Management Accounting, 73(1), p. 42.
Brady, M. and Cronin, J. (2000). Some New Thoughts on Conceptualizing Perceived
Service Quality: a Hierarchical Approach. Journal of Marketing, 65, pp. 34-49.
122
Brown, S. W. and Swartz, T. A. (1989). A Gap Analysis of Professional Service
Quality. Journal of Marketing, 53, April, pp. 92-98.
Buzzell, R. D. and Gale, B. T. (1987), The PIMS Principles. New York: The Free
Press.
Carman, J. M. (1990). Consumer Perceptions of Service Quality: An Assessment of
the SERVQUAL Dimensions”. Journal of Retailing, 66(1), pp. 33-35.
Carman, J.M. (1990). Consumer Perceptions of Service Quality: An Assessment of
the SERVQUAL Dimensions. Journal of Retailing, 66(1), pp. 33-55.
Carvalho, C., Brito, C. and Cabral, J.S. (2010). Towards a Conceptual Model for
Assessing the Quality of Public Services. International Review of Public Non Profit
Marketing, pp. 69-86.
Cattaneo, O., Gereffi, G. and Staritz, C. (2010). Global Value Chains in a Post-Crisis
World. World Bank, pp. 33-54.
Catts, R., Fogarty, G. and Forlin, C. (2006). Identifying Shortcomings in the
Measurement of Service Quality. Journal of Outcome Measurement, 4(1), pp. 425-
447.
Chan, L.K. and Wu, M.L. (2002). Quality Function Deployment: A literature
Review. European Journal of Operational Research, 143, pp. 463-497.
Chang, C.H. (2008). Quality Function Deployment Processes in an Integrated
Quality Information System. Computers and Industrial Engineering, 17, pp. 311-
316.
Chin, K.S., Pun, K.F., Leung, W.M., Lau, H. (2001). A Quality Function
Deployment Approach for Improving Technical, Library and Information Services:
A Case Study. European Journal of Operational Research, 138, pp. 324-343.
123
Cohen, L. (1995), Quality Function Deployment: How to Make QFD Work for You.
Addison-Wesley Reading, MA.
Collins, B. and Payne, A. (1991). Internal Marketing: A New Perspective for HRM.
European Management Journal, 9(3), pp. 261-270.
Cronin, J. and Taylor, S. (1992). Measuring Service Quality: a Reexamination and
Extension. Journal of Marketing, 56(3), pp. 55-68.
Crosby, P.B. (1980), Quality is Free. New York: Penguin Books.
Dabholkar, P.A., Sheperd, C.D. and Thorpe, D.I. (2000). A Comprehensive
Framework for Service Quality: An Investigation of Critical Conceptual and
Measurement Issues. Journal of Retailing, 76(2), pp. 139-173.
Day, R.G. (1993), Quality Function Deployment. Cambridge, MA: Productivity
Press.
Dean, A. M., Mei, A.W. O. and White, C. J. (1999). Analyzing Service Quality in the
Hospitality Industry. Managing Service Quality, 9(2), pp. 136-143.
Deming, W.E. (1986), Out of the Crisis. Cambridge: Massachusetts Institute of
Technology.
Deming, W.E. (1993), Quality, Productivity and Competitive Position. Cambridge:
Massachusetts Institute of Technology.
Dika, R.J. (1995). QFD implementation at Chrysler: The First Seven Years. Quality
Up, Costs Down: A Managers’ Guide to Taguchi Methods and QFD, pp. 123–163
124
Dube, L., Johnson, M.D. and Renaghan, L.M. (1999). Adapting the QFD Approach
to Extended Service Transactions. Production and Operations Management, 8(3),
pp. 301-317.
Ekinci, Y. (2002). A Review of Theoretical Debates on the Measurement of Service
Quality: Implications for Hospitality Research. Journal of Hospitality and Tourism
Research, 26(3), pp. 199-216.
Ellis, T. and Pizam, A. (1990). Customer Satisfaction and its Measurement in
Hospitality Enterprises. International Journal of Contemporary Hospitality
Management, 11(7), pp. 326-339.
Emmanuel, J.T. and Kroll, D.E. (1998), Handbook of Total Quality Management.
Boston, MA: Kluwer Academic Publishers.
Enis, B.M and Roering, K.J. (1981). Problems and Strategies in Service Marketing.
Journal of Marketing, 49(2), pp. 33-46.
Erto, P. and Vanacore, A. (2002). A Probabilistic Approach to Measure Hotel
Service Quality. Total Quality Management, 13(2), pp. 165-174.
Evans, J.R. and Lindsey, W.M. (1999), The Management and Control of Quality. 4th
edition, Cincinnati, OH: South-Western Publishing.
Feigenbaum, A.V. (1982). Quality and Business Growth Today. Quality Progress,
15, pp. 22-25.
Finn, D.V. and Lamb, C.W. (1991). An Evaluation of the SERVQUAL Scale in a
Retailing Setting. Association for Consumer Research Provo,18, pp. 480-493.
125
Fiore, A.M. and Kim, J. (2007). An Integrative Framework Capturing Experiential
and Utilitarian Shopping Experience. International Journal of Retail and
Distribution Management, 35(6), pp. 421-442.
Foutz, T. and Thompson, S. (1998). Customer Focused Approach to Design: New
Methodologies Consider Environmental Impact of Product Development.
Engineering and Technology for a Sustainable World, pp.7-12.
Franceschini, F. and Rossetto, S. (1997). QFD: the Problem of Comparing Technical/
Engineering Design Requirements. Research in Engineering Design, 7(4), pp.270-
278.
Frochot, I. and Hughes, H. (2000). Histoqual: Development of a Historic Houses
Assessment Scale. Journal of Tourism Management, 21, pp. 157-167.
Fuchs, V. (1968), The Service Economy. New York: National Bureau of Economic
Research, Columbia University Press.
Galanty, A.F. and Kirk, J.N. (1994). The Ritz-Carlton Housekeeping System: Service
QFD Applications. Sixth Symposium on QFD, Novi, Michigan.
Gale, B.T. and Wood, R.C. (1994), Managing Customer Value-Creating Quality and
Service that Customer Can See. New York: The Free Press.
Garvin, D.A. (1988), Managing Quality: The Strategic and Competitive Edge. New
York: Free Press.
Gershuny, J. (1978), After Industrial Society? The Emerging Self-Service Economy.
London: MacMillan.
126
Getty, J. M. and Thompson, K. N. (1994). The Relationship Between Quality
Satisfaction and Recommending Behavior in Lodging Decisions. Journal of
Hospitality and Leisure Marketing, 2(3), pp. 3-22.
Ghauri, P., Gronhaug, K. and Kristianslund, I. (2002). Research Methods in Business
– A Practical Guide., London: Prentice Hall.
Ghobadian, A., Speller, S. and Jones, M. (1994). Service Quality: Concepts and
Models. International Journal of Quality and Reliability Management, 11(9), pp. 43-
66.
Gitlow, H., Oppenheim, A. and Oppenheim, R. (1995), Quality Management: Tools
and Methods for Improvement. Burr Ridge, IL: Irwin.
Grönroos, C. (1978). A Service Orientated Approach to the Marketing of Services.
European Journal of Marketing, 12(8), pp. 588-601.
Grönroos, C. (1984). A Service Quality Model and its Marketing Implications.
European Journal of Marketing, 18(4), pp. 36-43.
Grönroos, C. (1991). The Marketing Strategy Continuum: Towards a Marketing
Concept for the 1990s. Management Desicion, 29(1), pp. 7-13.
Grönroos, C. (2009). The Perceived Service Quality Concept – A Mistake?
Managing Service Quality, 11(3), pp. 72-85.
Gryna, F.M and Juran, J.M. (1993), Quality Control Handbook. New York:
McGraw-Hill.
Güllü, E. and Ulcay, Y. (2002). Quality Function Deployment and a Practical
Implementation of the Model. Uludağ University, Journal of Faculty of
Architecture and Engineering, 7(1), pp. 71-80.
127
Gummesson, E. (1991). Marketing-Orientation Revisited: The Crucial Role of the
Part-Time Marketer. European Journal of Marketing, 25(2), pp. 60-75.
Guseman, D.S. (1981). Risk Perception and Risk Reduction in Consumer Services.
Marketing of Services, American Marketing Association, pp. 200-204.
Haavind, R. (1989). Hewlett-Packard Unravels the Mysteries of Quality. Electronic
Business, 15(20), pp. 101–105.
Haemoon, O. and Miyoung, J. (1998). Quality Function Deployment: An Extended
Framework for Service Quality and Customer Satisfaction in the Hospitality
Industry. International Journal of Hospitality Management, 17, pp. 375-390.
Hales, R. (1995). Using QFD to Adapt QFD to Your Culture. Journal for Quality
and Participation, 18(6), pp. 10–13.
Hazlett, S. and Philip, G. (1997). The Measurement of Service Quality: A New P-C-
P Attributes Model. International Journal of Quality and Reliability Management,
14(3), pp. 260-286.
Henderson, D. (1994). Customer Satisfaction Through Excellence. Transportation
and Distribution, 35(10), p. 90.
Heung, V., Qu, H. and Wong, M.Y. (2000). Airport Foodservice in Hong Kong:
A Study of Tourists’ Perceptions, Satisfactions, and Likelihood of their
Recommendations to Others. Proceedings of the Fifth Annual Graduate
Education and Graduate Students Research Conference in Hospitality &
Tourism, pp.19-30.
Hines, P.and Samuel, D. (1999). Designing a Supply Chain Change Process: A Food
Distribution Case. International Journal of Retail and Distribution Management,
27(10), pp. 409-420.
128
Hoekman, B.M. and Togan, S. (2005), Turkey: Economic Reforms and Accession to
the European Union. Washington: International Bank for Reconstruction and
Development.
Hoyle, D. (2005), ISO 9000 Quality Systems Handbook. Bodenhamy: Butford
Technical Publishing.
Jagdev, H., Bradley, P. and Molloy, O. (1997). A QFD Based Performance
Measurement Tool. Computers in Industry, 33, pp. 357-366.
James, J.C. and Martilla, J.A. (1997). Importance-Performance Analysis. Journal of
Marketing, 24, pp. 77-79.
Jeong, M. and Oh, H. (1998). Quality Function Deployment: An Extended
Framework for Service Quality and Customer Satisfaction in the Hospitality
Industry. International Journal of Hospitality Management, 17, pp. 375-390.
Johnston, R. and Clark, G. (2001), Service Operations Management. Harlo: Prentice-
Hall.
Juran, J.M. (1988), Juran on Planning for Quality. New York: The Free Press.
Kağnıcıoğlu, H.C. (2002). Quality Function Deployment in Product Planning
Process. Uludağ University, Journal of Faculty of Economics, 12(1), pp. 177-188.
Kandampully, J. (2001). The Impact of Demand Fluctuation on the Quality of
Service: A Tourism Industry Example. Managing Service Quality, 10(1), pp. 10-18.
Kapucugil, A. and Masoudi, A. (2008). A QFD and SERVQUAL Approach to Hotel
Service Design. Business Faculty Journal, 9(1), pp. 17-31.
Keenan, T. (1996). At What Price PPM? Ward’s Auto World, 32(4), p. 55.
129
Kennedy, D.A. and Young, B.J. (1989). Managing Quality in Staff Areas. Quality
Progress, 22(10), pp. 87-91.
Knuston, B., Patton, M. and Stevens, P. (1994). Internationalizing LODGSERV
as a Measurement Tool: A Pilot Study. Journal of Hospitality and Leisure
Marketing, 2(2), pp. 39-55.
Knutson, B., Patton, M., Thompson, C. and Yokoyama, F. (1990). Service
Expectation Index: A Comparison of Confirmatory Analysis and Factor
Analysis as Methods of Index Testing and Refinement. Hospitality Research
Journal, 14(2), pp. 413-420.
Knutson, B., Stevens, P. and Patton, M. (1995). DINESERV: Measuring
Service Quality in Quick Service, Casual/Theme, and Fine Dining Restaurants.
Journal of Hospitality and Leisure Marketing, 3(2), pp. 35-44.
Ko, A.S.O. and Lee, S.F. (2000). Implementing The Strategic Formulation
Framework For The Banking Industry of Hong Kong. Managerial Auditing Journal,
15(9), pp. 469–477.
Kotler, P. and Keller, K.L. (2006), A Framework of Marketing Management. Pearson
Education Inc.
Kuei, J.H. (1995), Strategic Total Quality Management. Westport, CT: Quorum
Books.
Kumra, R. (2008). Service Quality in Rural Tourism: A Perspective Approach.
Conference on Tourism in India-Challenges Ahead, Idia, pp. 424-431.
Levitt, T. (1972). Production Line Approach to Service. Harvard Business Review,
September-October, pp. 41-52.
130
Levitt, T. (1981). Marketing Intangible Products and Product Tangibles. Harvard
Business Review, 59, May-June, pp. 95-102.
Lewis, R. (1976). Uses and Abuses of Hospitality Research. The Cornell Hotel and
Restaurant Administration Quarterly, 29(3), pp. 11-12.
Love, J.F. (1986), McDonald’s: Behind the Arches, Toronto: Bantam Books.
Lovelock, C.H. (1981). Why Marketing Needs to be Different for Services.
Marketing of Services, 13, pp. 36-52.
Lovelock, C.H. (1983). Classifying Services to Gain Strategic Marketing Insight.
Journal of Marketing, 47, Summer, pp. 9-20.
Lovelock, C.H. and Wirtz, J. (2007), Service Marketing: People, Technology,
Strategy. Pearson Prentice Hall.
Madu, C.N. (2004), Competing on Quality and Environment. Chi Publishers.
Malhotra, N.R. (2004). Marketing Research: An Applied Orientation. Pearson
Education International.
Marinova, S. T. (2003), Foreign Direct Investment in Central and Eastern Europe.
Hampshire: Ashgate Publishing Limited.
Mazur, G. H. (1993). QFD for Service Industries From Voice of Customer to Task
Deployment. The Fifth Symposium on QFD, Novi, Michigan, June.
Mazur, G. H. (1997). Service QFD: State of the Art. Proceedings of the Third Annual
International QFD Symposium, Linkoping University, Sweden.
131
Minor, M.S., Wagner, T., Brewerton, F.J. and Hausman, A. (2004). Rock on! An
Elementary Model of Customer Satisfaction with Musical Performance. Journal of
Services Marketing, 18(1), pp. 7-18.
Motwani, J. and Kathawala, Y. (1994). Implementing Quality Function Deployment
– A System Approach. The TQM Magazine, 6(6), pp. 31-37.
Murgatroyd, S. (1993). The House of Quality: Using QFD for Instructional Design in
Distance Education. The American Journal of Distance Education, 7(2), pp. 34-48.
Murray, K.B. and Schlacter, J.L. (1990). The Impact of Services versus Goods on
Consumers’ Assessment of Perceived Risk and Variability of Perceive Risk, Self-
Confidence and Information Sources. Proceedings of the Fourth Annual Convention
of the Association for Consumer Research, pp. 406-416.
Nagendra, P.B. and Osborne, S.W. (2000). Professional Services Marketing: A
House of Quality Approach. Journal of Professional Services Marketing, 21(1), pp.
23-27.
Nishimura, H. (1972). Ship Design and Quality Table. Quality Control, 23, May, pp.
16-20.
Norman, R. (1984), Service Management. New York: John Wiley.
Oakland, J.S. (2000), Total Quality Management: Text with Cases. Oxford:
Butterworth-Heinemann.
Oke, S.A., Ofiabulu, C.E., Banjo, A.A., Akanbi, O.G., Oyawale F.A. (2008). The
Combined Application of Quality Function Deployment and Pareto Analysis for
Hotel Services Improvement. International Journal of Productivity and Quality
Management, 3(2), pp.241-262.
132
Oliver, R.L. (1997). What is Customer Satisfaction? Wharton Magazine, 5. pp. 45-
58.
Oliver, R.L. and Rust, R.T. (1994), Service Quality: New Directions in Theory and
Practice. London: Sage Publications.
Olsen, R.P., Sasser, W.E. and Wyckoff, D.D. (1978), Management of Service
Operations: Texts, Cases, Readings. Boston: Allyn and Bacon.
Öter, A. and Tütüncü, Ö. (2001). Quality Function Deployment in Travel
Organizations. Dokuz Eylül University, Journal of Institute of Social Sciences, 2(3),
pp. 95-117.
Palmer, A. (1994), Principles of Services Marketing. McGraw-Hill International.
Parasuraman, A. (1991), Marketing Research. Addison-Wesley Reading, MA.
Parasuraman, A., Zeithaml, V.A. and Berry, L. L. (1988). SERVQUAL: A Multiple
Item Scale for Measuring Consumer Perceptions of Service Quality. Journal of
Retailing, 64, pp.1-9.
Parasuraman, A., Zeithaml, V.A. and Berry, L.L. (1985). A Conceptual Model of
Service Quality and its Implications for Future Research. Journal of Marketing, 49,
Fall, pp. 41-50.
Pun, K.F., Chin, K.S. and Lau, H. (2000). A QFD/Hoshin Approach for Service
Quality Deployment: A Case Study. Managing Service Quality, 10(3), pp. 156–170.
Raghunathan, T.S. and Vonderembse, M.A. (1997). Quality Function Deployment’s
Impact on Product Development. International Journal of Quality Science, 2(4), pp.
253-271.
133
Ramsaran-Fowdar, R.R. (2007). Developing a Service Quality Questionnaire for the
Hotel Industry in Mauritius. Journal of Vacation Marketing, 13(1), pp.17-19.
Rathmell, J.M. (1974), Marketing in the Service Sector. Cambridge: Winthrop
Publishers Inc.
Ross, P.J. (1989), Taguchi Techniques for Quality Engineering. New-York:
McGraw-Hill.
Schvaneveldt, S.J., Enkawa, T. and Miyakawa, M. (1991). Consumer Evaluation
Perspectives of Service Quality: Evaluation Factors and Two-Way Model of Quality.
Total Quality Management, 2(2), pp. 149-161.
Shahin, A., (2004). SERVQUAL and Model of Service Quality Gaps: A Framework
for Determining and Prioritizing Critical Factors in Delivering Quality Services.
Service Quality – An Introduction, Partha Sarathy, 1st edition, ICFAI University
Press, pp. 117-131.
Shostack, G.L. (1977). Breaking Free from Product Marketing. Journal of
Marketing, 41, April, pp. 35-43.
Shostack, G.L. (1982). Designing Services that Deliver. Harvard Business Review,
January-February, pp. 133-9.
Smith, A. (1977), The Wealth of Nations. Harmondsworth: Penguin.
Sower, V.E., Savoie, M.J. and Renick, S. (1999), An Introduction to Quality
Management and Engineering. Prentice Hall.
Stanton, W.J. (1981), Fundamentals of Marketing. New York: McGraw-Hill.
134
Stauss, B. and Weinlich, B. (1997). Process-Oriented Measurement of Service
Quality. European Journal of Marketing, pp. 33-55.
Stelzer, D., Mellis, W. and Herzwurm, G. (1996). A Critical Look at ISO 9000 for
Software Quality Management. Software Quality Journal, 6, pp. 65-69.
Stuart, F.I. and Tax, S.S. (1996). Planning for Service Quality: An Integrative
Approach. International Journal of Service Industry Management, 7(4), pp. 58-77.
Sullivan, L.P. (1996). Quality Function Deployment: A System to Assure that
Customer Needs Drive the Product Design and Production Process. Quality
Progress, June, pp. 92-105.
Tam, J.A.M. (2005). Examining the Dynamics of Consumer Expectations in a
Chinese Context. Journal of Business Research, 58, pp. 777-786.
Teas, R.K. (1997). Expectations as a Comparison Standard in Measuring Service
Quality: An Assessment of a Reassessment. Journal of Marketing, 58(1), pp. 132-
139.
Today’s Zaman Paper, Article on Tourism, from 03 January 2010, available at
http://www.todayszaman.com/news-197382-tourism-sector-looks-forward-to-
popular-trends-in-2010.html
Tuchman, B.W. (1980). The Decline of Quality. New York Times Magazine,
November, pp. 38-41.
von Friedrichs Grangsjo (2001). Power in Destination Branding. Annals of Tourism
Research, 36(2), pp. 247-267.
White, C. and Yu, Y.T. (2005). Satisfaction Emotions and Consumer Behavioral
Intentions. Journal of Services Marketing, 19(6), pp. 411-421.
135
Williams, R.A. (1994). Delivering The Promise. World Class Design to
Manufacture, 1(1), pp. 33–38.
Yenginol, F. (2000). Quality Function Deployment in Product Development Process:
Technical Characteristics of Customers’ Requirements and Needs. Doctorate Thesis,
Dokuz Eylül University, Institute of Social Sciences (unpublished).
Young, B.J. (1981). Managing Quality in Staff Areas. Quality Progress, 22(10), pp.
87-91.
Zairi, M. (1995). Quality Function Deployment – A Main Pillar for Successful Total
Quality Management and Product Development. International Journal of Quality
and Reliability Management, 12(6), pp. 9-23.
Zeithaml, V. A. (1981). How Consumers’ Evaluation Processes Differ Between
Goods and Services. Marketing of Services, American Marketing Association, pp.
186-90.
Zeithaml, V. A., Parasuraman, A. and Berry, L.L. (1990), Delivering Quality
Service. New York: Free Press.
Zeithaml, V.A., Parasuraman, A. and Berry, L.L. (1988). SERVQUAL: A Multiple-
Item Scale for Measuring Consumer Perceptions of Service Quality. Journal of
Retailing, 64, pp.1-9.
Zhao, X., Bai, C. and Hui, Y. (2002). An empirical Assessment and application of
SERVQUAL in a Mainland Chinese Department Store. Total Quality Management,
pp. 241-254.

136
APPENDIXES
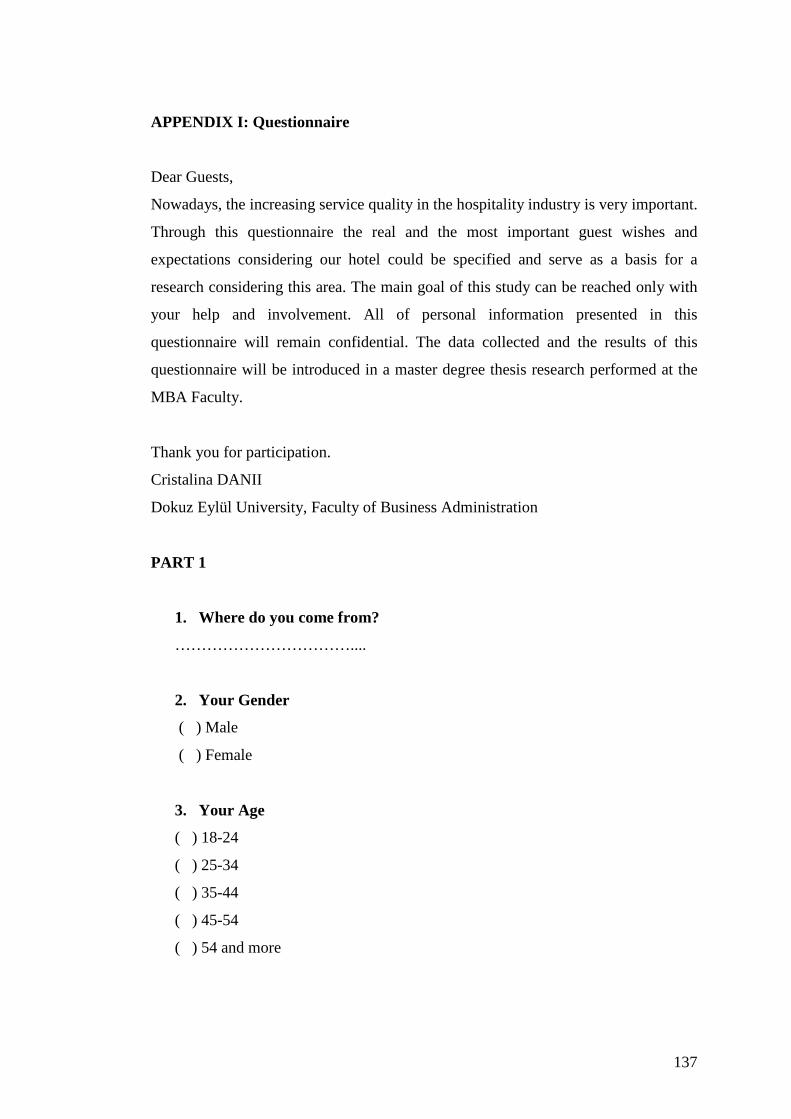
137
APPENDIX I: Questionnaire
Dear Guests,
Nowadays, the increasing service quality in the hospitality industry is very important.
Through this questionnaire the real and the most important guest wishes and
expectations considering our hotel could be specified and serve as a basis for a
research considering this area. The main goal of this study can be reached only with
your help and involvement. All of personal information presented in this
questionnaire will remain confidential. The data collected and the results of this
questionnaire will be introduced in a master degree thesis research performed at the
MBA Faculty.
Thank you for participation.
Cristalina DANII
Dokuz Eylül University, Faculty of Business Administration
PART 1
1. Where do you come from?
……………………………....
2. Your Gender
( ) Male
( ) Female
3. Your Age
( ) 18-24
( ) 25-34
( ) 35-44
( ) 45-54
( ) 54 and more

138
4. Your Profession
( ) Manager
( ) Worker
( ) Retired
( ) Own business
( ) Student
( ) No working
( ) Other ……………….
5. Your Education
( ) Elementary School
( ) High school
( ) University
( ) Master Degree
( ) Doctorate
( ) Other …………………....
6. How often do you spend your holiday in our hotel?
( ) Less often than once in 2-3 years
( ) Once in few years
( ) Once in a year
( ) More than once in a year
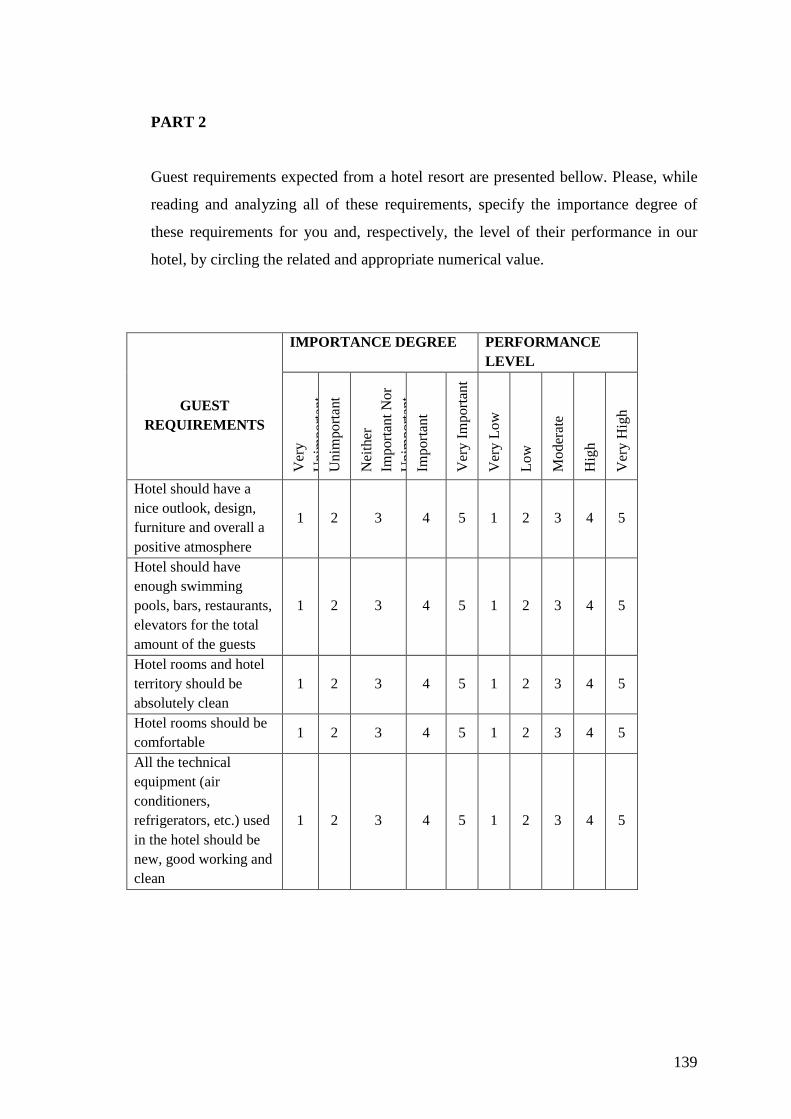
139
PART 2
Guest requirements expected from a hotel resort are presented bellow. Please, while
reading and analyzing all of these requirements, specify the importance degree of
these requirements for you and, respectively, the level of their performance in our
hotel, by circling the related and appropriate numerical value.
GUEST
REQUIREMENTS
IMPORTANCE DEGREE PERFORMANCE LEVEL
Ver
y U
nim
port
ant
Uni
mpo
rtan
t
Nei
ther
Im
port
ant N
or
Uni
mpo
rtan
t Im
port
ant
Ver
y Im
port
ant
Ver
y Lo
w
Low
Mod
erat
e
Hig
h
Ver
y H
igh
Hotel should have a nice outlook, design, furniture and overall a positive atmosphere
1 2 3 4 5 1 2 3 4 5
Hotel should have enough swimming pools, bars, restaurants, elevators for the total amount of the guests
1 2 3 4 5 1 2 3 4 5
Hotel rooms and hotel territory should be absolutely clean
1 2 3 4 5 1 2 3 4 5
Hotel rooms should be comfortable
1 2 3 4 5 1 2 3 4 5
All the technical equipment (air conditioners, refrigerators, etc.) used in the hotel should be new, good working and clean
1 2 3 4 5 1 2 3 4 5
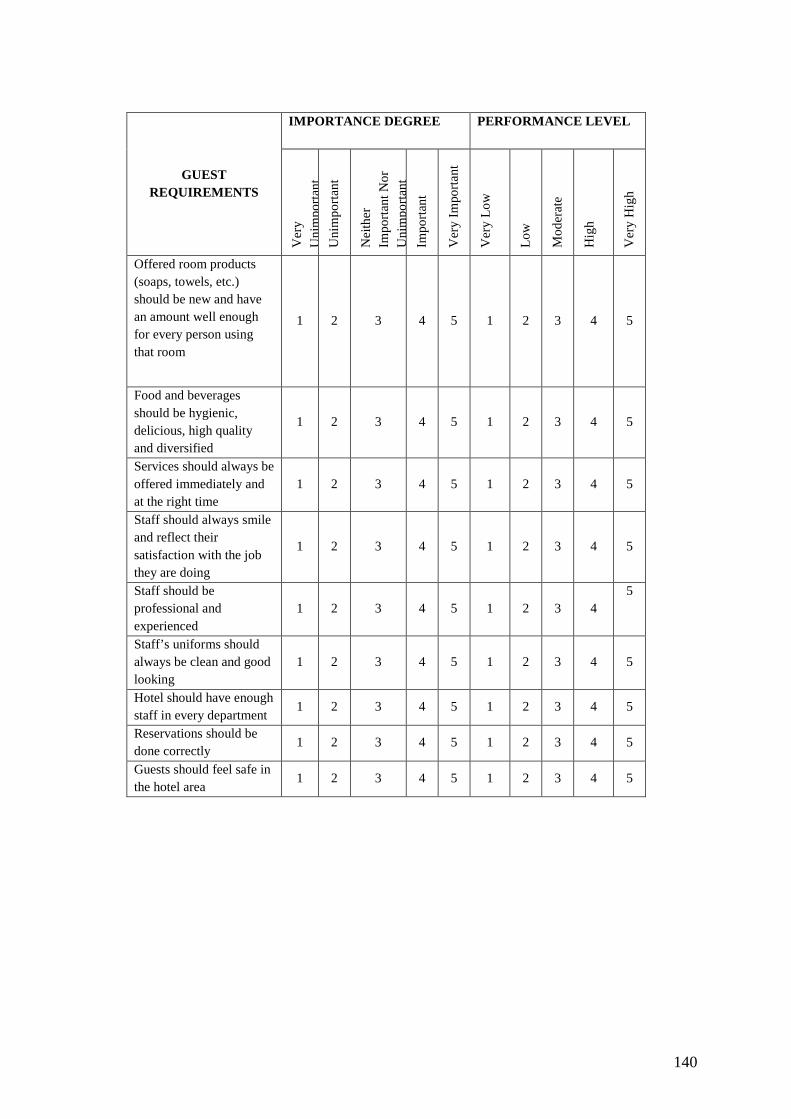
140
GUEST REQUIREMENTS
IMPORTANCE DEGREE PERFORMANCE LEVEL
Ver
y U
nim
po
rtan
t
Un
imp
ort
ant
Nei
ther
Im
po
rtan
t No
r U
nim
po
rtan
t
Imp
ort
ant
Ver
y Im
port
ant
Ver
y L
ow
Lo
w
Mo
der
ate
Hig
h
Ver
y H
igh
Offered room products (soaps, towels, etc.) should be new and have an amount well enough for every person using that room
1 2 3 4 5 1 2 3 4 5
Food and beverages should be hygienic, delicious, high quality and diversified
1 2 3 4 5 1 2 3 4 5
Services should always be offered immediately and at the right time
1 2 3 4 5 1 2 3 4 5
Staff should always smile and reflect their satisfaction with the job they are doing
1 2 3 4 5 1 2 3 4 5
Staff should be professional and experienced
1 2 3 4 5 1 2 3 4 5
Staff’s uniforms should always be clean and good looking
1 2 3 4 5 1 2 3 4 5
Hotel should have enough staff in every department
1 2 3 4 5 1 2 3 4 5
Reservations should be done correctly
1 2 3 4 5 1 2 3 4 5
Guests should feel safe in the hotel area
1 2 3 4 5 1 2 3 4 5
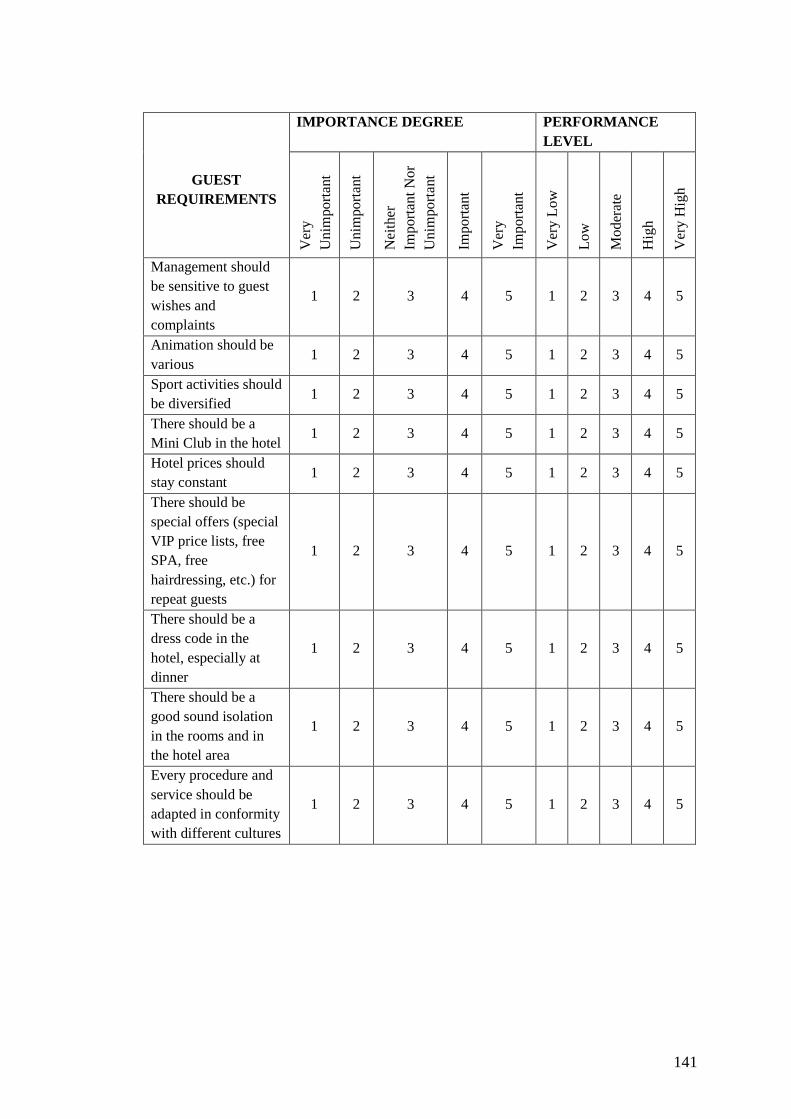
141
GUEST REQUIREMENTS
IMPORTANCE DEGREE PERFORMANCE LEVEL
Ver
y U
nim
port
ant
Uni
mpo
rtan
t
Nei
ther
Im
port
ant N
or
Uni
mpo
rtan
t
Impo
rtan
t
Ver
y Im
port
ant
Ver
y Lo
w
Low
Mod
erat
e
Hig
h
Ver
y H
igh
Management should be sensitive to guest wishes and complaints
1 2 3 4 5 1 2 3 4 5
Animation should be various
1 2 3 4 5 1 2 3 4 5
Sport activities should be diversified
1 2 3 4 5 1 2 3 4 5
There should be a Mini Club in the hotel
1 2 3 4 5 1 2 3 4 5
Hotel prices should stay constant
1 2 3 4 5 1 2 3 4 5
There should be special offers (special VIP price lists, free SPA, free hairdressing, etc.) for repeat guests
1 2 3 4 5 1 2 3 4 5
There should be a dress code in the hotel, especially at dinner
1 2 3 4 5 1 2 3 4 5
There should be a good sound isolation in the rooms and in the hotel area
1 2 3 4 5 1 2 3 4 5
Every procedure and service should be adapted in conformity with different cultures
1 2 3 4 5 1 2 3 4 5