CREATING MARKETS IN KENYA - International Finance ...
134
CREATING MARKETS IN KENYA Unleashing Private Sector Dynamism to Achieve Full Potential COUNTRY PRIVATE SECTOR DIAGNOSTIC
-
Upload
khangminh22 -
Category
Documents
-
view
4 -
download
0
Transcript of CREATING MARKETS IN KENYA - International Finance ...
CREATING MARKETS IN KENYA
CREATING MARKETS IN KENYAUnleashing Private Sector Dynamism to Achieve Full Potential
COUNTRY PRIVATE SECTOR DIAGNOSTIC
COU
NTRY PR
IVATE SECTOR D
IAGN
OSTIC

CREATING MARKETS IN KENYA
Unleashing Private Sector Dynamism to
Achieve Full Potential
COUNTRY PRIVATE SECTOR DIAGNOSTIC

About IFC
IFC—a sister organization of the World Bank and member of the World Bank Group—is the largest global development institution focused on the private sector in emerging markets. We work with more than 2,000 businesses worldwide, using our capital, expertise, and influence to create markets and opportunities in the toughest areas of the world. In fiscal year 2018, we delivered more than $23 billion in long-term financing for developing countries, leveraging the power of the private sector to end extreme poverty and boost shared prosperity. For more information, visit www.ifc.org
© International Finance Corporation 2019. All rights reserved.2121 Pennsylvania Avenue, N.W.Washington, D.C. 20433www.ifc.org
The material in this report was prepared in consultation with government officials and private sector in Kenya and is copyrighted. Copying and/or transmitting portions or all of this work without permission may be a violation of applicable law. IFC does not guarantee the accuracy, reliability or completeness of the content included in this work, or for the conclusions or judgments described herein, and accepts no responsibility or liability for any omissions or errors (including, without limitation, typographical errors and technical errors) in the content whatsoever or for reliance thereon.
The findings, interpretations, views, and conclusions expressed herein are those of the authors and do not necessarily reflect the views of the Executive Directors of the International Finance Corporation or of the International Bank for Reconstruction and Development (the World Bank) or the governments they represent.
This publication uses U.S. spelling. All mentions of dollars refer to U.S. dollars, unless otherwise indicated.
Photos: Cover, Dasan Bobo/World Bank; pp. 3 and 19, Peter Kapuscinski/World Bank; p. 14, shujaa_777/Adobe Stock; p. 27, Georgina Goodwin/World Bank; p. 42, kyslynskyy/Adobe Stock; p. 48, Dominic Chavez/IFC; pp. 52–
53, Anna Koblanck/IFC; p. 56, Sudha Bala Krishnan/IFC.

Acknowledgments viAbbreviations vii
OVERVIEW 2
01 COUNTRY CONTEXT 15
02 STATE OF THE PRIVATE SECTOR 18Although the Macroeconomic Environment Is Stable, Challenges to Private Investment Remain 18Innovation and Entrepreneurship 21Investment Performance 22Trade Performance 24
03 CROSS-CUTTING CONSTRAINTS TO PRIVATE SECTOR DEVELOPMENT 26Business Environment 26Competition Policy and Barriers to Market Entry 30Informality 34
04 ENABLING SECTORS 36Finance and Insurance 37Energy 42Transport 45Information and Communication Technologies (ICTs) 48Health 51
05 DEEP DIVES 57Agribusiness 58Affordable Housing 70Manufacturing 82
06 CONCLUSION 101
Notes 103References 104
APPENDIXES A STATE-OWNED ENTERPRISES 108B PHARMACEUTICALS DEEP DIVE 110
Notes 129References 130
CONTENTS

iv contents
BOXES2.1 Firm-level innovation and its impact
on productivity 213.1 Variation in productivity among
informal businesses and major obstacles for its improvement 35
4.1 Developments on interest rate controls in Kenya 40
5.1 The Better Life Farming Alliance 605.2 Cold chain investment opportunities 605.4 Sunny Processors 655.5 Olivado 655.6 Avoiding the fate of Isiolo abattoir 685.7 Affordable housing under the Big
Four agenda 715.8 Potential entry strategies in the
automotive industry 1006.3 Twiga Foods 62B.1 Mexico’s COFEPRIS: Establishing
regional leadership in regulatory excellence 120
B.2 Scale matters: lessons from India and Bangladesh 123
B.3 Industry-oriented skills for pharmacists: lessons from South Asia 125
FIGURES1.1 Selected Growth indicators, Kenya
and EAC peers, 2010–17 162.1 Kenya’s fiscal policy has been
expansionary 202.2 With interest caps, banks
reallocated their portfolios in favor of the public sector 20
2.3 Private investment’s contribution to growth decelerated 20
2.4 Foreign direct investment inflows ($) 222.5 Net FDI in perspective, Kenya and
East African peers 232.6 Kenya's Exports, 2016 243.1 Overall Doing Business ranking,
Kenya and Sub-Saharan Africa comparators, 2019 28
3.2 Global Competitiveness Index ranking, Kenya and Sub-Saharan Africa comparators 29
3.3 Economywide PMR score 313.4 Business risks related to weak
competition, 2018 314.1 Growth in private sector credit 384.2 NPLs in the EAC 394.3 Peak demand and customer
consumption trend 43
4.4 ICT in Kenya and Sub-Saharan Africa: Selected performance indicators 49
5.1 Agricultural exports, 2013 585.2 Key trade indicators for the
agriprocessing sector, Kenya and comparators, 2013 61
B6.3.1 Twiga Foods’ Distribution infrastructure 62
5.3 Maize and sugar dominate an otherwise widely diverse range of crop production in Kenya 64
5.4 Kenya’s affordable housing strategy and the targeted beneficiaries 70
5.5 Housing sector supply: “Inverted” pyramid 72
5.6 Kenya household income, tenure distribution, and housing 73
5.7 Benchmarked housing costs, Nairobi, Kenya, Johannesburg, South Africa, and Kigali, Rwanda, 2018 76
5.8 Contribution of the top five materials categories in Kenyan housing typologies 77
5.9 Fastest-growing manufacturing subsectors, exhibiting double-digit growth, 2009–16 82
5.10 Top-three importers to Kenya by product, 2009–16 84
5.12 Performance of selected Kenyan exports compared to global growth 84
5.13 Manufacturing value added, Kenya and comparator countries 85
5.14 Regional export comparison, Kenya and EAC comparators 86
5.15 Exports of Kenyan leather handbags, travelware, and corporate items 96
5.16 Total export value of Kenya’s leather products 96
5.17 Output performance of leather 97A.1 Share of SOEs in subsectors, Kenya
and average for 71 countries, 2019 108B. 1 Pharmaceutical sector’s
contribution to Kenya’s Vision 2030 110B.2 Size of national pharmaceutical
markets in the EAC 111B. 3 Decomposition of procured
essential medicines by country of origin, 2012–13 112
B. 4 Labor productivity in the pharmaceutical sector by country, 2014 112
B. 5 Kenya’s Economic Complexity for Pharmaceuticals 113
vKENYA COUNTRY PRIVATE SECTOR DIAGNOSTIC
B. 6 Value chain of the Kenyan pharmaceutical sector 114
B. 7 Distribution of costs for local manufacturing of medicines in Kenya 114
B. 8 Why Kenya has a low supply of high-quality affordable medicines? 116
B. 9 Overview of compliance of participating companies to key quality elements of GMP 116
B. 10 Average postmanufacturing price markups of medicines in emerging markets at each stage of the supply chain 118
B. 11 Proposed actions to increase supply of high-quality affordable medicines in Kenya 119
ILLUSTRATION B. 1 A spectrometer being used for API
testing at a Kenyan manufacturer during an IFC-led field visit, May 2018 121
MAPS4.1 Kenya’s transport infrastructure 455.1 Agricultural zones in Kenya 69
TABLESO. 1 Selected recommendations for
addressing key cross-cutting constraints 6O. 2 Recommendations for addressing
enabling sectors’ policy issues 103.1 Sector-specific competition restrictions 324.2 Pathways forward in reforming the
ICT sector 505.1 Market opportunities, impact, and
investment potential across key Kenyan value chains 66
5.2 Indicative housing costs and household affordability assuming full land and infrastructure subsidy, 2018 74
5.4 Kenya ranked against benchmark countries 87
5.5 National industrialization policy and development time frame 92
6.1 Sector Deep Dives: Recommendations for addressing policy issues 102
A.1 SOE participation and presence of top business groups 109
B.1 Incentives package for local production of medicines in Kenya, Ethiopia, China, and India 122
B. 2 Proposed Action Plan for Kenya’s Pharmaceuticals Sector 128

ACKNOWLEDGMENTS
The Kenya Country Private Sector Diagnostic was prepared by a World Bank Group core team led by Karen Grigorian (Senior Private Sector Specialist, Finance, Competitiveness, and Innovation Global Practice) and Stephan Dreyhaupt (Principal Economist, International Finance Corporation) and included Asta Bareisaite (Private Sector Specialist), Steven Farji Weiss (Economist), and Tigere Muzenda (Investment Officer).
The team would like to thank Mona Haddad (Director), Felipe Jaramillo (Country Director), Jumoke Jagun-Dokunmu (Regional Director), Mary Hallward-Driemeier (Senior Economic Adviser), Manuel Moses (Country Manager), Lisa Kaestner (Practice Manager), Niraj Verma (Practice Manager), Catherine Masinde (Practice Manager), Johan A. Mistiaen (Program Leader), Helene Monika Carlsson Rex (Program Leader), Gandham N. V. Ramana (Program Leader), and Vincent Palmade (Lead Economist) for their continued support and strategic guidance. The team would also like to thank the peer reviewers Martha Licetti (Practice Manager), Gokhan Akinci (Lead Private Sector Specialist), and Gabi George Afram (Lead Financial Sector Economist). The team is also grateful to Leah Okoth (Program Assistant) and Lydia Waribo (Executive Assistant) for unfailing administrative support.
The following team members contributed to the sectoral deep dives: agribusiness led by Hans Schrader (Senior Private Sector Specialist) and William Llewelyn Davies (Senior Operations Officer); manufacturing led by Etienne Raffi Kechichian (Senior Private Sector Specialist) and Sumit Manchanda (Senior Private Sector Specialist) and included Anzetse Were (Consultant) and Karibu Nyaggah (Consultant); pharmaceuticals led by Sudha Bala Krishnan (Operations Officer)
and Anouk Violette Pechevy (Operations Analyst); enabling sectors included Ana Maria Torres (Senior Operations Officer), Aleksandra Liaplina (Consultant), Mahjabeen N. Haji (Consultant); and affordable housing led by the Centre for Affordable Housing Finance and included Mbui Wagacha (Consultant).
The deep dives also benefitted from the substantial inputs of the extended team members and colleagues, including: Tania Priscilla Begazo Gomez (Senior Economist), Lev Freinkman (Consultant), Maria Paulina Mogollon (Senior Sector Economist), William Britt Gwinner (Principal Operations Officer), Cecilia Maria Paradi Guilford (Private Sector Specialist), Caroline Cerruti (Senior Financial Sector Specialist), Sarah Ochieng (Senior Private Sector Specialist), Frank Twagira (Senior Private Sector Specialist), Aref Adamali (Senior Private Sector Specialist), Peter Farup Ladegaard (Lead Private Sector Specialist), Lars Grava (Senior Private Sector Specialist), Tania Ghossein (Senior Private Sector Specialist), Hadija Kamayo (Financial Sector Specialist), Thierno Habib Hann (Senior Housing Finance Specialist), Godfrey Danisa Tapela (Senior Investment Officer), and Paul Levy (Consultant).
The team is also grateful to all IFC investment officers, World Bank experts, and leading government and private sector representatives who generously shared their time and insights.

ABBREVIATIONSABTs alternative building technologiesAfCFTA African Continental Free Trade AreaAGOA Africa Growth and Opportunity ActAPI active pharmaceutical ingredientASAL arid and semiarid landAVA Associated Vehicle AssemblersCAGR compound annual growth rateCAHF Centre for Affordable Housing Finance
in AfricaCAK Competitive Authority of KenyaCBK Central Bank of KenyaCESS inter-country transport chargesCMA Capital Markets AuthorityCMAW Creating Markets Advisory WindowCOMESA Common Market for Eastern and
Southern AfricaCPSD Country Private Sector DiagnosticEAC East African CommunityEPZ export processing zoneERC Energy Regulatory CommissionEU European UnionFBO faith-based organizationFDI foreign direct investmentGCI Global Competitiveness IndexGDP gross domestic productGMP Good Manufacturing PracticesGPP Good Pharmacy PracticeHDI Human Development IndexICT information and communication
technologyIDA-PSW International Development
Association–Private Sector WindowIFC International Finance CorporationIMS information management systemsIRA Insurance Regulatory AuthorityJICA Japan International Cooperation
AgencyKEMSA Kenya Medical Supply AuthorityKEPSA Kenya Private Sector AllianceKETRACO Kenya Electricity Transmission
CompanyKITP Kenya Industrial Transformation
Program
KNBS Kenya National Bureau of StatisticsKPLC Kenya Power and Lighting CompanyKMRC Kenya Mortgage Refinance CompanyKVM Kenya Vehicle ManufacturerskWh kilowatt hourLPI Logistics Performance IndexMEDS Mission for Essential Drugs and
SuppliesMSEs micro and small enterprisesMSMEs micro, small, and medium enterprisesMT metric tonMTP-III Third Medium-Term PlanMVA market value addedNAFDAC Nigeria, National Agency for Food
and Drug Administration and ControlNER net enrollment rateNGO nongovernmental organizationNHIF National Health Insurance FundNMRA National Medicines Regulatory
AuthorityNPL nonperforming loanNQCL National Quality Control LaboratoryNSE Nairobi Stock ExchangeNTB nontariff barrierNTF National Toll FundOECD Organisation for Economic
Co-operation and DevelopmentOOP out-of-pocketPPA power purchase agreementPMR Product Market RegulationPPB Pharmacy and Poisons BoardPPP public-private partnershipQMS quality management systemR&D research and developmentSACCO savings and credit cooperativeSEZ special economic zoneSME small and medium enterpriseSOEs state-owned enterprisesSTI science, technology, and innovationTVET technical and vocational education and
trainingUCL Universal Corporation LimitedUHC universal health coverage

viii abbreviations
UN United NationsUNIDO United Nations Industrial Development
OrganizationUSAID United States Agency for International
DevelopmentUSP U.S. PharmacopeiaVAT value added tax


Kenya has the opportunities and resources to stimulate sustainable economic growth and development, but its potential has been constrained by underinvest-ment and low firm-level productivity. Altogether, its development has not been sufficiently sustainable or equitable to transform the lives of ordinary citizens. Poverty remains high, with 36 percent of Kenyans living under the national poverty line, whereas the richest 10 percent of the population receive 40 percent of the nation’s income. This Country Private Sector Diagnostic (CPSD) sheds light on how the private sector can more effectively contribute to advancing the country’s developmental goals. Applying a sectoral lens, it puts forward operational recommendations highlighting strategic entry points for diversification and growth and addresses key constraints to private sector engagement. It also seeks to inform World Bank and IFC strategies, paving the way for joint programming to create markets and unlock private sector potential.
Kenya’s Development Goal: Create a Globally Competitive and Prosperous Country
The government of Kenya has high aspirations to build a better future for all Kenyans. Kenya needs to boost economic growth sustainably, create more jobs for young people, and build vital infrastructure to tackle extreme poverty and boost shared pros-perity. Vision 2030 is the government’s long-term development plan. It aims to transform Kenya into an industrialized, middle-income country that pro-vides a high quality of life to all its citizens by 2030.
To that end, the country has undertaken significant political, structural, and economic reforms that have driven economic growth, social development, and political gains over the past decade.
To fast track its economic development, the Kenyan government launched the Big Four agenda in 2017. It focuses on four pillars — food security, affordable housing, manufacturing, and universal health coverage — and aims to enable and accelerate job creation, economic growth, and social safety nets. In manufacturing, the administration intends to boost four subsectors: the so-called blue economy,1 agriprocessing, leather, and textiles.
A Potential to Become an African Success Story
To achieve its ambitious development goals, Kenya can build on strong fundamentals. First, its economy is already the largest in East and Central Africa. It enjoys many opportunities for trade, facilitated by the Africa Growth and Opportunity Act (AGOA) of the U.S. and the upcoming African Continental Free Trade Area (AfCFTA). Second, the country’s labor force is strong, English-speaking, and rooted in a youthful and growing population. Third, Kenya has good infrastructure and is a major communica-tions and logistics hub. Fourth, its 2010 Constitution laid out the groundwork for effective political and economic governance, with stronger accountability and public service delivery at the local level. Finally, it has a diverse and dynamic private sector — the focus of this report — backed by solid financial markets that has largely driven Kenya’s broad-based growth
OVERVIEW

4 overview
and could yield significant development dividends if the main barriers to private sector expansion are eliminated.
Kenya has a large and diverse private sector that is well-positioned to drive economic growth. The vitality and resilience of its private sector had tradi-tionally been one of the country’s strengths, enabling it to develop a diversified economy. It contributes over 80 percent of gross domestic product (GDP), 70 percent of total employment, and the bulk of export earnings. Indeed, the Kenyan economy is well diversified, boasting a major regional financial center in Nairobi, the fourth-largest stock market on the continent by trade volumes, a large manufacturing sector, a dynamic tourism market, and Africa’s largest exporter of agricultural products such as tea and horticulture.
Moreover, the Kenyan private sector has shown immense resilience through times of considerable political uncertainty and security constraints. Although 2017 is characterized by a prolonged and uncertain electoral period, which slowed overall economic performance, the Kenyan private sector nonethe-less posted sustained growth across key sectors. For instance, output in information and communication technology (ICT) increased by 10.9 percent, transport and storage by 8.8 percent, and construction and real estate by 8.6 percent. Such stellar performance in the presence of adverse shocks demonstrates the strength and competitiveness of the Kenyan private sector, which is, to some extent, unparalleled in the East African region.
Greater regional and global opportunities provide a favorable backdrop to boost the Kenyan economy and help it deliver on the Big Four objectives. The AfCFTA provides a significant opportunity to boost trade, competitiveness, and welfare. The agreement aspires to liberalize trade among African countries and, by doing so, stimulate exports, competitiveness, and innovation, as well as foster regional value chains that can facilitate integration into the global economy. Kenya is expected to reap substantial benefits from the agreement in terms of welfare gains (1 percent of GDP) and additional growth of GDP (2 percent) and exports (5.7 percent), though incurring in small revenue losses (-0.3 percent). Other market opportu-nities include the United States, under the AGOA, and China. However, complementary policies, including trade facilitation, reduction of nontariff measures, and improved regulatory transparency, remain necessary to maximize the gains from trade agreements.
Overcoming Critical Constraints to Building a Competitive, Inclusive, and Dynamic Private Sector
To realize these opportunities, there is an urgent need to address critical constraints to private sector develop-ment and investment. To unleash the dynamism of the private sector, the government must take decisive steps to address structural obstacles to economic growth, for example, infrastructure deficiencies, skills shortages, supply chain issues, as well as key cross-cutting con-straints — especially those pertaining to the enabling environment to market entry and competition and the formal-informal duality of the economy. Specifically, this CPSD suggests the following cross-cutting reform areas to help build a more competitive, inclusive, and dynamic private sector:
1. Enhancing the business enabling environmentDespite improvements to the business environment and reforms on doing business — most notably in the areas of starting a business and construction per-mits — the overall regulatory business environment remains complex, costly, and unpredictable. Kenya inched up in the World Bank’s Doing Business survey, moving from 80th in 2018 to 61st in 2019 (out of 190 countries) and was in third place in Sub-Saharan Africa. However, obstacles remain that could erode Kenya’s economic performance. One indicator is Kenya’s small inflows of foreign direct investment (FDI) relative to the size of its economy, which, according to investor surveys, are a function of infrastructure bottlenecks, skills shortages, political uncertainty, and high levels of crime and corruption. Combined, these factors create a high-cost business environment.
Corruption is one of the most significant problems facing businesses in Kenya. The World Economic Forum Global Competitiveness Report 2017 – 18 ranked Kenya 94th for irregular payments and bribes. Moreover, according to the Worldwide Governance Indicators, Kenya has experienced a steady decline on regulatory quality over the last decade, falling from a percentile rank of 48.5 in 2006 to 41.8 in 2016. This decline is mirrored in challenges related to competition policy, and more broadly, in new rules and regulations being promulgated without sufficient grounding in evidence or consideration of alterna-tives to traditional command-and-control regulation. The Statutory Instruments Act of 2013 constituted progress in establishing a more systemic approach to regulatory quality, but the lack of a more complete

5KENYA COUNTRY PRIVATE SECTOR DIAGNOSTIC
institutional and procedural framework for regulatory impact assessments severely hampers implementation.
Macroeconomic imbalances and subsequent policy choices are hampering private investment. The rapid expansion in government spending in recent years has kept yields on benchmark government securities elevated. Monetary policy also remains compromised with the cap on interest rates tied to the policy rate.2 Over the past year, the policy rate has been reduced by some 100 basis points. Although this has helped
“blue-chip” Kenyan borrowers (such as government and large corporates), small and medium enterprises (SMEs) — the backbone of the Kenyan economy — con-tinue to suffer given the higher risk premium attached to them. Consequently, there has been a growing shift in lending from the private sector to the government with an increase from an average of 9.2 percent in 2016 to 19.9 percent in 2017, whereas average growth in credit to the private sector declined from 9.1 percent to 2.3 percent over the same horizon. As a result, the contribution from private investment has been negative in recent years, declining from 1.3 percent-age points of GDP in the four years leading to 2013 to -0.3 percentage points in the four years leading to 2017 (a swing of 1.6 percentage points of GDP). Based on sectoral growth performance (assuming constant growth in labor supply and technology), the sectors that have contributed to the weak private sector growth are agriculture, manufacturing, and trading activities. Private investment appears to have been expanding more rapidly in the real estate and transportation sectors.
2. Strengthening competition policy and removing barriers to market entry
Kenyan markets are facing relatively high levels of government intervention in areas where the pri-vate sector already has a significant presence and is burdened by immense regulatory requirements for entering new markets. Kenya lags comparator countries on reducing barriers to market entry and effective operations. The country lacks effective rules to facilitate entry, contestability, and effective domestic competition, which has dampened investment. Direct competition from state-owned enterprises (SOEs), links between competing firms through partial government shareholding, and a lack of competitive neutrality given limited de facto separation of regulatory and commercial activities in sectors such as electricity, air transport, telecommunications, and agriculture can crowd out the private sector (particularly new
investors), further limiting opportunities for socially impactful market creation.
Kenya has a broad presence of SOEs including in sectors where private participation is viable. Kenya scores higher than Organisation for Economic Co-operation and Development (OECD) and other middle-income countries on the degree of state intervention.3 The country registers SOEs4 in at least 17 sectors com-pared with an average of 15.4 in OECD countries, including in sectors where there is active private sector participation such as retail, accommodation, manu-facturing, banking, insurance, and agriprocessing. In enabling sectors that provide essential inputs to the rest of the economy (electricity, transport, finance, telecommunications, and educations) and where natural monopolies and SOEs are important, the effectiveness in achieving policy goals in terms of affordability and access to quality services is limited, affecting the costs for enterprises in traded sectors. SOEs also generate a significant burden on fiscal accounts, running deficits particularly in agriculture, health and communications, and debt — particularly on railways and electricity — amounting to 7 percent of GDP in 2016.
3. Linking the formal and informal sectorsKenya’s private sector dynamism is held back by a pronounced formal-informal dualism. In Kenya, larger formal businesses produce the bulk of eco-nomic output, but micro and small enterprises in the informal sector employ most working Kenyans. Informal firms in Kenya make up most businesses and entrepreneurs (95 percent) and are the largest source of employment, employing nearly 70 percent of workers outside farming. However, they are generally engaged in lower value-added activities, with poor access to capital and technology, limited connectivity to global supply chains, and slow utilization of market opportunities. As a result, there has been a significant productivity gap with the formal sector. Any private sector development strategy for Kenya must address the importance of the informal sector and the need to strengthen its links with to formal sector.
Table O.1 is a summary of the main recommenda-tions for addressing these cross-cutting constraints. Chapter 3 provides a full list of constraints and recommendations.
6 overview
Enabling Sectors Critical for Kenya’s Growth
To overcome structural deficiencies related to input factors, support infrastructure, pressing social issues, growth, and employment, Kenya’s enabling sectors play a critical role. This CPSD identified the following pathways to stimulate Kenya’s development agenda:
Increasing Reliability of Electricity Supply through Private ProvisionThe energy sector is a critical enabler of the economy, with the cost and reliability of electricity serving as key input to all other sectors of the economy, directly and indirectly impacting growth and job creation across the country. Kenya already has an advanced energy sector structure, with a significant and growing presence of independent power producers (IPPs), unbundling and partial privatization of national utilities, and cost-re-flective tariffs. At the same time, the government is focused on new electricity generation infrastructure and new generation capacity to support the Vision
2030 program. Electricity generation already shows a strong upward trend, underpinned by new investments from both the state and private investors. In the past, Kenya has attracted significant private participation in power generation. There are 10 IPPs that generate power across 15 plants — three small-scale hydro plants, one geothermal plant, one biomass plant, and 10 fuel-oil plants — which account for about 30 percent of installed generation capacity (over 658 megawatts) in the country. The remaining 70 percent of capacity is owned and operated by KenGen. Demand for energy is strong, helped by the expansion of the electricity grid, including into rural areas. Power available for distribution increased by 5.8 percent per year on average in the 2010 – 17 period — and quickened to 8.1 percent year-on-year in the first half of 2018 — outpacing growth in the wider economy.
However, blackouts are frequent and affordability remains a concern. Firms pay high energy costs at $0.21 per kilowatt hour (kWh) (versus $0.18/kWh in Nigeria, $0.10/kWh in South Africa, and $0.08/kWh in China and India), with the electricity bill account-
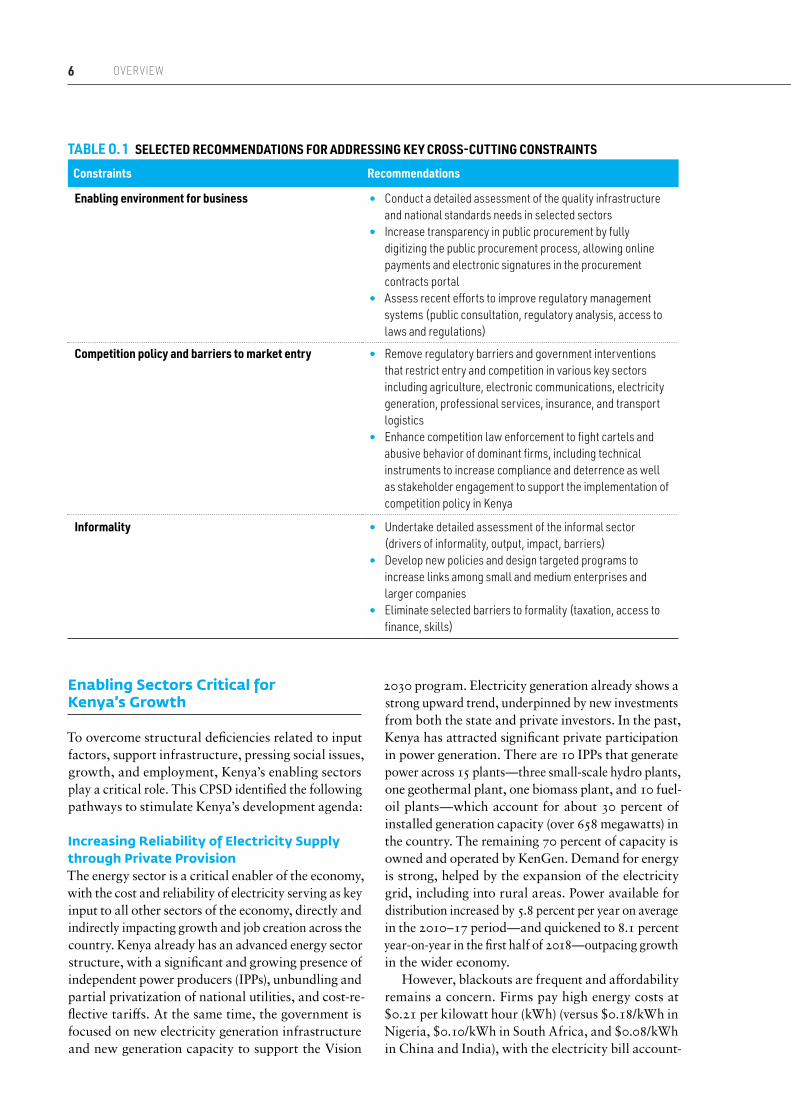
TABLE O. 1 SELECTED RECOMMENDATIONS FOR ADDRESSING KEY CROSS-CUTTING CONSTRAINTS
Constraints Recommendations
Enabling environment for business • Conduct a detailed assessment of the quality infrastructure and national standards needs in selected sectors
• Increase transparency in public procurement by fully digitizing the public procurement process, allowing online payments and electronic signatures in the procurement contracts portal
• Assess recent efforts to improve regulatory management systems (public consultation, regulatory analysis, access to laws and regulations)
Competition policy and barriers to market entry • Remove regulatory barriers and government interventions that restrict entry and competition in various key sectors including agriculture, electronic communications, electricity generation, professional services, insurance, and transport logistics
• Enhance competition law enforcement to fight cartels and abusive behavior of dominant firms, including technical instruments to increase compliance and deterrence as well as stakeholder engagement to support the implementation of competition policy in Kenya
Informality • Undertake detailed assessment of the informal sector (drivers of informality, output, impact, barriers)
• Develop new policies and design targeted programs to increase links among small and medium enterprises and larger companies
• Eliminate selected barriers to formality (taxation, access to finance, skills)

7KENYA COUNTRY PRIVATE SECTOR DIAGNOSTIC
ing for a disproportionate amount of total operating expense — in some cases over 50 percent according to the World Bank Enterprise Survey. Similarly, fre-quent power outages, which affect up to 90 percent of firms, undermine productivity and increase the costs of doing business, with many businesses and residential complexes opting for secondary, local power generation capacity.
Beyond the optimization of the planning process, financial resources will be needed to meet the govern-ment’s objective of doubling the electrification rate over the next four years. If private participation and market competition are to be bolstered, new primary and secondary legislation will likely be required, as well as capacity building for the Energy Regulation Commission and the Ministry of Energy. This will help ensure that market mechanisms are designed to promote rational, fair, and transparent competition among the market players.
Enabling Access to Finance for Small Businesses, Infrastructure, and HousingThe financial sector is a crucial backbone that drives the Kenyan economy. However, it is struggling to fulfil its function primarily because of two constraints: (1) low availability of “affordable” credit to businesses, especially SMEs, and (2) scarcity of long-term finance.
Significant gaps in access to finance for micro, small, and medium enterprises (MSMEs) hinder firms’ growth and productivity in Kenya. Private credit growth has slowed significantly, falling from its peak of about 25.0 percent in mid-2014 to its lowest level in over a decade of 1.6 percent by mid-2017. However, in the first half of 2018, it improved, going up to 4.3 percent. This growth is attributed to an improving economy, with the country’s GDP increasing to 5.7 percent in the first quarter of 2018 from 4.9 percent in the first quarter of 2017, and a stable political climate. Limited credit availability can hinder robust economic expansion, as has been observed in several economies in Europe and elsewhere after the global financial crisis. This slowdown in credit growth is explained by the introduction of a lending interest rate cap that has proved detrimental to private credit growth. In 2018, the government acknowledged this negative effect and proposed repealing the relevant section in the Banking Amendment Act of 2016 in addition to downgrading the banking sector’s rating to “satisfactory” in 2017, from “strong” in 2016. In March 2019, a high court in Kenya ruled that the law capping interest rates was unconstitutional and suspended the ruling for 12 months to allow lawmakers to reexamine the law.
Long-term finance for infrastructure and hous-ing is critically needed and cannot be met through budgetary resources alone. Addressing Kenya’s infra-structure deficit would require sustained investment of almost $4 billion per year in the medium term, which is about 6.1 to 7 percent of Kenya’s GDP. The cost of the Affordable Housing Strategy alone has been estimated by the State Department for Urban and Housing Development at $21 billion, which is close to the annual budget. Kenya has made prog-ress in developing its local currency domestic capital markets and is ready for demonstration projects in long-term financing. An important priority going forward is to strengthen the management of public debt, to lower yields on government securities, and achieve a reliable yield curve. However, long-term institutional investors are reluctant to engage into new investment areas while they are making comfortable returns on government securities.
Specific reforms to improve the financial architecture that is being addressed through public and private investments include: (1) consolidating all nonbanking regulators into a single financial services authority, (2) modernizing market conduct supervision, (3) improving credit reporting by enhancing transpar-ency in the process, (4) strengthening the regime for moveable collateral, (5) expanding the availability of alternative savings instruments, (6) developing and expanding initiatives aimed at improving liquidity in the housing credit markets, and (7) introducing new instruments to channel financing.
Providing Access to Health Care and Quality Medical ServicesHealth care is a critical enabling sector and is at the top of the country’s development priorities as part of the Big Four program, announced in December 2017. The size of Kenya’s health sector is estimated to be around $3.5 billion, of which around $600 million came from public funds in 2017. According to a health sector public expenditure review (World Bank 2014), about 42 percent of health care was provided privately in 2012, with the rest split among the public sector and donor support and nongovernmental organizations. Out-of-pocket spending remains high, causing many to fall into poverty and posing a barrier to health care access. Many Kenyans do not save or prepay for health care or are not able to do so.
Under the Big Four agenda and Vision 2030, a key deliverable is to achieve universal health cov-erage (UHC) by 2022. UHC refers to a situation where all people receive quality services when needed (promotive, preventive, curative, and rehabilitative

8 overview
health services) without being exposed to financial hardship. It has two main goals: access to quality care as needed and financial risk protection. Implicit are objectives related to equity in access, quality of services, and broader social protection. The govern-ment also looks to reform the governance of private insurance companies and increase the number of community health facilities.
The high-level political commitment presents an opportunity for Kenya to fast-track its progress towards UHC. But key design features of the UHC model are still under development. For example, the Kenyan government has not yet decided on the best financing model to achieve UHC and the appropriate level of health insurance subsidies for the informal sector. It is also not yet clear to what extent can the health system cope with the rapid increase in demand for health services and the roles of the dif-ferent stakeholders in the implementation process. To realize the goal of achieving UHC, the govern-ment has requested the World Bank to support UHC implementation in four counties as a first phase of implementing its vision.
The commitment to UHC and the shift of the government’s role from being a provider of care to a financer would open new opportunities for private sector development and market creation. Over the last six years — through direct intervention and support of initiatives such as Health in Africa — the country has seen increased commitment by the government in engaging and partnering with the private sector for delivery of services towards UHC under Vision 2030. The Kenyan private health sector continues to grow, commanding 50 percent of all goods, services, products, and technologies. At the same time, public investment is held back by fiscal constraints, leaving scope for greater private sector involvement. Smart implementation of the national insurance plan can reap numerous benefits such as equity in health care outcomes irrespective of ability to pay, more risk pooling, and increased ability to leverage private capital to build the much-needed health care delivery infrastructure. It also has the potential to lower overall health care system costs. Moreover, Kenya also seeks to become a medical tourism destination, opening a new range of business opportunities. Prospects for public-private partnerships (PPPs) are favorable in equipment supply, e-health, training and education, health insurance, and the establishment of new private hospitals. Cumbersome regulations, limited health insurance, and a shortage of skilled health workers are challenges, but reforms are expected given the greater urgency now attached to health care.
Enabling Broad-Based Growth through ICTs and TelecommunicationsThe strong growth of Kenya’s ICT sector is facilitating growth in other sectors of the economy by acceler-ating the flow of information and resources (using mobile money). The sector has changed dramatically over the past decade, transitioning to a burgeoning market that has become one of the most vibrant in Africa. Nairobi is recognized as one of Africa’s technology hub cities (along with Lagos, Cape Town, and Accra), with the potential to foster and scale digital ecosystems. The iHub, Kenya’s first technology and innovation lab, was established in March 2010 and has since become the centerpiece of a growing tech community with over 16,500 members. iHub has several initiatives that catalyze growth in the technology community. Kenya now has 27 active technology hubs.5
Vision 2030 recognizes ICT as a foundation of economic development. The government acknowl-edges that inclusive growth at rapid sustained rates would require strong support for innovation, entre-preneurship, ICT, and digital solutions. To this end, the Ministry of Industry, Trade, and Cooperatives has developed the Kenya Industrial Transformation Program to promote the ICT sector by strengthen-ing incubators, accelerators, rapid technology skills training, SMEs, and startups.
Despite its dynamism, the sector still faces numer-ous challenges. First, the absence of clear regulatory framework to promote infrastructure sharing limits efficiency and entry in the telecommunications market. Second, the weak enforcement of necessary policies has failed to reduce the dominance of some operators in the mobile and fixed broadband markets. Third, despite hosting the most advanced ICT sector in East Africa, innovation is held back by institutional weaknesses and public sector capacity constraints, especially in higher education, which is aggravating skills shortages. Kenya is also vulnerable to cybercrime, especially given the proliferation of new services and users, the large sums of money being transferred digi-tally, and the reactive rather than proactive approach toward security.
Addressing competition policy constraints in the ICT sector is critical to further its growth. An important aspect to look at is the facilitation of infrastructure sharing to improve coverage and use of capital. This can only be achieved through the development and implementation of regulations to drive infrastructure sharing, in particular, of cell towers and fiber-optic lines. Similarly, it is critical to improve competition in the mobile and payment system markets. To this

9KENYA COUNTRY PRIVATE SECTOR DIAGNOSTIC
end, a World Bank Group (2015) report suggested that in the wireless telecommunications subsector there was scope for improvement by reducing the switch-ing cost and the porting fee imposed on consumers.
In addition, operators seeking to compete in the telecommunications market require access to radio spectrum. However, Kenya lacks a pro-competi-tive process for spectrum assignment. Policies are needed to efficiently allocate spectrum in a manner that does not limit competition in the provision of communication services., To facilitate competition in mobile payment systems for the benefit of consumers, it is advisable to monitor the effective elimination of exclusive contracts between mobile payment providers and merchants (agents). It is also worthwhile to con-sider mechanisms for facilitating full interoperability among the different mobile payment providers and increasing the transparency of the fees charged for their service. In the mobile telecommunications sector, automating the procedure for number portability should also be a priority.
Connecting Kenya through Transportation InfrastructureThe transport sector is critical to achieving the govern-ment’s Vision 2030, which is calling for $2.1 billion to be spent annually to interconnect the nation’s roads, railways, ports, airports, water and sanita-tion facilities, and telecommunications networks. Kenya has been making considerable headway over the past few years on a development agenda designed to strengthen its position as the leading regional transport and logistics center in East Africa. This is evidenced by the country’s improved ranking in the quality of transport infrastructure, which went from 72nd to 56th in the World Economic Forum’s Global Competitiveness Index.
Nevertheless, Kenya’s infrastructure needs are vast and high transport costs are putting pressure on businesses. The main transport corridor serving Kenya and most of East Africa, the Mombasa-Nairobi Corridor as well as the Mombasa Port, are both still constrained and congested, negatively affecting the movement of freight to and from the country. Constrained mobility within the major cities also imposes significant economic inefficiencies on city economies. According to the World Bank Group’s 2013 Enterprise Survey, Kenyan businesses are particularly affected by the lack of infrastructure, identified as a top constraint for doing business. PPPs for transport infrastructure are yet to be tested. Furthermore, reg-ulatory frameworks need to be updated and properly enforced to ensure efficiency of sole operators (including
improving corporate governance of SOEs), guaran-tee access to key infrastructure by private providers of downstream services, and prevent uncompetitive practices that raise the cost of transport and logistics services. Performance on the World Bank’s Logistics Performance Index deteriorated sharply in the 2016 – 18 period, when Kenya’s ranking dropped from 42nd to 68th out of 160 countries. Most trading, customs, and border-crossing procedures are still essentially manual and relatively complex, negatively affecting the cost of doing business in the country.
Engaging the private sector in the financing and management of transport infrastructure. As the transport network expands in the coming years, it is important to secure private participation in the design, construction, and operation phases as a spate of multibillion-dollar projects break ground. Similarly, government’s divestiture of port and air-port infrastructure financing and management, and divestiture of rail freight services operations and airlines operations, would ease fiscal pressure and improve operational and financial performance of key infrastructure services. Passage of the PPP Act of 2013 provides the legal framework for engaging the private sector on several airport, seaport, highway, and railroad projects considered as priority PPPs.
Deep Dives for Market Creation
The core of this CPSD’s analysis is the identifica-tion of short-term opportunities for market creation, as well as potential for development impact. Based on a careful and analytic process focused on four parameters — development impact, feasibility, current performance, and value addition — three sectors were selected that have great potential for private sector job creation in the next three to five years in both urban and rural settings. These are agribusiness, affordable housing, and manufacturing. The three sectors are also of crucial importance for the econ-omy as a whole — together, they account for almost half of Kenya’s GDP.
Complementarities exist if all three sectors were to takeoff simultaneously. Enhancing the productivity of agriculture would support structural transformation, adding pressure on cities and the need for housing, particularly affordable housing. The need for new building materials and skills in the housing sector could support the manufacturing sector and boost further enterprise and job creation, in addition to the extra local development capacity and labor that will be needed to drive the affordable housing segment.

10 overview
TABLE O. 2 RECOMMENDATIONS FOR ADDRESSING ENABLING SECTORS’ POLICY ISSUES
Sectoral themes Recommendations
Energy • Encourage private participation through PPPs, particularly in transmission
• Build capacity of the Energy Regulatory Commission and the Ministry of Energy
• Implement a wholesale electricity market
Finance and Insurance • Consolidate all nonbanking regulators into a single financial services authority
• Modernize market conduct supervision; improve credit reporting by enhancing transparency in the process
• Strengthen the regime for moveable collateral• Expand the availability of alternative savings instruments• Introduce new instruments to channel financing• Following the high court’s suspended ruling for 12 months,
work closely with lawmakers to reexamine the law on interest rate caps
• Strengthen institutional investors• Improve credit liquidity and products for long-term house-
hold investment (housing)• Enhance connection between SACCOs and formal financial
system
Health • Reform the National Hospital Insurance Fund by addressing structural, financial, policy, and resource constraints to enhance its efficiency and financial stability
• Capitalize on ICT and e-Health technologies to expand offering of health solutions
• Incentivize training among private health care provid-ers — encourage e-learning
• Support investments in the pharmaceuticals subsector to promote high-quality manufacturers, retail chains, consoli-dation in distribution, and logistics
ICT • Establish market-based rules to assign spectrum and prevent distortions in the competitive environment
• In the mobile telecommunications sector, automate the procedure for number portability
Transport • Mobilize private financing for expanding transport networks and managing ports and airports, by prioritizing the most commercially viable in the PPP pipeline
• Set freight and passenger tariffs at sustainable market rates to ensure financial equilibrium
• Introduce sensible road-pricing strategies in key transport corridors where freight movements are highest
Note: PPPs = public-private partnerships; SACCOs = savings and credit cooperatives; ICT = information and communication technology.

11KENYA COUNTRY PRIVATE SECTOR DIAGNOSTIC
Kenya’s pathway to transformation also requires addressing the cross-cutting issues that challenge the overall competitiveness of the private sector and also tackling sector-specific constraints that exist in these three sectors that offer short-term opportunities.
AgribusinessAgribusiness, including agriculture and downstream processing activities, is the largest sector in Kenya’s economy, generating 26 percent of the country’s GDP. The sector has been consistently recognized as a key pillar of the economy, and food security is one of the government’s Big Four priorities. It has significant development impact given high employ-ment and growth multipliers, inclusive job-creation opportunities, and importance for economic resil-ience and stability. However, value added relative to agricultural production is low in Kenya. Numerous opportunities exist — including ICT adoption — that could help unlock productivity and increase regional and global competitiveness of the most promising agribusiness value chains.
Kenya’s land structure, infrastructure, trading posi-tion, and capacity for innovation are the strengths of its agribusiness sector. The land structure lends itself well to productive commercial farming with more developed market systems in comparison to other countries in the region. With a major port in Mombasa, established trade routes, improving rail networks, and reasonable road infrastructure, Kenya is a major logistics and trading hub for East Africa. Furthermore, Kenya’s strong financial and ICT ser-vices sector are driving innovations in agribusiness.
The review included key subsectors to reinforce the sectorwide analysis and better understand specific market needs and constraints. Three subsectors were selected as case studies to represent the potential for investment: (1) avocado, (2) mango, and (3) livestock (specifically meat). These provide more nuanced insights into competitive advantages and constraints in the country. Processing investment, smallholder links, and export promotion provide reform and investment opportunities in the sector.
As Kenya seeks to drive its agricultural transfor-mation, attention will need to focus on improving competitiveness. In particular, this will require:
1. Supporting improved extension services, including building the skills of service providers and shifting input subsidy programs towards subsistence farmers.
2. Supporting farmer aggregation models that pro-mote smallholder links to offtakers, which can
improve access to good farming practices and new technology.
3. Developing public and/or private sector – driven agriaggregation centers that provide value-added services to farmers and processors.
4. Upgrading quality infrastructure for agribusiness, which includes continued access to and support for international certifications, especially organic, to help build value and open markets, and investment in small-scale irrigation schemes.
5. Developing export promotion strategies and build-ing awareness of brand Kenya.
Affordable HousingKenya’s construction sector is on the rise, driven by demographics and expanding middle- and upper-income groups. In 2017, Kenya’s population was estimated to be 48.5 million and is growing at annual rate of 2.6 percent. According to the United Nations, Kenya’s population will grow by about 1 million each year to reach 85 million by 2050. About 32 percent of the population lives in urban areas, which is lower than the rate in other countries in Sub-Saharan Africa.
The high-end housing and commercial real estate subsectors have seen strong growth in recent years. The construction sector is an important driver of economic and employment growth in Kenya. The sector is now set for a further surge with the announce-ment of affordable housing as one of the Big Four priorities, creating opportunities for significant pri-vate participation. The affordable housing segment is facing severe supply shortages and addressing it is the top priority. Unleashing the potential of the affordable housing segment will have a high develop-ment impact in terms of economic expansion, skills and employment growth, backward and forward links, and inclusion. Reforms aimed at enhancing affordable housing production will also have positive externalities across the large and increasing small-scale and household-level housing construction sector.
The deep dive highlights the main constraints that discourage more private participation in the affordable housing segment. The high cost of land, high taxes and burdensome regulation (for example, building codes, professional fees, construction permitting systems), limited access to construction finance, compliance costs, high professional fees, and an underdeveloped housing finance market that is inaccessible to middle- and lower-income households, all limit expansion in the segment. The deep dive further explores the inefficiencies of the formal construction value chain, arguably the largest supply-side constraint, finding

12 overview
that the costs of developable land and construction materials are significantly higher in absolute terms than those in other African cities. High construction costs and supply-demand mismatches in turn stim-ulate informal housing construction, with cheaper but substandard building materials.
Kenyans who cannot access long-term housing finance are the main beneficiaries of the government’s affordable housing strategy. The government is tar-geting households with monthly incomes below K Sh 100,000 ($1,000), as they are creditworthy but cannot access mortgages. This segment of the housing market represents about 95 percent of the formally employed population.
The deep dive provides an insight into the current status of affordable housing in Kenya. It identifies constraints that contribute to the high-cost and low-af-fordability dynamic in the housing value chain. It further quantifies the costs of constructing different types and sizes of housing units in Kenya and assesses their affordability based on current household income distributions and mortgage finance rates.
Several actions can be undertaken over the next three to five years to unleash the potential of the affordable housing segment. Recommendations include the following:
1. Strengthening the enabling environment by improving urban planning frameworks and the availability of land, enacting better foreclosure and mortgage laws, improving access to nonmortgage housing finance, and providing practical supply- and demand-side tax incentives and equity investments for housing.
2. Refining Kenya’s PPP framework, providing alter-native contracting approaches suitable for urban land, infrastructure, and housing projects that are accessible to smaller, local companies to provide a foil to PPPs, which can be legislatively labori-ous, expensive to implement, and cumbersome to manage.
3. Making data and information on the sector more robust and widely available; for example, better recording and monitoring of land transactions and registrations will improve transparency and investment certainty in the sector — this should be complemented by an emphasis on the government’s role as facilitator rather than direct involvement in the construction of housing units through sub-contracting of private developers.
4. Addressing barriers to entry for local developers by improving program design, tendering procedures and specified plans, standards, and materials that
encourage growth of local skills, development capacity, and manufactured products.
5. Strengthening the authorizing environment around affordable housing by creating a national, mul-tisectoral coordinating committee to negotiate, develop, implement, and monitor required housing reforms through which key housing interests can engage on common themes.
6. Further developing capacity of local manufac-tured inputs into housing, as well as the local construction industry for increased local value addition in housing production, stimulating other value-added activities such as augmented cement and fabricated steel products, among others,
7. Strengthening institutional and legislative mecha-nisms, for example, by passing a new, comprehensive, and supportive Housing Act to increase certainty across the housing and construction sectors and to stimulate FDI in housing.
ManufacturingKenya’s manufacturing sector is a major employer with the potential to capitalize on the country’s labor force for future growth. In 2017, the sector employed 303,000 people and accounted for 11.4 percent of formal employment. Formal employment growth since 2013 has matched the sector’s overall growth at 2.2 percent annually. The sector had a male-to-female employment ratio of 5.2 in 2016. In 2017, this ratio improved to 3.9 but still lagged the national average of 1.9. The informal sector employed 2.8 million workers in the manufacturing sector in 2017, repre-senting almost 10 times the number of formal sector manufacturing employees. Kenya’s manufacturing sector also reveals a diversified base with fast-grow-ing subsectors, particularly pharmaceuticals, textiles, and apparel.
Although Kenya has the largest manufacturing base in East Africa, regional neighbors are outpacing its growth by wide margins — the sector has been stagnant despite efforts to increase its share of Kenya’s GDP. Manufacturing has been identified as a priority in the Big Four agenda, and the government has set ambi-tious targets to grow it to 15 percent of GDP by 2022 (currently 9.8 percent). These include key subsectors the government has been prioritizing, including tex-tiles, apparel, and pharmaceuticals. Manufacturing is also a nexus pillar of other components in the Big Four agenda in terms of affordable housing (con-struction materials) and universal health coverage (pharmaceuticals). This interest is further indicated

13KENYA COUNTRY PRIVATE SECTOR DIAGNOSTIC
by the development of special economic zones, which benefit from several incentives and have a focus on manufacturing.
This CPSD specifically highlights the potential of the pharmaceutical subsector to improve access to essential medicines within the domestic and regional markets. The main performance issues in the sector are limited regulatory capacity, quality infrastructure, market distortionary incentives, and an inadequate skills base to support quality upgrading. The most significant opportunity for safer and more affordable products in the market is improving the regulatory capacity for quality assurance and enforcement of locally produced and imported medicines. A coor-dinated approach will be needed through a package of interventions to support Kenya’s and the region’s efforts to increase the role of the private sector in supplying high-quality, affordable medicines. Appendix B provides a comprehensive deep dive of the phar-maceutical subsector and includes an action plan with specific recommendations.
Overcoming sectoral constraints will be critical to deliver on results. A recent benchmarking analysis that compared Kenya with potential competitors iden-tified several key constraints such as (1) inadequate or insufficient privately run skills and training facilities, (2) insufficient activities at the firm-level to leverage science, technology, and innovation, (3) barriers to entry and competition in key manufacturing sec-tors, (4) insufficient FDI to support base industries, (5) failure to comply with some environmental and social standards, which affect the sustainability of the sector, and (6) high cost of doing business, which compromises productivity and competitiveness. Given the prominent role that manufacturing occupies in the government’s agenda, future actions will have to be well executed and coordinated to help accelerate
the enabling factors that can facilitate growth and competitiveness of the sector.
The core of the recommendations for this sector rests upon improving markets for local goods and inte-grating Kenya as a regional player for more advanced manufactured products. They include the following:
1. Improving privately run skills and training facil-ities to address high unemployment and unmet demand for skilled workers. Improving the relevance of technical and vocational education training programs will be critical in meeting the Kenyan government’s Vision 2030.
2. Supporting innovation and technology adoption to improve product complexity. Areas such as product innovation and operational innovation tend to be fairly low, but firms displayed high scores on market innovation.
3. Financing for product research and development (R&D) and technology services could improve the innovation ecosystem and help firms access vital information to realize organizational, managerial, and technological changes. Policies could also focus on providing gradual partial subsidies for R&D to high-impact projects could help provide vital financing.
4. Strengthening framework and investment in indus-trial infrastructure, such as special economic zones, industrial parks, and transformation of the Kenya Industrial Research and Development Institute into a world-class research institution.
5. Reducing barriers to entry and competition in key manufacturing sectors, particularly where there is high state participation. Stronger market and competition policies, such as improved gover-nance of SOEs and more effective competition law enforcement, are also necessary.

Kenya has experienced buoyant growth in recent years, driven by public investment in infrastructure, strong consumer demand, and prudent macroeco-nomic policies. Gross domestic product (GDP) growth averaged 5.8 percent in 2010 – 17, exceeding the regional average of 3.7 percent. Factors underpinning the recent economic performance include a surge in public investment in infrastructure, renewed interest among foreign investors, lower transaction costs from improvements in information technology, and prudent monetary policy. Real GDP growth slowed to 4.9 percent in 2017, primarily owing to the impact of political instability caused by disputed presidential elections and the lingering effects of severe drought. Economic conditions improved in late 2017 and early 2018, helped by the completion of the election cycle and a process of political reconciliation between the main presidential rivals, as well as the return of more favorable weather conditions. Annual consumer price inflation has eased considerably since early 2017 (when it peaked at 12 percent) and has been contained within the central bank’s target range of 5 percent ±2.5 percent) since August 2017, allowing for some modest monetary policy loosening. Meanwhile, the government is implementing fiscal policy that aims to trim the budget deficit, boost revenues, and maintain investment levels in projects that support infrastructure development and job creation.
01COUNTRY CONTEXT

16 country context
With GDP per capita of $1,507, Kenya is second only to Sudan in the East African subregional rank-ing. The rebasing of Kenya’s national accounts in 2014 resulted in an upward revision of GDP and the reclassification of Kenya as a lower-middle-income country. Although remarkable by Kenyan standards, Kenya’s economic growth is still below some of its neighbors, notably Ethiopia (10.1 percent), Rwanda (7.2 percent), and Tanzania (6.7 percent) (figure 1.1). Kenya’s annual growth rate declined to 4.8 percent in 2017, below its long-term average.
Despite strong economic performance in some respects, poverty reduction has not kept up with the pace of economic growth. Although economic growth has created a growing middle class, poverty rates remain high. As shown in the 17th Kenyan Economic Update, the transmission of GDP growth to private consumption is very low. This means that general GDP growth contributes not as much to poverty reduction as it does in other comparable countries (World Bank 2018). The poverty rate declined from 47 percent in 2006 to an estimated 36 percent in 2016. This means that an estimated 17.5 million out of Kenya’s population of nearly 50 million remain poor. Because of Kenya’s relatively low urbanization rate of 26.5 percent, most of the poor population live in rural areas (44 percent of the rural population is poor). Persistently high-income inequality also poses challenges to the productive inclusion of the
poor. Kenya’s Gini coefficient of 0.39 is above that of neighboring comparators, including Ethiopia and Tanzania. The richest 10 percent of the population garner 40 percent of the nation’s income, whereas the poorest 10 percent receive only 2 percent.
Kenya has been experiencing rapid population growth and high rate of urbanization, which presents challenges as well as opportunities. With population growth averaging 2.6 percent a year and with close to 2 million people unemployed, and nearly 1 million young people entering the labor force each year, it is critical to generate enough new jobs. In addition, the urban population has been growing rapidly and accounted for about 30 percent of the total in the latest census (2009). This share is forecast to rise to 40 percent in 2020 and to 50 percent by 2030, imposing additional requirements on the supply and quality of new jobs outside of agriculture. On the positive side, there is potentially a huge demographic dividend whereby some 26 million Kenyans — more than half the population — are now below the age of 25, and this ratio will rise to almost two-thirds by 2030.
Consumption stands out as the main driver of GDP growth. Rising private consumption has been the main contributor to growth in recent years, propelled by the growing middle class, booming formality in services, increased lending to households, and higher remittances. Increased investment has also made a positive, although less significant, contribution, fueled
FIGURE 1.1 SELECTED GROWTH INDICATORS, KENYA AND EAC PEERS, 2010–17
Source: World Development Indicators.Note: EAC = East African Community; GDP = gross domestic product; data are averages across indicators.
0 3 6 9 12 0 1 2 3 4 5 6 -6 -4 -2 0 2 4 6 8 10 12 0 2 4 6 8 10 12 14 0 1 2 3 4
Uganda
Tanzania
Rwanda
Kenya
Ethiopia
a. GDP (%) b. GDP per capita (%)c. Exports of goods and
services (%) e. Populationd. Imports of goods and
services (%)

17KENYA COUNTRY PRIVATE SECTOR DIAGNOSTIC
by a shift in public spending from recurrent to “devel-opment spending,” largely on infrastructure. However, low national savings and investment rates continue to hold back overall economic growth prospects and the export sector has been a relative underperformer, leading to a large and persistent merchandise trade deficit. Exports of goods have consistently fallen short of goods imports, creating a large merchandise trade deficit (estimated at $10.2 billion in 2017) and driving the current account deficit (estimated at $5.0 billion in 2017, or 6.7 percent of GDP).
The current administration has prioritized devel-opment of four sectors to advance the economic and social agenda. Upon being reelected in 2017, President Uhuru Kenyatta unveiled the Big Four Action Plan, which aims to accelerate economic growth and achieve the targets set out in the Third Medium-Term Plan (MTP-III). It prioritizes food security, affordable housing, manufacturing, and affordable health care as the key enablers for job creation, economic growth, and social safety. In the case of manufacturing, the administration also expressed a further willingness to boost four manufacturing subsectors, namely the “blue economy,” agriprocessing, leather, and textiles. The targets of the Big Four Plan include 500,000 low-cost houses, universal health coverage, a ten-fold increase in exports, irrigation of an additional 1.2 million acres of land, millions of new jobs, the establishment of new industrial zones, and improved access to energy. According to the MTP-III, important mechanisms for achieving these objectives include improvements in the business environment,6 unleashing the poten-
tial of specific sectors and geographic locations (for example, north and northeast Kenya) and accelerat-ing financing sector and capital market development. Implementation of the Big Four Plan, which builds on the gains of the past, could become a game changer in Kenya. The administration faces high expectations on the part of ordinary Kenyans to deliver on this ambitious economic development agenda.
The government’s longer-term strategy, Vision 2030, sets a goal for Kenya to join the ranks of upper-middle-income countries. This entails a more than four-fold increase in Kenya’s current GDP per capita. Vision 2030 is operationalized in the MTP-III covering the 2018 – 22 period, which rests on three pillars: social, political, and economic. The social pillar focuses on human capital development, labor market placement of vulnerable populations, improved access to affordable housing and habitat conditions, and integration of marginalized youth. The political pillar envisages a democratic political system that is issue based, people centered, result oriented, and accountable to the public. Finally, the economic pillar prioritizes moving up the value chain in key sectors, including agriculture, manufacturing, and financial services, to achieve the goal of 10 percent annual GDP growth on a sustainable basis. The private sector helped devise Vision 2030 and its role is central in meeting the targets. The recent political accommoda-tion between the two main political parties provides hope for improved political stability that will be crucial for the enactment of the proposed reforms.

The vitality and resilience of Kenya’s private sector had traditionally been one of the country’s strengths, enabling it to develop a diversified economy. The private sector contributes over 80 percent of gross domestic product (GDP), 70 percent of total employ-ment, and the bulk of export earnings. Indeed, the Kenyan economy is well diversified, boasting a major regional financial center in Nairobi, the fourth-larg-est stock market on the African continent by trade volumes, a large manufacturing sector, a dynamic tourism market (albeit dampened by recent political developments), and the largest exports in Africa of agricultural products such as tea and horticulture.
The Kenyan private sector has shown immense resilience, even in the presence of considerable political uncertainty and security constraints. Although a pro-longed and uncertain electoral period in 2017 slowed overall economic performance, the Kenyan private sector nonetheless posted sustained growth across key sectors. For instance, output in ICT increased by 10.9 percent, transport and storage by 8.8 percent, and construction and real estate by 8.6 percent. Even the tourism sector recorded improvements, despite negative travel advisories issued by some countries in 2017. Tourism earnings increased by 20.3 percent and the number of international visitor arrivals increased
by 8.1 percent to nearly 1.5 million in the same year. Such stellar performance in the presence of adverse shocks demonstrates the strength and competitiveness of the Kenyan private sector, which is to some extent unparalleled in the East African region.
Macroeconomic Environment
Kenya’s robust growth in recent years has been supported by a stable macroeconomic environment. Despite a hike in 2017 caused by a drought-induced increase in food prices, Kenya’s inflation has been within the target band (5 ± 2.5 percent) in recent years. Inflation averaged 6.6 percent in 2014 – 16 and increased to 7.7 percent in 2017; thus far in 2018, inflationary pres-sures remain broadly muted (4.2 percent in the first half of 2018). Further, the stability of the exchange rate serves as nominal anchor to inflation expecta-tions. Supported by stronger diaspora remittance inflows and a recovery in tourism receipts, Kenya’s current account narrowed to 6.7 percent of GDP in 2017, from 10.4 percent of GDP in 2014. Reflecting continued foreign investor confidence in the Kenyan economy, inflows to the financial account (mainly to the government sector) remained strong, helping to
02STATE OF THE PRIVATE SECTOR

20 state of the private sector
finance the deficit as well maintain healthy reserves (average of 5 months import cover in 2017).
Nonetheless, fiscal, monetary, and financial sector challenges undermined Kenya’s private investment growth. First on the fiscal front, the expansionary fiscal stance in recent years contributed to elevated fiscal deficit levels (figure 2.1). The rapid expansion in government spending (thereby leading to increased domestic financing requirement) in recent years has kept yields on benchmark government securities ele-vated. With the interest rate cap tied to the policy rate, the effectiveness of monetary policy in sup-porting growth is compromised. Over the past year the policy rate has been reduced by some 100 basis points. Although this serves to benefit “blue-chip” Kenyan borrowers (government and large corporates), small and medium enterprises — the backbone of the Kenyan economy — continue to be priced out given the higher-risk premium attached to them. Further, earlier bank liquidations, elevated nonperforming loans, and the coming implementation of more strin-gent accounting standards (such as the International Financial Reporting Standard 9) have coalesced to increase risk-averse behavior among banks. However, with still strong appetite for debt to finance the large fiscal deficit, there has been a growing shift in lending from the private sector to the government (figure 2.2). Indeed, growth in government credit increased from an average of 9.2 percent in 2016 to 19.9 percent in 2017, whereas the average for the private sector declined from 9.1 percent to 2.3 percent over the same horizon.
The expansionary fiscal stance and challenges in the banking sector have contributed to the weaker contribution of private investment to growth. Unlike the solid contribution from the public sector (because of expansionary fiscal policy), private investment has been negative in recent years, declining from 1.3 percentage points of GDP in the four years leading to 2013 to -0.3 percentage points in the four years leading to 2017 (figure 2.3) — a swing of 1.6 percentage points of GDP. In other words, had the private sector sustained its contribution to GDP growth throughout the 2013 – 17 period, GDP growth would have been much higher. Based on sectoral growth performance (assuming growth in labor supply and technology constant), the sectors that have contributed to the weakness in private sector growth are agriculture, manufacturing, and trading activities, whereas private investment is likely to have been expanding more rapidly in the real estate and transportation sectors.
FIGURE 2.1 KENYA’S FISCAL POLICY HAS BEEN EXPANSIONARYFiscal deficit (% of GDP)
2014/152013/14 2015/16 2016/17 2017/18*
0
-10
-8
-6
-4
-2
Public Private
2015 2016 2017 2018-20
-10
0
10
20
30
40
50
Public Private
-0.8
-0.4
0.0
0.4
0.8
1.2
1.6
2015 2016 20172011 2012 20132009 2010 2014
FIGURE 2.3 PRIVATE INVESTMENT’S CONTRIBUTION TO GROWTH DECELERATED4-year moving average (percentage point of GDP)
Source: Data from the Kenya National Bureau Statistics.
FIGURE 2.2 WITH INTEREST CAPS, BANKS REALLOCATED THEIR PORTFOLIOS IN FAVOR OF THE PUBLIC SECTORYear-on-year credit growth (%)
Source: Data from the National Treasury of Kenya.*Preliminary results.
Source: Data from the Central Bank of Kenya.

21KENYA COUNTRY PRIVATE SECTOR DIAGNOSTIC
BOX 2.1 FIRM-LEVEL INNOVATION AND ITS IMPACT ON PRODUCTIVITY
Firm-level innovation rates are relatively high in Kenya compared with international standards. However, these innovations are largely incremental, meaning that the degree of innovativeness is low and their outcomes have a limited impact on productivity. This weak link between innovation and productivity could be explained by a number of factors, including limited knowledge capital investments underlying innovation activities and inadequate educational level of the labor force that hampers the ability of firms to transform their innovation outcomes into productivity gains.
These conclusions derive from the results of the most recent World Bank Group Enterprise Survey (2013) and the linked 2014 innovation module. Some highlights of the survey results are as follows:
• In Kenya, 53 percent of firms are product and/or process innovators, 40 percent of firms introduced product innovations, and 38 percent introduced process innovations.
• Innovation rates are even higher when it comes to marketing innovation — 69 percent of firms performed marketing improvements.
• However, only 11 percent of product innovators and 18 percent of process innovators introduced innovations that are new to the national market and a mere 2 percent of firms are international innovators.
• Medium and large firms are more innovative than small firms.
• Firms that do not participate in international markets are less innovative.
• There is little knowledge appropriation by firms in terms of registering patents and other instruments — only 5.5 percent of firms apply for a patent.
The survey results point to a need for a systematic upgrade in the government’s innovation policy. In particular, technology extension and advisory services can address some identified market failures and help improve the quality of innovation. The government of Kenya needs to expand its support for research and development financing and employ new policy instruments to encourage cooperation among firms and academic institutions.
Source: Cirera 2015.
Innovation and Entrepreneurship
Kenya is leading a technological revolution in East Africa. The country’s strong technology-led innova-tion and entrepreneurial “ecosystem” and growing internet connectivity provide a fertile environment for developing a digital economy. According to the World Bank Group’s (2013) Enterprise Survey, Kenyan firms have been relatively innovative and entrepreneurial.
“Innovation in Technology” became trademarks of Kenya, with a major potential to transform the private sector. The country launched its Open Data Initiative in July 2011 — the first in Sub-Saharan Africa and an inspiration to other countries in the region. However, levels of innovation are still low compared with other countries and do not appear to have had a significant impact on productivity (box 2.1).
Although Kenya is a pioneer in mobile-banking solutions and ICT, innovation levels remain low com-pared with other countries and do not appear to have had a significant impact on productivity. Investments in innovation inputs are highly concentrated in just a few firms (one firm has about 80 percent of all research and development), and their intensity is similar to those in countries with the same income levels (Cirera 2015). The share of firms investing in innovation activities is similar to the average found in other emerging markets and developing countries. Innovation activities do have a positive impact on employment creation, but this increase in employment is biased toward skilled labor. Nonetheless, the great success of mobile money in Kenya became a source of national pride and helped improve the country’s global profile.
Disruptive technologies, such as the internet of things, artificial intelligence , and 3D printing, have been heralded as the future of the global manufac-turing sector. However, in Kenya these technologies could hinder industrialization and result in fewer entry points into global supply chains. Although it may be possible for Kenya to “leapfrog” directly to newer technologies, it is more likely that develop-ing the relevant worker know-how, infrastructure, and corporate capabilities necessary to leverage the potential value of these newer technologies will be a very gradual process. To improve efficiency in the manufacturing sector, the government has allocated additional resources toward improvements in power generation and distribution, easing barriers for doing business, improving security, and reviving strategic industries under its Big Four Plan.
The digital economy as key enabler for enhanced business and human development outcomes. By leap-

22 state of the private sector
frogging directly to cutting-edge technologies, Africa, and Kenya in particular, can bypass the industrial phase in which developed countries invested in now cumbersome technological infrastructure and bypass the cost of revamping it as well. This is of particular importance when it comes to addressing deficiencies in basic needs. Exponential technologies can accel-erate access to water, food, energy, health care, and education. And a whole new wave of entrepreneurs and innovators in Africa are doing just that.
In the past decade, Kenya has seen unprecedented growth in the information and communication technology (ICT) sector, which has spurred major transformation in many business processes and oper-ations. For example, a 2016 study by academics from the Massachusetts Institute of Technology found that by gaining access to M-Pesa, a mobile money service, 2 percent of Kenyan households were lifted out of poverty between 2008 and 2014 (Suri and Jack 2016).
In agriculture too, technologies from sensors to mobile to predictive analytics are driving new models and outcomes. Gro Intelligence figures any form of agricultural information to its classification system, enabling comparable sets of data. Already more than 70 percent of African farmers have used ICT, with 90 percent seeing increased overall output as a result.
Similarly, exponential technologies are helping health care to leapfrog over constraints in communication, transportation, and affordability. Platforms that use mobile technology, such as Clinic Communicator, ensure that patients and doctors can communicate even when meeting face-to-face is a challenge. This innovative and entrepreneurial drive is key to Kenya’s future success — and clearly exponential technologies can accelerate that success.
Kenya has a modern services sector which has been at the core of the country’s recent economic growth. Services accounted for 49 percent of Kenya’s GDP in 2017, with distribution, transport, and retail playing the central role. In addition, several knowl-edge-intensive services, such as telecommunications, finance, and business services, have been growing strongly over the past decade. For example, Kenya’s ICT industry — very small in 2004 — has developed into a leading economic sector. Its contribution to Kenya’s GDP was nearly 3 percent in 2012, exceed-ing the ICT share in most Sub-Saharan African and many other developing countries.7 Kenya also has become a global leader in mobile banking — two-thirds of the adult population have access to financial services through the mobile banking service M-Pesa. The comparative advantage developed by Kenya in knowledge-intensive services has enabled the country
to become a regional hub for global professional ser-vices sector firms and make the country the leading services exporter in East Africa.
Investment Performance
Kenya remains an attractive destination for FDI. From 2011 to 2015, annual FDI volume fluctuated from a low of $1 billion in 2012 to a high of $3.5 billion in 2013, before dropping significantly to $0.4 billion in 2016 (figure 2.4). The latest World Investment Report (UNCTAD 2018) cites a rebound of FDI inflows at $0.6 billion, with a stock of inward FDI at $11.9 billion (15.9 percent of GDP) in 2017. The recently improved FDI performance was due mainly to buoyant domestic demand and inflows into ICT industries. The Kenyan government also provided additional tax incentives to foreign investors (UNCTAD 2018). The FDI outlook for the near terms also looks positive, mainly driven by current and upcoming infrastructure projects that are likely to boost economic growth and generate additional FDI flows in 2018 and beyond.
FDI inflows are relatively small given the size of Kenya’s economy. Foreign investors are drawn by Kenya’s solid growth prospects and diversified economy, its status as a key regional hub, and a lack of barriers to repatriating profits and capital. However, FDI falls short of that received by some other countries in East Africa, namely Tanzania and Uganda (figure 2.5, panel a). This is partly because the local extractive sector remains underdeveloped, although oil-related activity will rise if developers make a final decision (due in 2019) to commercialize
FIGURE 2.4 FOREIGN DIRECT INVESTMENT INFLOWS ($)
Source: Data from the International Monetary Fund.
20150
200
400
600
800
2016 2017 2018 2019 2020 2021
379348
426
576621
671721

23KENYA COUNTRY PRIVATE SECTOR DIAGNOSTIC
Kenya’s oil finds in the far north. Also, investors are deterred by infrastructure bottlenecks, skills short-ages, political uncertainty and high levels of crime and corruption, which combine to create a high-cost business environment.
FDI has targeted selected sectors in Kenya. Foreign investors have shown interest in ICT, real estate, bank-ing, retailing, power generation, oil exploration, and mining in recent years. Just over half of FDI is in the capital, Nairobi, followed by Mombasa, although investments in the tourism, agriculture, and mining sectors have a wider geographical spread. The main sources of FDI are the United Kingdom and the United States, followed by Germany, France, the Netherlands, and other European states, although investment from South Africa and Asia (especially India and China) is catching up, the former in particular benefiting
from the World Bank Group’s Multilateral Investment Guarantee Agency guarantees in the energy sector against breach of contract, war, and civil disturbance. Kenya hopes to attract export-focused investment in new special economic zones (SEZs), which offer tax concessions and other incentives, following the passage of enabling legislation in 2015. A first SEZ, located in Eldoret, may open in 2018, and several others are planned, including in Mombasa. SEZs will eventually replace existing export processing zones, which have a narrower range of permitted activities.
Several foreign firms are prominent in their field and others play a strategic role. These include Barclays in banking, Coca-Cola in soft drinks, and Vodafone and Safaricom in mobile phones. Other companies play a strategic role, such as the Dutch airline KLM with its investment in Kenya Airways. Horticulture,
FIGURE 2.5 NET FDI IN PERSPECTIVE, KENYA AND EAST AFRICAN PEERS
Source: UNCTAD 2018.Note: FDI = foreign direct investment; EAC = East African Community.
b. Net FDI (% of GDP)
a. FDI inflows, 2017 ($ million)
Comoros9
Ethiopia3,586
Tanzania1,180
Uganda700
Kenya672
Madagascar389
Somalia384
Mauritius293
Seychelles192
Djibouti165
Eritrea55

24 state of the private sector
especially cut flowers, has attracted many smaller private sector investors, although the sector is now consolidating. Kenya’s export processing zones have been successful in attracting some manufacturing investment, especially from Asia. This is geared to garment sales in the United States under the African Growth and Opportunity Act, which has been extended by 10 years to 2025. Spanish, U.K., and U.S. firms are engaged as independent power producers. South Africa’s Shoprite and France’s Carrefour are increas-ing their presence in retailing, India’s Airtel is the second-largest telecommunications operator, and Australia’s Base Resources is driving mineral sands extraction near the coast. Some consumer goods manufacturers, such as Colgate Palmolive, have downscaled their presence, hit by rising costs and competition from imports. Others, including Coca-Cola, PepsiCo, Nestlé, and Unilever, are expanding to take advantage of urbanization, higher consumer spending, and regional integration.
Trade Performance
Kenya’s exports have historically lagged imports and the trade to GDP ratio has fallen sharply in the since 2013. Despite experiencing broad-based growth in 2013 – 17, Kenya’s exports of merchandised goods have remained stagnant in absolute terms, thereby losing
its share as a proportion of GDP, from 10.6 percent in 2013 to 8.1 percent in 2017. While the import bill increased from $14.2 billion to $17.1 billion during the same period, the share of merchandise imports decreased from 29.7 percent to 20 percent of GDP. Overall, merchandise trade dropped from 40 per-cent to 31.4 percent. The merchandise trade deficit averaged $10.4 billion, reaching an all-time high of $12.2 billion in 2014 (20 percent of GDP) to then drop to $10.9 billion in 2017 or 15 percent of GDP. At the same time, the current account widened by $1.2 billion and reached 6.3 percent in 2017 up from 5.2 percent in 2016 but has nonetheless improved substantially since 2014 when Kenya recorded a current account deficit of 10.3 percent.
In terms exports destination, Kenya has a well-di-versified base of customers, with about 25 percent of exports to Africa, with Uganda (9.7 percent) and Tanzania (5.7 percent) being the largest regional con-sumers of Kenyan goods. Outside of Africa, Kenya’s largest markets are the United States (11.53 percent), the Netherlands (9.53 percent), Pakistan (8.58 percent), and the United Kingdom (8.06 percent) (figure 2.6, panel a). Despite this diversification, Kenya shows significant trade imbalances with its African and Asian trading partners. For instance, exports to Sub-Saharan Africa account for about one third of total merchandise exports. On the other hand, imports from Asia and accounted for 64 percent of total mer-
FIGURE 2.6 KENYA'S EXPORTS, 2017
Source: Data from United Nations Comtrade database.
b. By Industry (%)a. By destination (%)
Others
Egypt, Arab Rep.
UnitedKingdom
United States12
Netherlands10
9
Uganda9
Pakistan9
Tanzania6
5
42Other
Chemicals andplastics
Textiles andfurniture
Vegetables, foodstuff, and wood
6510
7
Minerals6
Metals4
Transport vehicles2
Machinery2 4

25KENYA COUNTRY PRIVATE SECTOR DIAGNOSTIC
chandise imports in 2017, but less than 10 percent of total exports.
Agricultural products dominate Kenya’s export profile, followed by manufactured products. Kenya’s agricultural products typically account for over 50 percent of exports by value (figure 2.6, panel b). Tea comprised 21.2 percent of total goods exports in 2017, followed by horticulture at 12.8 percent and coffee at 3.5 percent. The growth in the tea, cut flowers, and green beans value chains, which together account for over 65 percent of agricultural exports, represent major success stories for the country, which other countries in the region are eagerly attempting to replicate. The main growers are a mixture of private and foreign-owned firms, with, in the flower indus-try, the three largest multinational producers being Oserian, Karuturi, and Falmingo or Homegrown (all based around Lake Naivasha). Manufactured goods account for 12 of Kenya’s top 20 exports and average about one-third of their total value.
Imports are highly diversified and mainly come from Asia. Kenya’s large import bill is driven by strong demand (and in some cases import dependence) for industrial supplies, plant and machinery, transport equipment, energy products, and many consumer goods. India and China are the leading suppliers of goods imports to Kenya, providing 23.6 percent and 14.4 percent of all goods imports in 2017 (respec-tively), followed by the United Arab Emirates (6.4 percent) and Japan (4.8 percent). Consumer goods are dominated by low-cost imports from Asia (par-ticularly China), whereas formal trade is threatened by the prevalence of fake and counterfeit products.
Kenya’s Trade Agreements. Kenya is a member of the East African Community (EAC), the Common Market for Eastern and Southern Africa (COMESA), the Intergovernmental Authority on Development, and the Indian Ocean Rim Association. Tariffs on most intraregional trade with EAC and COMESA partners are liberalized. Kenya ratified the Economic
Partnership Agreement between the EAC and the European Union (EU) in 2016 which allowed it to retain its duty-free and quota-free access to the EU market. Reciprocal preferences between Kenya and the EU are subject to ratification by other EAC members and have not yet taken place.8 Kenya also benefits from trade preferences under the United States’ African Growth and Opportunity Act.
The African Continental Free Trade Area Agreement (AfCFTA) provides a significant opportunity to boost trade, competitiveness, and welfare. The AfCFTA aspires to liberalize trade between African countries, and, by doing so, boost exports, competitiveness, and innovation, as well as foster regional value chains that can facilitate integration into the global economy. The ambitious scope of AfCFTA goes beyond tradi-tional trade agreements and covers trade in goods and services, investment, intellectual property rights, and competition policy. Kenya is expected to reap substantial benefits from the agreement in terms of welfare gains (1 percent of GDP) and additional growth of GDP (2 percent) and exports (5.7 percent) while incurring small revenue losses (-0.3 percent).9 Kenya is one of the few African countries that can take advantage of an existing industrial base and duty-free access to an enlarged regional market to advance its industrialization goals.
Complementary policies are necessary to maximize the gains from trade agreements. Measures considered important to maximize the impact of trade agreements include trade facilitation and the reduction of nontariff measures, such as those associated with improved regulatory transparency, harmonization of sanitary and phytosanitary regulations, the accreditation and mutual recognition procedures for technical barri-ers to trade, among others. Reductions in nontariff measures would significantly increase the welfare gains from AfCFTA in Kenya from 1 percent to 1.7 percent GDP by 2025.10

Business Environment
The environment for private sector – led growth in Kenya has been improving, but only slowly in most respects. Kenya fares somewhat better than most of its neighbors, gradually inching closer to better-per-forming economies in the World Bank’s (2019) Doing Business report, moving from 80th in 2018 to 61st (out of 190 countries) and third in Sub-Saharan Africa (figure 3.1).
Similarly, in 2017 Kenya improved its ranking in the World Economic Forum’s Global Competitiveness Index (GCI), moving up three places in the ranking to 91st out of 144 countries, well ahead of Ethiopia (108th), Nigeria (127th), and Tanzania (113th) (figure 3.2). Although there were notable improvements in technological readiness and innovation pillars, the fact remains that the country is still only in the middle tier of global rankings and has not yet made nearly enough progress with investment climate reforms. According to the GCI, corruption, taxes, and ineffi-cient bureaucracy continue to be the top problematic factors for doing business. In the World Bank Doing Business report, Kenya is in the top quarter of countries
globally in only one area, “getting credit.” However, it is brought down by indicators that relate to admin-istrative procedures, such as trading across borders (112th), registering property (122nd), dealing with construction permits (128th), and starting a busi-ness (126th). Meaningful improvements will require a much bolder approach to reforms than what Kenya has exhibited to date.
Firms in Kenya report slightly lower administrative barriers than the average for Sub-Saharan Africa in the World Bank Group’s Enterprise Survey, including the number of days required to obtain an import license, construction permit, or operating license. They report that an average of just over 7 percent of their senior management time is spent in dealing with the requirements of government regulations, which is better than the 9 percent average for the rest of Africa. Businesses in Kenya face roughly half the number of “visits or required meetings with tax officials” compared with the rest of the continent (World Bank Group 2013).
Although Kenya has been making reforms, it has not made significantly more progress than the average country and therefore has not distinguished itself. In
03CROSS-CUTTING CONSTRAINTS TO PRIVATE SECTOR DEVELOPMENT
Although Kenya has made progress with its economy and reforms, it still faces several
cross-cutting constraints that hamper its ability to deliver on the Big Four goals. Key
among these are (1) the overall business enabling environment, (2) competition policy,
and (3) informality.

28 cross-cutting constraints to private sector development
the headline indicator of “Starting a Business,” Kenya has recently removed stamp-duty fees, eliminated requirements to sign compliance declarations, and merged certain procedures to save time and effort. Another improvement appears to be associated with the introduction of new Huduma service centers that facilitate government services, including company name reservations and stamp-duty assessments for property transfer. However, it is still ranked 117 globally, indicat-ing that there is still substantial room for improvement. Amongst other notable reforms undertaken in 2018
to improve the business climate in the country, is a reduction in the cost of obtaining a construction permit and digitalization of part of the trading across borders process. Overall, the regulatory business environment remains complex, costly, and unpredictable despite recent efforts on Doing Business reforms. If unattended, these will continue to erode Kenya’s productivity and economic performance.
Several regulatory areas emerge as candidates for reform. Such improvements will not only benefit firms by reducing transaction costs and promoting their
FIGURE 3.1 OVERALL DOING BUSINESS RANKING, KENYA AND SUB-SAHARAN AFRICA COMPARATORS, 2019
Source: Data from the World Bank Doing Business database.
FIGURE 3.2 GLOBAL COMPETITIVENESS INDEX RANKING, KENYA AND SUB-SAHARAN AFRICA COMPARATORS
Source: Data from WEF 2017.
Rank1
Overall GCI Institutions InfrastructureMacroeconomic
environmentHealth and
primary educationHigher education
and trainingGoods market
efficiencyLabor market
efficiencyFinancial market
developmentTechnological
readiness Market sizeBusiness
sophistication Innovation
TanzaniaEthiopia
Kenya
South AfricaRwanda
108
91
5861
113
137
10
20
30
40
50
60
70
80
90
100
110
120
130
TanzaniaEthiopia
KenyaSouth Africa
Rwanda
TanzaniaEthiopia
Kenya
South Africa
Rwanda
RankOverall ease ofdoing business
Registeringproperty
Gettingcredit
Protectingminority investors
Payingtaxes
Trading acrossborders
Enforcingcontracts
Resolvinginsolvency
Starting abusiness
Dealing withconstruction permits
Gettingelectricity
29
61
82
144
159
190
1
20
40
60
80
100
120
140
160
180
Kenya
Tanzania
Ethiopia
South Africa
Rwanda

29KENYA COUNTRY PRIVATE SECTOR DIAGNOSTIC
FIGURE 3.1 OVERALL DOING BUSINESS RANKING, KENYA AND SUB-SAHARAN AFRICA COMPARATORS, 2019
Source: Data from the World Bank Doing Business database.
FIGURE 3.2 GLOBAL COMPETITIVENESS INDEX RANKING, KENYA AND SUB-SAHARAN AFRICA COMPARATORS
Source: Data from WEF 2017.
growth but also help address some of the structural flaws in the country such as a large informal sector, identified as the biggest obstacle for firms according to the World Bank Enterprise Surveys (2013) fol-lowed by corruption. Corruption is one of the most significant problems businesses in Kenya are facing, as also noted in the World Economic Forum’s Global Competitiveness Report (second most problematic factor for businesses after access to financing) which also ranks Kenya in 94th place for irregular payments and bribes. For example, the regulatory framework
still lacks specific provisions safeguarding women’s rights to access credit or prohibiting discrimination based on gender or marital status.
According to the Worldwide Governance Indicators, Kenya has experienced a steady decline in regulatory quality over the last decade. Indicators capturing perceptions of the ability of the government to for-mulate and implement sound policies and regulations that permit and promote private sector development has declined from a percentile rank of 48.5 in 2006 to 41.8 in 2016.
Rank1
Overall GCI Institutions InfrastructureMacroeconomic
environmentHealth and
primary educationHigher education
and trainingGoods market
efficiencyLabor market
efficiencyFinancial market
developmentTechnological
readiness Market sizeBusiness
sophistication Innovation
TanzaniaEthiopia
Kenya
South AfricaRwanda
108
91
5861
113
137
10
20
30
40
50
60
70
80
90
100
110
120
130
TanzaniaEthiopia
KenyaSouth Africa
Rwanda
TanzaniaEthiopia
Kenya
South Africa
Rwanda
RankOverall ease ofdoing business
Registeringproperty
Gettingcredit
Protectingminority investors
Payingtaxes
Trading acrossborders
Enforcingcontracts
Resolvinginsolvency
Starting abusiness
Dealing withconstruction permits
Gettingelectricity
29
61
82
144
159
190
1
20
40
60
80
100
120
140
160
180
Kenya
Tanzania
Ethiopia
South Africa
Rwanda

30 cross-cutting constraints to private sector development
Policy RecommendationsTo address business environment challenges, and enhance competitiveness of the Kenyan economy, the following reform actions have been identified:
• Conduct a detailed assessment of the quality infrastructure and national standards needs in selected sectors to establish a robust quality eco-system and improve competitiveness.
• Increase transparency in public procurement by fully digitizing the public procurement process, allowing electronic signature in the procurement contracts portal and allowing online payments.
• Conduct an assessment of recent efforts to improve regulatory management systems (public consul-tation, regulatory analysis, access to laws and reg-ulation, and so on) and consider how they can be better targeted, implemented, and improved to deliver tangible improvements for business, citi-zens, and civil society.
• To reduce the number of procedures, time and cost to register a company, combine the busi-ness name registration and actual incorpora-tion of a company.
• To make the process of obtaining a construction permit faster and cheaper, continue roll-out of e-construction permit systems to more counties. Establish a risk-based system for environmental approvals. Also, assess the feasibility of lower-ing building permit and preconstruction clear-ance costs further. Accelerate efforts to establish an automated system for administering land use applications, occupation certificates and build-ing inspections.
• To allow for more efficient and less costly trans-fer and registration of property titles, establish efficient mechanisms to conduct valuations of land and real estate and to file and resolve com-plaints related to problems that occurred at the agency in charge of immovable property regis-tration, or the cadaster. Also, consider assessing the feasibility of further reducing or exempting the stamp duty on property transactions. Ensure that all privately held land plots in the economy as well as the largest business city are formally mapped and registered at the immovable property registry. Consider digitization of Kenya’s cadas-ter to improve transparency and speed of prop-erty transfer.
Competition Policy and Barriers to Market Entry
Kenya lags behind other comparator countries in terms of the extent to which rules facilitate entry, contestability, and effective domestic competition. According to the PMR methodology designed by the Organisation for Economic Co-operation and Development (OECD), Kenya’s economy has been found to be highly influenced by high state participation in economic activities and the prevalence of restrictive regulations that create barriers to entry and rivalry for both domestic competitors and foreign entrants. These restrictions that affect key enabling sectors such as energy, transport, telecommunications, and professional services are significantly higher than in OECD and other middle-income countries (figure 3.3). In addition, there are concentrated market structures in several sectors such as manufacturing where monop-olies, duopolies, and oligopolies are more prevalent than in other countries in the region, such as Uganda, Tanzania, Senegal, and Ghana, indicating that there could be barriers to entry in some subsectors (World Bank Group 2016, 3). Investors perceive significant operational risks associated with weak competi-tion in Kenya, such as unfair competitive practices, vested interests, and discrimination, according to the Economist Intelligence Unit (figure 3.4). Lastly, the country trails behind other middle-income countries in terms of antimonopoly policy and rules that enable a market-based economy (it ranks 72nd out of 129 countries in the market economy status according to the Bertelsmann-Stiftung Transformation index).
Key Challenges Preventing Effective Competition in KenyaRestrictive government policies and regulations in key markets and gaps in the market regulation system reduce the affordability of services and products for firms along value chains and limit opportunities for market creation. Table 3.1 is a summary of the competition restrictions that have been identified in several key markets in Kenya and are particularly detrimental to the private sector. Besides sectoral reforms to address regulatory restrictions, there is need to enhance regulatory quality by incorporating competition principles in the design of regulations and government interventions in markets. Although the Statutory Instruments Act of 2013 makes progress in this direction, the lack of an institutional and procedural framework for regulatory impact assess-ments severely hampers implementation. Increased regulatory and technical independence of sectoral
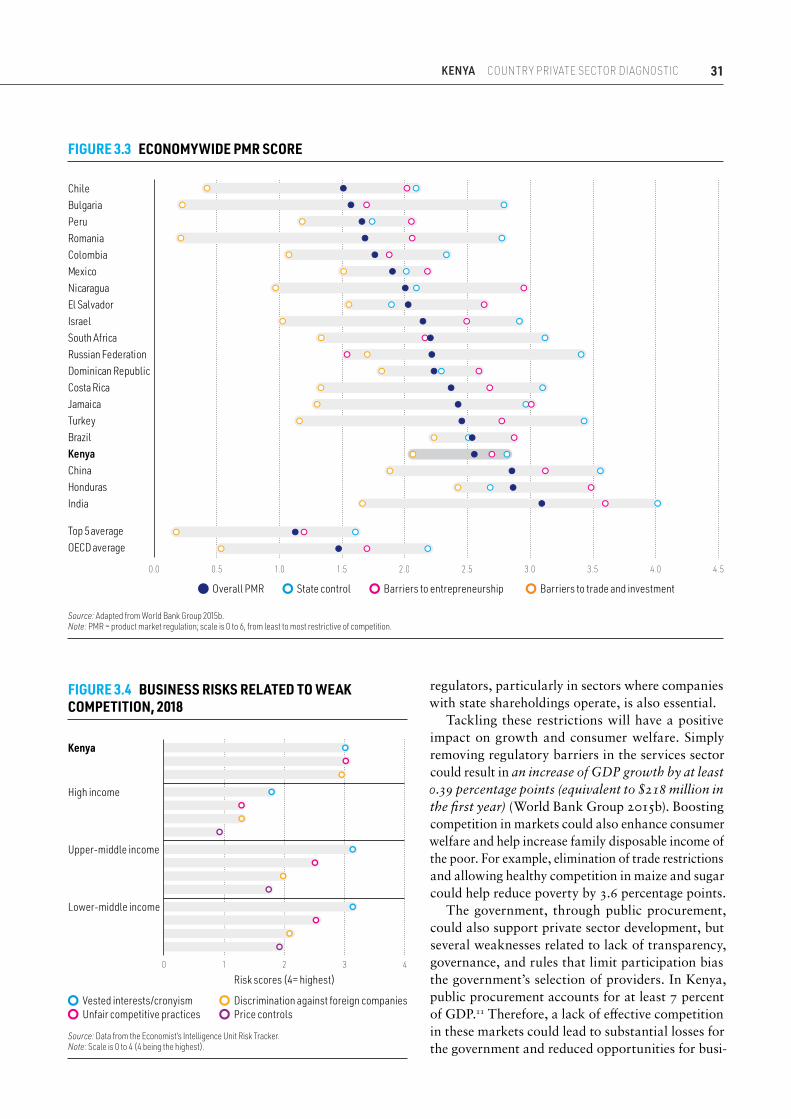
31KENYA COUNTRY PRIVATE SECTOR DIAGNOSTIC
regulators, particularly in sectors where companies with state shareholdings operate, is also essential.
Tackling these restrictions will have a positive impact on growth and consumer welfare. Simply removing regulatory barriers in the services sector could result in an increase of GDP growth by at least 0.39 percentage points (equivalent to $218 million in the first year) (World Bank Group 2015b). Boosting competition in markets could also enhance consumer welfare and help increase family disposable income of the poor. For example, elimination of trade restrictions and allowing healthy competition in maize and sugar could help reduce poverty by 3.6 percentage points.
The government, through public procurement, could also support private sector development, but several weaknesses related to lack of transparency, governance, and rules that limit participation bias the government’s selection of providers. In Kenya, public procurement accounts for at least 7 percent of GDP.11 Therefore, a lack of effective competition in these markets could lead to substantial losses for the government and reduced opportunities for busi-
Source: Adapted from World Bank Group 2015b.Note: PMR = product market regulation; scale is 0 to 6, from least to most restrictive of competition.
Barriers to entrepreneurship Barriers to trade and investmentOverall PMR State control
Top 5 averageOECD average
ChileBulgariaPeruRomaniaColombiaMexicoNicaraguaEl SalvadorIsraelSouth AfricaRussian FederationDominican RepublicCosta RicaJamaicaTurkeyBrazilKenyaChinaHondurasIndia
2.0 2.5 3.0 3.5 4.0 4.50.0 0.5 1.0 1.5
FIGURE 3.3 ECONOMYWIDE PMR SCORE
High income
Kenya
Upper-middle income
Lower-middle income
0 2 31 4
Risk scores (4= highest)
Vested interests/cronyismUnfair competitive practices
Discrimination against foreign companiesPrice controls
FIGURE 3.4 BUSINESS RISKS RELATED TO WEAK COMPETITION, 2018
Source: Data from the Economist’s Intelligence Unit Risk Tracker.Note: Scale is 0 to 4 (4 being the highest).

32 cross-cutting constraints to private sector development
TABLE 3.1 SECTOR-SPECIFIC COMPETITION RESTRICTIONS
Sector Subsector Competition Restrictions
Agriculture Staple grains Burdensome and ineffective government intervention preventing a level playing field for all players, for example, import licenses, quotas and tariffs, influence through the National Cereal and Produce Board in the maize sector, and information exchange among competitors distort the value chain, making it less efficient and expensive.
Pyrethrum Incomplete regulatory framework that prevents effective entry of private processors and protection of the state-managed Pyrethrum Processing Company of Kenya, previously a monopoly and monopsony for the sale of pyrethrum extracts and purchase of dry flowers.
Tea Unreasonably high regulatory requirements that affect entry and level playing field, for example, minimum hectarage requirements for factories, restrictions on ability of factories to source leaves, and involvement of counties in licensing.
Sugar Barriers that restrict open entry, such as nontariff barriers, that is, quotas and mandatory import permits and inefficient SOEs.
Fertilizers Reliance on the National Cereals and Produce Board for the purchase and distribution of subsidized fertilizers that affects input markets and potential anticompetitive practices that increase the cost of fertilizers.
Seeds Government involvement and intervention affecting entry and level playing field between SOEs and private companies.
Artificial insemination Government involvement and intervention affecting entry and altering the level playing field and a lack of transparency of quality standards of semen and of clearing imports.
Electronic communications
Telecommunications Lack of transparent regulatory framework for pro-competitive spectrum allocation which affects entry and the level playing field for all potential providers of broadband services. Weak regulatory framework on dominant operator that reduces investment opportunities for other players and increases regulatory risks.
Mobile payment systems Limited interoperability between mobile payment operators and neutral access to clearinghouses affects the ability of smaller players to grow.
Electricity Generation Concerns about regulatory neutrality given government participation and delays in the implementation of an open market for large electricity consumers
Professional services Legal and architectural services in particular
Mandatory minimum prices and restrictions on (1) participation by foreigners, (2) advertising, and (3) partnerships across professions limit entry and business strategy options and increase the costs of services for businesses, including legal, architectural, engineering, and surveying services for affordable housing.
Insurance Insurance and brokerage services
Restrictions on foreign equity participation, regulation of insurance premiums, and information-sharing practices that can facilitate collusion and increase costs for business.
Air transport Passenger transportation Regulatory issues related to licensing of new players, ownership restrictions even within the EAC common market, and underdeveloped framework of slot allocation.
Construction Inputs Restrictive trade rules (tariffs, quotas, and permits) on inputs such as steel and wood products resulting in high prices for developers.
Source: Adapted from World Bank Group (2015b, 78 – 81).Note: SOEs = state-owned enterprises; EAC = East African Community.

33KENYA COUNTRY PRIVATE SECTOR DIAGNOSTIC
nesses. Improving public procurement rules and their implementation through more use of digital systems, monitoring of preference schemes, and anti-cartel enforcement would create a more open market for government tenders at both the national and county levels. Conservative estimates show that ensuring competition in public procurement in Kenya, con-sidering only products that have been subject to bid rigging in other jurisdictions,12 could free up K Sh 28 billion per year.13
Kenya has adopted an enabling environment for public-private partnerships (PPPs). Acknowledging tight fiscal space, the Kenyan government has been looking at alternatives to public procurement for prioritizing infrastructure investments and has made infrastructure development through PPPs a priority. The government enacted the PPP Act in 2013 and subsequently developed PPP regulations for national and subnational governments. A PPP Unit was also established under the National Treasury to promote and oversee the implementation of the PPP program.
However, there is a gap in the public procurement and PPP laws that allows for direct contracting using joint ventures and government-to-government memo-randa of understanding without competitive selection to develop and operate government infrastructure. Furthermore, the framework for unsolicited proposals (section 61 of the PPP law) does not provide for the possibility of competition for PPPs that have been developed through private initiative. All these gaps distort the level playing field and limit entry of new investors particularly in enabling sectors.
Although Kenya has a competition framework, its implementation could be deepened to prevent and stop anticompetitive practices that increase costs for businesses, prevent entry of new players, or create an environment harmful to consumers. Price-fixing among competitors can increase prices by 45 per-cent on average,14 affecting intermediate and final goods. These agreements are sometimes facilitated by business and professional associations, as there is a general lack of awareness of their illegality — more than 24 percent of officers working in institutions that regulate markets and 45 percent of large and medium businesses in key sectors in Kenya agree that it is fine to discuss prices and levels of production with competitors (CAK and World Bank Group 2017). Furthermore, multimarket contact by the six main business groups across sectors, such as banking, elec-tricity generation, agriprocessing, and manufacturing of intermediate inputs, can create an environment that facilitates coordination. The economic features of industries, the way they are regulated, and the usual
configuration of business relationships increase the risk of price-fixing practices in chemicals and fertil-izers, cement and construction materials, transport logistics, and food products, and abuse of dominance is more common in network industries. Therefore, competition law enforcement, in particular, against cartels and abuse of dominance, is key to facilitate private sector development. Merger control is also important to prevent economic consolidation that can reduce competition, but inefficient regulatory procedures for merger review and excessive condi-tions on public interest can prevent efficient mergers and acquisitions, including transactions by private equity and venture capital funds. More coordination between the CAK and competition authorities in regional economic communities (the East African Community and the Common Market for Eastern and Southern Africa), as well as reduced red tape, is needed on this front.
State Control and Involvement in SOE Commercial ActivitiesState control and direct participation in commercial activities through state-owned enterprises (SOEs) and business associates can limit the development of competitive and open markets. Kenya scores higher than the OECD average and other middle-income countries in the state control PMR indicator, reflect-ing a higher degree of state intervention. Kenya has a broader presence of SOEs, registering SOEs in at least 17 sectors compared with an average of 15.4 in OECD countries. Public ownership exists in capi-tal-intensive sectors where government involvement is common, and sometimes necessary, such as electricity transmission and transport and road infrastructure. However, there is also significant government presence in other sectors where there is active private sector participation such as retail, accommodation, man-ufacturing, banking, insurance, and agriprocessing (see appendix A). The Kenyan government is involved in retail trade (supermarkets), wholesale trade of agriculture products, accommodation, and manu-facturing of food products and beverages (such as sugar or wine), subsectors where internationally the probability of having a SOE is less than 40 percent.
The government also invests together with the main business groups, for example, through the Industrial and Commercial Development Corporation (Centum’s shareholder) and the Development Bank of Kenya (shareholder together with Transcentury) or holds minority shareholdings in firms that operate in other sectors. In addition, minority government sharehold-ings in firms that compete with SOEs, or in more

34 cross-cutting constraints to private sector development
than one firm in the same subsector, persist in at least seven subsectors (for example, sugar milling, bank-ing, cement, hotels, and telecommunications). Direct competition from SOEs, links between competing firms through partial government shareholding, and a lack of competitive neutrality given weak de facto separation of regulatory and commercial activities in sectors such as electricity, air transport, telecom-munications, and agriculture might render entry and expansion of new players burdensome, thus limiting opportunities for socially impactful market creation. This can also create an environment in which firms do not have incentives to compete or increase their productivity, affecting their capacity to innovate and become competitive, generating negative spillover effects in downstream markets. Furthermore, SOE can access government resources that can masks their inefficiencies and distort the level playing field. In 2016, debt by parastatals — mostly by SOEs in railways and electricity — amounted to 7 percent of GDP, and SOE in agriculture, health and communications that carry out a mix of commercial and noncommercial activities generated deficits.
Policy RecommendationsOpportunities for market creation in Kenya and their impact on the economy could be enhanced through stronger market and competition policies, including through the following:
• Removal of regulatory barriers and government interventions that restrict entry and competition in various key sectors, including agriculture (tea, sugar, seeds); electronic communications (spectrum allocation, mobile payment systems); electricity generation; professional services (legal, architec-ture, quantity surveying); insurance, and trans-port logistics.
• Improvement of systems and practices for the design of government rules and interventions. Regulatory management systems must be enhanced to better consider expected impacts, including on competition and market outcomes, and to reduce discretion in enforcement and inspection practices. While also factoring in other policy priorities, these improvements should address an uncontrolled system of market regulations at national and sub-national levels, as well as rules that allow for par-ticipation of incumbents in government decisions, differential treatment of foreigners, government commercial activities in markets, and trade barri-ers that create distortions to the level playing field.
• Improved governance and market discipline mechanisms toward SOEs to increase their effi-ciency and to refocus direct participation through majority or minority shareholding toward mar-kets where private participation is not feasible or desirable, to ensure competitive neutrality and help crowd in the private sector.
• Additional efforts for effective and strong compe-tition law enforcement to fight cartels and abusive behavior of dominant firms, including technical instruments to increase compliance and deterrence, as well as stakeholder engagement to support the implementation of competition policy in Kenya.
The Kenyan government should also consider refo-cusing government direct participation in markets where private sector operation is not feasible, subject SOE to market discipline and evaluate the government strategy of investment corporations and funds so that government investments minimize market dis-tortions and address market failures in a cost-effective manner. Increased governance and transparency of SOE operations and government investments in pri-vate operators, together with regulations that allow for contestability (particularly in enabling sectors), will create a better enabling environment for entry and expansion of investments and creation of more competitive markets.
Informality
In Kenya, similarly to many low- and most middle-in-come countries, informal firms make up the majority of all enterprises. According to the Kenya National Bureau of Statistics, in 2014, about 95 percent of the country’s businesses remained in the informal sector. About 83 percent of total Kenya’s employment is informal, with more than two-thirds of informal sector jobs are concentrated in trade, restaurants, and hotels. Employment in the informal sector is associated with significantly lower levels of poverty than those experienced in farming.
Kenya’s informal sector is quite dynamic. According to the KNBS (2015b), of the 800,000 new jobs cre-ated in the economy in 2014, 700,000 were created by informal enterprises. However, consistent with experiences of other countries, there has been a significant productivity gap with the formal sector. In Kenya, the mean value of labor productivity for formal micro firms is about 8.4 times that of infor-mal firms surveyed. The corresponding gap for the

35KENYA COUNTRY PRIVATE SECTOR DIAGNOSTIC
median level of labor productivity is 3.8 times. But there has been considerable variation in productivity among informal businesses (box 3.1).
Given that a large proportion of informal workers belong to the low-income category, higher formalization as well as enhanced labor productivity in the informal sector would be essential for reducing poverty and improving the living conditions of relatively poorer sections of society. The barriers for formalization remain significant, however. The informality survey conducted in Kenya in 2013 asked firm owners if they would like their firms to be registered. Only close to 53 percent of the respondents replied positively to the question. The desire to register is more common among firms that are larger and more dynamic, and firms that face water, electricity, crime, access to land, access to finance, and corruption constraints. The costs associated with registering and taxes that reg-istered businesses have to pay are the most common reasons for surveyed firms not registering, but there are sharp differences by region, firm productivity, and education level of the manager.
Policy RecommendationsPublic intervention through policy improvements could effectively address the informal economy if businesses and government could find a way to join forces on a shared effort to continuously improve the overall business environment and strengthening tax
compliance, and recognize that each party can take actions aimed at improving mutual circumstances. Through effective public-private dialogue, policy makers could design measures focused on the spe-cific informal groups.
Policy recommendations between large and small informal firms are likely to be different. For large and sophisticated medium enterprises, the goal for policy makers should be to bring them under formal tax regime. For small informal firms, the policy inter-ventions could form programs to help them through training, improved access to microcredit and business development services.
In the context of Kenya, it is essential to acknowledge the heterogeneity of informal economy. The appro-priate policy response to various situations could be dramatically different. To improve the understanding of the breadth and depth of the informal segment, the authorities could:
• Conduct a detailed assessment of the informal sector output and employment.
• Develop new policies to help businesses move from the informal to the formal sector and gen-erate better jobs.
• Promote stronger links with the formal sector through development of programs to increase links between small and medium enterprises and larger companies.
BOX 3.1 VARIATION IN PRODUCTIVITY AMONG INFORMAL BUSINESSES AND MAJOR OBSTACLES FOR ITS IMPROVEMENT
Variation in labor productivity in the sample of surveyed informal businesses is significant. Labor productivity is much higher in the manufacturing sector compared with the services sector. Labor productivity is also higher among relatively older firms and firms with more educated managers. For example, labor productivity for firms with managers that have no education or only primary education is only 72 percent of that of firms with managers that have vocational training or a university degree.
It is worth noting that gender disparity is less substan-tial among informal firms compared to firms in the formal sector. That is, although labor productivity is significantly lower for firms with female managers among informal and formal micro firms surveyed, this gender-based gap is significantly smaller among informal businesses.
About 27 percent of the informal firms surveyed expended their activities reported over the last three years. Data on economic expansion, measured by an increase in employees, machines, and space used, sug-gest that firms that are older, those with more educated managers, and those located in the Central and Nairobi regions are more dynamic.
Access to finance is consistently identified as the largest development obstacle for informal firms surveyed in Kenya, with over 60 percent ranking it as the number one obstacle. Other key constraints include electricity, access to land, and corruption.
Source: World Bank Group 2013; 2016d.

04ENABLING SECTORS
Finance and insurance
Energy
TransportHealth
Information and communication
technology

37KENYA COUNTRY PRIVATE SECTOR DIAGNOSTIC
Finance and Insurance
Sector BackgroundKenya’s relatively large and diversified financial sector is multiregulated and comprises the banking, insurance, pensions, financial markets infrastruc-ture, and capital markets subsectors. The country is known worldwide as a leader in mobile payments and financial access is relatively broad. For example, over 80 percent of the adult population has access to an account at a financial institution, compared with 59 percent in Uganda and 47 percent in Tanzania. Kenya also enjoys one of the highest penetrations in digital finance, with 72 percent of adults having used mobile banking in 2017. With about 93 percent of Kenyans conducting everyday transactions online, mobile payments dominate. Indeed, the expansion of the sector’s leading company, M-Pesa, is considered an unparalleled case by which a company originally set up to manage microloans through mobile phones ended up dominating a significant amount of transactions.15 Progress made in expanding financial inclusion in Kenya is attributed to rapid innovation by the private sector in collaboration with the public sector. The expansion of retail banks into lower-income markets and the regulation of credit-only microfinance insti-tutions has led to an expansion in deposit accounts, branches, and agents. Financial institutions have also introduced agency banking, lowering the costs of providing financial services.
The financial sector is dominated by the banking sector. Banking assets currently stand at about 60 percent of gross domestic product (GDP). Kenya’s banking sector has undergone rapid structural change over the past decade. The banking sector has been fraught by two main challenges: (1) the deteriorating asset quality brought about by spillover effects of a challenging operating environment experienced in 2017 due to elections and (2) the capping of interest rates, which has led to subdued growth in the credit extended to the private sector. Cross-industry and cross-border integration has contributed to greater interconnectedness of financial systems, both nationally and internationally. Financial innovation is creating a more complex financial system in terms of the intricacy of financial instruments, the diversity of activities, and the concomitant mobility of risks.16 Kenya is one of the most densely served African countries, with 42 banks for a population of just over 45 million people. It is therefore expected that the banking sector will consolidate over the next few years.
The Kenyan capital market is the largest in East Africa and third largest in terms of capitalization in
Sub-Saharan Africa, after South Africa and Nigeria. The capital market is dominated by equities and government bonds. An automated bond-trading platform has been introduced linking the Nairobi Stock Exchange (NSE) and the Central Bank of Kenya (CBK), which has contributed to an increase in government-bond trading. However, volumes are well below their potential and a reliable government bond yield curve still needs to be developed. Market capitalization for listed companies on the NSE grew by 31 percent in 2017, rising to K Sh 2.5 trillion as of December 2017. The NSE remains concentrated as the top 10 companies accounted for 80 percent of the market capitalization as of December 2017. To address the issue of low number of listings as well as slow uptake of the capital markets products in Kenya, the Capital Markets Authority (CMA) has embarked on offering incentives to attract compa-nies with the potential to list to the bourse, which include lower corporate taxes, reduced listing fees, and tax amnesties.
The Kenyan insurance sector, although considered one of Africa’s most mature markets, it remains under-developed and comprises a relatively large number of companies. The industry has 45 insurance companies, two reinsurance companies, 154 insurance brokers, and 4,205 insurance agents. The primary business line for insurance companies in Kenya is motor insurance, a frequent phenomenon in developing markets given that motor third-party liability is often mandatory. According to the Insurance Regulatory Authority’s 2016 annual report, insurance penetration in Kenya stands at 2.73 percent, which is considered low com-pared with a world average of 6.28 percent. In 2017, the insurance industry recorded a nominal growth of 6.3 percent. Despite marginal nominal growth, the general insurance business still dominated the industry by a premium of 60.4 percent. The industry asset base increased by 11.8 percent in 2017, which was largely composed of investments at 81.9 percent. Insurance penetration, which is the ratio of Gross Direct Insurance Premiums to GDP, remained relatively stable at 2.7 percent compared to a world average of 6.1 percent and 3.0 percent for Africa.
Kenya’s pensions system manages assets valued at about 17 percent of GDP. The pension sector grew its assets under management by 13.6 percent, from K Sh 831.8 billion in June 2016 to K Sh 963.1 in June 2017, driven mainly by growth in investments quoted equities and immovable property.17 Pension coverage among employed Kenyans hit 20 percent

38 enabling sectors
in fiscal 2017, going up from 16.7 percent in fiscal 2015, with over 80 percent of the workforce in the informal sector having no social security or pension coverage. Growth in assets is attributed to improved compliance, gradual recovery in the stock market after the bank crisis in 2016 and modest recovery in property market.
Sector Performance and Key Challenges
BANKING SECTORDespite its success, which is unparalleled in Sub-Saharan Africa, Kenya’s financial sector faces several challenges. Credit growth has slowed significantly since 2015, reflecting a series of shocks, including the enactment of interest rate caps by the Banking (Amendment) Act 2016 in September 2016. Since 2015, the CBK has also stepped up oversight of the banking sector, underscoring the need for higher loan-loss provisioning (after three smaller players folded in fiscal 2016, namely Dubai Bank, Imperial Bank, and Chase Bank). The stock of private sector credit-to-GDP fell to 29 percent in 2017, from a high of 36.2 percent in 2015. In June 2018, the Cabinet Secretary for Finance announced that the interest rate cap would be repealed. As banks’ operations adopted more technology, threat to cybersecurity became real in 2017, prompting the CBK to issue a Guidance Note to banks on cybersecurity in August 2017, as a preemptive measure to mitigate the growing threat.
ACCESS TO FINANCEIn the 2019 Doing Business report, Kenya improved by 19 positions to rank 61 globally with notable improvements on protecting minority investors, getting credit, and resolving insolvency scores. Kenya’s best indicator is “Getting Credit,” in which the country ranks at 8 globally, an improvement from 29 globally in the 2018 Doing Business report. Kenya improved on access to credit by implementing a functional secured transactions system. The new law regulates functional equivalents to loans secured with mov-able property, such as financial leases and fiduciary transfer of title. Firms participating in the World Bank Group’s Enterprise Survey (2013) reported better-than-average access to most forms of formal finance than elsewhere in Sub-Saharan Africa, with a markedly lower reliance on internal finance for investment. Over one-third of firms reported that they had a bank loan or a line of credit, compared with roughly one-quarter in the rest of Sub-Saharan Africa. Over 90 percent of Kenyan firms had a bank account. However, in recent years, credit growth has
slowed significantly from its peak of about 25 percent per year in mid-2014 to just 1.6 percent in August 2017, the lowest level in over a decade (figure 4.1). The implementation of interest rate caps, beginning in the last quarter of 2016, is a key factor making it difficult for credit growth to recover (see box 4.1).18
The banking sector has also experienced higher credit risk than usual, as evidenced by the deteri-oration of asset quality following increased share of nonperforming loans (NPLs), reflecting some common subregional trends (figure 4.2). The ratio of NPLs to gross loans increased from 10.8 percent (K Sh 259.2 billion) in end of fourth quarter 2017 to 11.8 percent (K Sh 287.2 billion) by the end of first quarter 2018. In addition, falling profitability and/or extended losses inhibit banks’ ability to build up sufficient reserves and capital buffers through retained earnings. Nonetheless, the adoption of new prudential and risk-management guidelines and the opening of three private credit bureaus (over 2010 – 15) are helping strengthen banking sector resilience.
C APITAL MARKETAlthough Kenya boasts one of the most sophisticated capital markets on the African continent, it is none-theless faced with challenges. The financial sector is inordinately skewed toward banking institutions that are unable to provide long-term capital on an adequate basis. Furthermore, Kenyan banks are struggling to become active players in the equity and bond mar-kets. Several key gaps and market weaknesses exist, including a limited number and small size of new equity and debt issuances, and limited diversity of capital-market products and services amid increasing
FIGURE 4.1 GROWTH IN PRIVATE SECTOR CREDIT
2014 2015 2016 2017 2018
1.4%25.8%
Source: Data from the Central Bank of Kenya.

39KENYA COUNTRY PRIVATE SECTOR DIAGNOSTIC
FIGURE 4.2 NPLS RATIO TRENDSKenya and EAC peers (% of total)
appetite for investment, especially among institutional and foreign investors. Risks in the capital markets include high concentration by counters and inves-tor category, low liquidity, low product uptake, and political and economic risks. Although the NSE is the fourth-largest stock exchange on the continent in terms of trading volumes, only a small propor-tion of the 56 companies listed attract significant trading volumes. As of December 2017, the market concentration risk exposure of the top five companies by market capitalization was 64.83 percent. Despite active efforts by the government to attract capital investments, the NSE continues to have a low turnover ratio, low market capitalization-to-GDP ratio, and low value of stock traded-to-GDP ratio. The CMA has raised concerns that Kenya has been unable to achieve its projected listings targets as articulated in its Capital Markets Master Plan, which envisions at least four listings on the NSE every year. The NSE has struggled to attract new listings, having only raised K Sh 4.2 billion in two initial public offers in the last 5 years. The bourse has 64 listed stocks with a total market capitalization of K Sh 2.16 trillion, of which Safaricom controls 44.0 percent market share. The CMA has been engaging stakeholders includ-ing the NSE, National Treasury, Central Depository and Settlement Corporation, and Fund Managers Association. The NSE’s remedy strategy includes intro-ducing an incubator board designed to accelerate the growth and success of entrepreneurial companies, through an array of business support resources and services to nurture firms that are not ready to list but have promising prospects. This is geared toward helping develop a pipeline of successful businesses for possible listing on the exchange A strengthened policy and regulatory environment and improved market infrastructure are required to support the market’s development, efficiency, and integrity. There is also a clear need to focus on corporate governance and strengthening supervision.
HOUSING CREDIT MARKETKenya has a very limited yet developing mortgage portfolio. There are only an estimated 24,085 mort-gages across the country, most in excess of $50,000. Limited mortgage lending can be attributed to more attractive, lower-risk investments (including Treasury bonds), limited bank liquidity (now being addressed through the creation of a mortgage liquidity facility), constrained development of mortgageable units, and limited affordability as well as increasing indebtedness of households. There is a need to deepen housing lending, increase liquidity in the sector, improve credit
Source: Data from the Bank of Tanzania, Bank of Uganda, Central Bank of Kenya, and the National Bank of Rwanda.Note: NPLs = nonperforming loans; EAC = East African Community.
2015 2016 2017 20182014
9.5
10.9
8.1
0
2
4
6
8
10
a. Tanzania
0
2
4
6
8
b. Kenya
0
2
4
6
8
c. Rwanda
0
2
4
6
8
10
d. Uganda
6.3
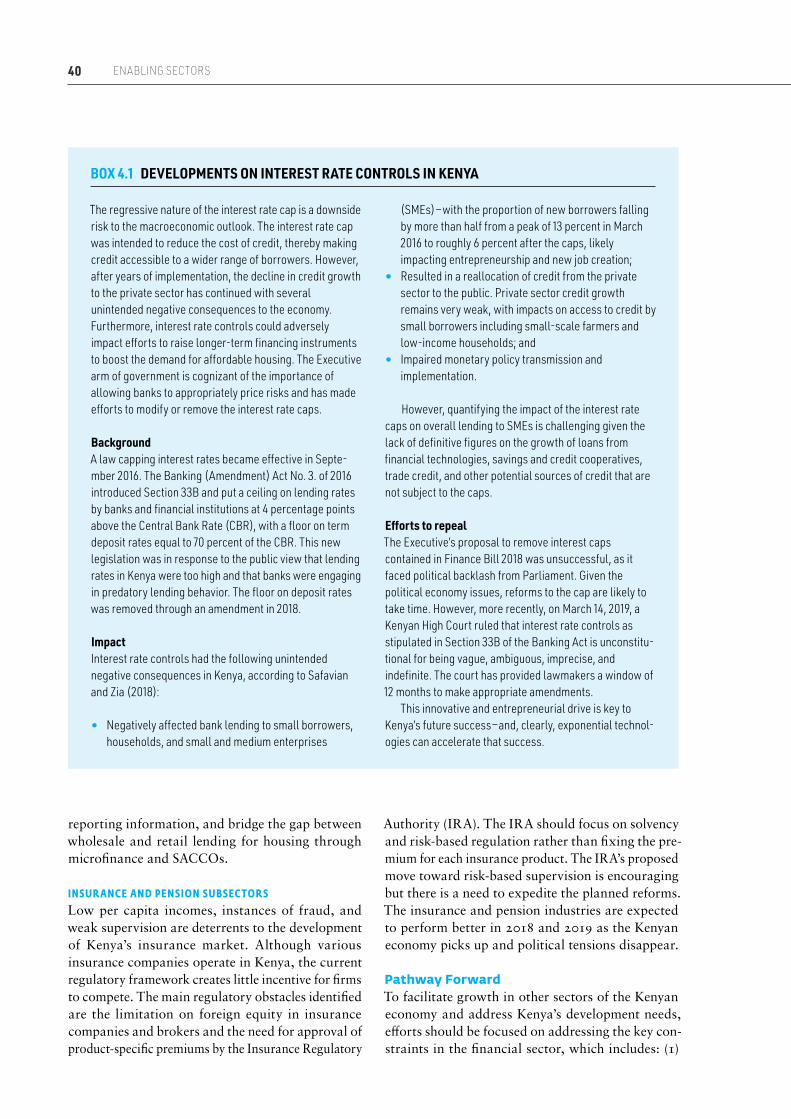
40 enabling sectors
reporting information, and bridge the gap between wholesale and retail lending for housing through microfinance and SACCOs.
INSUR ANCE AND PENSION SUBSECTOR SLow per capita incomes, instances of fraud, and weak supervision are deterrents to the development of Kenya’s insurance market. Although various insurance companies operate in Kenya, the current regulatory framework creates little incentive for firms to compete. The main regulatory obstacles identified are the limitation on foreign equity in insurance companies and brokers and the need for approval of product-specific premiums by the Insurance Regulatory
Authority (IRA). The IRA should focus on solvency and risk-based regulation rather than fixing the pre-mium for each insurance product. The IRA’s proposed move toward risk-based supervision is encouraging but there is a need to expedite the planned reforms. The insurance and pension industries are expected to perform better in 2018 and 2019 as the Kenyan economy picks up and political tensions disappear.
Pathway ForwardTo facilitate growth in other sectors of the Kenyan economy and address Kenya’s development needs, efforts should be focused on addressing the key con-straints in the financial sector, which includes: (1)
BOX 4.1 DEVELOPMENTS ON INTEREST RATE CONTROLS IN KENYA
The regressive nature of the interest rate cap is a downside risk to the macroeconomic outlook. The interest rate cap was intended to reduce the cost of credit, thereby making credit accessible to a wider range of borrowers. However, after years of implementation, the decline in credit growth to the private sector has continued with several unintended negative consequences to the economy. Furthermore, interest rate controls could adversely impact efforts to raise longer-term financing instruments to boost the demand for affordable housing. The Executive arm of government is cognizant of the importance of allowing banks to appropriately price risks and has made efforts to modify or remove the interest rate caps.
BackgroundA law capping interest rates became effective in Septe-mber 2016. The Banking (Amendment) Act No. 3. of 2016 introduced Section 33B and put a ceiling on lending rates by banks and financial institutions at 4 percentage points above the Central Bank Rate (CBR), with a floor on term deposit rates equal to 70 percent of the CBR. This new legislation was in response to the public view that lending rates in Kenya were too high and that banks were engaging in predatory lending behavior. The floor on deposit rates was removed through an amendment in 2018.
ImpactInterest rate controls had the following unintended negative consequences in Kenya, according to Safavian and Zia (2018):
• Negatively affected bank lending to small borrowers, households, and small and medium enterprises
(SMEs) — with the proportion of new borrowers falling by more than half from a peak of 13 percent in March 2016 to roughly 6 percent after the caps, likely impacting entrepreneurship and new job creation;
• Resulted in a reallocation of credit from the private sector to the public. Private sector credit growth remains very weak, with impacts on access to credit by small borrowers including small-scale farmers and low-income households; and
• Impaired monetary policy transmission and implementation.
However, quantifying the impact of the interest rate caps on overall lending to SMEs is challenging given the lack of definitive figures on the growth of loans from financial technologies, savings and credit cooperatives, trade credit, and other potential sources of credit that are not subject to the caps.
Efforts to repealThe Executive’s proposal to remove interest caps contained in Finance Bill 2018 was unsuccessful, as it faced political backlash from Parliament. Given the political economy issues, reforms to the cap are likely to take time. However, more recently, on March 14, 2019, a Kenyan High Court ruled that interest rate controls as stipulated in Section 33B of the Banking Act is unconstitu-tional for being vague, ambiguous, imprecise, and indefinite. The court has provided lawmakers a window of 12 months to make appropriate amendments.
This innovative and entrepreneurial drive is key to Kenya’s future success — and, clearly, exponential technol-ogies can accelerate that success.

41KENYA COUNTRY PRIVATE SECTOR DIAGNOSTIC
the availability of “affordable” credit to businesses, especially SMEs and households and (2) the scarcity of long-term finance. Some of the specific reforms that are being supported by the World Bank Group include the following:
• Reforming financial architecture. (1) Consolidation of all the nonbanking regulators into a single finan-cial services authority, (2) reforms necessary to create an investor-friendly environment, (3) an improved interface for the public to access public services through the digitization of the payments for these services, and (4) strengthening of market conduct supervision.
• Modernizing supervision. New challenges have confronted nonbanking regulators as markets have reached out to new clients with new prod-ucts. Keeping up with these developments involves filling regulatory gaps and supporting adoption of best practices related to consolidating super-vision, and so on.
• Improving credit reporting by enhancing trans-parency in the process. This will allow financial service providers to participate in credit infor-mation sharing.
• Strengthening the regime for moveable collateral. This will facilitate increased lending to SMEs at affordable rates by supporting the necessary legal and regulatory reforms for secured transactions, followed by the optimization of the already exist-ing electronic moveable-assets registry.
• Expanding the availability of alternative sav-ings instruments. The focus here is on facilitat-ing additional savings mobilization by developing alternatives to bank deposits, such as purchases of government bonds by retail investors using the mobile platform.
• Introducing new instruments to channel financ-ing. Such instruments could include infrastruc-ture project bonds and funds, Shariah-compliant instruments, and housing finance products. Other instruments that could be improved to support infrastructure, as well as other long-term financ-ing needs (for example, housing and SME financ-ing), include securitization and equity markets.
Other possible private investment opportunities:
• Investing in innovation funds for creative pri-vate sector – led products to enhance access to finance for underserved populations, particu-larly through mobile financial services. Digital platforms have transformed from simple mobile-
money transfers to unlocking savings, loans, invest-ments, and insurance opportunities. However, 17.4 percent of the population remains excluded from both formal and informal financial services. In addition, the adoption rate of mobile financial ser-vices in the underserved groups, such as women, rural residents, farmers, and the youth, is low. Furthermore, whereas about 88 percent of the population have mobile phones, only 71.4 percent are users of mobile financial services, highlighting an untapped opportunity to expand mobile finan-cial services among mobile-phone users.
• Liquidity and development of SACCOs. Kenya’s vibrant SACCO sector continues to pilot mech-anisms for land purchase, development, and the provision of household-related finance. Assistance to strengthen the corporate governance and finan-cial systems and ability to mobilize capital and disburse retail loans by SACCOs offer a signifi-cant opportunity to improve access to land, hous-ing, and housing finance.
• Demand is strong for investment products. A mobile-based government bond, M-Akiba, was launched in April 2017 to enhance the savings and investment culture in Kenya in a bid to enhance financial inclusion for economic development while raising finance for the government that will be dedicated to infrastructural development proj-ects. High retail investor appetite for the M-Akiba bond shows that leveraging digital channels can open new financial opportunities for the security issuer as well as tap into a new segment of retail bond consumers.
• Potential for innovations in insurance products. Insurance providers can explore the use of index-based insurance products to reach into high-risk, underserved areas. Insurers can more accurately price insurance products and thus reduce the risk of insurance cover in drought-prone regions.
These products include weather-index, area-yield index, and satellite-based rainfall index insurance, among others. To reduce the costs of offering financial services in rural areas, that is, those mostly affected by weather-related shocks, providers are also increasingly leveraging mobile technology. Service providers could distribute their products among rural populations and deploy mobile-based products to enable users to open accounts, save money, and pay for health care services, all via their mobile devices (CMA and others 2018).

42 enabling sectors
Energy
Sector Background
ENERGY SECTOR POLIC YThe Energy Act of 2006 provides the regulatory frame-work in Kenya, with a fairly advanced structure, significant and growing presence of independent power producers (IPPs), unbundling and partial privatiza-tion of national utilities, and cost-reflective tariffs (Power Africa 2015). The Ministry of Energy and Petroleum articulates policies in the sector and the Energy Regulatory Commission (ERC) regulates bulk tariffs for electricity generation and distribution and transmission charges. The Energy Act requires the regulator to ensure that the rates and tariffs established in electricity sale contracts, transmission, and distri-bution are just and reasonable although, as discussed in previous sections, high electricity costs remain a key constraint to private sector development.
POWER GENER ATIONSince 1997, Kenya has attracted significant private sector participation in power generation. Currently, there are 10 IPPs that generate power across 15 plants — three small-scale hydro plants, one geothermal plant, one biomass plant, and 10 fuel-oil plants. They account for about 30 percent of installed generation capacity (over 658 megawatts), with $2.4 billion in private equity and commercial loans mobilized to finance privately owned power plants. The remaining 70 percent of capacity is owned and operated by KenGen. Their sustainability — the first two privately owned generation operations were commissioned in 1997 — has been underpinned by stable sector investment conditions.
The private sector plays a key role in power gen-eration, particularly in the operation of diesel-fired plants, together with geothermal and wind genera-tion, whereas the state-owned KenGen dominates in hydropower. Financing of private sector investment in power generation has benefited from the World Bank Group’s Multilateral Investment Guarantee Agency political risk insurance. Kenya has 2,295 megawatts of installed on-grid capacity across 42 plants, plus an additional 11.5 megawatts in 19 off-grid stations in remote parts of the country. Installed capacity consists of 70 percent renewable sources, with potential to produce 10,000 megawatts of geothermal power from the Rift Valley Basin. Kenya is one of the lowest-cost developers of geothermal power in the world.
The government is already focused on delivering new electricity generation infrastructure while also providing new generation capacity to support the
Vision 2030 program. Most of the new generation will come from renewable energy sources. The role of the private sector is expected to grow in financing investments, especially in renewables.
POWER TR ANSMISSIONKenya has 4,149 kilometers of transmission lines, all of which are either 132 or 200 kilovolts. Kenya Electricity Transmission Company (KETRACO) is in the process of constructing about 4,500 kilometers of new lines, more than doubling the transmission network and introducing Kenya’s first high-voltage 400 kilovolt and 500 kilovolt DC transmission lines, as well as three major regional interconnectors to Ethiopia, Uganda, and Tanzania. Beyond these lines that are under construction, KETRACO is planning a further 4,200 kilometers of lines to expand and strengthen the grid.
POWER DISTRIBUTIONThe Kenya Power and Lighting Company (KPLC), a state-owned monopoly, is the sole distribution company, operating Kenya’s interconnected grid and several off-grid stations. As the single off-taker, the KPLC negotiated power purchase agreements (PPAs) with generation providers and provided energy to 3.6 mil-

43KENYA COUNTRY PRIVATE SECTOR DIAGNOSTIC
lion customers. The KPLC nearly doubled access in Kenya over the 4 years from 2011, from 26 percent of households in 2011 to 46 percent in 2015, with the assistance of the Rural Electrification Authority.
Sector Performance and ChallengesThe national power supply is increasing to meet growing demand. Electricity generation continues to show a strong upward trend, underpinned by new investment from both the state and private investors. Demand is similarly strong, helped by the expansion of the electricity grid, including into rural areas. Power available for distribution increased by 5.8 percent per year on average in the 2010 – 17 period — and quickened to 8.1 percent year-on-year in the first half of 2018 — outpacing growth in the wider economy.
Rural electrification still needs to be improved further. Kenya has also aggressively pursued connec-tions, having nearly doubled electricity access from 25 to 46 percent of households in four years (Power Africa 2015). Figure 4.3 shows the peak demand and customer consumption trends. Yet, in some cases electrification rates are low, for example, in Western Kenya, at 5 percent for rural households and 22 per-cent for rural businesses, even in areas of good grid coverage (Lee and others 2015).
Blackouts, however, are frequent and affordability remains a concern. The Doing Business report gives Kenya credit for having improved the reliability of electricity and streamlined the process of connecting to the electricity grid. Despite this, however, from the private sector’s perspective, reliability and high costs associated with power supply remain major issues. Firms pay high energy costs at $0.21 per kilowatt hour
(kWh) (versus $0.18/kWh in Nigeria, $0.10/kWh in South Africa, and $0.08/kWh in China and India), with the electricity bill accounting for a dispropor-tionate amount of total operating expense — in some cases over 50 percent according to the Enterprise Survey. Similarly, frequent power outages, which affect up to 90 percent of firms, undermine produc-tivity and increase the costs of doing business, with many businesses and residential complexes opting for secondary, local power generation capacity.
Total energy losses within the electricity network operated by the KPLC have increased and are likely to be about 20.53 percent in 2018, up from 18.8 percent in 2017, an increase of about 1.7 percent, representing a significant financial and operational burden on the utility. This contributes to high cost of electricity which is a major obstacle to private sector development. Electricity tariff is already viewed as being high from the industrialization perspective, and commercial losses are the main driver. To address this widespread business concert, in July 2018, the ERC and Kenya Power announced an 8 percent drop in electricity costs to make electricity more accessible particularly for SMEs.
Other challenges:
• High government financial exposure to the energy sector. If the Kenyan government delivers on trans-mission and distribution targets, the sector may exceed 20 percent of the total government debt burden. PPAs may also sit as contingent liabili-ties on the sovereign balance sheet.
• Inconsistent processes that make securing financing difficult. An unclear approach to project selection
FIGURE 4.3 PEAK DEMAND AND CUSTOMER CONSUMPTION TREND
2014 20162013 2015 2017 20180
2,000
1,500
1,000
500
2014 20162013 2015 2017 20180
9,000
7,500
6,000
4,500
3,000
1,500
Source: Data from ERC 2018.Note: Sales for 2018 is a projection.
a. Peak demand (megawatts) b. Sales (gigawatts per hour)

44 enabling sectors
at the expression of interest stage, the inconsistent application of the PPA negotiation process, chal-lenges in securing land, and lack of a standard approach to the government’s Letters of Support make securing financing challenging and also lead to cost overruns due to delays, particularly for IPPs.
• KETRACO does not have a cost-reflective com-mercial model. The state-owned enterprise (SOE) relies on the government for financing through grants rather than its own balance sheet. Electricity tariff is not fully cost reflective, but raising it rep-resents a challenge, given that it is already viewed as being high from the industrialization perspective.
• KenGen’s balance sheet indicates that it cannot take on significantly more debt to fund expan-sion, whereas the Geothermal Development Company’s revenue model is not sufficient to cover its true costs due to an implicit government subsidy. Furthermore, there are no safeguards to guarantee competitive neutrality between private operators and SOEs in generation, for example, in terms of access to state support measures, access to primary sources of energy, and participation in energy planning.
• Lack of affordable financing for private off-grid developers. Due to smaller-scale financing needs and more innovative technologies, private play-ers have difficulty securing affordable financing tailored to their needs.
Pathway ForwardDoubling the electrification rate over the next four years will require a careful planning process to opti-mize the use of available resources, a high degree of coordination at the institutional level, a clear and transparent mechanism to involve the private sector in the process, and the availability of resources to make the investments happen.
Beyond the optimization of the planning process, financial resources will need to be available to imple-ment the universal access programs — either through grid extension or a set of off-grid alternatives. A share of these resources can come from existing users through levies on electricity consumption or similar measures, but a significant share will most probably have to be financed by a combination of national treasury resources and international development partners, for example, using output-based aid schemes.
If private participation and market competition are to be bolstered, new primary and secondary leg-islation will likely be required, as well as capacity building for the ERC and the Ministry of Energy.
This will help ensure that the design of the market mechanisms promotes rational, fair, and transparent competition among the market players.
TR ANSMISSIONThe current financing model for KETRACO needs to be reviewed from the perspective of moving it toward a commercial model and to shift the burden from the government. The Kenyan government should consider allowing private participation. An example could be a build-operate-transfer contract, similar to what has been done in Peru and Brazil. These structures can be later interconnected to the grid. There are discussions on conducting a pilot: a $200 million project, which would consider a PPP structure. This pilot may potentially include IFC acting in an advisory capacity.
DISTRIBUTIONReducing losses is a key priority. The KPLC’s policies on metering need to be reviewed and a more in-depth separate independent analysis may be required for handling both new and existing residential and com-mercial consumers.
MINI- GRIDSRegulatory framework on mini-grids need to be finalized and the energy bill needs to be enacted. An alternative could be a concessions model, for exam-ple, giving the private sector vertically integrated mini-grid concessions with three clearly identified regulatory periods of five years each. Given techno-logical advances, the off-grid concessions should be for electricity (solar, wind, batteries), communica-tions (cellular and internet), and banking (fintech). The concession would not be only vertically but also horizontally integrated to attract the private sector to the isolated areas. If successful, the pilot could then be scaled up.
WHOLESALE MARKETKenya’s system is large enough to implement a whole-sale electricity market that could be instrumental in helping with the penetration and balancing of inter-mittent renewables and price discovery. It has the potential to be the first country in Africa to implement a wholesale electricity market where generators can sell their surplus or buy their deficit generation to settle their PPA commitments.

45KENYA COUNTRY PRIVATE SECTOR DIAGNOSTIC
Transport
Sector BackgroundVision 2030, the government’s long-term development plan, calls for the removal of bottlenecks for growth through necessary reforms to transform Kenya from a low to a middle-income country by 2030. To this end, Vision 2030 is calling for up to $2.1 billion to be spent annually to interconnect the nation’s roads, railways, ports, airports, water and sanitation facil-ities, and telecommunications networks.
Kenya has comparatively better transport infrastruc-ture and services than other countries in the region. The country has improved its ranking on quality of overall transport infrastructure from 72nd in 2015 to 56th in 2017 (out of 138 countries) in the World Economic Forum’s Global Competitiveness Index (GCI). It ranks behind Namibia (52), and South Africa (29), but is ahead of most other Sub-Saharan African countries.
Kenya’s transport infrastructure network consists of a single commercial seaport in Mombasa, which handles most of the cargo that enters the country and the region, a single narrow gauge-track inter-national rail network consisting of a mainline and a few branch lines which is being gradually replaced by a new standard gauge railway, and a classified road network of about 160,000 kilometers (map 4.1).
The sector contributed 9.7 percent of GDP growth in 2016, fueled by major projects in several subsectors,
including railways, airports, and road rehabilitation and expansion. Road-based transport is the dominant mode carrying 93 percent of all freight and passenger traffic in Kenya, with the remaining share spread between other lower-cost and lower-emissions modes, such as railways and inland waterways, accounting for a minimum share.
Sector Performance and Key ChallengesAlthough Kenya has witnessed major transport devel-opment over the past 5 years, as evidenced by several investments in expansion, development, and modern-ization of roads, railways, and ports, the country’s infrastructure needs are vast and high transport costs put pressure on businesses. Kenya is ranked 69th in the GCI on transport infrastructure, behind Rwanda (68th), Namibia (52nd), and South Africa (29th), but still above most other Sub-Saharan Africa countries. However, the main transport corridor serving Kenya and most of eastern Africa, the Mombasa-Nairobi Corridor, as well as the Mombasa Port, are still con-strained and congested, negatively affecting freight movements to and from the country. Constrained mobility within the major cities also imposes significant economic inefficiencies on city economies. According to the World Bank Group’s 2013 Enterprise Survey, Kenyan businesses are particularly affected by the lack
MAP 4.1 KENYA’S TRANSPORT INFRASTRUCTURE
Airports (1,000 passenger per year)
>5,000750–5,000<750
Ports
Direct Direct and transhipment
Road traffic (average annual daily traffic)
Unknown <100 100–300 300–1,000 >1,000
Railroad (million traffic per year)
Not operating 0.5–1.0 1.0–2.0 >2.0<0.5
Road type and condition
PavedUnpaved
Good Fair Poor Unknown
Source: Adapted from Briceño-Garmendia and Shkaratan 2011.

46 enabling sectors
of infrastructure, identified as a top constraint for doing business. PPPs for transport infrastructure are yet to be tested. Furthermore, regulatory frameworks need to be updated and properly enforced to ensure efficiency of sole operators (including improving cor-porate governance of SOEs), guarantee access to key infrastructure by private providers of downstream services, and prevent uncompetitive practices that raise the cost of transport and logistics services.
FINANCIAL SUSTAINABILIT Y OF THE NET WORKArguably the most pressing issue the transport sector faces is the public capture of key infrastructure assets — from ports to airports and railways — which has led to suboptimal financial and operational per-formance. The economic efficiency of Kenya’s logistics network is suffering because of excess capacity in combined road and rail infrastructure on the northern corridor, as well as price distortion linked to unsustain-able public policies. Projects under way (for example, Lamu port) or planned (that is, reconstruction and expansion of the Mombasa to Nairobi highway and Nakuru-Nairobi highway) may further lower the economic efficiency of Kenya’s logistics network as excess long-haul infrastructure transport capacity will increase the risk that the overall network becomes financially unsustainable and, hence, ill-maintained.
INSUFFICIENT SPENDING IN URBAN TR ANSPORT PROJECTThe sizeable public sum of money spent on selected mega projects is constraining much needed public investment in urban corridors that are key to promot-ing urban mobility and ultimately economic growth. For instance, Nairobi is among the most congested cities in the world with estimates suggesting that the city loses $600,000 to congestion each day.
ROAD SAFET YThe World Health Organization estimated Kenya’s death rate at 31 per 100,000 people for 2013, which landed it on the top-20 worst countries worldwide for road-related deaths. This means that over 3,000 people die through road accidents every year, most of them young males between the ages of 15 and 44. The cost to the economy from these accidents exceeds $50 million, exclusive of the actual loss of life (Manyara 2013).
Kenya outperforms its peers on logistics but there are signs that the quality and competence is deteri-orating. It is also ahead of most of its neighbors in the World Bank’s Logistics Performance Index (LPI), ranking 68th (a score of 2.81) out of 160 countries surveyed and only surpassed by South Africa (33rd)
and Rwanda (57th) in the region. Judged by this index, however, the country’s logistics performance deteriorated sharply since 2016 in absolute and rela-tive terms, when Kenya ranked 42nd (a score of 3.33). In only two years, all components that measure the LPI deteriorated, particularly customs (from 39th to 67th), infrastructure (from 42nd to 79th), and timeliness (from 46th to 79th).
Although improvements in logistics capacity are gradually making it easier and cheaper to conduct business and helping cement Kenya’s role as a regional hub, progress is uneven and moving freight through-out the country is still far from seamless. There are reports that in the first month that the Mombasa-Nairobi line opened, only 1,600 containers out of roughly 80,000 processed in Mombasa chose the railway option mostly because of delays in loading and unloading trains at the existing multimodal facilities. Similarly, customs and border-crossing procedures are still essentially manual and relatively complex procedures. Any attempt to increase Kenya’s com-petitiveness in global markets will need to address inefficiencies in transport and trade-related logistics services as a means of promoting efficiency, innovation, and transparency in cross-border trade, increasing capacity and range of services and reducing the cost of doing business in the country.
REVENUE COLLECTION TO FUND MAINTENANCE AND ENSURE SUSTAINABILIT YSeveral road corridors in the country are expected to be tolled, yet, the regulatory and institutional framework needs to be finalized. A tolling policy has been approved by Cabinet, but Kenya does not have recent experience in implementing road tolling and free alternatives will not be available for all the toll roads. Local investors have raised concerns on the enforcement of toll collections and enquired about the possibility of credit enhancement to backstop the government’s obligations to pay availability payments should the toll revenues be insufficient.
Pathway ForwardEngaging the private sector as a financier and oper-ator of transport infrastructure. As the transport network expands in the coming years, it will be important to secure private participation in the design, construction, and operation phases, as a spate of multibillion-dollar projects break ground. Government borrowing (externally and internally, including through infrastructure bonds), concessional development partner lending, and private funding will jointly finance infrastructure developments. The

47KENYA COUNTRY PRIVATE SECTOR DIAGNOSTIC
passage of the 2013 PPP Act provides the legal frame-work for engaging the private sector, with several projects in airports, seaports, highways, and railways considered priority PPP projects. Efforts to structure the very first PPP transaction in the road sector are already under way, and the World Bank is providing operational and financial support with a guarantee. Indeed, the Nairobi-Nakuru Toll Road which will span 175 kilometers in one of Kenya’s densest corridors will promote capital market solutions to crowd-in local financiers into infrastructure PPP projects to create a fiscally sustainable way to finance PPPs. Applying this approach in the Nairobi-Nakuru Toll Road project will have a demonstration effect for all the PPP projects in the pipeline. It is made possible by the size of local institutional investors in Kenya and the well-developed capital markets.
The private sector is hence well positioned to har-ness investments in the sector, but some prior policy actions need to be taken to enable its active partic-ipation. Possible solutions to address main policy issues include the following:
• Financing. Mobilize private financing for the reha-bilitation and/or expansion of transport networks in subsectors considered commercially viable such as airports, logistics, and ports. Indeed, the gov-ernment’s divestment from port and airport infra-structure financing and management and from rail freight services and airlines operations could ease fiscal pressure and improve financial and opera-tional performance.
• Roads. Introducing sensitive road-pricing strategies in key transport corridors where freight movements are highest. For instance, there are plans to establish a National Toll Fund (NTF) to underwrite the gov-ernment’s recurring payment commitment to pri-vate operators who will be tasked with building new roads and bridges under a PPP scheme. Revenues collected by the NTF, in turn could support both new road expansion as well as maintenance with the use of the existing road fund private sector window to further back stop the NTF.
• Ports. Alternative ownership and management structures can be further explored by establish-ing a standard container and bulk freight con-cessions with private operators and/or seeking private sponsor financing for future expansion of the Mombasa port’s facilities.
• Rail. Review tariffs in line with expected operation cost at full capacity and unbundling of infrastruc-ture and services in the future through the possi-ble introduction of private freight train operators.
• Air transport. Restructuring of Kenya Airways by rebalancing the costs structure to control better operating, in particular, personnel expenses. The government’s divestment from airport infrastruc-ture financing and management and from airlines operations (as opposed to merging both into a large state-dominated entity as planned). Review of pre-vailing airport fee structure to achieve a higher level of cost recovery, for instance, by adjusting the domestic flight passenger tax.

48 enabling sectors
Information and Communication Technologies (ICTs)
Sector BackgroundThe ICT sector in Kenya is growing strongly and facilitating growth in other sectors of the economy by speeding the flow of information and resources (using mobile money). The sector has changed dramatically over the past decade, transitioning to a burgeoning market that has become one of the most vibrant in Africa.19 Nairobi is recognized as one of Africa’s tech hub cities (along with Lagos, Cape Town, and Accra), with the potential to foster and scale digital ecosystems. Kenya’s first technology and innovation lab, iHub, was established in March 2010 and has since become the centerpiece of a growing tech community with over 16,500 members and has several initiatives that catalyze this growth. Kenya now has 27 active technology hubs.20
Safaricom is the leading player in mobile services with over 72 percent market share, followed by Airtel with 18 percent.24 Safaricom — owned by the United Kingdom’s Vodafone, private shareholders, and the state — remains the leading player in all key segments, especially in mobile money, underpinned by its suc-cessful M-Pesa platform, which was launched in 2007, it allows users to send money, pay bills, and apply for loans through their mobile phones. The platform con-
trolled 81 percent of the market and had 22.6 million subscribers by the end of fiscal 2017. Its key competitors are Airtel (India) and Telkom (the former parastatal now under private equity ownership). The authorities are divided over whether Safaricom’s dominance is anticompetitive. The Competition Authority of Kenya believes the firm is not abusing its position, whereas the Communications Authority is less certain and may impose regulatory remedies. However, innovation could suffer unless these remedies are well-designed.
Big foreign names are showing an interest in Kenya. Several recent developments underline Kenya’s promi-nent role in ICT. In May 2018, for example, Microsoft announced plans to connect Kenya to its global cloud network and may establish a local data center in the medium term. At the same time, the company launched in Kenya its first software testing center in Africa. Google also has an active local presence. In addition, Kenyan startups are attracting significant amounts of capital: five local firms raised $91 million in the first half of 2018, more than half the total sum in Africa. In terms of total startup numbers during the period, Kenya was second (with 23), behind Nigeria (with 31), but raised more capital. Other examples

49KENYA COUNTRY PRIVATE SECTOR DIAGNOSTIC
include a tie-up in April 2018 between Safaricom and PayPal, the global e-payments firm, as well as the progressive rollout of 4G services by all local operators. E-commerce opportunities will increase, especially for services, although transactions involv-ing goods face delivery challenges, similar to many emerging markets.
The Kenyan government acknowledges the ICT sector's relevance as a facilitator of inclusive growth. Indeed, the government’s Vision 2030 recognizes the sector as a foundation for economic development and the Ministry of Industry, Trade, and Cooperatives has developed the Kenya Industrial Transformation Program.
Sector Performance and Key ChallengesKenya outperforms its Sub-Saharan Africa peers on mobile connectivity (figure 4.4). However, there are still gaps in its rural digital infrastructure because of limited infrastructure sharing, weak regulations, and a dominant market player (Safaricom). As a result, affordability of mobile broadband services is limited compared to its peers .
The benefits of ICT are starting to be felt in other sectors, for example, Kenya is recognized as having taken a leading role in using ICT to access financial services. Mobile banking penetration rates rose to 66 percent in December 2017, with more than 50 percent of iknternet subscribers having broadband accounts, mainly on mobile platforms. The sector is expected to maintain a brisk rate of expansion, driven by innovation and strong demand. Communications grew by 11 percent in real terms in 2017, outpacing growth in the wider economy and lifting its contribu-tion to GDP at factor cost to 4.6 percent, a significant increase of 3.1 percent in 2010. The public sector is also taking a lead in adopting ICT solutions, as evidenced by the digitization of key services such as tax payments and land records. The government is also pushing ahead with plans for a special ICT hub in Konza, a town 50 kilometers south of Nairobi, to harness and develop the country’s skills outside the capital. However, whether a dedicated, semiurban hub such as Konza can generate more benefits than the activities in Nairobi remains an open question.
FIGURE 4.4 ICT IN KENYA AND SUB-SAHARAN AFRICA: SELECTED PERFORMANCE INDICATORS
a. Population coverage (%) b. Penetration rates (%)
c. Quality d. Affordability
4G
2220
2G
49.6
45.9
3G/4G
24.9
19.478
533G
2G
94
88
Fixed-broadbandsubscribers per
100 people
0.3
1.3
Mobile network performance score
25.421.9
2.8 15
Fixed broadband speed (Mbit/s)
Fixed broadbandsubscriptionprice (PPP, $)
96.1
125.1Mobile tariff (%)
34.9 28.2
Sub-Saharan AfricaKenya
Note: Mbit/s = megabits per second; PPP = Purchasing power parity. Mobile network performance score (from 0 to 100) is the average of three scores covering mobile latencies (in milliseconds), mobile download speeds (in Mbit/s), and mobile upload speeds (in Mbit/s). Mobile tariff is the average percentage cost of a basket of mobile broadband services relative to gross national income per capita.

50 enabling sectors
Although the Kenyan government seeks to deepen broadband penetration and has undertaken a number of initiatives to this end, several policy issues ham-pered the development of the telecommunications sector and private investments.
The absence of a clear regulatory framework to promote infrastructure sharing limits efficiency and entry in all telecommunications markets, despite the finalization of the draft policy in the 2013 – 2017 National Broadband Plan. The absence of regulation led to unnecessary duplication of infrastructure, particularly in Nairobi and Mombasa, which has resulted in the inefficient use of capital in the industry, thereby limiting the expansion of digital infrastructure especially in rural areas. For instance, Safaricom, which has the largest portfolio of assets, is reported to only share 19 percent of its towers.
The lack of enforcement of necessary policies has failed to reduce current dominance in the mobile and fixed broadband markets. Safaricom’s provision of M-Pesa has enabled it to maintain its dominance in the mobile market and has threatened the financial sustainability and survival of other players. Competition is also limited in the fiber and wireless market where Wanachi and Safaricom dominate. As SOEs play a significant role in the telecommunications industry (mainly Telkom Kenya, Safaricom), there may be a conflict of interest for the regulator in providing fair treatment and a level playing field for the industry.
Spectrum allocation in Kenya was previously an issue with a lack of transparency and a “command-and-con-trol” approach that limited opportunities for smaller operators to enter the market. However, in September 2017, Kenya’s ICT ministry introduced a Wireless Broadband Spectrum Policy that subjects all Internet service providers and mobile network operators to a new law governing spectrum management.
The sector still faces challenges such as skills short-ages and legal framework weaknesses to harness the benefits of ICT infrastructure development. Despite the advances, ICT and innovation are held back by institutional weaknesses and public sector capacity constraints, especially in higher education, which is aggravating skills shortages. Although Vision 2030 envisages Kenya as the top offshoring destination in Africa and high expectations have been set, the country has so far failed to take off as a key des-tination for business process outsourcing. The key challenges include a lack of adequate skill levels and personnel, a perceived lack of public sector support, and Kenya’s procurement laws. The country is also vulnerable to cybercrime, especially given the prolif-eration of new services and users, the large sums of
money being transferred digitally, and the reactive rather than proactive approach taken toward secu-rity. The detection of threats is improving, helped by closer international collaboration, although the Computer Misuse and Cybercrimes Act of 2018 is facing criticism for its potential to stifle free speech, which could damage the ICT sector in the longer term. The law remains the subject of an ongoing legal challenge. The diversion of public resources through corruption and patronage is another danger.
Pathway ForwardPossible solutions to address the main policy and nonpolicy issues:
• Facilitate infrastructure sharing to improve cov-erage and efficient use of capital, development and implementation of regulations to drive infra-structure sharing, for towers and fiber in partic-ular. In a competitive market, cost savings from improved operating efficiency are expected to be passed on to the users to increase affordability and adoption.
• Improve competition in the mobile and payment systems markets to unleash further sector growth. A World Bank Group (2015b) report and recent analysis suggested the following:
− Develop and enforce regulations to promote fair competition and equality and protect against the abuse of market power or other anticom-petitive practices within the sector.
− Separate Safaricom’s core telecommunications operations from its mobile financial service pro-vider, M-Pesa, and impose retail price controls and infrastructure sharing. Alternatively, impos-ing full interoperability that allows end users of separate networks or services to communicate with each other and to purchase services from providers other than their own network pro-vider could also reduce Safaricom’s dominance.
− Consider mechanisms for facilitating full interop-erability in the mobile market. There is scope to reduce consumer switching costs. Reducing or eliminating the porting fee imposed on con-sumers and automating the switching process will make number portability more effective.
− Consider mechanisms for facilitating full interoperability in the mobile payment market. In digital finance, rules to facilitate transfers between service providers and access to key telecommunications services (such as unstruc-tured supplementary service data) and to pre-

51KENYA COUNTRY PRIVATE SECTOR DIAGNOSTIC
TABLE 4.2 PATHWAYS FORWARD IN REFORMING THE ICT SECTORAll telecom • Facilitate effective infrastructure sharing
Mobile telecom • Consider separating Safaricom’s core operations from M-Pesa or imposing full interoperability.
• Reassess the level of porting fees.• Automate the procedure for number portability.
Spectrum allocation • Facilitate implementation of the Wireless Broadband Spectrum Policy through promoting collaboration between the Communications Authority of Kenya and the Competition Authority of Kenya to ensure competition in assigning mobile spectrum.
• Ensure that the public-private partnership framework for social and infrastructure projects does not distort the level playing field.
Mobile payment system • Ensure the elimination of exclusive contracts between mobile payments providers and merchants (agents).
• Assess options to facilitate third-party access to unstruc-tured supplementary service data channels or SIM cards.
vent discrimination between users of digital platforms by the dominant platform opera-tor are essential to ensure healthy competi-tion and allow for the entry and expansion of
new providers. In addition, it is advisable to monitor the effective elimination of exclusive contracts between mobile payment providers and merchants (agents).

53KENYA COUNTRY PRIVATE SECTOR DIAGNOSTIC52 enabling sectors
Health
Sector BackgroundKenya’s health care system can be split into three subsystems: the public sector, the commercial private sector, and faith-based organizations (FBOs). The public sector is the largest in terms of the number of health care facilities, followed by the commer-cial private sector and the FBOs. There is a large disparity between these health facilities, especially in rural areas.
In 2017, the size of Kenya’s health sector was estimated at around $3.5 billion, of which around $600 million were from public funds. According to a World Bank (2014) Public Expenditure Review of the health sector, in 2012, about 42 percent of health care is privately provided, with the remaining 58 percent equally split between the public sector and donor support and nongovernmental organization (NGOs). Indeed, the review shows that total private spending on health increased from $17.5 per capita in fiscal 2002 to $21 per capita in fiscal 2012. The contribution by donors, on- and off-budget, also increased from $5.3 per capita to about $15 period during the same period.
The health care system reflects a good mix between public and private provision. Health financing is mixed and receives funds from taxation, the National Health Insurance Fund (NHIF), private health insurances, employer schemes, community-based health financing, user fees (out-of-pocket [OOP] expenses), development partners, and NGOs. Government spending on health care is about 6 percent of GDP, lower than other countries in the region. About 25 percent of Kenyans are covered by a public, private, or community-based health-insurance scheme. OOP spending remains high, causing many to fall into poverty and posing a barrier to health care access. Many Kenyans do not save or prepay for health care or are not able to do so.
The 2010 Constitution devolved health services to the 47 counties, leaving the national government with the functions of policy, research, and regulation of the sector. In addition, the national government is responsible for level 6 hospitals, which are mainly referral facilities — the National Spinal Injury Hospital in Nairobi, Eldoret’s Moi Teaching and Referral Hospital, and the Kenyatta National Hospital. The counties are responsible for facilities classified between levels 1 and 5. On the other hand, private and FBOs are mainly concentrated at primary health care level, where their network of facilities is much larger at 60 percent, compared to government-run facilities. FBOs account for about 13 percent of health facilities
available at level 2 and 16 percent and 15 percent at levels 3 and 4, respectively (World Bank 2014).
In the pharmaceutical subsector, Kenya is home to the fastest growing market in the region, with expected annual growth of 7.6 to 12 percent in the next 5 years.21 However, domestic manufacturers supply only one-quarter of the market and the remainder is imported. Kenyan manufacturers also export 30 per-cent of their production. The private sector accounts for the entire manufacturing capabilities and around one-third of wholesale distribution in the subsector, with the rest of the distribution undertaken by the Kenya Medical Supply Authority (KEMSA) and FBOs.
Health care is at the top of the government’s devel-opment priorities as part of the Big Four program announced in December 2017. Health care has been prioritized as one of the President’s Big Four agenda items and is also one of the pillars of Kenya’s Vision 2030 development strategy. This aims to lift the country to middle-income status by 2030, implying higher
investment from public and private sources. For the health sector, the key pillar is the provision of univer-sal health coverage (UHC) by 2022. In his inaugural speech, the President Kenyatta announced UHC as a key achievement that the government will deliver during his second term. UHC refers to a situation where all people receive quality services when needed (promotive, preventive, curative, and rehabilitative health services), without being exposed to financial hardship. It has two main goals: access to quality care as needed and financial risk protection. Implicit are objectives related to equity in access, quality of services, and broader social protection. The govern-ment also looks to reform the governance of private insurance companies and increase the number of community health facilities.
Sector Performance and Key ChallengesKenya’s performance in the United Nations Development Programme’s Human Development Index (HDI) has improved significantly since 2000. This is largely because of improving life expectancy, badly dented
by HIV/AIDs in the 1990s. Kenya’s HDI is slightly higher than the average in Sub-Saharan Africa, at 0.555 versus 0.523, respectively, in 2015. Under-five and infant mortality were halved between 2003 and 2014, owing to increased use of essential services such as immunization, vitamin A supplementation, and insecticide-treated nets. At 49, Kenya’s Healthcare Access and Quality Index (HAQI) is relatively higher than the average for lower middle-income countries which in 2016 stood at 54. However, Kenya fares better than its low-middle-income peers in other measures. For instance, neonatal mortality saw a far slower rate of decline over the past decade, with more than 42 percent of deaths occurring in the first month of life. Despite improvements in nutrition since 2003, more than one in four children under five are stunted. The total fertility rate fell to 3.9 births per woman after a decade of stagnation, but the maternal mortality ratio remained unacceptably high at 362 per 100,000 live births in 2014. Also, teenage pregnancy remains high with 18 percent of girls between the ages of 15 and 19 having begun childbearing. Another area of concern is doctor absenteeism, which averaged 28 percent in fiscal 2012 and is highest among doctors at 39 percent (World Bank 2014).
Despite improvements in health outcomes, demand- and supply-side challenges remain, which hamper coverage and use of essential services. On the demand side, sociocultural beliefs and practices; the low status of women; poverty; the high cost of services (includ-ing transportation); long distances to health facilities, especially in arid and semiarid land counties; and poor health-provider attitudes all impede demand for essential services, including reproductive, maternal, newborn, child, and adolescent health services. In addi-tion, limited health insurance, regulatory constraints, and access to finance are barriers to sector feasibility. Some 75 percent of Kenyans do not have any health insurance coverage and rely fully on OOP expenses.
On the supply side, Kenya has a serious short-age of health workers, particularly in rural areas. Most health workers are employed in the private sector, where competition for doctors drives up costs. Challenges lie in improving the training and efficiency of health workers and reducing the so-called brain drain, where trained health workers look for greener pastures abroad. In addition, the vast majority of health care facilities fail to comply with minimum patient safety standards, and policy action is required to move them above the minimum standards. In pharmaceuticals, firms also face recruitment diffi-culties in filling skilled jobs, often relying on more expensive foreign workers.

54 enabling sectors
Health information and civil registration and vital statistics systems are inadequate, resulting in poor data management. Despite some improvements, data from health information systems, such as the District Health Information Software 2, are of low quality, often late, and incomplete.
Public financing is inadequate. Despite increases in public spending on health care, its share in total government expenditure is low and about one-third of health spending is OOP. Although per capita health spending increased from $45 in fiscal 2002 to $67 in the decade to fiscal 2013, the share of health in total government spending declined from 8 to 6 percent in the same period. A significant part of external financing remains off-budget, fragmented, uncoor-dinated, and unpredictable and primarily targets a few diseases such as HIV/AIDS, tuberculosis, and malaria. As a result of these financial, management, and human resource constraints, health care quality remains poor.
In the pharmaceutical subsector, multiple layers of distributors and subdistributors separate supplier from consumer, adding unnecessary costs, quality risks, and limiting traceability, particularly without market information systems in place. Reliance on subdistributors incurs markups along the supply chain, each adding about 25 percent to the price. Kenya has higher distribution margins than other countries. For example, South Africa has a maximum distribu-tion markup of just 6 percent. Most pharmacies do not have electronic inventory management systems, creating openings for counterfeits and substandard medicines when stockouts occur, and consumers search for access to essential medicines.
Pathway ForwardThe current high-level political commitment presents an opportunity window for Kenya to fast-track prog-ress to UHC. Key design features of the best UHC model for Kenyans are still under development. For example, the Kenyan government has not decided the best financing model to achieve UHC and the appropriate level of health insurance subsidies for the informal sector. Also, it is not yet clear to what extent the health system can cope with the rapid increase in demand for health services and the roles of the different stakeholders in the implementation process. To realize the goal of achieving UHC, the Kenyan government has requested the World Bank to support UHC implementation in four counties as a first phase of implementing the its vision.
The renewed focus on health and the shift of the government’s role from being a provider of care to
a financer also opens new opportunities for private sector development and market creation. Over the last six years, through the direct intervention and support of initiatives such as Health in Africa, the country has seen increased commitment by the gov-ernment in engaging and partnering with the private sector for delivery of services towards achievement of UHC under Vision 2030. The Kenyan private health sector continues to grow commanding 50 percent of all goods, services, products, and technologies. At the same time, public investment is held back by fiscal constraints, leaving scope for greater private participation. Smart implementation of the national insurance plan can reap numerous benefits such as equity in health care outcomes irrespective of abil-ity to pay, more risk pooling, and increased ability to leverage private capital to build a much-needed health care delivery infrastructure. It also has the potential to lower overall health care system costs. Moreover, Kenya also seeks to become a medical tourism destination, opening a new range of business opportunities. Prospects for PPPs are favorable in equipment supply, e-health, training and education, health insurance, and the establishment of new private hospitals. Cumbersome regulations, limited health insurance, and a shortage of skilled health workers are challenges, but reforms are expected given the greater urgency now attached to health care.
REGUL ATIONSAlthough cumbersome regulations in the sector are preventing more active private participation, there is strong government commitment to create a more inductive regulatory environment. The government recently streamlined health regulatory enforcement at service delivery points through developing a joint inspection system to replace repetitive individual visits by the nine regulatory bodies. Similar discussions are ongoing to try and streamline registration and licenses to minimize the administrative burden on health providers.
NHIF REFORMThe NHIF has been identified as the “vehicle” to deliver UHC in the medium to long-term, however, several challenges exists: (1) policy environment (lack of financing and strategy — voluntary basis of cur-rent NHIF expansion plan has strong limitations based on international experiences); (2) governance (the NHIF Act, financial and social accountability, recruitment of CEO); (3) efficiency (high administra-tive cost, weak ICT systems, management and skills mix, provider payment mechanisms not conducive

55KENYA COUNTRY PRIVATE SECTOR DIAGNOSTIC
to efficiency; (4) equity (members are largely from formal sector, limited cross subsidization between rich and poor); and (5) financial sustainability. Strong political commitment to NHIF reform exists and a reform panel has been established.
PPPSA draft health sector PPP strategy was developed to attract more private players. For instance, the man-aged equipment services subsector is one of the new businesses emerging in Kenya’s health care system, involving partnerships between private and public health care providers. A recent market study by the Dutch Ministry of Foreign Affairs (MFA 2016) also found business opportunities in the areas of medi-cal devices and supply chain management, e-health solutions, training and education, hospital building, and health financing.
MEDIC AL DEVICES AND SUPPLY CHAIN MANAGEMENTKenya has two large national distribution institu-tions — KEMSA and the Mission for Essential Drugs and Supplies (MEDS) — open for use by the public sector and FBOs, but there are numerous private distribution companies supplying medical supplies, equipment, and pharmaceuticals. One challenge that these partners encounter is finding a reliable service provider who can bring products in good (cooled) condition to customers or health facilities. The KEMSA, the MEDS, and some private distribution compa-nies use their own couriers, cars, or motorbikes to ensure delivery to specific regions. However, some geographic areas remain untapped, so distribution needs to be outsourced, providing opportunities for trusted distribution partners. Several private firms are ready to add value by partnering to improve storage, warehousing, logistics, and customer service. This will add in-depth understanding of supply chain management, as well as technology and systems to make the subsector more competitive.
E-HEALTHHealth and ICT are becoming more interconnected in Kenya and the development of new information technology solutions in health offers opportunities for companies with a specialty in this particular sub-sector. Recommendations for investments in e-health technologies include (1) creating technologies that address procurement challenges in hospitals, (2) creat-ing easy-to-use systems, (3) using existing technology platforms on which to build products and solutions, and (4) joining with local partners who can offer tips and provide links to key stakeholders.
TR AINING AND EDUC ATIONAs mentioned, the capacity and quality of training for health workers is a concern in Kenya. Gradual growth of private health-training institutions is helping increase the supply of health workers, particularly in the private sector where there is a major shortage of workers who are able to meet the required standards. Several initiatives are ongoing or being piloted. In addition, significant space exists given Kenya’s high mobile phone penetration and many remote rural areas are now connected to the internet. Hence, privately provided e-learning solutions and quality improvement courses for health workers could help bridge the skills gap.
HOSPITAL BUILDINGAs the economy expands, the need for investment in health care facilities will grow. More investors are planning to set up chains of clinics and hospitals or expand current facilities to serve larger and broader patient segments.
HEALTH FINANCINGThe private health insurance sector in Kenya is rel-atively small and mostly focused on the rich and upper-middle-class employed segment. Although it is worryingly high, the lack of health coverage for 75 percent of the mostly low-income population presents opportunities for private involvement in the insurance subsector. With the Big Four Plan, several large international players are now showing interest in providing solutions to UHC coverage and entering this submarket, such as Kenindia Insurance Company, British American Insurance, and Blue Shield.

05DEEP DIVES
This chapter provides comprehensive deep dives of the selected
three priority sectors, underscoring (1) their performance and
constraints, (2) areas for private participation, and (3)
actionable recommendations and specific actions to improve the
enabling environment around these sectors.

58 deep dives
Agribusiness
This section begins with a general introduction of the performance, opportunities, and challenges in the Kenyan agribusiness sector. This is followed by a review of cross-cutting opportunities in the areas of agricultural inputs, logistics, processing, finance, and technology, with a corresponding summary of priorities for private investment, public sector reform, and public investment. It concludes with an over-view of the competitive potential of specific value chains in Kenya: mango puree, fresh avocado exports, and beef production — reviewed for additional, more detailed insights.
Sector Performance, Opportunities, and ConstraintsAgribusiness, including agriculture and downstream processing activities, is the largest sector in Kenya’s economy. Agricultural production generates 26 per-cent of gross domestic product (GDP), provides 63 percent of employment and accounts for 57 percent of exports, and downstream agriprocessing is estimated to generate an additional, but comparatively low, 3.2 percent of GDP and 2.4 percent of employment.
Many aspects of the agribusiness sector in Kenya provide a source for optimism. Kenya has been able to leverage its relatively limited but fertile and high-altitude arable land to develop a wide range of high-value-added crops. Together, growth in the tea, cut flowers, and green beans value chains account for over 65 percent of agricultural exports (figure 5.1), which represents major success stories for Kenya that other countries in the region are eagerly attempting to replicate.
These successes rest on Kenya’s various strengths that include its land structure, its infrastructure and trading position, and its capacity for innovation. The colonial land structure, which included many large landholdings in high-fertile areas and remained largely intact postindependence, has proven condu-cive to high-productivity, commercial-scale farming.22 Although the resulting inequality challenges should not be overlooked, this land structure has resulted in greater experience, skills, and maturity of market systems in many value chains compared with other countries in the region. Kenya’s trading position and infrastructure also provide important advantages, with one of East Africa’s major ports in Mombasa, established trade routes by sea and air, improving rail networks, and reasonable core road infrastructure, the country is a major logistics and trading hub for East Africa. Finally, and more recently, notable innovations in agribusiness are taking place, driven by Kenya’s position as a hub for financial and ICT services.
Against these strengths must be weighed various challenges.
GOVERNANCE CHALLENGES
• Low government prioritization of the agriculture sector. Within the national government budget, agriculture represents an extremely low 2.3 per-cent of spending, compared with 17 percent in Ethiopia, 16 percent in Malawi, and an Africa policy target of 10 percent.23
• Devolution. Kenya’s sweeping devolution creates opportunities for improved local accountability and
FIGURE 5.1 AGRICULTURAL EXPORTS, 2013
Tea1,218
Cut flowers538
Other322
Coffee, green190
Green beans 97
Pinapples (processed)90
Sugar63
Oil palm 62
Beer of barley 43
Vegetables (preserved) 38
Beans, dry 33
Avocados 29
Nuts 28
Source: Data from FAOSTAT.

59KENYA COUNTRY PRIVATE SECTOR DIAGNOSTIC
transparency. However, in the short term, devolving oversight of agriculture to the county level (includ-ing extension services, infrastructure development, and so on), has created both capacity and invest-ment climate challenges (including additional taxes on intracounty trade, potential new challenges to land access and potential market distortion affects related to licensing and competition).
ECONOMIC CHALLENGES
• Land availability. Outside of the productive com-mercial segment,24 60 percent of farmed land remains under smallholder production. With a lack of land available for expansion (because of population pres-sure and low total stock of arable land), smallholdings continue to be subdivided into often uneconomical plot sizes. Where land does exist, costs are high and/or titling issues persist. However, the Kenyan government has recently adopted the Agricultural Structural Transformation and Growth Strategy that included a commitment to making a signifi-cant number of unused or underutilized large land plots available for agribusiness.
• Infrastructure. Poor quality rural road infrastruc-ture and relatively high transaction costs for ground and air transport has a negative impact on com-petitiveness.25 Air, shipping, and roads are gen-erally operating at over-capacity, with 30 percent of road infrastructure requiring rehabilitation or reconstruction.
• Market links. Many basic value chains (for exam-ple, maize, potatoes, fruits) are informal with rel-atively limited links to private offtakers. In turn, offtakers face challenges to source locally adequate volumes of products that meet quality require-ments for processing. Weak links challenges are compounded by high margins absorbed by trad-ing agents and transport challenges mentioned.
ENVIRONMENTAL CHALLENGES
• Water resources. Despite only 17 percent of Kenya’s land being arable and very low per capita water availability, Kenya relies heavily on rain-fed agri-culture, with only 3 percent of arable land under irrigation, which inhibits year-round production. This water stress is likely to be further exacer-bated by climate change.
• Soil health. Deforestation and related land pres-sures, which have reduced the use of fallow peri-ods, has led to rapid depletion of soil nutrients and low and declining yields.
• Diseases. Incidence of disease is high for both crops and livestock (especially aflatoxin in maize,
but also bacterial wilt and late blight in potatoes, and so on), resulting in food safety concerns and high postproduction losses.26
These challenges, in particular those related to government support, infrastructure and water resources, are most pronounced in Kenya’s poorer arid and semiarid lands (ASALs). These areas, which cover much of the north and east, as well as pockets of the south, are particularly reliant on subsistence agriculture, most notably livestock. Private sector activity in the ASALs is very limited and will require a longer-term approach to create markets (see for example, the section on livestock below). These regions are also eligible for the International Development Association – Private Sector Window (IDA-PSW).27
Addressing these constraints will require a range of public and private solutions for the agribusiness
“ecosystem” and tailored to the needs of specific value chains. The following sections begin with a review of cross-cutting opportunities, constraints, and solutions, with a focus on inputs, logistics, processing, technol-ogy, and finance. This is followed with a summary of competitive opportunities across a range of key value chains in Kenya. Finally, these findings are further elaborated via three value chain examples, namely mangoes, avocados, and meat.
The Role of Inputs, Logistics, Processing, Finance, and Technology
INPUT MARKETSFor Kenya’s smallholders, improving the quality, supply, and choice of inputs, especially seeds and fertilizers, is crucial to tackling the productivity challenge and improving access to markets. As in most countries, market barriers to investments in improved inputs are inherently linked to wider value-chain challenges, notably secure offtake for increased production, and access to upfront finance for input purchase.28 In addition, as is the case in Kenya, input markets are often heavily influenced by government interventions, including subsidies, which can serve important social objectives, but often create negative unintended dis-tortions on market systems.
Systematically improving Kenyan smallholders’ access and incentives to purchase inputs are therefore linked to wider value chain solutions (see box 5.1) and policy and regulatory environment reforms. The seed market, for example, around 70 to 80 percent of the total market is dominated by the state-owned Kenya Seed Ltd., limiting space for private investment and innovation.

60 deep dives
Likewise, the fertilizer market is heavily influenced by the government, with 70 percent of total fertilizer distribution channeled to farmers being publicly sub-sidized. The subsidy system is reported to be opaque, inefficient, and poorly targeted, with subsidized fer-tilizer often finding its way back onto the market for resale. The system also raises costs in the remainder of the fertilizer market, by reducing the size of the market supplied by the private sector and thereby disincentivizing investments in distribution and retail. Finally, some experts noted a link between bulk public sector procurement and declining soil fertility, because fertilizers are not adapted to soil needs.29
The government is already developing policy solutions to address these input market challenges. Under the draft Agricultural Sector Transformation and Growth Strategy (2018), the government is proposing to “shift nationwide subsidy program focus to allow ~2 million registered high need farmers to access a wide range of inputs (seeds, crop protection, fertilizer, equipment) from a range of private and public providers, using e-vouchers with digital service delivery.” If the political will for implementation exists, this would seem a valu-able area for World Bank Group support, building on experience in rolling out e-voucher systems elsewhere.30
LOGISTICSInefficiencies in agricultural logistics create barriers, but also opportunities, for private investment. These include, for example:
• Grain handling. There is an opportunity for inland bulk grain-handling facilities for maize grown in
the country, which would reduce the costs incurred in bagging: one company highlighted that it is currently paying $5 a ton in bagging costs, com-pared with margins of only $10 a ton.
• Transport. The Single Gauge Railway has the poten-tial to cut the cost of freight transport in half from Nairobi to Mombasa, but reliability and manage-ment issues are curtailing the benefits. The addi-tion of a refrigeration service would enhance the value of the service. The process for levying of inter-county transport charges (cess) is also disrup-tive and prone to rent seeking and appears to have become an increasing challenge after the devolu-tion (because revenues now flow to the counties).
• Cold chain. Kenya benefits from well-developed cold chain logistics for import and export via both air and sea, the development of which was driven in particular by the success of horticulture exports. There is now a growing need and oppor-tunity to expand cold chain logistics to serve the domestic market (see box 5.2), given the cost of postharvest losses,31 increasing urban demand for higher quality food, growing investments by super-markets and food-service companies (Carrefour, Shoprite, Subway, and so on), and improving food quality legislation. However, the unpredictable and fragmented nature of both production and demand makes capital investment risky.
PROCESSINGThe share of value addition compared to agricultural production is relatively low in Kenya. As figure 5.2 shows, only 16 percent of Kenya’s agricultural exports
BOX 5.1 THE BETTER LIFE FARMING ALLIANCE
Recognizing the need for a holistic, across-the-val-ue-chain approach to improve smallholder produc-tivity, IFC used its convening power to assist in building an alliance of multinationals, which include Bayer, Netafim, and Swiss Re Corporate Solutions, under the Better Life Farming.
Together with other country-level partners, the alliance combines expertise in seeds, precision irrigation, crop protection, finance, and insurance to boost yields. India and the Philippines were the first two focus countries, with a potential engagement in Kenya at an early concept stage. For more informa-tion, visit https://www.betterlifefarming.com/.
BOX 5.2 COLD CHAIN INVESTMENT OPPORTUNITIES
• Blended finance for private companies willing to invest in (1) third-party cold storage warehouses, especially in regional hubs where aggregation is needed, and (2) refrigerated transport (with concessional funding justified given risk and public good benefits).
• Explore public-private partnerships options for a cold chain consolidation warehouse facility, likely near Nairobi, to provide a single location for consolidation of subcontainer scale refrigerated and dry cargo for transport to Mombasa or onward into Kenya.
• Support existing innovators developing cold chain logistics for the domestic market on a private basis (see the example of Twiga Foods in box 5.3).

61KENYA COUNTRY PRIVATE SECTOR DIAGNOSTIC
FIGURE 5.2 KEY TRADE INDICATORS FOR THE AGRIPROCESSING SECTOR, KENYA AND COMPARATORS, 2013
Value per capita (US$)
250150
50
Total value
Share of processed
Indonesia
Kenya
Nigeria
Tanzania
Uganda
Ethiopia
Exports
Côte d’Ivoire
South Africa
Ghana
Imports
80%
92%
51%
57%
89%
60%
68%
69%
74%32%
53%
8%
86%
16%
35%
25%
22%
5%
Source: Data from McKinsey and Company 2015.
are processed, compared with 57 percent for imports. Likewise, Kenya exports only $11 of processed agri-cultural products per capita, compared with $83 in South Africa and $77 in Côte D’Ivoire. This is partly a result of the fact that many of Kenya’s major cash crops either do not require processing (for example, cut flowers) or require only primary processing prior to export (for example, coffee, tea). Of processed exports, only pineapples ($100 million per year) and beans ($50 million per year) have achieved any significant scale.
Based on industry interviews, the best opportunities to expand processed exports appear to be in fruit purees (mangoes, passion fruit), processed vegetables, and nuts (macadamia), with longer-term potential in meat. For the domestic market, a wider range of agriprocessing growth opportunities exist, including in fruit purees, potatoes and other vegetables, fish (for example, canned, smoked), meat, dairy, and, to a lesser degree, tea and coffee. There are few firms active in this space mainly because of production issues such as securing sufficient quantity and quality of raw material to justify capital-intensive process-ing investments. Opportunities also exist to expand processing of imported commodities for the local market (for example, vegetable oils, wheat into pasta, and so on), but they face constraints related to the cost and reliability of power and access to finance.
FINANCEKenya represents a vibrant and enabling market for financial technology, but the more traditional banking that is needed to service commercial agriculture is lacking. Only 4 percent of bank lending is for agribusi-ness, despite the majority of Kenyans being employed in agriculture or agribusiness. There is also a distinct lack of medium- to long-term agriculture-related debt in the market.32 Government engagement in input markets such as seed and fertilizer and the purchasing of some core commodities created unpredictability in the market and increases financing risk. An innovative Livestock Insurance Program supported by the World Bank targets subsistence farmers. Such innovations should be explored to also derisk investment in more commercially oriented farmers and enterprises. With improved value-chain structure and performance, there are opportunities for increased private sector activity in the areas of value chain finance, receivable financing (including warehouse receipts), equipment finance, and various forms of insurance.
AGRITECHModern technology has a wide range of agricultural applications, from providing weather updates, market
62 deep dives
data and access to finance for farmers, to driving logistical efficiencies for input suppliers and buyers, as well as providing traceability opportunities across the value chain. As mentioned, Kenya is ahead of the curve on innovation and the agribusiness sector is no exception (see box 5.3 for an example). Much of the innovation is developing and hence may benefit from catalytic development partner support in the form of innovation or market development grants or other similar financing. However, given the clear will and capacity of entrepreneurs in Kenya for market-based innovation, this is an area in which the private sector should be largely left free to develop and drive solutions.
Sectorwide Market SolutionsThe World Bank Group is well placed to address many of the sectorwide market needs mentioned, through (1) supporting direct private investment, (2) assisting the government to unlock investment through regu-latory and policy reforms, and (3) where necessary, continuing to support the public investment needed to open up markets over the longer term.
PRIVATE SECTOR SOLUTIONSOpportunities to support private sector solutions include, for example:
• Market access and increased productivity. Market solutions are needed to link smallholders into value chains, which in turn offers opportunities to increase productivity. This will be driven by improved access to inputs and secure offtake by commercial produc-ers, processors, and other aggregators. Through IFC, the World Bank Group is already investing in various value-chain actors that are working to improve smallholder productivity through input and offtake arrangements (for example, the Kenya Tea Development Agency, Vegpro, and so on). There are also existing commercial opportunities for IFC in supporting input service providers (for example, ETG Fertilizers, Amiran), and emerging innovative business models designed to address market-access challenges (for example, Twiga). Meanwhile, IFC advisory provides a channel to promote commercial innovation and value-chain alliances to improve
BOX 6.3 TWIGA FOODS
Launched in 2014, Twiga Foods is a fast-growing Kenya based enterprise, using mobile technology and logistics to enhance food supply chains by more effectively and rapidly consolidating highly fragmented, informal market supply and demand (thereby reducing food prices and spoilage). The
company’s clients include both farmers, to whom it provides a guaranteed offtake (currently 5,600 farmers with more than 600 percent year-on-year growth), and small-scale vendors (for example, street sellers, kiosks) to whom it provides distributed wholesale services (currently 4,300). Twiga
started off with bananas but has since grown to include other fresh fruit and vegetables (such as mangoes, potatoes, onions, and tomatoes). Figure B5.3.1 shows Twiga Foods’ logistics solutions across the value chain (including cold storage pack house facilities).
FIGURE B6.3.1 TWIGA FOODS’ DISTRIBUTION INFRASTRUCTURE
Data is collected, analyzed, and sent back through the system at every stage to constantly improve pricing, logistics, and quality.
Scouts sign smallholder farmers up through the mobile application. The scouts monitor products grown and notify farmers two to three days before harvest.
Farmers deliver the produce to collection centers outside Nairobi. They get paid within 24 hours via mobile money (M-Pesa).
Longhaul trucks transport the produce is along predefined routes from the collection centers to a centralized warehouse in Nairobi.
Twiga manages the inventory at an 80,000-squarefeet warehouse with cold chain facilities used for ripening, quality control, sorting, weighing, and repackaging the goods.
Goods are moved from the pack house to smaller depots across Nairobi then moved out on predetermi ned routes first thing the following morning.
The produce is delivered to small and medium vendors based on preordered demand via the platform or by calling in. Vendors pay using mobile money.

63KENYA COUNTRY PRIVATE SECTOR DIAGNOSTIC
productivity (for example, Better Life Farming Initiative and similar alliance solutions). This can be reinforced by strengthening of the core farmer extension system, which is planned under World Bank interventions.
• Access to finance. Linked to improving productiv-ity, farmers will need finance for access to inputs and, ultimately, for capital investment in mecha-nization, irrigation, and so on. With the right val-ue-chain structures, there is a clear opportunity for increased private sector activity in the areas of insurance, receivable financing (including use of warehouse receipts), value chain finance, and equip-ment finance. Although agritech products and ser-vices are growing and adapting to market demands, more development attention needs to be paid to val-ue-chain finance. IFC can provide advisory services to financial intermediaries to support agricultural investment risk analysis, especially for smallhold-ers that are active in multiple value chains, and improved product delivery mechanisms. Innovative pilots that support grants and risk-sharing oppor-tunities between financial institutions and farm-ers, such as IFC’s work on small irrigation systems, provides an opportunity test and potentially sup-port market creation in the finance space.
• Improved logistics. Improved grain storage and cold chain logistics are just some of the logistics market needs that can be addressed directly by the private sector.
POLIC Y AND REGUL ATORY REFORMSAlthough some areas can be largely left to the private sector, other areas will first be critical to support the government to address key policy and regulatory barriers, including:
• Input market reform. Opportunities exist to main-tain existing input subsidies, but they must be channeled in a way that better targets smallhold-ers, empowers those farmers to select appropriate inputs (for example, for seeds, fertilizers, mecha-nization services) and the private sector to supply them (for example, via e-voucher systems).
• Government interventions in agricultural mar-kets. Opportunities exist to support farmers in a way that minimizes market distortions and refocus-ing the government’s direct involvement to areas in which private participation is not feasible. Ensuring a neutral application of rules to state players and private firms is important to crowd in private opera-tors, for example, in seed production. Furthermore, rules that protect incumbents such as consent for
entry of new players, unclear rules for granting pro-cessing licenses for industrial crops, and nontariff barriers (NTBs) can be improved in line with the objectives of the 2013 Agriculture Act.
• Addressing fiscal (dis)incentives. Agribusiness companies in Kenya obtain low levels of fiscal benefits relative to other sectors, and increased enforcement of inter-county transport charges also disproportionately impact (high movement) agri-cultural enterprise, especially in the more remote (poorer) regions.
PUBLIC INVESTMENT NEEDSIn some areas, considerable public investment will remain critical to mobilize larger-scale private invest-ment over the longer term.
• Research and development (R&D). Financial sup-port for R&D is on the low side in Kenya and, as in all markets, represents an obvious role for the public sector (particularly in the areas of seeds, livestock breeds, and so on).
• Market links. In unstructured value chains, public assistance is needed to strengthen producer orga-nizations and increase productivity, in the likely absence of near-term private investment.
• Resilience. For vulnerable smallholders and pas-toralists, public support to build resilience to cli-mate shocks is an essential prerequisite for any future market engagement.
• Transport. Improving the road network is likely to offer one of the highest returns on investment for the public sector, given its impact on access to markets for smallholders and the competitive-ness of processing and fresh exports.
• Irrigation. Although opportunities exist for pri-vate financing of irrigation (for example, preci-sion systems for high-value crops), there is also a strong case for public support, given the need for increased arable land, water scarcity, and the risks posed by climate change.
Opportunities to support these much-needed public investments exist within the World Bank’s agricul-ture portfolio. This includes, most notably, the Kenya Climate Smart Agriculture Project ($250 million), which covers 24 counties across the ASALs, and the National Agricultural and Rural Inclusive Growth Project ($200 million), which covers the other 21 (rural) counties.
Assessing Specific Value ChainsA review of key subsectors (figure 5.3) was conducted to reinforce the sectorwide analysis and to better

64 deep dives
understand specific market needs and constraints. Table 5.1 is not intended to be exhaustive and the subsectors were selected to include a mix of:
• Substantial smallholder impact and reach (for exam-ple, maize, potato, livestock, dairy, gum Arabic);
• Established competitiveness and export potential (for example, tea, coffee, flowers); and
• Higher growth potential, based on feedback from private sector interviews (for example, mango, avocado, macadamia).
Three subsectors were then further selected as case studies: (1) avocado, (2) mango, and (3) live-stock (specifically meat). They were selected, given available time, to provide more nuanced insights into competitive advantages and constraints in the country. These subsectors are simply a sample and do not suggest that they represent higher potential for investment than many of the other promising subsectors in Kenya. Avocado was selected as it pro-vides a useful proxy for the high-value exportable horticulture segment. Mango was selected given its comparative advantages in Kenya and potential for expanded processing. Livestock was selected given its potential scale and its potential specifically to promote shared prosperity in the ASAL regions of Kenya, which are eligible for IDA-PSW . Gum Arabic was also included on the long list for the same reason.
MANGOES (LOC AL PUREE PRODUCTION)Kenyan mango production has generally been grow-ing, with production peaking at over 800,000 metric tons in 2015.33 Kenya’s major competitive advantages include relatively low farmgate fruit prices ($0.17 per kilogram) and capacity to harvest mangoes across a 5- to 6-month season. These increases the efficiency of local processing and makes it possible for Kenya to supply its main export market (the Middle East) when its largest competitors (India and Pakistan) are off season.
Despite this, processing (puree) and exports remain nascent: it is estimated that 93 percent of mangoes are consumed fresh within the country, only 5 percent are processed, and 2 percent are exported fresh (worth $14 million 2013). Direct processing is undertaken by a few large companies (for example, Kevian). The demand for processed mango is growing with increased investment in juice production for local markets by a major beverage company (Coca-Cola).
Lack of consistent and standardized fruit supply, small size of most mango farms, and last-mile access challenges are the major interrelated constraints facing
aggregators (see box 5.4 for an example). In addition to this need to strengthen smallholder links, there is a further opportunity in the organic market, as mango puree can command a significant $100 – $150 premium per metric ton. Although many Kenyan mango farmers use organic methods, they lack the certification, hence they and the processors do not benefit from the premiums.
BOX 5.4 SUNNY PROCESSORS
Established in 2008, Sunny Processors Limited processes around 3,000 to 4,000 metric tons a year of single strength mango puree, plus smaller quantities of other fruits, generating revenues of over $3 million. It has established supply con-tracts with Coca-Cola and Del Monte. Their fruit is supplied via their own farm, direct from larger farmers, and indirectly from smallholders through around 10 established suppliers.
Sourcing sufficient quantity of the right fruits represents the major constraint to growth. Hence, their next investment is likely to be in expanding their own farm into passion fruit, which would allow the processing equipment to be utilized over a longer period, increasing competitiveness.
FIGURE 5.3 MAIZE AND SUGAR DOMINATE AN OTHERWISE WIDELY DIVERSE RANGE OF CROP PRODUCTION IN KENYA
Sugar caneMaizePotatoesBananasCabbagesMangoesBeans, drySweet potatoesVegetable, freshCassavaTeaTomatoesPineappleWheatPigeon peasAvocadosOther
34%16%
6%6%
4%3%
3%3%3%
3%2%
2%1%
1%1%
1%10%
Source: Data from FAOSTAT database.

65KENYA COUNTRY PRIVATE SECTOR DIAGNOSTIC
Reform and investment opportunities include the following:
• Processing investments. For expansion of pro-cessing with concurrent investment in supply, either through nucleus farms or farmer contract or cooperatives.
• Smallholder links. Potential processing invest-ments can be combined with smallholder links to help address quality and consistency of supply and support certifications (for example, organic) where economically viable.
• Export promotion. Support government to ensure mango exports are of sufficiently high quality, develop and implement national branding strat-egy, and work to improve external market con-fidence of Kenyan mangoes.
AVOC ADO (FRESH EXPORTS)Kenya is the world’s sixth-largest producer of avocados (200,000 metric tons per year) and the eleventh-largest exporter (16,000 metric tons per year). This level of production has been driven by good growing conditions in the country, combined with expanding demand from accessible export markets, notably in the Middle East, China, and India. Kenya’s traditional export market is the European Union (EU). In anticipation of
continued growth of world demand, Kenyan farmers have been planting new trees to increase production.
About 70 percent of avocados are grown by small-holder farmers. These farmers also grow other crops such as coffee and macadamia. The quality of avo-cados is heavily influenced by proper irrigation and Kenyan avocados are often inconsistent in size and shape, reducing supply for export.
For export markets, Kenyan avocados generally command lower prices than higher-quality competi-tors (for example, Chile and Peru), suggesting quality issues. Processing (oil), although small scale, has also been successfully developed for export (see box 5.5). There is no significant domestic market for avocado oil.
Low-quality inputs coupled with high levels of smallholder farmers impact production quality. Farmers selling to offtakers often receive training on produc-tion and advice on harvesting. However, inconsistent irrigation and use of lower-quality seedlings impact quality. There is significant postharvest loss due to disease, root rot, and mishandling. Intercropping leads to productivity losses as trees age.
Reform and investment opportunities include the following:
• Market access. Efforts to expand and strengthen farmer links to offtakers (processors, fresh export-ers, and so on) will remain central to improving market access. These efforts could also be com-plemented via “agricultural hubs,” with access to cold chain storage and extension services, which would help lower postharvest losses and improve market links.
• Transport. Development of appropriate rail ter-minals and railcar refrigeration would help lower transportation costs to the Mombasa port.
• Inputs. Improved access to or application of irri-gation along with better seedlings can lead to higher exportable yields.
• Export promotion. Building the mandate and capacity of the Export Promotion Council to sup-port avocado export in key markets and devel-opment of a national branding strategy can help promote exports.
MEAT PRODUCTION (BEEF)Kenya has long been associated with a culture of pastoralism, which, together with a culture of high meat consumption, would appear to provide strong fundamental conditions for market-based opportu-nities. Kenya produces about 500,000 metric tons of beef, the highest in East Africa, around 20 percent of which is a result of imported live animals crossing
BOX 5.5 OLIVADO
Olivado was established by its New Zealand parent company to supply avocado oil to Olivado bottling companies. Avocado oil exports provide core revenue and has been commercially successful. The company has since expanded to fresh organically certified exports since 2017. Olivado does not produce any avocado directly; all fruit is supplied by farmers within a four-hour driving radius. The farmers typically grow macadamia and maize in addition to avocado. Olivado assists farmers via soil analysis, training on pruning techniques, harvesting processes and certifications — Global Gap, IMO (organic), and Fair for Life.
In 2018, Olivado began to export conventional (nonor-ganic) avocados and indicated that growth is mainly con-strained by access to avocado. There are no plans to acquire its own farm, but it is looking to invest in avocado seedling production and oil bottling and mango processing. Olivado also indicates it could command higher margins for exports of fresh avocado if Kenya’s reputation for quality avocados were higher. State intervention to promote or ensure export quality would be welcome.

66 deep divesTA
BLE
5.1
MAR
KET
OPPO
RTUN
ITIE
S, IM
PACT
, AND
INVE
STM
ENT
POTE
NTIA
L AC
ROSS
KEY
KEN
YAN
VALU
E CH
AINS
Crop
Mar
kets
targ
eted
com
petit
ivel
y (s
hort
term
)M
arke
ts th
at c
ould
be
targ
eted
com
petit
ivel
y (m
ediu
m to
long
term
)Im
pact
(pro
xied
by
scal
e)In
vest
men
t pot
entia
l
Mai
zeM
aize
app
ears
to b
e un
com
petit
ive
in
Keny
a, g
iven
net
impo
rts f
rom
the
EAC
and
high
tarif
fs n
eces
sary
to b
lock
ch
eape
r ext
ra-E
AC im
port
s.
Give
n th
e co
ntin
ued
tarif
f pro
tect
ion,
co
mpe
titiv
enes
s of m
aize
for t
he lo
cal m
arke
t co
uld
be im
prov
ed o
ver t
he m
ediu
m te
rm b
y ad
dres
sing
pro
duct
ivity
con
stra
ints
.
Larg
e vo
lum
es (m
ore
than
3
MT)
sol
d on
loca
l mar
ket;
very
la
rge
impa
ct o
n sm
allh
olde
r fa
rmer
s (m
ore
than
1 m
illio
n).
Min
imal
com
mer
cial
inve
stm
ent
pote
ntia
l in
prod
uctio
n; v
alue
-cha
in
oppo
rtun
ities
in in
put s
uppl
y, tr
adin
g,
stor
age,
and
so
on.
Tea
Tea
is a
mat
ure
sect
or w
ith w
ell-
esta
blis
hed
com
petit
iven
ess i
n lo
cal
and
glob
al m
arke
ts. S
cale
of e
xpor
ts
(mor
e th
an $
1 bill
ion)
indi
cate
s str
ong
inte
rnat
iona
l com
petit
iven
ess.
Furt
her g
row
th in
pro
duct
ion
and
expo
rts l
ikel
y to
be
grad
ual a
t bes
t, gi
ven
lack
of l
and
for
expa
nsio
n. M
arke
t opp
ortu
nitie
s hen
ce li
e in
in
crea
sed
valu
e ad
ditio
n an
d ni
che
mar
kets
(h
erba
l or o
rtho
dox t
ea, a
nd s
o on
).
Larg
e-sc
ale
expo
rts (
mor
e th
an $
1 bill
ion)
with
su
bsta
ntia
l sm
allh
olde
r im
pact
(KTD
A al
one
reac
hes
560,
000
farm
ers)
.
Maj
or p
laye
rs (K
TDA,
Glo
bal T
ea) a
re
alre
ady e
xist
ing
IFC
clie
nts.
Add
ition
in
vest
men
t opp
ortu
nitie
s may
com
e in
ni
che
or s
peci
alty
mar
kets
, but
sca
le w
ill
be u
nlik
ely.
Coff
eePr
emiu
m K
enya
n co
ffee
is g
loba
lly
com
petit
ive
and
can
com
man
d hi
gh
mar
ket p
rices
(mor
e th
an $
5,00
0 pe
r M
T); h
owev
er, a
ggre
gate
pro
duct
ion
and
yiel
ds h
ave
stea
dily
dec
lined
, im
plyi
ng c
halle
nges
in m
aint
aini
ng
com
petit
iven
ess a
t sca
le.
Addr
essi
ng p
rodu
ctiv
ity a
nd q
ualit
y cha
lleng
es
nece
ssar
y to
arre
st d
eclin
e in
pro
duct
ion
and
henc
e ex
port
s to
glob
al m
arke
ts. L
ocal
and
re
gion
al d
eman
d lik
ely t
o re
mai
n sm
all i
n th
e m
ediu
m te
rm.
Med
ium
-sca
le e
xpor
ts
($20
0 m
illio
n pe
r yea
r) a
nd
farm
er re
ach
(less
than
15
0,00
0).
Loca
l dem
and
for h
igh-
valu
e co
ffee
is
smal
l but
gro
win
g; n
iche
opp
ortu
nity
. Po
tent
ial t
o in
crea
se v
alue
add
ition
via
in
vest
men
ts in
spe
cial
ty p
rodu
cers
, who
ro
ast f
or lo
cal m
arke
t and
nic
he e
xpor
ts
(for
exa
mpl
e, M
iddl
e Ea
st),
but s
cale
will
lik
ely b
e lim
ited.
Cut f
low
ers
Flow
ers a
re e
stab
lishe
d an
d co
mpe
titiv
e in
glo
bal m
arke
ts.
Cont
inue
d re
cent
gro
wth
, alth
ough
ris
ks to
com
petit
iven
ess i
n th
e fo
rm o
f ris
ing
prod
uctio
n co
sts,
hig
h ai
rfre
ight
ch
arge
s, a
nd in
crea
sing
com
petit
ion
(for
exa
mpl
e, fr
om E
thio
pia)
.
Dem
and
grow
th fr
om tr
aditi
onal
(EU)
mar
ket
likel
y to
be g
radu
al a
t bes
t; op
port
uniti
es li
e in
gr
owin
g ex
port
s to
new
mar
kets
, par
ticul
arly
in
Asi
a (f
or e
xam
ple,
pot
entia
l in
Chin
a gi
ven
airf
reig
ht c
ost d
eclin
es fr
om $
3 pe
r kg
to $
2 pe
r kg)
. Sea
frei
ght o
ppor
tuni
ties (
as e
xist
in
LAC)
can
be
expl
ored
.
Larg
e in
term
s of b
oth
expo
rts
(mor
e th
an $
500
mill
ion
per
year
) and
med
ium
by
empl
oym
ent (
100,
000
dire
ct).
Clea
r opp
ortu
nitie
s for
inve
stm
ent
(incl
udin
g in
div
ersi
fied
flow
er, v
eget
a-bl
e, o
r her
b pr
oduc
ers)
. IFC
has
how
ever
be
en la
rgel
y hel
d ba
ck b
y wat
er
conc
erns
link
ed to
Lak
e Na
ivas
ha (t
he
prim
ary
grow
ing
regi
on).
Frui
ts (m
ango
sele
cted
for
in-d
epth
)
Keny
a is
com
petit
ive
in fr
esh
frui
t pr
oduc
tion
and
proc
essi
ng fo
r the
lo
cal m
arke
t and
mai
ntai
ns a
su
bsta
ntia
l nic
he in
pro
cess
ed
pine
appl
es fo
r exp
ort.
Keny
a ap
pear
s to
poss
ess c
ompe
titive
pot
entia
l fo
r exp
ort-
orie
nted
man
go p
roce
ssin
g (c
once
ntra
te o
r drie
d), b
ut fu
rther
rese
arch
is
need
ed o
n sc
ale
of th
e op
portu
nity
. Sca
le o
f fre
sh
expo
rt op
portu
nity
als
o ne
eds f
urth
er
expl
orat
ion,
like
ly to
be
chal
leng
ing.
Larg
e in
term
s of p
rodu
ctio
n (m
ore
than
3 m
illio
n M
T pe
r ye
ar) a
nd s
mal
lhol
der r
each
.
Proc
essi
ng is
cap
ital i
nten
sive
and
ce
rtai
nly
repr
esen
ts a
pro
mis
ing
aven
ue
for i
nves
tmen
t. Sc
ale
of o
ppor
tuni
ty
need
s fur
ther
ass
essm
ent.
Avoc
ado*
Keny
a ap
pear
s hig
hly c
ompe
titiv
e in
fr
esh
avoc
ado
prod
uctio
n fo
r the
loca
l an
d in
tern
atio
nal m
arke
t (el
even
th-
larg
est g
loba
l exp
orte
r) w
ith n
oted
se
ason
al a
dvan
tage
s.
Inve
stor
inte
rvie
ws i
ndic
ate
high
com
mer
cial
gr
owth
pot
entia
l in
fres
h ex
port
s; p
roce
ssin
g (o
il) fo
r exp
ort m
arke
ts s
mal
l but
pro
fitab
le.
Low
to m
ediu
m s
cale
in te
rms
of p
rodu
ctio
n (le
ss th
an
200,
000
MT
per y
ear)
but
with
gr
owth
pot
entia
l.
Prom
isin
g op
port
uniti
es fo
rin
vest
men
t in
com
mer
cial
pro
duct
ion
(like
ly v
ia d
iver
sifie
d ho
rtic
ultu
re
expo
rts)
; pot
entia
l for
sm
alle
r in
vest
men
t in
proc
esse
d oi
l for
exp
ort.
Tabl
e co
ntin
ues n
ext p
age

67KENYA COUNTRY PRIVATE SECTOR DIAGNOSTIC
TABL
E 6.
1 (C
ONTI
NUED
)
Crop
Mar
kets
targ
eted
com
petit
ivel
y (s
hort
term
)M
arke
ts th
at c
ould
be
targ
eted
com
petit
ivel
y (m
ediu
m to
long
term
)Im
pact
(pro
xied
by
scal
e)In
vest
men
t pot
entia
l
Dair
yKe
nya
is a
com
petit
ive
milk
pro
duce
r fo
r the
larg
e lo
cal m
arke
t, w
ith o
ne o
f th
e m
ost d
evel
oped
dai
ry s
ecto
rs in
Su
b-Sa
hara
n Af
rica.
Sm
all i
ntra
-re
gion
al e
xpor
ts.
If pr
oduc
tion
incr
ease
s, g
row
th o
ppor
tuni
ties
may
lie
in e
xpan
ded
milk
pro
cess
ing
(for
ex
ampl
e, y
ogur
t) fo
r reg
iona
l exp
ort.
Subs
tant
ial c
amel
milk
nic
he a
lso
of in
tere
st
but r
equi
res f
urth
er re
sear
ch.
Very
larg
e: o
ver 5
mill
ion
MT
per y
ear i
n m
ilk p
rodu
ctio
n,
prov
idin
g liv
elih
oods
for
900,
000
Keny
ans.
Inve
stm
ent p
oten
tial l
imite
d pr
imar
ily
due
to m
arke
t con
cent
ratio
n is
sues
.
Pota
toKe
nya
appe
ars c
ompe
titiv
e an
d se
lf-su
ffici
ent (
very
lim
ited
impo
rts
and
expo
rts)
in p
otat
o pr
oduc
tion
for
the
loca
l mar
ket,
both
fres
h an
d pr
oces
sed.
Intr
areg
iona
l tra
de o
ppor
tuni
ties i
n pr
oces
sed
pota
to p
rodu
cts r
equi
res f
urth
er re
sear
ch.
Larg
e in
term
s of p
rodu
ctio
n (c
irca
2 m
illio
n M
T) a
nd g
row
n by
ove
r 500
,000
farm
ers.
Lim
ited
in p
rodu
ctio
n or
pro
cess
ing:
la
rges
t loc
al p
roce
ssor
gen
erat
es le
ss
than
$5
mill
ion
in a
nnua
l pot
ato
cris
p sa
les.
Pot
entia
l for
inve
stm
ent i
n va
lue
chai
n (fo
r exa
mpl
e, p
osth
arve
st st
orag
e).
Mac
adam
iaKe
nya
is th
e th
ird-l
arge
st g
loba
l pr
oduc
er o
f mac
adam
ia n
uts,
im
plyi
ng s
tron
g co
mpe
titiv
enes
s. A
ll pr
oces
sing
is lo
cal.
How
ever
, thi
s ap
pear
s via
ble
only
bec
ause
of
expo
rt re
stric
tions
on
raw
nut
s.
Assu
min
g co
ntin
ued
stro
ng g
loba
l dem
and,
gr
owth
will
rest
on
Keny
a’s a
bilit
y to
incr
ease
pr
oduc
tion.
Sui
tabl
e la
nd fo
r exp
ansi
on
appe
ars t
o be
the
mai
n co
nstr
aint
, with
ex
istin
g gr
owth
at t
he e
xpen
se o
f cof
fee
prod
uctio
n.
No d
ata
on fa
rmer
num
bers
; pr
oces
sing
em
ploy
s aro
und
14,0
00 w
orke
rs.
Exis
ting
Keny
an m
arke
t lea
ders
face
po
litic
ally
exp
osed
peo
ple
cons
trai
nts
for I
FC in
vest
men
t; ho
wev
er, I
FC
port
folio
or p
ipel
ine
dem
onst
rate
s po
tent
ial o
f the
cro
p in
the
regi
on (f
or
exam
ple,
Mal
awi a
nd U
gand
a).
Live
stoc
k(b
eef)
Keny
a ap
pear
s to
have
str
ong
fund
amen
tal c
ondi
tions
for l
ives
tock
or
bee
f pro
duct
ion
but c
urre
ntly
lags
its
regi
onal
nei
ghbo
rs (f
or e
xam
ple,
Et
hiop
ia a
nd S
omal
ia).
Subs
tant
ial
upst
ream
wor
k is
nee
ded
to c
reat
e m
arke
ts.
Long
er-t
erm
mar
ket o
ppor
tuni
ties i
nclu
de
incr
ease
d qu
antit
y and
qua
lity o
f bee
f or l
ive
anim
als f
or lo
cal a
nd e
xpor
t mar
kets
, in
part
icul
ar, t
appi
ng th
e gr
owin
g M
iddl
e Ea
ster
n m
arke
t.
Very
larg
e (5
0 pe
rcen
t of a
ll ag
ricul
tura
l lab
or).
Inve
stm
ent p
oten
tial i
s sig
nific
ant b
ut
likel
y to
be lo
ng te
rm; f
urth
er re
sear
ch
need
ed to
iden
tify p
riorit
y cre
atin
g m
arke
ts o
ppor
tuni
ties.
Gum
Ara
bic
Keny
a ex
port
s sm
all v
olum
es (l
ess
than
4,0
00 M
T pe
r yea
r) o
f gum
Ar
abic
. Thi
s cro
p re
pres
ents
a
pote
ntia
l gro
wth
sec
tor f
or th
e no
rth,
al
thou
gh s
cale
is q
uest
iona
ble,
giv
en
the
smal
l ($2
00 m
illio
n) b
ut g
row
ing
glob
al m
arke
t siz
e.
Give
n cu
rren
t low
leve
ls o
f pro
duct
ion
in
Keny
a (le
ss th
an 10
,000
MT
per y
ear)
it is
un
likel
y tha
t pro
cess
ing
for l
ocal
mar
kets
will
be
com
petit
ive
in n
ear t
erm
, hen
ce th
is w
ill
likel
y rem
ain
a ni
che
expo
rt c
rop.
Impo
rtan
t for
the
nort
h;
curr
ent p
rodu
ctio
n sc
ale
low.
Glob
al m
arke
t siz
e is
cur
rent
ly 10
0,00
0 M
T pe
r yea
r and
exp
orts
by m
arke
t le
ader
(Sud
an) a
re o
nly 3
5,00
0 M
T pe
r ye
ar (l
ess t
han
$70
mill
ion)
; hen
ce
com
mer
cial
pot
entia
l is l
imite
d w
ithou
t su
bsta
ntia
l mar
ket g
row
th.
Note
: EAC
= Ea
st A
frica
Com
mun
ity; M
T = m
etric
ton;
KTD
A = K
enya
Tea D
evel
opm
ent A
genc
y. *A
voca
do is
also
a fru
it, bu
t for
valu
e-ch
ain pu
rpos
es it
is of
ten c
onsid
ered
sepa
rate
ly fro
m fr
uits
such
as pi
neap
ples
and m
ango
es, w
hich
tend
to ha
ve si
mila
r pro
cess
ing c
hara
cter
istics
.

68 deep dives
from Somalia, Uganda, and Tanzania. Sheep and goat production is around 80,000 metric tons, with surplus production of goats resulting in export opportunities.
Despite this apparent scale, investment opportu-nities are constrained by a market that is fragmented, largely unmanaged, and, hence, highly inefficient. The share of beef that comes from pastoralists (85 percent) generates little more than subsistence incomes. Export channels are undeveloped compared with poorer neighboring countries (for example, Somalia, Ethiopia) that have made greater progress in this area.
Challenges in linking pastoralists to markets cut across culture, economics, and climate. Cultural chal-lenges include the use of livestock-as-assets, resulting in sales when cash is needed, not when animals are the right age. Economic challenges include lack of market access and market information, and climatically, pastoralist production in Kenya is highly vulnera-ble to a shortage of natural grazing combined with growing climate risks.
Existing private investments are therefore limited and predominantly outside the core pastoralist regions. These include a small number of modern slaughter-houses, primarily in the Nairobi area, large ranches providing high-quality beef to local markets (particularly in Laikipia), and a growing number of largely SME scale feedlots that provide an intermediary fattening stage between pastoralism and slaughter, which is a key component to further developing the supply chain.
Livestock is the mainstay of the economy in the northern ASALs (figure 5.1) but attempts to promote meat value-chain investments have yet to generate results. For example, there have been various efforts to develop large-scale abattoirs in the north (for example, Isiolo, Wajir) but these have been publicly financed and appear to have been largely unsuccessful to date, given the lack of private participation and challenges in securing sufficient volumes of live animals and supplying distant markets (see box 5.6).
Given its scale and potential for positive devel-opment impacts in the poorest parts of Kenya, the development of the meat value chain represents a logical focus area for creating markets. However, mobilizing private investment at scale will require long-term engagement. Priorities for reform and for public investments needed to realize this potential, include the following examples:
• Market links. Integration of pastoralists into live-stock market systems will be critical for the long-term transformation of the meat sector in Kenya. Feed and fattening ranches will be an important link in the value chain.
• Disease-free zones. Effective management of quar-antine zones is a critical prerequisite for the expan-sion of exports.
• Infrastructure. Improved transport remains a pri-ority, and development of cold chain infrastruc-ture would require initial concessional funding.
• Veterinary services. Similar to crop inputs, vet-erinary service subsidies, in particular for vacci-nations, would benefit from reform to incentivize private provision in place of the free but limited public coverage.
• Traceability. Stakeholder interviews suggest that traceability outside of high-end ranch production will only be viable with regulatory enforcement.
ConclusionAlthough Kenya benefits from a relatively large number of commercial-scale farms (15 percent of farmed area is more than 60 hectares), arable land for expansion is extremely scarce. Kenya relies heavily on rain-fed agriculture, with only 3 percent of arable land under irrigation. Recurrent droughts have also put the water resources under stress. Where land is available, costs are high, and/or titling issues persist. Meanwhile, most smallholdings continue to be subdivided. The resulting land pressure has reduced fallow periods, leading to depletion of soil nutrients and declining yields.
Poor quality of rural road infrastructure and comparatively expensive airfreight results in access-to-market challenges for domestic production and exports. Air, shipping, and roads are generally operating over
BOX 5.6 AVOIDING ISIOLO ABATTOIR'S FATE
Isiolo is a major livestock trading town in the north of Kenya. To capitalize on this position, in 2007, the government, with support from the African Development Bank, started the construction of a modern abattoir. Eleven years on, the stru cture remains incomplete and has yet to be used as a slaughter-house. In addition to funding shortfalls, the project lacked a clear strategy for sourcing the quantity of livestock required for financial viability, as well as the necessary cold chain infrastructure to access major national and export markets.
Efforts to revive the project via a public-private partnership have so far been unsuccessful. Never theless, with devolution shifting more resources to the county level, other arid and sem iarid land counties are now planning similar publicly sup-ported abattoir projects. To avoid similar disappointments, it will be critical for the World Bank Group to work with them to ensure strong market design and private participation from the outset.

69KENYA COUNTRY PRIVATE SECTOR DIAGNOSTIC
their capacity, with 30 percent of road infrastructure requiring rehabilitation or reconstruction.
Nonetheless, Kenya has been able to leverage its relatively limited but fertile and high-altitude arable land to develop a wide range of high-value crops. Growth in the tea, cut flowers, and green beans value chains, which together account for over 65 percent of agricultural exports, represent major success stories for Kenya, which other countries in the region are eagerly attempting to replicate.
Despite stressed infrastructure, Kenya is a major logistics and trading hub for East Africa. Its trading position provides important advantages, including one of East Africa’s major ports in Mombasa, estab-lished trade routes by sea and air, improving rail networks, and serviceable core road infrastructure. More recently, Kenya has taken the lead locally, if not globally, in technical service innovations (ICT – related) supporting farmers and agribusinesses.
Kenya’s sweeping devolution creates great opportunity for improved local accountability and transparency. However, in the short term, devolving oversight of agriculture to the county level (including extension services, infrastructure development, and so on) has created capacity and investment climate challenges (including additional county taxes on intracountry trade).
As Kenya seeks to drive its agriculture transfor-mation, attention should be focused on the numerous opportunities to improve competitiveness, including
(1) supporting improved productivity of farmers with improved extension services, including building the skills of the service providers; (2) shifting input subsidy programs to focus only on subsistence farmers and developing innovative means to balance public and private engagement in distribution; (3) investing in small-scale irrigation schemes when large-scale investment is not warranted or practical; (4) supporting farmer aggregation models that can promote smallholder links to offtakers, which can improve access to good farming practices and new technology, resulting in better production for the farmer and better quality and more consistent supply for the offtaker; (5) developing public or private sector – driven agriaggregation centers that can provide value-added services to farmers and processors; (6) investing in infrastructure, for example, feeder roads or improved rail access to help open mar-kets and improve transport efficiency; (7) upgrading quality of infrastructure for agribusiness, which includes continued access and support for international certifi-cations, especially organic, to help increase value and open markets; and (8) developing export promotion strategies and building of Kenyan brand awareness.
In addition, agricultural transformation should be driven as much as possible by the private sector’s input, guidance, coordination, and activities. Private engagement to agriculture transformation will help keep resources focused on sustainable commercial development.
MAP 5.1 AGRICULTURAL ZONES IN KENYA
Source: Kenya, Ministry of Agriculture.
Vegetation Agricultural zones
DesertDesert, shrub, and grassSavannahCoastal brushMarsh and swampMountain, river, and coastal forest
Pyrethrum
Tea
Sugar
Coffee
Cattle
Sisal
Cotton

70 deep dives
Affordable Housing
IntroductionIn light of Kenya’s rapid pace of urbanization, the housing sector is under significant pressure. In 2017, Kenya’s population was estimated at 48.5 million (World Bank 2016a) and is growing at an annual rate of 2.6 percent. According to the United Nations, Kenya’s population will grow by about 1 million each year to reach 85 million by 2050. Currently, about 32 percent of the population lives in urban areas, which is lower than the rate in other countries in Sub-Saharan Africa.34 However, at 4.4 percent per year, the annual growth rate in city populations is much higher than the national average and twice the global average. Indeed, at the current rate, by 2050, half of Kenya’s population will live in cities (World Bank 2016a). This means that over half of annual household growth is in urban areas (that is, 0.5 million units per year), which will continue to place significant pressure on housing in the major cities. Although urbanization bodes well for economic growth by way of poverty reduction and expanded access to jobs and services for a growing proportion of the population, it inevitably brings to bear incremental pressure on housing.
Affordable housing is one of the Big Four priorities of the government. President Kenyatta outlined four development priorities for his final term: manufac-turing (and jobs), universal health coverage (UHC),
affordable housing, and food security. In the specific case of affordable housing, the government expects to deliver 500,000 new formal housing units by 2022. The affordable housing program is intended to simultaneously create 350,000 jobs. Based on limited information on implementation strategies, 400,000 houses are planned for construction through public-private partnership (PPPs) and 100,000 units will be constructed under a “social housing” scheme. The government has committed K Sh 40 billion ($400 million) of monetary and legislative incentives to the private sector to encourage PPPs. This includes the promise of 7,000 acres of serviced land, together with a reduced tax rate for developers that construct more than 400 “low-cost” houses annually, with further tax reductions for developers that produce over 500 units per year (see box 5.7).
The primary beneficiaries of the government’s affordable housing strategy are Kenyans who are unable to access long-term housing finance. To this end, the government is targeting households with monthly incomes that are below K Sh 100,000 ($1,000). These households are considered to fall into a “mortgage gap” — they are creditworthy but cannot access mortgages. This segment of the housing market represents about 95 percent of the formally employed population (figure 5.4).
FIGURE 5.4 KENYA’S AFFORDABLE HOUSING STRATEGY AND THE TARGETED BENEFICIARIES
SocialIncome range: K Sh 0–14,999
Low costIncome range: K Sh 15,000–49,999
Mortgage gapIncome range: K Sh 50,000–99,999
Middle- to high-incomeIncome: K Sh 100,000+
Distribution of housing units to target segments
by 2022
20%
50%
30%
500,000 new housing units under the government’s Big Four affordable
housing agenda
Private sector to supply this segment
Source: State Department of Housing and Urban Development.

71KENYA COUNTRY PRIVATE SECTOR DIAGNOSTIC
The World Bank Group has supported Kenya in the development of the affordable housing segment with lending and technical assistance. It has pro-vided technical assistance as part of the Naivasha Affordable Housing Project to leverage private capital and development expertise in the segment through an
innovative hybrid PPP arrangement. The Bank Group is also preparing an operation to expand access to affordable housing finance for targeted beneficia-ries via the provision of long-term funding and the strengthening of property registration.
BOX 5.7 AFFORDABLE HOUSING UNDER THE BIG FOUR AGENDA
The Kenyan government has developed an affordable housing strategy with six pillars. The strategy targets households with monthly incomes below K Sh 100,000 ($1,000) and seeks to lower unit prices below K Sh 3 million ($30,000).
1. Unlocking land for affordable housing supply. Land and its proximity to services (transport, jobs, social infrastructure) are critical enablers to affordable homes. The government has indicated its intent to make sufficient serviced land available to private developers and enter into public-private partnerships to support the supply of affordable homes on a larger scale. It is in the process of surveying all parcels of public land to assess whether they are properly registered and are suifigure for public- private arrangements (some land has already been iden-tified for development). That said, the commitment to provide ad hoc government land parcels is more limited than the potential benefits of a systematic reform of the land titling, permitting, and taxation system around pro-vision of serviced urban land, which is lacking at present.
2. Providing bulk infrastructure.The government is taking a holistic view of urban development and is committed to servicing land parcels by providing bulk infrastructure (water, sewage, power, access roads) to attract the private sector. It is also supporting rapid mass transit systems around key urban areas, starting with Nairobi. In the fiscal 2019 budget allocations, infrastructure will take the biggest chunk of the funds allocated for development (K Sh 112.99 billion).
3. Simplifying the building codes.The government is planning to simplify the building code and streamline permit applications to support the afford-able housing supply. New building codes have been adop-ted, discarding the British standards in favor of European norms now in use globally, and are expected to promote harmony and enhance safety in the sector. However, some critics indicate that these new codes are not relevant to the needs of a developing nation and remain inappropri-ately high. A new e-construction permitting system is also being adopted by various counties and indications show
that it has already reduced the time and costs of obtaining construction permits.
4. Reducing development cost.The government intends to incentivize large-scale deve-lopments to reduce cost, as well as the use of alternative building materials and construction techniques. The corporate tax rate of developers that construct at least 100 units per year was lowered to 15 percent in the fiscal 2019 budget.
5. Financing.The government is in the process of setting up the Kenya Mortgage Refinance Company (KMRC), a public-private company that will provide long-term funding to financial institutions to extend loan tenors. The KMRC will be a who lesale financial institution that issues bonds in the local capital markets and, with the proceeds, extends long-term loans to financial institutions, secured against mortgages. The National Treasury will own 20 percent of it and the remainder will come from development finance institutions, Kenyan banks, and savings and credit coop-eratives. On supply finance, the government is creating a National Housing Development Fund to act as an aggrega-tor of demand and support savings by collecting the con-tributions of employers and employees to the Homes Ownership Savings Plan.
6. Enabling environment.The government is planning to enable legislation to facili-tate and digitize property registration, sectional titling (Sectional Properties Act), strategic land acquisition (Public Land), and prohibit land speculation (Idle Land Tax and Pot-ential Land Tax). On April 8, 2018, an order was issued to digi-tize land documents in registries across the country to make it easier to provide ownership titles, especially on commu-nally owned land. However, the Law Society of Kenya has taken the Land Ministry to court, claiming this process has been implemented without consultation and is open to cor-ruption. It claims that legislation must be drafted to back this up and an order is not sufficient and could be reversed by subsequent administrations. A task force has now been set up to develop guidelines for the digitization process.

72 deep dives
The Bank Group has been actively involved in other financial interventions in the affordable housing segment. Although lending has been limited, Bank Group – financed interventions were focused on improving the enabling environment for affordable housing. Because of the Bank Group, Kenya has made considerable strides in increasing transparency at its land registry and cadaster systems, as well as in expediting construction through the implementation of e-construction permits. For instance, a digitization program was introduced to increase transparency with the support of the IFC. Similarly, the second e-construction permits program ever launched in Africa was facilitated by the Bank Group as a means of providing registration of building professionals; submission, monitoring, review, and approval of development applications and issuance of permits; inspections processes; and data archiving. The program is being progressively rolled out across Kenya’s city governments. The Bank Group will rein-force its presence in the segment by financing the establishment, capitalization, and operations of the KMRC, with a view to expanding the availability of long-term funds that commercial banks and savings and credit cooperatives (SACCOs) make available to targeted beneficiaries.
Although the Bank Group has been actively under-taking business development in the affordable housing segment, a deeper understanding of the demand- and supply-side constraints that hinder investments is required. This deep dive seeks to test prevailing assumptions around the types of housing that are affordable to different segments of Kenya’s urban pop-ulation. It provides an insight into the current status of affordable housing in Kenya, identifying constraints along the housing value chain that contribute to its high-cost and low-affordability dynamic. It further quantifies the costs of constructing different types and sizes of housing units in Kenya, and assesses affordability based on current household income distributions and mortgage finance rates. Then it concludes by offering recommendations for public and private sector engagement in the segment.
AFFORDABLE HOUSING SECTOR CONTEX TThe housing sector is an important generator of employ-ment and contributor to output growth. Based on available statistics, the value of housing construction in 2016 was about $2.7 billion, equivalent to 6.3 percent of Kenya’s GDP. This housing output comprised $1.19 billion in gross value added and a further $1.53 billion in intermediate inputs purchased from other sectors of the economy. Imports accounted for 9.3 percent of total intermediate inputs and the equivalent of 16
percent of manufactured inputs. Total employment in housing construction may exceed 575,000, but more than 90 percent of this is estimated to be informal. After adjusting for import leakages, it is estimated that housing construction has a direct impact output multiplier of 2.16. The Big Four agenda could increase the contribution of housing to GDP from 6.3 percent to more than 14 percent and grow employment from 575,000 to more than 750,000 in housing construction. Demand for intermediate inputs would likely grow from $1.53 billion to over $4.2 billion, which would place significant pressure on imports of intermediate goods, if the local manufacturing sector does not ade-quately respond to this demand growth. However, if the housing program were to be developed in parallel with an effective domestic manufacturing localization and growth strategy, it could yield much higher mul-tipliers in the domestic manufacturing sector.
Demand for urban housing will continue to grow as Kenya urbanizes. Demand for housing is estimated to be around 200,000 units per year, of which 100,000 units are required in urban areas. This demand is projected to increase to nearly 300,000 units per year by 2050 (World Bank 2016). By comparison, fewer than 50,000 formally constructed housing units are currently produced annually, of which only 2 percent are formally constructed homes targeted at low-income segments (figure 5.5). Given a housing deficit of about 2 million units, nearly 61 percent of urban households are forced to live in suboptimal conditions and slums.35 This is higher than the rates observed in other countries in Sub-Saharan Africa, for example, 50 percent in Nigeria and 23 percent in South Africa. Although affordable, slums are inade-
FIGURE 5.5 HOUSING SECTOR SUPPLY: “INVERTED” PYRAMID
Upper and middleincome
83%
Lower-middleincome
15%
Low income 2%
15%
Distribution of the annual supply of 50,000 formally constructed housing units
Source: Adapted from Wagacha 2018 using data from the Centre for Affordable Housing in Africa.

73KENYA COUNTRY PRIVATE SECTOR DIAGNOSTIC
quate in terms of durability, tenure security, service provision, and urban management, and extremely costly for the government to upgrade in situ.
Rapid urbanization has created heterogenous housing submarkets. Distinctively different residential products, including different forms of housing typologies and forms of tenure, coexist in major and intermediate cities. For instance, 64 percent of Kenyan households own their accommodation, whereas 36 percent rent. Of the 27 percent of households that live in urban areas, 70 percent rent and the remaining 30 percent own their accommodation (figure 5.6). The share of renting households in urban areas ranges from a low of 61 percent in Kitui to a high of 91 percent in Nairobi.36 In rural areas by contrast, 88 percent of households own their homes and only 12 percent rent them. The predominant forms of housing in urban areas are bungalows (41 percent), medium- and high-rise apartments (21 percent), Swahilis37 (21 percent), and shanties (13 percent).
Informal housing predominates. Given the very low rates of formal housing construction, most households access accommodation by renting informally, with most construction being undertaken on an incremen-tal basis where households have access to land. This predominantly informal nature of housing delivery results in the relatively low levels of intermediate input imports, whereas in the formal housing market, imports are significantly higher.
Fiscal constraints, however, prohibit the government from intervening directly in the production of new housing. The State Department of Housing, Urban Development and Public Works estimates that the delivery of affordable housing under the Big Four will cost about $21.3 billion. This compares with the coun-try’s entire budget for fiscal 2018 of just $26.2 billion. Solutions to address this funding gap will therefore need to rely upon private finance and delivery, coupled with long-term contributions from households themselves.
Overview of Private Sector Constraints and Market Opportunities in Affordable HousingHigh-quality, formal housing in urban Kenya is not affordable to most households. Only 10 percent of Kenyan potential house buyers can afford housing despite selective and vibrant growth of a housing sector that exhibits high returns. The key drivers of poor affordability are telling: poverty, restricted avail-ability of reasonably priced end-user credit in banks (including affordable housing buyers) to less than 10 percent of potential applicants, restricted mortgages and other housing finance products, and growing informal employment and incomes, all conspire to prevent the home ownership rate from increasing. With an estimated backlog of over 2 million units (World Bank 2017b), many lower-income urban households are forced to live in rented single-room
“Swahili” accommodation and shanties.
FIGURE 5.6 KENYA HOUSEHOLD INCOME, TENURE DISTRIBUTION, AND HOUSING
Source: Adapted from Gardner and others 2019.

74 deep dives
The availability of and access to housing finance from formal institutions is limited in scope and scale and excludes the majority of low- and middle-income households. Kenya’s mortgage loan sector remains very limited, with only 24,085 mortgages in 2018 and an estimated outstanding value of K Sh 203.3 billion ($1.97 billion). This is equivalent to only 2.5 percent of GDP, compared with 30 percent in South Africa and 70 percent in the United States. SACCOs have overtaken commercial banks and mortgage providers in the provision of housing and housing construction loans, accounting for more than 90 percent (over 100,000 housing loans) of home finance loans in Kenya. Increasingly, SACCOs also negotiate access to land and housing for their members, but they have limited governance and administrative capacity to do so.38 The Kenya Union of Savings and Credit Co-operatives, the proposed Housing Microfinance Fund (World Bank 2018), and the recently launched KMRC are welcome initiatives to increase the flow of finance into housing lending. The interest rate cap in 2016, coupled with decreasing asset quality (non-performing loans ratio of 10 percent), have resulted in lenders shortening the maturity of their loans and curbing mortgage lending.
Housing rental is the predominant tenure form in Kenya’s cities. The main driver behind high rates of informal rental are affordability constraints and limited affordable housing for sale. Rental markets provide accommodation opportunities that would otherwise not be available to low- and middle-income households, and that in turn create a significant eco-nomic sector of small-, medium-, and large-scale real estate investors and landlords. Considering rental levels, it is estimated that 53 percent of urban renters pay less than K Sh 2,000 per month in rental, 26 percent pay between K Sh 2,000 to 4,000, 16 percent pay between K Sh 4,000 and 10,000, and only 5.5 percent pay above K Sh 10,000 (KNBS 2015c). Table 5.2 shows the cost, repayment, and proportion of Kenyan households who can afford formally con-structed homes with mortgage financing.39
Kenya’s housing development faces a credit-starved environment. Even with the capping of interest rates in 2016, the actual cost of credit still averages between 16 and 18 percent because of additional administra-tion fees. The dominance of banks in the provision of credit facilities in the Kenyan economy (as opposed to rate capping, as in the current debate) is a key anomaly constraining the long-term credit needed
TABLE 5.2 INDICATIVE HOUSING COSTS AND HOUSEHOLD AFFORDABILITY ASSUMING FULL LAND AND INFRASTRUCTURE SUBSIDY, 2018
Unsubsidized formally constructed product benchmark Cost Monthly repayment
Share of households who can afford
US$K Sh,
millions US$ K Sh %
House on a 120m2 stand Apartment
55m2 60m2 65,000 6.5 1,134 114,182 0.3
45m2 50m2 60,000 6.0 1,047 105,422 0.3
35m2 40m2 50,000 5.0 872 87,802 0.6
30m2 35m2 40,000 4.0 698 70,282 1.0
25m2 25m2 30,000 3.0 523 52,661 1.4
20m2 20m2 20,000 2.0 349 35,141 3.8
120m2 serviced site 15,000 1.5 262 26,381 5.0
Basic serviced site or upgrading scheme 10,000 1.0 174 17,520 10.2
Land purchase or incremental building only 5,000 0.5 87 8,760 33.4
Source: Data from the Centre for Affordable Housing in Africa.

75KENYA COUNTRY PRIVATE SECTOR DIAGNOSTIC
for housing projects. In developed markets, bank funding usually accounts for only 40 percent of total funding, with the balance 60 percent coming from nonbank funding from avenues including the capital markets and alternative funding such as high-yield investment instruments.
On the supply side, there is significant polarization between small, local, informal housing developers and contractors and large mostly non-Kenyan develop-ment and construction companies. A limited number of mid-sized local developers and contractors exist, but they continue to struggle to gain recognition and access to formal housing project opportunities. There are also allegations of poor quality construc-tion in the informal and formal housing markets. Low-quality materials and construction are problems in large housing projects, and informally developed accommodations often fail to meet Kenya’s already outdated building standards.
Kenya’s housing sector is also hampered by a lim-ited flow of investment finance for the production and maintenance of residential markets. This finance ranges from long-term investment and construction finance for developers, investment in the construction, materials and housing-production value chain, as well as real estate investment and end-user finance. The various contributors to the lack of investment across the housing supply and demand value chain contribute to increased costs of construction for developers, as well as low consumer affordability levels.
Misaligned incentives discourage private invest-ment in the affordable housing segment. Unmet housing demand in the middle- and upper-income markets and low profitability leave private suppliers and developers little reason to go down market. An excess of demand in the market leads speculators and investors to take up affordable housing even from targeted groups. The spillovers of unmet demand feed informal and illegal urban settlements as the urban population continues to grow.
The high land cost40 in Kenya also limits the devel-opment of affordable housing. The limited supply of reasonably located affordable and developable land and constraints on the production of lower-cost accommodation products are key barriers to the delivery of affordable housing. This limited supply is attributed to discordant systems of land tenure, titling, and release and high levels of land speculation, with inefficient systems of spatial planning and land-use management further exacerbating appropriate zoning, land identification, and release. Dysfunctional land markets and institutions are largely responsible for the high cost of land in Kenya. Land costs are
also raised by high land stamp duties (2 to 4 percent of land value) and legal and survey fees. Taxation policy for rental income (taxed at 30 percent) is a disincentive to producing formal rental housing, and outdated building codes can add as much as 60 per-cent to construction costs. Large minimum-lot size standards (around 160 square meters) also drive up land costs. High financial and transaction costs for surveying and registering properties, inappropriate tax policies, outdated building regulations, and the high cost of construction materials also keep costs high, prevent the construction sector from maturing, and serve to keep informal development growing (World Bank 2016a).
Kenya’s inefficient property registration and titling system adversely affects the housing sector by raising transaction costs, reducing ownership certainty, and creating opportunities for patronage and corruption. Kenya ranked 121st out of 190 econ-omies on property registration in the 2017 World Bank Doing Business surveys. It takes nine pro-cedures and an average of 61 days to register property in Kenya.
The registration process is further complicated by devolution, with different counties showing differ-ent levels of efficiency. Kenya’s inefficient planning, zoning, and land registration systems, combined with foreign ownership restrictions and land speculation and holding, continue to hamper access to well-lo-cated land for housing development. Through the 2010 Constitution and new laws enacted in 2012, foreigners (both firms and individuals) can no longer own land on a freehold basis and are instead limited to 99-year leases (reduced from 999 years). In addi-tion, some county governments have tried to attach onerous conditions to lease renewals, causing con-cern for corporate ventures in agriculture (including tea plantations), although the central government seems likely to block county interference. As with several other aspects of land tenure, a lack of clar-ity in existing laws and the prospect of additional land-related legislation will generate uncertainties. More positively, the digitization of land records and e-construction permitting in certain counties may speed up land transactions and land development and help resolve disputes.
High taxation, land disputes, and legal and survey fees act as a disincentive to produce formal rental housing. Taxation on rental income discourage pro-spective landlords from entering the affordable housing market, and outdated building codes add as much as 60 percent to construction costs. In addition, land-re-lated disputes are a major challenge for investors.

76 deep dives
They can cause lengthy delays and, in some cases, the project to fail, and their impact and uncertainty are exacerbated by the poor state of land records and changes to land laws.
Industry-specific skills for technical and profes-sional services are in short supply. Although basic labor rates are relatively low, skilled and professional inputs into the construction industry are generally constrained and often imported at high cost. Growing the professional competency and capacity in Kenya would be critical in supporting the affordable housing segment and the construction sector generally. This will require interventions and regularity of develop-ment to attract and retain competent professionals (many of whom have been lost to the Kenyan econ-omy), continued professional development initiatives, and improvements to the quality and quantum of outputs from the professional academic institutions. Improved artisanal skills bases are critical to overcome this. These skills include all basic building trades (civil works, building, carpentry, plumbing, tiling). High professional costs also add to the total cost of compliance and approvals for affordable housing construction. However, most critically, professional and trade skills will only become sustainable once there is greater long-term investment consistency in the construction industry. Without sustainable, multiyear prospects, such skills become mobile and move to more consistent areas of international demand. One good example of existing efforts in the area of skills development is the HF Foundation. It focuses on facilitating technical skills training that is guided by the vision of creating an “army of 1 million artisans” for the building and construction industry in Kenya.41
Housing Construction Value ChainThe cost composition of the housing market is key to understanding the challenges for affordable housing in Kenya. High property costs stem from the cost of land and construction, and inefficient property registration. Using a housing cost benchmarking methodology developed by the Centre for Affordable Housing Finance in Africa, figure 5.7 breaks down the cost of a 55-square-meter detached house on a 120-square-meter serviced stand in Johannesburg, South Africa, Kigali, Rwanda, and Nairobi, Kenya. Overall, the house is 61 percent more expensive in Nairobi than in Johannesburg and 19 percent more expensive than in Kigali. Construction costs comprise 44 percent of total product costs in Kenya, compared with 47 percent (of a much lower overall cost) in South Africa. This indicates the layers of development costs in Kenya that accumulate to increase the total costs
of housing, including land and infrastructure, com-pliance costs, other costs, profits, and value added tax (VAT). Overall, Kenyan construction costs are 51 percent higher than in South Africa and both labor costs (+35 percent) and material costs (+62 percent) contribute significantly to this. Although informal labor costs are, in general, lower in Kenya, the skills required for conventional construction are scarce and relatively more expensive.
A critical cost contributor to housing in Kenya is therefore the intermediate inputs into residential construction. Although primary sector intermediate inputs (sand, stone, timber) are relatively competitively priced, secondary sector (manufactured) building materials and components are significantly more expen-sive than in South Africa, resulting in the 62 percent materials cost increment between the two countries. The major materials cost contributors are (in order of magnitude) manufactured steel products, manu-factured cement products, timber products, plastics, electrical equipment, cement, chemical products, and ceramics, glazing and porcelain. High intermediate input costs are exacerbated by high import tariffs on many materials (including steel). Constraints in the local steel value chain include high transport costs and a recent ban on logging activities that has affected local timber production. The revealed competitiveness analysis points to Kenya’s reducing competitiveness in many building material categories, corroborating the need for significant imports of materials at high cost. Figure 5.8 shows the relative contribution to the total construction cost of materials across three housing typologies in Kenya.
Unavailability of municipally provided service infrastructure further drives up costs for develop-ers. The third-largest cost driver (after manufactured materials and labor) is bulk and internal infrastructure provision (13 percent for a 55-square-meter house and 16 percent for a 35-square-meter house). Municipal and utility networks in most cities are limited, which necessitates the development of on-site water and waste systems, and connecting to electricity grids is expensive and often requires having an on-site backup generation capacity because of the unreliable electric-ity distribution. The high costs of providing on-site water, sanitation, and energy supply, especially for detached houses, therefore contributes significantly to overall product cost (+36 percent compared with Johannesburg).
Compliance costs deter expansion of the hous-ing sector. Considering the detailed breakdown of the accommodation costs, many inefficiencies were also identified. High compliance and approval costs

77KENYA COUNTRY PRIVATE SECTOR DIAGNOSTIC
Refined goodsCement productsCementSteelElectrical and mechanical equipment
59.1 67.210.9
12.7
8.1
14.210.4
11.2
16.0
12.7
11.28.0
21.0
15.2
12.511.1
7.4
a. Free-standing houses b. Low-rise walk-up apartment blocks c. High-rise apartment blocks with lifts
56.3
FIGURE 5.8 SHARE OF THE TOP FIVE MATERIALS CATEGORIES IN KENYAN HOUSING TYPOLOGIES (%)
Source: Data from the Centre for Affordable Housing in Africa.
FIGURE 5.7 BENCHMARKED HOUSING COSTS, JOHANNESBURG, SOUTH AFRICA, KIGALI, RWANDA, AND NAIROBI, KENYA, 2018
Source: Adapted from Gardner and others 2019.
10,000
20,000
30,000
40,000
50,000
60,000
0
70,000
NairobiKigaliJohannesburg
40,996
a. Total cost ($)
b. Cost breakdown (%)
Compliance and approvalsLand OtherDeveloper markupInfrastructureValue added taxConstruction
44.2
13.8
12.6
9.9
7.4
6.35.8
46.2
15.6
14.1
10.0
7.9
NairobiKigaliJohannesburg 46.9
13.0
14.9
10.0
4.84.7
5.6 4.12.1
65,824
55,477

78 deep dives
(+65 percent) are mainly because of the high cost of professional services (legal, design, surveys, impact assessments), land registration costs, and registration efficiency. Relatively higher financing costs because of higher interest rates and difficulties with “take-out” end-user financing also add to cost of affordable housing. Holding costs, construction, and bridging financing costs (where these can be accessed and managed by small, poorly capitalized companies) are affected by high interest rates, high-risk perceptions, and are exacerbated by development delays. These financing costs are amortized through increases in market prices of accommodation. Limited access to end-user finance requires innovative financial instru-ments be used to dispose of properties, many of which require more expensive financing costs. The impact of Kenya’s 16 percent VAT on total project costs is a significant burden to affordable housing production, even with the proposed corporate tax rebates for companies producing affordable housing at scale.
Finally, limited local supply of qualified workforce for construction and servicing of the housing sector puts burden on housing costs. Although built envi-ronment professionals such as architects, engineers, and quantity surveyors are well-trained and organized in institutes and associations, there appears to be a shortage of professional construction and project managers, which leads to some inefficiencies and performance constraints in the sector. Interviews with industry players indicated that professional fees on infrastructure projects such as roads could be well above global benchmarks, and on building construction projects, it typically tends to be above 10 percent of building costs and in some instances as high as 16 – 18 percent. Unwillingness to offer professional services at discount and speculatively is one reason for this because of the high number of projects that never make it through development. It was not clear if these fee levels took sufficient account of fee-reducing factors such as lesser complexity and greater degrees of design repetition on housing projects. This aspect should be further explored. With regard to availability and quality of contrac-tors, interviews, correspondence, and desk-based research indicated that numbers of small and medium residential contractors and property developers operating in the Nairobi area and in some of the secondary cities, appear to be quite entrepreneurial and well-led, but they struggle to compete against large foreign-based operators who are able to bring in materials, labor, and management capacity skill at relatively low cost.
RecommendationsThe deep dive has highlighted the main constraints that discourage private sector involvement in the afford-able housing segment. High land cost, inappropriate taxes and regulation, limited access to construction finance, and an underdeveloped mortgage market that is inaccessible to lower-income households with constrained affordability limit expansion in the sector. The deep dive further explored the inefficiencies of the formal construction value chain, arguably the largest supply-side constraint, finding that the costs of construction materials are significantly higher in absolute terms than those in other African cities. High formal construction costs in turn stimulate informal housing construction, with cheaper but substandard building materials and workmanship. Based on the constraints and opportunities identified, there are several actions that can be undertaken in the next four years to meet the targets of the government’s affordable housing program.
Recent efforts to improve land titling and registra-tions and the construction permit process, implement a mortgage liquidity facility, and provide tax incentives for affordable housing have made some progress in terms of the enabling environment for the affordable housing segment. Some of these improvements have been partially driven by the Big Four agenda, others have been in process for some time. More specifically:
• Processes toward digitization of registry (announced but not implemented yet);
• Implementation of new building codes “Eurocodes” from 2021;
• Establishment of the mortgage liquidity facility;• E-construction permits process (being rolled out
by cities);• Identification and release of certain landholdings
for low income development (albeit not system-atic); and
• Supply- and demand-side tax incentives (albeit uneven) for development and rental of affordable housing.
However, there are still many areas that require more attention, most notably (1) developing a compre-hensive housing strategy; (2) improving the availability of land; (3) enacting better foreclosure and mort-gage laws; (4) providing practical tax incentives and equity investments for housing; and (5) improving the financing, provision, and management of municipal infrastructure.

79KENYA COUNTRY PRIVATE SECTOR DIAGNOSTIC
Making data and information more widely available. Land and housing sector information is critical to understanding and adapting affordable housing strat-egies over time. The public and private sectors need to improve their information gathering, analysis, and dissemination to monitor, evaluate, and adjust afford-able housing development. This includes the need to better record and monitor land transactions and registrations, accommodation construction, and the application of government assets (land, finance, and infrastructure) to households that are most in need.
Addressing local developers’ barriers to entry.The cost-benchmarking exercise found that over half of formal housing costs are not construction-related, but instead linked to other parts of the housing con-struction value chain, with land and titling, and bulk and internal infrastructure provision being significant cost drivers. Formally developed affordable housing projects in Kenya are disproportionately focused on delivery by large (and mostly foreign) development and construction companies, which inadvertently excludes locally owned companies from participating in the Big Four program. Affordable housing strategies and projects must include and proactively develop the capacities of large, medium, and small local developers and contractors, as well as accommodate production capacity of households and small-scale landlords.
Strengthening the authorizing environment.Considering implementation recommendations, the need for a national, multisectoral coordinating com-mittee remains critical. Although additional research and feasibility work is constantly being undertaken into the Big Four affordable housing program, there is no formal forum or process through which required housing sector reforms can be negotiated, developed, implemented, and monitored. There is confusion in the industry regarding how the Big Four affordable housing strategies will be implemented, how imped-iments will be met, and how funding and subsidies will be structured and provided for. Such a formal, multisectoral coordinating structure must offer key housing interests, a platform to engage on common themes that must be resolved to develop a housing and construction sector that better meets Kenya’s housing needs during and after the Big Four agenda. The forum should include formal participation from national and county government departments, hous-ing developers and contractors, building materials supply sector, financial sector, affected community groups, and labor representatives to create a platform for large-scale housing provision.
Developing competitiveness of the local construction industry.A stronger and larger localized manufacturing sector supporting the development of the affordable housing segment would create a virtuous cycle of affordable home production, manufacturing growth, employment creation, and economic prosperity. Overall, Kenya has experienced declining global competitiveness in building materials over the past five years, with rela-tively few product categories gaining global market share. If the Big Four’s affordable housing is to stim-ulate the Kenyan economy, it will be essential that intermediate industries supplying the sector, as well as other construction sectors, are also developed to ensure greater local value added in the development process. High costs of materials could be reduced by improving access to critical materials through increased local production (such as the stimulation of local quality cement production) and/or value-added activities (such as augmented cement products and fabricated steel products). Key opportunities also exist to build local industry capacity to deliver a number of construction materials inputs, for which Kenya has a relative competitive advantage in the local and subregional market. Furthermore, the reliance on imported expensive luxury items in construction should be mitigated by improving locally produced products and building interest and acceptance of locally produced materials of good quality. This man-ufacturing growth strategy also has the potential to reduce Kenya’s trade deficit in building materials, as well as to grow a local and subregional market for Kenyan construction goods, services, and capacity. A failure to do so could result in building materials imports that are K Sh 60 billion or more than they are currently. Attempting to facilitate localization through higher import tariffs without local manufac-turing development is likely to be counterproductive because it will raise the costs of required building materials and reduce the affordability of housing even further. In any case, the average tariff applicable to product categories in which Kenyan producers have been losing global market share is already between 2.3 and 4.4 percent higher than those categories in which they have gained market share.
Strengthening institutions and regulatory frameworks.A substantial increase in formal housing production will place pressure on all related parts of the housing ecosystem. Kenya’s legislative and policy framework still has significant gaps impeding the implementation of large-scale housing projects. Promulgation of the new, comprehensive, and supportive Housing Act is

80 deep dives
urgently required. Such approaches must set clear rules for sharing responsibilities, risks, costs, and profits between public and private entities. Spatial planning and land-use management systems, land identification and release strategies, infrastructure development, and building standards and controls need to be revised and ramped up to support the Big Four program. Regulations that increase the cost of construction projects should be amended, such as minimum fees for professional services that are required for construction projects, and institutions should be empowered to address anticompetitive practices and rules in construction input markets. Furthermore, the administrative capacity of national, county, and municipal governments and state entities will require bolstering to accommodate the proposed rapid acceleration in housing production. In addition, a refinement of Kenya’s PPP framework is neces-sary, together with providing alternative contracting approaches suitable for urban land, infrastructure, and housing projects that are accessible to smaller, local companies to provide a foil to PPPs, which can be legislatively laborious, expensive to implement, and cumbersome to manage.
Areas of Future ResearchThe Big Four’s affordable housing agenda presents important opportunities for further research and development and strategic investments at various points in the housing construction value chain. This deep dive did not undertake specific feasibility assess-ments and further analysis is recommended to consider potential investments in the following areas:
• Land assembly, banking, and release mechanisms to scale up strategic release of publicly owned or controlled land for affordable housing development.
• The nature and form of incentives for afford-able housing production, including supply- and demand-side subsidization, incentives or supports, the approach to financing and operating infra-structure, and the approach to end-user financ-ing for housing.
• The provision of alternative, more affordable hous-ing products better suited to the housing demand and affordability profile in Kenya. This includes approaches to the provision of titled land, basic services, and slum upgrading.
• Strategies to stimulate and improve outcomes in the housing rental market, given that this will remain the prevalent housing delivery approach into the future.
• Review of minimum prices for professional ser-vices that are required for housing development and property purchase and financing.
• Competition law enforcement to dismantle monop-olistic practices in key construction inputs such as cement and steel. In South Africa for example, 17 cartels in construction materials affecting both public and private construction projects have been sanctioned in 2005 – 15. According to estimates by the Competition Commission of South Africa, cement prices are at least 9.7 percent higher in that country because of the cartels and the lim-ited number of market players, the same may be true for Kenya.
• Master plan and implementation of the critical infrastructure required to facilitate an orderly and cost-effective urban growth and, most importantly, improvement of the metropolitan movement sys-tems (public transport and roads) and the munici-pal water and sanitation networks. This will also require improving municipal finance and manage-ment approaches to manage and expand infra-structure networks.
• Investments into improving the certainty of supply and quality of output from the local cement and manufactured cement products industry, which has only one bulk cement producer that faces seri-ous quality issues (Bumburi Cement, which con-trols about 40.5 percent of the market share, was recently purchased by the Lafarge Group who owns 14.6 percent of East Africa Portland Cement, which in turn controls 24 percent of the Kenyan cement market).
• A program to improve the efficiency, quality of work, and ability to take on larger contracts of Kenya-based local contractors and developers is required. This should focus on internal efficiencies of companies, professional competences, and con-struction financing and joint venture (local-local or local-foreign) opportunities to assist their par-ticipation in the construction value chain.
• Research on the development of a local steel value chain to take advantage of recent mining sector improvements and new investments in iron ore extraction, as well as improving capacity and qual-ity from smelting and steel manufacturing opera-tions and shielding local producers from periodic international dumping using appropriate trade remedies based on technical analysis. This would be a longer-term undertaking and might not be completed within the time frame of the afford-able housing development target of 2022.

81KENYA COUNTRY PRIVATE SECTOR DIAGNOSTIC
• The potential for cost and time savings in con-struction of affordable housing by applying selected alternative building technologies (ABTs) should be considered (monolithic concrete structures, frame and infill, and other alternative technol-ogies). However, the potential cost savings from ABTs are deemed to be limited and should not be considered a panacea for affordable housing. This analysis should be accompanied by a complemen-tary study of the market acceptability of ABTs and the level of efforts from the government and other relevant organizations that would be required to make ABTs more accepted in the Kenyan con-text. The new “Eurocodes,” to be implemented from 2021, will make provision for implementa-tion of ABTs.
• Scaling up of green building approaches should be pursued in Kenya (such as the partnership with IFC’s EDGE program and the Green Building Council). Significant international experience shows that, although this may not reduce capital costs of construction, it can substantially reduce life-cy-cle costs, which become critical to the long-term affordability and operating costs of subsidized (social) housing stock, as well as private rental and owned housing stock. Green building also opens up the potential for new sources of inter-national development capital.
• Investments in continued technical and profes-sional skills development and professionalization of local developers are required to build a more efficient construction sector utilizing a greater local skills base and able to undertake larger-scale developments.
An affordable housing segment that consistently creates value within Kenya’s economy needs to take a long-term, systemic view of scaling up housing production, and not a short-term approach. The gov-ernment’s commitment to these reforms is critical to achieve the ambitious targets set out in the Big Four agenda. It needs to become deeply integrated in Kenya’s local regulatory manufacturing, construction, and financial services sectors and must be dedicated to meeting the accommodation demand profile of Kenyan households (and not only the formal upper- and upper-middle-income groups). Finally, it must build consistent and growing demand for locally manufac-tured intermediate inputs and assist in developing a local cadre of talented tradespeople and professionals working in the construction industry. This requires systemic changes rather than special dispensations
for the Big Four program or projects that are more likely to create price bubbles, materials shortages, and a reliance on expensive import leakages of skills, development capacity and materials. To meet Kenya’s housing needs, the capacity developed over the next five years must leave a robust housing sector capable of continuing to deliver at scale into the future, as well as the potential to expand exports and capacity into the Common Market for Eastern and Southern Africa (COMESA) region.

82 deep dives
Manufacturing
OverviewKenya’s manufacturing sector has remained rel-atively flat with slow growth in recent years.42 In 2017, the sector had a gross output of $22 billion,43 together with manufacturing value added of $6.5 billion, representing 9.8 percent of GDP. Despite real GDP growth averaging 5.5 percent over 2013 – 17, the sector has grown at a far slower pace of 2.2 percent annually over the same period. Agriculture, which is the largest sector of the economy, contributed 34 percent to GDP in 2017 and enjoyed a robust com-pound annual growth rate (CAGR) of 13.5 percent in the same period. Construction has been one of the fastest-growing sectors in this period, with average annual growth of 16 percent, rapidly making it an important contributor to GDP. Nevertheless, man-ufacturing historically has had strong performance by Sub-Saharan Africa standards and is seen by the government as one of the main strategic areas to help the country achieve its development objectives.
Kenya’s manufacturing sector is a major employer and has the potential to capitalize on Kenya’s labor force for future growth. In 2017, the sector employed 303,000 people and accounted for 11.4 percent of formal employment.44 Formal employment growth since 2013 has matched growth of the sector overall, at 2.2 percent annually. The sector had a male-to-female
employment ratio of 5.2 in 2016.45 In 2017, this ratio improved to 3.9 but still lagged the national average of 1.9. The informal sector46 employed 2.8 million workers in the manufacturing sector in 2017, repre-senting almost 10 times the number of formal sector manufacturing employees.47 Furthermore, informal employment is growing at three times the rate of formal employment. Real wages grew modestly for manufacturing workers in the private sector, at an average 1.9 percent annually in 2013 – 17.48 Despite slow growth in overall labor productivity of 2.0 percent49 annually, since 2013 manufacturing labor productivity has been declining at an average annual rate of 3.3 percent.
Kenya’s manufacturing reveal a diversified base with some surprisingly fast-growing subsectors (figure 5.9). Food and beverage is the dominant subsector, accounting for half of total manufacturing gross output in 2016. Other sizeable subsectors include textiles, apparel, chemicals, plastic products, cement, and fabricated metals, which each account for at least 3 percent of total manufacturing output. Apart from food products, these subsectors are all starting from a small base, but they serve as key drivers in manufacturing. These include key subsectors that the government has been prioritizing, textiles, apparel, and pharmaceuticals. Although leather has also been a
FIGURE 5.9 FAST-GROWING MANUFACTURING SUBSECTORS, EXHIBIT DOUBLE-DIGIT GROWTH, 2009–16
CAGR
(%)
Gross output ($ million)0.0 0.5 1.0 1.5 2.0 2.5 3.0 3.5 4.0 4.5 5.0 6.05.5
0
2
4
6
8
10
14
12
Apparel
Fabricated metals
Leather
PharmaceuticalsFurniture
Textiles
Food products
20162009Gross output:
Source: Data adapted from KNBS 2010; 2017c.Note: CAGR = compound annual growth rate.

83KENYA COUNTRY PRIVATE SECTOR DIAGNOSTIC
focus of the government, at 5 percent average annual growth in 2009 – 16, it has not grown as fast as the other priority subsectors. In fact, growth in the sub-sector has reversed and in 2013 – 16 it declined by an average of 2 percent annually.
As one of the three main sectors that contribute to Kenya’s export portfolio, manufacturing is an important foreign-currency earner, with several sub-sectors helping drive its growth. Twelve of Kenya’s top 20 exports are from manufacturing and averages about one-third of their total value. However, from 2007 to 2016, its contribution to total exports slowly declined, from 37 percent to 30 percent and its exports grew modestly at 2 percent annually, outpaced by the more rapid growth of extractives (14 percent) and agricultural products (5 percent). Nonetheless, there are notable fast-growing manufacturing subsector exports, including pharmaceuticals (8 percent, 10-year growth), leather articles (8 percent), and tanning extracts (5 percent). In addition, apparel is a very promising subsector, with a CAGR of 6 percent over the past five years.
A brief survey of selected key manufacturing sub-sectors reveals a level of dynamism that indicates that parts of the manufacturing sector are undergoing fundamental structural change. The fastest-growing subsectors50 are pharmaceuticals (12 percent), textiles (11 percent), and apparel (9 percent) annually since 2009. Conversely, chemicals, including plastics and iron and steel, have exhibited slower or declining growth rates in the same period. Some subsectors that the government has chosen to prioritize are showing strong growth. Apart from iron and steel, local production across key manufacturing subsectors has been increasing since 2009. Export growth is strong in the strategic subsectors of apparel, leather, and pharmaceuticals, but is declining or steady in construction-related subsectors (that is, cement, glass, plastics). As Kenya’s economy continues to grow, it appears that the country is fueling this part of its growth through imports. For example, as the con-struction sector has continued to grow, iron and steel production has not risen, as might be expected. Instead, the country has met its demand for iron and steel through rapid import growth. In 2016, iron imports outpaced local production by almost five times. In addition, as pharmaceutical production and export growth have both increased (at 12.0 and 10.7 percent, respectively), so too have pharmaceutical imports (10.5 percent). This suggests that Kenya’s economy continues to be tightly interlinked with the global economy.
The private sector is generally divided between larger formal businesses, those who have higher pro-ductivity and produce the bulk of economic output, and micro, small, and medium enterprises (MSMEs) in the informal sector, those who are estimated to employ around 90 percent of working Kenyans and characterized by relatively lower-value-added activities (for example, retail trade and hospitality). MSMEs suffer from poor access to capital inputs and technology and limited connectivity to supply chain and market opportunities.51 A fundamental issue for MSMEs in the manufacturing sector relates to the poor availability of managerial and technical skills, which greatly challenges the sector’s growth.52 In response to their importance to the economy, the government has established the Micro and Small Enterprise Act of 2012 and its operationalization through the setting up of relevant institutional mechanisms. The Act provides for new rules and institutions to support micro and small businesses to enable them to suc-ceed. It provides legal and institutional frameworks for the promotion, development, and regulation of MSMEs. Recommendations for further growth of MSMEs need to be focused on improving innovation and technology upgrading, in addition to improved access to finance and increased efforts to improving the overall enabling environment.
An examination of Kenya’s trading partners reveals a focus on trade that takes advantage of international trade agreements and maximizes regional proximity. From an export perspective, it appears that Kenya has leveraged its U.S. market access via the African Growth and Opportunity Act (AGOA), exporting an average of $234 million of apparel annually since 2009. However, after the United States, Kenya’s three top markets are regional — Uganda ($230 million), Tanzania ($106 million), and the Democratic Republic of Congo ($69 million). Although Kenya does have notable exports to Asia and Europe, total exports to countries that were top-three destinations for a product equaled roughly the same amount as exports to the Democratic Republic of Congo. Essentially, Kenya’s main export markets are concentrated in the United States and East Africa — a strategy that allows Kenya to continue growing exports to key strategic markets.
Comparing Kenya’s selected manufacturing sub-sectors with global growth indicates that Kenya’s manufacturing performance since 2009 has some bright spots, particularly in strategic subsectors that may highlight potential competitive advan-tages (figure 5.10). Growth in apparel, leather, and pharmaceuticals has been outpacing global growth,

84 deep dives
with pharmaceuticals growing particularly fast, at 12.0 percent versus global growth of just 2.7 percent. This performance may be indicative of the country capitalizing on various opportunities to gain a global toehold, albeit from a small base. But this strong performance has been tempered by headwinds in other subsectors, in which Kenya’s performance lags global growth, most notably in cement and glass, where Kenya’s performance comparison with global growth is especially stark.
Kenya is a regional leader within the manufacturing sector, although neighboring countries have begun to focus their own industrialization efforts, closing in on the lead that Kenya has historically enjoyed. Kenya’s manufactured products are largely focused on the domestic market, exporting only about 18 percent of its total output in 2009. Of these exports, about one-third went to the East African Community (EAC) and two-thirds to the rest of the world. Kenya’s share of manufacturing value is the highest among its peers in East Africa, which include Ethiopia, Tanzania, Rwanda, and Uganda.53 Generally, from 2008 to 2017 manufacturing market value added (MVA)54 for East Africa experienced growth, with some notable standouts (figure 5.11). Ethiopia and Tanzania have experienced rapid growth, at 14 percent and 7 percent, respectively, although Kenya’s man-ufacturing MVA has shown modest gains, growing at 3 percent annually.
Over the 10-year period from 2007 to 2016, the EAC exported an average of $1.3 billion annually in apparel, pharmaceuticals, leather goods, and con-struction-related goods such as cement and glass (figure 5.12, panel a). Kenya accounted for about 64 percent of these exports. However, this is only part of the story. Although Kenya has experienced some fast growth in the export of pharmaceuticals (8 percent) and leather goods, (7 percent), its neighbors have experienced exponential growth (figure 5.12, panel b). For example, apart from pharmaceuticals, Rwanda has experienced double-digit growth in all these subsectors, with rapid growth in apparel (45 percent), leather goods (133 percent), and glass (54 percent). Rwanda, however, is also growing from a small base. Ethiopia and Tanzania, each have larger subsectors than Rwanda, also have their share of fast-growing subsectors. Tanzania’s focus on apparel has yielded 19 percent growth annually, whereas Ethiopia is on its way to becoming a manufacturing powerhouse with impressive growth in the following diverse subsectors: cement (91 percent), leather goods (46 percent), apparel (44 percent), and pharmaceuticals (12 percent). Overall, the region is well positioned to build a solid manufacturing skills base in textiles and apparel, leather, and pharmaceuticals.
FIGURE 5.10 PERFORMANCE OF SELECTED KENYAN EXPORTS COMPARED TO GLOBAL GROWTH
CementCement
ChemicalsChemicals
Glob
al gr
owth
(%)
-2-3
-10
1
2
3
4
5
6
7
2 4 6 8-20 -15 -10 -5 0 10 12Kenya’s growth (%)
CementCement
ChemicalsChemicals
Textiles
Apparel
Leather
Pharmaceutical
Plastics
Iron andsteel
Glass
Source: Data form International Trade Centre Trade Map database.

85KENYA COUNTRY PRIVATE SECTOR DIAGNOSTIC
FIGURE 5.11 MANUFACTURING VALUE ADDEDKenya and comparator countries (% of GDP)
0
5
10
15
20Kenya Uganda TanzaniaEthiopiaRwandaVietnam South AfricaEgypt, Arab Rep.
2000 20172000 20172000 20172000 20172000 20172000 2017 2000 20172000 2017
Source: Data from the World Development Indicators database.Note: GDP = gross domestic product.
FIGURE 5.12 REGIONAL EXPORT COMPARISON, KENYA AND EAC COMPARATORS
a. Value ($ million) b. 10-year CAGR (%)
Kenya
Rwanda
Ethiopia
Tanzania
Uganda
-20 0 20 40 60 80 100 1200 50 100 150 200 250
Apparel
Leather articlesGlassCement
Iron and steelPlasticsPharmaceuticals
Apparel
Leather articlesGlassCement
Iron and steelPlasticsPharmaceuticals
Apparel
Leather articlesGlassCement
Iron and steelPlasticsPharmaceuticals
Apparel
Leather articlesGlassCement
Iron and steelPlasticsPharmaceuticals
Apparel
Leather articlesGlassCement
Iron and steelPlasticsPharmaceuticals
459
11-52354
133
44-3141291
-1446
1911-2-4
651
-14
3138
-5-9
8
44
112813-813
0.324.631.790.382.710.680.28
29.411.371.411.064.360.072.65
17.3751.1447.01
2.8722.2542.63
0.83
2.49107.6922.20
8.6878.81
8.300.72
255.28197.28149.92103.00
94.0025.32
2.38
Source: Data from International Trade Centre Trade Map database.

86 deep dives
Constraints and Cross-cutting RecommendationsTo achieve its policy objectives in terms of manufac-turing-led growth and for the sector to transition toward higher-value-added and export-led growth, Kenya will need to continue its efforts to improve enabling factors. In its Vision 2030, it has outlined several areas for reform and aware which ones can help the manufacturing sector grow. A recent bench-marking analysis that compared Kenya with potential competitors helped to identify several constraints related to the manufacturing sector (table 5.4).55
The analysis highlights that Kenya falls short on issues such as infrastructure quality, environmental sustainability, and transportation costs. Based on further analysis of the findings of the benchmarking report and additional discussions with stakeholders, the CPSD team narrowed the focus of the recommendations around five areas: (1) strategic skills development, (2) innovation and technology adoption, (3) industrial infrastructure, (4) improving competition policy, (5) product and technology upgrading, and (6) envi-ronmental and social sustainability. This should be supported by further reforms to improve the invest-
TABLE 5.4 KENYA RANKED AGAINST BENCHMARK COUNTRIES
KenyaEgypt,
Arab Rep. Ethiopia Mauritius RwandaSouth Africa Tanzania Vietnam
Business operating environment
Macroeconomics (exports, manufacturing, and FDI)
7 5 9 2 8 4 6 1
Legal and regulatory framework, contract enforcement
5 9 8 2 5 4 5 2
Investment policy or political, financial, economic risks
5 8 9 3 1 3 7 6
Quality of infrastructure (national level) 3 4 9 8 7 2 5 6
Labor or human resources 3 6 9 7 3 3 7 2
Telecommunications 5 5 9 2 7 1 8 2
Logistics Performance Index 2 3 9 7 5 1 4 6
Local market and access to foreign market
Local market for manufactured goods 6 3 1 7 8 4 5 2
Ease of Doing Business (DTF), Trading across borders (rank), 2015
3 7 8 1 5 6 9 4
Customs duties 7 8 9 2 5 4 6 3
Business operating costs
Tax 5 3 5 9 5 4 5 2
Land, building costs 3 – – – 5 1 4 2
Utilities 9 3 2 4 5 6 6 1
Telecommunications 6 3 9 4 1 7 8 2
Logistics (cost to import) 5 2 6 1 6 8 9 3
Low carbon and green indicators
Low carbon and green indicators 6 8 2 1 7 2 2 2
Source: Adapted from the Government of Kenya 2018.
Score1–2 3–4 5–6 7–8 9–10

87KENYA COUNTRY PRIVATE SECTOR DIAGNOSTIC
ment climate. The focus on these enabling areas is intended to help Kenya continue to build foundational manufacturing industries, such as plastics, steel, and food processing and beverages, and also expanding into more advanced manufacturing. The core of the recommendations rests upon improving markets for local goods, and further integrating Kenya as a regional player for more advanced manufactured products.
1. Improve focus on privately run skills and training facilities
Kenya faces high unemployment and unmet demand for skilled workers. The lack of skilled workers con-strains firms, affecting their productivity and growth. Strategies to manage the skills gaps encountered by firms include specialized jobs being filled by foreign or expatriate workers (for example, pharmaceutical firms) and investing in training when required to meet global standards. However, informal employ-ment dominates the Kenyan manufacturing sector (10 times the formal manufacturing sector) with many employed in small and medium enterprises (SMEs). Tight margins and a lax regulatory environment further weaken incentives to invest in skills for these firms.
On the supply of training programs, technical and vocational education and training (TVET) institutions (those focused on learning for the world of work) have a poor reputation in Kenya. A survey of Kenyan firms carried out in 2017 on behalf of IFC in the manufacturing, construction and oil and gas sectors found that employers identify gaps in both technical and soft skills of graduates of TVET institutions (Open Capital Advisors 2017). It also highlighted that existing TVET institutions are below indus-try standards, resulting in low demand for TVET programs and lack of collaboration with industry. TVET institutions are converting to degree-grant-ing universities to counter the low demand of their programs. An education deep dive in Ghana high-lighted similar issues with TVET institutions — their quality is poor, similar to many other countries in the region, with graduates experiencing difficulties finding employment.
Improving the relevance of TVET programs will be critical in meeting the Kenyan government’s Vision 2030 for technical education and training. The rele-vance of TVET programs will require collaboration and partnering with private manufacturing firms that would be large-scale employers of TVET graduates. Inputs from private firms should include curriculum design, technical experts as trainers, and the required up-to-date equipment. This would be a mutually
beneficial arrangement, as firms would have a vested interest in the successful training of future employees.
The challenge of improving the skills of its current workforce will require a diversity of training providers. In the short term, existing workers will need to be upskilled and reskilled to meet the needs of firms. The formal education system is not the solution for the current stock of workers. Promoting a diversity of training providers, including private training pro-vision, will be needed to meet the current demand for skills. The training academy in Tatu City is an example of a private initiative in collaboration with the local government that is bridging the skills gap in the construction sector. The youth train for six months and are then hired by contractors working on local projects (contractors are required to hire locally). This approach is similar to privately run skills-bridging programs at special economic zones (SEZs) that upskill or reskill workers to meet the needs of firms in the SEZs.
A strategy for skills development designed for the manufacturing sector will be critical if businesses, education institutions, and government together are to grow the talents and skills that are needed and upskill and reskill existing workers. This will be particularly important as the manufacturing sector prepares to move into higher-value-added products and for the impact of automation, R&D, and innovation. Improving information on skills demand will be an important start to ensuring that they are aligned to supply demand in key occupations. An IFC survey of firms in the manufacturing, construction, and oil and gas sectors highlighted that demand is greatest for transferable skills across these sectors, such as welding and electrical. In the pharmaceutical sector, for instance, the importance of skilled labor for qual-ity assurance and enforcement cannot be overstated. Yet the Kenya Good Manufacturing Practices (GMP) Roadmap notes the “discrepancy between the ade-quate scientific degrees of personnel and the limited knowledge of the World Health Organization’s GMP requirements potentially illustrates a general problem with existing educational systems and highlights a high need for review of academic and postacademic curricula...” (UNIDO 2014). The pharmaceutical firms that can hire locally for certain positions report that recent graduates are inadequately prepared to work in the industry, which leads to significant invest-ments in training programs of an average of three to six months — often diverting resources such as staff time from production. Building industry partnerships and making greater use of technology can support

88 deep dives
the collection, analysis, and dissemination of skills information, including for future workers.
2. Support innovation and technology adoption to improve product complexity
Kenya’s policy priority for manufacturing hinges on its ability to leverage science, technology, and innovation (STI) to improve productivity and prod-uct complexity. Even though the country is ranked third-highest on innovation in Sub-Saharan Africa according to the Global Innovation Index, it is still only 78th globally.56 Kenya scored favorably in market sophistication (61), business sophistication (49), knowledge and technology outputs (70), and creative outputs (56), but challenges remained in institutions (84), human capital and research (112), and infrastructure (103).57
A recent analysis of productivity challenges in Kenya highlights the need for increased knowledge capital investments and innovation activities at the firm level. These elements are necessary to boost eco-nomic complexity and productivity. Kenya displays inadequate policy and institutional framework to support STI. According to the analysis, only certain programs for supporting technology transfer or intel-lectual property rights exist, although these tend to be small and mainly focused on providing relevant information to firms. In addition, some programs that target assistance for market access also support innovation via quality certification or by providing information on new markets and technologies. Other types of innovation instruments, such as R&D tax incentives, are yet to be developed. Therefore, the STI institutional framework in Kenya can be described as an embryonic policy framework (Cirera 2015).
Kenya ranks relatively high in firm-level innovation, but this is primarily incremental, meaning the degree of innovativeness is low. Areas such as product and operational innovation tend to be fairly low, but firms displayed high scores on market innovation. In terms of sectors, it was found that the chemical sector is the most innovative, whereas organizational innovation is more prevalent in machinery and equipment and less common in services. Innovation in R&D is low but in line with countries that have a similar level of economic development. There is little integration of knowledge from external sources such as universities and other institutions (Cirera 2015).
At this stage in Kenya’s manufacturing sector, a focus on innovation policies to improve collab-oration between institutions, financing for product R&D, and technology services could help improve the innovation ecosystem. Improving access of firms
to technology service centers could help firms access vital information to realize organizational, managerial, and technological changes. Policies could also focus on providing gradual partial subsidies for R&D to high-impact projects could help provide vital financing. This needs to be coupled with improved coordination with universities and research institutions to help maximize economies of scale (Cirera 2015). These services can be integrated into the growing SEZ framework, as the bulk of new manufacturing is intended to take place within these zones. A number of these SEZs will be sector specific, allowing more targeted R&D facilities for tenant firms. Partnership on these services with universities will also be a way to improve collaboration.
3. Strengthen framework and investment in industrial infrastructure
The Kenya 2030 Second Medium-Term Plan (MTP-II), which ran from 2013 to 2017, specifically listed manufacturing as a priority sector and identified industrial infrastructure projects and related inter-ventions as flagship projects to underpin continued growth in manufacturing. These included:
• Establishment of SEZs,• Development of SMEs and industrial parks,• Development of industrial clusters,• Skills development for technical human resources
for the manufacturing sector, and• Transformation of the Kenya Industrial Research
and Development Institute into a world-class research institution.
The Ministry of Industry, Trade, and Cooperatives has developed the Kenya Industrial Transformation Program (KITP) to drive Kenya toward becoming a primary industrial hub in Africa through targeted sector-specific interventions. The KITP provides a strong overarching industrial development vision to support the SEZs in accelerating economic growth in Kenya. SEZs can be a significant game changer for Kenya by addressing key competitiveness constraints and providing an effective ecosystem to energize invest-ments into Kenya. They could unlock substantial job creation and investment across value chains.
The World Bank Group has been supporting the Kenyan government’s ambitions in the manufacturing sector for the past 8 years and has helped modernize Kenya’s Export Processing Zone (EPZ) program into the more forward-looking and inclusive SEZ program. Kenya passed an SEZ Act in 2015 and the Bank Group continues to partner with the government on SEZs

89KENYA COUNTRY PRIVATE SECTOR DIAGNOSTIC
to make its vision on unconstrained manufacturing growth a reality.
Several private and public zones are now in prog-ress across Kenya, at different stages of development and financing. However, several NTBs continue to constrain the full potential. Primary among these are:
• Barriers to increased competition,• Rules-of-origin issues and other conflicting regu-
lations between the EAC and COMESA,• No common position or coordination between
the EAC partners on SEZ policy,• Weak transportation links between the EAC part-
ner states, and• Inefficiencies and backlogs at Mombasa Port.
It is important to continue to support the development and successful implementation of the SEZ program based on international good practices. SEZs can be effective channels to provide a streamlined business environment, including customs, that can reduce the cost of doing business in Kenya. One-stop shops can be effective mechanisms for that. Given the context in which Kenya is operating today and the sectors of competitive strength, Kenya will have to base the strength of its sectors and SEZ programs on an envi-ronmentally sustainable platform. Frameworks such as eco-industrial parks advocated by IFC and German Agency for International Cooperation (Gesellschaft fur Internationale Zusammenarbeit, GIZ) can be helpful in strengthening Kenya’s SEZ and manufac-turing sector and making it competitive.
Well-developed and serviced land that offers plug-and-play options to the potential users (by sector) of the zone — such as zoned and ready to build or built-up plots, drainage, and water supply, effluent treatment plant for firms in leather or textile, access to internet, immediate access to renewable energy that is reliable both in quality and delivery — will be critical to the success of the manufacturing sector. Appropriate good practice regulations should be drafted, if they do not already exist, to ensure the promise of growth through SEZs is not half baked. This will require assistance with building and strengthening the SEZ regulatory authority, undertaking the prefeasibility assessment of sites, supporting PPP approaches for development, and helping in the operation of zones.
In addition, support for Kenya’s broader indus-trial infrastructure and ecosystem , which includes industrial parks; technology, research, or incubation centers; and clusters will be critical for manufac-turing sector growth. Given that the largest group of companies within Kenya are MSMEs, it will be
important to strengthen the links among firms and develop specific programs to improve capabilities and access to finance for MSMEs.
4. Reduce barriers to entry and competition in key manufacturing sectors
Kenya’s economy has been found to be highly influenced by high state participation in economic activities and the prevalence of restrictive regulations that create barriers to entry and rivalry for both domestic com-petitors and foreign entrants. These restrictions affect key enabling sectors such as energy, transport, and telecommunications. In addition, there are concentrated market structures in manufacturing where monopolies, duopolies, and oligopolies are more prevalent than in other countries in the regions such as Uganda, Tanzania, Senegal, and Ghana, indicating there could be barriers to entry in some subsectors (World Bank Group 2016, 3). Investors perceive significant operational risks asso-ciated to weak competition in Kenya, such as unfair competitive practices, vested interests, and discrimi-nation, according to the Economist Intelligence Unit.
Kenya’s manufacturing sector could be strengthened through stronger market and competition policies such as the following:
• A system that ensures that the design and imple-mentation of government interventions considers its impact on competition and market outcomes (prices, access, welfare, productivity) to address an uncontrolled system of market regulations at the national and subnational levels, as well as rules that allow incumbents to participate in govern-ment decisions, differential treatment of foreign-ers, government commercial activities in markets, and trade barriers that create distortions on the level playing field. There may also be NTBs in effect, such as in the pharmaceutical sector where joint reviews and inspections for mutual recogni-tion of products are not in effect within the EAC.
• Improved governance and market discipline mech-anisms toward state-owned enterprises to increase their efficiency and refocusing their direct partic-ipation, through majority or minority sharehold-ing, toward markets where private participation is not feasible or desirable to ensure competitive neutrality and crowd in the private sector.
• Additional efforts for effective and strong compe-tition law enforcement to fight cartels and abusive behavior of dominant firms, including technical instruments to increase compliance and deterrence as well as stakeholder engagement to support the implementation of competition policy in Kenya.

90 deep dives
5. Enhance base industries’ ability to contribute to the economy and support technology upgrading
Base industries — such as steel, chemicals, and food processing — need further support and enhancement. Kenya has a continuous history in manufacturing, but its core industries have lagged and failed to incre-mentally improve their complexity of products. The government sees these subsectors as foundational and hopes to establish more complex products, such as machinery and automotive parts. The recent discovery of iron ore in the eastern part of the country and a focused program in Vision 2030 could help alter the status of the industry, which is relatively minor in comparison to imports and is focused on basic products such as galvanized steel and nails (Chege, Ngui, and Kimuyu 2016). Hausmann and others (2014) show that more complex products, typically manufacturing products, are more proximate (or connected) to other manufacturing products and thus it is easier to shift to more complex products if a number of other complex products are already being produced. Kenya’s export basket is characterized by low levels of complexity and connectedness (Bhorat and others 2017).
Kenya scores poorly on manufacturing complexity and on its ability to leverage new technologies to upgrade production processes. This leads to high production costs across most subsectors. Firms lack finance and technical support to upgrade their tech-nology and business operations. Most textile and apparel firms have not conducted thorough energy audits which, given the old age of their equipment, constitutes a missed opportunity. In a COMESA survey of Kenya’s footwear companies, 85 percent regarded the poor state of their machinery and the lack of machinery as a major factor that undermines the quality of their products.58 Over 90 percent of them were facing major challenges with respect to machinery and tools, and all of them reported that they were operating with inadequate machinery and tools, with 80 percent saying their machinery and tools were unreliable.
To improve base industries and support the increased complexity of their products, it is important to focus on foreign direct investment (FDI) to attract more complex anchor investors. Kenya’s FDI performance, despite some promising growth, has stalled in recent years. From 2011 to 2016, annual FDI volume fluc-tuated from a low of $1.0 billion in 2012 to a high of $3.5 billion in 2013, before collapsing to just $0.4 billion in 2016. Most of these investments were in real estate, alternative or renewable energy, and finan-
cial services, suggesting market-seeking investment. Although some manufacturing sectors have received FDI, including beverages, chemicals, and electronic components, overall investment levels remain negligible relative to the sector’s size. Although it is possible for FDI activity to pick up in the near term, the gov-ernment needs to make a concerted effort to attract manufacturing FDI, especially in the strategic sectors.
6. Ensuring environmental and social sustainability
For significant industrialization and for manufactur-ing growth, addressing environmental sustainability issues is key. Implementing sustainable industrial infrastructures increases resource efficiency, which has impacts on cost reductions and competitiveness. Not only are there government standards to meet, there are also international investors in manufactur-ing that increasingly require stringent adherence to particular standards of environmental sustainability in the development and operations of manufacturing facilities. This is because of their own commitments to shareholders and other stakeholders. The National Environmental Management Authority is responsible for implementing environmental safeguards in Kenya. However, a lack of funding, gaps in regulations, and the lack of emphasis on the benefits of sustainability mean that there is little oversight on development projects with large environmental impacts. In gen-eral, Kenya’s manufacturing industry is faced with the following environmental challenges:
• Weak and fragmented policy coordination among relevant ministries and government agencies,
• Low technology, innovation, and R&D uptake,• Weak capacity to meet quality and technical stan-
dards, and• An influx of counterfeit and substandard goods.
Some manufacturing subsectors such as leather (tanning) and construction materials (iron, steel, and plastics) can take advantage of the growing pressure for environmental and socially responsible production. Kenya could develop high-value sectors compliant with stringent water, waste, energy, and land man-agement standards, as well as compliant with ethical, social, and labor guidelines.
For the manufacturing sector, localization of economic value is largely driven by the potential to gradually substitute the import of goods and commod-ities by manufacturing or producing them in-country. Outdated equipment and technology, high energy consumption, and the high cost of spare parts and
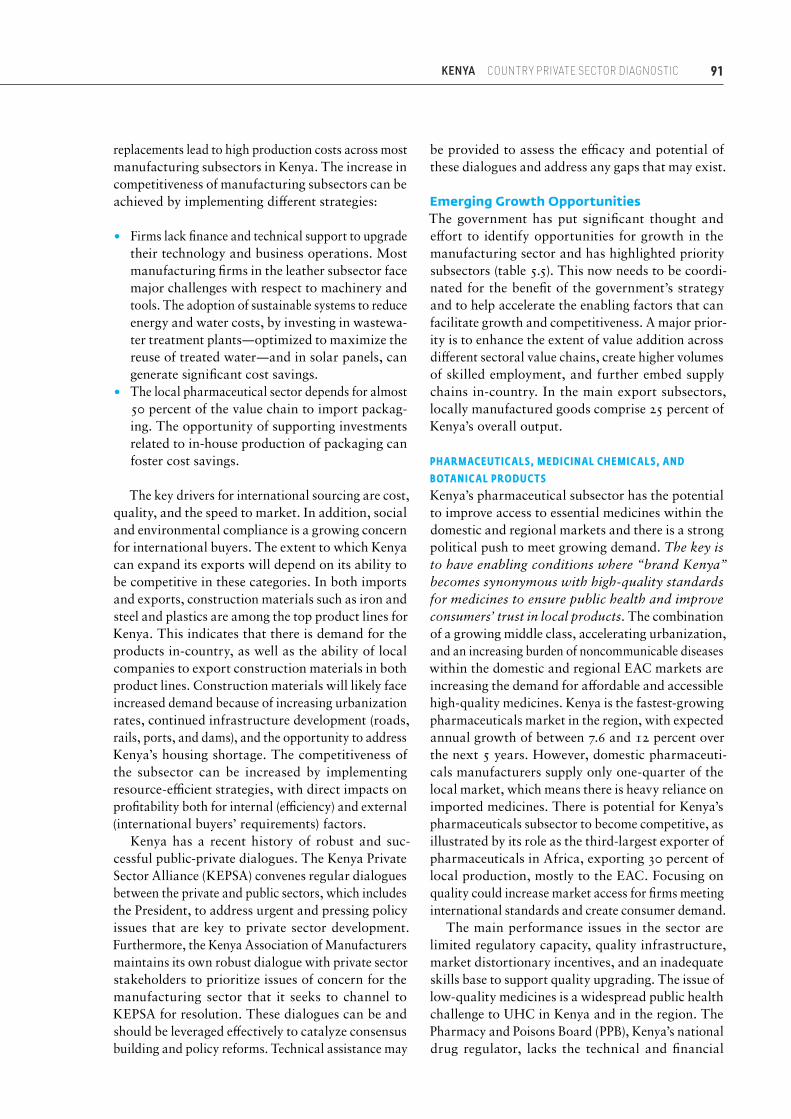
91KENYA COUNTRY PRIVATE SECTOR DIAGNOSTIC
replacements lead to high production costs across most manufacturing subsectors in Kenya. The increase in competitiveness of manufacturing subsectors can be achieved by implementing different strategies:
• Firms lack finance and technical support to upgrade their technology and business operations. Most manufacturing firms in the leather subsector face major challenges with respect to machinery and tools. The adoption of sustainable systems to reduce energy and water costs, by investing in wastewa-ter treatment plants — optimized to maximize the reuse of treated water — and in solar panels, can generate significant cost savings.
• The local pharmaceutical sector depends for almost 50 percent of the value chain to import packag-ing. The opportunity of supporting investments related to in-house production of packaging can foster cost savings.
The key drivers for international sourcing are cost, quality, and the speed to market. In addition, social and environmental compliance is a growing concern for international buyers. The extent to which Kenya can expand its exports will depend on its ability to be competitive in these categories. In both imports and exports, construction materials such as iron and steel and plastics are among the top product lines for Kenya. This indicates that there is demand for the products in-country, as well as the ability of local companies to export construction materials in both product lines. Construction materials will likely face increased demand because of increasing urbanization rates, continued infrastructure development (roads, rails, ports, and dams), and the opportunity to address Kenya’s housing shortage. The competitiveness of the subsector can be increased by implementing resource-efficient strategies, with direct impacts on profitability both for internal (efficiency) and external (international buyers’ requirements) factors.
Kenya has a recent history of robust and suc-cessful public-private dialogues. The Kenya Private Sector Alliance (KEPSA) convenes regular dialogues between the private and public sectors, which includes the President, to address urgent and pressing policy issues that are key to private sector development. Furthermore, the Kenya Association of Manufacturers maintains its own robust dialogue with private sector stakeholders to prioritize issues of concern for the manufacturing sector that it seeks to channel to KEPSA for resolution. These dialogues can be and should be leveraged effectively to catalyze consensus building and policy reforms. Technical assistance may
be provided to assess the efficacy and potential of these dialogues and address any gaps that may exist.
Emerging Growth OpportunitiesThe government has put significant thought and effort to identify opportunities for growth in the manufacturing sector and has highlighted priority subsectors (table 5.5). This now needs to be coordi-nated for the benefit of the government’s strategy and to help accelerate the enabling factors that can facilitate growth and competitiveness. A major prior-ity is to enhance the extent of value addition across different sectoral value chains, create higher volumes of skilled employment, and further embed supply chains in-country. In the main export subsectors, locally manufactured goods comprise 25 percent of Kenya’s overall output.
PHARMACEUTIC ALS, MEDICINAL CHEMIC ALS, AND BOTANIC AL PRODUCTSKenya’s pharmaceutical subsector has the potential to improve access to essential medicines within the domestic and regional markets and there is a strong political push to meet growing demand. The key is to have enabling conditions where “brand Kenya” becomes synonymous with high-quality standards for medicines to ensure public health and improve consumers’ trust in local products. The combination of a growing middle class, accelerating urbanization, and an increasing burden of noncommunicable diseases within the domestic and regional EAC markets are increasing the demand for affordable and accessible high-quality medicines. Kenya is the fastest-growing pharmaceuticals market in the region, with expected annual growth of between 7.6 and 12 percent over the next 5 years. However, domestic pharmaceuti-cals manufacturers supply only one-quarter of the local market, which means there is heavy reliance on imported medicines. There is potential for Kenya’s pharmaceuticals subsector to become competitive, as illustrated by its role as the third-largest exporter of pharmaceuticals in Africa, exporting 30 percent of local production, mostly to the EAC. Focusing on quality could increase market access for firms meeting international standards and create consumer demand.
The main performance issues in the sector are limited regulatory capacity, quality infrastructure, market distortionary incentives, and an inadequate skills base to support quality upgrading. The issue of low-quality medicines is a widespread public health challenge to UHC in Kenya and in the region. The Pharmacy and Poisons Board (PPB), Kenya’s national drug regulator, lacks the technical and financial

92 deep dives
resources to adequately monitor the quality of medicine in circulation and to shut down firms endangering the public’s health. Compared with other countries such as Nigeria, the current therapy screening area of just 11 percent of products per year is inadequate. Compliant local firms are negatively affected by the proliferation of counterfeits and substandard medicines, whose sales are not curbed because of insufficiently severe consequences for violators, such as prosecution, mandatory shutdown, and stock seizures. Kenyan manufacturers are caught in a cycle of low incentives to upgrade quality without sufficient profitability and scale, as consumers tend to distrust generics because of the poor quality in circulation. The implications for consumers are higher prices for medicines of indistinguishable quality and uncertain access.
Local manufacturers state that insufficient access to affordable finance is the most pressing challenge to investing in physical site and quality management system (QMS) upgrades. Interviews with local man-ufacturers revealed insufficient access to affordable finance as the most pressing challenge, particularly with regard to upgrading standards and efficiency. Elements related to the physical site and the QMS are the most pressing issues to ensure GMP compli-ance, as evidenced by the firm assessment. However, firms struggle to access capital from local banks to purchase additional equipment or expand or upgrade infrastructure. This is in part because of commercial banks’ insufficient experience with risk assessments, specifically for the pharmaceutical sector and of
high-interest loans inadequately suited for long-term financing of plant upgrading.
Firms face challenges filling jobs in quality assurance and quality control from within the Kenyan market. High-skilled jobs that firms have local-recruitment challenges include industrial pharmacists, chemists, microbiologists, site supervisors, and engineers. Semi-skilled jobs in demand include machine operators, quality controllers, and marketing and sales positions. Firm interviews consistently revealed a strong pref-erence for hiring locally to build a pipeline of skilled workers for the sector in Kenya and in the region. Without a local pool of qualified labor for these positions, firms import foreign labor mostly from the mature South Asian market and bear the relocation and work permit fees. Firms that can hire locally for certain positions report that recent graduates are inadequately prepared to work in the industry, which leads significant investments in training programs of an average of three to six months — often diverting resources such as staff time from production. Firms also face an ongoing risk of poaching and turnover in a market without a sufficient pipeline of talent for skilled labor available locally.
Several factors related to import duties on inputs, public procurement, tax, and financial incentives distort the market, which leaves local firms at a disadvantage to their importing competitors. When competing for government tenders, Kenyan firms argue that the 15 percent price preference for local manufacturers by the Kenya Medical Supply Authority is not significant
TABLE 5.5 NATIONAL INDUSTRIALIZATION POLICY AND DEVELOPMENT TIME FRAME
Subsector Time frame
Short term Medium term Long term
Labor intensive
Agriprocessing •
Textile and apparel • •
Leather and leather goods • •
Medium to high technology
Iron and steel • •
Machine tools and spare parts •
Agrimachinery and farm implements •
Pharmaceutical •
Advanced manufacturing
Biotechnology and nanotechnology •
Source: Adapted from MOIED 2012.

93KENYA COUNTRY PRIVATE SECTOR DIAGNOSTIC
compared to the 10 percent discount for imported medicines by Kenyan-owned firms. Similarly, local firms are paying tariffs on imported packaging not available locally, because of challenges to reclaiming VAT refunds from the Kenyan Revenue Authority and writing off the value of the rebates. As about 50 percent of packaging material is imported, local firms are effectively less competitive compared to duty- and VAT-free imported medicines as the tariffs on packaging could be up to 25 percent and VAT up to 16 percent. Further, producers in Kenya do not enjoy as significant corporate income tax treatment (tax rate and holiday) compared to those in Ethiopia, India, and China.
Within the EAC, slow implementation of joint pro-tocols, such as reviews and inspections for mutual recognition, limits local firms’ access to export markets and potential to scale without preferential registration processing. Local manufacturers face NTBs in the form of the slow process and lack of implementation of the African Medicines Registration Harmonization (AMRH) program. Firms cite challenges with the lack of a common information technology system to share information between countries and a common payment system to collect registration fees. The World Bank, which has supported the AMRH program since 2009, has cited the importance of political will and varied regulatory capacity across the region as a disincentive for harmonized standards. This means that few Kenyan manufacturers can benefit from the preferential reg-istration application processing times — for example, four months versus the average of one year — and meet growing regional demand and achieving scale.
The most significant opportunity for safer and more affordable products in the market is to improve the regulatory capacity for quality assurance and enforcement of locally produced and imported medi-cines. The main areas for government action to create the enabling conditions for Kenya’s pharmaceuticals sector includes:
• Improving technical and financial resources for strong regulatory oversight of medicine quality. This would include (1) implementation of the Kenya GMP Roadmap and (2) technologies for real-time quality testing through the value chain — working with the U.S. Agency for International Development (USAID) to leverage their experience in Nigeria, Ghana, Ethiopia, and Uganda through the U.S. Pharmacopeia’s (USP) Protecting Medicines Quality program.
• Leveling the playing field so that local firms com-pliant with international standards can fairly com-
pete with imports based on quality and price. This should be through revised tariffs on pack-aging, price preferences for public tenders, tax incentives, and import classification.
• Assessing roadblocks to implement harmonized protocols in the EAC. The aim here should be to increase market access for competitive, quality compliant firms and improve attractiveness for investors in the subsector. This would include the establishment of a semi-autonomous, sustain-able regional agency for effective implementation of joint initiatives, and information management systems to facilitate exchanges at the national and regional levels.
At the industry or firm level, there is potential to leverage advisory and investment solutions to sup-port manufacturers and distributors to upgrade and monitor medicine quality.
• Supporting e-health solutions to provide con-sumers with lower-cost options and assist firms along the value chain to increase quality. The World Bank Group’s TechEmerge matchmaking platform facilitates industry adoption of proven technologies to address operational challenges. Industry disruptors, such as MyDawa, promote supply chain transparency and efficiency, as custom-ers order high-quality, cheaper medicines directly using their smartphones. IFC and the World Bank could assess similar models for commercial via-bility, scale, and replicability from an investment and/or advisory support perspective.
• Adapting industry-led training solutions in col-laboration with global standard-setting organiza-tions, such as the USP training initiative in India, in Kenya, and/or in the EAC. IFC’s e-learning and/or distributor and retailer academy platforms, suc-cessfully tested in agribusiness, could be assessed for adaption in manufacturing subsectors. A sec-torwide skills strategy should ensure alignment with international standards. Continuous pro-fessional development based on industry needs and the regulator and identifying suitable train-ing and financing providers.
A coordinated approach is needed through a pack-age of interventions to support Kenya’s, as well as the region’s, efforts to increase the role of the private sector in supplying high-quality, affordable medicines (see appendix B for details). The recommendations will likely require a minimum five-year time hori-zon and a package of World Bank Group lending,
94 deep dives
advisory support, and investments, drawing upon Creating Markets Advisory Window and the Global Financing Facility.59 There is significant potential to bring in the United Nations Industrial Development Organization, the PPB, the Federation of Kenyan Pharmaceuticals Manufacturers, the EAC Secretariat, and industry representatives.
It is important to recognize that there may be resulting positive and negative impacts on Kenyan firms in the sector. Those that can meet the quality standards will have the opportunity to grow and expand, including in the donor and export markets. Those that cannot, will be forced to exit the market, and some assistance in this transition for firms and workers might be an important element in ensuring public support.
CHEMIC ALS AND CHEMIC AL PRODUCTS60
The chemicals industry, including the manufacture of basic industrial chemicals and pesticides, is a com-plex and evolving subsector. The main activities that produce chemicals includes metallurgical industries centered on iron, aluminum, copper, brass, and steel production. These activities provide a wide range of materials required by the engineering industry; chemical industries that produce fertilizers; chemi-cals-based recycling industries, especially those using industrial wastes and by-products; agro-industries such as those that produce molasses; cosmetics, var-nishes, oils, toiletry, soaps, and detergents; paints and resins; plastics and rubber; and inert gases (nitrogen and neon).
Hydrocarbons form the major input of many chem-icals-based industries, as well as energy generation. Kenya’s imports of oil products in 2014 totaled 4.6 million tons, a significant increase over the early 2000s. These include crude materials, aviation fuel, crude petroleum, motor fuel, kerosene, illuminating oil, jet fuel, gas oil, diesel oil, and other oils. Demand for petroleum fuels in Kenya and the region, especially for gasoil and gasoline, has been on the rise although there are infrastructure challenges, particularly in the lack of capacity in Kenya’s product-receiving terminal. Some of the imported petroleum is reex-ported to neighboring landlocked countries, Rwanda, Burundi, the Democratic Republic of Congo, and Uganda. The transport sector (rail, road, marine, and aviation) is the largest consumer of petroleum fuels. The key products of petroleum are gasoline, liquid petroleum, and butane.
In 2014, global chemical sales amounted to $3,555 billion, with China being the biggest consumer (30.4 percent), followed by Europe (17.0 percent) and the rest of the Asian countries (16.3 percent).61 Production
is concentrated in China, with decreasing amounts of production in the EU and the United States. Olefins and aromatics make up 90 percent of petrochemical production and are the basic components of all other petrochemicals and polymers. As these petrochemicals are commodity products, their market is cost-driven and highly price sensitive. China emerged as the leading consumer and accounted for 26.7 percent of global consumption in 2014.62 Regionally, COMESA and EAC chemicals imports from the rest of world increased by 5 percent and 11 percent, respectively (CAGR), in 2011 – 15.
The main opportunity for Kenya to strengthen its chemicals subsector is to meet growing demand from the local chemicals consumers, that is, the agri-culture, manufacturing, and service sectors. Kenya is not a major manufacturer of chemicals, except those that are locally mined and processed in-coun-try, such as fluorspar, lead, and titanium. The bulk of the chemicals used in the country are imported and mainly consist of petroleum, fertilizers, plas-tics, pesticides, and consumer products. There is also significant import of chemicals designated by international regulatory instruments as highly toxic. Managing chemical waste and pollution is therefore a key issue in Kenya.63
There are about 100 manufacturers of plastic prod-ucts in the country employing over 8,000 people. The products are marketed locally and exported to the COMESA subregion. Almost all of the raw materials are imported. There are also 20 plants involved in the recycling of waste plastics. Production of plastics utilizes many organic chlorine compounds, such as vinyl chloride, that are carcinogenic. Waste plastics are a major concern in Kenya, mainly because of the way in which they are disposed, usually through open burning, which generates dioxins and furans. Recycling of these plastics can form the basis of many SMEs.
Demand for plastics and packaging together with machinery will continue to grow, as Kenya strengthens its manufacturing base by importing machinery and raw materials to set up manufacturing plants to meet the rising demand for plastic and packaging products in East Africa. COMESA and EAC plastics imports increased by 8 and 5 percent, respectively (CAGR), in 2011 – 15. Kenya is a net importer of plastics. Demand for consumer plastic products has been growing at an average rate of 10 to 20 percent, annually.
LEATHER AND REL ATED PRODUCTSThe focus on the leather subsector is informed by the World Bank (2015a) study, “Kenya Leather Industry: Diagnosis, Strategy and Action Plan,” which indi-

95KENYA COUNTRY PRIVATE SECTOR DIAGNOSTIC
cates that the subsector has potential for growth. Furthermore, within the Big Four manufacturing agenda, leather has been selected as a key subsector, with the government seeking to produce 20 million shoes, increase export revenues in the industry to K Sh 50 billion, process all hides and skins, and ensure 5,000 cottage industries are set up by 2022. The government also aims to complete the Machakos Leather Park, with three more leather parks identified to follow. In this financial year, the government seeks to export K Sh 7 billion worth of leather products. The leather subsector has large potential domestic markets where an estimated 42 million pairs of shoes are purchased in Kenya annually, of which 15 million pairs (36 percent) are leather. The competitiveness
of Kenya’s leather subsector is based on the coun-try’s comparative cost advantages, derived from its abundant supply of cattle, goats, and sheep (Kenya is the third-largest livestock holder in Africa) and its relatively low labor costs.
Despite the subsector’s potential, performance in recent years has been volatile. Kenya’s leather hand-bag, travelware and corporate-item exports increased significantly from $0.4 million in 2007 to about $2.3 million in 2013, showing potential for future growth (figure 5.13). Nonetheless, the leather subsector is dominated by the export of “wet blue” and crust leather, with limited value addition (figure 5.14).
In terms of production, in 2017, leather and related products were laggards and recorded a decline of 12 percent in value terms, attributed to a reduction in the production of finished leather and shoes with leather uppers, which declined by 13.3 and 8.2 per-cent, respectively (figure 5.15). Kenya has lost most of its share of the domestic market for finished leather products and now depends on foreign markets and the export of semi-finished leather products to survive.
As with most of Kenya’s private sector, the leather subsector is divided into formal, larger players on one hand and largely informal micro and small enterprises (MSEs) on the other. The formal segment tends to be focused on the higher-value-added tannery and leather-export space, whereas MSEs tend to focus on the value-added manufacture of leather products, such as shoes, sandals, bags, belts, and other prod-ucts for the domestic and regional markets. Most of Kenya’s livestock and thus hides and skins come from a predominantly pastoralist population, particularly in northeast Kenya.
FIGURE 5.13 LEATHER EXPORTS: HANDBAGS, TRAVELWARE, AND CORPORATE ITEMS$ million
Source: Adapted from World Bank 2015.
0
500
1,000
1,500
2,000
2,500
2007 2008 2009 2010 2011 2012 2013
FIGURE 5.14 TOTAL EXPORT VALUE OF KENYA’S LEATHER PRODUCTS
Source: Adapted from World Bank 2015.
Share in total leather export (%)Export value ($ million)
Labor intensive Labor intensiveCapital intensive
Leather productsFinished leatherWet blue and crustRaw hides and skins
ManufacturingAbattoirs and Traders Tanning
5%
$6.7
89%
$131
2%
$3.5
4%
$5.6

96 deep dives
At the animal husbandry stage, the quality of hides and skins has deteriorated over time, with tanneries noticing a significant decline since the advent of devo-lution in Kenya. One of the key functions devolved to the county governments was agriculture and live-stock. However, county governments seem reluctant to finance livestock extension officers to work with local communities to manage their livestock. This is mainly because the county governments have limited funds at their disposal and the financing of extension officers is seen as a cost that would not generate short-term returns. As a result, animal health and husbandry officers are not financed by the county governments. This results in turn in poor-quality hides with tick bites, parasites, skin diseases, and poor nutrition of livestock, which ultimately affects hide quality. In addition, communities tend to brand their livestock, which could damage hides and skins for further use.
Hides and skins tend to be semi-processed and then exported. At the tannery stage, a key constraint is the cost and quality of power, which limits Kenyan producers’ ability to be competitive. One tannery interviewed stated that about 65 percent of its total costs were for electricity alone. There are also concerns regarding compliance with environmental standards by tanneries. The lack of adherence to international leather-related environmental standards at the tannery level limits leather exports to high-income markets.
There is limited large-scale value addition in the leather subsector. As mentioned, the larger players’ focus is on basic value addition to hides and skins for export. The value-addition space is dominated by MSEs, often informal, that service local markets, particularly in the manufacture of school shoes, with no large players operating in the value-added leather space, with the EPZs not having a single manufacturer of leather goods and products.
A major constraint is the quality of inputs in expanding domestic production of leather goods. Because most high-quality leather is exported, value addition in the domestic market is constrained by the provision of low-quality leather. Once leather reaches the final stage of its particular color, texture, and pattern, the local market has limited buyers of finished leather. The absence of large players at the value-addition stage stems from the fact that Kenya does not have an ecosystem of input suppliers for leather goods that can easily supply producers. In addition, leather has a fashion element that is dynamic and there is a lack of readily available accessories locally, thus local players cannot comply to the dif-ferent design elements, such as soles, cutting dyes,
cutting dices, and molds needed to meet the demands of the fashion segment. Accessories for leather are imported, which is a lengthy process and complicates the ability to comply with global export delivery timelines. Furthermore, input accessories are subject to 10 to 25 percent tariffs, whereas finished goods can be imported at a 25 percent tariff. These tariff structures disincentivize the import of accessories for shoe manufacturing, for example. In addition, it is a challenge to meet international standards for exports because of poor tannery practices and the types of chemicals used at the tanning process.
In terms of products, despite footwear contributing the largest share of final leather products produced in Kenya, the country still imports more footwear than it exports. Kenya is a net importer ($8.3 million) of leather footwear and many experts estimate the true value of leather footwear imports to be even higher. The second-hand market (mitumba) accounts for around 63 percent of footwear, through which 26.5 million pairs of Kenyan footwear are sold annually. The majority of purchased shoes are in the low-cost category. Nonleather shoes dominate both the mitumba and lower price range footwear; out of an estimated 42 million pairs of shoes purchased in Kenya annually, only 15 million pairs are leather shoes. Domestic producers only supply low-and mid-price leather shoes to the market. In the low-price leather shoe market, there are still vibrant local producers, mainly the informal (Jua Kali) sector, competing against cheap imports from China and Ethiopia. In the mid-price category, only about 0.8 million leather shoes are made in Kenya, with the other 1 million pairs imported. There are no local producers of high-
2015 2016 20172014
Finished leather Shoes with leather uppers
-25
-20
-15
-10
-5
0
5
10
FIGURE 5.15 OUTPUT PERFORMANCE OF LEATHER
Source: Data from the Kenya National Bureau of Statistics.

97KENYA COUNTRY PRIVATE SECTOR DIAGNOSTIC
end leather footwear. After footwear, leather bags is the second-largest leather segment.
There is an opportunity to invest in the development of common infrastructure and services that could help improve the quality in the upstream segments of the supply chain. This could include services for improving animal husbandry practices, the professional man-agement of abattoirs, and improved management of hides and skins traders. The development of leather parks could also help provide facilities with a common effluent treatment plant. This would release capital from effluent treatment to improve production and equipment. Such parks could also serve as vehicles to implement improved leather standards in collabora-tion with the Kenya Bureau of Standards and provide common manufacturing facilities for certain aspects of the leather manufacturing and testing process.
TEX TILES AND APPARELKenya’s textile and apparel subsector is relatively labor intensive in nature and largely export-driven, with viable prospects for future development. At present, the share of East Africa in the global textile and apparel trade is marginal, estimated at less than 1 percent of global exports. A key challenge for Kenya and for the East Africa region, more generally, is how to enhance the textiles and apparel value chain and diversify exports in international markets.
There are significant market opportunities for Kenya to diversify and grow its textile and apparel subsector. Demand for textiles and apparel is grow-ing at a high rate globally, in Africa and the EAC region, and domestically. Population growth inevi-tably creates additional demand for cotton, textile, and apparel-related products and the rise in average incomes in transition economies generates demand to substitute lower-priced and second-hand garments with more expensive products.
Production activity is shifting away from the EU, China, and Bangladesh, which are becoming more costly locations. Global textile FDI has increased by 32 percent over the past 5 years. The fabric and apparel market globally is forecast to grow by 4 to 6 percent annually up to 2020. In 2015, the EU, China, and the United States accounted for 37 percent of world textile imports, down from 52.8 percent in 2000,and accounted for 59 percent of world apparel imports, down from 78 percent in 2000. This indicates that import demand from other economies, especially from emerging markets, has been growing faster than elsewhere over the past 15 years.64
Imports of textiles and apparel into regional mar-kets are increasing. Imports of apparel into COMESA
and the EAC from the rest of the world increased by 32 and 7 percent, respectively (CAGR), in 2011 – 15. Meanwhile, COMESA and EAC textile or fabric imports from the rest of the world increased by 17 and 6 percent, respectively (CAGR), in the same period. FDI in the textile subsector has been highly volatile but increased on average by 73 percent per year in 2004 – 16 in Africa. A total of 198 companies invested in Africa in the textile subsector between January 2003 and January 2017.
Kenya’s textiles and apparel industry is a significant manufacturing activity, providing livelihoods to about 200,000 households. In 2011 – 16, Kenya attracted $37 million of FDI into the subsector,65 although compared to Ethiopia, this is a small fraction, which received $3.19 billion in the somewhat longer period of 2007 – 16.66 Trade performance data show that the subsector relies significantly on imports across the entire value chain. In 2012 – 16, the rate of growth for Kenyan exports was higher than the world aver-age. Total apparel exports represented $338 million in 2015, $339 million in 2016, and $340 million in 2017. Although Kenya retains its position as the top exporter of apparel to the United States under AGOA (Kenya’s largest market for apparel), export growth to the United States has leveled off in the past three years, at $270 million in 2015, $281 million in 2016, and $292 million in 2017. Data suggest that a portion of sourcing by large U.S. buyers has been diverted to other regional markets, notably Madagascar, which regained its AGOA eligibility in 2014, and emerging low-cost competitors such as Ethiopia.67 However, imports are growing at 4 percent annually, mainly in the yarn segment of the value chain.
According to a World Bank Group and Global Development Solutions (2015) report, the sector has faced continuous challenges related to production costs compared to competitors in terms of energy and labor costs, managerial and technical skills, and speed to market. For textile firms, chief among these is the cost of power at over $0.21 per kilowatt hour (kWh) in 2014, Kenyan firms are on fundamentally unequal footing to firms in other countries that pay considerably less, such as in China ($0.08/kWh) and in Ethiopia ($0.06/kWh). This results in power costs accounting for up to 25 percent of Kenyan textile firms’ operating costs. However, this percentage is not attributable to the high cost of power alone. A review of textile firms undertaken as part of this strategy process revealed that some are operating on equipment that, in some cases, is up to 38 years old and which draws considerably more power for its output than more modern equipment. Investment

98 deep dives
by textile firms in new technology will significantly reduce their operating costs and improve sustainability.
Another debilitating factor is the cost associated with the need to import inputs. After labor, materials are the second-highest cost component in the cut-make-trim segment of the value chain. As Kenya is far from its major fabric suppliers in Asia, the long lead time to imported inputs substantially increases costs. In terms of labor productivity, many Kenyan firms are at a competitive disadvantage on a cost basis. For instance, the average labor cost in the apparel sector is higher in Kenya ($175) compared with Madagascar ($60 – $90), Tanzania ($90), and Uganda ($105).68 This needs to be taken in light of potential differentiations on skill levels in these countries. Sewing operators’ wages in Kenya average $180 per month compared with $60 in Ethiopia. Exporters are also hampered by difficulties accessing markets, with a container taking longer to get to the United States than it does from countries such as China, India, South Africa, and Vietnam. Shipping costs in Kenya at over $2,000 is also more expensive than in almost all apparel exporting countries, such as Ethiopia.69
In addition, it is recommended that reform efforts are required to promote skilled workers, for most roles and levels in the textiles and apparel subsectors to help the industry move beyond basic, low-val-ue-added apparel production (cut-make-trim). It is also critical that technologies for the industries are upgraded. This could be done through developing special lines of credits for companies that take on board environmental and social considerations or by developing special financing mechanisms for the underserved, yet competitive, segments of the indus-try. The sector could also help develop a business incubator for SMEs and women entrepreneurs (spe-cifically in fashion design and accessories and home décor) to provide tailored business services and link with regional entrepreneurship centers to learn from other market players (for example, partner with the African Women’s Entrepreneurship Program).
A potential opportunity for Kenya’s textile and apparel industry lies in the fabric and yarn part of the value chain, mainly because of underutilized production capacity. Plants are either running at lower than their full capacity or are not providing the desired quality of a product higher up in the value chain. Indian and Chinese manufacturers are looking to diversify, given their rising domestic production costs. Factory wages are around $500 a month along China’s coastal rim ($250 in the interior), whereas monthly salaries in the same subsector in Kenya are only $120 – $150 a month. Value-chain integration can
help boost job creation, profits, and exports. This process — from cotton to a container of jeans — along a fully integrated value chain could potentially generate a total profit of $69,938 and 1,452 total person days of factory work. However, if cotton is exported at the lint stage (after ginning), more than 70 percent of the potential profit is lost.70
Buyers and consumers are placing increasing pressure on manufacturers to move toward environmentally and socially responsible production across the value chain. The industry is under growing ethical pressure. Bangladesh, the second-largest clothing manufac-turer after China, quickly overtook its competitors in China, Indonesia, and Vietnam owing to on-time deliveries and cheap pricing. However, in 2013, the deaths of more than 1,100 workers in the collapse of a garment factory in Bangladesh led global buyers to reevaluate their sourcing. Although wages are low in Bangladesh — at $67 a month following a series of riots in the wake of the catastrophe that brought them up from $30 — international buyers are recon-sidering their strategies.
AUTOMOTIVE INDUSTRYThere is a large market for automotive industry growth in the Africa region. Africa has 42.5 million registered vehicles. The potential for growth is strong as the motorization rate is far below global averages at 44 vehicles per 1,000 people compared to 180 globally. Although the African market has been growing at 3.6 percent per year from 2005 – 15, it still lags other emerging regions such as Asia and the Middle East (8.9 percent) and Latin America (4.2 percent). Most of this growth is supplied by imports, with second-hand vehicles accounting for a large share of vehicles sold on the continent.
There are some producing countries on the conti-nent — Algeria, the Arab Republic of Egypt, Morocco, and South Africa have sizeable automobile assem-bly sectors. Despite this, only 900,000 new vehicles were produced in Africa in 2015, which is just 0.9 percent of global production. As a result, very few new vehicles compete against the large number of second-hand imports.
Kenya’s market follows these wider continental trends, but with an even lower motorization rate of 28 vehicles per 1,000 people. Kenya has 1.3 million reg-istered vehicles, with second-hand imports accounting for an estimated 8 out of 10 imported vehicles. The domination of second-hand imports has resulted in a fleet of old vehicles, with an average age of 15 years. However, the market has been growing faster than the regional average at 7.6 percent between 2005 – 14,

99KENYA COUNTRY PRIVATE SECTOR DIAGNOSTIC
with imported cars growing faster at 10 – 12 percent. If this trend continues, Kenya will have 5 million vehicles on the road by 2030.
Kenya only adds approximately 10,000 – 20,000 new vehicles per year, of which the majority (over 85 percent) are light and heavy commercial vehicles, driven mainly by new businesses investing in Kenya.
There are three main assemblers in Kenya: Associated Vehicle Assemblers, Kenya Vehicle Manufacturers, and Isuzu (the former General Motors East Africa). In 2016, their capacity utilization were low at 40 percent, 3 percent, and 30 percent, respectively.
Despite the utilization challenges faced by Kenya’s assemblers, the Kenyan government — like other gov-ernments in the region — is eager to take advantage of the potential business opportunity that the country’s growing automobile market can present, in partic-ular as incomes grow and motorization rates move towards global averages (box 5.8).
Strengthening Industrial InfrastructureCertain Kenyan manufacturing subsectors have com-petitive advantages and would benefit from additional investment in industrial infrastructure. These sub-sectors include textiles, leather, agriprocessing (that is, dairy, tea, and coffee), pharmaceuticals, plastics, chemicals, and paper.
The government seeks to encourage momentum in these manufacturing subsectors by supporting the development of three SEZs (Athi River, Egerton, and Naivasha). A prefeasibility study of these sites has already been conducted and shows promise. Kenya will need assistance in developing these zones and the related infrastructure under a private or a PPP framework. Assistance would also be required to build the capacity of the SEZ authority and effectively marketing the zones to potential investors and tenants.
In addition, to ensure the success of these invest-ments, it is imperative that the EAC benefits from a technical advisory program to formulate a policy on SEZs and removes other NTBs that are limit-ing investment and trade in manufacturing. Finally, Kenya’s manufacturing will benefit significantly from improved customs efficiency along the transport cor-ridors linking it with EAC partner states.
BOX 5.8 POTENTIAL ENTRY STRATEGIES IN THE AUTOMOTIVE INDUSTRY
The automotive strategies implemented in Africa in recent years fall into two broad categories:
1. Export-focused industries (such as in Morocco and South Africa). The diversity of vehicles or parts manufactured remains low, as well as the capacity to generate the economies of scale required to guarantee the cost competitiveness of exported vehicles and parts. The domestic market is usually a secondary focus.2. Domestic market-focused industries (such as in Algeria, the Arab Republic of Egypt, and Nigeria). These plants are characterized by low-value-added assembly, in which disassembled knocked-down vehicles are reassembled or parts and components are assembled into a finished semi-knocked-down vehicle. Investment for these plants are lower and usually follows the introduction of a strong customs or fiscal protection to limit or prohibit imports of assembled vehicles, which range from high duties to import quotas.
Which strategy is most appropriate for Kenya would have to be investigated further. Both are beset by considerable challenges, requiring the economies of scale to produce cars and parts at the prices required by the large global brands, or assembling cars for local and regional markets that can compete head-on with cheap second-hand vehicles in what remains a low-to-middle income region.
Sources: Adapted from Schiller and Pillay 2016, 48; Pertuiset and Douroux 2017, 100.

The Kenyan government is committed to accelerating economic development and growth, providing oppor-tunities for employment, and improving the welfare of its citizens. These are reflected in its Development Vision 2030 and Big Four agenda. This Country Private Sector Diagnostic (CPSD) serves as a tool for the government, investors, and the development community that supports these goals and builds on the opportunities Kenya has to offer. Critically, it envisions a significant role for the private sector in achieving its developmental aims.
This entails a multipronged approach. First, policy makers, investors, and other stakeholders must be aware of the opportunities Kenya has to offer — a vibrant private sector, strong export and trade potential, a solid financial sector, and sound infrastructure. Second, the key constraints that hamper private engagement
must be addressed, particularly the overall business enabling environment, competition policy, and infor-mality throughout the economy. Third, the thematic areas that impact all sectors must be strengthened, particularly those that provide inputs with cost impli-cations such as power, financing, or logistics.
In the short term, however, the three sectors addressed in this CPSD’s deep dive analysis — agribusi-ness, affordable housing, and manufacturing — provide the greatest opportunities for market creation and developmental impact. The deep dives looked at devel-opment impact, feasibility, current performance, and value addition, and provided specific and actionable recommendations and advice that will help the private sector assist in achieving the development goals (for a summary, see table 6.1).
06CONCLUSION

101KENYA COUNTRY PRIVATE SECTOR DIAGNOSTIC
TABLE 6.1 SECTOR DEEP DIVES: RECOMMENDATIONS FOR ADDRESSING POLICY ISSUES
Agribusiness
• Support farmers’ productivity with improved extension services, including building the skills of the service providers.
• Channel existing input subsidies to better target smallholders and empower farmers to select appropriate inputs that the private sector will supply.
• Develop innovative means to balance public and private sector engagement in input distribution.
• Upgrade infrastructure to strengthen quality ecosystem.• Develop public and private sector – driven agriaggregation
centers to provide value-added services to farmers and processors.
• Public assistance in unstructured value chains to strengthen producer organizations and increase their productivity.
• Provide support for farmer aggregation models that can promote smallholder links to offtakers.
• Put measures to support farmers to minimize market distortions.
• Regulate monopolies in some industries (bulk grain handlers) and overt government market interventions in others (seeds, fertilizer, veterinary services).
• Facilitate access to up-front finance for input purchase, equipment finance, and other forms of insurance.
• Continue access and support for international certifications, especially organic, to help build value and open markets.
• Develop export promotion strategies and build awareness of the Kenyan brand.
• Provide public support for vulnerable smallholders and pastoralists to build resilience to climate shocks.
• Increase public investment in irrigation.• Invest in small-scale irrigation schemes when large-scale
investment is not warranted or practical.
Affordable Housing
• Improve access to critical materials through increased locally produced goods (such as the stimulation of local quality cement production) and/or value-added activities,
• Develop regional specialization in value addition to construction materials for export in the Great Lakes region.
• Proactively develop the capacities of large, medium, and small local developers and contractors to improve competitiveness.
• Enhance access to development and construction finance by local developers and contractors.
• Implement measures to improve the enabling environment (ownership disputes resolution, digitize registry, implement new building codes, expand e-construction permits).
• Promote on-the-job skills development programs.
• Place emphasis on professional construction and construction project managers.
• Reduce professional fees.• Strengthen spatial planning and land use management
systems.• Further invest in land identification and release strategies,
and county capacity for infrastructure development and operation.
• Devise building standards and controls to support the Big Four program.
• Formulate strategy for skills development for the manufacturing sector.
• Improve information on skills demand.
Manufacturing
• Focus on innovation policies that improve collaboration between institutions.
• Provide financing for product R&D and technology services to help improve the innovation ecosystem.
• Improve coordination with universities and research institutions to help maximize economies of scale.
• Support broader industrial infrastructure in SEZs and strengthen the SEZ regulatory authority.
• Strengthen cross-links with SMEs and develop specific programs to improve capabilities and access to finance for MSMEs.
• Remove regulatory barriers and government interventions that restrict entry and competition in key manufacturing sectors.
• Improve governance and market discipline mechanisms towards SOEs.
• Focus investment promotion and policy for base sectors to attract complex anchor investors who could bring FDI and know-how needed for the sectors to become more dynamic.
• Ensure that investments in machinery and tools meet environmental targets.
• Adopt sustainable systems to reduce energy and water costs by investing in wastewater treatment plants.

102
Notes
1. Blue economy refers to the sustainable use of ocean resources for economic growth and improved livelihoods. It comprises fisheries, renewable energy, maritime transport, tourism, and waste management.
2. In March 2019, a Kenyan high court ruled that the 2016law capping interest rates in the country was unconstitutional and suspended the ruling for 12 months to allow Kenyan lawmakers to reexamine the law.
3. Based on the OECD PMR indicator state control, whichincludes public ownership, scope of public enterprise, government involvement in network sectors, direct control over business enterprises, price controls and use of command and regulations.
4. An SOE is defined as a publicly controlled firm whennational, state, regional or other subnational government hold, either directly or indirectly through a publicly controlled com-pany, the largest single share of the firm’s equity capital including government entities not organized as companies but carrying out commercial activities (that is, with the bulk of their income coming from sales and fees).
5. World Bank data; Economist Intelligence Unit; BusinessMonitor International; Central Intelligence Agency World Factbook.
6. The World Bank Group (2015b) report, Unlocking Growth Potential in Kenya: Dismantling Regulatory Obstacles to Competition, is admirably frank and contains a number of bold recommendations, which, if fully enacted, should bring consid-erable improvements to the business environment.
7. Mureithi (2016).
8. East African Community countries committed to liberalize 82 percent of their imports (in value) from the European Union upon entry to enforce the Economic Partnership Agreement and to gradually liberalize the remainder over a period of 15 years.
9. Jensen and Sandrey (2015).
10. Ibid.
11. Estimates are based on government expenditure data forfiscal 2016 and fiscal 2017.
12. Products considered include public works, waste manage-ment, travel agenting, industrial and hospital gases, medicalsupplies, airmail, and construction equipment, where cartelshave been detected in other countries including in Latin America and South Africa.
13. Estimates are based on World Bank Group Cartel Database for Latin America and Africa and standard overcharges andduration used for ex ante estimates by competition authoritiesin the United States, the United Kingdom, the European Union,and the Netherlands.
14. Based on Connor’s (2014) review of 2,041 quantitativeestimates of overcharges of hardcore cartels around the world.
15. For instance, M-Pesa processed 1.7 billion transactions in the 2016/17 period for a total of K Sh 3.6 billion ($36 billion),which is equivalent to 49 percent of GDP.
16. World Bank (2015b).
17. CMA and others (2017).
18. The Banking (Amendment) Act No. 3 of 2016 introduced section 33B which imposed a ceiling of 4 percent over the rateset by the CBK on interest charged by financial institutionsregulated under the Banking Act and a floor on deposit rates
of at least 70 percent of the base rate set by the CBK. The Act was subsequently amended in 2018 to provide some clarity to section 33B to indicate the “base rate” referenced is the Central Bank Rate. The amendment also removed the floor on deposits.
19. World Bank (2014a).
20. World Bank data; Economist Intelligence Unit; BusinessMonitor International; Central Intelligence Agency World Factbook.
21. See appendix B for a comprehensive analysis of the pharma-ceutical sector and key constraints and opportunities for private sector development.
22. Around 15 percent of agricultural landholdings in Kenyaare 60 hectares or greater. This compares to an average of around 2 percent for low-income countries and around 10 percent forlower-middle-income countries (Lowder, Skoet, and Rainey 2016).
23. The Comprehensive Africa Agriculture DevelopmentProgramme targets a 10 percent share of total governmentexpenditure for agriculture.
24. Large-scale commercial farms (that is, over 60 hectares)constitute 15 percent of Kenya’s total farmed area, which is acomparatively high percentage for Sub-Saharan Africa.
25. Although the cost of airfreight at $1.6 per kilogram ison the low side for the region, this is higher relative to (subsi-dized) regional competitors (Ethiopia, Rwanda). An additional15 percent in costs for levies, certifications, screenings, and soon, for airfreight offers potential for efficiency savings. Ground transportation costs are increasing primarily due to increasedcross-county levies.
26. Estimates of postharvest losses vary widely in Kenya from 20 to 30 percent for many crops, to as high as 50 percent recorded in some cases for fresh fruits and vegetables.
27. For agribusiness, dedicated blended funding also existswithin IFC through the Global Agriculture Food Security Program, which predates IDA-PSW and for which all regions of Kenyaare eligible.
28. Many value chains in Kenya (for example, maize, potatoes, fruits) are informal with relatively limited links to private offtak-ers. In turn, offtakers face challenges to source locally adequate volumes of products meeting quality requirements for processing.
29. Efforts are under way to restore soil pH balances via increaseduse of lime in fertilizer programs.
30. For additional recommendations, see the section on agri-business sectorwide market solutions.
31. According to a working paper by Ridolfi, Hoffmann, andBaral (2018), postharvest losses for fruits and vegetables havebeen reported to be as high as 50 percent in Kenya and wouldat a minimum be in the 20 – 35 percent range.
32. Major exceptions are two local currency bonds issued bythe East African Breweries (Diageo subsidiary), one in 2015 and another in 2017, totaling around $110 million. Together, thesetwo bonds made up a fairly significant portion of the Kenyanbond market over the past five years.
33. Data includes mangosteen and guava.
34. For example, the urban population in South Africa is 64.8 percent, Cabo Verde is 65 percent, and Botswana is 57.4 percent.
35. According to the United Nations Millennium Development Goal definition of a slum.
36. World Bank (2016b).
103KENYA COUNTRY PRIVATE SECTOR DIAGNOSTIC
37. The Swahili house connotes communal living in a formalstructure, usually comprising separate rooms often along threewalls, and open or closed common areas, and a separate area for toilet(s), shower(s), and kitchen(s), which are shared along thefourth wall. There would be closed and open common spacesinside the structure. These include long vertical rooms with shared toilet, shower, and kitchen facilities.
38. The National Cooperative Housing Union has over 800members, many of whom undertake small-scale (under 50 units) developments on behalf of their members.
39. These figures are calculated using the CAHF’s HousingAffordability Calculator, which is based on an estimated prevailing interest rate of 17.1 percent over 10 years, with the borrowerpaying a 10 percent deposit. Lending data provided by the Banking Supervisory Report, 2016. The loans or products that are below $20,000 are purely indicative, as few formal financial institu-tions would provide mortgages of this size. Although the recent interest rate cap has increased the affordability of mortgages, ithas inadvertently reduced their availability.
40. Land costs in this instance must be understood to be a factor of not only raw land costs as reflected in registered transactions, but also the high costs of obtaining permits and registrations and other practices often encountered, such as offshore payments for proportions of land transactions in Kenya and the use of prop-erty purchase. In the development of this deep dive, a numberof reports, studies, and news articles were consulted to get asense of land costs for housing development. One such report on performance of the real estate sector in Nairobi (Cytonn 2018)contends that land prices in Nairobi are high due to inadequate supply of developable land and increasing demand driven byhigher than average urban population growth, a rising middleclass with increased spending power, and some improvement in availability of infrastructure.
41. See https://www.hfgroup.co.ke/foundation.
42. KNBS (2013; 2017b; 2018b).
43. Current prices, unless otherwise noted.
44. KNBS (2018b, 162).
45. KNBS (2018b, 44).
46. According to the KNBS (2018b, 50), “The informal sector is characterized by small scale activities, easy entry and exit due to fewer regulations, skills gained from vocational intuitions,less capital investment, limited job security and also self-em-ployment. This sector however excludes illegal activities such as drug trafficking and others. Over the years, it has expanded into activities of manufacturing and information, communicationand technology.”
47. KNBS (2018b, 50).
48. KNBS (2018b, 49).
49. Based International Labour Organization definition asoutput per worker (GDP constant 2010 $).
50. Calculations based on local production figures using data from KNBS (2013; 2017b).
51. Mogollon and others (2016).
52. Cusolito and Cirera (2016).
53. https://data.worldbank.org/products/wdi.
54. Market value added shows the difference between the mar-ket value of a firm and the capital contributed by all investors,both bondholders and shareholders. It is calculated as the sum
of all capital claims held against the firm, plus the market value of debt and equity.
55. Government of Kenya. 2018. “Kenya SEZ Pre-FeasibilityStudies and Market Demand Analysis.”
56. Cornell University, INSEAD, and WIPO (2018).
57. Ochieng (2018).
58. Mudungwe (2012).
59. The Creating Markets Advisory Window supports the World Bank Group advisory upstream project preparation, such as the policy reforms and public good investments needed along withfirm-specific advisory to catalyze private capital. The GlobalFinancing Facility works with the public and private sectors for health and nutrition of women, children, adolescents (including pharmaceutical manufacturers and medical technology companies),through co-financing grants and loan buydowns together with a World Bank lending operation on the public side and with private sector through IFC investment (blended finance) and advisory.
60. Information based on “Kenya Special Economic Zones Pre-Feasibility Studies and Market Demand Analysis, Governmentof Kenya, 2018.”
61. Cefic (2014).
62. Nexant (2014).
63. MEMR (2011).
64. Lu (2016).
65. FDI Intelligence from The Financial Times Ltd.
66. There were only three projects before 2011.
67. Includes products under the Harmonized System codes61, 62, and 63 (U.S. International Trade Commission; UnitedNations Comtrade).
68. MoITC (2018); KNBS (2017b); ITC (2016); World Bank(2018); East Africa and Investment Hub; United Nations Comtrade.
69. World Bank Group and Global Development Solutions (2015).
70. USAID (2015).
References
Bhorat, Haroon, Ravi Kanbur, Christopher Rooney, and François Steenkamp. 2017. “Sub-Saharan Africa’s Manufacturing Sector: Building Complexity.” Working Paper Series 256, African Development Bank, Abidjan.
Briceño-Garmendia, Cecilia M. and Maria Shkaratan. 2010. Kenya’s Infrastructure: A Continental Perspective Africa Infrastructure Country Diagnostic Country Report. Washington, DC: World Bank. http://docu-ments.worldbank.org/curated/en/677331468209960394/Kenyasinfrastructure-a-continental-perspective.
CAK (Competition Authority of Kenya) and World Bank Group. 2017. “Competition in Kenya Survey.” World Bank Group, Washington, DC.
Cefic (European Chemical Industry Council). 2014. “The European Chemical Industry: Facts & Figures 2014.” Presentation. Cefic, Brussels. http://www.cefic.org/Documents/FactsAndFigures/2014/Facts%20and%20Figures%202014%20-%20The%20Brochure.pdf.

104 references
Chege, Jacob, Dianah Ngui, and Peter Kimuyu. 2016 “Learn to Compete: Scoping Paper on Kenyan Manufacturing.” Working Paper 25, Brookings Institution, Washington, DC. https://www.brookings.edu/wpcontent/uploads/2016/07/L2C_WP25-1.pdf.
Cirera, Xavier. 2015. “Catching Up to the Technological Frontier? Understanding Firm-Level Innovation and Productivity in Kenya.” World Bank, Washington, DC.
Cirera, Xavier, Roberto N. Fattal Jaef, and Hibret Belete Maemir. 2016. “Taxing the Good? Distortions, Misallocation, and Productivity in Sub-Saharan Africa.” Policy Research Working Paper 7949, World Bank, Washington, DC.
Connor, John M. 2014. “Cartel Overcharges.” The Law and Economics of Class Actions 26 (March): 249–387.
Cornell University, INSEAD, and WIPO. 2017. The Global Innovation Index 2017: Innovation Feeding the World. Ithaca, Fontainebleau, and Geneva. https://www.globalin-novationindex.org/gii-2017-report.
Cusolito, Ana Paula and Xavier Cirera. 2016. “A Firm-level Productivity Diagnostic for Kenya’s Manufacturing and Services Sector.” Technical Note 106985, World Bank, Washington, DC.
DEFT Advisory and Research. 2017. Rapid Market and Value Chain Assessment of the Building Construction Sector in Cambodia Final Report. New Delhi, DEFT Advisory and Research.
BIS (U.K. Department for Business, Innovation and Skills). 2013. “Supply Chain Analysis into the Construction Industry: A Report for the Construction Industrial Strategy.” BIS Research Paper No. 145, BIS, London. https://www.gov.uk/govern-ment/uploads/system/uploads/attachment_data/file/252026/bis13-1168-supply-chain-analysis-into-the-construction-in-dustry-report-for-the-constructionindustrial-strategy.pdf.
Cytonn Investments. 2018. “Nairobi Metropolitan Area Land Report – ‘The Resilient Investment Option.’” Nairobi: Cytonn Investments.
ERC (Energy Regulatory Commission). 2018. “Public Notice on Electricity Tariff Harmonization.” ERC, Nairobi.
Financial Sector Regulators Forum. 2017. “The Kenya Financial Sector Stability Report 2016.” Issue No. 9, Financial Sector Regulators Forum, Nairobi.
Fuchs, Michael. 2018. “Lowering the High Interest Rate Cost of Housing Finance in Africa.” CAHF Working Paper Series 1, Centre for Affordable Housing Finance, Johannesburg.
Gardner, David. 2018. “Overview of Housing Finance in East Africa.” Presentation to the East Africa Property Investment Summit.
Gardner, David, Keith Lockwood, Jacus Pienaar, and Miriam Maina. 2019. Assessing Kenya’s Affordable Housing Market. Centre for Affordable Housing Finance, Johannesburg. http://housingfinanceafrica.org/app/uploads/CAHF-Kenya-Housing-Analysis-FINAL-20190430.pdf.
Government of Kenya. 2018. Kenya Special Economic Zones Pre-Feasibility Studies and Market Demand Analysis. Nairobi.
Jensen, H. and R. Sandrey. 2015. The Continental Free Trade Area – A GTAP Assessment. Stellenbosch: Trade Law Centre; Washington, DC: The U.S. Agency for International Development.
KAM (Kenya Association of Manufacturers). 2018a. Manufacturing Priority Agenda 2018. http://kam.co.ke/kam/wp-content/
uploads/2018/02/2018-Manufacturing-Priority-Agenda.pdf. Nairobi: KAM.
———. 2018b. “Manufacturing in Kenya Under the ‘Big 4 Agenda’: A Sector Deep-Dive Report.” KAM, Nairobi.
Kayiira, Duncan. 2017a. “Landscapes of Investment: Regional Report - East African Community (EAC).” Centre for Housing Finance, Johannesburg.
KMT (Kenya Markets Trust). 2014. “Dairy Performance Review Rapid Assessment Report.” KMT, Nairobi.
———. 2014. “Kenya Livestock and Meat Market Analysis.” KMT, Nairobi.
KNBS (Kenya National Bureau of Statistics). 2011a. National Housing Survey: Renter’s Module. KNBS, Nairobi.
———. 2011b. National Housing Survey Housing Developers Questionnaire. KNBS, Nairobi.
———. 2013a. Basic Report on the 2010 Census of Industrial Production. KNBS, Nairobi.
———. 2013b. 2012/2013 Kenya National Housing Survey. KNBS, Nairobi.
———. 2014a. Basic Report on the 2010 Census of Industrial Production. KNBS, Nairobi. https://www.knbs.or.ke/basicreport-on-the-2010-census-of-industrial-production-cip/?option=com_phocadownload&view=category&down-load=385:basic-report-on-the-2010census-of-industrial-pro-duction-cip&id=95:census-of-industrial-production-cip&It-emid=599.
———. 2014b. Economic Survey 2015. KNBS, Nairobi.
———. 2015a. Basic Report on Well-Being in Kenya. KNBS, Nairobi.
———. 2015b. Economic Survey 2015. KNBS, Nairobi.
———. 2015c. Kenya Integrated Household Budget Survey 2015–2016. KNBS, Nairobi.
———. 2016a. Kenya Demographic and Health Survey 2014. KNBS, Nairobi.
———. 2016b. Economic Survey 2016. KNBS, Nairobi.
———. 2017a. 2016 Micro, Small and Medium Enterprises (MSME) Survey Basic Report. KNBS, Nairobi.
———. 2017b. Economic Survey 2017. KNBS, Nairobi. https://www.knbs.or.ke/download/economic-survey-2017/.
———. 2017c. Statistical Abstract 2017. KNBS, Nairobi.
———. 2018a. The 2015/16 Kenya Integrated Household Budget Survey (KIHBS) - Labour Force Basic Report. KNBS, Nairobi.
———. 2018b. Economic Survey 2018. KNBS, Nairobi. https://www.knbs.or.ke/economic-survey-2018-launched/.
———. 2018c. “Kenya Integrated Household Budget Survey 2015–2016.” Ministry of Devolution and National Planning, Nairobi.
Kruger-Levy, N. and A. Bertoldi. 2017. Residential REITs and Their Potential to Increase Investment in and Access to Affordable Housing in Africa. Johannesburg: Centre for Affordable Housing Finance in Africa. http://housingfinancea-frica.org/app/uploads/CAHF-Real-Estate-Investment-Trusts-Study2017.02.pdf.

105KENYA COUNTRY PRIVATE SECTOR DIAGNOSTIC
Lee, Kenneth, Eric Brewer, Carson Christiano, Francis Meyo, Edward Miguel, Matthew Podolsky, Javier Rosa, and Catherine Wolfram. 2016. “Barriers to Electrification for ‘Under Grid’ Households in Rural Kenya.” Development Engineering 1 (June): 26–35. DOI:10.1016/j.deveng.2015.12.001.
Lowder, Sarah K., Jakob Skoet, and Terri Raney. 2016. “The Number, Size, and Distribution of Farms, Smallholder Farms, and Family Farms Worldwide.” World Development 87 (November): 16–29.
Lu, Sheng. 2016. “WTO Reports World Textile and Apparel Trade in 2015.” FASH455 Global Apparel & Textile Trade and Sourcing (blog), July 27. https://shenglufashion.com/2016/07/27/wto-reports-world-textile-and-apparel-trade-in-2015/.
Manyara, Charles G. 2013. “Combating Road Traffic Accidents in Kenya: A Challenge for an Emerging Economy.” In Kenya After 50: Reconfiguring Education, Gender, and Policy edited by Koster M.M., Kithinji M.M., Rotich J.P. New York: Palgrave Macmillan.
McKinsey and Company. 2015. “iDelivering Kenya’s Industrialization Program, Agri-processing Sector.” Draft study prepared for the Kenyan Ministry of Trade and Industry.
MEMR (Kenya, Ministry of Environment and Mineral Resources). 2011. Kenya National Profile to Assess the Chemicals Management. Nairobi. http://cwm.unitar.org/national-profiles/publications/cw/np/np_pdf/Kenya_National_Profile_final.pdf.
MFA (the Netherlands, Ministry of Foreign Affairs). 2016. Kenyan Healthcare Sector Opportunities for the Dutch Life Sciences & Health Sector. The Hague.
MOIED (Kenya, Ministry of Industrialization and Enterprise Development). 2012. “Sessional Paper No. 9 of 2012 on the National Industrialization Policy Framework for Kenya 2012–2030.” Nairobi.
Mogollon, Maria Paulina, Nikola Denchev Kojucharov, Georgia Frances Isabelle Dowdall, Frank Abner Twagira, Tania Priscilla Begazo Gomez, Aref Adamali, Xavier Cirera, Nora Carina Dihel, Toni Kristian Eliasz, Markus Njehiah Kimani, Jana Malinska, Richard Wamutitu Mugo, Sarah Ruth Ochieng, Aun Ali Rahman. 2016. Shifting Kenya’s Private Sector into High Gear: A Trade and Competitiveness Agenda. Washington, DC: World Bank Group.
Mudungwe, Nicholas. 2012. Kenya Footwear Cluster: Baseline Analysis. Addis Ababa: Common Market for Eastern and Southern Africa Leather and Leather Products Institute. https://www.allpi.int/courses-and-publications/baseline-survey?down-load=18:kenya-footwear-cluster-baseline-analysis-august-2012.
Nexant. 2014. “Petrochemical Outlook: Challenges and Opportunities.” Presentation prepared for the European Union–Organization of the Petroleum Exporting Countries Dialogue, December. https://ec.europa.eu/energy/sites/ener/files/documents/OPEC%20presentation.pdf.
Ochieng, Adonijah. 2018. “Kenya Edges up in 2018 Global Intervention Ranking.” Business Daily, July 18. https://www.businessdailyafrica.com/datahub/Kenya-global-innovation-ranking/3815418-4658050-4873f4z/index.html.
Pertuiset, Thierry and Delphine Douroux. 2017. “Le Potentiel de Développement d’Une Industrie Automobile en Côte d’ivoire.” Duzan Conseil, Paris.
Power Africa. 2015. Development of Kenya’s Power Sector 2015–2020. https://www.usaid.gov/sites/default/files/docu-ments/1860/Kenya_Power_Sector_report.pdf.
Open Capital Advisors. 2017. E4E Challenges and Potential Solutions in Kenya’s Manufacturing, Construction and Oil and Gas Sectors. Nairobi, Open Capital Advisors.
Safavian, Mehnaz and Bilal Zia. 2018. “The Impact of Interest Rate Caps on the Financial Sector Evidence from Commercial Banks in Kenya.” Policy Research Working Paper 8393, World Bank Group, Washington, DC.
Schiller, Thomas and Karthik Pillay. 2016. “Navigating the African Automotive Sector: Ethiopia, Kenya and Nigeria.” London: Deloitte.
SIB (Standard Investment Bank). 2016. “East Africa Cement Sector.” SIB, Nairobi. http://sib.co.ke/media/docs/East-AfricanCement-Sector-VU-(Jan%202016).pdf.
Suri, Tavneet and William Josiah Jack. 2016. “The Long-Run Poverty and Gender Impacts of Mobile Money.” Science 354 (6317): 1,288–1,292.
UNCTAD (United Nations Conference on Trade and Development). 2018. World Investment Report 2018: Investment and New Industrial Policies. Geneva: UNCTAD.
UNIDO (United Nations Industrial Development Organization). 2014. Kenya GMP Roadmap: A Stepwise Approach for the Pharmaceutical Industry to Attain WHO GMP Standards. https://www.unido.org/sites/default/files/2014-12/Kenya_GMP_Roadmap_ebook_0.pdf.
USAID (U.S. Agency for International Development) East Africa Trade and Investment Hub. 2015. “Strengthening the Cotton, Textile and Apparel Value Chain in East Africa: An Assessment Draft.” USAID East Africa Trade and Investment Hub, Nairobi. https://www.eatradehub.org/strengthening_the_cotton_tex-tile_and_apparel_value_chain_in_east_africa_an_assess-ment_draft.
Wagacha, Mbui. 2018. “CPSD: Study on Affordable Housing.” Draft presentation for Kenya Country Private Sector Diagnostic.
WEF (World Economic Forum). 2017. The Global Human Capital Report 2017. https://www.weforum.org/reports/the-global-human-capital-report-2017.
World Bank. 2005. “The Role of Standards under Kenya’s Export Strategy: Contribution to the Kenya Diagnostic Trade and Integration Study.” World Bank, Washington, DC.
———. 2014. “Laying the Foundations for a Robust Healthcare System in Kenya: Kenya Public Expenditure Review.” World Bank, Washington, DC.
———. 2015a. Kenya Leather Industry: Diagnosis, Strategy and Action Plan. World Bank, Washington, DC. http://doc-uments.worldbank.org/curated/en/397331468001167011/Kenya-Leather-industrydiagnosis-strategy-and-action-plan.
World Bank. 2015b. “Project Appraisal Document, Financial Sector Support Project.”
———. 2016a. Kenya Urbanization Review. Washington, DC: World Bank. http://documents.worldbank.org/curated/en/639231468043512906/pdf/AUS8099-WPP148360-PUBLIC-KE-Urbanization-ACS.pdf.
———. 2016b. Improving Access to Affordable Housing in Kenya: A Strategic Framework. Washington, DC: World Bank.
106 references
———. 2016c. Kenya—National Agricultural and Rural Inclusive Growth Project (English). Washington, D.C.: World Bank Group. http://documents.worldbank.org/curated/en/479301472176839024/Kenya-National-Agricultural-and-Rural-Inclusive-Growth-Project.
———. 2017a. Benchmarking Public-Private Partnerships Procurement. Washington, DC: World Bank. http://doi.org/10.1017/CBO9781107415324.004.
———. 2017b. Kenya Economic Update - Housing: Unavailable and Unaffordable. Washington, DC: World Bank.
———. 2017c. Enabling the Business of Agriculture. Washington, DC: World Bank.
———. 2017d. Kenya—Climate Smart Agriculture Project (English). Washington, D.C.: World Bank Group. http://documents.worldbank.org/curated/en/440241486868444705/Kenya-Climate-Smart-Agriculture-Project.
———. 2018a. “Construction Value Chain Analysis - Construction Sector 05-14-18 Final.” Background paper for Kenya Country Private Sector Diagnostic.
———. 2018b. “Revised TOR for Affordable Housing High-Level Assessment 05-11-18 Final Draft.” Background paper for Kenya Country Private Sector Diagnostic.
World Bank Group. 2013. Enterprise Surveys: Kenya Country Profile. Washington, DC: World Bank Group.
———. 2015a. Catching Up to the Technological Frontier? Understanding Firm-Level Innovation and Productivity in Kenya. Washington, DC: World Bank Group.
———. 2015b. Unlocking Growth Potential in Kenya: Dismantling Regulatory Obstacles to Competition. World Bank, Washington, DC. https://openknowledge.worldbank.org/handle/10986/25789.
———. 2016a. Breaking Down Barriers: Unlocking Africa’s Potential through Vigorous Competition Policy. Washington, DC: World Bank Group. http://documents.worldbank.org/curated/en/243171467232051787/Breaking-down-barriersunlocking-Africas-potential-through-vigorous-competition-policy.
———. 2016b. Doing Business in Kenya. Washington, DC: World Bank Group.
———. 2016c. Kenya Country Economic Memorandum: From Economic Growth to Jobs and Shared Prosperity. Washington, DC: World Bank Group.
———. 2016d. Informal Enterprises in Kenya. Washington, DC: World Bank Group.
———. 2017. Doing Business 2018. http://doi.org/10.1596/978-1-4648-1146-3. Washington, DC: World Bank Group.
———. 2018. Kenya Economic Update. 17th edition. Washington, DC: World Bank Group.
———. 2019. Doing Business 2019. Washington, DC: World Bank Group.
World Bank Group and Global Development Solutions. 2015. “Kenya Apparel and Textile Industry: Diagnosis, Strategy and Action Plan.” Report prepared for the Kenya, Ministry of Industrialization and Enterprise Development. World Bank, Washington, DC. https://openknowledge.worldbank.org/handle/10986/22782.
http://documents.worldbank.org/curated/en/440241486868444705/Kenya-Climate-Smart-Agriculture-Project
http://documents.worldbank.org/curated/en/440241486868444705/Kenya-Climate-Smart-Agriculture-Project

APPENDIXES

APPENDIX A STATE-OWNED ENTERPRISES
FIGURE A.1 SHARE OF SOES IN SUBSECTORS, KENYA AND AVERAGE FOR 71 COUNTRIES, 2019
Source: Adapted from World Bank Group 2015 using data from World Bank Group–Organisation for Economic Co-operation and Development PMR database and the Kenya National Treasury.Note: PMR = product market regulation; SOE = state-owned enterprise; SOE presence of 100 percent in Kenya denotes at least one SOE operates in the subsector.
Market failure: natural monopoly, asymmetry of
information
Network industry with economies of scale and
scope
Unclear economic rationale
0% 20% 40% 60% 80% 100%
Manufacture of tobacco productsManufacture of railway and tramway locomotives and rolling…
Road transport - freight transportRetail trade, incl. of motor vehicles
Manufacture of basic metalsManufacture of aircraft and spacecraft
Building and repairing of ships and boatsWholesale trade, incl. of motor vehicles
Motion picture distribution and projectionConstruction
Accommodation, food and beverage service activitiesManufacture of fabricated metal products, machinery and…
Water transport - freight and passengerTelecommunications - mobile services
Air transport - (domestic and international) passenger and freightOther business activities
Manufacture of refined petroleum productsTelecommunications - fixed-line networkTelecommunications - fixed-line services
Telecommunications - Internet servicesGas distribution
Gas importGas supply
Gas transmissionInsurance, reinsurance and pension funding
Other urban, suburban and interurban passenger transportGas production
Electricity distributionRailways - freight transport
Water transport - operation of water transport infrastructureElectricity supply
Water collection, treatment and supplyHuman health activities
Post - courier servicesRailways - passenger transport
Electricity importElectricity generation
Financial service activities, except central banking, insurance…Electricity transmission
Railways - operation of railroad infrastructureRoad transport - operation of road infrastructure
Air transport - operation of air transport infrastructurePost - basic letter services
Post - basic parcel services
SOE in Kenya Average SOE presence in 71 countries

109KENYA COUNTRY PRIVATE SECTOR DIAGNOSTIC
TABLE A.1 SOE PARTICIPATION AND PRESENCE OF TOP BUSINESS GROUPS
Sector Subsector SOE presence Government minority shareholding
Government share-holding in competitors
Enabling sectors - critical to stimulate employment and growth in all other sectors of the economy
Finance and insurance
Banking • • •Insurance, reinsurance • •
Payment Systems •
Leasing •
Forex
Communications Mobile telecom • •
Internet access/data transmission • •
Media, broadcasting, publishing • •
Postal services •
Energy Generation • • •Transmission •
Distribution and supply •
Transport Railway Transport •
Water Transport •
Air Transport •
Airport, port, roads •
Passenger transportation •
Logistics and warehousing • •
Traded sectors - sectors in which kenya could be well positioned to be competitive in international markets
Agribusiness Agricultural inputs •
Forestry •
Tourism Hospitality • • •Manufacturing Construction material • • •
Food products and beverages • • •Refined petroleum products •
Other manufacturing • •
Domestic/nontraded services
Construction and real estate
Processing zones •
Housing •
Construction and engineering
Property management, renting • •
Wholesale and retail trade
Wholesale • •
Retail trade •
Social sectors directly impacting the endowment of human capital
Education •
Health •
Water and sanitation
Source: Data from World Bank Group–Organisation for Economic Co-operation and Development PMR database; Kenya, Inspectorate of State Corporations; Forbes; various companies’ annual reports and webpages, and news.Note: SOE = state-owned enterprises; PMR = product market regulation.

Introduction
Kenya’s pharmaceutical sector has the potential to improve access to essential medicines within the domestic and regional markets, and there is strong political push to meet the growing demand. The key is to have enabling conditions where “brand Kenya” becomes synonymous with quality, which requires tackling the counterfeit and substandard medicines in circulation to ensure safety of the public’s health. The Ministry of Industry, Trade, and Cooperatives and the Ministry of Health have recognized the sec-tor’s important role on economic development and health perspectives. The National Industrialization
Policy Framework 2012–30 cites policy actions to support the industry’s ability to meet growing demand locally and in the region, which supports the “Buy Kenya, Build Kenya” policy, particularly for essential medicines. This approach aligns with the 2nd East African Community (EAC) Regional Pharmaceutical Manufacturing Plan of Action 2017–27, in which Kenya, as the largest pharmaceutical market and exporter in the region, along with other EAC partner states rec-ognize the untapped potential of the regional market. The growing middle class, accelerating urbanization, and increasing burden of noncommunicable diseases are expected to continue demand for medicines of high quality that are affordable and accessible.
APPENDIX B PHARMACEUTICALS DEEP DIVE
FIGURE B.1 PHARMACEUTICAL SECTOR’S CONTRIBUTION TO KENYA’S VISION 2030
Source: Adapted from WHO 2011.
Shared goals supporting local production of medicines
AVAILABILITY• Regular supply of essential
medicines for all• Strategic selection of medicines
for local production
RELIABILITY• Zero tolerance of substandard
quality by the manufacturers and regulators
AFFORDABILITY• Affordable locally produced
products to the government and consumers
National prosperity Healthy citizens
Objective: Expand a competitive and sustainable industry that will attract private investmentTarget: Manufacturing to account for 15% of GDP
Objective: Improve disease treatment by ensuring access to quality essential medicinesTarget: Universal health coverage by 2022
Key outcomes: • Quality assurance• Competitive
prices
• Job creation• Health
improvement
Key outcomes: • Quality assurance• Affordable prices• Self-sufficiency
• Availability ofessential medicines

111KENYA COUNTRY PRIVATE SECTOR DIAGNOSTIC
Sector Potential, Performance, and Competitiveness
Kenya is the fastest-growing pharmaceutical market in Africa, with an expected compound annual growth rate (CAGR) between 7.6 percent1 and 12 percent2 over the next 5 years.3 Domestic demand grew and was estimated at $804 million in 2016 (figure B.2) from $294 million in 2006. Prescriptions of generics have been driving the recent growth with a CAGR estimated at 9 percent over the period 2013–20.4 For local manufacturers of generics, the East African Community (EAC) represents a sizable market of $1.1 billion on this segment, with antiinfectives, immunological and cardiovascular agents making up for 50 percent of the value.5
Kenya has a solid foundation for production of pharmaceuticals and has become a hub in East Africa. In the EAC, Kenya represents over 60 percent of the manufacturers and revenues and 40 percent of the demand.6 Kenyan firms produced over $230 million of medicines in 2016, increasing from $103 million in 2008.7 The number of manufacturers registered with the Pharmacy and Poisons Board (PPB) increased from 4 in 1975 to 40 in 2018—of which 34 cover an estimated 66 percent of disease conditions.8 They focus primarily on the production of generics in tab-lets, cough and cold preparations, antiseptics, and antiprotozoals.9 Domestic manufacturers serve only about 25 percent of the national market. Kenya’s reliance on imported medicines is estimated between 70 to 80 percent—and up to 100 percent for specific products such as vaccines.10 Imported generics mostly come from India and China. In 2016, Kenya imported
$0.4 billion of packaged medicines, mostly from India (70 percent) or Europe (24 percent).11
Local manufacturers are strongly oriented to sup-plying the private market, despite underutilization of capacity among domestic producers and tariffs on inputs, such as packaging, that have constrained competitiveness. They serve around 25 percent of the Kenyan market and export around 60 percent of the local output, mostly to the EAC.12 In 2016, Kenya imported $495 million of packaged medicines, most of it from India (70 percent) and Europe (24 percent).13 Figure B.3 shows the origin of essential medicines purchased by Kenyan wholesaler in 2012–13.
Kenya Medical Supplies Authority (KEMSA) is the largest pharmaceutical distributor, with nearly 30 percent of all prescription drugs purchases in the Kenyan market.14 It specializes in providing medi-cal logistics services for public health facilities and programs.15 Kenyatta National Hospital, the largest public and referral hospital in Kenya, is also a major procurer.16 KEMSA purchases drugs through open tender or quotations for urgent supplies. The large international tenders and the strong focus on price have helped control tendering costs and improve confidence in the public procurement process.17 A study based on a survey from 2007–08 concluded that KEMSA’s prices were more competitive than similar products purchased by health facilities from other distributors.18
Kenya’s competitiveness is illustrated by its role as the third-largest exporter of pharmaceuticals in Africa and the current momentum for FDI in the sector. Around 30 percent of Kenyan production of medicines is exported, with exports growing at a
FIGURE B.2 SIZE OF NATIONAL PHARMACEUTICAL MARKETS IN THE EACSales (constant $ billion)
Source: Data from the United Nations Comtrade database and Business Monitor International.Note: Data for 2018 and 2019 are forecasted; EAC = East African Community.
1.4
0.0
0.2
0.4
0.6
0.8
1.0
1.2
2016 20182014
a. Burundi
2010 2012 2016 20182014
c. Tanzania
2010 20122016 20182014
b. Uganda
2010 2012 2016 20182014
d. Kenya
2010 2012

112 appendix bpharmaceuticals deep dive
CAGR of 12 percent over the last five years.19 The five top manufacturers export between 40 percent and 85 percent of their production, mostly to other East African countries. An analysis of pharmaceu-tical prices in Tanzania, based on data generated by mystery shoppers in 2013,20 showed that the cost of Kenyan exports to Tanzania were competitive with both locally manufactured medicines in Tanzania and Indian imports. Further, there are positive signs of international investors’ interest in the sector in Kenya. IFC’s first pharmaceutical manufacturing deal in the region outside of South Africa is part of a $25 million project with Universal Corporation Limited (UCL), a leading Kenyan firm recently acquired by Strides from India to expand their operations. Square Pharmaceuticals from Bangladesh is establishing a manufacturing plant in one of Kenya’s special economic zones (SEZs) to increase their regional exports and meet growing domestic demand. Kolon Pharmaceuticals, one of South Korea’s largest indus-trial conglomerates, seeks to further their expansion in Africa and are assessing Kenya’s potential. Foreign firms are looking to establish themselves in the East African market with branded generics as demand has become sizable and the donor community aims to increase the amount of medication purchased from local companies.
Kenya offers relatively good labor productivity (see figure B.4) and local firms manage the costs of labor and raw materials for production at comparable levels with those in India—that is, around 8 percent and 55 percent, respectively.
Development Impact
The main development impact of supporting the growth of Kenya’s pharmaceutical market is increasing access to high quality (safe), affordable medicines. Low quality medicine is a widespread public health challenge to universal health coverage. In Kenya, more than 30 percent of medicines were found to be substandard and six percent were counterfeits, based on outdated and limited data that industry stakeholders agree is a vast underestimate of the dangerous products in cir-culation.21 A 2013 study in 39 Sub-Saharan countries estimated that over 122,000 deaths among children under age five were associated with the consumption of poor-quality antimalarials.22
FIGURE B.3 DECOMPOSITION OF PROCURED ESSENTIAL MEDICINES BY COUNTRY OF ORIGIN, 2012–13
0 10,000 20,000 30,000 40,000 50,000
South Africa
Ghana
Kenya
India
Egypt, Arab Rep.
Bangladesh
FIGURE B.4 LABOR PRODUCTIVITY IN THE PHARMACEUTICAL SECTOR BY COUNTRY, 2014 $ per employee
Source: Adapted from Mackintosh and others 2015.
Local manufacturers India and Pakistan China European Union and Switzerland Other African Other
a. Public b. Private c. Faith-based organizations
54
33
76
111
4
8
31
4
19
67
30
81
7
Source: Adapted from IFPMA 2017.

113KENYA COUNTRY PRIVATE SECTOR DIAGNOSTIC
Focusing on quality enhancement has the potential to increase market access for firms meeting international quality standards and demand for more high- and semi-skilled jobs in those quality compliant firms. Interviews with the top eight manufacturers in the sector revealed an estimate of 3,600 jobs,23 of which approximately two-thirds are low-skilled and the remaining are high- and semi-skilled.24 These jobs are technical in nature because of the level of expertise needed for production and quality control. As the sector develops, firms are expected to require higher skills for international quality standards compliance to access donor-funded and export markets. In a conservative scenario where import dependency remains constant and demand grows by 7.5 percent annually, another 1,200 jobs may be created by 2022.25 There is also potential for indirect jobs in the supply chain, such as packaging producers, which is not yet captured.
The sector also presents high potential gain in complexity at its current level of feasibility that is predictive of growth (figure B.5).26 While more fea-sible opportunities to improve competitiveness exist, expected complexity gains from adding these products to the country’s portfolio are relatively low. Over time, the sector’s development is also expected to create an ecosystem with maintenance and repair services as well as more upstream activities, which will further support the gains from growth and jobs among firms that are competitive based on quality standards compliance.
Value Chain Structure and Key Characteristics
Kenya’s pharmaceutical value chain has three main stages: (1) production of inputs, (2) production of medicines, and (3) distribution (which includes whole-sale and retail) to consumers. Value is evenly spread along these three steps (see figure B.6).
Production of InputsThe Kenyan pharmaceutical sector has not yet moved towards the most complex activities of the value chain.27 Research and development (R&D) is very limited and the few firms that have R&D departments focus on reverse engineering generic products. Firms manufacture simple nonpatented products or rely, for two of them, on technology transfer agreements with multinational manufacturers.28 Like most in the region, Kenyan producers import over 90 percent of their active pharmaceutical ingredients (APIs) and excipients at significantly high prices.29 Figure B.7 illustrates that raw and packaging materials contribute to about 50 percent of the product’s wholesale price, most of the value coming from APIs.30 and 31 Three firms manufacture raw materials for API production but these are fully destined for export, as the local capacity for processing raw inputs is underdevel-oped.32 Most packaging materials are also imported, despite tariff duty being applied. Large and small firms import about 60 and 35 percent of packag-ing items, respectively.33 The industry also imports the machinery and equipment for production from Europe and Asia, including labor for maintenance and repair services.
Production of MedicinesKenya’s pharmaceutical sector is concentrated and dominated by mostly family-run firms that focus on the simplest types of manufacturing. The largest ten firms account for nearly 80 percent of local produc-tion and mainly produce unbranded generics. Most local firms compete in the same market segments with similar product portfolios. Over half of Kenyan firms are producing antiinfectives and are not tapping sufficiently into more lucrative immunological and cardiovascular markets that have a larger share in the region. Local firms tend to produce simple dosage forms such as plain tablets and capsules. While some firms diversify by producing syrups, suspensions, and creams (a fast-growing segment), only three firms pro-duce injectable infusions and ophthalmic formulations that require technologically complex processes and stringent quality control such as sterile conditions.34
FIGURE B.5 KENYA’S ECONOMIC COMPLEXITY FOR PHARMACEUTICALS
0.7
0.0
0.1
0.2
0.3
0.4
0.5
0.6
0.15 0.20 0.250.100.00 0.05
Photographic and cinematographic goods
Expe
cted
com
plex
ity ga
in
Pharmaceuticals
Textiles for industrial use
Dairy products
Feasiblity
Revealed comparativeadvantage 0.0–0.2 0.3–0.4 0.5–0.6 0.7–0.8 0.9–1.0
Source: Adapted from Cader and Tacchella (2018).

114 appendix bpharmaceuticals deep dive
Local firms’ annual capacity utilization (about 60 percent in 2014) suggests that there is room for the industry to address demand on specific products—if they can comply with international quality standards.35 Underutilization of capacity is driven by supply-side issues including operations management and foreign exchange losses, as well as lack of visibility on demand.36 Most firms cannot produce higher-value products because of a lack of technical expertise and financing for investing in advanced technologies. Costs of production and limited equipment upgrading suffer from high borrowing costs, which are around five percentage points higher than in India or Bangladesh.37 Raw materials and labor are the main sources of costs, 51 percent and 9 percent of wholesale price, respectively, in proportions that are comparable to production costs in India.
Distribution to ConsumersDistribution is highly fragmented with multistage markups passed on to consumers. Over half of Kenyan hospitals and over three-quarters of health centers and dispensaries are owned and run by the government, with the rest (around 17 percent of each category) in the faith-based sector. Nonprofit facilities have diverse wholesale sources, buying 44 percent from the Mission for Essential Drugs and Supplies, about one-third from private wholesalers, and sourcing the rest from the public sector. Public facilities mostly source their essential medicines from KEMSA (91 percent in
2012–13), with lower-level facilities obtaining their supply through the local district hospital.38 There are approximately 700 registered distributors in Kenya, 3,500 retail pharmacies registered with the PPB, and an estimated 3,000 to 4,000 unregistered outlets.39
Source: Vugigi 2017.
FIGURE B.7 COST DISTRIBUTION OF LOCALLY MANYFACTURED MEDICINES IN KENYA
Mar
ketin
g cos
ts6%
Misc
ella
neou
s cos
ts5%
Raw materials40%
Markup14%
Packaging materials11%
Labor9%
Insu
ranc
e,du
ty, a
nd tr
ansp
ort
7%Ut
ilitie
s and
main
tena
nce
5%
Quality control and R&D3%
FIGURE B.6 VALUE CHAIN OF THE KENYAN PHARMACEUTICAL SECTOR
Source: Based on IFC analysis and interviews and Maisha Meds Point of Sale database.Note: API = active pharmaceutical ingredient; KEMSA = Kenya Medical Supplies Authority; NGO = nongovernmental organization.

115KENYA COUNTRY PRIVATE SECTOR DIAGNOSTIC
Wholesalers often sell onto multiple subwholesalers to ensure greater coverage and use their expansive local knowledge in rural areas. They also benefit from exclusivity agreements with foreign firms and typically add markups between 25 and 50 percent.40 Similarly, markups are high among importers who must recover high costs of credit driven by a slow payment cycle. The state-owned KEMSA is the largest player with 30 percent of drugs purchases.41 and 42 Without World Health Organization Good Manufacturing Practices (WHO GMP) compliance, most local manufacturers are excluded from the donor-funded market for which KEMSA procures and mostly supply the faith-based and private markets.
A substantial proportion of essential medicines is purchased in retail drug shops and pharmacies—of which 40–60 percent are illegal or unregulated.43 According to Mackintosh and others (2015) there is no reliable estimates of the percentage of essential medicines accessed through private shops in Kenya, in part because of gaps in household budget survey data. Kenya is at an initial stage of consolidation with few retail pharmacy chains such as Goodlife and Pharmart. Registered pharmacies are scarce in rural areas (0.4 per 100,000 people in the northeastern region) compared to in Nairobi (26 per 6 people), which, combined with longer supply chains, lead to low affordability in rural areas.44 For instance, the price of a generic version of amoxicillin can be up to
four times higher depending on location and quality and limited data does not allow for conclusions on causality. Markups of private retailers tend to be the highest in the value chain (42 percent on average in 2014), because of high transport, staffing and financial costs per unit.45
Constraints to Sector Competitiveness for Higher Quality and Lower Cost Medicines
Kenyan manufacturers are caught in a vicious cycle with low incentives to upgrade quality without suf-ficient profitability or scale as consumers tend to distrust generic versions because of the poor quality of what is available. In the private market, approxi-mately 57 percent of medicines (including protected and unprotected products) sold in value terms are original brands, which means patients pay more for their medication and a larger share of sales go to foreign manufacturers. Low demand for their prod-ucts prevents Kenyan firms from achieving sufficient profitability that would allow them to upgrade their operations for standards compliance. Companies that have invested in higher quality tend to face higher production costs, which makes them less competitive relative to low quality local producers and imports of indistinguishable quality. This has led to a prevalence
FIGURE B.8 WHY KENYA HAS A LOW SUPPLY OF HIGH-QUALITY AFFORDABLE MEDICINES?
Source: Kenya CPSD team.Note: EAC = East African Community; NTBs = nontariff barriers.
Week regulatory capacity for quality assurance and enforcement
Informal retail channelsTax and financial
disincentive(including procurement)
Manufacturing Distribution
NTBs within EAC
Limited access to finance for required equipment
Shortage of quality assurance expertise
Fragmented distribution with multiple layers
Key constraints
Little profit incentive to upgrade quality
Insufficient scale of production hindering
competitiveness
No traceability infrastructure
Weak inventory managementInability to forecast demand and plan production
Multiple and high markups because of long supply chain and payment cycle
Implications
Expensive medicinesInability to distinguish medicine
quality leading to low confidence in "brand Kenya"
High risk of medicine stockoutsConsumer implications

116 appendix bpharmaceuticals deep dive
of substandard and counterfeit products that enter the supply chain, in part also because of the long, fragmented delivery network, with limited traceability. Figure B.8 illustrates the factors that contribute to poor quality and high costs in the Kenyan market.
Kenya’s PPB46 lacks the capacity to adequately monitor the quality of medicines in circulation and shut down the firms that pose product-safety risk across three main levels: (1) manufacturers, (2) imports, and (3) distributors (including wholesale and retail).
1. ManufacturersThe PPB lacks the ability to monitor the quality of local production, which requires adequate technical and financial resources, to ensure and enforce compliance with WHO GMP standards so medicines are safe and efficacious. Figure B.9 illustrates these challenges based on the Kenya GMP Roadmap by the United Nations Industrial Development Organization (UNIDO) and the PPB in which most firms assessed received an overall “c” rating (that is, a high-risk company for production safety).47
The following challenges for local firms lead to higher operating costs for local, which affect their revenue- and profit-enhancing abilities to upgrade production in line with quality standards:
a. Limited access to affordable finance for site and equipment investments
Interviews with local manufacturers revealed insuffi-cient access to affordable finance as the most pressing challenge, particularly with regards to upgrading standards and efficiency.48 Elements related to the physical site and the quality management system (QMS) are the most pressing issues to ensure GMP compliance, as evidenced by the firm assessment.49 However, firms struggle to access capital from local banks to purchase additional equipment or expand or upgrade infrastructure. This is in part because of commercial banks’ insufficient experience with risk assessments specifically for the pharmaceutical sector, and of high interest loans inadequately suited for long-term financing of plant upgrading.
b. Shortage of skills and resources for trainingFirms face challenges filling jobs in quality assurance and quality control from within the Kenyan market. High-skilled jobs that firms have recruitment chal-lenges with locally include industrial pharmacists, chemists, microbiologists, site supervisors, and engi-neers.50 Semi-skilled jobs in demand include machine operators, quality controllers, and marketing and sales positions. Firm interviews consistently revealed
a strong preference for hiring locally to build a pipe-line of skilled workers for the sector in Kenya and the region. Without a local pool of qualified labor for these positions, firms are import foreign labor mostly from the mature South Asian market and bear the relocation and work permit fees. Firms that can hire locally for certain positions report that recent graduates are inadequately prepared to work in the industry, which leads significant investments in training programs of an average of three to six months—often diverting resources such as staff time from production. The Kenya GMP Roadmap reiter-ates the “discrepancy between the adequate scientific degrees of personnel and the limited knowledge of WHO GMP requirements potentially illustrates a general problem with existing educational systems and highlights a high need for review of academic and post-academic curricula...”51 Staff also require ongoing training to help identify and correct poten-tial areas of quality and safety lapses in production, as noted by the CEO of a local firm: “I would like to have more staff able to spot a problem in granu-
FIGURE B.9 COMPLIANCE OF PARTICIPATING COMPANIES TO KEY GMP QUALITY ELEMENTSNo. of observations
Quality assurance
Utilities
Sanitation and hygiene
Qualification and validation
Complaints management
Product recalls
Contract production and analysis
Self-inspection and quality audits
Personnel
Training
Personal hygiene
Premises
Equipment
Material handling
Documentation
Good practices in production
Good practices in quality control
Inadequate Improve Acceptable
5 2
1 6
1 6
5 2
1 6
5 2
2 5
1 5 1
3 4
7
5
2 4 1
1 6
4 3
4 3
5 2
4 3
Source: Adapted from UNIDO 2014.Note: GMP = good manufacturing practice.

117KENYA COUNTRY PRIVATE SECTOR DIAGNOSTIC
lation, formulation, and compression of any other step of production before a batch of medicines is manufactured… this requires technical and critical thinking skills that are hard to find.” Firms also face an ongoing risk of poaching and turnover in a market without a sufficient pipeline of talent for skilled labor available locally.
c. Unlevel playing field with distorted tax and finance incentives between local and foreign firms
Several factors related to public procurement, tax, and financial incentives are distorting the market. When competing for government tenders, Kenyan firms argue that the 15 percent price preference for local manufacturers by KEMSA is not significant compared to the ten percent discount for imported medicines.52 Similarly, local firms are paying tariffs on imported packaging not available locally, because of challenges to reclaiming VAT refunds from the Kenyan Revenue Authority and writing off the value of the rebates.53 As about 50 percent of packaging material is imported, local firms are arguably less competitive compared to duty- and VAT-free imported medicines as the tariffs on packaging could be up to 25 percent and VAT is 16 percent.54 Producers in Kenya note they do not benefit from significant corporate income tax treatment (tax rate and holi-day) compared with their counterparts in Ethiopia, India, and China. For instance, Ethiopia provides a five-year exemption when firms import more than half of total production and for two years when less than 50 percent.
d. Nontariff barriers limit firms’ export market access and potential to scale
Local manufacturers face nontariff barriers (NTBs) in the form of the slow process and lack of imple-mentation of the African Medicines Registration Harmonization (AMRH) program. Joint reviews and inspections agreed upon by EAC member states for mutual recognition of registration are not in effect. Firms cite challenges with the lack of a common information technology system to share information between countries and a common payment system to collect registration fees. The World Bank, which has supported the AMRH program since 2009, has cited the importance of political will and varied reg-ulatory capacity across the region as a disincentive for harmonized standards.55 This means that few Kenyan manufacturers are able to benefit from the preferential registration application processing times—for example, four months versus the average of one
year—which directly constrains them in their ability to meet growing regional demand and achieve scale.
2. ImportsInadequate postmarket surveillance makes it diffi-cult for the PPB to assess the quality of medicines in circulation, especially imports that may include counterfeits and substandard medicines regularly enter-ing an unsecured supply chain. Manufacturing errors, degradation through poor storage, or deliberate and fraudulent manufacturing and labelling contributes to the lack of safety and security of medicines.56 Yet the PPB’s current screening covers just over one percent of products per year. Compared to other countries such as Nigeria, this is an inadequate level of screening given the range of medicines needing to be quality assured at porous borders and along the value chain.57 The PPB the lacks capacity to implement guidelines for target sampling to products that (1) have the great-est potential for bioavailability or stability problems, (2) are from new or questionable suppliers, and (3) have been the source of complaints. Compliant local firms are negatively affected by the proliferation of counterfeits and substandard medicines, which are not curbed despite the Anti-Counterfeit Authority’s mandate to effect anticounterfeiting policy and law. There are insufficiently severe consequences for firms endangering public health such as prosecution, man-datory shutdown, and stock seizures. The PPB also appears to have delays in marketing authorization of new products, including those that could be better and cheaper, which further props up illicit trade by creating a disincentive for firms and consumers to go through unregulated market channels.
3. Distribution, including wholesale and retailThe fragmented distribution network is largely because of the prevalence of wholesalers and subwholesalers, which reinforces the limited traceability and high markups that are passed on to consumers. From the supplier to the consumer, there are multiple layers that add unnecessary costs, quality risks, and limit traceability, particularly without market information systems in place. The reliance on subdistributors adds markups across the supply chain as each adds around 25 percent to the final price of the product, as figure B.10 shows.58 Kenya has high margins for distribution compared to other countries, such as South Africa, which has maximum markup on distribution of just six percent.59 Retail pharmacies then charge up to 33 percent on top of that to arrive at the fixed single exit price set by the government each year.60

118 appendix bpharmaceuticals deep dive
Most pharmacies are not using electronic systems to manage inventory, which creates an opening for counterfeits and substandard medicines when there are stockouts of medicines. Data from 2014 showed that the availability of essential medicines in public hospitals and lower-level facilities were 61 percent and 48 percent, respectively,61 and nearly all private pharmacies had experienced stockouts. Overall, 71 percent of consumers experience stockout of essential medicines.62 The PPB has also noted lack of market data on disease and consumption patterns as a chal-lenge to effective regulation.
Opportunities to Increase Quality and Lower Costs of Medicines in Kenya
A fundamental precondition to increase the supply of locally produced and imported medicines that are safe and affordable is strong political commitment to
“brand Kenya” based on good quality standards. The key priorities are to improve the regulatory capacity for medicines quality assurance and levelling the play-ing field for local manufacturers and importers along with skills development including closer links with higher learning institutions. Figure B.11 summarizes opportunities at the government and industry (or firm) levels for World Bank Group support in Kenya across the value chain from manufacturing to distribution.
Three main areas for government action are nec-essary to create the enabling conditions for Kenya’s pharmaceutical sector: (1) improving technical and financial resources for strong regulatory oversight to ensure and enforce medicine quality, (2) leveling the
playing field so local firms can fairly compete with imports based on quality and price, and (3) assessing roadblocks to implement harmonized protocols in the EAC to increase market access and attractiveness for investors in the sector.
1. Improve regulatory oversight to ensure and enforce medicine quality
a. Implement the Kenya GMP RoadmapProviding support for the PPB to implement the Kenya GMP Roadmap is a logical next step to ensure that the guidelines are implemented by firms to meet international standards. UNIDO has been working with stakeholders, including the PPB, the Ministry of Industry, Trade, and Cooperatives and the Ministry of Health, to take stock of current quality compliance among local manufacturers. Stakeholder consultations suggest funding a two- to three-year program could help milestones are fully implemented, including:
• Maintaining a clearly laid out, sustainable, and effi-cient governance structure for the PPB, including the National Quality Control Laboratory (NQCL), which is responsible for testing drug samples;
• Facilitating PPB’s capacity for audits through the GMP Inspectorate, including development of staff-friendly tools for use in periodic reviews, and estab-lishing a clear, workable process for noncompliant firms, limiting scope of license to manufacture, or recalling and destroying substandard products;
• Communicating to firms the specific assessment requirements for upgrade planning (for example, facility and QMS-related aspects);
FIGURE B.10 AVERAGE POSTMANUFACTURING PRICE MARKUPS OF MEDICINES IN EMERGING MARKETS AT EACH STAGE OF THE SUPPLY CHAIN
0 200 25015010050
CIF/tax5-10%
Importer25-30%
Wholesalers25-30%
Subwholesalers75% (25% each)
Retailers generic50-80%
There’s often multiple subwholesalers in the supply chain, each adding at least 25% markup.
Markups for branded products can range from 25% to 260%, on average, and up to 500%, in extreme cases.
Source: Adapted from IFC 2017.Note: CIF = cost, insurance, and freight.

119KENYA COUNTRY PRIVATE SECTOR DIAGNOSTIC
• Developing strong, effective, and sustainable links within and across governance bodies, such as the Pharmaceutical Technical and Steering Commit-tee; and
• Supporting advocacy with line ministries to ensure ongoing and demonstrable political support for local manufacturing.
Building capacity for quality assurance and enforce-ment in the PPB will help ensure that firms that are unable to meet international standards exit the market. Enforcement of these measures will require consulta-tions within the various units of the PPB, including the NQCL,63 the government, and industry to ensure quality enforcement does not lead to shortages or increases in imports without sustainable regulatory oversight mechanisms in place. This program would support establishing the PPB as a regional leader in regulatory excellence (see box B.1 for lessons from Mexico).
b. Leverage technology solutions for real-time testing of quality throughout the value chain
Experience from several other African countries sug-gests three main areas where the government could prioritize digital health technology investments to strengthen market surveillance of product quality:
• Utilizing handheld technologies for real-time field quality testing, for example TruScan;
• Implementing drug supply chain security mea-sures for tracking medicine at the unit level, for example, track-and-trace system; and
• Establishing business intelligence systems, such as Good Pharmacy Practice (GPP), for data manage-ment of inspections conducted by regulators and management of health facility inventory.
Nigeria and Ghana have proactively tackled their problems with counterfeits and substandard medicines by screening products using handheld raman spec-trometers, such as TruScan. The device can identify a substance’s chemical components on the spot and it is used by most pharmaceutical firms to evaluate APIs for consistent quality because inferior ingredi-ents lead directly to dangerous drugs or indirectly to shortages. Illustration B.1 shows a device similar to TruScan.
Regulators in West Africa have followed industry leads, given the extent of counterfeits and substan-dard products in the region. Nigeria had a significant problem with an estimated 64 percent of antimalarial medicines being reported as substandard in 2011. To tackle this issue, the National Agency for Food and Drug Administration and Control (NAFDAC) intro-duced a series of measures to increase surveillance in the market, including procurement of TruScan units.64 Between 2010 and 2012, NAFDAC noted a reduction in the level of circulating counterfeits and
FIGURE B.11 PROPOSED ACTIONS TO INCREASE SUPPLY OF HIGH-QUALITY AFFORDABLE MEDICINES IN KENYA
Source: Kenya CPSD team.Note: EAC = East African Community.
Improved regulatory oversight of medicine quality
Policy reforms to level the playing field
Manufacturers Distributors
Assess roadblocks to EAC–wide protocols
Support quality upgrading in line with international
standards
Develop pipeline of skilled labor for quality upgrading
Streamlined distribution and retail network (for example, consolidation)
Interventions
Upgrading quality increases profits
Regular, accessible mareket data collection
Scaling improves competitiveness
Better stock monitoringImproved responsivess and use of capacity
Lower markups from consolidated distribution networks and reduced payment cycle risk
Outcomes
Increased access to affordable and safe medicinesConsumer benefits

120 appendix bpharmaceuticals deep dive
substandard medicines from 16.7 percent in 2005 to 6.4 percent in 2012.65 In Ghana, the anticounterfeiting program, Promoting Quality of Medicines (PQM), which is funded by the USAID (United States Agency for International Development) and implemented by the leading standards body, U.S. Pharmacopeia (USP), is also using TruScan, as it is easy to learn and delivers immediate results to safeguard the public.66 The evidence presented shows that drug quality is likely improving in both countries, as spectrometry devices allow regulators and law enforcement agents to inspect the quality of both imported and locally manufactured medicines equally. Inspectors typically require a relatively short training period on how to handle the device and importance of their job function in enforcing quality standards with suppliers and distributors. Technical experts at the USAID have estimated about twenty-five units would be sufficient to cover the Kenyan market.
Ethiopia is investing in transparency and quality management throughout its pharmaceuticals supply chain with track-and-trace systems. This system is a mass serialization solution for pharmaceutical companies that prints a unique identifying code onto each product after it has been packaged. The information can flow backwards and forwards for tracking (that is, knowing where the physical loca-tion of a particular good is within the supply chain at all times) and tracing (enabling strict controls of
goods’ handling), which push companies to align production and distribution processes for traceability requirements and avoid non-compliance. The USAID, in collaboration with Ethiopia’s Food Medicine and Healthcare Administration and Control Authority, has
ILLUSTRATION B.1 A SPECTROMETER BEING USED FOR API TESTING AT A KENYAN MANUFACTURER DURING AN IFC-LED FIELD VISIT, MAY 2018
Source: Kenya CPSD team.Note: API = active pharmaceutical ingredient.
BOX B.1 MEXICO’S COFEPRIS: ESTABLISHING REGIONAL LEADERSHIP IN REGULATORY EXCELLENCE
Mexico’s national drug regulatory authority, COFEPRIS (Federal Commission for the Protection against Sanitary Risk), is recognized as a regional leader by the Pan American Health Organization and the World Health Organization for its strong system of regulating and monitoring of drugs. It has signed bilateral agreements with other regulatory agencies that recognize registrations by COFEPRIS. Firms benefit with greater access to markets such as Colombia and Chile. In 2016, the Mexican regulator launched 5 principles to improve protection against health risks:
1. Ethics. Increasing confidence in the agency with transparency and open access to information.2. Expertise. Improving the regulatory environment for clinical trials and pharmacovigilance3. Efficiency. Collaborating with foreign regulators and the private sector to implement best practices
4. Competitiveness. Simplifying administrative steps (including for exports) and a risk-based testing model in line with international best practices.a and b
5. Global approach. Engaging with international counterparts and consolidate its status.
As recognition of Mexico’s practices translating into quality and safety, COFEPRIS has become a member of the Pharmaceutical Inspection Co-operation Scheme—an organization that brings together the most important regulatory agencies in the world. The clear agenda and permanent dialogue with industry observed in Mexico offers lessons for Kenya on regional leadership in regulatory excellence and good regulatory practices.
Source: Adapted from Oliveira 2018.a. EMA (2016).b. USFDA (2017).

121KENYA COUNTRY PRIVATE SECTOR DIAGNOSTIC
been funding the development and implementation of a new, fully integrated open-source electronic regula-tory information system that will enable end-to-end pharmaceutical supply chain visibility in Ethiopia. The government’s political support has been essential for the pilot project’s success, in part has been driven by the aim of reducing import dependence. An important added benefit is the built-in information management system for materials, inventory, sales and distribution monitoring, counterfeits and substandard medicines diversion, and theft prevention.67
Given that Kenya’s pharmaceutical distribution and retail sector is characterized by fragmentation resulting in inconsistent quality and high costs, it is important to encourage formalization through incentives. One possible area for consideration with the use of a track-and-trace system is the complementary links with the National Health Insurance Fund (NHIF).68 The government could mandate that those NHIF members’ coverage may only be redeemed at licensed, reputable retail outlets, which could incentivize the informal drug shops to register and have access to a growing consumer segment.
In Uganda, data warehousing technology and business intelligence are used to improve medicine management and pharmaceutical services. The Uganda Ministry of Health adopted the Supervision, Performance Assessment, and Recognition Strategy to increase the ability of health workers to manage medicines. It includes a data collection effort from all 3,700 health facilities on five main pharmaceutical service areas: dispensing quality, prescribing quality, inventory man-agement, store management, and reporting quality for all essential medicines. Established in 2017, the
“Pharmaceutical Information Portal” has progressively contributed to improving the quality of the medicines in the market as the National Drug Authority can auto-matically generate GPP adherence inspection reports. The Ministry has also facilitated the national rollout of RxSolution for generating medicine consumption data to support procurement decisions and reduce the risk of stockouts while working to ensure quality of medicines among retailers.
2. Level the playing field through policy reformsLevelling the playing field between local manufactur-ers and imports is essential to ensure competition in the market for medicines. As noted, Kenya does not benefit from backward integration into APIs and scale economies relative to imports, particularly compared with larger players from Asia. Yet competition policy challenges persist. Local producers could respond more quickly than importers to changes in demand,
but they suffer from an inverted tariff structure on packaging and from the distortive incentives for pro-ducers in other countries. While no duty is levied on imports on finished medicines, local firms face tariff on packaging and challenges with claiming rebates on VAT from the Kenyan Revenue Authority. In contrast, Ethiopia exempts VAT on all items to produce medicines if the products are exported along with other incentives (see table B.1).
Emerging markets with a willingness to develop their pharmaceutical industry typically provide a broad range of incentives aimed to support local production (see figure B.1). While Kenya is following the standard pattern of evolution for this industry, which is starting with production of generics for simple therapeutic areas, a package of incentives is critical before firms could move into complex therapies. (see figure B.1). A regional approach to incentives would boost local production and limit NTBs to exports. For instance, the Federation of East African Pharmaceutical Manufacturers suggests the following EAC-wide incentive package:
• Price preference. A preferential margin of 20 per-cent for all regionally produced medicines and medical devices in public tenders according to Article 35 of the Common Market Protocol;
• Tax incentives. No duties on imports of raw and packing material and pharmaceutical manufactur-ing related equipment as well as its spare parts; and
• Import classification. Classification of medicines according to the production capabilities of local manufacturers. Medicines that can be produced locally will be taxed or even restricted from import.
Implementing such package will require consulta-tions within various EAC member states’ Ministries of Finance, Ministries of Industry, and Ministries of Health and consensus on the identification of the most optimal measures to ensure fair and effective competi-tion in the market. As noted, the precondition is estab-lishing fundamentals on quality oversight and having adequate skills to support the sector’s development.
3. Assess the roadblocks to EAC-wide harmonized protocols
Removing NTBs within the EAC is key for high quality Kenyan manufacturers to access regional demand and operate at large scale. While Kenya has less than 50 million people, the EAC Common Market represents over 180 million people and a $2 billion market.69 Removing NTBs within the EAC would allow Kenyan firms to operate in conditions that are comparable to

122 appendix bpharmaceuticals deep dive
Bangladesh where 166 million people consumed $2.2 billion of medicines in 2016.70 Box B.2 describes the development of scale in South Asia in which firms benefit from greater efficiencies as a result.
The end-term assessment of the AMRH program proposed two potential solutions to the limited prog-ress on Common Market initiatives:71
• Establish a semiautonomous and financially sus-tainable regional healthcare products agency to implement joint initiatives effectively and
• Support the deployment of effective information management systems at the national and regional levels to aid information sharing.
TABLE B.1 INCENTIVES PACKAGE FOR LOCAL PRODUCTION OF MEDICINES IN CHINA, ETHIOPIA, INDIA, AND KENYA
China Ethiopia India Kenya
Preferential pricing in public lenders
No information available. 25 percent price preference, prepayment of 30 percent of the tender value when awarded contract, loan for 70 percent remaining
No information available. 15 percent preference for local manufacturers and 10 percent for Kenyan-owned companies
Export incentives and facilitation
Fifty percent of corporate income tax reduction when exporting over 70 percent of production.Direct cash subsidies, discounted utility rates and land rent.
Preferential treatment to most global markets
Subsidy on exports which varies based on destination.Market access support, for example, 50 percent subsidy of registration fees in other countries.
Duty drawback on raw materials EPZs set-up with packaged incentives
Reduced import competition
List of drugs discouraged from import updated on needs basis.Ten percent import tariff (WTO members).
An average 4.5 percent import duty on 35 tariff lines
Thirty-five percent import tariff on all products.Six percent import tariff (WTO members).
No measure
Customs duty exemption No information available. Capital good, raw materials, and spare parts fully exempted (up to 15 percent of the value of imported capital goods for spare parts).
Incentives apply if located in SEZs.Capital goods, raw materials, and spare parts are fully exempted.
Capital goods and raw materials fully exemptedSpare parts and packaging not exempted
VAT exemption VAT rate of 5 percentVAT exemption or refund for the purchase of research and develop-ment equipment.
VAT rate of 15 percentVAT exemptions on all items if products are exported.
VAT exemption on all raw materials imported and procured within the State.
VAT rate of 16 percent. Exemption from VAT if in EPZs. Rebate for VAT on packaging not effectively applied.
Corporate income tax exemption
Tax rate of 25 percent.Tax holiday applicable in SEZ: 100 percent for 5 years, 50 percent for another 5 years, and further exemption if investment is in the SEZ Special Reserve Account
Tax rate of 30 percentTax holidayFive years and two years exemption for exports of more or less than 50 percent of production, respectively.
Tax rate of 15 percent for high and new technology enterprises after tax holiday.Tax holiday: 2 years in select SEZs.
Tax rate 30 percentSEZs enterprises subject to a reduced rate of 10 percent for the first 10 years and 15 percent for the next 10 years
Source: Adapted from the Ethiopia, Ministry of Health and Ministry of Industry 2015.Note: SEZ = special economic zone; WTO = World Trade Organization; VAT = value added tax.

123KENYA COUNTRY PRIVATE SECTOR DIAGNOSTIC
A semiautonomous and financially sustainable regional agency would ensure that decisions result-ing from regional assessments are legally binding and that mutual recognition is implemented. The establishment of a national medicines regulatory authorities (NMRAs)–led coordination desk in the short term and the establishment of an East African Health Care Products Agency in the long term that coordinates the regional joint activities, coupled with mutual recognition agreements for individual nationally assessed and approved products, would be the most efficient and effective way to address the fundamental issues. The agency could rely on two sources of revenues: contributions from the NMRAs and fees charged to marketing authorization applicants. Annual filing of between 60 and 145 products for joint assessment could be fully financed with industry fees. Lessons can be learnt from the New Partnership for Africa’s Development’s current initiative to establish an African Medicines Agency.
Effective information management systems (IMS) are required at the national and regional levels to aid information sharing, storage, and management. Support will be required for the final deployment of the platforms and migration of the data from the old manual systems. A regional system that will support this information sharing, although developed, requires links to national systems for easy and regular sharing of the required information among partners. One way of doing this is to develop interfaces, while another
option is to align the NMRAs on the same IMS. This would take substantially longer and be more expen-sive. A comparable project in the Intergovernmental Authority on Development bloc that was developed while using periodic and manual information uploads, proved to be more feasible within reasonable timelines and tight budgets.
At the industry or firm levels, there is potential to leverage advisory and investment solutions to support manufacturers and distributers upgrade and mon-itor medicine quality and develop skills for quality assurance and compliance expertise.
SUPPORT QUALIT Y UPGR ADING THROUGH THE VALUE CHAIN FROM MANUFACTURING TO RETAILIFC is the largest multilateral supporting the pri-vate health care market and is now ramping up its presence in the pharmaceutical sectors. In line with IFC’s health care strategy and IFC 3.0’s aim of cre-ating markets, there are growing opportunities for enabling systemic changes in the pharmaceutical market to raise quality standards through a value chain approach from manufacturing to retail.
In manufacturing, IFC committed $10 million in June 2018 to UCL, which is its first project in the pharmaceuticals subsector in the region outside of South Africa. The financing supports the manufac-ture of critical medicines as UCL is GMP-accredited and can access donor tenders, such as those put out by the USAID and the United Nations Children’s
BOX B.2 SCALE MATTERS: LESSONS FROM INDIA AND BANGLADESH
Kenya’s focus on high-volume and low-margin products requires large-scale production. The largest manufacturer in Kenya can possibly produce 7 billion tablets a year but is only using less than 15 percent of its capacity.a In contrast, the largest manufacturer in Bangladesh uses nearly 50 percent of its 10-billion-tablet capacity and major European facilities can produce 250,000 tablets an hour.b
Asian countries have relied on demand- and sup-ply-driven approaches to develop scale. On the demand side, India and Bangladesh benefit from large and growing populations. On the supply side, both countries’ industries operate large-scale facilities, many of which are within industrial parks. These dedicated industrial areas, which are logistically well-located and well-serviced land, help firms’ access markets. The government of Bangladesh invested $39 million in an industrial park near Dhaka to achieve self-sufficiency production of active pharmaceuti-
cal ingredients and gain competitive advantage in the global market.c To further support market expansion in line with growing demand, Bangladesh has taken advantage of the World Trade Organization Trade-Related Aspects of Intellectual Property Rights flexibility that allows low-in-come countries to export to other low-income countries with no patent protection until 2033.d and e Both countries are now nearly self-sufficient in production, through investments in manufacturing facilities that contribute to local firms’ profitability as costs have fallen and demand for local generics continues to growth.f
Source: Adapted from Bumpas, Kostermans, and Nair (2007).a. Vugigi (2017).b. ILSL (2019).c. NSDCS (2017).d. Vugigi (2017).e. Sultana (2016).f. EAC (2017).

124 appendix bpharmaceuticals deep dive
Fund for HIV/AIDS medications. In line with the recommendations of the Kenya GMP Roadmap, there is further scope to continue investments in firms that have been rated “A” in production capacity for physical site and QMS improvements.
Given that high costs of credit for capital invest-ments to upgrade quality remain a barrier to most companies in the Kenyan and EAC markets, there are lessons from Ethiopia’s pharmaceutical sector development—supported by the highest levels of government. The capital investment constraints that Kenyan firms face for meeting GMP and Good Distribution Practice (GDP) standards may also be reduced through the use of the SEZ legislation, as Square Pharma is doing in Kenya’s SEZ. Favorable tax, licensing, land allocation, and regulatory and processing policies may reduce the perception of risk by banks. Ethiopia, for example, has recently estab-lished a pharmaceuticals-dedicated industrial park to attract investment in the sector. With support from the World Bank,72 the Kilinto industrial park (308 hectares) has been designated as pharmaceuti-cal-specific, targeting firms from China and India in generics drug manufacturing. Local firms that will relocate will benefit from links with multinational companies. As a result, over 27 foreign companies invested since 2011,73 while seven companies have expressed interest to lease land in the industrial park, of which four have signed memorandum of under-standings with the Ethiopian government. A review comparing the benefits of the Ethiopian industrial park versus the Kenyan special economic zones might be helpful in assessing if further changes are needed.
In logistics, the 2017 investment in the Africa Logistics Properties Holding together with the United Kingdom is supporting development of modern high-quality warehousing in Kenya. Quality ware-housing is critical for product quality and security in medicine storage. There is scope to assess links for the pharmaceutical sector, potentially through a prelease with a distributor to build specifications, such as temperature-controlled facilities that are GMP or GDP compliant. Again, a push for ensuring qual-ity by the Kenyan government and taking degraded or fraudulent medicine out of the supply chain will incentivize distributors to use better quality logistics to maintain quality of their product.
In retail, IFC’s commitment to bring access high-quality medicines likely to be increasingly demand in the market has been demonstrated by its 2015 investment in Goodlife’s early-stage growth. A second investment in 2018 will support expansion to underserved and lower-income markets, served by
largely informal, unregulated drug stores. Having a program to push for more regulation and supervision of retail pharmacies would continue to help improve the market and allow for efficient reorganization of the market. As in manufacturing, there is scope for competition to drive efficiency growth in the retail sector. For instance, in 2016, IFC invested in private equity backed by leading chain, Haltons Pharmacy, for expansion plans that mirror Goodlife’s desire to target consumers and localities lacking access to licensed, high-quality retailers. It will be important to continue business development in the region to support the growth in health care spending, such as among the 25 million members of the National Health Insurance Fund.
LEVER AGE TECHNOLOGY SOLUTIONS FOR QUALIT Y MANAGEMENT IN A STREAMLINED DISTRIBUTION AND RETAIL NET WORKIn collaboration with industry stakeholders, there is scope to leverage the World Bank Group’s TechEmerge matchmaking platform between proven technology providers and firms for solving challenges faced by manufacturers, distributors, pharmacies, clinics, and drug shops. TechEmerge already has programs in India and Brazil and is now looking towards the East African health care market, which could include the pharmaceutical sector. Kenya has already developed e-health solutions to provide consumers with lower cost options and assist firms along the value chain increase quality, such as Maisha Meds, Livia Dawa App, and MyDawa.74
Examples such as MyDawa illustrate how empower-ing consumers directly can reduce fragmentation, safety risks, and prices in the delivery network. Consumers browse a range of medicines from accredited manu-facturers, mostly from India, purchase using M-Pesa mobile platform, and are notified by text messages that the product is available for collection from a pharmacy of their choice. This model illustrates how Kenya can tackle substandards and counterfeits through better traceability and authentication along the supply chain. Consumers can authenticate the products they purchase by sending a text message of a short code from the tamper-proof seal to verify what they have ordered. They also benefit from below market prices for MyDawa branded products and third-party products with savings of up to 40 percent. Another example of using technology to streamline the supply chain is mPharma, which works with pharmacies in Ghana and Nigeria on inventory management to accurately forecast demand and build up bargaining power with suppliers to lower costs to consumers by up to 30

125KENYA COUNTRY PRIVATE SECTOR DIAGNOSTIC
percent. Both models help eliminate unnecessary steps in the long, fragmented supply chain from manu-facturer to consumer through greater transparency and lower costs. There are opportunities to leverage technology with existing operations in Kenya, such as with MedSource—the first group-purchasing organi-zation in the country that negotiates discounts with manufacturers, distributors, hospitals and clinics, and pharmacies. MedSource works with over 300 distributors and members to monitor the availability of high-quality products.
IFC could identify commercially viable models for ensuring quality and best prices for consumers through comparison shopping and for providing incentives for pharmacists to provide credible consultations to repeat consumers. This may include initial work with technology providers through advisory support to determine investment readiness.
DEVELOP A PIPELINE OF SKILLED L ABOR TO SUPPORT QUALIT Y UPGR ADINGAn in-depth stakeholder consultation is first required to deepen the collective understanding of specific requirements of the sector and to support the level of growth anticipated. The World Bank has experience leading such inclusive consultations in the health sector, such as with the Kenya Medical Practitioners, which could be leveraged to assess needs along the value chain. A structured set of technical meetings with manufacturers, retailers, training institutions, regulators, and civil society could lead to a frame-work for priority actions that would inform a skills
development strategy to support the quality upgrades and growth of the sector particularly in the face of automation, innovation, and R&D.
A skills development strategy for the sector may also be informed by the assessment. There are different approaches for consideration within the Kenya and EAC context that may include:
• Strengthening a coordination mechanism to ensure that all relevant stakeholders work together to develop appropriate skills solutions for the needs of the pharmaceutical industry;
• Ensuring standards, certifications, and quality assurance mechanisms are in place so that the skills developed are in line with international standards;
• Aligning workforce skills development approaches that considers upskilling, reskilling, and continu-ous professional development needs of the indus-try and their oversight bodies;
• Identifying suitable training providers to meet the needs of the industry and its regulator; and
• Introducing new financing mechanisms and incen-tives to encourage more students to enter the sector.
While the focus is on the pharmaceutical sector in Kenya, this approach is relevant in other countries in the region and for other manufacturing sectors. For instance, there are potential spillovers and ben-efits to other sectors where occupations and skills are shared across industries within manufacturing, such as engineers (for example, electrical, chemical, mechanical) (box B.3).
BOX B.3 INDUSTRY-ORIENTED SKILLS FOR PHARMACISTS: LESSONS FROM SOUTH ASIA
Bangladesh is an example of a country that is transition-ing from being dependent on imports to being 97 percent self-sufficient to manufacture pharmaceuticals, in part because of its strong base of skilled labor. Its pharmaceu-ticals industry employs the most white-collar profession-als in the country, over 115,000 workers as of 2014.a Rapid sector development is illustrated by the fact that local manufacturers began initiated production of biopharma-ceuticals and anticancer drugs led by a highly-skilled workforce.b Similarly, in India, pharmacy education has been developing faster than anywhere in the world; BPharm and MPharm levels are taught as industry- and product-oriented professions and are taught mostly in private colleges and universities. Most pharmacists with a BPharm degree normally seek positions (such as
production, quality control, and marketing) within the industrial sector where jobs are well-defined and the pay is attractive. They also can be appointed to drug regula-tory agencies or quality control laboratories by the state or central government. Many MPharm graduates entering the pharmaceutical industry work in areas such as research, formulation development, and clinical trials.c These trends in both countries are unlike those in the United States, Europe, and Africa, where more graduates are in industry over clinical practice—a skills challenge in reverse of what is observed in East Africa.
a. Hossain and Shoaib (2014).b. Mazid and Rashid (2011).c. Subal and Dondeti (2010).

126 appendix bpharmaceuticals deep dive
There are examples from India of industry-led training solutions in collaboration with global stan-dard-setting organizations that may be adapted for Kenya. The USP, which is implementing the PQM program in Ghana, has recently launched education courses with a training institute in India to support manufacturers build technical capacity. Courses cover applications of quality control, quality assurance, quality risk management, corrective and preven-tive actions, good documentation practices, and other technical skills, including the specific require-ments of GMP. Scientists that have helped develop global pharmacopeia standards teach the courses with real-world case studies on standard operating procedures and hands-on practice. Students are a mix of workers with an average of two years of industry experience sponsored by their employers to build technical expertise and recent graduates keen on job placement in the industry. The USP’s Hyderabad Training Institute is housed in a local pharmacy college with the required licenses and infrastructure, including laboratory equipment. The use of applications-enabled learning in course work facilitates regular student access to materials, quizzes, and reporting to employers on test scores and improved knowledge of methods for quality manufacturing. Initiatives such as this and plans for meeting sectorwide needs may be assessed for commercial viability, potential scale, and alignment with regulatory guidelines for the Kenyan and, per-haps, the EAC context in collaboration with industry associations and IFC clients.
Solutions for upgrading skills at the retail level may leverage e-learning and/or distributor and retailer acad-emy platforms that have largely not yet been adapted for the pharmaceutical sector. Technology start-ups that train software developers in the region through technical boot camps for full-time roles at leading firms could serve as a model for continuous medical education among pharmacists and pharmaceutical technologists. IFC’s Distribution Excellence Program and Retailer Academy models have been used in agribusiness primarily for demand-driven training with firms for improved business and advisory skills. For example, working with Swiss-based Novartis to improve business skills of pharmacy owners in the Arab Republic of Egypt showed early results of stronger business relationships with reputable distribution partners as well as finan-cial returns on the investment. The specific curricula
would need to be informed by the Kenyan industry, including the Federation of Kenyan Pharmaceuticals Manufacturers (FKPM), the Hospital Pharmacists Association of Kenya, the Pharmaceutical Society of Kenya, and the Kenya Pharmaceutical Association, for standardization and to ensure relevance of training prior to on-the-job learning. Leveraging the TechEmerge platform may assist in identifying suitable solutions providers to develop such a platform for the Kenyan and regional market.
Finally, it is important to note that a coordinated approach is needed through a package of interven-tions to support Kenya’s and the region’s efforts to increase the role of the private sector in supplying high quality, affordable medicines, financing options may include the World Bank Group’s Creating Markets Advisory Window75 and/or the support of initiatives such as the Global Financing Facility in Support of Every Woman Every Child (GFF) that aim to lever-age private sector for improving quality, accessibility and affordability of essential health services and products (including pharma) for women, children and adolescents.76 Taking the recommendations for-ward for raising quality standards in Kenya’s and the region’s pharmaceutical manufacturing sectors will likely require a minimum five-year time horizon and a package of World Bank Group lending, advi-sory, and investments. There is significant potential to leverage existing efforts with the UNIDO, the PPB, the FKPM, and the EAC Secretariat, and other industry stakeholders.
The key to change and growth in this sector lies with the government’s ability to ensure medicine quality are met through more rigorous application of stan-dards and enhanced market surveillance and testing. Such a program would have unambiguously positive impacts on the health of Kenyans. Fortunately, there are new technologies that can rapidly assist in this and can be identified by TechEmerge. It is important to recognize, however, that this policy change will have both positive and negative impacts on Kenyan firms in the sector. Those that can meet the quality standards will have the opportunity to grow and expand, including in the donor and export markets. Those that cannot or will not meet these standards will be forced to exit the market and some assistance in this transition for the firm and its workers might be an important element in ensuring public support and reducing resistance in the sector.

127KENYA COUNTRY PRIVATE SECTOR DIAGNOSTIC
Proposed Action Plan for Kenya’s Pharmaceuticals Sector
Table B.2 lays out the recommendations and proposed interventions to help address the constraints affecting private sector development in Kenya’s pharmaceuti-
cals sector. Interventions refer to World Bank Group lending, advisory, and investments. Potential impact is assessed through stakeholder consultations within the Bank Group and with the government, donors, and industry based on impact on public health of improved medicine quality, affordability, and access.
TABLE B.2 PROPOSED ACTION PLAN FOR KENYA’S PHARMACEUTICALS SECTOR
Recommendation Intervention
1.1. Strengthen regulatory capacity for quality standards assurance and enforcement
• Implement the GMP Roadmap to enhance the credibility of the local industry’s product safety.
• Enforce GMP compliance and adherence to corrective and preventive actions.
• Conduct frequent, ongoing testing across the value chain, including of imports, for medicine quality and safety and consumer confidence.
• Technically assist the PPB to adapt best practices and operating procedures used by stringent regulatory authori-ties globally for regulatory excellence.
1.2. Assess constraints to achieving scale, for example, through EAC Regional Harmonization and Common Market protocols
• Establish a semiautonomous and financially sustainable regional health care products agency to implement joint initiatives effectively.
• Support the deployment of effective information management systems at the national and regional levels to aid information sharing.
1.3. Utilize technology solutions for market surveil-lance of quality and business intelligence
• Utilize handheld technologies for real-time field quality testing, for example, TruScan (with USAID).
• Implement drug supply chain security measures for tracking medicine at the unit level, for example, track-and-trace system (with USAID).
• Establish business intelligence systems, such as Good Pharmacy Practice, for data management of inspections conducted by regulators and management of health facility inventory (with USAID).
2.1. Conduct in-depth skills assessment of current and future skills needs and advisory solutions for skills across the value chain
• Assess current and future skills needs across occupations in manufacturing for GMP and along the distribution retail channels for GDP.
• Develop a skills development strategy for the sector.• Implement solutions based on the assessment and strategy
such as industry-led training or e-learning platforms.
2.2. Support investments in the sector to promote high-quality manufacturers, retail chains, and consolidation in distribution and logistics
Note: GDP = good distribution practices; GMP = good manufacturing practices; PPB = Pharmacy and Poisons Board; USAID = U.S. Agency for International Development.

128
Notes
1. Based on spending of major procurers of products classified under code 30 in the Harmonized System and a 25 percent share of medicines being local.
2. Based on expected growth by retailers.
3. United Nations Comtrade database; Kenya, National Treasury(2018); IHME (2018); EIC (2016); interviews with local manu-facturers and multinational pharmaceutical company affiliates.
4. Holt and others (2015).
5. EAC Secretariat (2017).
6. EAC Secretariat (2017).
7. Asoko Insight (2018); United Nations Comtrade database; UNIDO (2010).
8. Asoko Insight (2018); Vugigi (2017); EAC Secretariat (2017).
9. Antiprotozoal drugs are used to treat infections caused by protozoan parasites.
10. UNIDO (2010); Vugigi (2017).
11. United Nations Comtrade database.
12. Asoko Insight (2018); Mackintosh and others 2015; Wamae and Kariuki 2014.
13. International Trade Statistics; United Nations Comtradedatabase.
14. Asoko Insight (2018); UNIDO (2010).
15. Mackintosh and others (2015).
16. UNIDO (2010).
17. Mackintosh and others (2015).
18. UNIDO (2010).
19. United Nations Comtrade database; Asoko Insight (2018).
20. Ewen, Kaplan, and Justin-Temu (2016), based on five prod-ucts with enough manufacturers’ data.
21. Baratta, Germano, and Brusa (2012).
22. Renschlerand others (2015).
23. The sector’s employment levels have remained relativelyconstant with 3,400 jobs in 2008.
24. Interviews with stakeholder.
25. Based on IFC estimates.
26. Hidalgo and Hausmann (2009).
27. Vugigi (2017).
28. Ibid.
29. CHAI (2016).
30. APIs are any substance or mixture of substances that isthe active ingredient of the drug (USFDA 2001).
31. Vugigi (2017).
32. Mackintosh and others (2015).
33. Local producers of packaging for pharmaceuticals have an advantage mostly in plastic bottles and outer cartons.
34. Mackintosh and others (2015); Wamae and Kariuki Kungu (2014).
35. Mackintosh and others (2015).
36. EAC Secretariat (2017).
37. International Monetary Fund, International FinancialStatistics, and data files; https://data.worldbank.org/indicator/FR.INR.LEND.
38. Mackintosh and others (2015).
39. Asoko Insight (2018); UNIDO (2010).
40. Rosen and Rickwood (2014).
41. Most donor medicines in Kenya are procured by KEMSA. Although in practice, the organization acts as the procurementservices agent and primary recipient, it has little control overwhich manufacturer they purchase from. When using donor funds, KEMSA must follow the procurement rules laid out by the donor.
42. UNIDO (2010).
43. Mackintosh and others (2015); interviews with stakeholders.
44. KNBS (2009); Medpages database.
45. Rosen and Rickwood (2014); Maisha Meds Point of Saledatabase.
46. The drug regulator was established under the Pharmacyand Poisons Act, Chapter 244 of the Laws of Kenya.
47. In 2012, a cross sample of seven companies (20 percent of the sector) were selected by UNIDO to represent the local industry and were assessed as part of the GMP Roadmap development.
48. Financial institutions charge between 14 and 21 percentinterest rate, with the rates being pushed up by their fees, despite the introduction of a law to cap commercial banks’ interest at 4 percent above the Central Bank rate. Since the introduction ofinterest caps, there has been a decline in access to credit, withthe private sector credit growth hitting an eight-year low of2.1 percent in May 2017 compared to a five-year average of 18percent (Tumo 2017).
49. The term “quality management system” is applied to alldocumentation systems and procedures used by a company toensure GMP compliance (UNIDO 2014).
50. Interviews with stakeholders.
51. UNIDO (2014).
52. FEAPM (2015).
53. Republic of Kenya v. Kenya Revenue Authority, Ex ParteCooper K Brands Limited, miscellaneous application number458 of 2013, http://kenyalaw.org/caselaw/cases/view/122923.
54. The limited demand for local packaging is based on therelatively small size of Kenya’s pharmaceuticals manufacturingmarket, inconsistent quality (for example, faded ink or blurredimages when printing, which undermines brand marketing),and the cost of imports are significantly less expensive. Oneinterview with a stakeholder in May 2018 revealed that inputssuch as wood pulp needed for packaging incurs VAT in addition to higher cost of electricity and labor, local packaging is lesscompetitive than imports.
55. World Bank (2018).
56. IFC (2017).
57. Rosen (2018).
58. IFC (2017).
59. IMS Institute for Healthcare Informatics (2018).
60. Ratshisusu (2017).
61. Mackintosh and others (2015).

129KENYA COUNTRY PRIVATE SECTOR DIAGNOSTIC
62. Consultations with industry experts.
63. The Pharmacy and Poisons Act established the PPB andNQCL as the two main bodies responsible for ensuring safetyof drugs and medicines.
64. Bate and Hess (2010).
65. Ifijeh (2015).
66. Refers to Ghana-based Center for Pharmaceutical Advancement and Training, part of the USP’s Global Health Impact Program.
67. Rotunno and others (2014).
68. The NHIF is the main Kenyan government social security platform for health care insurance, which covered 36 percent of the population in 2017. The NHIF Act allows for accreditation of both private and public facilities, provided they meet the setcriteria.
69. EAC Secretariat (2017).
70. EBL Securities Ltd. (2018).
71. Boston Consulting Group (2017).
72. Ethiopia Competitiveness and Job Creation Project (P143302 and P160279): $425 million total credit.
73. Recent FDI includes: in December 2017, HumanwellPharmaceutical Ethiopia—a Chinese venture—launched the$20 million first phase of what is slated to be a $100 millionproduction facility in the Amhara Region; in January 2016, U.K. private equity firm 54 Capital backed Addis PharmaceuticalFactory through a $42 million deal; in February 2013, JulpharEthiopia, a joint venture between Medtech Ethiopia (45 percent ) and the United Arab Emirates’ Gulf Pharmaceutical Industries (55 percent), commissioned its $9.2 million Addis Ababa facility; in October 2016, Chinese firm Sansheng (Ethio) Pharmaceutical broke ground on the first phase of its $85 million productionfacility, trial production commenced in March 2018.
74. Maisha Meds is a Kenya-based technology company thatuses Google’s mobile operating system, Android, to leveragethe pharmacy point of sale to increase visibility up and downmedication supply chains and ensure evidence-based care. Livia Dawa App is e-medicine application consumers can use to upload prescriptions, make a payment, and have medicines deliveredhome or to a pharmacy.
75. The Creating Markets Advisory Window supports World Bank Group advisory upstream project preparation, such as the policy reforms and public good investments needed along withfirm-specific advisory to catalyze private capital.
76. The Global Financing Facility (GFF) works with the public and private sectors for the health and nutrition of women, children, and adolescents (including pharmaceutical manufacturers andmedical technology companies), through co-financing grants and loan buy-downs together with a World Bank lending operationon the public side and through IFC investment (blended finance) or advisory on the private side. For more details about the GFF’s private sector engagement, visit https://www.globalfinancingfa-cility.org/our-partnership/private-sector.
References
Asoko Insight. 2018. “Industry Map - Kenya Pharmaceutical Manufacturing.” Asoko Insight, Nairobi.
Baratta, Francesca, Antonio Germano, and Paola Brusa. 2012. “Diffusion of Counterfeit Drugs in Developing Countries and Stability of Galenics Stored for Months under Different Conditions of Temperature and Relative Humidity.” Croatian Medical Journal 53 (2): 173–184.
Bate, Roger and Kimberly Hess. “Anti-Malarial Drug Quality in Lagos and Accra—A Comparison of Various Quality Assessments.” Malaria Journal 9 (1): 157.
BCG (Boston Consulting Group). 2017. “EAC Medicines Regulatory Harmonization Program – End-Term Evaluation.” Draft report. BCG. Boston.
Bumpas, Janet, Kees Kostermans, and Dinesh Nair. (2007). “Public and Private Sector Approaches to Improving Pharmaceutical Quality in Bangladesh.” Discussion Paper 68357, World Bank, Washington, DC.
CHAI (Clinton Health Access Initiative). 2016. “Accelerating Local Manufacture of cGMP Quality Assured Pharmaceutical Products in East Africa.” CHAI: Boston.
EAC (East African Community) Secretariat. 2017 “2nd EAC Regional Pharmaceutical Manufacturing Plan of Action 2017–2027.” Arusha.
EBL Securities Ltd. 2018. “Pharmaceuticals Industry of Bangladesh.” EBL Securities Ltd., Dhaka. http://www.eblsecurities.com/AM_Resources/AM_ResearchReports/SectorReport/Pharmaceuticals%20Industry%20of%20Bangladesh.pdf.
EIC (Ethiopian Investment Commission). 2016. “Pharmaceutical Manufacturing Sector Development.” In Ethiopia Study Report, EIC, Addis Ababa.
EMA (European Medicines Agency). 2016. “Results of the Sampling and Testing Programme for the Year 2014.” EMA, Amsterdam.
Ethiopia, Ministry of Health and Ministry of Industry. 2015. “National Strategy and Plan of Action for Pharmaceutical Manufacturing Development in Ethiopia (2015–2025).” Addis Ababa.
Ewen, Margaret, Warren Kaplan, and Mary Justin-Temu. (2016). “Prices and Availability of Locally Produced and Imported Medicines in Tanzania.” Report of a survey conducted in August 2013, World Health Organization, Geneva.
FEAPM (Federation of East African Pharmaceutical Manufacturers). 2015. “Feasibility of Implementing Industrial Policies to Support Local Pharmaceutical Manufacturing in East Africa.” FEAPM Policy Memo, FEAPM, Arusha. http://www.feapm.com/images/Documents/FEAPM%20Policy%20Memo%20Feasibility%20of%20the%20East%20African%20Model.pdf.
Hidalgo, Cesar A. and Ricardo Hausmann. 2009. “The Building Blocks of Economic Complexity.” Proceedings of the National Academy of Sciences of the United States of America 106 (26), 10570–10575.
Holt, Tania, Mehdi Lahrichi, Jean Mina, and Jorge Santos da Silva. 2015. “Insights into Pharmaceuticals and Medical Products – Africa: A Continent of Opportunity for Pharma and Patients.” McKinsey & Company, Washington, DC.

130 references
Hossain, Mir Monir and S.M. Shoaib. 2014. “Role of Pharmaceutical Sector in the National Economy of Bangladesh.” World Journal of Pharmacy and Pharmaceutical Sciences 3 (2): 951–960.
IFC (International Finance Corporation). 2017. Private Sector Pharmaceutical Distribution and Retailing in Emerging Markets: Making the Case for Investment. Washington, DC: IFC.
Ifijeh, Martins. 2015. “Drug Counterfeiting Has Reduced Drastically, Says NAFDAC.” This Day, May 28.
IFPMA (International Federation of Pharmaceutical Manufacturers and Associations). 2017. “The Pharmaceutical Industry and Global Health.” IFPMA, Geneva.
IHME (Institute for Health Metrics and Evaluation). 2017. “Financing Global Health Visualization.” University of Washington, Seattle. http://vizhub.healthdata.org/fgh/.
ILSL (International Leasing Securities Limited). 2019. “Square Pharmaceuticals Limited.” ILSL, Dhaka. Accessed on 21 June 2018. http://ilslbd.com/research_reports/Equity%20Note%20-%20Square%20Pharmaceuticals%20Ltd.pdf
IMS (Institute for Medical Statistics) Institute for Healthcare Informatics. 2014 “Understanding the Pharmaceutical Value Chain” New Jersey, IMS. https://www.ifpma.org/wp-content/uploads/2016/02/IIHI_Report_Pharma_Value.pdf.
Kenya, National Treasury. 2018. “Medium Term 2018 Budget Policy Statement: Creating Jobs, Transforming Lives – ‘The Big Four’ Plan.” Nairobi.
KNBS (Kenya National Bureau of Statistics). 2009. “Kenya 2009 Population and Housing Census Highlights.” Nairobi.
Mackintosh, Maureen, Geoffrey Banda, Paula Tibandebage, and Watu Wamae, eds. 2015. “Making Medicines in Africa: The Political Economy of Industrializing for Local Health.” International Political Economy Series, Palgrave Macmillan, London.
Mazid, Abdul M. and Mohammad A. Rashid. 2011.“Pharmacy Education and Career Opportunities for Pharmacists in Bangladesh.” Bangladesh Pharmaceutical Journal 14 (1): 1–9.
Cader, Masud and A. Tacchella. 2018. “Industry Pilots – Incorporating Economic Complexity to Board Papers.” Presentation, Country Economics and Engagement Department, Country Analytics Unit, International Finance Corporation, Washington, DC.
NSDCS (Bangladesh, National Skills Development Council Secretariat). 2017. “Analysis of Skill Levels in the Pharmaceutical Sector of Bangladesh.” Dhaka.
Oliveira, Jaime. 2018. “Drug Regulation in Mexico: Five Principles Visible Progress and Long Way Ahead.” Global Forum, February. https://globalforum.diaglobal.org/issue/february-2018/drug-regulation-in-mexico-five-principles-vis-ible-progress-long-way-ahead/.
Ratshisusu, Hardin. 2017. “Price Formation in the South African Pharmaceutical Market.” Presentation at the Russian Competition Week, Roundtable on Pharmaceuticals, September 21.
Renschler, John P., Kelsey M. Walters, Paul N. Newton, and Ramanan Laxminarayan. 2015. “Estimating Under-Five Deaths Associated with Poor-Quality Antimalarials in Sub-Saharan Africa.” The American Journal of Tropical Medicine and Hygiene 92 (6): 119–126.
Rosen, Daniel and Sarah Rickwood. 2014. “Supply Chain Optimisation in Africa’s Private Sector: Reducing the Price to Patient.” IMS Health White Paper Africa, London.
Rotunno, Raffaele, Vittorio Cesarotti, Attilio Bellman, Vito Introna, and Miriam Benedetti. 2014. “Impact of Track and Trace Integration on Pharmaceutical Production Systems.” International Journal of Engineering Business Management 6 (25).
Subal, C. Basak and Sathyanarayana Dondeti. 2010. “Pharmacy Education in India.” American Journal of Pharmaceutical Education 74 (4): 68.
Sultana, Jesmin. 2016. “Future Prospects and Barriers of Pharmaceutical Industries in Bangladesh.” Bangladesh Pharmaceutical Journal 19 (1): 53–57.
Tumo, Rodgers. 2017. “Cost of Credit Still High in Kenya Despite Interest Rate Cap.” Xinhua , July 24. ht tp: / /w w w.kassfm.co.ke / home /2017/07/24 /cost-of-credit-still-high-in-kenya-despite-interest-rate-cap/.
UNIDO (United Nations Industrial Development Organization). 2014. Kenya GMP Roadmap: A Stepwise Approach for the Pharmaceutical Industry to Attain WHO GMP Standards. https://www.unido.org/sites/default/files/2014-12/Kenya_GMP_Roadmap_ebook_0.pdf.
USFDA (U.S. Food and Drug Administration). 2001. “Guidance for Industry, Q7A Good Manufacturing Practice Guidance for Active Pharmaceutical Ingredients.” Washington, DC.
USFDA (U.S. Food and Drug Administration). 2017. “Drug Quality: Postmarket Sampling and Testing Results for Drugs (FY 2016).” Washington, DC. www.fda.gov/downloads/Drugs/ScienceResearch/UCM545200.pdf.
Vugigi, Sarah Kadesa. 2017. “Assessment of the Pharmaceutical Manufacturing Industry in Kenya to Forecast Local Production Sufficiency.” Doctorate thesis, Kenyatta University, Nairobi.
Wamae, Watu and Joan Kariuki Kungu. 2014. “Pharmaceutical Manufacturing Trends in Kenya: Key Trends and Development.” African Centre for Technological Studies Working Brief No. 3.
WHO (World Health Organization). 2011. “Local Production for Access to Medical Products: Developing a Framework to Improve Public Health.” WHO, Geneva.
World Bank. 2018. “Implementation Completion and Results Report: AFCC2/RI-African Medicines Regulatory Harmonization Project (P128332).” World Bank, Washington, DC.
World Bank Group. 2015. Unlocking Growth Potential in Kenya: Dismantling Regulatory Obstacles to Competition. World Bank, Washington, DC. https://openknowledge.worldbank.org/handle/10986/25789.

CREATING MARKETS IN KENYA
COU
NTRY PR
IVATE SECTOR D
IAGN
OSTIC
IFC2121 Pennsylvania Avenue, N.W.Washington, D.C. 20433 U.S.A.
ContactsKaren [email protected]
Stephan [email protected]
ifc.org