C.P by Richard H. Neale, David E. Neale
168
-
Upload
independent -
Category
Documents
-
view
1 -
download
0
Transcript of C.P by Richard H. Neale, David E. Neale


Construction planning
Richard H. Neale, BSc, MSc, CEng, MICE, MCIOB David E. Neale, CEng, FICE, MIHT, MBIM
...... 11 Thomas Telford, London

Preface
This guide aims to review construction planning in a simple and practical way. We have been construction project managers, and this is reflected in the style and content of the book. OUf aim has been to describe and explain good planning practice which can be applied with diligent but not excessive effort; planning that produces results without protracted analysis and massive computer print-out.
This guide has three parts
• Part 1: Context and strategy
• Part 2: Techniques, procedures and methods
• Part 3: Planning in practice.
In part 1, chapter 1 emphasizes the vital role that managers must play in the planning process, and also introduces some essential preliminary principles. Chapter 2 describes the imJX)nanr strategic decision-making process that lays a practical foundation for an effective plan.
Part 2 is the technical core of the book. Chapters 3-5 describe planning techniques, the planning and management of construction resources, and the techniques and methods of effective control.
Part 3 explains how planning is used in practice. Chapter 6 explains the organization of planning, and the way in which plans are developed and shaped to achieve the best balance of resource usage, timely completion and the economical recovery of overhead Costs. Chapter 7 concludes the book with three case studies, which give a detailed illustration of the planning process applied to three actual construction projects.
A simplifying assumption used in the guide has been the USC

of the term contractor. Despite the contemporary diversification of the forms of organizations and contract for civil engineering projects, contractor remains the term which is most commonly used for those who construct civil engineering works. For the purposes of the discussion of construction planning, and to simplify the text , it is also reasonable to regard organizations such as local authority direct labour forces as contractors. Similarly, all design organizations have been called designers.
Richard Neale Loughborough University of Technology
David Neale May Gurney & Co Ltd Norwich

Acknowledgements
This guide reflects the acquisition of knowledge and experience over a considerable period. During this time, both of the Authors have benefitted from discussions with many successful planners and managers who have been prepared (0 share and exchange experiences. Grateful thanks are extended to these perceptive and helpful people.
All three case studies in chapter 7 are taken from real life, and the Authors wish to extend their sincere thanks to the clients of these projects for allowing the information to be published. The Authors wished to write a practical book, and this can only be achieved with the inclusion of real information; and this depends on the co-operation of real people.
Several of the staff of May Gurney and Company Ltd helped in the preparation of this guide , and sincere thanks are due [0:
Jim Holmes, chairman of May Gurney and Company Ltd for permission to use the case study material ; Alan Phillips, chief planning engineer, for the computer examples; Peter Foreman and Ron Abbott for advice on linear programmes and monitoring; and Joyce Wilde , Angela Pearce and Christine Hill for the typescript.

Contents
Part l. Context and strategy
1 Construction planning in context 1 1.1. Planning: the common thread 3 1.2. The project manager 4 1.3. Objectives of planning 4 1.4. Planning and planning techniques 5 1.5. Planning data 6 1.6. Planning in the organization 7 1.7. The cost of planning 8
2 Early decisions 10 2.1. Who is the plan for? 10 2.2. What should be the level of detail? 10 2.3. What should be the time-scale? IS 2.4. The planning hierarchy IS 2.S. Programme duration 15 2.6. Activity and activity duration 17 2.7. Activity duration 18 2.8. Summary 20
Part 2. Techniques, procedures and methods 3 Planning techniques 22
3.1. The anatomy of planning techniques 22 3.2. The planner's tool-kit 23 3.3. Which technique? 2S 3.4. Bar charts 28 3.5. Line-of-balance 33 3.6. Linear programmes (time-chainage charts) 44 3.7. Network analysis 51

4 Resources 74 4.1. Estimation of resource requirements 75 4.2. Resource analysis 76 4.3 Other forms of presentation 80 4.4. Planning for effective scheduling 81 4.5. Scheduling systems 83 4.6. Resource scheduling and people-management 83
5 Monitoring and control 84 5.1. Control of risk 85 5.2. Client's control 87 5.3. The contract programme 88 5.4. Contractor's control 90 5.5. S-curves: the basic tool 93 5.6. Contractors' control curves 95 5.7. Control curve for progress and cost/value
comparison 95 5.8. Cash flow curve 96 5.9. Control curves for labour, plant and equipment 98 5.10. Monitoring progress by key activities and
resources 5.11. Control of materials 5.12. Monitoring line-of-balance and linear
programmes 5.13. Management information systems
Part 3. Planning in practice
6 Putting planning into practice 6.1. Working space 6.2. Initial appraisal 6.3. Early decisions 6.4. Detailed appraisal 6.5. Planning and conferring 6.6. Shaping the plan 6.7. Variations and project control 6.8. Handing over the plan 6.9. The dynamics of project management 6.10. The changing emphasis of planning 6.11. Short·term planning 6.12. Summary
100 100
100 101
103 103 105 105 108 110 III 119 120 121 122 122 124

7 Case studies 125 7. 1. Line-of-balance case study 125 7.2. Linear programme (time-chainage chan) case
study 135 7.3. Network analysis case study 141
References 156
Bibliography 158
Index 159

1 Construction planning in context
This chapter gives a general review of planning, which is the common thread in construction management . The objectives of planning are explained . and a distinction is made between planning and the use of planning techniques. The important role of the project manager. planning in the organization , and the cost of planning complete a review of the organizational comext.
All construction projects require planning and they o[[eo require huge expenditure. They usually require their designers and can· structors to produce something large and unique over a long timescale, in the open air, in a place where few or even no production facilities exist before the project starts. Any manager who docs not plan is no manager: it is a long-established principle that planning is one of the major managerial functions; it is managers who must plan to anticipate and influence future events. Furthermore , managers who do not plan cannot control, because they have no yardstick by which to judge actual progress or expenditure.
The Authors believe that most experienced civil engineers understand the paramount importance of planning, and few underestimate how difficult it can be to do it effectively. This guide aims to assist in making planning effective. The major aspects of construction planning will be reviewed, the techniques expJainw and some practical case studies for illustrations given . Unfortunately, no guide can provide the {wo factors most crucial to effective planning
• commitment of the senior management to making the pLanning function work effectively, and to gaining control ; and, as a consequence

CONS TR UC TIO N PLANNING
• providing sufficient resources to enable the planning function to be effective - especially for the development and motivation of skilled and knowledgeable people.
These factors are entirely the responsibility of senior managers, but once this commitment has been made, then there is a great need for training and the development of knowledge and skill. The Authors hope that this guide will help in this.
Fig. 1. Examples of people and organizations whose activities must be planned and co-crdinated during (a) public sector and (b) private sector construclion projects
2

CONTEXT
I.I. Planning: the common thread The term planning can be applied to the whole of a construc·
tion project , from beginning to end, from inception and feasibility study to final conunissioning and handing over the completed works to the client. It includes the planning of the design as well as the site construction work. One of the most difficult aspects of the early stage of planning is the need to co-ordinate the diversity of people and organizations that become involved, and the necessary activities and processes. Fig. 1 illustrates how planning provides the common and unifying thread j planning is one of the essential activities that must be continuous throughout the life of the project.
The project manager's power to influence the course of the project diminishes as the project progresses and this is illustrated in Fig. 2. As decisions are made, actions taken , designs made and contracts entered into, the project takes a more definite shape and opportunities to make changes disappear. It is clear that the early
H'"
Feasibility study and prchmonary
"''''" Complehon oldestgn
COIlst.uctoon CQf1lracl
Preparatoon olconlract doctJments
M.anagement·rypc ,-!COf1tl3C;t
"-.................. T,ao.bOIlaI
'"'''''''' SrtecoostrucbOtl ........ :---..
',. ____ ~ ____ J-____ ~~~~ __ ~~~
t ProteCldulatoon l Fig. 2. Illustration of lhe reduclion of a projecl manager's in./lun:a on a Projle! as lhe project progresses
3

CONS TRUC TION PLANNING
decisions have far reaching effects, and so must be made in a wellplanned and objective way.
Further into the project, planning the construction work is an activity that will be familiar to most civil engineers, where planning lays the foundation for the control of what is usually the most expensive and fast moving phase of a construction project . The main difficulty here is keeping up to date with the inevitable and Wlavoidable unplanned events that occur, and replanning to achieve project objectives.
Obviously, planning whole projects is a wide and diverse subject, so this guide concentrates mainly on planning for the construction phase of a project - but within the concept of the overall common thread of construction management.
1.2. T he project manager Throughout this book it has been assumed that all projects will
have project managers whose duties will include planning and the management of the planning function. This may seem to be an obvious statement to those readers whose experience is in the site construction phase of projects, where there is always a project manager - although they may use the more traditional terms agent or site manager. Traditionally, the client has appointed an engineer who has acted as the client's project manager in addition to designing the works. In recent years, it has become increasingly common for clients to take a more direct part in the management of their investments, and appoint their own project managers at ,pte inception of a project - often using specialist project management consultants - y.-hose task is to manage for them the entire project from inception to completion and hand over. (This strategy is often known as total project management.) Although this guide has been written principally for contractors, much of it will therefore be relevant to clients' project managers.
1.3. The objectives of planning In general, the main objectives of planning are as follows.
• Analysis which is envisaging how the job will be done, in what order and with what resources; reducing the project, or part of the project, to a number of manageable activities. Each activity should be readily identifiable as a coherent piece of work,
4

CONTEXT
ideally relating to the project management structure and thus under the control of a specific individual.
• l1~~icipalion which is to foresee potential difficulties, to plan to overcome them, and to anticipate risks so that their effects can be minimized. It can be argued that this is the major objective of construction planning, because civil engineering is a fairly high risk business, and the planning of many activities is fraught with uncertainty.
• Scheduling resources to enable optimum use to be made of the available and most economic resources, for each project and - taking all projects together - for the organization as a whole.
• Co-ordination and comrol to provide a basis for co-ordinating the work of the parties and contractors participating in the project, and to provide a basis for predicting and controlling time and cost.
• Production of data to enable planning data to be acquired for use in the preparation of future plans.
These objectives are illustrated in the case histories in chapter 7.
1.4. Planning and planning techniques It is most important to distinguish between planning and the
use of planning techniques.
• Planning is the creative and demanding mental activity of working out what has to be done, how, by when, by whom, and with what, i.e. doing the job in the mind. Plans are not just pieces of paper. Plans represent the results of careful thought, comprehensive discussions, decisions and actions, and commitments made between people and contractual parties.
• Plamling techniques form the planner's tool·kit; they assist in the analysis of the plan, organizing the information, and have a crucial effect on the way in which the plan is communicated to others.
Taken together, these two elements of planning produce the plan: a strategy and tactics for the execution of the project, in terms of activities, time, quantities, resources, and perhaps costs and values. The plan is expressed as charts and reports and forms the basis
5

CONSTRUCTION PLANNI NG
Data sources
Books and magazines
Planning output
Manufacturers ' titerature h> Personal experience O1her peoples' experience Planning Companydata (,black books') (doing the job
~!~~=;~sdocuml!flts r----~ inthemind) ,
R,,,,,,, Programme
Method statement
Resource schedule
Cashrlow diagram
Planning
Fig. 3. The planning process
Resource histogram
Communicating
for communicating what has been planned. This process is illustated in Fig. 3.
The importance of this distinction between planning and the use of planning techniques is that it is clear that planners cannot plan without managers; without managerial involvement planners are reduced to theorists. The professional specialist planner 's task is to provide the analytical skill, technical knowledge and basic data which will underpin the managerial planning process, It is the manager's task to plan; that is, to decide on strategies and tactics, to break down the work to be done into tasks and subtasks, and to assign the responsibility for completing these tasks to individuals or organizations. The programme of work is only as good as the quality of the planning. Thus again the vital role of management in planning is emphasized, a role that cannot be delegated to 'the people in Planning and their computers',
1.5. Planning data Planning depends on data. Without reliable and relevant data,
planning can only process best guesses (although this can be better than no planning at all) . Fig. 3 illustrates the way in which data are used in the planning process, and typical outputs.
6

CONTEXT
As each construction project is different, it is difficult to make an accurate prediction on the likely duration of the design and construction activities. Therefore, all projects are a learning process for the project management, and this learning should enable more accurate predictions to be made as the project progresses. These new data can be used to refme or revise the plan. As more accurate data are acquired, it becomes possible to plan at a level of detail that would have been quite unrealistic at the start of the project.
An additional factor is the availability of data which have been assembled for purposes other than planning; for example, in a design office, monthly or weekly time sheets are used to cost engineers' time to projects, but these same time sheets may also provide useful data for planning.
1.6. Planning in the organization Planning is part of the job of most civil engineers, but in many
organizations there is a clear role for the specialist planner. This is especially true of the contractor who obtains work by competitive tendering. With a tender success rate of one in six or less, drawing up tender plans has to be cost-effective. The planning techniques described in chapter 3 can be mastered reasonably easily, but it takes familiarity and practice to use them with speed, and only specialists can develop this skill.
Fitting a specialist planner into an organization requires careful thought. If the planner's work is to have value, those who have to implement the plans must believe in them. The planner must gain the respect of those whom he or she serves; the planner's work mUSt be realistic and credible; and the planner must be co-operative and have the ability to work well with other people. The most brilliant plans will fail if the planner has not incorporated the ideas and wishes of the project manager and the rest of the project team in the plan, but obtaining this infomation from busy people requires considerable skill and persistence. Thus personality is an important factor to be considered when appointing a planner.
Within an organization, benefits may be gained by grouping planners together to form a service department . This will result in a uniformity of approach and presentation that will make the OU1-put easier to comprehend by those who use it. Additionally, the formation of such a department will facilitate the compilation of
7

CONS TR UCT I ON PLA NN I N G
planning data, allow bener use of expensive computer installations, and enable a training programme to be more easily maintained.
The one disadvantage of creating a planning depanment is the risk of creating a them-and-us relationship between planners and implementers. Thus even though the planner may be based in an office remote from the work itself, every effon must be made to ensure that the planner is treated as part of the project team. Planners must make a very positive effort to keep in touch with the realities of construction project management. Senior management must provide the means for them to do it, accepting the travel and other costs as an essential part of the planning process.
1.7. The cost of planning For any project or firm, a decision has to be made on the size
and cost of the planning function. Clearly, the employment of large
o
Oirect costs and planning costs
/ Saturation planning Al though planning input beyond this point may continue to reduce direct costs. the overall project cost will begin to increase.
2 3
Direct project cost
Cost of planning
" Planning input as a percentage of construction cost
Fig. 4. Planning input as a percentage of construction cost. In this example saturation planning occurs when planning input is about 3% of total construction cost
8

Table 1. The cose of planning
Activity
Petrochemical and process industry projects with frequent design changes, requiring full -time on-site planners.
Multi-disciplinary industrial projects, complex civil engineering projects.
Fully designed projects with few postcontract changes.
CONTEXT
Planning cost/(Otal project cost: %
2- 4
1- 2
0-5
numbers of planners cannot in itself ensure against project over~
run and overspend. There must be a point for every project when further spending on planning brings no saving in project cost, but instead merely adds to the overheads and therefore increases the total cost (Fig. 4). This saturation planning begins at the low point (X ) of the total cost curve. Table 1 suggests a range of values for sensible spending on planning, derived from experience rather than theory. The range of figures given reflects the nature and complexity of construction projects.
To put these costs in context, a civil engineering contractor bidding keenly for a project may tender with a net profit margin of 2-4%; that is, the expected profit is of a similar size to the expected planning cost.
9

2 Early decisions
Decisions made early in a project often have a profound influence on the success of later activities . This is especially true of project planning. Before starting to prepare any plan, it is vital to establish who the plan is for, what level of detail is required, and its time-scale. It is essential to give careful thought to establishing this strategic framework before starting on the planning in more detail.
Planning is a difficult and time-consuming process, and early decisions on the way in which a particular plan will be made can have immense influence on the efficiency of the planning process. It is the Authors' experience that one of the skills that makes a project manager effective is the ability to set up the project properly at the beginning; certainly the Authors' experience is that projects were more successful when they had learned from experience to identify where the major problems would occur, and how to plan around them. This chapter discusses these major, early decisions.
2.1. Who is the plan for? As in all management activities, it is essential to identify the
target. Substantial construction projects can generate enormous quantities of information, and the planner must make an objective selection. Table 2 lists the people who may require or prepare a construction plan, summarizes what they will want or need to know from it, and gives appropriate time-scales.
2.2. What should be the level of detail? When first confronted with the need to plan, it is the Authors'
experience that most engineers will try to do this in great detail ,
10

EARLY DE C I SIONS
making a plan that represents reality as faithfully as possible. This would be fine if the planner could be more or less cenain that the plan would work Out exactly as intended, but in practice this rarely happens. Apart from a human's obvious inability to predict future events with ce rtainty and in detail , it is obvious also that for each individual to plan in this great level of detail, at the beginning, would create the most unmanageable co-ordination problem. The quantity of information would be truly amazing, the confusion profound . In fact, it may be easier to just get on and complete the project!
Figure 5 illustrates how the level of detail may be related to the needs of the task in hand. The outer frame represents the whole plan: this would show every detail for every activity in the project, for every profession and trade. What the project manager and planner have to do is to decide on the required size and shape of the planning window for each of a number of plans which will serve different purposes. Thus Fig. 5 shows that the clients are usually more concerned about overall results than detailed methods and
Foreman·s weekly The ouler Irame; lhe lheorel lcal lully programme detailed complete programme
Time Clienrs master programme
Fig. 5. Derennining (he size and shape of ehe imler planning frame or window
11

Table 2 Who is the plan for")
Plan drawn up Primary Scope of plan Scope of Time- Unit Level of purpose programme scale detail
Fo, By of plan
Central Project Administrative A project overview from identifica- Outline Entire Month Low government director planning tion of need through feasibili ty project project Loc,] study, prcliminary design, (public programme govcrnment inquiry), detail design, land acquisi-Public tion, preparation of documents, utility construction period , maintenance
~ period to adoption.
Private sector Project Financial A project overview from pro ject Outline Entire Month Low industrialist or director planning conception to production and project project entreprencur payback, including appointment of programme
consultant/management contractor, design and documentation periods, construction, process installation, commissioning, trial production, full production.

Project Project Co-ordination Design period, documentation , Outline and Project W«k Low/medium
"""'<" .,."..., of design and letting contracts, construction and brood design and construction mainK'lanCe periods, details construction
commissioning.
Contr-.ctor Contractor 's Tender plan All activities within construction Construction Construction W«k Medium
".rr period in sufficient detail to enable programme p<riod contractor to prepare the tender and particularly to price the preliminaries.
~ Working plan A reassessment of the tender plan
with more detaiL
~ The Engineer Contract plan An official version of the working (el . 14) plan to satisfy the conditions of
contract requirements.
Contractor Contractor's Resource Every activity, major items of plam , Short-term 6- 10 weeks D,y Mediumlbigh Subcontractor staff planning dates of key material deliveries and programme Engineer's movement of subcontractors. Representative
Foreman Comractor's Detailed Every operation (part of activity) Weekly 1- 2 weeks Halfday High Tradesman staff disposition of with the actual piam, manpower programme
of plant and and supervisors employed . manpower
C ON S TR UC TION PLANNING
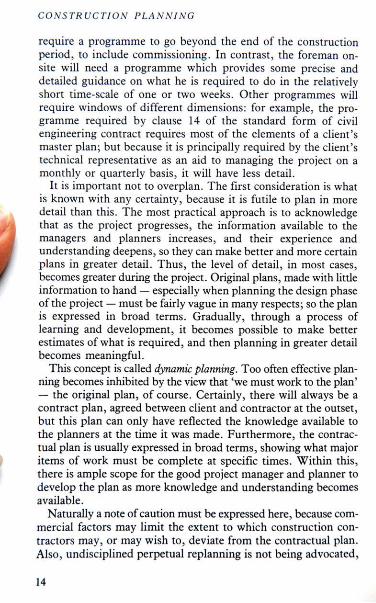
require a programme to go beyond the end of the construction period, to include commissioning. In contrast, the foreman onsite will need a programme which provides some precise and detai led guidance on what he is required to do in the relatively short time-scale of one or two weeks. Other programmes will require windows of different dimensions: for example , the programme required by clause 14 of the standard form of civil engineering contract requires most of the elements of a client's master plan; but because it is principally required by the cl ient 's technical representative as an aid to managing the project on a monthly or quarterly basis, it will have less detail.
It is important not to overplan. The first consideration is what is known with any certainty, because it is futile to plan in more detail than this. The mOSt practical approach is to acknowledge that as the project progresses, the information available to the managers and planners increases, and their experience and understanding deepens, so they can make better and more certain plans in greater detail. Thus, the level of detail, in most cases, becomes greater during the project. Original plans, made with little information to hand - especially when planning the design phase of the project - must be fairly vague in many respects; so the plan is expressed in broad terms. Gradually, through a process of learning and development , it becomes possible to make better estimates of what is required, and then planning in greater detail becomes meaningful.
This concept is called dynamic plarming. Too often effective planning becomes inhibited by the view that 'we must work to the plan ' - the original plan, of course. Certainly, there will always be a contract plan, agreed between client and contractor at the outset, but this plan can only have reflected the knowledge available to the planners at the time it was made. Furthermore, the contracrual plan is usually expressed in broad terms, showing what major items of work must be complete at specific times. Within this, there is ample scope for the good project manager and planner to develop the plan as more knowledge and understanding becomes available.
Naturally a note of caution must be expressed here , because commercial factors may limit the extent to which construction contractors may, or may wish to , deviate from the contractual plan. Also, undisciplined perpetual replanning is not being advocated,
14

E AR L Y DE C I S I ONS
but the systematic deve lopment of broad strategic plans to greater levels of detail. Of course, complete revisions are sometimes necessary when there is a substantial change of design or projec t management strategy, but these are major exercises and should not be undertaken without well-proven need.
The concept of dynamic planning is central to the use of computer-based planning systems. If the intention is to prepare only one plan, at the beginning, it may be easier and quicker to do it by hand. Computers are beneficial when plans are developed in more detail as the project progresses, when new well-presented output can be available inunediately after each revision. Computers are almost essential for systematic monitoring, for similar reasons.
2.3. What should be the time-scale? The time· scale is most important , and is not just a question of
choosing months or weeks or days or hours, solely with regard (0 the necessary level of detail. The process of control and fre· quency of monitoring used by the firm , or specified for the pro· ject, should be the first consideration. This will be explained in more detail in chapter 5. Fig. 6 illustrates some plans and suggests appropriate time-scales, which are related to Table 2.
2.4. Planning hierarchy In practice, plans are prepared on an hierarchical basis, with
a plan at a particular level of detail being expanded to greater detail as the execution of the work becomes more imminent. It is only in this way that all plans will be consistent. Table 2 illustrates such an hierarchy of plans.
2.5. Programme duration Obviously, programme duration is one of the most important
early decisions. There are two ways to determine how long the project will take
• it is imposed by external considerations of the time available or allowable, and the designer or contractor then has to devise a plan to mect this requiremcnt , or
• it is built up from a detailed analysis of the work to be done and the resources available, using estimates of the time required for each specific activity.

CONS TR UC TI O N PLANNING
Ganger's daily
/ schedule
Siteloreman's ___ weekly
High '"
programme
(day/hOllrs) 12 week 'look-ahead" 1--- ---, __ constrllction
'" '" programme
~ .. ~ Medillm
(weeks)
Clause 14 .. ~ construction
'" programme
I-------~ Overall financial programme
Low (mOrlthsiquarter) "'-/
o 1 7 30 '" 300 Programme dllral ion: days
900
Fig. 6. R elationship between duration and level of detail; e.g. a programme fo r a foreman may be one day in duration bur require every hour in Ihe day w be accounted for, whereas a programme for a financier may cover three years but require an assessment every three months
Examples 1- 3 are examples of externally imposed considerations. Examples 4 and 5 are examples of durations built up from a detailed analysis of the work to be done and the resources which are available.
Example J: Earthmoving weather window In many regions of the UK it is unwise to attempt bulk earth
moving using scrapers between October and March. If, for example , it is required to move 400 000 m3 of earth starting on 1 August, the weather constraint dictates that this must be completed in twO months. So with scrapers capable of moving, on average, 20000 m3 per month each, 10 scrapers will be required. This is a large number of scrapers, and special measures may have to be taken to allow them to work effectively on anything but a large site .
16

EARLY DE C I S I ONS
Example 2: Summer pavi',g windO'W In the UK, concrete highway paving with contraction joints is
only permitted between 21 April and 21 October.
Example 3: Cfiem's cmlSlraims The client may often
• have an economic need for fast construction; for example, the level of turnover and profit from a large retail store usually justifies quite considerable expenditure on methods to achieve rapid construction.
• require a project to be constructed in stages, for economic or practical reasons; for example, to spread the cost of a large development over a longer period, and to generate income from the completed stages to help finance the remaining work; or to rebuild an existing sewage treatment works while keeping it in operation.
• require work to be done during a factory holiday shutdown.
Example 4: Duration derennined by the output 0/ a major resource It is often the case that the output of a construction operation,
or a complete project , is determined by the output of a key item of plant ; this is most common in dredging , pile driving and road building.
Example 5: Duration detennined to achieve minimum cost In many cases, contractors use recorded data on the method and
output of similar operations completed in the past to assess the combination of resources most likely to complete the work at minimum direct cost. The duration of the operation is then calculated from the volume of work to be done in this way.
2.6. Activity and activity duration Although what follows is not part of the early decision-making
process described earlier in this chapter, the reader should not proceed to chapter 3 without a clear understanding of what is meant by activity and activity duration. .
The four planning techniques described ~ chapter 3 ~ reqUlre projects to be analysed and broken down mto converuent work
17

CO NS T R U C T/ ON P LANN I NG
units or activities. The scope or work content of each activity is, of itself, not imponant . What is imponant is that the planner must be able, with the planned resources, (0 decide how long it will take to complete. For example, an activity for a bridge project might be
• Construct pier foundation: duration 10 days.
An equally valid activity might be less encompassing:
• Fix formwork (0 pier foundation: duration 2 days.
Providing that the planner understands the meaning of the activ· ity within the project and can determine a duration for the activ· ity, it may be as large and embracing, or as small and detailed, as the planner wishes.
2.7. Activity duration As part of a large stormwater drainage project, consider an
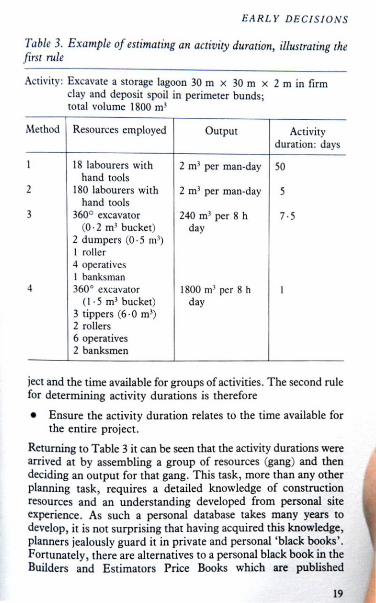
activity for constructing a water storage lagoon by excavating 1800 m3 of firm clay and depositing it around the excavation to form a bund. Table 3 gives four construction methods for carrying out this activity with durations varying from one to SO days. As every method is valid, which one should the planner select?
When faced with such a decision the first rule to follow is
• Choose an activity duration based on the most economical and appropriate use of resources.
If the storage lagoon is located in a country where unskilled labour is abundant and inexpensive, methods 1 or 2 will be economic and appropriate. The choice between the extremes of five and SO days will depend on the urgency of the project as a whole. If the storage lagoon is in a country where labour is scarce and more expensive it would be constructed by a method somewhere between methods 3 and 4. In this case the plant used would be considered in relation to the other plant likely to be on site. The large excavator called for in method 4 would only be used if such a machine was already available on site or the need to save time exceeded the need for economic operation.
From this example it may be appreciated that individual activ· ity durations must also be related to the time available for the project as a whole. Table 4 suggests a logical sequence of examining a pro· jecr to establish a general understanding of the urgency of the pro·
18
E AR L Y DEC I S I ONS
Table 3. Example of estimati,lg all activity duratiml, illustraIillg the fil'sl mle
Activity: Excavate a storage lagoon 30 m x 30 m x 2 m in fi rm clay and deposit spoil in perimeter bundsj total volume 1800 m3
t\lethod Resources employed OUtput Activity duration: days
1 18 labourers with 2 m1 per man-day 50 hand tools
2 180 labourers with 2 m1 per man-day 5 hand tools
l 3600 excavator 240 m1 per 8 h 7-5 (0 ·2 mJ bucket) day
2 dumpers (0 ·5 rnl) I roller 4 operatives I banksman
4 360 0 excavator 1800 rn l per 8 h 1 (1 ·5 m1 bucket) day
3 tippers (6 ·0 m3)
2 rollers 6 operatives 2 banksmen
ject and the time available for groups of activities. The second rule for determining activity durations is therefore
• Ensure the activity duration relates to the time available for the entire project.
Returning to Table 3 it can be seen that the activity durations were arrived at by assembling a group of resources (gang) and then deciding an Output for that gang. This task, more than any other planning task, requires a detailed knowledge of construction reSOurces and an understanding developed from personal site experience. As such a personal database takes many years to develop, it is not surprising that having acquired this knowledge, planners jealously guard it in private and personal 'black books' . Fortunately, there are alternatives to a personal black book in the Builders and Estimators Price Books which are published
19

CONSTRUC T/ON PLANNI NG
Table 4. Estimating durati01!
I. Identify constraints imjX)sed by the client , e.g . overall project duration, availability of site , stages of construction.
2. List constraints imposed by third parties , e.g. timing of road and services diversions, limited hours for noisy operations, access for heavy vehicles.
3. Note the weather windows. 4. Note the public and industry holidays . S. Decide on the method of construction: this will provide the broad
strategy, the major items of equipment and other resources. 6. Determine the durations of the principal operations. 7. Fit in the remaining operations to achieve the best use of resources .
The first five steps will usually have divided the project into a number of sections. This will enable these sections to be planned in detail more realistically.
annually. I-3 Other sources of resources output information are given in references 4-7. Table 4 can be used as a check-list or as the basis for a graphical method of duration examination using the planning techniques described in chapter 3.
There is one further point to make about the determination of activity durations, namely to use output rates that reflect average performance and allow for all the non-productive operations, human fallibility and the constraints of weather and workplace; e.g.
• for plant items: refuelling, maintenance, breakdowns
• for humans: sickness, tiredness
• weather: rain , low ·temperatures
• workplace: tidal work, confined spaces, hazardous sites.
2.S. Summary Early decisio,ls
Before staning to prepare a plan, consider the following questions
• who is the plan for ?
• what should be the level of detail?
• what should be the time-scale?
20

EARLY DE CI S IONS
Project duratioll Can the project duration be decided on by the planner or will
it be imposed by external considerations?
Activities When flXing activity durations use the most economic and appro
priate resources, ensure they relate to the time available for the entire project and use average output rates.
21

3 Planning techniques
Four techniques are used commonly in construction planning: bar charts, network analysis, line-of-balance and linear programmes. This chapter explains how these techniques are used, and gives guidance on selecting the right technique for the job in hand.
Chapters 1 and 2 have laid the foundations for construction planning. The next two chapters describe the techniques used by the professional planner. This is the planner ' s tool-kit. As with all tools they must be used intelligently, and sometimes adapted to overcome a specific and unusual problem. The Authors ' experience is that good planners are inventive people, and they can create custom-built techniques to suit specific problems and circumstances. This is as it should be, and it is not the intention that the techniques described in this guide should be applied rigidly, in exactly the way described. The reality is that there is a whole family of techniques, and variations of techniques. Obviously some logical rules have to be observed, and consistency of application and presentation is essential , but within these requirements there is much flexibility.
3.1. The anatomy of planning techniques Before describing planning techniques in detail , it is useful to
look at the components that form the tools in the planner 's tool· kit. Most planning techniques aim to express the work to be done, to a time-scale; some also include resources, and perhaps cost and value. In simple terms, they aim to help control time and cost. The other major factor in project control, quality, is controlled by its own family of control techniques; and quality is related to time and cost through the skill and judgement of the project manage-
22

PLANN1NG TEC H N 1QUES
men( team. The major components of planning techniques are
• activities: liter~ly , being busy, expending energy, consuming re.sources, taking time; in construction planning, this means a job to be done; for example preparing a drawing, an order to be placed, a hole to be dug , bricks to be laid in a wall , a flow of water to be diverted .
• activity durations: the time required for the completion of each activity.
• project time-scale: the time structure of the project; it is usual to give each week in the project a number (this makes calculation easier), and these then have to be related to calendar dates, holidays, etc.
• event: an occurrence at a specific point in time; for example, the granting of planning consent, or the start or end of a traffic diversion.
• work method: the plan must be expressed in some logical way, indicating the sequence of operations, and which activities and events are interrelated; this may be implicit (as with bar charts) or explicit (in network analysis, where work method is usually called logic),
• resources: often called the four Ms (men, machines, materials, and money) but can also include overheads (for example, site accommodation), and even such essentials as managerial skill .
• costs: what the work has or will cost , often derived directly from the unit costs of the individual resources.
• value: what has or can be earned by payment for work done derived from the bill of quantities, the estimate or an internal budget. The calculation of value-to-date can be used as an overall measure of project progress.
3.2. T he planner's tool-kit The main tools are the bar chart , the line-of-balance, the linear
programme and network analysis. There are other tools, such as physical models in twO and three dimensions, and computer models.
23

CONS TR UC TI O N PLA NN I NG
The bar chan The bar chart is everybody's favourite. It is easy to draw, easy
to understand, and not too searching of managerial skill ; it is best used for straightforward, well·understood construction work, with simple relationships between the activities. This graphical technique still forms the basis for most resource scheduling. Qae of its main disadvantages is that changes in plan require extensive redrafting.
Lim!-of·balance Line-of-balance is a specialized technique for repetitive work.
It was derived from manufacturing industry, and has been found to be effective in planning work that is truly repetitive . Examples of successful applications include planning the construction of identical floors in high rise construction, and large housing developments. The ftrst case study in chapter 7 is a low-cost housing scheme in a developing country, for which the construction of a large development of identical houses was planned using line-of-balance.
Line-of-balance has been found to be difficult to use on projects which require a large number of trades or operations 10
construct each identical unit . The problems arise not from the technique itself, but from the difficulty of showing all the information on one chan, especially when using the technique to monitor progress. When used to plan, it can be an excellent means of relating resources, activity durations and the general pace of work on site.
Linear programme (or time-chainage chan) Linear programming is a specialized technique for linear work.
This is a basic tool of UK road contractors, and the second case study in chapter 7 shows the use of this technique to maximum effect. Other successful applications include the construction of a large canal in a developing country, and it is especially useful in tunnelling.
Like line-of-balance, this is a simple two-dimensional graphical technique and can show clearly only a limited amount of information and a limited degree of complexity.
Network analysis Network analysis is a powerful , logical and analytical technique.
It is most effective when used for complicated projects, especially
24

PLAN N I NG TE C H N I QUES
those with external constraints and complex interrelationships. The technique is based on drawing the logical relationships
between construction operations, and - from an analysis of the relative durations - establishing which operations have the most crucial effect on the project duration. It can be drawn in a number of ways, the most well-known in the UK being the arrow diagram. The technique is sometimes known as the critical path method (CPM), and critical path analysis (CPA). A version which incorporates a statistical method for calculating the probability that a project will be completed on a specific date is called the programme evaluation and review technique (PERT).
Network analys is has a good and comprehensive logical basis, lends itself easily to computer processing, and can be used as an effective control tool. These excellent characteristics are also its principal weakness, because it is easy for the planner to be drawn into a level of planning and analysis that is much 100 detai led and advanced for most construction projects.
3.3. Which technique? Like any other professional, the planner has to selec t the right
tool for the job. An engineer does not use a theodolite to take levels! He could of course, but he would be using a tool that was unnecessarily sophisticated for the task in hand. Similarly, a planner does not use network analysis for a simple job. Similar analogies can be drawn between the more specialized survey instruments (such as vertical plumbing devices) and linear programmes and line-ofbalance; these do a special but limited job very well.
Figure 7 is a planning technique selection chart. It will be noted that sometimes the client requires the use of network analysis, often for good reasons of his own, in which case the contractor' s choice is more limited. Nevertheless, specialized techniques may still be used where required, and integrated into a master network programme in the ways described in section 3.7.
It is of fundamental importance to note that the level of detail of the plan and the choice of tech11ique are related . For example, the overall programme for a large and complex industrial project should be drawn as a network (as indicated in Fig. 7). Suppose that one activity on that programme is 'construct road '; obviously this is fine at this level of detail , but what technique should be used by the engineer who has to plan the construction of this road
25

CONSTR UC TIO N PLANN I NG
No
No
NO
NO
Use network anatysis rorthe master plan
Use hne·ol·balance
Usea bar chari
'------1 Use netwotkanafysis
Fig. 7. W'hich planning technique?
in more detail? Of course, a linear programme should be used. Failure to recognize this vital principle has caused great problems in the past; for example, where firms have adopted a policy of using network analysis for everything, only to fmd that it does not work too well for the construction of a road - and the engineer in charge of the road then concludes that network analysis does not work! For this reason , Fig. 7 asks questions about the job, not the pro· ject; the job is the work to be planned, at a specific level of detail .
Table 5 summarizes the characteristics of the techniques, and the basic principles of the techniques will be described in the foUow· ing sections.
26

Table 5 The pla,mer's lool-kit
Technique Planning uses Programme uses Progress control use
Bar chart Simple projects Good communicating tool Absense of explicit logic Universally understood relationships Limits usefulness In common use Tedious to update manually Good basis for resource scheduling Most computer systems give bar
chart from network
Line·of·balance Repetitive work Good communicating tool Useful planning tool (houses, precast Demonstrates trade interference Difficult to show a lot of concrete production , detail clearly multi·storey Illustrates general pace of buildings) work and trade intereference
Linear programme Linear products Good communicating tool Useful planning tool (highways, tunnels Demonstrates interrelationship Progress shown easily if plan railways, viaducts) of sequential operations kept simple
Network analysis Complex projects Poor communicating tool in Powerful control tool Management contracts network form especially for large numbers Design management Usually converted to bar chart of contractors
for general use Forms basis of most computer systems

CO N S TRU C TION PLANNING
3.4. Bar charts Basic bar chart
As a means of planning, programming and communicating, the bar chart is hard to beat. It is simple in concept , easy to construct and equally easy to understand; it is hardly surprising therefore that it is the most widely used technique in the planners' tool·k.it.
Figure 8 shows part of a bar chart for a factory extension. The activities are listed down the left hand side, the time-scale is drawn horizontally and the bars represent the time when work will proceed on the activities. It is usual, although not essential, to list activities in their planned chronological order of performance; this gives a diagonal pattern of time bars across the chan which provides an added visual stimulus to the representation of progress.
The basic bar chart is an excellent means of relating activities to time; however, as a planning technique, it has a number of shortcomings
• it does not show relationships between activities
• it does not indicate the rate of progress within each time bar
Time: weeks
No. Achvlt~ , , 3 • 5 6 7 , 9 " " , SteelwQfk shopdrawongs , Structural steel labncallon
3 SUUC1ural steel
~ galvanizing
• 51:11 up s< te and pOlIng
5 ~c. and blind lislab drai~
6 &eakclown poleheads
7 PIlecapsand eogebeams , Ground slab andctlanoels
9 Erect structural ~ ;:m "..-"
Aoohngand .....,
Fig. 8. Basic chart for a factory extension
28

PLANNING TECHN IQ UE S
• it does not relate activities to location .
To overcome these shortcomings several variations to the basic bar chart have been developed. They are the linked bar chart ; the moni toring bar chart ; and the subdivided bar chart.
Li11ked bar chart Figure 9 shows a bar chart where the planner has linked the
horizontal time bars with vertical lines (links) to indicate the construction logic. For example, the link between activities 9 and 10 is in effect a statement that 'the roofing and cladding cannot begin until the steelwork erection is complete '. This is so obvious that the link is almost redundant , but the logic connection between activities 3 and 9 may not be quite so obvious and without that link the site manager might have thought he was free to start activity 9 earlier by overlapping it with the preceding activity .
The addition of links makes the bar chart a more practical technique for site use, particularly when it becomes necessary to revise the programme. A delay in activity 2 of one week due to late production of shop drawings will also delay activities 3, 9 and 10 by
T,me weeks
'0 AChv,ly , , 3 , 5 6 , 8 9 " " , SleelwOl~ Shop(l.aw,ngs , SI'UClu,al sleel lat:mcal,on
3 SUuctu'al sleel galvan'l'''9
• Sel ups,leand
"'''' 5 E.c. and blind
..... slab Cra'ns , B<eak (lown Dllel'lea(lS , P'le caps,and edgeDeams
8 G'OIJndslab and ch~nnels
9 E'ecls lr yClu'al sleelwo,~
" ROOlongand ctaoaong
Fig. 9. Linked bar chan for a factory extension
29

CO NSTRUC 1'fON PLANNING
one week and extend the overall project time. Without the links the significance of the delay to act ivity 9 might not have been so obvious. The addition of links to express construction logic works well when the time bars can be plotted diagonally across the diagram and when the project is straightforward. As shown in Fig. 7, for complex projects it is generally bener to use network analysis, but bar charts can then be drawn from the network for communication purposes.
A further enhancement is the cascade. By means of a mathematical sorting technique , activities can be printed as chains of bars with similar values of float, those with least float being printed at the top of the chart (float will be defined in section 3.7.) This gives the characteristic cascade appearance, as sequentially linked bars progress across and down the chart, as in a cascade of water. The clever trick is to avoid depending links crossing over excessively, which would make the diagram very difficult to interpret. This is a tedious process to analyse by hand, and cascade charts are usually done by computer systems. The advantage, of course, is that the ordering of a bar chart into activities of progressively less criticality, focuses managements' minds on the vitally important issues.
M onitoring bar chart In addition to indicating an intended programme for the pro
ject, bar charts can be used to monitor progress by showing a second bar drawn for the actual dates worked. For accurate monitoring, this second bar is only oflimited help, because it shows only when work was proceeding on the activity. Looking at Fig. 10, one may only deduce that the activity has started; it is impossible to see how much has been done or whether progress on the activity is behind or ahead of schedule. By the addition of expected and actual percentage completions, as shown in Fig. 11 , a more accurate estimate of progress may be made. Chapter 5 deals in more detail with the mechanics of the monitoring progress; the purpose of introducing monitoring at this stage is to acquaint the reader with the format of the chart.
S ubdivided bar chart There are certain types of projects, particularly those where the
work is spread out, where the planner might fmd it useful to relate
30

PL ANNING TECHNIQUES
~Programme BRIDGE N O .
~Progress PROGRAMME
Activity Date
Wee< I 2 3 • 5 6 7 • 9
Excavate pier -I
~ foundation
2 Concrete ~ foundations
3 Fix column
I lormwork
6. Time now
Fig. 10. Hm.u much progress has aceivity 3 made?
~Programme
~Progress
Activity
Excavate pier foundation
Concrete IOUMations
Fix column lormwork
"
Each square denotes t 0% completion
BRIDGE NO .
Fig. J J. At firse glance activity 3 appears to be 66% camplelt. In/ocr ic is only J 0% comp/eee, bur has used up 66% 0/ che rime allowed. Ie is chere/ore 56% behind programme or about I ti weeks lace
31

CO .VS T R UC TION PLANN I NG
-
r TemporarYlornt:l:t..l
JacKs - rl \ f,-\ _ Military _~
Irestllng W , 1\
Span 1
ACslabdeck
Span2
_ Brrckplers and abutments
Span 3
Fig. 12. Cross-section of road tnJer rail bridge showing temporary works for jackh'g supersrrocture
the time bars to the location of the work. One way of doing this is to subdivide the activity list into sections as in Figs 12 and 13. This works quite well for this bridge reconstruction where the piers divide the structure into obvious sections.
Management structure is another basis for subdivision. If the activities are grouped into sections which correspond to the division of responsibility on the project, the person in charge of each
Activity Week , 2 3
Excavate road at bearings ~ Make temporary joints
Span t Erect military trestl ing .~ lor jack platforms
Jack span and renew 1 ;~~~:, 1'iI bearings
Reposition treslling ~
Span 2 Excavate road at bearrngs -Make temporary jOints
Jack span and renew ·Road ~ beanngs closure
Fig. 13. Bar chart for superstrocture work; activities are subdivided according to spans
32

PLA N NI N G TE CHNIQUES
section can obtain most of the information required from just one section of the chart.
Good praClice Even though bar charts are simple, they will be more useful if
planned and drawn with care. The draughting process can be made easier by providing good standard bar chart blanks with faint guidel ines for planning and monitoring bars. Each organization will have its own special requirements for standard sheets, but generally for detailed project planning the sizes shown in Table 6 should be suitable.
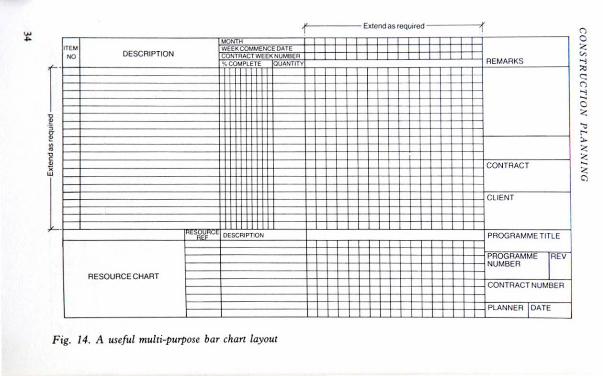
It is common practice to leave a space at the bottom of the chart which can be used for resource aggregation (chapter 4) or monitoring (chapter 5). Fig. 14 shows a useful multi-purpose layout for a bar chart suitable for these purposes.
3.5. Line-of-balance Basic pn·nciples
Line-of-balance is used to plan the construction of a number of similar items. The technique is used to analyse the application of labour and plant resources to ensure that each resource can progress from one item to the next in an orderly way, completing it s Own work on all the items without being delayed waiting for preceding work to be completed. Thus the technique aims to keep all the resources in balance, each following the other productively and having a clear run of work.
The basic principles of the technique will be described using as an example the construction of ten similar) simple houses. The house is shown in Fig. IS. The more practical and detailed aspects of line-of-balance are explained in the first case study in chapter 7, which is taken from a real project.
Table 6 Standard bar chart sheet sizes
Sheet size Number of Divisions Purpose activities
Al extended 60-80 104 weeks Construction programme AI 60-80 52 weeks Construction programme A3 30 13 weeks Detailed look ahead A4 10 14 days WeekJy programme
II
I"" I"" oeSCRIPTION ~,
RESOURCE CHART
Fig. 14. A useful multi-purpose bar chart layout
~f---- Extenctasfequned'-------,<'r
I REMARKS
JCU ENT
_"TLE
IHOY
" ' ''OMO''
I PLANNER 1 DATE
Q
"

PLANN I NG TECHN I QU E S
Activiries Figure 16 shows a simplified plan for the construction of one
house. The ac tivities are
• construction of foundations (activity I)
• construction of walls (activity 2)
• construction of roof (activity 3)
• provision of services, stage I; usually called first fix (activity 4)
• application of wail , floor and ceiling finishes (activity 5)
• completion of services: second fix (activity 6)
• external works : drainage, fencing, etc. (activity 7).
woo 15002000
11 10002500 8000 .
i I 1 I I i
~ T;::: -- -~ ~~~::--- ----='l
~
~ ~
~
I' ' I I: : I
I ' I I' , I, : I I I I
I: : I I: I I'
8 I ,I 8 ~
I ' I I I I L
Fig. 15. House used to explain line-oj -balance technique
lS

CONSTRUCTI ON P L A NN I NG
~ " 5 ,
~ ~ • • ~ ~ • e • ~ 5 ~ ~ ~ 8 ~ ~ ~ ~
, ~ ~ • ~ • " m ~ m w m w m w
Activity 3 , n ! OuraltOn 5 2 , 6 3 , 2 ,
0 ,
,'2 , ,
2~ , , , , ,
" 20 2'S 32 36 " " Working days
F ig. 16. Plan of work f or one house
These activities coincide with the division of the work between the building trades. The main objective of using line-of-balance is to make optimum use of resources. To facilitate this it is important that the activities and resources are related closely; i.e. the job is planned on a trade basis.
ACliv ilY durarions The activity durations are estimated from an analysis of the work
to be done, and are shown in Fig. 16, expressed in working days.
P rojeCl lime-scale Section 2.S explains that project duration may be either imposed
by external considerations, or built up from a detailed analysis of the work to be done and the resources available; or by a combination of these considerations. In this example, the initial plan will be prepared on the basis of making best use of resources. In the first case study, the use of resources is important but also the project must be completed quickly.
W ork melhod - lhe plan In construction work, estimates of activity duration cannot be
anything other than approximate . In repetitive construction where the activities and trades follow in sequence, any delay in the planned completion of an activity will result in following trades waiting unproductively for its completion. Therefore it is prudent to make some provision for late completion by planning a short delay or buffer between each activity. The estimate of buffer times is related
36

PLA NN I NG TECHNIQUES
to the project manager' s assessment of thi)reliability of the estimate of ac tivit }' duration; where the reliabilit y poor, large buffers must be used.
The plan for this example project assumes that only one trade will be working on a house at any time, so the work plan given in Fig. 16 shows a simple linear sequence. In practice, this strategy may result in the planned project duration being too long , and there may be a need for several trades to work on a house simuhaneously; this more complex application of line-of-balance is illustrated in the first case study .
The obvious choice of resources will be (Q employ just one gang of each trade, SO each gang will work on every house. Fig. J 7 shows this progression for activity I, followed by activity 2, and then by activity 3: this illustrates the problem that the line-of-balance technique is designed to solve. Activity 2 will proceed at a slower pace than activity I , and this in turn will halt work on activity 3, because the roofers will be ready to start work on the third house before the walls are finished. This problem is called interference and is fundamental to scheduling repetitive work. Of course, in practice the interference problem may not manifes t it se lf in this way; if tradesmen cannot see work available for them for some reasonable period ahead, they may simply work more slowly -and so cause even more problems later on in the project. This is one reason why projects become more difficult to manage as they progress, and is why careful planning and con trol will be beneficial.
" 9
• I ~ ~'~~~ ~ .
----,
2 'R~~~delaYedbymasons ~HruC:D
o 8 12 16 20 24 28 32 36 40 44 48 Working days
Fig. J 7. The iruer!ermce problem
37

CONSTR UC TI ON P LA NN I NG
Litle-cf-bala"ce Q1wlysis The purpose of this analysis is to balance the rate of progress
of the ac tivities, and to schedule the ac tivities to eliminate interference. This is done by
• adjusting the rate of production for each activity, so that this approximates [0 a common rate of production for all activities
• delaying the stan of those activities that (even after adjustment) proceed faster than the activity immediately preceding it , to maintain at leasl rhe mi"imum buffe r specified at all times.
In the classical, factory-based , line-of-balance analysis, it is assumed that individual resources make equal contributions to progress, regardless of the number of the resources used. For example, if a task requires 20 man-hours, then one person would complete it in 20 hours, whereas 20 people would complete the task in one hour. Thus the rate of progress of each activity may be adjusted quite finely; consequently, the activities may be made to work at almost the same rate of progress.
In construction, such an approach is unrealistic. Tradesmen rarely work as individuals or in large groups. Years of experience and practice have established the most effective size for a group. For example, to obtain the most efficient productivity, bricklayers usually work in a team of two bricklayers serviced by one labourer. Therefore, the balancing calculations have to be done on the basis of the output of gangs, rather than individuals. This restriction makes it more difficult to achieve a common rate of work within a plan.
The second pan of the analysis (maintaining the minimum buffer time by delaying the start of relevant activities) will be illustrated by using the unadjusted plan shown in Fig. 17. Plotting the schedule in the way shown in Fig. 17 is tedious; an easier method is shown in Fig. 18. The calculations are given in Table 7. To obtain the slope of the line, it is necessary to calculate T, the time required from the start of work on the first house to the start of work on the last. This value is the rate of production for this activity.
To plot the subsequent activity, it is necessary to compare the rate of production of the activity with that of the immediately preceding activity; for example, the production rate of activity 2 (72 days) is slower than the production rate of activity 1 (45 days),
38

PLA NN ING TE C H N IQ UES
~
~ ~ • ~
" Production rate IOf n· ' houses
9
8
7
~6 E '5 ~
~ ' 3
2
I~StartbuHer Il--- Start butter 0 " 20 30 " 50 60 70 80 90 100 110
Working days
Fig. 18. Line-of -balance schedule
so activity 2 may start immediately after the buffer, without fear of interference with 1. Thus the buffer is a start buffer. Therefore the calculations for activity 2 are
start day of start day of house I activity 1 +
on house 1
start day of house 10
o day 7
start day of activity 2
on house 1 7
day 79
+
+
+
duration of activity I
for one house 5
T for activity 2
72
+
+
buffer following activity I
2
The next activity (number 3, roof) is expected to proceed faster than activity 2. Unless the start ofthis work is delayed , the roofers will catch up with the masons building the walls. In this case it is the completion ofthe activity that is important, and the diagram must be drawn so that the minimum buffer is maintained between the completion of the walls on the last house and the start of the roof on that house. In this case, the buffer is an end buffer, and
39

Table 7 Calculations for lille-o/-balallce schedule
Activity Duration Time for Buffer: Type Start day Start day t : days n - I houses days of house I house 10
T: days buffer
I. Foundations 5 45 2 Start o (project start) 0+45 = 45
2. Walls 8 72 3 End 0+5+2=7 7+72 =- 79 3. Roof 6 54 2 End 90 - 54 = 36 79+8+3 =- 90 4. St:rvices I 3 27 I Start 98 - 27 = 71 90+6+2 = 98 5. Finisht:s 5 45 2 End 71+3+ 1=75 75+45=120 6. Services 2 2 18 I Start 127-18= 109 120+5+2 = 127 7. External works 4 36 109 + 2+ I = 11 2 112 +36 = 148
Total project time 148 + 4 _ 152 days; approximately 30 weeks for a 5 day week.

PLANNING TE C HNIQUES
the start of the activity on the first house is calculated backwards from the predetermined finish date. The calculations for activity 3 are
start day of house 10
start day of house 1
start day of duration of buffer activity 2 + activity 2 + following
on house 10 for one house activity 2 79 + 8 + 3
day 90
stan day of activity 3 on house 10
T for activity 3
54 90 day 36
In this way , the schedule can be completed, as shown in Fig. 19. Obviously , this schedule lacks a common rate of production, so some improvement would be desirable . Fig. 20 shows that increasing the rate of production of activity 2 (walls) would enable activity 3 (roof) to start earlier. On the other hand , increasing the rate of production of activity 4 must delay the start of activity 5 relative to activity 3. The first case study shows how these adjustments may be made, giving detailed calculations.
" 60 60 Working days
H'"
Fig. 19. Line-of-balallce for tell·llOuse project
'" '" ' 60
41

CONSTRUC TION PLANNlNG
VariatioNs As in all techniques, line-of-balance can be developed and varied
to suit specific circumstances. Some variations are outlined in the fo llowing sections.
Parallel scheduliNg The plan does not have to be a linear sequence; some activities
can proceed in parallel. This is illustrated in the first case study. There may be a loss of clarity in the diagram, because the activity lines have to be superimposed on each other.
PlaNNed hand-over schedule In housing developments, houses are often occupied as they are
completed. Thus, the project plan may be based on a planned handover schedule, for example, six houses per week. Such a requirement may determine the common work rate, and cause the diagram to be constructed backwards from the hand-over schedule line. The planned hand-over rate defines the approximate value of T for all activities.
10
9
• 7
Increasing the production rate 01 activity 2 will allow activity 3 to starl earlier
Increasing the production rate 01 activity4 will delay the start 01 activity 5
o ~ ~ W ~ 100 1~ I~ t~ Working days
Fig. 20. Line-of-balance schedule for ten-house project showing effects of increased rate of production on activities 2 and 4
42

PLANNING TECHNIQUE S
Imenniuem worki1lg Some improvement in schedules may be made by the planned
use of act ivities that stop when interference would be imminent, and start again after a delay. For example, in Fig. 21 , a services subcontractor could start activity 6 earlier than shown, complete the work on some houses, leave the site , and return at a later date to complete the work. Activity 7 (external works) can then be brought forward.
Use of spreadsheet computer programs The balancing calculations for line·of-balance are tedious , and
are an obvious application for a spreadsheet computer program. The use of these programs facilitates experimentation with alter· native strategies, so encouraging the development of better plans. This is described in more detail in reference 8. The calculations for Tables 20 and 21 were done by spreadsheet, although for explanatory purposes Table 21 is shown as a hand-calculation (see section 7.1 ).
o
Sut>contractor completes l ive houses on an early visit and returns to complete the remainder later Bu1ferhere
20 40 60 80 Workmgdays
100
AcllVlty 7 can bestartedearller
120 140 160
Fig. 2 J. Line-of-balallce schedule for ten-house project with intumiue11t working
43

CONS TR U C TIO N PLA N NING
3.6. Linear programmes (time-chainage charts) Basic principles
Linear programmes are an ideal technique for roads, railways and other projects measured by chainage; the linear programme is drawn on a large sheet of squared paper marked with the x-axis representing chainage and the y-axis the passage of time. In essence, the technique is to plot all activities showing planned progress against time and location.
In Fig. 22 , the inclined line represents an activity AB which is planned to start at chainage sao at the start of week two and to end at chainage 1500 at the end of week three. It can be seen that
• the rate of progress of the activity is represented by the slope of the inclined line . For activity AB the rate is sao m/week
• the expected position of the gang carrying out the activity can be found at any given time by reading off the chainage against the time scale.
A ctivities: compact, extended, extensive and static To represent the project activities realistically, it is best to classify
them into four types; these are illustrated in Fig. 23. Representing an activity as a single line works well for a compact activity, i.e . one that , for any given time, occupies only a short length of the project , e.g. kerb-laying (Fig. 23(a )) .
An extended activilY (Fig. 23(b)) is used where the operation may spread over a considerable distance. It may need to be drawn as two parallel lines, each representing the start and completion of
3-------- _______ _ B
A
o L----------o500hc---------c,OOO~--------~,500 Chainage:m
Fig. 22. Linear programme [onnal
44

12
10
~ . f 6
~ ~ 4
2
0
F ig. 23.
PL ANNI NG TE C H N I QUE S
(d) StatIC (notianatwldth)
t 000 2000 3000 4000
Lit/ear programme activities
Finishes
Substructure
(e) Static (chainage broken)
6000
the activity. The example shown in Fig. 23(b) is the laying of lean mix concrete road base, where the operation extends from the placing of side forms up to the point where the concrete has cured for seven days, perhaps a distance of 2 km along the road.
An exremive activity is one where the work occupies the entire chainage for the activity throughout its duration. For example the construction of a 1000 m-Iong earth embankment from a borrow pit occupies the whole of the section until the last grading of the formation. An extensive activity of this type is represented by a block (Fig. 23(c ».
In addition to these three continuous activities that progress along the project, there is a static activity which takes place once only at a certain chainage, e.g. a highway bridge or a tunnel shaft. This type of activity (which will probably also need a detailed programme all to itself) may be depicted on the linear programme by a vertical bar of notional width (Fig. 23(d» . If that bar needs to be widened to provide more space for the description (Fig. 23(e» the chainage may be stopped on the left of the bar and restarted on the right.
Table 8. Linear programme activities
Activity
Compact Extended Extensive Static
Form
lnclined line Parallel inclined lines Block Vertical column
Example
Kerb laying , fencing Concrete paving Earthworks, delays Bridge, junction, roundabout , tunnel shaft
45

CONS TR UC TION PLANNING
Table 8 summarizes these four activity types. In practice they are not rigidly defined and it may be necessary to generate other shapes and configurations to represent specific construction methods.
With a linear programme it is easy to show constraints as nonactivities. For example, because of delays in completing land purchases, a contract is let in which JX)ssession of the whole site cannot be given to the contractor at the start of the contract period. The
Orainage
I i I I
Existing ====:..:::;~~~;: A43from Oxford
Fig. 24. Data for linear programme

PLA N N I NG TE CHN I Q UES
extent, in both place and time, of this area of enforced non-activity may be marked on the plan in the same block form as the extensive activity.
A ssembling the data Before begirming to plot activities, all the data that may be needed
should be collected together and transferred on to the chart. If the x-axis on the chart is drawn about one third up from the bottom of the sheet, a space is made available to plot data abstracted from the drawings. Fig. 24 shows how this may be done for a road project. If this step is neglected, concentration will be continually broken by the frequent need to refer to drawings and documents.
The plotting of activities will call for answers to many questions; for example
• where do kerbs start and finish?
• where are the lay-bys?
• where does the capping layer end?
• where is the sub-base thickened to 450 mm?
To ensure that the answers are no further away than the bottom of the planning sheet, it is suggested that
• a continuous simplified sketch plan of the project is drawn at the boltom of the sheet
• working up the page, the data for every individual operation are entered in the order of construction, e.g. for a road: site clearance, fencing, culverts, earthworks (flrst stage), drainage, fonnation , sub-base, paving layers, earthworks (second stage), road lines
• the stan and finish is shown for every operation and any points of change, i.e. thickening of road base or change of fence type
• all the above data are marked along horizontal lines or given a more graphical treatment if this makes it clearer. Earthworks stand out particularly well when drawn as a long section.
I denzify constraints When all the data have been abstracted from the drawings and
marsha1led tidily below the x-axis, the next stage is to identify and
47

CO NSTR UC TION Pl.ANNING
plot the constraints. These have already been briefly discussed in section 2.5. Constraints are imposed by
• the client
• a third party
• nature.
The check-list in Table 9 contains some common constraints. Those that are relevant must be marked on the diagram so that their effects may be allowed for in drawing up the plan.
Platming With the abstracted project data drawn in diagrammatically at
the bottom of the sheet and the constraints marked in on the timechainage diagram, planning may begin. It will be possible to concentrate on constructing the project on paper without constantly breaking the chain of thought to refer to documents.
As planning is a creative activity and no two projects are the same, it is impossible to give any flrm rules on procedure. However, the following suggestions may help.
• Generally plot aciivilies following the same order as the construction procedure, i.e. foundations first , finishes last.
• Mark in major activities which must be carried out within weather windows.
• After marking up the sheet with major items, section completion dates and other key constraints , the project will have been divided up into a number of sections. Within each section decide on method of construction and the major items of plant to be used - this will set progress rates.
• Activities may now be fitted in on a trial-and-error basis using these progress rates. Where activities take too long to complete, resources will have to be increased to reduce times. When gaps appear in the sequence, the planner should consider shortening the programme, reducing resources or trying a later start .
Figure 25 shows pan of a road scheme. In this example only one line has been used for extended activities, the upper line depicting completion. As the slope of an activity gives the rate of
48

I~LANNING TE C H N I QUES
Table 9. Check-list of project cmlstraims
Constraint
Timing
Weather windows
Weather restrictions
Holidays Access
Envi.ronmental restrictions
Availability of key resources controlled by others
Existing services
Third parties
Description
Project start , finish and sectional completion dates. Permitted paving season, normal earthmoving periods. Low temperature periods, monsoon seasons. Public, trade, religious. Permitted access points to project, forbidden accesses, periods of favourable/unfavourable tides, railway possessions, river possessions, factory closures. Zones where restrictions may apply over noise, dust , weekend works and nightwork. Disturbance to protected flora and fauna. Major hired plant items, e.g. dredger, very heavy duty cranes. Labour, e.g. specialist subcontract groups. Overhead power lines, buried services, water, gas, telephone, TV. fue l oil . Works carried out by other contractors and statutory undertakers.
progress, an adjustable square becomes a useful planning tool. Having set the angle to suit the progress of a given gang, it is a simple movement to sketch in the effect of adding an additional gang to reduce an overrunning activity.
The second case study illustrates the use of the linear programme technique for a road scheme. The technique worked so well on the project that the linear programme was used for the contract programme and provided the basis for monitoring both by contractor and client. Linear programmes have been effective for numerous road projects, and also for a new single track railway extension, reconstruction of a multi-span viaduct, and replacement of quay heading.
49

CONS T R UC TI ON PL A NN I NG
II ,,,
"
I ,
I
, : , . ill
- 6. :
~
" BT6 E5
Topsoi l: 3750 Topsoil :8SOO Suitable: 6200 Suitable: 1250 UlS: 21()O UlS:70 UlSbeIOW:800
"'" UISbelow: 170
~~-;;;;1; : 6100 ~~~;.::!!,~ Upper lill : 2300
"~'50 -
! ;::~'"' ; i1~1 ~; : I I
," I 9. , " .. " IS. Surtacing
5. Topsoil strip 11 . ". Yergeear1 hworks 6 Bulk earthworks 12. IIi 21 . Accommodation works
Fig. 25. Part of a linear programme for a trunk road scheme showing activities from chainage 5500 to 7600 from start up to week 50
50

P L A N N I NG TE C Hl'UQ U ES
VariatiorlS The reader may have come across other variations of the tech
nique. The system described in the preceding section was originally developed by one of the authors for planning a new rail re-alignment in East Africa after experimenting unsuccessfully with the use of network analysis. It was based on the method of operational train control used by controllers on the East African Railways system to plot train positions on a single line network. The futility of using network analysis fo r a project as linear as a single line railway has to be tried to be appreciated. The network diagram ends up as a huge ladder of activities from which it is difficult to deduce anything useful.
Similar systems have been developed independently elsewhere, usually by contractors. One of these puts the chainage axis at the top of the sheet and plots time downwards; this is often used for tunnels because it is considered by some to be a more realistic representation of the work.
Linear programmes to networks When there is an insistence that the programme for a linear pro
ject be presented as a network derived bar chart or cascade diagram there is no need to abandon the linear programme as the planning technique. It is quite easy to draw a network from a linear programme and an example is given at the end of section 3.7.
3.7. Network analysis Basic principles
Network analysis is a general term for a graphical planning technique which shows the project as a network of its activities linked together to show their interrelationships and sequence of execution. With the addition of estimates of activity duration, the diagram can be analysed numerically to determine the estimated project duration. This analysis also distinguishes between those activities whose timely execution is vital to the earliest completion of the project, and those which may be delayed for a specific time without causing delay in the project completion .
Network analysis provides
• a diagram in which the work method is made explicit: a logic diagram
51

CO N S TRU C TION PLANNING
• a means of estimating the project duration by calculation from the activity durations
• a method of calculation which identifies activities that have a critical effect on the project duration (hence the terms critical path method and critical path analysis which are sometimes used to describe this technique)
• a method of calculation which determines by how much noncritical activities may be delayed without causing a delay in project completion.
In practical project management , this last facility of network analysis is most important, because it provides an objective means of scheduling project activities to make the best use of the available resources.
Good guidance on the use of network analysis for project management is given in BS 6046.9 The terms and symbols used in this section are taken from BS 6046, except where stated .
For historical reasons, network analysis diagrams may be drawn in two ways: either precedence or activity-on-arrow. Until recently activity-on-arrow networks (arrow diagrams) were more popular in the UK and USA, whereas precedence was more popular in , for example, Australia. Precedence diagrams are now beginning to become more IXlpular in the UK and seem likely to replace arrow diagrams eventually. Although the relative merits of each form are quite flllely balanced (and BS 6046: 1981 Part 29 gives an excellent comparative analysis), precedence diagrams are usually found to be easier for those who are new to the technique. Therefore, in this guide the precedence form is described first, and arrow diagrams are offered as an alternative. The technique will be described by means of its application to the construction of a small pumping station.
Pumping station example Figure 26 shows a simple chamber used in land drainage. Porous
land drains are laid in the land to be drained, and lead to a chamber with an automatic, submersible electric pump. The water is pumped to a convenient point of disposal , or to the next chamber in a line of chambers, controlled by an automatic system in the control box. The control box is also the termination point of the
52

PLA NN I NG TE CH N I QUE S
[8J0ver ----1 r--;
_C?~. I
I L_~ I I I I L- _ __ __---.J
Drain! Control r ,,,,,
IX Plan , .0,"1..
'- ..J , 1: ~ __ P~,:!,p'ln9 maIn ---Backlr1l2 I
~,
• '. DraIn 0 ,
Backhll 1 Pump :1 ..
'. . ' , • . . , Seclron
Fig. 26. Land-drainage chamber: chamber is 3 m square internally
incoming power supply, which is then connected to the pump from the control box.
Acriviries and work merhod The activities for the construction of the chamber are given in
Table 10. The construction method is given in the following, and is shown in network analysis form in Fig. 27.
ACliviry 1 (piling) is necessary because the chamber will obviously be constructed in waterlogged ground. These piles will be lightweight, and will be inserted with fairly light equipment. This will be the ftrst activity, because little can be done until it is finished. The drains will have been laid in the ftelds previously, but will have been terminated about 5 m short of the chamber to avoid being damaged by the piling. Thus Fig. 27 shows this first activity proceeding on its own. It is expected to take 2 days to complete.
53

CO N S 1' R UC TION PI.ANNING
Tabli.' /0, .4.ctivilY list for la"d-drainage chamber
Activity
L Pil ing 2, Excavate 3. Floor 4. Control box base 5. Walls 6. Roof 7. Backfill I 8. Drains 9, Pump
to. Backfill 2 11 . Control box 12. Fencing
Work involved
Install light steel piles to support excavation . Excavate , support piles, blind bottom. Reinforcement , formwork, concrete to floor. Reinforcement , etc. , 10 control box base. Reinforcement , formwork , concrete to walls. Reinforcement, etc., to roof, including cover. Backfill to underside of drains. Make drain connections. Install pump and connect to main. Complete all backfill and top soil. Install control box and electricity supply. Fencing, gate and seeding.
Activity 2 (excavation) follows immediately after the completion of the piling. Fig. 27 shows this sequence, the arrow between activities I and 2 meaning that the piling must be wholly completed before the excavation can begin. The arrow joining the righthand side of the box for activity 1 and the left-hand side of this activity is known as a finish-to-start dependency. As the excavation proceeds downwards, frames are installed to support the piling, and when the design depth has been reached the bottom of the excavation is blinded with concrete. The excavation will be dewatered continually with a diaphragm pump. This activity is expected to take 6 days.
Activity 3 (floor) begins immediately after the completion of the excavation.
Activity 4 (control box base) can be started immediately after the completion of the main excavation working in parallel with activity 3. It could,' of course, have been started at the onset , because it is some distance from the main excavation so is not directly affected by it. Nevertheless, piling and excavation require the continual movement of construction machinery, which may damage the base. So the planner has decided not to begin this small piece of work until the excavation is complete.
Thus Fig. 27 shows how a network diagram indicates that both activity 3 and activity 4 may begin immediately after the completion of activity 2. Of course, more generally, an activity may have
54

Fig. 27. Precedence rlelwork for land-dra inage chamber , 8 2
78acktill I 8. 0rams lOBackfil1
7""~'""Y' nsn rT'TIl 2 6 I I 3 3 3 • I P,hn 2. ExC. 3. Floor 5 Walls 6. Rool 9 Pump 11 .CB 12.Fencm
LL..LJ LL..LJ LL..LJ
Acl,v'ty number and description 2
CB Base
F ig. 28. A Clivily -(m-amnu network for land drainage chamber
2

CONS TRUC1'10N Pl.A NN I NG
a number of succeeding activities. It is important to note the use of the words may begirl: if there are not enough resources to begin activity 4 immediately, it is fairly obvious that it may be delayed for a while without delaying the overall time for the completion of the chamber. On the other hand, it is also obvious that delay in starting activity 3 will delay the chamber completion date.
A ctiv ity 5 (walls) follows the completion of the floor, and is independent of the control box base (activity 4), and so may proceed at the same time .
Activity 6 (roof) may follow the completion of the walls; this activity includes the cover.
A ctivity 7 (backfill 10 underside of drains) is necessary before the drain connections can be made, and obviously the walls must be completed before the backfilling can start ; these relationships are shown in Fig. 27.
Activity 8 (dra i1lS) can follow the backfill and compaction to the level of their undersides. These connections are usually made by withdrawing a single pile on the line of the drain , and making the connection in a short trench.
A ctivity 9 (pump) follows the completion of the roof. The cover in the roof slab must be large enough for the pump 10 be removed for maintenance or replacement, so it is easier, and more prudent , to wait until aU the concrete work is finished and the chamber is cleaned out before installing this piece of equipment.
Activity 10 (backfill 2) cannot start until the drain connections are complete, and also it obviously cannot be done before completion of the roof. These preceding dependencies are shown by the finish-la-start links between activities 6 and 10, and 8 and 10.
Activity 11 (control box) is installed by the supplier, who places it on its base, connects it to the pump and also to the mains electricity supply.
Activity 12 (fencing) cannot be done until the completion of the backfilling and topsoil replacement. It is shown following the installation of the control box, although in practice these tWO
activities could proceed together. Indeed, for security reasons it may be necessary to complete the fencing before installing the control box, but because fencing must follow backfill 2, this would result in an extension of the project duration.
Thus Fig. 27 shows how a network analysis diagram may be used to illustrate a planned construction method.
56

PLA NN I NG TE C H NIQUE S
Amnv diagrams: ml alten/ative form of network Figure 28 shows the activity-on-arrow diagram for the same con
struction method. The essential difference is that the activity is depicted by an arrow, rather than a box. The numbered circles at each end of the arrow are called events; these represent a point in time when all the preceding activities have been completed and all the foHowing activities may be started. (This definition is important, as will be seen later in this section on the calculation of float. ) Thus event 3 shows that point in time when the excavation is complete and both floor and control box base may be started; event 9 shows that the pump should have been installed and the control box base completed, so the control box supplier may start work. Note that the length of the arrow is not related to the activity duration, which has not yet been estimated; in fact it would be much more difficult to draw a diagram in this way.
The dotted arrow 7-8 shows that the roof must be complete before the backfilling may start; this dependency is the same as the finish-to-start link shown in Fig. 27 between activity 6 (roof) and activity 10 (backfill). This dotted activity is known as a dummy activity. It is necessary because the arrow diagram uses arrows 10
show both activities and the sequence of work. Thus the number of dependencies that may be shown will be related 10 the number of activities, and in most cases this number will be insufficient 10 show all the logical interrelationships in the work method. The dummy activities have zero duration and consume no resources, but otherwise are given the same treatment as the other activities . The need to introduce this contrivance is one of the weaknesses of arrow diagrams compared with precedence diagrams, because in precedence diagrams interrelationships can be introduced at will, with no need for dummies.
Otherwise, the two forms of network apply the same principles, as a comparison of Figs 27 and 28 will make clear.
Activity durations and resource assumptions When drawing line-of-balance and linear programme diagrams,
it is necessary to consider activity durations at the outset; the diagrams just cannot be drawn without this information. Also when bar charts are drawn directly for simple projects, it will be seen that it is again necessary 10 estimate the activity durations before the chart can be drawn.
57

CONSTR UC TION PL A NN I NG
One of the powerful attributes of network analysis is that the work method (logic diagram), resources required and activity durations may be considered separately, although ultimately they are all interrelated. The advantage is that the planner may consider one of these components of the plan at a time, rather than all at once. In planning the construction of the land-drainage chamber it has been seen that the work method can be shown in network form without considering what resources will be needed, except in the case of the sheet piles which are an intrinsic part of the work method. The number of men, machines, etc. , has not yet been considered; i.e. it has been assumed that the availability of resources is inftnite for the initial network plan. This assumption will enable the planner to use network analysis as a means of deciding on the resource levels required, rather than making assumptions at the beginning. Logical dependencies which express such resourcedependent reasoning as 'when this gang has finished this activity it can move to ... ' must be avoided, because the resulting network will be a confused amalgam of construction method and resource allocation. The importance of this principle will become clear in the resource analysis section.
Estimation of activity durations Some guidance on estimating durations has already been given
in section 2.7. At this stage in the plan, the duration of an activity should be estimated assuming that the resources allocated to it will be those normally used. Any consideration of ways of accelerating progress should be left until the critical activities have been identified, so that the commitment of additional resources will produce the maximum benefits. The activity durations estimated for the land-drainage chamber are shown in Fig. 27, and also in Fig. 28.
Time analysis The duration of the project may now be calculated from the dura
tions of the individual activities and their interrelationships. The purpose of the time analysis is to determine
(a ) the estimated duration for the project (b ) the earliest start time for each activity (and so the earliest
finish time) (c) the latest start time (and latest finish time) for each activity
58

PL ANNING TE C H N IQ U E S
(d ) from (b) and (c), the amount by which any activity may be delayed without delaying the project beyond the duration estimated in (a ); that is, its float time.
The calculation for (a ) and (b ) is by the forward pass calculation; this is shown in Fig. 29. The calculation is made easier by using the convention that the project start date is day zero, although this may seem a strange assumption. The reason is that the calculations focus on the completion of an activity; for example, an activity of two days estimated duration would be completed at the end of the second day, if it started at the beginning of the first day. Thus its completion day is day 2, so to make the arithmetic work it must be considered 10 start after the end of day zero (i.e. the beginning of day 1), giving 0 + 2 = 2. The use of this convention is generally considered to make the activity times look sensible, but it is only a convention.
The forward pass analysis is quite simple. Activity 1 (piling) starts after the end of day zero, is of two days duration and therefore will be complete at the end of day 2. From the network logic, activity 2 (excavation) may then start (after the end of day 2) and is to be completed six days later (at the end of day 8). Both activity 3 (floor) and activity 4 (control box base) may then start, after the end of day 8; and so the calculation continues. Early start times and early finish times are inserted in the top corners of the activity boxes, as indicated in Fig. 29. When two linking arrows converge on an activity , as with activity 10 (backfill 2), the network logic demands that both preceding activities must be complete before the activity may start. Thus although the preceding activity, number 6 (roo£), will be complete by the end of day 21 , activity 10 (backfill 2), will still have to wait until the completion of the other preceding activity, number 8 (drains), i.e. until after the end of day 26. Thus the rule for calculation of the earliest start time of activities that have more than one preceding activity is to take the lalest preceding finish time. The forward pass also establishes the expected project duration time, in this case 32 days .
The backward pass establishes the latest start and finish time for each activity, and so works backwards from the end. For activities which have only one preceding activity, the latest start time is simply the latest finish time less the activity duration (the last activity takes the project time as its latest finish time). Where an
59

17 1 1181 L'B18~261 r-c 7.S'filll 6. Drains
17 C 1181 18 c 26
Eartiesl start tillllfl er+eSll iniShl ime
0 2 2 2 6 18 I 8 3 111 11 6 17 17 , 1211 121 3 24 1 1. Piling l----l 2. EKe. I 3. Floor l----l 5. Walls 6. Roo! 9. Pump ~
0 C 2 2 C 18 I 8 C 111 11 C 17 18 1 221 122 1 251
latest finisJ time I I
l al9Ststart time Critical activilies Float time
8 2 10 '-i 4.CBbase
2311':; 12'5
Fig. 29. Precedence network for land-drainage chamber showing time analysis
126 2 126 , -..1_ 1O. S'li112
126 C 128
24 3 127 11 .CB
25 1 [28
2B 4 132 1 12. FeoonSl
2B C 132
n o >: '" .., " c: n ~
..; o >:

PLANNING TE C H N I QUES
activity has more than one succeeding activity, the calculation involves making a choice; for example, the latest finish time of activity 6 (roof) could be either day 26 (from activity 10) or day 22 (from activity 9). Of course, it has to be day 22, the earliest time, because sufficient time must be allowed for the completion of the chain of activities 9- 11 - 12 as well as the chain 10- 12. Thus in the backward pass, the latest finish time of an activity is the ear/iest of the latest start limes of all the succeeding acrivities. A simple reminder is 'take the latest time going forward , the earliest coming back' .
Thus the critical activities can be readily identified. Where the earliest start time and the latest start time are the same (and for precise definition, also the earliest and latest finish times are the same) the activity is obviously critical; that is, any delay beyond its earliest dates will delay the whole project. These activities are marked with a 'C' as shown. Activities that are not critical have what is called float.
Arlalysis of float The determination of float may be done by
• drawing a bar chart from the network, or
• calculation.
The first method is time consuming but enables float to be interpreted more easily; the second is quicker and is often done by computer .
Figure 30 shows a bar chart drawn from the network shown in Fig. 29. The method is to plot the earliest start time for each activity, followed by a bar showing its duration; thus the end of the bar is the earliest finish time. The latest fmish time is also plon ed, and an outline bar shown from the earliest finish to the latest finish, which crudely represents float (note that BS 6046 shows the float as a line of dots, which is not such an effective illustration of float). These outline bars show the amount by which each activity may be delayed without delaying the earliest project completion date , but this does not mean that some other activities will not be delayed. A more specific definition of float is now required.
There are three types of float, and these will be illustrated by
61

CONSTR U C T I ON PLA NN I NG
ActIvIty PfO!OC1111l1O: days No DeSCflpllon , , , , • "
, , "
, ~ , , 1 PIling F= 2 excavatIon 1 , 1
3 Floor = Totat lloal-.1 , CB base 1, ,' 1 I Free1toal-1
5 Waifs 1 1M
6 Rool ~
7 Backlill t .. 8 DrainS 1
9 Pump """"'" 10 Backl,1f2 "'" \I Cont/olbax ~
12 Fencll'I9 """"'" Fig. 30. Bar chart for larld drai1UJge chamber, drawn in early start order
means of activity 4 (control box base). Total float is the latest finish time of an activity, less the earliest start time, less the activity dura· tion . For activity 4, this is 2S - 8 - 2 = 1 S days .
The outline bar in Fig. 30 is of 1 S days' duration, and the method described earlier for drawing the bar chart gives the total float (if any).
Free float is the amount by which an activity may be delayed without delaying any subsequent activity beyond its earliest start time. For activity 4, there is only one succeeding activity , number 11 (control box), with an earliest start date of day 24. The earliest finish of activity 4 is day 10, so it may be delayed by 24 - 10 = 14 days of free float before the delay would have any effect on activity 11 (control box). This is shown in Fig. 27. Stated more formally, free float is the earliest start time of arlY succeeding activity , less the activity early start time, less the activity duration; e.g. for activity 4, it is 24 - 8 - 2 = 14 days.
b,dependem float is the float which will be available to an activity if all preceding activities are delayed until their latest finish, and no succeeding activity is to be delayed beyond its earliest start date. It is the earliest start date of any succeeding activity, less the latest fmish date of any preceding activity, less the activity dura· tion. For activity 4, this is 24 - 8 - 2 = 14 days. The float caJcula·
62

PLANN I NG TE C H N I QUE S
tions for the whole of the land-drainage chamber network are given in Table 11, and the float is drawn in Fig. 30.
A more rigorous defmi tion of a critical activity can now be given; an activ ity is critical if it has no float .
Practical use of float At face value, independent float is the most useful form of float,
because it is the float available to an activity independent of the movements of preceding and subsequent activities within their own floaL Unfortunately, as one would suspect, this happy state of affairs seldom occurs, so in most cases calculation of independent float is a futile exercise.
Free float is also attractive for scheduling purposes, and fortunately it occurs fa irly frequently. A useful short-cut in manual calculation is to ignore all activities in chains of simple follow-on activities, except the last activity, because these can never have free float. Fig. 31 illustrates this; the float calculations are given in Table 12 .
Table 12 illustrates the way in which the definition of free float makes it impossible for it to occur within an unconstrained chain of activities; and also that total float in such a chain is also shared float . The total float in the network is 4 x 60 = 240 units, which
Table 11. F loal calculations f or land-drainage chamber: days
Aclivity Duration Total float· Free float Independent float
I. Piling 2 2~0 - 2 : 0 2 - 0 - 2 .. 0 2 - 0 - 2 = 0 2. Excavation 6 8 - 2 - 6 : 0 8-2 - 6 : 0 8 - 2 - 6 : 0 3. Floor 3 11 -8-3:0 11 - 8 - 3 = 0 11- 8 -3=0 4. Control box base 2 25-8-2:15 24 - 8 - 2 .. 14 24-8 - 2_ 14 s. Walls 6 17 - 11 - 6 = 0 17 - 11 - 6 : 0 17- 1I - 6:0 6. Roof 4 22-17 - 4 : 0 22 - 17-4=0 22 - 17 - 4 = 0 7. Backfill I 1 18 - 17 - 1= 0 18 - 17- 1-= 0 18 - 17 - 1:0 8. Drains 8 26 - 18 -8:0 26 - 18 - 8 : 0 26 - 18 -8=0 9. "'mp 3 25 - 2 1-3-= 1 24-21-3=0 24 - 22 -3: l t
10. Backfi ll 2 2 28 - 26 - 2: 0 28 - 26-2=0 28-26 -2=0 11. Control box 3 28 - 24 -3= 1 28 -24 - 3 : 1 28-25-3=0 12. Fencing 4 32-28-4=0 32-28-4",,0 32-28-4 = 0
"Obviously activities with no IOta! float cannot have any other form of float. The calculations are given for illustration only.
t it is possible to obtain negative independent float (but not negative 10lal or free float). This is meaningless and is laken as zero. Plolting activity 9 (pump) as a bar chan will illustrate the cause of this.
63

0110 110 10 110 120 20 110 130 30 110 1" r A r---- B r---- c f---. 0 I--
60 160 170 70 160 1 SO 60160 190 90 160 IUJO
01010 o 11001100 1001 0 1100 Slar! E Eo'
OJ CJ 0 o I C 1100 100 I C Itoo ('J
o 110110 10 110120 20 110 130 30 110 1100 A r----- B r----- C r----- 0
0160 170 "' I,o lso 80 160 190 90 I GO 100
o 11001100 E
ole 1100 (bi
Fig. 3/ . Free float in chairlS of activities (aJ and (b) rev ised [oml

PLANNING TE C H N I QUES
Tab/e 12 Float ca/wlatiom for Fig 3/' arbitra ry units
Activ ity Duration Total float Free Float
A 10 70 - 0 - 10 = 60 10 - 0 - 10 = 0 B 10 80 - 10 - 10 = 60 20 - 10 - 10 = 0 C 10 90 - 20 - 10 = 60 30 - 20 - 10 = 0 D 10 100 - 30 - 10 = 60 100 - 30- 10 = 60 E 100 100 - 0 - 100 = 0 100 - 0 - 100 = 0
must indicate some sharing in a network of 100 units duration. Obviously, if activity A is delayed by the whole of its 60 units of float , then activities B, C and D will lose their float. It is important, therefore, to refer to the network diagram when interpreting float, and not to rely just on the figures in the calculation table.
Sensible meaning has to be attached to the word criticaL For example, if an activity of four months' duration has one day of float , it is effectively critical.
Time analysis and arrow diagrams The principles of network analysis are common to both forms
of network. So the calculations shown in Fig. 32 are essentially the same as those shown in Fig. 29. However, the meaning attached to the figures in the diagram is different. In precedence diagrams, the box represents the activity and the four time figures in the box show the earliest and latest start times and the earliest and latest finish times, a/ that activity. In arrow diagrams, the figures show the earliest and latest limes 0/ the event. Remembering that an event shows a point in time when all the preceding activities have been completed, and all the succeeding activities may then start, it is clear that the figures given in the event circle refer only to a single point in time - not necessarily start and finish times of all the activities involved . Thus the calculation of float is different, but based on exactly the same definitions as for precedence diagrams.
Total float is the latest event time for the activity, less the earliest event time, less duration. Thus for activity 3- 9 (the control box base, precedence activity 4) this calculation is 25 - 8 - 2 = 15 days.
Free float is easier with arrow diagrams, because the earliest event time at the end of the head event (i.e . the event at the head of the arrow) is in fact the earliest start time of any subsequent activity;
6S

g:
Control bo~ base
2
Fig. 32. Acriviry-on-amrw network for land-drainage chamber: time analysis
'" o <: "' :;l c::
'" ~ o <: ." ... ,. <: <: ~ Cl

PLAN N I NG TE C II NIQUES
hence the free float for activity 3-9 is 24 - 8 - 2 == 14 days. This is the earliest time of the head event, less the earliest event time of the tail event, less the activity duration.
Independent float is similarly simplified by the use ofthe con· cept of event time: it is the earliest event time of the head event, less the latest event time of the tail event, less the activity duration . For activity 3-9, it is 24 - 8 - 2 = 14 days.
Thus in some ways float calculations are easier for arrow diagrams than for precedence diagrams, but again the need to use the dummy activity weakens the case for arrow diagrams. Float calculations for the dummy 7-8 will give a total float of 5 days. In this case the float calculated for a dummy actually refers to the preceding activity and its relationship with activity 8-10; this makes the interpretation of float more difficult.
Variations Overlapping activities. Until now, all the networks shown have
assumed that the whole of an activity must be complete before a succeeding activity may start. In practice, it is often the case that when some progress has been made on one activity, a succeeding
o 110 10 o 10 10
Excavate r---L Excavate 2
2 1 1'0 o 10
2 '0112 L.L.. Lay pipe ----'- 2
2 112
' \'0 \" --l.. Backfill
' \ \ " " (a) (b)
Fig. 33. Precedence diagrams with overlapping activities: (a) leads and (b) lags
67

CONS TR UC TI ON PL ANN I NG
activity may start. Fig. 33(a ) shows a network for a pipeline in three simple activities: excavate trench, lay pipes, backfill. The arrows drawn show start-to-start relationships (between the start of two activities) and finish-to-finish relationships, showing relationships between the end of two activities. The numbers on these arrows represent leads for start-to-start relationships , and lags for finish-to-finish. The interpretation of this diagram is that the pipeiaying may start two days after the start of excavation, and the backfLiling after a further two days. Obviously, some equivalent constraint must be attached to the completion of these activities, because the excavation must be complete two days before the pipelaying can be completed, and the pipe must be laid two days before backfilling can be completed.
The analysis of lead and lag relationships follows the nonnal rules of the forward and backward pass calculations. This is quite straightforward for Fig. 33(0 ) but more difficult for Fig. 33(b ). For example, the activity ' lay pipe' has an early start time of day 2, because it may start two days after the start of the activity ' excavate trench ' . Its earliest finish is either its earliest start time plus duration (2 +6 = day 8) or, from the lag relationship, two days after the end of the preceding activity (10 + 2 = day 12). Following the rules of the forward pass, the earliest finish time is day 12 . The backward pass applies similar principles, using the earliest times.
Leads and lags do have the advantage that they may be usd to represent reality more closely, but the interpretation of the analysis becomes more complex. For example, the activities ' lay pipe' and ' backfill' in Fig. 33(b ) clearly have a critical completion date, but there is some float attached to their start time. This may represent reality quite well , but confuses the definition of float! This is shown in Fig. 34 and this can be called preceding float.
A further illustration of start-ta-start and finish-to-fmish relationships is given in Fig. 3J(b) .
S ummary or hammock activities. These are used either: to summarize part of the network or a subnetwork, for inclusion in a higher level plan at a lower leve l of detail j or to represent activities such as ' maintain site offices' , the duration of which is dependent on the duration of the actual project activities. The difference between these activities and normal activities is that their duration is not assigned to them directly, but is drawn from the duration
68

PLANN I NG TEC H N I QUES
"me o 2 3 5 6 7 8 9 10 11 12 13 14
lay pipe
Backlill
Fig. 34. Bar chare for Fig. 31 showing /loat available at stare bUl tlot at eNd (concept of precedi1lg /loat)
of the activities between the start and end of the summary or hammock. If changes are made to this part of the network, the duration must be revised. Computers do trus automatically for activities designated as hammocks or summaries.
Figure 35 shows a summary activity for the land-drainage chamber. The project will include a number of these chambers, so the master programme will show the summary activities only. The term summary is used for these activities, for obvious reasons; the term hammock is usually applied to the overhead cost usage, where the activity is suspended, like a hammock, between the relevant physical activities.
Networks for repetitive constmaio11. Network analysis diagrams do not lend themselves easily to repetitive construction, but a simplified approximation may be given using a ladder network. This enables a detailed plan for a repetitive part of a project , done by line-of-balance, to be incorporated into a higher level master programme done as a network .
Figure 36 shows how the plan for the ten repetitive houses given in the line-of-balance example may be converted 10 a ladder net work; this is shown in arrow diagram form . The term ladder comes from the appearance of the diagram. The construction plan is simplified by showing the construction of each element for all the houses as a single activity; foundations becomes 50 days, that is ten foundations at five days each. (It is also possible to include the buffer times, by simply increasing the activity duration by this amoun t. ) These combined activities form the rungs of the ladder.
69

17 1 18 18 8 26 26 2 28 7.B'fill l 6. Drains 10.B 'fiI12
17 C 18 18 C 26 -1261 c 28
0 2 2 2 , 8 8 3 11 11 , 17 17 , 21 I 21 3 " " 3 27 28 , 32 1. Piling 2. Exc. 3. Floor f-----.l 5. Walls 6. Roof 9. Pump J l1.ee _112. FenCing
0 C 2 2 C 8 8 C 11 11 C 17 18 1 22 22 1 25 25 1 28 28 C 32
8 [ 2 10 4. CB base
23 15 25 0 32 32[ Summary
0 32[
Fig. 35. Precedence network for land-drainage chamber wirh summary activity

PLANNI NG TE C H N I QUES
Activity Duration per Time lor len house: days house.i : days
, - 2 5 50 3 - 4 8 80 5 - 6 6 60 , - 8 3 30 9 - 10 5 50 11 - 12 2 20 13 - 14 4 40
Foundations
50
Walls
80 6
.""'r------R'iOO~'-----_i 6 ~ 60
6~L_ __ _<S.~N~'"~'~'------.~ ~ 30 . ~
J ~ Finishes ~ ~ 50 ~
5~ Se';~"2 ~ 2 ~ e.ternal works ~ ~ 40 ~
Fig. 36. Ladder network, using line-of-balance example (Fig. /9) for len houses
Some provision must now be made to show an approximation to the sequence of work. This is done by using real time dummies for the fust and last unit of each activity. Thus, the flrst wall cannot be started until the flrst foundation is complete. The foundation takes five days, so a real time dummy of this duration is inserted as shown. By similar logic, the event which says: 'both foundations and walls are now complete ' must be preceded by a real time dummy for the walls of the last house. This dummy ensures that sufficient time is allowed for the walls of the last house to be completed after the completion of its foundations.
71

CONSTRUC TION PLANN I NG
The resulting network is then analysed in the standard manner. Obviously, the wal1s are critica l, and so is the limely completion of the succeeding activities, although there is some flexibility in their starting times. The interference problem which is central to lhe line·of·balance technique has not been considered, so the numerical results are different.
Ladders are a useful, but approximate device. Care must be laken when considering the analysis of resources.
Converting a li"ear programme 10 a network It is not unusual for a client to specify that the contractor shall
provide a network-derived bar chart. This is a common request
,
6
Earthworks 2
Setout
°°k----.~~---,lO~"---,., 5~O"O---c2"O~OOn-Chalnage: m
1'1
@SeIOUI ° ° 1
r.nfarthwO:ks~4 Drainage ~6 (v 3 2 , 2 6
Buller
W:" ~. Gb • ,1-~F~~~=7'~"""--_ 5 ' 7 Buller
w.i1 @@o: 0-4 6 ~ Sub·base I • 7 .
1
Ib)
Fig. 37. Conversion of linear programme to network: (a) simple road scheme in linear programme format; (b) same scheme converted to a network
72

P L A NN I NG T EC H N IQ U E S
from management contractors who wish lO incorporate each individual contraclOr 's job network inlO the main project network. If the job is linear , there is no need lO abandon the linear programme; both this technique and network analysis use timed ac tivities and it is quite simple to transfer these from one format to the other .
The first stage is to identify each activity then number the beginning and end of each activity with event numbers as shown in Fig. 37(a ) . Activities need to be numbered in time sequence working from the bottom to the top of the time!chainage diagram. When all activities have been numbered, the network may be constructed. Where an activity begins immediately after the completion of the preceding activity as shown at events I and 2, set out/earthwork/drainage, the activity arrrows meet at the event nodes as shown on Fig. 37(b ) . When, however, waiting or buffer time has been introduced between activities, as between drainage 2- 3 and formation 4-5, it is necessary to use real-time dummy activities in the network to maintain the logic.
Although an arrow network has been chosen to illustrate the conversion, in practice it is simpler to use a precedence diagram which does not require dummy activities. This procedure may appear tedious, but with very little practice it is possible to become quite adept at the conversion. A planner used to entering data by a keyboard will be able to transfer data directly onto the computer after the initial event numbering operation. The planner will not need to actually draw the network in Fig. 37(b ) but will let the computer draw it for him.
73

4 Resources
One of the important objectives of planning is the efficient use of resources. This chapter gives an explanation of the techniques of resource analysis, and gives guidance on methods of resources scheduling. The important human aspects of resources planning are explained.
A major benefit of methodical and effective planning is the means it provides for the efficient control of resources. The basic construction resources are often called the four Ms: men, machines, materials and money. There are others: time is an important resource, as is the construction site itself, which like all other resources must be used to maximum effect. And, of course, good weather is an invaluable resource; a resource with seasonal availability which must be recognized at the strategic level of planning. The principal focus of managerial attention must, nevertheless, be the four Ms and time, and these resources will be the main subject of this chapter. The management of these resources will be developed in chapter S.
The construction industry often operates at very low levels of net profit (of the order of 2- 4% of turnover) so it cannot easily tolerate inefficiency in the use of resources. An example of resource use on a typical competitive civil engineering project is shown in the first two columns of Table 13.
It can be seen from the third and fourth columns that 5% unforeseen wastage on materials, or a 10% subcontractor 's claim or 7% overuse of labour and plant will swallow up the net profit. As, unf?runately, resource overusage of this order is quite easily achi~ved, the careful management of resources must be a prime requIrement of the planning process.
74

RESOUR CES
Of lhe four planning techniques that make up the planner 's toolkit , network analysis lends itself most readily 10 comprehensive resource analysis. In the line-of-balance technique, and 10 a lesser extent in linear programming, making effective use of resources is an integral part of drawing up the chart , and further analysis is not easy.
This chapter concentrates on resources analysis of plans derived from networks; a simi lar but less specific analysis may be based on bar charts. The analysis will be explained using the example of the land-drainage chamber which was used to explain network analysis in chapter 3.
4.1. Estimation of resource requirements The estimate of the resources required for the construction of
lhe chamber is given in Table 14. This is a very simplified estimate for this simple example. In practice, this estimate may be made in more detail , and the plan may be refined to overlap some
Table 13. Swallowing the profit margin, showing four common areas of ineffic iency, anyone of which w ill totally swallow up the 2% profi t ' margin
Resources Percentage of Common Consequent effeet project value inefficiences on projeet
Materials 40 5% overuse due to 4O%x5%", 2% loss losses, contamination overexcavation and short deliveries .
Subcontractors 20 10% extra cost due 20% x 10%: 2% loss to dayworks claims, waiting for materials and instructions.
Labour 18 i 7% overuse due to 28% x 7%:: 2% loss Plant 10 bad planning, failure
to put plant off hire.
Overheads 10 20% under-reeovery 20% x 10% '" 2% loss due to project over-run , inflation, and estimating errors.
Net profit 2
75

CONSTRUCTI O N PLA N N I N G
activities to achieve more efficient usc of some of the resources. Resources can be planned in either of two ways.
• On the basis that a finite number of each resource must be available for each and every period - this is the method shown in Table 14.
• In the form of total amounts for an activity, e.g. man-days, money etc. ; in Table 14, the allocation of three men to activity 1 (piling) is equivalent to the allocation of six man-days for this ac tivity of two days duration .
Usual1y in construction, site resources are planned on the basis of the allocation of a fmite number of resources to an activity (first method) because this enables estimates to be made of maximum manning and equipment levels, which is essential for planning site accommodation, plant servicing and so on. The second method is used for financial planning.
4.2 . Resource analysis Resource analysis is concerned with making the best use of
resources in the time-scale of the project, so the analysis must be done on a time basis. Therefore, the network is usually redrawn
Table 14 Resources for larld-drairlOge chamber*
Activity Labour Carpenters Sheet piles Wall T ractor (set) forms shovel
(set)
1. Piling 3 - I - I 2. Excavation 3 - I - I 3. Floor 3 2 I - -4. Control box base I 2 - - -s. Walls 3 2 I I -6. Roof 3 2 I - -7. Backfill I 2 - I - I 8. Drains 2 - I - I 9. Dewatering pump I - I - -
10. Backfill 2 2 - I - I I I . Control boxt 12. Fencing 2 - - - -*Rcinforcing steel will be fixed by labour-only subcontractors. t l nstalled by specialist subcontractor.
76
Pump
-I I -I I I I ---

RESOU R CES
Activity Project time: days
No. Description , , , , 9 " " " " " " " " " " " " , Piling 2iZl 2 Excavation ?? 1 Lli!.
3 FlOOr ff$ 4 CBbase '!'l' I
5 Walls tj 1 ) 3) J _ Labourers shown J ; 2 :; ~ above bars
6 Roof carpentersshownL-~ 7 Backfill I below bars
8 Drams 332323lI.
9 Pump , , , =
fO Backli1l2 t&fu
" Control bo~ ~
f2 Fencing ~ Labourers JJlll l ))«JJJJ JJ)~55531J22222222
Carpenters "22222222223
Sheetpites Wall/orms Tractor shovel , , , , , , , , , , , , , , , , , , , Dewatering pump
Fig. 38. Resource requirements, early start order
in the form of a bar chart, and resources allocated in the way shown in Fig. 38. The resource requirements estimated to be required for each activity are shown in Table 14.
There are three forms of resource analysis: resource aggregation; resource smoothing; and resource levelling.
Resource aggregation Resource aggregation is shown in F ig. 38. This is the simple
summation of the total number of each resource required by the activities planned , for each period. Care has to be taken with items such as the sheet piles and the pump, because these are required to maintain the excavation in good order throughout most of the construction . So these items must be allocated to activities such as walls although they are not directly concerned with wall construction. (As an alternative, such resources can be shown in the network itself as hammock activities; e.g. sheet piles would be a
77

CONSTR UC TI ON PLA NN IN G
hammock from the sta rt of the piling activity to the completion of the backfill activity.)
Resource smoothing Resource smoothing may be used to make LIte pattern of resource
demand given by the aggregation more manageable, but without extetldi,lg the piarmed projeer durario1l . The technique is to delay some of the activities within their respective float, 10 remove peaks of resource demand. The objective is lO produce a schedule that requires a steady and more or less constant demand for a panicular resource (a smoothed resource), because generally it is difficult to manage a resource for which demand fluctuates between very different levels .
A simple illustration of smoothing is given in F ig. 39 where the de lay of activity 4 has given a smooth demand for carpenters, and an improved, but still imperfect, demand for labourers. Obviously , the scope for smoothing resources demand is limited by the float available and the constraints expressed by the network.
Activity Projec\time: days
No. Description , , , , , " " " " " " " " " ~ " D , Piling ~\JPP 2 e.cavation
3 ,,~ #4 , , , CBbase , , 5 Walls lJnr 12
6 Roof is ;~
7 Backlill t .z. • DrainS ft,p ~pn , Pump
, , , """"'"
" Backl ill2. ~
" Control box => " Fencing ~ Labourers J Jl lJ1J)Jl]JlllJJ~~S S "112 Z 22222
Carpenters 22221 2 222222122
Sl"Ieetpiles Wanlorms Tractor shovel , , " , , , , , , , , , , , , , , , Dewatering pump
Fig. 39. Smoothed resources
78

RESOURCES
Resource Jevellirlg Resource levelling reschedules the project activities to give a
ma.x.imum demand for each resource within an imposed limit. This may cause the project to be delayed, if the resources made available are insufficient to reschedule the activities within the float available. Fig. 40 shows a schedule for levelled resources, with an imposed limit of three labourers and two carpenters. The first problem occurs with the roof (activity 6) and backfill 1 (activity 7) because to schedule them concurrently would require 3 + 2 = 5 labourers. Because the roof is the longest and most expensive of the two activities , and is also a critical activity, it is sensible to delay the backftU, and allocate the resources to the roof. Delay of activity 7 from day 18 to day 22 must delay the next activity in the network, activity 8; originally starting after day 18, it now starts four days later. This activity is critical, yet has been delayed by the resource levelling process; this is an illustration of the effect of scheduling with imposed resource restraints. Clearly, in the levelling process, the original critical path concept evaporates; resources are now allocated to activities on the basis of the impon ance of
Aclivity Projec11ime: days
No. Deseriplion , , , , , " " " " " " ~ ~ " n " ~ ~ " , Piling
""'~ 2 Ellcavalion
3 '100< ~ " • CSbase , I .r!
#fzl#~ " 5 Walls
6 Rool
7 SackMl1 c!t , Drains n~~n~~l
9 Pump , " =::J
10 Badd~12 .t6
" Conlrolboll ""'" 12 Fencmg 6k±6 Labourers 1 111 1 1) 111 II l 1))) )111]] 11/1111111111
Carpenlers ",111111,11 1
Sheelpoles WaUforms -Traclor~ I, \ \ \' \ \ " ",. \ ' , ., Dewalerrng pomp
Fig. 40. Levelled resources (project duration eXlended)
79

CO N S TR UC TI ON PLA N NI NG
the activity itself to the completion of the project , by a new system of priorities. For example, when a choice has to be made between two or more activities which require the same resource, it may be best to allocate the resource to the activity with the longest duration, or the earliest start, or by some other rational priority. Alternatively, the project manager may assign priorities to activities on the basis of a 1- 10 scale, and this may form the basis for decision making in conditions of limited resources.
Continuing the levelling, the delay of the drains then delays backfill 2 (activity 10) and the fencing (activity 12). The project duration has been extended by four days (from 32 days to 36 days).
In this example the process was applied to just one resource, labourers. Fortuitously, the demand for carpenters is unaltered, but the sheet-piles are required for an extra four days, and so is the dewatering pump. Thus an improvement in the schedule of one resource (in this case labour) has resulted in the schedule for another two resources to be made less economic. This is the fundamental problem with resource scheduling, and the final schedule will almost always be a compromise. It is in the process of searching for an effective resource schedule that skilled and experienced planners can make a really important contribution to the efficiency of construction.
4.3. Other forms of presentation The resource demand schedule is shown in Figs 38-40 as a
simple strip of numbers (e.g. labourers 3 3 3 etc. ). This form of presentation is quite adequate for most practical purposes, and has the advantage of being very compact. An alternative form is to plot these figures in diagrammatic form, as a vertical bar chart or histogram. Examples of computer drawn histograms are given in the third case study.
A further refinement is the cumulative resources curve, shown in Fig. 41. The graphs show the cumulative demand for labourers and carpenters , in man-days. Curves of this type form a basis for project monitoring and control, which is described in chapter 5. The curve shown in Fig. 41 is derived from the original early-start bar chart , and a further refinement is to plot on the same axes a similar curve based on a late-start schedule. This is shown in a general way in Fig. 42. The difference between the two lines is called the float envelope j this is the envelope of the resource
80

RES OUR CE S
ActiVity
NO. DescnpliOfl
I Piling
2 ExcavatlOfl
3 Floor
4 CBbase
Walls
PrOject tlme:days
1 9 II 13 IS 17 19 21 23 25 27 n 3 1
HPJ} Cumulative curve. labour 100
"--80
~ 6 Roof
Backfill I
V
8 DraJns
9 Pump
10 Backfil12
II COfItrol bo~
12 FenCing
" , """""
------ Q!, _ <Cumulative curve, ~ 2
,/'~ carpen ters
Cumulative man·days. labourers l ~ gI1t!1,a1'l2<.2a:l1:"; 1II0\"'7!(1!olS$SJ6S7l ~?'l I!284MMIIQ\l1 9< 9!i.
Cumulative man-days. carpenters
60 ~ -~
40 ~
J 20
Fig. 4 J. Cumulative resource curves for labour and carperuers, early start
demand for the resource under consideration for all the ways of resource smoothing; i.e . for all schedules that do not delay the project completion from that originally calculated.
4.4. Planning for effective scheduling These analyses demonstrate why it is best to assume that infinite
resources are available when first drawing the network diagram. If resource limitations are implied in the constraints and these dependencies are shown on the original network diagram, the resource analysis becomes muddled between rescheduling the activity times and also having to change resource-based logic. It is far more effective to draw the network to express onJy physical constraints and engineering decisions, assuming infinite resource availability, and leave the introduction of resource constraints until the resource analysis. That is, the use of resources should be an output from the planning process, not an input. Normally, when major scarce resources are to be used, it would be foolish to assume infinite availability, so the work would have to be planned around them. Nevertheless, for general construction work, using generally available resources, the initial assumption of infmite availability
81

CONSTR UC TION PLANNING
, .. "" "" OJ"
'''' ~
n" "? 100 e ~ 9()
i 8()
• ~ 7" ~ .. E , " 50
." 3<l
'" '"
2 3 5 6 , 9 '" n " Time: weeks
'" 22 36 " 69 67 '''2 'OS '" "" '50 , .. Cumulative resource. early start: man·days , " 26 ." 53 67 62 97 '" '32 '" , .. Cumulative resource. la te start: man'days
Fig. 42. The /loat envelope
should result in better resource schedules. Furthermore, it is clear that there will be more scope for the resource analysis to produce an economic schedule if the network is not unnecessarily complex. Logical relationships should be introduced into a network only after careful thought, because these will in turn constrain the options available to the scheduler. A very complex, tightly planned project will offer much less scope for the scheduler than a more loosely planned project with more activities running concurrently.
82
RESOURCE S
4.5. Scheduling systems Most computer-based project management systems have a
scheduling facility. These aim to produce schedules automatically, and are constructed around a system of rules (such as those given in the resource levelling part of section 4.2) to enable a best schedule to be identified. These automatic schedulers can be used to great effect , but they require skill and understanding from the user _ that is, they must be used with caution.
It is often much more important that the project manager and planner produce a schedule which they have devised from a study of the construction work itself, and to which they have become personally commined, rather than strive for a theoretically optimum mathematically derived schedule. Schedules must appear sensible and practical to those who have to make them work. Generally, manual analysis will encourage the production of such schedules, but the use of computers to produce a new aggregation quickly and easily, after each activity is rescheduled by the planner , is beneficial and encourages experimentation. In many cases, using computers in this way may be more effective than using the automatic scheduler.
4.6. Resource scheduling and people management The human aspects of resource scheduling are important. First,
it is rarely practical to schedule the work of individual people. People usually work in groups - in project teams, office groups or, on site, in gangs. The formation and development of harmonious working groups is an important managerial task, so the scheduling of human resources must be based on groups rather than individuals. This practical reality results in schedules that are cruder than those based on scheduling individuals, thus simplifying a complex process. Second, human resources are capable of scheduling their own work. If management does not schedule the human resources and manage the implementation of these schedules, the human resources may make their own schedules to suit their own individual objectives and wishes; such schedules may have detrimental effects on the efficient scheduling of nonhuman resources such as plant and money. Thus schedules for human resources must aim to ensure that each group of people has a continuous programme of work, together with the necessary resources; and that they know that this is the case.
83

5 Monitoring and control
Planning lays the foundations for monitoring and control. Monitoring is required to establish what progress has been made against the plan. Control is taking corrective action. Simple methods of monitoring and control arc given , based on the planning techniques already described.
Essentially, there are two ways to execute and control construction work. It may be let under contract to someone else, where control is exercised through the enforcement of the contact; in practicc, this means the threat of penalty for non-performance, after the event. Alternatively) it may be executed and controlled directly with the help of some form of system. Monitoring and control will be discussed in the context of these alternatives.
When used in project management , the words monitoring and control are often used as ifthey were interchangeable. Computer systems for handling and reporting cost data are more likely to be called cost control systems than cost monitoring or costing systems. This terminology is unfortunate , because it can obscure the reality of project control by giving the impression that it can be done by some automatic, dispassionate and perhaps even painless process. In fact, there can be no such thing as a project control system. Project control is exercised by managers, and perhaps by other people, who take action which influences future events. Usually, the actions will be based on decisions made after a study of the fac ts; that is, on the results of some form of monito ring process. A formal and systematic monitoring process will form a management information system (MIS). A good MIS will provide managers with a sufficiently accurate statement of the current state of a project for making sensible decisions, and will also enable the
84

MONITORING AND CONTROL
manager to make a prediction of the likely results. Control and taking action must be based on authority and power. In most cases this is drawn from some form of contract. For example, clients may have the contractual right to charge their contractors liquidated damages if they run late and contractors will have the power to require subcontractors to remove defective work and repeat it properly. Contracts also place obligations and constraints on the parties to them.
It is quite useless to provide a project manager with information about something which he is powerless to influence, so the basis of authority - in practice the' form and content of the contract - will determine the objectives and design of the MIS. Thus, before explaining the process of monitoring and control of construction work, it is necessary to describe the contractual framework. This begins with an analysis of the apportionment of the risks involved, because this is the basis of contract strategy.
5.1. Control of risk Imagine that a port authority wishes to build a new container
terminal. From a knowledge of the current shipping market, it
Table 15. Risks facing a port authority considering building a new tenninal
Type of risk Examples
Commercial There may be a shipping recession. Another port may construct a more attractive terminaL
Disaster The project may be delayed, damaged or destroyed a natural (or man-made) disaster.
Design The terminal may not be efficient to operate. The terminal may prove to be structurally defective .
COSt Estimates of construction cost may be too optimistic. overrun Efficiencies of workforce and construction plant may
fall below acceptable levels.
Time Estimates of construction time may be too optimistic. overrun The workforce may work inefficiently and take
longer than the schedule allows.
85

CONSTR UCT I ON PL A NN I NG
is calculated that for the terminal to be economically viable , (i. e. to attract container business away from other ports), the construction costs must not exceed £10 million and the terminal must be operational within 18 months. The risks facing the port authority are summarized in T able 15 .
The commercial risks will be borne by the port authority. Although it may seek specialist advice from experts in world trade and maritime affairs, the actual financial risks of a failure in commercial judgement will remain with the port authority. The risk of delay or damage from the effects of a disaster will almost certainly be covered by insurance, leaving the port authority with a number of choices, shown diagrammatically in Fig. 43, of how to apportion the remaining risks.
Commercial risks
Retained by authority
I Risks from disaster
j Passed to insurance undelWriters
Reta ined by authorily in·house design
Design risks
Oplions
I Cost over· run risks
Oplions
Time over·run risks
Options
r p-;SSed-;o -1 I design & build \.---------'
L~~~_J Fig. 43. Who ends up with ehe risks?
86

M ON ITO RI NG AND C O N TROL
It is poss ible , but unlikely, that the port authority may choose to design and construct the terminal using its own resources; in this case it accepts the design, cost overrun and time overrun risks. If the authority is a large one operating a number of ports, it is likely that it will decide to accept the design risks by using its own designers but avoid the risks of cost and time overrun by having the construction done by a contractor.
The two remaining options are to pass the design risk to a consulting engineer and the construction risks to a contractor; or, to pass all three risks to a contractor with experience in the design and construction of such projects. Once the risk has been passed on to another party, as far as the port authority is concerned, it has been effectively controlled. This example illustrates that a contract is a device for controlling risks by passing those risks, for a consideration , to another party.
The first exercise in the control of risk is always to decide how much risk to pass on to others (by contract or subcontract) and therefore how much to retain. Having made that decision, those risks that remain must be monitored and controlled.
5.2. Client's control The relationship between risk and control is best illustrated by
a discussion of two extreme contract strategies, illustrated in Fig. 44. The fixed price, lump sum contract passes most of the risk
Contract form
Cl ienf s acceptance 01 riSk
CI,enf s power of dj,ect control
Fi~ed
r~~~ _--,-R~'~"!~:~~~fod~,,~:~m~'~", __ ;t~~t ,"m
Minimum Max,mum
M'OImum
Fig. 44. Illustration o/ the relationship between cOlllract/onn. control and risk
87

CONSTRUCTION PLANNING
to the contractor. It also gives the contractor the right to control the execution of the work, and the data relating to cost are private to him. At the other extreme, in the case of the cost plus contract, the client reimburses the contractor for all direct expenses - the COSt - and also charges for management and other overheads -the plus. In these cases, the risk is with the client, but so is the control because the client is free to direct the work as he wishes, and has direct access to cost information to help him make decisions.
In the fixed price, lump sum contract, the client can monitor progress but there is little that he can do to control it. In most cases, the contract will be an entire contract, for the delivery of the whole of the works on a specific date . There will be no practical provision in the contract for adjusting the price for changes or extra work, because these are not expected. This form of contract is analogous to firing a gun: the direction and speed of the bullet cannot be influenced after it has left the gun barrel j thus the client can monitor progress and technical performance only. Nevertheless, the client can manage the project: developing a good spirit of co-operation, ensuring that payments are made promptly. If progress falters the client and his representatives can influence the contractor by continually emphasizing the problems and persuading the contractor to take action.
In the case of contracts where the client maintains more direct control - cost plus being an extreme example - then the client has access to information on costs and resource usage, and so can use some of the management information systems used by construclion contractors.
5.3. The contract programme Most forms of contract require that the contractor will provide
a programme for the complete project at an early stage, and that the programme shall be acceptable to the client. This contract programme forms the basis for assessing the progress ofthe project. In the standard form of civil engineering contract, this requirement is given in Clause 14, which states inter alia
14. (I ) Within 21 days after the acceptance of his T eoder the Contractor shall submit to the Engineer a programme for his approvaJ showing the order of procedure in which he proposes to carry out the Works
88

M ON I TO RING A N D CONTR OL
and thereafter shall furnish such further details and information as the Engineer may reasonably require in regard thereto. The Contractor shall at the same time also provide in writing for the information of the Engineer a general description of the arrangements and methods of construction which the Contractor proposes to adopt for the carrying out of the Works.
(2) Should it appear to the Engineer at any time that the actual progress of the Works does not conform with the approved programme referred to in sub-clause ( I) of this Clause the Engineer shall be entitled to require the Contractor to produce a revised programme showing the modifications to the original programme necessary to ensure completion of the Works or any Section within the time for completion as defmed in Clause 43 or extended time granted pursuant to Clause 44(2).
The legal status of this programme is complex. It is not necessary for the contractor to work to the programme. The contract requires that the entire works be delivered on the specified date . The contractor is not required to deliver each item on the programme on the date shown on that programme, because this would subdivide the project into a number of projects. In this case, the defects liability period for each part would start from the completion of that part , rather than from the completion of the whole project, which will give rise to administrative and financial difficulties.
Thus the contract programme can only be used to guide the client 's representatives on whether the actual progress achieved at a particular time is sufficient to make it likely that the planned completion date will be met. Of course, contractors who are behind schedule will argue - often realistically - that they will catch up later , so progress has to be quite substantially behind schedule before the client can have any real influence on the contractor.
'Who owns float?' is another important issue in the contract programme. Take for example a case where due to an unusual technical problem the client 's engineer is late in providing the drawings for an activity on the contract programme. The start of this activity is delayed by three weeks. The contract programme is in the form of a network, from which it is clear that this activity has four weeks float. The engineer argues that there is therefore no problem, and that he will not consider claims for the cost of the delay.
The contractor puts forward the counter-argument that he owns the float, because of the entire nature of the contract, and he needs lhis to make best use of his resources through systematic
89

CON S TR UC TIO N P LANNING
schedul.ing . In the Authors' view, this argument is correct, especially in the case of well-organized contractors. Of course, quantifying a claim for the cost of delay on an activity with float will be very difficult , taking into account that the contractor will have a duty under common law to mitigate the effects of this delay. Despite this, the principle that the contractor owns the float must be respected , and clients should not rob him of this important managerial asset.
In turn, main contractors will not wish to pass float on to a subcontractor, because they will need this to juggle with the progress of al1 the subcontractors and the directly controlled work so as to achieve the desired overall result. Thus subcontractors will be given firm start and finish dates, and will be expected to plan their own activities so that their own plan includes adequate float.
5.4. Contractor's control The contractor has to decide what work wil1 be left to subcon
tractors and which he will do directly. If a subcontractor is used, the contractor becomes a client and much of what has been written about control by the client will apply to the contractor. If he uses his own resources, he must realize that each of the major categories of resources will have its own control characteristics, and must be managed in an appropriate way. Table 16 summarizes the ways of monitoring construction resources and makes some suggestions about ways in which they may be controlled.
Monitoring and control is the core activity of site management , and has to be done effectively and efficiently. There are three essential components
• collecting information about the actual achievements on the project
• processing this information into simple reports which compare planned and actual progress in a way which can be understood quickly
• taking necessary control1ing action, replanning as necessary.
This is a cyclic, regular process, which requires persistence on the part of the managers and planners ; it is illustrated by Fig. 45. It is essential to find some effective level of information gathering and processing which gives reasonably accurate and relevant infor-
90

MONITOR ING AND CON TROL
Table 16. \flays of morliron"lg comrnlcriorl resources and cosls
Principal What can go How can resource Some possible resources IYrong? use be monilOred? control Ilnd costs measures
DirC'Ct Labour Low output. Regular. cost/income Replanning. rom Indust rial action. compansons. Bonus systems.
Sickness and S-curves. Enlightened absenteeism management and
welfare . Plant Low outputl Regular costl income Oper3lOr
misuse. compan son. training. Breakdowns. S-curves. Preventive Theft . maintenance.
Security marking. Materials Waste. Regular reconcilia- Delivery checks.
o.·eruse/misuse. t ion of delivery Setling-out Shon measure. and use. checks. Good Theft. S-curves. housekeeping.
Secure compounds.
Subcontracton Insolvency. Progress monitor- Financial and Inefficiency. ing. F irm technical vetting Incompetence. negotiating. before contract.
On·site Site staff Too manyl Compare actual Issue written job o\'erheads tOO few. COStS with descriptions.
Inexperienced. forecast staff costs Control manning. Lack of skill and other project Practical training. and understand- staff costs. Provide ing. motivation.
Site offices, Full establish- Compare time- Ad just equipment, ment remains related est.ablishment to lranspon, etc. on site after establishment COSt suit turnover.
reduction of with turnover. level of activity.
Off'si te HQ office Plenty, but not overhead s COStS within the scope
of this book. Insurance Poor damage Accident Disciplinary
and accident reponing system. measures for record pushes artlessness. up premiums. Tnining .
Finance COStS Heavy stan-up Value-income Quicker COStS not monitoring. certification. matched by Rigorous credit early income. conlCol. Good Client slow to client relations. pay.
91

CONS TRU C TION PLAN N I NG
o 0
&>~-----~~ Galhe/the laC1S about progress and cost (USIng a M IS)
~~ X~_AePlan
", A. ... , I 'y" ,,/ I
Itememo I vo ,_ L.-:/
< , ,
Pr()(;eSSln10 SlJ(;Clnc1and meaninglul reports lor managers
,,~
ashllow
!l ... ) ""} 0 0 0
<:~~~~""''''''''~J~ ~ ~l<€? " ,", \ ~~~:I~;~~',~~~~SSmenl
",/ '-.\ al1e rnallves
Fig. 45. The cycle of monitoring and control
mation without wearisome and time consuming effort. The methods given in this chapter may appear to be fairly simple, but experience has shown that they can be used effectively week-in, week-ollt , on most projects. To maintain very complex, delailed and nationally more accurate and precise systems has been faund to cansume so much effort that frequently the system falls into disuse (after an initial period af enthusiasm) leaving no monitoring and control system at all . A careful balance has ta be struck between simplicity and accuracy. The Authors believe that more sophisticated systems
92

M ONITOR I NG A N D CONTROL
should only be introduced after these simple systems have been established as working lOols.
5.5. S-curves: the basic tool Figure 42 illust rated how graphs may be drawn showing the
cumulalive amount of planned resources against time. If such graphs are drawn for actual projects, they usually have the characteristic S-shape shown in Fig. 46. This shape reflects the pattern of activity of most projects, which take time to gather momentum, have an intensive main period of activity when most of the resources are consumed, and a finishing-off period, when the level of activity dies away. S-curves may be drawn for people, money, materials such as concrete and other resources, and may thus form the basis for controlling the use of those resources. The overall progress of the project will be monitored by using total project costs and values, and it is this overall control chart which is shown in Fig. 46. Progress may also be assessed by monilOring a few key activities.
The basic cost/value S-curve shown in Fig. 46 is common to
Estimate of final cosVvalue (cont ract sum)
Curve 3: actual / COSVvalue ~
/
/
/ /
/
/ /
I I
I I .
CUfrent date
ConstructlOfl perIOd
Fig. 46. Basic cost/value S-curve
Intenaroce .
"""" 93

CONS TR UCTI ON PLA N NI NG
both client and contractor. To the client it represents the rate at which the cost of the project will be incurred , and the amount and timing of the cash payments. To the contractOr, it represents the rate at which the work will bring value to the firm , and also of course, the timing and amount of cash receipts.
Curve 1 is the cumulative cost or value of the work done dayby-day, according to the cost/value of each activity at its planned scheduled date. Curve 2 is calculated from curve I by interpreting the contract conditions for payment. Most construction contracts allow for the contractor to be paid for the work in stages, rather than in one single sum on completion. The contract defines the period of the valuation, the maximum time between valuation and payment, the amount of money to be retained by the client to safeguard his interests in case of the discovery of defective work, and other items such as payment for materials brought to the site but not yet used. This contractual information enables the planner to calculate the values for curve 2. Note that usually some of the retention money is repaid at the end of the construction period (on substantial completion) and the remainder after a maintenance period during which any defects which are revealed shall be corrected.
The cost/value curve is a convenient basis for assessing the overall progress of a project. Money is a common factor in all the numerous resources and activities in a project , and may be usually used as the common measure of progress (but see section S.lO).
Progress achieved at the end of each period may be assessed by valuing the work actually completed, in the same way in which the original planned value was computed. Thus curve 3 shows the cost/value of the work completed to date, period-by-period. Time is measured on the horizontal scale, so the amount by which the project is ahead of schedule may be read off the graph. The percentage of work complete is given by comparing the actual and planned cost/value as follows
percentage complete actual cost/value x 100 estimated final cost/value
Fig. 46 shows a project ahead of schedule, but the same principles apply, obviously, to projects behind schedule. Equally it is possible to revise the planned cash payments curve (curve 2) to reflect the actual progress, but this has been omitted for reasons of clarity.
94

MONITORI NG A ND CONTR OL
From the d iscussion on client comrol given in section 5.2, it is possible that control curves of this type may satisfy the needs of a client entirely; they must be supported of course by explana· rion and interpretation.
5.6. Contractors' control curves Progress monitoring is expensive. It requires a large proportion
of the planner's time and also of those who will supply the infor· mation . Thus some effective level of detail has to be established, but , more importantly, the items that are to be monitored must be selected carefully. It is not economic to monitor everything, so the project manager must select those items for monitoring that will give him sufficient information to exercise control. For most projects control curves will be drawn for
• progress, cost/value comparions
• cash flow
• labour, perhaps with plant and equipment
• a few key activities
• a few key resources.
To most contractors, the comparison of cost and value, and the control of cash flow (which is the driving force of contractors) are crucial. Thus curves I and 2 are most important.
5.7. Control curve for progress and cost/value comparison Figure 47 shows the general form of such curves. The planned
accrued value curve is the same as curve 1 in Fig. 46. This gives the cumulative planned value of the work done. As the project proceeds, the actual value of the work done at a particular date may be estimated fairly accurately, and this may be ploned in a similar way, as in Fig. 46. The amount of time that the project is ahead of or behind schedule may be assessed. The addition of the cumulative total cost line will give an indication of profitability; care must be taken over the use of this term, because profit only has real meaning for the firm as a whole, not individual projects. Thus the word contribution is more generally used, meaning the contribution the project is making to the general overhead expense and profit of the firm, after deducting the direct project costs.
95

CONSTR UCTI ON PLA NN I NG
i I
Actual accrued value
/ /
Aheadot schedule
, ,
Additional contnbullon
Z Actual ;;; aCCflJed
; cost
Cunentdate Time
Fig. 47. Concrol curve for progress a"d cost/value compariso1'
This control curve is crucial to decision making. It is important that it is prepared speedily and promptly, usually monthly but often weekly. To achieve timely production of the chart , it is often necessary to use approximate or simplified data, rather than detailed and accurate figures. These charts are for decision making, where time is the essential factor. Of course prudence indicates that these systems are subsequently validated and corrected by more detailed management information systems.
5.8. Cash-flow curve Figure 48 shows a cash-flow control curve. It is the same as Fig.
46 but with the addition of a curve showing the cumulative payments to suppliers (and the actual payments of other costs). Thus the difference between the planned payment line and the planned (i.e. expected) cash payments from the client gives the planned working capital requirement for the project. The maximum difference between these two figures is the maximum cash expected to be required by the contractor to run the project. The total area between the curves (shown shaded in Fig. 48) will be in units of money multipled by time and if multiplied by an appro-
%

MONITORING AND CONTROL
priate interest rate (or, more correctly, cost of capital), then this will give a good indication of the expected cost of financing the project .
The computation of the plmmed payments to suppliers line will be difficult and tedious. It is often accurate enough (for control purposes) to make the approximation that this curve will follow the planned accrued value curve by a fixed delay - say four weeks. This fixed delay may be estimated from a study of a sample of actual payments made by the firm for major resources such as labour , plant, concrete, steel , bricks, etc. By noting the time difference between the date of use of these in the project , and the date when the payment was made, an estimate of the payment delay may be given by taking the weighted average of cost times payment delay. Such approximations may give timely information of sufficient accuracy for management decision making; the alternative may be to provide accurate information but to accept the necessary time delay.
With high interest rates and small profit margins, control of cash has become of paramount importance for the survival of many [trms. The cash-flow curves shown in Fig. 48 can be used as a
Curve 1 : planned accrued costlvalue
Curve4 : I
Maximum planned work.ng capital
Fig. 48. Contractor's cash /lOU) curve
97

CO N S TR UC TI ON P1.A N N I N G
basis for monitoring the actual cash flow, and for predicting future cash flows.
5.9. Control curves for labour, plant and equipment Labou r may be termed an active resource . However automated
construction work becomes, machines will always be controlled by people. This active quality of labour content of a project means lhat manpower performance by itself is an indicator of the overall progress of the project . Thus control curves may be drawn for either man-hours or labour cost , and will take a similar form to Fig. 47.
Monitoring progress on the basis of man-hours is common practice in the oil , gas, process and petrochemical industries. Here a common procedure is as follows.
• As part of the tender conditions the contractor has to provide a detailed breakdown of the true man-hour content of his tender for monitoring progress. Even better , a man-hourresourced network is used as a contract programme; this will enable a computer to be used for periodic monitoring.
• After tender award a monitoring bar chart is prepared, for example as shown in Fig. 49, to show the percentage ofthe total project that each activity represents; this is known as a weighting. These weightings are entered in a column on the bar chart , (hen each weighting is divided by the number of monitoring periods in the activity to arrive at a unit weighting.
o For example, given (hat the total project is to take 100 000 man-h , activity I (excavate foundations) is planned to take 10 000 man-h, its duration is two weeks, and that the monitoring period is one week, then
weighting of activity 1 = 10 000 x 100 10% 100 000
unit weighting (per week) of activity 1
10% 2 weeks
S% week
• For each monitoring period, the unit weightings of all activities are summed and entered at the bottom of the chart. These progress sums may be ploned as a histogram or cumulatively as a programme S-curve.
98

Al ONITORI NG AND CON TROL
Wook ACllvlty WOlglltmgs , , 3 , 5 6 ,
, Excavato
" /' foundations 5 5
Concrete / , foundations " '·5 ' ·5
3 Columns 5 ' ·5 ' ·5 / , Roo' 30 " " 5 Floor 30 / " " • Flfllshes " ~ I 10
~/ ")0 ~
P'ogramme wee!< 5·0 t2·5 to·O 17·5 300 15·0 10·0
cumula tive 50 17·5 27·5 45·0 75·0 90·0 100-0
Plogress week ' ·0 10·0 10·0
cumula llve ' ·0 14·0 24·0
Fig. 49. Weighted man-hour progress chart
• To monitor progress it is necessary to assess the progress of each activity on a percentage basis. These percentages are applied to the activity weightings to produce progress weightings and the progress weightings summed to find how the project is progressing in terms of percentage of work complete. This percentage is plotted in comparison with the programme S-curve.
This procedure provides a visual comparison of S-curves and also an accurate progress percentage figure for reporting purposes.
In the offshore industry a number of individual projects, some geographically remote , may have to be progressed simultaneously to a common completion date . To have gas wells and pipelines ready to produce but unable to be commissioned because the onshore reception facilities were incomplete would be unthinkable.
99

CO NS TR UCT I ON PLA NN I NG
It is in these circumstances that the need for accurate and frequent monitoring is quickly understood and the increased costs of planning staff easily justified.
In his excellent book on the use of network analysis in project control , Albert LesteriO describes an alternative to the weighting method, and develops this approach to progress monitoring in some detail. A graph of man-hours has the advantage of being independent of changes in wage rates or the value of money, but the use of cost is more realistic and makes it easier to integrate the labour data with other control data, which will be in monetary units. Plant and equipment may also be considered to be active resources, because they are used and controlled by people. It is these active resources which achieve progress on a project, and thus a control curve for labour, plant and equipment (in financial terms) will give a good measure of general progress.
5.10. Monitoring progress by key activities and resources The physical progress of many civil engineering projects may
be monitored by consideration of just a few items. For example, tunnelling is essentially about boring and lining; the construction of a concrete dam is essentially achieved by placing concrete. Curves comparing planned and actual achievement may be drawn and updated daily, giving a simple and immediate control tool.
5.11. Control of materials In contrast to labour and plant, materials are a passive resource.
They are subject to wastage, theft , decay and physical damage. They may be stockpiled , stored and, in some cases, reused. They require separate methods of control , and cannot be included in the general project monitoring and control systems described previously.
5.12. Monitoring line-of-balance and linear programmes Figure SO shows the line-of-balance schedule given in Fig. 19,
updated to show progress at week SO. This shows that the foundations gradually fell a little behind schedule but not enough to cause problems. Walls started late and are proceeding more slowly than planned, whereas the roofers are working faster than planned and so will soon be brought to a halt by the wall builders. Urgent managerial action is needed to increase the rate of wall production.
100

" 9
,
MONITOR I NG A N D CONTROL
10 20 30 40 50 60 70 SO
Workiogdays t Progress alweek 50
Fig. 50. Line-of-balance schedule for ten-house project: progress at week 50
This simple example shows how effective line-of-balance can be in monitoring and control. Unfortunately, showing progress on a complicated line-of-balance programme can simply result in a mass of incomprehensible lines. To be effective line-of-balance programmes must be kept at a fairly simple level of detail. Linear programmes can be updated in the same way, and the same simplicity is Obviously required.
5.13. Management infonnation systems This guide is about construction planning. In this chapter, the
basic concepts have been explained and it has been shown how planning and planning techniques may be used to form the basis of monitoring and control. What has not been described, and is beyond the scope of this guide, is how management information systems are designed and implemented to provide the necessary information. These systems can provide the basis for control of
lOl

CONSTR UC TI ON PLANNING
al1 the resources and costs shown in Table 16, and so they can be complex and therefore need to be explained in more detail than would be appropriate here. Further information can be found in reference 11.
102

6 Putting planning into practice
This chapter concentrates on the more practical and organizational aspectS of planning . To be effective and efficiem, planners need a good environment. with adequate space and good sources of information . Planners must make a careful and methodical appraisal of a new projece They have to interact with the other members of the project management team, and so must develop skills of communication and presentation. An example is given of how the plan is developed -shaped - 10 produce an effective solution, based on an actual projeel. Construction projects are dynamic and ever-changing, and this powerful influence on planning is analysed.
The preceding chapters covered the elements of the planning proceSSj the early decisions to be made, techniques, resource analysis, monitoring and control procedures. This chapter looks at some of the practical aspects of using these elements to produce working plans. Fig. 51, which follows the planning process from the original brief to the handing-over of the working plan, serves as a guide to the sections in this chapter.
6.1. Working space The planner's flrst essential is a working environment free from
disturbance. The task of assimilating information from drawings and documents, building the project mentally and then writing down those building instructions is difficult enough without distraction from intrusive telephones and talkative colleagues.
There will of course be those important meetings with others when shaping the plan, but , for the most part, with the exception of short-term programming, detailed planning is essentially a solo activity. Therefore the planner 's office should be as self-contained
103

CONS TR UC TI ON PLA NN IN G
~ What sort ot prOlect?
SeClion Inlt,al appraisal.
agenerallook at the What are the major leatures. 62 prOject data risks and conditions?
~ Whols the plan tor? " Earty deciSions: What IS the level oldetali? " whal sort 01 plan IS needed? What hmescale? '3
63
[:2] DetaIled appraisal : Whal are theconstralnls? a methodical second look at What are the risks?
6A theprojectdata
lei PrOject team conterences: Br lehng the team 6.5 essential two-way Involving the prOject manager commufllcallon
ESJ 3'
Planning techfllques ' Bar charI. line·ol·balance. 35 appropria te methodsot Imear programme or network? 3.6 analysis
3.7
[QiJ Resource scheduling: Aggregallon. smoolhlng. men. machines. materials levelling money and time
~ Shapmg: Could more resources reduce 6.6 tla lancmgdlrectcosts and project time and cost?
s,te overheads
~ MOnitOring: Controlling risk 5. ,
keeping the plan on the rails MOflltOrlng resource use " Fig. 5/. The elements of planning and control
as possible with all equipment, documents and reference books easily to hand. Sharing commonly used reference documents is a false economy, because every borrowing sortie is a potential source of distraction for both borrower and lender.
In the early stages of planning the planner will want to keep sight of the general arrangement and site layout drawings while referring to the various detail drawings. It will ease pressure on the precious table space if these general layout drawings can be pinned to the wall. They will be to hand when the planner needs them and available for the conferences and briefing sessions that will be necessary later. Here then are two further essentials of the planner 's office: plenty of table atld wall space.
104

PRA C TI CE
6.2. Initial appraisal For most planners a project begins with a pile of documents and
a roll of drawings. A planner working in the post-design phase may receive drawings that have been completely detailed with specification and contract documentation complete; planners working in an earlier phase may only receive a few sketches and an oral briefing. Whatever the scale of supply, the initial data need to be appraised twice: screened generally for an initial appraisal, then later assessed in detail to extract the essential project features that must be allowed for in drawing up the plan.
The initial appraisal is to enable the planner to learn just enough about the project to organize the planning period . This appraisal should take only an hour or two and generally will be achieved by seeking the answers to such questions as
• Where is the project and how is it accessed?
• What is the function of the project? How does it work?
• Where are the site boundaries?
• What are the major features and how do they relate to each other?
• What are the principal quantities?
• What are the obvious risks?
• What are the contract conditions?
• How long is the contract period ?
For the planner who has to assess many projects it saves time if a standard check-list is prepared incorporating these and other questions; an example is given in Fig. 52.
6.3. Early decisions The understanding of the project gained by this initial appraisal
enables those fundamemal decisions discussed in chapters 2 and 3 to be taken. These fundamental decisions are
• Who is the plan for?
• What is the time-scale?
• What is the level of detail ?
lOS

CONSTR UCTION PLANNING
INITIAL PROJECT APPRAISAL Oate a 1 ~ BV :J C
1. Projecl hlle
2. Client )( Y Z. Foods p le
3. ApproJ{imate value
4. Plan !Tender required al Place g.,..,st.ol. Oate 14 2 S8 Time 12 00
5. BrIef description 5 ' ''3te. st:o .. ~ p".,..t:.o,.t f~ ........ c. ........ s.~
6 . Coodilions 01 contract
7. Method 01 measurement
8. 51andard specil ication
9. Covering letterlinvilalion
10. Special condilions
~,.k_... .. C:C:O'Y'ood a.t.l 0<'1 . ... _ t...rn4O..l. .... orlcS
ICE 5t1bSe 0 I 3 1 <l6T ", ..... ..,..,d. '"
SESt l' 121 9T" Shln6 ......
r-ACTION
p .. ~ .. ...,..., ........................ od .t. ... t.~t.1 .I e. c.oll~ -F .. .-
E"t.~; ...... -c;. ......... -F.....l UOQ .... . """-t.-O<"' Sen OS .. c.,..... . ...... '"
11 . MM amendmenlS No" ...
12. Parlicular specification N .. ",~
13. aoo
14. Form of tender
15. Formls of bond
16. Other documents
17. Form of contract
18. Payment terms
19. Design requirements
20. Access
21. PrinCipal quantllles
22. Ma/Ot' features
23 Risks
F ... c.t.Ot",!:I -Flo ..... 0,."""" 1000,..,<1. E.t.. n""""'s t.a.ndlnj 5000 .... "-
P .. .-t.o..l ( ............. to ...... lol."., E" .. ....,... ... " M .. IE , .. I><:.O., .... o..c:"
Nou-.,,,.j ............ s'"' ... , Hi.9 ..... l,,,~ of' 01 ...... ....,... £..!OOO/d":::1
----------~~----~-----~ 24 Planning needed
25. Planning time estimate
Nc.~t:-toa.&.d to ...... """' .. t.j .... 'o-o<l s ..... t. ....... ..........s
IIt'I:l.jOltJjSi t.c.ljPl ........ :2 To t.Gl4'f:l.
Fig. 52. Example of a standard initial appraisal check-list
106
ere

PRA CTI CE
• Which planning techniques should be used?
Answering these latter questions, perhaps after referring to Table 2 and Fig. 7. will leave the planner with a very clear idea of the form and content of the plan he must make. For example, a planner working for a management contractor at the start of a commission to design and build a sewage treatment works might decide that
• the plan is for the project manager to enable him to administer and co-ordinate the designers, subcontractors and suppliers
• the time-scale must include not only design and construction but proving, commissioning and maintenance periods, approximately 3 + 12 + 12 = 27 months
• the level of detail needs to be accurate enough to record the arrival and departure of subcontractors and therefore the programme time unit should be weeks rather than months
• the project is complex and will involve many parties, and therefore network analysis is an appropriate planning technique
• because the management contractor intends to pass on much of the risk to subcontractors. the details of labour, plant and materials resources are not a primary concern. There will therefore be no need to carry out resources analysis at this stage of the planning.
Table 17. Time allowed for planning the example project
Activity
Detailed appraisal of feasibility study Research a similar project completed
last year for another client Draw up a network Time activities and input network data
Onto computer Print bar chart as output, check results
and draft short covering report
Total
Time allowed: days
0·5 0·5
0·5
3·5
107

CONSTR UCTION PLANNING
To continue with the example, when the planner has made these early decisions, he is then able to assess how much time should be allowed for the planning . As the project is at an early stage and the only prime document is a consultant 's feasibility study, the planner draws conclusions which are given in Table 17. With a clear idea of the task to be undertaken and the time required to do it , the planner can move on to the detailed appraisal.
6.4. Detailed appraisal Whereas the initial appraisal may be dealt with quickly by a cur
sory examination of the drawings and documents, the detailed appraisal needs to be undertaken methodically and carefully, and , most importantly, 0111y orlce. A project brief may contain any or all of the main documents listed in Table 18 as well as references to a number of secondary documents.
Reading documents efficiently requires method . What is the reader looking for? The answers are
• generally
o any instruction or specification departing from the accepted normal standard (as laid down in the secondary documents)
• specifically
Table 18. Mairl and secondary terlder documents·
Main documents
Covering letter/invitation to tender Special conditions Particular conditions of contract Amendments to method of measurement P~amble to the bills of quantities Bills of quantities Particular specifications
Site investigation report Programme Drawings Form of tender Formes) of bond
S«ondary documents
Conditions of contract
Standard method of measurement
Standard specification British Standard specifications
Standard details Background drawings available for
inspection at client 's offices
* A SCt of tender documents may not include any of the secondary documents listed here. The planner will need to have a SCt available and be familar with the contents.
108

PRACTICE
o any instructions concerning possession of the site or restriction of accesses
o any other instructions affecting the planner 's freedom to plan the works
o any design rules affecting construction, for example, speed of placing filling material , minimum age for loading concrete structures.
To ensure that this detailed (and often tedious) appraisal is only carried out once, referenced notes must be made. When these notes are attached to the preliminary appraisal checklist, they provide a distillation of all the main issues affecting the plan; their importance cannot be overstated.
If the documents under appraisal are planner's copies which do not have to be returned to the client , reference numbers may be marked in ink directly on to the margin of the document. If this is not possible a light pencil number in the margin and/or a paper flag stuck to the page may act as markers. Each note should precis the point made in the document and echo the questions raised in the planner 's mind when he read the original text , as shown in Table 19.
As this appraisal will be read by anum ber of other people in the project team who may wish to refer back to the source documents for clarification, the importance of a clear reference system is obvious.
Table 19. Example of planner's notes on a detailed appraisal
Reference Page Item Comment
42 15 Specification calls for This could hinder pro-beam soffit shutters gress. Enquire client's to remain for 14 days reasoning . Can this after casting concrete. period be shortened?
43 17 On-site batching is Estimator to make specified. allowance for setting up
batcher, or qualify tender for ready-mixed concrete supply.
109

C ONSTRUCTION PLA NNING
6.5. Planning and conferring After the detailed appraisal the planner may begin to plan. All
is to hand: the layout drawings are on display; the detailed drawings are piled in order; the appraisal notes are complete; the office is peaceful and telephone calls have been diverted.
The process of building up the plan will entail a number of conferences with colleagues. The first of these may take place after the detailed appraisal. This is an appropriate time for the planner, who by now has a good knowledge of the project, to brief the remainder of the project team, who will at this stage know little or nothing about the project. Such a briefing, together with a set of appraisal notes, will undoubtedly save the other members of the team many hours of reading.
At this point the project manager must begin to participate actively in the planning process. He should work with the planner to establish the broad strategy of the plan, complementing the planner 's detailed knowledge with his own broad experience of construction and his knowledge of company resources and policy. The project manager might comment on site conditions, e.g.
• there were serious groundwater problems in this area 10 years ago. Arrange for some additional trial pits.
or use of resources , e.g.
• a batching plant will become available shortly; check if the concreting operations can be programmed close together to make site batching economic
or perhaps on risk
• this project is beyond the company's experience and fraught with potential problems. The company should not tender for it.
Near the end of the planning process a further conference may be called to brief the project team and collect their comments, criticism and advice. Such conferences require the planner to master a few presentation skills if ideas are to be put over clearly and thereby claim the attention (and co-operation) of colleagues. The secret of successful presentation, as in concreting, or any other process, lies in careful preparation.
• Separate the drawings and charts needed and place them in the order of display.
110

PRA C TI CE
• Colour areas of drawings which need to be referred to.
• Have suitable wall or table space available to display drawings.
• On one side of A4 paper list the main headings of the presen· tation in a logical order, for example
o introduction: project history and purpose o location and access o project description o outline programme and methods o resources o summary of problems.
Usually the planner will be so familiar with the project that he will be able to speak quite fluently without notes, requiring only the list of main headings and the plans as reference documents.
Planning conferences need to be carefully minuted; problems identified, decisions made and actions called for must be carefully listed. It is good practice to circulate these minutes promptly to all those involved as a reminder to take any actions called for.
6.6. Shaping the plaD Although at the outset there may appear to be many ways of
building the project, the planner's careful appraisals, consultations and deliberations will eventually narrow the options to a single, reasonably robust plan of construction. The project activities may then be resourced and this plan tested to see if it meets the require· ments of project time and imposed resource levels. If the plan sur· vives those tests, it will then require shaping to ensure that the resource levels provide the most economic construction cost.
Shaping is balancing direct costs against site overhead costs to give a minimum construction cost; it is the operation that con· tractors carry out when refIning their tenders and it usually has to be done on a trial·and·error basis. Fortunately, there is now network·based computer software available which enables any number of trial·and·error solutions to be carried out quickly and relatively painlessly.
" Shaping is done by drawing a cost·resourced network to accom· modate not only the direct costs but also the time-related indirect (or overhead) costs as hammock activities. Examples of time-relat~ overhead costs are: maintaining site offices and workshops; site
111

CONSTR UC TI O N PLA NN I NG
supervision; general site plant. Sometimes major plant items such as a tower crane, cofferdam, central batching plant, floodlighting, scaffolding or a generator are also time-related overhead costs, There may be also finance and management charges levied on a time-related basis.
Figure 53 illustrates an accommodation bridge to be constructed to carry a minor road across a new dual carriageway road. The bridge is to be built under a separate contract from the main road works and the client has stipulated that the bridge contractor shall provide a full time agent on site. The contractor's project manager believes a full time agent for such a modest structu re to be an unduly burdensome overhead and asks the planner to take the site overheads into account and programme to achieve least cost.
The planner, intending to use a computer program to find the <.. least cost solution, depicts the project in the form of a precedence '\ network (Fig. 54). He first links the activities by logic restraints assuming inflllite resources to be available and then adds the resource restraints (broken lines) using the following reasoning,
• One excavation team will excavate the four foundations in [Urn (restraints 210-310, 310- 410, 410- 510).
• Only one set of bank seat forms will be made (restraint 420-520).
• Only one set of pier forms will be made (restraint 230-330).
The next stage requires input from the estimator . The direct costs of construction activities are entered into the activity boxes and the site overheads added as hammock activities. Each hanunock restraint is positioned carefully to show the start and finish of the
"'" waletprooflng <i/rn;;;;;;;;er
WeSl bankseal
Easl pier
Fig. 53. Bn'dge used to illustrate shaping the plan
112

RHIt/WlC 231)-330 removed tor VIlfSlOll 2
Foremao carpenter
Fig. 54. Precedence network diagram for bridge shoum in Fig. 53 (version /)
o C)
eoeral ••
Hammock ac1ov,ry (SIte overheadl
Logocrestra,ot
Resou.cereSlra,ol

CO N STR UC TION PLANN I NG
particular overhead charge. For example, the agent, who costs £560 per week is shown for the total project time whereas the foreman carpenter, costing £420, is charged from the start of the pier excavation only until completion of the in situ deck (activities 210- 610),
Care must be taken in choosing the positions of hammock restraints to ensure that the network logic will not be upset should resource restraints be altered later.
Once the resourced network has been completed, the planner now enters the data into the computer. The results, in the form of bar chart and cumulative cost histogram, are shown in Figs 55 and 56. The planner notes the following .
• First version
o the project time is 24 weeks o the total cost £283 640 o the critical path goes through pier construction activities.
As the object of this exercise is to attempt to achieve an overall saving by shortening the construction period, the planner examines the critical path to see if additional resources can be applied to any critical activities. He decides that activities 230 and 330, construction of the piers, could be carried out simultaneously and alters the network by removing restraint 230- 330. He reasons that the cost of an additional set of pier forms might be more than offset by the savings in overheads. The estimator advises that an extra set of pier forms will cost £3000 so the planner amends the resource costs by spreading this extra cost equally over activities 230 and 330.
The data held on the computer are amended and a new progranune and cumulative cost histogram produced, as shown in Figs 57 and 58, summarized as follows
• Second version
o the project time is 20 weeks o the total cost £278 080 o the critical path goes through both pier and bankseat activities .
The comparison with the first version shows that the shortened programme offers a 16% time saving and a 2% cost saving; enough to win a tender or double a profit margin! Fig. 59 shows a graphical comparison of the cumulative cost.
114

_I · WOiUI fOUlJIU , VUSII. I _I ifill 'hI 1'IIIIItt1 .... " . IIfI'I', 1 ... 00
'" * '" m ,. '" .. ,. .. '" ,. '" .. ~
'" .. ,. '" * -M .. , m .. ~
"1ll1S!
U~'IUI"".''' o(S' PIli ClIISllIII:lo(ll ' I[I..s( too5ll1J(l lI!\I ,,[I
Uc..I'Ul MlIIlI., IOSI PILI ClIISllIllfOSI'ItI'*l( COiIiIIlltI LlII'111
UtQlJ[ II1II Ill .. II -.sf"
IOISlUl .tI ~1 UCWIIIJ[ .... IIlIIlCI-s£A1 OOIJSIIUt! USI_S[.I1
tlllSmJl:ll " W I OI(I
.(1"'_'" " 01 .. 1 __ ,
_lllIIl
IJrllllOll~
Im"'1 -~, r_c.nmt W(DtIoIOf
MAY eURN EY & C O . LTD. IfIMf.IIOfIIIf • • t6tl-llllll !>On " .. , a
1111[ ". 11 I'IDIfthACCONNOOAT ION BR I DeE ellU l,
" 11 II N 11 II li nn n n ~
~"
am; t([tt cem ernt
11111· Ism ssm ·
ssm S!I'I!I'I ssm ..... _ ... om
mtc &em ccm tem
, , t ,
ctro:cc:ro:ttrucrucro:tttmt,
- I I I ----------- ----- ----, .. I I I I ------------" " 10 ]1
."'1111", ttUUer,tll .1 SIms St .... I .. ... _. " .. , _ .. , .. , __ ."1,,, _ ' .... " Ul"m ' ''.'h'''' '' j.l. • .,]"1,,,.
v; Fig. 55. Bar chart for firs t version of bridge
I(mllr ~
," ~
'" m ,. '" '" .. ~ ". .. '" ,. ~
'" ,. .. ,. ,. -M ... m , . ••
."
'" :. C) 'l ;; '"

_ '- llsommIOllM'('ttulU.I1I'KIOlilOlS! • FIIlIO , \lUSIOOO t NOJItI Ml! ,1,1 NOlin Jl.UIIOIO ' P.I1SI , 114,00
MAY DURNEY .. CD. 1100$( • .iIli'l ICM.I.oHlll1l
LTD. ~ , ..II .. .. , • 11 111 11,11
"'IJItI, oIICCONNODATION BRIDIIE 01101,
_.11'
..• '.0
""ll eMI, 1.:<0 vlLL( , Its.II .1I !lALIUI'l \1 ' 111$, t l ' 1' 1.11
, ............... .. , ...... " .............. .. ..............................
, ................... " ......... . ... " .. ,'-,,, .. ,, ........ ,, ... . .. , ................................ .. , .......................... " .......... '
, .. , ... , ... , ... " .. " ... , .. , ........... " .. . , ... , ........ , ... , ......... , ...... , ........ ,' ............... " ............................ .. . ,,,., ........ , ... , ........ ,, ....... ,', ... ,, .... , .. , .... , ... , ........................................... . ......... " ...... ' ... , .... , ......................... ..
" .......... , ... , .. ,., ....... , .................. , .... , .. .. , ........................................................... . .. " .. , ............... , ... ,',., ... " ... " .. " ... , ......... , .... . , ..... , ................................... , ............. " ... , .... .
"' .. " .. ", .... """' ... "." .. "" .. " .. ,, ..................... .. ................ " ............ " ... " .. " .. " ........ "' .... , .. ", .. "' .. " ..... , .. .. .... ""''''''''''''''''''''''''''''''''''''" ...... '' ............................. " ....... ,, .... .. .... "'" ....... ' ........ " ............ " .""" ... ""'''''''''''''''" .. ,, .. ,,'''''''''' .. ,, ............... . " .. ""''''''''''''''''''''''" .. ,,'''''''''''''''''''''''''''''''' ......... ,, ...................... ,,'''''''""."' .. , ' .. " ......... ' ..... "."' .... ',.' .......... , .. '" .. , ......... " .. " .. "." .. ,,,.,,, ............. ,''' ..... ' ......... ' .......... ..
, ., .. " .... " ...... , .. , ... , .. , ...... , ..... " .. , .. " ..... , ... , .. " .. " ..... " .. "., ........ , ... , ....... , ... , ........ , ... , .............. , .. "."''''''''"."." .. "'''''''''''''''''''''''''"."''''''" .. ,,''' ................. ,, .. ,,,,''''''''''" .. """, .... ,, .................. .. , ...... , ....... , .... " .. " ..... , ... , ..... , .. , ................ , ............. , ... , .. , ...... " .. , ... , ...................... , ........ , ................... , ..
U II " II t. II II • " Fig. 56. Histogram for first version of bridge showing total cumulative cost

_ , . ... 00II, .,_ , IUII. I
~, .. " ,'" ~' _II. '''." , '"."
'" m ~ ~
'" ,. '" ~ ~
'" ,. ,. ,. ,. M -'" m ,. ,.
fltMO ll .... , •• ""1.1 0.l1li:' . "',1.1_ 0lIl"':' . " "1.1
[ltMlI '" . ,. tlSl ,,1.1 0.l'1li:' 0.' "1.1 ... 0.111(1 U$T m J
ca.!TIIC' . I' _ SUI 1ICM'111l filii U.' --..1 a.!T. ' 1.II1 _ lUI
Wtl . 'DI'WIf'. ,,,,.,._, ""1lS(
0I'"t:( ... ~ 1m ... , ... ,..., flllll"," t.WUIU II Ite..
=. =
M A Y BU~N~Y • CO _ LTD. 1_. _'OI. ~I~Jlt'
D. 1I1l ,
" It II n a " II " ~
1US1 SSS!;! ' "
= mu m$$ $$$SI IISIS _ ••
= eate , ttmm;ce==
I I
caee cern teae eaet etea met
I I I I I ----------------, ,,--- -----, " 11 II
- .... ....
..... ,
" n II ,I II " ~
...... m .... ",.",., "I.
Fig. 57. Bar chart for second version of bridge
-, IoI'f 00 ... , • 11 ... "" II
n 11 l '
n 11 I '
~" • "'1." ....
'" m
'" m ,. '" m ,. ,. ."
,. ~ ,. ,. ~
~ ... ,. ,. '.

~ -,11_ .111_ f. l~UIl ttll 'f[tS1. l MAV BURNE V • CO_ LTD. lD\!. "'I~. -.oHllnl
,~ , J1fuotr , _l fIO : IIt1U l 10011 ,1, 1 .. l lCl_lll1O 1 ... " , Ill ...
ill-''' ''' (lIllS, _ h"
.. " '.N
1111I tc$" I •• SIIIIS , [ I
,.Ut 01 to • • 1(.1( !I, "
. .....,----:.-= =---_.-: .. _----------
................. " ...... , ....... ', ........ .. ... , ........................ .. , ............................... . ......... , .............. , ......... ..
, .................................... .. ....... , ............. , ................ .. ........... , ...... , ............... , ....... " , ........................... , ....... , ........ .. .... " .... " ..... , ..... " ..... " ...... , ........ , .. ........... , ................... " ............... , .. ,', ................. , ........ , .. " .......... , ....... ..
, ... ", .... " ................ " ..... ", ...... ,', ........ , , ", .. ", .... " .................. " ... ""' ....... ,, ...... .. , .. " ... ", ... " .... ,., ............ , ...... , ....... " ....... ..
, .................. , ...... , .................. ,'., .............. .. ..... " .. ,,, ................ ,, ..... ,, ..................... ,, ...... .. ........ " .............. , .. ""." .................................... , , ... " .... , .. " ... ", ................. " .. ,', ..... " .. ", ........ , ......... , ..... . , ............................................... " " ........................... ",, ... ...
,,,, .... ,, .. ,, ..... ,.,,., ... ,,, ....... ,, ..... ,, .......... ,, ...... , ............ " ........ , ..... .. , ... , .. ,., .... " .. ", ... ,' .................. " ............. , .... , ..... , ............... " ............. .
, ... ", .... , ........ " , .... " .... , .. ", .. ,', .. ,', .... , ........... , ...... , ... ", .... " ....... " ............. .. .......... ,,, .. ,",, ...... ,, .... ,,,, ..... ,, .... ,, .... ,, ... ,, ... ,, .................. ,, ........... ,, ........ " .... .. , , : " ........ " .... " ... " ....... " ................................... " .. ... " .. " ............ " .... " ... "" ................ , , I ,
. . .. , ..... , .. " ...... ...... ..... ..... " .... .... , ....... "u" . ...... . m •• un .......... .... ... , ............. ..... ' . .... .. H ... ~_ ••• _ • • _ ........ ... . . ... _ .. _ .. _ __ _ ••
" II 11 ~ II II II " H H n n n ~
Fig_ 58. Histogram for second version of bridge showing 10lal cumulative COSI

PRA C TI CE
J()()
200
"Xl
50
OL' ~--~6----~'OC----C'~S---C'~9---C~~----~"'Time woeks
Fig. 59. Comparison of costs of versions J and 2
6.7. Variations and project control Compmer4 based network analysis programmes may be used not
only as a rapid means of shaping the plan by evaluating a1tcrnatives, but also for predicting the effect of variations on the progress of a project. If a fuJly resourced network is maintained on disc in a si(c4 based microcomputer the effects of changes to the programme may Ix known at oncc. _
One af me most common ways in which a contract may be varied, albeit usuaUy an unintentional one, is by the late provision of information from the client to the roDmctnr. The client may be unaware
11 9

CONSTR UC TI ON PL ANNI NG
of the disastrous effect the delay will have on progress until months later when presented with a claim for disruption.
How much bener that the planner should use his skills to estimate the cost of the disruption and thereby motivate the client to provide the information earlier and avoid the resultant dispute? With a resourced network programme it is only necessary to reprogramme the one activity affected by the late supply of information and then ask the computer to produce a cumulative cost evaluation. The results could be dramatic
Dear Sir
You will note from the attached print-out that we estimate that the cost of the delay caused by waiting for the bending sc hedules may amount to £10 000 per week.
Systems of this type, which enable the planner to construct a model of the project and store it in the computer, are immensely useful for project control but do demand a high degree of devotion from the planner . To enable the computer to make a rapid response to changes, the project model must be completely up-to-date. On large sites , with a resident planner dedicated to the task, impressive results may be achieved. On most other sites the crises of the day will usually take preference to updating the network with the result that it will never be available to respond to immediate demands.
6.8. Handing ovec the plan, the narrative report Reference to Fig. 3 will remind the reader that a plan may need
to be communicated by a number of output documents. The professional planner will want to hand these documents over as a package accompanied by a cover note listing the contents. Although the Authors have yet to hear of a planner being sued for negligence, the planner runs the same risk as any other construction professional who sells a service. It is therefore prudent to ensure that a'!!'pla~ning documents ar;.;cc~d and..!igned for . Inthat way it sho!!ld be po~sible to avoid ordering materials from out of date resource lists or scheduling supp-lies from su-rseae programmes.
One output document which has not been mentione so far in this guide is the n~ve report. This is an important document to be used on those occasions when it is impossible for the planner to present his plan to those who will implement it. This document is a useful means of putting a plan into context; it should contain
120

PHACT I CE
• a brief summary of the planning philosophy
• mention of any misgivings or reservations the planner may have about his plan
• any recommendations for further action, i.e. updating , monitoring, resourcing, etc.
Whenever possible the opportunity should be taken to allow the planner to present his plan to the project team. The value of this presentation lies not only in the time saved by the project team in their comprehension of the project, but also by impressing on the planner that his plans are not a theoretical exercise but are implemented by real people.
6.9. The dynamics of project management One of the major differences between the management of con·
struClion projects and the management of a manufacturing process is the continual chan e and develo ment tha,Loccurs through
e life of a - ro'ecl, making the mana er's task ver anding . Imagine, for example:T.he processof constructing a large building. The initial stages may require the management of heavy civil engineering work in the excavation and construction of the base· men\. Such work is subject to the effects of weather and ground condition, uses heavy plant and is constructed to quite large tolerances by a robust set of people. The project will then progress through work of increasing refinement : structural frame , enclosure, services, etc., finishing with the exacting work of telecommunications and high quality finishes.
This changing ~developing nature oi l!Wects means that planning has To be done for organization chang~s well as for the physical work. The project organization will change, and the people in il,'""iS-to continue with the building example - those people with expertise in groundworks are replaced by those who know about the technology of building and the management of building trades contractors. This progression of organization must be planned in advance because it sets the context and strncture of the work plan. That is, this organizational development will determine the way in which the master plan is broken down into detailed plans, and this in turn will set up the Structure of the system for monitoring and camral.
1/1

CO N S TR UC T I ON P L A NN I NG
6.10. The changing emphasis of planning In the initial stages of planning, the emphasis is on the method
of construction an<lthe eS1Unation and ~cheduling of the reso!!fces that will be _required . Management's concentration is on the acni~nt of deadTines and the efficient procurement of resources. By contrast, in the middle of the project, the plan has been made, the resources have arrived and management becomes more concerned with the day-to-day efficiency of the use of resources; perhaps to the extent of neglecting to concentrate equally on the timely achievement of project objectives.
Expressed more simply, this is a change from 'how many pipelaying gangs will be needed? ' to 'what are we going to do with Charlie's gang next week?' It is likely that to keep Charlie's gang productively occupied, the project manager may change the method and sequence of construction, if this is possible, rather than have the gang standing idle. Thus in the middle of the project the
\ emphasis changes such that current planning thought is no longer dominated by construction method, but by resource utilization. This
< has a quite profound effect on the planning, and of course means that the nature of the master plan may be substantially different from that of the weekly section plan. The danger is that this concentration on resource utilization may result in late completion of the project.
6.11. Short-term planning Table 2 made reference to weekly or two-weekly plans for
foremen, gangers and trade foremen. Such shon-term programmes need to be compiled in a different way from long-term strategic programmes. The rule that planning should be carried out singlehanded by a planner working on his own without interruption does not apply here.
Shan-term programmes are about the use of specific named resources . They describe what individual gangs and items of plant should achieve in half day periods. To be successful these programmes must be compiled by, or with, the general foreman or work supervisor. Whoever does the plotting) the foreman must have a full say in the disposition of his resources. To present a foreman with a shon-term works programme without consultation would be setting up a challenge which the planner could not win. A typical short-term works programme is shown in Fig. 60.
122

8lacktord'lew Ro&ct Ptogramme lor weeks 24 & 25
Ope""",, -g:r. """ Too Woo Tho Fri 5 .. "m "'" T"" Woo T"" Fri 5 .. 5"
Kerblaylf".g I Green + 1 -- -- -Ch 7000--
Sub·base J.G.8Y + 2 -- -- f- ---; Ch.7500---
Subll,ade ~ cappII'IQ S<: - f- - - -Ch .......
Headwalls J. Black + 1 On holiday
Green lane J.Brown
BlIdg" Carps. S.wtl,te" 1 - ~ ~t:!.k~_
N "", "'" SlCa;;i .. ~" E,
5 """ Carps + Wh.,e + , yard Imm Oil
sill. SIC;;;;;, -- -- -- s,te
Blackwater Brow'" + ~~dw.!l!.!orm~_
culver! Whole + 1
Railway thrustbore 5<C E.~'eda'i'~ali si'&- -- - - -., MoIecoLId
L...,,,,, IIIIlIlIIIIIl Stootlixers ~ Carps. ~Kerblayels Si'e: se<:tton A Foreman: Fmnl< Bo~s
FIg. 60. Example of a short-tenn plan

CO N STRUC TIO N P L A NN ING
6.12. Summary This guide has given a brief but comprehensive review of the
whole process of construction planning. The emphasis has been laid on the organizational and procedural aspects of planning, illustrating the complex context in which the construction planner has to work. There is, clearly, much more to construction planning than the mastery of planning techniques and computer systems, although such mastery - and fluent skill - is absolutely vital. Thus careful preparatory work, building a sound technical, procedural and organizational strategy) is the essential prerequisite for successful construction planning and control. In the case studies given in chapter 7, all of which are taken from actual projects, some indication of the broader context within which the plan was shaped has been given) as well as examples of the practical application of each of the four principal planning techniques.
124

7 Case studies
This chapter comprises three case studies, all derived from actual construction projects . The case studies are: a line-of-balance programme for a low-cost housing project in a developing country; a linear programme (time-chainage chart) for a dual carriageway trunk road and structures in the UK; and network analysis, in precedence form, applied 10 a raw water pumping station and storage lagoons, in the UK
7.1. Line·of·balance case study ProjeCl: Low-cost housing Tirle: Bukit Nusa Indah Estate, Jakarta, Indonesia Client: P.T. Nusa May Gurney Planning brieF Short-term planning for resource utilization
Description The plan is for one group of 130 houses within a much larger
project (Fig. 61). The requirements of the project indicate that these houses must be constructed as fast as possible. Fig. 62 shows the design of the houses, all of which are identical. The purpose of this case study is to illustrate the use of the line~of~balance planning technique. The description is structured along the lines of the anatomy of planning techniques given in section 3.1.
Activities Houses are constructed by groups of tradesmen having well~
defined skills . Thus the trade activities become the basis for planning and control. Table 20 lists the activities for each hous~ ing unit , illustrating a sensible level of detail for planning such a project.
125

CONS TR UC TI ON PLA NN I NG
Fig. 6/. Low-cost housing, /irst case study
Activity duratiom The duration of each activity for each housing unit is derived
from the est imate of the man·hours required. This is given in the man·hours per unit , column M.
Project time-scale Some estimate has to be made of the necessary hand·over rate ,
to estab lish a common rate of work for all trades. Obviously this would be easy if the c1iem had specified a hand-over rate, but in this case only the overall project time-scaJe has been given: 6 months (26 weeks or 182 days).
Work method The principal factors to be considered are
• the staff and other overhead costs of the UK contractor are high , SO a time·scaJe shorter than 6 months wou1d bring significant financial savings
• the uncertainties associated with working in a developing coun· try indicate that it would be prudent to include a safety period between the contractor 's planned completion date and the client's required date .
126

Plan Secll()lll Secloon2
Fig. 62. General a1Tangemenl of Type 66 house, in first case study

CONSTR UCT I ON PLANNING
Thus the planner must answer twO major related questions
• what should be the planned completion date of the work?
• what should be the planned weekly output of housing units?
The problem is an illustration of the statement made in section 1.6 which emphasizes !.he need for skilled and experienced planners, because it can only be solved by a combination of experience, and trial and error. After some preliminary calculations , and discussion with the senior managers , the planner decides to make a first analysis on the assumptions of a working rate of 24 houses per week, which he believed to be the practical maximum rate, and a working week of 60 hours. The calculations are set out in the form of a schedule, in Table 20; these calculations are explained briefly here.
Column M, man-hours per house, is derived from estimates made by the local contractor.
Colum" N, theoretical number of men required, is derived from the number of man-hours per housing unit, and the number of units required per week (24), divided by the number of working
Table 20. Basic duration calculations for li,Je-of-balance case study: see text for expla" acioll of quamicies
AClivity number At: man·h N " A H R " T, R and descriplion per unit days days days
I. Foundation 127 50·8 6 54 9 25·5 2· I 30- 3 I 2. Well 140 56 7 56 , 24·0 2 ·0 32 -3 I 3. Plumber I 79 31-6 4 32 , 24·3 2 ·0 31 -8 3 4. 81ockwork I 439 175 -6 12 1'0 15 24·6 3 ·7 31 ·5 5 5. Roofing I 43' 175 -2 6 1'0 30 24·7 n 31 ·4 5 6. Eleclrician I 2' 11-2 2 12 6 25·7 J.4 30· 1 I 7. Plumber 2 2 0 · ' I I I 30·0 0 ·2 25 ·8 I ,. Rendering 651 260-4 I ' 270 15 24 ·9 J.6 31· 1 4 9. Roofing 2 99 3"- 4 40 10 24·2 2·5 31-9 I
10. F looring 130 52 , 56 7 25·8 1·6 29·9 1 I I. Plumber 3 12 4· ' I 5 5 25 ·0 1·2 31 -0 I 12. Carpenler
and glazier I2l 49 · 2 6 54 9 26·3 2 · 1 29 ·4 I Il . Electrician 2 54 21·6 2 22 II 24 ·4 2 ·7 31· 7 1 14 . Ext. works 465 1'6 , 192 24 24 ·8 s.s 31· 2 15. Painter 710 l l 2 10 320 l2 24 -6 J.8 31· 4
128

CA S E S TUDIE S
hours in a week, in this case 60, assuming a six-day week of ten hours per day.
Cohmm 11 , men per house , is a practical estimate of the number of men required to complete each activity for one housing unit. This is based on a knowledge of the normal grouping of men in each trade (for example plumbers usually work in pairs and two masons usually work with one labourer) adjusted as necessary to achieve the necessary total output. This figure is determined by the planner and senior managers.
Column A, actual number of men, is the theoretical value N corrected by the introduction of the practical estimate of the number of men per house n. Thus, for activity I , N is 50· 8; so for n =6, realistic values of A are either 6 x 8 = 48 (i.e. eight groups of six men) or 6 x 9 = 54 (nine groups of six men). In this case, the planner has chosen the faster rate , so activity 1 will proceed at a rate slightly faster than the general rate of 24 houses per week.
Column H , the number of houses worked on simultaneously, is part of the calculation for column A ; e.g. nine groups of six men, giving A = 54, means also that these nine groups will work on one house each.
Column R , the actual rate of house production per week, is the calculation for the adjusted, practical number of men to be used; e.g. for activity I , the theoretical number of men is 50· 8, but the realistic plan is to use nine groups of six men, i.e. 54 men. Thus the planned rate of house production per week will be increased by the factor 54 + 50 · 8. Thus activity 1 is planned to proceed at 25 ·5 houses per week, not the notional 24.
Column t, the time required for each trade to complete its work on one housing unit, is simply calculated from the man-hours per house divided by the man-hours available per day. Thus activity I requires 127 man-hours per house , so a group of six men will take 127/(6xlO) ~ 2·1 days.
Column T is the time required from the start of the first house 10 the start of the last house. This calculation is necessary to determine the slope of the lines-of-balance for each activity. The slope is the number of housing units, less one, divided by the rate per week R expressed in days. Note that the values of Tfor each activity should be similar.
Column B is the minimum buffer time, based on a se ries of decisions made by the planner and project manager. Note that the major
129

Excavate loundations
Well
Plumber Ist lix
Fix doors, windows + cast ~th
ElectriCian 1
rt1' Electrician, Plumber,
Painti
lSt fix 2nd fix
Glazier + I Internal Floors carpenter Internal
painting ~nd~~_,,>+~:!i!~"~~~~':"d:;liX~~~~C:::~<1i ~ Plumber I Electrician
External rendering External painting I // ,3rd !ix I i 2nd fix
!--- -+<>--+ij.C...:J , Fascia '
barge "",," guners
® """ Rool ing2 ®
Electrician Plumber 1st lix 2nd l ix
Roo/ing 2
Roo!ing 1
Ib)
Plumber 3rd lix
Electrician 2nd lix
Painting
Carpenter and gluier
External wor1<s
Fig, 63. Trade sequence diagram: (a) diagram used fa plan work and (b) simplified diagram used [or /iPle-<J[-baiallce; gangs shov.m by numbered circles
C') 0
" '" ... '" c:: C')
::! 0
" ." ... ,. " :<: " Cl

''''
Fig. 64. Line-{}f-balance diagram for low-cost housing
80
Slarl day 5;8 Duration
Project completion 98·4 + 7·8 "' 106·2days
90 ,00 Working days "

Table 21. Calculations for drawing line-of-balance diagram
Activity number Time for Elapsed Buffer: Start day calculation Start day calculation and description one unit : time: days unit 1 unit 130
days days
1. Foundations 2-1 30-3 1 Project start 0 0+30 3-30· 3
2_ WeU 2-0 32-3 1 0+2 · 1+ 1", 3 · 1 4 4+32 -3-36 ·3 Follows I, slower
3. Plumber 1 2 -0 31 -8 3 0+2 · 1+ 1", 3 · 1 4 4 + 31-8-35-8 Follows I, slower
4_ Blockwork I 3-7 31-5 5 40-8 - 31-5 · 9-3 10 10+31-5-----41 · 5 Follows 2 & 3, faster than both 36·3+2+ 1- 39·3,
35-8+2+3 .. 40·8 therefore follo .... '$
activity 3
S. Roofing I 7-3 31 -4 5 50 -2-31 -4 - 18 -8 - 19 19 +3 1-4-50- 4 4 1-5 +3·7 + 5- 50 -2
6. Electrician 1 1-4 30-1 1 62-7-30 -1· 32-6-33 33 + 30-1-63- 1 50 -4 + 7 ·3+5 - 62· 7

7. Plumber 2 0 -2 25-8 65-5 - 25-8:39-7-40 40+ 25-8-65-8 63 · 1+1 ·4 + 1: 65 ·5
8. Rendering 3-6 31-1 4 62 -7-3 1 - 1 ~ 3 1-6-32 32+31-1-63- 1 50· 4+ 7 ·3+5 =62·7
9. Roofing 2 2-5 31-9 40+0·2+ 1= 41 ·2 _ 42 42+ 31-9-73-9 Follows 7 & 8, slower 1han both 32+3 ·6+4 =39 ·6
10. Flooring 1-6 29-9 3 77-4 - 29-9 : 47-5-48 48 +29-9-77-9 73· 9+2 ·5+1 .. 77 ·4
11. Plumber 3 1-2 31-0 48 + 1-6+3:52 -6 -53 53+31 - 84
12. Carpenter/glazier 2-1 29-4 86-2 - 29-4:56-8-57 57+29-4-86-4 84+1·2+1 ", 86·2
13. Electrician 2 2-7 31 -7 3 57+2·1+ 1=60·1 -61 61+3 1-7-92-7
14. External works 5-8 31-2 98-4 - 31-2:67-2-68 68+31-2_99-2 92 · 7 +2·7 + 3=98·4
15. Painter 7 -8 31-4 98-4 - 31 -4:67-0-67 67+31-4-98 -4 " 92·7 +2·7 +3 =98· 4 ,. '" '" '" ... c::
'" W ;;; ~ '"

CONS TR UC TI ON PL ANNI NG
activities have longer buffers, a conunonsense assumption; the completion of the electrical installation is also considered to be rather uncertain.
C01lstnICtiOll sequence The construction sequence is given in Fig. 63, the trade sequence
diagram. The actual diagram used to plan the construction is given, and also a simplified diagram used as the basis for the line-ofbalance planning.
Drawing th e line-of- balallce diagram The line-of-balance diagram is given in Fig. 64, based on the
calculations given in Table 21. Care must be taken when calculating the values when activities run in parallel; it is helpful to remember that the buffers are all estimated with reference to the preceding activity, i.e. they are an estimate of potential delay of that particular activity. Some notes for guidance on the parallel activities are as follows.
• Activities 2 (well) and 3 (plumber 1) both follow activity 1 (foundations) after a buffer of one day.
• Activity 4 (blockwork 1) fo llows both activities 2 and 3, so it starts after the latest time of either , i.e. the worst case must be calculated, considering the buffers fo llowing both activities 2 and 3.
• Activities 6 (electrician 1) and 8 (rendering) both follow activity 5 (roofmg 1) with the roofing buffer of 5 days; activity 7 (plumber 2) follows activity 6 (electrician 1); again the worst case must be calculated. This is an interesting case, because although there is float on activity 7 in each housing unit , the high rate .of working means that this is the critical activity, determining the start of activity 9 (roofing 2),
• Activities 14 (external works) and 15 (painting) both fo llow activity 13 (electrician 2) with a buffer of three days.
The start time of each trade will be an integer. It is unusual for tradesmen to start work on a new project at any other time than at the start of a day; therefore these have been rounded up to the beginning of the following day.
134

CA S E S T UDIE S
I,llerpretatiorl The project ends with two concurrent activities, numbers 14
(external works) and 15 (painter). The estimated project completion date is therefore the latest of
number 14: 99·2 + 5· 8 "" 105 days or number IS: 98 ·4 + 7· 8 "" 106·2 days
for a six-day week, giving a planned project duration of about 18 weeks. This is well inside the target time of 26 weeks.
7 .2. L inear progra mme (time-chainage chart) case study Project: Dual carriageway trunk road and structures Title: All Wymondham - Cringleford Improvement Client: Director (Transport), Department of Transport and Environment Consulting engineers: G. Maunsell & Partners Planning brier Contractor's working plan
Description In essence the project is 7 km of new dual 9·3 m carriageway
trunk road with roundabouts at each end to accommodate connections to the existing road. There are three major structures: a road overpass, a stream underpass and a side road railway bridge. Other features include a staggered junction and 3 km of side roads. The entire project is located on agricultural land and woodland.
Planner's initial appraisal The initial appraisal is summarized as follows
• The project is located near the contractor's head office and is accessible at both ends and two intermediate points.
• Major features
o 400 000 m3 excavation/fLlling o 54 000 m3 imported capping material o one single carriageway in situ concrete overbridge o one reinforced concrete box culvert stream underpass o one unusual concrete arch bridge across a [wo lIack main-line
railway (Fig. 65).
• The road surfacing may be flexible or concrete.
135

CONSTR UC TION PLANNING
Fig. 65. Concrete arch road-over-rail bridge, shO'UJing erection of steel arch forms, second case study
• 92 weeks available.
• Contract documentation appears to follow usual format.
• Nothing outside the contractor 's experience except the concrete arch bridge.
• No obvious unusual risks.
Early decisions The planner had been asked to prepare a plan to be used initially
as a tender plan but containing sufficient detail for use as a work· ing programme if the bid was successful. The planner decided that the three bridges and the tie· ins at the two ends would each need their own detailed plan, but the overall project plan should be presented as a linear programme. The early decisions made were:
• Who is the plan for? The contractor 's construction team (albeit the estimator will make use of it first).
• What is the time-scale? Construction period only, 92 weeks.
136

CA SE STUD IES
Table 22. Estimate of plarmillg time for secorld case study
Activity
Make detailed appraisal of contract documents Prepare three bridge programmes: use
computer 10 analyse Draw linear programme Plan tie-in construction in bar chart format Allow for conferences Site visit
Total
Time: days
4 6
5 1 2 1
19
• What is the level of detail? Medium, use a week unit.
• What planning techniques are to be used? Network analysis for three bridges; simple bar charts for the two tie-ins; linear programme for the overall plan.
Programme The planner 's estimate of planning time was four weeks, and
the breakdown of this figure is given in Table 22. To complete the plan in the time available it was necessary to use three planners one dealing with overall plan and roadworks, another with the strucrures and the third planner with the traffic management at tie-ins.
Fig. 66. Concrete train, second case study
117

Fig. 67. Linear progra mme chart for second case study
138

139

CON S T R U C TION PLA N N I NG
Delailed appraisals A detailed appraisal of the documents was made. Lack of space
does nOt allow reproduction of the detailed appraisal here but all comments of significance to the plan were transferred to the linear programme.
The plamli1lg process For the overall plan the planner followed the process described
in section 3.6. All information from the drawings concerning earthworks, drainage and road construction was transferred onto the lower third of the programme sheet. In addition a diagrammatic continuous sketch of the project was drawn at the bottom of the sheet. This sketch was annotated to show permitted accesses, side road closures and major watercourses.
Concurrent with this exercise, individual programmes were drawn up for each of the three major structures. No attempt was made to relate one structure to another or to the overall plan. Each structure was planned for completion on the basis of the most economic solution.
The next step was to decide whether the carriageway would be rigid or flexible. After much deliberation, the estimating team came to the conclusion that a rigid (concrete) road was likely to give the most competitive bid. With this information the planner could begin to construct the linear programme.
Planning was carried out as follows.
• The three weeks of annual construction industry holiday was blocked in.
• Before plotting earthworks, time was allowed for setting out, services diversions and soils instrumentation.
• First stage earthworks was plotted within the AprilSeptember earthworks weather window.
• The concrete carriageway was plotted within the April October concrete road weather window in the following year (Fig. 66).
• The three structure programmes were plotted in simplified form on the linear programme as vertical columns such that the concrete train could pass all the structures without impedi-
1<W

CA S E S T UDIE S
ment, and continuity of work for craftsmen and formwork was achieved when possible .
• All the remaining activities were ftIled-in within the remaining spaces available.
The completed plan is shown in Fig. 67.
7.3. Network analysis case study Project: Raw water pumping station and ancillary works Title : Costessey Raw Water Transfer Scheme Client: Anglian Water Planni,lg brief: Contractor's tender plan
Description The project provides a new flexible raw water source for a quarter
of a million people in the city of Norwich and the surrounding area. The project makes use of three former gravel pits that naturally offered an ideal configuration of storage lagoons. The scheme involves the construction of a new river intake on the River
800mmd,a. pumpmgmam to Helgham ---~1iJ waterworks
Fig. 68. Storage lagoons, cransfer pumpi,lg slaliou and iflterC01meclilig pipework, third case study
141

CONS TRUCTION PLANNI N G
Wensum, interconnecting pipework to the pits and a transfer pumping station (Fig. 68).
The imake is sited on the south bank of the river and uses sheet piles with a reinforced concrete capping beam to accommodate a 1200 mm dia. steel pipe to transfer water, via the pumping station, to the pits. The low level pumping station has a reinforced concrete basement founded on chalk 9 m below ground level and water table. It houses two sets of pumps, one to transfer water from the river to the pits, the other to abstract from the pits and pump to the treatmem works (Fig. 69).
1200 and 1000 mm dia. interconnecting pipework between the pits gives maximum flexibility of use in the evem of pollution of any or all of the pits or of the river. Water from pit 1 is normally fed by low level feed pipe [ 0 pit 2, and water from pit 3 fed by interconnecting pipework to pit 2. From pit 2 the water is abstracted and pumped to the treatment works.
Plmmer's initial appraisal The initial appraisal yielded the following major features
• the transfer pumping station will need to be constructed within a cofferdam 9 m deep
• deep well dewatering of the cofferdam will probably be necessary
• six intake structures are to be constructed
• seven sections of deep pumping main and pipework are to be laid, probably all in cofferdams
• the feed pipe to pit 2 is a site welded high density polypropylene (HDPE) pipe to be laid in a dredged channel on the lake bed (Fig. 70).
The contract conditions called for hand-over of the pumphouse for mechanical and electrical installation at week 7) with overall completion to be stated by the contractor between 7S and 80 weeks.
Early decisions The planner had been asked to produce a tender plan to
• develop working methods
142

CA SE STUD I ES
E • • CJ Orfginal ground level
tj!::::~=e;;;-. --'- Normal Peal groundwaler ,',.' ,,," Oeepwell
Gravels /
Substantial concrete base slab Bentonite Seal
l-IH""'''''~'''~·~;"~·~·~~' ~,,!,.j;,~l:~tt Chalk / ~:.. =-.: -1:h:~.~at~~~::::-~ ~ Contraclor"scolle.clam piling
1 m
Lowered groundwater level Temporary deep well pump 20m deep
Sioned pipe 300 mm dia.
1 Total depth 01 wel' 35 m
Fig. 69. CrosH eClion through transfer pumping station showing cofferdam and deep wells
• decide completion time
• evaluate site overhead costs
• establish plant and labour resources independently of the estimator.
The planner concluded that the project had a number of possible independent work sites, would need careful resource programming, panicuJarly in respect of sheet piles and driving plant, and would require careful monitoring during construction. The early decisions were
• Who is the plan for? The contractor 's tendering team.
• What is the time~sca1e? Construction period onJy, say 80 weeks.
• What is the level of detail? Medium, use a week unit.
• What planning technique? Network analysis using Hornet software.
143

CONSTR UC T I ON P L A NN I NG
Programme The planner 's estimate of the planning time is given in Table
23 and was 7 days.
Derailed appraisal The fo llowing abstracts serve to illustrate the procedure used .
COlldili01lS of COIl/raC(
h em
• ICE 5th Edit ion with Client 's amendments and additions
• CI. 13. Requ irement for contractor to enter Contract period on the Appendix to form of tender. Period may vary from 60 to 75 weeks.
Comment
Nothing unusual to allow for except Clause 13.
Consider the risks, both in liquidated damages and inadequate recovery from preliminary bill items if projecl overruns.
Fli;. 70. Fahn'calillg alld floalillg illlO POSilioll Ihe HDPE [eedpipe/ Ihird case study
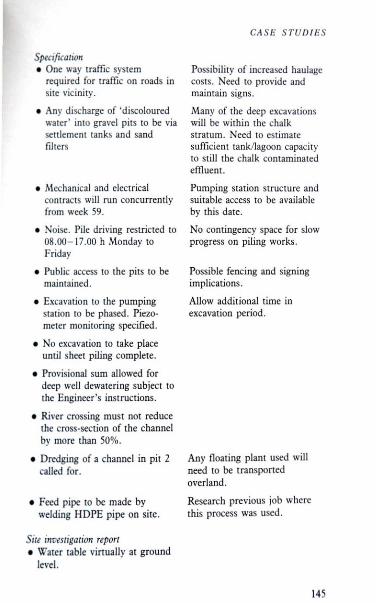
Specification • One way traffic syStem
required for traffic on roads in site vicinity.
• Any discharge of 'discoloured water' into gravel pits to be via settlement tanks and sand filters
• Mechanical and electrical contracts will run concurrently from week 59.
• Noise. Pile driving restricted to 08 .00 - 17.00 h Monday to Friday
• Public access to the pits to be maintained.
• Excavation to the pumping station to be phased. Piezometer monitoring specified.
• No excavation to take place until sheet piling complete.
• Provisional sum allowed for deep well dewatering subject to the Engineer's inst ructions.
• River crossing must not reduce (he cross-section of the channel by more than 50%.
• ~redging of a channel in pit 2 called for.
• Feed pipe to be made by welding HOPE pipe on site.
Site investigation report • Water table vin ually at ground
le\'el.
CASE STUJ)IE S
Possibility of increased haulage costs. Need to provide and maintain signs.
Many of the deep excavations will be within the chalk stratum. Need to estimate sufficient tankllagoon capacity to still the chalk contaminated effluent.
Pumping station st ructure and suitable access to be available by this date.
No contingency space for slow progress on piling works.
Possible fencing and signing implications.
Allow additional time in excavation period.
Any floating plant used will need lO be transported overland.
Research previous job where this process was used.
145
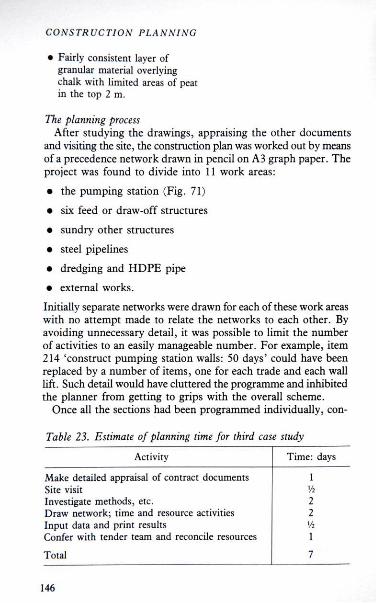
CONSTRUCTION PLANNING
• Fairly consistent layer of granular material ove rlying chalk with limited areas of peat in the top 2 m.
The plannirlg process After studying the drawings , appraising the other documents
and visiting the site, the construction plan was worked out by means of a precedence network drawn in pencil on A3 graph paper. The project was found to divide into 11 work areas:
• the pumping station (Fig. 71 )
• six feed or draw-off structures
• sundry other structures
• steel pipelines
• dredging and HDPE pipe
• external works.
Initially separate networks were drawn for each of these work areas with no attempt made to relate the networks to each other. By avoiding unnecessary detail , it was possible to limit the number of activities to an easily manageable number. For example, item 214 'construct pumping station walls: SO days' could have been replaced by a number of items, one for each trade and each wall lift . Such detail would have cluttered the programme and inhibited the planner from getting to grips with the overall scheme.
Once all the sections had been programmed individually, con-
Table 23. Estimate of planning time for third case study
Activity
Make detailed appraisal of contract documents Site visit Investigate methods, etc. Draw network; time and resource activities Input data and print results Confer with tender team and reconcile resources
Total
146
Time: days
'h 2 2 \0 1
7

CA SE S TUDIES
Fig. 71. Transfer pumping statiml, third case study
struction logic and resource links were added. As many of the sect ions contained large elements of temporary work, pa rticularly sheet piling, use of sheet piles and continuity of pile driving and extracting plant became significant .
T he final network is shown in Fig. 72; it contains on ly 91 activities but exactly and economically chart s the planner's proposals for bui lding the project.
Analysis and Qutput Although the 91 activity network could have been analysed
manually it was quicker and more cost effective to use a computer. The first analysis was carried out before resourcing the network and several adjustments made before the planner was satisfied that the best solution had been ac hieved within the contract time available. Part of the programme is shown in Fig . 73 in compu terplotted bar chart form. The format chosen for this illustration is very condensed with one week represented as a single unit of time. The software was also able to produce alterna tive, standard programmes, us ing one day as a time unit. When the planner was
147

Fig. 72. Nelwork analysis diagram for third case study

Fig. 72 - continued

~ N(lIU C>
0 0 >:
'" ..., '" c:: C> ..., ~
0 >: .. .... ,. >: >: ~
>:
'"
Fig. 72 - continued

Fig. 72 - continued
---..... ~ COStEsst:v ",,, 'OW<S!'UO.............cs,. TIOT<
I _WMJ"'-'~""I "" I' !~' I

CO N S TR UCTI ON PL A NN I NG
=§..~---- ,-_.,,.. ....• . _-
-:: ::
- " ... .. .... --.- . " ..... .... -
-...---_ .... n.u ._ .... _ ..... ....-...-- ...... .. _ .... --' .. -, ......... _ .... _.-.. ,-_ .. ... , .. , .. "'. __ <9 _._ " ''''-''' '''''''. -, ....... .... , .. -... _, .... ,_ ...
~ .. : rm:=.,
.~ .
.-" -.. ,' "
" can- , , ~ .. - .
' ~:,IC:I _ ... , a::D- , '"" , 0- , ,n, ~." -'" , .~.
n, ";;:=-.. '" ,<D--, " ,<D--", ,<D--, _, -,----- -- .- . ._ ,
::
::
::
::
::
......... '----------...._n.-. . ... , ..
.. ,.." .. _-" .. .. ",-- "., .. ,-__ .... .,m
., .. -~
._ ...... ..-._
.,,' --_..-....
. ... .. . r< •• _ • .--. .. , ...... ......
- " :~-_'_'_' , n,
,~ .
,_. ~,
: ::--,--,--,--, " , , , , - " " EJ:D--- , , , , , ,~---,
'~;
".:c----, , , <ttD--- , , , , , ~--- ,
, , , , ,
,~.
~.
,I:D-- , , , , ,
~-- ."
~ . . " .. " = _ .. , .....
aD _ _ " .... , .. UD_. · .. "" .. = -
Fig. 73. Computer-ploued bar chart
152
,- , ' D-~ : -,D. ,D , - , -,

CA S E S TUDI ES
satisfied with the overall structure of the plan, the network was resourced. In this case resourcing was done by calling up every activity on the computer screen and allocating resources. For this tender exercise it was dec ided that only three resources would be investigated: direct labour , subcontract labour , and cost.
The result of the labour resource analysis is shown in histogram
IZZ1Z2I Comrac10r"s labour c::=J Subcontrac1or 's labour
Fig. 74. Computer-ploned histogram
153

CONSTRUC TION PLANNING
1_ .000 , ,
,--1 ,---1
I - .000 1 I I
--j _ .000 ,
I 200000 ._ 1
Fig. 75. Compurer-p[olled resource envelope
fonn in Fig. 74. Some useful estimating information can be deduced from this.
• There is an 8 1h month period of high activity requiring .an
154

CA S E STUDIES
average work force of 4S persons, of which 15 are likely to be subcontract labour .
• There is a 7 Lh: month period of low activity requiring an average work force of only 6- 10 persons.
Clearly there is scope for smoothing this rather indented histogram, but for tender purposes, the information is sufficient for contractors preliminary costs to be estimated, particularly those of site accommodation, supervision and personnel transport.
Figure 75 shows a computer-printed cumulative cost envelope derived from the cost resource input. This was available in the software package and enabled an estimate of cash flow limits to be provided to the client. This information was required to be provided with the tender.
155
References
1. Wessex database for civil engineen'ng. Wessex (Electronic) Publishing Ltd.
2. Spans civ il engineen"ng price book. E&FN Spon. London. 3. Laxtons national building price book. Thomas Skinner Directories,
East Grinstead. (Although these three books do not normally list output data in a
direct form, it may be deduced therefrom. Although these books are intended for estimators, and not ideal for most planning purposes , they can be very useful for timing specialist activities. )
4. Hall D. S. M . Elements of estimating. Batsford, London. (A sound introductory book to the skills of estimating. Although aimed mainly at the building industry the book is a useful source of data on output rates for labour, craftsmen and plant. )
5. Spence Geddes. Estimating for building and civil engineering works. Newnes· Buuerwonhs, London. (Intended for civil engineering estimators but equally useful to planners , this book contains extensive output data for labour and plant engaged upon basic civil engineering operations.)
6. Caterpillar Tractor Co. Caterpillar performance handbook. Caterpillar Tractor Co. , Peoria, IL, USA. (The classic reference book for calculating outputs of heavy eanhmoving machinery . Available through Caterpillar dealers for their customers, or to be borrowed from colleagues.)
7. Price A.D. F . ec al. An evaluation of production output from constructum labour and plant. Available from Dr A. D . F . Price, Depanment of Civil Engineering, University of Technology, Loughborough , Leics LEII 3TU.
8. Neale R. H . and Raju B. Line-of-balance by spreadsheet. Building Technology and Management, Dec. 1988/Jan. 1989, Ascot, Berks.
9. British Standards Institution. Use of network techniques in project management. Parr 2. Guide to the use of graph ical and estimating techniques; Parr 3. Guide to the use of computers; Part 4. Guide to
156

REFERENCES
resource: analysis and COS! control. BSt, London, 1981 , BS 6046. 10. Lester A. ProjeC! planning and concrol. Butterwonhs, London,
1982. (Written by a practising project manager with a major company, this book gives a very clear explanation of the subject , and is a source of much practical advice on the use of network analysis. Costing and computer systems are also included.)
11. Barton P. (ed .) In/onnation systems in construction managemenl . Batsford, London, 1985 . (Contains some good papers on the subject by a number of experts. The papers cover a good range of topics.)
157

Bibliography
Antill J. M. and Woodhead R. Critical path methods in consrruction practice. John Wiley and Sons, New York, 1982, 3rd edn. (One of the best-selling textbooks on the subject , written by a practising engineer and a senior academic.)
Harris F . and McCaffer R. Modern constnJction managemenI. Collins, London, 1983, 2nd edn. (One ofthe best-selling general textbooks on construction management . Planning techniques are included within a broad coverage of the subject. )
Harris R. B. Precedence and arrow mrworking techniques/or construction. John Wiley and Sons, New York , 1978. (One of the classical books on network analysis, written by an eminent American professor. For a detailed and comprehensive explanation of the subject , this book is one of the best. )
Department of the Environment , Propen y Services Agency. Planned progress monitoring. PSA, London, 1980. (This booklet gives a clear review of the subject , with simple diagrams; available from the PSA, Lunar House, 40 Wellesley Road, Croydon, CR9 2EL.)
National Building Agency. Programmed house building by line of balance. NBA, undated . (Classical text on line-of-balance. Unfortunately, it is now out of print , but copies will be available from libraries. )
Pilcher R. Project cost control in construction. Collins, London, 1985. (A detailed and comprehensive analysis of cost control by an acknowledged expen. Includes cost control by both clients and contractors. )
ISS

Index
Activities, definition , 23 line-oC-balance , 35, 36
Activity duration , definition, 23 line-of-balance, 36
BS 6046, 1981 , 52 Balancing overheads and direct
costs, 111 - 119 Bar chart, 23- 24, 28-33, 34
standard sizes, 33 Cash-flow control curve, 96- 98 Clause 14 programme, 13, 14,
88-89 Co-ordination, 5 Contract programme, 88- 90 Contractor's control, 90- 93
curves. 93, 95 - 96, 98- 100 Control , S Control of risk, 85- 87 Costs, definition, 23 Cumulative float envelope, 80,
82 Detailed appraisal of the plan ,
108- 109 Dynamic nature of projects,
121 Dynamic planning, 14 Estimating duration, seven
steps, 20 Estimating programme
duration, 15-17 Estimating resource require
ments, 75-76
Event , definition , 23 Form of contract and risk,
87-88 Hierarchy of plans, IS Initial appraisal of the plan ,
105 Key activities and resources,
100 Level of detail , 10- 15, 25 - 27 Line-of-balance, 23 , 24, 26,
27 , 33-43 analysis, 38- 41 buffer times, 36- 37 hand-over schedule, 42 monitoring , 100- 101 parallel scheduling, 42 use of spreadsheet , 43
Linear programme, 23 - 24, 44-5 1
activities, 44- 47 to networks , 51, 72-73 monitoring , 100- 101
Linked bar chart , 29-30 Master plan , 14- 15 Monitoring and control , 84- 85 Monitoring bar chart , 30, 31 Network analysis, 23- 25 ,
51 - 73 activities, 53- 56 activity durations, 57-58 arrow form, 57 float, 61- 65
159

CONSTR UC TI ON PLANNING
hammocks, 68- 69 overlapping, 67-68 ownership of float , 89 precedence form, 53 - 56 resources, 57- 58 summaries, 68- 69 time analysis, 58-61 , 65- 67 work method, 53-56
Networks, repetitive work, 69- 72
Objectives of planning, 4-5 Planner's tool-kit , 23 - 25 Planning techniques, anatomy,
22-23 definition, 5- 6
Planning , cost of, 8-9 data , 6-7 definition , 5 department, 6-7 in the organization, 6-7 saturation, 9 specialist, 7 time-scale, 15
Project manager 's power to control , 3-4
Project time-scale , defmition, 23
160
Resource aggregation, 77-78 Resource analysis, 76- 80 Resource levelling, 79-80 Resource scheduling systems,
83 Resource scheduling, people
management, 83 Resource smoothing , 78 Resources scheduling, 5 Resources, defmition, 23 S-curves, 93-95 Selection of planning
technique, 25- 27 Senior management commit-
ment , 1 Shaping the plan, 111 - 119 Subdivided bar chart, 30- 33 Value , definition, 23 Variations and project control,
119-120 Window imo the project, II ,
14 Work method , 23
line-of-balance, 36- 37