Country Report MALAYSIA - AsiaConstruct Conference |
14
23 nd AsiaConstruct Conference Kuching, Sarawak Malaysia (on Borneo Island) 8 – 10 October 2018 Country Report MALAYSIA Construction Industry Development Board Malaysia (CIDB) Level 10, Menara Dato’ Onn Putra World Trade Centre (PWTC) No. 45, Jalan Tun Ismail 50480 Kuala Lumpur Malaysia October 2018
-
Upload
khangminh22 -
Category
Documents
-
view
4 -
download
0
Transcript of Country Report MALAYSIA - AsiaConstruct Conference |

23nd AsiaConstruct Conference
Kuching, Sarawak
Malaysia (on Borneo Island)
8 – 10 October 2018
Country Report
MALAYSIA
Construction Industry Development Board Malaysia (CIDB)
Level 10, Menara Dato’ Onn
Putra World Trade Centre (PWTC)
No. 45, Jalan Tun Ismail
50480 Kuala Lumpur
Malaysia
October 2018

23th AsiaConstruct Conference Kuching, Sarawak, Malaysia (on Borneo Island) Malaysia Country Report 2
CONTENT
EXECUTIVE SUMMARY
MACROECONOMIC REVIEW
Overview of the National Economy
Main Economic Indicator
OVERVIEW OF THE CONSTRUCTION INDUSTRY
Construction Project’s Review
Contractor Registration
Construction Labour Market
Construction Productivity
Construction Cost
Import and Export of Construction Services

23th AsiaConstruct Conference Kuching, Sarawak, Malaysia (on Borneo Island) Malaysia Country Report 3
EXECUTIVE SUMMARY
In 2017, the Malaysian economy recorded a robust growth at 5.9% (2016: 4.2%). The growth
was supported by expansion in both private and public sector spending. Private consumption
growth improved to 7.0% (2016: 6.0%) while public consumption growth expanded by 5.4%
(2016: 0.9%). On the supply side, all economic sectors continued to expand. The construction
sector recorded moderate growth at 6.7% (2016: 7.4%). The value of construction projects
awarded in 2017 recorded at 7,548 projects worth RM163.1 billion. The number of contractors
registered an increased by 21.3% to 87,071 contractors, meanwhile number of construction
labour force amounted to 1.3 million people. Construction sector productivity grew marginally
at 2.4%%. Compared to 2016, the average price for major building materials does not change
much. Average daily wage rates for local skilled construction personnel recorded an increase
up to 4.0%; an increase up to 8.0% for skilled machine operator; and an increase of 4.0% for
Industrialised Building System (IBS) installer. It is estimated that the construction sector will
continue to grow in 2018.
MACROECONOMIC REVIEW AND OUTLOOK
Main Economic Indicator 2017
The Malaysian economy grew by 5.9% (2016: 4.2%) in 2017 driven by domestic demand.
Private consumption growth improved to 7.0% (2016: 6.0%), supported mainly by continued
wage and employment growth. Public consumption growth expanded by 5.4% (2016: 0.9%)
due to higher spending on supplies and services by the Federal Government amid sustained
growth in the emoluments. Public investment recorded a marginal growth of 0.1% in 2017
(2016: -0.5%) supported by continued spending by the General Government and public
corporations.
On the supply side, in 2017, most sectors registered higher growth. Growth in the service
sector expanded at a faster pace of 6.2% (2016: 5.6%). The manufacturing sector expanded
further at 6.0% (2016: 4.4%); agriculture production growth rebounded to 7.2% (2016: -5.1%);
and mining sector growth moderate to 1.1% (2016: 2.2%). The construction sector registered
a moderate growth of 6.7% (2016: 7.4%). The construction sector growth was supported
mainly by the civil engineering sub-sector, due to the steady progress of large petrochemical,
transportation, and utility project.

23th AsiaConstruct Conference Kuching, Sarawak, Malaysia (on Borneo Island) Malaysia Country Report 4
Malaysian labour force expanded by 303,000 people and net employment gains amounted to
295,000 jobs. Labour force participation rate edged higher at 67.8% (2016: 67.7%) and
employment growth grew to 2.1% (2016: 0.7%). The unemployment rate stood unchanged at
3.4% (2016: 3.4%).
Inflation rate increased to 3.7% in 2017 (2016: 2.1%). Higher external and domestic costs from
higher global commodity prices and disruptions in domestic food supplies contributed to
inflation during the year.
Consistent with the unchanged level of Overnight Policy Rate (OPR) in 2017, money market
was stable throughout the year. The Ringgit appreciated by 10.4% to end the year of 2017 by
RM4.06 against the US Dollar.

23th AsiaConstruct Conference Kuching, Sarawak, Malaysia (on Borneo Island) Malaysia Country Report 5
Table 1 Malaysia Main Economic Indicator
2014 2015 2016 2017
GDP at Current Market Price
(RM billion) 1,106 1,159 1,231 1,353
GDP Growth at Real 2010 Prices
(RM billion) 1,013 1,063 1,108 1,174
GDP Growth at Real 2010 Prices (%) 6.0 5.0 4.2 5.9
Agriculture 2.0 1.3 -5.1 7.2
Mining and quarrying 3.3 5.3 2.2 1.1
Manufacturing 6.1 4.9 4.4 6.0
Construction 11.7 8.2 7.4 6.7
Services 6.6 5.1 5.6 6.2
Demographic Indicator
Population (million persons) 30.7 31.2 31.6 32.1
Population growth rate (%) 2.7 1.6 1.3 1.6
Labour force (million persons) 13.9 14.1 14.2 14.5
Labour force growth rate (%) 2.3 1.6 0.7 2.1
Unemployment rate (%) 2.9 3.1 3.4 3.4
Inflation rate (%) 2.1 2.1 2.1 3.7
Financial Indicator
Overnight interbank interest rate (%) 3.23 3.05 3.00 2.91
Commercial banks fixed deposit
interest rate (%)
3 months
12 months
3.13
3.31
3.13
3.31
2.92
3.06
2.94
3.10
Exchange rate at end of period
(RM against USD) RM3.50 RM4.29 RM4.49 RM4.06
Source: Central Bank of Malaysia
Malaysian Economy Outlook
In the first half of 2018, the Malaysian economy recorded an average growth of 5.0% (1Q2018:
5.4%; 2Q2018: 4.5%). Growth was slower in second quarter 2018 at 4.5% (1Q2018: 5.4%)
affected by disruptions in the agriculture and mining sector. The agriculture sector growth
contracted by 2.5% (1Q2018: 2.8%) and mining sector growth decline by 2.2% (1Q2018:

23th AsiaConstruct Conference Kuching, Sarawak, Malaysia (on Borneo Island) Malaysia Country Report 6
0.1%). Services and manufacturing continue to grow and remained supportive of the whole
growth. Growth in the construction sector continued to moderate in the second quarter at 4.7%
(1Q2018: 4.9%). The growth was supported by ongoing transportation, petrochemical and
power plant projects.
The Malaysian economy growth is projected to remain stable between 5.5% and 6.0% for
2018. The growth is expected to be led by the construction and services.
Table 2 GDP Growth by Main Economic Activity (%)
Economic Sector 2018
Q1 Q2 Annual (f)
Agriculture 2.8 -2.5 3.6
Mining and Quarrying 0.1 -2.2 1.8
Manufacturing 5.3 4.9 5.9
Construction 4.9 4.7 7.3
Services 6.5 6.5 6.1
Real GDP Growth 5.4 4.5 5.5 – 6.0
Source: Central Bank of Malaysia
OVERVIEW OF THE CONSTRUCTION INDUSTRY
Construction Project Review
In 2017, value of construction projects awarded recorded at 7,548 projects worth RM163.1
billion. Construction project refers to projects awarded to the main contractor with the value
of RM500,000 and above. In this report, the value and number of projects were taken as of
March 2018.
Projects recorded by CIDB Malaysia are categorised into residential, non-residential, social
amenities and infrastructure. Overall, in 2017, non-residential projects had the highest value
of projects, representing 35.4%. Residential category ranking second with RM48.2 billion
(30.0%), followed by infrastructure projects at RM46.8 billion (28.7%) and social amenities
projects at RM10.4 billion (6.4%).
23th AsiaConstruct Conference Kuching, Sarawak, Malaysia (on Borneo Island) Malaysia Country Report 7
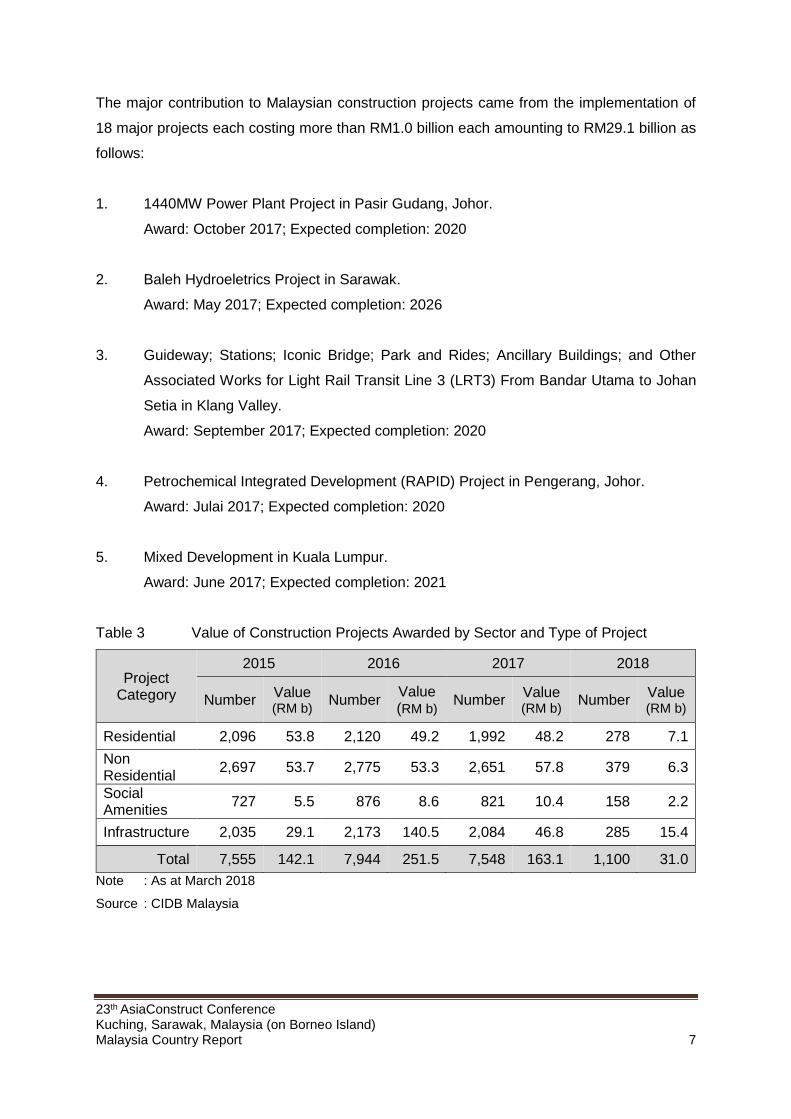
The major contribution to Malaysian construction projects came from the implementation of
18 major projects each costing more than RM1.0 billion each amounting to RM29.1 billion as
follows:
1. 1440MW Power Plant Project in Pasir Gudang, Johor.
Award: October 2017; Expected completion: 2020
2. Baleh Hydroeletrics Project in Sarawak.
Award: May 2017; Expected completion: 2026
3. Guideway; Stations; Iconic Bridge; Park and Rides; Ancillary Buildings; and Other
Associated Works for Light Rail Transit Line 3 (LRT3) From Bandar Utama to Johan
Setia in Klang Valley.
Award: September 2017; Expected completion: 2020
4. Petrochemical Integrated Development (RAPID) Project in Pengerang, Johor.
Award: Julai 2017; Expected completion: 2020
5. Mixed Development in Kuala Lumpur.
Award: June 2017; Expected completion: 2021
Table 3 Value of Construction Projects Awarded by Sector and Type of Project
Project Category
2015 2016 2017 2018
Number Value (RM b)
Number Value (RM b)
Number Value (RM b)
Number Value (RM b)
Residential 2,096 53.8 2,120 49.2 1,992 48.2 278 7.1
Non Residential
2,697 53.7 2,775 53.3 2,651 57.8 379 6.3
Social Amenities
727 5.5 876 8.6 821 10.4 158 2.2
Infrastructure 2,035 29.1 2,173 140.5 2,084 46.8 285 15.4
Total 7,555 142.1 7,944 251.5 7,548 163.1 1,100 31.0
Note : As at March 2018
Source : CIDB Malaysia

23th AsiaConstruct Conference Kuching, Sarawak, Malaysia (on Borneo Island) Malaysia Country Report 8
Contractor Registration
In 2017, the number of contractors registered increased by 21.3% to 87,071 (2016: 71,799
contractors). These contractors were categorised by grade, from Grade 1 (G1) to Grade 7
(G7). Grade G1 to G3 contractors forms the largest portion of contractors at 76.4% (66,492
contractors). Grade G4 and G5 contractors accounted for 11.6% (10,587 contractors), while
grade G6 and G7 contractors comprise 11.5% (9,992 contractors) of the total registered
contractors.
Table 4 Contractors Registered by Registration Grade
Grade Bidding Limit 2014 2015 2016 2017
G1 Not exceeding RM200,000 34,485 33,991 34,068 34,766
G2 Not exceeding RM500,000 9,268 10,441 12,407 19,214
G3 Not exceeding RM1 million 8,825 8,875 9,375 12,512
G4 Not exceeding RM3 million 3,038 3,093 3,408 4,940
G5 Not exceeding RM5 million 4,130 4,287 4,746 5,647
G6 Not exceeding RM10 million 1,594 1,528 1,589 2,890
G7 Unlimited 5,332 5,618 6,206 7,102
Total 66,672 67,833 71,799 87,071
Source : CIDB Malaysia
Construction Labour Market
Total number of labour in the construction sector had a slight increase of 0.8% to 1.25 million
people (2016: 1.25 person). Construction sector labour worker formed the second smallest
share before the mining and quarrying sector at 8.7%.
Table 6 Labour Market in Construction Sector
2016 2015 2016 2017
Number of employee (‘000 persons) 1,278 1,310 1,252 1,262
% from total employee 9.2 9.3 8.8 8.7
Source: Central Bank of Malaysia

23th AsiaConstruct Conference Kuching, Sarawak, Malaysia (on Borneo Island) Malaysia Country Report 9
Construction Productivity
Labour productivity measures economic output per unit of labour. Malaysia’s labour
productivity grew 3.8% in 2017 (2017: RM81,268; 2016: RM78,294 billion). Compared to other
economic sectors, the construction sector registered the lowest level of productivity. The
construction sector recorded a moderate growth of 2.4% in productivity (2016: 13.2%) at
RM40,242 billion in 2017. Nevertheless, construction sector plays a key role in the economy
through its multiplier effect on other industries.
Table 7 Labour Productivity Performance
Main Economic Sector RM
2014 2015 2016 2017
Agriculture 51,741 53,908 51,289 51,988
Mining and Quarrying 1,159,389 984,885 1,133,372 1,210,832
Manufacturing 97,342 102,633 106,307 110,858
Construction 34,714 34,723 39,298 40,242
Services 64,887 66,750 69,534 73,030
Labour Productivity 73,087 75,634 78,294 81,268
Source: Labour Productivity, Department of Statistics Malaysia
Construction Cost
Average Price of Major Construction Building Material
In general, the average price for major building materials does not differ much except for steel
reinforcement. The prices of steel reinforcement recorded an increase of 8.9%. The prices of
sand, paint and glass recorded an increase of between 1.5% and 4.0%. In contrast, prices for
aggregate, cement and ready-mixed concrete decreased by average 1.5% in 2017.

23th AsiaConstruct Conference Kuching, Sarawak, Malaysia (on Borneo Island) Malaysia Country Report 10
Table 8 Average Prices of Major Construction Building Materials
Material Unit RM
2014 2015 2016 2017
Steel Reinforcement tonne 3,363.44 2,089.64 2,478.00 2,698.39
Bricks piece 0.40 0.42 0.43 0.43
Aggregate tonne 44.85 45.97 42.99 42.04
Sand tonne 37.98 40.91 41.90 42.68
Cement 50kg bag 18.71 18.89 19.24 19.11
Ready-mixed Concrete m3 250.13 264.15 257.38 253.04
Paint litre 122.26 129.49 130.92 132.96
Glass m2 46.55 51.10 52.55 54.67
Source : CIDB Malaysia
Construction Industry Wage Rates
Construction Personnel Wage Rates
Average daily wage rates for local skilled construction personnel were varied and registered
an increase of 2.0% to 4.0% in 2017. Plumber - reticulation (RM120.52) and steel structure
fabricator (RM118.67per day) were the highest earners in the skilled worker category.
While the average daily wage rates of local semi-skilled construction personnel recorded a
growth between a high of 4.0% and a low of 2.0% in 2017. The highest earners in the semi-
skilled category were the building wiring installer (RM113.79 per day) and plumber -
reticulation (RM104.75 per day).

23th AsiaConstruct Conference Kuching, Sarawak, Malaysia (on Borneo Island) Malaysia Country Report 11
Table 9 Average Daily Wage Rate for Local Construction Personnel
Worker Category
RM per day
Skilled Semi-Skilled
2016 2017 2016 2017
General Construction Worker - Building 68.83 71.83 - -
Concretor 98.66 102.05 84.30 87.65
Barbender 102.82 106.99 83.71 87.56
Carpenter-Formwork 105.89 108.43 902.20 92.80
Bricklayer 100.62 103.46 79.16 81.45
Roofer 110.19 113.80 92.59 95.57
Carpenter - Joinery 114.06 117.48 95.95 98.74
Steel Structure Fabricator 114.91 118.67 98.81 101.59
General Welder 109.94 113.38 95.50 97.85
Plumber - Building & Sanitary 107.74 110.94 87.12 89.79
Plumber - Reticulation 117.09 120.52 102.05 104.75
Building Wiring Installer - - 110.96 113.79
Electrical Wireman PW2
(RM Monthly) 2,454.59 2,508.26 - -
Electrical Wireman PW4
(RM Monthly) 3,174.45 3241.57 - -
Scaffolder - Prefabricated 102.68 105.74 86.13 89.25
Scaffolder - Tubular 104.82 108.57 85.93 89.34
Plasterer 104.89 107.43 89.12 92.12
Tiller 112.40 116.47 91.90 95.56
Painter - Building 97.95 101.34 82.24 85.31
General Construction Worker - Civil 83.04 86.30 - -
Source : CIDB Malaysia
Construction Machine Operator Wage Rates
In 2017, the average daily wages of skilled machine operator grew between 2.0% to 8.0%.
The highest wage earners were tower crane operators (RM127.12 per day) and mobile crane
operators (RM121.59 per day).

23th AsiaConstruct Conference Kuching, Sarawak, Malaysia (on Borneo Island) Malaysia Country Report 12
For semi-skilled machine operator, the average wages increase between 1.0% and 5.0%. The
highest wage earners were tower crane operators (RM96.72 per day) and mobile crane
operators (RM94.83 per day).
Table 10 Average Daily Wage Rates for Local Construction Machinery Operator
Category of Operator
RM per day
Skilled Semi-Skilled
2016 2017 2016 2017
Excavator 103.53 106.08
Pile Riggers 98.22 101.86 78.19 80.80
Off Road Truck Operators 95.08 97.06 77.21 78.22
Backhoe Loader Operators 98.03 100.02
Roller Operators 94.58 97.53 75.34 76.96
Roller/Compactor 96.64 98.86 77.53 79.19
Scrapper Operators 98.46 101.26 81.21 83.21
Motor Grader Operators 97.83 101.08
Wheel Loader Operators 96.87 100.00 79.09 81.20
Paver Operators 100.19 108.40 81.35 84.20
Mobile Crane Operators 119.33 121.59 93.53 94.83
Crawler Crane Operators 117.97 119.92 92.48 92.80
Tower Crane Operators 123.46 127.12 93.98 96.72
Forklift Truck Operators 94.57 98.34 75.48 79.28
Slinger/Dogger Operators 91.82 95.41 75.48 77.24
Source : CIDB Malaysia
Industrialised Building Installer (IBS) Installer Wage Rates
IBS installers comprises of local Malaysian workers. Average daily wage rates for IBS installer
registered an increase between 3.0% and 4.0%. The highest wages were earned by skilled
IBS precast concrete installer (RM156.81 per day) and IBS lightweight panel installers
(RM147.87 per day).

23th AsiaConstruct Conference Kuching, Sarawak, Malaysia (on Borneo Island) Malaysia Country Report 13
For semi-skilled IBS installer, the average daily wage rates also registered an increase of
between 1.0% and 2.0%. The highest wages were earned by semi-skilled IBS precast
concrete installers (RM125.60 per day) and IBS lightweight panel installers (RM122.39 per
day).
Table 11 Average Daily Wage Rate for Local IBS Installer
Category of IBS Installer
RM per day
Skilled Semi-Skilled
2016 2017 2016 2017
IBS Precast Concrete Installers 152.84 156.81 123.68 125.60
IBS Lightweight Panel Installers 142.83 147.87 120.34 122.39
Lightweight Block Wall Installers 127.57 132.47 108.39 110.10
System Formwork Installers 126.94 130.71 111.11 112.71
Roof Truss Installers (wood) 125.30 128.59 105.58 106.90
Roof Truss Installers
(light steel gauge) 129.15 132.62 107.00 108.31
Source : CIDB Malaysia
Export and Import of Construction Services
Based on Malaysia’s balance of payment statement, the value of projects awarded to the
foreign contractor (imports) increased by 37.9% to RM16.9 billion in 2017 (2016: RM12.2
billion). The involvement of Malaysian construction companies in foreign countries (exports)
decreased by 1.8% to RM4.1 billion (2016: RM4.1 billion). This shows a deficit in construction
services, which widened to RM12.8 billion in 2017 (2016: RM8.1 billion).
Among the biggest projects undertaken by Malaysian companies were the energy power plant
in the United Kingdom; Solapur-Bijapur National Highway in India; and road and infrastructure
work in Qatar.
Comparatively, in 2017 a large number of construction projects in the Malaysia domestic
market were secured by contractors from China, Japan and Singapore. They were mainly
geared towards factory, residential and commercial projects. Other foreign contractors were
from Hong Kong and Denmark.

23th AsiaConstruct Conference Kuching, Sarawak, Malaysia (on Borneo Island) Malaysia Country Report 14
Table 12 Export and Import of Construction Services
2014 2015 2016 2017
Export of Construction (RM million) 2,796 4,038 4,137 4,072
% Export Change -13.7% 44.4% 2.5% -1.8%
Import of Construction (RM million) 8,675 10,549 12,221 16,851
% Import Change 7.1% 21.6% 15.8% 37.9%
Net Trade: Export-Import(RM million) -5,879 -6,511 -8,084 -12,779
Source : Balance of Payment, Department of Statistics Malaysia
The exports and imports of architectural, engineering and other technical services have shown
a decrease in 2017. In 2017, the exports declined by 15.2% to RM6.1 billion against a vast
decrease in the imports by 37.4% to RM8.9 billion.
Table 13 Export and Import of Other Business Services
2014 2015 2016 2017
Export of
Architectural, engineering and other
technical (RM million)
6,297 7,173 7,227 6,127
% Export Change -2.2% 13.9% 0.8% 15.2%
Import of
Architectural, engineering and other
technical (RM million)
8,104 10,550 14,183 8,875
% Import Change 12.9% 30.2% 34.4% -37.4%
Net trade: Export-Import (RM million) -1,806 -3,377 -6,956 -2,748
Source : Balance of Payment, Department of Statistics Malaysia
CONSTRUCTION INDUSTRY OUTLOOK FOR 2018
The Malaysian economy is projected to register a sustained growth in 2018. Domestic
demand will be the principal driver of growth, led by private sector activity. All economic
sectors are projected to register positive growth in 2018. The construction sector will continue
to expand with new and existing civil engineering project and expected to have a sustainable
demand.