Transv. 3º # 10 – 50 La Vega – Cundinamarca Cra. 5º # 9-21 y ...
Upload
khangminh22Category
view
5download
0
Cost Risk Assessment(CRA)

2
Presenter Profile – Scott Berg Earned Value Senior Consultant Has worked on numerous programs of diverse size,
complexity and nature as: Risk analyst Cost analyst Scheduler
Has performed over 200 Cost Risk Assessments on both proposals and on-going projects
Has consulted as an EV SME Holds BA and MS in Economics from the University of Utah. Taught in-house Earned Value courses at L3-CS-West from
2011-14. [email protected]
3
Project Management Service Provider
Nationwide capability (Operating in over 17 states)
Over 50 clients, mostly Fortune 100/500
Headquarters in Hopkinton, MA
Satellite offices Huntsville, AL Dallas, TX San Diego, CA
Focus Industries Aerospace & Defense Development Engineering High Tech/Healthcare/IT Complex Development Projects in any industry
Fully insured, most employees have US Government security clearances
COMPANY OVERVIEW
Nationwide Team of ExpertsCost Effective Solutions

4
Project Planning & Scheduling Program Planning Program Control System Build & Run Proposal Planning & Scheduling Startup, Replans and Surge Planning PP&C Standard & Custom Training
Earned Value Management System (EVMS) System Compliance Efficient EVMS Business Processes EVMS Training & Surveillance
Project Management Management System Implementation Project Execution Management Visibility for Executive Steering Team Training
COMPANY OFFERINGS

5
Cost Risk AssessmentQuantifying risk and uncertainty is a cost estimating best practice Uncertainty: the indefiniteness about the outcome of a
situation Point estimate: The expectation of “the team” Risk: The chance of loss
Uncertainty
Opportunity(Lower cost)
Risk(Higher cost)
Poin
t Es
timat
e

6
Cost Risk Assessment
What risks could impact the outcome of the project?o Technical risks -- how might technical risks impact project
performance?o Cost risks -- what are the sources and magnitudes of cost
variances? o Schedule risks -- is time really money and what cost
impacts are likely due to schedule variances? Are there unexpected technical gains that can be
realized? What can the program team do to improve schedule
performance? Are there ways to more efficiently accomplish the
project requirements?

7
Cost Risk Assessment
Cost Risk Assessment must have a basis in fact or it’s merely another opinion that can be easily dismissed Using valid “Sim-to” historic performance is the best way to
estimate risk potential More historic observations makes for better estimation
o Similar activityo Similar deliverableo Same organization
Generic risk multipliers can be used if valid performance history is not available
Monte Carlo simulation provides the quantificationthat validates the CRA results

8
Knowing the Project
A project is: A temporary endeavor with a limited duration A unique planned set of specifically defined interrelated
tasks Effort designed to accomplish well defined objectives Planned with specific scope and timing Complete when all the defined objectives are complete

9
Knowing the Project
What are the unique conditions of each activity? Required Resources
o Laboro Materialo Subcontracts
When the activity happens in the project
KickoffDesign
ProcureBuild
TestShip
10
Measuring Project RiskImportant to know What is being done Where it’s being done When in the program (Early, Late, Last) is it being done
o Finishing is usually harder than starting What resources are being used
o Different resources have different risk o Hardware builds include labor and materialso Sometimes Project Management (PMO) resources can be
consolidated

11
Measuring Project Risk
Account for correlation between activitiesCorrelation: A mutual relationship or connection between two or more things What tasks should be correlated?
o Build Labor and Ops Management?o NRE and System Engineering?
What is the basis of fact for determining correlation? Can tasks have negative correlations?
o Discrete tasks and Level of Effort?

12
Estimating Project RiskWhat is being done by whom and where impacts the risk profile of the task
Typical Risk LevelTask Technical Cost Schedule
Clean Sheet Engineering
“Sim-to” Engineering
SW/HW Integration
New Build
LRIP
Full Rate Production
Clean Sheet Engineering SEVERE SEVERE SEVERE
HIGHSEVERE
SEVERE
SEVEREHIGH
HIGH
HIGH
HIGH
HIGH
MEDIUM
MEDIUM
MEDIUM
LOW
LOW LOW

13
Earned Value and CRA
Earned Value Management (EVM) is a project management process or technique that integrates technical, schedule and cost aspects of a project to measure performance An integrated management system and its related sub-
systems which allow for:• Organization of all work scope• Assignment of authority and responsibility• Objective measurement of progress (earned value)• Accumulation and assignment of Actual Costs• Analysis of Significant Variances from plans• Summarization and Drill-Down of performance data throughout • Forecast completion of milestones and contract events• Estimate of final contract costs• Authorization of all project activities

14
Why EV is important to CRAAll project activities are defined and assigned Product identification defined (WBS) Responsible party assigned (OBS)
Eng.
Mfg
Owner
SW
HW
Build
Install
1.0
1.21.1
1.1.1 1.1.2 1.2.1 1.2.2
1.1.1.A
1.1.2.B
1.1.2.A
1.1.1.B
1.2.1.A
1.2.2.A
1.2.2.B
1.2.1.B
1.2.1.C
Control Accounts
OBS
WBS

15
EV Metrics
All project scope has basic metrics Scheduled to date BCWS Accomplished to date BCWP Actual cost to date ACWP Budget at Complete BAC Estimate at Complete EAC
16
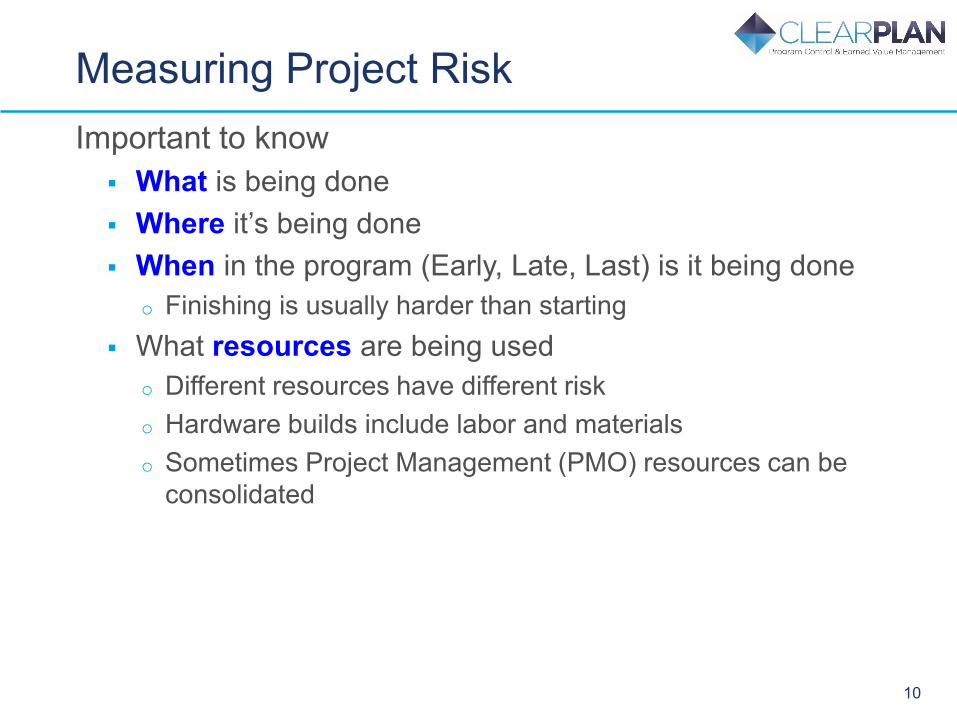
EV MetricsAll project scope has Performance metrics Schedule metrics
o Schedule variance (SV)o Schedule performance index (SPI)
Cost Metricso Cost Variance (CV)o Cost performance index (CPI)
What the metrics mean The variances:
o Positive: Good Under budget, ahead of scheduleo Negative: Bad Over budget, behind schedule
The performance indices:o Greater than 1: Good Under budget, ahead of scheduleo Less than 1: Bad Over budget, behind schedule

17
Earned Value’s importance to CRA
Characteristics of EV that are important to CRA All scope is planned All completed work is measured Actual costs correspond to earned value
Work remaining (BCWR) is clearly defined “What” is left to do “Who” is responsible for doing it
Clear relationship between BCWR and ETC The estimate to complete (ETC) corresponds to the
Budgeted work to complete (BCWR)
18
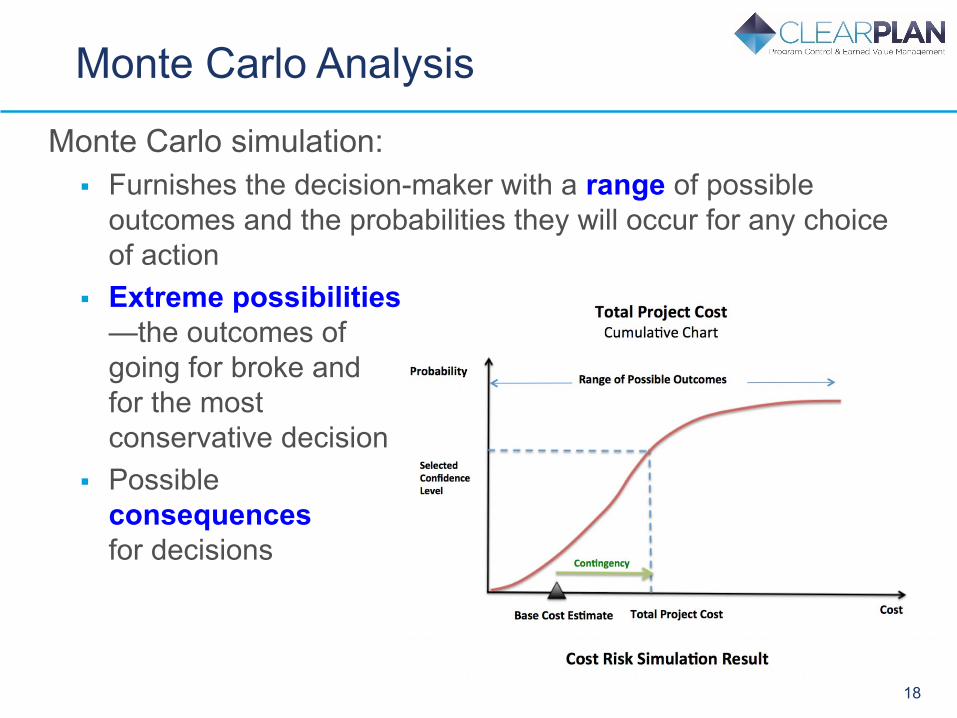
Monte Carlo Analysis
Monte Carlo simulation: Furnishes the decision-maker with a range of possible
outcomes and the probabilities they will occur for any choice of action
Extreme possibilities—the outcomes of going for broke andfor the most conservative decision
Possible consequencesfor decisions

19
Common Probability Distributions (Curves)Normal Symmetric “Bell curve” Two points: Mean and Standard Deviation Values in the middle near the mean are most likely to occur
PERT/Beta Three points for Best Case, Medium Case, Worst Case Appropriate for activities that about which much is known, often
outperform expectation, but can overrun by a considerable amount.
Triangular Three points for Best Case, Medium Case, Worst Case Compared to the PERT, the extremes are more emphasized. Triangular is most often used for activities about which there is
less knowledge about the outcome.

20
Monte Carlo Analysis
During a Monte Carlo simulation Values are sampled at random from the input probability
distributions. Each set of samples is called an iteration, and the
resulting outcome from that sample is recorded. Monte Carlo simulation does hundreds or thousands of
iterations. The result is a probability distribution of observed outcomes.

21
Monte Carlo Analysis
Monte Carlo simulation provides a much more comprehensive view of what may happen. It tells you:
o What could happeno How likely an event or outcome might beo What the consequences could be

22
Monte Carlo AnalysisMonte Carlo simulation provides a number of advantages over deterministic, or “single-point estimate” analysis: Probabilistic Results. Results show not only what could
happen, but how likely each outcome is. Graphical Results. Easy to create graphs of different
outcomes and their chances of occurrence. Correlation of Inputs: Possible to model interdependent
relationships between input variables. Scenario Analysis: Analysts can see exactly which inputs
had which values together when certain outcomes occurred. This is invaluable for pursuing further analysis.
Sensitivity Analysis. Easy to see which inputs had the biggest effect on bottom-line results.

Quadcopter Cost Risk Assessment

24
QuadcopterDevelopment of a new piece of hardware $600 million Contract Value
o Non Recurring Engineering• Hardware Design• Navigation system• Software Development
Hardware Quantities:o Prototype: 1 unito Test Build: 2 unitso LRIP: 20 unitso Full Rate Production: 1000 units
Budgets:o Current effort detail plannedo Future work in planning packageso 10 percent of cost budget in Management Reserve
Performance to date:o Slightly behind schedule and over budget

25
QuadCopter Scope Overview
All Dollars (000)

26
QuadCopter Earned Value Results

27
QuadCopter Earned Value Results

28
QuadCopter CRA Results

29
QuadCopter CRA Results

30
QuadCopter CRA Results
$674.2M
$610.6M
Program EAC $532.4M

31
QuadCopter CRA Results

32
QuadCopter CRA Results
Full Rate Production Removed
33
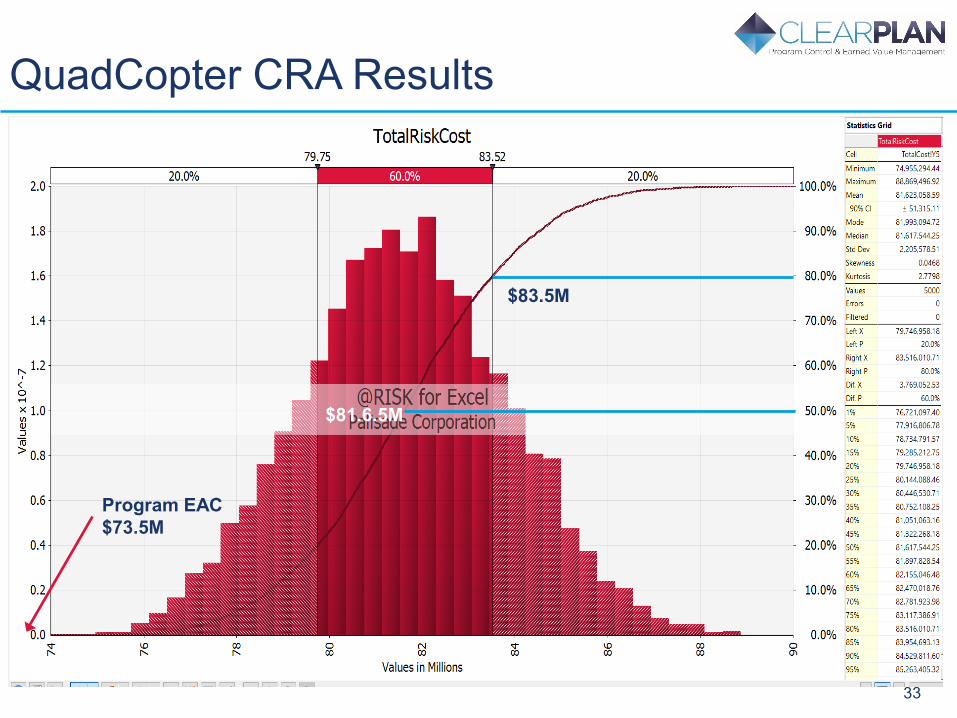
QuadCopter CRA Results
$83.5M
$81.6.5M
Program EAC$73.5M
Copyright © 2022 FDOKUMEN