Crown-pillar risk assessment-planning aid for cost-effective mine closure remediation
17
Crown-pillar risk assessment-planning aid for cost-effective mine closure remediation T. G. Carter and R. I. Miller Synopsis In many countries mines are now required to file closure plans and post bonds for decommissioning. Establishing whether the remediation of specific sur- face hazards arising from mining activity is necessary in a given situation is not always straightforward. In consequence, particularly because of the high cost of closure requirements, considerable interest is being focused on improving methods of assessing the stability of surface crown pillars. Even with such improvements, however, it is not always a simple matter to determine the most appropriate and cost-effective remediation method for a particular surface crown pillar. Some simple probabilistic approaches to the charac- terization of a crown-pillar rock mass are suggested to assist in determining the risk of crown-pillar failure by reference to previous experience. An outline is then given of methods for rationalizing the selection of optimum remediation solutions based on the use of risk-based decision matrices for the quantification and comparison of costs. Establishing whether remediation is necessary to ensure the long-term stability of surface crown pillars over still active or abandoned near-surface stapes in hard rock mines presents a particular challenge for mine closure planning. Decision- making is frequently complicated simply by the difficulty of assessing the stability of the crowns as they are usually weathered and are also often covered by overburden. An attempt to assign a single factor of safety for the unique set of dimensions and properties of a particular crown pillar is generally not valid. However, some basis is required for practical decision-making so that a rational selection of optimum remediation measures can be made and casted and options for closure evaluated. Appropriate stability analyses obviously form a key initial component of the overall decision-making process. Legislative requirements for long- term security also constitute one of the more important governing criteria that must be considered in such decision- making.1 In fact, the regulations themselves often impose such strict controls on the remediation measures that are acceptable for 'walk-away' closure approval that they limit the applicability of many otherwise workable solutions. The present contribution therefore provides some examples of ways in which the application of uncertainty- based decision-making procedures can assist in the selection of cost-effective remediation measures for submission as part of required closure planning documentation. Paper presented at the conference Risk assessment in the extractive industries held at the University of Exeter on 22-24 March, 1994; revised manuscript received by the Institution of Mining and Metallurgy on 13 October, 1994. Paper published in Trans. Instn Min. Metal!. (Sect. A: Min. industry), 104, January-April 1995. ©The Institution of Mining and Metallurgy 1995. Assessing crown stability Since in almost all situations where a crown pillar has been used in mining there are significant differences between the overall rock mass characteristics of the ore zone and those of the hanging-wall and footwall, it is clear that attempts to describe the stability of such crowns by means of a single- value factor of safety will present difficulties. Nevertheless, some assessment must be made of the overall likelihood of failure so that conclusions can be reached on whether or not a particular crown zone poses a long-term hazard. Available methods of analysis Recent back-analysis and detailed assessment of the charac- teristics of past failures of surface crown pillars have enabled the development of a useful guideline approach for evalu- ating the influence on stability of variability in the rock mass. 2 Examination of documented crown-pillar failures in blocky rock masses suggests that failure most frequently develops where several adversely orientated discontinuities intersect or where a particular suite of major joints provides a release mechanism for gravity collapse. Similarly, in failures of significant areal extent the geometry is often controlled by the orientations of major individual discontinuities. Where crown pillars are characterized by unfavourable geometry, small block sizes and generally poor-quality rock conditions, failure tends to occur by ravelling and breakdown of the blocks that form the crown zone (Fig. l(b)), whereas in good-quality rock where jointing is not adverse the inter- locking of blocks may create a stress arch that, by providing some measure of horizontal clamping, promotes stability (Fig. 1 (a)). In cases where ubiquitous fabrics are the cause of failure uncontrollable slabbing and sloughing have often been res- ponsible for inducing progressive or chimney-type crown failures, the latter being particularly evident where very weak crown material is present between relatively strong foot- and hanging-wall rocks. 3 For most other types of failure due to ubiquitous fabrics not only is the structural character of the crown important but so also is the weakness that such a fabric creates on the hanging-wall side of the stope. In fact, the presence of such fabrics can initiate a form of progressive failure that leads, first, to widening of the stope by de- lamination of material from the hanging-wall and ultimately ends in complete destabilization and collapse of the crown. 4 Approaches to assessment Current approaches to assessment of the stability of a surface crown pillar encompass a spectrum of techniques from empirical rule-of-thumb methods through to the application of sophisticated numerical modelling using available computer codes, such as UDEC, FLAC, UNWEDGE or PHASES. However, whenever sophisticated analytical pro- cedures are used the lack of a detailed understanding of rock mass characteristics and variations imposes severe limitations on the validity of the results obtained. When crown conditions are complex probabilistic evaluation techniques A41
-
Upload
independent -
Category
Documents
-
view
0 -
download
0
Transcript of Crown-pillar risk assessment-planning aid for cost-effective mine closure remediation

Crown-pillar risk assessment-planning aid for cost-effective mine closure remediation
T. G. Carter and R. I. Miller
Synopsis In many countries mines are now required to file closure plans and post bonds for decommissioning. Establishing whether the remediation of specific surface hazards arising from mining activity is necessary in a given situation is not always straightforward. In consequence, particularly because of the high cost of closure requirements, considerable interest is being focused on improving methods of assessing the stability of surface crown pillars. Even with such improvements, however, it is not always a simple matter to determine the most appropriate and cost-effective remediation method for a particular surface crown pillar.
Some simple probabilistic approaches to the characterization of a crown-pillar rock mass are suggested to assist in determining the risk of crown-pillar failure by reference to previous experience. An outline is then given of methods for rationalizing the selection of optimum remediation solutions based on the use of risk-based decision matrices for the quantification and comparison of costs.
Establishing whether remediation is necessary to ensure the long-term stability of surface crown pillars over still active or abandoned near-surface stapes in hard rock mines presents a particular challenge for mine closure planning. Decisionmaking is frequently complicated simply by the difficulty of assessing the stability of the crowns as they are usually weathered and are also often covered by overburden.
An attempt to assign a single factor of safety for the unique set of dimensions and properties of a particular crown pillar is generally not valid. However, some basis is required for practical decision-making so that a rational selection of optimum remediation measures can be made and casted and options for closure evaluated. Appropriate stability analyses obviously form a key initial component of the overall decision-making process. Legislative requirements for longterm security also constitute one of the more important governing criteria that must be considered in such decisionmaking.1 In fact, the regulations themselves often impose such strict controls on the remediation measures that are acceptable for 'walk-away' closure approval that they limit the applicability of many otherwise workable solutions.
The present contribution therefore provides some examples of ways in which the application of uncertaintybased decision-making procedures can assist in the selection of cost-effective remediation measures for submission as part of required closure planning documentation.
Paper presented at the conference Risk assessment in the extractive industries held at the University of Exeter on 22-24 March, 1994; revised manuscript received by the Institution of Mining and Metallurgy on 13 October, 1994. Paper published in Trans. Instn Min. Metal!. (Sect. A: Min. industry), 104, January-April 1995. ©The Institution of Mining and Metallurgy 1995.
Assessing crown stability
Since in almost all situations where a crown pillar has been used in mining there are significant differences between the overall rock mass characteristics of the ore zone and those of the hanging-wall and footwall, it is clear that attempts to describe the stability of such crowns by means of a singlevalue factor of safety will present difficulties. Nevertheless, some assessment must be made of the overall likelihood of failure so that conclusions can be reached on whether or not a particular crown zone poses a long-term hazard.
Available methods of analysis Recent back-analysis and detailed assessment of the characteristics of past failures of surface crown pillars have enabled the development of a useful guideline approach for evaluating the influence on stability of variability in the rock mass. 2 Examination of documented crown-pillar failures in blocky rock masses suggests that failure most frequently develops where several adversely orientated discontinuities intersect or where a particular suite of major joints provides a release mechanism for gravity collapse. Similarly, in failures of significant areal extent the geometry is often controlled by the orientations of major individual discontinuities.
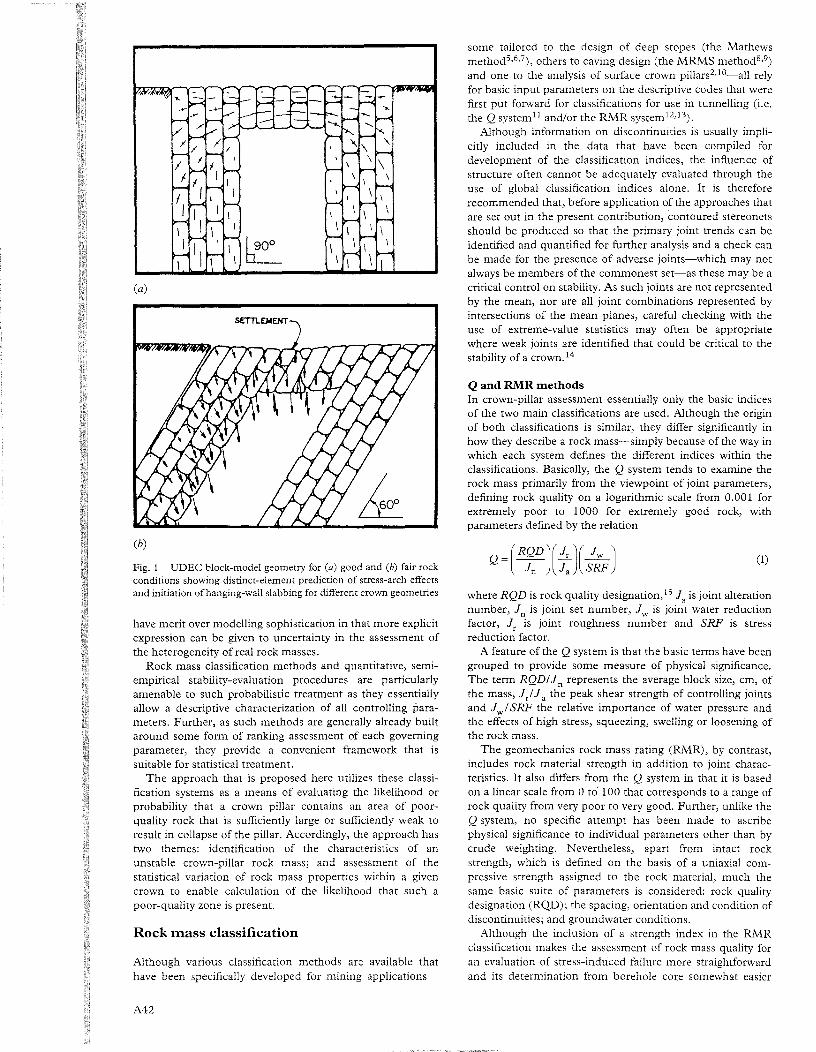
Where crown pillars are characterized by unfavourable geometry, small block sizes and generally poor-quality rock conditions, failure tends to occur by ravelling and breakdown of the blocks that form the crown zone (Fig. l(b)), whereas in good-quality rock where jointing is not adverse the interlocking of blocks may create a stress arch that, by providing some measure of horizontal clamping, promotes stability (Fig. 1 (a)).
In cases where ubiquitous fabrics are the cause of failure uncontrollable slabbing and sloughing have often been responsible for inducing progressive or chimney-type crown failures, the latter being particularly evident where very weak crown material is present between relatively strong foot- and hanging-wall rocks. 3 For most other types of failure due to ubiquitous fabrics not only is the structural character of the crown important but so also is the weakness that such a fabric creates on the hanging-wall side of the stope. In fact, the presence of such fabrics can initiate a form of progressive failure that leads, first, to widening of the stope by delamination of material from the hanging-wall and ultimately ends in complete destabilization and collapse of the crown.4
Approaches to assessment Current approaches to assessment of the stability of a surface crown pillar encompass a spectrum of techniques from empirical rule-of-thumb methods through to the application of sophisticated numerical modelling using available computer codes, such as UDEC, FLAC, UNWEDGE or PHASES. However, whenever sophisticated analytical procedures are used the lack of a detailed understanding of rock mass characteristics and variations imposes severe limitations on the validity of the results obtained. When crown conditions are complex probabilistic evaluation techniques
A41
(a)
(b)
Fig. 1 UDEC block-model geometry for (a) good and (b) fair rock conditions showing distinct-element prediction of stress-arch effects and initiation of hanging-wall slabbing for different crown geometries
have merit over modelling sophistication in that more explicit expression can be given to uncertainty in the assessment of the heterogeneity of real rock masses.
Rock mass classification methods and quantitative, semiempirical stability-evaluation procedures are particularly amenable to such probabilistic treatment as they essentially allow a descriptive characterization of all controlling parameters. Further, as such methods are generally already built around some form of ranking assessment of each governing parameter, they provide a convenient framework that is suitable for statistical treatment.
The approach that is proposed here utilizes these classification systems as a means of evaluating the likelihood or probability that a crown pillar contains an area of poorquality rock that is sufficiently large or sufficiently weak to result in collapse of the pillar. Accordingly, the approach has two themes: identification of the characteristics of an unstable crown-pillar rock mass; and assessment of the statistical variation of rock mass properties within a given crown to enable calculation of the likelihood that such a poor-quality zone is present.
Rock mass classification
Although various classification methods are available that have been specifically developed for mining applications-
A42
some tailored to the design of deep stapes (the Mathews method5' 6' 7), others to caving design (the MRMS method8,9)
and one to the analysis of surface crown pillars2,1°-all rely for basic input parameters on the descriptive codes that were first put forward for classifications for use in tunnelling (i.e. the Q system11 and/or the RMR system12,13).
Although information on discontinuities is usually implicitly included in the data that have been compiled for development of the classification indices, the influence of structure often cannot be adequately evaluated through the use of global classification indices alone. It is therefore recommended that, before application of the approaches that are set out in the present contribution, contoured stereonets should be produced so that the primary joint trends can be identified and quantified for further analysis and a check can be made for the presence of adverse joints-which may not always be members of the commonest set-as these may be a critical control on stability. As such joints are not represented by the mean, nor are all joint combinations represented by intersections of the mean planes, careful checking with the use of extreme-value statistics may often be appropriate where weak joints are identified that could be critical to the stability of a crown. 14
Q and RMR methods In crown-pillar assessment essentially only the basic indices of the two main classifications are used. Although the origin of both classifications is similar, they differ significantly in how they describe a rock mass-simply because of the way in which each system defines the different indices within the classifications. Basically, the Q system tends to examine the rock mass primarily from the viewpoint of joint parameters, defining rock quality on a logarithmic scale from 0.001 for extremely poor to 1000 for extremely good rock, with parameters defined by the relation
(1)
where RQD is rock quality designation, 15 ]a is joint alteration number, Jn is joint set number, Jw is joint water reduction factor, Jr is joint roughness number and SRF is stress reduction factor.
A feature of the Q system is that the basic terms have been grouped to provide some measure of physical significance. The term RQD! J n represents the average block size, em, of the mass, J / J a the peak shear strength of controlling joints and J w I SRF the relative importance of water pressure and the effects of high stress, squeezing, swelling or loosening of the rock mass.
The geomechanics rock mass rating (RMR), by contrast, includes rock material strength in addition to joint characteristics. It also differs from the Q system in that it is based on a linear scale from 0 to" 100 that corresponds to a range of rock quality from very poor to very good. Further, unlike the Q system, no specific attempt has been made to ascribe physical significance to individual parameters other than by crude weighting. Nevertheless, apart from intact rock strength, which is defined on the basis of a uniaxial compressive strength assigned to the rock material, much the same basic suite of parameters is considered: rock quality designation (RQD); the spacing, orientation and condition of discontinuities; and groundwater conditions.
Although the inclusion of a strength index in the RMR classification makes the assessment of rock mass quality for an evaluation of stress-induced failure more straightforward and its determination from borehole core somewhat easier

than with the Q approach, it does tend to limit the sensitivity of the method when an attempt is made to classify subtle, but important, joint-controlled effects.
Rather than being a limitation on their application, these intrinsic differences between the classifications are a significant advantage in that when both systems are applied and the deduced Ri\1.R and Q values are compared some confirmation of the reliability of the data from field observations is obtained. Not only can the inherent variability in the rock mass characteristics be assessed but a better appreciation of uncertainties in the definitions of parameters can also be gained. Used together, therefore, in conjunction with other specific information on the orientation, persistence and surface conditions of discontinuities, such classifications provide a good basis for the type of probabilistic analysis that is the subject of subsequent sections of the present paper.
Crown-pillar characterization In addition to the need to cope with the vagaries of the various classifications, considerable and real difficulties arise in attempting to define single classification values for typical crown-pillar rock masses that are both representative and unique.
In principle, the same basic techniques of geostatistical analysis that are routinely applied to the evaluation of variability in ore grade can also be applied to assessment of the variation in rock quality across a crown-pillar zone, for, just as ore grade varies across a site, so too does rock mass quality. In practice, however, variations in the latter are generally much more difficult to quantify as an evaluation of rock quality at a particular point requires a relatively large amount of information about the rock mass, whereas ore grade can usually be assessed by measuring a single parameter. There is seldom, if ever, sufficient relevant information to define completely the spatial variation of rock quality across a given crown in a fully quantitative manner. Furthermore, most crown pillars are characterized by the presence of different zones of competent rock (usually the margins to the ore) and weak, faulted ground (often the ore zone). In recognition of this, the approach that is developed in the present contribution is based on treating the quality of the weakest zone of rock in a particular crown pillar as a random variable and evaluating the likelihood (probability) that this zone of the crown is sufficiently poor or extensive to result in a collapse.
Variation in rock mass characteristics across the crown and abutments is one aspect that must be carefully examined, but the difficulties of classification are further compounded when areas close to the surface are assessed. Here the rock is not only likely to be variable as a result of weathering effects but is often so completely covered by overburden that it can only be crudely characterized from borehole core. In these situations classification of the rock mass is by no means straightforward. Estimating representative discontinuity characteristics is tricky and defining RQD is particularly difficult. In such circumstances there is merit in determining RQD from core (with specific corrections for core size effects16•17) and comparing the calculated values with estimates based on underground measurements of fracture frequency and surface observations of scan-lines. Where core is not available for areas of the rock mass for which a classification is required representative RQD values for different sections of the crown can be estimated from maps of fracture frequency using the exponential decay relationship proposed by Priest and Hudson 18•19 as correlated to other published trends
(including the range of RQD data compiled by Deere 15 and that compiled by Bieniawski (see Kendorski et al. 20)):
RQD = lOOe-tA(tA + 1) (2)
where A is the fracture frequency (fractures/m) and t = 0.1 m defines the theoretical limit-case, upper-bound RQD range.
Values computed from this approach can also be checked using the method proposed by Palmstrom:2 1
RQD = 115- 3.3Jv (3)
where Jv is a measure of the number of joints crossing a 1-m3
block of rock. Although correct characterization of the weakest part of
the rock mass in the crown zone is the key to appreciation of the inherent strength of the pillar, accurate information on the geometry of the underground stope excavation is also essential to a proper assessment of stability. Obtaining a sufficiently accurate profile is sometimes no trivial matter as all too often no reliable data are available on the final geometry of the excavation. Furthermore, in many cases the stope crown and hanging-wall may have caved and ravelled to such an extent that the shape created by mining may have changed completely. Resolution of the considerable uncertainties that can sometimes arise in defining the geometry of a particular stope crown requires careful site investigation-often with the use of fairly sophisticated techniques, such as those discussed by Cole et al., 22 Carter et al. 23 and Steed and co-workers. 24
Empirical assessment of crown stability
Although various rule-of-thumb methods for the design of surface crown pillars have been applied in mining practice for well over a century, recent research has documented numerous failures that have occurred where the rules were simply inappropriate. 25•26 Attempts have therefore been made to improve the existing rules by undertaking detailed checks of available data to establish rock mass characteristics and pre-failure geometry for as many failed and non-failed surface crown pillars as possible. 27
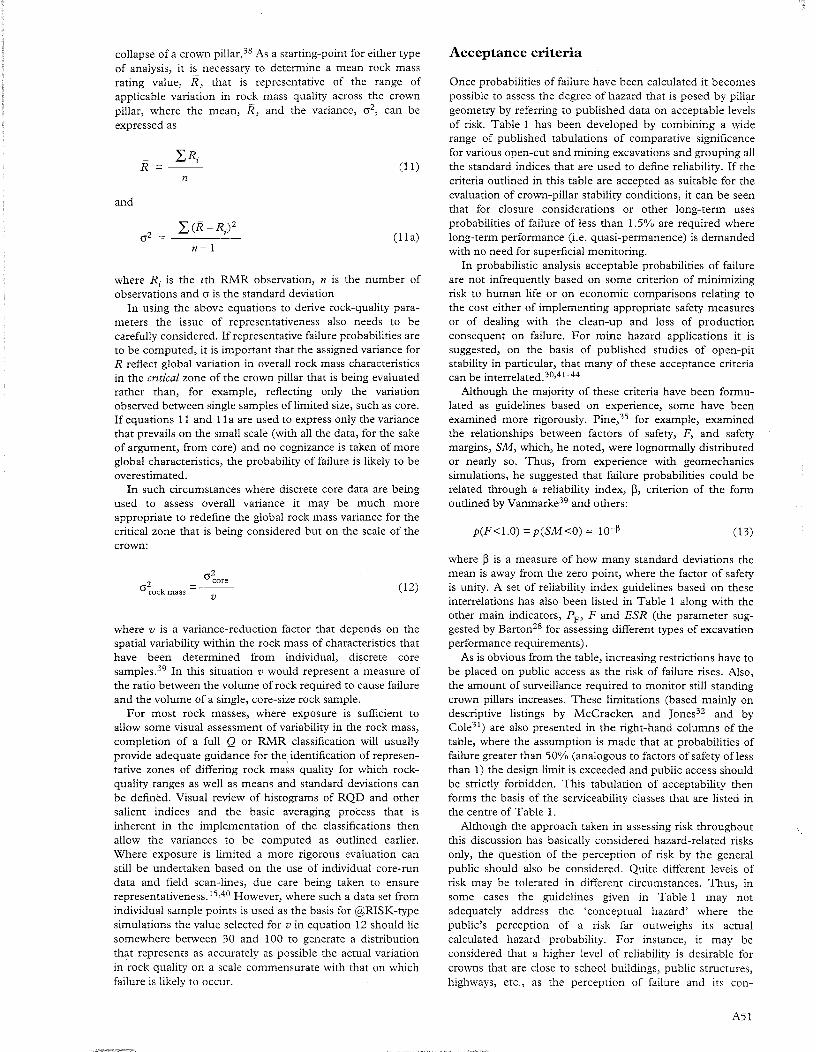
Early evaluation led to the development of an improved relationship of the form shown in Fig. 2 whereby the thickness to span ratio that was employed in the old rule-ofthumb approach, rather than being defined as a single value, was replaced by an expression related to rock mass quality:
T = 1.55 Q-0.62
s (4)
where Tis thickness and Sis span. Initially, it was considered that this method of evaluation would provide a simple, guideline relationship that would be suitable for checking crowns in geological settings similar to those for which assessments were held in the database. It was, however, quickly realized that since the relationship was not scaleindependent, its use without calibration could very easily lead to significant errors. Accordingly, efforts were made to develop a relationship that would describe crown geometry more accurately.
Scaled crown span Some success was achieved by exammmg different beambending analogies by methods of dimensional analysis. This allowed the definition of a scaling expression that could be effectively applied to provide a unique characterization of the
A43

NGI-Q
0.001 0.01 0.1 1.0 4 10 40 100 400 1000 I 00.0 +----+----+---+----+--t----+-t------,r--------1
0
[i 10.0 a: z <( CL (f)
0 1.0 f-<J) (f) w z
"" u :C f-
0.1 0 Hwl Fw ROCK MAS~ 1----+---1 • FAILURE CASES
6 ORE ZONE t FILLED CASES
0 I
20 40 60 80 I I I I
GEOMECHANICS RMR
100 I
Fig. 2 Summary of crown-pillar case records plotted as thickness to span ratios versus rock mass qualiry of weakest zone within crown geometry. NGI-Q, Norwegian Geotechnical Institute tunnelling quality index, Q
three-dimensional geometry of a given surface crown pillar. 10
In addition, it was subsequently found that this 'scaled crown span' concept enables fairly reliable comparisons to be made of the stability of different pillars that have been excavated in different rock masses of different overall quality. The approach was based on a simple scaling expression of the form Cs = S x Kg, where a geometric scaling factor, Kg, is used to modify the actual span, S, to take into account differences in three-dimensional pillar geometry. The scaling relationship that was developed to consider all the critical dimensions of crown thickness and the dip and geometry of the rock forming the stope walls and surface crown pillar (Fig. 3) can be expressed as
Cs = S --,-,---------:---'Y:__ __ ----, { }
0.5
T[(1 + SR)(1- 0.4cos e)] (5)
where Cs is scaled crown span, m; S is actual crown-pillar span, m; y is specific gravity of the rock mass; T is thickness of the crown pillar, m; e is dip of the orebody/foliation, degrees; and SR is the span ratio S/ L (span of crown pillar divided by its strike length).
Detailed discussion of the full development of this expression is beyond the scope of the present work, but it should be noted that in the overall expression the foliation dip angle, e, reflects also the dip of the controlling hangingwall of the stope. Thus, for a tabular orebody (Fig. 3(a)), as the dip of the foliation and, hence, of the stope sidewalls shallows from 90 to less than 45°, the effective span of the stope should no longer be considered as the width of the ore zone but rather as the dip length of the hanging-wall.
Although by no means perfect, this simple scaling approach represents a considerable improvement on the straight thickness to span ratio as a means of defining pillar stability as some account can be taken of each of the most important variations in three-dimensional geometry. With time and the accumulation of more case records the approach is likely to undergo further development and refinement. At this stage, however, it can be considered a useful index approach that, like the Mathews method for deep-stope design or the Q and RMR systems for tunnel evaluation, provides a ready means for quick assessment of the likely stability of a given pillar geometry. (For a fuller
A44
s STOPE SPAN
OPEN STOPE
(a)
(b)
Fig. 3 Terminology for definition of crown-pillar scaling relationship. (a) Schematic view of stope showing span, S; length, L; and dip, e. (b) Stope cross-section showing S, e and crown thickness, T
description of the development and application of the approach the interested reader is referred to Carter10 or to the original (1990) report by Golder Associates to CANMET. 2)
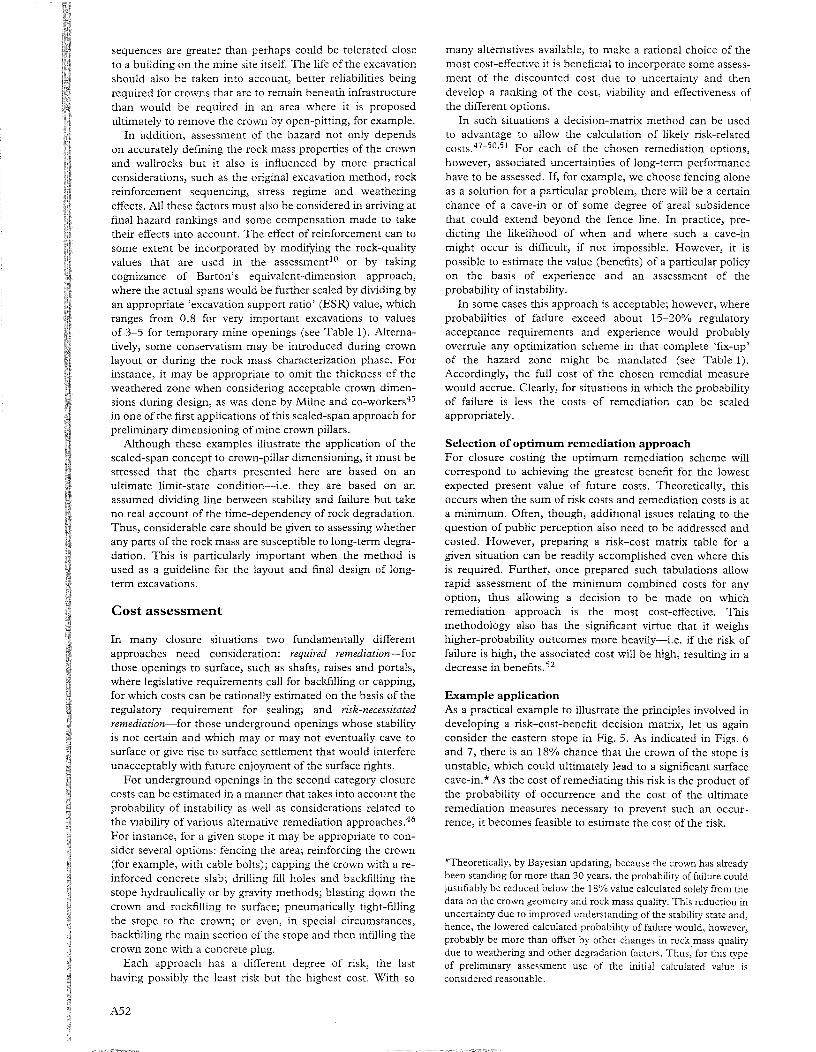
Taking the scaling expression given as equation 5 and recasting the database records plotted in Fig. 2 allow generation of the graph presented as Fig. 4. Again, all the case records in the Golder-CANMET database have been plotted against the rock quality of the weakest zone in the crown. As in Fig. 2, for convenience of reference the RMR and Q scales have both been used for the plotting, their relative positioning being based on Bieniawski's 197 6 correlation, RMR = 9logeQ + 44.13
Although it must be recognized that for certain rock conditions significant divergences can occur in the correlation between the two indices, this widely published relationship has been utilized as, for most rock masses, it adequately reflects the relationship between the two classifications. However, in cases where comparative classifications suggest wide divergences either these must be treated explicitly or a specific site and/or rock mass calibration relationship must be developed.
Critical span line In addition to the plot of the database records, Fig. 4 includes three power-law relationships for the assessment of

maximum spans in different rock conditions-two of which plot as linear traces and one as a curved envelope. Although each was originally formulated for the definition of span only, they provide a useful framework for checking scafep spans on the premise that the scaling coefficient, Kg, incorporates all appropriate three-dimensional factors to ensure that Cs is suitably scaled. However, examination of the slopes of the linear expressions shows that neither adequately reflects the trend of the boundary between failed and stable cases. The line proposed by Barton in 197628 to define the maximum span of generally unsupported civil engineering openings
the non-linear trend to increasing stability at the very goodquality end of the Q-RMR scale as indicated in Barton's original Q data 11 •28 and as suggested by some of the case records in the Golder-CANMET crown-pillar database.2 It should also be appreciated that this curve, rather than defining a theoretical limit, represents a transition line between stable and failed cases as defined at a specific moment in time. It is, thus, a curve that, although it represents some low probability of failure, isolates most cases for which failure is likely. However, exceptions may well occur: some of the pillars for which records are held failed
NORWEGIAN GEOTECHNICAL INSTITUTE TUNNELLING OUAL11Y INDEX, 0
z <( a.. "' z ,. 0
"' u
100.0
LEGEND ltj:l:=~ : . . 0 Hw/ Fw ROCK MASS t~ ,, EJ ___ ~o..'J.I II I • FAILURE CASES :J.Lf CAVING II I 6. ORE ZONE
+ FILLED CASES r-~11 I 11/llil I ! I i 'I j! I lllJ.J
10.0 , li I I I I
'" ' ,,:1 '' i '!'I I Ifill'
1.1 I ill 1+/':J I fCARTER (19891
I I i ~~ V'f,,\2 lcRITICA'. SPAN< 4.410 O.'l> I. ~~·,-lt~·
1.0 • ' ' 'I ..... ' • ' '
,,,, >111
' ,,, . " :1111 I ' II ,1!1
' " ' I 1' II 'H ! I i J;r K I II I
!"';:
L
~
' ' ' ,,
' ' " ' 1\11 '' ' I I II f I I II~ i ill I 11--r- I
I I ill' I L-n. BARTON 119741 I l~ l~lll GOLDER ASSOCIATES 119901
CR;TICAL I SPAN Sc"'3.3Q0
.43 x[sinh0·
0016 (0)]
'' "' ' '' I ,1!1 I 'II!:
I T<t I II I ·"" ,,,- IIIII
Hill IU~iil' II IIIII
:1 ~II illllll I Ill I
.. ; '"
I i !111 STABLE " I I II I I . . '1 I I I 'Iiiii I I U! I ::n BARTON (1976) rili I f--·' I I
I I IIIII Ailllll I II II OJ IlL CRITICAL SPAN = 2 0 .
10 20 30 40 50 60 70 80 90 100
VEl~Y "OOR fAIR GOO()
GEOMECHANICS RMR CLASSIFICATION
Fig. 4 Summary of crown-pillar case records in Golder-CANMET database plotted as scaled crown spans versus rock mass quality using Q or RMR classification methods. (References: Barton (1974); 11
Barton (1976);28 Carter (1989);27 Golder Associates (1990) 2)
(critical span, S = 2 Q 0·66) tends to the conservative side for poor rock-quality conditions, whereas the power-law expression for average critical span proposed by Carter27 to fit the mean trend to the various mining engineering classifications (critical span, S = 4.4Q 0·32) tends, by contrast (mainly because it essentially addresses only short-term mining requirements), to underestimate the time-dependent influences on failure that are seen in some of the older case records at the poor-quality end of the scale (see also the discussion on stand-up time by Franklin and Palassi29).
However, if the shape of the original empirical 'unsupportedspan' curve outlined by Barton and co-workers in 1974 11 is plotted together with a non-linear tail to encompass Barton's various data points11 •28 at the very good-quality end of the scale (these are not shown in Fig. 4), the resulting curve tends not only to separate the case records in the crown-pillar database better but also tracks other available data for good and very good rock conditions more accurately. The following expression, termed the 'critical span line', has therefore been developed to match the shape of Barton and co-workers' original curve: 11
(6)
where Sc, m, provides a measure of the maximum scaled span for a given pillar beyond which failure may occur. It should be appreciated, however, that the hyperbolic sinh term in equation 6 has been introduced simply to account for
soon after excavation whereas others stood for a hundred years before failure, and some currently stable pillars could yet fail owing to unfavourably located joints or other factors.
Nevertheless, in its present form Fig. 4 provides a basic means of rapid crown-pillar stability assessment by allowing the scaling of different crown geometries for different rock mass conditions. Further, because it is based on a fairly extensive database of more than 200 surface crown-pillar case records, it does provide a ready basis for sensitivity evaluation when used in conjunction with more sophisticated techniques of numerical analysis.
Application to existing crowns Although Fig. 4 can be used for basic deterministic analysis (by simply calculating the scaled span of a given pillar and then, with the controlling rock mass quality defined, plotting its position on the chart to determine its stability state), the graph can also form the basis for more extensive probabilistic assessment of variations in stability.
It is important to realize, however, that when the original database records were plotted crowns were only known either to be standing or to have failed. Actual factors of safety for both 'stable' and failed crowns were not known with any certainty at the time, although now it would be possible to assess how close to marginal some of the crowns were from the final plotted position for each case. This same limitation exists when the chart is used deterministically for crown design. If, for example, the geometry of a particular crown
A45

Table 1 Comparative significance of crown pillar failure (modified from McCracken and Jones32 with data from Kirsten and Moss,33 Priest and Brown,34 Barton,28 Pine35 and Cole31 )
Class Probability Minimum Reliability Design guidelines for pillar acceptability of failure, factor of indices Serviceable life of crown pillar Public Regulatory Operating % safety access position on surveillance
~ ESR Expectancy Years closure required
A 50-100 <1 <0.1 >5 Effectively zero <0.5 Forbidden Totally Ineffective unacceptable
B 20-50 1.0 0.5 3 Very, very short-term 1.0 Forcibly Not Continuous (temporary mining prevented acceptable sophisticated purposes only; monitoring unacceptable risk of failure for temporary civil tunnel portals)
c 10-20 1.2 1.0 1.6 Very short-term (quasi- 2-5 Actively High level of Continuous temporary stope crowns; prevented concern monitoring undesirable risk of failure with for temporary civil works) instruments
D 5-10 1.5 1.2 1.4 Short-term (semi- 5-10 Prevented Moderate level Continuous temporary crowns, e.g. of concern simple under non-sensitive mine monitoring infrastructure)
E 1.5-5 1.8 1.5 1.3 Medium-term (semi- 15-20 Discouraged Low to Conscious permanent crowns, moderate level superficial possibly under structures) of concern monitoring
F 0.5-1.5 2 2.5 Long-term (quasi- 50-100 Allowed Of limited Incidental permanent crowns, civil concern superficial portals, near-surface monitoring sewer tunnels)
G <0.5 »2 >3 0.8 Very long-term >100 Free Of no concern No (permanent crowns over monitoring civil tunnels) required
ESR, Excavation support ratio.
point plots in the potential caving zone-defined as the area above the critical-span line-the likelihood of failure is high unless the crown is sufficiently supported or fill is to be used in mining. Establishing the exact factor of safety of the designed crown, however, is not a simple matter.
Probabilistic assessment of crown stability
Although the empirical crown-pillar stability relationships outlined above were essentially formulated on the basis of a deterministic evaluation of the database records, the approach lends itself to use as a means to quantifY probabilistically how likely a given pillar is to fail. This can readily be accomplished for a single crown geometry with reference to defined variations in rock mass quality or, where pillar geometry also varies (for example, along the strike of a long stope section), it can be done for both geometry and rock mass quality. In fact, there is considerable technical merit in using a sensitivity-based approach that permits assessment of the full range of likely rock qualities. Such an approach not only allows better understanding to be gained during evaluation of the stability state of a given pillar but it also takes into account more effectively the variations in rock mass characteristics that occur in real situations.
such pillars underlie areas accessible to the public. Better public awareness and understanding of the risk of failure are usually achieved when the results of critical analyses are expressed in terms of the probability of a factor of safety smaller than 1, or the probability of failure (Pp). This, in fact, has been the thrust of much recent work connected with mine hazard assessment studies.!O,ZZ,27 >30,31 It has also been at the centre of thinking directed to the quantification of risk and uncertainty (see Table I, as modified and extended from tabulations compiled principally by McCracken and Jones,32
Kirsten and Moss,33 Priest and Brown,34 Barton,zs Pine35
and Cole30,31).
Aside from the technical perspective, the use of probabilistic approaches for assessing the stability of crown pillars has some other significant advantages, particularly where
A46
Table 2 Average geometrical and rock mass quality conditions for crown zone above first-level stope east of highway in Fig. 5
Crown span, S, m Thickness, T, m Strike length, m Foliation dip, degrees Rock quality MeanRQD,% MeanQ MeanRMR S.d. (cr), RMR units
14.5 18.5 45.0 70
73 9.3 63 11

Fig. 5 Example geometry of two areas of near-surface stoping for which risk assessment and remediation solutions are required to safeguard highway. (For cross-sectional geometry see Fig. 9)
Graphical assessment Let us suppose that we wish to analyse the stability of the crown pillar over the eastern stope shown in Fig. 5 as there is some concern that its failure could lead to collapse of the highway. Fig. 6 shows the basic approach that can be used for graphical probability assessment in this situation and illustrates how readily an estimate of the current stability state can be derived for any given crown. The average geometrical and rock mass quality conditions for the crown zone considered as an example are given in Table 2.
By substituting into the scaling relationship and assuming that the specific gravity, y, of the rock mass is 2.7 the equivalent scaled crown span, Cs, can be calculated as follows:
2.7
I 1
0.5
~5.2m (7)
This value can now be plotted against rock mass quality on the chart shown in Fig. 4 using the Q scale along the top axis or the RMR scale along the bottom axis. To enable a rapid determination of whether the crown is generally stable or is liable to cave the mean values for Q and RMR can be plotted either with appropriate ranges or as single-value estimates. In this case the crown plots in the stable section of the graphbut how stable is it? This can be fairly readily assessed if now, rather than plot a rock-quality range or mean value only, a probability density function is plotted to reflect the likely variability in rock mass quality within the crown. For this level of preliminary assessment with the simple graphical approach a normal distribution curve has been used as it can be assumed that rock mass quality values will be normally
distributed provided that the coefficient of variation (CoV) remains reasonably small.
In assessing the spread of such a distribution it is important, however, to take care not to mix the characteristics of different parts of the crown rock mass by taking the simple option of choosing a distribution with a large standard deviation. In most crowns one part-usually the ore zone or the immediate margins of the ore zone-is less competent than the remainder of the pillar. It is important in such situations that the distribution selected match as best as possible the spread of actual conditions. In this regard it should be noted that the weakest area is not always the ore zone. Because the majority of ores originate by injection of mineralized fluids into a fault zone, sometimes, when such injection is predominantly siliceous, the ore zone-being quartz-rich-can be much more competent than either the hanging-wall or footwall rock masses. In such cases the distribution should be chosen to reflect the characteristics of the controlling (weakest) zone of the rock mass. For the example shown in Fig. 5 the characteristics of the footwall rocks (Table 3) are the critical consideration. In this case, in undertaking a preliminary stability assessment the mean Q of 9.3 and the mean and standard deviation in RMR units of 63 and 11 for the footwall rocks would be utilized as these
Table 3 Summary rock mass characteristics for highway stope example
Q RMR (s.d.)
Hanging-wall 25 72 (14) (mafic volcanics)
Ore zone 43 78 (7) (metaconglomerate)
Footwall 9.3 63 (11) (slaty metagreywacke)
A47

RITICAL QUALITY
0 = 2.9
RMR CRfT. = 54
0
~
GRAPHICAL STABILITY
ROCK QUALITY ASSESSMENT
RMRMEAN RMRcRIT
63 54
f---11 DIFFERENCE 9
Standard Deviation, a (RMR units) 11
NORWEGIAN GEOTECHNICAL INSTITUTE TUNHEWHG QUALITY III)EJ( , Q PROBABILITY OF FAILURE 20% (b d ff d' .. ase on o set, a !VISIOns
~yl EXTliDI!I.Y I 1iiRY ,_ I ,_ I-I 1001> I=~T=·I from Mean in RMR units) (0.82) ,_ 0 .001 0.01 OJ LO ~ 10 ~0 100 400 1000
100 /JJ IIIII/I II Ill I F= ~ r4 CRITICAL SPAN LINE
] .. <J
CAVING " _1 Sc = 3.3 Q0·"" X [sinh"-0016 (Q)) (metres) J ,
CONDITIONS :z <( a.. "' :z 10 ~
1\ ~io- SCALED CROWN SPAN
"" <J 0 C5 = 5.2 "' ...J
~ U)
~ ESSENTIALLY I
STABLE .Jv ~
,.. 1111 111111~ .. }
0 10 20 30 40 301 601 70 80 !0 100
V£l'Y """" 1'0011 .... GOOD IV!l<Yeooo I EVALUATION OF RMR
MEAN
WITH RESPECT TO RMR CRITICAL
[ ROCK QUALITY CRITICAL QUALITY PROBABILITY OF CRITERIA OFFSET FROM MEAN CONCERN
52 74 · 1.645 a 95%
I •• ::,.~~-, 1-- AMA..,.,. ·l.OOOa 64%
RMR RANGE s [y /(T{1+S.J{1-0.4cos9}})0
·5 (metres) t I STD.
ere: s = crown pillar span (m) DEVIATION y = rock mass specific gravity
-T - thickness of crown p1llar (m) 8 = orebody/foliation dip, •
and S, = span ratio = S/L ie., (crown pillar span + crown pillar strike length)
LESS than AMR~(T
RMRI.EAN = RMRCAH
RMR..,.,. GREATER than
RMA0 .,
. 0.675 a
· 0.250 a
0.000
+ 0.250 a
+ 0.675 a
+ I.OOCa
+ 1.645 a
75%
60%
50%
40%
25%
16%
5%
where a ; Standard Deviation Rock Quality in RMR units
Fig. 6 Example application of scaled crown-span concept to evaluate probability of failure for surface crown pillar of known geometry
would reflect conditions in the weakest part of the crown appropriately.
At this stage it should be appreciated that, when performing probabilistic assessments of rock mass quality, it is much more convenient to express all variabilities in RMR units than to use the Q scale. This is because the latter is a logarithmic index, which makes it difficult to refer to consistent coefficients of variation or standard deviations except in log Q terms. Thus, irrespective of the classification approach that has been used to assess the rock quality, for the purposes of probabilistic evaluation it becomes efficient to adopt the linear RMR scale simply because it aids comprehension in plotting and analysis.
Whichever classification is the preferred choice, the approach that should always be followed in identifying distributions for the parameters used in a probabilistic analysis is to try to reflect closely the best possible understanding of the geology of the crown zone. To achieve this the rock mass forming the crown and sidewalls of the stope should be
A48
examined with the utmost care. For the example shown in Fig. 5, where it is considered that the footwall rocks, being the weakest and most intensely sheared, will dominate crown behaviour, a normal probability distribution range at least one standard deviation either side of the mean (Fig. 6) would be selected as representative. A further conservative assumption is then made that failure will occur whenever the RMR is locally less than the critical minimum rock mass quality/rating required for stability. (The assumption is conservative because, as shown in Fig. 4, a limited number of crowns were stable even when the RMR was less than the critical value-i.e. above the bold curve.) This critical minimum rock quality can readily be approximated for the crown considered in the example, for which the equivalent scaled span is 5.2 m. The value can be read off the chart or calculated for the linear portion of the critical-span curve for values of Q <50 or RMR <80 using either of the following regression relationships (which are based on the straight-line portion of the curve):

(8) or
(9)
For the example the critical rock mass quality, as read off the graph or calculated from the above linear expressions, would be
RMRcrit"" 54 (or Qcrit"" 2.9) (1 0)
As shown by the calculations in the top right-hand comer of Fig. 6, this critical quality value falls nine RMR units (i.e. 0.82 standard deviations) below the mean rock mass rating of 63; thus, from the table in the lower right-hand comer of the figure the probability of failure can be estimated as about 20%. This suggests that, although the crown is essentially safe, there is about one chance in five that some combination of the poorer parts of the rock mass will prevail right across one section of the crown such that a failure could occur.
@RISK approach Although the simple graphical approach described above is quite adequate for rapid assessments of crown stability (for instance, at a preliminary level when it is necessary to develop hazard rankings), it is also possible to apply the same basic procedures somewhat more rigorously by using quantitative probabilistic methods. Assessment can then be carried out not only of variations in rock quality in terms of RMR or Q but also of variations within the geometry of the crown. This type of more rigorous evaluation can still be fairly readily accomplished by first describing the variability of all key parameters in terms of appropriate probability distributions and then using a statistical analysis package, such as the @RISK* or Crystal Ball add-ins for Lotus 1-2-3 and Microsoft Excel, to evaluate probabilities of failure. Essentially, the approach requires that rock mass quality variation and geometric characteristics be randomly chosen from within defined probability density functions that have been selected on the basis of their appropriateness for each of the key parameters. Distributions must be defined for each of the controlling dimensions of the crown geometry and for each of the basic parameter descriptor codes that are used in formulation of the rock-quality indices for both the Q and RMR values.
For stochastic analysis RQD and rock strengths can typically be described by lognormal or truncated normal distributions, such truncations being implemented to 1 :nt the random selection of meaningless values (for exa»,ple, negative RQD or strength). The remaining parameters that are used to calculate the rock mass classifications can then be described using discrete values from the standard ranges given in the Q and RMR classification tables. This allows, for each specific parameter, the shape of the distribution to be matched to observed variations in the rock mass. Examples are provided in the form of the histogram plots on the right side of the @RISK spreadsheet illustrated in Fig. 7. In these plots discrete function variables have been used for each of the 1
3, Jn, condition, etc., terms to match the division codes
set by Barton 11 or by Bieniawski 13 for each classification descriptor group. Each description used in the @RISK spreadsheet has therefore been assigned a value, x, that is based on the corresponding rock mass classification weighting and a
*Palisade Corporation. @RISK Risk analysis and simulation. Add-in to Lotus 1-2-3™, version 1.55. User guide, 1990.
weight or likelihood, p, that specifies the probability of occurrence of the outcome on the basis of field observation and data collection information.
One of the significant advantages of discrete functions of the type that is used to describe some of the parameters in Fig. 7 is that they allow geomechanics variables that are not normally distributed, such as joint spacing and persistence, to be readily defined. Most of the other common variables that are used in the calculations have approximately normal distributions and, although most natural variables tend to exhibit coefficients of variation (CoV = a/11) that are somewhat more constant than their standard deviations,35,3 6
it is generally accepted practice simply to use tabulated means, Jl, and standard deviations, a, to represent variations in the parameters, as has been done for the Q and RMR indices obtained in Fig. 7.
Further, in carrying out probabilistic evaluation ofQ and, particularly, of RMR values attention must be given to the problem of cross-correlation. Of particular importance in calculating RMR values is the significant cross-correlation between spacing and RQD. Although some correlation also can be considered to exist between Jn, the number of joint sets, and RQD, detailed checks of this interrelationship and other, possibly important, correlations suggest that these weaker dependencies are of little significance to the overall calculations. Thus, as only the correlation between spacing and RQD in the RMR classification is significant, this relationship has been specifically dealt with in formulating the @RISK spreadsheet illustrated in Fig. 7. This has been achieved by making the sampling of the spacing distribution conditional on the sampled RQD, where the latter is represented by a truncated lognormal distribution with the upper-limit correlation between RQD and spacing specified to conform with equation 2-i.e. to be consistent with the form of the correlation relationship suggested by Priest and Hudson. 18•19 Although the more obscure and less significant correlation relationships (e.g. between roughness and surface characteristics) have not been specifically treated, both @RISK and Crystal Ball are capable of incorporating any specified correlations into their random sampling schemes without affecting the individual probability distributions of the input parameters.
Once such a spreadsheet has been created its use in practice is quite straightforward. First, for each iteration of the @RISK spreadsheet shown in Fig. 7 a pair of Q and RMR values is calculated independently. Next, two specific estimates of critical span, Sc, that are consistent with these RMR and Q values are computed from equation 6. The two Sc values are then compared on a case by case basis with stochastically assessed values of scaled crown span, Cs, that have been independently derived from the probabilistic descriptions of the geometry of the crown zone using equation 5 (see tabulation section at lower left of Fig. 7).
If either of the critical-span values from the Q or RMR calculations is found to be less than the scaled crown-span value representing the actual crown geometry for that iteration step, then for that crown-pillar geometry and rock mass quality the pillar plots within the caving area of Fig. 4 and, thus, a case of 'failure' is registered. With at least 500 iterations to ensure an adequate representation of the input distributions two separate estimates of the most likely probability of failure are derived, one based on the stochastic spread of computed Q values and one based on the RMR calculations. These values can then simply be averaged to provide a best-estimate failure probability for the pillar under consideration. In this case, as shown in Fig. 7, an approximately 18% probability of failure is suggested, which
A49

I
I
CLASSIFICATION DRILL CORE QUALITY (RQD) Very Poor Poor Fair Good Excellent
Deere ( 1964) Ratings 2 4 8 13 17 20 <RMR
Class~ication Value 10% 20% 40% 60% 80% 100% <0
Relative Likelihood 2.3% 4.7% 7.8% 23.4% 35.2% 26.6%
Lowest
~ Mean Std. Dev
~ II 73.1 I 23.6% I
JOINT SET NUMBER (Jn) I SPACING (S) I No. of Joint Sets Massive 1 2 3 4 4+ Crushed
Classification .... Q 0.5 2 4 9 12 15 20
Relative Likelihood 5% 10% 25% 40% 15% 5% 0%
Spacing (m) >3m 1-3m 0.3-1m .05-.3m <50mm
Coding Values .... RMR 30 25 20 10 5
Expected Likelihood 7% 16% 36% 42% 0%
(based on ROD) Averaqes - Jn SpacinqRatinq Jl 7.41 17.31 JOINT ROUGHNESS (Jr) & CONDITION
Slick Smooth Rough Smooth Rough Non-
Surface Characteristcs Planar Planar Planar Wavy Wavy Cont.
Class~ication .... Q 0.5 1 1.5 2 3 4 Q
Values .... RMR 3 6 9 12 18 25 RMR
Relative Likelihood 10% 40% 25% 5% 15% 5%
Averaaes - Jr Cond'n I 1.61 9.51 JOINT ALTERATION (Ja) I INTACT STRENGTH
Joint Infilling Healed Stained Sand Silt Clay-Stiff, Soft Swelling
Classification Value 0.75 1 2 3 4 8 12
Relative Likelihood 15% 40% 30% 15% 0% 0% 0%
Intact Strength UCS >200MPa 100-200 50-100 25-50 10-25 <10MPa
Classification Value 15 12 7 4 2 1
Relative Likelihood 15.0% 55.0% 20.0% 5.0% 5.0% 0.0% Averages - Ja, UCS II 1.61 10.61
OTHER CRITERIA : Rock Material Propertie Relative Densrtv 2.70 Stress State
Groundwater Minor SeepaQe Drv Hiahl Adverse Normal Low 4.00 7.00 10.00· <RMRI - - -
Classification Values 0.66 0.75 1.00 <O> I 2.50 1.00 5.00
Relative Likelihood 0% 10% 90% I 0% 100% 0%
I MEAN
I RANGE I CLASSIFICATION Exoocted Value f -1 1 Std .Deviation f + 1 1
VALUES RM~~ 9.31
I 2.97
29.;: I rsoo Iterations) 63 52
STABILITY ASSESSMENT Minimum Maximum Most Ukel
Crown Pillar Span (m) Geometrical Factors Crown Thickness (m)
Crown Strike Length (m) OrebodviStope Dip =
Crrtical Soan Sc from Q• 10.67 m. & from RMR -PROBABILITY @RISK Simulation
OF INSTABILITY Latin t:lYPElrcube Method using Q-VALUES 14.8% & RMR-VALUES 20.8%
13.5 17.0 14.5 15.5 23.0 . 18.5 45.0 I Span Ratio = 70.0 Demees I 9.971 Scaled Cs span'
Notes: 1. Distributions probabilistically calculated using LOTUS 123 wrth @RISK.
0.32
5.27
2. Methodology- Bartonetal.,1974, Blemawski,1976,1989,Carter,1989,1992
I 0
~I 0.
0
0
II 0
-~~1 0
0 10"1. 20"1'. 40% eo% ""''""'
:~~ ,_ I
:_JR. II•-- I 0.~ 2 • " 12 15 20
0.5 I 1,5 2 3 4
0
0. ~ 0
0
0
--1 0. I ' 20
., . ., teo2!50MPa
FAILURE PROBABILITY
~1 J\ l 11J 30 54 03 l!i!l e:5 103
0
~
I' < 0
[\~
Fig. 7 Example of crown-pillar stability appraisal with @RISK spreadsheet showing input distributions for Q and RMR classifications and output probabilities. Distributions calculated probabilistically using Lotus 1-2-3 with @RISK add-in module. Methodology from Barton and coworkers,ll Bieniawski, 12•13 and CarterlO,Z7
is comparable to the estimate of 20% obtained with the simple graphical plotting approach illustrated in Fig. 6.
Accuracy of assessment Although the application of probabilistic approaches aids in determining the risk of collapse for a particular crown pillar, it is often not clear how much of the assessed risk relates purely to uncertainty in the characterization of the rock conditions. This 'ignorance factor' itself comprises two components: limitations in the understanding of the rock conditions and errors and uncertainties in the definition of the parameters. It is illustrative, therefore, to examine critically the approach that is used to define the parameters.
For the @RISK analyses shown in Fig. 7 the Latin hypercube sampling method has been used in preference to the Monte Carlo approach as it was found to be capable of more rapid computational convergence for similar statistical accuracy. During development of the @RISK spreadsheet variations in the number of iterations were tried, ranging from about 50 steps to more than 2000. The results from the runs that were performed with both Monte Carlo and Latin hypercube methods confirmed Pine's observation that the output generated by the two techniques is not significantly different provided that an adequate number of iterations is undertaken;35 in the case considered here more than about 300 iterations were typically found to be sufficient.
A50
On the presumption that representative mean, ft, and variance, 0 2, values can be developed for the pillar rock mass the @RISK method shown in the lower part of Fig. 7 or the two-point probability estimate approach of Rosenbleuth37
can be used for ready assessment of the probability of
collapse of a crown pillar. 38 As a starting-point for either type of analysis, it is necessary to determine a mean rock mass rating value, R, that is representative of the range of applicable variation in rock mass quality across the crown pillar, where the mean, R, and the variance, cr2, can be expressed as
R I,R,
---- (11) n
and
a2 'I,(R- R;) 2
(11 a) n-1
where R1 is the ith RMR observation, n is the number of observations and a is the standard deviation
In using the above equations to derive rock-quality parameters the issue of representativeness also needs to be carefully considered. If representative failure probabilities are to be computed, it is important that the assigned variance for R reflect global variation in overall rock mass characteristics in the critical zone of the crown pillar that is being evaluated rather than, for example, reflecting only the variation observed between single samples of limited size, such as core. If equations 11 and 11 a are used to express only the variance that prevails on the small scale (with all the data, for the sake of argument, from core) and no cognizance is taken of more global characteristics, the probability of failure is likely to be overestimated.
In such circumstances where discrete core data are being used to assess overall variance it may be much more appropriate to redefine the global rock mass variance for the critical zone that is being considered but on the scale of the crown:
()~ore (j~ock mass - --
V (12)
where v is a variance-reduction factor that depends on the spatial variability within the rock mass of characteristics that have been determined from individual, discrete core samples. 39 In this situation v would represent a measure of the ratio between the volume of rock required to cause failure and the volume of a single, core-size rock sample.
For most rock masses, where exposure is sufficient to allow some visual assessment of variability in the rock mass, completion of a full Q or RMR classification will usually provide adequate guidance for the identification of representative zones of differing rock mass quality for which rockquality ranges as well as means and standard deviations can be defined. Visual review of histograms of RQD and other salient indices and the basic averaging process that is inherent in the implementation of the classifications then allow the variances to be computed as outlined earlier. Where exposure is limited a more rigorous evaluation can still be undertaken based on the use of individual core-run data and field scan-lines, due care being taken to ensure representativeness. 15A0 However, where such a data set from individual sample points is used as the basis for @RISK-type simulations the value selected for v in equation 12 should lie somewhere between 30 and 100 to generate a distribution that represents as accurately as possible the actual variation in rock quality on a scale commensurate with that on which failure is likely to occur.
Acceptance criteria
Once probabilities of failure have been calculated it becomes possible to assess the degree of hazard that is posed by pillar geometry by referring to published data on acceptable levels of risk. Table 1 has been developed by combining a wide range of published tabulations of comparative significance for various open-cut and mining excavations and grouping all the standard indices that are used to define reliability. If the criteria outlined in this table are accepted as suitable for the evaluation of crown-pillar stability conditions, it can be seen that for closure considerations or other long-term uses probabilities of failure of less than 1.5% are required where long-term performance (i.e. quasi-permanence) is demanded with no need for superficial monitoring.
In probabilistic analysis acceptable probabilities of failure are not infrequently based on some criterion of minimizing risk to human life or on economic comparisons relating to the cost either of implementing appropriate safety measures or of dealing with the clean-up and loss of production consequent on failure. For mine hazard applications it is suggested, on the basis of published studies of open-pit stability in particular, that many of these acceptance criteria can be interrelated.30,4I-44
Although the majority of these criteria have been formulated as guidelines based on experience, some have been examined more rigorously. Pine,35 for example, examined the relationships between factors of safety, F, and safety margins, SM, which, he noted, were lognormally distributed or nearly so. Thus, from experience with geomechanics simulations, he suggested that failure probabilities could be related through a reliability index, ~' criterion of the form outlined by Vanmarke39 and others:
p(F<l.O) = p(SM <0)"' 10-13 (13)
where ~ is a measure of how many standard deviations the mean is away from the zero point, where the factor of safety is unity. A set of reliability index guidelines based on these interrelations has also been listed in Table 1 along with the other main indicators, PF' F and ESR (the parameter suggested by Barton28 for assessing different types of excavation performance requirements).
As is obvious from the table, increasing restrictions have to be placed on public access as the risk of failure rises. Also, the amount of surveillance required to monitor still standing crown pillars increases. These limitations (based mainly on descriptive listings by McCracken and Jones32 and by Cole31 ) are also presented in the right-hand columns of the table, where the assumption is made that at probabilities of failure greater than 50% (analogous to factors of safety of less than 1) the design limit is exceeded and public access should be strictly forbidden. This tabulation of acceptability then forms the basis of the serviceability classes that are listed in the centre of Table 1.
Although the approach taken in assessing risk throughout this discussion has basically considered hazard-related risks only, the question of the perception of risk by the general public should also be considered. Quite different levels of risk may be tolerated in different circumstances. Thus, in some cases the guidelines given in Table 1 may not adequately address the 'conceptual hazard' where the public's perception of a risk far outweighs its actual calculated hazard probability. For instance, it may be considered that a higher level of reliability is desirable for crowns that are close to school buildings, public structures, highways, etc., as the perception of failure and its con-
A51
sequences are greater than perhaps could be tolerated close to a building on the mine site itself. The life of the excavation should also be taken into account, better reliabilities being required for crowns that are to remain beneath infrastructure than would be required in an area where it is proposed ultimately to remove the crown by open-pitting, for example.
In addition, assessment of the hazard not only depends on accurately defining the rock mass properties of the crown and wallrocks but it also is influenced by more practical considerations, such as the original excavation method, rock reinforcement sequencing, stress regime and weathering effects. All these factors must also be considered in arriving at final hazard rankings and some compensation made to take their effects into account. The effect of reinforcement can to some extent be incorporated by modifYing the rock-quality values that are used in the assessment 10 or by taking cognizance of Barton's equivalent-dimension approach, where the actual spans would be further scaled by dividing by an appropriate 'excavation support ratio' (ESR) value, which ranges from 0.8 for very important excavations to values of 3-5 for temporary mine openings (see Table 1). Alternatively, some conservatism may be introduced during crown layout or during the rock mass characterization phase. For instance, it may be appropriate to omit the thickness of the weathered zone when considering acceptable crown dimensions during design, as was done by Milne and co-workers45
in one of the first applications of this scaled-span approach for preliminary dimensioning of mine crown pillars.
Although these examples illustrate the application of the scaled-span concept to crown-pillar dimensioning, it must be stressed that the charts presented here are based on an ultimate limit-state condition-i.e. they are based on an assumed dividing line between stability and failure but take no real account of the time-dependency of rock degradation. Thus, considerable care should be given to assessing whether any parts of the rock mass are susceptible to long-term degradation. This is particularly important when the method is used as a guideline for the layout and final design of longterm excavations.
Cost assessment
In many closure situations two fundamentally different approaches need consideration: required remediation-for those openings to surface, such as shafts, raises and portals, where legislative requirements call for backfilling or capping, for which costs can be rationally estimated on the basis of the regulatory requirement for sealing; and risk-necessitated remediation-for those underground openings whose stability is not certain and which may or may not eventually cave to surface or give rise to surface settlement that would interfere unacceptably with future enjoyment of the surface rights.
For underground openings in the second category closure costs can be estimated in a manner that takes into account the probability of instability as well as considerations related to the viability of various alternative remediation approaches. 46
For instance, for a given stope it may be appropriate to consider several options: fencing the area; reinforcing the crown (for example, with cable bolts); capping the crown with areinforced concrete slab; drilling fill holes and backfilling the stope hydraulically or by gravity methods; blasting down the crown and rockfilling to surface; pneumatically tight-filling the stope to the crown; or even, in special circumstances, backfilling the main section of the stope and then infilling the crown zone with a concrete plug.
Each approach has a different degree of risk, the last having possibly the least risk but the highest cost. With so
A52
many alternatives available, to make a rational choice of the most cost-effective it is beneficial to incorporate some assessment of the discounted cost due to uncertainty and then develop a ranking of the cost, viability and effectiveness of the different options.
In such situations a decision-matrix method can be used to advantage to allow the calculation of likely risk-related costs.47- 50,51 For each of the chosen remediation options, however, associated uncertainties of long-term performance have to be assessed. If, for example, we choose fencing alone as a solution for a particular problem, there will be a certain chance of a cave-in or of some degree of areal subsidence that could extend beyond the fence line. In practice, predicting the likelihood of when and where such a cave-in might occur is difficult, if not impossible. However, it is possible to estimate the value (benefits) of a particular policy on the basis of experience and an assessment of the probability of instability.
In some cases this approach is acceptable; however, where probabilities of failure exceed about 15-20% regulatory acceptance requirements and experience would probably overrule any optimization scheme in that complete 'fix-up' of the hazard zone might be mandated (see Table 1). Accordingly, the full cost of the chosen remedial measure would accrue. Clearly, for situations in which the probability of failure is less the costs of remediation can be scaled appropriately.
Selection of optimum remediation approach For closure costing the optimum remediation scheme will correspond to achieving the greatest benefit for the lowest expected present value of future costs. Theoretically, this occurs when the sum of risk costs and remediation costs is at a minimum. Often, though, additional issues relating to the question of public perception also need to be addressed and costed. However, preparing a risk-cost matrix table for a given situation can be readily accomplished even where this is required. Further, once prepared such tabulations allow rapid assessment of the minimum combined costs for any option, thus allowing a decision to be made on which remediation approach is the most cost-effective. This methodology also has the significant virtue that it weighs higher-probability outcomes more heavily-i.e. if the risk of failure is high, the associated cost will be high, resulting in a decrease in benefits. 52
Example application As a practical example to illustrate the principles involved in developing a risk-cost-benefit decision matrix, let us again consider the eastern stope in Fig. 5. As indicated in Figs. 6 and 7, there is an 18% chance that the crown of the stope is unstable, which could ultimately lead to a significant surface cave-in.* As the cost of remediating this risk is the product of the probability of occurrence and the cost of the ultimate remediation measures necessary to prevent such an occurrence, it becomes feasible to estimate the cost of the risk.
*Theoretically, by Bayesian updating, because the crown has already been standing for more than 30 years, the probability of failure could justifiably be reduced below the 18% value calculated solely from the data on the crown geometry and rock mass quality. This reduction in uncertainty due to improved understanding of the stability state and, hence, the lowered calculated probability of failure would, however, probably be more than offset by other changes in rock mass quality due to weathering and other degradation factors. Thus, for this type of preliminary assessment use of the initial calculated value is considered reasonable.

Because of the hazard posed to the highway it would seem on first examination that extensive remediation would be needed prior to closure of the mining operation. On the basis of the guidelines given in Table 1 it is presumed that permanent cemented backfill would provide the required long-term (almost 1 00%) security but at a cost, let us say, of $1 000 000. A do-nothing option, although not acceptable to the regulatory authorities, could, if followed, ultimately result in a failure, which it is assumed would cost at least $3 000 000 to remediate fully, including repairs to the highway. By contrast, simply fencing the site off right up to the edge of the highway right-of-way would cost only $100 000, but, because of geometric complications, it is presumed that if a failure did occur there would be a 25% chance of the subsidence extending beyond the fence-line and affecting the highway. If this were to occur, remediation costs would still be of the order of $3 000 000, but liabilityrelated costs exceeding $5 000 000 could be incurred.
What is the best option? Should the mine spend money now on a more thorough investigation of the area to quantify the risk of failure more accurately? Or would it be better to just fence it off and live with the risk-after all, the chances are high that simple fencing will succeed indefinitely and that the highway will not be affected. If, however, there was some fundamental weakness in the crown and it did fail-as in fact happened (see Figs. 8 and 9)-the mine would have to write off its investment in fencing as well as paying $3 000 000 to remediate the area plus an additional $5 000 000, say, in liability costs.
Fig. 8 Footwall failure zone exposed after collapse of crown pillar above upper-level stopes
Alternatively, the conservative approach could be taken right from the start; the area could be remediated for $1 000 000 and all risks could be eliminated. The nagging doubt would remain, however, over whether the better part of a million dollars had been spent unnecessarily.
A last option that the mine might look at would be to spend, say, $50 000 on additional investigation, losing another month or two but enabling it, perhaps, to reduce the uncertainty and make a much better decision.
In considering the merits of undertaking further investigation let us presume that the information already available indicates that the overall stability of the crown would be controlled by a weak fault zone or zones, if these were present. Let us assume also that there would be an 85% likelihood that such a fault zone would result in low RQD values if drilled with angled diamond core holes. The type of distribution that might be seen is illustrated in Fig. lO(a). Conversely, if no fault were present, the rock quality would probably be better, as reflected by the histogram in Fig. 10(b). In the latter case let us presume that there would be less than a 10% chance that poor rock (with RQD <25%) would be encountered. Once these data on controlling rock conditions had been acquired sufficient information would be available to assist the mine in making the right decisions.
Two key concepts govern the choice of approach to an analysis of the options open to the mine: decision analysis and Bayesian updating of probabilities.48,51 ,53 The basic concept behind risk-based decision analysis is relatively straightforward: for each decision total up the direct costs of the decision (e.g. add $100 000 for fencing or $1 000 000 for backfill to the probability-weighted (i.e. expected) costs/ benefits of the consequences) and then select the decision with the lowest overall weighted cost. Thus, for this example, if the mine wished to select a course of action without undertaking the additional drilling investigation, the costbenefit effects could be calculated as shown below.
CAVE ZONE
FOOTWALL SLATY GREYWACKES
MAXIMUM HANGINGWALL CAVE LINE
HANGINGWALL VOLCANICS
Fig. 9 Schematic cross-section A-A through crown pillar showing locations of stopes prior to collapse (for location of section see Fig. 5)
A53

POSSIBLE DISTRIBUTION OF ROD FOR FAULTED CROWN
(a) (b)
POSSIBLE DISTRIBUTION OF ROD FOR BLOCKY ,COMPETENT CROWN
Fig. 10 Comparative histograms of typical rock-quality characteristics for crown with fault zone (a) present and (b) not present
Option ]-Complete stope backfill
Cost of backfill, $ 1 000 000.00 Cost of risk (estimate),$ 0.00
Total cost, $ 1 000 000.00
Option 2-Fence only
Cost of fencing, $ Cost of risk (estimate),$
Total cost, $
100 000.00 360 000.00
460 000.00
Here the risk-based costs in the fencing option are based on a 4.5% chance that a caving failure will affect the highway (i.e. 18% chance of crown instability x 25% chance of failure extending beyond the fence line= 4.5%). If this did happen, it would be necessary to spend an additional $8 000 000-i.e. the risk cost is calculated as $8 000 000 x 4.5% = $360 000.
Clearly, on the basis of the total weighted costs tabulated above there is, despite the risks, merit in the mine opting merely to fence off the area at an expected long-term weighted cost of $460 000. The questions remain, however, of whether the mine would benefit from undertaking additional field investigation and, furthermore, whether an investigation using state-of-the-art techniques-for example, drilling carefully positioned, angled core holes through the crown-would indicate poor-quality rock.
For this situation we can calculate that there would be an approximately 75:25% chance that the pillar would be composed of rock with RQD values better than 25%-i.e., the probability that the drilling would encounter poor rock would be estimated as: probability of poor rock, PPoor =
A 54
(probability that fault zone is present, so failure likely) x (probability of low RQD if fault zone present) + (probability of no failure because fault zone not present) x (probability of low RQD given no fault zone):
PPoor = (0.18 X 0.85) + ((1- 0.18) X 0.10]
= 0.2350 (14)
By contrast, the probability of not finding poor-quality rock is estimated as
PGood = (1- 0.2350) = 0.7650 (15)
With this knowledge Bayes' theorem can be invoked to calculate updated probabilities offailure. The principle of the theorem is that it expresses the manner in which 'prior' probabilities about a hypothesis are increased or diminished in proportion to the extent to which new information is consistent with the hypothesis. If the core drilling were carried out and it did encounter poor-quality rock (a 24% likelihood-PPoor), then, by Bayes' theorem, the updated probability of crown collapse due to the presence of a fault zone would be 65%:
0.18 X 0.85
0.2350 0.6511 (16)
where the updated probability of failure due to a fault zone= (current probability of failure due to poor rock-e.g. fault zone) x (probability of intersecting poor-quality rock if a fault exists) + (current probability of encountering poor-quality rock). If, however, the core drilling proved that rock competence was high throughout the pillar, the updated proba-

bility of a failure due to a fault would be only about 2%:
0.18 X 0.10
0.7650 0.0235 (17)
where the updated probability of failure due to a fault = (current probability of failure due to poor rock-e.g. a fault zone) x (probability of not intersecting poor-quality rock as no fault zone exists) +(current probability of not intersecting poor-quality rock).
If the mine did decide to undertake the core drilling and it showed that the rock quality was indeed poor (a 24% chance), what would be the most cost-effective decision? Using the updated probability of failure for collapse of the crown pillar, the expected costs for the two options that are being considered would be calculated as follows.
Fencing Fencing costs $100 000 to install and has a (1 -0.6511 = 0.3489) chance of success with a 25% of 65.11% chance that a collapse could break through and affect the highway, thereby incurring additional expenditure of $8 000 000. Thus, the total weighted cost is $100 000 + (0.25 X 0.6511 X $8 000 000) = $1 402 200.
Backfill Backfilling costs $1 000 000 and provides 1 00% security, giving a total weighted cost of $1 000 000.
Obviously, with poor rock conditions proved by the drilling, backfilling becomes the more cost-effective approach.
I
/REVISED Pt = 2%
REVISED PDF AFTER DRILLING
'INITIAL P D F PRIOR TO INVESTIGATION
ROCK QUALITY .......
Fig. 11 Conceptual changes in probability distribution with improved understanding of rock quality as consequence of additional investigation. PDF, probability density function
If, on the other hand, as suggested by the original probability distribution (shown diagrammatically in Figs. 6 and 11), the drilling did not find poor rock within the pillar (a 76.5% likelihood-PGood), the updated decision analysis would suggest the following.
Fencing Cost, $100 000, with (1 - 0.0235 = 98%) chance of success and only 25% of 2.35% chance of incurring additional expenditure of $8 000 000. Thus, total weighted cost= $100 000 + (0.25 x 0.0235 x $8 000 000) = $147 200.
Backfill Cost, $1 000 000; security, 100%; giving total weighted cost of $1 000 000.
Clearly, proof that good rock existed in the crown pillar would considerably reduce the weighted risk-based cost. The mine would therefore be even more justified in opting simply to fence off the area of the hazard.
Is the drilling information worth the expenditure? The previous analysis showed that if the drilling were not carried out, the optimal decision would be to fence the site at an expected cost of $460 000. If drilling is undertaken, the optimal decision depends on the outcome: if the rock quality is poor, the best choice is to backfill; if it is good, a fence is the most sensible option. The overall expected cost if the drilling were to be carried out would be: weighted cost of drilling = (cost of investigation) + (weighted cost of poor ground) + (weighted cost of good ground)-i.e.
$50 000 + (0.2350 X $1 000 000) +
(0.7650 X $147 200) = $397 608
Thus, the drilling program would be a good investment as it would reduce the overall expected cost from $460 000 to $397 608.
Assessment of uncertainties The approach presented above, while straightforward in concept, makes assumptions of representativeness that the parameters truly reflect actual conditions. However, as is evident from the example, a large degree of uncertainty results simply from lack of detailed knowledge of crown conditions. Only by gaining improved information from detailed field investigation is it possible to reduce this type of uncertainty. In such critical situations enough data must be collected that the uncertainty is reduced to that arising from the true variability in rock mass conditions (Fig. 12).
$
j tL C:t "" (,!) ::::> - f-f--U)O w :z ,... >w
1- :z 0... z: - >< ~ LLI LL1 a:: f-.... ;;:; "' :z ::>
at
DATA ACCURACY 10% ..... . Fig. 12 Relationship between uncertainties due to natural
variability and data inadequacies as function of data accuracy and cost of site investigations. 1, Uncertainty due to ignorance and errors and inaccuracies in data; 2, uncertainty due to true variation in rock mass and geometric factors
As can be seen, formal techniques of decision analysis are merely aids to the making of explicit decisions on the basis of a careful analysis of the problem at hand. 51 In principle, all
A55

such decisions are simple: the real difficulties lie in ensuring that the initial database is valid and in developing a full understanding of the ramifications of the decision. Once that understanding is reached and the reliability of the database has been verified the decision may be readily apparent. In fact, the general techniques illustrated here merely formalize in mathematical terms the judgments that go into making any reasonable decision. Bayes' theorem and the principles of decision analysis are the mathematical expressions of common sense and judgment.
Decision analysis can be of great value in reducing apparently very complex decisions to more manageable parts and in providing a more balanced perspective on the advantages and disadvantages of a decision. However, it must be appreciated that it is easy to be misled by a decision analysis that embodies false premises. In considering stopes, like those in the example, that were directly adjacent to a highway one would want to think long and hard before committing expenditure to a fencing-only option unless drilling had been undertaken that had proved good-quality rock in the pillar area. Where decisions affect lives other options always need to be explored. In such cases not only should the cost alternatives be verified but so, too, should the geomechanical factors that form the basis for the decisionmaking. Any of these issues could, if overlooked, invalidate the analysis-with catastrophic consequences, as actually occurred in the case example, where one particularly weak zone controlled the overall behaviour characteristics.
Another complication for effective decision-makingalthough usually of a more minor nature-is inaccuracy in the estimating. Although the associated uncertainties can usually be ignored in deriving overall cost estimates for preliminary decision-making, it should be appreciated that at times wrong decisions can be made as a result of such uncertainties or because of wide error margins in the costings. Typically, for the level of costing required for the type of decision analysis that has been discussed it is rare that there is a need to extend the accuracy beyond a Class C estimate (i.e. ±25% accuracy). Costs can therefore usually be based on previous practice and experience. This issue, however, becomes significant when little cost differential separates the various alternatives. In these cases it is worth undertaking more detailed estimating since costs developed from basecase information (derived from applicable labour and material rates) usually allow the error band of uncertainty to be reduced significantly, as indicated in Table 4.
Table 4 Usual levels of acceptable accuracy for costestimating purposes
Class
A
B
c
Accuracy, 0/o
±2-5
±1D-15
±25-30
Estimate
Final construction tender Design-level engineering Feasibility or pre-feasibility level
Nevertheless, even with these provisos, for crown-pillar work all estimating of costs should be considered very tentative as actual remediation costs can vary dramatically owing to the unforeseen cor- •;cations that can arise when the work is in progress. 23 In .ny cases where it is evident that remediation will be difficult it is wise to consider undertaking detailed contingency costing as well as base-case costing when preparing final decision-matrix tabulations.
A 56
Conclusions
Establishing the stability and deciding whether remediation is required to ensure the long-term integrity of surface crown pillars over active or abandoned near-surface mine workings can be a complex task. However, the application of riskbased decision-making procedures can assist significantly in the rational costing and selection of remediation alternatives so that a better evaluation can be made of options for closure. Probabilistic analyses using the critical-span analysis model with Bayesian updating of critical parameters constitutes a key initial component in the overall decisionmaking process. The method also provides a ready means for assessing the influence on stability of variable rock mass properties and, hence, allows remediation costs to be optimized more effectively.
It should be appreciated, however, that the analyses presented here do not attempt to address the issue of time explicitly. Many crown pillars that are initially stable will fail eventually as mechanisms of weathering, degradation, creeprupture and progressive failure develop. Little is currently known of the statistical distribution of time-to-failure. This is obviously an area where more data and research are needed. Further, although the suggested approaches can help in quantifYing risk and, hence, can aid in decision-making, it must be stressed that they do not remove natural geological uncertainty, nor are they a substitute for good data that characterize natural variability adequately. To be useful and reliable the techniques must also be used wisely and appropriate investigations should be undertaken to minimize uncertainties due to ignorance. In fact, care must always be taken to ensure that basic information accurately reflects natural variation or all subsequent analysis will be meaningless.
Acknowledgement
Part of the work presented in this paper was funded by CANMET under contract no. 23440-8-9074/01-SQ. Other parts were funded by the Ontario Ministry of Northern Development and Mines or were conducted as part of programmes funded by various mining companies. Specific thanks are due to those organizations and to the more than a dozen mining companies that have supported work in the area of probability-based design for near-surface mine openings by supplying unpublished, often confidential, information to form part of various case-study databases. The authors also wish to acknowledge the particular assistance of Dr. W. J. Roberds and Dr. J. L. Carvalho among many other colleagues at Golder Associates who have contributed directly or indirectly to the formulation of views outlined in this paper.
References 1. Mackasey W. 0. Concepts on dealing with abandoned mine hazards. In Proc. Int. conference on surface crown pillar evaluation for acrive and abandoned metal mines, Timmins, 1989, 135-41. 2. Golder Associates. Report 881-l 739 to CAN MET, Crown pillar srabiliry back-analysis (Canada Centre for Mineral and Energy Technology, 1990), 90 p. Contract no. 23440-8-9074/01-SQ. 3. Betournay M. C. Mitri H. S. and Hassani F. Chimneying disintegration failure mechanisms of hard rock mines. In Proc. 1st Nonh American rock mech. symp. Austin, 1994, 987-96. 4. Carter T. G. er al. Evaluation of stress conditions within surface crown pillars. In Proc. conference on stresses in underground strucrures, Ouawa, 1990, 163-74. 5. Golder Associates Report 802-1571 to CANMET, Predicrion of stable excavation spans for mining at depths below 1000 metres in hard rock CANMET contract no. 17SQ.23440-0-9020, 1981.

6. Potvin Y. Hudyma M. R. and Miller H. D. S. Design guidelines for open stope support. CIM Bull., 82, no. 926, 1989, 53-62. 7. Bawden W. F. Optimization of geomechanical mine design. In Proc. 15th Canadian rock mechanics conference 1988, 73-87. 8. Laubscher D. H. Geomechanics classification of jointed rock masses-mining applications. Trans. Instn Min. Metall. (Sect. A: Min. industry), 86, 1977, Al-8. 9. Laubscher D. H. Design aspects and effectiveness of support systems in different mining conditions. Trans. Instn Min. Merall. (Sect. A: Min. industry), 93, 1984, A70-81. 10. Carter T. G. A new approach to surface crown pillar design. In Proc. 16th Canadian rock mechanics symposium, Sudbury, 1992, 75-83. 11. Barton N. Lien R. and Lunde J. Engineering classification of rock masses for the design of tunnel support. Rock Mechanics, 6, 1974, 189-236. 12. Bieniawski Z. T. Engineering classification of jointed rock masses. Trans. S. Afr. Instn Civ. Engrs, 15, no. 12 1973, 335-44. 13. Bieniawski Z. T. Rock mass classification in rock engineering. In Proc. symp. exploration for rock engineering, Johannesburg, val. 1, 1976, 97-106. 14. Carter T. G. Prediction and uncertainties in geological engineering and rock mass characterization assessments. In Proc. 4th. Italian conf engineering rock mechanics, Torino, 1992, paper 1, 22 p. 15. Deere D. U. Technical description of rock cores for engineering purposes. Rock Mech. Engng Geol., 1, 1963, 16-22. 16. Heuze E. F. Sources of errors in rock mechanics field measurements and related solutions Int. ]. Rock Mech. Min. Sci., 8, no. 41971,297-310. 17. Hatheway A. W. Rock quality designation RQD-a wonderful shortcut. AEG News, 33, no. 4 1990, 28-30. 18. PriestS. D. and Hudson]. A. Discontinuity spacings in rock. Int.]. Rock Mech. Min Sci., 13, May 1976, 135-48. 19. Priest S. D. and Hudson J. A. Estimation of discontinuity spacing and trace length using scanline surveys. Int. J. Rock Mech. Min Sci., 18,1981,183-97. 20. Kendorski F. S. et al. Rock mass classification for block caving mine drift support. In Proc. Int. conf rock mechanics Melbourne, Australia, val. B., 1983, 51-63. 21. Palmstrom A. The volumetric joint count-a useful and simple measure of the degree of rock mass jointing. In Proc. founh congr. Int. Assoc. Engineering Geology, New Delhi, India, val. V., theme 2, 1982, V.221-8. 22. Cole K. W. et al. Removal of actual and apprehended dereliction caused by abandoned limestone mines. In Proc. conf building on marginal and derelict land. (Glasgow: Instn Civil Engineers, 1986), 99-124. 23. Carter T. G. et al. Investigations and remedial measures for reinstatement of highway collapse over old mine workings. In Proc. 2nd Int. conf Construction in areas of abandoned mineworkings, Edinburgh, U.K., 1988, 289-97. 24. Steed C. M. Carter T. G. and Ingraham P. C. Remedial work on abandoned mine hazards. In Proc. CIM 1Oth underground operators conf, Val d'Or, Quebec, 1991, 7 p. 25. Betournay M. C. A design philosophy for surface crown pillars of hard rock mines. CIM Bull., 80, no. 903, 1987,45-61. 26. Betournay M. C. Nantel S. and Lessard D. Summary of twenty-four surface crown pillar case studies. CIM Bull., 81, no. 915,1988,73-7. 27. Carter T. G. Design lessons from evaluation of old crown pillar failures. Reference 1, 177-87. 28. Barton N. Recent experiences with the Q-system of tunnel support design. Reference ·13, 107-17. 29. Franklin]. A. and Palassi M. Maximum span and stand-time of underground excavations. In Proc. int. congr. Innovarive mine design for rhe 21sr century, Kingsron, Onrario, 1993 Bawden W. F. and Archibald]. F. eds (Rotterdam: Balkema, 1993), 443-53. 30. Cole K. W. Building over abandoned shallow mines-a strategy for engineering decisions on treatment. Ground Engineering, 20, no. 4 1987, 14-30. 31. Cole K. W. Building over abandoned shallow mines-Paper 1: considerations of risk and reliability. Ground Engineering, 26, no. 1 1993,34-7. 32. McCracken A. and Jones G. A. Use of probabilistic stability analysis and cautious blast design for urban excavation. In Rock engineering and excavarion in an urban environmenr, proceedings of conference, Hong Kong, February 1986 (London: IMM, 1986), 231-40. 33. Kirsten H. A. D. and Moss A. S. E. Probability applied to slope design-case histories. In Proc. ASCE symp. rock masses and probabiliry of slope failure, Denver, 1985, 106-19.
34. Priest S. D. and Brown E. T. Probabilistic stability analysis of variable rock slopes. Trans. Instn Min. Merall. (Seer. A: Min. indusrry), 92, 1983, Al-12. 35. Pine R. J. Risk analysis design applications in mining. Trans. Insrn Min. Merall. (Seer. A: Min. indusrry), 101, 1992, A149-57. 36. Harr M. E. Reliability based design in civil engineering (New York: McGraw-Hill, 1987). 37. Rosenbleuth E. Point estimates for probability moments. Proc. Nat. Acad. Sci., 72, no. 10 1975, 3812-4. 38. Hoek E. A limit equilibrium analysis of surface crown pillar stability. Reference 1, 3-13. 39. Vanmarke E. H. Probabilistic modelling of soil profiles and reliability of earth slopes.]. Geotech. Engng Div. ASCE, 103, GT11, 1977, 1227-65. 40. Terzaghi R. D. Sources of error in joint surveys. Geotechnique, 15, 1965, 287-304. 41. Moss A. S. E. and Steffen 0. K. H. Geotechnology and probability in open-pit mine planning. In Proc. llrh Commonwealth mining and metallurgical congress, Hong Kong (London: Institution of Mining and Metallurgy, 1978), 543-53. 42. McMahon B. K. Probability of failure and expected volume of failure in high slopes. In Proc. 2nd Ausrralia-New Zealand Inst. of Engineers conf on geomechanics, Brisbane, Ausrralia, val. 2, 1975, 308-17. 43. McCracken A. and Stacey T. R. Geotechnical risk assessment for large-diameter raise-bored shafts. Trans. Instn Min. Metall. (Sect. A: Min. indusrry), 98, 1989, Al45-50. 44. Piteau D. R. and Martin D. C. Slope stability analysis design based on probability techniques at Cassiar mine. CIM Bull., March 1977, 139-50. 45. Milne D. M. Potvin Y and Madill T. Crown pillar design for Geco mine. In Proc. 93rd CIM annual meeting, Vancouver, 1991, paper 139, 17 p. 46. Carter T. G. and Steed C. M. Application of remedial measures for stabilization of abandoned mine workings. In Proc. A. E. G. symp. mine subsidence prediction and control, Pittsburgh, U.S.A., 1990, 207-21. 4 7. Siddall ]. N. Analytical decision-making in engineering design (Englewood, Calif.: Prentice-Hall, Inc., 1972). 48. Freeze R. A. et al. Hydrogeological decision analysis: 1. A framework. Groundwarer, 28, no. 5 1990, 738-66. 49. Ang A. H.-S. and Tang W. H. Probabiliry concepts in engineering planning and design. Volume II: Decision, risk and reliability (New York: Wiley, 1984). 50. Benjamin J. R. and Cornell C. A. Probability, sratisrics and decision for civil engineers (New York: McGraw-Hill, 1970). 51. Roberds W. Methods for developing defensible subjective probability assessments. Proc. Transporrarion Research Board (Washington D.C.: National Research Council, 1990), 183-90. 52. Brummer R. K. er al. Risk-cost-benefit analysis applied to the design of support in burst-prone mines. Reference 29,969-80. 53. Roberds W. Miller I. and Caldwell D. Evaluation of alternative MGDS development strategies, high level radioactive waste management. In Proc. second annual int. conf, Las Vegas, val. 2, 1991, 1143-9.
Authors
T. G. Carter Member graduated in geology from the University College of Swansea, Wales, in 1970. He obtained a SM in civil engineering from the Massachusetts Institute of Technology, U.S.A., in 1972 and a Ph.D. in engineering geology from the University of Surrey, England, in 1983. He has spent the last ten years studying surface crown-pillar problems and has published several papers and reports on the topic. He is currently a principal with Golder Associates in Toronto, Canada, with broad responsibilities in the field of mining rock mechanics.
Address: Golder Associates, Ltd., 2180 Meadowvale Boulevard, Mississauga, Ontario, Canada L5N 5S3.
R. I. Miller received the degree of B.A. from the University of British Columbia, Canada, in 1965 and degrees of B.A.Sc. and M.A.Sc. in civil engineering from the same institution in 1967 and 1971, respectively. With an initial background in the computer analysis of structural engineering problems, he has spent most of his career with Golder Associates, where he specializes in computer modelling of geotechnical systems, performance assessment and decision analysis. He is currently a principal with Golder Federal Services Inc. in Washington, D.C., U.S.A.
A 57