CRA Distribution Inquiry Report: Combined Modules - Charles ...
70
ALBERTA UTILITIES COMMISSION Distribution System Inquiry Proceeding ID 24116 REPORT ON COMBINED MODULE 2 AND 3 TOPICS CHARLES RIVER ASSOCIATES Mr. David DesLauriers, Vice President Mr. Jordan Kwok, Associate Principal March 13, 2020 Prepared on Behalf of: CONSUMERS’ COALITION OF ALBERTA
-
Upload
khangminh22 -
Category
Documents
-
view
0 -
download
0
Transcript of CRA Distribution Inquiry Report: Combined Modules - Charles ...
ALBERTA UTILITIES COMMISSION
Distribution System Inquiry
Proceeding ID 24116
REPORT ON COMBINED MODULE 2 AND 3 TOPICS
CHARLES RIVER ASSOCIATES
Mr. David DesLauriers, Vice President
Mr. Jordan Kwok, Associate Principal
March 13, 2020
Prepared on Behalf of:
CONSUMERS’ COALITION OF ALBERTA
AUC Distribution System Inquiry: Combined Modules Charles River Associates
Page i
Acknowledgement
This evidence was produced by the undersigned individuals, who attest that they will provide
independent, unbiased, professional opinions that are fair, objective, and non-partisan.
_____________________________________
David DesLauriers
_____________________________________
Jordan Kwok
March 13, 2020
Disclaimer
The conclusions set forth herein are based on independent research and publicly available
material. The views expressed herein are the views and opinions of the authors and do not
reflect or represent the views of Charles River Associates or any of the organizations with
which the authors are affiliated. Any opinion expressed herein shall not amount to any form of
guarantee that the authors or Charles River Associates has determined or predicted future
events or circumstances and no such reliance may be inferred or implied. The authors and
Charles River Associates accept no duty of care or liability of any kind whatsoever to any
party, and no responsibility for damages, if any, suffered by any party as a result of decisions
made, or not made, or actions taken, or not taken, based on this paper. Detailed information
about Charles River Associates, a trademark of CRA International, Inc., is available at
www.crai.com.
Copyright 2020 Charles River Associates

AUC Distribution System Inquiry: Combined Modules Charles River Associates
Page ii
Table of Contents
1. Report Objective and Structure .................................................................................................. 1
1.1. Our Mandate ..................................................................................................................... 1
1.2. Description of Approach and Report Structure ................................................................. 1
1.3. Technologies and Customer Configurations to be Considered ........................................ 3
2. Direct Answers to AUC Questions ............................................................................................. 4
2.1. Question 1 ......................................................................................................................... 4
2.2. Question 2 ......................................................................................................................... 4
2.3. Question 3 ......................................................................................................................... 6
2.4. Question 4 ......................................................................................................................... 7
2.5. Question 5 ......................................................................................................................... 8
3. Regulatory Framework ................................................................................................................ 9
3.1. Statement of Principles ..................................................................................................... 9
3.2. Summary of Current Regulatory Framework in Alberta for DFOs .................................. 12
3.3. Key Observations Regarding Current Framework in Context of Stated Principles ........ 14
3.4. Case Study: Performance Based Ratemaking in the UK ............................................... 16
3.5. Case Study: Australian Microgrid Initiatives ................................................................... 20
3.6. Case Study: Hawaiian Microgrid Initiatives ..................................................................... 23
3.7. Case Study Observations and Recommendations ......................................................... 26
3.8. Network Planning Considerations for Future DFO ......................................................... 28
3.8.1. Non-Wires Alternatives in Network Development ............................................ 28
3.8.2. Stakeholder Participation in Planning Processes ............................................ 30
4. Rate Design ................................................................................................................................ 32
4.1. Tariff Rate Design Principles .......................................................................................... 33
4.2. General Considerations in Evolving Distribution Systems .............................................. 36
4.2.1. Reconsidering Rates in Light of DERs ............................................................ 36
4.2.2. Managing Impacts of Rate Reform .................................................................. 39
4.2.3. Metering and Billing Approaches for Distributed Generation .......................... 40
4.2.4. Overlaying Policy Decisions on Principled Rates ............................................ 43
4.3. Applicability to Current Structures .................................................................................. 44
4.3.1. DCG Rates – Small Micro-generation ............................................................. 44
4.3.2. DCG Rates – Large Micro-generation ............................................................. 48
4.3.3. Other DCG Connections .................................................................................. 49
AUC Distribution System Inquiry: Combined Modules Charles River Associates
Page iii
4.3.4. Demand Side Management ............................................................................. 52
4.3.5. Storage Rates .................................................................................................. 53
4.3.6. EV Rates .......................................................................................................... 54
4.4. Locational Pricing Considerations .................................................................................. 57
4.5. Conclusions and Recommendations .............................................................................. 59
Appendix A: DERs and Wholesale Markets – ERCOT Case Study .............................................. 61
ERCOT Background .................................................................................................................... 61
Market Participation Tradeoffs ..................................................................................................... 61
DERs in the ERCOT Market ........................................................................................................ 62
Distributed Generation ................................................................................................... 62
Energy Storage ............................................................................................................... 63
Demand Response ......................................................................................................... 65
Energy Efficiency ............................................................................................................ 65
Key Takeaways from ERCOT ...................................................................................................... 65
AUC Distribution System Inquiry: Combined Modules Charles River Associates
Page 1
1. Report Objective and Structure
1.1. Our Mandate
We have been asked by the Consumers’ Coalition of Alberta (“CCA”) to provide expert advice
for the Alberta Utilities Commission’s (“AUC”) Electric Distribution System Inquiry (“Inquiry”),
initiated December 6, 2018, under AUC proceeding ID 24116. As stated by the AUC, the
inquiry is directed at mapping “key issues related to the future of the electric distribution grid,
to aid in developing the necessary regulatory framework to accommodate the evolution of the
electric system.”1 This Inquiry was originally slated to be split into three modules to address
(1) new technologies on the distribution system; (2) implications on distribution utility services,
regulatory structures, and utility business models of these new technologies; and (3)
regulatory and rate responses that may be necessary to respond to new technologies.
Module One is largely complete and Modules Two and Three are to be combined into a
“Combined Module.”2 Our report addresses the topics raised by the AUC to be considered in
this Combined Module. We focus our input where we have experience and expertise that we
believe supports the advancement of the substantive inquiry that the AUC has undertaken.
1.2. Description of Approach and Report Structure
In framing the Combined Module, the AUC presented five questions in its outline for written
submissions by stakeholders in the Inquiry. We have generally structured our assessment, as
described in this report, to respond to these questions. In addition, we have expanded our
response to include discussion on policy aspects that support our responses. We also include
relevant case studies to inform on regulatory and policy activities in other jurisdictions facing
similar evolving industry issues.
The contents of the report are therefore structured as follows:
Section 2: High-level responses to the AUC’s five questions in its outline for written
submissions in the Combined Module.
Section 3: Discussion of overarching issues of regulatory structure, with a finding on the
ongoing appropriateness of the “I – X” construct as the expectations for the distribution
system and interconnected technologies evolve. Several related case studies are
presented.
Section 4: Description and assessment of issues of tariff rate design for distribution
utility service. In particular, we will identify relevant rate design principles and apply them
in the context of various connection schemes, like those presented in the AUC’s
Preliminary Information Requests.3
1 AUC Bulletin 2018-17, December 6, 2018
2 24116-X0106, “AUC Revised Process Schedule”, December 11, 2019
3 24116-X0470, “AUC Preliminary Information Requests to All Registered Parties,” November 29, 2019

AUC Distribution System Inquiry: Combined Modules Charles River Associates
Page 2
Appendix A: A case study of the Texas energy market (“ERCOT”). Via this case study,
we identify considerations for proliferating distribution-situated generation technologies
and increased demand side participation in an energy-only wholesale market, as is in
place in Alberta.
The issues we address are multi-faceted and complex and although no single simple solution
may present, we believe a focused, principle-based approach provides a useful framework in
which to evaluate the issues that the AUC is considering in these modules. The fundamentals
that we apply to our analysis and inform our findings and recommendations are as follows:
Principle-driven approach
In Sections 3 and 4, we will present a set of principles to be applied in assessing regulatory
structures and rate design. In brief, these principles include, in no particular order:
Rates support economically efficient outcomes, send correct price signals, and attempt
to simulate results of competitive markets
Rates reflect cost causation
Rates minimize unintended consequences to the extent possible
Rates support the utility’s ability to attract capital
Rates encourage managerial efficiency
Regulatory frameworks should balance objectives, including affordability to customers,
understandability of rates, clarity from misinterpretation, reasonable level of granularity,
and avoidance of undue discrimination.4
Importantly, assessment of regulatory elements by a principle-driven approach is not
outcome-driven. For example, the goal is not necessarily to minimize cost to consumers, nor
to maximize investment or returns to utilities. Rather, the consistent application of principles
should result in long term outcomes that are consistent with general regulatory objectives,
including the provision of reliable service at reasonable cost. Our findings and
recommendations will reflect this understanding.
Technology agnostic
Our opinion is that, from an initial position, distribution regulation and rate design should be
technology agnostic, and not give undue advantage to any particular technology. This is
consistent with a principle-driven approach, where regulators rely upon open markets to
develop technology choices, while adopting appropriate regulatory frameworks with rates
designed to incent the development of economically beneficial technology. We do not
believe that any structure that assigns differing values to alternative technologies is
warranted.
4 These principles are consistent with those articulated by James C Bonbright, “Principles of Public Utility Rates,” New
York, Columbia University Press, first edition, 1961
AUC Distribution System Inquiry: Combined Modules Charles River Associates
Page 3
Policy compatible
We recognize that policy initiatives may seek to support certain technologies or otherwise
drive distribution system outcomes (e.g., to achieve environmental policy goals, or to provide
rate relief to lower income ratepayers or ratepayers who have less ability to adapt to, or
adopt, new technologies). Such policies may be compatible with a technology-agnostic and
principle-based approach; however, they should be applied deliberately and with an
understanding of the outcomes resulting from any implementation of incentives.
Focus on the distribution system and distribution regulation
Given the nature of the AUC’s Inquiry and our mandate from the CCA, we limit our
assessment to issues that are directly related to the distribution system and distribution
regulation. Although the expansion of new technologies deployed at the distribution system
level can affect transmission regulation or the Alberta wholesale energy market, we purposely
contain this report to distribution utility issues. Where principles may apply across distribution
and transmission regulation and rate structures, we will note areas of overlap. Section 5 also
comments on the relationship between wholesale market structures and technologies
situated at the distribution system level.
1.3. Technologies and Customer Configurations to be Considered
As identified by the AUC in initiating this inquiry, a broad range of technological changes and
deployment of new technologies may necessitate change to the future distribution network.
These can include changes to the underlying regulatory framework and rate design. For our
purposes, we treat those technologies identified by Dr. Richard Tabors in his Module One
testimony in support of the CCA.5 These emerging, distribution-situated technologies (we will
refer to these collectively as “DERs”) are:
Distributed generation, including solar photovoltaic (“PV”) and combined heat and power
(“CHP”) facilities
Distributed battery storage
Electric vehicles (“EV”) and EV charging stations
Microgrids
Demand-side management (“DSM”) measures, including demand response (“DR”) and
energy efficiency (“EE”)
Where appropriate, we will distinguish between deployment of these technologies in front of,
or behind, the customer meter. We will also identify where we think the size of a distributed
resource is, or is not, relevant. Where appropriate, we will rely on the (approximately) six
customer configuration examples provided in the AUC’s preliminary information requests.
Finally, when we refer to distribution connected generation (“DCG”), we generally are
referring to both generators and storage resources. Where there is discussion specific to
storage, we will identify that the distinction is being made.
5 24116-X0167, “CCA Evidence of Dr. Richard Tabors,” July 17, 2019

AUC Distribution System Inquiry: Combined Modules Charles River Associates
Page 4
2. Direct Answers to AUC Questions
This section provides high-level answers to the AUC’s five questions in its outline for written
submissions in the Combined Module. Where relevant, we reference more fulsome
discussion and analysis provided in later sections of the report.
2.1. Question 1
During the technical conference for Module One, several parties recommended that the
regulatory framework governing the Alberta Interconnected Electric System (“AIES”)
should be technology agnostic and economically efficient. Other principles that also
may be applied include customer choice, fairness, efficiency and open competition. In
your view, what principles should be applied to implement the regulatory framework
necessary to accommodate the economic and technological forces that are
transforming the market structure governing energy distribution by public utilities?
We suggest the following principles for the regulatory framework governing the AIES, and
particularly for distribution networks:
Rates support economically efficient outcomes, send correct price signals, and attempt
to simulate results of competitive markets
Rates reflect cost causation
Rates support the utility’s ability to attract capital
Rates encourage managerial efficiency
Rates minimize unintended consequences to the extent possible
Regulatory frameworks should balance objectives, including affordability to customers,
understandability of rates, clarity from misinterpretation, reasonable level of granularity,
and avoidance of undue discrimination.
These principles are generally consistent with those laid out by James Bonbright in 1961 and
have been employed broadly over the time since then. If applied thoughtfully, these same
principles should remain relevant and appropriate as the landscape for distribution utilities
changes in light of the various economic and technical forces referred to by the AUC. The
principles are described in more detail later in this report, in section 3.1 and section 4.1.
As we note in the introduction, we support a technology agnostic approach as a starting point
for a regulatory framework. However, adhering completely to a technology agnostic approach
is fundamentally a policy choice. To the extent that there are policies in place that are
designed to support certain preferred technologies, we urge regulators to carefully evaluate
potential outcomes to avoid unintended consequences such as significant costs shifts among
customers or unwarranted cost increases to the system (i.e., economically inefficient
outcomes).
2.2. Question 2
When considering the various load and generation connection schemes summarized
in the preliminary IRs, and potentially others, how does the current regulatory
AUC Distribution System Inquiry: Combined Modules Charles River Associates
Page 5
framework governing those connection schemes apply, or not apply, to the principles
put forward in part (i)? What changes might be recommended?
We suggest that several key elements comprise a regulatory framework, particularly as they
relate to rate design, to achieve adherence to the principles we advance. Our
recommendations apply across the various customer configuration and connection schemes
detailed in the AUC’s preliminary IRs. These elements include:
Implementation of three-part rates, including for residential customers deploying DCG
and/or EVs, with rates that include fixed, demand, and variable components. This is of
particular concern for DCG customers (including those with storage assets) and may
also be an approach to incentivizing efficient behavior for EV customers.
To the extent that certain customer classes already face three-part rates – or similar
rates with reduced emphasis on variable charges – rate structures will likely still need to
be revisited to balance the relative size of fixed, demand, and variable charges to reflect
costs and send effective signals to lead to efficient investment and operational decisions.
Exceptions from three-part may generally be extended to non-adopters of DERs, as
those customers are less likely to trigger the cost-shifting concerns associated with DER
deployment. There may also be considerations that warrant grandfathering or
transitional rate structures for certain customers who would otherwise be subject to a
three-part rate.
Additional attention should be paid to the accuracy of consumer contribution charges for
new DCGs to support efficient decisions at the stage of initial deployment of capital.
There is room for improvement in the transparency and understandability of rate
structures as they apply to different customer classes with different DER and metering
configurations. This is particularly true should DFOs in Alberta develop new rate classes
for micro-generation customers, EV customers, etc.
These findings are described in more detail in section 4.3. If applied across customer types
and configurations, we expect that the resulting customer rates would be consistent with
stated principles and lead to economically efficient outcomes. We also offer the following
configuration-specific observations:
Treatment of distribution network charges for DCGs with STS contracts should be
revisited. Such DCG customers should no longer contribute to reduction in DTS charges
for the distributor and DTS credits should no longer be applicable. This approach
ensures a level playing field between generators, thus fulfilling objectives around
technology agnosticism and avoidance of undue discrimination, while also eliminating
concerns over billing determinant erosion and cost shifting.
Current rules around the recovery of the small micro-generation sell-rate should be
reformed. As we understand it, there is currently no regulatory review of these rates and
the entities that agree to the price bear no risk for that price. The costs incurred are
ultimately borne by customers and the potential exists for significant economic efficiency
losses to occur by offering above-market rates with no countervailing benefit to the
system.
If EVs become more common in Alberta, there are a range of experiences from other
jurisdictions that may inform Alberta’s path forward. EV-specific tariffs may work to
AUC Distribution System Inquiry: Combined Modules Charles River Associates
Page 6
constrain the impact of EVs on total system requirements. There are also available
approaches to limit the rate shock of EV tariff implementation and to educate consumers
about EV tariff adoption.
2.3. Question 3
To what extent does the current regulatory treatment for micro-generation,
distribution-connected generation, industrial systems designations, energy storage
resources, and any other customers or market participants apply the principle of
technology agnosticism? Should this agnosticism be applied not only to the type of
technologies used within those different regulatory constructs, but also to the fuel
source, connection configuration, generator size, etc.? And how should this
agnosticism extend between those regulatory constructs? In other words, should it
matter what type of customer is connecting to the generating unit, what the size of the
generating unit is, and what the generation will be used for, so long as the generator
and customer adhere to certain technical limitations of the grid and pay the
appropriate tariffs?
As stated, we suggest a technologically agnostic approach to regulatory design for the
distribution system, at least in establishing a foundation for the regulatory framework and rate
design. We recognize that there may be a need, in some instances, to deviate from a strictly
technology agnostic approach to achieve some specific outcomes. However, these policies
should be applied deliberately and with an understanding of how incentives are being shifted
and overall outcomes may change.
Perfectly equivalent regulatory treatment across all customer types and configurations may
not be feasible or desirable. This is particularly acute across customers and/or DERs of
significantly different sizes. For example, the cost of requiring more sophisticated metering
equipment may be justified by the potential benefits (and costs imposed) for larger loads. In
turn, this may allow increased requirements for such measures from larger customers and/or
DERs. Larger entities also have a proportionally larger impact on market efficiencies and
system cost and the variance in treatment may be justified.
Based on our review, the overall regulatory framework appears technology agnostic and
provides Alberta DFOs the opportunity to exercise managerial discretion to make investment
decisions to provide the level and types of services they perceive customers want (within
prevailing regulatory and legal constraints). However, there are several ways that the current
regulatory and rate structures implicitly preference certain technologies. First, to the extent
rate design outcomes rely on variable rates, or do not reflect cost causation in the split
between variable and demand rates, they could effectively overstate the value of DERs,
particularly in energy produced or consumption avoided. By overstating this value, rates
inherently promote smaller resources and technologies that are scalable to deployment as
DCGs. Second, and relatedly, the particular treatment of large DCGs and associated DFO
credits inappropriately favors large DCG generation over transmission connected generation
based on distinctions over connection and metering configuration, which we view as
insufficient to justify this result.
AUC Distribution System Inquiry: Combined Modules Charles River Associates
Page 7
2.4. Question 4
If, in response to the questions posed in parts (ii) and (iii) above, changes to the
existing regulatory framework have been recommended, what would need to change
and why? For example, the location and configuration of the metering? Access to
certain information and data? Distribution and/or transmission network planning? Who
pays for the cost of connecting the site’s generating unit and how it is determined?
The types of tariffs applied to the site for load and generation, and their potential
design? The compensation for electricity supplied to the grid? Who has control over
dispatch and settlement?
Our focus in this report generally approaches the questions posed from two directions: (1)
from the perspective of the overall regulatory framework and the incentives observed by
utilities; and (2) from the perspective of rate design and the signals observed by consumers
and other DER entities. Regarding the overall regulatory framework, we recommend shifts in
the regulatory approach that better incent innovation, while ensuring utilities make the
appropriate level of investments at the right cost to provide a reasonable balance and
advancement from today’s framework. Changes should also respond to shifts in customer
needs for their utility service. Specific framework modifications could include:
A strict set of prudence criteria with cost benefit analysis to be applied for investments in
emerging technologies;
An incentive metric in performance-based regulation (“PBR”) that rewards for innovation
but with a strict tie to cost-benefit and prudence;
A PBR metric that evaluates how well utilities understand evolving customer needs;
Continued imposition of I-X operating efficiency goals;
A set of penalties and disincentives for uneconomic or stranded investment, especially
with regards to new and emerging technologies. However, we recognize that utilities are
well positioned to assume and manage risk.
Related to rate design, we have described many of our suggestions in response to (ii) and (iii)
above. Our key recommendations revolve around reforms to rate design, as well as customer
contribution rules for new DCGs. Thus, changes would be required to tariff design, how tariffs
are applied to load and generation (including supply to grid via generation or storage), and
who pays for the costs of new site connections. In some instances, implementation of three-
part distribution rates will require deployment of advanced metering capabilities, though we
have not recommended any changes that would necessarily require shifts in metering
configuration.
We also note that we have not reviewed Alberta’s regulatory framework across all of the
dimensions listed above. For example, we have not addressed, in detail, issues of information
and data access, distribution and transmission planning, or dispatch and settlement in the
wholesale market. (On the latter, we offer a case study on the participation of DERs in the
ERCOT market.) We expect other commenters in this inquiry will be better positioned to
expound on these issues.
AUC Distribution System Inquiry: Combined Modules Charles River Associates
Page 8
2.5. Question 5
Given your responses to part (iv) above, what would be the effect on other entities that
currently operate in, or benefit from, the AIES? What are the opportunities and
challenges for distribution facility owners to evolve their business models and/or value
propositions?
For utilities, our recommended changes to regulatory frameworks and the I-X regulation
would allow opportunities for innovation, while ensuring a balanced approach that protects
against unwarranted consumer costs. Reforms would also allow utilities to respond to
changing customer needs and aspirations, which may extend beyond the goal of lower rates,
alone. This may lead to, among other things, opportunities to expand utility offerings and
increase rate base. Improved rate design for DERs should also limit the ability for DER
customers to bypass rates, which improves opportunities for cost recovery, reduces billing
unit erosion, avoids cost shifting, and prevents the potential utility “death spiral.”
For customers, we would expect rate reforms to limit undue cost shifts and send better
signals on both operational and investment time scales. In turn, this should lead to improved
static and dynamic efficiency, in which long term costs should be minimized relative to the
services demanded. Furthermore, utility costs should be allocated in accordance with cost
causation, along with balancing other important non-cost rate design factors, while keeping
accommodations for customer populations that could be negatively affected by both rate
restructuring and rate bypass by larger ratepayers. As touched on above, adjustments to the
regulatory framework for DFOs have the potential to better align utility service offerings with
customer preferences.
For generators, the changes to rate structure and balance across billing elements, in addition
to reforms around customer contribution and large DCG credits, should level the competitive
landscape across generation types, sizes, and configurations. Micro-generators should see
their value proposition more accurately reflect cost causation, and overstatement of DCG
energy value should be reduced. Additionally, large DCG would no longer have an inherent
advantage solely on the basis of being connected at the distribution level rather than the
transmission level.
AUC Distribution System Inquiry: Combined Modules Charles River Associates
Page 9
3. Regulatory Framework
This section outlines the key principles that we believe should be considered in utility
regulatory frameworks and provides observations as to the extent to which the current
regulatory framework in Alberta reflects these principles. This section also provides case
studies that explore how regulatory frameworks in the United Kingdom, Australia, and Hawaii
have addressed similar issues of emerging technology adoption while balancing consumer
risk and other important rate and regulatory factors. This section concludes with our
observations as to potential refinements to the current Alberta regulatory framework that may
help it continue to address new challenges presented by changing customer needs and
preferences and emerging technologies.
3.1. Statement of Principles
A monopoly (single-provider) market is suited for public utility electric transmission and
distribution (“T&D”) services due to the characteristics of these public utility services and
investments. T&D assets, such as substations, transformers, poles and other facilities, are
usually long-lived and display a high ratio of unavoidable fixed costs to variable costs. Utility
regulators typically rate regulate public utilities within this market structure to avoid the
negative societal consequences of duplicative investments to service a public good or
service. Because public utilities tend to deliver significant economies of scale that provide a
cost advantage over the full spectrum of T&D services, including fixed costs and variable
costs for respective capacity and energy needs, this single-provider structure continues to
provide significant consumer and societal benefits. Conversely, a market structure that
deviates from a single-provider construct for T&D services would most likely result in higher
overall costs to consumers since economics of scale loss and duplicative investments would
be difficult to avoid. A primary role of the regulatory framework therefore is to recognize a
monopoly’s societal benefits of non-duplicity and economies of scale, while ensuring efficient
and reasonable consumer price outcomes.
To recognize the benefits of a single-provider market, while protecting consumers from
monopolistic pricing, regulators for T&D services administratively set the price. What emerges
from this construct is what is often referred to as the “regulatory compact.” This compact
represents the understanding that utilities, upon acquisition of an exclusive franchise, must
also accept economic price regulation. The utilities also understand that linked with the
exclusive franchise is an obligation to serve and that obligation carries certain performance
expectations and standards. Regulatory frameworks should also encourage innovation and
efficient managerial performance of the utility. The goal of the regulatory framework should be
– to the extent possible – to encourage price outcomes that are consistently aligned with
expected prices in a competitive market. However, it is impossible to achieve a regulated
price outcome for a single-provider utility service that matches exactly to outcomes in open
competition.
Regulatory frameworks for single-provider markets typically rely on cost based (cost of
service) standards for rates and/or ones that incorporate a performance metric – PBR. The
performance metrics can vary, but typically include cost savings and reliability targets. In
some cases, mechanisms allow for utilities to retain some savings.
We emphasize that PBR or cost-based frameworks are not always perfect substitutes for
competitive prices, as modelling any result of a truly competitive market outside of that
AUC Distribution System Inquiry: Combined Modules Charles River Associates
Page 10
construct is not possible. PBR development requires important compromises amid competing
goals. We have established that competitive market structures are not well suited for T&D
provision. However, open market forces lead to economically efficient outcomes and should
be encouraged, when practical.
In the following paragraphs, we establish six principles for an ideal regulatory framework
which, again, are in line with those espoused by James C. Bonbright in “Principles of Public
Utility Rates” (1961). These principles are presented in no particular order, as each forms part
of the whole. An ideal regulatory framework should:
Set utility rates to provide sufficient ability for utility to “attract capital”
Utilities are entitled to a reasonable opportunity, over a set timeframe (e.g., the life of the
investment), to recover their full embedded costs, including a fair return on capital, via rates.
Utilities that recover their prudently incurred embedded costs plus a return are able to
maintain creditworthiness and, in turn, attract capital sources at reasonable costs.
Consumers reap the benefits of lower capital costs in rates. These principles are well
established through US and Canadian case law.6 The fair rate of return earned in rates “may
be regarded as a substitute, though not a close substitute, for the tendency of prices and
costs to come into accord under forces of market competition.”7 This ability to attract capital
also provides utilities with the economic incentive to invest in goods and services that allow
them to carry out their obligation to serve and provide the types and quantities of services
requested by consumers. However, capital attraction, alone, does not necessarily incent the
utility to innovate or provide safe and reliable utility service at the lowest or reasonable cost.
Set utility rates to provide “economically efficient” outcomes
Economically efficient utility rates are ones that discourage wasteful investment and
encourage efficient consumption of utility services. Rates set to provide these goals help to
diminish the risk of excess utility investment relative to consumer demands (leading to
stranded costs) and guide investment in long term assets up to where consumers’ demand is
met (with sufficient capacity reserves). For instance, rates that are set below marginal costs
will only encourage wasteful investment by encouraging consumers to use services that are
priced below their cost-based value. This, in turn, creates losses at the utility level that must
be recovered from all consumers. Although marginal-based costs are the most efficient way
to incentivize economically efficient buying behavior, setting rates entirely on a marginal cost
basis will not provide a sufficient level of cost return for the utility and, in turn, will violate
capital attraction need. Marginal costs, however, can be used as a guide in pricing.
Encourage “managerial efficiency”
Rates set through proper regulatory frameworks should encourage and promote efficient
operation and management of the utility. For instance, costs incurred should be prudent and
reasonable and incurred to provide the required level of service at reasonable cost.
Inefficient operation, poor managerial actions and other actions under management control
6 E.g., Bluefield Water Works v. Public Service Commission, 262 U.S. 679 (1923); FPC v. Hope Nat. Gas Co., 320
U.S. 591 (1944).
7 James C. Bonbright, “The Role of Public Utility Rates,” New York, Columbia University, first edition, 1961 p. 53.
AUC Distribution System Inquiry: Combined Modules Charles River Associates
Page 11
that result in unnecessary or excessive costs for consumers should be discouraged. From an
economic signal perspective, such factors interfere with communicating the true cost and
value levels of the utility service to the consumer that would otherwise be communicated
freely through competitive markets. However, utilities are in the best position to evaluate
consumer demands for the level and types of services needed. Frameworks must strike a
balance between providing sufficient managerial control to the utility for making investment
and operating decisions while ensuring economically efficient outcomes.
Set rates that send correct price signals to consumers
Consumers should be able to accurately evaluate and set their own demand for a particular
service based on a correct understanding of value. In this way, consumers can weigh their
purchasing decisions for utility services against their larger basket of goods and services and
make an informed decision as to how to allocate their resources. Correct price signals also
permit utilities to invest in their systems to provide a level and quantity of service that are in
balance with consumer demand. An effective way to communicate price signals is to set rates
based upon underlying costs to produce and deliver the service. Such pricing avoids
overinvestment by utilities and wasteful consumption by consumers, which occurs when
investments are made without accurate consideration of underlying value. Marginal costs
provide the strongest price signals, since they communicate the cost of producing that next
incremental unit of service. As explained earlier, rates cannot be entirely based on marginal
costs, since they will not recover the full level of embedded utility costs.
Regulatory frameworks should consider affordability from the customers’ perspective
This concept can compete with the goal of “capital attraction” for full cost recovery. Current
regulatory frameworks acknowledge the importance of a customer’s ability to pay. However,
rate proceedings on this matter are generally limited to specialized rate designs or specific
programs to certain eligible consumers. Rate affordability is further discussed in section 4.1.
Attempt to simulate results from a competitive market
Though regulation can never perfectly imitate competition, it should aim for an economically
efficient result that would otherwise be achieved in open markets. Matching supply and
demand organically resolves trade-offs. Thus, a regulatory framework must reconcile
competing objectives:8
Capital attraction and managerial efficiency. Capital attraction, taken to an extreme,
results in overinvestment in infrastructure and high rates without regard to efficiency of
expenditure and operations. The regulatory framework needs to address this conflict,
which would not occur in perfectly functioning competitive markets, by imposing
standards for prudent investment while permitting the utility to make investments and
operating decisions they believe best suit their customers’ needs.
Capital attraction and price signals (“consumer rationing”). Utility rates are set on
the basis of average embedded costs to attract capital, but using average cost rates
instead of marginal cost rates obscures the true value of the next incremental service. In
monopolistic markets, it is difficult to abandon the average cost rate-setting method
8 James C. Bonbright, “The Role of Public Utility Rates,” New York, Columbia University, first edition, 1961 p. 38, 62.

AUC Distribution System Inquiry: Combined Modules Charles River Associates
Page 12
since total rate levels must recover all embedded costs. Furthermore, since marginal
costs are not additive to average costs, marginal cost pricing is not suitable for system-
level rate recovery.
Competitive markets are not always perfect. To work, their prices must adjust automatically to
balance supply and demand for equilibrium, offer low barriers to entry, and consist of a
sufficient number of buyers and sellers to avoid market power influence. However, when
working, competitive markets are best suited to foster innovation. Market forces identify
winners and losers based on service quality, type, and cost as well as other factors.
Therefore, regulatory frameworks seeking to address innovation should evaluate utilities
based on the same factors and not be tethered to other rate setting goals that may have the
effect of favoring one technology over another. That is, to foster innovation, a regulatory
framework should be technologically agnostic.
The framework should not prescribe a certain technology. In competitive markets, this
outcome would naturally evolve based on market dynamics and consumer feedback.
Set rates that minimize unintended consequences to the extent possible
Under the principles of an ideal competitive market, the following outcomes should be
avoided:
Overcapacity from too much capital attraction; wherein utility fixed capacity is over-
built or redundant stranded costs lead to inflated price levels.
Under-capacity and inability to meet demand; wherein underinvestment occurs
relative to system capacity needs or other production, delivery or reliability needs, and
customers face the risk of service interruption with related loss of value.
Products and services priced below marginal costs; wherein customers are either
unwilling to pay for a service, even at a low cost, or prices are insufficient to recover the
marginal costs of providing the service.
Uncompetitive products and services priced above marginal costs; wherein
customers are unwilling to pay for a product or service due to its high price, such that
utilities cannot recover costs. In this case, prices are higher than consumers’ value of the
service.
3.2. Summary of Current Regulatory Framework in Alberta for DFOs
In 2012, the AUC implemented PBR for four electric and two gas distribution utilities in the
province: AltaGas, ATCO Electric and ATCO Gas, EPCOR, and Fortis. A PBR plan was also
approved for the fifth electric utility, ENMAX, which commenced prior to 2012. With the
exception of ENMAX’s first generation PBR, the AUC has approved PBR plans in increments
of five years. The first set of PBR plans were effective from January 1, 2013, to December 31,
2017. In December 2016, the AUC approved the current PBR plans, in effect from January 1,
AUC Distribution System Inquiry: Combined Modules Charles River Associates
Page 13
2018, to December 31, 2022.9 While price cap regulation applies to electric utilities, revenue
cap regulation applies to the gas distribution utilities (ATCO Gas and AltaGas).
Prior to 2012, the AUC generally used cost-of-service (“COS”) regulation, in some cases
applying a formula-based approach. Under COS, the electric utilities ordinarily presented two-
year forecasts of their revenue requirements and capital additions.10 The AUC allowed these
costs to be fully recovered via transmission and distribution charges levied on different
customer classes. However, Alberta’s Office of the Utilities Consumer Advocate (“UCA”)
found that COS regulation over-incented the addition of recoverable capital assets and
discouraged non-recoverable activity such as maintenance, efficiency initiatives, and capital
deferral.11 The utilities were not permitted to keep any “profits.” Any savings from predicted
costs were passed onto customers in the next rate proceeding. COS regulation was also
burdensome in a restructured market. The AUC needed to monitor production and retailing
separately from newly competitive distribution and transmission activity. As a result, the AUC
reviewed thousands of pages of test-year data and hundreds of specialized rate riders for
each of the five utilities.12
PBR, in contrast, was designed to reduce predicted costs, discourage overinvestment in
potentially superfluous capital additions, and streamline regulatory proceedings. In Alberta,
the PBR mechanism is formulaic.13 The basic formula is called “I – X” and caps a utility’s
prices or, in the case of gas distribution, overall revenues. I – X consists of the following
components:
Base rate: A utility’s base starting rate, or “year zero” rate to which the I – X formula is
applied in subsequent years. Base “going-in” rates are critical to the success of a PBR
plan. During negotiations for the 2018-2022 PBR plans, the utilities supported a COS-
regulated test year (2018) to reset going-in rates, while parties such as CCA favored
eliminating all tracking of capital spending. The AUC compromised: the going-in rates
reflect the actual costs, cost savings, and capital additions for 2017, the year prior to the
PBR plan’s implementation.
Adjustment percentage: After year 1 of the PBR plan, the going-in rate is adjusted by a
percentage of I – X, or an inflation rate for energy-related products less predicted
9 AUC Decision 20414-D01-2016: 2018-2022 Performance-Based Regulation Plans for Alberta Electric and Gas
Distribution Utilities, February 6, 2017.
10 In some instances, utilities filed either single year or multi-year (e.g., 3-5 year) forecasts.
11 Application #1606029; Proceeding ID #566, Exhibit No. 299.02, December 16, 2011.
12 AUC Decision 2012-237: Distribution Performance-Based Regulation, September 12, 2012.
13 The electric and gas distribution utility ENMAX has been regulated under a two-part formulaic rate since 2009.
Distribution rates, fees, and non-residential investment were calculated with an I-X mechanism. Revenue
requirement and transmission were calculated with an I-X mechanism plus an additional “G factor,” or the previous
year’s amortized transmission investment. ENMAX’s going-in rates matched its approved 2006 rates. ENMAX’s first
formula-based regulation term was seven years to provide regulatory certainty and match the life of capital assets.
(AUC Decision 2009-035) The first plan was approved for a seven-year term that ended on December 31, 2013.
However, ENMAX used COS regulation to rebase its revenue requirement for the 2014 test year to establish going-in
rates before filing a new two-year PBR plan for the years 2015-2017. (AUC Decision 21149-D01-2016).
AUC Distribution System Inquiry: Combined Modules Charles River Associates
Page 14
efficiency improvements the utilities achieve. The X factor, (including a stretch
component) is currently 0.3%14 industry-wide, so every utility’s performance is
accounted for. Thus, energy-related prices adjusted by I-X reflect industry-wide
conditions that would yield price changes in competitive markets and allow utilities to
retain their cost savings as “profits.”
Alberta’s I – X formula includes some cost-based adjustments, vestiges of COS regulations.
The AUC recognized that certain events might only affect the energy industry or a single
utility, and these costs cannot be recovered through the I or X factors.15 The impacts of these
factors can be recovered through the following:
Y factor: Predictable, non-capital costs that the utility cannot control. These include
municipal fees, load balancing, weather risk, production abandonment, and income
taxes. Y factor costs are directly recoverable from customers.
Z factor: Unpredictable events for which the utility has no reasonable cost recovery
mechanism within the I – X framework. Z factors are approved on an individual event
basis and must meet a certain monetary threshold to prevent overuse.
K factor: Beginning in 2018, two separate K factors, also known as “capital trackers,”
will be applied to two types of capital additions: Type 1 and Type 2.
Type 1 capital is extraordinary, not included in the utility’s rate base, and required
by a third party. Utilities must apply for capital tracker true-ups each year.
Type 2 capital is predictable and included in the utility’s rate base. An initial amount
of Type 2 capital, or “base K-bar”, would be established for all Type 2 capital in the
first year of PBR implementation. The AUC calculates Base K-bar with an
accounting test. Each year, the AUC will index the 2018 base K-bar amount by I – X
to incrementally increase K-bar funding.16
Overall, as we understand it, the AUC’s second-generation approved PBR plans slowly
transition from COS-based regulation to “pure” PBR, in which budget outperformance is
rewarded.
3.3. Key Observations Regarding Current Framework in Context of Stated Principles
We find that the current regulatory framework in Alberta is generally in alignment with our
outlined framework principles presented in this section. The framework is designed to support
full embedded cost recovery for prudently incurred capital and operating expenses that
provide utilities with the opportunity to earn a fair rate of return and attract capital. In addition,
the framework is technology agnostic and provides the utility the opportunity to exercise
14 AUC Decision 23355-D02-2018: Rebasing for the 2018-2022 PBR Compliance Filing, October 10, 2018.
15 AUC Decision 2012-237: Distribution Performance-Based Regulation, September 12, 2012, para. 18.
16 AUC Decision 20414-D01-2016: 2018-2022 Performance-Based Regulation Plans for Alberta Electric and Gas
Distribution Utilities, February 6, 2017, para. 242.
AUC Distribution System Inquiry: Combined Modules Charles River Associates
Page 15
management discretion to make investment decisions according to the level and types of
services it perceives customers want.
However, we believe that some refinements to the current framework may be warranted with
regards to the treatment of new and emerging technologies. The current PBR, for instance,
is designed to provide incentives for the utility to deliver operating cost efficiencies through
the I-X factor. Although reasonable cost levels through operating efficiency is a valid
regulatory framework goal, as we consider the opportunities and risks presented by new
technologies, other incentives may be appropriate to communicate through the PBR. For
instance, no specific incentive currently exists to foster innovation other than through what
could be achieved via delivering a lower cost that would be rewarded through the I-X factor.
With innovation, of course, comes potential risk. In turn, risk can translate to increased costs
to consumers. It is important for regulatory frameworks to sufficiently balance the need to
encourage innovation while, at the same time, protect consumers from poor decision-making
and management with regard to technology deployments. We believe an approach that better
incents innovation, while ensuring utilities are making appropriate investments in the right
amounts and the right cost, could provide a reasonable balance and advancement from
today’s framework. This can be achieved within PBR. We believe utilities should take the risk
for innovation and that PBR should provide a reward for taking that risk. The reward may be
retention of cost savings from increased margin due to efficiencies, or other specific
incentives that are tied to outcomes of new technology deployment (e.g., improved reliability,
deferred T&D investment). We have also already described how the potentially higher return
on equity (“ROE”) can be provided for successful innovation investments. However, these
reward incentives should be balanced by an appropriate set of checks to ensure investments
are made soundly and prudently.
In addition, it is important for the regulatory framework to respond to the fact that customer
needs for utility service are changing, and these needs extend beyond the sole goal of lower
rates. The current regulatory framework may benefit from providing an incentive to utilities to
better understand customer evolving needs and to deliver solutions accordingly.
PBR can also provide a framework to incent utilities to make investments that promote long-
term efficiency. These investments may entail immediate cost outlays but provide benefits in
the future. Over a longer time horizon, these types of investments can provide a positive net
present value based on the balance of costs to future benefits. For instance, advanced
metering infrastructure (“AMI”) programs entail significant up-front cost investments that, on a
single test year basis, may entail cost increases with little to no corresponding benefit. Yet,
over the life of the investment (for instance 20 years), the value of future benefits, when
weighed against up-front costs, results in increased efficiency (overall lower costs) to
consumers. A PBR program can potentially incentivize this type of investment by providing
the utility an opportunity or incentive to make the investment and include it in rate base.
However, there should also be corresponding checks in place that measure forecasted future
benefits against actual benefits achieved. As one example, a PBR program could provide an
incentive for the utility to retain a portion of benefits achieved that are in excess of forecasted
benefits. Conversely, the program could penalize underachievement of expected benefits by
forcing the utility to absorb the underachievement in follow up-reconciliations. Other potential
examples could apply.
Specific framework changes could include:
AUC Distribution System Inquiry: Combined Modules Charles River Associates
Page 16
A strict set of prudence criteria with cost benefit analysis to be applied for investments in
emerging technologies;
An incentive metric in PBR that rewards for innovation, but with a strict tie to cost-benefit
and prudence;
A PBR metric that evaluates how well utilities understand evolving customer needs;
Continued imposition of I-X operating efficiency goals;
A set of penalties and disincentives for uneconomic or stranded investment, especially
with regards to new and emerging technologies;
A set of incentives and penalties to encourage utilities to invest in innovation that can
provide future benefits. However, we recognize that utilities are well positioned to
assume and manage risk (within the types of investment allowed for DFOs under
prevailing statute and regulations).
The PBR framework could also be adapted, consistent with broader Alberta policies, to
provide specific incentives for outcomes that have been determined to be in the public
interest. This is particularly true for policies that may run counter to other incentives faced by
a utility under PBR. For example, a goal of decarbonization may run counter to utility
incentives to increase billing unit sales and could, therefore, be accounted for under a
separate provision under PBR. Likewise, if innovation is a priority, higher returns could be
provided for successful implementation of innovation projects.
3.4. Case Study: Performance Based Ratemaking in the UK
The United Kingdom (“UK”) has used a mechanism similar to I – X, called RPI – X, to recover
costs for various regulated industries since the 1980s.17 The UK’s gas and electric industries
implemented RPI – X in 1986 and 1990 after their respective privatizations. UK regulators
first set price caps to be reviewed every 5 years. The price caps were then adjusted by an
RPI – X factor on an annual basis. The RPI – X factor consists of the retail price index for an
industry’s basket of products less expected efficiency savings across all fourteen electric
distribution utilities.18
In 2013, Ofgem, the UK’s regulator for gas and power distribution and transmission utilities,
transitioned to a cost recovery mechanism called “RIIO” (Revenue = Incentives + Innovation
+ Outputs). RIIO aims to incent safety, reliability, carbon emission reductions, and especially
customer satisfaction. One of RIIO’s primary metrics is “customer satisfaction with network
operators,” a value out of 10 collected via a Customer Satisfaction Survey,19 which asks
customers questions such as if they experienced an outage, if the outage was swiftly handled
and communicated, or they successfully connected to the grid, if applicable. The industry
17 The UK’s water industry also adds a K factor for capital additions.
18 Ofgem, “Regulating Energy Networks for the Future: RPI-X@20, History of Energy Network Regulation,” February
27, 2009.
19 Ofgem, “RIIO-ED1 Annual Report 2017-2018,” March 8, 2019.
AUC Distribution System Inquiry: Combined Modules Charles River Associates
Page 17
average score is 8.7 out of 10.20 Utilities are also scored by Ofgem based on the number of
complaints received and the degree to which they engaged with their stakeholders. The
maximum reward or penalty for customer satisfaction is +/- 1.5% of annual base revenue- in
2017-2018, electricity distribution utilities received a net reward of £49.2 million.
The RIIO regulatory process allows for more reciprocity between Ofgem and transmission
and distribution utilities. The utility actively assists Ofgem in setting its own performance
targets by submitting a unique business plan, rather than crafting a business plan in response
to a regulatory command.
RIIO terms are eight years in duration, allowing for long-term investments. Ofgem first sets a
fixed revenue requirement in real dollars, or “total expenditure” (“totex”) that dictates the
amount utilities may collect over the eight-year period. Totex is the sum of capital
expenditures (“capex”) and operating expenditures (opex) in a pre-determined ratio. Capex
and opex have separate rates of returns. Utilities maximize the rates by adhering to Ofgem’s
preferred ratio of capex-opex.21 Utilities are able to recover both capex and opex, rather than
“passing through” opex benefits straight to customers without realizing them as a company.
For electricity distribution entities, RIIO totex is £27.8 billion. Collectively, utilities are
projected to underspend by £1,293 million (5%) by 2023; four utilities are projected to slightly
exceed their revenue requirements.22
While RIIO retains adjustments for inflation, it is more directly performance-based than RPI -
X. Utilities receive pre-set budgetary and performance targets. There are six types of
performance targets: reliability, environmental impact, distribution-level connections,
customer service, social obligations, and safety minima. A financial penalty is imposed if
projects exceed their budgets or performance targets are not met, while utilities may keep
excess revenue from projects completed under budget. The RIIO model also contains
uncertainty adjustment mechanisms for unpredictable events, similar to Alberta’s Z factor.
Ofgem publicizes and ranks results annually, forcing transparency and fostering productive
competition amongst the utilities.
Finally, to encourage low-carbon technology buildout, two government programs offer both
allowances and competition for pilot programs. The Network Innovation Allowance (“NIA”) is
an annually guaranteed fund for small-scale projects such as electric vehicle charging
networks, behind-the-meter battery storage, and smart meter deployment. In 2017-18, utilities
registered 197 NIA projects worth £21.9m, 83% of the annual NIA allowances. The Network
Innovation Competition (“NIC”) allows utilities to compete for large-scale demonstration
project funds.23 These programs allow utilities to take risks and invest in cutting-edge projects
without fear of under-recovery. They also allow utilities to address their own regional needs
rather than deploy a “best” technology dictated by Ofgem. Pilot program results are shared on
20 www.ofgem.gov.uk/data-portal/all-charts?search_api_views_fulltext=satisfaction
21 Steve McMahon, “Innovation and Network Price Controls: The RIIO experience,” May 2018.
22 Ofgem, “RIIO-ED1 Annual Report 2017-2018,” March 8, 2019.
23 Ofgem, “Factsheet 93: RIIO - A New Way to Regulate Energy Networks,” October 4, 2010.
AUC Distribution System Inquiry: Combined Modules Charles River Associates
Page 18
a publicly accessible web portal so utilities may share information amongst themselves.24
Ofgem remains involved throughout the NIA and NIC process. Ofgem awards grants, solicits
progress reports, and decides whether to recover future costs from a utility initiative after its
pilot is proven to yield financial benefits. For example, Northern Gas Networks won £8.9m in
NIC funding for “demonstrat[ing] that it is safe to transport 100% hydrogen in gas distribution
networks.”25 Now that the pilot is nearly complete, and the technology is demonstrably safe,
Northern Gas Networks has included a gas-to-hydrogen conversion trial for 300 network
customers in its latest business plan.26 The goal of hydrogen conversion is to achieve 100%
carbon-free gas networks.27
RIIO’s second iteration, RIIO-2, will span 2021-2026 for gas distribution entities and electricity
and gas transmission networks, and 2023-2028 for electricity distribution entities. Ofgem has
four stated goals for RIIO-2:28
1. Allow consumers to dictate performance priorities;
2. Grant fair returns to utilities that properly incorporate risk and market conditions;
3. Increase efficiency incentives; and
4. Simplify price controls such that only the strongest consumer priorities are incented.
Utilities were required to submit their RIIO-2 business plans by December 2019. Amidst an
increasingly decentralized energy landscape and a UK-wide net zero emissions target by
2050, Ofgem seeks business plan submissions that incorporate smart meter rollout,
distributed PV solar penetration, and behind-the-meter battery storage and electric vehicle
charging specific to each utility’s service territory. For example, National Grid’s plans for
electricity transmission detail a stakeholder-recommended course of action to abate harmonic
distortions. When distributed energy resources (“DERs”) and offshore wind connect to the
grid at uneven frequencies, customer equipment became damaged. National Grid proposed
to individually respond to customer DER connection applications and build harmonic filters
without third-party developer assistance, allowing for potential aggregation of harmonic filters
for multiple utility-owned projects without stranding risk.29
Ofgem has never required specific deployment targets for these potentially disruptive
distribution-level technologies. These technologies have mostly been deployed through NIA-
and NIC-funded pilots. However, the planning process for electric distribution entities is still in
the early stages. As consumer stakeholder working groups meet to set priorities for the 2023-
2028 electric distribution RIIO-2 term, more specific targets may emerge.
24 www.smarternetworks.org/
25 Ofgem, “Network Innovation Competition 2017 Funding Decisions,” November 30, 2017.
26 Northern Gas Networks, “A14-NGN RIIO-2: Our Whole Systems Strategy,” December 2019.
27 Ofgem, “Network Innovation Competition 2017 Funding Decisions,” November 30, 2017.
28 Ofgem, “RIIO-2 Framework Decision,” 2018.
29 National Grid, “National Grid Electricity Transmission’s Business Plan 2021–26,” December 2019, pg. 60.
AUC Distribution System Inquiry: Combined Modules Charles River Associates
Page 19
For example, Ofgem found that consumers primarily seek safe, resilient, and environmentally
sustainable networks. Therefore, to satisfy the request for sustainability, electricity and gas
transmission and gas distribution entities will need to meet performance targets for natural
gas venting and leakage, SF6 emission, and other environmental actions.30
The updated price control framework for electricity distribution networks will reflect key
strategic issues to meet the main consumer priorities. Returning to the decarbonization
example, Ofgem admits that performance targets will be difficult to attribute to any one utility.
The price control mechanism to incent decarbonization must walk a fine line between
innovation and imprudently saddling the consumer with high costs of new services and
infrastructure. Similarly, resilience will be in part measured by a metric called the Network
Asset Risk Metric (“NARM”) to avoid stranded costs. Instead of measuring the remaining risks
in a utility’s asset portfolio, NARM will measure the reduction of risks achieved during the
RIIO-2 term. NARM will also estimate present value of future benefits to further reduce
expected risk. In contrast, the RIIO-1 NARM did not accurately portray true market risk, as it
only measured risk reduction in one-year increments.
Future and ongoing working groups will allocate responsibilities between utilities and other
entities such as the government.31 For instance, National Grid hopes to coordinate with
policymakers to share funding and infrastructure for an electric vehicle charging network in
which 95% of drivers in England and Wales are located within 50 miles of a fast-charging
station. National Grid estimates that 90% of necessary transmission connections can be
supplied from existing substations, but to meet the 50-mile radius benchmark, outside support
and investment is crucial.32
Price control simplification and consumer priority-setting represents a shift in Ofgem’s
regulation style. The consumers’ will and understanding of RIIO-2 takes precedence. Rather
than letting “expertise” drive regulatory proceedings, Ofgem is betting that an active role in
designing cost recovery structure will influence customer behaviors to meet their own stated
goals for their utilities.
We note that Ofgem has also made an effort to involve customers in utility matters. Ofgem’s
“Consumer First” program features 1) a standing panel of 100 customers, 2) a Consumer
Challenge Group of expert consumer advocates who regularly meet with Ofgem, and 3) a
Price Control Review Forum in which various stakeholders and industry insiders debate key
issues. Ofgem also conducts extensive consumer research about willingness to pay in order
to establish desirable price controls.33
30 Ofgem, “RIIO-2 Sector Specific Methodology,” May 24, 2019.
31 Ofgem, “RIIO-ED2 Framework Decision,” updated January 23, 2020.
32 National Grid, “National Grid Electricity Transmission’s Business Plan 2021–26,” December 2019, pg. 61.
Maxine Frerk, “Consumer Engagement in the RIIO Price Control Process: Review,” November 25, 2016, pg. 4.

AUC Distribution System Inquiry: Combined Modules Charles River Associates
Page 20
3.5. Case Study: Australian Microgrid Initiatives
Australia has quickly begun development and investment into microgrids as a way to provide
reliable supply to remote communities, mitigate bushfire risks, and reduce network costs.34
Following the growing interest in these technologies, the national government set up a
Regional and Remote Communities Reliability Fund (“RRCR”) in 2019 to spend up to $50M
on as many as 50 feasibility studies looking at microgrid technologies to replace, upgrade, or
supplement off-grid and fringe-of grid communities. With this program, Australia hopes to
demonstrate commercial viability of the technology, and its associated reliability and security
benefits, to attract greater investment for microgrid implementation.35 In addition to the
RRCR, there is other government funding at the federal and state levels for microgrid
development and implementation. These programs’ aims range from improving
competitiveness and deployment of renewable energy technologies36 to demonstrating the
market potential for third-party microgrids in managing customer usage.37
While the funding programs for new microgrid technologies across Australia are quite
extensive, the regulations and governance of these stand-alone power systems (“SAPS”)
continue to evolve. The Australian Energy Market Commission’s (“AEMC”) Consumer Action
Plan 2019 includes new rules and reviews to give consumers more choices about energy
products and services, while providing them with more control over energy bills and stronger
protections.38 The AEMC has identified a three-tiered framework for regulating SAPS, by
size:
Category 3, including very small microgrids with a “handful of customers” and/or those
supplying large customers and individual power systems where there is a sale of energy;
Category 2, ranging from microgrids connecting more than a “handful of customers” to
those supplying smaller towns; and
Category 1, very large microgrids with such a high potential number of customers that
there is likelihood of supporting effective competition in generation and retail.39
The AEMC reviews also distinguish SAPS provided by distribution network service providers
(“DNSP”) registered with the National Energy Market (“NEM”), and those by third-party
providers.40 Recommendations regarding the two types of service providers emphasize the
need to maintain access to competitive retail, ensure customers provided by SAPS retain all
34 www.minister.industry.gov.au/ministers/taylor/media-releases/more-affordable-and-reliable-energy-regional-australia
35 www.energy.gov.au/government-priorities/energy-programs/regional-and-remote-communities-reliability-fund
36 arena.gov.au/
37 solar.ovida.com.au/victorian-micro-grid-trial ; www.energy.vic.gov.au/microgrids
38 www.aemc.gov.au/sites/default/files/2019-12/Consumer%20action%20plan_1.pdf
39 AEMC, “Final Report: Review of the Regulatory Frameworks for Stand-Alone Power Systems”, Priority 2.
40 The National Energy Market, which operates in the eastern half of the country, is a wholesale electricity market and
physical power system supplying 200 TWh to approximately 9 million customers annually. The Australian Energy
Market Operator, somewhat similar to a North American ISO/RTO, manages the electricity and gas systems and
markets across both NEM and the Wholesale Electricity Market (WEM) in the western part of the country.
AUC Distribution System Inquiry: Combined Modules Charles River Associates
Page 21
existing consumer protections independent of the service provider, and receive the benefits of
lower network costs in rates. Recommendations additionally include changes in the
distribution annual planning report to identify items specific to SAPS, as well as the
introduction of new customer engagement obligations on distribution businesses.
Jurisdictions are encouraged to review the legislative instruments governing reliability
standards and guaranteed service levels.
Currently, National Energy Law (“NEL”) only applies to the interconnected electricity grid on
the east coast of the country that underpins the NEM. Stand-alone systems not connected to
the grid are subject to jurisdictional regulation by the states and local governments.41 The
AEMC has chosen to defer regulation of Category 2 and 3 SAPS to the states, reasoning that
smaller SAPS would generally be expected to be vertically integrated without meaningful
competition. Therefore, they would not need to be governed at the federal level. AEMC has
encouraged each jurisdiction to develop and adjust its own regulations for these SAPS,
emphasizing the need for consumer protections, in addition to safety and metering
requirements. On the other hand, for Category 1 microgrids, the AEMC believes such size
and competition warrants economic regulation in a similar manner to standard supply and is
supporting legislation to this end.
The AEMC has prepared several reports on the topic of microgrid regulation. The first
focuses on situations in which DNSPs may recognize potential “economic efficiency” gains in
moving customers to a SAPS, as compared to providing electricity from the interconnected
grid. Existing NEL and National Energy Retail Rules (“NERR”) apply currently only to
customers supplied by the grid. Maintaining similar customer rights, if moved to SAPS by
providers, is a core requirement underlying the AEMC recommendations. The report also
presents recommendations regarding support for transitioning customers to SAPS supply,
customer engagement, and network planning, as well as service delivery models and
classifications for the purpose of network regulation.
Similar to the Community Choice Aggregation transition model in much of North America, the
AEMC recommended that DSNPs not be required to obtain explicit consent from customers
before moving them to SAPS supply, while requiring that they “continue to benefit from
equivalent price and reliability protections.”42 Though enabling transition without explicit
consent, the AEMC recommended the implementation of new SAPS customer engagement
obligations, including formal SAPS consultations and announcements by DNSPs. This
recommendation, however, does not apply should the customers be transitioned to a third-
party SAPS provider. Further, the report recommends that DNSP-led SAPS continue to be
considered part of the DNSP network, and therefore granted all rights and protections
provided to grid-connected customers. In the case of new connections or reconnections of
customers likely to benefit from SAPS, as opposed to existing grid-connected customers, the
AEMC recommended that such supply be competitively sourced rather than automatically
provided by local DNSPs.
AEMC has also concluded that service delivery model for SAPS supply would be best
supported by existing wholesale energy market arrangements, such as the AEMO settlement
41 AEMC, “Final Report: Review of the Regulatory Frameworks for Stand-Alone Power Systems,” Priority 1.
42 AEMC, “Priority Report 1”, pg. vviii.
AUC Distribution System Inquiry: Combined Modules Charles River Associates
Page 22
system. However, instead of using a market spot price for energy delivery to SAPS
customers, the AEMC recommended that retailers be charged an administered settlement
price. This will enable grid competition and remove retailer risk of spot market volatility while
protecting customers from any wholesale price signals inconsistent with minimizing cost of a
SAPS. The report also addresses classification of the services provided by a DNSP SAPS
supply model and how DNSPs will be allowed to fund these services. To do so, the AEMC
identifies two components of the SAPS: the stand-alone distribution system, and the
generating system(s) connected to provide the electricity.43 DNSPs would be able to recover
costs of the distribution systems through usual regulated revenues. However, the generation
of electricity would not be subject to the same classification by the Australian Energy
Regulator (“AER”) and would require competitive generation procurement.
Another report focused on the implementation and regulation of the technology. In doing so,
the AEMC developed Categories 1-3, outlined above, to determine under which jurisdictions
each of the SAPS would be governed. Similar to those provided by DNSRs, a third-party
Category 1 SAPS would be regulated by the AER, including revenue determination and
incentive schemes. Retailers would have access to Category 1 SAPS customers in the same
way as grid-connected customers and would be required to provide the same security,
reliability, and price protections granted to traditional customers. The AEMC encouraged
COAG Energy Council to enact similar standards as the NEL and NERR to such SAPS
activities. For Category 2 and 3 customers, AEMC offered recommendations but did not
direct them to the Energy Council. It believed states and local jurisdictions were better suited
to determine access obligations, economic regulations, reliability targets, and network
operations. Their recommendations often paralleled those made for a Category 1 SAPS, as
applicable, but did mandate federal action.44
Stakeholder engagement on SAPS-related issues is ongoing.45 To date, we note that there
has been stakeholder input from the distribution service providers, as well as the Independent
Pricing and Regulatory Tribunal (“IPART”). The IPART provided feedback on changes that
may be required to ensure consumers safe and reliability electricity in light of the new supply
models. Furthermore, AEMC, jointly with the AER, held a SAPS workshop on January 29,
2020, where 40 stakeholders from industry, government and market bodies discussed
network planning, the settlement model, and the SAPS settlement price, as well as ring-
fencing and the proposed regulatory framework for distributor-led SAPS.
Australia presents a unique opportunity for wide microgrid development, given its large
number of customers currently off-grid or fringe-of-grid. As described in this case study, with
an array of federal and local initiatives to drive investment and implementation of SAPS,
Australia has determined that it is necessary for regulations to ensure customer protections,
reliability standards, and pricing structures. In its 2019 reviews, the AEMC focused its key
43 AEMC “Priority Report 1”, pg. x.
44 AEMC, “Priority Report 2”.
45 www.aemc.gov.au/news-centre/media-releases/workshop-recap-what-stakeholders-said-about-distributor-led-stand-
alone Stakeholder comments are welcome and requested by February 13, 2020.
AUC Distribution System Inquiry: Combined Modules Charles River Associates
Page 23
amendment recommendations to the NEL and NERR, as well as its prompt to states to
amend their local regulations, on:
Requirements on customer engagement and participation, specific to incumbent
distributor and third-party microgrids;
Identifying under which jurisdiction various microgrids are regulated, by customer count
and grid operator type;
Supporting microgrids with the wholesale energy markets, adjusting settlement prices as
deemed necessary;
Classifying the various components of a microgrid for the purpose of cost recovery,
either through regulated revenue or other mechanisms; and,
Ensuring reliability, security, and consumer protections regardless of how they are
supplied.
3.6. Case Study: Hawaiian Microgrid Initiatives
Hawaii, an archipelago of small islands, some with peak loads under 10 MW, is a prime
location for microgrid development.46 The state is also on the forefront of renewable energy
implementation, as the remote locations and strong storms encourage innovative solutions for
providing reliable electricity.47 For example, Molokai, an island with a peak demand of 5.5
MW, is working with the Hawaii Natural Energy Institute to design a stable microgrid system
using local renewable energy resources.48 Relatedly, in partnership with Hawaiian Electric
Company (“HECO”), the U.S. Navy has invested in a number of microgrid projects across
various Hawaiian islands, with some phases complete and others ongoing.49 These efforts
support improved grid reliability, resiliency, and renewable penetration.
In response to growing interest in microgrids and other distributed energy resources in the
state, Governor Ige signed Act 200 into law in July 2018, facilitating and formalizing the
development and implementation of microgrids on the islands through establishment of a
standard microgrid services tariff (“MST”). In the legislation, a “microgrid project” is defined as
a group of interconnected loads and DERs within clearly defined electrical boundaries, which
acts as a single controllable entity but can also connect to a utility’s electrical grid to operate
in a grid-connected mode.50 In response, the state Public Utilities Commission (“PUC”) has
opened proceedings focusing on:
Developing a microgrid services tariff to facilitate applications for microgrid applications
that improve energy resiliency;
46 What exactly constitutes a microgrid is an issue before the Hawaii PUC.
47 www.utilitydive.com/news/hawaii-microgrid-bill-aims-to-keep-the-state-a-model-for-others/525926/
48 www.hnei.hawaii.edu/projects/molokai-secure-renewable-microgrid
49 www.energy.gov/eere/femp/spiders-jctd-smart-cyber-secure-microgrids; microgridknowledge.com/military-
microgrids-pearl-harbor/
50 www.capitol.hawaii.gov/session2018/bills/GM1309_.pdf
AUC Distribution System Inquiry: Combined Modules Charles River Associates
Page 24
Addressing current limitations for multi-customer applications of microgrids due to
current programs, interconnection rules, and lack of utility participation in enabling grid
connection or transfers between microgrids;
Developing compensation mechanisms for resiliency services through existing programs
and tariffs; and
Standardizing the definitions and governance of microgrids and their interconnections.51
To address these priorities, the PUC established two working groups. The first, the Market
Facilitation Working Group, was tasked with recommending draft tariff language for the MST
and proposing new programs to facilitate development, including addressing compensation
for grid services, and utility distribution systems in the event of an outage. The second, the
Interconnection Standards Working Group, was tasked with revising rules governing
distributed generation technical requirements, which would standardize interconnection and
islanding/reconnection processes for existing and new microgrids. A key issue in these
microgrid regulations, to be addressed by the working group, is the ability and permission of
the utility to require grid connection or islanding of the microgrid at times scheduled by the
utility.
The working groups submitted a combined final report in February 2020. Of note, the Market
Facilitation Working Group identified two types of microgrids within the scope of the MST:
customer microgrids, which use non-utility infrastructure to meet its interconnected loads, and
hybrid microgrids, which use both utility and non-utility infrastructure. Both types of microgrids
are interconnected to the utility grid and have an isolation breaker for islanding. In this
proposed tariff, customer microgrids themselves are utility customers, paying HECO for
electricity used while offsetting costs with compensation for any electricity production from the
local generator. Hybrid microgrid customers are direct customers of the utility and pay HECO
for electricity with similar offsetting cost compensation as the customer microgrids. In the
hybrid microgrid model, however, HECO additionally compensates and charges the hybrid
microgrid operator for electricity produced and consumed, respectively. The report also
suggested potential tariff compensation structures for resilience and service fees, through
agreements between customers and the microgrid operator, as well as by HECO pursuant to
future tariffs.52 Illustrative examples of the two microgrid models defined in the report are
showing in Exhibit 1, Exhibit 2, and Exhibit 3.53
51 Public Utilities Commission of Hawai’i, Order No. 36481, (1) Prioritizing Items for Resolution in this Docket and (2)
Making Determinations on Issues Raised by the Preliminary Questions in Order No. 35884, Docket No. 2018-0163.
52 Per PUC advice, the MST did not address compensation for microgrids while grid-connected or for retail energy
sales during normal conditions, as that is to be addressed in a separate docket regarding DERs. The report also
considered utility microgrids, remote microgrids, mini-grid hybrid microgrids, virtual power plants, and hybrid
microgrids above 3 MW out of the scope for this MST.
53 Graphics adapted for clarity based on exhibits in the February 14, 2020 Microgrid Services Tariff Working Group
Report.

AUC Distribution System Inquiry: Combined Modules Charles River Associates
Page 25
Exhibit 1: Hawaii concept for Simple Customer Microgrid
Exhibit 2: Hawaii Concept for Multiple Customer Microgrid
Exhibit 3: Hawaii Concept for Hybrid Microgrid
In the working group discussions, HECO proposed a hybrid microgrid tariff approach in an
effort to avoid more complex issues such as retail wheeling and grid operational
responsibilities in emergency conditions, as well as potential regulatory issues associated
AUC Distribution System Inquiry: Combined Modules Charles River Associates
Page 26
with the public utilities’ participation in microgrid operations.54 Currently, the public utilities do
not allow microgrid or otherwise independent customers to transfer electricity between one
another over the utility-owned transmission and distribution system. In the PUC proceedings
thus far, HECO has pushed back on enabling these customers to circumvent grid charges.
The proposed hybrid tariff attempts to mitigate these clashes.
The February 2020 report also included draft rules addressing a potential scheduled
transition from grid-connected modes to island mode operations of a microgrid (“Island
Mode”), and how it is initiated. As currently drafted, utilities may initiate Island Mode in
response to abnormal conditions present on their system. The Microgrid Resources Coalition
expressed its issue with such language, noting that the microgrid should not be subject to the
discretion of utilities unless a service is compensated for in a contract. Given a main goal of
the MST is grid resiliency, they question whether microgrids should be allowed to connect or
disconnect from the grid at any time. The right to operate dispatch power needs to be
addressed further in discussions.
From a stakeholder engagement standpoint, the Hawaiian microgrid initiatives have, to date,
included involvement from a broad range of affected parties. A member of the Hawaii State
Division of Consumer Advocacy volunteered to lead the working groups for this effort, and
facilitated the meetings and development of deliverables. Many of the other working group
participants were representatives of the state utilities. Other groups such as the Distributed
Energy Resources Council, Renewable Energy Action Coalition of Hawaii, and Energy
Freedom Coalition of America have intervened in the state PUC proceedings on the MST,
which contributed to the formation of the working groups by the Commission.
Hawaii, like Australia, is a prime candidate for microgrid development. The state government
is the source of the technology-specific directive to develop microgrids. However, while
Australian microgrid development is largely driven by recommendations from AEMC reports,
the Hawaiian PUC has given leeway to two working groups to consider the specifics of
market structures and interconnection procedures. HECO, the islands’ largest investor-owned
utility, has proven to be a valuable member of the working groups. HECO has agreed to
sacrifice some of its utility franchise, as customer microgrids are permitted to use their own
infrastructure. HECO and the other stakeholders in the working group must now discuss
compensation and expedited interconnection for hybrid microgrids, which use HECO’s poles
and wires. A key issue will be whether the working group members are able to strike a
balance between fair compensation for reliability, a pressing concern on the islands, and
adequate cost recovery for HECO.
3.7. Case Study Observations and Recommendations
We observe from these case studies that regulatory frameworks can differ, but they share
many of the same regulatory principles we have identified as important. Differences between
frameworks primarily appear in treatment of how incentives are treated for new technologies.
Frameworks we reviewed continue to support the need for consumer protection, fair price
setting for regulated service, and sufficient cost recovery for single-utility market providers in
order for them to attract capital and maintain reliable service.
54 Microgrid Services Tariff Working Groups, “Status Update,” January 9, 2020.
AUC Distribution System Inquiry: Combined Modules Charles River Associates
Page 27
Relative to the current Alberta framework, UK governmental bodies appears to take a more
active role in technology development and piloting, whereas it appears Alberta permits
utilities to be the main decision-maker as to what technology to purchase and for what
purpose. The Albertan regulatory approach is technology-agnostic which we believe best
supports what would develop in an open market environment. That said, this disparity in
treatments highlights the fact that additional regulatory scrutiny as well as reward for sound
and innovative investment decision making may be warranted for Alberta. Since utilities are in
role of decision-makers and risk takers, the framework should reward accordingly while
protecting consumers from unsound investment – a delicate balance to strike. In addition,
Ofgem’s stated goals for RIIO-2 appear to be particularly well suited to support decisions for
new technologies since they emphasize the importance of consumer needs, fair returns for
sound risk taking for utilities, and emphasis on incentives that are closely tied to consumer
trends. We believe these goals are also appropriate for Alberta to consider.
The Australia case study shows that even a technology choice such as a microgrid, which in
some cases can almost entirely replace the need for T&D investment, can still be adequately
addressed within existing regulatory frameworks. The case study reminds us that technology
capabilities and deployment can happen at a faster pace than regulatory framework changes
can fully accommodate. As is the case with UK, the Australian government is taking an active
role in responding to consumer wishes and supporting testing and development of microgrid
rollout as opposed to permitting utilities to take the primary decision-making role. Yet,
AEMC’s plan for consumer protection continue to acknowledge the importance of providing
more options for choice for consumers while ensuring regulated rates for delivery service
where needed, continue to be fair and reasonable.
The Hawaii case study highlights a policy approach in which the state government, through
enactment of enabling legislation, drives a specific set of outcomes to support a specific
technology (microgrids). As we have explained throughout this report, we believe there is a
role for specific policy direction to support an outcome for a technology adoption choice that
may be different in terms of technology or timing of adoption as compared to what open
markets would deliver. The Hawaii approach also includes working group studies and pilot
programs to carefully monitor results and to avoid unintended consequences. We believe this
approach is also in alignment with fundamental regulatory principles. The legislative action in
Hawaii is also an example where government instead of the utility or regulatory sector was
the prime influencer for a specific policy direction for technology.
Throughout the cases, there exists a theme of customer protections, fair pricing, and cost-
based regulated revenue streams for delivery business. Regulatory frameworks are versatile
and can be adapted to emphasize and de-emphasize goals within the overall balance of
recognizing obligation to serve, maintaining fair pricing, and the importance of cost recovery
for single-provider distribution systems. We also observe a consistent recognition of the
importance of stakeholder involvement, including utilities, regulators, advocates, and
customer interests. Facilitating stakeholder involvement ensures diverse perspectives are
represented and consumer protection concerns are represented.
We note there are further regulatory issues should microgrids be allowed and ultimately
developed. Microgrids raise concerns over loss of traditional utility franchise and stranded
network costs. If legacy network costs cannot be recovered from customers defecting to
microgrids, those costs must be recovered from remaining customers (or go unrecovered).
Those customers may then be more likely to develop their own microgrids, leading to what is
AUC Distribution System Inquiry: Combined Modules Charles River Associates
Page 28
referred to as the utility death spiral. There are available approaches to avoid this undesirable
outcome and adhere to principles of cost causation and cost recovery. One measure is to
introduce standby rates as a condition of allowing, and regulating, microgrids. These standby
rates allow for recovery of fixed transmission and distribution investment. Such rates reflect
the fact that the incumbent franchise utility is expected to back up the microgrid, and that the
investments and maintenance to provide that service are not avoided. Also, for certain large
facilities, regulators should consider a stranded cost recovery charge so that remaining
customers do not absorb the costs of stranded assets.
3.8. Network Planning Considerations for Future DFO
An important element of economic regulation of electric utilities, including distribution utilities,
is how network planning is conducted and overseen, and how proposed utility development is
reviewed. In the era of centralized generation, distribution system planning was an exercise in
preparing to serve a one-way supply of dispatchable generation to a set number of
consumers with relatively predictable and ever-increasing consumption patterns. Now, DCG
consumers may return excess electricity to the grid, all customers may have consumption
metered more precisely, and sophisticated ratepayers may switch retail suppliers and control
behavior in response to price or reliability events. Furthermore, expectations for consistent
load growth are no longer the norm. There is also the potential to deploy declining cost
technologies (e.g., battery storage) and to monitor and respond to grid conditions more
precisely. In the face of new technological capabilities, including expanded DERs and vastly
improved communications and information technology capabilities for system planning, it may
be appropriate to revisit distribution planning and oversight. Here, we focus on two ways in
which network planning may evolve: mandated consideration of non-wires alternatives and
increased stakeholder participation.
3.8.1. Non-Wires Alternatives in Network Development
Under the traditional system planning paradigm, the interconnection of additional,
uncontrolled load, or new generation, would generally be met by conventional “poles and
wires” type network upgrades and associated costs. This need no longer be the case. With
proper planning and control technologies, DERs and other non-wires technologies have the
capability to add value to the distribution system and limit the need for and cost of upgrades.
Such technologies may contribute via capabilities in flexible dispatch, voltage support,
frequency regulation, and provision of reserves. Thus, if possible, an effective distribution
planning process should 1) identify future system needs and opportunities, 2) evaluate all
potential options for meeting them, and 3) determine the most valuable/least cost/least risk
solutions.55 Key to this sequence is the evaluation of options for meeting needs, and
ensuring that the utility planners consider the full range of options, including both wires and
non-wires solutions.
55 Carl Linville, “Distribution Planning: Why It Is Changing and What It Is Becoming,” Regulatory Assistance Project,
January 28, 2020.
AUC Distribution System Inquiry: Combined Modules Charles River Associates
Page 29
By way of example, we provide cases in which United States jurisdictions seek to ensure
consideration of non-wires alternatives (“NWA”) as a means of exercising regulatory oversight
towards ensuring that least cost options are achieved via network planning processes.
At a federal level, in Order No. 1000, the U.S. Federal Energy Regulatory Commission
(“FERC”) required regional planners “[w]hen evaluating the merits of such alternative
transmission solutions, public utility transmission providers…must consider proposed
non-transmission alternatives on a comparable basis.”56 Furthermore, if selected as the
efficient, cost-effective solution, the NWA planning solution would be subject to regulated
recovery via regional cost allocation rules.
In New York, the government has issued an NWA directive. Governor Andrew Cuomo’s
flagship Reforming the Energy Vision (“REV”) initiative seeks to “defer or avoid
conventional infrastructure investments by procuring distributed energy resources…that
lower costs and emissions while maintaining or improving system reliability.”57 The REV
web portal allows developers to apply for an NWA procurement in each of New York’s
six investor-owned utility territories.
State regulators in Hawaii criticized HECO’s two-year forward grid planning document,
the 2019 Integrated Grid Plan (“IGP”), for lack of NWA. For example, generation
resources on the Hawai’ian island of Oahu are concentrated on the island’s western side
and are flanked by mountain ranges. The IGP proposed a new substation to serve
housing developments in eastern Oahu instead of “proactively working with distributed
generation developers to make sure those communities are resilient and backed up.”58
New Hampshire utility Eversource has proposed NWA to provide reliability and avoid
distribution upgrades for the town of Westmoreland, New Hampshire. The
Westmoreland Clean Innovation Project, if approved, will feature a 1.7 MW / 7.1 MWh
lithium-ion battery plant. Of note, the plant will cost $7 million, while a distribution circuit
upgrade would have only cost $6 million. Eversource estimates additional $2 million in
long-term savings because of the battery plant’s additional ability to shave peak load.59
In the Canadian context, the Ontarian Independent Electricity System Operator (“IESO”)
launched a small-scale electricity market pilot in York, a region with whose electricity demand
is expected to outstrip its system capability within a decade. IESO intends to connect solar
panels, energy storage, and other DERs to the local distribution network to reduce the need
for expansion of provincial transmission capacity. These resources, once excluded from the
market, will be able to compete to supply power during periods of high demand.60
56 FERC Order No. 1000, para. 148.
57 nyrevconnect.com/non-wires-alternatives/
58 www.utilitydive.com/news/hawaii-regulators-question-lack-of-non-wires-alternatives-in-hecos-integra/560470/
59 www.utilitydive.com/news/eversource-turns-to-non-wires-solution-in-outage-plagued-new-hampshire-town/555370/
60 www.ieso.ca/Corporate-IESO/Media/News-Releases/2019/08/IESO-Demonstration-Project-to-Test-Ontarios-First-
Local-Electricity-Market
AUC Distribution System Inquiry: Combined Modules Charles River Associates
Page 30
3.8.2. Stakeholder Participation in Planning Processes
In developing network plans, either at the transmission or distribution level, concerns arise if
there is an insufficient amount of transparency and openness in the process. This is true both
from the regulatory standpoint, as regulators should be made aware of the reasoning
underlying proposed development plans, but also for other stakeholders, who may provide
valuable insight and need to understand the rationale and fairness of planning processes.
Transparency and openness also serve to limit the burdens of after-the-fact disputes.
In Decision 22942-D02-2019 the Commission expressed certain concerns respecting the
AESO’s oversight of distribution driven transmission facilities:
“The Commission also determined in Decision 2010-606 that although the AESO could
delegate the determination of facilities in excess of GEIP to TFOs, the AESO should retain
final oversight of GEIP and should review and approve any determination prepared under the
delegation. As well, the Commission expected the AESO to develop distribution point of
delivery interconnection process guidelines to support the determination of GEIP. However, in
its response to AESO-AUC-2018NOV01-019(a), the AESO indicated that it did not carry out
any work to establish distribution point of delivery process guidelines following the issuance of
Decision 2010-606.”61
In the United States, FERC has addressed these issues in several landmark orders related to
transmission planning. In 2007, FERC issued Order No. 890, which required all public utility
transmission providers (both ISO/RTO transmission planners as well as non-market utilities)
to adhere to a number of transmission planning principles: including coordination (e.g.,
hosting of meetings related to planning processes), openness (e.g., broad access to planning
meetings), and transparency (e.g. sharing of methodology, criteria, and process). At the time,
FERC reasoned that transmission planning was conducted with limited or no input from
customers or other stakeholders, with no sharing of key assumptions or underlying data.
FERC reasoned:
“…this lack of coordination, openness, and transparency results in opportunities for undue
discrimination in transmission planning. Without adequate coordination and open participation,
market participants have no means to determine whether the plan developed by the
transmission provider in isolation is unduly discriminatory. This means that disputes over
access and discrimination occur primarily after-the-fact because there is insufficient
coordination and transparency between transmission providers and their customers for
purposes of planning.”62
FERC expanded on the objectives of Order No. 890 with Order No. 1000, issued in 2010.
Order No. 1000 required additional reforms to ensure that jurisdictional transmission service
was provided at just and reasonable rates and in a manner that is not unduly discriminatory.
As a key part of the required reforms, Order No. 1000 eliminated the right of first refusal of
existing transmission providers to build all project resulting from regional transmission
planning processes. As part of this change, the order continued and expanded the ability for
third-party developers to submit alternative solutions in the transmission planning process.
FERC required:
61 AUC, “Decision 22942-D02-2019,” September 22, 2019, para. 1136.
62 FERC Order No. 890, para. 425.

AUC Distribution System Inquiry: Combined Modules Charles River Associates
Page 31
“To ensure comparable treatment of all resources, the Commission has required public utility
transmission providers to include in their OATTs language that identifies how they will evaluate
and select among competing solutions and resources. This includes the identification of the
criteria by which the public utility transmission provider will evaluate the relative economics and
effectiveness of performance for each alternative offered for consideration.”63
From U.S. federal precedent, it is clear that FERC has identified stakeholder participation as
a valuable element of network planning processes. The benefits of such participation accrue
in terms of ensuring no undue discrimination, supporting the acceptability of the ultimate rate,
and accounting for a range of possible alternative planning solutions, even if they originate
through the stakeholder process. We recommend that Alberta consider this style of reform,
particularly as electricity networks engage stakeholders in new way and a wider range of
technologies become available to serve future needs.
63 FERC Order No. 1000, para. 315.
AUC Distribution System Inquiry: Combined Modules Charles River Associates
Page 32
4. Rate Design
In this section, we introduce and discuss issues associated with distribution tariff rate design.
Here, we focus on the value of proper price signals to consumers, which in turn will drive
utilities to adapt, including providing appropriate services and facilitating adoption of new
technologies. These signals are, in effect, what are communicated to end consumers through
rates that recover allocated revenue requirements from customer classes. We first present
general principles for distribution tariff rate design. We then discuss the application of those
principles and whether current Alberta DFO tariff structures are consistent with the principles
presented. Where they are not, we discuss what the ramifications might be, and what
changes we might recommend to best align consumer price signals as the Alberta distribution
system evolves.
Consistent with the regulatory principles we set forth in Section 3 associated with regulatory
frameworks, particularly “opportunities for cost recovery,” we work from the assumption that
distribution tariff rates must generally be structured to recover the total distribution utility
revenue requirement. The costs to provide distribution services are mainly fixed costs related
to providing the necessary level of delivery capacity, with limited dependence on system
throughput. Variable costs are primarily related to inconstant operating & maintenance
(“O&M”). 64 Since rates must be designed to recover total embedded system costs, a dollar
that is not collected through one customer or billing component must be recovered from
another customer or billing component.
To ensure consistency and clarity, we will use the same syntax as is used elsewhere in this
proceeding and in other proceedings before the AUC. In terms of customer bill components,
we will focus on distribution-specific changes – though we will reference transmission or
energy charges where appropriate – which include the following:
Fixed charges ($/period): A flat rate billed to a customer per billing period
Demand charges ($/kW): A rate based on a measure of peak customer consumption,
typically based on contract demand, the maximum metered demand during a billing
period, and/or maximum (or percentage of maximum) demand over a longer
measurement period.
Variable charges ($/kWh): A consumption-based rate billed on a per kWh basis
A tariff structure that includes all of the above billing components is referred to as a “three-
part rate.” As distribution infrastructure costs are largely fixed and have only relatively small
variable costs to operate, a cost reflective three-part rate for distribution may have
comparatively larger weighting of demand charges relative to variable charges.
We will also discuss several broad approaches to metering. As we refer to these approaches,
we will assume the following definitions apply:
Net metering: A practice in which the energy supplied to the grid is netted against, or
subtracted from, the energy drawn from the grid. In effect, a single meter may be run
64 To the extent that tariff rates include energy charges and attempt to recover the cost of generation, variable charges
may also include the cost of fuel.
AUC Distribution System Inquiry: Combined Modules Charles River Associates
Page 33
forwards or backwards, should a customer be a net producer at any given time, and the
customer is billed (or credited) for the billing period based only on the net electricity
imported from the grid as measured by the meter. There is no distinction between the
“buy” rate design and the “sell” rate design. Frequently, banking of injection credits is
allowed across billing periods.
Net billing: A metering practice in which a consumer has separate readings, but usually
on the same meter, for periods of consumption from the grid and production to the grid.
The customer’s bill is calculated based on all of the prevailing billing determinants for
periods during which it is consuming from the grid, along with a credit, potentially set at a
distinct “sell” rate, for periods when it is a net supplier to the grid. Thus, during periods
when the customer is not a net supplier but is self-generating some portion of its
demand, it is able to consume from on-site generation and reduce its billing volumes,
and possibly reduce any peak charges. Generally, no banking is allowed across periods.
Buy all / Sell all (“BA/SA”): A practice in which there is no netting of billing permitted
within the retail tariff. All consumption is metered with no adjustment for on-site
generation, and that quantity is used to calculate a customer’s bill. Any and all
generation is metered separately on a separate meter, the “sell” rate applies, and it is
assumed to be “sold” to the grid. The consumer receives a credit for that sale at
whatever the (pre-determined) rate is set to.65 No generation is used to offset
consumption billing determinants.
We recognize that the AUC has already gathered significant stakeholder input on issues of
metering and rate design policy for distributed generation in the Alberta Electric Distribution
System-Connected Generation Inquiry (Exhibit 22534, “DSG Inquiry”). Many of the same
principles and considerations addressed in that inquiry are relevant here. We will reference
the DSG inquiry as appropriate to limit duplication of material. Furthermore, as we did not
participate in that Inquiry, we will note where we agree or disagree with positions taken in that
proceeding.
4.1. Tariff Rate Design Principles
In regulating distribution utilities and designing distribution rates, there are a range of widely
accepted principles that should be applied and balanced. Here, we focus on those signals
experienced by customers. These build on principles put forth in section 3 of this report.
The crux of the following principles for distribution tariff rate design is that rates should be set
to send price signals to permit consumers to accurately evaluate the demand they have for
the unit of service being provided at the price offered, as compared to the value and benefit
they actually receive. A principled distribution tariff rate:
Encourages utility systems to invest to produce up to the point where consumer supply
(units offered and price) and demand (units consumed) are in balance.
65 See, for example, www.nrel.gov/state-local-tribal/blog/posts/back-to-basics-unraveling-how-distributed-generation-is-
compensated-and-why-its-important.html
AUC Distribution System Inquiry: Combined Modules Charles River Associates
Page 34
Avoids wasteful utility investment (excess capacity) and wasteful customer usage (units
priced below marginal costs) because consumers will purchase up to levels they want at
price offered, at least to the extent that customer demand is elastic.
Facilitates consumer decisions as to how to allocate their purchasing power between
utility services and other services or purchases.
Conversely, rate designs that meaningfully depart from these principles may lead to unfair,
inefficient, and generally undesirable outcomes. These concerns are particularly acute in the
context of the propagation of DERs, which have the potential to magnify shortcomings in
existing rate design and lead to significant and unwarranted cost shifts as well as
considerably inefficient short- and long-term outcomes. We present these concerns at a high
level in the following section, and then in detail in section 4.3.
Cost Causation
Rate frameworks should allocate costs to consumers based on cost-causative factors to the
extent possible. That is, to the degree that a particular consumer or set of consumers is
responsible for imposing costs on the system (e.g., by driving the need for system upgrades),
that set of consumers should be responsible for paying those costs. Cost causation supports
both equity (fairness) and efficiency objectives, as aligning assignment of cost with imposition
of cost on the system creates efficient incentives for consumers and protects against
unwarranted costs shifts.
As applied to tariff rate design, cost causation is accounted for both in the division of cost
recovery among customer classes and, more relevant here, how costs are allocated between
fixed, demand, and variable charges. Fixed and demand charges should be designed to
recover the largely-fixed costs of infrastructure investment and the overall capacity of the
distribution system. Variable charges may then be incurred to recover the variable costs
imposed on the system by use, like operation and maintenance expenditures. In the context
of regulated distribution rates, it is therefore understandable that a principle-based distribution
tariff design (not including energy or transmission) would be heavily weighted towards non-
variable billing components given the high fixed cost and low variable cost nature of
distribution infrastructure. 66
As appropriate, the cost causation principle should be weighed against other non-cost
considerations, as discussed more fully below.
Economic Efficiency
Regulatory frameworks, including tariff rate design, should set rates to that drive economically
efficient outcomes. Distribution rates may affect economic efficiency both in how rates reflect
the cost of infrastructure and how they impact energy generation and consumption. Proper
rates will encourage economically efficient levels of consumption. Elements of economic
efficiency that will be relevant for our following discussion include:
66 The same logic applies in the case of transmission infrastructure. However, the fixed vs. variable distinction needs to
be applied carefully, particularly in the context of generation. See, for example, www.raponline.org/wp-
content/uploads/2020/01/rap-lazar-chernick-marcus-lebel-electric-cost-allocation-new-era-2020-january.pdf (pages
78-79).

AUC Distribution System Inquiry: Combined Modules Charles River Associates
Page 35
Static efficiency describes the level of efficiency of the system at a certain point in time.
For electric power systems, this generally pertains to the efficiency of the system on an
operational basis and has two key sub-components:
- Productive Efficiency: Technically defined as being at the lowest point on the
average cost curve. In the context of power markets, productive efficiency refers to
whether the least cost set of resources are selected to serve load during any given
operational period.
- Allocative Efficiency: Whether the allocation of resources – the amount of energy
consumed at any given time – reflects consumers’ wants and needs. Put another
way, whether the marginal price of energy (and the consumers’ willingness to pay)
equals the marginal cost of producing that unit of energy.67
Dynamic efficiency describes whether the system is efficient across time and is most
relevant here in the context of whether there are incentives in place that lead to
appropriate levels of long-run investment to meet customer needs.
If implemented properly, distribution tariff rates may support all of these elements of
economic efficiency, sending utilities signals to invest in facilities and produce up to the level
of requested demand, while leading consumers purchase up to point where costs and value
provided by electric service are in balance. Well-designed rates will limit the incidence of
stranded costs and unneeded, wasteful investments in long-lived assets. Setting prices below
marginal costs should be avoided since both these instances create wasteful use of
resources that results in harmful consequences to consumers.68
Balance of Objectives
Cost Causation and Economic Efficiency are key goals in tariff rate design, but it is our view
that they need be balanced with additional non-cost objectives. While they may entail some
trade-offs that are difficult to quantify, these objectives support tariffs that are effective,
practically implementable, and fair to a wide range of consumer types. These further
objectives include:
Simplicity, ease of understanding, administration, and acceptability: Customers
should be able to understand the rates – and incentives – they face, and those rates
should be publicly acceptable and feasible to apply.
67 Bonbright elegantly states this as “the optimum-use or customer-rationing objective, under which the rates are
designed to discourage the wasteful use of public utility services while promoting all use that is economically justified
in view of the relationships between costs incurred and benefits received.” (Bonbright, page 292)
68 There is a considerable literature around whether distribution rates should reflect the marginal cost of providing
distribution services vs. the embedded cost of providing the service. Technically, rates based on marginal cost (not to
be confused with variable rates) result in more economically efficient outcomes. However, they are likely if not certain
to result in under-recovery on the part of the utility and are therefore difficult to reconcile with principles around cost
recovery and capital attraction. We therefore generally assume that rate levels need to be set on an average cost
basis for our purposes here. For a more fulsome discussion, see, for example, Lazar et al. “Electric Cost Allocation
for a New Era: A Manual”, Regulatory Assistance Project, January 2020, p. 189-195.
AUC Distribution System Inquiry: Combined Modules Charles River Associates
Page 36
Clear of misinterpretation: Relatedly, rates should be unambiguous and not subject to
misinterpretation or controversy. This is of particular concern as the administration of
distribution rates becomes more complicated with the increased prevalence of DERs.
Reasonably granular: While recognizing constraints associated with precisely
identifying cost causation and the value of avoiding overly-complex tariffs, rates should
apportion costs among different customer types.
No undue discrimination: Customers with like cost-to-serve characteristics should not
be treated differently.69
Distribution regulatory frameworks will also generally include considerations for “ability to pay”
and affordability. This concern is based on the fundamental nature of electric energy as an
essential service in the modern world. A tariff rate based purely on cost causation and
economic efficiency principles may result in an undue burden on certain consumer types,
particularly low-income and more cost sensitive consumers. Regulatory frameworks should
recognize these realities and, in a measured way, may design rates to provide concessions to
certain types of consumers. Doing so should not violate principles around cost recovery and
capital attraction; rather, cost shifting to other customer types may be advised.
4.2. General Considerations in Evolving Distribution Systems
4.2.1. Reconsidering Rates in Light of DERs
Particularly for residential customers, regulated distribution tariff rates have traditionally been
designed to minimize fixed and demand charges and to mainly recover customer costs
through the variable components of the billing structure.70 This tended to accomplish several
objectives, particularly encouraging conservation, increasing political palatability, and allowing
opportunities for more cost-sensitive consumers (e.g., low income ratepayers) to reduce their
bill by limiting consumption. However, two-part rates (i.e., rates without demand charges)
ignore the fact that a customer’s peak demand drives the level of fixed costs a utility must
incur to meet delivery needs. Fixed costs cannot be reliability collected from a variable based
rate component except in some limited circumstances. This problem is particularly acute
when considering certain rate designs for DERs.
The trend of cost recovery via variable rates at the residential and small commercial rate tiers
is evident from a review of current Albertan rates, shown in Exhibit 4. Historically, demand
charges were not common for smaller customers, owing to the need for advanced metering
capabilities that would allow the measurement of peak customer usage. Such metering
infrastructure was limited to larger commercial and industrial customers. This need no longer
be the case. For example, Fortis states that “FortisAlberta plans to exchange all current
69 James C. Bonbright, “The Role of Public Utility Rates,” New York, Columbia University, first edition, 1961 p. 291.
70 To reiterate, we continue to focus here on the distribution component of customer bills, as distinguished from
transmission rates, rates for energy commodity, and the several other riders that are faced by Alberta consumers.
However, it is our understanding that many of these other components of the ultimate customer rate are also heavily
weighted towards variable charges.
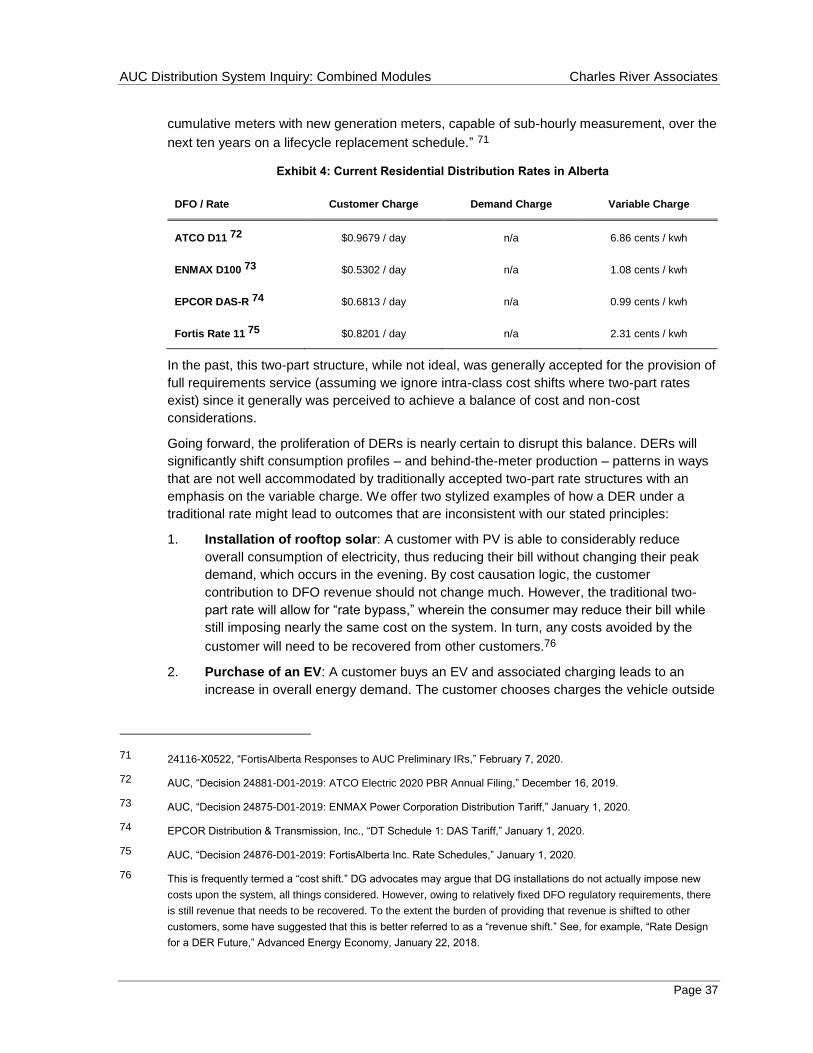
AUC Distribution System Inquiry: Combined Modules Charles River Associates
Page 37
cumulative meters with new generation meters, capable of sub-hourly measurement, over the
next ten years on a lifecycle replacement schedule.” 71
Exhibit 4: Current Residential Distribution Rates in Alberta
DFO / Rate Customer Charge Demand Charge Variable Charge
ATCO D11 72 $0.9679 / day n/a 6.86 cents / kwh
ENMAX D100 73 $0.5302 / day n/a 1.08 cents / kwh
EPCOR DAS-R 74 $0.6813 / day n/a 0.99 cents / kwh
Fortis Rate 11 75 $0.8201 / day n/a 2.31 cents / kwh
In the past, this two-part structure, while not ideal, was generally accepted for the provision of
full requirements service (assuming we ignore intra-class cost shifts where two-part rates
exist) since it generally was perceived to achieve a balance of cost and non-cost
considerations.
Going forward, the proliferation of DERs is nearly certain to disrupt this balance. DERs will
significantly shift consumption profiles – and behind-the-meter production – patterns in ways
that are not well accommodated by traditionally accepted two-part rate structures with an
emphasis on the variable charge. We offer two stylized examples of how a DER under a
traditional rate might lead to outcomes that are inconsistent with our stated principles:
1. Installation of rooftop solar: A customer with PV is able to considerably reduce
overall consumption of electricity, thus reducing their bill without changing their peak
demand, which occurs in the evening. By cost causation logic, the customer
contribution to DFO revenue should not change much. However, the traditional two-
part rate will allow for “rate bypass,” wherein the consumer may reduce their bill while
still imposing nearly the same cost on the system. In turn, any costs avoided by the
customer will need to be recovered from other customers.76
2. Purchase of an EV: A customer buys an EV and associated charging leads to an
increase in overall energy demand. The customer chooses charges the vehicle outside
71 24116-X0522, “FortisAlberta Responses to AUC Preliminary IRs,” February 7, 2020.
72 AUC, “Decision 24881-D01-2019: ATCO Electric 2020 PBR Annual Filing,” December 16, 2019.
73 AUC, “Decision 24875-D01-2019: ENMAX Power Corporation Distribution Tariff,” January 1, 2020.
74 EPCOR Distribution & Transmission, Inc., “DT Schedule 1: DAS Tariff,” January 1, 2020.
75 AUC, “Decision 24876-D01-2019: FortisAlberta Inc. Rate Schedules,” January 1, 2020.
76 This is frequently termed a “cost shift.” DG advocates may argue that DG installations do not actually impose new
costs upon the system, all things considered. However, owing to relatively fixed DFO regulatory requirements, there
is still revenue that needs to be recovered. To the extent the burden of providing that revenue is shifted to other
customers, some have suggested that this is better referred to as a “revenue shift.” See, for example, “Rate Design
for a DER Future,” Advanced Energy Economy, January 22, 2018.
AUC Distribution System Inquiry: Combined Modules Charles River Associates
Page 38
of peak hours. In this manner, the customer’s payments for distribution service
increase significantly with little, if any, increase in fixed distribution costs (the
customer’s increased energy load would mostly impact fuel and volumetric O&M.)
Under a traditional, non-EV rate this customer may wind up paying more than their fair
allocation (under cost causation logic) of the DFO’s revenue requirement, especially in
the near-term. Proper rate design can send signals to an EV owner to charge at times
that, in aggregate, limit the need for system expansion to serve peak demand, thereby
avoiding additional system costs imposed by EVs.
While more complex examples could be assembled, the conclusion remains the same:
continuing under the traditional variable-rate-focused structure is likely to lead to outcomes
that are inconsistent with a principled approach to rate design.77 In the two examples above,
we show one example where existing costs are bypassed, and another where there need to
be appropriate signals in place to avoid imposition of additional expansion needs on the
system.
The key responsive design change that we recommend, specifically for those residential and
small commercial customers with on-site generation (including storage) and/or an EV, is a
shift from rate structures that place an emphasis on variable rate components to rates that
recover a larger portion of DFO costs through corresponding demand charges.78 For
example, the subset of residential and small commercial rate class customers with on-site
generation and/or EV could be subject to rates that reflect 1) recovery of lost revenue arising
from fixed and demand costs associated with on-site use, and 2) any additional demand
costs associated with EV. Such rates may also be designed to provide time of use price
signals. The resulting rates would better align price signals with actual costs, increase
efficiency of price signals, increase uniformity of design across customer classes, and
increase rate stability for utilities (and consumers) as DERs become more prevalent.79
Distribution tariff design for ongoing system use is not the only important price signal
experienced by DER customers, and particularly those installing DCG. Consideration of
ongoing tariff rate charges alone may have limited meaning, particularly in cases where
investments have already been made. As pointed out by FortisAlberta, it is at least as
important to consider the DFO’s customer contribution policy at the time of connection when
thinking about incentives for effective capital deployment.80 We concur that customer
contribution policy is key to “provision of an effective incentive for a customer (and DFO) to
size the service capacity appropriately and deploy the associated capital occurs at the time of
connection in response to the DFO’s customer contribution (or investment) policy contained
77 Such outcomes under traditional structures can be generalized as likely to shift costs from customers with lower load
factors (e.g., customer that has installed DG) to those with higher load factors (e.g., customer that operates an EV).
78 While we are focused here on distribution rates, we recommend the same change be made for transmission rates,
as the same logic applies for applicable transmission fixed costs.
79 A more complete introduction to three-part rates can be found here:
files.brattle.com/files/7137_curating_the_future_of_rate_design_for_residential_customers.pdf
80 24116-X0522, “FortisAlberta IR Responses,” February 7, 2020, pg. 3-6.
AUC Distribution System Inquiry: Combined Modules Charles River Associates
Page 39
within its Commission-approved tariff.”81 We generally agree, and would support policies that
allow direct costs imposed by new DER resources to be experienced by the customers that
cause those costs. This is supportive to both cost causality and dynamic efficiency goals.82
However, we do not agree that design of monthly rates is not also important to capital
deployment; a DER customer should be expected to make an investment decision in a DER
capability based on both the up-front contribution cost and the expected ongoing costs or
savings associated with the investment.
It is worth further distinguishing between incentives experienced by existing resources that
represent already-deployed capital and prospective, and new resources (those discussed
above). For existing resources, key decisions have already been made based on historically
prevailing rate and cost allocation structures. We concur in part with Fortis that, once capital
has been deployed, the rate structure may be “more about determining the appropriate
means of cost recovery rather than providing any incentive(s) to deploy (or not deploy)
capital.”83 We would add that rate design may also provide signals to promote desirable
operational decisions. Thus, for these resources, the focus should be on fair allocation of
system costs and incentives to act in a manner that facilitates economically efficient
operation. This is largely achieved via ongoing incentives communicated via consumption
rates, like demand and variable charges.
4.2.2. Managing Impacts of Rate Reform
Shifting emphasis in distribution rate design to three-part rates – for residential customers
with DCG and/or EVs – is not without consequences. Limiting the amount of a customer bill
that can be avoided reduces incentives for conservation, investments in energy efficiency,
and deployment of DCG. We would argue that, strictly speaking, any reduced incentives
would be consistent with a strict view of allocative economic efficiency.84 We also recognize,
though, that conservation, increased energy efficiency investments, and/or deployment of DG
may be policy priorities of a given jurisdiction. Accordingly, a regulator acting in line with a
policy priority may elect to limit the extent to which rates are shifted to truly reflect fixed vs.
variable costs, but should do so understanding the incentives and distortions they are
creating.
In addition to shifting going-forward incentives, adjustments to distribution rates to emphasize
fixed and demand charges can affect customers who have made EE or DCG investments
under the expectation of a certain rate structure. Particularly in the DCG case, changes in
rate structure have the potential to reduce the benefit of such sunk investments, potentially
prolonging or eliminating payback periods. This concern could be ameliorated by
implementing gradual rate structure changes or grandfathering certain legacy rates to certain
customers. Accommodations for grandfathering and transition periods should be balanced
81 24116-X0522, “FortisAlberta IR Responses, February 7, 2020, pg. 5.
82 We discuss approaches to addressing these issue in a locational pricing context in section 4.4.
83 24116-X0522, “FortisAlberta IR Responses,” February 7, 2020, pg. 4.
84 For example, variable distribution rates in excess of actual marginal cost of providing distribution service would
incent energy conservation beyond levels that are efficient. Consumers would reduce energy demand in response to
price signals that over-state the cost of providing the next unit of energy.
AUC Distribution System Inquiry: Combined Modules Charles River Associates
Page 40
with the fact that such shifts may be warranted based on cost factors and principled rate
design considerations.
The other frequent and understandable concern raised in the context of shifts away from
variable rates is the impact on low use customers or those that are particularly cost sensitive.
Shifts away from variable rate structures and towards rate structures focused on fixed or
demand charges (that usually reflect cost imposed by the average user of a current class)
make it harder to manage utility costs for low income ratepayers, as reducing consumption
has a diminished effect on utility bills. Importantly, customers that do not have DCGs and/or
EVs do not raise the same level concerns about rate bypass and the need for price signals
that are better aligned with cost causation. For these reasons, we recommend that only the
subset of residential and small commercial customers with on-site generation and/or EV be
subject to the tariff reforms that we are suggesting here. This approach allows legacy rates to
continue to be available to many residential and small commercial customers while also
modernizing tariff structures in Alberta and improving cost accountability for customers with
on-site generation and/or EVs, including those with storage installations.
4.2.3. Metering and Billing Approaches for Distributed Generation
When discussing distribution rates, it is unavoidable to discuss how DCG is metered and
accounted for in bills, and therefore how they are compensated for services provided. As
presented under heading 0 above, the primary suite of options includes net metering, net
billing, and buy all / sell all (“BA/SA”). We recognize that the AUC has already gathered
significant stakeholder input on issues of metering and rate design policy, particularly via the
Alberta Electric Distribution System-Connected Generation Inquiry (“DSG Inquiry”, final report
issued December 29, 2017). We further understand that a clear policy towards net billing has
been stated under Micro-generation Regulation.85 Thus, we will keep our comments here
brief.
Based on our experience, the positions of the respective parties in the DSG Inquiry are
consistent with what we would expect. DCG proponents are understandably supportive of net
metering as a helpful mechanism for stimulating DCG growth.86 On the other hand, the
AUC’s final report in the proceeding succinctly lays out the arguments against net metering,
presenting the DFO’s position as follows:
…net metering would result in DCG customers not paying for all of their share of the
distribution costs that they are using. These DCG customers rely on the distribution system for
the delivery of electrical energy when their DCG unit is unable to generate (for example, at
night and when it is cloudy for solar DCG or when the wind is not blowing for wind DCG) and in
doing so, experience the same levels of reliability enjoyed by all customers connected to the
distribution system. If these DCG customers are only billed on the basis of net generation, non-
DCG customers, who are often less affluent Albertans who cannot afford or have the
opportunity to install DCG on their homes, are paying costs caused by the DCG customers.87
85 AUC, “Alberta Electric Distribution System-Connected Generation Inquiry,” December 29, 2017, para. 221.
86 AUC, “Alberta Electric Distribution System-Connected Generation Inquiry,” December 29, 2017, para. 230.
87 AUC, “Alberta Electric Distribution System-Connected Generation Inquiry,” December 29, 2017, para. 228.
AUC Distribution System Inquiry: Combined Modules Charles River Associates
Page 41
We generally agree regarding the cost shifts inherent in net metering.88 We concur that the
result is a rate structure that is inconsistent with principles, particularly cost causation and
economic efficiency. Net metering threatens to allow customers who install DCG resources to
avoid costs that are nonetheless incurred by the DFO to provide service on which they will
rely; customers both rely on the distribution system when the DCGs are not generating, and
also rely on the distribution system to facilitate export during periods when DCG production
exceeds demand. Furthermore, by overstating the value of generation behind the meter, net
metering threatens both static efficiency and dynamic efficiency. DCG may operate when it is
inefficient to do so (for non-renewable DCG with meaningful operational costs, like fuel) and
long-term investment decisions would then reflect artificially high perceived variable value of
energy. 89
We further agree that a net billing approach relieves some of the concerns raised by net
metering and is therefore a reasonable approach. Net billing reduces the ability of DCG
customers to bypass the cost of DFO and transmission service provided on their behalf.
Furthermore, net billing limits, but does not eliminate, the ability of DCG customers to receive
compensation for self-generation in excess of its value. If there are multiple variable
components of a customer utility bill, the perceived value of energy generated, up to the point
where the customer reaches a net grid injection, would be equal to the sum of all of the
variable components. Should this include transmission, distribution, and other rider-type
variable rate components, this is likely to significantly overstate the actual value of generation
and lead to cost shifts.90
To relieve the remaining shortcomings of a net billing approach, the solution is
implementation of three-part rates that better reflect and more closely track the split between
fixed, demand, and variable charges on the basis of cost causation. As described throughout
this report, this achieves several objectives. Establishing peak-based demand charges, that
reflect the infrastructure costs to serve the consumer’s peak load, can send effective and fair
signals about the burden that the consumer is placing on the distribution system, and
therefore should be responsible for. These costs should not be bypassable simply by
reducing the total volume of energy consumed. Adjusting variable rates (downward) to reflect
the limited proportion of distribution network costs that are actually a function of energy
throughput is both cost reflective and eliminates the effective overstatement of value from
DCG production.
88 These cost shifts and the inherent subsidy in net metering were also pointed out by Dr. Tabors in his Module One
Evidence (24116-X0167, “CCA Evidence of Dr. Richard Tabors,” July 17, 2019, para. 16)
89 It is noteworthy that AltaLink pointed out that the same considerations apply for net metering in the context of
transmission charges, which seek to recover largely fixed cost assets primarily through variable rates. (DSG Inquiry
Report at P 229) We agree with this point and add that transmission tariff rate structure, as reflected in customer
bills, may warrant reforms that use the same logic as that applied for DFO rates.
90 This is only true to the extent that transmission and distribution rate design has not been modified to a cost-reflective
three-part tariff rate.
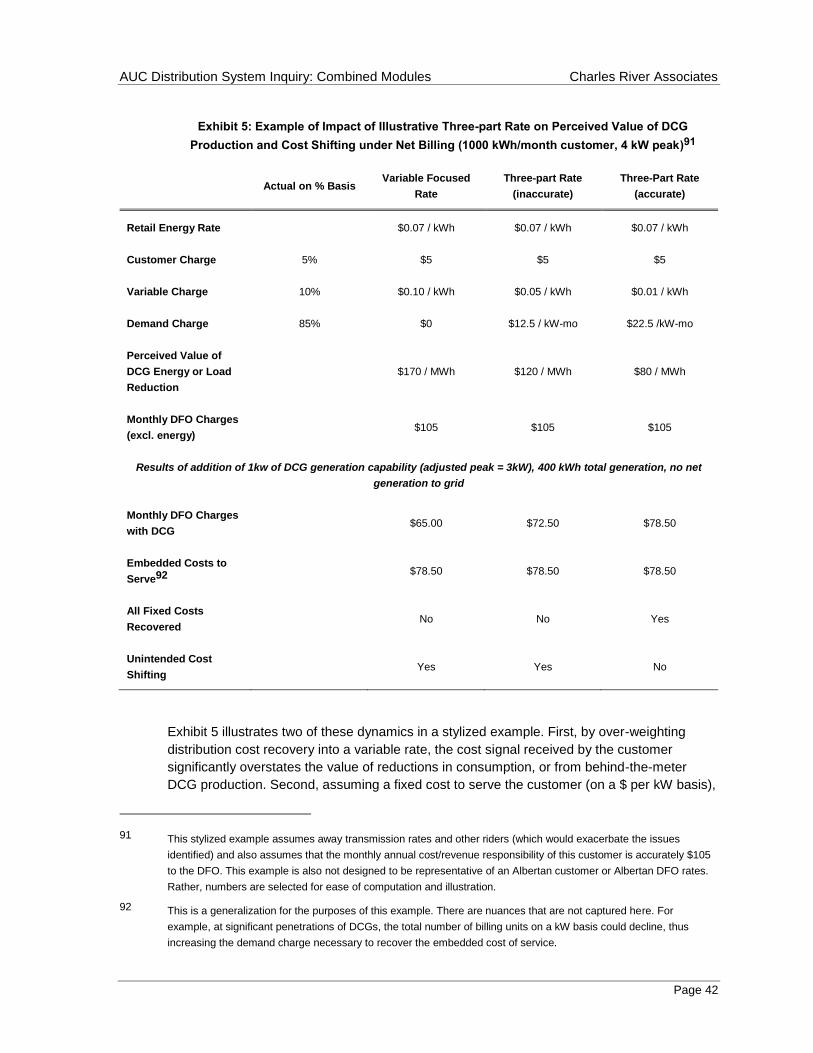
AUC Distribution System Inquiry: Combined Modules Charles River Associates
Page 42
Exhibit 5: Example of Impact of Illustrative Three-part Rate on Perceived Value of DCG
Production and Cost Shifting under Net Billing (1000 kWh/month customer, 4 kW peak)91
Actual on % Basis Variable Focused
Rate
Three-part Rate
(inaccurate)
Three-Part Rate
(accurate)
Retail Energy Rate $0.07 / kWh $0.07 / kWh $0.07 / kWh
Customer Charge 5% $5 $5 $5
Variable Charge 10% $0.10 / kWh $0.05 / kWh $0.01 / kWh
Demand Charge 85% $0 $12.5 / kW-mo $22.5 /kW-mo
Perceived Value of
DCG Energy or Load
Reduction
$170 / MWh $120 / MWh $80 / MWh
Monthly DFO Charges
(excl. energy) $105 $105 $105
Results of addition of 1kw of DCG generation capability (adjusted peak = 3kW), 400 kWh total generation, no net
generation to grid
Monthly DFO Charges
with DCG $65.00 $72.50 $78.50
Embedded Costs to
Serve92 $78.50 $78.50 $78.50
All Fixed Costs
Recovered No No Yes
Unintended Cost
Shifting Yes Yes No
Exhibit 5 illustrates two of these dynamics in a stylized example. First, by over-weighting
distribution cost recovery into a variable rate, the cost signal received by the customer
significantly overstates the value of reductions in consumption, or from behind-the-meter
DCG production. Second, assuming a fixed cost to serve the customer (on a $ per kW basis),
91 This stylized example assumes away transmission rates and other riders (which would exacerbate the issues
identified) and also assumes that the monthly annual cost/revenue responsibility of this customer is accurately $105
to the DFO. This example is also not designed to be representative of an Albertan customer or Albertan DFO rates.
Rather, numbers are selected for ease of computation and illustration.
92 This is a generalization for the purposes of this example. There are nuances that are not captured here. For
example, at significant penetrations of DCGs, the total number of billing units on a kW basis could decline, thus
increasing the demand charge necessary to recover the embedded cost of service.
AUC Distribution System Inquiry: Combined Modules Charles River Associates
Page 43
installation of a DCG asset is likely to lead to under-recovery of costs to serve the customer,
and those costs are then likely to be shifted and recovered from other customers, leading to
inequities.
Having discussed net metering and net billing, a third option is BA/SA, in which there is no
need to manage netting of consumption or production. Rather, all consumption is metered
and billed based on a gross basis, and all generation is metered and assumed to be sold at
the prevailing sell rate, which may be fixed or variable. BA/SA requires a separate production
meter to be associated with the generator (which may be a considerable expense). BA/SA
has the benefit of being transparent and simple, potentially more so than a net billing
approach, while minimizing cross-subsidization issues. Sell rate billing components
associated with energy sales may also be adjusted outside of a rate case to reflect changing
market conditions over time. BA/SA still requires assessment of the costs (or credits)
associated with using the distribution system, and is still vulnerable to over- or under-stating
the value of generation if these costs are not cost reflective. We could also support a BA/SA
approach to metering, though most of the benefits can be achieved via a well-structured net
billing approach, which is already the Alberta standard.
4.2.4. Overlaying Policy Decisions on Principled Rates
Distribution tariff design should achieve goals that are constrained to the principled regulation
of distribution infrastructure and associated cost recovery, as we have described. Though
rates may, by coincidence, be structured such that they have the consequence of promoting
certain outcomes, we advise a more purposeful approach. For example, a policy of net
metering is likely to promote development of distributed generation by overstating the value of
that generation to the end user, thereby improving the economics of self-generation and DG
installation. While such outcomes may be consistent with broader policy goals (e.g.,
deployment of rooftop PV solar, or clean energy generation more generally), they may also
have unintended consequences, like also promoting behind-the-meter backup diesel
generators. To the extent that end-use customer electricity rates are to be used as tools to
achieve policy objectives, there are appropriate, targeted mechanisms available.
Separate mechanisms designed to promote certain policy outcomes can be more precise,
more transparent, and less likely to produce unintended costs shifts. A common example is a
feed-in-tariff (“FIT”), wherein a volumetric adder for certain distributed generation
technologies is provided for every kWh generated or injected to the grid, depending on policy
design and whether a net metering or BA/SA structure is in place. Such a policy has a range
of advantages, including:
The rate may be adjusted over time in response to policy decisions or other
determinations, and such changes may be made outside a rate case;
The incentive may be targeted at certain types of generation. For example, distributed
clean energy technologies may be allowed to participate, while emitting technologies
may be excluded;
The particular incentive is transparent and not bundled in with broader rate design
determinations;
Costs may be allocated transparently and in a manner reflecting the benefits achieved
by the policy. For example, policies to reduce emissions and improve environmental
AUC Distribution System Inquiry: Combined Modules Charles River Associates
Page 44
quality may be allocated broadly to all ratepayers (via a surcharge) or even to taxpayers,
if credits are funded outside of utility rates. This also avoids unintended costs shifts, like
those inherent in a net metering approach.
FIT structures are not the only mechanisms available to drive certain outcomes, nor is clean
energy development the only type of outcome that may be promoted. To support certain
types of DERs, regulators and policymakers may consider mechanisms like direct financial
incentives (rebates and tax credits), low-interest financing programs, and streamlined
interconnection processes.93 Certain types of utility initiatives (e.g., microgrids or EV charging
network development) may be supported through funding of pilot programs, guaranteed cost
recovery, or revenue decoupling. At a higher level, certain outcomes may be achieved
through clean electricity standards or emissions pricing schemes.
4.3. Applicability to Current Structures
This section aims to apply our stated principles in the context of the DERs under
consideration in the AUC’s Distribution System Inquiry. We will assess where, in our view,
principles are being applied properly, and where there is room for improvement. As a guide,
we will reference the resource configurations laid out in the AUC’s information requests of
November 29, 2019. We will also provide examples from current, publicly-available Alberta
DFO tariff sheets, though we will not attempt to critique every tariff schedule.
4.3.1. DCG Rates – Small Micro-generation
In its preliminary IRs to all parties, the AUC describes the rate treatment of a small micro-
generation (<150 kW) subject to the Micro-generation Regulation. For small micro-
generators, we understand that a net billing structure is in place and there must be, at least,
separate registers for recording consumption from the grid and generation to the grid. There
is no metering required for energy consumed on site, and there is no requirement for interval
metering such that the timing of generation or consumption is a factor in billing. This metering
arrangement is necessary and sufficient to facilitate a basic net billing approach. In the
example provided, there is a symmetric credit available for any net generation equivalent to
the energy charge. Generally, there are no customer-specific contributions required by the
DCG customer to fund metering, settlement, or interconnection costs.94
93 www.usaid.gov/sites/default/files/documents/1865/68469.pdf
94 24116-X0470, “AUC Preliminary IRs to All Parties,” November 29, 2019, pg. 4-6.
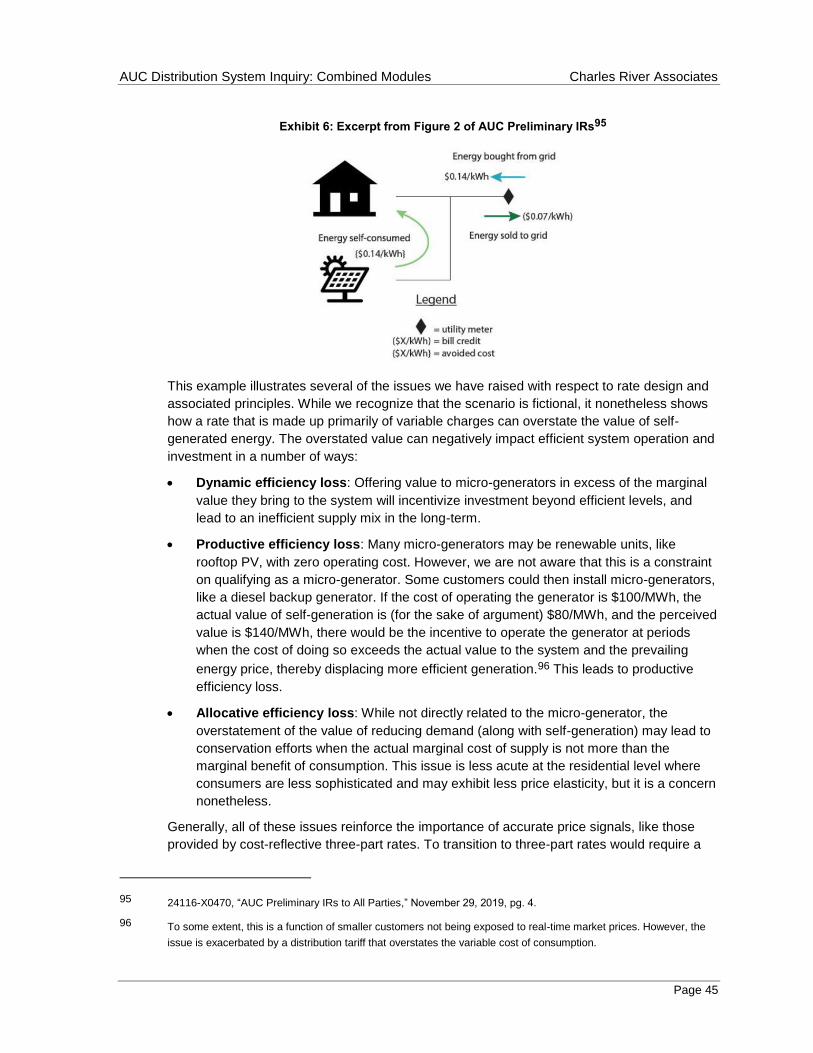
AUC Distribution System Inquiry: Combined Modules Charles River Associates
Page 45
Exhibit 6: Excerpt from Figure 2 of AUC Preliminary IRs95
This example illustrates several of the issues we have raised with respect to rate design and
associated principles. While we recognize that the scenario is fictional, it nonetheless shows
how a rate that is made up primarily of variable charges can overstate the value of self-
generated energy. The overstated value can negatively impact efficient system operation and
investment in a number of ways:
Dynamic efficiency loss: Offering value to micro-generators in excess of the marginal
value they bring to the system will incentivize investment beyond efficient levels, and
lead to an inefficient supply mix in the long-term.
Productive efficiency loss: Many micro-generators may be renewable units, like
rooftop PV, with zero operating cost. However, we are not aware that this is a constraint
on qualifying as a micro-generator. Some customers could then install micro-generators,
like a diesel backup generator. If the cost of operating the generator is $100/MWh, the
actual value of self-generation is (for the sake of argument) $80/MWh, and the perceived
value is $140/MWh, there would be the incentive to operate the generator at periods
when the cost of doing so exceeds the actual value to the system and the prevailing
energy price, thereby displacing more efficient generation.96 This leads to productive
efficiency loss.
Allocative efficiency loss: While not directly related to the micro-generator, the
overstatement of the value of reducing demand (along with self-generation) may lead to
conservation efforts when the actual marginal cost of supply is not more than the
marginal benefit of consumption. This issue is less acute at the residential level where
consumers are less sophisticated and may exhibit less price elasticity, but it is a concern
nonetheless.
Generally, all of these issues reinforce the importance of accurate price signals, like those
provided by cost-reflective three-part rates. To transition to three-part rates would require a
95 24116-X0470, “AUC Preliminary IRs to All Parties,” November 29, 2019, pg. 4.
96 To some extent, this is a function of smaller customers not being exposed to real-time market prices. However, the
issue is exacerbated by a distribution tariff that overstates the variable cost of consumption.
AUC Distribution System Inquiry: Combined Modules Charles River Associates
Page 46
rate study. The primary results would be that a meaningful fraction of variable charges would
be repriced into a demand billing component.
When considering expanding and updating network service demand charges, it is important
to carefully design how demand billing units are measured. Broadly speaking, demand
charge may be measured based on customer demand at the system coincident peak (“CP”)
or some other measure, usually a variation of non-coincident peak (“NCP”). Our observation
is that applying demand charges based on system CP97 is an arrangement susceptible to
gaming; sophisticated customers (with the help of energy service providers) may be able to
manage measurement of demand during CP. Furthermore, customer usage during system
coincident peak may not coincide with the level of investment deployed with the DFO to
support customer needs.98 We recommend assessing peak demand on a NCP basis, or on a
hybrid basis.99 A hybrid can reflect the notion that networks are generally planned for high
use periods, while also considering that specific network loading during those periods is
unpredictable and gaming should be discouraged. A hybrid example would be if customer
demand were measured based on the highest monthly demand between 4pm and 8pm on
weekdays.
Another consideration is the particulars of the sell-rate for net generation. A buy-rate for a
standard residential customer may reflect the weighted average of the cost to deliver energy
across all hours of a period (though such structures can vary across competitive suppliers). A
sell-rate, to provide more accurate price signals to generators, may be structured more
granularly as rate structures evolve. For example, if the expectation is that most DCG
customers will be installing solar generation, sell-rates could be calculated to reflect the
historical or expected market price during daytime hours. Depending on metering available,
like for large micro-generators, sell-rates could be made even more dynamic. Taking into
account such factors in sell rate formulation has the potential to overcome some of the
inefficiencies associated with DCGs, particularly given that they do not actively participate in
the wholesale market and are not subject to the time-varying wholesale price. However,
improving sell-rate formulation needs to be balanced against the distortions associated with
asymmetric buy- and sell-rates, as described below.
As both buy- and sell-rates evolve, particularly if more temporal (or locational) precision may
be introduced on both sides, there is value in eventually converging to a symmetric rate. The
virtue in conveying symmetric signals between buying and selling also ties back to the need
97 The 12 CP method is presently used to allocate transmission bulk system costs to DTS customers and, DFO’s
include bulk system costs as a component of distribution tariffs.
98 When a customer avoids usage on CP, embedded costs for facilities to serve CP must be recovered from remaining
customers; over the longer term however, if the customer consistently is able to avoid causing demand on CP and
does not in effect, simply shift CP to create another system peak at a different time, it is possible future system CP
related investment may be deferred.
99 This is already practice in some Alberta customer rates. For example, for Small General Service (Rate 41)
FortisAlberta defines demand for distribution capacity based on the greatest of: (1) the highest Metered kW Demand
in the billing period; (2) 85% of the highest Metered Demand in the past 12 months including and ending with the
billing period, less 50 kW; (3) the Contract Minimum Demand as specified by the Terms and Conditions; or (4) the
Rate Minimum of 3 kW.

AUC Distribution System Inquiry: Combined Modules Charles River Associates
Page 47
to accurately convey the cost of consumption, and value of production or curtailment, to
consumers via tariff rates. Experts from MIT express this concept well:
“If these prices and charges are not symmetrical, incentives can be significantly distorted. For
example, if exports of power are compensated at a lower rate than withdrawals or consumption
of power at the same location and time, then a generator that is individually metered and
exporting power will earn less than a behind-the-meter generator at the same location, despite
having the exact same value to the power system. Similarly, a megawatt-hour of demand
reduction behind the meter would see greater economic value than a megawatt-hour of
injection from a generator at the same location. These kinds of distortions should be minimized
in order to put all resources on a level playing field and avoid inefficient regulatory arbitrage
opportunities.”100
More concerning than the current small micro-generation sell-rate itself is how the costs
associated with those rates are recovered. As described by the AUC in its preliminary IRs,
credits for the sell-rate for small DCG customers are set by each customer’s energy service
provider. Revenues from those rates are then flowed through to the Alberta Electric System
Operator (“AESO”), which collects sufficient revenue to compensate the energy service
providers via the transmission tariff. There is no regulatory review of these rates, the AESO
has no influence over the agreed-to rate, and the energy service providers bear no risk for the
agreed-to sale price. 101 Indeed, the energy service provider may benefit from selling
electricity at an above-market rate during periods when micro-generators are not offering,
while passing the cost of what is effectively an above-market incentive on to other
(transmission) ratepayers. These outcomes are significantly concerning for a range of
reasons, not least because there is insufficient oversight of a utility cost ultimately borne by
customers, and potential exists for significant economic efficiency losses by offering above-
market rates with no countervailing benefit to the system.
We note that there are limited provisions for passing metering, settlement, or interconnection
costs to customers that install DCG. This may be an explicit policy choice to support micro-
generation. This approach, however, may mask the true cost to consumers of installing DCG,
threatening both the principles of cost causation and economic efficiency, while also
potentially leading to cost shifting from those customers that install DCG to those who do not.
We also have concerns about the treatment of micro-generators – and DERs more generally
– in the context of principles that support tariffs that are easy to understand and clear of
misinterpretation. While the AUC’s description of the treatment of micro-generators and other
customer configurations is quite clear, we struggled to derive the same understanding from
the various applicable DFO tariffs and regulations. There is no separate tariff for such
resources, and we were unable to easily identify the net billing sell rate.102 This should be
remedied. We would suggest, at least, specific DCG tariffs for residential and commercial
customers with DCG resources installed that clearly lay out the metering, billing, and
settlement rules for such resources. As described above, we also recommend that the
100 Pérez-Arriaga and Knittel, “Utility of the Future Full Report,” Massachusetts Institute of Technology, pg. 77, 2016.
101 24116-X0470, “AUC Preliminary IRs to All Parties,” November 29, 2019, pg. 13.
102 This problem is evident to us due to the fact there were instances in which the descriptions in the IRs needed to be
clarified by intervening DFOs.
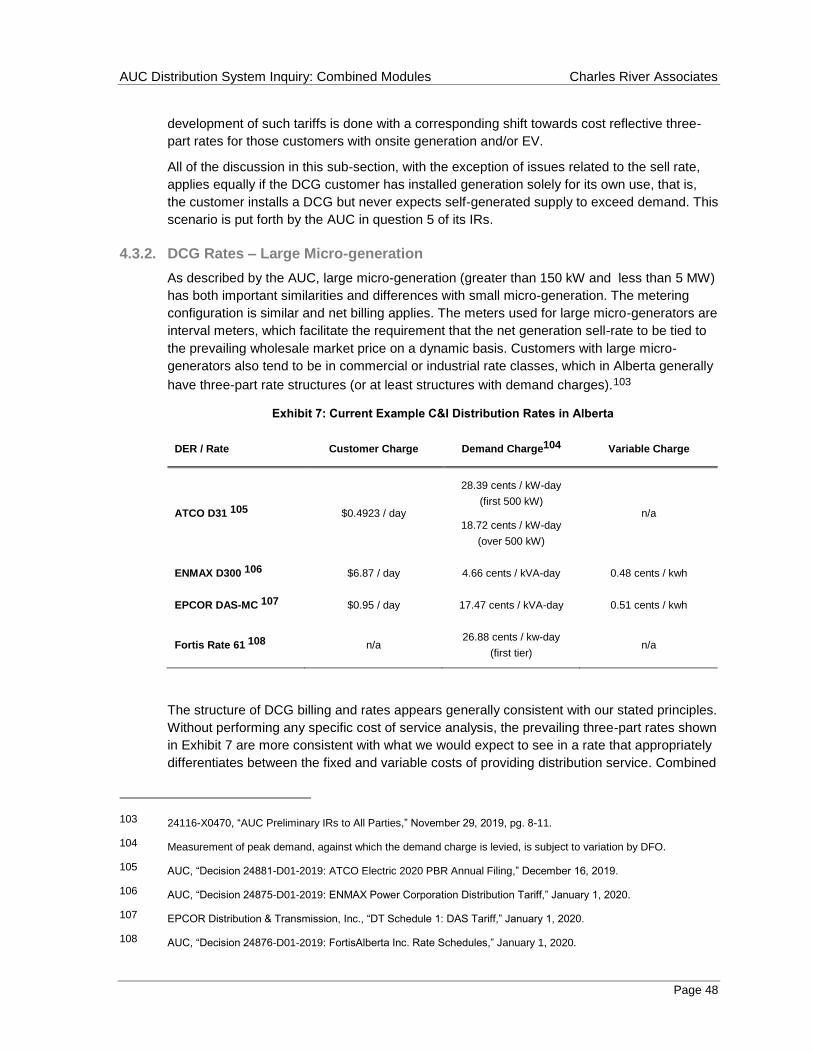
AUC Distribution System Inquiry: Combined Modules Charles River Associates
Page 48
development of such tariffs is done with a corresponding shift towards cost reflective three-
part rates for those customers with onsite generation and/or EV.
All of the discussion in this sub-section, with the exception of issues related to the sell rate,
applies equally if the DCG customer has installed generation solely for its own use, that is,
the customer installs a DCG but never expects self-generated supply to exceed demand. This
scenario is put forth by the AUC in question 5 of its IRs.
4.3.2. DCG Rates – Large Micro-generation
As described by the AUC, large micro-generation (greater than 150 kW and less than 5 MW)
has both important similarities and differences with small micro-generation. The metering
configuration is similar and net billing applies. The meters used for large micro-generators are
interval meters, which facilitate the requirement that the net generation sell-rate to be tied to
the prevailing wholesale market price on a dynamic basis. Customers with large micro-
generators also tend to be in commercial or industrial rate classes, which in Alberta generally
have three-part rate structures (or at least structures with demand charges).103
Exhibit 7: Current Example C&I Distribution Rates in Alberta
DER / Rate Customer Charge Demand Charge104 Variable Charge
ATCO D31 105 $0.4923 / day
28.39 cents / kW-day
(first 500 kW)
18.72 cents / kW-day
(over 500 kW)
n/a
ENMAX D300 106 $6.87 / day 4.66 cents / kVA-day 0.48 cents / kwh
EPCOR DAS-MC 107 $0.95 / day 17.47 cents / kVA-day 0.51 cents / kwh
Fortis Rate 61 108 n/a 26.88 cents / kw-day
(first tier) n/a
The structure of DCG billing and rates appears generally consistent with our stated principles.
Without performing any specific cost of service analysis, the prevailing three-part rates shown
in Exhibit 7 are more consistent with what we would expect to see in a rate that appropriately
differentiates between the fixed and variable costs of providing distribution service. Combined
103 24116-X0470, “AUC Preliminary IRs to All Parties,” November 29, 2019, pg. 8-11.
104 Measurement of peak demand, against which the demand charge is levied, is subject to variation by DFO.
105 AUC, “Decision 24881-D01-2019: ATCO Electric 2020 PBR Annual Filing,” December 16, 2019.
106 AUC, “Decision 24875-D01-2019: ENMAX Power Corporation Distribution Tariff,” January 1, 2020.
107 EPCOR Distribution & Transmission, Inc., “DT Schedule 1: DAS Tariff,” January 1, 2020.
108 AUC, “Decision 24876-D01-2019: FortisAlberta Inc. Rate Schedules,” January 1, 2020.
AUC Distribution System Inquiry: Combined Modules Charles River Associates
Page 49
with the required approach to interval metering and time-varying sell rates, the overall
incentives faced by large micro-generators are likely be more consistent with the principles of
cost causality and economic efficiency. We would nonetheless reiterate our comments about
the need to improve clarity in the tariff sheets around the treatment of DCGs in billing and
settlement.
4.3.3. Other DCG Connections
Other DCG connections may include small scale generation and other DCG that are neither
covered under Micro Generation Regulation nor the Small Scale Generation Regulation, and
may also include DCG with associated load or without. This set of generators, with STS
contracts and generation capability typically greater than 5 MW109, is what we focus on in this
section.110
The AUC describes a class of DCGs connected directly to the distribution system with no
associated load, as shown in Exhibit 8. The purpose of these generators is chiefly to supply
energy to the grid. They may be connected under either the Electric Utilities Act (“EUA”) or
Small Scale Generation Regulation. In the former case, costs of metering, meter data
management, and interconnection are generally borne by the DFO. The exception is a case
in which the generation unit exceeds typical interconnection costs, in which case a portion of
costs will be borne by the DCG. If the DCG is subject to the Small Scale Generation
Regulation, all such costs are borne by the owner of the DCG. All DCGs with no load sell
through an interval meter and are settled at the Alberta pool price.
In responding to the AUC’s IRs, the DFOs clarify that in both cases, costs of metering, meter
data management, and interconnection are generally borne by the DCG owner.111 It is also
worth noting here that there is potential for confusion about rates introduced by the current
arrangements given that it is not immediately clear to us in which case the EUA rules should
apply and when the Small Scale Generation Regulation should apply.112 Furthermore, Fortis
109 Substation fraction means the share of a substation's capacity attributable to a market participant under Rate DTS or
Rate STS, calculated by dividing the contract capacity of the individual system access service by the sum of all
contract capacities of all system access services provided at the same substation under Rate DTS and Rate STS.
Therefore, an STS contract is required for the substation fraction calculation. Whether a DCG is over or below 5 MW
an STS contract may be required depending on the minimum loading levels at the substation as determined by the
DFO.
110 DCG eligible under the Small Scale Generation Regulation are suppliers of renewable energy with or without load,
and we understand that regulatory treatment is tied to community benefits. DCGs under this regulation are required
to exchange energy through the balancing pool and their nameplate capacity cannot exceed the hosting capacity of
the distribution system at the interconnection point.
111 See, for example, 24116-X0529, “EDTI-AUC-2019NOV29-001-013,” February 7, 2020, pg. 5 and 24116-X0522,
“FortisAlberta IR Responses, February 7, 2020.
112 Based on discussions with our local expert, Raj Retnanandan, we understand that the Small Scale Generation
Regulation is applicable to renewable or alternative energy provided to the AIES and the EUA applies to suppliers
from sources other than renewable and alternative energy.
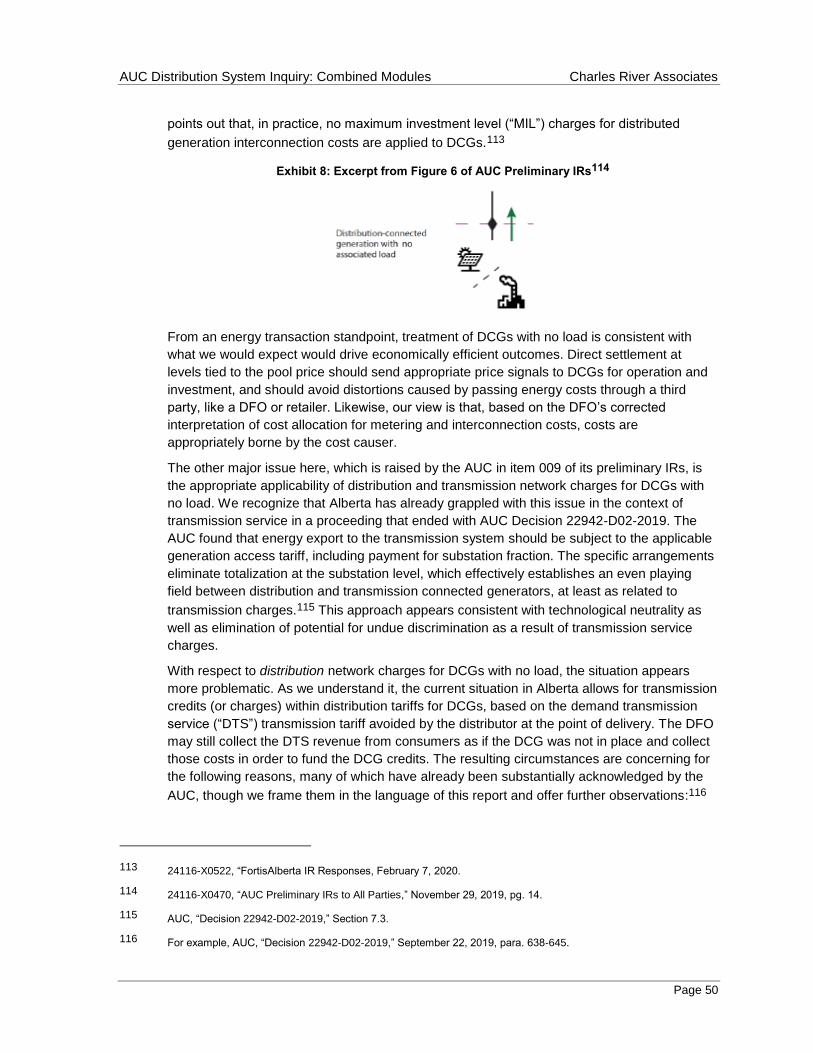
AUC Distribution System Inquiry: Combined Modules Charles River Associates
Page 50
points out that, in practice, no maximum investment level (“MIL”) charges for distributed
generation interconnection costs are applied to DCGs.113
Exhibit 8: Excerpt from Figure 6 of AUC Preliminary IRs114
From an energy transaction standpoint, treatment of DCGs with no load is consistent with
what we would expect would drive economically efficient outcomes. Direct settlement at
levels tied to the pool price should send appropriate price signals to DCGs for operation and
investment, and should avoid distortions caused by passing energy costs through a third
party, like a DFO or retailer. Likewise, our view is that, based on the DFO’s corrected
interpretation of cost allocation for metering and interconnection costs, costs are
appropriately borne by the cost causer.
The other major issue here, which is raised by the AUC in item 009 of its preliminary IRs, is
the appropriate applicability of distribution and transmission network charges for DCGs with
no load. We recognize that Alberta has already grappled with this issue in the context of
transmission service in a proceeding that ended with AUC Decision 22942-D02-2019. The
AUC found that energy export to the transmission system should be subject to the applicable
generation access tariff, including payment for substation fraction. The specific arrangements
eliminate totalization at the substation level, which effectively establishes an even playing
field between distribution and transmission connected generators, at least as related to
transmission charges.115 This approach appears consistent with technological neutrality as
well as elimination of potential for undue discrimination as a result of transmission service
charges.
With respect to distribution network charges for DCGs with no load, the situation appears
more problematic. As we understand it, the current situation in Alberta allows for transmission
credits (or charges) within distribution tariffs for DCGs, based on the demand transmission
service (“DTS”) transmission tariff avoided by the distributor at the point of delivery. The DFO
may still collect the DTS revenue from consumers as if the DCG was not in place and collect
those costs in order to fund the DCG credits. The resulting circumstances are concerning for
the following reasons, many of which have already been substantially acknowledged by the
AUC, though we frame them in the language of this report and offer further observations:116
113 24116-X0522, “FortisAlberta IR Responses, February 7, 2020.
114 24116-X0470, “AUC Preliminary IRs to All Parties,” November 29, 2019, pg. 14.
115 AUC, “Decision 22942-D02-2019,” Section 7.3.
116 For example, AUC, “Decision 22942-D02-2019,” September 22, 2019, para. 638-645.
AUC Distribution System Inquiry: Combined Modules Charles River Associates
Page 51
Allowing a credit to DCGs that is not available to transmission-connected generators
constitutes undue discrimination by offering what amounts to a subsidy.117 There is no
meaningful economic or technical differentiation between distribution- and transmission-
connected generators, except for what amounts to a coincidence of meter location. Both
types of units rely on both distribution and transmission systems to deliver electricity to
consumers and benefit from services the transmission system provides.118 This undue
discrimination also would lead to an implicit technology preference by offering an
additional, unwarranted revenue stream to DCGs (with no load).119
The result of establishing an uneven playing field for DCGs as compared to
transmission-connected generation would be inefficient long-term outcomes. By
providing an additional revenue stream to DCGs, we would expect a shift towards DCG
development ceteris paribus. This shift would be inconsistent with a generation buildout
with competitive and non-discriminatory price signals relying on competitive forces and
would therefore likely be economically inefficient.
Offering DTS credits to DCGs based on reduction in point of delivery (“POD”) billing
determinants effectively results in a cost shift from DCGs to consumers without
justification. DCGs do nothing to reduce near term transmission revenue requirements;
those amounts are based on already-deployed capital. Yet, allowing them to reduce
POD determinants will lead to erosion of overall transmission billing determinants, which
will eventually lead to increased transmission costs for all customers. In aggregate,
customers also face duplicative charges, they pay for the credits for avoided DTS paid to
DCGs, and then must provide additional funding to compensate for the billing
determinant erosion. This result is inequitable and inconsistent with cost causation.
While the issue of how to implement the changes arising from Decision 22942 is currently
being discussed, we suggest the following principle-based approach to addressing the
charges and credits in question. That is, DCG customers who are required to enter into STS
contracts should no longer receive any credits for reduction in DTS charges for the distributor.
Such DCGs would pay for their use of the transmission system through the substation
fraction charge. Since DCG customers with STS contracts would no longer contribute to
reduction in POD charges, the premise of DTS credits and concerns would no longer be
applicable. This should apply regardless of whether such DCGs are associated with load.120
This approach ensures a level playing field between generation types, thus fulfilling objectives
around technology agnosticism and avoidance of undue discrimination, while also eliminating
concerns over billing determinant erosion and cost shifting. This approach should also be
117 Similar points are recognized by several respondents to the AUC’s preliminary IRs. See, for example, 24116-X0517,
“Capital Power Responses to AUC Information Requests,” February 7, 2020; 24116-X0518, “AESO-AUC-
2019NOV29-001 to 013,” February 7, 2020.
118 AUC, “Decision 22942-D02-2019,” September 22, 2019, para. 741.
119 We also understand that DCGs may avoid Generator Unit Operator Contribution (“GUOC”) charges.
120 To the extent feasible, the same principles should be extended to DCG customers with production capability less
than the minimum loading level at the substation in order to place all non-micro generation DCG on an equal footing.
AUC Distribution System Inquiry: Combined Modules Charles River Associates
Page 52
applied uniformly across DFOs; this would ensure adherence to principles and increase
certainty in the marketplace.121
Here, we also raise the issue of the changing nature of distribution grid usage (and charges),
for customers with DCG. Traditionally, distribution systems (and many transmission systems)
have been characterized by one-way electricity flow and clear differentiation between
suppliers and consumers. With DCG, this clear distinction fades. DCG customers may be
both consumers and producers and drive bi-directional flows on the distribution system.
Resulting cost impacts on the distribution system may include:
Dependence on the grid for backup, maintenance, or black start services;
Initial network investments to accommodate power injected by DCG, including
substation or switchboard replacement or upgrades;
Changes in network O&M costs, including changing loss factors, and need for more
sophisticated voltage control schemes and protective devices;
New processes for long-term network planning.122
Thus, it may be appropriate to revise network charges to account for this shift, which could be
done by implementing a separate rate for dual use customers (i.e., DCG customers). The
resulting rate could reflect the nature of the DCG customer as a supplier. As suppliers, DCGs
can impose demands on the grid, which may drive needs for upgrades. This should be
recognized in rates. This could be achieved through a wholly separate rate category, or by
calibration of the sell rate under a net billing or a BA/SA structure. Various approaches have
been suggested for how such charges could be structured.123 In the Albertan context, it
would be important to ensure that DCG network use and upgrade charges are structured
similarly to supply transmission service (“STS”) and other charges experienced by wholesale
generators selling into the AESO market. This avoids undue discrimination and ensures a
level playing field across generator types. To the extent wholesale generators are not
currently responsible for the above noted non wires costs, the issue may need to be revisited
in the context of STS rates.
4.3.4. Demand Side Management
Demand side management efforts, including energy efficiency and demand response, are not
new. As Dr. Tabors described in his Module One testimony, consumer acceptance of such
activities has been limited, owing to factors like the low overall cost of electricity, limits on
supportive technology, and price inelasticity of demand (i.e., limited value to effectuating
energy price response).124 However, new technologies like programmable charging in EVs,
smart thermostats, and other capabilities sometimes referred to as “the internet of things”
121 This eliminates what AltaLink refers to as “tariff shopping”, wherein different tariff structures provide different price
signals; with no corresponding difference in the services received or provided by/to the grid.” (AML-AUC-
2019NOV29-001)
122 www.iit.comillas.edu/docs/IIT-14-076A.pdf
123 For example, www.iit.comillas.edu/docs/IIT-14-076A.pdf and ceepr.mit.edu/files/papers/2014-006.pdf
124 24116-X0167, “CCA Evidence of Dr. Richard Tabors,” July 17, 2019, para. 47-56.
AUC Distribution System Inquiry: Combined Modules Charles River Associates
Page 53
have the potential to shift this dynamic and increase price responsiveness. In particular,
digital aggregation and remote control of loads by entities like Curtailment Service Providers
(“CSPs”) has the potential to drive demand side management, while not requiring major
investments of time or capital by individual consumers.
As load becomes more participatory in its approach to consumption of electric services, via
DSM measures, it is important that it also receives the right price signals such that it is able to
participate in a manner that fosters economic efficiency. Historically, especially for residential
and small commercial customers, there was limited price-driven variation in electricity
consumption, and therefore variable-based rates only provided incentives for consumer to
limit overall energy consumption. However, with the expectation of increased DSM comes
heightened concern over developing rates that reflect cost and send signals for economically
efficient behavior. As described in the context of DCGs as well, the chief concern with
allocative efficiency loss, should consumers limit consumption based rate structures that
overstate the actual marginal cost of supply. The same principles apply; it is important not to
over- or under-value each increment of consumption.
Furthermore, as described in the context of demand charges, it is important to carefully
design tariff rates to recover fixed infrastructure costs. In this instance, distribution systems
are planned for and allocated based on non-coincident demand, and demand billing
determinants should therefore be on the same basis.
4.3.5. Storage Rates
In its IRs, the AUC comments that there are no current enactments or market rules that
govern energy storage resources in Alberta. Instead, the AUC introduces several hypothetical
arrangements for storage resources connected to the distribution and transmission systems.
These include a behind-the-meter storage system, a distribution-connected storage system,
and a transmission-connected storage system.
Given the current regulatory circumstances in Alberta, there is little to comment on here in
terms of specifics. Thus, we provide general thoughts about storage and rely on our principle-
based approach to setting distribution tariff rates. As an initial matter, storage is an important
and versatile technology that we expect to see play a larger role in future power systems
owing to falling costs of certain types of energy storage assets (e.g., electrochemical
batteries) and synergies between storage and expanded deployment of variable energy
resources. In other jurisdictions, the expectation of an expanded role for energy storage has
driven regulatory reforms to level the playing field for storage. For example, FERC Order No.
841 requires U.S. RTOs to revise their rules to allow storage resources to participate in their
markets on an equivalent basis to other resource types.
We recommend that the AUC and other Alberta utility stakeholders work towards
implementing rules to facilitate the deployment of energy storage as appropriate and
consistent with the principle of technology agnosticism. Particular areas of regulation where
storage participation should be considered include:
Treatment of merchant storage connected to the distribution system;
Storage as a regulated asset on distribution or transmission systems;
Merchant storage participating in the wholesale market.
AUC Distribution System Inquiry: Combined Modules Charles River Associates
Page 54
In the distribution-connected merchant context, we contend that a distribution tariff rate that
sends well-designed cost signals to distribution customers and DCGs should also serve well
to send cost signals to electric storage resources.125 To first order, a distribution situated
storage resource may be viewed at times as a load, and at times as a generator. If
appropriate signals are in place for both roles of a non-storage resource, appropriate signals
should also be in place for each role of an energy storage resource.
Treatment of storage as a competitive asset acting under distribution tariff rates and price
signals to consumers is only one element of how storage may be considered in the regulation
of distribution utilities. Storage also holds the potential to play a role not as a competitive
asset, but as a regulated, rate-based asset. In the context of distribution planning and
operation (and transmission planning and operation), storage may be considered as cost-
effective non-wires alternative for deferring or avoiding certain system upgrades or providing
ancillary services.126 These other potential uses of storage technology should also be
considered in distribution utility regulation. When storage performs non-merchant services,
the applicable storage tariffs should attempt to recognize the relevant context from a cost and
value perspective.
There are different, complex considerations for larger resources participating in a wholesale
market environment. In wholesale markets, the flexible nature of storage resources may be
more fully and dynamically leveraged. For example, with more sophisticated operational
strategies in play, there may be a need to represent the capabilities and constraints of
storage more thoroughly in market offers and market optimization software. To treat batteries
in this manner would require market software that optimizes across operational time periods,
which in our understanding is not currently a feature of the AESO market.
4.3.6. EV Rates
According to the AUC, there are no tariff rates specific to EV charging infrastructure, whether
in-home, at a commercial site, or as part of a direct charging network. Noting that vehicle-to-
grid charging is still in early development stages, the AUC focuses its IRs on EVs as load in
four scenarios with successively higher demands on the system and variation between
whether sites are private or public, and at residential or commercial sites.127
125 However, this is not to argue that storage resources should do not deserve specific treatment. To eliminate concerns
over misunderstandings, particularly given the expanded role that storage resources are expected to play in the
future power system, we would suggest that storage receive explicit treatment in tariff rates and applicable
regulations.
126 We agree with entities like IPCAA that point out that the deployment of ESRs by DFOs or TFOs requires careful
management and oversight. Regulated ESR investments need to be well-justified as a cost effective solution.
Resulting ESR development would probably also benefit from competitive sourcing. See, IPCAA-AUC-2019NOV29-
013. As Capital Power points out, it would also be important to make sure that a regulated ESR investment is not
able to over-recover costs based on both merchant sales and regulated rates. See, CPC-AUC-2019NOV29-013.
127 24116-X0470, “AUC Preliminary IRs to All Parties,” November 29, 2019, para. 31-34.
AUC Distribution System Inquiry: Combined Modules Charles River Associates
Page 55
In our view, EVs can be treated as potentially large new loads from a distribution tariff design
standpoint and, for Level 1 chargers, cost impact considerations may be minimal.128
However, as pointed out by Dr. Tabors, network issues may arise if EV adoption happens
quickly and is clustered in certain neighborhoods.129 EDTI also notes that Level 2 chargers
do present unusually large, sustained demands on the system.130 In our view, the impact can
be significantly mitigated if EV adoption is planned for and EV owners are incentivized to act
in an efficient manner.131 If this is done effectively, the introduction of EVs may increase load
factor and utilization of existing infrastructure; if done poorly, EVs may increase load factor,
drive need for system reinforcements, and increase overall distribution system costs.
This again points to a rate design that effectively communicates to the customer, and EV
owner, a reasonably accurate signal about the costs being imposed on the system by
charging, and the cost to charge the vehicle at any given time. Again, rates reflective of cost
causation by on-site generation and/or EV achieves this objective and helps to achieve
desirable outcomes like maximizing use of existing infrastructure while limiting the need for
new development and additional system cost. This can be accomplished via three-part rates
or via other structures, like time-of-use tariffs for energy or a ratepayer impact model, as
described further below.132 Here, the key issue is representing the time-differentiated impact
of charging decisions both on the burden imposed on the distribution (and transmission)
networks and the cost of energy.
EV owners should be incentivized to charge at times that they are not going to increase their
peak demand – and thereby limit system expansion needs – or to limit how much their peak
demand increases. Rates that adhere to the cost causation principle will also limit the ability
of EV customers to shift costs of associated system expansion onto EV non-adopters. We
acknowledge again that many C&I customer tariffs in Alberta already have multi-part rates
that provide the types of signals being suggested.
A novel feature of EV-type loads is that most EVs come with the ability to control when
charging occurs via a programmable charge controller. This increased sophistication, paired
with the potential for increased load on the system, suggests that alternative customer
classes may be appropriate. For example, all four of Maryland’s investor-owned utilities must
develop a time-of-use rate specific to residential EV customers. Additionally, public stations
128 Should Vehicle to Grid (“V2G”) technologies become more prevalent, it is likely that the nature of EVs could change
considerably in their ability to act more like a bulk storage resource than a distributed load. However, as pointed out
by Dr. Tabors, this technology is not yet mature for commercial applications (Dr. Tabors Module One Evidence, para.
29).
129 24116-X0167, “CCA Evidence of Dr. Richard Tabors,” July 17, 2019, para. 26.
130 24116-X0529, EDTI-AUC-2019NOV29-012.
131 www.raponline.org/blog/electric-cars-are-a-lot-like-water-heaters/
132 It is conceivable that charges in a distribution tariff could be differentiated by time, as is common for energy TOU
rates. This would provide further incentives to shift consumption to outside of peak periods.
AUC Distribution System Inquiry: Combined Modules Charles River Associates
Page 56
owned by the utility will use a separate electricity rate so EV drivers pay for infrastructure and
electricity use without spreading the cost across all electricity consumers.133
While not specific to the DFO rates, new EV tariff classes could have more time-sensitive rate
structures for the energy component of customer charges.134 Time-of-use energy rates could
also be imposed on EV charging customers if there is concern that they are failing to receive
appropriate signals about the cost of energy being consumed at any given time, which would
lead to potential allocative efficiency loss. In a jurisdiction like Alberta, with retail competition,
the imposition of time-of-use (“TOU”) energy rates cannot necessarily be required for all
customers as they are in some jurisdictions.135 However, one change would be for the non-
switching customer rate to be set as a TOU-type rate for all customers with an EV.
EV rate classes are a prime example of the interplay between rate design and public policy,
particularly for public charging infrastructure. There is criticism that demand charges, which
historically have been in place for C&I customers, are not well suited to public fast chargers,
particularly if the peaky nature of public fast charging winds up shifting costs to charging
installations beyond what would reflect cost causation. Furthermore, high monthly fixed costs,
even if warranted, are challenging for new, not-yet-mature businesses like public fast
charging providers. If there is policy interest in supporting EV infrastructure and deployment
of zero-emitting EVs in general, then these hurdles to deploying charging infrastructure may
be lowered via rate design decisions. With these challenges and societal policy goals in mind,
RMI recommends EV tariffs for public chargers that limit fixed charges, instead focusing on
cost recovery via variable rates that vary by time and location.136
If Alberta’s DFOs were to develop EV-specific rate classes, there are approaches used
elsewhere that may provide a guide for how to limit rate shock and bill impacts on existing EV
customers. Before implementing a new distribution-level EV tariff, many jurisdictions have
conducted pilot programs with both EV and non-EV owners participating. Then, using
ratepayer impact models (“RIM”), utilities calculated the net present values of the tariff’s costs
and benefits by category. For instance, the New York Power Authority assessed the
“Ratepayer Impact of EV Adoption by Region” by assigning electricity supply and residential
charger installation into a cost category and utility bill savings to a benefit category and
calculating the net benefit.137 Portland General Electric used a modified RIM analysis called
TEAM, which includes 17 cost-benefit categories such as tax credits, administrative costs,
133 Maryland Public Service Commission, “Maryland PSC Approves Modified Utility Electric Vehicle Portfolio,” January
14, 2019.
134 Some examples of EV tariff rates are provided here:
www.swenergy.org/data/sites/1/media/documents/publications/documents/How_Leading_Utilities_Are_Embracing_E
Vs_Feb-2016.pdf and files.brattle.com/files/14717_the_state_of_residential_ev_electric_rates_10-15-2018.pdf
135 Jim Lazar, Paul Chernick, and William Marcus, “Electric Cost Allocation for a New Era,” Regulatory Assistance
Project, January 2020, pg. 87.
136 rmi.org/rate-design-best-practices-public-electric-vehicle-chargers/
137 NYSERDA, “Benefit-Cost Analysis of Electric Vehicle Deployment in New York State,” February 2019, pg. S-6.
AUC Distribution System Inquiry: Combined Modules Charles River Associates
Page 57
and environmental benefits.138 In Maryland, some proposed tariff offerings will not place all
charging infrastructure costs on ratepayers. Some upfront costs will be borne under utility rate
base or a government subsidy.139
Transitions to EV tariffs may also be facilitated by education programs. According to a study
by New York State, even with high levels of EV infrastructure in place, the benefits of EV
tariffs do not outweigh the costs unless customers follow the price signals built into the
tariff.140 First, customers must be incented to visit an education portal. The utility Salt River
Project in Arizona rewards EV customers with a $50 gift card for signing up for alerts from the
utility’s EV mailing list.141 Then, the education program itself must be memorable and clear.
Pacific Gas and Electric developed a low-budget, consumer-friendly web platform where
consumers can search for regional incentives, compare tariffs, and locate charging stations,
all in one centralized hub.142
4.4. Locational Pricing Considerations
As load and generation patterns shift over time, not all spots on distribution networks will be
affected equally. Some infrastructure may be sufficient or over-built to serve the needs of
customers and DERs, while some parts of the grid may be stressed and require upgrades.
This dynamic has long been recognized in transmission pricing and planning. Bulk locational
marginal prices (“LMPs”) in most electric markets143 send time- and location-varying
indications to generators and loads about where electric energy (and new transmission) is
most valuable, and planning processes have sought to reduce transmission congestion
where justified. Similar opportunities may be available for sending locational price signals at
the distribution level. Locational signals for distribution could be developed to apply at
operational time scales, which should incent shifts to both short- and long-term behavior, or to
send signals more focused on long-term siting of DERs or load. Put another way, locational
price signals can communicate to customers and market participants both where to develop
new resources and how to operate both new and existing resources.
138 Portland General Electric Company, “UM 1811 Transportation Electrification Compliance Filing,” February 15, 2019,
pg. 22.
139 Maryland Public Service Commission, “Maryland PSC Approves Modified Utility Electric Vehicle Portfolio,” January
14, 2019.
140 NYSERDA, “Benefit-Cost Analysis of Electric Vehicle Deployment in New York State,” February 2019, pg. 83-84.
141 Melissa Whited, Avi Allison, and Rachel Wilson, “Driving Transportation Electrification Forward in New York,”
Synapse Energy Economics June 25, 2018.
142 ev.pge.com/
143 Alberta’s current system-wide marginal price does not account for small-scale local variances in the temporal and
locational marginal costs of electricity generation, transmission, and distribution. (www.aeso.ca/aeso/training/guide-
to-understanding-albertas-electricity-market)

AUC Distribution System Inquiry: Combined Modules Charles River Associates
Page 58
The most basic long-term price signal for distribution system locational pricing is a varying
interconnection fee based on capacity and reliability needs.144 Depending on the maximum
capacity for a regional substation and expected consumption and production patterns, more
DCG on the system could either overload or provide relief to the system. The interconnection
fee for any particular location would vary depending on the costs that would be imposed by
the DCG. The initial interconnection fee for DCG can be conceptualized as a price signal
regarding the parts of the system that can best accommodate further DCG capability. We
note the importance of ensuring that charges to new DERs are sufficiently “deep” to
appropriately disincentivize investment where it is likely to lead to significant upgrade costs.
Also, adding transparency to such costs is a worthwhile goal, which may ease locational
decisions for developers of DERs. For example, National Grid’s electricity transmission entity
hosts a real-time “network capacity map” of every substation in its United Kingdom service
territory, color-coded by amount of available capacity.145 An alternative or complement to
locational charges is “hot spot” credits, an option suggested by the Rocky Mountain Institute,
to provide incentives for resources that would relieve current system constraints.146
The above fee structure aims to avoid new asset development leading to uneconomic
buildout of distribution infrastructure such as substations, transformers, and elevated utility
poles and cables, because once installed, infrastructure is a sunk cost. Similar signals can
also be provided to existing resources via location-varying demand charges, which may
indicate to the consumer the value of changing operational behavior to delay or avoid an
upcoming network upgrade. Locational demand charges like this can be thought of as
indicating the marginal cost of using the network and, by location, could be layered on top of
existing demand charges to recover embedded costs. Experts at MIT point out that, “the
strength of the economic signals sent to network users through their network charges should
be modulated to account for the capacity margin of the network under consideration.”147 That
is, the lower the capacity margin of the network, the larger the distribution price signal would
be to consume the remaining margin. The considerations to achieve this are complex and
depend on a number of factors, and need to be structured to avoid penalizing customers who
have little ability to change their contribution to network costs.
An even more complex approach to sending short-term price signals for consumers at the
distribution level is a distribution locational marginal price (“DLMP”).148 Like LMPs at the bulk
power system (i.e., transmission) level, DLMPs convey to the consumer the marginal cost of
144 We note that location price signals from Generating Unit Owner Contributions (“GUOC”) are in place for transmission
connected wholesale power generation pursuant to Section 29(1) of the Transmission Regulation. Concurrent with
review of locational pricing for DCG, there may be merit in reviewing GUOC in the interest of improving the
effectiveness of price signals as well as to achieve harmonization between DCG and wholesale generation.
145 www.nationalgridet.com/get-connected/network-capacity-map
146 Devi Glick, Matt Lehrman, and Owen Smith, “Rate Design For The Distribution Edge,” Rocky Mountain Institute,
August 2014.
147 Pérez-Arriaga and Knittel, “Utility of the Future Full Report,” Massachusetts Institute of Technology, pg. 111 (Box
4.5), and 290, 2016.
148 In the context of locational price signals and DLMP, it can be challenging to differentiate between the locational price
for wires service and energy, so we will discuss them together.
AUC Distribution System Inquiry: Combined Modules Charles River Associates
Page 59
supplying an additional unit of demand at a certain location, accounting for the time varying
cost of energy, congestion, and losses.149 Depending on how it is structured, DLMP may
incorporate:
Local generation availability via bids and offers for both reactive and real power,
resulting in price curves down to the substation level;150
Line congestion and losses;151 and
Feeder load.152
If calculating LMPs is a complex task, calculating DLMPs is even more so. Nonetheless, it
has been suggested as an approach to managing locational issues arising from increased
prevalence of DERs. There are also formulations of DLMP that attempt to simplify the
construct somewhat. While less precise, an alternative approach to providing a distribution
level price signal is to use the so-called “LMP+D” method for distributed generators: LMP+D
is an average, administrative estimate of the total avoided cost of the full process of electricity
delivery. This would sum the wholesale locational marginal price plus a utility-provided
estimate of the average avoided distribution system costs.153
A system like DLMP or LMP is likely a long way off in Alberta. As it stands, Alberta does not
yet use locational marginal pricing in its wholesale markets. If network congestion and the
need for better locational price signals become pressing concerns, implementing an LMP is
likely a more cost effective first step towards improving price signals and market efficiency.
DLMPs will remain an option for the long term, but have yet to be implemented at scale in any
jurisdiction. We expect the level of associated complexity will deter near-term adoption, and
this would not be a recommended path for Alberta at this time.
4.5. Conclusions and Recommendations
In this section, we address tariff rate design issues in general and assess whether current
distribution rate structures in Alberta adhere to principles we set forth. The principles we put
forward include:
Rates should drive towards economically efficient outcomes;
Rates should reflect cost causation;
149 Edmunds, Galloway, and Gill, “Distributed Electricity Markets and Distribution Locational Marginal Prices: A Review,”
2017.
150 Richard D. Tabors, “Valuing Distributed Energy Resources (DER) via Distribution Locational Marginal Prices
(DLMP),” June 1, 2016.
151 Edmunds, Galloway, and Gill, “Distributed Electricity Markets and Distribution Locational Marginal Prices: A Review,”
2017.
152 Reno et al., “Using Distribution LMP and Time-of-Delivery Pricing to Promote Optimal Placement and Increased
Profitability of Residential PV Systems,” 2014.
153 Richard D. Tabors, “Valuing Distributed Energy Resources (DER) via Distribution Locational Marginal Prices
(DLMP),” June 1, 2016.
AUC Distribution System Inquiry: Combined Modules Charles River Associates
Page 60
Rates should balance non-cost objectives, including 1) simplicity, east of understanding,
administration and acceptability; 2) clear of misinterpretation; 3) reasonably granular;
and 4) no undue discrimination.
As an initial matter, we describe why the expanded deployment of DERs is likely to result in a
shift in distribution customer behavior that is concerning in the context of historical
approaches to rate design, particularly for residential customers. If rate design is not better
aligned with fundamental principles, we expect that inefficient and unequitable outcomes are
likely to result. We then review current rate design structures in Alberta, using the AUCs IRs
as the primary guide. We identify certain concerns, and suggest the following reforms to
avoid outcomes that would not be in line with principled rate design:
Implementation of three-part rates reflective of cost causation for those customers with
on-site generation (including storage) and/or electric vehicles. Further attention should
also be paid to the accuracy of consumer contribution charges for new DCGs.
To the extent that certain customer classes already face three-part rates – or rates with
significantly less emphasis on variable charges – rate structures may still need to be
revisited to balance the relative size of fixed, demand, and variable charges to be
reflective of cost and send effective signals to lead to efficient operational decisions.
Customers that do not have DCGs and/or EVs do not raise the same level of concerns
about rate bypass and cost shifting, imposition of additional system needs and costs,
and the general need for price signals that are better aligned with cost causation. Such
customers should be allowed access to legacy rates. Customers that made investment
decisions based on price signals embedded in previously-available rates may be
accommodated via grandfathering or transition periods.
Treatment of distribution network charges for DCGs with STS contracts should be
revisited. Such DCG customers should no longer contribute to reduction in DTS charges
for the distributor and DTS credits should no longer be applicable. This approach
ensures a level playing field between generation types, thus fulfilling objectives around
technology agnosticism and avoidance of undue discrimination, while also eliminating
concerns over billing determinant erosion and cost shifting.
Current rules around the recovery of the small micro-generation sell-rate should be
reformed. As we understand it, there is currently no regulatory review of these rates and
the entities that agree to the price bear no risk for that price. The costs incurred are
ultimately borne by customers, and potential exists for significant economic efficiency
losses by offering above-market rates with not countervailing benefit to the system.
As these changes are deployed in Alberta, it is also important to improve the
transparency and understandability of rate structures, particularly as they apply to
different customer classes with different DER and metering configurations. This issue
will be particularly relevant should the AUC and the Alberta DFOs develop further rate
classes for DCG and EV customers, as recommended.
AUC Distribution System Inquiry: Combined Modules Charles River Associates
Page 61
Appendix A: DERs and Wholesale Markets – ERCOT Case Study
In considering the role of DERs in a liberalized jurisdiction, one important element of the
overall industry and regulatory structure is the interplay between the wholesale markets and
resources that have not traditionally been active participants in those markets. While this is
not squarely within our focus, which is the regulatory and rates treatment of distributed
resources, we have been asked to provide a case study for how such issues are treated in
other markets.
ERCOT Background
The Texas electricity market (“ERCOT”) presents a good analog for Alberta and is a good
case study because it is farther along in some issues related to market design and
participation of distributed resources. Like Alberta, ERCOT runs an “energy-only market”
where the price signals from the energy and ancillary services markets incent producers (and
consumers) to ensure long-term resource adequacy. Neither market has a capacity market.
Furthermore, both markets have successful programs associated with retail competition and
choice, both markets have limited interconnections with neighboring systems, and both
markets have considerable industrial load related to extractives industries.
ERCOT and the Alberta market also have some significant differences. While ERCOT uses
administrative shortage pricing to supplement energy market price signals when the system is
strained, the AESO market relies on permissive market power monitoring and mitigation
procedures, including the unilateral exercise of market power (via economic withholding), to
simulate shortages and assist generators in recovering long run marginal costs. ERCOT and
Alberta’s markets are also different. ERCOT co-optimizes the procurement of energy and
ancillary services, and relies on locational pricing to send locational signals for both short
term operational purposes and as a mechanism to stimulate generation development at parts
of the system where it is most needed. ERCOT is also significantly larger than Alberta, with
more than 26 million customers served and a peak demand in excess of 74 GW.
Market Participation Tradeoffs
Allowing and accounting for participation of DERs in wholesale energy markets is frequently a
tradeoff between measures that improve efficiency and considerations around administrative
and technical burden for market participants and the market operator. In a perfect world, a
market operator would optimize the utilization of all resources on the system and balance
them with a robust representation of load, including any price elasticity of demand. In
practice, this is not feasible.
On the supply side, active participation by smaller generating resources may be burdensome
for resource owners (e.g., formulation and submission of offers on a daily basis) and, owing
to the small size of the resources, have a small impact on overall market efficiency. Including
a larger number of supply resources also adds complexity to the already-complex task of
optimizing unit commitment and dispatch. Thus, a balanced market design might relegate
smaller generators to “settlement only” status so that price signals are communicated without
including smaller resources in operational decisions like larger ones.
AUC Distribution System Inquiry: Combined Modules Charles River Associates
Page 62
On the demand side, customers may be shielded from time- (and location-) varying wholesale
price signals by rate design either on purpose or by nature of the arrangements with
competitive suppliers. As discussed, they may not have the interest, capability, or sensitivity
to respond to price signals, at least not without facilitation by a third party (e.g., an
aggregator). It is infeasible to ask customers, or even groups of customers, to indicate their
consumption preferences to a market operator on a regular basis.
Taken together, the practical realities of running a power market do not allow all resources to
be treated on an equivalent basis, and decisions need to be made about which resources can
and should participate actively, and which resources may participate in a less active manner.
Here, we observe how some of these tradeoffs have been made in the ERCOT market.
DERs in the ERCOT Market
The below sections describe how ERCOT rules treat various DERs, as well as how they are
being updated to reflect evolving system needs.
Distributed Generation
ERCOT defines Distributed Generation (“DG”) as a generating facility located at the point of
customer delivery, 10 MW or less in capacity, and connected to a voltage less than or equal
to 60 kV. All Distributed Generation Resources (“DGR”) greater than 1 MW are required to
register with ERCOT as a Settlement Only Distribution Generator. Electricity exports to the
distribution system are accounted for in ERCOT market settlements. DGR with installed
capacity of less than or equal to 1 MW, or with capacity greater than 1 MW that does not
export, is registered as a Self-Generator with the PUC and does not need to register with
ERCOT. Metering and reporting of meter data is the responsibility of the host transmission or
distribution service provider.154 While DGRs are a subset of Generation Resources (GR) and
therefore subject to all ERCOT Protocols and rules that apply to GRs, DGRs are designated
as settlement-only assets and do not impact market clearing prices.
ERCOT has expressed that DGRs present certain operational concerns that could create
reliability risks for the system. As noted in a September 2019 Market Notice, these risks are
due to regulatory gaps in governance of outage coordination and modelling of distribution
facilities, as well as accommodation of DGR impacts during load shedding events.155 To
address these issues, ERCOT has proposed revisions to the Protocols governing DGR
participation and is actively hosting workshops to engage with stakeholders. These
workshops began in November 2019 and are currently scheduled monthly through February
2020.156 As indicated in the agenda from the initial November DGR workshop, these
discussions will result in a formal Nodal Protocol Revision Request (“NPRR”) as well as other
154 www.ercot.com/services/rq/re/dgresource
155 www.ercot.com/services/comm/mkt_notices/archives/4288
156 www.ercot.com/committees/workshops
AUC Distribution System Inquiry: Combined Modules Charles River Associates
Page 63
rule changes to the DGR participation models.157 Key items to be addressed in such changes
are DGR definitions and size requirements, outage scheduling requirements, and modelling
of such resources. In the interim, all new DGR connections to the grid have been suspended,
though existing resources may continue to operate.
Previously, in 2015, ERCOT developed the Distributed Resource Energy and Ancillaries
Market Task Force (“DREAM TF”) to review the regulatory and market frameworks for
distributed resource participation in the markets and propose enhancements to the existing
model. Among issues reviewed were the potential for a DGR to be associated with a
Resource Node and be included in zonal pricing or Congestion Revenue Rights markets, as
well as allowances for the resources to take economic outages and/or be aggregated on a
zonal and system-wide basis. DREAM TF also reviewed opportunities for enhancements to
the existing ERCOT registration and compliance requirements, settlement data submission
processes, and the ERCOT dispatch and control for such assets.
While the Task Force’s February 2016 report did not state recommendations to be
implemented regarding these assets, it identified the current regulatory challenges or barriers
to entry that would need to be addressed should ERCOT choose to grant DGRs participation
outside of the existing mechanisms, in which DGRs are settlement-only resources. These
include the lack of guidance in existing ERCOT Protocols on representing DGRs in
association with Resource Nodes, requirements for Aggregated Load Resources to all be
located within the same Zone, and the cost of metering that these assets would have to
absorb in the absence of cost recovery mechanisms.158 Some of these and similar issues are
being addressed again in the DGR workshops.
Additionally, while there have been a few utility-launched pilot programs for demonstrating
electric vehicles as distributed energy resources on the grid, ERCOT has not yet released its
own research or pilot programs of adopting such resources onto the grid.159
Energy Storage
ERCOT has also recently addressed how energy storage resources (“ESR”) are treated in
the markets, forming the Battery Energy Storage Task Force (“BESTF”) to review the
participation models. ESRs in ERCOT have been historically modeled as a combination of a
Generation Resource and a Controllable Load Resource (“CLR”). The initial set of ERCOT
market rule revisions, which codifies consensus reached at the BESTF and TAC, was
approved by the ERCOT Board in February 2020. This included changes to ESR market
participation and compensation:
157 The ERCOT Protocols are intended to implement ERCOT’s functions as the Independent Organization for the
ERCOT Region as certified by the Public Utility Commission of Texas (PUCT). Market Participants, the Independent
Market Monitor, and ERCOT are all subject to the Protocols. Formal revisions to such Protocols are done through
Nodal Protocol Revision Requests (NPRR), which are subject to stakeholder comments and impact analysis reviews
before being addressed by the Technical Advisory Committee and Board. Revisions are ultimately filed to the PUCT.
158 ERCOT, “Distributed Resource Energy and Ancillaries Market Task Force (DREAM TF) TAC Report,” February
2016.
159 www.greentechmedia.com/articles/read/vehicle-to-grid-testing-austin-energy-pecan-street
AUC Distribution System Inquiry: Combined Modules Charles River Associates
Page 64
Settlement Points for ESRs set to the Resource Node of the existing modeled generator
resource associated with the ESR, providing symmetrical dispatch and settlement for
charging and discharging at the real-time price;
Setting the offer cap for ESRs at the system-wide offer cap, the maximum allowed
energy market offer as set by the Public Utilities Commission of Texas (“PUCT”);
Applying startup offers and minimum-energy offers of $0 per start and $0/MWh,
respectively; and,
Allowing ESRs to update energy offer curves and real-time energy market bids any time
prior to the security constrained economic dispatch (“SCED”) execution, enabling
enhanced flexibility for these resources. 160
The BESTF operational and market policy review is ongoing, with monthly meetings
scheduled throughout 2020 that will likely lead to additional NPRRs. Key discussion topics
and revisions not yet approved by the Board include removal of duration limitations on such
resources, as well as eliminating the designation of ESRs as dual DG and CLRs, instead to
be registered as an Energy Storage Resource to participate in economic dispatch and
ancillary services. While the recent U.S. Federal Energy Regulatory Commission (“FERC”)
Order No. 841 required ISOs and RTOs to provide more opportunities for ESRs to participate
in the wholesale markets, ERCOT is not under FERC jurisdiction and has chosen not to
comply with the ruling, instead revising treatment of such resources through the Task
Force.161
The ownership of ESRs has been contested in Texas, as the previously existing model
enabled transmission and distribution companies to own these assets. In attempts to alleviate
confusion as to whether this is permitted under state law, several responsive pieces of
legislation have been proposed. Ultimately, Senate Bill 1012 was recommended by the PUC
and signed into law effective September 1, 2019. This succeeded in clarifying that
municipally-owned utilities and electric cooperatives may own and operate batteries without
registering as power generation companies. Whether transmission and distribution utilities
may legally own battery storage has yet to be decided by the state. Generating companies in
the state, such as Vistra and NextEra, have argued that utilities cannot do so – while storage
developer Tesla and investor-owned utility Oncor Electric believe ownership is permitted
through the Public Utility Regulatory Act, which governs the ERCOT grid. The debate
between the utilities and non-utilities focuses on whether utility-owned storage devices would
be considered generation, in which case the wholesale power markets and power prices
would be affected, and merchant operators would be required to compete with assets that are
able to recover cost under regulated rates. Utilities argue that such effects would be
insignificant, and indistinguishable from other potential actions they may take.162
160 ERCOT, “BESTF-2 Energy Storage Resource Energy Offer Curves, Pricing, Dispatch, and Mitigation Board Report,”
approved February 11, 2020.
161 www.ercot.com/content/wcm/lists/164134/Storage_One_Pager_FINAL.pdf
162 www.utilitydive.com/news/texas-utilities-poised-to-get-new-ability-to-own-energy-storage-assets/560797/
AUC Distribution System Inquiry: Combined Modules Charles River Associates
Page 65
Demand Response
A number of DR programs and participation models exist in Texas, some directly
administered by ERCOT and others by service providers in the region. DR resources
participate in ERCOT’s real-time energy and ancillary service markets. DR opportunities in
the wholesale market include emergency response services and ancillary service products,
while opportunities facilitated by utilities include peak reduction, contracted load response,
commercial load management, and self-initiated price response. Resources may qualify for
various market and program participation based on resource type, size, and response
times.163 For example, energy storage resources currently participate primarily in the Fast
Responding Regulation Services, in which they are registered like a generating resource
when injecting onto the grid, and a CLR when withdrawing.164 Distributed generation with
advanced metering systems may participate in price response activity. In 2018, no resources
on the system qualified to provide non-spinning reserve services, as none qualified to do
so.165 Various response time requirements also determine which resources can participate in
the programs, as the Emergency Response Service allows a maximum of 30-minute ramp
time. 166
Texas load management programs are implemented by the transmission and distribution
service providers, under which end-use customers receive payment from the providers in
exchange for reducing peak demand upon request. In the event of larger system
emergencies, ERCOT can request the service providers to deploy the program.166
Energy Efficiency
Energy Efficiency (“EE”) measures do not have any active role in the ERCOT wholesale
markets. Instead, EE is governed through the state Energy Efficiency Rule, passed in 2011,
which calls for IOUs to achieve 30% reduction of its annual growth in demand of residential
and commercial customers. Once a 30% reduction in annual growth in demand is achieved,
the standard reverts to 0.4% of total peak demand thereafter. Required reduction levels
cannot fall below previous year's levels.167
Key Takeaways from ERCOT
While Texas has a number of protocols and mechanisms in place for distributed generation,
energy storage, and demand response resources to participate in the ERCOT markets, much
of these participation models are currently being revisited or debated in a range of venues
163 ERCOT, “Load Participation in the ERCOT Nodal Market”, Draft Version 3.01
www.ercot.com/content/services/programs/load/Load%20Participation%20in%20the%20ERCOT%20Nodal%20Mark
et_3.01.doc
164 This model is likely to change given revisions to the Protocols being prepared by the Battery Energy Storage Task
Force.
165 Security-Constrained Economic Dispatch Qualification is required for Load Resources to provide Non-Spinning
Reserve Services.
166 ERCOT, “2018 Annual Report of Demand Response in the ERCOT Region,” March 2019.
167 programs.dsireusa.org/system/program/detail/4622

AUC Distribution System Inquiry: Combined Modules Charles River Associates
Page 66
(e.g., PUCT, Texas legislature, ERCOT) in response to expectations for increased
penetration of renewables and demand side resources. Distributed generators currently
participate as settlement-only assets, though after the ERCOT workshops, their definitions,
requirements, and participation model may change. ERCOT is also reviewing how energy
storage resources participate and are compensated, while the allowable ownership structures
of such resources have been contested at the PUCT and state legislature. Demand response
in ERCOT has more established mechanisms that are not currently as challenged or
reviewed, but DR resources’ role as active participants is also limited. Permissible DR
participation varies based on the market involved, resource type, size, and achievable
response times.