
Systematic review of the clinical effectiveness and cost ...

NATIONAL BROADBAND NETWORK
A RISK ASSESSMENT AND COST-EFFECTIVENESS ANALYSIS
by
DARRYN MCCLELAND
The School of Information Technology and Electrical Engineering,
University of Queensland
Submitted for the degree of
Bachelor of Engineering (Honours)
in the division of Mechatronic Engineering
OCTOBER 2010

School of Information Technology and Electrical Engineering,
The University of Queensland,
St Lucia QLD 4072
Dear Professor Paul Strooper,
In accordance with the requirements for the degree of Bachelor of Engineering (Honours) in
the School of Information Technology and Electrical Engineering, I submit the following
thesis entitled
“National Broadband Network: A Risk Assessment and Cost-Effectiveness Analysis”.
This thesis was performed under the supervision of Professor David A. Williams. I declare
that the work submitted in this thesis is my own, except where acknowledged in the text, and
has not been previously submitted for a degree at The University of Queensland or any other
institution.
Yours sincerely,
Darryn McCleland


i
ABSTRACT The rollout of the new $43bn National Broadband Network is the largest ever infrastructure
project in Australia. This thesis conducts a thorough risk assessment and cost-effectiveness
analysis on the numerous hazards facing the NBN project. The risk assessment identifies 59
hazards under 7 main failure modes of: Construction, Operation, Demand, Network,
Technology, Financing and Regulation. The most significant contributors to the overall risk
ranking are the Regulatory hazards due to the political sensitivity and lack of regulation
surrounding the NBN Co and telecommunication implementation policies. This is closely
followed by Financial hazards due to the high cost of the $43bn project and the lack of
interest from private investors due to the extended return on investment period. The
underlying key hazards include, scope creep, increased demand for high speed broadband,
increased demand for mobility/wireless connectivity, overseas bottlenecks in network design,
high prices charged by Wholesaler/ISPs, lack of private investment, lack of
telecommunication and market competition policies, and political instability.
Several remedial actions are suggested to address the key hazards and reduce the overall risk.
These include: Liberal Party’s broadband plan, NBN 3.0, NBN 3.1, NBN 3.2, domestic
caching and regulatory reform policies. The most cost-effective remedial option is a
combination of the NBN 3.0 and domestic caching, which resulted in a 61.8% reduction in
risk. This option provides a purely 4G wireless network with domestic caching relocating key
static media to domestic servers to avoid overseas bottleneck data rates. While this option is
the most cost-effective due to its low price, it still doesn’t address some key concerns for
Australia’s broadband future. The NBN 3.2 plan, which is a combination of the Liberal’s
broadband plan and NBN 3.0 wireless network, focuses on sufficient fibre infrastructure
upgrades and the demand for mobile connectivity options. When combined with domestic
caching and regulatory reform, it results in a risk reduction of 62.4%, the lowest overall risk
ranking for the NBN Risk Model. While not the most cost-effective solution due to its slightly
higher construction costs, this plan is recommended for the inherent benefits that both
wireless and fixed HFC connection options provide to the public.


ii
ACKNOWLEDGMENTS
Firstly I would to thank Professor David Williams who not only presented me with the
opportunity to undertake a thesis that I found genuine interest in, but also provided support
and guidance in completing such a demanding thesis. His insight and ideas helped lead me
down new and exciting paths of research.
I would also like to thank my family for providing me with the opportunity to attend the
highly regarded and acclaimed University of Queensland. The knowledge and skills I have
gained whilst studying at the University of Queensland will continue to foster my career
aspirations.


iii
Table of Contents Abstract......................................................................................................................................i Acknowledgments ....................................................................................................................ii List of Tables ............................................................................................................................v List of Figures..........................................................................................................................vi List of Abbreviations ........................................................................................................... viii Definitions................................................................................................................................ix 1. Introduction.......................................................................................................................1
1.1. Aims.............................................................................................................................1 1.2. Scope............................................................................................................................1 1.3. Limitations ..................................................................................................................2
2. Literature Review .............................................................................................................5 2.1. Risk ..............................................................................................................................5 2.2. Risk Assessment .........................................................................................................5 2.3. Acceptable Risk ..........................................................................................................7 2.4. Fault/Event Tree Analysis .........................................................................................8
3. Theory ................................................................................................................................9 3.1. Background.................................................................................................................9
3.1.1. Australia’s Current Broadband Situation ..............................................................9 3.1.2. Importance of Broadband ....................................................................................11
3.2. Construction Hazards..............................................................................................15 3.2.1. Labour Shortage ..................................................................................................15 3.2.2. Scope Creep.........................................................................................................17 3.2.3. Latent Grounds ....................................................................................................19
3.3. Operational Hazards................................................................................................21 3.3.1. Contention ratio ...................................................................................................21 3.3.2. Maintenance and Equipment (Fibre) Failure.......................................................22 3.3.3. Security – Cyber Crime, Spam and Intellectual Property ...................................23
3.4. Demand Hazards......................................................................................................25 3.4.1. Decreased Demand..............................................................................................25 3.4.2. Increased Demand ...............................................................................................32
3.5. Network Hazard .......................................................................................................37 3.5.1. Design Bottlenecks..............................................................................................37
3.6. Technological Hazards.............................................................................................41 3.6.1. Wireless Technologies.........................................................................................41
3.7. Financial Hazards ....................................................................................................49 3.7.1. Financing Vehicles ..............................................................................................50 3.7.2. Private Investment ...............................................................................................53 3.7.3. Operating Revenue ..............................................................................................55
3.8. Regulatory Hazard...................................................................................................57 3.8.1. Regulatory Policies..............................................................................................57 3.8.2. Telstra’s Fibre Network and Customer Base.......................................................59 3.8.3. Political Instability...............................................................................................59

iv
4. Methodology ....................................................................................................................63 4.1. Risk Assessment .......................................................................................................63 4.2. Sensitivity Analysis...................................................................................................65 4.3. Cost-Effectiveness Analysis (CEA).........................................................................65
5. Results ..............................................................................................................................67 5.1. Fault Tree Analysis (FTA).......................................................................................70 5.2. Key Hazards .............................................................................................................79 5.3. Sensitivity Analysis...................................................................................................82 5.4. Remedial Actions......................................................................................................83
5.4.1. Liberal’s national broadband plan .......................................................................83 5.4.2. NBN 3.0...............................................................................................................85 5.4.3. Domestic Caching ...............................................................................................87 5.4.4. Regulatory Reform: .............................................................................................90
5.5. Cost-Effectiveness Analysis .....................................................................................93 6. Discussion ........................................................................................................................97
6.1. Sensitivity analysis ...................................................................................................97 6.2. Cost-Effectiveness ....................................................................................................99 6.3. Financial Concerns.................................................................................................103
6.3.1. How much should an NBN cost? ......................................................................103 6.3.2. Demand Concerns .............................................................................................106
6.4. Limitations and recommendations for further work..........................................107 7. Conclusion and Recommendations .............................................................................109 Appendices............................................................................................................................113
Appendix A - Labour Shortages .....................................................................................113 Appendix B - Telstra Case Study....................................................................................114
Method 1.........................................................................................................................114 Method 2.........................................................................................................................115
Appendix C – Companion Disk (NBN Risk Model)......................................................116 References.............................................................................................................................117

v
LIST OF TABLES Table 2.1 Risk Matrix Example .................................................................................................7
Table 3.1 NBN Estimated Construction Costs [12].................................................................19
Table 3.2 ISP’s Fibre Prices ....................................................................................................29
Table 3.3 List of submarine fibre optic cables connecting Australia [36]...............................38
Table 3.4 Advancements in mobile communication data rates [42], [43], [44], [45], [41] .....42
Table 3.5 Wireless Technology Fit for Market Needs [41] .....................................................43
Table 3.6 FTTP versus Wireless last mile connection.............................................................47
Table 3.7 ABS Internet Activity, December 2009 [47] ...........................................................56
Table 3.8 Labour’s NBN versus Liberal’s proposed broadband network ...............................59
Table 4.1 Likelihood Ratings...................................................................................................63
Table 4.2 Consequence Ratings...............................................................................................64
Table 5.1 Identified Hazards and Likelihoods of Failure ........................................................68
Table 5.1 Technological Hazards FTA....................................................................................71
Table 5.2 Risk Assessment Results .........................................................................................79
Table 5.3 Sensitivity Analysis Results ....................................................................................82
Table 5.4 Current NBN plan versus NBN 3.0 .........................................................................85
Table 5.5 Consumer Internet Traffic Forecast by Sub-Segments [31] ....................................87
Table 5.6 Remedial Action Costs ............................................................................................93
Table 5.7 Cost-Effectiveness Analysis of combination of remedial actions ...........................94
Table 6.1 Percentage of Risk Reduction................................................................................101
Table A.1 Forecasted BAU ICT Labour vs. NBN Demand for Labour ................................113

vi
LIST OF FIGURES Figure 3.1 Average monthly subscription price for broadband, 2009 [9] ...............................10
Figure 3.2 Fastest residential broadband download speed advertised, 2009 [9] .....................10
Figure 3.3 Percentage of fibre connections in total broadband subscriptions, 2009 [9]..........11
Figure 3.4 Contributions of ICT investment to GDP growth [10]...........................................12
Figure 3.5 OECD correlation between broadband penetration and GDP per capita [10]........13
Figure 3.6 Forecasted BAU ICT Labour vs. NBN Demand for Labour .................................16
Figure 3.7 Price Floor’s Surplus Effect ...................................................................................26
Figure 3.8 Average monthly subscription price for very high-speed connections ..................26
Figure 3.9 Average monthly subscription price for medium-speed connections ....................27
Figure 3.10 Range of broadband prices per Mbps by country [10] .........................................28
Figure 3.11 Diffusion of Innovations ......................................................................................30
Figure 3.12 Cisco’s Forecasted Global IP Traffic Growth Rate [31] ......................................32
Figure 3.13 Access speeds required by applications [32]........................................................33
Figure 3.14 Fixed Bandwidth Demand [33] ............................................................................34
Figure 3.15 The three stages of broadband user experience [32] ............................................34
Figure 3.17 Australia’s submarine cable connections [1]........................................................39
Figure 3.17 Advancements in mobile communication data rates (log graph) .........................45
Figure 3.18 4th Generation wireless speed tests for multiple users [33] ..................................46
Figure 3.19 Indicative shares of public infrastructure investment by financing vehicle in
Australia and the United Kingdom (2006-2007) [2] .......................................................51
Figure 3.20 NBN Project IRR versus required returns for private sector equity [17] .............53
Figure 3.21 Aggregate fibre take-up scenarios [17] ................................................................55

vii
Figure 3.22 Priority release sites across Australia [58] ...........................................................61
Figure 5.1 Construction Hazards FTA.....................................................................................70
Figure 5.2 Operational Hazards FTA ......................................................................................71
Figure 5.3 Demand Hazards FTA............................................................................................72
Figure 5.4 Network Hazards FTA ...........................................................................................73
Figure 5.5 Technological Hazards FTA ..................................................................................74
Figure 5.6 Financial Hazards FTA ..........................................................................................75
Figure 5.7 Regulatory Hazard FTA .........................................................................................76
Figure 5.8 Combination of individual FTAs leading to Top Event.........................................77
Figure 5.9 Risk ranking results for various hazards to the NBN.............................................80
Figure 5.10 Consumer Internet Traffic Forecast by Sub-Segments [31].................................88
Figure 6.1 Sensitivity Analysis ................................................................................................97
Figure 6.2 Telstra’s five-year share price, September 2006-2010 [66] .................................104
Figure 6.3 Telstra versus ASX 200, September 2006-2010 [66]...........................................105
Figure B.1 Telstra’s Revenue and product profitability [67].................................................114

viii
LIST OF ABBREVIATIONS AAB Alliance for Affordable Broadband
BAU Business As Usual
CAGR Compound Annual Growth Rate
CDN Content Delivery Network
CEA Cost-Effectiveness Analysis
DSL Digital Subscriber Line
FTA Fault Tree Analysis
FTTN Fibre to the Node
FTTP Fibre to the Premises
Gbps Gigabits per second
GTEs Government Trading Enterprises
HFC Hybrid Fibre Copper
ICT Information Communication Technology
IP Internet Protocol
IPTV Internet Protocol Television
Kbps Kilobits per second
LTE Long Term Evolution
Mbps Megabits per second
MIMO Multiple Input Multiple Output
NBN National Broadband Network
OECD Organisation for Economic Co-operation and Development
OLT Optical Line Terminal
ONT Optical Networking Terminal
PAYGO Pay As You Go
PB Petabyte
PFI Private Financing Initiative
PPP Private Public Partnership
RBBP Regional Backbone Blackspot Priority
RRR Required Rate of Return
TCO Total Cost of Ownership
WACC Weighted Average Cost of Capital
Wi-Fi Wireless Fidelity
Wi-Max Worldwide Interoperability Microwave Access

ix
DEFINITIONS
1. Broadband – download data transfer rates equal to or greater or greater than 256kbps
in accordance with OECD standards
2. Harm – Physical injury or damage to health, property or the environment
3. Hazard – Source of potential harm or a situation with a potential for harm
4. Hazardous event – Event which can cause harm
5. Hazard identification – Process of recognising that a hazard exists and defining its
characteristics
6. High speed Broadband – download data transfer rates equal to or greater than 10Mbps
7. Infrastructure bonds - A financial instrument by which the bond holder loans money
to the government for a fixed term and receives periodic interest payments. On
maturity, loan money is returned to the bond holder.
8. Last mile - is the final leg of delivering connectivity from a communications provider
to a customer
9. Latency – is a measure of the time delay experience in a system.
10. PAYGO - is the practice of financing expenditures with funds that are currently
available rather than borrowed.
11. Public good - is a good that is non-rivalrous and non-excludable, which results in
positive externalities that are not remunerated.
12. Risk – Combination of the frequency, or probability, of occurrence and the
consequence of a specified hazardous event
13. Risk analysis – Systematic use of available information to identify hazards and to
estimate the risk to individuals or populations, property or the environment
14. Risk assessment – Overall process of risk analysis and risk evaluation
15. Risk control – Process of decision-making for managing and/or reducing risk; its
implementation, enforcement and re-evaluation from time to time, using the results of
risk assessment as one input
16. Risk estimation – Process used to produce a measure of the level of risk being
analysed. Risk estimation consists of the following steps: frequency analysis,
consequence analysis and their integration.
17. Risk evaluation – Process in which judgements are made on the tolerability of the risk
on the basis of risk analysis and taking into account factors such as socio-economic
and environmental aspects.

x
18. Risk management – Systematic application of management policies, procedures and
practices to the tasks of analysing, evaluating and controlling risk.
19. RRR - The minimum rate of return that an investment must provide or must be
expected to provide in order to justify its acquisition.
20. System – Composite entity, at any level of complexity, of personnel, procedures,
materials, tools, equipment, facilities and software. The elements of this composite
entity are used together in the intended operational or support environment to perform
a given task or achieve a specific objective.
21. WACC – The calculation of a firm's cost of capital in which each category of capital
is proportionately weighted.

1
1. INTRODUCTION The National Broadband Network (NBN) is Australia’s largest ever infrastructure project,
costing $43 billion to construct over 9 years. It is a Labour government initiative undertaken
to provide high speed broadband to all Australians. Fibre optic connections will be provided
to 90% of Australian premises, providing speeds of 100Mbps, while the remaining rural and
remote areas will be serviced by a combination of wireless or satellite technologies providing
speeds of at least 12Mbps. The following introductory section establishes the aims, scope and
limitations of the following risk assessment and cost-effectiveness analysis of the NBN.
1.1. AIMS
This thesis seeks to identify the inherent risks associated with undertaking the NBN project,
provides remedial actions to address the most severe risks and analyses the cost effectiveness
of the remedial actions. The risk assessment identifies relevant hazards and through
quantitative analysis assigns likelihoods (probabilities of failure) of hazards occurring along
with the respective consequence ratings of such hazards. A sensitivity analysis helps to
identify the effect of the inputs of likelihood and consequence on the overall risk ranking
output. Remedial actions are then identified to address the most severe hazards and to either
target the likelihood or consequence based on the sensitivity analysis results. The cost-
effectiveness analysis compares the relative costs and outcomes of the various remedial
actions. The most cost-effective solution can then be suggested to minimise risks of the NBN
project.
1.2. SCOPE
This risk assessment identifies risks associated with the NBN project as of 2010. The
proposed remedial actions are designed to target the current foreseeable risks of the project.
As the NBN project’s rollout is over a 9 year period, there will be another election during the
construction phase. The immediate effects of this election on risk will be considered,
however the resulting effect on the NBN project should a change of ruling party come about
2
cannot be accurately foreseen and is beyond the scope of this thesis. As such, risks and
remedial actions have been identified based on the following assumptions:
• The Australian Labour Party is the ruling political party.
• The NBN plan incorporates a $43 billion investment, with FTTP for 10% of Australians
and remaining premises being serviced by a combination of wireless and satellite
technologies. The project is expected to take 9 years to rollout and commenced in 2010.
In order to conduct the risk assessment and assign likelihood ratings, the modes of failure for
the NBN must be fully understood. The following factors will act as performance measures
for the project:
• Financial - exceeding the budgetary constraint of $43 billion by 10%,
• Project delivery - exceeding the build time of 9 years by 10 months,
• Project life span – failure to remain operational for 20 years from first build without the
need for significant upgrades,
• Geographic - failure to reach at least 90% of the Australian population with high speed
broadband (i.e. above 10Mbps), and
• Geographic – failure to provide at least 99% of the Australian population with broadband
services (i.e. above 256Kbps).
Likelihood ratings are assigned to the various hazards with these performance measures in
mind.
1.3. LIMITATIONS
Any risk analysis should be comprehensive, but it must remain feasible given the available
time and resources. A $25 million preliminary implementation study into the National
Broadband Network by KPMG McKinsey provides an indication of the amount of time and
financial resources this $43 billion infrastructure project requires.

3
A Risk assessment is a process that does not result in a fixed final answer. Due to the nature
of the NBN project and the duration of the risk assessment being conducted over a 10-month
period, certain contributing factors were in a state of transition.
These include:
• Political instability due to the Federal election
• Recovering economic climate post global financial crisis
• Initial stage 1 testing and installation of fibre network in Tasmania
The risk assessment and cost-effectiveness analysis has been conducted with the above
factors in mind.

4

5
2. LITERATURE REVIEW The following literature review highlights prior research and risk assessment methods. The
Fault/Event Tree Analysis method is also discussed as a hazard identification and causal
relationship tool.
2.1. RISK
Risks in infrastructure projects are usually broken down into seven main failure modes of;
Construction, Operation, Demand, Network, Technology, Financial and Regulation [2]. Risk
can be further classified into two categories; voluntary and involuntary. Voluntary risks are
those willingly undertaken by an individual having control over their actions. Normal risks
associated with living in society, such as those incurred through exposure to crime, aircraft
crash on housing, domestic gas explosions etc. are usually considered to be of the involuntary
type [3]. Risk is said to exist if there are potential sources of damage or hazard and risk is the
combination of damage plus uncertainty of the hazard occurring. In engineering applications,
risk is formally defined as the product of the probability of failure and consequences [4]:
Risk = (Probability of failure) x (Consequences of failure)
2.2. RISK ASSESSMENT
Risk assessments are able to address multiple failure modes. It is a diagnostic tool that
accounts for all components of uncertainty and the factors affecting the risk, be it technical,
human or otherwise. [4]. Vick (2002) explains the process of adverse events occurring as
having three parts: (1) an Initiator that begins it, (2) the Response of the structure to the
initiator, and (3) the consequences if inadequate response results in failure.
A risk assessment is primarily a scenario development tool that seeks to understand the risk
contribution from each possible scenario that leads to the hazardous outcome or event of
interest [5]. Once hazards have been identified it is essential to prioritise them so that action
can be taken and so that they can be dealt with in a suitable way [6]. Each of the identified

6
hazards must be examined to determine all the barriers that contain it or intervene to prevent
or minimize exposure to the hazard. The steps needed to maintain the integrity of the barrier
represents the challenges to barriers. The probability or frequency of exposure to the hazard
should also be identified for each scenario. Finally, the consequences of being exposed to the
hazard should be understood. The process can be formalized through the following steps [5]:
1. Identification of Hazards
2. Identification of Barriers
3. Identification of Challenges to Barriers
4. Estimation of Hazard Exposure
5. Consequences evaluation
Risk assessments are continuous and should not be regarded as a one-off exercise. There are
three types of risk assessment that all form part of a safety management system [4]:
• Baseline risk assessment – which assesses where a company is in terms of risk,
identifying major risks and thereby establishing their priorities and a program for
future risk control.
• Issue based risk assessment – as circumstances and needs arise, separate risk
assessment studies need to be conducted. An additional risk assessment will need to
be carried out when, for instance, a new machine is installed, a system of work is
changed or operations alter, after an accident or ‘near-miss’ has occurred, as new
knowledge comes to light and information is received which may influence the level
of risk to employees.
• Continuous risk assessment – This is the most important form of risk assessment that
should take place continually, as integral part of day-to-day management. This
includes audits, general hazard awareness linked to a suggestion theme, pre-work
assessments using checklists.
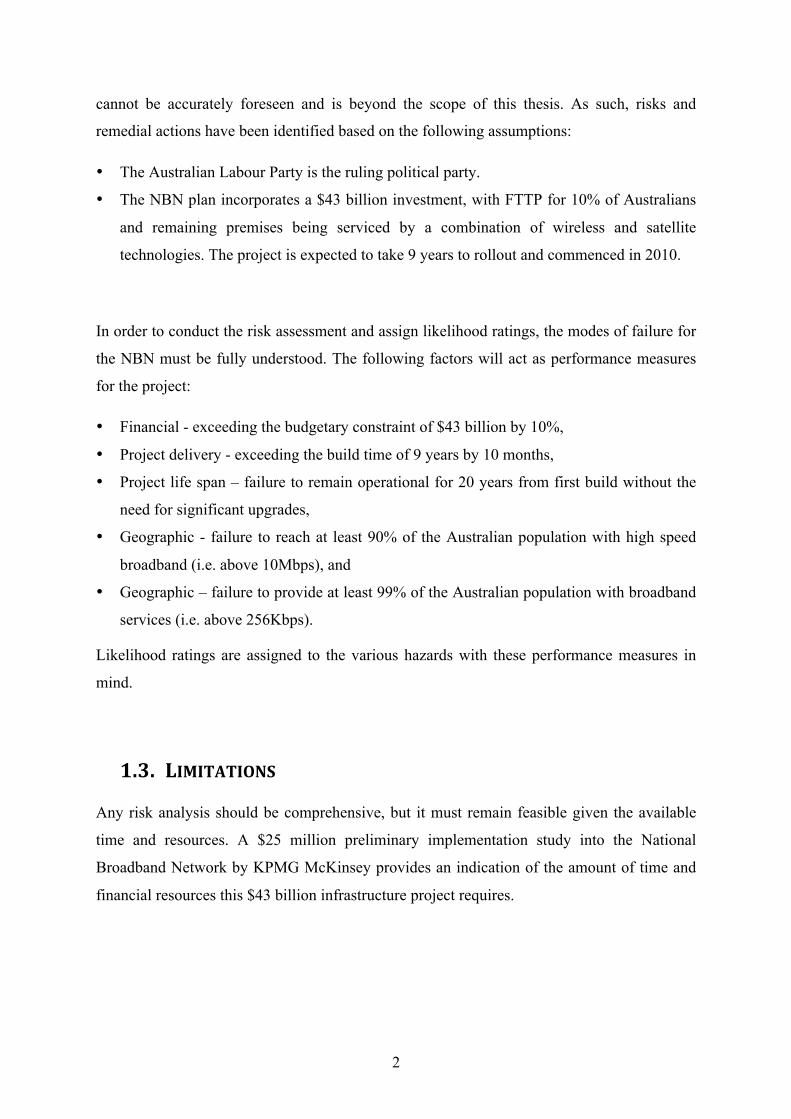
There are several approaches that can be used for the measurement of risk. The Risk Matrix
type approach categorises the consequences of the hazard and their likelihood separately.
They are then combined in a matrix to represent priority, as shown below [6].
7
Table 2.1 Risk Matrix Example
Multiple Fatalities 1 2 3 4
Fatality 2 3 4 5
Reportable Accident 3 4 5 6
Con
sequ
ence
s
Loss Time Accident 4 5 6 7
Once a
month
Once a
year
Once every
10 years
Once in a
Lifetime
Likelihood
A risk matrix can be used to accurately identify key hazards by combing the likelihood of
occurrence and consequence rating of the hazard occurring.
2.3. ACCEPTABLE RISK
The results of risk assessments can be used in a relative manner to methodically rank risk-
exposure levels. De facto levels of socially tolerated (acceptable) levels of risk exposure can
define acceptable risk thresholds. For example, the risk of death from Car accidents is 1 in
5300. There are similar risks related to other major causes of death from cardiovascular
disease through to homicide, which are tolerated by society [5]. The level of risk that is
tolerated depends greatly on the values, beliefs and attitudes of society, thus varying from
community to community [3].
Although regulators often strive to assess absolute levels of risk, the relative ranking of risks
is a better risk management strategy for allocating resources towards regulatory control.
Ensuring system risks are below regulatory safety targets is often an important criterion in the
decision-making process. A risk may be tolerable if the benefits appear to exceed the risk [3].
Cost-benefit analysis is often required as an adjunct to formulating risk-control strategies to
socially acceptable levels [5]. Cost-benefit analysis is effectively a measure of the
willingness to live with a risk in order to secure the benefits, and in the confidence that the
risk is being properly controlled [3].

8
Another form of risk ranking is to use odds or the probability of hazard exposure per unit of
time. Another more objective method of risk comparison examines the duration of the
exposure and is used for comparison purposes using consistent units such as dollars lost per
year. The societal benefits and the cost trade-offs for risk reduction are widely used guides to
set and justify risk acceptability limits. By comparing the risks and benefits associated with
certain activities, fair, balanced and consistent limits for risk acceptability can be set and
institutional controls on risk can be established [5].
2.4. FAULT/EVENT TREE ANALYSIS
Fault Tree analysis is a systematic, deductive technique which allows the development of
causal relations leading to a given undesired event, called the Top Event [7]. It accounts for
the interaction of many events to produce other events. Simple logical relationships such as
intersection and union are used to methodically build a logical structure, which represents the
system.
Event trees follow a similar method to that of Fault Tree Analysis. They use logic methods
for identifying the various accident sequences which can generate from a single initiating
event. An event tree begins with a defined accident-initiating event. It follows that there is
one tree for each different accident-initiating event considered. Once an initiating event is
defined, all the safety functions that are required to mitigate the accident must be defined and
organised according to their time of intervention [8]. In the case of the NBN, the seven failure
modes identified before are the initiating events.
9
3. THEORY This section discusses the main underlying hazards that could lead to the seven failure modes
of Construction, Operation, Demand, Network, Technology, Finance and Regulation. A brief
background of Australia’s current broadband situation is also provided to help understand
some of the reasons for undertaking the NBN and the effect it will have on Australia.
3.1. BACKGROUND
The NBN will be a wholesale only, open access network. The Government has established a
new company, NBN Co. Ltd, to design, build and operate the new NBN. Australia’s current
aging broadband network has prompted the government initiative to maintain Australia’s
strong economic growth and to gain various broadband and online benefits that are discussed
below.
3.1.1. Australia’s Current Broadband Situation
The NBN project was commissioned to address Australia’s aging broadband infrastructure.
The NBN seeks to provide Australians with high speed broadband at reasonable prices. In
2009, Australia’s broadband was ranked the fifth most expensive out of the 30 OECD
Countries, as shown in Figure 3.1 below.

10
Figure 3.1 Average monthly subscription price for broadband, 2009 [9]
The speed of Australia’s broadband is falling behind technology leaders like Japan, Korea,
Germany and the USA as shown in Figure 3.2. Australia’s fastest advertised broadband
speeds in 2009 were 30Mbps. This may have increased since to speeds around 50Mbps, but
the relative position of Australia’s broadband situation still remains the same.
Figure 3.2 Fastest residential broadband download speed advertised, 2009 [9]
55.64
0
10
20
30
40
50
60
70
80
90
100 USD
PPP
per m
onth
30000
10 000 20 000 30 000 40 000 50 000 60 000 70 000 80 000 90 000 100 000 110 000
Kbps

11
Figure 3.3 Percentage of fibre connections in total broadband subscriptions, 2009 [9]
In terms of technology, fibre is yet to be offered to Australian residential broadband users. A
number of other OECD countries already have a significant penetration of fibre connections
into their broadband market, as shown in Figure 3.3 above.
3.1.2. Importance of Broadband
One of the main reasons stipulated by the Australian government for the construction of the
NBN project is the positive impact that ICT investment and broadband has on the economy.
Broadband has the ability to accelerate and enhance economic growth, improve social and
cultural developments and facilitate innovation. Widespread and affordable broadband access
can contribute to productivity and growth through applications that promote efficiency,
network effects and positive externalities, with benefits for business, the public sector and
consumers. As shown in Figure 3.4 below, Australia shows the highest correlation between
ICT investment and GDP growth amongst OECD nations.
0% 10% 20% 30% 40% 50% 60%
Australia Ireland
Switzerland Italy
Netherlands Iceland
Czech Republic Hungary
United States OECD
Norway Denmark
Slovak Republic Sweden Korea Japan

12
Figure 3.4 Contributions of ICT investment to GDP growth [10]
The private sector benefits from broadband in the form of e-business and new market
opportunities, allowing small and medium sized enterprises to realise growth through
productivity increases [11]. Broadband enables the emergence of new business models, new
processes, new inventions, new and improved goods and services. It increases competition in
markets and flexibility in the economy, for example by the increased diffusion of information
at lower cost, by improving access to increasingly larger markers, by allowing people to work
from multiple locations with flexible hours and by generally speeding up procedures and
processes [10]. The public sector such as health, education and government services, also
benefit from the productive efficiencies that broadband has to offer. Broadband can enhance
quality of life for residential consumers through economic, social and cultural development.
Broadband access allows rural and remote communities to experience economic and social
inclusion. It can facilitate access to new and advanced goods and services, as well as
opportunities to participate in the digital economy and information society [11]. There is also
believed to be a correlation between broadband penetration and GDP Capita as shown in
Figure 3.5 below. If this correlation is correct, then the introduction of high speed broadband
through the NBN project will hopefully lead to an increase in broadband penetration, which
in turn may lead to higher GDP per Capita and better standards of living.
0.0
0.1
0.2
0.3
0.4
0.5
0.6
0.7
0.8
0.9
1.0 Percen
tage
1990‐95
1995‐2003 (1)

13
Figure 3.5 OECD correlation between broadband penetration and GDP per capita [10]
Another reason for the NBN is the health care benefits it will provide. People living in rural
and remote areas will have improved access to specialist doctors without having to travel
long distances. All Australians will benefit from better-informed diagnosis, targeted treatment
and patient management enabled by online collaboration between health professionals and
the instant transmission of diagnostic images, such as x-rays.
0
20,000
40,000
60,000
80,000
100,000
120,000
0
5
10
15
20
25
30
35
40
GDP pe
r Capita
Broadb
and pe
netraX
on percentage
Broadband penetraXon (%)
GDP per capita (USD PPP)

14

15
3.2. CONSTRUCTION HAZARDS
The NBN project is being built over a 9-year period, starting with fibre rollout to 100,000
premises in Tasmania. There are a number of hazards, which will become evident during the
design and construction phase of the project. For example, a shortage of materials and
hardware such as OLTs (Optical Line Terminals), ONTs (Optical Networking Terminals) and
fibre optic cable may affect the project at some stage in the construction lifespan. There may
also be operational security issues determined by the amount of fibre placed along power
lines (aerial), therefore making the cable more accessible than ducted or buried fibre. The
enormous scale of the NBN provides the hazard of third party integration, where the various
contractors building the network run the risk of using different standards for construction and
operation. NBN Co’s coordination of contractors during the construction phase will be of
utmost importance. The hazards of labour shortage, scope creep and latent grounds are
determined to present the highest likelihood of occurrence and are discussed in more detail
below.
3.2.1. Labour Shortage
The NBN project will require a peak labour force of around 18 000 during years 4 to 7 of
construction [12]. This is based on 15% of the project being completed per year during this
period and will therefore require the peak number of personnel. This labour force will be
required in addition to the existing labour force employed in the Information and
Communication Technology sector. Strong growth in the Australian economy has led to a
dramatic drop in unemployment rates over the last decade. This decline in unemployment
rates has seen the pool of surplus labour disappear [13]. There are a number of factors that
could influence the shortage of skills such as:
• Growth of new industries with few ready-skilled trades people available
• Lack of interest in particular industries among job seekers
• Technology changes within an industry, especially production, resulting in new methods
and therefore new skills needs which are not being successfully incorporated in existing
training
• Growth in demand for new skills or work practices, associated with the pressure of
globalisation, international competition and structural change
16
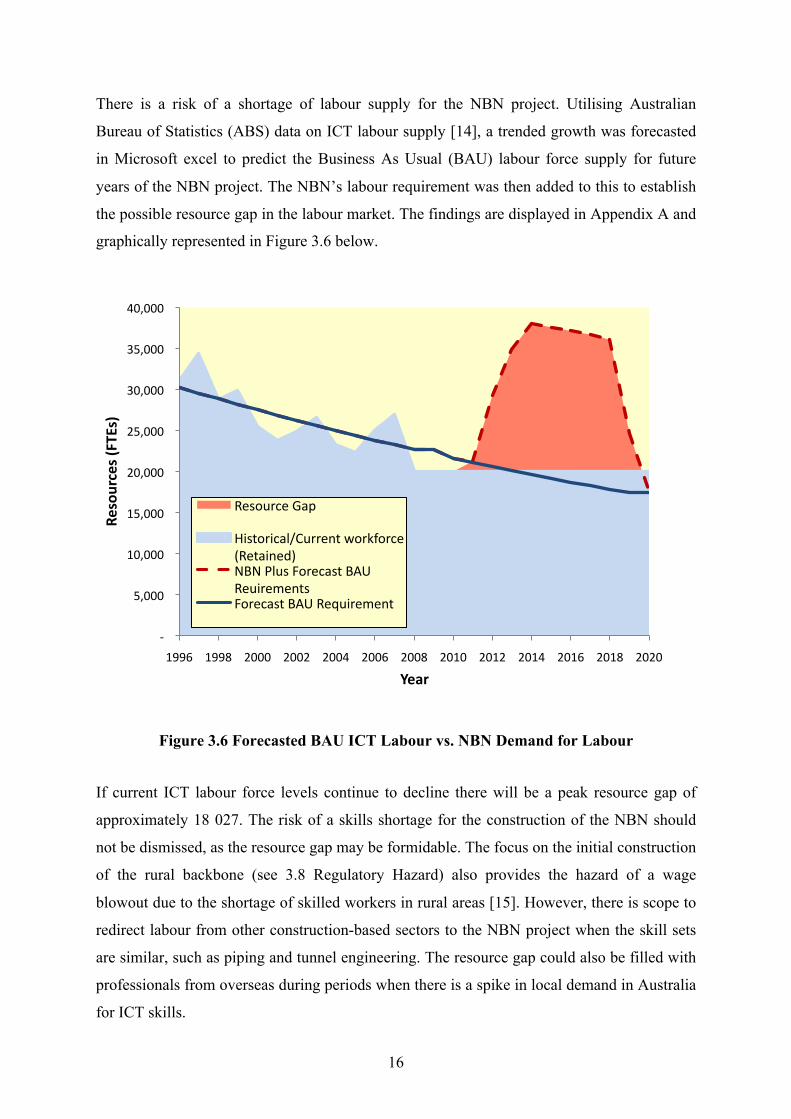
There is a risk of a shortage of labour supply for the NBN project. Utilising Australian
Bureau of Statistics (ABS) data on ICT labour supply [14], a trended growth was forecasted
in Microsoft excel to predict the Business As Usual (BAU) labour force supply for future
years of the NBN project. The NBN’s labour requirement was then added to this to establish
the possible resource gap in the labour market. The findings are displayed in Appendix A and
graphically represented in Figure 3.6 below.
Figure 3.6 Forecasted BAU ICT Labour vs. NBN Demand for Labour
If current ICT labour force levels continue to decline there will be a peak resource gap of
approximately 18 027. The risk of a skills shortage for the construction of the NBN should
not be dismissed, as the resource gap may be formidable. The focus on the initial construction
of the rural backbone (see 3.8 Regulatory Hazard) also provides the hazard of a wage
blowout due to the shortage of skilled workers in rural areas [15]. However, there is scope to
redirect labour from other construction-based sectors to the NBN project when the skill sets
are similar, such as piping and tunnel engineering. The resource gap could also be filled with
professionals from overseas during periods when there is a spike in local demand in Australia
for ICT skills.
‐
5,000
10,000
15,000
20,000
25,000
30,000
35,000
40,000
1996 1998 2000 2002 2004 2006 2008 2010 2012 2014 2016 2018 2020
Resources (FTEs)
Year
Resource Gap
Historical/Current workforce (Retained) NBN Plus Forecast BAU Reuirements Forecast BAU Requirement
17
3.2.2. Scope Creep
Every project should have a set of deliverables, an assigned budget and an expected closure
time. These constitute the scope of the project. Any variation in the scope of a project can
affect the schedule, budget and in turn, the ultimate success of the project. If requirements
originally excluded are later included and constitute a variation, the project scope will extend.
The NBN’s project scope is set to deliver fibre to 90% of Australian premises at a cost of $43
billion over a 9-year project rollout. Scope creep can occur when this line is moved, usually
outwards, to extend current features or include additional features.
Scope creep can be classified as Technical or Business scope creep [16]. The technical scope
creep can show up when the project team wants to please the customer and is not able to
reject the customer's request for a change in the requirements during project execution. Gold
plating is another reason, which can cause technical scope creep. In this case, the project team
or design team adds additional features and functionality that are not part of original
requirements in order to please the customer. The NBN project has already seen a form of
technical scope creep in the form of fibre being extended from 90% to 93% coverage of
Australian premises. This scope creep came as a result of the implementation study
conducted by McKinsey & Company and KPMG which suggested an extension of coverage
to 93% of Australian premises [17]. However, the additional coverage still remains within the
existing budgetary constraints.
Business scope creep occurs due to external forces that may be beyond the control of a
project manager. An example might be the continual changes in market trends, which makes
previously defined requirements now obsolete. The NBN may be prone to business scope
creep in the form of wireless being opted for instead of fibre for the “last mile” connection. In
this case, the market demand for wireless mobility may lead to a change in design to discard
FTTP (Fibre to the premises) and instead implement a FTTN (Fibre to the Node) network
with wireless communications used for the last mile connection (see section 3.6.1 Wireless
Technologies).
18
One can avoid scope creep by managing the scope of the project effectively. There are a
number of ways to control or avoid scope creep [16]:
• Involve the customer and/or the end users early in the project.
• Thoroughly analyse and gather requirements during the initial stages of the project.
• Introduce a Change Control Board (CCB) team that would evaluate the risk of
implementing the changes.
• Make sure to involve critical stakeholders throughout the project phases (especially
during the planning phase).
• Avoid gold-plating and gain the ability to refuse changes in requirements with proper
reasons and support.
• In extreme cases, stop the project so that new additional requirements can be properly
scoped and integrated rather than tacked on.
The NBN project evidently follows and breaks a number of the above rules for controlling
and/or avoiding scope creep. Firstly, the lack of a preliminary cost benefit analysis started the
project on unsteady grounds, as the exact benefits from such a large infrastructure investment
have not been clearly articulated. Since then, an implementation study conducted by KPMG
& McKinsey has made suggestions to alter certain aspects, although most of these do not
affect the construction of the project. There has also been discussion and suggestions by a
group of telco chiefs, namely the Alliance for Affordable Broadband (AAB), that the NBN
plan should be amended to a FTTN network with 4G wireless technology used for the last
mile connection. A form of “gold plating” scope creep could occur if wireless last mile
connections were provided, in addition to FTTP.
Scope creep can lead to projects exceeding budgets and/or taking longer to complete. The
NBN project has already undergone minor changes to design, such as the extent of fibre
coverage and the planned release sites, but this has not led to any increase in costs or change
on the project completion date. The lack of a cost-benefit analysis may result in a number of
changes to the NBN as certain aspects of the fibre network may be found to be more essential
to certain parts of the Australia than others. For example, since the recent 2010 Federal
elections there has been an amendment to the priority release sites to gain access to the fibre
network in addition to hospitals, schools and rural areas priority release sites (see section 3.8
Regulatory Hazard).
19
3.2.3. Latent Grounds
Latent grounds refer to unforseen circumstances that may alter or affect the construction and
progress of the NBN project. The lack of an in depth preliminary study is often a precursor to
the delay of works and exceeding budgets due to latent grounds. One of the major causes for
concern for the NBN project in terms of latent grounds is the amount of hard rock that will be
encountered during tunnelling operations. The amount of hard rock has an affect both on the
time and cost that it takes to tunnel through as opposed to soil. The geological consistency of
the land over the entire NBN network is difficult to predict and uncertainty exists as to the
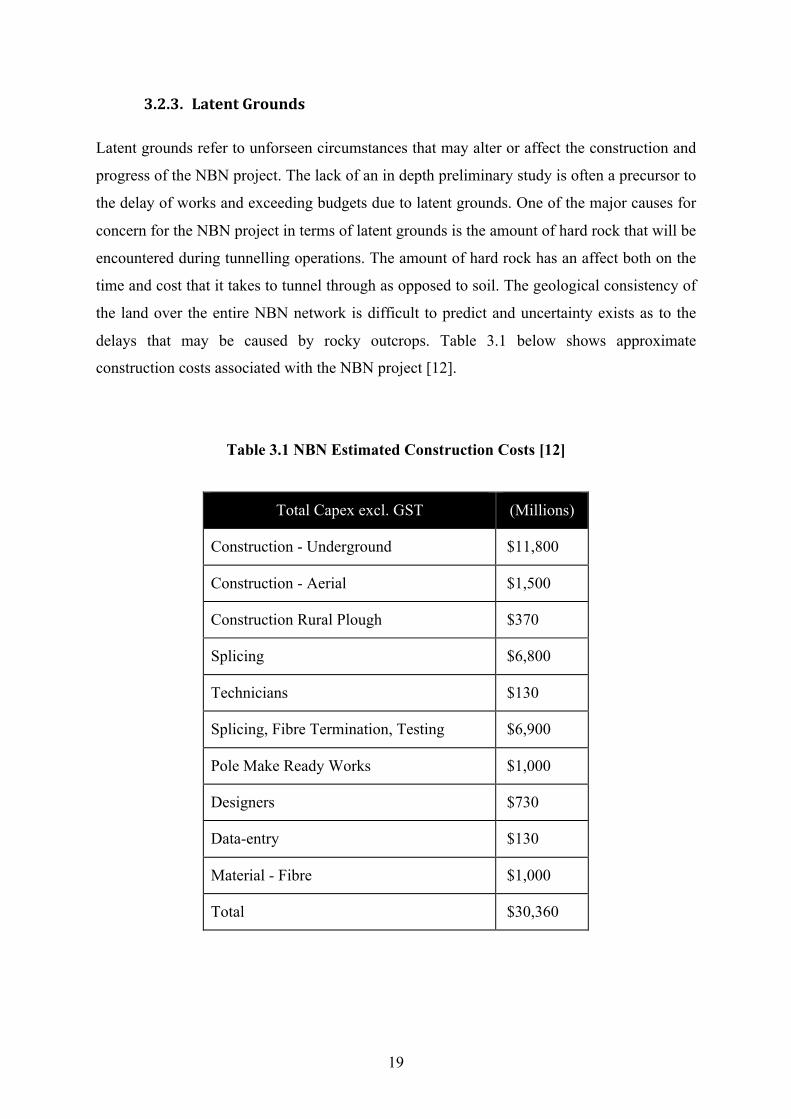
delays that may be caused by rocky outcrops. Table 3.1 below shows approximate
construction costs associated with the NBN project [12].
Table 3.1 NBN Estimated Construction Costs [12]
Total Capex excl. GST (Millions)
Construction - Underground $11,800
Construction - Aerial $1,500
Construction Rural Plough $370
Splicing $6,800
Technicians $130
Splicing, Fibre Termination, Testing $6,900
Pole Make Ready Works $1,000
Designers $730
Data-entry $130
Material - Fibre $1,000
Total $30,360

20
The underground construction represents the greatest cost in the construction phase, totalling
$11.8 billion. This figure is based on 50% of fibre requiring underground construction such
as ducts and pits to house the cable. This means that the total construction costs are highly
sensitive to any fluctuations caused by delays in tunnelling and underground construction.
The risk of latent grounds is considerable due to the large cost placed on underground
construction. However, the percentage of aerial works, which is the amount of fibre placed
along power and telephone lines, has the opportunity to decrease construction costs and the
time delay compared to underground construction. The greater the percentage of fibre aerial
works, the less risk there is from latent grounds due to underground construction. There is
however an increase in risk for Operational hazards, as aerial works allows easier access to
the fibre cable and therefore increased security hazards. This does not go without saying that
aerial works doesn’t carry its own inherent risk and can be affected by latent grounds too, but
the sensitivity of overall costs to a slight change in construction costs means that there is less
cause for concern with a greater percentage of aerial works.

21
3.3. OPERATIONAL HAZARDS
Operational risk is commonly associated with unexpected problems in staff management,
maintenance and other elements of operating the infrastructure and is usually present from
the commencement of operations [2]. Operational risk could arise if the planned level of
service availability from the NBN network does not eventuate. One of the main reasons for
the construction of the NBN project is to provide economic benefit to Australia through
productivity enhancements [18]. There is a risk that large-scale power, network and hardware
outages could cause a major loss in productivity for businesses dependent on ICT services.
Such hazards can be addressed through the introduction of design redundancies, which
takeover operation from failed nodes in the network. There are also operational hazards when
the network is fully functioning. Security of the content transferred over the NBN also
threatens to affect the productivity benefits that the network could offer to the economy.
3.3.1. Contention ratio
The contention ratio is the ratio of the potential maximum demand to the actual bandwidth.
The higher the contention ratio, the lower the effective bandwidth as a large number of users
may place demand on the bandwidth at the same time, especially during peak usage times
[19]. Generally, ISP’s offer business broadband services with a contention ratio of 20:1,
while some residential ratios can be as high as 150:1. A ratio of 20:1 means that the
broadband users share their broadband speed, of say 20Mbps, with 20 other premises. If each
user was accessing their connections equally at the same time then they could expect speeds
of around 1Mbps. In the case of the NBN, a contention ratio of 32:1 can be expected [20]. It
is for this reason that we can expect that constant actual download speeds of 100Mbps for the
NBN will not materialise as the 100Mbps bandwidth will be shared amongst the various users
accessing the same exchange point. Even if 100Mbps was possible for all users on the same
exchange point, then the actual network and fibre backbone would struggle to cope with the
broadband demand. The 20 users accessing 100Mbps would have a total download
bandwidth of 2Gbps. If this scenario was to eventuate over a number of exchange points
simultaneously, then there would be a network overload and the speed would have to slow
down at some point. This clearly illustrates that a hazard exists that the 100Mbps of the NBN
will not eventuate. This will depend on the final decisions in design of the network to
accommodate design redundancies in order to cope with peak network demands.

22
3.3.2. Maintenance and Equipment (Fibre) Failure
The estimation of the life span of a project is essential for economic practices to determine
whether a project is economically viable. A capital-intensive project like the NBN will
require sufficient operating lifespan in order to financially recover the capital investment in
the project. Lower than expected equipment life and the resulting diminished operational
lifespan is a hazard to the NBN project.
The NBN project places utmost importance on the use of fibre optic cable to provide FTTP
connections to over 90% of Australian premises. There is concern that the lifespan of the
fibre optic cable may be lower than expected. The varying environmental conditions from the
fibre cable either being placed in ducts or along power lines will impact the life span of the
fibre cable. Manufacturers calculate an expected life of around 60 years for fibre optic cables
[21]. The calculation takes into consideration fatigue and stress corrosion susceptibility,
which accounts for environmental factors such as water, wind and heat. The 60 year
prediction can be applied to a relatively stable environment such as an underground duct.
Australia’s temperate climate favours underground fibre cable. Cable exposed to water and
extreme cold temperatures can lead to ice formation and stress cracking of the fibre cables.
The harsh Australian sun can be detrimental to aerial fibre optic cables placed along power
lines and exposed to the elements. Modern fibre cables utilise UV protective shielding that
protects the cable. Aerial fibre cables will also be susceptible to increased mechanical
stressing from winds. As a result, a 25% decrease in lifespan to approximately 45 years is
predicted for aerial fibre cables due to environmental stresses. This figure is backed up by the
KPMG McKinsey Implementation study, which confirms 40 years or more lifespan for fibre
cabling [17].
As is the case with any infrastructure, adequate maintenance of the NBN will be essential.
The breakdown of equipment is an expected occurrence but the success of the operation of
the network will be dependent on the ability to control breaks in transmission. Australia
already has in place a successful “Dial Before You Dig” referral service for information on
underground pipes and cables. This campaign reduces the likelihood of fibre cable being
damaged by digging.

23
Maintenance and equipment failure is always a considerable concern for infrastructure
projects like the NBN. The inert nature of fibre compared to copper cabling, which is prone
to corrosion and fibre’s relatively long lifespan presents less of a maintenance hazard than a
copper network. The NBN will require maintenance as is the case with any project but these
costs should be relative to the size of the network.
3.3.3. Security – Cyber Crime, Spam and Intellectual Property
As is the case with any infrastructure project, the safety and security of customers using the
end product is of utmost importance. If an asset is deemed to be unsafe or insecure for
customers to use then it is deemed a failure in providing a service to the customer. The NBN
is unlikely to present any physical safety concerns to the average user, however users will be
susceptible to online security attacks in one way or another. A recent survey of Internet and
email users indicates the current scale of security threats present.
• The number of people who received phishing attacks doubled between 2004 and 2006,
from 57 million to 109 million [22].
• It is estimated that between 50% and 65% of all e-mail is spam. While some 80% of
organizations have some form of anti-spam technology in place, even protected
employees will spend as much as 80 minutes per 1,000 e-mails (about 2.4 work days a
year) dealing with spam [23].
Strategies to prevent spam are proving costly, because of the need to involve governments
and ISPs as no standard approach exists [24]. While spam poses a serious threat to offsetting
some of the productivity benefits that the NBN will provide, there are also concerns about
malicious viruses and spyware that affect computer performance and can lead to identity
theft. If online security threats are not sufficiently addressed, then the inherent benefits
provided by the NBN could be diminished. Some of the benefits such as remote access for
daily tasks, like Internet banking, could be discarded as an option for some users. The
monetary losses for victim from credit card and identity fraud have more than quadrupled
since 2005. A survey found that 23 percent of online banking consumers have reverted back
to offline methods because of security concerns [22].
24
As the Internet is a global access platform, governments need to collaborate in order to
control cybercrime through consistent policy making. This will prevent online criminals from
hiding behind a wall of bureaucracy in a country which may have Internet laws that
essentially protect criminals and assist criminal activities. In order to press down on
cybercrime, police will need to have real-time access to network traffic, and new powers to
rapidly secure evidence held on computer systems. [25] Australia has signed up to a global
treaty aimed at fighting fraud and other offences committed using the internet such as
computer hacking, child pornography and copyright infringement [25]. The convention,
which provides a standard framework for investigating and prosecuting crimes involving the
internet across national borders, has been adopted by more than 45 countries, including the
US, Canada and Japan, since it began in 2004. This is a step in the right direction for securing
NBN customers from malicious cyber attacks.
The security hazard from cybercrime, spam and intellectual property is present on current
broadband networks. There is no indication that a high-speed broadband network will
facilitate these criminal activities further, but there is cause for concern over the reduction in
economic productivity due to this security hazard.
25
3.4. DEMAND HAZARDS
The demand hazards facing the NBN arise because the demand for the NBN services might
not meet expectations. This risk is present throughout the life of the project, both during
construction and operation. An unanticipated decline in customer demand for the NBN
services would lead to a reduction in the value of the infrastructure as an asset. A sufficient
level of demand will be required in order to provide high speed broadband services and to
generate sufficient revenue to cover construction and operation costs of the project. Similarly,
if there is excessive demand, it may result in network congestion and users failing to achieve
data rates of 100Mbps.
3.4.1. Decreased Demand
The economics of supply and demand lead to price setting in accordance with the supply
available and the demand for the product or service. The NBN Co. will be supplying a service
to customers across Australia, offering high speed broadband. The large cost for the
construction of the fibre infrastructure should ideally be recovered through the wholesale
rates offered by the NBN Co. Early predictions indicated that the top-tier 100Mbps
broadband service would be priced around $200 a month in order to cover the costs and
required rates of return for the project [26]. This rate has since been revised down to around
$130 per month as offered by iiNet and iPrimus. However, this price is still more than double
the current cost of the average broadband plan with similar download quota. The high prices
for fibre broadband could act as a price floor and effect demand, as shown in Figure 3.7. A
price floor results in a surplus or excess supply as consumers either cut back their demand or
drop out of the market entirely and suppliers increase production due to the increase in price
equilibrium.

26
Figure 3.7 Price Floor’s Surplus Effect
The NBN’s supply of high speed broadband at a fixed price F = $130, could result in a supply
surplus as less customers are able to afford the price. However, when the fibre subscription
rates are compared with countries with similar geographic conditions and population density
such as the USA, the proposed fibre prices appear acceptable (Figure 3.8 below).
Figure 3.8 Average monthly subscription price for very high-speed connections
(Greater than 35Mbps advertised) [9]
139.95 152.68
0
20
40
60
80
100
120
140
160
180
USD
per m
onth
27
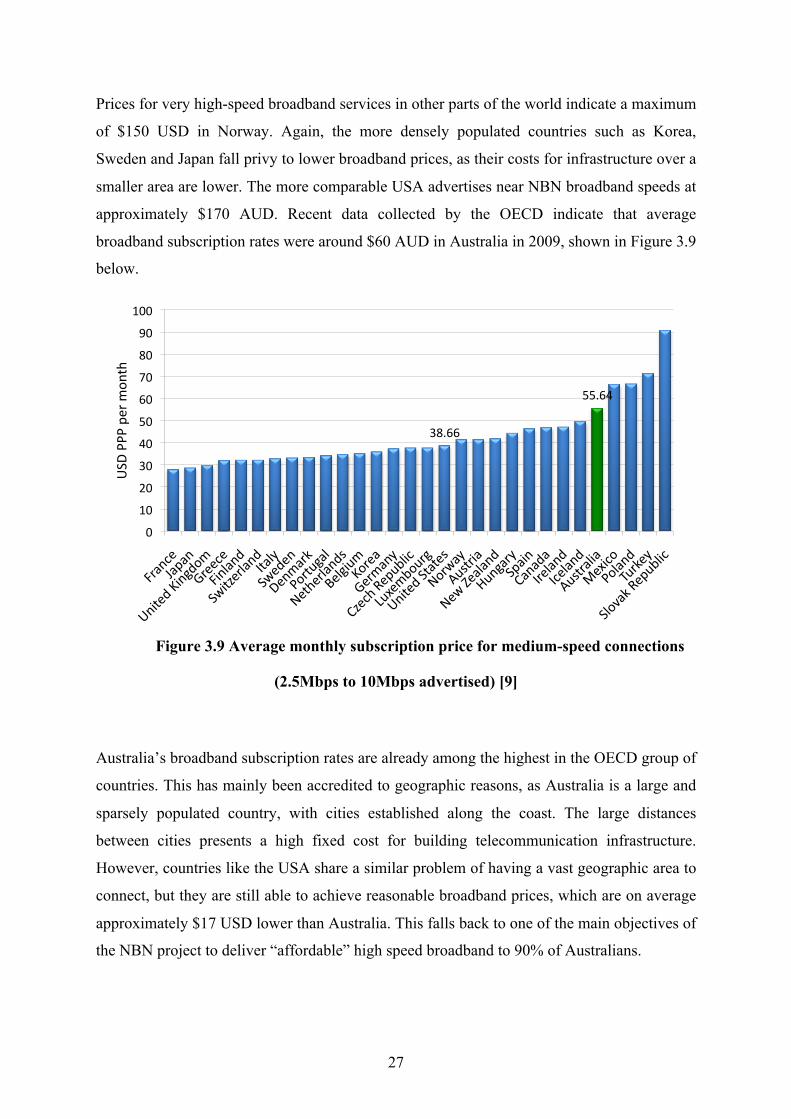
Prices for very high-speed broadband services in other parts of the world indicate a maximum
of $150 USD in Norway. Again, the more densely populated countries such as Korea,
Sweden and Japan fall privy to lower broadband prices, as their costs for infrastructure over a
smaller area are lower. The more comparable USA advertises near NBN broadband speeds at
approximately $170 AUD. Recent data collected by the OECD indicate that average
broadband subscription rates were around $60 AUD in Australia in 2009, shown in Figure 3.9
below.
Figure 3.9 Average monthly subscription price for medium-speed connections
(2.5Mbps to 10Mbps advertised) [9]
Australia’s broadband subscription rates are already among the highest in the OECD group of
countries. This has mainly been accredited to geographic reasons, as Australia is a large and
sparsely populated country, with cities established along the coast. The large distances
between cities presents a high fixed cost for building telecommunication infrastructure.
However, countries like the USA share a similar problem of having a vast geographic area to
connect, but they are still able to achieve reasonable broadband prices, which are on average
approximately $17 USD lower than Australia. This falls back to one of the main objectives of
the NBN project to deliver “affordable” high speed broadband to 90% of Australians.
38.66
55.64
0
10
20
30
40
50
60
70
80
90
100
USD
PPP
per m
onth

28
Figure 3.10 Range of broadband prices per Mbps by country [10]
Figure 3.10 indicates that Australia has the highest priced subscription rates per Mbps out of
the OECD countries. This is due to the lack of competition in the Australian broadband
market and Telstra’s control of major ICT infrastructure. Wholesalers who follow a Bertrand
competition strategy compete on price and are able to reduce competition in the downstream
retail market but increasing their wholesale fee [27]. This is evident in the Australian market,
whereby the high wholesale fee is passed on to the consumer. The high price in Figure 3.10
may also account for the expensive satellite connections, which are used to connect remote
areas of Australia.
18.46 4.95
3.85 3.56
3.22 3.16
2.82 2.65
2.44 2.27 2.10
1.92 1.74 1.72
1.58 1.51 1.44 1.42
1.16 1.15 1.11
1.03 1.02
0.95 0.92
0.41 0.35 0.34
0.25
Mexico Turkey
Canada Poland
Hungary Belgium
Czech Republic United States
Slovak Republic Portugal Norway
Austria Spain Switzerland
Ireland Luxembourg Germany Italy
United Kingdom Netherlands Iceland
Greece Denmark
New Zealand Australia
Finland Sweden Korea
France Japan
115.01 41.42
110.51 73.83
46.31 22.07 15.60 26.66
54.18 13.35
20.99 22.73
43.27 74.60
22.28 16.51 19.17 22.24
13.16 45.20
37.29 46.70
26.07 86.02
160.96 68.76
98.80 4.48
27.91 86.00
0.10 1.00 10.00 100.00 1000.00
Mexico Turkey
Canada Poland
Hungary Belgium
Czech Republic United States
Slovak Republic Portugal Norway Austria Spain
Switzerland Ireland
Luxembourg Germany
Italy United Kingdom
Netherlands Iceland Greece
Denmark New Zealand
Australia Finland
Sweden Korea
France Japan
USD PPP
29
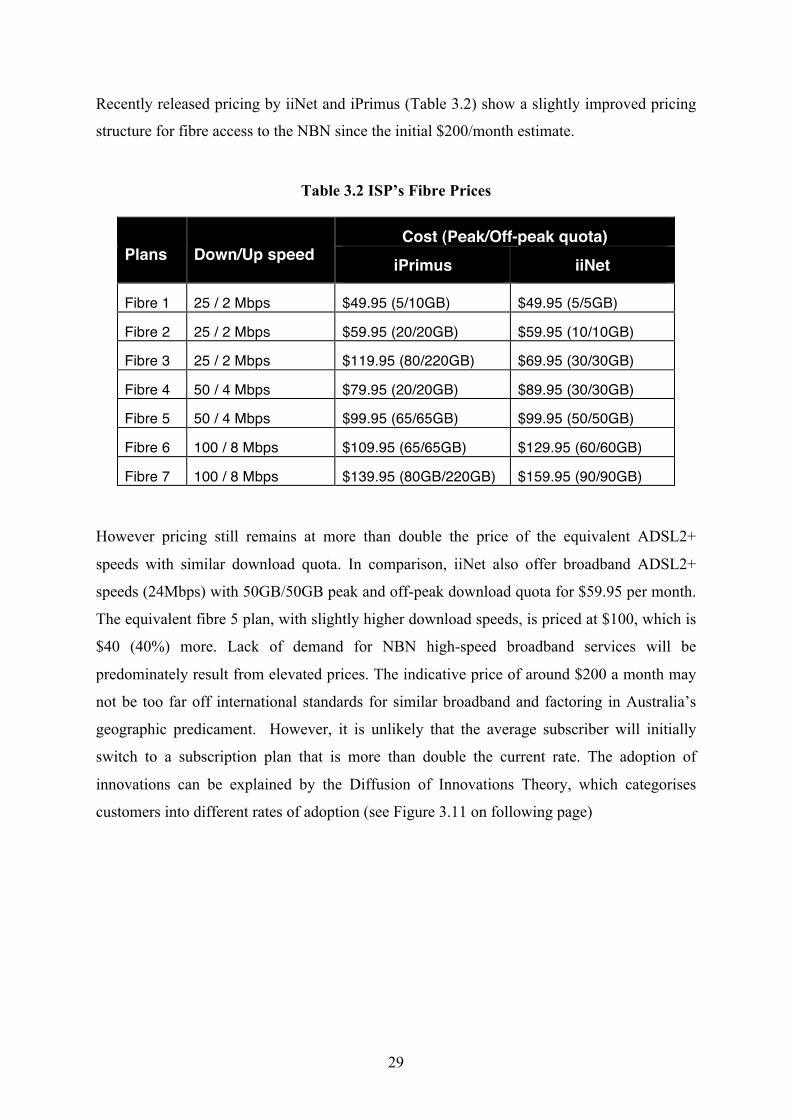
Recently released pricing by iiNet and iPrimus (Table 3.2) show a slightly improved pricing
structure for fibre access to the NBN since the initial $200/month estimate.
Table 3.2 ISP’s Fibre Prices
Cost (Peak/Off-peak quota) Plans Down/Up speed iPrimus iiNet
Fibre 1 25 / 2 Mbps $49.95 (5/10GB) $49.95 (5/5GB)
Fibre 2 25 / 2 Mbps $59.95 (20/20GB) $59.95 (10/10GB) Fibre 3 25 / 2 Mbps $119.95 (80/220GB) $69.95 (30/30GB)
Fibre 4 50 / 4 Mbps $79.95 (20/20GB) $89.95 (30/30GB) Fibre 5 50 / 4 Mbps $99.95 (65/65GB) $99.95 (50/50GB)
Fibre 6 100 / 8 Mbps $109.95 (65/65GB) $129.95 (60/60GB)
Fibre 7 100 / 8 Mbps $139.95 (80GB/220GB) $159.95 (90/90GB)
However pricing still remains at more than double the price of the equivalent ADSL2+
speeds with similar download quota. In comparison, iiNet also offer broadband ADSL2+
speeds (24Mbps) with 50GB/50GB peak and off-peak download quota for $59.95 per month.
The equivalent fibre 5 plan, with slightly higher download speeds, is priced at $100, which is
$40 (40%) more. Lack of demand for NBN high-speed broadband services will be
predominately result from elevated prices. The indicative price of around $200 a month may
not be too far off international standards for similar broadband and factoring in Australia’s
geographic predicament. However, it is unlikely that the average subscriber will initially
switch to a subscription plan that is more than double the current rate. The adoption of
innovations can be explained by the Diffusion of Innovations Theory, which categorises
customers into different rates of adoption (see Figure 3.11 on following page)
30
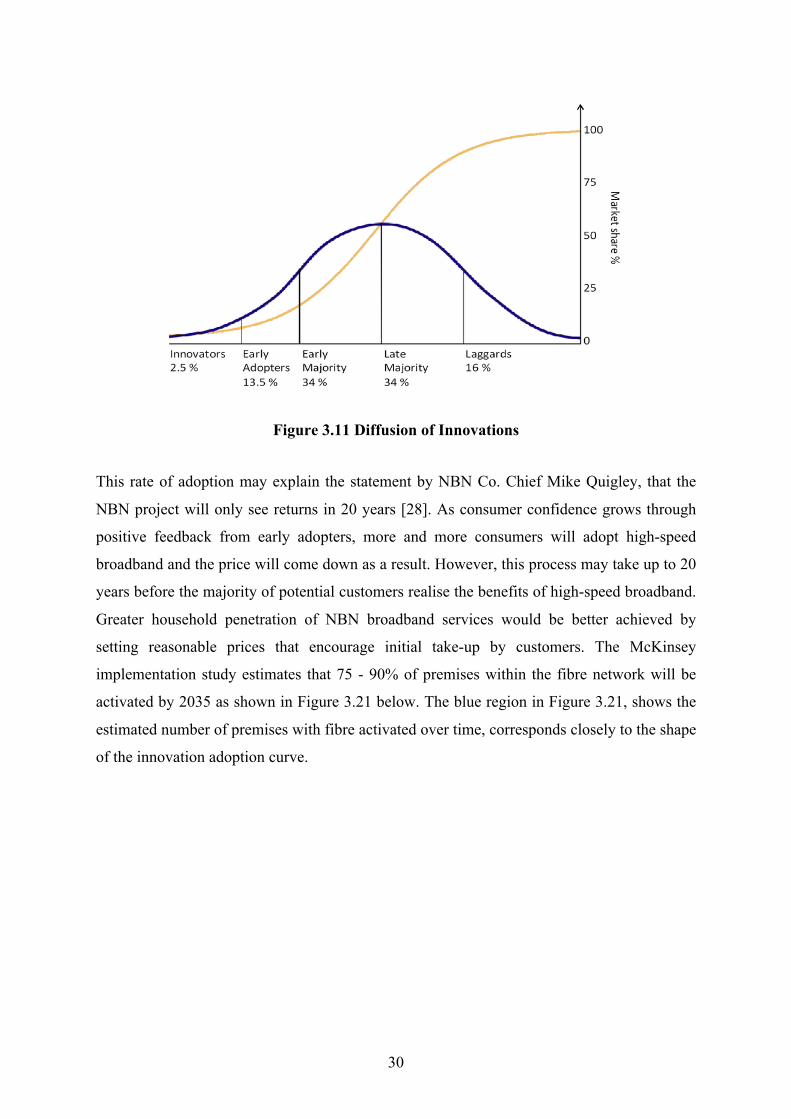
Figure 3.11 Diffusion of Innovations
This rate of adoption may explain the statement by NBN Co. Chief Mike Quigley, that the
NBN project will only see returns in 20 years [28]. As consumer confidence grows through
positive feedback from early adopters, more and more consumers will adopt high-speed
broadband and the price will come down as a result. However, this process may take up to 20
years before the majority of potential customers realise the benefits of high-speed broadband.
Greater household penetration of NBN broadband services would be better achieved by
setting reasonable prices that encourage initial take-up by customers. The McKinsey
implementation study estimates that 75 - 90% of premises within the fibre network will be
activated by 2035 as shown in Figure 3.21 below. The blue region in Figure 3.21, shows the
estimated number of premises with fibre activated over time, corresponds closely to the shape
of the innovation adoption curve.

31
Figure 3.21 Aggregate fibre take-up scenarios [17]
The broad region of premises activated with fibre by 2035 represents between 10 and 12.5
million premises, which would constitute a large variance in operating revenue. The risk of a
lower take-up of fibre by premises translates not only into lower operating revenue but also
lower returns for investors and relates back to the financial hazards discussed in section 3.7
Financial Hazards.
The risk of the decrease in demand has up until now focused on high prices discouraging
customers from switching to the NBN. However, the probability of a lack of demand based
on the need for such high broadband speeds in place of current ADSL2+ services should also
be acknowledged. Although evidence in section 3.4.2 covering Increased Demand shows that
there is a growing trend towards increased IP traffic, in the short term the NBN’s high speed
broadband services could be deemed an unnecessary upgrade for the average customer.
Demand for high-speed broadband will also be driven by applications and digital content that
require high data rates [29]. Such applications will likely emerge during the latter years of the
9 year NBN rollout.
32
3.4.2. Increased Demand
The NBN project faces the risk of greater than expected demand for high-speed broadband
services. Factors such as increases in fuel and travel costs means more people are looking
towards alternatives such as video conferencing and online shopping. An ever-increasing
population also increases the total demand for broadband services. Increased demand for the
NBN could lead to poor service levels and congested fibre networks as the networks were
designed for fewer users. This presents less of a risk to the overall NBN project, than below
expected demand, as the increased demand would fund infrastructure upgrades. NBN Co.
have also released, after testing in first release sites in Tasmania, that the network will be able
to provide users with data rates up to 1Gbps [30]. However, the longevity of the project
would be in question if the design did not account for adequate expansion of the network
required by exceeding the expected number of users and an increase in data rate
requirements.
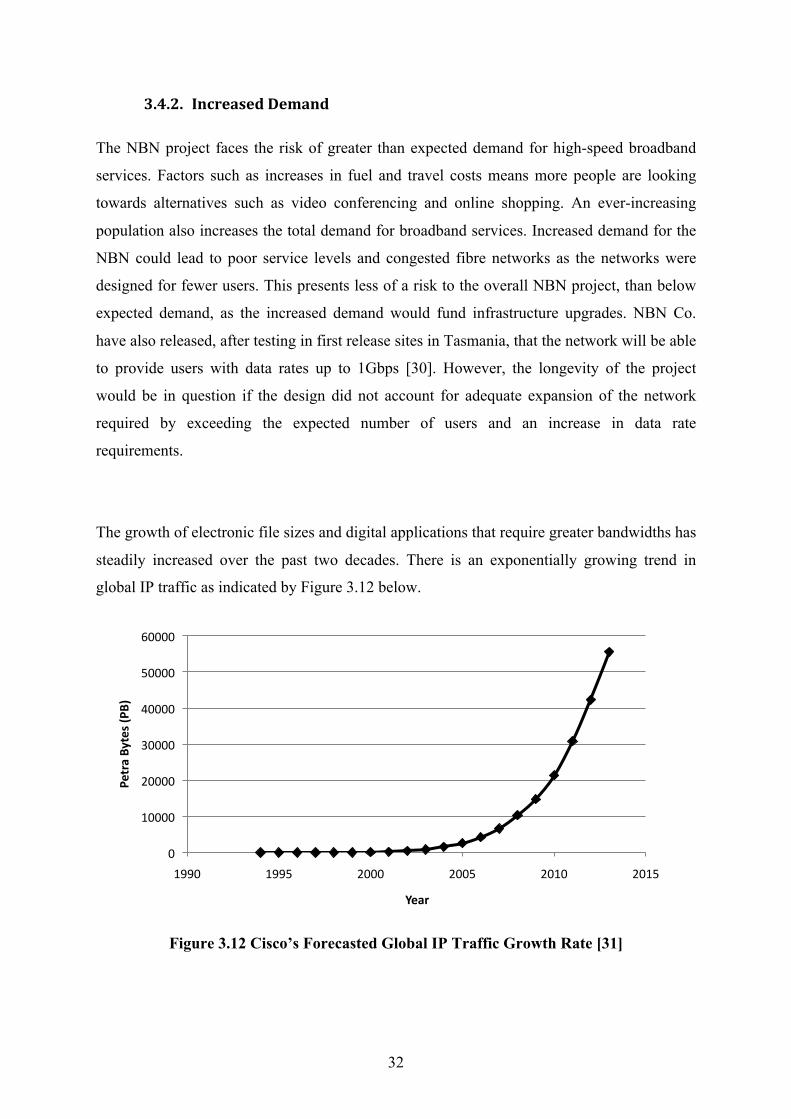
The growth of electronic file sizes and digital applications that require greater bandwidths has
steadily increased over the past two decades. There is an exponentially growing trend in
global IP traffic as indicated by Figure 3.12 below.
Figure 3.12 Cisco’s Forecasted Global IP Traffic Growth Rate [31]
0
10000
20000
30000
40000
50000
60000
1990 1995 2000 2005 2010 2015
Petra By
tes (PB)
Year

33
If predictions by Cisco materialise, Global IP traffic will double from 21 000 PB (Petabytes)
in 2010 to 42 000 PB by the end of 2012. The growth in traffic is largely attributable to
emergence of online high definition video viewing such as IPTV, video on demand and
YouTube which are expected to account for 90% of IP traffic in 2014 [31]. As demand for
applications and uses such as video streaming, multi-channel tv, 3d tv etc grow, so will the
demand for high speed broadband as shown in Figure 3.13 below.
Figure 3.13 Access speeds required by applications [32]
The NBN Co. has recognised the growing demand for higher speed broadband by extending
the NBN service levels to speeds of up to 1Gbps. This is a reaction to the realisation that by
the end of the rollout of the fibre network, speeds of 1Gbps will be standard globally.

34
Figure 3.14 Fixed Bandwidth Demand [33]
Figure 3.14 shows the predicated growth of speeds to 1Gbps by 2020. The increase in global
IP traffic driven by video is stimulating demand for higher speed broadband services. As
more and more Australian ISPs provide IPTV services, demand for improved broadband
services will grow. There is also the scenario of supply creating demand as the provision of a
1Gbps fibre network would provide incentives for application developers to utilise the excess
bandwidth. Figure 3.15 below shows the key drivers of users’ broadband experience.
Figure 3.15 The three stages of broadband user experience [32]
The provision of broadband results in creativity for application development and emergence
of new digital content. The speed of access determined by broadband speed enhances the
broadband experience as internet browsing and online interaction is more enjoyable [32].
35
Application development and online video will increase the demand for high-speed
broadband. The forecasted growth in global IP traffic shows an exponential trend, which
could see the demand for high-speed broadband far exceeding original expectations. The
NBN could face the hazard of an above-expected demand for take-up of lead-ins. If the
network is not designed with excess capacity or the ability to accommodate extra users, then
the network could suffer serious congestion and data rates will fall well below the advertised
100Mbps. However, the choice of fibre optic cabling has the potential to be upgraded over
time as the demand for high-speed broadband grows and exchange technology progresses to
allow for faster speeds.

36

37
3.5. NETWORK HAZARD
The network hazard arises as the use of the NBN infrastructure depends on decisions made in
relation to other elements of the network. This risk is present throughout the life of the
project. For instance, the NBN may be subject to a relative shift in demand for other
broadband services such as wireless (see section 3.4 Demand Hazards). Other hazards such as
poor service levels provided by ISPs, poor integration between the fibre and wireless/satellite
network and the risk of Telstra operating their own last mile fibre connection also add to the
overall Network failure mode. In addition, the NBN’s 100Mbps speeds are dependent on all
connection links, both domestically and internationally. This leaves the network susceptible
to overseas bottlenecks where information offshore is accessed via communication cables
that cannot provide NBN speeds.
3.5.1. Design Bottlenecks
Currently 80% of Australia’s international Internet traffic is to the US. Considering current
trends, this looks unlikely to change in the short to medium term [34]. Email accounts for
about 10% of Internet traffic, with the majority of traffic (approximately 80%) from file
transfer and web browsing/downloads. This further indicates the level of Internet traffic that
would leave Australia’s local high-speed fibre optic network and that would require access to
servers abroad. There is evidence supporting the concern that the 100mbps speeds supported
within Australia would be dramatically reduced to a few Mbps when accessing overseas
servers.
Tests conducted on overseas networks in the USA, privy to high-speed broadband
connections (100Mbps maximum speeds), show the extent of the bottleneck situation
between the USA and Australia. The test indicated that a maximum speed of only 4.06Mbps
was attainable when connected to a server in Melbourne [35]. This highlights the effect of the
bottleneck caused by only a handful of submarine fibre cables connecting Australia. Table
3.3 on the following page highlights this lack of international connectivity.
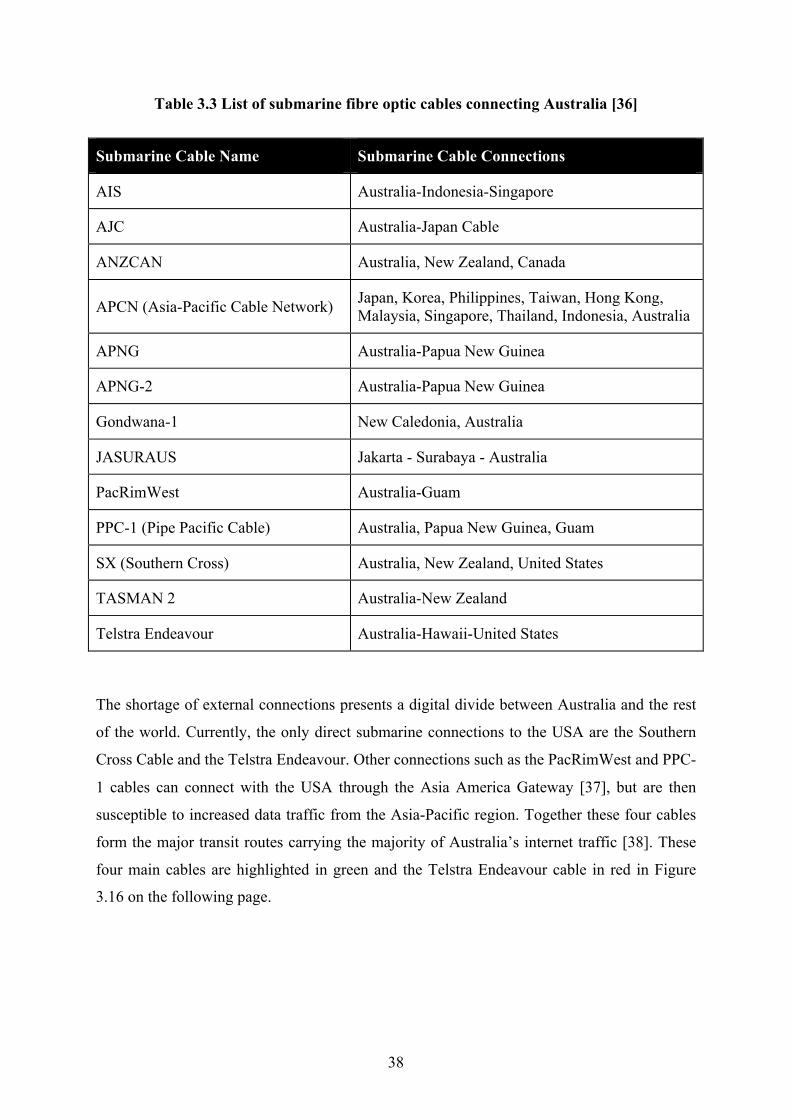
38
Table 3.3 List of submarine fibre optic cables connecting Australia [36]
Submarine Cable Name Submarine Cable Connections
AIS Australia-Indonesia-Singapore
AJC Australia-Japan Cable
ANZCAN Australia, New Zealand, Canada
APCN (Asia-Pacific Cable Network) Japan, Korea, Philippines, Taiwan, Hong Kong, Malaysia, Singapore, Thailand, Indonesia, Australia
APNG Australia-Papua New Guinea
APNG-2 Australia-Papua New Guinea
Gondwana-1 New Caledonia, Australia
JASURAUS Jakarta - Surabaya - Australia
PacRimWest Australia-Guam
PPC-1 (Pipe Pacific Cable) Australia, Papua New Guinea, Guam
SX (Southern Cross) Australia, New Zealand, United States
TASMAN 2 Australia-New Zealand
Telstra Endeavour Australia-Hawaii-United States
The shortage of external connections presents a digital divide between Australia and the rest
of the world. Currently, the only direct submarine connections to the USA are the Southern
Cross Cable and the Telstra Endeavour. Other connections such as the PacRimWest and PPC-
1 cables can connect with the USA through the Asia America Gateway [37], but are then
susceptible to increased data traffic from the Asia-Pacific region. Together these four cables
form the major transit routes carrying the majority of Australia’s internet traffic [38]. These
four main cables are highlighted in green and the Telstra Endeavour cable in red in Figure
3.16 on the following page.
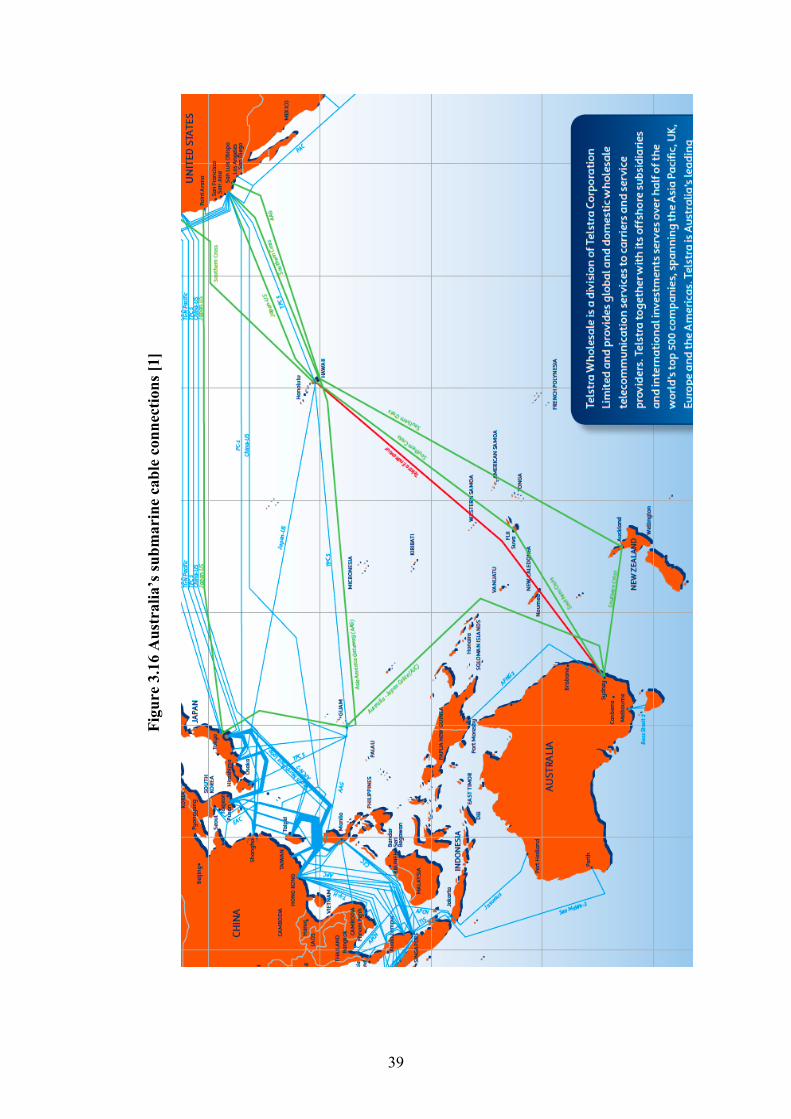
39
Figu
re 3
.16
Aus
tral
ia’s
subm
arin
e ca
ble
conn
ectio
ns [1
]

40
There are plans under way by Pacific Fibre to build a new submarine fibre connection from
Sydney to Auckland to Los Angeles. The project is estimated to cost around $400 million and
the fibre will have 5 times the current capacity of the existing Southern Cross fibre
connection to the USA. The cable will provide up to 5.12 Terabits/s and will effectively
double the current capacity of Australia’s access to overseas servers [39].
Poor data overseas rates cannot be fully explained by the lack of fibre infrastructure. This is
also attributed to the long distance connection between Australia and the USA. The great
continental divide translates into a “round-trip delay” as data accessed in the USA has to be
transferred back across the pacific. The speed of light and delay caused by communications
equipment factors, such as signal boosters/repeaters, will not be overcome through an
increase in bandwidth. The lead to lag times in data access can be solved through data
architecture, rather than infrastructure [38]. The idea is to relocate static media, such as video,
locally within Australia. This would allow the full utilisation of the 100Mbps NBN speeds
and exclude slower international connections. As long as Australians have to regularly access
content from overseas, there will be a compromise to the maximum attainable data rates.
Network architecture needs to be addressed to solve the lag time experienced by overseas
connections.

41
3.6. TECHNOLOGICAL HAZARDS
Technological hazard facing the NBN arise because the risk of the fibre, wireless and satellite
network infrastructure might become obsolete or stranded if users choose to switch to a new
form of broadband service delivery. This technological risk is present throughout the life of
the project. Hazards such as security risks also arise with the ability to tap fibre lines and
access users’ information. The greater the amount of aerial works, the higher this risk is as
aerial fibre cables are more accessible than fibre cable placed in ducts or buried. Due to the
fast and progressive nature of technology development, the NBN is susceptible to technology
improvements during the relatively long rollout over 9 years. Considering the Internet was
born as recently as 1982, less than3 decades ago, the NBN project, which will take nearly a
decade to complete, will be at risk of becoming outdated before it is fully operational. There
is the extended risk that the NBN will become outdated before the projected 15-year project
life is reached. Wireless technologies present the greatest risk of outdating the FTTP network
delivery, offering a more mobile and convenient last mile connection. The increasing demand
for mobile connectivity and improvements in wireless technology is discussed below.
3.6.1. Wireless Technologies
The advancement of wireless technologies over the past decade has led to a significant
increase in download speeds, making it possible to provide services such as high speed
internet access and to receive broadcast television programs [40]. The upcoming 4th
Generation (4G) wireless network was being contested by 3 main standards. These included
Ultra Mobile Broadband (UMB), Worldwide Interoperability Microwave Access (WiMAX
Mobile) and Long Term Evolution (LTE). However, development of UMB ceased in
November 2008 in favour of LTE. Plans for the introduction of LTE as a 4G network indicate
that it will complement current 3G and even 2G networks [41]. A related trend is the growth
in use of Wi-Fi (Wireless Fidelity) and WiMAX. Wi-Fi uses local wireless networks for
high-speed mobile access to the Internet. WiMAX has a broader range of distance compared
to Wi-Fi. WiMAX’s main application is to attempt to alleviate network congestion from
cellular providers in urban areas. Metro Wi-Fi systems are becoming increasingly popular in
handling data services in dense urban areas. 3G, and soon 4G LTE, could be described as
bringing Internet capabilities to wireless mobile phones; Wi-Fi as providing wireless Internet

42
access for laptop computers; and WiMAX as expanding networks with wireless links to fixed
locations. The technologies are seen by some as competing for customers, and by others as
complementary providing a broader base and greater choice of devices for wireless
communications and networking [41]. There is scope and cost saving benefits to use a
combination of these wireless technologies as a “last mile” connection in a FTTN network.
Table 3.4 below summarises the relative performances of competing and complementary
wireless standards that have emerged over the last two decades. Most importantly, it shows
the rapid progression of data rates since the inception of mobile communication technology.
Table 3.4 Advancements in mobile communication data rates [42], [43], [44], [45], [41]
Generation Mobile Technology Year Introduced
Downlink Peak Network Speed
1G NMT/AMPS (Analogue) 1982 1 kbps
GSM (CDMA/TDMA) 1992 13 kbps
GPRS 2000 80 kbps
CDMA2000 1x 2000 144 kbps 2G
EDGE 2001 236.8 kbps
UMTS 2002 384 kbps
EDGE Evolution 2005 1.9 Mbps
UMTS WCDMA 2005 2.048 Mbps
HSDPA 2006 14.4 Mbps
CDMA2000 EV-DO 2006 14.7 Mbps
HSPA+ 2008 42 Mbps
3G
LTE 2009 100 Mbps
802.16m WiMAX (2x2 MIMO) 2010 144 Mbps 4G
LTE Advanced (4x4 MIMO) 2011 326 Mbps
1 Note: The above download speeds only account for a single user and the speeds will decrease when multiple users connect to a cell.

43
Table 3.5 below is an adaptation of a Market needs analysis carried out in 2007 on 3G and
emerging wireless technologies. It has been updated to account for the emergence of 4G as a
replacement for 3G, and the use of fibre fixed lines in the NBN. It clearly indicates the
market’s demand for wireless. It is apparent that wireless technologies can coexist and
supplement the faster fixed line fibre optic broadband connections. However, as wireless
technology advances so will the data rates. Essentially, wireless and fixed fibre optic lines
will find themselves competing in the same market segment. In this case, wireless will
possess an obvious advantage over fixed lines due to the mobile nature of the connection. A
fixed fibre backbone will always be required to support wireless communications as current
4G has an absolute maximum range of 50km. The use of WiMAX and LTE is ideally suited
to the “last-mile” connection, supporting a FTTN network setup. At distances under 2km
there would be near identical data rates achieved by a FTTN network with 4G wireless last-
mile connections compared to a FTTP network.
Table 3.5 Wireless Technology Fit for Market Needs [41]
Segmentation
Variable Wireless Data Market
Needs Wireless Technology Fit
Fixed Broadband capability must compete against fibre options. Continuous coverage not required.
3G not intended to compete against fibre approaches. 4G will compete in this area, though mostly in regions where fibre is not available. Fibre networks are evolving toward 1Gbps, which make it difficult for wireless systems to compete directly.
Fixe
d ve
rsus
Mob
ile
Mobile Good throughput is necessary, but it does not have to meet fixed line performance. Continuous coverage in coverage areas. Nationwide service offerings.
3G is now available in most major markets, with fallback to 2.5G services in other areas.

44
Segmentation
Variable
Wireless Data Market
Needs Wireless Technology Fit
Enterprise Nationwide service offerings. Unlimited usage service plans. Choice in devices, including modem cards, smartphones, and data capable mobile phones.
3G, and eventually 4G, technologies provide coverage in top markets, with fallback to 2.5G for other areas. Mobile WiMAX will potentially offer service in densely populated areas. All technologies will likely have unlimited usage service plans. 3G/4G technologies will have the widest device selection and strongest economies of scale.
Ente
rpris
e ve
rsus
Con
sum
er
Consumer Wide range of feature phones with multimedia capabilities.
3G/4G technologies will have the greatest selection of multimedia feature phones.
Urban High capacity to serve large numbers of subscribers. Broadband speeds desirable.
3G, municipal Wi-Fi, and eventually 4G will all provide broadband services in urban areas.
Urb
an v
ersu
s Rur
al
Rural Good coverage in low-density areas achieved through large radius cells. High data throughputs are a lesser priority.
These areas are to be serviced by 4G technologies under the NBN plan.
Developed Value-added services such as broadband data and wireless e-mail. Mobile applications constantly emerging.
3G networks can provide broadband data. 4G networks will eventually be able to offer broadband services. 3G operators are likely to provide the greatest number of value-added services.
Dev
elop
ed v
ersu
s Em
ergi
ng
Mar
kets
Emerging Basic telephony services supporting high-density populations. Data is a lower priority.
UMTS, CDMA2000, and WiMAX can all provide basic telephony services with data options.
Laptop High data throughputs. .
4G can deliver high data throughputs and is available in PC Card and USB dongle formats.
Smartphone Medium data throughputs and wide coverage areas.
2.5/3G is the best choice because of data support and wide coverage areas.
App
licat
ion
Type
Feature phone
for multimedia
High data throughputs and wide coverage areas.
4G is the best choice because of data support and wide coverage areas.

45
It is estimated that the future cost per megabyte for 4G Wireless services will be 83% lower
than current radio technology W- CDMA and 66% lower than HSDPA [46]. This is crucial as
there is a projected six-fold increase in global IP traffic between 2007 and 2012 (driven
mainly by video) with mobile data projected to double every year from 2008 to 2013. Figure
3.17 below is a graphical representation of Table 3.4. It shows the exponential trend in the
advancements of mobile communication data rates over time. Current experimental data rates
for 4G wireless communications have reached speeds of 326Mbps in the downlink [41],
which comfortably surpasses the 100Mbps landmark speed the NBN is offering to home
users.
Figure 3.17 Advancements in mobile communication data rates (log graph)
However, recent testing of 4G compliant wireless technologies has revealed that although the
peak data rates may far exceed 100Mbps, as the number of users per cell is increased, the
achievable data rates drops dramatically as shown in Figure 3.18 below.
0.001
0.01
0.1
1
10
100
1000
1980 1985 1990 1995 2000 2005 2010 2015
Peak Dow
nlink Speed
(Log scale ‐ Mbp
s)

46
Figure 3.18 4th Generation wireless speed tests for multiple users [33]
Any wireless network wireless network used to provide the last mile connection should be
designed so that anyone tower does not service too many users. This problem is synonymous
to fixed line contention ratios, which can reach upwards of 150:1 and result in a similar drop
off in data rates (refer to section 3.3.1 Contention ratio). There is a growing demand in
Australia for mobile communications, which is evidenced by the rise in the number of
wireless subscribers over the past few years. Recently collected data by the Australian Bureau
of Statistics (ABS) shows the number of wireless broadband subscribers has risen from
approximately 2% in 2006 to around 33% by the end of 2009 [47]. Whether the wireless
subscribers are using a wireless connection to complement or replace a fixed line connection
is difficult to distinguish as the overall number of broadband subscribers increases each year.
However, it could be reasonably assumed that there is an emerging trend of broadband users
switching from fixed line broadband to wireless as the demand for the convenience of mobile
Internet increases. The switchover from analogue to digital television signals will free up a
large portion of the RF spectrum for broadcasting. This presents even more of an opportunity
for wireless technologies to advance (see section 3.8 Regulatory Hazard). The Risk involved
with the emergence of superior wireless technologies and the demand for mobile Internet
means that a FTTP network would be deemed unnecessary, as fixed lines become redundant.
Table 3.6 below summarises the various advantages and disadvantages of a fibre versus
wireless last mile connection for the NBN.

47
Table 3.6 FTTP versus Wireless last mile connection
Arguments for Fibre last mile connection
Arguments for Wireless last mile connection
• Fibre offers better security, reliability and
privacy
• Wireless is susceptible to interruptions
caused by changing environmental
conditions such as storms
• Wireless networks are more expensive
than fibre networks to maintain in the
long run
• Spectrum for transmitting wireless data is
a scarce resource
• Cheaper initial setup costs as there is no
physical connection required to each home
• Benefits of mobility and ability to utilise
broadband subscription anywhere within the
NBN
• Strong market forces resulting in Telcos
supplying the demand for wireless
infrastructure
• Freed up spectrum from switchover from
analogue to digital TV provides opportunity
for greater range and improved signal
integrity for wireless
The emergence of wireless technologies that can compete with fixed line service data rates
and also offer mobility threatens to outdate the fixed fibre network. As discussed earlier in
section 3.4 Demand Hazards, the effect of wireless technologies dominating the market
would also have a detrimental effect on the demand risk for the NBN’s FTTP network.

48

49
3.7. FINANCIAL HAZARDS
It is estimated that $43 billion will be required to fund the NBN project. The financial hazard
present to the NBN arises as the expected availability and cost of finance might not
materialise. This can occur, for example, as interest rates and exchange rates change over
time. The most obvious financial hazard is due to scope creep and latent grounds, which
would occur during the construction phase. The impacts of these hazards have already been
discussed in section 3.2 Construction Hazards. The NBN project has already fallen privy to a
form of scope creep after a recommendation by the joint McKinsey & KPMG study [17] to
extend fibre coverage from 90% to 93% of Australian premises. This however has not had
any further financial implications and holds to the same budgetary constraints. Similarly,
latent grounds during the construction of the NBN may contribute to rising costs.
Financial hazards are apparent over the entire life of the project, not just during the
construction phase. Demand and take-up of the broadband services also has an effect on
financial risk, as a decrease in demand would lead to lower revenue levels for the project, as
discussed in section 3.4 Demand Hazards. There are already concerns about the high priced
entry-level 100Mbps plans being offered by iiNet and iPrimus.
Interest rates and exchange rates can contribute to the financial hazards. A variability in
interest rates can affect a company’s ability, in this case the NBN Co, to meet its debt
commitments [48]. The exchange rate risk for the project will be minimal as capital raised
and the revenues accrued both occur domestically. However, due to Australia’s dependence
on its primary activities such as mining exports, exchange rates can affect the price of raw
materials and therefore pass on the costs to other aspects of the Australian economy. This
may manifest itself in the form of wage increases and therefore contribute to an increase in
construction costs (see section 3.2 Construction Hazards). A decrease in sales and revenue for
the resources sector due to unfavourable exchange rates (strengthening Australian dollar),
would also affect the governments collection of taxes, most notably the mining and resource
super profit tax. This would place a strain on government funding of the NBN and affect the
choice of financing vehicle.
50
3.7.1. Financing Vehicles
The NBN project will be financed through a combination of government and private
initiatives. The government will fund the bulk of its share of the $43 billion through
infrastructure bonds offered to the public. The peak government funding requirement will be
approximately $26 billion in year 6 [17]. The government has pledged up to $4.7 billion
directly to the NBN Co. from the Building Australia Fund. Infrastructure bonds will supply
up to $17 billion, leaving the public sector to contribute the remaining $21 billion [28].
The choice of an efficient financing vehicle can minimise the total cost of finance and reduce
risk and uncertainty. This cost of finance is made up of the return on the funds, the cost of
contingent liabilities and transaction costs. The choice of the appropriate financing vehicle
can lower the total cost of financing by [2]:
• Allocating non-diversifiable project risks to those who have the capability to better
manage this risk (i.e. the private sector).
• Improving the portfolio balance for the investors, reducing the market risk through
diversification, which lowers the return required to hold the asset.
• Reducing the lifetime transaction costs of financing and/or the costs of delay.
There are typically two broad types of financing vehicles used by governments:
1. Pay-As-You-Go (PAYGO), which involves various current revenues and fund sources
within the public sector, and
2. Capital-Market financing, which requires borrowing or equity contribution from
private sources.
The government has pledged up to $4.7 billion directly to the NBN Co. that will essentially
be funded by taxpayers’ money, a PAYGO financing vehicle. The risk with funding
government projects through PAYGO is the final total cost of financing, in most cases
resulting in a deadweight loss associated with the collection of taxes. There is an inherent
opportunity cost as these funds raised to pay for the NBN could be used to support other
programs or alternatively left with the taxpayer. As can be seen in Figure 3.19 below, the
United Kingdom’s public infrastructure financing choices differ from Australia’s in the
greater percentage of Public-Private-Partnerships (PPPs).

51
Figure 3.19 Indicative shares of public infrastructure investment by financing vehicle in
Australia and the United Kingdom (2006-2007) [2]
The greater percentage of PPPs in the UK could be attributed to the full utilisation of their
Private Finance Panel. The lack of private investment in Australian infrastructure projects is
discussed in the subsequent section 3.7.2 Private Investment. The reasons for the variation in
financing practices adopted by governments can be attributed to the following common
reasons [49]:
• Infrastructure characteristics affect the user profiles and revenue-raising capacities of
particular assets
• Fiscal and macroeconomic conditions can restrict the use of particular financing vehicles
because of their budgetary consequences
• Institutional arrangements define the legal and regulatory framework as well as the
intergovernmental relationship within which public infrastructure assets are operated and
financed
• Perceptions of the role of government underlie voters’ expectations for the involvement
of government in delivering specific services and managing the economy.
These varied reasons for the choice of financing vehicles also contribute to the financial
hazard faced by the NBN. For instance, the current political climate in Australia with neither
party holding an outright majority, might lead to a choice of a financing vehicle which might
not be the most suitable for the NBN project, but would be aligned with voters’ expectations

52
in order to win voter confidence in the political party. This hazard also ties in with the
political hazard facing the NBN, as discussed in 3.8 Regulatory Hazard. Nonetheless,
whatever the choice for the particular financing vehicle to fund the NBN, there will be an
inherent risk involved that can negatively impact other unrelated infrastructure projects due
the opportunity cost involved in undertaking the NBN.
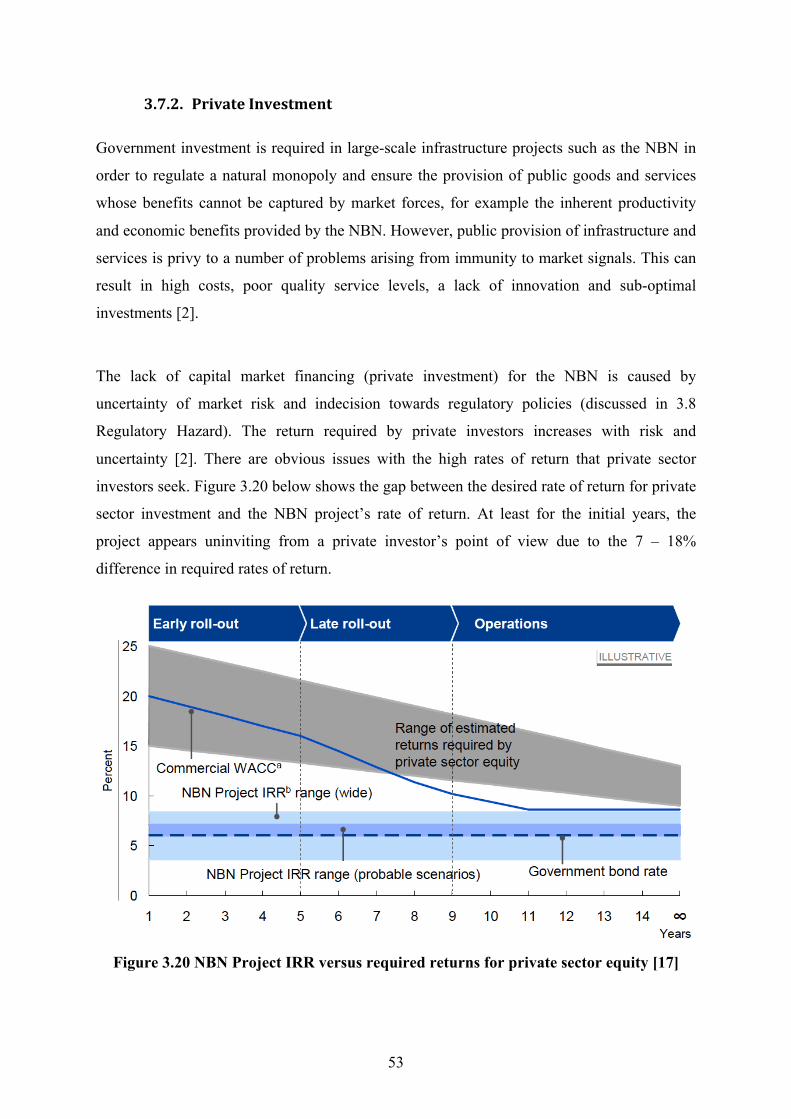
53
3.7.2. Private Investment
Government investment is required in large-scale infrastructure projects such as the NBN in
order to regulate a natural monopoly and ensure the provision of public goods and services
whose benefits cannot be captured by market forces, for example the inherent productivity
and economic benefits provided by the NBN. However, public provision of infrastructure and
services is privy to a number of problems arising from immunity to market signals. This can
result in high costs, poor quality service levels, a lack of innovation and sub-optimal
investments [2].
The lack of capital market financing (private investment) for the NBN is caused by
uncertainty of market risk and indecision towards regulatory policies (discussed in 3.8
Regulatory Hazard). The return required by private investors increases with risk and
uncertainty [2]. There are obvious issues with the high rates of return that private sector
investors seek. Figure 3.20 below shows the gap between the desired rate of return for private
sector investment and the NBN project’s rate of return. At least for the initial years, the
project appears uninviting from a private investor’s point of view due to the 7 – 18%
difference in required rates of return.
Figure 3.20 NBN Project IRR versus required returns for private sector equity [17]
54
Figure 3.20 indicates equity investors in infrastructure projects require a 15-22 percent return
when investing prior to construction commencement, indicated by “Early roll-out” on the
graph. This required rate of return (RRR) has increased significantly from a rate of 14-15% in
mid 2009, as a result of the global financial downturn, as investors demand higher rates of
return due to the perceived increase in investment risk [17]. The WACC is based on the cost
of private sector debt and private sector equity, post tax. The high initial WACC curve is a
result of the large financial investment required to raise capital. The WACC is a good
indicator of the inherent risk involved in the NBN project. The early rollout phase presents a
high cost of equity and limited liquidity [17]. The risk premium demanded by private sector
equity should decline towards the NBN’s rollout completion as uncertainties surrounding
construction costs, business establishment and customer migration decline. The decreasing
WACC also relates to the increasing stability of the project as regulatory and policy
safeguards are implemented. The “Operations” phase of the NBN project relates to the
premium required of 5-10 percent over the return generated by a mature infrastructure asset.
The technological nature of the NBN also provides increased risk for private investors. The
NBN project could be described as more of venture capital investment, as opposed to an
infrastructure investment. Venture capital investments present greater risks but provide
greater returns. Venture capital investments typically have a shorter investment horizon with
returns usually realised within 7 years. The inherent problem with the NBN is the timeline of
the project. The high risk of returns of the NBN is further impacted by the relatively long
project rollout. As mentioned before, NBN Co.’s Mike Quigley only expects capital returns
in 20 years [28]. However, there is hope for future private investments as Brisbane’s Lord
Mayor Campbell Newman announced recently that i3 Group will rollout Brisbane’s own
fibre network using sewer cable laying methods, which is expected to cost 60% less than
NBN methods [50]. This venture poses no cost to Brisbane ratepayers as the venture is
funded purely by the i3 Group. Overall, the financial risk of the NBN for private investors is
a result of a high-risk project providing opportunity for high-returns, but over a longer than
desired timeframe.

55
3.7.3. Operating Revenue
The main financial risk facing the operational phase of the NBN is from the unknown take-up
rate of fibre connections. Lower demand, and therefore a lower take-up of fibre connections
would adversely affect the revenue generated by the NBN. The McKinsey implementation
study estimates that 75% - 90% of premises within the fibre network will be activated by
2035 as shown in Figure 3.21 below.
Figure 3.21 Aggregate fibre take-up scenarios [17]
It has been broadly estimated that between 10 and 12.5 million premises would take up fibre
connections by 2035. The difference between the upper and lower estimates represents a
variance of 20% in projected operating revenue. In December 2009 there were 9.1 million
premises that subscribed to some form of internet connection [47] as shown in Table 3.7
below. If all 9.1 million current Internet subscribers in Australia were to switch over to fibre,
this would equate to 90% of current premises within the proposed fibre footprint.
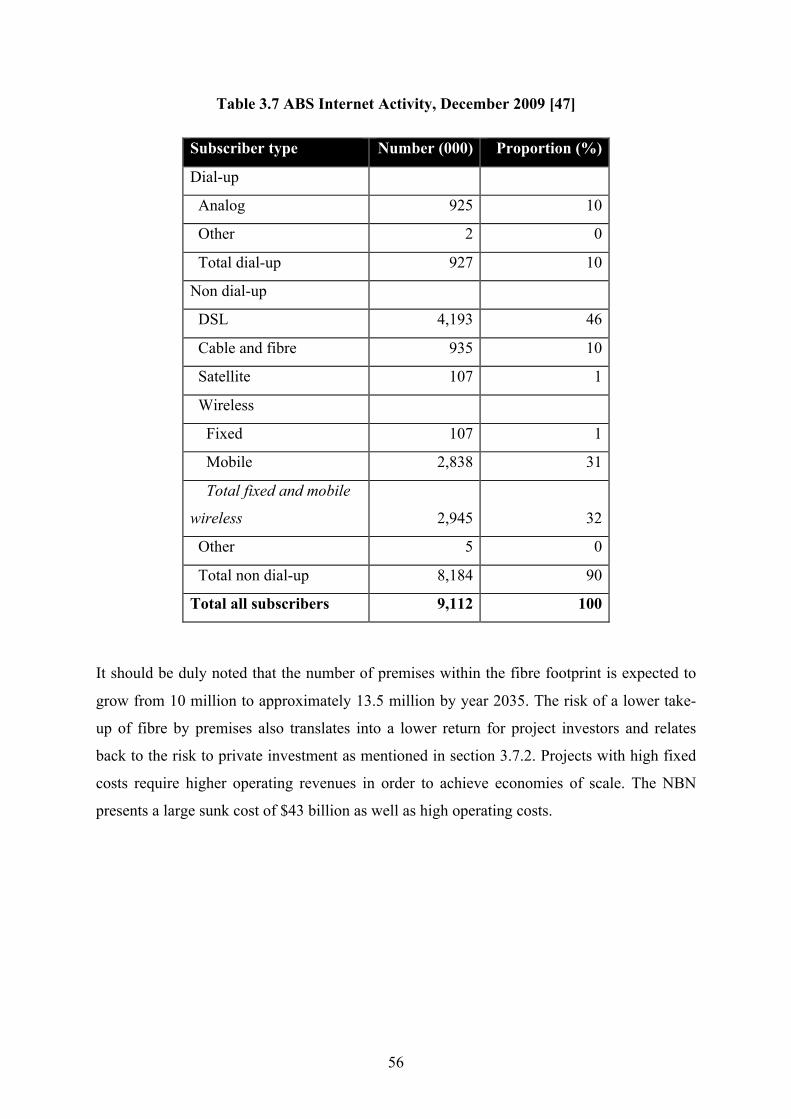
56
Table 3.7 ABS Internet Activity, December 2009 [47]
Subscriber type Number (000) Proportion (%)
Dial-up
Analog 925 10
Other 2 0
Total dial-up 927 10
Non dial-up
DSL 4,193 46
Cable and fibre 935 10
Satellite 107 1
Wireless
Fixed 107 1
Mobile 2,838 31
Total fixed and mobile
wireless 2,945 32
Other 5 0
Total non dial-up 8,184 90
Total all subscribers 9,112 100
It should be duly noted that the number of premises within the fibre footprint is expected to
grow from 10 million to approximately 13.5 million by year 2035. The risk of a lower take-
up of fibre by premises also translates into a lower return for project investors and relates
back to the risk to private investment as mentioned in section 3.7.2. Projects with high fixed
costs require higher operating revenues in order to achieve economies of scale. The NBN
presents a large sunk cost of $43 billion as well as high operating costs.

57
3.8. REGULATORY HAZARD
Regulatory risks can occur in infrastructure projects when government regulations potentially
affect the project’s profitability. Successful regulation can improve efficiency and provide a
stable investment environment. However, regulation uncertainty can affect stakeholder
expectations about the regulatory outcomes achievable, thereby creating stronger incentives
for disagreement, uncertainty and a higher probability of inconsistency in the application of
regulation [2]. Such risk arises, for example, due to a change in planning and environmental
requirements, pricing determination and regulatory conditions governing the entry of new
service providers. Government regulations generally address the following two areas:
• Price regulation, and
• Access regulation
NBN Co. will be provided on a wholesale basis and ISPs will set their price accordingly. The
task of price determination can affect the demand for take up of the NBN by customers. If the
access price is set too high, then the initial number of customers will be too low (see section
3.4 Demand Hazards). On the other hand, setting the price too low over the long term will
lead to the NBN being unable to generate the revenue necessary to operate and maintain
existing infrastructure (see section 3.7 Financial Hazards). Price regulation, or the threat of
such regulation, can be a deterrent to private investment in public infrastructure. Regulatory
uncertainty can also result in delays to investment as investors attempt to minimise the cost of
regulatory risk and retain a range of options.
3.8.1. Regulatory Policies
NBN Co. was established as a publicly owned body under the understanding that it would be
privatised at the completion of the NBN project. However, recent political instability as a
result of the 2010 federal election has lead to discussions about the final public or private
ownership of the NBN. From the early 1990s there has been a trend towards the commercial
or private provision and ownership of public infrastructure [2]. Privatisation promotes
productive efficiencies, better-valued service levels and innovation. Private companies can
react more quickly to challenges and opportunities without going through a bureaucratic
decision making processes. In a technologically focused project like the NBN, the ability to

58
adapt quickly to changing market conditions will be key to survival. However, privatisation
does lead to the hazard of monopolistic behaviour by any one firm who possesses a greater
market share and can therefore assert dominance on other telcos. A decision needs to be made
as to the maximum share ownership of the NBN Co. by any one private entity. There have
been discussions by leading telcos about whether ownership should be limited to 20% or just
5% in order to promote better market competition [51]. Effective policymaking will ensure
there is sufficient competition by limiting majority ownership. However, share ownership
must still allow for competent decision-making by a few major private stakeholders.
There is an opportunity for the government to promote future generation wireless
technologies through effective policymaking with regards to spectrum usage. The current
switch over from analogue to digital television will have the effect of freeing up wireless
spectrum due to digital signals being more efficient users of the radio-frequency spectrum.
The USA’s Federal Communications Commission (FCC) has recently instigated such a
policy to allow for private mobile and television companies to purchase the now unused
spectrum. The most desired and important frequency for Mobile phone companies is the
700Mhz range. This frequency allows signals to travel for kilometres while unaffected by
weather, foliage and able to travel through buildings. They will allow mobile carriers to
cover, from a single tower, up to ten times the area possible from a tower using existing
frequencies [52]. The freeing up of this spectrum provides real opportunities for the
advancement of wireless technologies and the development of wireless infrastructure by
private telcos. The Australian government needs to realise the potential of the freed up
spectrum and set policies accordingly to maximise its benefit to private and public users.
An effective policy framework will promote innovation and application development that
fully utilises the NBN’s capabilities. Application development and innovation relates back to
one of the main reasons for the undertaking of the NBN, to facilitate economic growth. In
addition, an adequate reform of the telecommunications framework and reform of existing
consumer safeguards in the telecommunications sector will complement the NBN network
and ensure efficient use of resources [53]. There is, however, the hazard that inappropriate
policy setting will result in constrictive regulations on the NBN and the full potential and
benefits of the NBN will not be realised.

59
3.8.2. Telstra’s Fibre Network and Customer Base
At the commencement of this thesis, an issue existed surrounding the cooperation of Telstra
with the NBN Co. The design of the new fibre optic network across Australia accounted for
Telstra’s existing fibre-optic cabling which covers around 150 000 kilometres across
Australia [54]. In the worst-case scenario, the NBN faced laying thousands of kilometres of
fibre, already covered by Telstra. This would represent a significant cost to the NBN project
and be seen as a waste of materials and resources on what would essentially be a duplicated
network already covered by Telstra. On the 20th June 2010, Telstra and the NBN Co. entered
into a Financial Heads of Agreement, which essentially would lead to a faster, cheaper and
more efficient rollout of the NBN. The agreement, worth an expected $11 billion, provides
for the use of existing Telstra infrastructure, including pits, ducts and backhaul fibre. The
agreement also covers the progressive migration of customers from Telstra’s copper and pay-
tv cable networks to NBN Co.’s new fibre network [55]. This agreement effectively lowers
the significant financial risk that faced the NBN Co. due to the excessive costs that would
have been involved in duplicating Telstra’s existing fibre network. It also accounts for the
concerns of sufficient demand for the new fibre network by including the migration of part of
Telstra’s broadband customer base across to NBN Co.
3.8.3. Political Instability
The federal election in 2010 led to an even greater focus on the NBN, which was originally
proposed by the Australian Labour Party. The opposition Liberal Party have different views
on a NBN and proposed an alternative solution, which is summarised and compared against
the Labour’s NBN plan in Table 3.8 below:
Table 3.8 Labour’s NBN versus Liberal’s proposed broadband network
Australian Labour Party - NBN 2.0 Liberal Party of Australia – NBN 3.0
• FTTP network • HFC, DSL and wireless network
• $43 billion investment • $6.3 billion investment
• Broadband speeds of 100Mbps • Broadband speeds of at least 12Mbps
• 9 year rollout • 7 year rollout
• 99% Coverage • 97% Coverage

60
The two most significant differences are ultimately the capital expenditure and the expected
broadband speeds provided by the two projects. The Liberal party’s NBN proposal
represented a large cost saving for “reasonable” speeds. A few days before the federal
election, NBN Co Chief Mike Quigley announced that the NBN project would deliver 10
times initial predicted speeds, up to 1Gbps [30]. The timing of the statement acted to
reinforce the Labour Party’s commitment to a high-speed broadband network, even though
there are doubts as to whether such speeds are necessary for the home. The Alliance for
Affordable Broadband (AAB), which consists of a number of top Australian telco chief
executives, suggested that speeds of up to 1Gbps would not be required by homes in the short
to medium term [56]. The Liberal Party’s NBN plan focuses more on the importance of
market powers (private investment) to deliver the “last mile” service. The AAB also firmly
believes that the “last mile” connection would be better serviced by emerging wireless
technologies such as 4G LTE and Wi-Max which would address increasing demand for
mobile connectivity [56].
Early release sites for the NBN are focussed on remote areas that don’t have access to
broadband services. There is also a focus on establishing the fibre backbone, which will act to
connect rural and urban areas across Australia. The six regional backbone blackspot priority
(RBBP) locations that are of importance are [57]:
1. Geraldton, Western Australia
2. Darwin, Northern Territory
3. Emerald and Longreach, Queensland
4. Broken Hill, New South Wales
5. Victor Harbor, South Australia
6. South West Gippsland, Victoria
The above RBBPs are displayed in Figure 3.22 below. The NBN implementation plan is set
to upgrade metropolitan areas and other areas with existing high speed broadband in the final
release. Therefore it could be argued that the first part of the NBN rollout is similar to the
Liberal Party’s backhaul backbone fibre network proposal.

61
Figure 3.22 Priority release sites across Australia [58]

62
The recent federal election has already had an effect on the proposed rollout. The rollout has
been redesigned to address more regional areas first. This decision came as a result of the
political pressure on the Labour Party to win marginal independent seats after the recent 2010
federal election resulted in a hung parliament. There will also be an accelerated rollout of
wireless and satellite solutions, which will aid to connect more rural areas sooner. This late
change of rollout to oblige a few key politicians demonstrates the regulatory hazard present in
the high stakes NBN project. It also identifies possible future hazards that the NBN’s project
rollout and operation can be affected by political instability.
In summary, the recent federal election of 2010 presented a significant political risk to the
NBN project. If the Liberal party had formed a coalition government, Labour’s $43 billion
NBN would have be abandoned in favour of a lower cost but slower broadband network. The
9 year life span of the NBN project means that there is still continuing risk for political
instability until at least the next federal election. However, due to the similarities between the
fibre backbone focus by both the Labour and Liberal Party’s NBN plans, the initial 4 year
rollout of either project would be similar. In the case that the Labour Party loses power in the
next election, the NBN would not become redundant and necessarily disbanded. The fibre
backbone established would be able to be incorporated into the Liberal’s plans to revert to a
FTTN network instead of FTTP and leave the “last mile” connection to the telcos and market
powers. There is also considerable risk that the Labour Party will continue to adapt its
original NBN plan to win the support of voters. If the NBN is used as a tool to sway the
public’s political opinion, then there is serious concern that the NBN could be designed to
look good only on paper and appealing to voters instead of being practical, functional and in
the best interests of future generations.
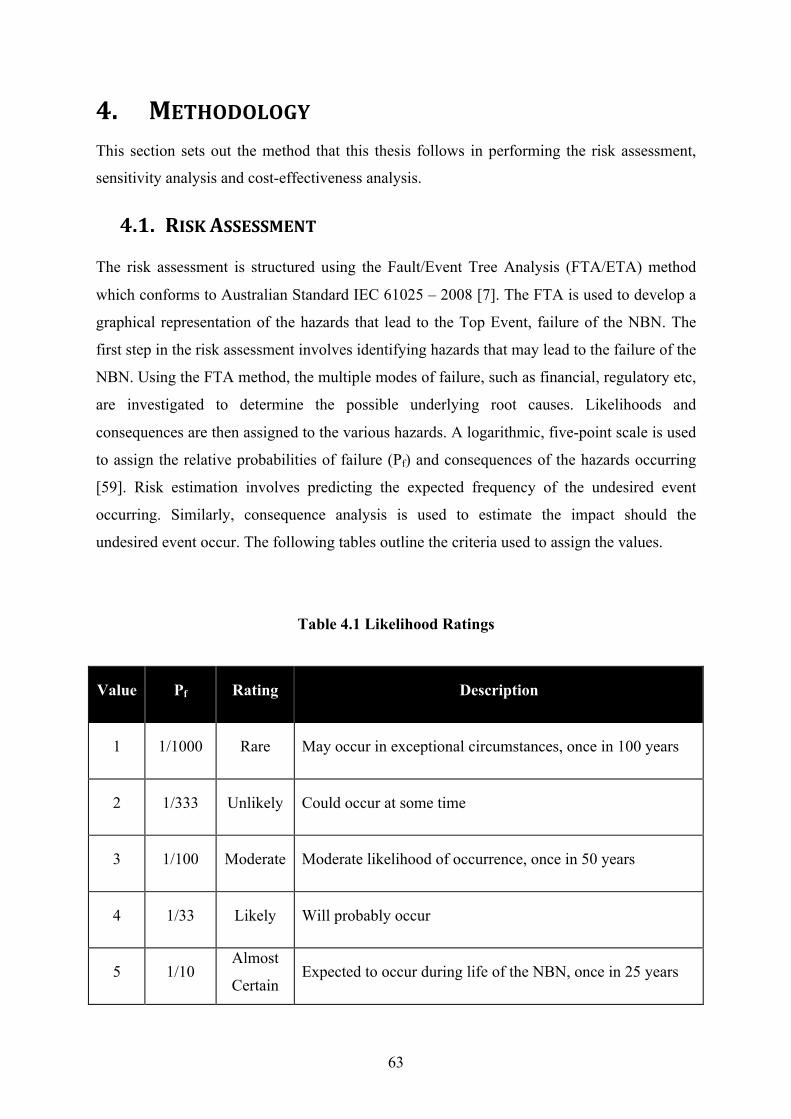
63
4. METHODOLOGY This section sets out the method that this thesis follows in performing the risk assessment,
sensitivity analysis and cost-effectiveness analysis.
4.1. RISK ASSESSMENT
The risk assessment is structured using the Fault/Event Tree Analysis (FTA/ETA) method
which conforms to Australian Standard IEC 61025 – 2008 [7]. The FTA is used to develop a
graphical representation of the hazards that lead to the Top Event, failure of the NBN. The
first step in the risk assessment involves identifying hazards that may lead to the failure of the
NBN. Using the FTA method, the multiple modes of failure, such as financial, regulatory etc,
are investigated to determine the possible underlying root causes. Likelihoods and
consequences are then assigned to the various hazards. A logarithmic, five-point scale is used
to assign the relative probabilities of failure (Pf) and consequences of the hazards occurring
[59]. Risk estimation involves predicting the expected frequency of the undesired event
occurring. Similarly, consequence analysis is used to estimate the impact should the
undesired event occur. The following tables outline the criteria used to assign the values.
Table 4.1 Likelihood Ratings
Value Pf Rating Description
1 1/1000 Rare May occur in exceptional circumstances, once in 100 years
2 1/333 Unlikely Could occur at some time
3 1/100 Moderate Moderate likelihood of occurrence, once in 50 years
4 1/33 Likely Will probably occur
5 1/10 Almost
Certain Expected to occur during life of the NBN, once in 25 years
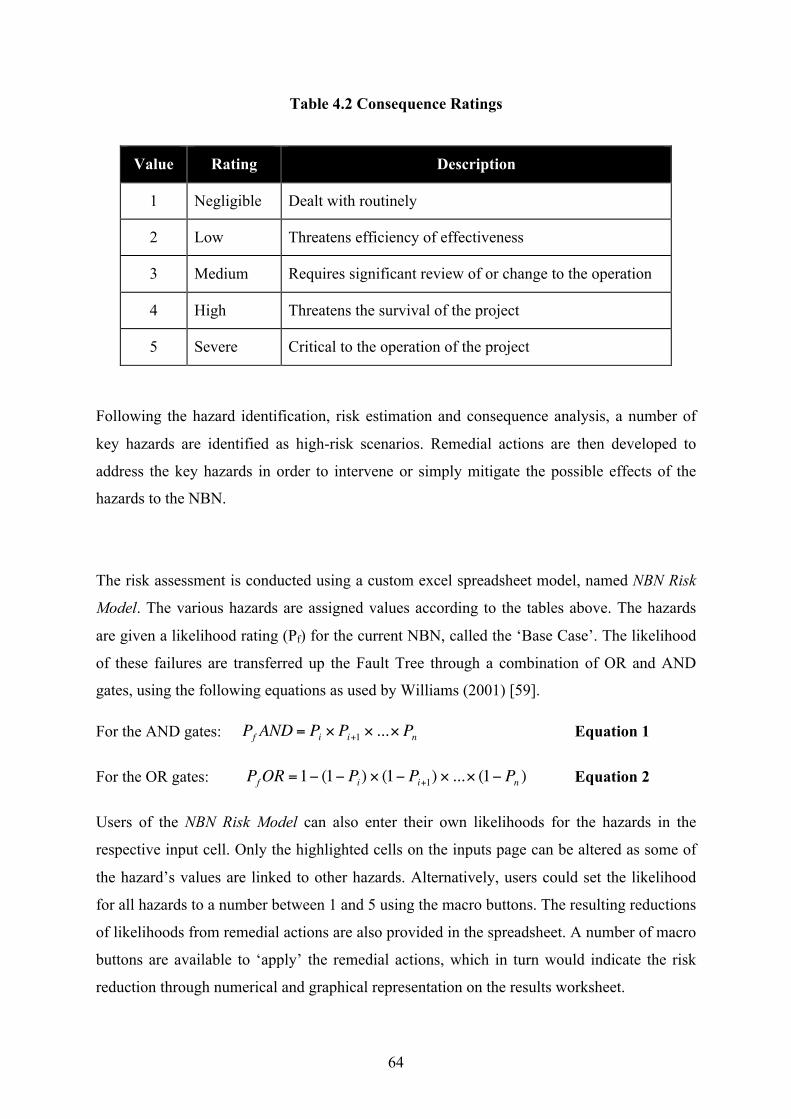
64
Table 4.2 Consequence Ratings
Value Rating Description
1 Negligible Dealt with routinely
2 Low Threatens efficiency of effectiveness
3 Medium Requires significant review of or change to the operation
4 High Threatens the survival of the project
5 Severe Critical to the operation of the project
Following the hazard identification, risk estimation and consequence analysis, a number of
key hazards are identified as high-risk scenarios. Remedial actions are then developed to
address the key hazards in order to intervene or simply mitigate the possible effects of the
hazards to the NBN.
The risk assessment is conducted using a custom excel spreadsheet model, named NBN Risk
Model. The various hazards are assigned values according to the tables above. The hazards
are given a likelihood rating (Pf) for the current NBN, called the ‘Base Case’. The likelihood
of these failures are transferred up the Fault Tree through a combination of OR and AND
gates, using the following equations as used by Williams (2001) [59].
For the AND gates:
€
Pf AND = Pi × Pi+1 × ...× Pn Equation 1
For the OR gates:
€
PfOR =1− (1− Pi) × (1− Pi+1) × ...× (1− Pn ) Equation 2
Users of the NBN Risk Model can also enter their own likelihoods for the hazards in the
respective input cell. Only the highlighted cells on the inputs page can be altered as some of
the hazard’s values are linked to other hazards. Alternatively, users could set the likelihood
for all hazards to a number between 1 and 5 using the macro buttons. The resulting reductions
of likelihoods from remedial actions are also provided in the spreadsheet. A number of macro
buttons are available to ‘apply’ the remedial actions, which in turn would indicate the risk
reduction through numerical and graphical representation on the results worksheet.
65
The process of risk estimation and consequence analysis is a subjective process. However,
wherever possible, research was conducted to formulate better predictions for probability of
failure and consequences. The research data that aided the estimation process is included in
the previous section 3 Theory.
4.2. SENSITIVITY ANALYSIS
The sensitivity analysis investigates how a variation in inputs to the NBN Risk Model affects
the outputs to the model. By varying the input parameters of consequence and probability of
failure between 1 and 5, the dynamic behaviour of the risk model is observed. Effectively,
this involves assigning all hazards a value of 1 and assigning the consequences of the failure
modes a value of 1. The hazards are then assigned a value of 2 while holding consequences
constant at a value of 1. This is carried out for all values up till 5 and then repeated by
holding the hazards constant and varying the consequence values. A graphic representation of
the results will clearly indicate the degree of sensitivity of the risk model to the variation of
probability of failure and consequence.
4.3. COSTEFFECTIVENESS ANALYSIS (CEA)
A CEA acts as a means for comparison of different remedial options under consideration.
The remedial actions generated by the risk assessment are used to determine their relative
costs with respect to the cost of the NBN. The forecasted cost of $43 billion for the
construction of the NBN is used to calculate the relative costs. Similarly, the relative failure
for the remedial actions is determined with respect to the base case NBN, by setting the base
case to a relative failure ranking of 5. A calculation of relative risk versus relative cost is then
determined by the product of the relative cost and the relative failure, where the lower the
score, the better the outcome. A cost-benefit analysis was deemed unsuitable for this analysis
due to numerous intangible benefits and costs associated with the NBN project. Placing a
monetary value on such costs and benefits would be too subjective to be credible for this
study. As such, any costs or benefits were given a relative ranking so that they may still be
quantitatively analysed.

66

67
5. RESULTS The following Table 5.1 Identified Hazards and Likelihoods of Failure, shows the various
hazards identified in the NBN risk assessment along with their probability of failure (Pf). A
total of 59 hazards were identified as having a possible affect on the NBN. The pages
following Table 5.1 show the FTA performed using the identfied hazards. The FTA
graphically shows the relationships between the identified hazards and how they contribute to
the overall risk ranking of the NBN. The FTA has been split into the seven failure modes as
addressed under section 3 Theory, namely:
1. Construction Hazards
2. Operational Hazards
3. Demand Hazards
4. Network Hazards
5. Technological Hazards
6. Financial Hazards
7. Regulatory Hazards
The final FTA diagram showing the Top Event, Failure of the NBN, is a combination of these
seven failure modes, resulting in an overall risk ranking.

68
Table 5.1 Identified Hazards and Likelihoods of Failure
Hazards Description Likelihood Pf Construction Hazards
Delay of Works Shortage of ICT Labour - Splicing Technicians 3 0.0100
Delay of Works Shortage of ICT Labour - Other ICT Labour 3 0.0100
Delay of Works People (Organisational, Disputes resolution, Political) 3 0.0100
Delay of Works Bankruptcy of Contractors 2 0.0033
Delay of Works Materials - Shortage of SATs, OLTs, ONTs, 1 0.0010
Delay of Works Materials - Design (ISO drawings) 2 0.0033 Delay of Works Materials - Shortage of Fibre Supply 2 0.0033 Delay of Works Latent Ground 4 0.0333 Design problems Security - % Aerial Works 3 0.0100
Design problems Security - Protocol and Communication standards used 3 0.0100
Design problems Scope Creep - % of Australian Premises Supplied with Fibre >90% 4 0.0333
Design problems Third party Integration of Alliances 3 0.0100
Budget Exceed Underground construction (% Existing Ducts available) 3 0.0100
Budget Exceed Latent Ground 4 0.0333 Budget Exceed Labour Costs Increase 2 0.0033 Budget Exceed Materials Supply & Demand 2 0.0033 Operational Hazards
Cyber Crime, Spam & Intellectual Property 4 0.0333
Less than 90% Australia reached by Fibre 1 0.0010
Required 100Mbps data rates Current ability of technology to obtain 100Mbps 3 0.0100
Maintenance and Equipment Failure Lack of redundancy in design 3 0.0100
Maintenance and Equipment Failure Reduced equipment/project lifespan 2 0.0033
Demand Hazards
Increased Demand Government Incentives - Above expected take-up of lead-ins 2 0.0033
Increased Demand Increased demand for high speed broadband 3 0.0100
Increased Demand Increase in Travel Costs 4 0.0333 Increased Demand Increase in population 4 0.0333 Increased Demand Innovation and Application development 3 0.0100 Decreased Demand High price Charged by Wholesaler/ISPs 4 0.0333 Decreased Demand Fibre Technology superseded 4 0.0333 Decreased Demand Negative NBN publicity 3 0.0100 Decreased Demand Below average take-up of lead-ins 3 0.0100 Decreased Demand Reliability issues 3 0.0100

69
Hazards Description Likelihood Pf Network Hazards
Retailers vs Wholesalers High price Charged by Wholesaler/Service Providers 4 0.0333
Retailers vs Wholesalers Poor service levels 2 0.0033
Telstras FTTP Network Telstra operating own last mile FTTP connection 1 0.0010
Maintenance & lack of Redundancy in design 3 0.0100
New & Competing technologies 4G & Future Generation Wireless 4 0.0333
New & Competing technologies
Poor integration of fibre (90%) and wireless/satellite 2 0.0033
Slow Data Rates Increased demand for high speed broadband 3 0.0100
Slow Data Rates Above expected take-up of lead-ins (Government Incentives) 2 0.0033
Slow Data Rates Bottlenecks in network design 5 0.1000 Technological Hazards Fibre Superseded 4G & Future Generation Wireless 4 0.0333
Fibre Superseded Increased demand for wireless broadband - Demand for mobility 5 0.1000
Fibre Superseded New broadband technologies 4 0.0333 Security Accessibility to Fibre - % Aerial Works 3 0.0100 Security Ability to tap fibre lines 3 0.0100 Data Rates Ability to provide 100Mbps data rates 3 0.0100 Financial Hazards
Scope creep % of Australian Premises Supplied with Fibre >90% 4 0.0333
Scope creep Integration of new community technologies 2 0.0033
Global Financial Downturn Exchange Rate - Expensive imported materials and equipment 2 0.0033
Global Financial Downturn Government Revenue downturn 3 0.0100
Project Financing Government Investment - 10% ($4.7bn) Capital requirements 4 0.0333
Project Financing Government Investment - Infrastructure bonds 4 0.0333
Project Financing Lack of Private Investment 5 0.1000 Project Revenue Below average take-up of lead-ins 3 0.0100 Regulatory Hazards
Lack of telecommunication and competition policies
NBN Co. Natural Monopoly, competition policy, RF spectrum assignment
5 0.1000
High price Charged by Wholesaler/Service Providers 4 0.0333
Telstra's Co-operation Telstra not sharing customer base with NBN Co. 2 0.0033
Telstra's Co-operation Telstra operating own last mile FTTP connection 1 0.0010
Political Instability Labour vs Liberal broadband plans 5 0.1000

70
5.1. FAULT TREE ANALYSIS (FTA)
Figure 5.1 Construction Hazards FTA

71
Figure 5.2 Operational Hazards FTA
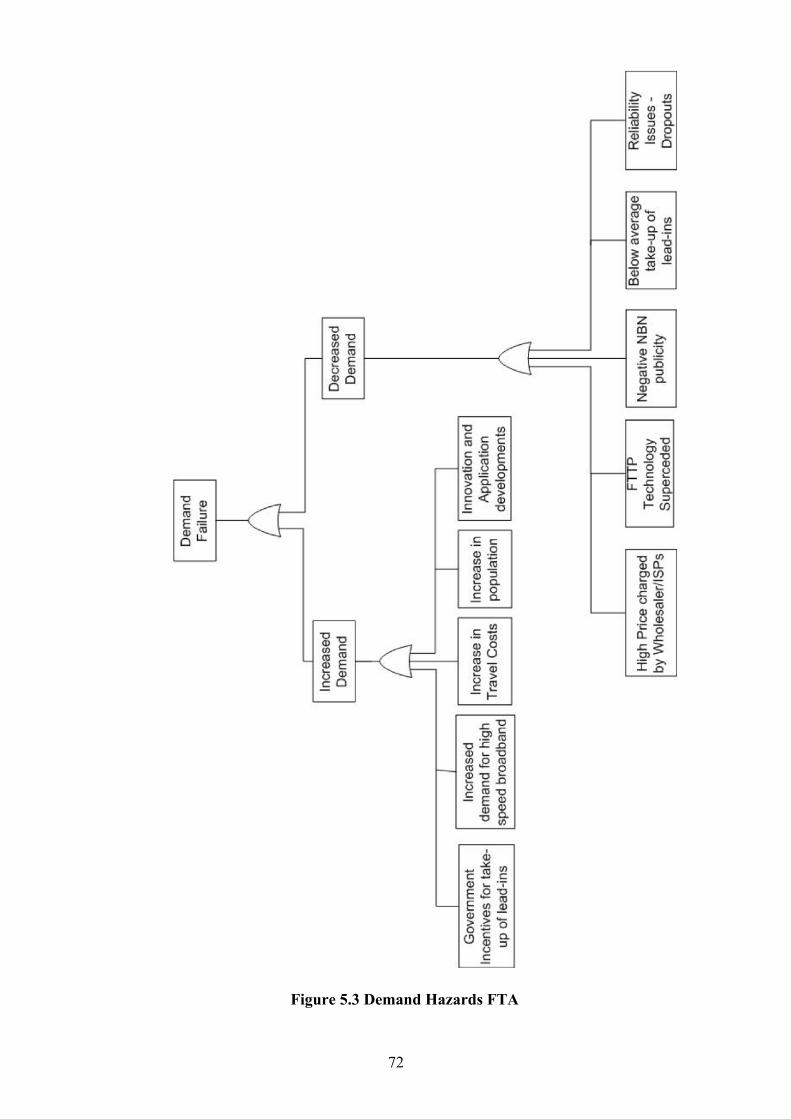
72
Figure 5.3 Demand Hazards FTA
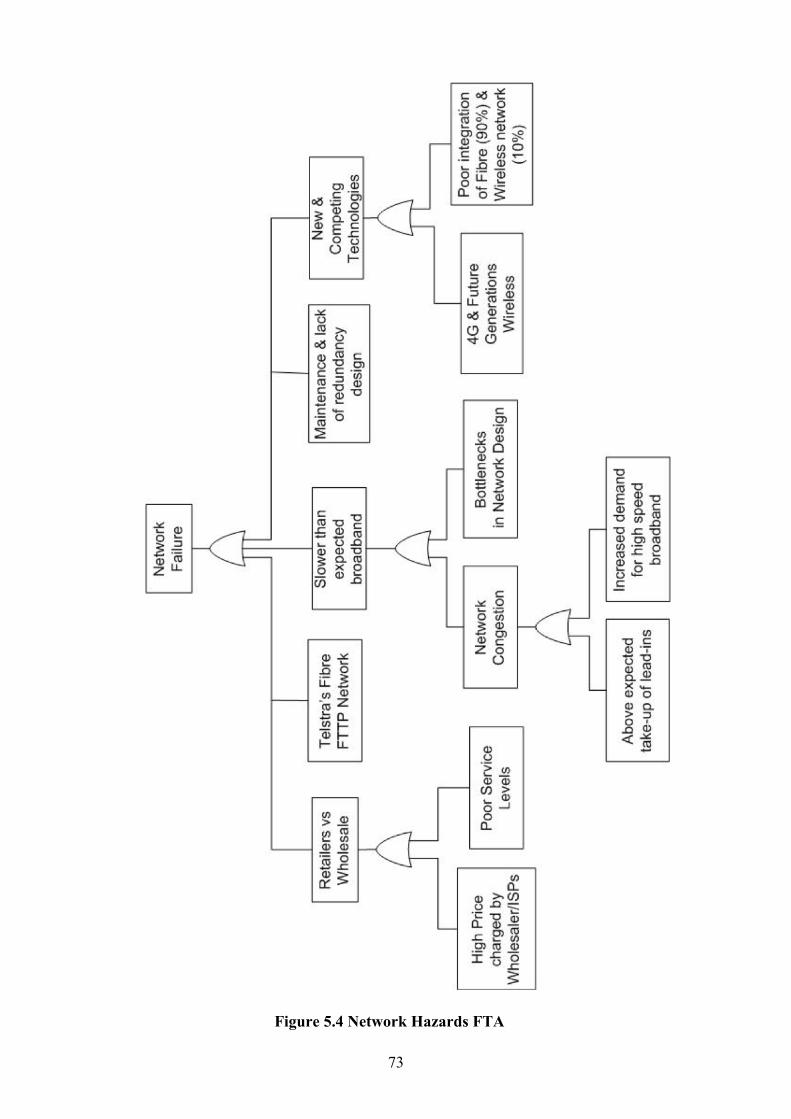
73
Figure 5.4 Network Hazards FTA

74
Figure 5.5 Technological Hazards FTA

75
Figure 5.6 Financial Hazards FTA

76
Figure 5.7 Regulatory Hazard FTA
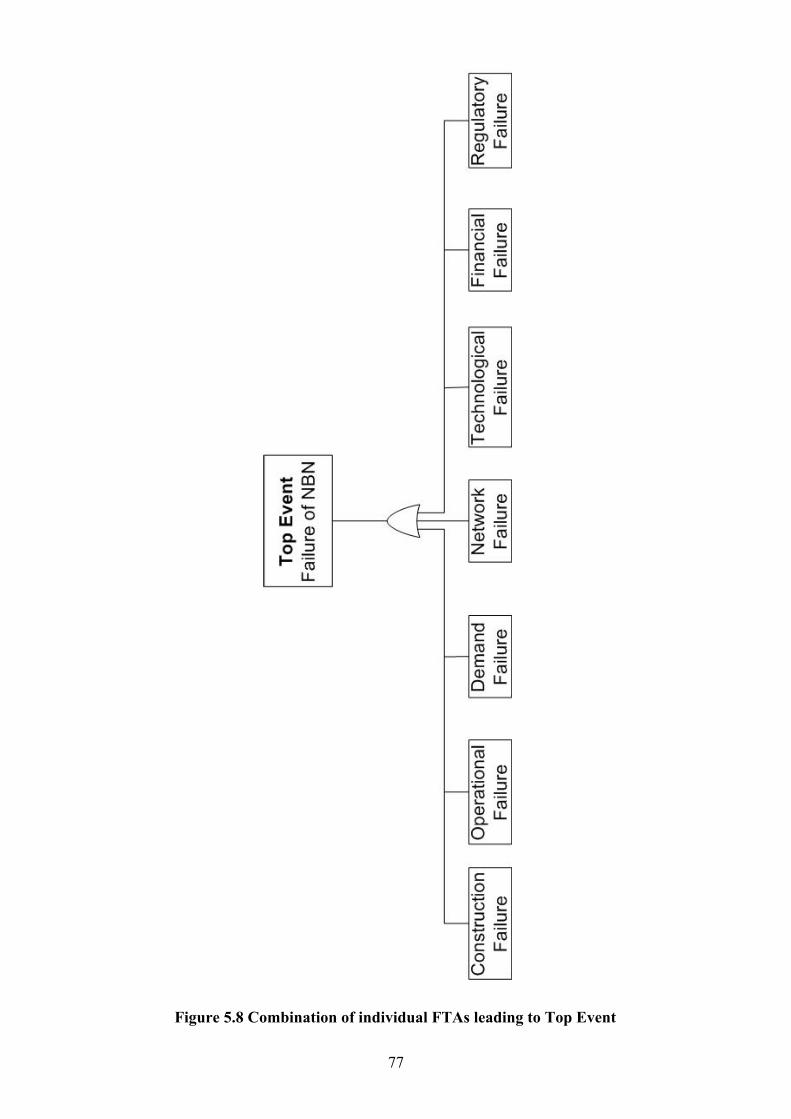
77
Figure 5.8 Combination of individual FTAs leading to Top Event

78

79
5.2. KEY HAZARDS
The combination of the seven failure modes and 59 hazards identified in Table 5.1 generate
the following results:
Table 5.2 Risk Assessment Results
Likelihood Consequence Risk Ranking
Construction Hazards 0.173 3 0.519
Operational Hazards 0.057 3 0.170
Demand Hazards 0.172 4 0.690
Network Hazards 0.185 3 0.554
Technological Hazards 0.167 4 0.670
Financial Hazards 0.209 5 1.043
Regulatory Hazards 0.220 5 1.102
Total Risk Ranking for the NBN 4.747
A total risk ranking of 4.74 is calculated for the NBN.
Table 5.2 above shows the breakdown of risk by failure modes. Regulatory hazards are
determined to be the highest risk to the NBN with a risk ranking of 1.102. This was followed
by financial hazards and demand hazards. The graph below is a graphical representation of
the risk ranking results.

80
Figure 5.9 Risk ranking results for various hazards to the NBN
In order to address the key hazards of Regulatory, Financial and Demand, the underlying
hazards that contribute to these top-level failure modes will have to be addressed. From Table
5.1, the main underlying hazards are:
• Construction hazards:
o Delay of works due to latent grounds
o Exceeds budget due to latent grounds
o Scope creep through greater than 90% coverage
• Operational Hazards:
o Cyber crime, spam and intellectual property
• Demand Hazards:
o Increased in demand for high speed broadband
o Increased in travel costs
o Increase in population
o High price charged by wholesaler/ISPs
o Fibre technology superseded
• Network Hazards:
o High price charged by Wholesaler/ISPs
o 4G and Future generation wireless technologies
o Increase in demand for high speed broadband
o Bottlenecks in network design
0.519
0.170
0.690
0.554 0.670
1.043 1.102
0.0
0.2
0.4
0.6
0.8
1.0
1.2 Risk Ran
king

81
• Technological Hazards:
o Increase in demand for wireless broadband
o Increase in demand for mobility
o New emerging broadband technologies
• Financial Hazards:
o Lack of private investment
o Scope creep through greater than 90% coverage
o Project Financing – capital requirements and infrastructure bonds
• Regulatory Hazards:
o Lack of telecommunication and market competition policies
o Political instability - Labour vs. Liberal NBN plans
o High price charged by Wholesaler/ISPs
A number of the above hazards crossover within the seven failure modes. For example, scope
creep relates both to construction and financial hazards as it will increase construction time
and lead to an increase in costs. By dealing with the one hazard, both failure modes of
construction and financial will benefit from hazard reduction. Addressing these hazards will
lead to the greatest risk reduction through remedial actions. The above list of hazards is
summarised to form the following eight key hazards.
1. Scope creep
2. Increase in demand for high speed broadband
3. Increase in demand for mobility/wireless connectivity
4. Bottlenecks in network design
5. High prices charged by Wholesaler/ISPs
6. Lack of private investment
7. Lack of telecommunication and market competition policies
8. Political instability

82
5.3. SENSITIVITY ANALYSIS
A sensitivity analysis was conducted on the overall risk ranking, by systematically varying
the inputs of construction, operation, demand, network, technology, financial and regulatory
hazards. The likelihood ratings for all hazards were varied from 1 to 5, while the consequence
ratings were also varied on the 1 to 5 scale. The overall risk ranking for the combined failure
modes is displayed below.
Table 5.3 Sensitivity Analysis Results
CONSEQUENCE
LIKELIHOOD Negligible Low Medium High Extreme
Rare 0.057 0.113 0.170 0.227 0.284
Unlikely 0.187 0.374 0.562 0.749 0.936
Moderate 0.545 1.091 1.636 2.182 2.727
Likely 1.646 3.293 4.939 6.585 8.232
Almost Certain 3.818 7.635 11.453 15.270 19.088
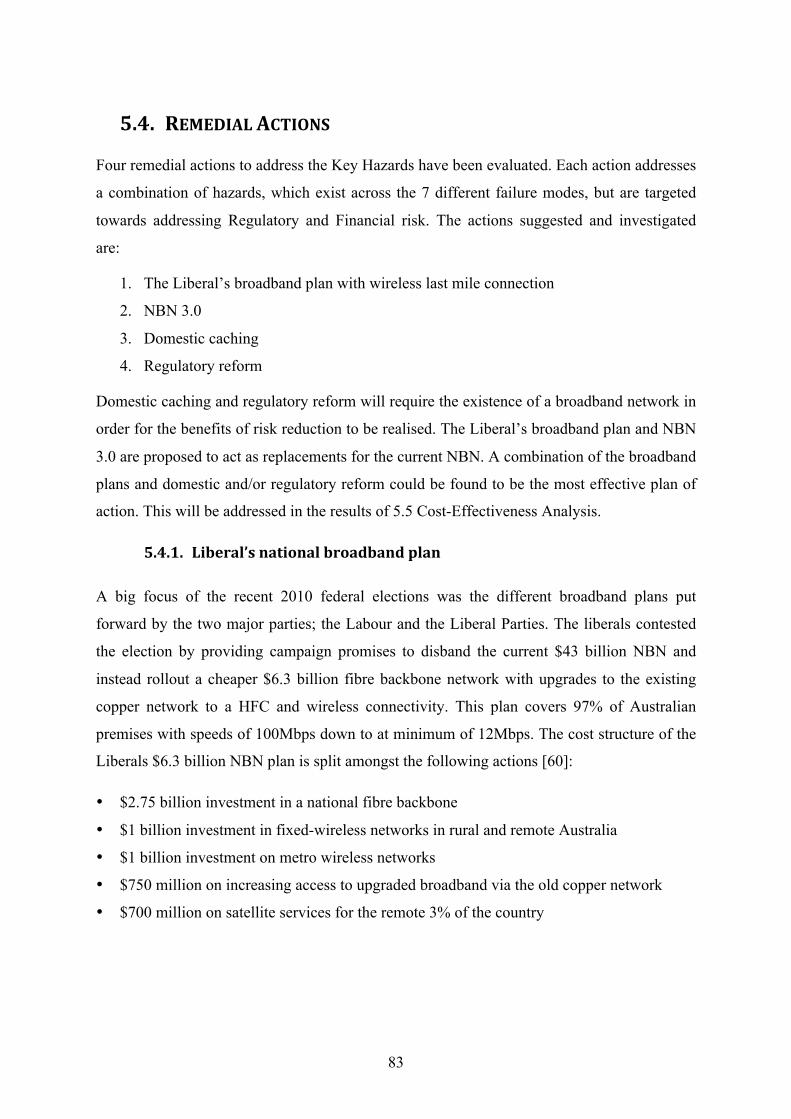
83
5.4. REMEDIAL ACTIONS
Four remedial actions to address the Key Hazards have been evaluated. Each action addresses
a combination of hazards, which exist across the 7 different failure modes, but are targeted
towards addressing Regulatory and Financial risk. The actions suggested and investigated
are:
1. The Liberal’s broadband plan with wireless last mile connection
2. NBN 3.0
3. Domestic caching
4. Regulatory reform
Domestic caching and regulatory reform will require the existence of a broadband network in
order for the benefits of risk reduction to be realised. The Liberal’s broadband plan and NBN
3.0 are proposed to act as replacements for the current NBN. A combination of the broadband
plans and domestic and/or regulatory reform could be found to be the most effective plan of
action. This will be addressed in the results of 5.5 Cost-Effectiveness Analysis.
5.4.1. Liberal’s national broadband plan
A big focus of the recent 2010 federal elections was the different broadband plans put
forward by the two major parties; the Labour and the Liberal Parties. The liberals contested
the election by providing campaign promises to disband the current $43 billion NBN and
instead rollout a cheaper $6.3 billion fibre backbone network with upgrades to the existing
copper network to a HFC and wireless connectivity. This plan covers 97% of Australian
premises with speeds of 100Mbps down to at minimum of 12Mbps. The cost structure of the
Liberals $6.3 billion NBN plan is split amongst the following actions [60]:
• $2.75 billion investment in a national fibre backbone
• $1 billion investment in fixed-wireless networks in rural and remote Australia
• $1 billion investment on metro wireless networks
• $750 million on increasing access to upgraded broadband via the old copper network
• $700 million on satellite services for the remote 3% of the country

84
A risk assessment conducted on the Liberal’s plan using the NBN Risk Model highlights a
number of risk reductions and risk increases in certain areas. The likelihoods of hazards
occurring were reduced in the following areas:
• Private investment - as costs are lower and the broadband plan is focused on private
sector development of the network and wireless technologies
• Lower wholesale price setting by NBN Co. - as construction costs will be lower than the
NBN and therefore required returns and operating revenues will be lower
The Liberal’s plan presented higher likelihoods of hazards occurring in the following areas:
• Percentage of Australian’s reached by fibre connections will be less than the NBN
• Lack of redundancy in design, due to less fibre construction, leading to possible
maintenance and equipment failure
• Increased risk in demand for high speed broadband as network will be slower than NBN
• Telstra operating own last mile connection
• Telstra not sharing their previously negotiated customer base and existing fibre
infrastructure.
Overall, the Liberal’s broadband plan presents a higher risk ranking than the current NBN
plan. However, a cost-effectiveness analysis will most likely show that the Liberal’s plan is
more cost-effective due to its cost of construction being projected at 15% of the NBN.
However, the risk assessment of the Liberal’s plan did highlight the shortcomings of a
cheaper network, which may become technologically outdated sooner and ultimately result in
slower data rates.

85
5.4.2. NBN 3.0
The Alliance for Affordable Broadband (AAB) was formed by a group of Telco chiefs and
experts. They put forward suggestions for amendments to the current NBN, calling their
version NBN 3.0. The AAB propose that NBN 3.0 should service 98% of Australians using
4G wireless technology for the last mile connection instead of FTTP. The following table
highlights the key similarities and differences between the NBN and NBN 3.0
Table 5.4 Current NBN plan versus NBN 3.0
Similarities Differences
• NBN 3.0 will operate off a National Fibre
Backhaul Network
• Speeds of 100Mbps
• Fibre for schools, hospitals and most
businesses providing speeds up to 1Gbps
• Satellite for remote areas at speeds up to
12Mbps
• Fibre backbone and 4G Wireless
technologies used for last mile
connection
• Project rollout over 4 years
• Public/private model utilising existing
private fibre and wireless infrastructure in
conjunction with new national wholesale
4G network.
• 4G Wireless network costing $3.5 billion
The NBN 3.0 plan emphasises the importance of private competition. Competition based on
infrastructure provision is preferential over the current NBN’s plan for infrastructure
monopolies with retail competition. The NBN 3.0 also prioritises providing broadband to
those who don’t have access, rather than providing up to 1Gbps connections to premises in
urban areas that already have access to broadband. The focus on 4G wireless technologies for
connecting 98% of Australians is highly dependent on government’s policymaking decision
with respect to the freeing up of spectrum with the switch over to digital television signals
(see section 3.8.1 Regulatory Policies). The opening up of the 700Mhz spectrum will allow
wireless to become a plausible alternative to fibre connections. At this frequency, wireless
signals are able to carry higher data rates with less attenuation over large distances. The
signal is also less affected in built up areas by buildings and other obstructions that may
affect line of sight connection. As a result, required data rates of 100Mbps will be achievable
and the greater signal range will allow a single wireless tower to cover a greater region and
therefore lower the fixed infrastructure cost.

86
NBN 3.0 is projected to cost US$3 billion. A similar national 4G wireless network in the
USA is projected to cost US$7 billion, which includes operational costs for the first 7 years
[56]. The network will cover 93% of 300 million people in the USA, over an area roughly the
same landmass of Australia. Considering Australia’s lower population of 22 million and that
75% of the population is located along the coastal region, leads to approximating half the cost
of the US 4G wireless network. For the purpose of this thesis, NBN 3.0 will be costed at AU$
3.5 billion, rounding up after currency conversion rate of around US$0.90 to one Australian
dollar. It must be noted that the above costing only includes plans for provision of 4G
wireless technology to 98% of Australian premises. The AAB provided no further cost
structure for the fibre backbone, fibre to schools, hospitals and businesses and satellite
connections for rural areas. Therefore, the analysis will only consider the 4G wireless
network in assessing its risks and benefits as a remedial action.
The NBN 3.0 will be suggested as a three-part remedial action for the current NBN. The first
option will consider the NBN 3.0 as a standalone plan, providing 98% wireless coverage,
which will be referred to as NBN 3.0. The second option will consider NBN 3.0 as an
addition to the existing NBN, by providing both FTTP and the 98% wireless coverage, which
will be referred to as NBN 3.1. The cost of the two plans combined will simply be their
summation. The final and third option will combine the Liberal Party’s broadband plan with
the NBN 3.0 to provide a plan similar to that suggested by the AAB, which will be referred to
as NBN 3.2. This will include the fibre backbone, fibre to schools, hospitals and businesses
providing speeds up to 1Gbps and satellite connections for rural areas at speeds up to 12Mbps
and extending 4G wireless from just rural and metropolitan areas to 98% coverage. The cost
of these two plans combined will be added together, less the Liberal Party’s included costing
of $1bn worth on fixed wireless for rural and remote Australia, and $1bn for metro wireless.
The costing of these three plans is shown below:
NBN 3.0 = $3.5
NBN 3.1 = $43bn + $3.5bn = $46.5bn
NBN 3.2 = $6.5bn + $3.5bn - $2bn = $8bn

87
5.4.3. Domestic Caching
The problem of slow overseas data rates is due to a combination of sheer distance and to a
lesser extent, the number of access paths via submarine cables to countries such as the USA.
The emergence over the past decade of dynamic websites, which continuously update, meant
that access for that website content was stored in one location (ie a server in the USA). Rather
than accessing a local cache, which is possibly out of date, the original overseas cache is
accessed through international submarine fibre links. However, there has been a vast growth
in demand for video content, which is classified as static media because the file does not
change after creation. The figure below shows the forecasted growth for video and other
media.
Table 5.5 Consumer Internet Traffic Forecast by Sub-Segments [31]
The predicted Compound Annual Growth Rate (CAGR) for each sub-segment is indicated in
the last column of the above table. It is clear that Internet video to TV is expected to have the
highest growth rate at around 107%. This can be attributed to the increasing demand for iPTV
services. Internet video also poses high growth of around 48% due to popular media forums
such as YouTube. A graphical representation of the above data is shown on the following
page.
.
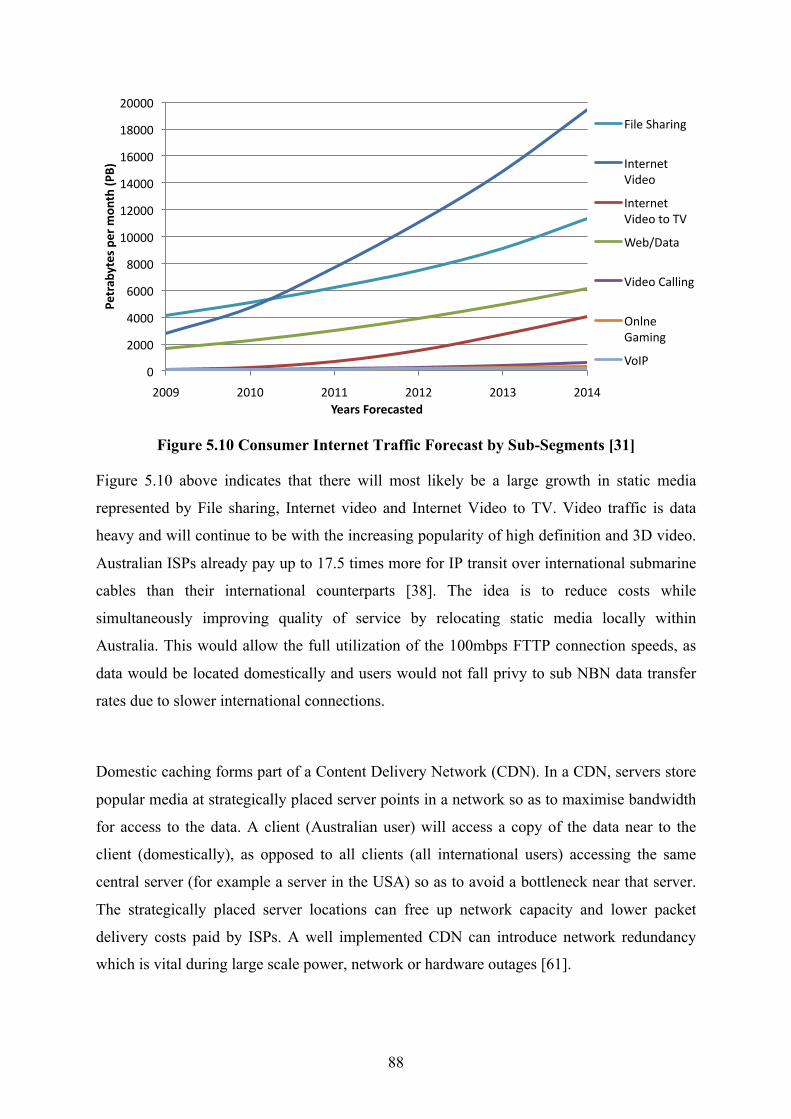
88
Figure 5.10 Consumer Internet Traffic Forecast by Sub-Segments [31]
Figure 5.10 above indicates that there will most likely be a large growth in static media
represented by File sharing, Internet video and Internet Video to TV. Video traffic is data
heavy and will continue to be with the increasing popularity of high definition and 3D video.
Australian ISPs already pay up to 17.5 times more for IP transit over international submarine
cables than their international counterparts [38]. The idea is to reduce costs while
simultaneously improving quality of service by relocating static media locally within
Australia. This would allow the full utilization of the 100mbps FTTP connection speeds, as
data would be located domestically and users would not fall privy to sub NBN data transfer
rates due to slower international connections.
Domestic caching forms part of a Content Delivery Network (CDN). In a CDN, servers store
popular media at strategically placed server points in a network so as to maximise bandwidth
for access to the data. A client (Australian user) will access a copy of the data near to the
client (domestically), as opposed to all clients (all international users) accessing the same
central server (for example a server in the USA) so as to avoid a bottleneck near that server.
The strategically placed server locations can free up network capacity and lower packet
delivery costs paid by ISPs. A well implemented CDN can introduce network redundancy
which is vital during large scale power, network or hardware outages [61].
0
2000
4000
6000
8000
10000
12000
14000
16000
18000
20000
2009 2010 2011 2012 2013 2014
Petrab
ytes per m
onth (P
B)
Years Forecasted
File Sharing
Internet Video
Internet Video to TV
Web/Data
Video Calling
Onlne Gaming
VoIP
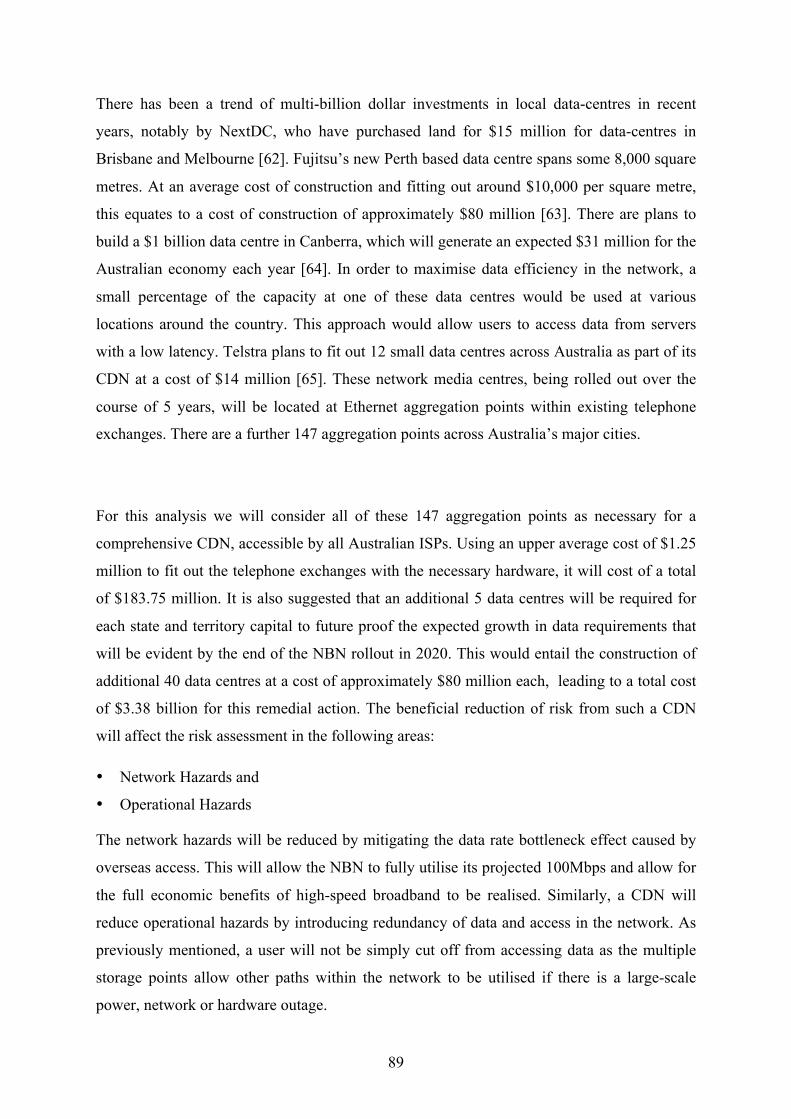
89
There has been a trend of multi-billion dollar investments in local data-centres in recent
years, notably by NextDC, who have purchased land for $15 million for data-centres in
Brisbane and Melbourne [62]. Fujitsu’s new Perth based data centre spans some 8,000 square
metres. At an average cost of construction and fitting out around $10,000 per square metre,
this equates to a cost of construction of approximately $80 million [63]. There are plans to
build a $1 billion data centre in Canberra, which will generate an expected $31 million for the
Australian economy each year [64]. In order to maximise data efficiency in the network, a
small percentage of the capacity at one of these data centres would be used at various
locations around the country. This approach would allow users to access data from servers
with a low latency. Telstra plans to fit out 12 small data centres across Australia as part of its
CDN at a cost of $14 million [65]. These network media centres, being rolled out over the
course of 5 years, will be located at Ethernet aggregation points within existing telephone
exchanges. There are a further 147 aggregation points across Australia’s major cities.
For this analysis we will consider all of these 147 aggregation points as necessary for a
comprehensive CDN, accessible by all Australian ISPs. Using an upper average cost of $1.25
million to fit out the telephone exchanges with the necessary hardware, it will cost of a total
of $183.75 million. It is also suggested that an additional 5 data centres will be required for
each state and territory capital to future proof the expected growth in data requirements that
will be evident by the end of the NBN rollout in 2020. This would entail the construction of
additional 40 data centres at a cost of approximately $80 million each, leading to a total cost
of $3.38 billion for this remedial action. The beneficial reduction of risk from such a CDN
will affect the risk assessment in the following areas:
• Network Hazards and
• Operational Hazards
The network hazards will be reduced by mitigating the data rate bottleneck effect caused by
overseas access. This will allow the NBN to fully utilise its projected 100Mbps and allow for
the full economic benefits of high-speed broadband to be realised. Similarly, a CDN will
reduce operational hazards by introducing redundancy of data and access in the network. As
previously mentioned, a user will not be simply cut off from accessing data as the multiple
storage points allow other paths within the network to be utilised if there is a large-scale
power, network or hardware outage.

90
5.4.4. Regulatory Reform:
Regulatory reform and efficient policymaking will address the obvious regulatory risks but
not political instability. A number of telecommunication-based policies could be introduced
to address the following:
• Improving productivity across the economy
• Management of government owned resources - NBN Co. and RF spectrum
• Competition amongst ICT and ISP operators
• Consumer protection
• Rural, regional and remote Australia access
• Reducing unnecessary regulation, and
• Community safety and national security
Policies in these areas will lead to a reduction in risk for regulatory, financial, demand and
operational hazards. The first act should address private ownership of the NBN Co. following
the completion of the NBN. Private ownership of the network is necessary to promote
efficiency and survival of the NBN. The private sector normally prevails over government in
striving for cost reductions and operating efficiencies in the search for profit maximization. A
balance between the maximum percentage ownership by anyone private investor is necessary
to facilitate competition, while still allowing a large enough ownership, say 25%, for concise
decision making by a few major owners. This will reduce regulatory risk and also instill
investor confidence within the NBN to allow for lower risk private investments.
Following on from the previous point, the financial hazards of the NBN could be addressed
by the actual development of up to date communication based policies. The act of
policymaking would mitigate perceived market risk for potential private investors. A
reduction in perceived market risk would mean investors require lower rates of return, which
would be closer to the rates of return offered by the NBN project (see section 3.7.2 Private
Investment). This would lead to greater private investment, earlier on in the project timeline,
rather than later when the risks of construction have been mitigated.

91
The magnitude of the NBN project provides an inherent risk of a natural monopoly
developing. Sufficient competition based policy could provide protection for consumers and
adequate competition would lead to a lowering of demand risk. Competition leads to more
socially efficient price setting (lower prices) in exchange for more quantity. This would result
in a lower price for access to NBN services and hence greater take-up of fibre, wireless and
satellite lead-ins. This increased take-up of NBN services will lead to greater operating
revenues and provide financial stability for the NBN.
The switchover from analogue to digital television signals will free up a significant portion of
RF spectrum. This provides the opportunity for further development and utilization of
wireless technologies (see section 3.8.1 Regulatory Policies). Successful policymaking by
opening up this freed spectrum to offers from the market will allow innovation and the
advancement of wireless technology, which would contribute to overall broadband access
options and hence competition within Australia. 4G Wireless will also benefit from lower
frequency spectrum assignment (around 700Mhz), as there is less attenuation over distance
for lower frequency signals. This will allow wireless to become even more competitive as
fewer 4G towers would have to be installed with the increased range of a single tower.
Finally, community safety and national security policies would help reduce operational
hazards. Sufficient policy making to empower police would provide protection against cyber
crime, spam and intellectual property. However, such policy making would be more difficult
to administer as it requires international involvement so cyber criminals cannot hide behind
the defence of their international borders and differing domestic cyber policies (see section
3.3 Operational Hazards).
The costing of such a regulatory reform is beyond the scope of this thesis. However, costs can
also be perceived as a benefit foregone. In the case of regulatory reform, if sufficient policies
are not set in place then the NBN will certainly become inefficient and lead to lower levels of
productivity in the economy than initially expected. Costing the productivity benefits of the
NBN is again, a subjective and difficult task. The case for efficient wireless spectrum usage
does however provide a means to cost regulatory reform as a benefit foregone. If sufficient

92
policy is not in place for the newly freed up RF spectrum, then wireless technologies will not
be given the same opportunity to develop as in other parts of the world. The cost of $3.5
billion for the NBN 3.0 would be foregone and along with the benefits. It is therefore decided
to attach the cost for the NBN 3.0 of $3.5 million to the cost of the remedial action of the
regulatory reform. Again, note that this costing is beyond the scope of this thesis and so the
dollar amount of $3.5 million will be used simply for the academic exercise of comparing
remediation actions in the cost-effectiveness analysis.

93
5.5. COSTEFFECTIVENESS ANALYSIS
The suggested remedial actions have the effect of either reducing or increasing the likelihood
of some hazards at varying costs. The following table summarises the projected costs of each
remedial action:
Table 5.6 Remedial Action Costs
Remedial Action Cost (Billions)
Liberal’s NBN $6.5
NBN 3.0 $3.5
NBN 3.1 $46.5
NBN 3.2 $9
Domestic Caching $3.38
Regulatory Reform $3.5
Various combinations of the above remedial actions are assessed when calculating the most
cost-effective plan of action. As mentioned before, the Liberal’s NBN and NBN 3.0/1/2 are
stand-alone broadband plans as alternatives to the current NBN. Therefore, the cost of $43
billion for the current NBN will be withdrawn when assessing these remedial actions.
Domestic caching and regulatory reform provide additional costs to whatever broadband
network option is chosen. The following Table 5.7 summarises the various costs and risk
reductions of all remedial options. The last column on the right shows the cost-effectiveness
results, where the lower the value is, the better the outcome. The remedial actions have been
numbered from 1 to 5 (shown in brackets) for easier referencing in the table.
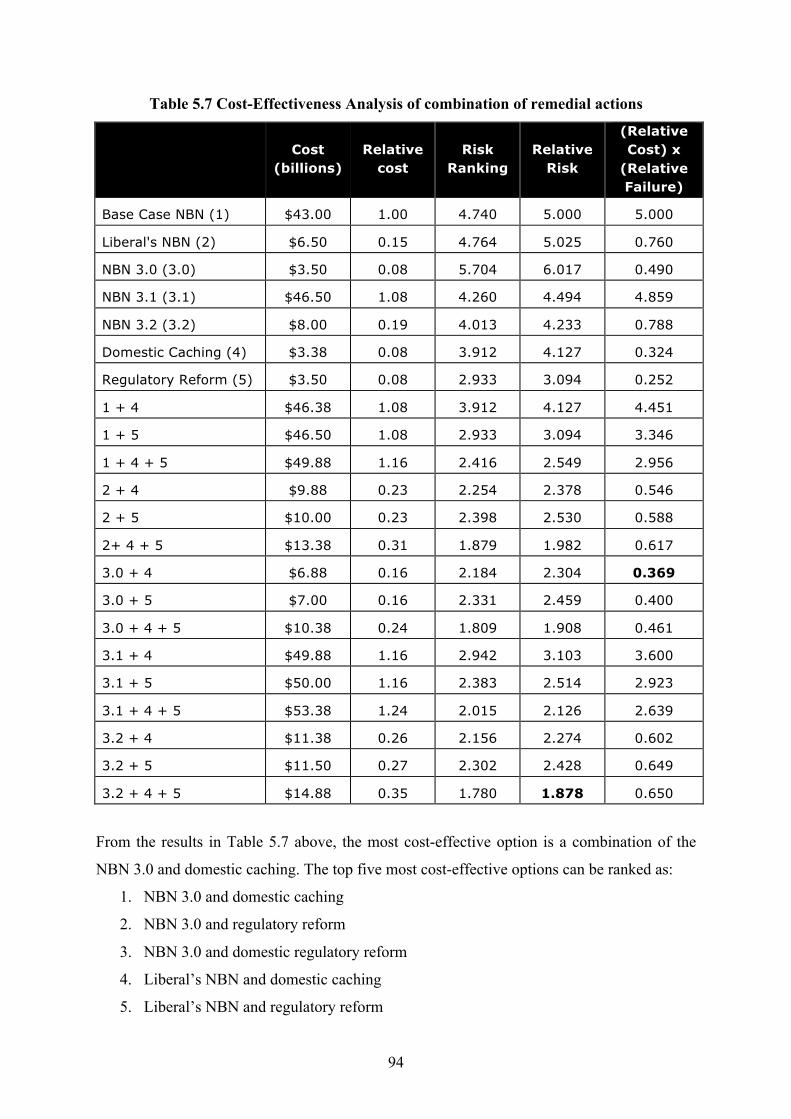
94
Table 5.7 Cost-Effectiveness Analysis of combination of remedial actions
Cost (billions)
Relative cost
Risk Ranking
Relative Risk
(Relative Cost) x
(Relative Failure)
Base Case NBN (1) $43.00 1.00 4.740 5.000 5.000
Liberal's NBN (2) $6.50 0.15 4.764 5.025 0.760
NBN 3.0 (3.0) $3.50 0.08 5.704 6.017 0.490
NBN 3.1 (3.1) $46.50 1.08 4.260 4.494 4.859
NBN 3.2 (3.2) $8.00 0.19 4.013 4.233 0.788
Domestic Caching (4) $3.38 0.08 3.912 4.127 0.324
Regulatory Reform (5) $3.50 0.08 2.933 3.094 0.252
1 + 4 $46.38 1.08 3.912 4.127 4.451
1 + 5 $46.50 1.08 2.933 3.094 3.346
1 + 4 + 5 $49.88 1.16 2.416 2.549 2.956
2 + 4 $9.88 0.23 2.254 2.378 0.546
2 + 5 $10.00 0.23 2.398 2.530 0.588
2+ 4 + 5 $13.38 0.31 1.879 1.982 0.617
3.0 + 4 $6.88 0.16 2.184 2.304 0.369
3.0 + 5 $7.00 0.16 2.331 2.459 0.400
3.0 + 4 + 5 $10.38 0.24 1.809 1.908 0.461
3.1 + 4 $49.88 1.16 2.942 3.103 3.600
3.1 + 5 $50.00 1.16 2.383 2.514 2.923
3.1 + 4 + 5 $53.38 1.24 2.015 2.126 2.639
3.2 + 4 $11.38 0.26 2.156 2.274 0.602
3.2 + 5 $11.50 0.27 2.302 2.428 0.649
3.2 + 4 + 5 $14.88 0.35 1.780 1.878 0.650
From the results in Table 5.7 above, the most cost-effective option is a combination of the
NBN 3.0 and domestic caching. The top five most cost-effective options can be ranked as:
1. NBN 3.0 and domestic caching
2. NBN 3.0 and regulatory reform
3. NBN 3.0 and domestic regulatory reform
4. Liberal’s NBN and domestic caching
5. Liberal’s NBN and regulatory reform

95
It should also be noted the combination of the NBN 3.2 plan with domestic caching and
regulatory reform results in the greatest risk reduction and lowest overall risk ranking for the
NBN Risk Model. This combination of plans requires a greater extent of spending for this risk
reduction and therefore does not result in the most cost-effective combination of remedial
actions.

96
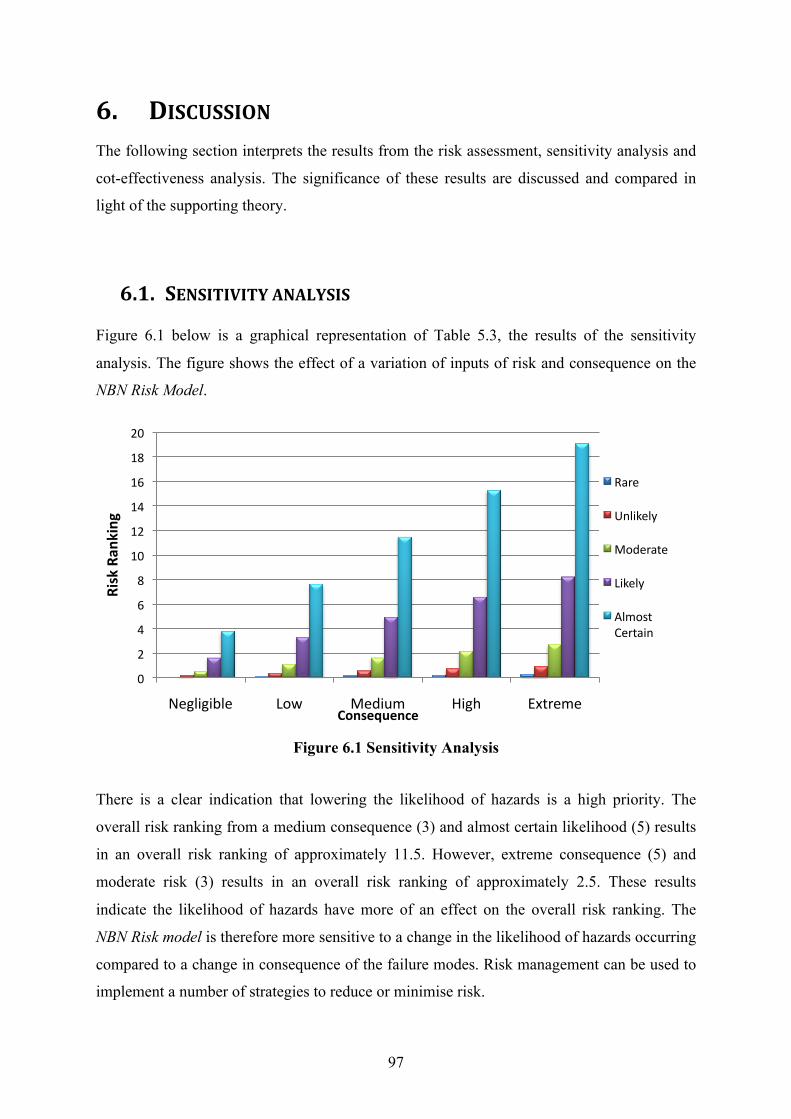
97
6. DISCUSSION The following section interprets the results from the risk assessment, sensitivity analysis and
cot-effectiveness analysis. The significance of these results are discussed and compared in
light of the supporting theory.
6.1. SENSITIVITY ANALYSIS
Figure 6.1 below is a graphical representation of Table 5.3, the results of the sensitivity
analysis. The figure shows the effect of a variation of inputs of risk and consequence on the
NBN Risk Model.
Figure 6.1 Sensitivity Analysis
There is a clear indication that lowering the likelihood of hazards is a high priority. The
overall risk ranking from a medium consequence (3) and almost certain likelihood (5) results
in an overall risk ranking of approximately 11.5. However, extreme consequence (5) and
moderate risk (3) results in an overall risk ranking of approximately 2.5. These results
indicate the likelihood of hazards have more of an effect on the overall risk ranking. The
NBN Risk model is therefore more sensitive to a change in the likelihood of hazards occurring
compared to a change in consequence of the failure modes. Risk management can be used to
implement a number of strategies to reduce or minimise risk.
0
2
4
6
8
10
12
14
16
18
20
Negligible Low Medium High Extreme
Risk Ran
king
Consequence
Rare
Unlikely
Moderate
Likely
Almost Certain

98
Such risk management strategies include:
• Transferring the risk to another party
• Avoiding the risk
• Reducing the negative effect of the risk
• Accepting some or all of the consequences of a particular risk.
From the sensitivity results, it is logical for the remediation options to target the reduction in
likelihood as opposed to consequence management. For this reason the remedial actions were
specifically designed to reduce the likelihood of hazards occurring rather than addressing the
negative effects or consequences of the hazards occurring.
99
6.2. COSTEFFECTIVENESS
The summarised results in Table 5.7 from the cost-effectiveness analysis indicate a
combination of the NBN 3.0 and domestic caching would result in the most cost-effective
option. The current NBN being rolled out is the least cost–effective course of action,
presenting a combination of high risk and high costs.
The NBN 3.0, which provides wireless coverage to 98% of Australian premises, addresses
the concern for the increasing demand for mobility and wireless broadband solutions. The
NBN 3.0 plan would mitigate a large amount of the financial hazards as it focuses on private
investment and the development of wireless networks. The lower construction cost, and
resultant lower financial risk facing investors, would be more attractive to private investors
than the current NBN. The shorter rollout over 4 years would also provide quicker returns for
investors than the NBN’s 9 year rollout. Private telcos have also shown significant interest in
mobile communications over the past decade. It could be safely assumed that a wireless
broadband network would therefore be more attractive to private investors as they can realise
the competitive nature such a network would provide.
The NBN 3.0 has some inherent risks. Although wireless data rates are catching up to those
provided by fibre, some premises within the 4G tower’s range may not be privy to the same
connection speeds others achieve. As is the case today with copper networks and to a lesser
extent, fibre networks, the further a user is away from an exchange, the slower the data rates.
This is caused by the relationship between attenuation of a signal and distance. The further a
user is from the exchange, the greater the attenuation of the signal (signal gets weaker) and
data rates are reduced as a result. Fibre has the lowest attenuation rate over distance with
wireless usually most severely impacted. A number of factors contribute to the severity of
wireless’ attenuation over distance, namely environmental. Hills and valleys can act to either
weaken or strengthen the signal in those areas. Weather conditions and the nature of
surrounding surfaces such as buildings and foliage can also attenuate the signal or provide
interference through reflected signals. Fibre and copper communication mediums enjoy the
benefit of a closed-in environment, protected from external factors. It is likely that while
some premises close to a 4G tower will experience adequate data rates, there is the chance

100
that other premises will be less than satisfied with the data rates provided. Densely populated
areas will also require more towers per area, as there is a decrease in the tower’s data rates
with an increase in the number of users. The NBN 3.1 plan would address this problem by
providing FTTP, so that premises can choose fixed broadband if their wireless reception is
not suitable. The Liberal’s NBN plan also provides the option of utilising upgraded
fibre/copper services in such areas. Alternatively, the high demand for wireless connectivity
may be sufficient for the market to manage the provision of 4G Wireless alone. A purely
fixed line broadband network, either HFC or fibre, may therefore be a viable option, leaving
the market to provide the more profitable wireless network. It is usually the responsibility of
government to provide public goods, as they provide positive externalities, which are not
remunerated. In this case, fibre connectivity to 90% of Australians could be perceived as a
public good as the market cannot recover the full benefits, such as productivity increases,
through service fees.
Table 6.1 on the following page provides additional information on the percentage of risk
reduction by each remedial action.

101
Table 6.1 Percentage of Risk Reduction
Cost (billions)
Risk Ranking
(Relative Cost) x (Relative Failure)
Reduction in Risk (%)
Base Case NBN (1) $43.00 4.740 5.000 0.0% Liberal's NBN (2) $6.50 4.764 0.760 -0.5% NBN 3.0 (3.0) $3.50 5.704 0.490 -20.3% NBN 3.1 (3.1) $46.50 4.260 4.859 10.1% NBN 3.2 (3.2) $8.00 4.013 0.788 15.3% Domestic Caching (4) $3.38 3.912 0.324 17.5% Regulatory Reform (5) $3.50 2.933 0.252 38.1%
1 + 4 $46.38 3.912 4.451 17.5%
1 + 5 $46.50 2.933 3.346 38.1%
1 + 4 + 5 $49.88 2.416 2.956 49.0%
2 + 4 $9.88 2.254 0.546 52.4%
2 + 5 $10.00 2.398 0.588 49.4%
2+ 4 + 5 $13.38 1.879 0.617 60.4%
3.0 + 4 $6.88 2.184 0.369 53.9%
3.0 + 5 $7.00 2.331 0.400 50.8%
3.0 + 4 + 5 $10.38 1.809 0.461 61.8%
3.1 + 4 $49.88 2.942 3.600 37.9%
3.1 + 5 $50.00 2.383 2.923 49.7%
3.1 + 4 + 5 $53.38 2.015 2.639 57.5%
3.2 + 4 $11.38 2.156 0.602 54.5%
3.2 + 5 $11.50 2.302 0.649 51.4%
3.2 + 4 + 5 $14.88 1.780 0.650 62.4%
The NBN 3.0 as a standalone option actually results in a 20.3% increase in risk. It is the
addition of domestic caching, which reduces the overall plans risk significantly. The NBN 3.2
plan, combined with the remedial actions of domestic caching and regulatory reform, presents
the lowest overall risk ranking option (greatest risk reduction at 62.4%). However, it is not
the most cost-effective option. It should be kept in mind that a Cost-Effectiveness Analysis
simply compares relative risk reduction against cost. So a remedial option may reduce the
risk slightly but for a negligible cost will appear more cost effective than a remedial action
that reduces the risk substantially but incurs a significant cost. A remedial action’s main
purpose is to reduce risk. Taking this into consideration, the greater risk reduction by the
remedial action of the NBN 3.2, combined with domestic caching and regulatory reform, may
present a more worthwhile course of action. A cost-benefit analysis may be better suited to
102
fully assess the benefits of the suggested remedial actions. It is likely the benefits of offering
both the mobile connectivity aspect of 4G wireless along with fixed line HFC network would
surpass the benefits of a wireless or fibre only network. The NBN 3.2 addresses similar
aspects to the current NBN, but on a smaller scale. There is significant focus on providing
broadband to rural and remote areas of Australia and construction of an Australian fibre
backbone. The plan does not provide fibre to 90% of homes but would instead upgrade
existing copper networks to an HFC network for a fraction of the cost of FTTP. Another
notable remedial option is the combination of the Liberals broadband plan with domestic
caching and regulatory reform, which results in a 60.4% reduction in risk.
It must be noted that none of the proposed standalone broadband plans can offset the slow
overseas data rates. The remedial action of domestic data caching serves the purpose of
excluding the bottleneck speeds of the overseas submarine fibre from the equation. A well-
designed CDN will allow the full speed potential of any national broadband network to be
realised.
103
6.3. FINANCIAL CONCERNS
The financial burden of the NBN project has presented two debatable questions; how much
should an NBN cost, and do we need such high speeds at high prices at this stage in time?
The question of the cost of an NBN is discussed further in the following section.
6.3.1. How much should an NBN cost?
The NBN has attracted a lot of attention from the media and public, primarily due to the
financial burden of $43 billion it will take to construct. This thesis has placed emphasis on
analysing the financial hazards and designed remedial actions to reduce the high cost of
construction through presenting various cheaper national broadband network options.
In a country like Australia, with a large landmass that is sparsely populated, it is difficult to
determine exactly how much a customised broadband solution should cost. One way is to
utilise the market’s current valuation of the cost of a national broadband network. Appendix
A - Labour Shortages contains two methods for calculating the current value the market
places on a NBN. Both methods utilise Telstra as a case study with its dominant 65% market
share in the telecommunications industry. Method 1 uses Telstra’s share price and sales
revenues from broadband services to determine the market value of a NBN. Method 2 uses
Telstra’s current assets of Property, Plant and Equipment to extend this cost of infrastructure
from 65% market share to a national infrastructure cost and confirms Method 1’s results.
Both methods return a value of around $36 billion. This value could indicate that the current
NBN solution being rolled out nationally is approximately $7 billion overpriced. However,
this figure of $36 billion is closer to the NBN’s cost of $43 billion than the cost of the
Liberal’s broadband plan and NBN 3.0. It could be argued that the current NBN represents a
cost closer to what the current market value is for a NBN. However, if Method 1 is repeated
and the share price for Telstra is taken from July 2007, prior to the NBN plan announcement
and the Labour Party entering power (see Figure 6.2 below), then again a there would be
different value for the a national broadband network.

104
Figure 6.2 Telstra’s five-year share price, September 2006-2010 [66]
Telstra’s share price averaged over July 2007 was $4.75, giving a total share value of
approximately $59 billion. However, three years later in July 2010 the share price had
dropped to $3.20 and approximately $40 billion in shareholder value. This drop in value can
be attributed to external factors such as the global financial crisis, as indicated by a similar
drop in the ASX200 over the same period as shown below.
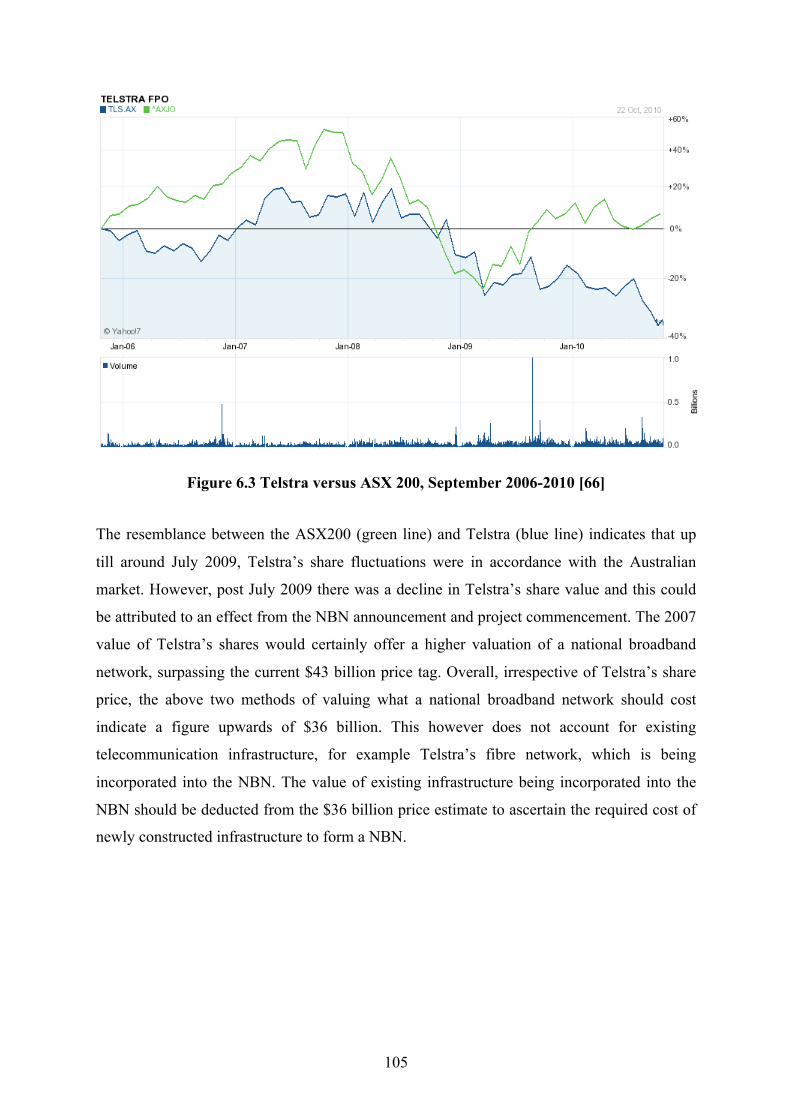
105
Figure 6.3 Telstra versus ASX 200, September 2006-2010 [66]
The resemblance between the ASX200 (green line) and Telstra (blue line) indicates that up
till around July 2009, Telstra’s share fluctuations were in accordance with the Australian
market. However, post July 2009 there was a decline in Telstra’s share value and this could
be attributed to an effect from the NBN announcement and project commencement. The 2007
value of Telstra’s shares would certainly offer a higher valuation of a national broadband
network, surpassing the current $43 billion price tag. Overall, irrespective of Telstra’s share
price, the above two methods of valuing what a national broadband network should cost
indicate a figure upwards of $36 billion. This however does not account for existing
telecommunication infrastructure, for example Telstra’s fibre network, which is being
incorporated into the NBN. The value of existing infrastructure being incorporated into the
NBN should be deducted from the $36 billion price estimate to ascertain the required cost of
newly constructed infrastructure to form a NBN.

106
6.4. DEMAND CONCERNS
Pricing options by iiNet and iPrimus, as discussed in section 3.4.1 Decreased Demand,
indicate lower than initially expected pricing for fibre connections. The various fibre plan
options are repeated below:
Table 3.2 ISP’s Fibre Prices
Cost (Peak/Off-peak quota) Plans Down/Up speed iPrimus iiNet
Fibre 1 25 / 2 Mbps $49.95 (5/10GB) $49.95 (5/5GB)
Fibre 2 25 / 2 Mbps $59.95 (20/20GB) $59.95 (10/10GB)
Fibre 3 25 / 2 Mbps $119.95 (80/220GB) $69.95 (30/30GB) Fibre 4 50 / 4 Mbps $79.95 (20/20GB) $89.95 (30/30GB)
Fibre 5 50 / 4 Mbps $99.95 (65/65GB) $99.95 (50/50GB)
Fibre 6 100 / 8 Mbps $109.95 (65/65GB) $129.95 (60/60GB) Fibre 7 100 / 8 Mbps $139.95 (80GB/220GB) $159.95 (90/90GB)
The early adopters who will take up the fibre broadband plans are most likely to be heavy
users of the Internet and various online content. The attraction of the faster download speeds
fibre offers allows users to download more content in a shorter time. However, the top plan
above only offers a total of 180GB of data by iiNet and 300GB by iPrimus (although only
80GB is available during peak times). For a user with an above average connection speed this
will be the limiting factor for their online usage. It is concerning to see ISPs offering
ADSL2+ data plans with up to 1TB of download quota for $100, whereas the faster fibre
plans have considerably less data allowances included.
There is also concern that fibre users will not see much improvement over ADSL2+ speeds as
users are still susceptible to the overseas bottlenecks. Domestic caching will be required to
solve the problem of not being able to fully utilise the 100Mbps download speeds. These low
data allowances will certainly act as a limiting factor and deter even early adopters from fibre
connections. However, data plan allowances are constantly changing and the data allowances
could increase in the near future. It would be unwise for ISP’s to offer the improved speeds
that a fibre connection offers without a suitably higher data allowance to attract more demand
for the fibre connections.
107
6.5. LIMITATIONS AND RECOMMENDATIONS FOR FURTHER WORK
The nature of the five scale ranking system used to determine the likelihood and consequence
of hazards has some limitations. The simplicity of the scale does help to reduce subjectivity
when assigning a likelihood or consequence to a hazard. However, when assessing some
hazards, such as the financial and regulatory hazards, a larger ranking scale could have lead
to a greater emphasis of the consequence of such hazards on the overall risk ranking of the
NBN. The scale was effective though in indicating that these hazards were the most
pronounced, but it is questionable as whether a larger scale could have contributed to more
accurate and dispersed results. Future studies could assign a larger 10 point scale which
would provide more variety in defining the likelihood and the consequence of hazards.
The accuracy of costing the various remedial actions could be argued. The Liberal party
presented their broadband plan with a cost breakdown for the various aspects of the network.
There could, however, be discrepancies in the costing for the various works that would not be
known unless a more in depth cost assessment was carried out. Similarly for the NBN 3.0
plan, the cost structure presented by the AAB was based on an estimate for a similar wireless
plan presented by a USA firm. A number of inaccuracies could arise from simply scaling the
costs based on land mass size and population density. Future studies could incorporate an in
depth cost model for these two broadband plans.
The costing of the regulatory reform was purely an academic exercise in order to be able to
assess its validity in the cost-effectiveness analysis. The domestic caching remedial action
was based on an estimate of the number and cost of building data centres in strategic
locations around the country. It would be advisable for future work on the topic to include
study into Australia’s current CDN situation and whether certain regions may require more or
less data capacity in the form of data centres.
The NBN Risk Model is designed to account for the perceived likelihoods of hazards to the
NBN occurring and the relative consequences of those hazards. For the purpose of comparing
the remedial actions in the cost-effectiveness, it is merely the risks that can be accounted for

108
and how certain remedial actions present less risk (benefits) over other options. This model
however, cannot fully account for all benefits that some remedial actions offer. For instance,
the NBN 3.2 provides the benefit of both wireless and fixed HFC connectivity options, but
these benefits are not realised to the full extent through a simple risk model. A cost-benefit
analysis would be better suited to assessing the benefits of the NBN 3.2 combined with
domestic caching and regulatory reform, the lowest risk scenario. A cost-benefit analysis
would most likely find that the benefits (risk reduction) are under estimated by the NBN Risk
Model. Future work should look at applying a cost-benefit analysis to the remedial actions.
Finally, the nature of the cost-effectiveness analysis is to deduce which remedial action
reduces risk for the lowest cost. The method does fall short when a small reduction in risk is
accomplished for a negligible cost. This option may come out the most cost-effective but will
have missed the main objective of a remedial action; to reduce risk. A cost-benefit analysis in
this case may be better suited as it would account for intangible benefits and costs, which
would otherwise be missed by a cost-effectiveness analysis. Alternatively, a threshold can be
established for the minimal risk reduction that a remedial action can contribute. If a remedial
action does not reduce risk sufficiently passed the threshold, then it is disregarded as a viable
option.

109
7. CONCLUSION AND RECOMMENDATIONS The risk assessment identified 59 hazards under the 6 main failure modes of: Construction,
Operation, Demand, Network, Technology, Financing and Regulation. Six remedial actions
were investigated to address the key hazards. A cost-effectiveness analysis was then used to
determine the most cost-effective combination of remedial actions to reduce risk. All stated
goals of the risk assessment were successfully completed.
The construction hazards present in the NBN were found to be most effected by the risk of a
shortage of ICT labour, latent grounds causing an increase in construction costs and time, and
scope creep leading to greater than 90% of Australian premises covered by fibre connectivity.
The construction failure mode presents a relatively low risk compared to the other failure
modes. As a result, no remedial actions were designed to address the construction phase of
the project.
Operational hazards highlight the risk of cyber crime, spam and intellectual property and to a
lesser extent the affect ISP’s contention ratios would have on the ability for fibre connections
to reach the claimed 100Mbps. The lifespan of fibre optic cable was also discussed and found
in general to have a sufficient operational life of at least 40 years. Suitable maintenance
procedures would also ensure that the fibre network remained operational for longer.
Demand hazards addressed both issues of increased and decreased demand for the NBN.
Decreased demand may eventuate due to fibre technology being superseded, for instance by
wireless, or through a decreased uptake of fibre connections due to high prices charged by the
Wholesaler and/or ISPs. Increased demand for high-speed broadband was deemed likely due
to increasing Internet traffic and the growing demand for online video and IPTV services.
The increased demand hazard was assigned a lower probability of failure in comparison to
decreased demand due to fibre’s capacity to handle higher data loads.

110
Network hazards are affected by the demand for NBN services and also the choices in design
with regards to other aspects of the network. The overseas bottleneck issue is of serious
concern as 70% of Australian Internet traffic is directed towards accessing websites and
servers in the USA. The shear distance and design bottleneck of these undersea fibre optic
cables leads to slow data rates. If this hazard is not addressed the full potential of the NBN
high-speed network will never be fully realised.
Technological hazards identified the concern that fibre could be superseded as technology
advances rapidly. This is attributed to the increasing demand for mobile connectivity which is
being helped along by the progress of 4G and future generation wireless technologies.
Financial hazards are an obvious risk due to the $43 billion cost of construction of the NBN,
Australia’s largest infrastructure project. Decreased demand for fibre connections again
presents itself as a hazard as operating revenues for the NBN are dependent on the take-up of
fibre lead-ins. The lack of private investment is also of serious concern, as the government’s
financing vehicles will find it difficult to cover the full cost of the project.
The most significant contributors to the overall risk ranking are the Regulatory hazards,
caused by political sensitivity and lack of regulation surrounding the NBN Co and
telecommunication implementation policies. Regulation of NBN Co, the RF spectrum,
consumer protection through competition policy and national security will lower the project’s
overall market risk and lead to an increase in investor confidence which relates back to the
financial hazards.
The remedial actions of the Liberal Party’s broadband plan, NBN 3.0/3.1/3.2, Domestic
caching and Regulatory reform are designed to address and reduce the likelihood of the key
hazards occurring. The most cost-effective broadband network option was the NBN 3.0 plan
to provide high speed broadband through last mile 4G wireless connectivity to 98% of
Australian premises. When combined with the remedial action of domestic caching, it
presented the most cost-effective plan, reducing risk by 61.8%.
111
The NBN 3.2 plan, combined with the remedial actions of domestic caching and regulatory
reform, presents the lowest overall risk ranking option, reducing risk by 62.4%. The greater
risk reduction by the NBN 3.2 remedial action compared to an increase in risk by the NBN
3.0, may present the NBN 3.2 as a more worthwhile course of action. A cost-benefit analysis
may be better suited to fully assess the benefits of the suggested remedial actions. It is
possible that the benefits of offering both the mobile connectivity aspect of 4G wireless
connections along with fixed line HFC network would surpass the benefits of a wireless or
fibre only network. Future studies should look at using the cost-benefit analysis method to
better assess the benefits that the two styles of fixed and wireless connectivity would offer
over a choice of only one connection type.
It is also recommended that pricing for the current NBN should be reviewed and possibly
lowered in order to encourage take-up of the fibre connections. This will allow more users to
initially benefit from the NBN and encourage greater take-up by other Australians as
consumer confidence in the network grows. Current pricing for fibre plans is more than
double the price of an ADSL2+ broadband plan with similar data allowance. There is still the
risk that early fibre users will not be able to utilise the higher data rates until the overseas
bottleneck issues are addressed. A well-designed CDN is required to address these slow
overseas data rate concerns and to equip the NBN with the means to deal with infrastructure
outages and equipment failures.

112

113
APPENDICES
APPENDIX A LABOUR SHORTAGES
Table A.1 Forecasted BAU ICT Labour vs. NBN Demand for Labour
Year ABS Data
Expected Workforce
Forecast BAU
NBN Requirement
Total ICT Labour Force
Required
Resource Gap
1996 31,100 30,259 1997 34,400 29,541 1998 28,800 28,840 1999 29,900 28,156 2000 25,500 27,488 2001 23,800 26,835 2002 24,900 26,199 2003 26,600 25,577 2004 23,300 24,970 2005 22,300 24,378 2006 25,000 23,800 2007 26,900 23,235 2008 20,000 20,000 22,684 2009 20,000 22,684 2010 20,000 21,620 21,620 1,620 2011 20,000 21,107 140 21,247 1,247 2012 20,000 20,606 8,680 29,287 9,287 2013 20,000 20,117 14,769 34,887 14,887 2014 20,000 19,640 18,386 38,027 18,027 2015 20,000 19,174 18,386 37,561 17,561 2016 20,000 18,719 18,386 37,106 17,106 2017 20,000 18,275 18,386 36,662 16,662 2018 20,000 17,842 18,206 36,048 16,048 2019 20,000 17,418 7,234 24,653 4,653
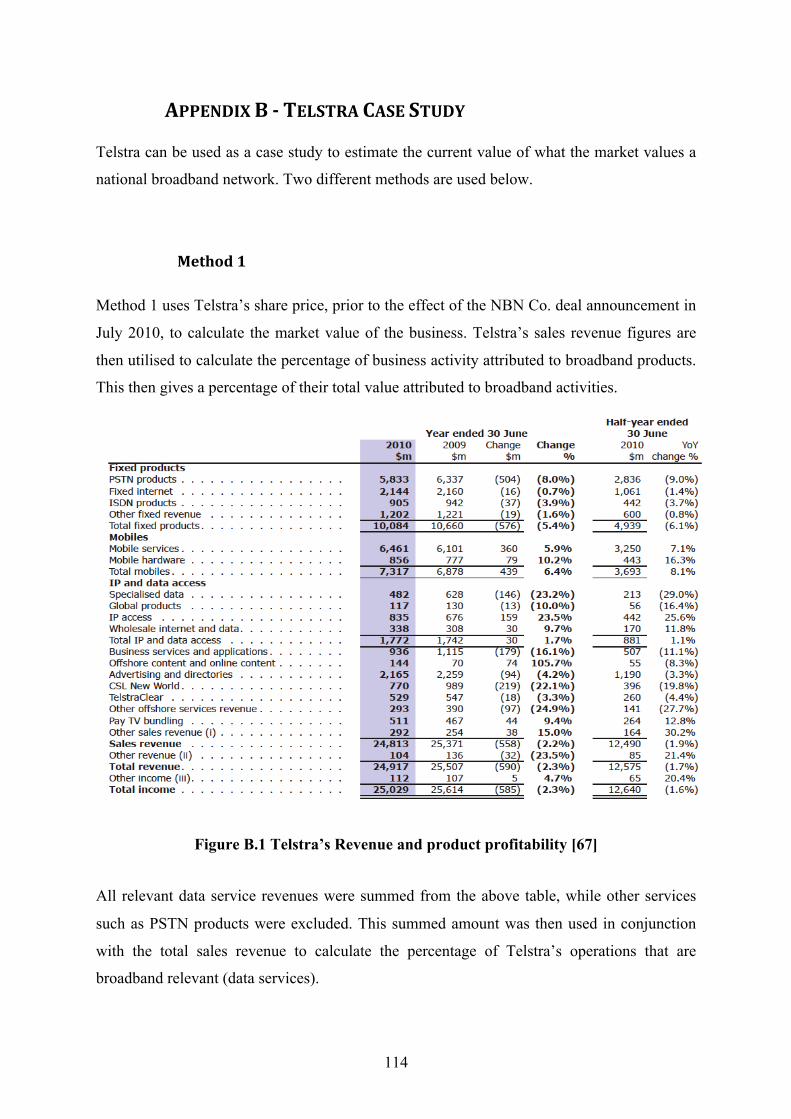
114
APPENDIX B TELSTRA CASE STUDY
Telstra can be used as a case study to estimate the current value of what the market values a
national broadband network. Two different methods are used below.
Method 1
Method 1 uses Telstra’s share price, prior to the effect of the NBN Co. deal announcement in
July 2010, to calculate the market value of the business. Telstra’s sales revenue figures are
then utilised to calculate the percentage of business activity attributed to broadband products.
This then gives a percentage of their total value attributed to broadband activities.
Figure B.1 Telstra’s Revenue and product profitability [67]
All relevant data service revenues were summed from the above table, while other services
such as PSTN products were excluded. This summed amount was then used in conjunction
with the total sales revenue to calculate the percentage of Telstra’s operations that are
broadband relevant (data services).
115
Total Data Service Revenue ÷ Total Sales Revenue x 100%
= $14.465 ÷ $24.183 x 100% = 59.81%
This figure was then used in conjunction with Telstra’s share price averaged over June/July
($3.20), number of shares (12 443 074 357) and 65% market share to calculate the overall
market value of a NBN.
NBN Market value = No. of Telstra Shares x Total Data Service Revenue % x Market Share
= 12 443 074 357 x $3.20 x 59.81% ÷ 65%
= $36.639 billion
Telstra can also be valued pre-Labour government using the above method with a share price
of $4.75 (July 2007) and 12.407 billion shares on offer against the July 2010 price of $3.20
giving:
2010 = 12.443bn x $3.20 = $39.818 billion
2007 = 12.407bn x $4.75 = $58.933 billion
We can see a significant drop in capital and the value of Telstra from July 2007 to 2010.
Method 2
From Telstra’s 2010 full year financial results [67], assets including Property, Plant &
Equipment are valued at $22.894 billion. Using an expected market share of 65% this would
lead to a total market value of a broadband network equating to:
Total NBN market value of infrastructure = $22.894 ÷ 65% = $35.221 billion
This $35 billion worth of broadband infrastructure is consistent with Method 1 when a share
price of $3.20 (June/July 2010) is used, which gives $36.639 billion. It can be concluded that
the market value of the current NBN is approximately $36 billion.

116
APPENDIX C – COMPANION DISK (NBN RISK MODEL)
The companion disk contains the following files:
• NBN Risk Model (Excel)
• NBN Fault Tree Analysis (Visio)
• ITEE Expo presentation (Powerpoint)
• ITEE Expo poster (Powerpoint)
• Progress seminar presentation slides (Powerpoint)
• Research Proposal (PDF)
• Research Material (Various file types)
117
REFERENCES [1] Telstra. (2008, Next Generation Cable Systems ‐ Endeavour. Telstra Wholesale.
[2] C. Chan, et al., "Public Infrastructure Financing: An International Perspective," Productivity
Commission Staff Working PaperMarch 2009.
[3] M. G. Stewart and R. E. Melchers, Probabilistic risk assessment of engineering systems.
London ; New York: Chapman & Hall, 1997.
[4] S. G. Vick and A. S. o. C. Engineers, Degrees of belief : subjective probability and engineering
judgment. Reston, Va.: ASCE Press, 2002.
[5] M. Modarres, et al., Reliability engineering and risk analysis : a practical guide. New York:
Marcel Dekker, 1999.
[6] E. a. S. International Symposium on Risk, Failure Minimisation and Analysis Pilanesberg,
South Africa) and R. K. Penny, Risk, economy and safety, failure minimisation and analysis :
failures '96 : proceedings of the Second International Symposium on Risk, Economy and
Safety, Failure Minimisation and Analysis, Pilanesberg, South Africa, 22‐26 July 1996.
Rotterdam: A.A. Balkema, 1996.
[7] Standards Australia, "AS IEC 61025‐2008 Fault Tree Analysis (FTA)," ed, 2008.
[8] E. Zio, An introduction to the basics of reliability and risk analysis. Singapore: World
Scientific, 2007.
[9] OECD. (2009, OECD Communications Outlook 2009. Information and Communication
Technologies, 350.
[10] OECD. (2008, OECD Information Technology Outlook 2008. Information and Communication
Technologies, 350.
[11] P. Lindroos and M. Pinkhasov, "Broadband Driving Growth: Policy Response," O. f. E. C.‐o. a.
Development, Ed., ed, 2003.
[12] Evans & Peck, "Capital Budgets and Resource Gap Analysis for FTTP Access Network ‐
Preliminary Study," 18 January 2010.
[13] CCIQ. (2005, Skills and Labour Shortages: A Critical Issue for Queensland Business. Chamber
of Commerce & Industry Queensland.
[14] Australian Bureau of Statistics. 8126.0 ‐ Information and Communication Technology
[Online].
[15] M. Bingemann and A. Hepworth, "Wage blowot threat to NBN rollout," The Australian, 10
September 2010.

118
[16] K. Thakore. (2010, 2 June). How Should the Project Manager Deal with Scope Creep?
Available: http://www.projectsmart.co.uk/how‐should‐the‐project‐manager‐deal‐with‐
scope‐creep.html
[17] McKinsey & Company and KPMG, "National Broadband Network Implementation Study,"
2010.
[18] National Broadband Network. (2010, 9 September). How will it benefit the Australian
economy? Available: http://www.nbn.gov.au/content/how‐will‐it‐benefit‐australian‐
economy
[19] ServiceSat. (2010, 11 October). Internet Speeds and Contention Ratios Explained. Available:
http://www.servicesat.net/internetspeedsan.html
[20] NBN Co. (2009, What is Optical Fibre? NBN Co. Fact Sheet. Available:
http://www.nbnco.com.au/wps/wcm/connect/d09d300043a207508ddbfdc5166da634/NBN
Co_FactSheet_Fibre.pdf?MOD=AJPERES
[21] Sterlite. (2006, Optical Fibre Lifetime Calculation. Available:
http://www.sterlitetechnologies.com/pdf/KnowledgeCenter/AN0001%20‐
%20Optical%20Fiber%20Lifetime.pdf
[22] C. Koch. (2007, June 11, 2007). How You Can Fight Cybercrime. CIO.com.
[23] A. C. Trembly, "Spam is a productivity killer," National Underwriter, vol. 107, 8 December
2003.
[24] "Study reveals spam's true cost to global productivity," Precision Marketing, May 27 2005.
[25] K. Dearne, "Australia to sign global traty to combat cybercrime," in The Australian, ed, 2010.
[26] N. Cochrane. (2009, 2 September). NBN cost debate picks up steam. CRN, 3.
[27] M. Motta, Competition policy : theory and practice. Cambridge ; New York :: Cambridge
University Press, 2004.
[28] M. Bingemann, "No return on NBN for 'up to 30 years'," The Australian, 16 April 2010.
[29] OECD, "The Future Digital Economy: Digital content creation, distribution and access,"
Committee for Information, Computer and Communications Policy, p. 84, 22 May 2006.
[30] E. Rodgers, "Big gig: NBN to be 10 times faster," ABC News, 12 August 2010.
[31] Cisco, "CiscoVisual Networking Index: Forecast and Methodology, 2009 ‐2014," ed, 2010, p.
17.
[32] M. Alder and K. Kilraine, "Leaders of Laggards? Australia's Broadband Future," KPMG, p. 56,
2004.
[33] M. Kaiser, "NBN Co. Presentation," in Western Corridor Luncheon, 2010.
119
[34] J. Hibbard, et al., "International Internet Connectivity and its Impact on Australia,"
Department of Communication Information Technology and the Arts, 2004.
[35] J. Gans. (2010, The overseas broadband bottleneck. Core Economics. Available:
http://economics.com.au/?p=6073
[36] Wikipedia. (2010, List of international submarine communications cables. Available:
http://en.wikipedia.org/wiki/List_of_international_submarine_communications_cables
[37] Telstra. (2008, 2 September). Telstra's new submarine cable lands in Sydney. Available:
http://www.telstraenterprise.com/newsevents/news/Pages/Telstra’snewsubmarinecablelan
dsinSydney.aspx
[38] T. Clarke. (2010, NBN 101: Floating the Submarine cable question. Computerworld. Available:
http://www.computerworld.com.au/article/358578/nbn_101_floating_submarine_cable_qu
estion/
[39] Pacific Fibre. (2010, 2 September). Why is Pacific Fibre needed? Available:
www.pacificfibre.net/why.php
[40] L. K. Moore, "Wireless Technology and Spectrum Demand," CRS Report for Congress, 2006.
[41] Rysavy_Research, "EDGE, HSPA and LTE ‐ The Mobile Broadband Advantage," Rysavy
Research and 3G Americas, September 2007.
[42] Wikipedia. (2009, 6 September). 3G. Available: http://en.wikipedia.org/wiki/3G#Evolution
[43] Wikipedia. (2010, 6 September). 1G. Available: http://en.wikipedia.org/wiki/1G
[44] Wikipedia. (2010, 6 September). Enhanced Data Rates for GSM Evolution. Available:
http://en.wikipedia.org/wiki/Enhanced_Data_Rates_for_GSM_Evolution
[45] Wikipedia. (2010, 6 September). 3GPP. Available: http://en.wikipedia.org/wiki/3GPP
[46] S. Rodriguez, et al., "4G CMOS Nanometer Receivers for Mobile Systems: Challenges and
Solutions," International Symposium on Signals, Circuits and Systems, pp. 1‐4, 2009.
[47] Australian Bureau of Statistics, "Internet Activity, Australia," ed. Canberra, 2009.
[48] F. K. Crundwell, "Financing Engineering Projects," ed London: Springer London, 2008, p. 531.
[49] A. Merna and C. Njiru, Financing infrastructure projects. London: Thomas Telford Ltd, 2009.
[50] M. Bingemann, "Brisbane plans own fibre network," The Australian, 15 October 2010.
[51] B. Grubb. (2009, 21 September). Telcos call for NBN ownership cap. iTnews. Available:
http://www.itnews.com.au/Tools/Print.aspx?CIID=155063
[52] Economist.com. (2010, The Difference Engine: Bigger than Wi‐Fi The Economist. Available:
http://www.economist.com/blogs/babbage/2010/09/white‐space_wireless/
[53] S. Conroy, "National Broadband Network: Regulatory Reform for 21st Century Broadband,"
presented at the Discussion Paper, 2009.

120
[54] J. Campbell, "Broadband big waste risk," Herald Sun, April 18 2010.
[55] S. Conroy, "Agreement between NBN Co and Telstra on the rollout of the National
Broadband Network," Department of Brodband, Communications and the Digitial Economy,
20 June 2010.
[56] Computerworld, "NBN 3.0 from the Alliance for Affordable Broadband: Open Letter,"
Computerworld Australia, 31 August 2010.
[57] National_Broadband_Network. (2010, 3 September). Fixing regional backbone blackspots.
Available: http://www.nbn.gov.au/content/fixing‐regional‐backbone‐blackspots
[58] National_Broadband_Network. (2010, 3 September). Geographical Rollout. Available:
http://www.nbn.gov.au/content/geographical‐rollout#australia
[59] D. Williams, et al., "ACARP C8039 ‐ Risk Assessment & Cost Effectiveness Analysis," ed, 2001.
[60] Liberal Party of Australia. (2010, The Coalition's plan for real action on Broadband and
Telecommunications. Available:
http://www.liberal.org.au/~/media/Files/Policies%20and%20Media/Infrastructure/Broadba
nd%20and%20Telecommunications%20Policy.ashx
[61] Wikipedia. (2010, 27 September). Content delivery network. Available:
http://en.wikipedia.org/wiki/Content_delivery_network
[62] T. Clarke. (2010, NextDC buys up Melbourne and Brisbane data centre land. Computerworld.
Available:
http://www.computerworld.com.au/article/351903/nextdc_buys_up_melbourne_brisbane_
data_centre_land/
[63] Computerworld. (2010, Top 10 new data centre considerations. Available:
http://www.computerworld.com.au/article/print/343890/top_10_new_data_centre_consid
erations/
[64] F. Foo. (2010, Green light for $1bn Canberra data centre. The Australian. Available:
http://www.theaustralian.com.au/australian‐it/green‐light‐for‐1bn‐canberra‐data‐
centre/story‐e6frgakx‐1225856083935
[65] B. Winterford. (2010, 27 September). Telstra reveals homegrown content delivery network.
iTnews. Available: http://www.itnews.com.au/News/213885,telstra‐reveals‐homegrown‐
content‐delivery‐network.aspx
[66] (2010, Telstra Coporation Limited Share Price. Yahoo!7 Finance. Available:
http://au.finance.yahoo.com/q/bc?t=5y&s=TLS.AX&l=on&z=l&q=l&c=&c=%5EAXJO
[67] (2010, Annual Report Telstra. Available: www.telstra.com.au/abouttelstra/investor
Copyright © 2022 FDOKUMEN