Systematic reviews of effectiveness and cost-effectivene - NICE
316
PUIC Home: Review of effectiveness and cost-effectiveness – 1 – PREVENTING UNINTENTIONAL INJURIES AMONG UNDER-15s IN THE HOME Report 1: Systematic reviews of effectiveness and cost-effectiveness of home safety equipment and risk assessment schemes Final Report: 12 th August 2009 COMMISSIONED BY: NICE Centre for Public Health Excellence PRODUCED BY: Peninsula Technology Assessment Group (PenTAG), Peninsula Medical School, Universities of Exeter and Plymouth AUTHORS: Mark Pearson, Research Fellow, PenTAG Ruth Garside, Senior Research Fellow, PenTAG Tiffany Moxham, Information Scientist, PenTAG Rob Anderson, Senior Lecturer, PenTAG CORRESPONDENCE TO: Mark Pearson Peninsula Technology Assessment Group (PenTAG) Peninsula Medical School Universities of Exeter and Plymouth Noy Scott House Barrack Road Exeter EX2 5DW [email protected]
-
Upload
khangminh22 -
Category
Documents
-
view
0 -
download
0
Transcript of Systematic reviews of effectiveness and cost-effectivene - NICE
PUIC Home: Review of effectiveness and
cost-effectiveness
– 1 –
PREVENTING UNINTENTIONAL INJURIES
AMONG UNDER-15s IN THE HOME
Report 1:
Systematic reviews of effectiveness and
cost-effectiveness of home safety
equipment and risk assessment schemes
Final Report: 12 th August 2009
COMMISSIONED BY:
NICE Centre for Public Health Excellence
PRODUCED BY:
Peninsula Technology Assessment Group (PenTAG), Peninsula Medical School, Universities of Exeter and Plymouth
AUTHORS:
Mark Pearson, Research Fellow, PenTAG Ruth Garside, Senior Research Fellow, PenTAG Tiffany Moxham, Information Scientist, PenTAG Rob Anderson, Senior Lecturer, PenTAG
CORRESPONDENCE TO:
Mark Pearson Peninsula Technology Assessment Group (PenTAG) Peninsula Medical School Universities of Exeter and Plymouth Noy Scott House Barrack Road Exeter EX2 5DW [email protected]
PUIC Home: Review of effectiveness and
cost-effectiveness
– 2 –
About the Peninsula Technology Assessment Group (PenTAG)
The Peninsula Technology Assessment Group is part of the Institute of Health
Service Research at the Peninsula Medical School. PenTAG was established in 2000
and carries out independent Health Technology Assessments for the UK HTA
Programme, systematic reviews and economic analyses for NICE (Technology
Appraisal and Centre for Public Health Excellence) and systematic reviews as part of
the Cochrane Collaboration Heart Group, as well as for other local and national
decision-makers. The group is multi-disciplinary and draws on individuals’
backgrounds in public health, health services research, computing and decision
analysis, systematic reviewing, statistics and health economics. The Peninsula
Medical School is a school within the Universities of Plymouth and Exeter. The
Institute of Health Research is made up of discrete but methodologically related
research groups, among which Health Technology Assessment is a strong and
recurring theme. Projects to date include:
• Interventions to prevent unintentional injury in children on the road: Systematic reviews of effectiveness and cost-effectiveness of road and street design-based interventions aimed at reducing unintentional injuries in children (2009)
• A systematic review of risk factors for unintentional injuries among children and young people aged under 15 years: Quantitative correlates review of unintentional injury in children (2009)
• Providing public information to prevent skin cancer. Barriers to and facilitators to conveying information to prevent first occurrence of skin cancer: a systematic review of qualitative research (2009)
• Population and community programmes addressing multiple risk factors to prevent cardiovascular disease: a qualitative study into how and why some programmes are more successful than others (2009)
• Barriers to and facilitators for the effectiveness of multiple risk factor programmes aimed at reducing cardiovascular disease within a given population: a systematic review of qualitative research (2009)
• Bevacizumab, sorafenib tosylate, sunitinib and temsirolimus for renal cell carcinoma: A systematic review and economic model (2008)
• The Effectiveness and Cost-Effectiveness of Methods of Storing Donated Kidneys from deceased donors: A Systematic Review and Economic Model (2008)
• The Effectiveness and Cost-Effectiveness of Cochlear Implants for Severe to Profound Deafness in Children and Adults: A Systematic Review and Economic Model (2008)
• Inhaled Corticosteroids and Long-Acting Beta2-Agonists for The Treatment of Chronic Asthma an Children Under the Age of 12 Years: a Systematic Review and Economic Analysis (2007)
• The Effectiveness and Cost-Effectiveness of Cardiac Resynchronisation Therapy for Heart Failure. Systematic Review And Economic Evaluation (2007)
PUIC Home: Review of effectiveness and
cost-effectiveness
– 3 –
• The effectiveness and cost-effectiveness of Carmustine Implants and Temozolomide for the treatment of newly-diagnosed High Grade Glioma. Systematic Review And Economic Evaluation (2007)
• The Effectiveness and Cost-Effectiveness of Cinacalcet for Secondary Hyperparathyroidism in end stage renal disease patients on dialysis. Systematic Review And Economic Evaluation (2007)
• The Cost-Effectiveness of testing for hepatitis C (HCV) in former injecting drug users. Systematic Review And Economic Evaluation. (2006)
• The Effectiveness and Cost-Effectiveness Of Surveillance Of Barrett’s Oesophagus: Exploring The Uncertainty (2005)
• The Effectiveness And Cost-effectiveness Of Dual Chamber Pacemakers Compared To Single Chamber Pacemakers For Bradycardia Due To Atrioventricular Block Or Sick Sinus Syndrome - Systematic Review And Economic Evaluation (2005)
• The Effectiveness And Cost-Effectiveness Of Pimecrolimus And Tacrolimus For Atopic Eczema - A Systematic Review And Economic Modelling (2005)
• Do The Findings Of Case Series Studies Vary Significantly According To Methodological Characteristics?(2005)
• The Effectiveness And Cost-Effectiveness Of Microwave And Thermal Balloon Endometrial Ablation For Heavy Menstrual Bleeding - A Systematic Review And Economic Modelling (2004)
• The Effectiveness And Cost-Effectiveness Of Imatinib For First Line Treatment Of Chronic Myeloid Leukaemia In Chronic Phase (2003)
• Systematic Review Of Endoscopic Sinus Surgery For Nasal Polyps (2003)
• Screening For Hepatitis C Among Injecting Drug Users And In Genitourinary Medicine (GUM) Clinics - Systematic Reviews Of Effectiveness, Modelling Study And National Survey Of Current Practice (2002)
• The Effectiveness And Cost-Effectiveness Of Imatinib (STI 571) In Chronic Myeloid Leukaemia - A Systematic Review (2002)
Acknowledgements
With many thanks to: Jo Perry, Jenny Lowe, Lianne Perry, and Sue Whiffin (PenTAG)
for administrative project support; Kate Boddy (PenCLAHRC) for conducting the
website searches; Dr Jaime Peters (PenTAG/ PenCLAHRC) for statistical advice; and
Zulian Liu (PenTAG) for checking extracted data.
Many thanks also to the NICE CPHE team (Hilary Chatterton, Simon Ellis, James
Jagroo, Louise Millward, and Lesley Owen), and Sheila Merrill (Home Safety Manager
– England, RoSPA), for providing constructive feedback that facilitated the
development and revision of this review.
Declaration of authors’ competing interests
No authors have competing interests.

PUIC Home: Review of effectiveness and
cost-effectiveness
– 4 –
List of abbreviations
A&E Accident and emergency department
BA Before and after study
C$ Canadian dollars
CBA Controlled before and after study
CHEC A collaborative project led by researchers at the University of Maastricht, which developed a ‘criteria list’ for assisting with the systematic review of economic evaluations
CI Confidence interval
Con. Control group
CPHE Centre for Public Health Excellence
Ed. Education (in the form of semi-structured safety counselling)
EV External validity (of a study)
FU Follow-up
GP General Practitioner
HRA Home risk assessment
HSE Home safety equipment
In. Intervention group
IRR Incidence rate ratio
IV Internal validity (of a study)
LRFIPP Lifesavers Residential Fire and Injury Prevention Program, a smoke alarm giveaway scheme with education brochures, which ran in Oklahoma City from 1990 to 1994 (evaluation published in Haddix et al. 2001)
MD Mean difference
n Number of participants in a study that were followed-up (for a particular outcome)
N Number of participants in a study that received the intervention
NA Not applicable
NB Please note
NICE National Institute for Health & Clinical Excellence
NR Not reported
NS Not significant
OR Odds ratio
PenCLAHRC Peninsula Collaboration for Leadership in Applied Health Research and Care
PenTAG Peninsula Technology Assessment Group
PUIC Prevention of unintentional injuries to children (suite of NICE systematic reviews)
RCT Randomised controlled trial
RoSPA The Royal Society for the Prevention of Accidents
S&I Supply & installation (of home safety equipment)
UK United Kingdom
USA United States of America
PUIC Home: Review of effectiveness and
cost-effectiveness
– 5 –
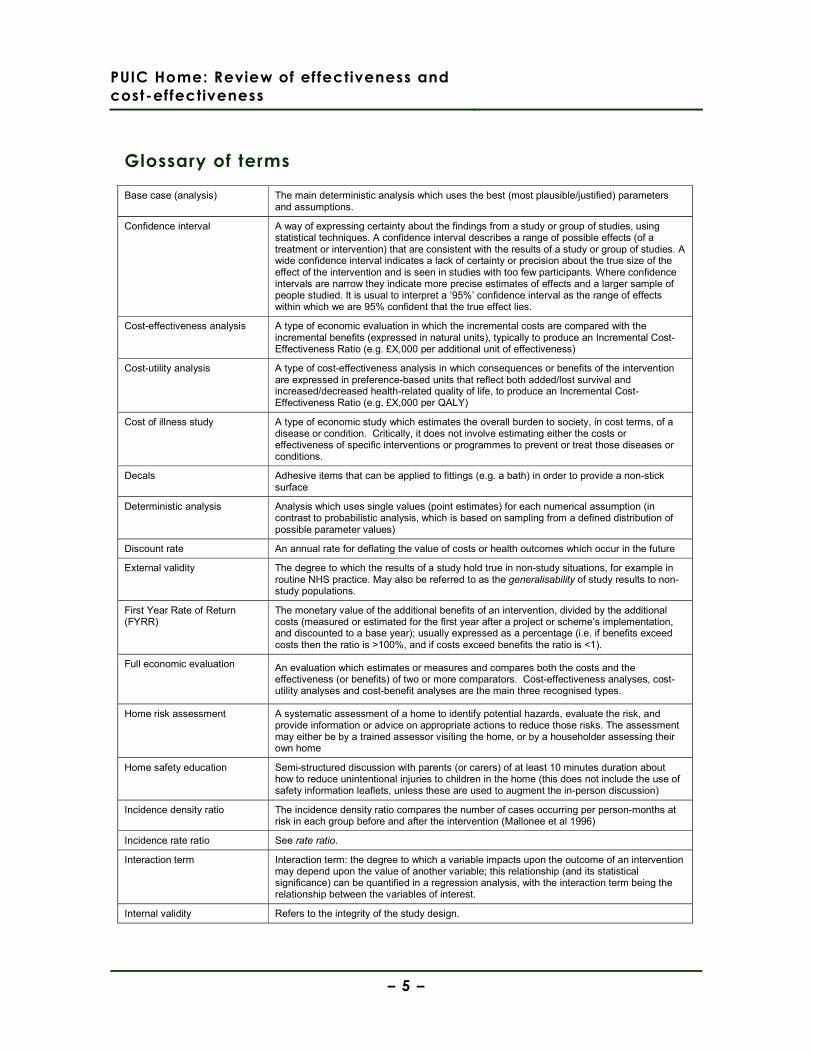
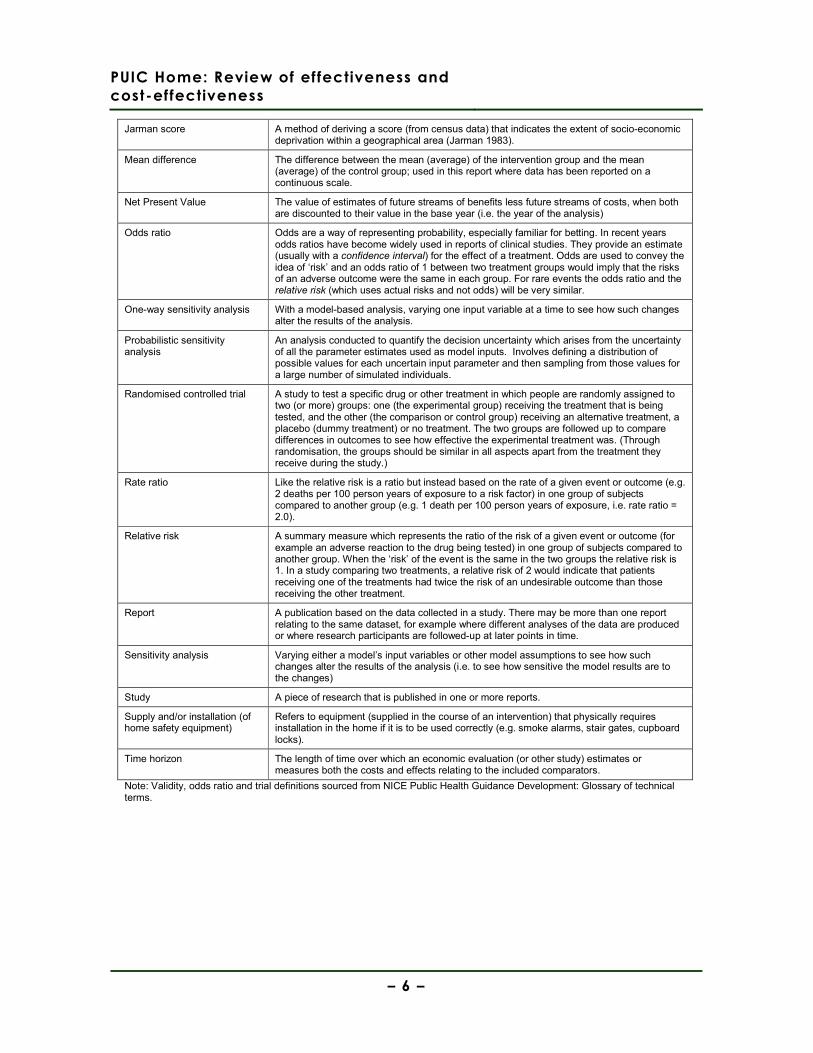
Glossary of terms
Base case (analysis) The main deterministic analysis which uses the best (most plausible/justified) parameters and assumptions.
Confidence interval A way of expressing certainty about the findings from a study or group of studies, using statistical techniques. A confidence interval describes a range of possible effects (of a treatment or intervention) that are consistent with the results of a study or group of studies. A wide confidence interval indicates a lack of certainty or precision about the true size of the effect of the intervention and is seen in studies with too few participants. Where confidence intervals are narrow they indicate more precise estimates of effects and a larger sample of people studied. It is usual to interpret a ‘95%’ confidence interval as the range of effects within which we are 95% confident that the true effect lies.
Cost-effectiveness analysis A type of economic evaluation in which the incremental costs are compared with the incremental benefits (expressed in natural units), typically to produce an Incremental Cost-Effectiveness Ratio (e.g. £X,000 per additional unit of effectiveness)
Cost-utility analysis A type of cost-effectiveness analysis in which consequences or benefits of the intervention are expressed in preference-based units that reflect both added/lost survival and increased/decreased health-related quality of life, to produce an Incremental Cost-Effectiveness Ratio (e.g. £X,000 per QALY)
Cost of illness study A type of economic study which estimates the overall burden to society, in cost terms, of a disease or condition. Critically, it does not involve estimating either the costs or effectiveness of specific interventions or programmes to prevent or treat those diseases or conditions.
Decals Adhesive items that can be applied to fittings (e.g. a bath) in order to provide a non-stick surface
Deterministic analysis Analysis which uses single values (point estimates) for each numerical assumption (in contrast to probabilistic analysis, which is based on sampling from a defined distribution of possible parameter values)
Discount rate An annual rate for deflating the value of costs or health outcomes which occur in the future
External validity The degree to which the results of a study hold true in non-study situations, for example in routine NHS practice. May also be referred to as the generalisability of study results to non-study populations.
First Year Rate of Return (FYRR)
The monetary value of the additional benefits of an intervention, divided by the additional costs (measured or estimated for the first year after a project or scheme’s implementation, and discounted to a base year); usually expressed as a percentage (i.e. if benefits exceed costs then the ratio is >100%, and if costs exceed benefits the ratio is <1).
Full economic evaluation An evaluation which estimates or measures and compares both the costs and the effectiveness (or benefits) of two or more comparators. Cost-effectiveness analyses, cost-utility analyses and cost-benefit analyses are the main three recognised types.
Home risk assessment A systematic assessment of a home to identify potential hazards, evaluate the risk, and provide information or advice on appropriate actions to reduce those risks. The assessment may either be by a trained assessor visiting the home, or by a householder assessing their own home
Home safety education Semi-structured discussion with parents (or carers) of at least 10 minutes duration about how to reduce unintentional injuries to children in the home (this does not include the use of safety information leaflets, unless these are used to augment the in-person discussion)
Incidence density ratio The incidence density ratio compares the number of cases occurring per person-months at risk in each group before and after the intervention (Mallonee et al 1996)
Incidence rate ratio See rate ratio.
Interaction term Interaction term: the degree to which a variable impacts upon the outcome of an intervention may depend upon the value of another variable; this relationship (and its statistical significance) can be quantified in a regression analysis, with the interaction term being the relationship between the variables of interest.
Internal validity Refers to the integrity of the study design.
PUIC Home: Review of effectiveness and
cost-effectiveness
– 6 –
Jarman score A method of deriving a score (from census data) that indicates the extent of socio-economic deprivation within a geographical area (Jarman 1983).
Mean difference The difference between the mean (average) of the intervention group and the mean (average) of the control group; used in this report where data has been reported on a continuous scale.
Net Present Value The value of estimates of future streams of benefits less future streams of costs, when both are discounted to their value in the base year (i.e. the year of the analysis)
Odds ratio Odds are a way of representing probability, especially familiar for betting. In recent years odds ratios have become widely used in reports of clinical studies. They provide an estimate (usually with a confidence interval) for the effect of a treatment. Odds are used to convey the idea of ‘risk’ and an odds ratio of 1 between two treatment groups would imply that the risks of an adverse outcome were the same in each group. For rare events the odds ratio and the relative risk (which uses actual risks and not odds) will be very similar.
One-way sensitivity analysis With a model-based analysis, varying one input variable at a time to see how such changes alter the results of the analysis.
Probabilistic sensitivity analysis
An analysis conducted to quantify the decision uncertainty which arises from the uncertainty of all the parameter estimates used as model inputs. Involves defining a distribution of possible values for each uncertain input parameter and then sampling from those values for a large number of simulated individuals.
Randomised controlled trial A study to test a specific drug or other treatment in which people are randomly assigned to two (or more) groups: one (the experimental group) receiving the treatment that is being tested, and the other (the comparison or control group) receiving an alternative treatment, a placebo (dummy treatment) or no treatment. The two groups are followed up to compare differences in outcomes to see how effective the experimental treatment was. (Through randomisation, the groups should be similar in all aspects apart from the treatment they receive during the study.)
Rate ratio Like the relative risk is a ratio but instead based on the rate of a given event or outcome (e.g. 2 deaths per 100 person years of exposure to a risk factor) in one group of subjects compared to another group (e.g. 1 death per 100 person years of exposure, i.e. rate ratio = 2.0).
Relative risk A summary measure which represents the ratio of the risk of a given event or outcome (for example an adverse reaction to the drug being tested) in one group of subjects compared to another group. When the ‘risk’ of the event is the same in the two groups the relative risk is 1. In a study comparing two treatments, a relative risk of 2 would indicate that patients receiving one of the treatments had twice the risk of an undesirable outcome than those receiving the other treatment.
Report A publication based on the data collected in a study. There may be more than one report relating to the same dataset, for example where different analyses of the data are produced or where research participants are followed-up at later points in time.
Sensitivity analysis Varying either a model’s input variables or other model assumptions to see how such changes alter the results of the analysis (i.e. to see how sensitive the model results are to the changes)
Study A piece of research that is published in one or more reports.
Supply and/or installation (of home safety equipment)
Refers to equipment (supplied in the course of an intervention) that physically requires installation in the home if it is to be used correctly (e.g. smoke alarms, stair gates, cupboard locks).
Time horizon The length of time over which an economic evaluation (or other study) estimates or measures both the costs and effects relating to the included comparators.
Note: Validity, odds ratio and trial definitions sourced from NICE Public Health Guidance Development: Glossary of technical terms.
PUIC Home: Review of effectiveness and
cost-effectiveness
– 7 –
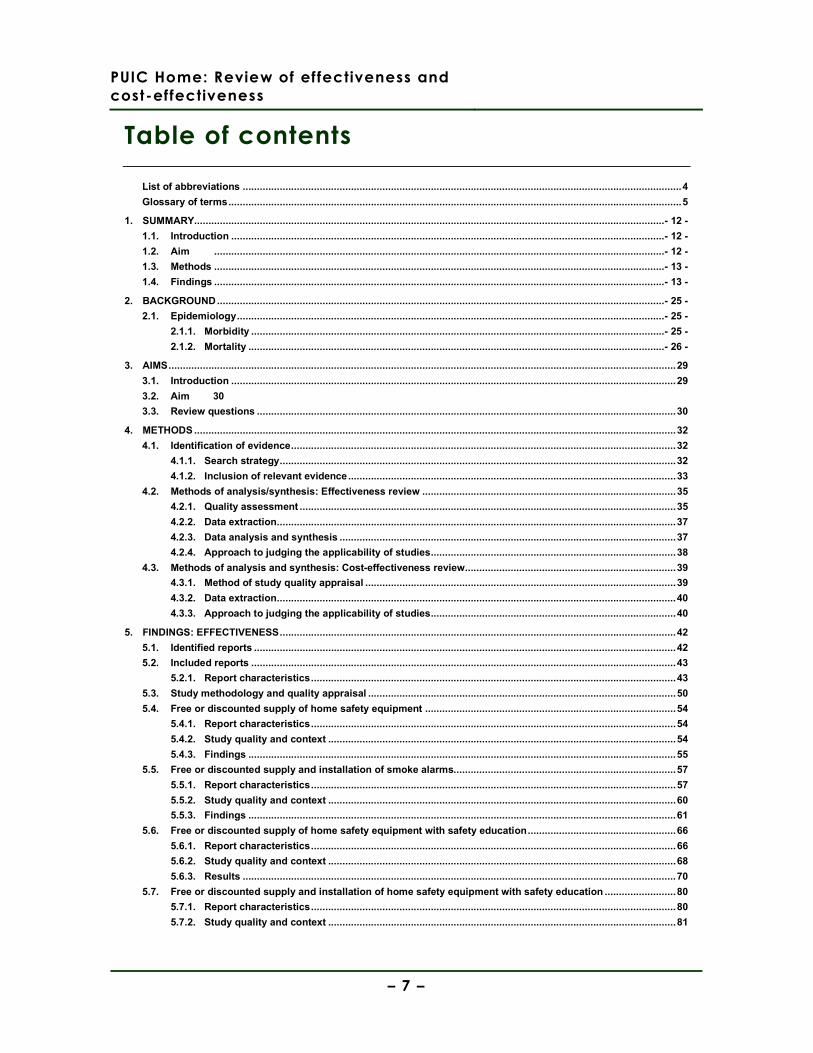
Table of contents
List of abbreviations ..........................................................................................................................................................4
Glossary of terms...............................................................................................................................................................5
1. SUMMARY.....................................................................................................................................................................- 12 -
1.1. Introduction ........................................................................................................................................................- 12 -
1.2. Aim ..............................................................................................................................................................- 12 -
1.3. Methods ..............................................................................................................................................................- 13 -
1.4. Findings ..............................................................................................................................................................- 13 -
2. BACKGROUND.............................................................................................................................................................- 25 -
2.1. Epidemiology......................................................................................................................................................- 25 -
2.1.1. Morbidity .................................................................................................................................................- 25 -
2.1.2. Mortality ..................................................................................................................................................- 26 -
3. AIMS..................................................................................................................................................................................29
3.1. Introduction ............................................................................................................................................................29
3.2. Aim 30
3.3. Review questions ...................................................................................................................................................30
4. METHODS .........................................................................................................................................................................32
4.1. Identification of evidence.......................................................................................................................................32
4.1.1. Search strategy...........................................................................................................................................32
4.1.2. Inclusion of relevant evidence...................................................................................................................33
4.2. Methods of analysis/synthesis: Effectiveness review .........................................................................................35
4.2.1. Quality assessment ....................................................................................................................................35
4.2.2. Data extraction............................................................................................................................................37
4.2.3. Data analysis and synthesis ......................................................................................................................37
4.2.4. Approach to judging the applicability of studies......................................................................................38
4.3. Methods of analysis and synthesis: Cost-effectiveness review..........................................................................39
4.3.1. Method of study quality appraisal .............................................................................................................39
4.3.2. Data extraction............................................................................................................................................40
4.3.3. Approach to judging the applicability of studies......................................................................................40
5. FINDINGS: EFFECTIVENESS...........................................................................................................................................42
5.1. Identified reports ....................................................................................................................................................42
5.2. Included reports .....................................................................................................................................................43
5.2.1. Report characteristics................................................................................................................................43
5.3. Study methodology and quality appraisal ............................................................................................................50
5.4. Free or discounted supply of home safety equipment ........................................................................................54
5.4.1. Report characteristics................................................................................................................................54
5.4.2. Study quality and context ..........................................................................................................................54
5.4.3. Findings ......................................................................................................................................................55
5.5. Free or discounted supply and installation of smoke alarms..............................................................................57
5.5.1. Report characteristics................................................................................................................................57
5.5.2. Study quality and context ..........................................................................................................................60
5.5.3. Findings ......................................................................................................................................................61
5.6. Free or discounted supply of home safety equipment with safety education....................................................66
5.6.1. Report characteristics................................................................................................................................66
5.6.2. Study quality and context ..........................................................................................................................68
5.6.3. Results ........................................................................................................................................................70
5.7. Free or discounted supply and installation of home safety equipment with safety education .........................80
5.7.1. Report characteristics................................................................................................................................80
5.7.2. Study quality and context ..........................................................................................................................81
PUIC Home: Review of effectiveness and
cost-effectiveness
– 8 –
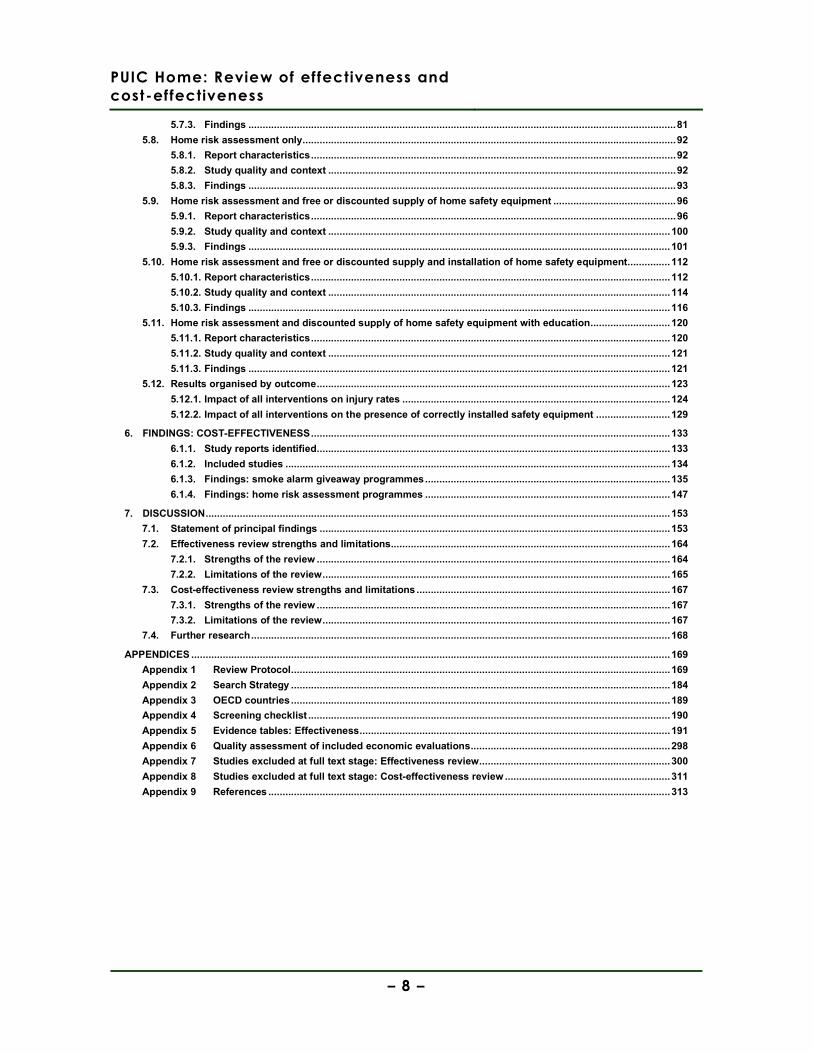
5.7.3. Findings ......................................................................................................................................................81
5.8. Home risk assessment only...................................................................................................................................92
5.8.1. Report characteristics................................................................................................................................92
5.8.2. Study quality and context ..........................................................................................................................92
5.8.3. Findings ......................................................................................................................................................93
5.9. Home risk assessment and free or discounted supply of home safety equipment ...........................................96
5.9.1. Report characteristics................................................................................................................................96
5.9.2. Study quality and context ........................................................................................................................100
5.9.3. Findings ....................................................................................................................................................101
5.10. Home risk assessment and free or discounted supply and installation of home safety equipment...............112
5.10.1. Report characteristics..............................................................................................................................112
5.10.2. Study quality and context ........................................................................................................................114
5.10.3. Findings ....................................................................................................................................................116
5.11. Home risk assessment and discounted supply of home safety equipment with education............................120
5.11.1. Report characteristics..............................................................................................................................120
5.11.2. Study quality and context ........................................................................................................................121
5.11.3. Findings ....................................................................................................................................................121
5.12. Results organised by outcome............................................................................................................................123
5.12.1. Impact of all interventions on injury rates ..............................................................................................124
5.12.2. Impact of all interventions on the presence of correctly installed safety equipment ..........................129
6. FINDINGS: COST-EFFECTIVENESS..............................................................................................................................133
6.1.1. Study reports identified............................................................................................................................133
6.1.2. Included studies .......................................................................................................................................134
6.1.3. Findings: smoke alarm giveaway programmes......................................................................................135
6.1.4. Findings: home risk assessment programmes ......................................................................................147
7. DISCUSSION...................................................................................................................................................................153
7.1. Statement of principal findings ...........................................................................................................................153
7.2. Effectiveness review strengths and limitations..................................................................................................164
7.2.1. Strengths of the review ............................................................................................................................164
7.2.2. Limitations of the review..........................................................................................................................165
7.3. Cost-effectiveness review strengths and limitations .........................................................................................167
7.3.1. Strengths of the review ............................................................................................................................167
7.3.2. Limitations of the review..........................................................................................................................167
7.4. Further research...................................................................................................................................................168
APPENDICES ........................................................................................................................................................................169
Appendix 1 Review Protocol.....................................................................................................................................169
Appendix 2 Search Strategy .....................................................................................................................................184
Appendix 3 OECD countries.....................................................................................................................................189
Appendix 4 Screening checklist ...............................................................................................................................190
Appendix 5 Evidence tables: Effectiveness.............................................................................................................191
Appendix 6 Quality assessment of included economic evaluations......................................................................298
Appendix 7 Studies excluded at full text stage: Effectiveness review...................................................................300
Appendix 8 Studies excluded at full text stage: Cost-effectiveness review ..........................................................311
Appendix 9 References .............................................................................................................................................313

PUIC Home: Review of effectiveness and
cost-effectiveness
– 9 –
List of tables
Table 1: Accidents inside the home resulting in presentation at hospital aged 0-14 2000-2002..............................................- 27 - Table 2: Number and rate of childhood deaths in England and Wales recorded as accidental ...............................................- 28 -
Table 3: Intervention components and their reporting in this review. ..........................................................................................38 Table 4: Included study characteristics ......................................................................................................................................44 Table 5: Interventions: Home safety equipment supplied and/or installed ..................................................................................49 Table 6: Quality assessment of included reports........................................................................................................................51 Table 7: Free of discounted supply of home safety equipment: Report characteristics...............................................................54 Table 8: Free or discounted supply and installation of smoke alarms: Report characteristics .....................................................58 Table 9: Fire-related injuries following supply & installation of smoke alarms.............................................................................62 Table 10: Installation and functioning of smoke alarms following intervention ............................................................................63 Table 11: Supply of smoke alarms (by different methods of distribution) at one month post-intervention....................................64 Table 12: Free or discounted supply of home safety equipment with safety education: Report characteristics...........................66 Table 13: Installation of home safety equipment after intervention with free or discounted supply and education.......................72 Table 14: Use of home safety equipment after intervention with free or discounted supply and education .................................73 Table 15: Improvements in home safety knowledge and behaviour (fires, scalds, and falls) after intervention with free or
discounted supply of home safety equipment and education ...........................................................................76 Table 16: Improvements in home safety knowledge and behaviour (poisonings, wounds, drowning, and suffocation)
after intervention with free or discounted supply of home safety equipment and education..............................77 Table 17: Free or discounted supply and installation of home safety equipment: Report characteristics ....................................80 Table 18: Child injuries in the 24 months following supply and installation of home safety equipment with safety
education.........................................................................................................................................................83 Table 19: Installation of home safety equipment after intervention with supply of home safety equipment with safety
education and installation ................................................................................................................................85 Table 20: Installation of stair gates (at 12 month follow-up): analysis of effect of intervention involving supply and
installation of stair gates (with safety education) upon reducing health inequalities..........................................86 Table 21: Installation of smoke alarms (at 12 month follow-up): analysis of effect of intervention involving supply and
installation of smoke alarms (with safety education) upon reducing health inequalities ....................................87
Table 22: Improvements in home safety knowledge and behaviour after intervention with supply of home safety equipment with safety education and installation .............................................................................................89
Table 23: Home risk assessment only: Report characteristics....................................................................................................92 Table 24: Improvements in home safety knowledge and behaviour after intervention involving home risk assessment
only .................................................................................................................................................................94 Table 25: Home risk assessment and free or discounted supply of home safety equipment: Report characteristics...................96 Table 26: Child injuries (any medically attended injury) in the 36 months following home risk assessment and free or
discounted supply of home safety equipment. ...............................................................................................103 Table 27: Installation of home safety equipment following home risk assessment and free or discounted supply of home
safety equipment. ..........................................................................................................................................106 Table 28: Improvements in home safety knowledge and behaviour following home risk assessment and free or
discounted supply of home safety equipment. ...............................................................................................109 Table 29: Home risk assessment and free or discounted supply and installation of home safety equipment: Report
characteristics ...............................................................................................................................................112 Table 30: Improvements in home safety knowledge and behaviour following home risk assessment and free or
discounted supply and installation of home safety equipment. .......................................................................118 Table 31: Home risk assessment and discounted supply of home safety equipment with education: Report
characteristics ...............................................................................................................................................120 Table 32: Installation and continued use of home safety equipment 12 months after home risk assessment and
diascounted supply of safety equipment in conjunction with education ..........................................................122 Table 33: Installation and continued use of home safety equipment 12 months after home risk assessment and
discounted supply of safety equipment in conjunction with education; intra-arm comparison of intervention group by use of Children’s Safety Centre (CSC).........................................................................122
Table 34: Safety score 12 months after home risk assessment and discounted supply of safety equipment in conjunction with education; intra-arm comparison of intervention group by use of Children’s Safety Centre (CSC)...................................................................................................... Error! Bookmark not defined.
Table 35: Injury data reported by all included studies...............................................................................................................127 Table 36: Presence of safety equipment reported by all studies...............................................................................................130 Table 37. Published economic studies of smoke alarm give-away schemes: Study designs ....................................................136 Table 38: Economic studies of smoke alarm give-away schemes: Results ..............................................................................139
PUIC Home: Review of effectiveness and
cost-effectiveness
– 10 –
Table 39: Relative differences in events and costs in wards with and without the giveaway programme ..................144 Table 40. Published economic studies of relevant home risk assessment schemes: Study designs.........................................149 Table 41. Economic studies of relevant home risk assessment schemes: Results ..................................................................150 Table 42: Barriers and facilitators to effective interventions reported in effectiveness studies ..................................................161

PUIC Home: Review of effectiveness and
cost-effectiveness
– 11 –
List of figures
Figure 1: Review flowchart.........................................................................................................................................................42
PUIC Home: Review of effectiveness and
cost-effectiveness
Background
- 12 -
1. Summary
1.1. Introduction
This report presents the findings of a systematic review about the effectiveness and
cost-effectiveness of interventions (involving the supply and/or installation of home
safety equipment, and/or the provision of home risk assessments) aimed at reducing
unintentional injuries to children in the home.
1.2. Aim
The aim of this systematic review was to identify, critically appraise, and synthesise
evidence relating to interventions involving the supply and/or installation of home
safety equipment, and/or the provision of home risk assessments. Four research
questions informed the review:
• Which interventions involving the supply and/or installation of home safety
equipment (free of charge or at a reduced cost) are effective and cost-effective in
preventing unintentional injuries among children and young people aged under 15 in
the home?
• Are home risk assessments effective and cost-effective in preventing unintentional
injuries among children and young people aged under 15?
• What are the factors which either enhance or reduce the effectiveness of
interventions involving the supply and/or installation of home safety equipment and/or
home risk assessments, or which help or hinder their implementation? (effectiveness
review)
• What are the main causal relationships which seem to explain how the different
combinations of resources (and levels of costs) of these interventions are related to
intended outcomes (cost-effectiveness review)
PUIC Home: Review of effectiveness and
cost-effectiveness
Background
- 13 -
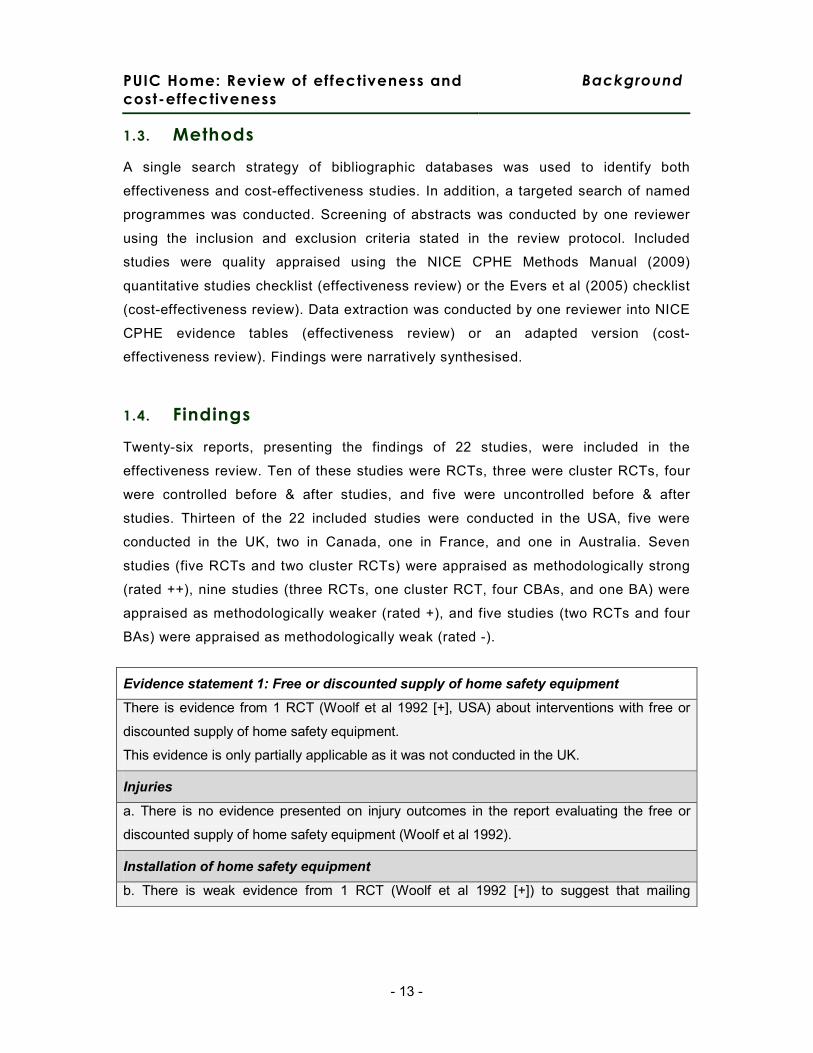
1.3. Methods
A single search strategy of bibliographic databases was used to identify both
effectiveness and cost-effectiveness studies. In addition, a targeted search of named
programmes was conducted. Screening of abstracts was conducted by one reviewer
using the inclusion and exclusion criteria stated in the review protocol. Included
studies were quality appraised using the NICE CPHE Methods Manual (2009)
quantitative studies checklist (effectiveness review) or the Evers et al (2005) checklist
(cost-effectiveness review). Data extraction was conducted by one reviewer into NICE
CPHE evidence tables (effectiveness review) or an adapted version (cost-
effectiveness review). Findings were narratively synthesised.
1.4. Findings
Twenty-six reports, presenting the findings of 22 studies, were included in the
effectiveness review. Ten of these studies were RCTs, three were cluster RCTs, four
were controlled before & after studies, and five were uncontrolled before & after
studies. Thirteen of the 22 included studies were conducted in the USA, five were
conducted in the UK, two in Canada, one in France, and one in Australia. Seven
studies (five RCTs and two cluster RCTs) were appraised as methodologically strong
(rated ++), nine studies (three RCTs, one cluster RCT, four CBAs, and one BA) were
appraised as methodologically weaker (rated +), and five studies (two RCTs and four
BAs) were appraised as methodologically weak (rated -).
Evidence statement 1: Free or discounted supply of home safety equipment
There is evidence from 1 RCT (Woolf et al 1992 [+], USA) about interventions with free or
discounted supply of home safety equipment.
This evidence is only partially applicable as it was not conducted in the UK.
Injuries
a. There is no evidence presented on injury outcomes in the report evaluating the free or
discounted supply of home safety equipment (Woolf et al 1992).
Installation of home safety equipment
b. There is weak evidence from 1 RCT (Woolf et al 1992 [+]) to suggest that mailing
PUIC Home: Review of effectiveness and
cost-effectiveness
Background
- 14 -
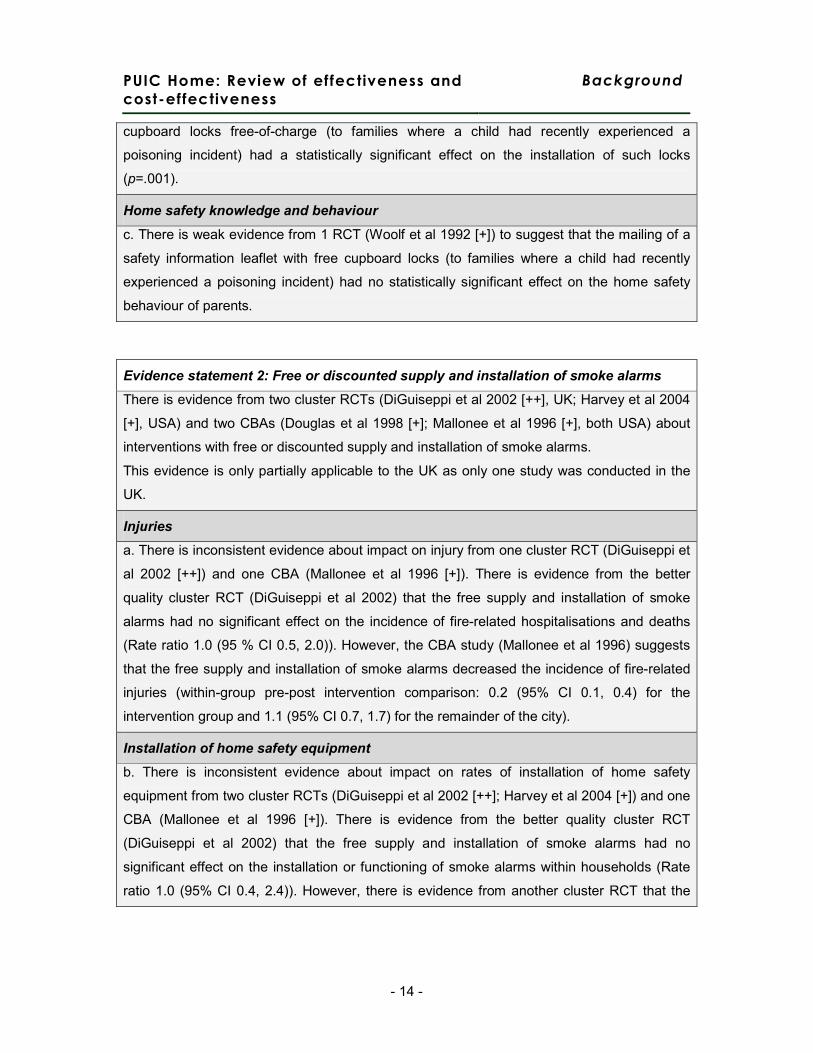
cupboard locks free-of-charge (to families where a child had recently experienced a
poisoning incident) had a statistically significant effect on the installation of such locks
(p=.001).
Home safety knowledge and behaviour
c. There is weak evidence from 1 RCT (Woolf et al 1992 [+]) to suggest that the mailing of a
safety information leaflet with free cupboard locks (to families where a child had recently
experienced a poisoning incident) had no statistically significant effect on the home safety
behaviour of parents.
Evidence statement 2: Free or discounted supply and installation of smoke alarms
There is evidence from two cluster RCTs (DiGuiseppi et al 2002 [++], UK; Harvey et al 2004
[+], USA) and two CBAs (Douglas et al 1998 [+]; Mallonee et al 1996 [+], both USA) about
interventions with free or discounted supply and installation of smoke alarms.
This evidence is only partially applicable to the UK as only one study was conducted in the
UK.
Injuries
a. There is inconsistent evidence about impact on injury from one cluster RCT (DiGuiseppi et
al 2002 [++]) and one CBA (Mallonee et al 1996 [+]). There is evidence from the better
quality cluster RCT (DiGuiseppi et al 2002) that the free supply and installation of smoke
alarms had no significant effect on the incidence of fire-related hospitalisations and deaths
(Rate ratio 1.0 (95 % CI 0.5, 2.0)). However, the CBA study (Mallonee et al 1996) suggests
that the free supply and installation of smoke alarms decreased the incidence of fire-related
injuries (within-group pre-post intervention comparison: 0.2 (95% CI 0.1, 0.4) for the
intervention group and 1.1 (95% CI 0.7, 1.7) for the remainder of the city).
Installation of home safety equipment
b. There is inconsistent evidence about impact on rates of installation of home safety
equipment from two cluster RCTs (DiGuiseppi et al 2002 [++]; Harvey et al 2004 [+]) and one
CBA (Mallonee et al 1996 [+]). There is evidence from the better quality cluster RCT
(DiGuiseppi et al 2002) that the free supply and installation of smoke alarms had no
significant effect on the installation or functioning of smoke alarms within households (Rate
ratio 1.0 (95% CI 0.4, 2.4)). However, there is evidence from another cluster RCT that the
PUIC Home: Review of effectiveness and
cost-effectiveness
Background
- 15 -
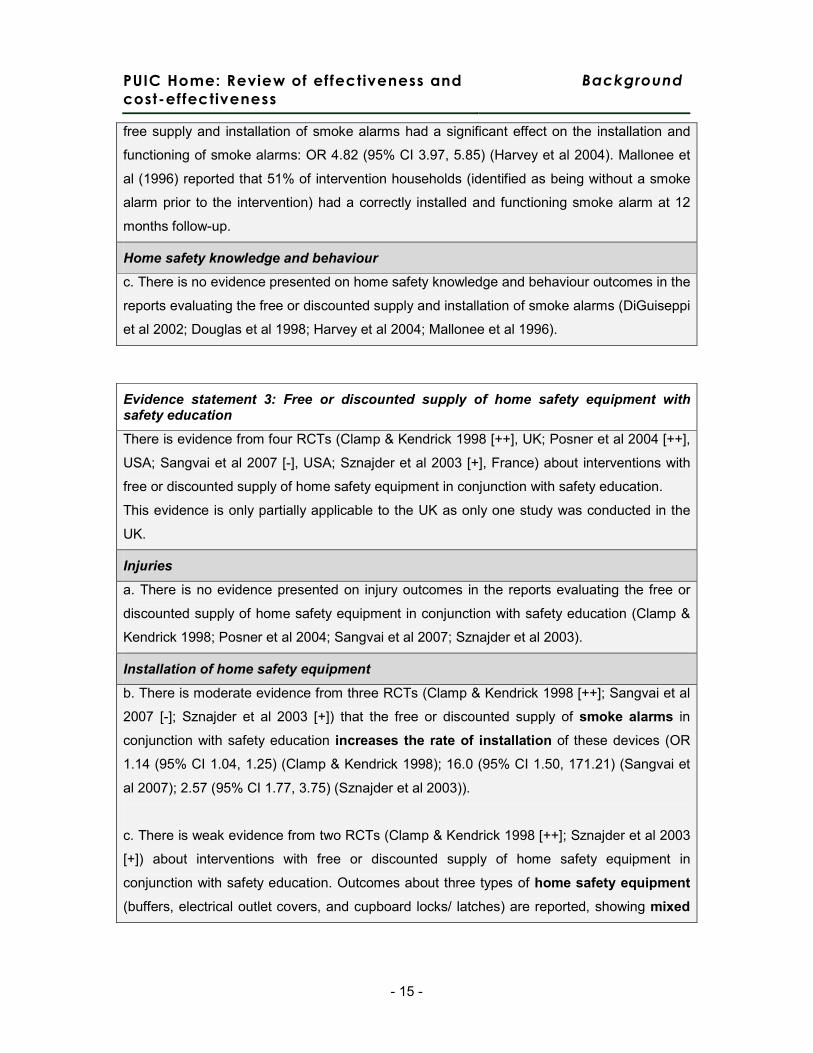
free supply and installation of smoke alarms had a significant effect on the installation and
functioning of smoke alarms: OR 4.82 (95% CI 3.97, 5.85) (Harvey et al 2004). Mallonee et
al (1996) reported that 51% of intervention households (identified as being without a smoke
alarm prior to the intervention) had a correctly installed and functioning smoke alarm at 12
months follow-up.
Home safety knowledge and behaviour
c. There is no evidence presented on home safety knowledge and behaviour outcomes in the
reports evaluating the free or discounted supply and installation of smoke alarms (DiGuiseppi
et al 2002; Douglas et al 1998; Harvey et al 2004; Mallonee et al 1996).
Evidence statement 3: Free or discounted supply of home safety equipment with safety education
There is evidence from four RCTs (Clamp & Kendrick 1998 [++], UK; Posner et al 2004 [++],
USA; Sangvai et al 2007 [-], USA; Sznajder et al 2003 [+], France) about interventions with
free or discounted supply of home safety equipment in conjunction with safety education.
This evidence is only partially applicable to the UK as only one study was conducted in the
UK.
Injuries
a. There is no evidence presented on injury outcomes in the reports evaluating the free or
discounted supply of home safety equipment in conjunction with safety education (Clamp &
Kendrick 1998; Posner et al 2004; Sangvai et al 2007; Sznajder et al 2003).
Installation of home safety equipment
b. There is moderate evidence from three RCTs (Clamp & Kendrick 1998 [++]; Sangvai et al
2007 [-]; Sznajder et al 2003 [+]) that the free or discounted supply of smoke alarms in
conjunction with safety education increases the rate of installation of these devices (OR
1.14 (95% CI 1.04, 1.25) (Clamp & Kendrick 1998); 16.0 (95% CI 1.50, 171.21) (Sangvai et
al 2007); 2.57 (95% CI 1.77, 3.75) (Sznajder et al 2003)).
c. There is weak evidence from two RCTs (Clamp & Kendrick 1998 [++]; Sznajder et al 2003
[+]) about interventions with free or discounted supply of home safety equipment in
conjunction with safety education. Outcomes about three types of home safety equipment
(buffers, electrical outlet covers, and cupboard locks/ latches) are reported, showing mixed
PUIC Home: Review of effectiveness and
cost-effectiveness
Background
- 16 -
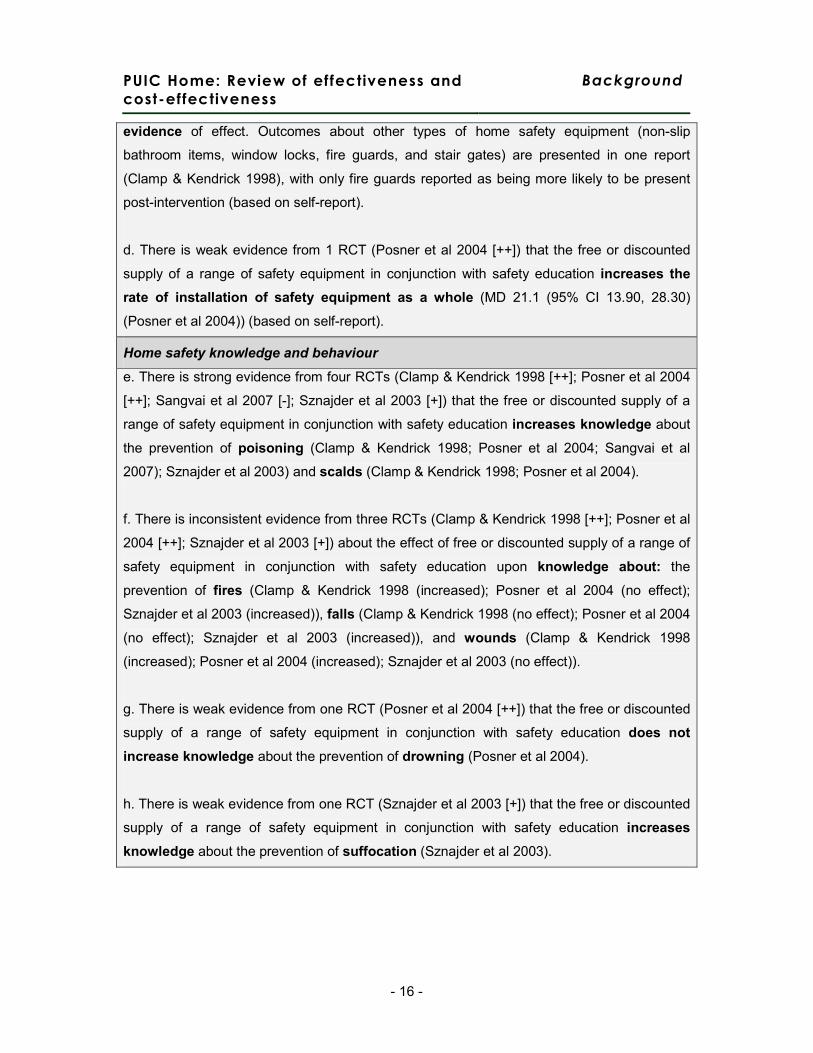
evidence of effect. Outcomes about other types of home safety equipment (non-slip
bathroom items, window locks, fire guards, and stair gates) are presented in one report
(Clamp & Kendrick 1998), with only fire guards reported as being more likely to be present
post-intervention (based on self-report).
d. There is weak evidence from 1 RCT (Posner et al 2004 [++]) that the free or discounted
supply of a range of safety equipment in conjunction with safety education increases the
rate of installation of safety equipment as a whole (MD 21.1 (95% CI 13.90, 28.30)
(Posner et al 2004)) (based on self-report).
Home safety knowledge and behaviour
e. There is strong evidence from four RCTs (Clamp & Kendrick 1998 [++]; Posner et al 2004
[++]; Sangvai et al 2007 [-]; Sznajder et al 2003 [+]) that the free or discounted supply of a
range of safety equipment in conjunction with safety education increases knowledge about
the prevention of poisoning (Clamp & Kendrick 1998; Posner et al 2004; Sangvai et al
2007); Sznajder et al 2003) and scalds (Clamp & Kendrick 1998; Posner et al 2004).
f. There is inconsistent evidence from three RCTs (Clamp & Kendrick 1998 [++]; Posner et al
2004 [++]; Sznajder et al 2003 [+]) about the effect of free or discounted supply of a range of
safety equipment in conjunction with safety education upon knowledge about: the
prevention of fires (Clamp & Kendrick 1998 (increased); Posner et al 2004 (no effect);
Sznajder et al 2003 (increased)), falls (Clamp & Kendrick 1998 (no effect); Posner et al 2004
(no effect); Sznajder et al 2003 (increased)), and wounds (Clamp & Kendrick 1998
(increased); Posner et al 2004 (increased); Sznajder et al 2003 (no effect)).
g. There is weak evidence from one RCT (Posner et al 2004 [++]) that the free or discounted
supply of a range of safety equipment in conjunction with safety education does not
increase knowledge about the prevention of drowning (Posner et al 2004).
h. There is weak evidence from one RCT (Sznajder et al 2003 [+]) that the free or discounted
supply of a range of safety equipment in conjunction with safety education increases
knowledge about the prevention of suffocation (Sznajder et al 2003).
PUIC Home: Review of effectiveness and
cost-effectiveness
Background
- 17 -
Evidence statement 4: Free or discounted supply and installation of home safety equipment with safety education
There is evidence from one RCT (resulting in two study reports: Kendrick et al, 2009 [++];
Watson et al 2005 [++], UK) about an intervention with free or discounted supply and
installation of home safety equipment (in conjunction with safety education).
This evidence is judged as highly applicable as it is recent and from the UK.
Injuries
a. There is moderate evidence from one RCT that free home safety equipment (or its
delivery) and installation with safety education has no statistically significant impact on
serious injury rates in children as measured by secondary care attendance (IRR 1.02 95%
CI 0.90, 1.13), hospital admission (IRR 1.02 95% CI 0.70, 1.48), the abbreviated injury scale
(OR 1.14 95% CI 0.76, 1.71) or the minor injury severity score (OR 0.98 95% CI 0.75, 1.27)
(Watson et al 2005).
Primary care attendance appeared to increase (IRR 1.37 95% CI 1.11, 1.70) (Watson et al
2005).
Installation of home safety equipment
b. There is weak evidence from one RCT that free home safety equipment (or its delivery)
and installation with safety education increases the use of smoke alarms at 12 months
(OR 1.83 95% CI 1.33, 2.53) and 24 months (OR 1.67 95% CI 1.21, 2.32) (Watson et al
2005). The intervention did not have a statistically significant impact on reducing socio-
economic inequalities in the uptake and continued use (12 months post-intervention) of
smoke alarms (Kendrick et al 2009).
c. There is weak evidence from one RCT about free home safety equipment (or its delivery)
and installation with safety education. Outcomes showed mixed evidence of effect: no
impact on fire guards being fitted and always used after 12 or 24 months, and increased
use of stair gates and window locks at 12 months, but not 24 months (Watson et al 2005).
The intervention had a statistically significant impact on reducing socio-economic
inequalities in the uptake and continued use (12 months post-intervention) of stair gates
(Kendrick et al 2009).
Home safety knowledge and behaviour
d. There is weak evidence from one RCT that free home safety equipment (or its delivery)
PUIC Home: Review of effectiveness and
cost-effectiveness
Background
- 18 -
and installation with safety education may increase the safe storage at 12 months of
cleaning products and sharp objects, but that these effects are no longer seen after 24
months for safe storage of sharp objects (Watson et al 2005).
Evidence statement 5: Home risk assessment only
There is evidence from one RCT (Paul et al 1994 [-], Australia) about an intervention with
home risk assessment only.
This evidence is of low applicability to the UK as the intervention is not recent and took place
in a rural Australian setting.
Injuries
a. The study about home risk assessments only did not report injury outcomes.
Installation of home safety equipment
b. There is weak evidence from one RCT suggesting that an intervention with home risk
assessment only may increase the use of smooth table top corners at 5-9 months after
the intervention. However, the study does not report the other measured results which do
not favour the intervention.
Home safety knowledge and behaviour
c. There is weak evidence from one RCT suggesting that an intervention with home risk
assessment only does not affect knowledge and behaviour around nine out of the 13
measured safety items at 5-9 months.
Evidence statement 6: Home risk assessment and free or discounted supply of home safety equipment
There is evidence from two RCTs (Babul et al 2007 [+], Canada; King et al 2001; 2005 [++],
Canada), one cluster RCT (Kendrick et al 1999 [++], UK), two CBAs (Hendrickson 2005 [+],
USA; Johnston et al 2000 [+], USA), and two BAs (Bablouzian et al 1997 [-], USA; Metchikian
et al 1999 [-], USA) about interventions with a home risk assessment and free or discounted
supply of home safety equipment.
This evidence is partially applicable to the UK as only one of the studies was conducted in
the UK.
PUIC Home: Review of effectiveness and
cost-effectiveness
Background
- 19 -
Injuries
a. There is inconsistent evidence from one RCT (King et al 2001; 2005 [++]) and one cluster
RCT (Kendrick et al 1999 [++]) about the effect of a home risk assessment and free or
discounted supply of home safety equipment on the occurrence of medically attended
injuries. There is evidence that injury rates decreased at 12 months following the
intervention (OR 0.75 (95% CI 0.58, 0.96) (King et al 2001)) (outcomes self-reported), but not
at 25 months following the intervention (OR 0.97 (95% CI 0.72, 1.30) (Kendrick et al 1999)).
There is evidence that injury rates were decreased (at borderline statistical significance) at
36 months (OR 0.80 (95% CI 0.64, 1.00) (King et al 2005)) (outcomes self-reported).
Installation of home safety equipment
b. There is inconsistent evidence from two RCTs (Babul et al 2007 [+]; King et al 2001 [++])
and one CBA (Johnston et al 2000 [+]) about interventions with a home risk assessment and
free or discounted supply of home safety equipment that included a smoke alarm. Outcomes
about the rates of installation of smoke alarms (all self-reported) show mixed evidence of
effect (Babul et al 2007 (no effect); King et al 2001 (increased); Johnston et al 2000
(increased)).
c. There is inconsistent evidence from two RCTs (Babul et al 2007 [+]; King et al 2001 [++])
and two BAs (Bablouzian et al 1997 [-]; Metchikian et al 1999 [-]) about interventions with a
home risk assessment and free or discounted supply of home safety equipment. Outcomes
about three types of home safety equipment (electrical outlet covers, cupboard locks/
latches, and stair gates) are reported, showing mixed evidence of effect.
Home safety knowledge and behaviour
d. There is moderate evidence from two RCTs (Babul et al 2007 [+]; King et al 2001 [++]) and
one BA (Bablouzian et al 1997 [-]) that a home risk assessment and free or discounted
supply of home safety equipment does not improve home safety knowledge and
behaviour about preventing fires or falls (Bablouzian et al 1997; Babul et al 2007; King et al
2001 (fires only)).
e. There is inconsistent evidence from two RCTs (Babul et al 2007 [+]; King et al 2001 [++]),
one CBA (Johnston et al 2000 [+]) and one BA (Bablouzian et al 1997 [-]) about the effect of
a home risk assessment and free or discounted supply of home safety equipment on home
PUIC Home: Review of effectiveness and
cost-effectiveness
Background
- 20 -
safety knowledge. Knowledge about preventing scalds was improved (Babul et al 2007;
King et al 2001), however there was mixed evidence of effect upon knowledge about the
prevention of poisoning (Babul et al 2007 (no effect); Johnston et al 2000 (improved); King
et al 2001 (no effect)).
f. There is weak evidence from one RCT (Babul et al 2007 [+]) that a home risk assessment
and free or discounted supply of home safety equipment does not improve home safety
knowledge and behaviour about preventing drowning (Babul et al 2007).
g. There is inconsistent evidence from one RCT (King et al 2001 [++]) and one CBA
(Hendrickson 2005 [+]) about the effect of a home risk assessment and free or discounted
supply of home safety equipment on parents’ perceived self-efficacy. There is evidence
from one CBA that there was a significant difference between intervention and control groups
in self-efficacy at 6 weeks follow-up (Hendrickson 2005). However, there is evidence from
one RCT that self-efficacy did not improve at 12 months follow-up (King et al 2001).
h. There is evidence from one BA (Metchikian et al 1999 [-]) that a home risk assessment
and free or discounted supply of home safety equipment improves home safety knowledge
and behaviour (as a whole) at 4-6 months follow-up (descriptive data only).
Evidence statement 7: Home risk assessment and free or discounted supply and installation of home safety equipment
There is evidence from one CBA (Schwarz et al 1993 [+], USA) and three BAs (Cagle et al
2006 [-], USA; Carman et al 2006 [-], UK; Klitzman et al 2005 [+], USA) about an intervention
with a home risk assessment and free or discounted supply and installation of home safety
equipment.
This evidence is partially applicable as only one of the studies was conducted in the UK.
Injuries
a. Two studies report injury outcomes after home risk assessment and free or discounted
supply and installation of home safety equipment (Cagle et al 2006; Carman et al 2006).
Carman only presents descriptive statistics, making impact unclear. Cagle suggests that
scald injuries are significantly reduced post-intervention, however this conclusion may be
PUIC Home: Review of effectiveness and
cost-effectiveness
Background
- 21 -
unsound due to lack of control group and contamination issues.
Installation of home safety equipment
b. Three studies report on the continued presence and use of installed equipment after home
risk assessment and free or discounted supply and installation of home safety equipment
(Cagle et al 2006; Klitzman et al 2005; Schwarz et al 1993).
There is mixed evidence about the impact on continued working equipment.
One study found that 60% of installed hot water tempering valves remained in situ after 6-9
months (Cagle et al 2006).
One study found significant improvements in the numbers of households with working
window guards and fire extinguishers post-intervention (Klitzman et al, 2005).
Finally, two studies showed significantly more smoke alarms installed and working post
intervention (Klitzman et al 2005 p<0.0001; Schwarz et al 1993 OR 0.30 95% CI 0.24, 0.38:
showing less alarm absence in the intervention group).
Home safety knowledge and behaviour
c. There is mixed evidence from 2 studies about the impact of home risk assessment and
free or discounted supply and installation of home safety equipment on safety knowledge
and behaviour. Of the four safety knowledge and behaviour outcomes (reduced hot water
temperature, number of scald risks, fire escape plan and medications with child proof caps)
reported by these 2 studies, one was positively affected by the intervention (fire escape
plan), one negatively affected (hot water temperature increased in intervention group), and
the others were not significantly affected..
Evidence statement 8: Home risk assessment and discounted supply of home safety equipment with education
There is evidence from one RCT about an intervention with a home risk assessment and
discounted supply of home safety equipment (in conjunction with education) (Gielen et al
2002 [++], USA).
This evidence is of low applicability to the UK as it is from the USA.
Injuries
a. The study about home risk assessments and discounted supply of home safety equipment
with education did not report injury outcomes.
PUIC Home: Review of effectiveness and
cost-effectiveness
Background
- 22 -
Installation of home safety equipment
b. There is weak evidence from one RCT suggesting that home risk assessments and
discounted supply of home safety equipment with education do not increase the presence
and use of smoke alarms, stair gates, or cupboard locks of latches or the use of a specially
built children’s safety centre (Gielen et al 2002).
Home safety knowledge and behaviour
c. The RCT does not report on differences in behaviour between the control and intervention
groups in terms of safety knowledge and behaviour. It does suggest that those who had
visited a safety centre took more action to prevent injury, but no more people from the
intervention arm visited the centre than from the control arm.
Summary evidence statement 9: Overall impact of home based interventions on rates of injury and installation of safety equipment
Injuries
Of the 22 included studies, seven report on the impact of interventions on injury rates.
a. There is inconsistent evidence about impact on injury rate from seven studies: four
found no significant reduction in injury with any intervention (three RCTs - DiGuiseppi
et al 1999, 2000, [++] UK; Kendrick et al, 1990 [+] UK; Watson et al, 2005, [++] UK;
and one uncontrolled before and after study – Carmen et al, 2006 [-] UK). The three
that did suggest injury rates were reduced have limitations due to difficulty in
attributing the change to the intervention (Cagle et al, 2006 USA [-], BA) the use of
self-reported outcomes and high attrition rates (King et al, 2001, 2005 Canada [++],
RCT) and the use of unadjusted analyses, and an atypical high risk setting (Mallonee
et al, 1996 USA [+], RCT).
The applicability of these findings is partial, with all the studies finding no impact
being set in the UK, and those suggesting positive results in North America.
Installation of smoke alarms
Of the 22 included studies, 14 provide information about the installation of smoke
detectors post intervention, however, only six used robust designs which both
PUIC Home: Review of effectiveness and
cost-effectiveness
Background
- 23 -
reported observed outcomes and had a control group.
b. There is inconsistent evidence from six robust studies (which use both observed
outcome measures and a controlled study design) about the presence of functional
smoke alarms. Four suggest that the intervention increased functioning presence
(Harvey et al, 2004 RCT [+] USA; Mallonee et al, 1996 CBA [+] USA; Sangvai et al
2007 RCT [-] USA; Schwarz et al, 1993 CBA [+] USA) and two suggest that no
significant impact was seen on smoke alarms (DiGuiseppi et al, 1999; 2002 RCT [++]
UK; Gielen et al, 2002 RCT [++] USA).
Installation of other home safety equipment
Of the 22 included studies, 19 provide information about the installation of home
safety equipment post intervention, however, only one used a robust designs which
both reported observed outcomes and had a control group.
c. There is evidence from one RCT that home risk assessments with free or
discounted supply of home safety equipment with safety education does not increase
the functional presence of safety equipment (Gielen et al, 2002, RCT [++]USA).
Evidence statement 10: Cost-effectiveness of smoke alarm giveaway schemes
There is inconsistent evidence from 2 cost-effectiveness analyses of smoke alarm giveaway
schemes with education materials, that such schemes when targeted at high risk areas and
households may be cost-effective from a societal perspective (Ginnelly et al. 2005 [+];Haddix
et al. 2001 [+]). The UK-based alarm giveaway programme (Ginnelly et al. 2005) was found
to be both less effective and more costly than no giveaway programme, whereas the USA-
based programme (Haddix et al. 2001) was found to be both highly effective and cost-
saving, compared with no programme. In addition to the fact that one study was in inner-city
London (UK) and the other was in a large US city, there were a number of other differences
in the characteristics of the intervention, the targeted intervention areas and analysis
methods which may explain the directly opposite effectiveness and cost-effectiveness
results. In particular, the UK study was based on effectiveness data from an RCT whereas
the US study was based on an uncontrolled before and after study; also, the US study
PUIC Home: Review of effectiveness and
cost-effectiveness
Background
- 24 -
included the value of productivity losses associated with fire-related injuries (and for each
fatal injury these were over $0.75 million).
The evidence from the UK-based cost-effectiveness study is judged as directly applicable to
UK urban settings (Ginnelly et al. 2005). However, the evidence from the older USA-based
study (Haddix et al. 2001) is judged as only partially applicable to UK urban settings. There
was no evidence from non-urban settings, or of schemes which did not target high risk and
low socio-economic status areas.
Evidence statement 11: Cost-effectiveness of home risk assessments
There is weak evidence from one cost-effectiveness study based on a randomised controlled
trial in Canadian cities, that a single home visit involving an information package, discount
vouchers, and home-specific risk-reduction advice (based on a previous risk assessment) is
cost-effective from a heath system perspective (King et al. 2001 [-]). This cost-effectiveness
conclusion either relies on the assumption that avoiding such injuries to children is worth
over C$372 to society, and/or that the value of other benefits to families and carers (e.g.
gained leisure or earnings not lost caring for the injured child) exceeds C$372. Assessment
of the quality of this study was highly compromised by the very small amount of space
devoted to describing it within the effectiveness paper.
The evidence is from a Canadian study which uses 15-year old data and is therefore judged
as only partially applicable to UK family homes; the generalisability of the study’s findings
beyond Canada is also hindered by the absence of sensitivity analyses.
PUIC Home: Review of effectiveness and
cost-effectiveness
Background
- 25 -
2. Background
2.1. Epidemiology
Globally, unintentional injury contributes to the top fifteen causes of death across all
age groups of children aged 0-19 years, with road traffic accidents, drowning, fire
related burns and falls most common (Peden et al. 2008) A separate review has been
undertaken by PenTAG to evaluate engineering measures aimed at the prevention of
injury to children on the road, and was previously presented to the PHIAC. The
current review considers the prevention of unintentional injury to children in the home.
In children under the age of five, the majority of injuries occur in the home. It is
known that higher levels of injury morbidity and mortality are found among those from
more deprived backgrounds, whatever measure (parental occupation, deprivation
index of local area, etc.) is used, although to date there has been little robust
research about the impact of interventions on different socio-economic groups
(Dowswell & Towner 2002). In addition, unintentional injury is more common, and
more serious in boys than girls, and this gap increases with a child’s age (Healthcare
Commission and Audit Commission 2007). Given variation in injury rates both
between and within countries, it is clear that many such injuries are preventable.
2.1.1 . Morbidity
Until 2002, the Department of Trade and Industry compiled annual accident statistics
for England and Wales using the Home and Leisure Accident Surveillance Systems
(HASS/LASS), to assess the number of unintentional injuries resulting in harm serious
enough to result in a visit to hospital. The Department of Health has recently
commissioned the South West Public Health Observatory to undertake research
assessing the feasibility replacing the system of HASS/LASS and this will report in
early 2010 (http://www.rospa.com/hassandlass/update.htm).
Data from the most recent of the HASS/LASS reports is available from the Royal
Society for the Prevention of Accidents (RoSPA) website. This shows that in 2002
there were 477,486 accidents in the home among those aged 0-4 years and 405,019
among those aged 5-14 years which resulted in injuries requiring hospital attendance
PUIC Home: Review of effectiveness and
cost-effectiveness
Background
- 26 -
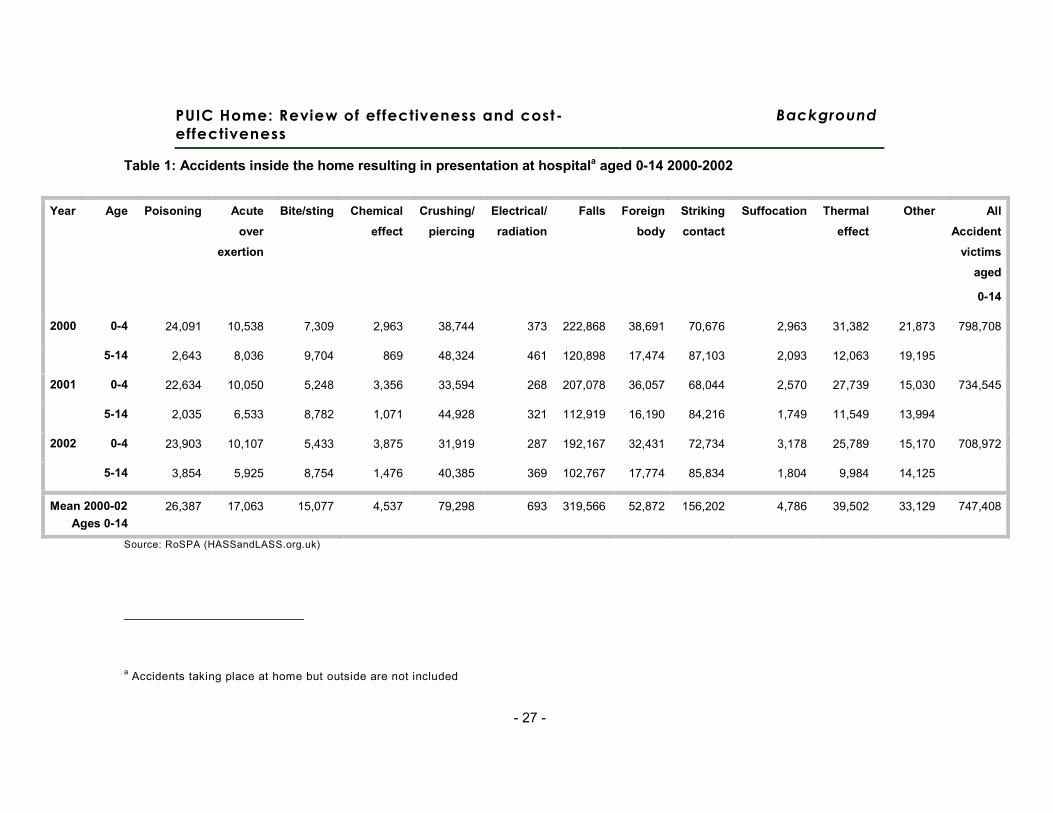
(www.hassandlass.org.uk). On average, in 2000-02, nearly three-quarters of a million
children aged 0-15 years presented at hospital annually having been injured inside
the home (Table 1).
Falls (location not specified) are the most frequent cause of child injury, leading to
presentation at hospital, followed by striking contact and crushing/piercing injury.
According to the Children’s Fire and Burn Trust, latest figures from the National Burn
Injury Database show that an average of 1500 children under the age of 5 are
admitted to hospital for burns annually, 60% for scalds due to hot water, hot drinks or
cooking accidents (http://www.childrensfireandburntrust.org.uk/).
2.1.2 . Mortality
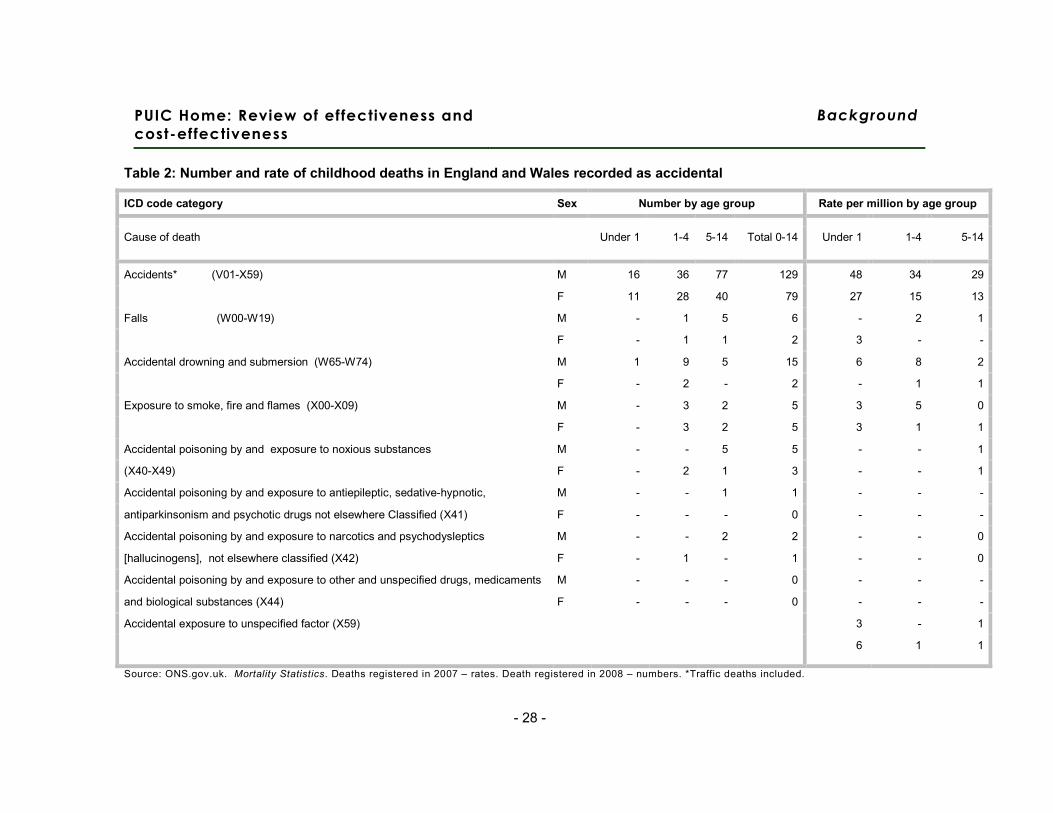
Absolute numbers of deaths recorded as “accidental” by the ONS for 2008 are shown
in Table 2, together with the rate per million population for 2007 (Office for National
Statistics 2009). In 2008, there were 208 deaths recorded as accidental by the ONS
(Table 2) Unfortunately, while this provides age specific data for the cause of death,
this is not linked to information about the location. From other sources, however, we
know that for about half of those with unintentional injuries in the 0-14 age group
presenting at accident and emergency departments, these are likely to have been
sustained at home (Healthcare Commission and Audit Commission 2007).
A 1996 study suggested that for every one child death in the UK due to home and
leisure activities, there are 151 hospital admissions and 1947 attendances at accident
and emergency departments (Walsh et al. 1996).
PUIC Home: Review of effectiveness and cost-
effectiveness
Background
- 27 -
Table 1: Accidents inside the home resulting in presentation at hospitala aged 0-14 2000-2002
Year Age Poisoning Acute
over
exertion
Bite/sting Chemical
effect
Crushing/
piercing
Electrical/
radiation
Falls Foreign
body
Striking
contact
Suffocation Thermal
effect
Other All
Accident
victims
aged
0-14
2000 0-4 24,091 10,538 7,309 2,963 38,744 373 222,868 38,691 70,676 2,963 31,382 21,873 798,708
5-14 2,643 8,036 9,704 869 48,324 461 120,898 17,474 87,103 2,093 12,063 19,195
2001 0-4 22,634 10,050 5,248 3,356 33,594 268 207,078 36,057 68,044 2,570 27,739 15,030 734,545
5-14 2,035 6,533 8,782 1,071 44,928 321 112,919 16,190 84,216 1,749 11,549 13,994
2002 0-4 23,903 10,107 5,433 3,875 31,919 287 192,167 32,431 72,734 3,178 25,789 15,170 708,972
5-14 3,854 5,925 8,754 1,476 40,385 369 102,767 17,774 85,834 1,804 9,984 14,125
Mean 2000-02
Ages 0-14
26,387 17,063 15,077 4,537 79,298 693 319,566 52,872 156,202 4,786 39,502 33,129 747,408
Source: RoSPA (HASSandLASS.org.uk)
a Accidents taking place at home but outside are not included
PUIC Home: Review of effectiveness and
cost-effectiveness
Background
- 28 -
Table 2: Number and rate of childhood deaths in England and Wales recorded as accidental
ICD code category Sex Number by age group Rate per million by age group
Cause of death Under 1 1-4 5-14 Total 0-14 Under 1 1-4 5-14
Accidents* (V01-X59) M 16 36 77 129 48 34 29
F 11 28 40 79 27 15 13
Falls (W00-W19) M - 1 5 6 - 2 1
F - 1 1 2 3 - -
Accidental drowning and submersion (W65-W74) M 1 9 5 15 6 8 2
F - 2 - 2 - 1 1
Exposure to smoke, fire and flames (X00-X09) M - 3 2 5 3 5 0
F - 3 2 5 3 1 1
Accidental poisoning by and exposure to noxious substances M - - 5 5 - - 1
(X40-X49) F - 2 1 3 - - 1
Accidental poisoning by and exposure to antiepileptic, sedative-hypnotic, M - - 1 1 - - -
antiparkinsonism and psychotic drugs not elsewhere Classified (X41) F - - - 0 - - -
Accidental poisoning by and exposure to narcotics and psychodysleptics M - - 2 2 - - 0
[hallucinogens], not elsewhere classified (X42) F - 1 - 1 - - 0
Accidental poisoning by and exposure to other and unspecified drugs, medicaments M - - - 0 - - -
and biological substances (X44) F - - - 0 - - -
Accidental exposure to unspecified factor (X59) 3 - 1
6 1 1
Source: ONS.gov.uk. Mortality Statistics. Deaths registered in 2007 – rates. Death registered in 2008 – numbers. *Traffic deaths included.
PUIC Home: Review of effectiveness
and cost-effectiveness
Aims
– 29 –
3. Aims
3.1. Introduction
NICE is developing a range of public health guidance to prevent unintentional injuries
among children and young people aged under 15. This review (Report 1) focuses on
the effectiveness and cost-effectiveness evidence related to interventions involving
the supply and/or installation of home safety equipment, and/or the provision of home
risk assessments, aimed at reducing unintentional injuries to children in the home.
Two related reports have also been produced to inform this guidance. Report 2
contains a review of qualitative research regarding barriers to, and facilitators of, the
prevention of unintentional injuries to children in the home. Report 3 contains a
report of economic modelling which assesses a smoke alarm give-away scheme and
a home risk assessment and advice programme including free safety equipment.
In parallel with this work, NICE is or will be developing public health intervention
guidance during 2009 and 2010 on a number of child injury prevention areas:
• ‘Preventing unintentional injuries among under 15s: road design’ (schemes involving
design- or engineering-based interventions to the road or street environment);
• ‘Preventing unintentional injuries among under 15s: outdoor play and leisure’;
• ‘Preventing unintentional road injuries among under 15s: education and protective
equipment’.
There will also be public health guidance (‘Strategies to prevent unintentional injuries
among under 15s’, developed through the programme guidance development
process) focusing on the broader legislative/regulatory and related strategic policy
frameworks which aim to prevent unintentional injuries in children. NICE will also be
preparing guidance that focuses on preventing unintentional road injuries among
young people aged 15-24.
PUIC Home: Review of effectiveness
and cost-effectiveness
Aims
– 30 –
3.2. Aim
This report presents two systematic reviews which aim to identify, critically appraise,
summarise and synthesise evidence relating to the effectiveness (review 1) and cost-
effectiveness (review 2) of interventions (involving the supply and/or installation of
home safety equipment, and/or the provision of home risk assessments) aimed at
reducing unintentional injuries to children in the home.
3.3. Review questions
The three reviews sought to answer the following review questions, as specified in
the agreed Review Protocol (see Appendix 1):
• Which interventions involving the supply and/or installation of home safety
equipment (free of charge or at a reduced cost) are effective and cost-effective in
preventing unintentional injuries among children and young people aged under 15 in
the home?
• Are home risk assessments effective and cost-effective in preventing unintentional
injuries among children and young people aged under 15?
• What are the factors which either enhance or reduce the effectiveness of
interventions involving the supply and/or installation of home safety equipment and/or
home risk assessments, or which help or hinder their implementation? (effectiveness
review)
• What are the main causal relationships which seem to explain how the different
combinations of resources (and levels of costs) of these interventions are related to
intended outcomes (cost-effectiveness review)
Outcomes of interest:
• Changes in injuries and deaths in children and young people aged under 15.
• Changes in knowledge, attitude, skills and behaviour in relation to preventing
unintentional injuries among children and young people aged under 15 in the home.
PUIC Home: Review of effectiveness
and cost-effectiveness
Aims
– 31 –
• The rates of supply, correct installation and proper maintenance of safety equipment
resulting in a reduction in unintentional injuries among children and young people
aged under 15 in the home.
PUIC Home: Review of effectiveness
and cost-effectiveness
Methods
– 32 –
4. Methods
A summary of the methods used in this systematic review is provided below. The
original review protocol is reproduced in Appendix 1 (p.169)
4.1. Identif ication of evidence
4.1.1. Search strategy
See Appendix 2 (p.184) for full search methods and database search strategies.
A single strategy was used to identify relevant primary research for the effectiveness,
cost-effectiveness (reported here, Report 1), and qualitative research reviews (see
Report 2). A search of electronic bibliographic databases was undertaken: Medline,
PsycINFO, ISI Web of Knowledge Social Science Citation Index (SSCI) and Science
Citation Index Expanded (SCI-EXPANDED), Health Management Information
Consortium (HMIC), CINAHL, Applied Social Science Index and Abstracts (ASSIA),
The Cochrane Library database of systematic reviews, EconLit, SafetyLit, the EPPI-
Centre databases; TRoPHI, DoPHER, and Bibliomap, and the databases of the
Centre for Review and Dissemination; Database of Abstracts of Reviews of Effects
(DARE), National Health Service Economic Evaulations Database (NHSEED), and
NHS Economic Evaluation Database (HTA). All bibliographic searches used filters to
limit publication years from 1990-date of search, English language, and non-animal
research where possible. A follow up targeted search of named programmes
(identified from the bibliographic searches and from scoping work conducted by NICE
CPHE) was conducted in Medline and using the search engine Google.
Search terms including the use of specific named devices were determined as part of
the protocol process between CPHE and the research group and incorporated
stakeholder considerations and the ability of devices to be “installed” in line with the
focus of this review.
Potentially includable papers from a parallel review for the CPHE programme on
preventing unintentional injuries in children, “A systematic review of risk factors for
unintentional injuries among children and young people aged under 15 years:
PUIC Home: Review of effectiveness
and cost-effectiveness
Methods
– 33 –
Quantitative correlates review of unintentional injury in children”, were also tagged
during title/abstract screening for this review.
Websites and searches of reference lists of reports and reviews were also used to
locate reports.
4.1.2. Inclusion of relevant evidence
4.1.2.1 . Inclusion and exclusion criteria
Inclusion criteria for both effectiveness and cost-effectiveness reviews:
• Reports published from 1990
• Reports published in English language
• Studies conducted in OECD countries (see Appendix 3, p.189)
Inclusion criteria specific to the effectiveness review:
• Evaluations (prospective or retrospective) of interventions involving the
supply and/or installation2 of home safety equipment and/or home risk
assessments3 using comparative designs (randomised controlled trials, non-
randomised controlled trials, before and after studies, or natural experiments)
Exclusion criteria specific to the effectiveness review:
• Empirical studies which only document interventions and related outcomes
without evidence regarding injury outcome prior to or without the intervention.
2 The ‘supply and/or installation’ of home safety equipment was defined as being for free or at a discount; some interventions required research participants to physically collect the equipment themselves, whilst others organised delivery to participants’ homes.
3 Defined as: A systematic assessment of a home to identify potential hazards, evaluate the risk, and provide information or advice on appropriate actions to reduce those risks. The assessment may either be by a trained assessor visiting the home, or by a householder assessing their own home
PUIC Home: Review of effectiveness
and cost-effectiveness
Methods
– 34 –
• Empirical studies which do not separately report injury-related outcomes for
children or young people aged under 154.
Inclusion criteria specific to the cost-effectiveness review:
• Full economic evaluations of relevant types of intervention, and high quality
costing studies conducted in the UK or countries of a similar level of economic
development.
Exclusion criteria specific to the cost-effectiveness review:
• Cost-of-illness studies, or other studies which do not involve assessing the
cost and related benefits/effectiveness of particular interventions (or class of
intervention).
4.1.2.2 . Screening
Reports identified through the searches were uploaded into a Reference Manager
database. All titles and abstracts (where available) were screened independently by
one of two reviewers (MP and RG). Inclusion decisions were made by a single
reviewer (MP or RG), and checked by a second reviewer (MP or RG) where there
was uncertainty (<0.2% of abstracts). A checklist (see Appendix 4, p.190) was used
to assess adherence to the inclusion criteria. If the abstract provided insufficient
information to assess for inclusion, or if no abstract was available and the report was
not clearly excludable on the basis of the title alone, then the full text of the report
was obtained. The full text of reports was independently assessed for inclusion by
one of two reviewers (MP or RG); where there was uncertainty over the inclusion or
exclusion of a report (about 7% of full-text reports), this was resolved by discussion.
Reports and the reason for their exclusion at the full-text stage are listed in Appendix
7 (p.300).
Where systematic reviews were identified, the lists of included and excluded reports
were scanned to identify potentially relevant reports that could enter the screening
4 However, a study that reported injury outcomes in (for example) the age range 5-18 years would be included if the majority of the data related to children aged 15 years or under.
PUIC Home: Review of effectiveness
and cost-effectiveness
Methods
– 35 –
process detailed above. Citations for these reviews are also listed in Appendix 7
(p.300).
4.2. Methods of analysis/synthesis: Effectiveness review
4.2.1. Quality assessment
All included reports were quality appraised using the revised GATE checklist in the
Methods for the development of NICE public health guidance (National Institute for
Health and Clinical Excellence 2009)
There are five sections of the revised GATE. Section 1 seeks to assess the key
population criteria for determining the study’s external validity – that is, the extent to
which the findings of a study are generalisable beyond the confines of the study to
the study’s source population.
Sections 2 to 4 assess the key criteria for determining the study’s internal validity –
that is, making sure that the study has been carried out carefully, and that the
outcomes are likely to be attributable to the intervention being assessed, rather than
some other (often unidentified) factor. In an internally valid study, any differences
observed between groups of patients allocated to receive different interventions may
(apart from the possibility of random error) be attributed to the intervention under
investigation. Biases are characteristics that are likely to make estimates of effect
differ systematically from the truth. Each of the critical appraisal checklist questions
covers an aspect of methodology that research has shown makes a significant
difference to the conclusions of a study.
In accordance with the CPHE methods manual (National Institute for Health and
ClinicaI Excellence 2009), checklist items were worded so that one of five responses
was possible:

PUIC Home: Review of effectiveness
and cost-effectiveness
Methods
– 36 –
++ Indicates that for that particular aspect of study design, the study has been designed/conducted in such a way as to minimise the risk of bias
+ Indicates that either the answer to the checklist question is not clear from the way the study is reported, or that the study may not have addressed all potential sources of bias for that particular aspect of study design
- Should be reserved for those aspects of the study design in which significant sources of bias may persist
Not reported (nr) Should be reserved for those aspects in which the study under review fails to report how they have/might have been considered
Not applicable (na) Should be reserved for those study design aspects which are not applicable given the study design under review (for example, allocation concealment would not be applicable for case control studies)
Each effectiveness study is then awarded an overall study quality grading for internal
validity (IV) and a separate one for external validity (EV):
++ All or most of the criteria have been fulfilled. Where they have not been fulfilled the study conclusions are thought very unlikely to alter.
+ Some of the criteria have been fulfilled. Those criteria that have not been fulfilled or not adequately described are thought unlikely to alter the study conclusions.
- Few or no criteria have been fulfilled. The study conclusions are thought likely or very likely to alter.
Quality appraisal was conducted independently by one of two reviewers (MP or RG).
Double-checking of a percentage of these study quality appraisals was unfortunately
not feasible within the reviewer resources available across the various public health
reviews. However, there was a constant flow of communication between the two
reviewers (MP and RG) about the appraisal of specific aspects of included studies. In
the latter stages of the review, this discussion widened to include revisiting each
report’s quality appraisal in order to ensure consistency between reviewers in the
application of the appraisal checklist and judgement made about study quality. This
resulted in the revision of some of the initial gradings so as to ensure consistency
between reviewers.
PUIC Home: Review of effectiveness
and cost-effectiveness
Methods
– 37 –
Within the evidence statements, specific terms were used to describe the strength of
the evidence (quality, quantity and consistency). These were defined by the reviewers
as follows:
Weak evidence: one study only, or two studies that show consistent results, but only
one scores a [+] for internal validity.
Moderate evidence: two or more studies where at least two of them score a [+] for
internal validity, and results are all consistent.
Strong evidence: two or more studies where at least two of them score a [++] for
internal validity, and results are all consistent.
Inconsistent evidence: more than one study where the results do not agree.
4.2.2. Data extraction
All included reports were read independently by one of two reviewers (MP or RG) and
data extracted into evidence tables (see Appendix 5, p.191) using the NICE CPHE
Methods Manual (2009) format. Data extracted from a random sample of 10% of the
included papers was double-checked by a third reviewer (ZL). In addition to data on
the core outcomes of interest, research methods used and statistical analyses
conducted, data was extracted about sample characteristics and the components of
interventions in order to inform considerations about the applicability of findings to the
UK context. Limitations identified by both report authors and the review team are also
recorded (separately) in the evidence tables.
4.2.3. Data analysis and synthesis
In order to identify variations in effectiveness for interventions comprising different
components, the interventions evaluated in the included studies were classified as
shown in Table 3 (p.38). It should be noted that ‘education about home safety’, for the
purposes of this review, is defined as a semi-structured discussion with parents (or
carers) of at least 10 minutes duration about how to reduce unintentional injuries to
children in the home (that is, the definition does not include the use of safety
information leaflets, unless these are used to augment the in-person discussion).
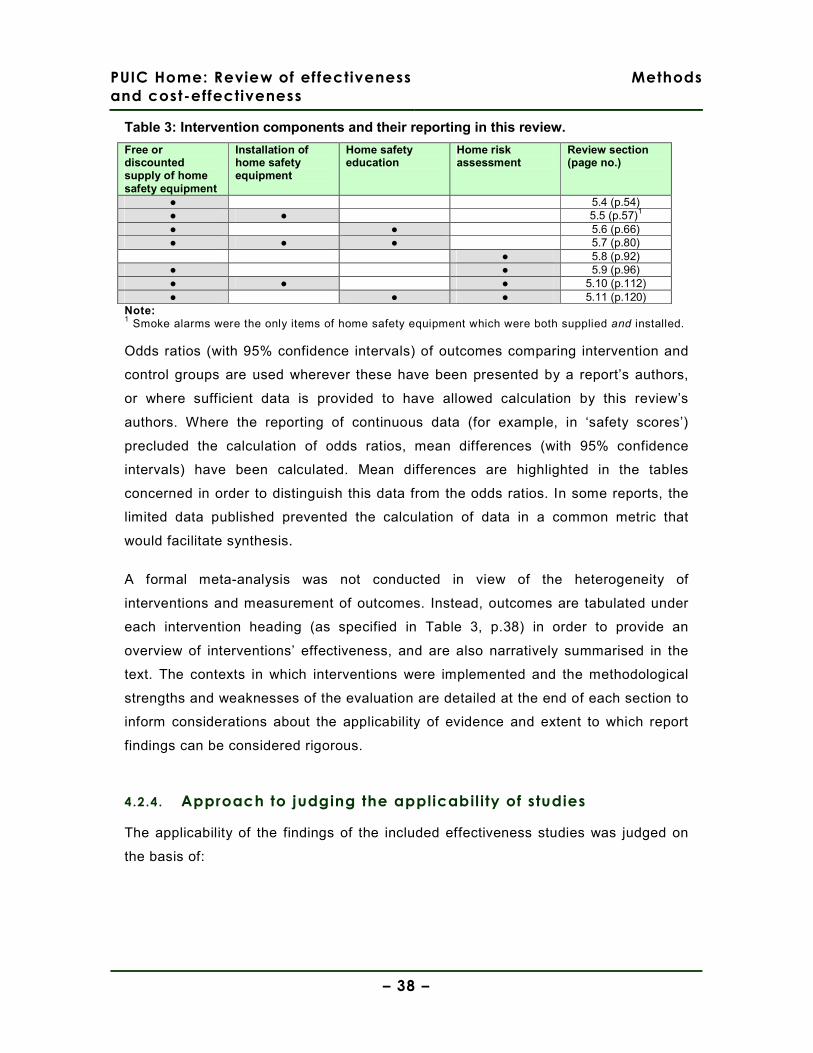
PUIC Home: Review of effectiveness
and cost-effectiveness
Methods
– 38 –
Table 3: Intervention components and their reporting in this review.
Free or discounted supply of home safety equipment
Installation of home safety equipment
Home safety education
Home risk assessment
Review section (page no.)
● 5.4 (p.54) ● ● 5.5 (p.57)1
● ● 5.6 (p.66) ● ● ● 5.7 (p.80) ● 5.8 (p.92)
● ● 5.9 (p.96) ● ● ● 5.10 (p.112) ● ● ● 5.11 (p.120)
Note: 1 Smoke alarms were the only items of home safety equipment which were both supplied and installed. Odds ratios (with 95% confidence intervals) of outcomes comparing intervention and
control groups are used wherever these have been presented by a report’s authors,
or where sufficient data is provided to have allowed calculation by this review’s
authors. Where the reporting of continuous data (for example, in ‘safety scores’)
precluded the calculation of odds ratios, mean differences (with 95% confidence
intervals) have been calculated. Mean differences are highlighted in the tables
concerned in order to distinguish this data from the odds ratios. In some reports, the
limited data published prevented the calculation of data in a common metric that
would facilitate synthesis.
A formal meta-analysis was not conducted in view of the heterogeneity of
interventions and measurement of outcomes. Instead, outcomes are tabulated under
each intervention heading (as specified in Table 3, p.38) in order to provide an
overview of interventions’ effectiveness, and are also narratively summarised in the
text. The contexts in which interventions were implemented and the methodological
strengths and weaknesses of the evaluation are detailed at the end of each section to
inform considerations about the applicability of evidence and extent to which report
findings can be considered rigorous.
4.2.4. Approach to judging the applicabil ity of studies
The applicability of the findings of the included effectiveness studies was judged on
the basis of:
PUIC Home: Review of effectiveness
and cost-effectiveness
Methods
– 39 –
• The perceived feasibility of providing a similar programme in the UK (e.g. in
terms of types of trained staff involved, levels of resources, and delivery
organisations)
• The social, economic and geographical context of the programme evaluated
compared with equivalent UK settings
The lack of an empirical framework for judging applicability has meant that these
judgements have necessarily been based upon reviewers’ perceptions of similarities
and differences between (for example) social and health care systems. In view of this
dearth of information about what can be considered to be reasonable grounds for
stating that findings in one country may be applicable in the UK, we have largely
judged studies conducted in the UK to be ‘highly applicable’ and all others of ‘partial
or low applicability’.
4.3. Methods of analysis and synthesis: Cost-
effectiveness review
4.3.1. Method of study quality appraisal
Quality appraisal was assessed using the 19-item CHEC Criteria list (which has many
items in common with the more well-known ‘Drummond checklist’) (Evers et al. 2005).
It has some advantages over the Drummond checklist because (a) it has been
developed and validated through a systematic review of previous checklists and an
international consensus process, and because (b) key questions about the
identification, measurement and valuation of costs and consequences are asked
separately for costs and consequences/effects. Since there were no analyses based
on decision models it is appropriate that there are no specific quality assessment
items relating to the quality of decision models.
Note that we used the 19-point list as published in the 2005 paper by Evers et al.,
rather than the adapted checklist in the (2009) Second Edition of Methods for the
development of NICE public health guidance. This is in order to maintain consistency
with the other reviews of economic evaluations being conducted to support the
development of public health guidance on unintentional injury to children (and also
because, at the time of the earlier review - on injuries on the road – the NICE-
PUIC Home: Review of effectiveness
and cost-effectiveness
Methods
– 40 –
recommended methodology checklist for economic evaluations was the one from the
Drummond et al. 1997 textbook on economic evaluation)(Drummond et al. 1997).
4.3.2. Data extraction
Details of each included economic evaluation and UK-based cost analysis have been
extracted to a table containing each study’s design/methods, and another table to
show the main results.
The study design table recorded the following details: author and publication year;
type of economic study (e.g. cost-effectiveness analysis or cost analysis), main data
years (e.g. time period of before-and-after effectiveness study); country and setting;
population and/or localities; interventions and comparators; perspective of the
analysis; time horizon and discount rates used (if applicable); costs and savings
included; type of cost-effectiveness estimate, and; sensitivity analysis.
The study results table recorded the following details: the ‘from’ and ‘to’ intervention
(i.e. the comparison); the cost of the intervention(s); the benefits associated with the
intervention(s); the incremental cost-effectiveness ratio (where appropriate; or other
cost-effectiveness estimate).
4.3.3. Approach to judging the applicabil ity of studies
The applicability of the findings of the included economic evaluations was judged on
the basis of:
• The perceived feasibility of providing a similar programme in the UK (e.g. in
terms of types of trained staff involved, levels of resources, and delivery
organisations)
• The social, economic and geographical context of the programme evaluated
compared with equivalent UK settings (including the background prevalence or
incidence of the unintentional injury types of interest, and the patterns of
causes of injuries where known/described)
• The number of years since the study was conducted
PUIC Home: Review of effectiveness
and cost-effectiveness
Methods
– 41 –
• The extensiveness of sensitivity analyses - potentially allowing some
estimation of the programme’s cost-effectiveness to settings where particular
characteristics of the intervention (e.g. grade and pay of staff delivering it) or
its context (e.g. injury incidence rates or severity) are known to vary.
These criteria broadly reflect the majority of the criteria specified for judging the
applicability of economic evaluation findings as described in the CPHE Methods
Manual (2009), except those relating to whether and how QALYs were estimated.
(NB. This version of the manual had not been published at the time the protocol for
this review was developed). Inevitably, given that the main reviewer is not an expert
on the topic of home injury or child injury prevention, these judgements should be
viewed as provisional assessments.
4.3.3.1 . Analysing and synthesising the findings
A narrative synthesis approach was adopted, in which:
• studies were first grouped according to the type of intervention evaluated
• the key features of each study were described individually, and then
• notable similarities and differences in the methods and results across studies were
described and interpreted
Particular emphasis was placed on critically appraising and comparing any recent,
good quality and UK-based studies.
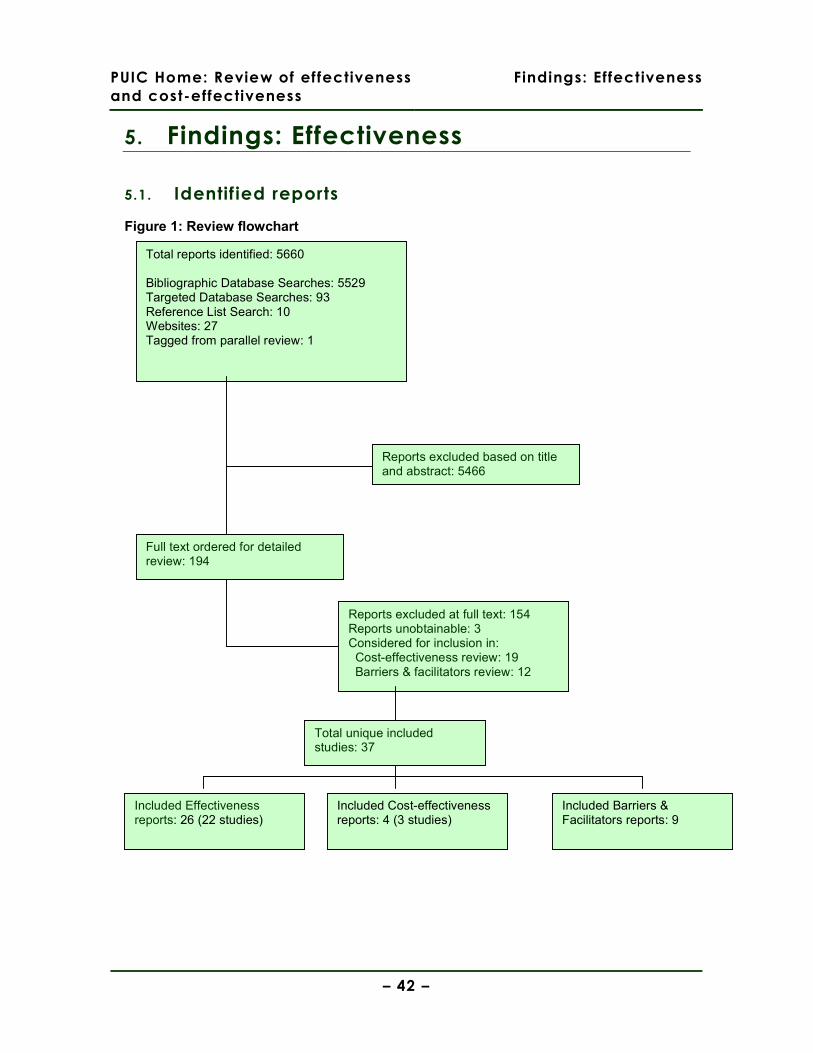
PUIC Home: Review of effectiveness
and cost-effectiveness
Findings: Effectiveness
– 42 –
5. Findings: Effectiveness
5.1. Identif ied reports
Figure 1: Review flowchart
Total reports identified: 5660 Bibliographic Database Searches: 5529 Targeted Database Searches: 93 Reference List Search: 10 Websites: 27 Tagged from parallel review: 1
Reports excluded based on title and abstract: 5466
Included Effectiveness reports: 26 (22 studies)
Full text ordered for detailed review: 194
Reports excluded at full text: 154 Reports unobtainable: 3 Considered for inclusion in: Cost-effectiveness review: 19 Barriers & facilitators review: 12
Included Cost-effectiveness reports: 4 (3 studies)
Included Barriers & Facilitators reports: 9
Total unique included studies: 37
PUIC Home: Review of effectiveness
and cost-effectiveness
Findings: Effectiveness
– 43 –
5.2. Included reports
5.2.1. Report characteristics
A total of 26 reports were included in the effectiveness review (Table 4, p.44). Four of
these reports included additional analyses of datasets from an earlier included report,
or outcomes data from a later follow-up of the same sample (DiGuiseppi et al 2002;
Mallonee et al 1996; Kendrick et al 2009; King et al 2005), meaning that a total of 22
studies were included.
Evaluations were conducted using a range of study types; ten were RCTs (Babul et al
2007; Clamp & Kendrick 1998; Gielen et al 2002; King et al 2001; Paul et al 1994;
Posner et al 2004; Sangvai et al 2007; Sznajder et al 2003; Watson et al 2005; Woolf
et al 1992), three were cluster RCTs (DiGuiseppi et al 2002; Harvey et al 2004;
Kendrick et al 1999), four were controlled before & after studies (Hendrickson 2005;
Johnston et al 2000; Mallonee et al 1996; Schwarz et al 1993), and five were
uncontrolled before & after studies (Bablouzian et al 1997; Cagle et al 2006; Carman
et al 2006; Klitzman et al 2005; Metchikian et al 1999).
Table 4 (p.44) also shows that 13 of the 22 included studies were conducted in the
USA (Bablouzian et al 1997; Cagle et al 2006; Gielen et al 2002; Harvey et al 2004;
Hendrickson 2005; Johnston et al 2000; Klitzman et al 2005; Mallonee et al 1996;
Metchikian et al 1999; Posner et al 2004; Sangvai et al 2007; Schwarz et al 1993;
Woolf et al 1992); five were conducted in the UK (Carman et al 2006; Clamp &
Kendrick 1998; DiGuiseppi et al 2002; Kendrick et al 1999; Watson et al 2005), two in
Canada (Babul et al 2007; King et al 2001), one in France (Sznajder et al 2003), and
one in Australia (Paul et al 1994). Details of the study quality appraisal, intervention
components, and key contextual characteristics of the interventions are also
contained in Table 4 (p.44).
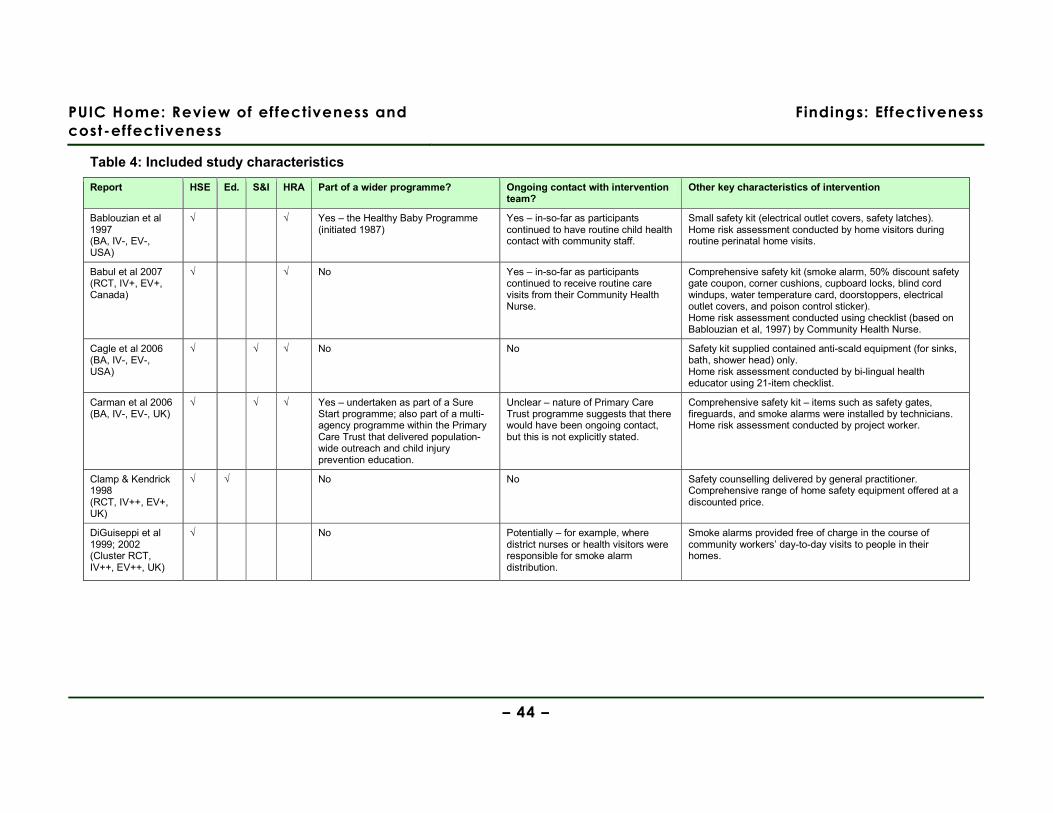
PUIC Home: Review of effectiveness and
cost-effectiveness
Findings: Effectiveness
– 44 –
Table 4: Included study characteristics
Report HSE Ed. S&I HRA Part of a wider programme? Ongoing contact with intervention team?
Other key characteristics of intervention
Bablouzian et al 1997 (BA, IV-, EV-, USA)
√ √ Yes – the Healthy Baby Programme (initiated 1987)
Yes – in-so-far as participants continued to have routine child health contact with community staff.
Small safety kit (electrical outlet covers, safety latches). Home risk assessment conducted by home visitors during routine perinatal home visits.
Babul et al 2007 (RCT, IV+, EV+, Canada)
√ √ No Yes – in-so-far as participants continued to receive routine care visits from their Community Health Nurse.
Comprehensive safety kit (smoke alarm, 50% discount safety gate coupon, corner cushions, cupboard locks, blind cord windups, water temperature card, doorstoppers, electrical outlet covers, and poison control sticker). Home risk assessment conducted using checklist (based on Bablouzian et al, 1997) by Community Health Nurse.
Cagle et al 2006 (BA, IV-, EV-, USA)
√ √ √ No No Safety kit supplied contained anti-scald equipment (for sinks, bath, shower head) only. Home risk assessment conducted by bi-lingual health educator using 21-item checklist.
Carman et al 2006 (BA, IV-, EV-, UK)
√ √ √ Yes – undertaken as part of a Sure Start programme; also part of a multi-agency programme within the Primary Care Trust that delivered population-wide outreach and child injury prevention education.
Unclear – nature of Primary Care Trust programme suggests that there would have been ongoing contact, but this is not explicitly stated.
Comprehensive safety kit – items such as safety gates, fireguards, and smoke alarms were installed by technicians. Home risk assessment conducted by project worker.
Clamp & Kendrick 1998 (RCT, IV++, EV+, UK)
√ √ No No Safety counselling delivered by general practitioner. Comprehensive range of home safety equipment offered at a discounted price.
DiGuiseppi et al 1999; 2002 (Cluster RCT, IV++, EV++, UK)
√ No Potentially – for example, where district nurses or health visitors were responsible for smoke alarm distribution.
Smoke alarms provided free of charge in the course of community workers’ day-to-day visits to people in their homes.
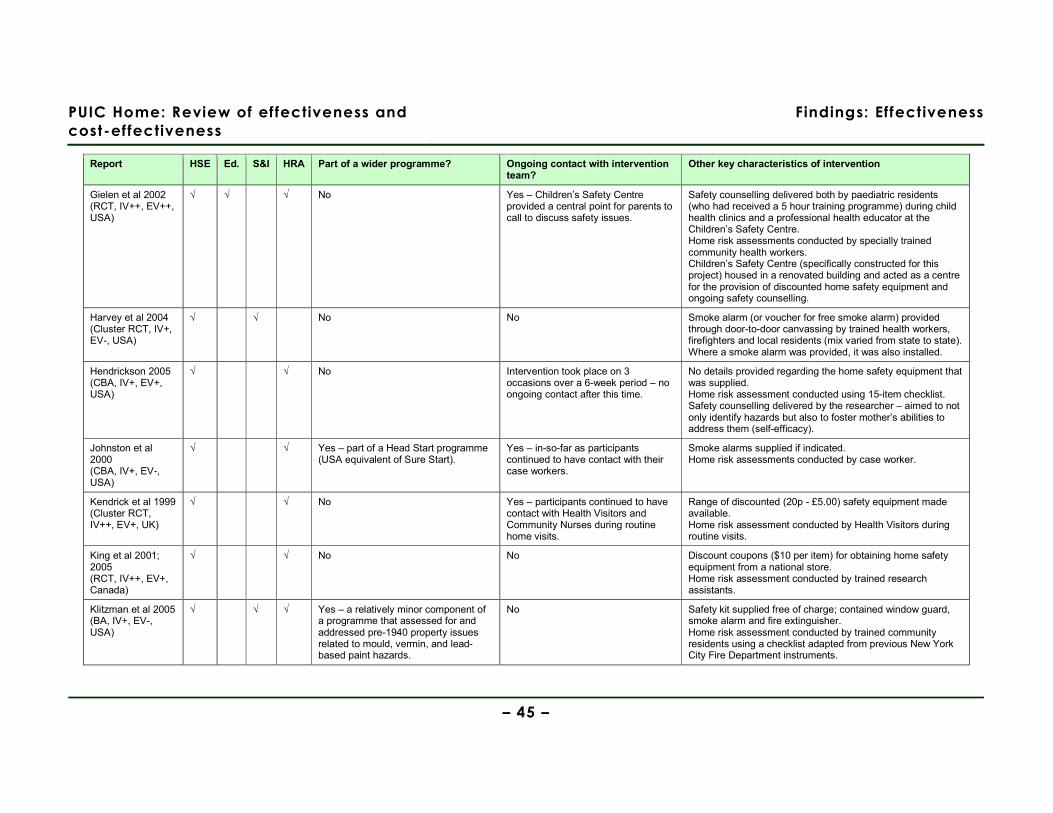
PUIC Home: Review of effectiveness and
cost-effectiveness
Findings: Effectiveness
– 45 –
Report HSE Ed. S&I HRA Part of a wider programme? Ongoing contact with intervention team?
Other key characteristics of intervention
Gielen et al 2002 (RCT, IV++, EV++, USA)
√ √ √ No Yes – Children’s Safety Centre provided a central point for parents to call to discuss safety issues.
Safety counselling delivered both by paediatric residents (who had received a 5 hour training programme) during child health clinics and a professional health educator at the Children’s Safety Centre. Home risk assessments conducted by specially trained community health workers. Children’s Safety Centre (specifically constructed for this project) housed in a renovated building and acted as a centre for the provision of discounted home safety equipment and ongoing safety counselling.
Harvey et al 2004 (Cluster RCT, IV+, EV-, USA)
√ √ No No Smoke alarm (or voucher for free smoke alarm) provided through door-to-door canvassing by trained health workers, firefighters and local residents (mix varied from state to state). Where a smoke alarm was provided, it was also installed.
Hendrickson 2005 (CBA, IV+, EV+, USA)
√ √ No Intervention took place on 3 occasions over a 6-week period – no ongoing contact after this time.
No details provided regarding the home safety equipment that was supplied. Home risk assessment conducted using 15-item checklist. Safety counselling delivered by the researcher – aimed to not only identify hazards but also to foster mother’s abilities to address them (self-efficacy).
Johnston et al 2000 (CBA, IV+, EV-, USA)
√ √ Yes – part of a Head Start programme (USA equivalent of Sure Start).
Yes – in-so-far as participants continued to have contact with their case workers.
Smoke alarms supplied if indicated. Home risk assessments conducted by case worker.
Kendrick et al 1999 (Cluster RCT, IV++, EV+, UK)
√ √ No Yes – participants continued to have contact with Health Visitors and Community Nurses during routine home visits.
Range of discounted (20p - £5.00) safety equipment made available. Home risk assessment conducted by Health Visitors during routine visits.
King et al 2001; 2005 (RCT, IV++, EV+, Canada)
√ √ No No Discount coupons ($10 per item) for obtaining home safety equipment from a national store. Home risk assessment conducted by trained research assistants.
Klitzman et al 2005 (BA, IV+, EV-, USA)
√ √ √ Yes – a relatively minor component of a programme that assessed for and addressed pre-1940 property issues related to mould, vermin, and lead-based paint hazards.
No Safety kit supplied free of charge; contained window guard, smoke alarm and fire extinguisher. Home risk assessment conducted by trained community residents using a checklist adapted from previous New York City Fire Department instruments.
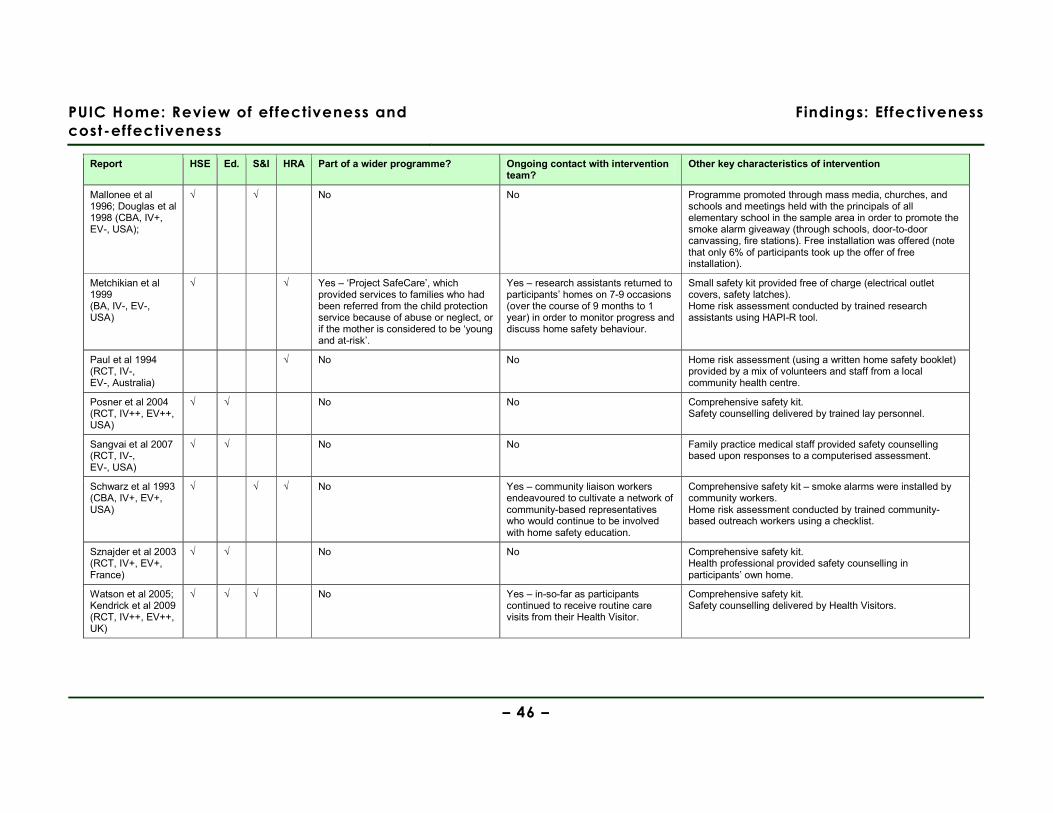
PUIC Home: Review of effectiveness and
cost-effectiveness
Findings: Effectiveness
– 46 –
Report HSE Ed. S&I HRA Part of a wider programme? Ongoing contact with intervention team?
Other key characteristics of intervention
Mallonee et al 1996; Douglas et al 1998 (CBA, IV+, EV-, USA);
√ √ No No Programme promoted through mass media, churches, and schools and meetings held with the principals of all elementary school in the sample area in order to promote the smoke alarm giveaway (through schools, door-to-door canvassing, fire stations). Free installation was offered (note that only 6% of participants took up the offer of free installation).
Metchikian et al 1999 (BA, IV-, EV-, USA)
√ √ Yes – ‘Project SafeCare’, which provided services to families who had been referred from the child protection service because of abuse or neglect, or if the mother is considered to be ‘young and at-risk’.
Yes – research assistants returned to participants’ homes on 7-9 occasions (over the course of 9 months to 1 year) in order to monitor progress and discuss home safety behaviour.
Small safety kit provided free of charge (electrical outlet covers, safety latches). Home risk assessment conducted by trained research assistants using HAPI-R tool.
Paul et al 1994 (RCT, IV-, EV-, Australia)
√ No No Home risk assessment (using a written home safety booklet) provided by a mix of volunteers and staff from a local community health centre.
Posner et al 2004 (RCT, IV++, EV++, USA)
√ √ No No Comprehensive safety kit. Safety counselling delivered by trained lay personnel.
Sangvai et al 2007 (RCT, IV-, EV-, USA)
√ √ No No Family practice medical staff provided safety counselling based upon responses to a computerised assessment.
Schwarz et al 1993 (CBA, IV+, EV+, USA)
√ √ √ No Yes – community liaison workers endeavoured to cultivate a network of community-based representatives who would continue to be involved with home safety education.
Comprehensive safety kit – smoke alarms were installed by community workers. Home risk assessment conducted by trained community-based outreach workers using a checklist.
Sznajder et al 2003 (RCT, IV+, EV+, France)
√ √ No No Comprehensive safety kit. Health professional provided safety counselling in participants’ own home.
Watson et al 2005; Kendrick et al 2009 (RCT, IV++, EV++, UK)
√ √ √ No Yes – in-so-far as participants continued to receive routine care visits from their Health Visitor.
Comprehensive safety kit. Safety counselling delivered by Health Visitors.

PUIC Home: Review of effectiveness and
cost-effectiveness
Findings: Effectiveness
– 47 –
Report HSE Ed. S&I HRA Part of a wider programme? Ongoing contact with intervention team?
Other key characteristics of intervention
Woolf et al 1992 (RCT, IV+, EV+, USA)
√ No No Limited safety kit (safety latches and now non-recommended Ipecac syrup). No personal contact with participants as safety kit was mailed to participants’ homes.
Key: IV - Internal validity EV - External validity HSE - Home safety equipment Ed. - Education (a safety counselling component that was semi-structured and lasted for ten or more minutes) S&I - Supply & installation (of home safety equipment) HRA - Home risk assessment
PUIC Home: Review of effectiveness
and cost-effectiveness
Findings: Effectiveness
– 48 –
An overview of the variety of interventions evaluated and the mixtures of home safety
equipment that were supplied and/or installed is shown in Table 5 (p.49). Reference
to Table 5 whilst considering the synthesis presented in this review may be helpful for
obtaining an overview of the differences between interventions (for example, whether
equipment was supplied but not installed) and some of the complexities of the
interventions concerned (for example, where equipment was supplied in a number of
ways, or where there were differences in what was charged).
Home safety equipment was classified as follows:
• Buffers – equipment designed to cushion any impact (e.g. table corners, anti-door
slam devices)
• Electrical – electric socket covers only
• Latches – drawer and cupboard safety latches or locks
• Bathroom – non-slip bathroom items
• Anti-scald – equipment designed to prevent contact with scalding water (e.g.
thermostatic regulators, spout covers, or bathwater thermometers)
• Windows – equipment designed to minimise injuries from impact with glass (e.g.
window guards, window safety film)
• Individual items of home safety equipment (i.e. window locks, fire guards, stair
gates, and smoke alarms)
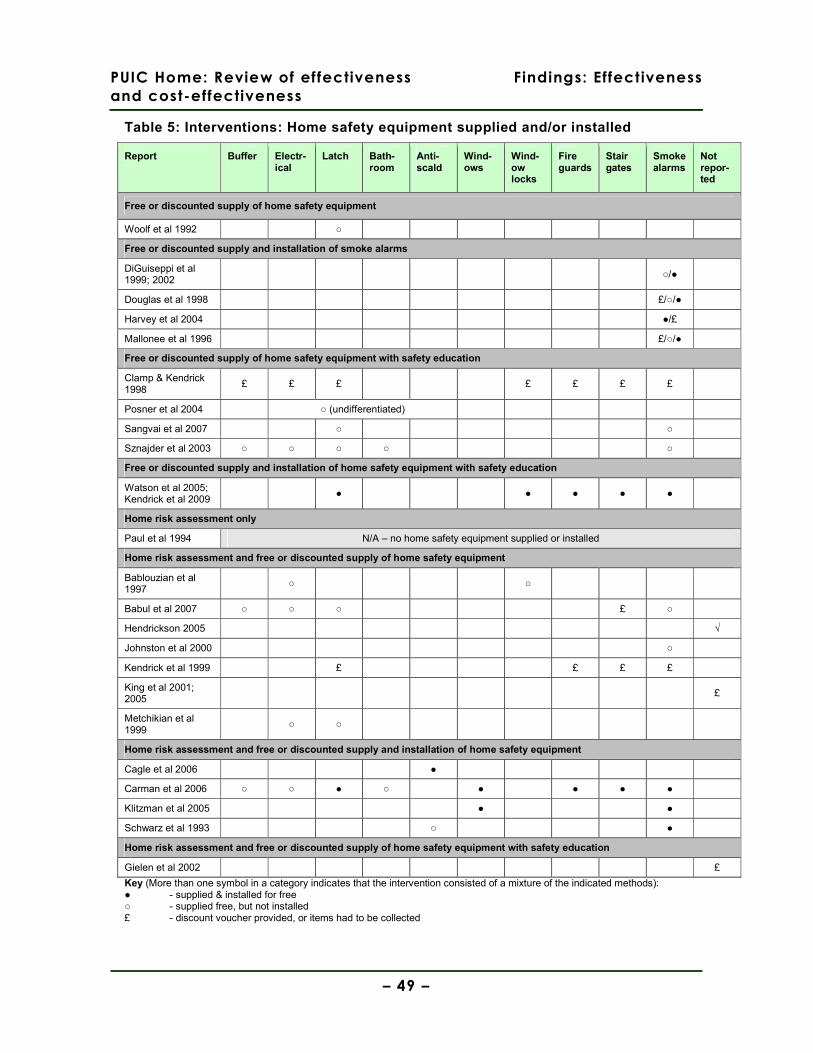
PUIC Home: Review of effectiveness
and cost-effectiveness
Findings: Effectiveness
– 49 –
Table 5: Interventions: Home safety equipment supplied and/or installed
Report Buffer Electr-ical
Latch Bath-room
Anti-scald
Wind-ows
Wind-ow locks
Fire guards
Stair gates
Smoke alarms
Not repor-ted
Free or discounted supply of home safety equipment
Woolf et al 1992 ○
Free or discounted supply and installation of smoke alarms
DiGuiseppi et al 1999; 2002
○/●
Douglas et al 1998 £/○/●
Harvey et al 2004 ●/£
Mallonee et al 1996 £/○/●
Free or discounted supply of home safety equipment with safety education
Clamp & Kendrick 1998
£ £ £ £ £ £ £
Posner et al 2004 ○ (undifferentiated)
Sangvai et al 2007 ○ ○
Sznajder et al 2003 ○ ○ ○ ○ ○
Free or discounted supply and installation of home safety equipment with safety education
Watson et al 2005; Kendrick et al 2009
● ● ● ● ●
Home risk assessment only
Paul et al 1994 N/A – no home safety equipment supplied or installed
Home risk assessment and free or discounted supply of home safety equipment
Bablouzian et al 1997
○ ○
Babul et al 2007 ○ ○ ○ £ ○
Hendrickson 2005 √
Johnston et al 2000 ○
Kendrick et al 1999 £ £ £ £
King et al 2001; 2005
£
Metchikian et al 1999
○ ○
Home risk assessment and free or discounted supply and installation of home safety equipment
Cagle et al 2006 ●
Carman et al 2006 ○ ○ ● ○ ● ● ● ●
Klitzman et al 2005 ● ●
Schwarz et al 1993 ○ ●
Home risk assessment and free or discounted supply of home safety equipment with safety education
Gielen et al 2002 £
Key (More than one symbol in a category indicates that the intervention consisted of a mixture of the indicated methods): ● - supplied & installed for free ○ - supplied free, but not installed £ - discount voucher provided, or items had to be collected

PUIC Home: Review of effectiveness
and cost-effectiveness
Findings: Effectiveness
– 50 –
5.3. Study methodology and quality appraisal
Study quality appraisal is summarised in Table 6 (p.51). Ten of the 22 included
studies were RCTs, three were cluster RCTs, four were controlled before & after
studies, and five were uncontrolled before & after studies. The internal validity of five
of the ten RCTs and two of the three cluster RCTs was appraised as being
methodologically strong (rated ++). The internal validity of three of the ten RCTs, one
of the three cluster RCTs, all four of the CBAs and one of the five BAs were was
appraised as being methodologically weaker in-so-far as not all potential sources of
bias had been addressed in the study design (rated +). The internal validity of the
remaining studies (two RCTs and four BAs) was appraised as methodologically weak,
where substantial sources of bias were not addressed in the study design (rated -).
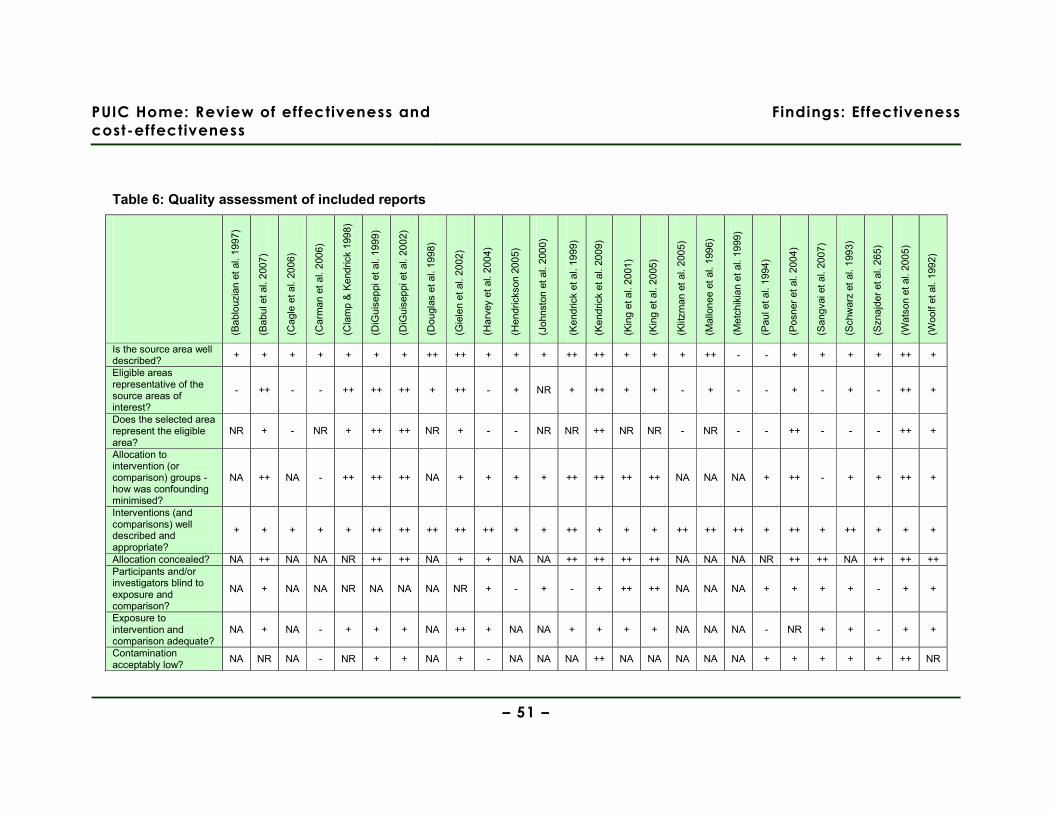
PUIC Home: Review of effectiveness and
cost-effectiveness
Findings: Effectiveness
– 51 –
Table 6: Quality assessment of included reports
(Bab
louz
ian
et a
l. 19
97)
(Bab
ul e
t al.
2007
)
(Cag
le e
t al.
2006
)
(Car
man
et
al.
2006
)
(Cla
mp
& K
endr
ick
1998
)
(DiG
uise
ppi e
t al
. 199
9)
(DiG
uise
ppi e
t al
. 200
2)
(Dou
glas
et a
l. 19
98)
(Gie
len
et a
l. 20
02)
(Har
vey
et a
l. 20
04)
(Hen
dric
kson
200
5)
(Joh
nsto
n et
al.
2000
)
(Ken
dric
k et
al.
1999
)
(Ken
dric
k et
al.
2009
)
(Kin
g et
al.
2001
)
(Kin
g et
al.
2005
)
(Klit
zman
et
al. 2
005)
(Mal
lone
e et
al.
1996
)
(Met
chik
ian
et a
l. 19
99)
(Pau
l et a
l. 19
94)
(Pos
ner
et a
l. 20
04)
(San
gvai
et
al.
2007
)
(Sch
war
z et
al.
1993
)
(Szn
ajde
r et
al.
265)
(Wat
son
et a
l. 20
05)
(Woo
lf et
al.
1992
)
Is the source area well described?
+ + + + + + + ++ ++ + + + ++ ++ + + + ++ - - + + + + ++ +
Eligible areas representative of the source areas of interest?
- ++ - - ++ ++ ++ + ++ - + NR + ++ + + - + - - + - + - ++ +
Does the selected area represent the eligible area?
NR + - NR + ++ ++ NR + - - NR NR ++ NR NR - NR - - ++ - - - ++ +
Allocation to intervention (or comparison) groups - how was confounding minimised?
NA ++ NA - ++ ++ ++ NA + + + + ++ ++ ++ ++ NA NA NA + ++ - + + ++ +
Interventions (and comparisons) well described and appropriate?
+ + + + + ++ ++ ++ ++ ++ + + ++ + + + ++ ++ ++ + ++ + ++ + + +
Allocation concealed? NA ++ NA NA NR ++ ++ NA + + NA NA ++ ++ ++ ++ NA NA NA NR ++ ++ NA ++ ++ ++ Participants and/or investigators blind to exposure and comparison?
NA + NA NA NR NA NA NA NR + - + - + ++ ++ NA NA NA + + + + - + +
Exposure to intervention and comparison adequate?
NA + NA - + + + NA ++ + NA NA + + + + NA NA NA - NR + + - + +
Contamination acceptably low?
NA NR NA - NR + + NA + - NA NA NA ++ NA NA NA NA NA + + + + + ++ NR
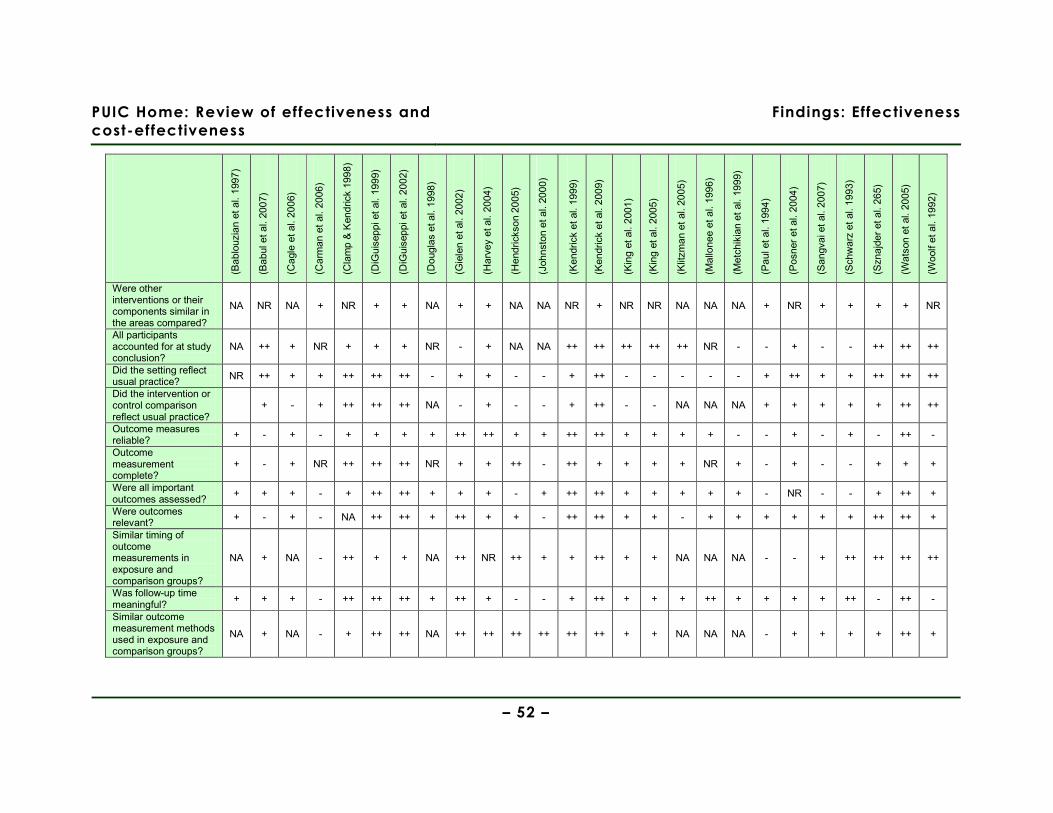
PUIC Home: Review of effectiveness and
cost-effectiveness
Findings: Effectiveness
– 52 –
(Bab
louz
ian
et a
l. 19
97)
(Bab
ul e
t al.
2007
)
(Cag
le e
t al.
2006
)
(Car
man
et
al.
2006
)
(Cla
mp
& K
endr
ick
1998
)
(DiG
uise
ppi e
t al
. 19
99)
(DiG
uise
ppi e
t al
. 20
02)
(Dou
glas
et a
l. 19
98)
(Gie
len
et a
l. 20
02)
(Har
vey
et a
l. 20
04)
(Hen
dric
kson
200
5)
(Joh
nsto
n et
al.
2000
)
(Ken
dric
k et
al.
1999
)
(Ken
dric
k et
al.
2009
)
(Kin
g et
al.
2001
)
(Kin
g et
al.
2005
)
(Klit
zman
et
al. 2
005)
(Mal
lone
e et
al.
1996
)
(Met
chik
ian
et a
l. 19
99)
(Pau
l et a
l. 19
94)
(Pos
ner
et a
l. 20
04)
(San
gvai
et
al. 2
007)
(Sch
war
z et
al.
1993
)
(Szn
ajde
r et
al.
265)
(Wat
son
et a
l. 20
05)
(Woo
lf et
al.
1992
)
Were other interventions or their components similar in the areas compared?
NA NR NA + NR + + NA + + NA NA NR + NR NR NA NA NA + NR + + + + NR
All participants accounted for at study conclusion?
NA ++ + NR + + + NR - + NA NA ++ ++ ++ ++ ++ NR - - + - - ++ ++ ++
Did the setting reflect usual practice?
NR ++ + + ++ ++ ++ - + + - - + ++ - - - - - + ++ + + ++ ++ ++
Did the intervention or control comparison reflect usual practice?
+ - + ++ ++ ++ NA - + - - + ++ - - NA NA NA + + + + + ++ ++
Outcome measures reliable?
+ - + - + + + + ++ ++ + + ++ ++ + + + + - - + - + - ++ -
Outcome measurement complete?
+ - + NR ++ ++ ++ NR + + ++ - ++ + + + + NR + - + - - + + +
Were all important outcomes assessed?
+ + + - + ++ ++ + + + - + ++ ++ + + + + + - NR - - + ++ +
Were outcomes relevant? + - + - NA ++ ++ + ++ + + - ++ ++ + + - + + + + + + ++ ++ +
Similar timing of outcome measurements in exposure and comparison groups?
NA + NA - ++ + + NA ++ NR ++ + + ++ + + NA NA NA - - + ++ ++ ++ ++
Was follow-up time meaningful?
+ + + - ++ ++ ++ + ++ + - - + ++ + + + ++ + + + + ++ - ++ -
Similar outcome measurement methods used in exposure and comparison groups?
NA + NA - + ++ ++ NA ++ ++ ++ ++ ++ ++ + + NA NA NA - + + + + ++ +

PUIC Home: Review of effectiveness and
cost-effectiveness
Findings: Effectiveness
– 53 –
(Bab
louz
ian
et a
l. 19
97)
(Bab
ul e
t al.
2007
)
(Cag
le e
t al.
2006
)
(Car
man
et
al.
2006
)
(Cla
mp
& K
endr
ick
1998
)
(DiG
uise
ppi e
t al
. 19
99)
(DiG
uise
ppi e
t al
. 20
02)
(Dou
glas
et a
l. 19
98)
(Gie
len
et a
l. 20
02)
(Har
vey
et a
l. 20
04)
(Hen
dric
kson
200
5)
(Joh
nsto
n et
al.
2000
)
(Ken
dric
k et
al.
1999
)
(Ken
dric
k et
al.
2009
)
(Kin
g et
al.
2001
)
(Kin
g et
al.
2005
)
(Klit
zman
et
al. 2
005)
(Mal
lone
e et
al.
1996
)
(Met
chik
ian
et a
l. 19
99)
(Pau
l et a
l. 19
94)
(Pos
ner
et a
l. 20
04)
(San
gvai
et
al. 2
007)
(Sch
war
z et
al.
1993
)
(Szn
ajde
r et
al.
265)
(Wat
son
et a
l. 20
05)
(Woo
lf et
al.
1992
)
Exposure and comparison groups similar at baseline? If not, were these adjusted?
NA + NA - + ++ ++ + ++ NR NA NA ++ ++ ++ ++ NA NA NA - + NR + ++ ++ +
Intention to treat analysis?
NA + NA - ++ ++ ++ NA NR NR NA NA + ++ ++ ++ NA NA NA NR ++ NR NA ++ ++ -
Estimates of effect size given or calculable?
NA + NR - NR ++ ++ NR + - ++ + ++ ++ ++ ++ NA NR NA NR NR NR ++ - ++ NR
Analytical methods appropriate?
- ++ + - + ++ ++ + ++ - + + ++ ++ + + + + - - - - ++ + ++ NA
Precision/uncertainty of intervention effects given or calculable? Were they meaningful?
- - NR NR + ++ ++ NR + - - + + ++ + + NR NR NR - + - ++ + ++ +
Was the study sufficiently powered to detect an intervention effect (if one exists)?
NA ++ NA NA ++ NR NR NR + NR NA NA + + + + NA NR NA NR ++ - NR NR + ++
Are the study results internally valid (ie unbiased)?
- + - - ++ ++ ++ + ++ + + + + ++ ++ ++ + + - - ++ - + + ++ +
Are the findings generalisable to the source population (ie externally valid)?
- + - - + ++ ++ - ++ - + - ++ + + + - - - - ++ - + - ++ +
Key: ++ Indicates that for that particular aspect of study design, the study has been designed/conducted in such a way as to minimise the risk of bias + Indicates that either the answer to the checklist question is not clear from the way that the study is reported, or that the study may not have addressed all potential sources of bias for that particular aspect of study design - Indicates aspects of study design in which significant sources of bias may persist NR Not reported NA Not applicable
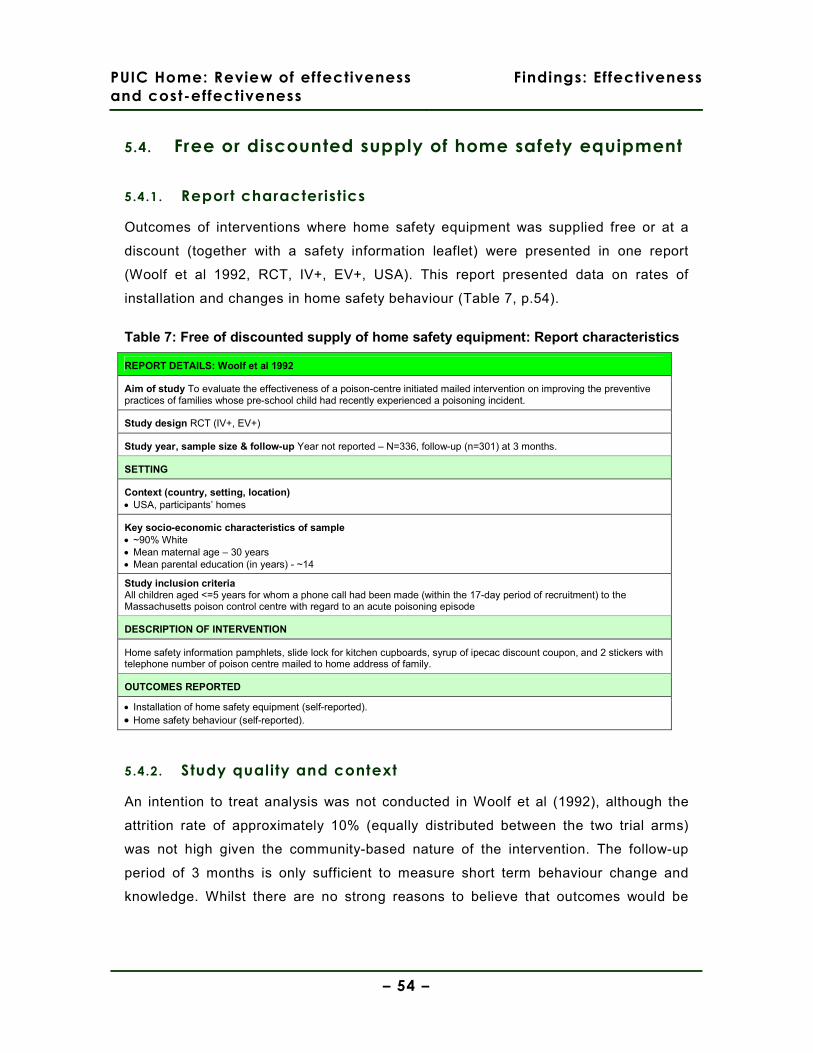
PUIC Home: Review of effectiveness
and cost-effectiveness
Findings: Effectiveness
– 54 –
5.4. Free or discounted supply of home safety equipment
5.4.1. Report characteristics
Outcomes of interventions where home safety equipment was supplied free or at a
discount (together with a safety information leaflet) were presented in one report
(Woolf et al 1992, RCT, IV+, EV+, USA). This report presented data on rates of
installation and changes in home safety behaviour (Table 7, p.54).
Table 7: Free of discounted supply of home safety equipment: Report characteristics
REPORT DETAILS: Woolf et al 1992
Aim of study To evaluate the effectiveness of a poison-centre initiated mailed intervention on improving the preventive practices of families whose pre-school child had recently experienced a poisoning incident.
Study design RCT (IV+, EV+)
Study year, sample size & follow-up Year not reported – N=336, follow-up (n=301) at 3 months.
SETTING
Context (country, setting, location) • USA, participants’ homes
Key socio-economic characteristics of sample • ~90% White • Mean maternal age – 30 years • Mean parental education (in years) - ~14
Study inclusion criteria All children aged <=5 years for whom a phone call had been made (within the 17-day period of recruitment) to the Massachusetts poison control centre with regard to an acute poisoning episode
DESCRIPTION OF INTERVENTION
Home safety information pamphlets, slide lock for kitchen cupboards, syrup of ipecac discount coupon, and 2 stickers with telephone number of poison centre mailed to home address of family.
OUTCOMES REPORTED
• Installation of home safety equipment (self-reported). • Home safety behaviour (self-reported).
5.4.2. Study quality and context
An intention to treat analysis was not conducted in Woolf et al (1992), although the
attrition rate of approximately 10% (equally distributed between the two trial arms)
was not high given the community-based nature of the intervention. The follow-up
period of 3 months is only sufficient to measure short term behaviour change and
knowledge. Whilst there are no strong reasons to believe that outcomes would be
PUIC Home: Review of effectiveness
and cost-effectiveness
Findings: Effectiveness
– 55 –
dissimilar in a UK population, it should be noted that the study sample was
predominantly White, well-educated and of a high socio-economic status.
5.4.3. Findings
Injur ies
The report evaluating the effectiveness of discounted supply of safety equipment did
not present data on injury outcomes.
Installation of home safety equipment
One report (Woolf et al 1992, RCT, IV+, EV+, USA), in which cupboard locks were
mailed free-of-charge to families where a child had recently suffered an acute
poisoning episode, presented data (self-reported) on the installation of this safety
equipment. Participants in the intervention arm were statistically significantly more
likely (p=.001; odds ratio not reported or calculable) to have installed a cupboard lock
than those in the control arm.
Home safety knowledge and behaviour
One report (Woolf et al 1992, RCT, IV+, EV+, USA), in which a safety information
leaflet was included with the mailed safety equipment, presented data (self-reported)
on changes in home safety behaviour. No statistically significant changes in safety
behaviour were found between the intervention and control arms with regard to the
disposal of old medicines, household cleaning products, and poisonous plants; the
storage of all medicines in containers with childproof caps; or of having held a
discussion with the child’s grandparents about poisoning prevention measures that
they could take.

PUIC Home: Review of effectiveness
and cost-effectiveness
Findings: Effectiveness
– 56 –
Evidence statement 1: Free or discounted supply of home safety equipment
There is evidence from 1 RCT (Woolf et al 1992 [+], USA) about interventions with free or
discounted supply of home safety equipment.
This evidence is only partially applicable as it was not conducted in the UK.
Injuries
a. There is no evidence presented on injury outcomes in the report evaluating the free or
discounted supply of home safety equipment (Woolf et al 1992).
Installation of home safety equipment
b. There is weak evidence from 1 RCT (Woolf et al 1992 [+]) to suggest that mailing
cupboard locks free-of-charge (to families where a child had recently experienced a
poisoning incident) had a statistically significant effect on the installation of such locks
(p=.001).
Home safety knowledge and behaviour
c. There is weak evidence from 1 RCT (Woolf et al 1992 [+]) to suggest that the mailing of a
safety information leaflet with free cupboard locks (to families where a child had recently
experienced a poisoning incident) had no statistically significant effect on the home safety
behaviour of parents.
PUIC Home: Review of effectiveness
and cost-effectiveness
Findings: Effectiveness
– 57 –
5.5. Free or discounted supply and installation of smoke
alarms
5.5.1. Report characteristics
Outcomes of interventions where smoke alarms were supplied and installed (where
requested by recipients) were presented in five reports (DiGuiseppi et al 1999; 2002,
cluster RCT, IV++, EV++, UK; Douglas et al 1998, CBA, IV+, EV-, USA); Harvey et al
2004 (Cluster RCT, IV+, EV-, USA; Mallonee et al 1996, CBA, IV+, EV-, USA) (Table
8, p.58). Two studies reported fire-related injuries (DiGuiseppi et al 1999; 2002;
Mallonee et al 1996), three studies reported the installation of home safety equipment
(DiGuiseppi et al 2002; Harvey et al 2004; Mallonee et al 1996), and none reported
home safety knowledge or behaviour. There were no interventions that both supplied
and installed items of home safety equipment other than smoke alarms.
Mallonee et al (1996) reports 48 month follow up of the Okalahoma city intervention.
Although it did not meet the inclusion criteria for this effectiveness review, a cost-
effectiveness study by Haddix et al (2001), which is included in the review of cost-
effectiveness (see section 6, p.133) actually supplies some effectiveness data about
this same intervention after longer follow up, and we report this detail only here.
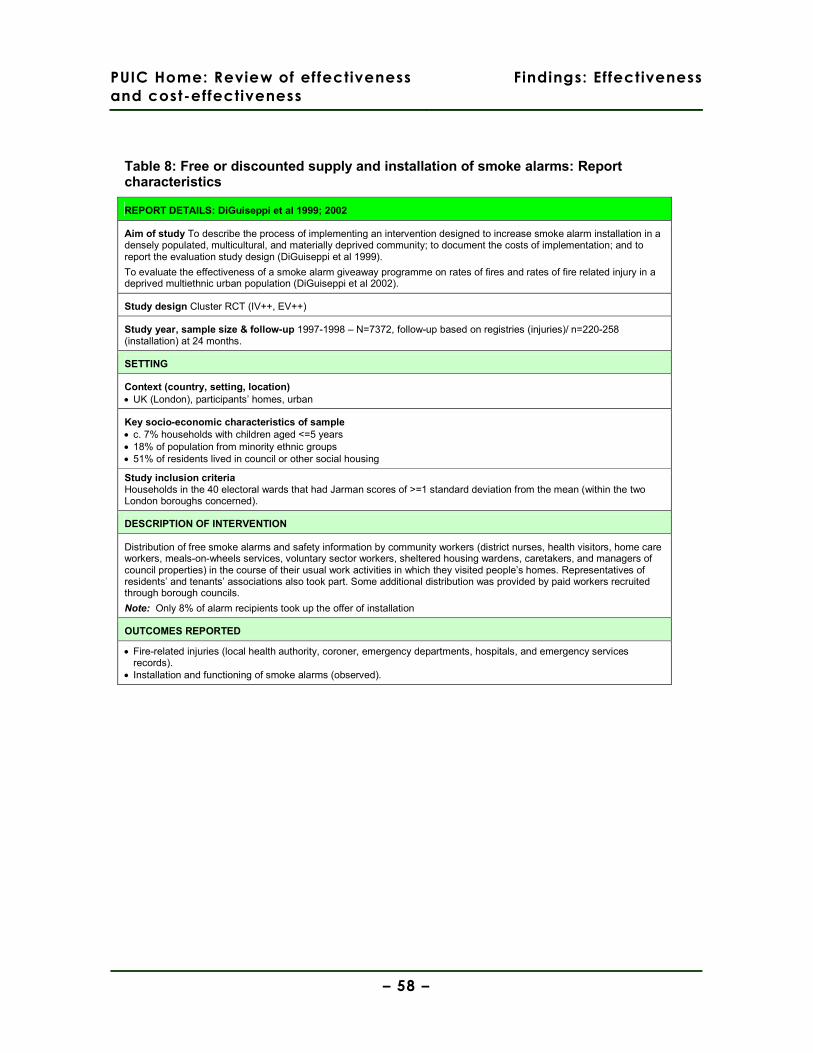
PUIC Home: Review of effectiveness
and cost-effectiveness
Findings: Effectiveness
– 58 –
Table 8: Free or discounted supply and installation of smoke alarms: Report characteristics
REPORT DETAILS: DiGuiseppi et al 1999; 2002
Aim of study To describe the process of implementing an intervention designed to increase smoke alarm installation in a densely populated, multicultural, and materially deprived community; to document the costs of implementation; and to report the evaluation study design (DiGuiseppi et al 1999).
To evaluate the effectiveness of a smoke alarm giveaway programme on rates of fires and rates of fire related injury in a deprived multiethnic urban population (DiGuiseppi et al 2002).
Study design Cluster RCT (IV++, EV++)
Study year, sample size & follow-up 1997-1998 – N=7372, follow-up based on registries (injuries)/ n=220-258 (installation) at 24 months.
SETTING
Context (country, setting, location) • UK (London), participants’ homes, urban
Key socio-economic characteristics of sample • c. 7% households with children aged <=5 years • 18% of population from minority ethnic groups • 51% of residents lived in council or other social housing
Study inclusion criteria Households in the 40 electoral wards that had Jarman scores of >=1 standard deviation from the mean (within the two London boroughs concerned).
DESCRIPTION OF INTERVENTION
Distribution of free smoke alarms and safety information by community workers (district nurses, health visitors, home care workers, meals-on-wheels services, voluntary sector workers, sheltered housing wardens, caretakers, and managers of council properties) in the course of their usual work activities in which they visited people’s homes. Representatives of residents’ and tenants’ associations also took part. Some additional distribution was provided by paid workers recruited through borough councils.
Note: Only 8% of alarm recipients took up the offer of installation
OUTCOMES REPORTED
• Fire-related injuries (local health authority, coroner, emergency departments, hospitals, and emergency services records).
• Installation and functioning of smoke alarms (observed).
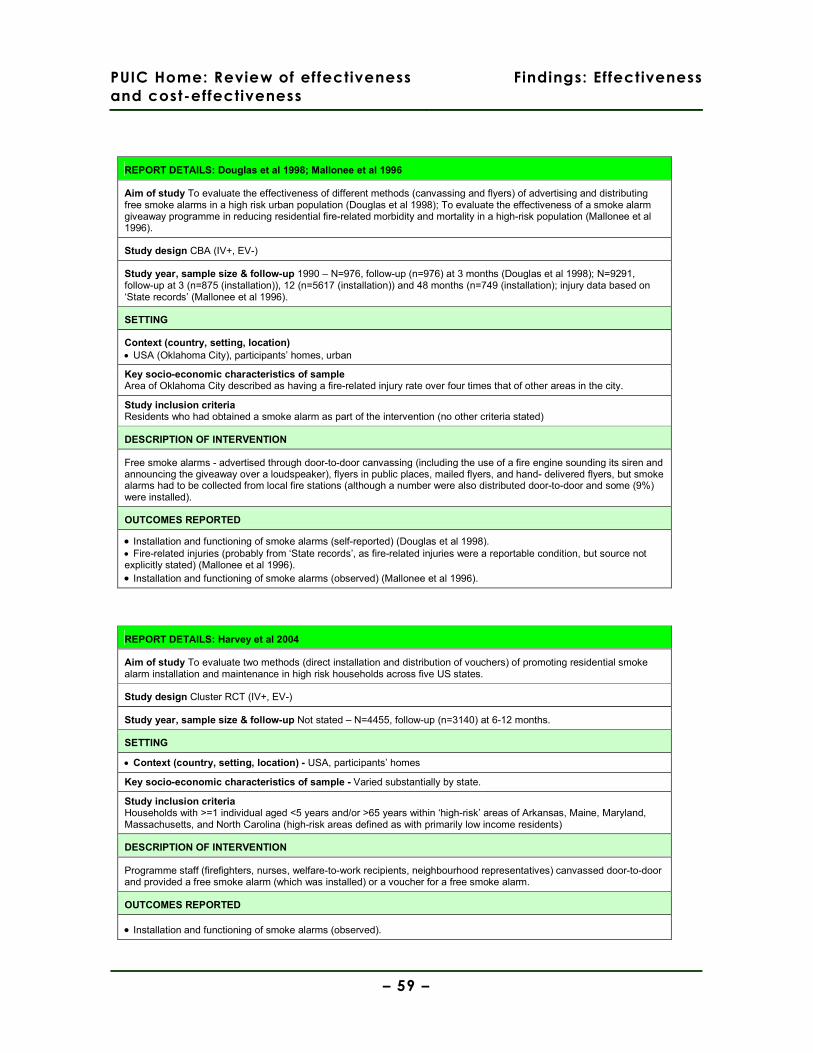
PUIC Home: Review of effectiveness
and cost-effectiveness
Findings: Effectiveness
– 59 –
REPORT DETAILS: Douglas et al 1998; Mallonee et al 1996
Aim of study To evaluate the effectiveness of different methods (canvassing and flyers) of advertising and distributing free smoke alarms in a high risk urban population (Douglas et al 1998); To evaluate the effectiveness of a smoke alarm giveaway programme in reducing residential fire-related morbidity and mortality in a high-risk population (Mallonee et al 1996).
Study design CBA (IV+, EV-)
Study year, sample size & follow-up 1990 – N=976, follow-up (n=976) at 3 months (Douglas et al 1998); N=9291, follow-up at 3 (n=875 (installation)), 12 (n=5617 (installation)) and 48 months (n=749 (installation); injury data based on ‘State records’ (Mallonee et al 1996).
SETTING
Context (country, setting, location) • USA (Oklahoma City), participants’ homes, urban
Key socio-economic characteristics of sample Area of Oklahoma City described as having a fire-related injury rate over four times that of other areas in the city.
Study inclusion criteria Residents who had obtained a smoke alarm as part of the intervention (no other criteria stated)
DESCRIPTION OF INTERVENTION
Free smoke alarms - advertised through door-to-door canvassing (including the use of a fire engine sounding its siren and announcing the giveaway over a loudspeaker), flyers in public places, mailed flyers, and hand- delivered flyers, but smoke alarms had to be collected from local fire stations (although a number were also distributed door-to-door and some (9%) were installed).
OUTCOMES REPORTED
• Installation and functioning of smoke alarms (self-reported) (Douglas et al 1998). • Fire-related injuries (probably from ‘State records’, as fire-related injuries were a reportable condition, but source not explicitly stated) (Mallonee et al 1996). • Installation and functioning of smoke alarms (observed) (Mallonee et al 1996).
REPORT DETAILS: Harvey et al 2004
Aim of study To evaluate two methods (direct installation and distribution of vouchers) of promoting residential smoke alarm installation and maintenance in high risk households across five US states.
Study design Cluster RCT (IV+, EV-)
Study year, sample size & follow-up Not stated – N=4455, follow-up (n=3140) at 6-12 months.
SETTING
• Context (country, setting, location) - USA, participants’ homes
Key socio-economic characteristics of sample - Varied substantially by state.
Study inclusion criteria Households with >=1 individual aged <5 years and/or >65 years within ‘high-risk’ areas of Arkansas, Maine, Maryland, Massachusetts, and North Carolina (high-risk areas defined as with primarily low income residents)
DESCRIPTION OF INTERVENTION
Programme staff (firefighters, nurses, welfare-to-work recipients, neighbourhood representatives) canvassed door-to-door and provided a free smoke alarm (which was installed) or a voucher for a free smoke alarm.
OUTCOMES REPORTED
• Installation and functioning of smoke alarms (observed).
PUIC Home: Review of effectiveness
and cost-effectiveness
Findings: Effectiveness
– 60 –
5.5.2. Study quality and context
The study reported by DiGuiseppi et al (1999; 2002, UK) was conducted to a high
standard; random allocation to intervention and control groups was conducted by an
independent statistician, balance in key socio-economic characteristics between
these groups was attained and reported, and details of the intervention were clearly
documented. Whilst the difficulties of rigorously evaluating a large-scale public
intervention should be acknowledged, the study by Mallonee et al (1996, USA) was
not conducted to a similar standard; for example, analyses were not adjusted for
differences in important socio-economic characteristics or changes in contributory
behavioural factors during the course of the evaluation. This may be of particular
significance in view of the distinctive nature of the intervention area at baseline,
where 47% of fires (compared with 8% in the remainder of Oklahoma city) were
identified as resulting from children playing with fire.
The manner in which distribution of smoke alarms took place differed considerably
between the UK study (DiGuiseppi et al 1999; 2002) and the USA study (Mallonee et
al 1996). Whilst both interventions endeavoured to involve community groups in the
process, there were some important differences in how this was done. In the
DiGuiseppi et al study (1999; 2002) the focus was more upon door-to-door
canvassing by a range of community professionals and volunteers. However, in the
Mallonee et al study (1996), whilst door-to-door canvassing was used, the
intervention was largely promoted and implemented by members of the fire service
driving a decommissioned fire engine through the streets, sounding a siren and
encouraging residents to come out and collect a free smoke alarm. In both studies,
the actual uptake of the offer to install the free smoke alarm was low (DiGuiseppi et al
– 8%; Mallonee et al – 6%).
The study conducted by DiGuiseppi et al (1999; 2002) took place in socially-deprived,
multiethnic populations in London for which detailed socio-economic characteristics
were summarised that can inform judgements about applicability in other UK
contexts. Whilst it is noted by Mallonee et al (1996) that households in the
intervention area had a lower median income and a poorer quality of housing than in
the remainder of the city, no further details are provided.

PUIC Home: Review of effectiveness
and cost-effectiveness
Findings: Effectiveness
– 61 –
The lack of analyses adjusted for differences in baseline characteristics of
participants places limits on the usefulness of the findings reported by Harvey et al
(2004, USA). This is compounded by the aggregation of findings across all five states
in the reporting of the intervention vs. control odds ratio. In the absence of the
reporting of data that would allow a more stratified analysis that could potentially
show important differences in effectiveness (related to the different characteristics of
the sample in each of the five states), it is very difficult to comment upon the
applicability of the findings. The authors also note some potentially important
differences in the ways that the intervention was delivered in the five states, but
again these cannot be further investigated due to the aggregation of data.
The study by Douglas et al (1998, USA) is substantially limited by the short timeframe
(one month post-intervention) in which outcomes were measured and descriptive data
only being reported. The authors acknowledge that the method of evaluation
(telephone survey) may have resulted in an over-estimation of functioning smoke
alarms; for example, respondents’ belief that they had correctly installed the smoke
alarms may not have actually been the case.
5.5.3. Findings
Injuries
Two of the five reports (DiGuiseppi et al 2002, cluster RCT, IV++, EV++; Mallonee et
al 1996, CBA, IV+, EV-) presented data on fire-related injuries where interventions
had distributed smoke alarms in London, UK (DiGuiseppi et al 2002) and Oklahoma
City, USA (Mallonee et al 1996) (Table 9, p.62).
DiGuiseppi et al (2002) reported an adjusted rate ratio (based on local health
authority, hospital and other records) for intervention vs. control groups. This
favoured the intervention, but was statistically non-significant for both minor and
major injuries (including mortalities) that were identified as having been likely to have
been preventable with an installed and functioning smoke alarm.
Mallonee et al (1996) reported unadjusted annual injury rates (likely, although not
explicitly stated, to have been based on State records) in the intervention area that
showed a dramatic post-intervention decrease, whereas injury rates in other areas of
the city remained broadly unchanged. The report’s authors calculated an incidence-
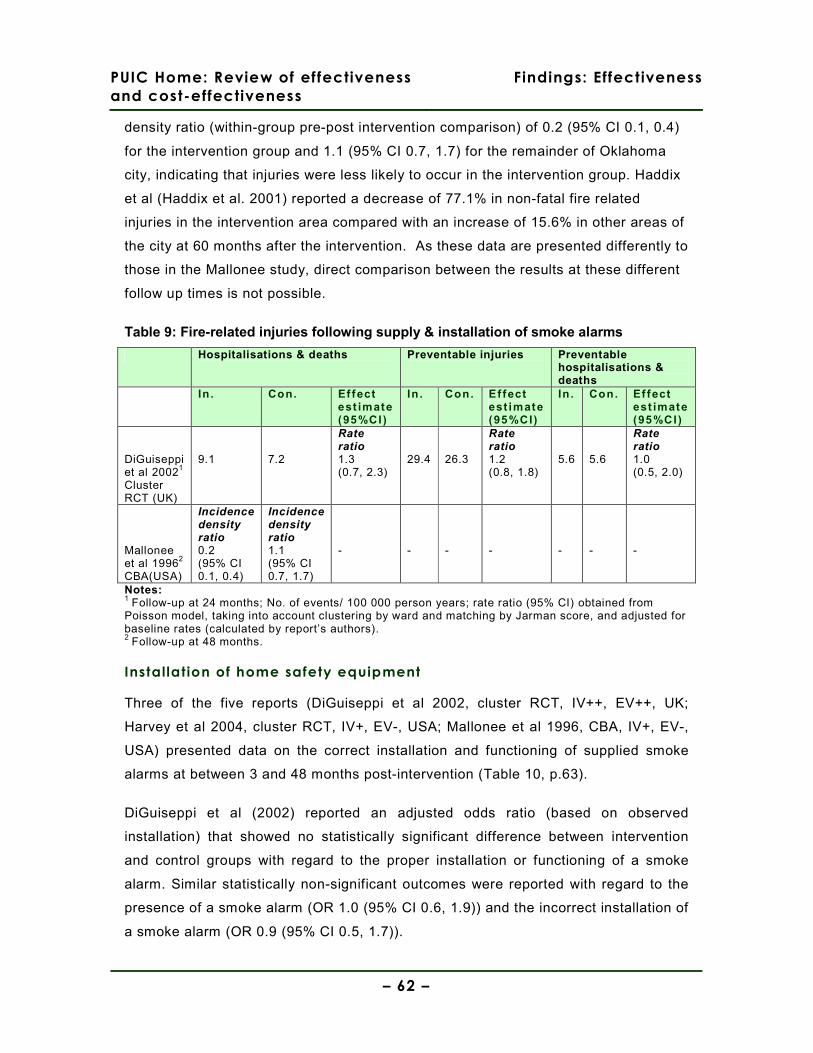
PUIC Home: Review of effectiveness
and cost-effectiveness
Findings: Effectiveness
– 62 –
density ratio (within-group pre-post intervention comparison) of 0.2 (95% CI 0.1, 0.4)
for the intervention group and 1.1 (95% CI 0.7, 1.7) for the remainder of Oklahoma
city, indicating that injuries were less likely to occur in the intervention group. Haddix
et al (Haddix et al. 2001) reported a decrease of 77.1% in non-fatal fire related
injuries in the intervention area compared with an increase of 15.6% in other areas of
the city at 60 months after the intervention. As these data are presented differently to
those in the Mallonee study, direct comparison between the results at these different
follow up times is not possible.
Table 9: Fire-related injuries following supply & installation of smoke alarms
Hospitalisations & deaths Preventable injuries Preventable hospitalisations & deaths
In . Con. Ef fect est imate (95%CI)
In . Con. Ef fect est imate (95%CI)
In . Con. Ef fect est imate (95%CI)
DiGuiseppi et al 20021
Cluster RCT (UK)
9.1
7.2
Rate ratio 1.3 (0.7, 2.3)
29.4
26.3
Rate ratio 1.2 (0.8, 1.8)
5.6
5.6
Rate ratio 1.0 (0.5, 2.0)
Mallonee et al 19962
CBA(USA)
Incidence density ratio 0.2 (95% CI 0.1, 0.4)
Incidence density ratio 1.1 (95% CI 0.7, 1.7)
-
-
-
-
-
-
-
Notes: 1 Follow-up at 24 months; No. of events/ 100 000 person years; rate ratio (95% CI) obtained from Poisson model, taking into account clustering by ward and matching by Jarman score, and adjusted for baseline rates (calculated by report’s authors). 2 Follow-up at 48 months.
Installation of home safety equipment
Three of the five reports (DiGuiseppi et al 2002, cluster RCT, IV++, EV++, UK;
Harvey et al 2004, cluster RCT, IV+, EV-, USA; Mallonee et al 1996, CBA, IV+, EV-,
USA) presented data on the correct installation and functioning of supplied smoke
alarms at between 3 and 48 months post-intervention (Table 10, p.63).
DiGuiseppi et al (2002) reported an adjusted odds ratio (based on observed
installation) that showed no statistically significant difference between intervention
and control groups with regard to the proper installation or functioning of a smoke
alarm. Similar statistically non-significant outcomes were reported with regard to the
presence of a smoke alarm (OR 1.0 (95% CI 0.6, 1.9)) and the incorrect installation of
a smoke alarm (OR 0.9 (95% CI 0.5, 1.7)).
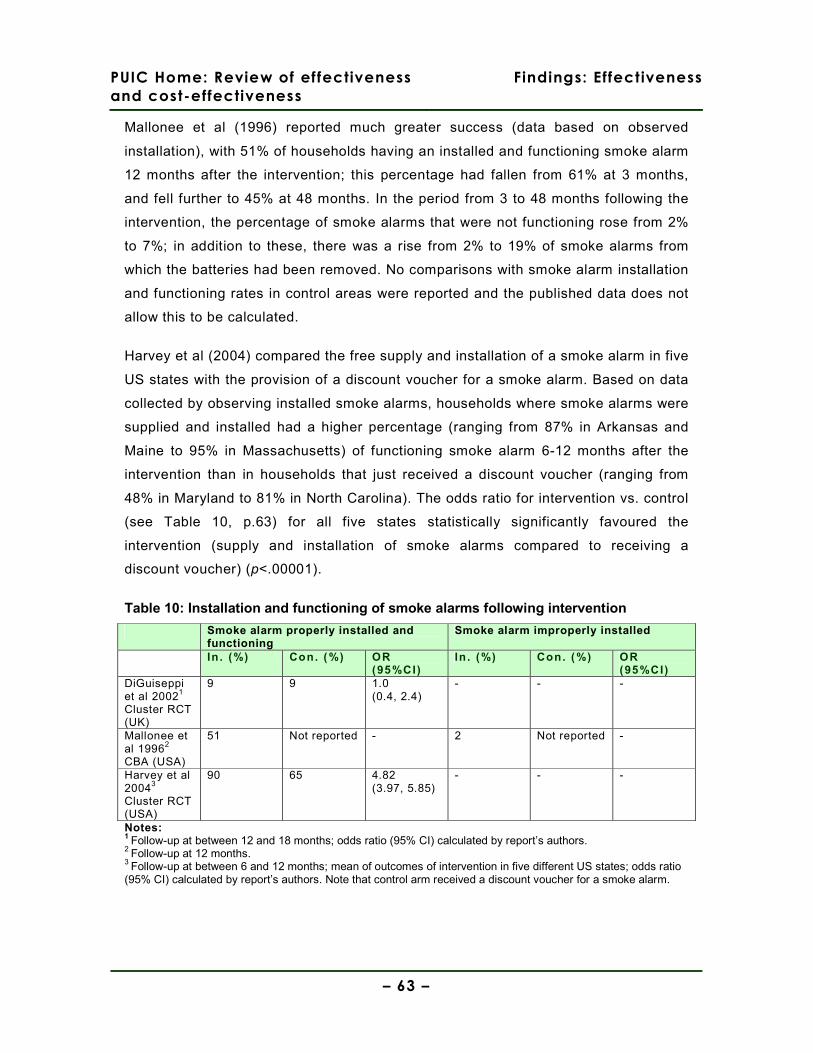
PUIC Home: Review of effectiveness
and cost-effectiveness
Findings: Effectiveness
– 63 –
Mallonee et al (1996) reported much greater success (data based on observed
installation), with 51% of households having an installed and functioning smoke alarm
12 months after the intervention; this percentage had fallen from 61% at 3 months,
and fell further to 45% at 48 months. In the period from 3 to 48 months following the
intervention, the percentage of smoke alarms that were not functioning rose from 2%
to 7%; in addition to these, there was a rise from 2% to 19% of smoke alarms from
which the batteries had been removed. No comparisons with smoke alarm installation
and functioning rates in control areas were reported and the published data does not
allow this to be calculated.
Harvey et al (2004) compared the free supply and installation of a smoke alarm in five
US states with the provision of a discount voucher for a smoke alarm. Based on data
collected by observing installed smoke alarms, households where smoke alarms were
supplied and installed had a higher percentage (ranging from 87% in Arkansas and
Maine to 95% in Massachusetts) of functioning smoke alarm 6-12 months after the
intervention than in households that just received a discount voucher (ranging from
48% in Maryland to 81% in North Carolina). The odds ratio for intervention vs. control
(see Table 10, p.63) for all five states statistically significantly favoured the
intervention (supply and installation of smoke alarms compared to receiving a
discount voucher) (p<.00001).
Table 10: Installation and functioning of smoke alarms following intervention
Smoke alarm properly installed and functioning
Smoke alarm improperly installed
In . (%) Con. (%) OR (95%CI)
In . (%) Con. (%) OR (95%CI)
DiGuiseppi et al 20021
Cluster RCT (UK)
9 9 1.0 (0.4, 2.4)
- - -
Mallonee et al 19962
CBA (USA)
51 Not reported - 2 Not reported -
Harvey et al 20043
Cluster RCT (USA)
90 65 4.82 (3.97, 5.85)
- - -
Notes: 1 Follow-up at between 12 and 18 months; odds ratio (95% CI) calculated by report’s authors. 2 Follow-up at 12 months. 3 Follow-up at between 6 and 12 months; mean of outcomes of intervention in five different US states; odds ratio (95% CI) calculated by report’s authors. Note that control arm received a discount voucher for a smoke alarm.
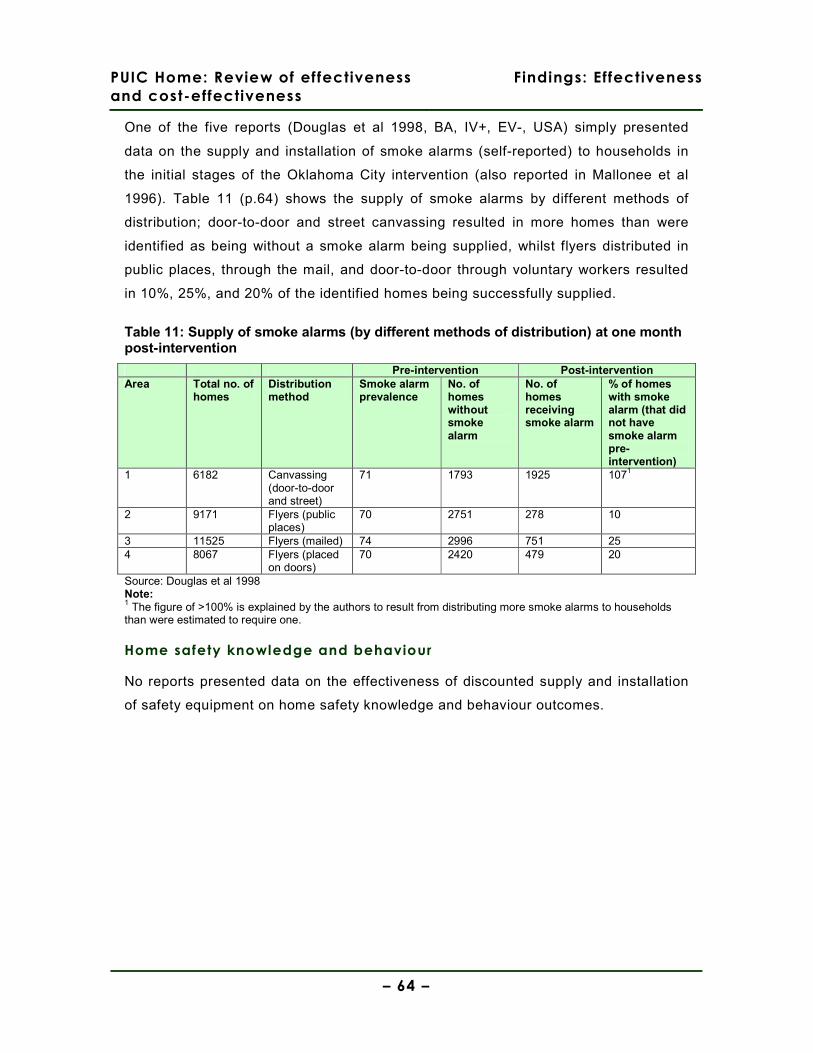
PUIC Home: Review of effectiveness
and cost-effectiveness
Findings: Effectiveness
– 64 –
One of the five reports (Douglas et al 1998, BA, IV+, EV-, USA) simply presented
data on the supply and installation of smoke alarms (self-reported) to households in
the initial stages of the Oklahoma City intervention (also reported in Mallonee et al
1996). Table 11 (p.64) shows the supply of smoke alarms by different methods of
distribution; door-to-door and street canvassing resulted in more homes than were
identified as being without a smoke alarm being supplied, whilst flyers distributed in
public places, through the mail, and door-to-door through voluntary workers resulted
in 10%, 25%, and 20% of the identified homes being successfully supplied.
Table 11: Supply of smoke alarms (by different methods of distribution) at one month post-intervention
Pre-intervention Post-intervention Area Total no. of
homes Distribution method
Smoke alarm prevalence
No. of homes without smoke alarm
No. of homes receiving smoke alarm
% of homes with smoke alarm (that did not have smoke alarm pre-intervention)
1 6182 Canvassing (door-to-door and street)
71 1793 1925 1071
2 9171 Flyers (public places)
70 2751 278 10
3 11525 Flyers (mailed) 74 2996 751 25 4 8067 Flyers (placed
on doors) 70 2420 479 20
Source: Douglas et al 1998 Note: 1 The figure of >100% is explained by the authors to result from distributing more smoke alarms to households than were estimated to require one.
Home safety knowledge and behaviour
No reports presented data on the effectiveness of discounted supply and installation
of safety equipment on home safety knowledge and behaviour outcomes.
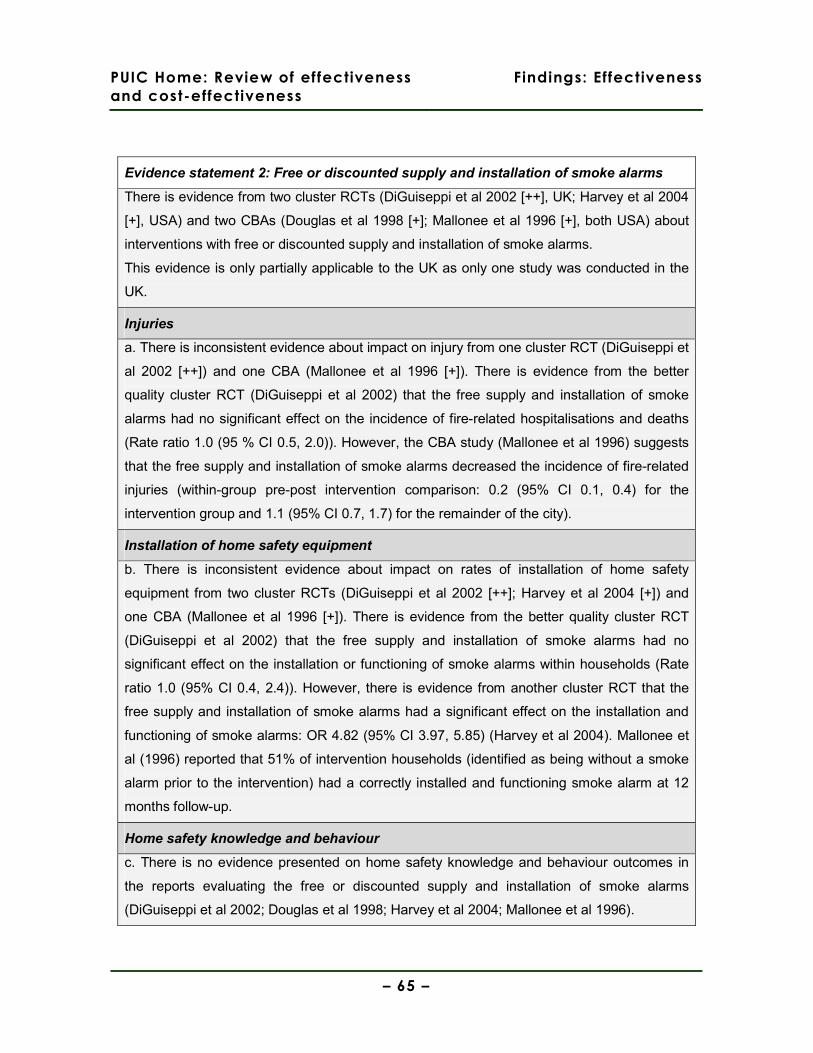
PUIC Home: Review of effectiveness
and cost-effectiveness
Findings: Effectiveness
– 65 –
Evidence statement 2: Free or discounted supply and installation of smoke alarms
There is evidence from two cluster RCTs (DiGuiseppi et al 2002 [++], UK; Harvey et al 2004
[+], USA) and two CBAs (Douglas et al 1998 [+]; Mallonee et al 1996 [+], both USA) about
interventions with free or discounted supply and installation of smoke alarms.
This evidence is only partially applicable to the UK as only one study was conducted in the
UK.
Injuries
a. There is inconsistent evidence about impact on injury from one cluster RCT (DiGuiseppi et
al 2002 [++]) and one CBA (Mallonee et al 1996 [+]). There is evidence from the better
quality cluster RCT (DiGuiseppi et al 2002) that the free supply and installation of smoke
alarms had no significant effect on the incidence of fire-related hospitalisations and deaths
(Rate ratio 1.0 (95 % CI 0.5, 2.0)). However, the CBA study (Mallonee et al 1996) suggests
that the free supply and installation of smoke alarms decreased the incidence of fire-related
injuries (within-group pre-post intervention comparison: 0.2 (95% CI 0.1, 0.4) for the
intervention group and 1.1 (95% CI 0.7, 1.7) for the remainder of the city).
Installation of home safety equipment
b. There is inconsistent evidence about impact on rates of installation of home safety
equipment from two cluster RCTs (DiGuiseppi et al 2002 [++]; Harvey et al 2004 [+]) and
one CBA (Mallonee et al 1996 [+]). There is evidence from the better quality cluster RCT
(DiGuiseppi et al 2002) that the free supply and installation of smoke alarms had no
significant effect on the installation or functioning of smoke alarms within households (Rate
ratio 1.0 (95% CI 0.4, 2.4)). However, there is evidence from another cluster RCT that the
free supply and installation of smoke alarms had a significant effect on the installation and
functioning of smoke alarms: OR 4.82 (95% CI 3.97, 5.85) (Harvey et al 2004). Mallonee et
al (1996) reported that 51% of intervention households (identified as being without a smoke
alarm prior to the intervention) had a correctly installed and functioning smoke alarm at 12
months follow-up.
Home safety knowledge and behaviour
c. There is no evidence presented on home safety knowledge and behaviour outcomes in
the reports evaluating the free or discounted supply and installation of smoke alarms
(DiGuiseppi et al 2002; Douglas et al 1998; Harvey et al 2004; Mallonee et al 1996).
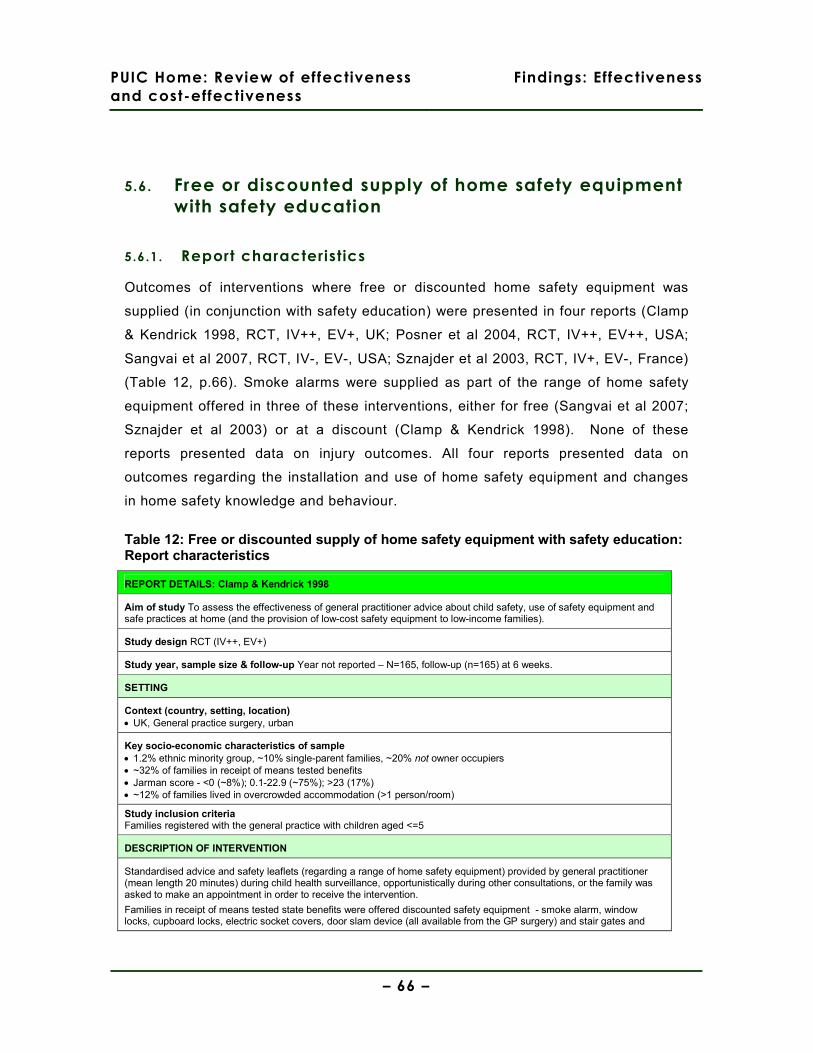
PUIC Home: Review of effectiveness
and cost-effectiveness
Findings: Effectiveness
– 66 –
5.6. Free or discounted supply of home safety equipment
with safety education
5.6.1. Report characteristics
Outcomes of interventions where free or discounted home safety equipment was
supplied (in conjunction with safety education) were presented in four reports (Clamp
& Kendrick 1998, RCT, IV++, EV+, UK; Posner et al 2004, RCT, IV++, EV++, USA;
Sangvai et al 2007, RCT, IV-, EV-, USA; Sznajder et al 2003, RCT, IV+, EV-, France)
(Table 12, p.66). Smoke alarms were supplied as part of the range of home safety
equipment offered in three of these interventions, either for free (Sangvai et al 2007;
Sznajder et al 2003) or at a discount (Clamp & Kendrick 1998). None of these
reports presented data on injury outcomes. All four reports presented data on
outcomes regarding the installation and use of home safety equipment and changes
in home safety knowledge and behaviour.
Table 12: Free or discounted supply of home safety equipment with safety education: Report characteristics
REPORT DETAILS: Clamp & Kendrick 1998
Aim of study To assess the effectiveness of general practitioner advice about child safety, use of safety equipment and safe practices at home (and the provision of low-cost safety equipment to low-income families).
Study design RCT (IV++, EV+)
Study year, sample size & follow-up Year not reported – N=165, follow-up (n=165) at 6 weeks.
SETTING
Context (country, setting, location) • UK, General practice surgery, urban
Key socio-economic characteristics of sample • 1.2% ethnic minority group, ~10% single-parent families, ~20% not owner occupiers • ~32% of families in receipt of means tested benefits • Jarman score - <0 (~8%); 0.1-22.9 (~75%); >23 (17%) • ~12% of families lived in overcrowded accommodation (>1 person/room)
Study inclusion criteria Families registered with the general practice with children aged <=5
DESCRIPTION OF INTERVENTION
Standardised advice and safety leaflets (regarding a range of home safety equipment) provided by general practitioner (mean length 20 minutes) during child health surveillance, opportunistically during other consultations, or the family was asked to make an appointment in order to receive the intervention.
Families in receipt of means tested state benefits were offered discounted safety equipment - smoke alarm, window locks, cupboard locks, electric socket covers, door slam device (all available from the GP surgery) and stair gates and
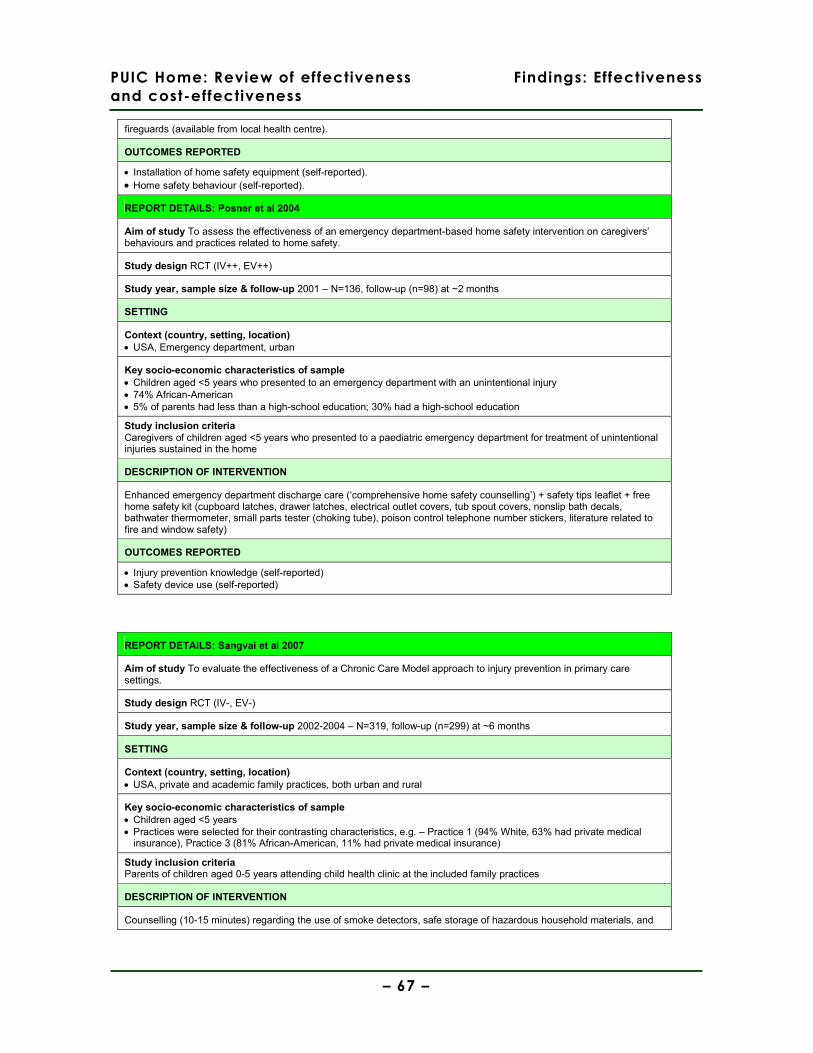
PUIC Home: Review of effectiveness
and cost-effectiveness
Findings: Effectiveness
– 67 –
fireguards (available from local health centre).
OUTCOMES REPORTED
• Installation of home safety equipment (self-reported). • Home safety behaviour (self-reported).
REPORT DETAILS: Posner et al 2004
Aim of study To assess the effectiveness of an emergency department-based home safety intervention on caregivers’ behaviours and practices related to home safety.
Study design RCT (IV++, EV++)
Study year, sample size & follow-up 2001 – N=136, follow-up (n=98) at ~2 months
SETTING
Context (country, setting, location) • USA, Emergency department, urban
Key socio-economic characteristics of sample • Children aged <5 years who presented to an emergency department with an unintentional injury • 74% African-American • 5% of parents had less than a high-school education; 30% had a high-school education
Study inclusion criteria Caregivers of children aged <5 years who presented to a paediatric emergency department for treatment of unintentional injuries sustained in the home
DESCRIPTION OF INTERVENTION
Enhanced emergency department discharge care (‘comprehensive home safety counselling’) + safety tips leaflet + free home safety kit (cupboard latches, drawer latches, electrical outlet covers, tub spout covers, nonslip bath decals, bathwater thermometer, small parts tester (choking tube), poison control telephone number stickers, literature related to fire and window safety)
OUTCOMES REPORTED
• Injury prevention knowledge (self-reported) • Safety device use (self-reported)
REPORT DETAILS: Sangvai et al 2007
Aim of study To evaluate the effectiveness of a Chronic Care Model approach to injury prevention in primary care settings.
Study design RCT (IV-, EV-)
Study year, sample size & follow-up 2002-2004 – N=319, follow-up (n=299) at ~6 months
SETTING
Context (country, setting, location) • USA, private and academic family practices, both urban and rural
Key socio-economic characteristics of sample • Children aged <5 years • Practices were selected for their contrasting characteristics, e.g. – Practice 1 (94% White, 63% had private medical
insurance), Practice 3 (81% African-American, 11% had private medical insurance)
Study inclusion criteria Parents of children aged 0-5 years attending child health clinic at the included family practices
DESCRIPTION OF INTERVENTION
Counselling (10-15 minutes) regarding the use of smoke detectors, safe storage of hazardous household materials, and
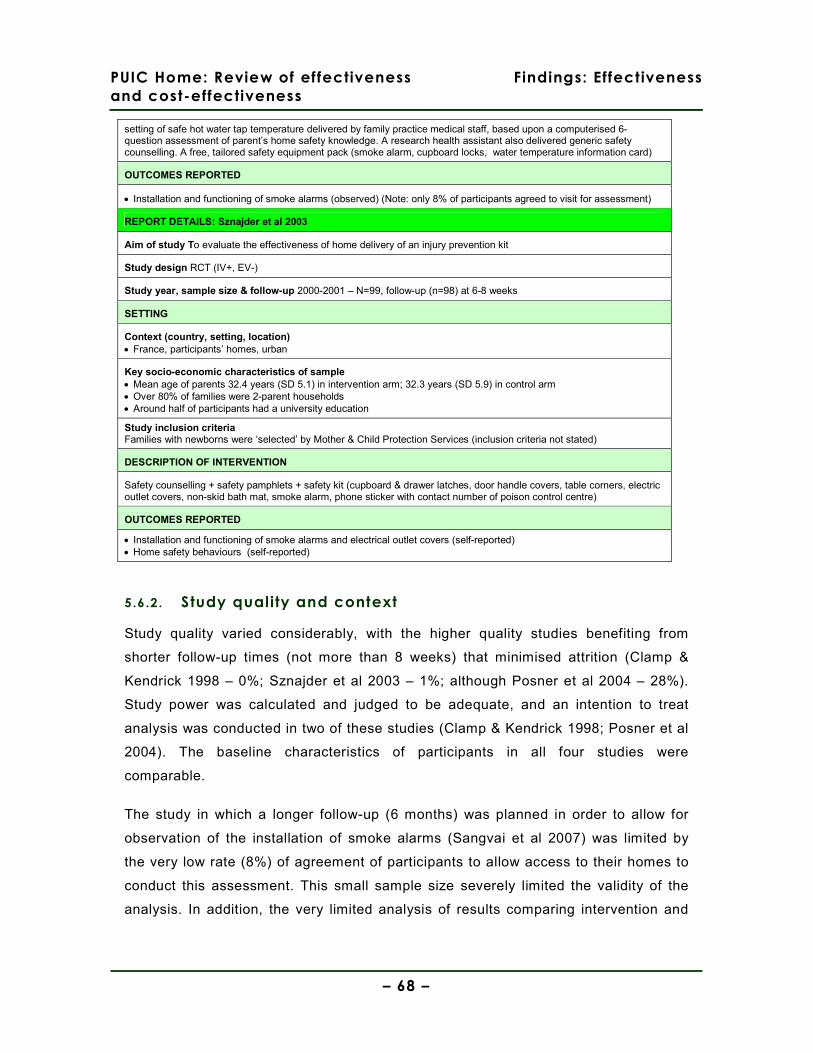
PUIC Home: Review of effectiveness
and cost-effectiveness
Findings: Effectiveness
– 68 –
setting of safe hot water tap temperature delivered by family practice medical staff, based upon a computerised 6-question assessment of parent’s home safety knowledge. A research health assistant also delivered generic safety counselling. A free, tailored safety equipment pack (smoke alarm, cupboard locks, water temperature information card)
OUTCOMES REPORTED
• Installation and functioning of smoke alarms (observed) (Note: only 8% of participants agreed to visit for assessment)
REPORT DETAILS: Sznajder et al 2003
Aim of study To evaluate the effectiveness of home delivery of an injury prevention kit
Study design RCT (IV+, EV-)
Study year, sample size & follow-up 2000-2001 – N=99, follow-up (n=98) at 6-8 weeks
SETTING
Context (country, setting, location) • France, participants’ homes, urban
Key socio-economic characteristics of sample • Mean age of parents 32.4 years (SD 5.1) in intervention arm; 32.3 years (SD 5.9) in control arm • Over 80% of families were 2-parent households • Around half of participants had a university education
Study inclusion criteria Families with newborns were ‘selected’ by Mother & Child Protection Services (inclusion criteria not stated)
DESCRIPTION OF INTERVENTION
Safety counselling + safety pamphlets + safety kit (cupboard & drawer latches, door handle covers, table corners, electric outlet covers, non-skid bath mat, smoke alarm, phone sticker with contact number of poison control centre)
OUTCOMES REPORTED
• Installation and functioning of smoke alarms and electrical outlet covers (self-reported) • Home safety behaviours (self-reported)
5.6.2. Study quality and context
Study quality varied considerably, with the higher quality studies benefiting from
shorter follow-up times (not more than 8 weeks) that minimised attrition (Clamp &
Kendrick 1998 – 0%; Sznajder et al 2003 – 1%; although Posner et al 2004 – 28%).
Study power was calculated and judged to be adequate, and an intention to treat
analysis was conducted in two of these studies (Clamp & Kendrick 1998; Posner et al
2004). The baseline characteristics of participants in all four studies were
comparable.
The study in which a longer follow-up (6 months) was planned in order to allow for
observation of the installation of smoke alarms (Sangvai et al 2007) was limited by
the very low rate (8%) of agreement of participants to allow access to their homes to
conduct this assessment. This small sample size severely limited the validity of the
analysis. In addition, the very limited analysis of results comparing intervention and
PUIC Home: Review of effectiveness
and cost-effectiveness
Findings: Effectiveness
– 69 –
control groups in Sangvai et al (2007) raises the possibility of reporting bias. Of the
three studies with a shorter follow-up period (6-8 weeks), only Sznajder et al (2003)
directly observed the installation of home safety equipment rather than relying upon
participants’ self-report. However, Clamp & Kendrick (1998) did conduct a small
random sample of home visits (n=10 from each of the intervention and control
groups), reporting ‘high concordance’ between self-reported and actual behaviours5.
The nature of the interventions delivered also varied considerably in terms of the
manner in which the home safety equipment was supplied and the context in which
the educational information was delivered. The educational intervention was delivered
by medical staff in a primary care setting in two studies (Clamp & Kendrick 1998;
Sangvai et al 2007), whilst one was delivered as part of an emergency department’s
discharge care (following the treatment of a child for an injury) (Posner et al 2004),
and one was delivered in participants’ homes by health professionals (Sznajder et al
2003). The home safety equipment supplied was limited to safety latches and smoke
alarms in the study reported by Sangvai et al (2003). A much wider range of
equipment was provided in the other studies (Clamp & Kendrick 1998; Posner et al
2004; Sznajder et al 2003), although it should be noted that the safety equipment was
not available free of charge in the Clamp & Kendrick (1998) study; rather, it was
available at a discount and also required collection from the GP surgery.
All of the studies reported an educational intervention of approximately 15-20 minutes
duration, but the exact manner in which the intervention was delivered and its
contents (beyond broadly discussing home safety and the use of home safety
equipment) are not detailed any further in any of the four reports.
The study by Clamp & Kendrick (1998) was conducted in a socially-deprived, urban
setting in the UK (see details in Table 12, p.66) that allows the application of the
study’s findings to other similar settings in the UK to be made. Posner et al’s (2004)
5 Kappa coefficients for consistency of responses to questionnaire and observed safety equipment use were 1 (for 21 questions), 0.75-0.99 (for 5 questions), 0.59-0.74 (for 6 questions), and <0.60 (for 4 questions). The areas of home safety behaviours for which higher and lower κ coefficients were obtained is not noted, except for the lowest (storage of sharp objects in the kitchen (κ=0.49) and use of electrical socket covers (κ=0.33)).
PUIC Home: Review of effectiveness
and cost-effectiveness
Findings: Effectiveness
– 70 –
study was conducted in an urban USA setting with a majority African-American
population, and the study’s findings may be applicable to other similar areas. Despite
the efforts reported by Sznajder et al (2003) to recruit a sample that included socio-
economically deprived groups, over 60% of participants were in salaried occupations
and more than half had a university education; this limits the applicability of the
study’s findings to similar socio-economically advantaged groups.
5.6.3. Results
Injuries
No studies evaluating the effectiveness of discounted supply of safety equipment with
safety education reported injury outcomes.
Installation of home safety equipment
All four of the reports (Clamp & Kendrick 1998, RCT, IV++, EV+, UK; Posner et al
2004, RCT, IV++, EV++, USA; Sangvai et al 2007, RCT, IV-, EV-, USA; Sznajder et al
2003, RCT, IV+, EV-, France) presented data on the installation (Table 13, p.72) and
use of home safety equipment (Table 14, p.73). Three of these four reports Clamp &
Kendrick 1998; Posner et al 2004; Sznajder et al 2003) used upon parents’ self-report
to assess installation and use; the one report that attempted to observe installation
and use (Sangvai et al 2007) only attained agreement from 8% of participants for
follow-up (n=13).
A consistent and statistically significant difference that favoured the intervention
group in the installation of smoke alarms was presented in three of the four reports
(Clamp & Kendrick 1998; Sangvai et al 2007; Sznajder et al 2003), although it should
be noted that the confidence interval around the odds ratio was extremely wide in one
study (Sangvai et al 2007).
Two of the four reports presented mixed results regarding the rate of use of locks on
cupboards containing cleaning products, one reporting results that statistically
significantly favoured the intervention group (Clamp & Kendrick 1998) and another
reporting no statistically significant difference (Sznajder et al 2003). The use of locks
on cupboards containing medicines post-intervention showed a consistent but
statistically non-significant difference between intervention and control groups (Clamp
PUIC Home: Review of effectiveness
and cost-effectiveness
Findings: Effectiveness
– 71 –
& Kendrick 1998; Sznajder et al 2003), although the confidence interval around the
odds ratio was wide in the latter study.
One of the four reports presented data on the rates of installation of stair gates and
window catches; no statistically significant differences between intervention and
control groups were found (Clamp & Kendrick 1998).
Posner et al (2004) reported a statistically significant difference (p<.001) between
intervention and control groups that favoured the intervention in the installation of a
wide range of supplied safety equipment (including safety latches, electrical outlet
covers, and non-slip bathroom items). However, it should be noted that the
confidence intervals around the mean differences between intervention and control
arms were wide. Posner et al (2004) do not report differences in the uptake of these
various items, instead simply reporting ‘device use’ as a whole.
The use of home safety equipment that does not require specific skills to install is
reported in Table 14 (p.73). A statistically significant difference that favoured the
intervention in the use of fire guards, electrical outlet covers and door slam devices
was reported by Clamp & Kendrick (1998), although one of the two reports which
presented data on the use of electrical outlet covers found no significant difference
between intervention and control groups (Sznajder et al 2003). Similarly, the use of
supplied non-slip bath mats and decals was found to have no significant difference
between intervention and control groups (Sznajder et al 2003), but the use of
cushioned table corners was found to statistically significantly favour the intervention
group, although the confidence interval was wide (Sznajder et al 2003).
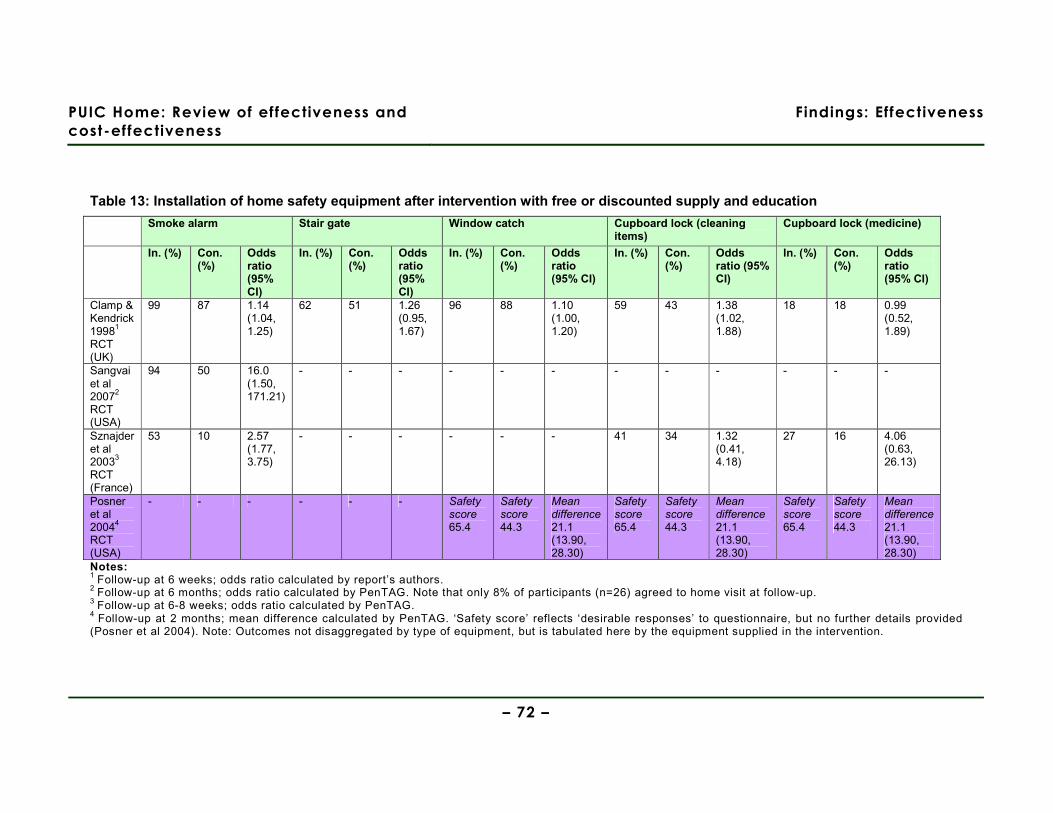
PUIC Home: Review of effectiveness and
cost-effectiveness
Findings: Effectiveness
– 72 –
Table 13: Installation of home safety equipment after intervention with free or discounted supply and education
Smoke alarm Stair gate Window catch Cupboard lock (cleaning items)
Cupboard lock (medicine)
In. (%) Con. (%)
Odds ratio (95% CI)
In. (%) Con. (%)
Odds ratio (95% CI)
In. (%) Con. (%)
Odds ratio (95% CI)
In. (%) Con. (%)
Odds ratio (95% CI)
In. (%) Con. (%)
Odds ratio (95% CI)
Clamp & Kendrick 19981
RCT (UK)
99 87 1.14 (1.04, 1.25)
62 51 1.26 (0.95, 1.67)
96 88 1.10 (1.00, 1.20)
59 43 1.38 (1.02, 1.88)
18 18 0.99 (0.52, 1.89)
Sangvai et al 20072
RCT (USA)
94 50 16.0 (1.50, 171.21)
- - - - - - - - - - - -
Sznajder et al 20033
RCT (France)
53 10 2.57 (1.77, 3.75)
- - - - - - 41 34 1.32 (0.41, 4.18)
27 16 4.06 (0.63, 26.13)
Posner et al 20044
RCT (USA)
- - - - - - Safety score 65.4
Safety score 44.3
Mean difference 21.1 (13.90, 28.30)
Safety score 65.4
Safety score 44.3
Mean difference 21.1 (13.90, 28.30)
Safety score 65.4
Safety score 44.3
Mean difference 21.1 (13.90, 28.30)
Notes: 1 Follow-up at 6 weeks; odds ratio calculated by report’s authors. 2 Follow-up at 6 months; odds ratio calculated by PenTAG. Note that only 8% of participants (n=26) agreed to home visit at follow-up. 3 Follow-up at 6-8 weeks; odds ratio calculated by PenTAG. 4 Follow-up at 2 months; mean difference calculated by PenTAG. ‘Safety score’ reflects ‘desirable responses’ to questionnaire, but no further details provided (Posner et al 2004). Note: Outcomes not disaggregated by type of equipment, but is tabulated here by the equipment supplied in the intervention.
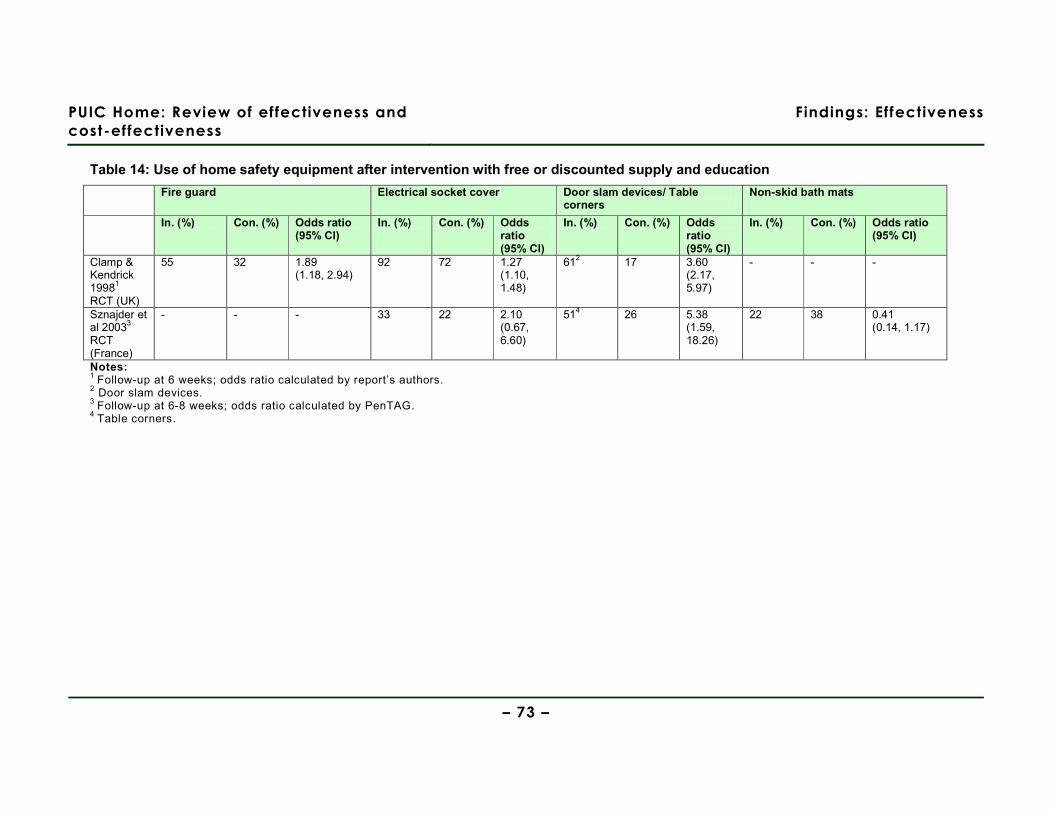
PUIC Home: Review of effectiveness and
cost-effectiveness
Findings: Effectiveness
– 73 –
Table 14: Use of home safety equipment after intervention with free or discounted supply and education
Fire guard Electrical socket cover Door slam devices/ Table corners
Non-skid bath mats
In. (%) Con. (%) Odds ratio (95% CI)
In. (%) Con. (%) Odds ratio (95% CI)
In. (%) Con. (%) Odds ratio (95% CI)
In. (%) Con. (%) Odds ratio (95% CI)
Clamp & Kendrick 19981
RCT (UK)
55 32 1.89 (1.18, 2.94)
92 72 1.27 (1.10, 1.48)
612 17 3.60 (2.17, 5.97)
- - -
Sznajder et al 20033
RCT (France)
- - - 33 22 2.10 (0.67, 6.60)
514 26 5.38 (1.59, 18.26)
22 38 0.41 (0.14, 1.17)
Notes: 1 Follow-up at 6 weeks; odds ratio calculated by report’s authors. 2 Door slam devices. 3 Follow-up at 6-8 weeks; odds ratio calculated by PenTAG. 4 Table corners.
PUIC Home: Review of effectiveness
and cost-effectiveness
Findings: Effectiveness
– 74 –
Home safety knowledge and behaviour
Four reports (Clamp & Kendrick 1998, RCT, IV++, EV+, UK; Posner et al 2004,
RCT, IV++, EV++, USA; Sangvai et al 2007, RCT, IV-, EV-, USA; Sznajder et
al 2003, RCT, IV+, EV-, France) presented data on changes in home safety
knowledge and behaviour (Table 15 (p.76)); Table 16 (p.77)). As detailed in
the preceeding section, all of the reports used upon self-reported data or
observation of behaviour with only a very small sample.
All four studies (Clamp & Kendrick 1998; Posner et al 2004; Sangvai et al
2007; Sznajder et al 2003) reported statistically significant improvements in
the intervention group in knowledge and behaviour relating to the prevention of
poisoning; whilst the odds ratio confidence intervals in two of these studies
were wide (Posner et al 2004; Sangvai et al 2007), they were much narrower
in the two studies that reported a smaller effect size (Clamp & Kendrick 1998;
Sznajder et al 2003). One of the three reports that presented data on changes
in knowledge and behaviour relating to the prevention of falls found a
statistically significant difference that strongly favoured the intervention group
(Sznajder et al 2003), whilst two studies reported no statistically significant
difference between intervention and control groups (Clamp & Kendrick 1998;
Posner et al 2004).
Two of the four reports presented data that showed statistically significant
improvements in the intervention group in knowledge and behaviour relating to
the prevention of wounds (Clamp & Kendrick 1998; Posner et al 2004),
although one found no statistically significant difference (Sznajder et al 2003).
Two of the four reports presented data showing statistically significant
improvements in the intervention group in knowledge and behaviour relating to
the prevention of scalds (Clamp & Kendrick 1998; Posner et al 2004), and two
of the four reports presented data showing statistically significant
improvements in the intervention group in knowledge and behaviour relating to
the prevention of fires (Clamp & Kendrick 1998; Sznajder et al 2003).
Other improvements in home safety knowledge and behaviour were presented
in two reports, one relating to the prevention of drowning (Posner et al 2004)
and one to the prevention of suffocation (Sznajder et al 2003); large effect

PUIC Home: Review of effectiveness
and cost-effectiveness
Findings: Effectiveness
– 75 –
sizes that favoured the intervention group were reported in both of these
studies, but the confidence intervals around the odds ratios were wide.
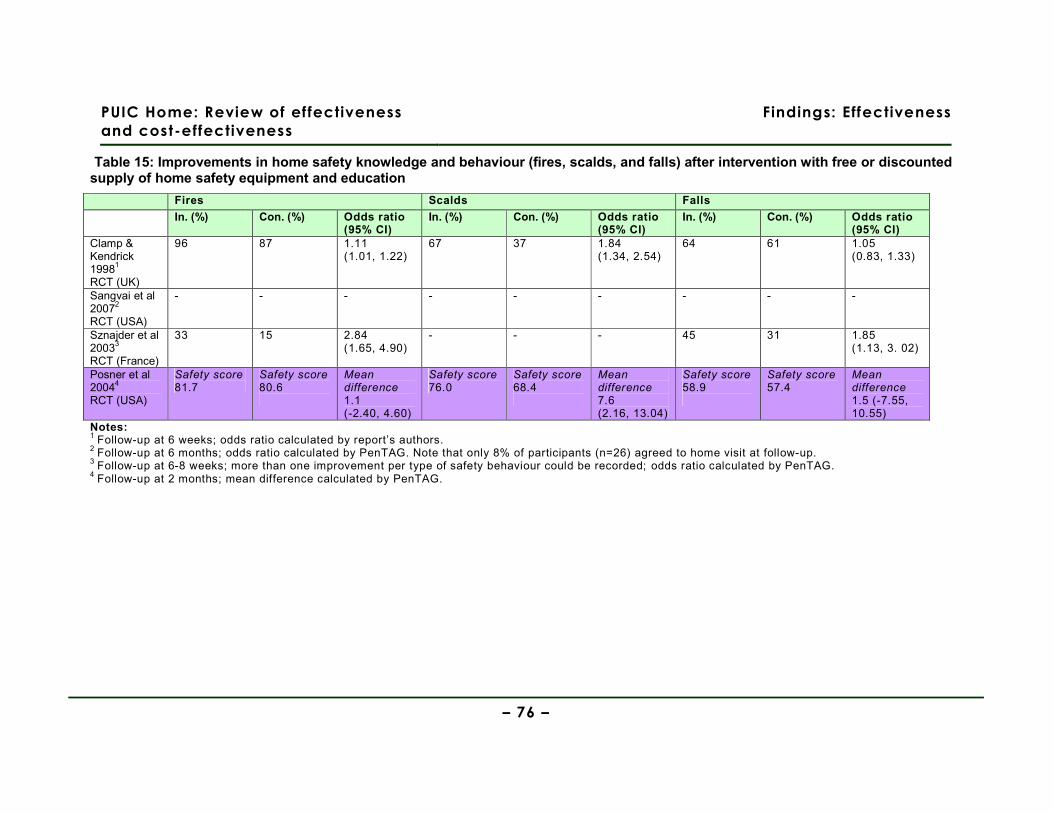
PUIC Home: Review of effectiveness
and cost-effectiveness
Findings: Effectiveness
– 76 –
Table 15: Improvements in home safety knowledge and behaviour (fires, scalds, and falls) after intervention with free or discounted supply of home safety equipment and education
Fires Scalds Falls
In. (%) Con. (%) Odds ratio (95% CI)
In. (%) Con. (%) Odds ratio (95% CI)
In. (%) Con. (%) Odds ratio (95% CI)
Clamp & Kendrick 19981
RCT (UK)
96 87 1.11 (1.01, 1.22)
67 37 1.84 (1.34, 2.54)
64 61 1.05 (0.83, 1.33)
Sangvai et al 20072
RCT (USA)
- - - - - - - - -
Sznajder et al 20033
RCT (France)
33 15 2.84 (1.65, 4.90)
- - - 45 31 1.85 (1.13, 3. 02)
Posner et al 20044
RCT (USA)
Safety score 81.7
Safety score 80.6
Mean difference 1.1 (-2.40, 4.60)
Safety score 76.0
Safety score 68.4
Mean difference 7.6 (2.16, 13.04)
Safety score 58.9
Safety score 57.4
Mean difference 1.5 (-7.55, 10.55)
Notes: 1 Follow-up at 6 weeks; odds ratio calculated by report’s authors. 2 Follow-up at 6 months; odds ratio calculated by PenTAG. Note that only 8% of participants (n=26) agreed to home visit at follow-up. 3 Follow-up at 6-8 weeks; more than one improvement per type of safety behaviour could be recorded; odds ratio calculated by PenTAG. 4 Follow-up at 2 months; mean difference calculated by PenTAG.
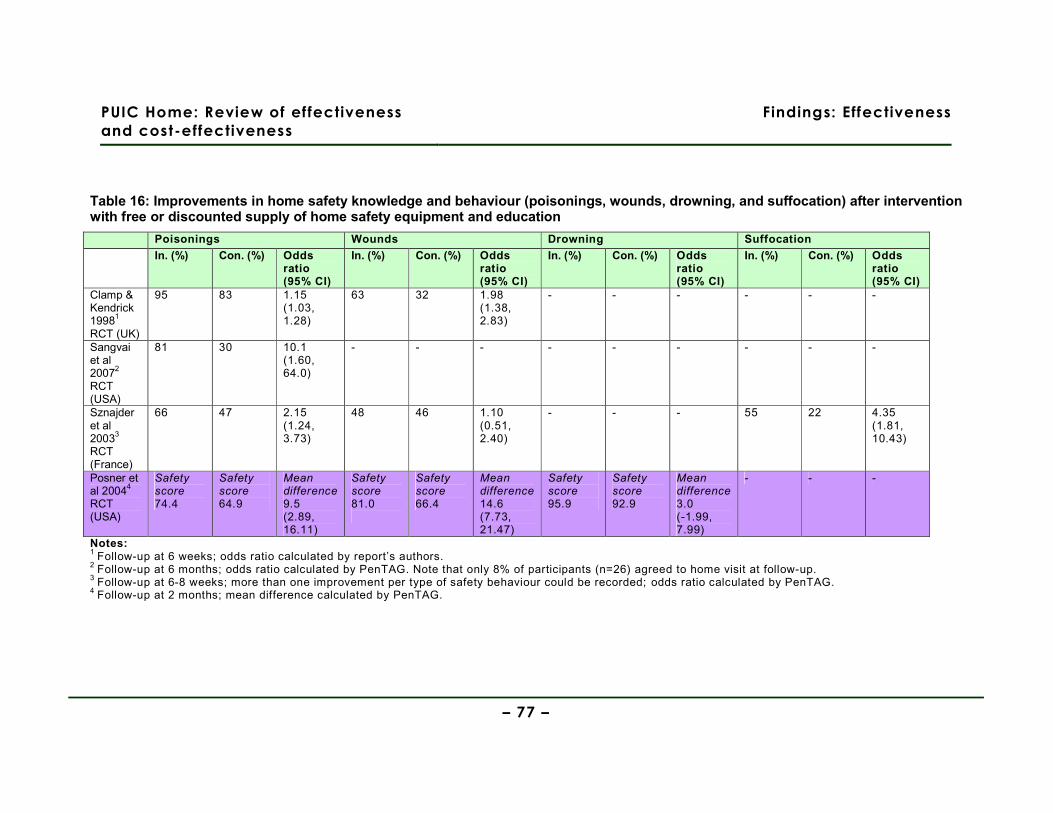
PUIC Home: Review of effectiveness
and cost-effectiveness
Findings: Effectiveness
– 77 –
Table 16: Improvements in home safety knowledge and behaviour (poisonings, wounds, drowning, and suffocation) after intervention with free or discounted supply of home safety equipment and education
Poisonings Wounds Drowning Suffocation
In. (%) Con. (%) Odds ratio (95% CI)
In. (%) Con. (%) Odds ratio (95% CI)
In. (%) Con. (%) Odds ratio (95% CI)
In. (%) Con. (%) Odds ratio (95% CI)
Clamp & Kendrick 19981
RCT (UK)
95 83 1.15 (1.03, 1.28)
63 32 1.98 (1.38, 2.83)
- - - - - -
Sangvai et al 20072
RCT (USA)
81 30 10.1 (1.60, 64.0)
- - - - - - - - -
Sznajder et al 20033
RCT (France)
66 47 2.15 (1.24, 3.73)
48 46 1.10 (0.51, 2.40)
- - - 55 22 4.35 (1.81, 10.43)
Posner et al 20044
RCT (USA)
Safety score 74.4
Safety score 64.9
Mean difference 9.5 (2.89, 16.11)
Safety score 81.0
Safety score 66.4
Mean difference 14.6 (7.73, 21.47)
Safety score 95.9
Safety score 92.9
Mean difference 3.0 (-1.99, 7.99)
- - -
Notes: 1 Follow-up at 6 weeks; odds ratio calculated by report’s authors. 2 Follow-up at 6 months; odds ratio calculated by PenTAG. Note that only 8% of participants (n=26) agreed to home visit at follow-up. 3 Follow-up at 6-8 weeks; more than one improvement per type of safety behaviour could be recorded; odds ratio calculated by PenTAG. 4 Follow-up at 2 months; mean difference calculated by PenTAG.
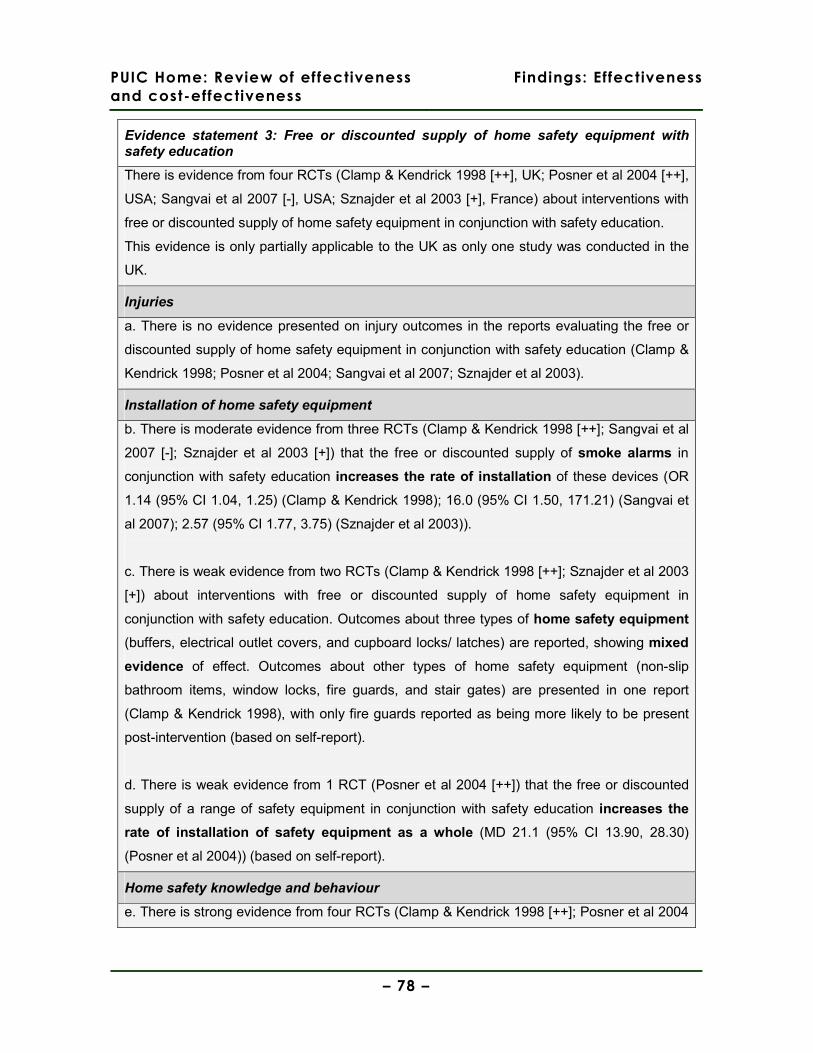
PUIC Home: Review of effectiveness
and cost-effectiveness
Findings: Effectiveness
– 78 –
Evidence statement 3: Free or discounted supply of home safety equipment with safety education
There is evidence from four RCTs (Clamp & Kendrick 1998 [++], UK; Posner et al 2004 [++],
USA; Sangvai et al 2007 [-], USA; Sznajder et al 2003 [+], France) about interventions with
free or discounted supply of home safety equipment in conjunction with safety education.
This evidence is only partially applicable to the UK as only one study was conducted in the
UK.
Injuries
a. There is no evidence presented on injury outcomes in the reports evaluating the free or
discounted supply of home safety equipment in conjunction with safety education (Clamp &
Kendrick 1998; Posner et al 2004; Sangvai et al 2007; Sznajder et al 2003).
Installation of home safety equipment
b. There is moderate evidence from three RCTs (Clamp & Kendrick 1998 [++]; Sangvai et al
2007 [-]; Sznajder et al 2003 [+]) that the free or discounted supply of smoke alarms in
conjunction with safety education increases the rate of installation of these devices (OR
1.14 (95% CI 1.04, 1.25) (Clamp & Kendrick 1998); 16.0 (95% CI 1.50, 171.21) (Sangvai et
al 2007); 2.57 (95% CI 1.77, 3.75) (Sznajder et al 2003)).
c. There is weak evidence from two RCTs (Clamp & Kendrick 1998 [++]; Sznajder et al 2003
[+]) about interventions with free or discounted supply of home safety equipment in
conjunction with safety education. Outcomes about three types of home safety equipment
(buffers, electrical outlet covers, and cupboard locks/ latches) are reported, showing mixed
evidence of effect. Outcomes about other types of home safety equipment (non-slip
bathroom items, window locks, fire guards, and stair gates) are presented in one report
(Clamp & Kendrick 1998), with only fire guards reported as being more likely to be present
post-intervention (based on self-report).
d. There is weak evidence from 1 RCT (Posner et al 2004 [++]) that the free or discounted
supply of a range of safety equipment in conjunction with safety education increases the
rate of installation of safety equipment as a whole (MD 21.1 (95% CI 13.90, 28.30)
(Posner et al 2004)) (based on self-report).
Home safety knowledge and behaviour
e. There is strong evidence from four RCTs (Clamp & Kendrick 1998 [++]; Posner et al 2004
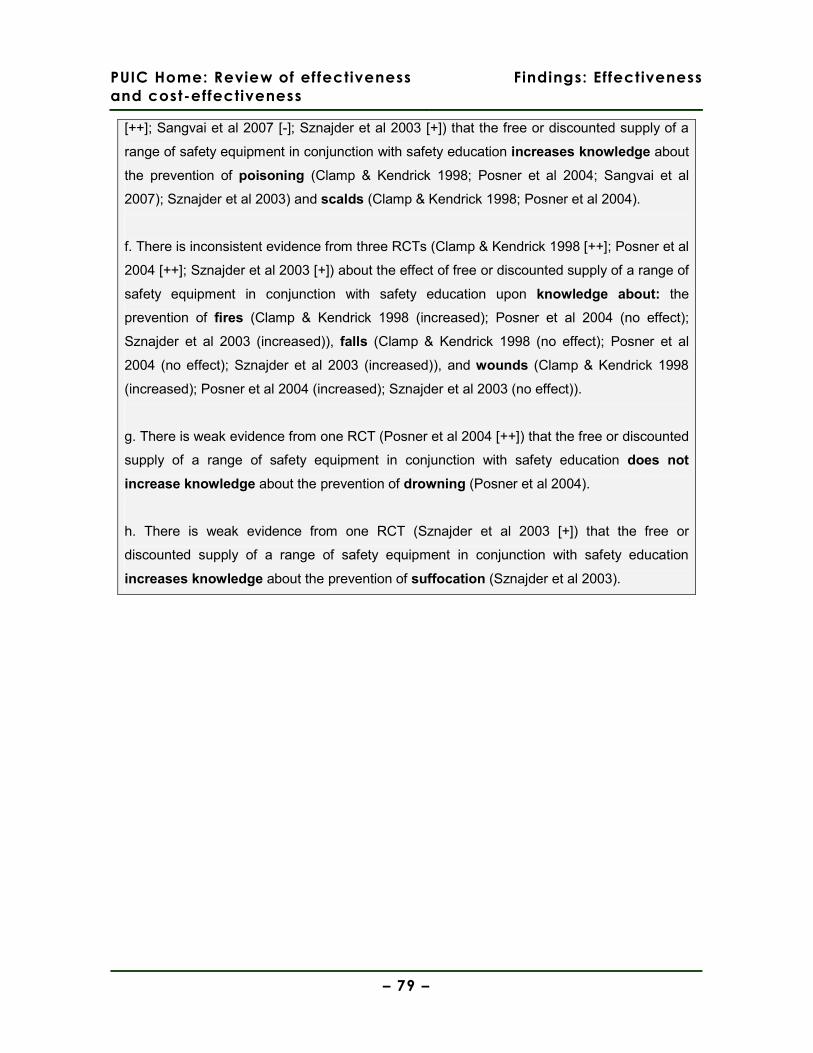
PUIC Home: Review of effectiveness
and cost-effectiveness
Findings: Effectiveness
– 79 –
[++]; Sangvai et al 2007 [-]; Sznajder et al 2003 [+]) that the free or discounted supply of a
range of safety equipment in conjunction with safety education increases knowledge about
the prevention of poisoning (Clamp & Kendrick 1998; Posner et al 2004; Sangvai et al
2007); Sznajder et al 2003) and scalds (Clamp & Kendrick 1998; Posner et al 2004).
f. There is inconsistent evidence from three RCTs (Clamp & Kendrick 1998 [++]; Posner et al
2004 [++]; Sznajder et al 2003 [+]) about the effect of free or discounted supply of a range of
safety equipment in conjunction with safety education upon knowledge about: the
prevention of fires (Clamp & Kendrick 1998 (increased); Posner et al 2004 (no effect);
Sznajder et al 2003 (increased)), falls (Clamp & Kendrick 1998 (no effect); Posner et al
2004 (no effect); Sznajder et al 2003 (increased)), and wounds (Clamp & Kendrick 1998
(increased); Posner et al 2004 (increased); Sznajder et al 2003 (no effect)).
g. There is weak evidence from one RCT (Posner et al 2004 [++]) that the free or discounted
supply of a range of safety equipment in conjunction with safety education does not
increase knowledge about the prevention of drowning (Posner et al 2004).
h. There is weak evidence from one RCT (Sznajder et al 2003 [+]) that the free or
discounted supply of a range of safety equipment in conjunction with safety education
increases knowledge about the prevention of suffocation (Sznajder et al 2003).

PUIC Home: Review of effectiveness
and cost-effectiveness
Findings: Effectiveness
– 80 –
5.7. Free or discounted supply and installation of home
safety equipment with safety education
5.7.1. Report characteristics
Outcomes of an intervention where free or discounted home safety equipment was
supplied and installed in conjunction with safety education were presented in two
reports based upon the same study (Watson et al 2005, IV++, EV++, UK; Kendrick et
al 2009, IV++, EV++, UK) (Table 17, p.80). One report presented data on injury
outcomes (Watson et al 2005), both reports presented data on installation of home
safety equipment (Watson et al 2005; Kendrick et al 2009), and one report presented
data on changes in home safety knowledge and behaviour (Watson et al 2005).
Table 17: Free or discounted supply and installation of home safety equipment: Report characteristics
REPORT DETAILS: Watson et al 2005; Kendrick et al 2009
Aim of study To assess the effectiveness of safety advice and safety equipment in reducing unintentional injuries for families with children aged under 5 and living in deprived areas.
Study design RCT (IV++, EV++)
Study year & follow-up 2000-2002 – N=3428, follow-up at 12 months (n=3428 (injuries)/ n=1880 (knowledge and behaviour) (Watson et al 2005); n=744 (installation) (Kendrick et al 2009)) and 24 months (n=1580 (knowledge and behaviour) (Watson et al 2005).
SETTING
Context (country, setting, location) • UK, participants’ homes or health clinics, urban
Key socio-economic characteristics of sample • Children aged <5 years • 50% of families in receipt of means tested benefits • ~33% had no access to a car • 45% of families lived in rented accommodation • 11% of households had >1 person per room • 71% of sample resided in a deprived area (Townsend score >0) • ~33% of households had both parents unemployed
Study inclusion criteria Families with >=1 children aged <5 years who were on the caseload of Health Visitors within the 47 GP practices.
DESCRIPTION OF INTERVENTION
Safety counselling by Health Visitor + safety kit (stair gates, fire guards, smoke alarms, cupboard locks & drawer locks). Families on a low-income (defined as being in receipt of benefits) could have the safety equipment installed free of charge; others were offered free delivery only.
OUTCOMES REPORTED
• Injuries (primary and secondary care records) (Watson et al 2005) • Installation and functioning of smoke alarms and stair gates (self-reported) (Kendrick et al 2009; Watson et al 2005) and
other home safety equipment (self-reported) (Watson et al 2005) • Home safety behaviours (self-reported) (Watson et al 2005)
PUIC Home: Review of effectiveness
and cost-effectiveness
Findings: Effectiveness
– 81 –
5.7.2. Study quality and context
Both reports (Kendrick et al 2009; Watson et al 2005), based upon the same dataset,
were designed and conducted to high methodological standards. The socio-economic
and home safety behaviour characteristics were sufficiently well-balanced at baseline
to not warrant adjustments for baseline differences in the statistical analysis, the
analysis plan was pre-specified, used an intention to treat analysis, and appropriately
used logistic regression to compare the intervention and control groups. A sufficient
sample size was obtained at follow-up to give 80% power to detect a relative
reduction of 10% (at the 5% significance level) in medically attended injuries between
the intervention and control groups. The use of primary care records for assessing
injury outcomes (in Watson et al 2005) allowed analysis of a sample with 0% attrition;
attrition in the samples assessing home safety equipment installation and knowledge
and behaviour outcomes was reasonable (8% in the intervention group and 4% in the
control group at 12 months follow-up (Kendrick et al 2009; Watson et al 2005); 18% in
the intervention group and 24% in the control group at 24 months (Watson et al
2005)). The authors acknowledge the possibility of the intervention’s effectiveness
being overestimated; the low initial participation rate (35%) may be a sign that only
those families who were already more motivated to address home safety issues
agreed to take part. Despite the use of a validated questionnaire, there also remains
a risk of social desirability bias in the responses given by study participants.
The intervention was implemented in a socio-economically deprived urban area in the
UK and used existing community health infrastructure to deliver the safety education.
The safety equipment was provided and delivered free of charge regardless of a
household’s income, but free installation was only provided for households in receipt
of means tested benefits. The results are directly applicable to areas in the UK with
similar socio-economic characteristics.
5.7.3. Findings
Injuries
One of the two reports presented data on a range of child injury outcomes in the 24
months following the supply and installation of home safety equipment in conjunction
with safety education (Watson et al 2005, RCT, IV++, EV++, UK) (Table 18, p.83).
PUIC Home: Review of effectiveness
and cost-effectiveness
Findings: Effectiveness
– 82 –
Interestingly, primary care attendance (assessed using primary care records) related
to unintentional injuries showed a statistically significant increase in the intervention
group (IRR 1.37 (95% CI 1.11, 1.70)), whilst across all other measures of injury
(assessed using primary and secondary care records) a statistically non-significant
difference between intervention and control groups was reported (IRR secondary care
attendance: 1.02 (95% CI 0.90, 1.13); IRR hospital admission: 1.02 (95% CI 0.70,
1.48); IRR severity score on abbreviated injury scale: 1.14 (95% CI 0.76, 1.71)).
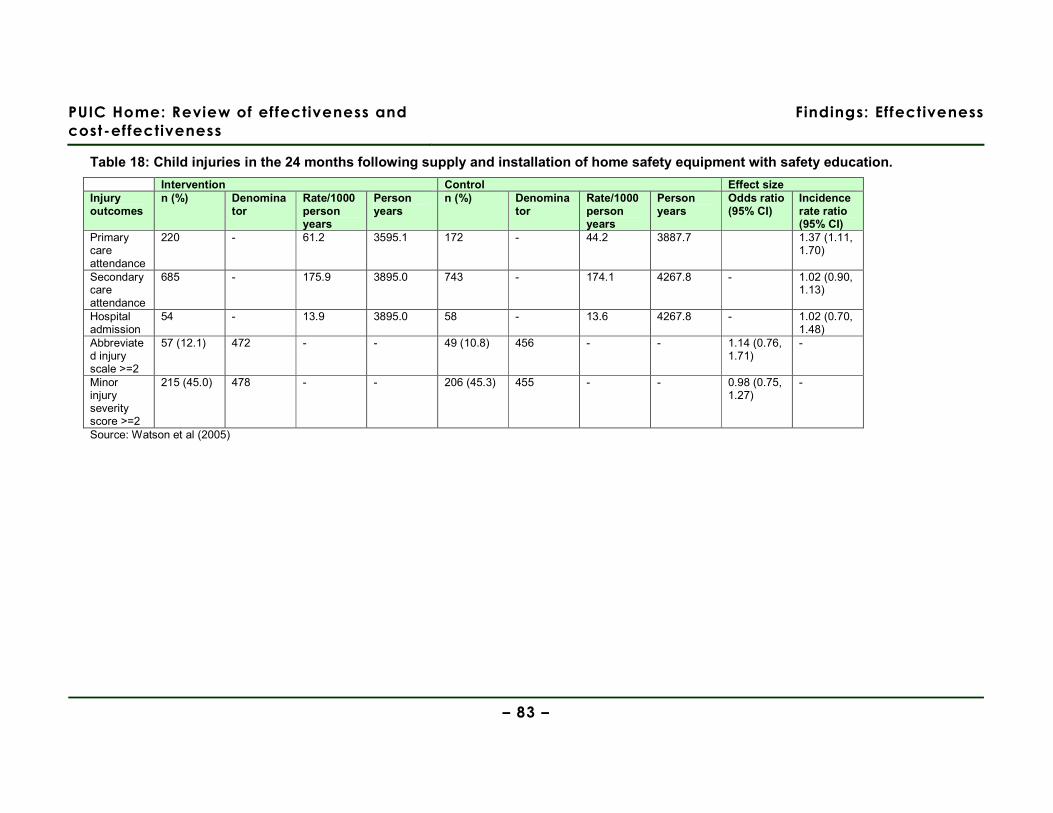
PUIC Home: Review of effectiveness and
cost-effectiveness
Findings: Effectiveness
– 83 –
Table 18: Child injuries in the 24 months following supply and installation of home safety equipment with safety education.
Intervention Control Effect size Injury outcomes
n (%) Denominator
Rate/1000 person years
Person years
n (%) Denominator
Rate/1000 person years
Person years
Odds ratio (95% CI)
Incidence rate ratio (95% CI)
Primary care attendance
220 - 61.2 3595.1 172 - 44.2 3887.7 1.37 (1.11, 1.70)
Secondary care attendance
685 - 175.9 3895.0 743 - 174.1 4267.8 - 1.02 (0.90, 1.13)
Hospital admission
54 - 13.9 3895.0 58 - 13.6 4267.8 - 1.02 (0.70, 1.48)
Abbreviated injury scale >=2
57 (12.1) 472 - - 49 (10.8) 456 - - 1.14 (0.76, 1.71)
-
Minor injury severity score >=2
215 (45.0) 478 - - 206 (45.3) 455 - - 0.98 (0.75, 1.27)
-
Source: Watson et al (2005)

PUIC Home: Review of effectiveness
and cost-effectiveness
Findings: Effectiveness
– 84 –
Installation of home safety equipment
Both reports presented data on the continued use of home safety equipment following
its supply and installation in conjunction with safety education (Kendrick et al 2009,
RCT, IV++, EV++, UK; Watson et al 2005, RCT, IV++, EV++, UK), both differentiated
at 12 and 24 months (Table 19, p.85), and by specific types of safety equipment
(Table 20 – stair gates (p.86); Table 21 – smoke alarms (p.87)). The dataset (self-
reported by parents) analysed in both reports was the same, with the focus in
Kendrick et al (2009) being upon differences in continued use of the safety equipment
by markers of socio-economic inequalities.
At follow-up at 12 months (see Table 19, p.85), Watson et al (2005) reported a
statistically significant difference that moderately to strongly favoured the intervention
group with regard to the installation and use of stair gates (OR 1.46 (95% CI 1.19,
1.80)), smoke alarms (OR 1.83 (95% CI 1.33, 2.52)), and window locks (OR 1.28
(95% CI 1.02, 1.59)), but no statistically significant difference between intervention
and control groups with regard to the installation and use of fire guards (OR 1.14
(95% CI 0.93, 1.40)). This effect failed to persist at follow-up at 24 months (e.g. use
of stair gates: OR 0.92 (95% CI 0.74, 1.14)) except for the installation of a working
smoke alarm (OR 1.67 (95% CI 1.21, 2.32)).
One of the two reports presented data on the continued use of supplied and installed
stair gates and smoke alarms (in conjunction with safety education) at 12 month
follow-up, analysed by key socio-economic characteristics (Kendrick et al 2009). The
intervention was reported to have had a statistically significant effect on reducing
inequalities in the continued use of installed stair gates among families living in
rented housing (p value for interaction term=0.006) and families who were in receipt
of means-tested benefits (p value for interaction term=0.04), but not on any other
markers of socio-economic inequalities (see Table 20, p.86). However, the
intervention had no statistically significant effect on reducing inequalities in the
continuing use of smoke alarms across any of the markers of socio-economic
inequalities (see Table 21, p.87).
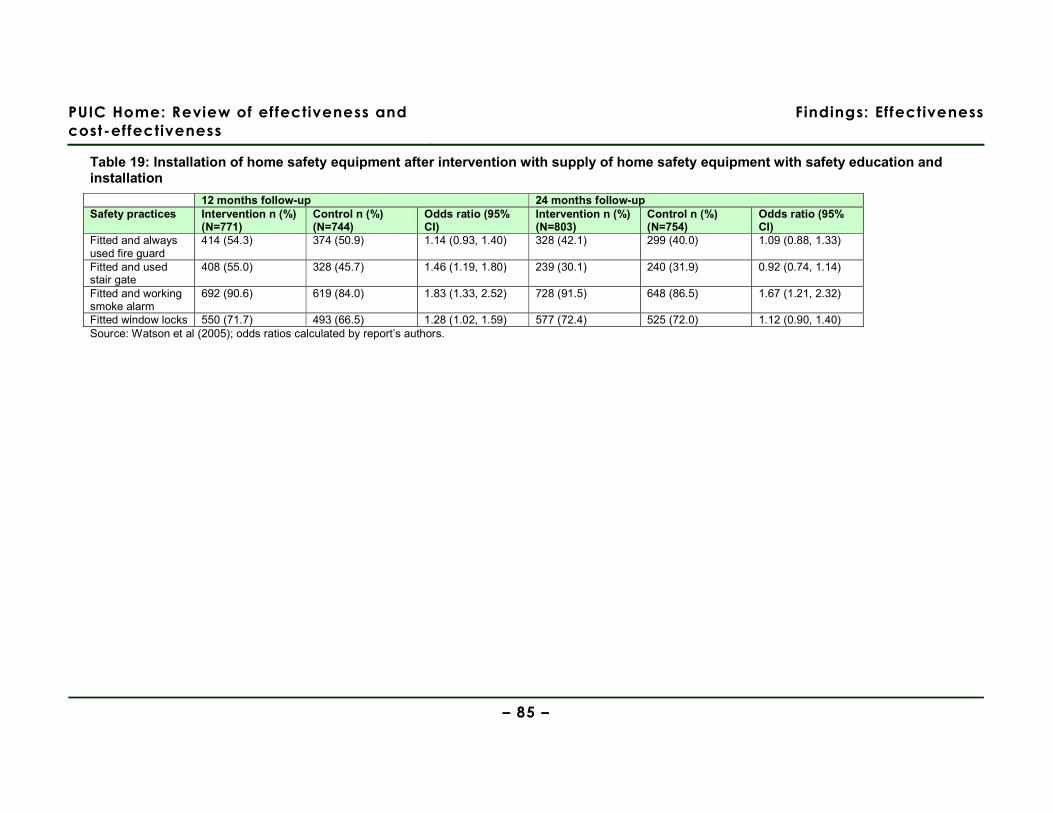
PUIC Home: Review of effectiveness and
cost-effectiveness
Findings: Effectiveness
– 85 –
Table 19: Installation of home safety equipment after intervention with supply of home safety equipment with safety education and installation
12 months follow-up 24 months follow-up Safety practices Intervention n (%)
(N=771) Control n (%) (N=744)
Odds ratio (95% CI)
Intervention n (%) (N=803)
Control n (%) (N=754)
Odds ratio (95% CI)
Fitted and always used fire guard
414 (54.3) 374 (50.9) 1.14 (0.93, 1.40) 328 (42.1) 299 (40.0) 1.09 (0.88, 1.33)
Fitted and used stair gate
408 (55.0) 328 (45.7) 1.46 (1.19, 1.80) 239 (30.1) 240 (31.9) 0.92 (0.74, 1.14)
Fitted and working smoke alarm
692 (90.6) 619 (84.0) 1.83 (1.33, 2.52) 728 (91.5) 648 (86.5) 1.67 (1.21, 2.32)
Fitted window locks 550 (71.7) 493 (66.5) 1.28 (1.02, 1.59) 577 (72.4) 525 (72.0) 1.12 (0.90, 1.40) Source: Watson et al (2005); odds ratios calculated by report’s authors.
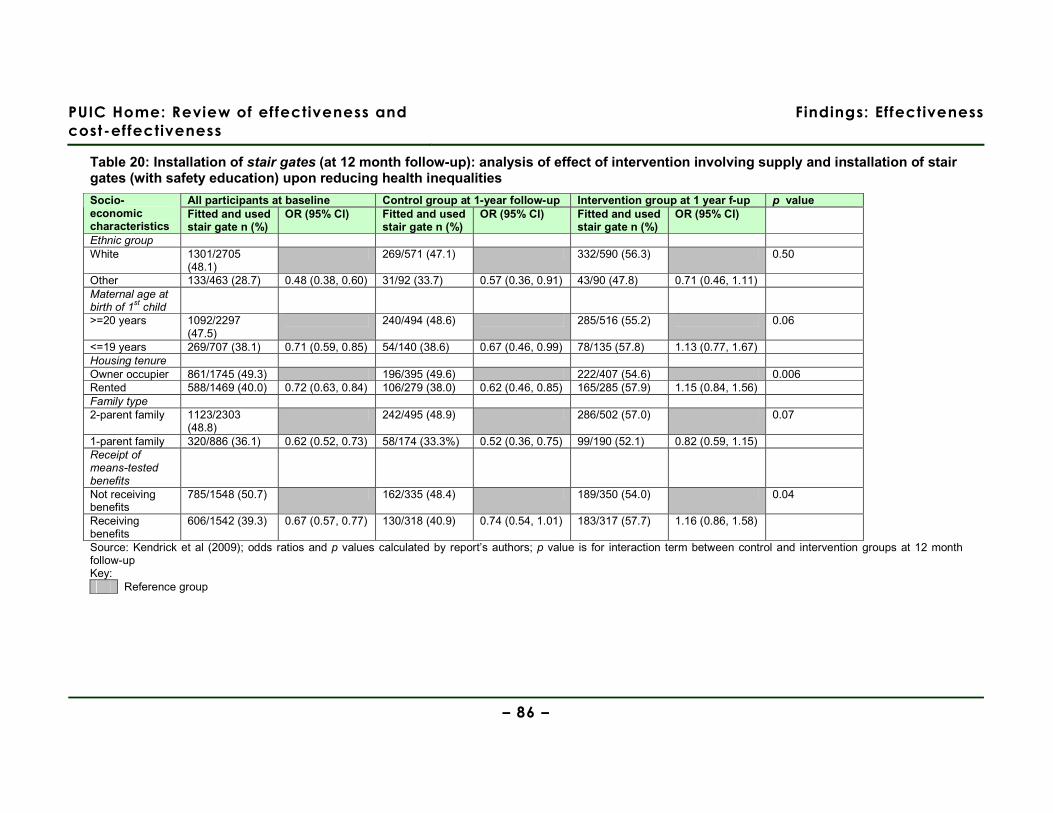
PUIC Home: Review of effectiveness and
cost-effectiveness
Findings: Effectiveness
– 86 –
Table 20: Installation of stair gates (at 12 month follow-up): analysis of effect of intervention involving supply and installation of stair gates (with safety education) upon reducing health inequalities
All participants at baseline Control group at 1-year follow-up Intervention group at 1 year f-up p value Socio-economic characteristics
Fitted and used stair gate n (%)
OR (95% CI) Fitted and used stair gate n (%)
OR (95% CI) Fitted and used stair gate n (%)
OR (95% CI)
Ethnic group White 1301/2705
(48.1) 269/571 (47.1) 332/590 (56.3) 0.50
Other 133/463 (28.7) 0.48 (0.38, 0.60) 31/92 (33.7) 0.57 (0.36, 0.91) 43/90 (47.8) 0.71 (0.46, 1.11) Maternal age at birth of 1
st child
>=20 years 1092/2297 (47.5)
240/494 (48.6) 285/516 (55.2) 0.06
<=19 years 269/707 (38.1) 0.71 (0.59, 0.85) 54/140 (38.6) 0.67 (0.46, 0.99) 78/135 (57.8) 1.13 (0.77, 1.67) Housing tenure Owner occupier 861/1745 (49.3) 196/395 (49.6) 222/407 (54.6) 0.006 Rented 588/1469 (40.0) 0.72 (0.63, 0.84) 106/279 (38.0) 0.62 (0.46, 0.85) 165/285 (57.9) 1.15 (0.84, 1.56) Family type 2-parent family 1123/2303
(48.8) 242/495 (48.9) 286/502 (57.0) 0.07
1-parent family 320/886 (36.1) 0.62 (0.52, 0.73) 58/174 (33.3%) 0.52 (0.36, 0.75) 99/190 (52.1) 0.82 (0.59, 1.15) Receipt of means-tested benefits
Not receiving benefits
785/1548 (50.7) 162/335 (48.4) 189/350 (54.0) 0.04
Receiving benefits
606/1542 (39.3) 0.67 (0.57, 0.77) 130/318 (40.9) 0.74 (0.54, 1.01) 183/317 (57.7) 1.16 (0.86, 1.58)
Source: Kendrick et al (2009); odds ratios and p values calculated by report’s authors; p value is for interaction term between control and intervention groups at 12 month follow-up Key:
Reference group
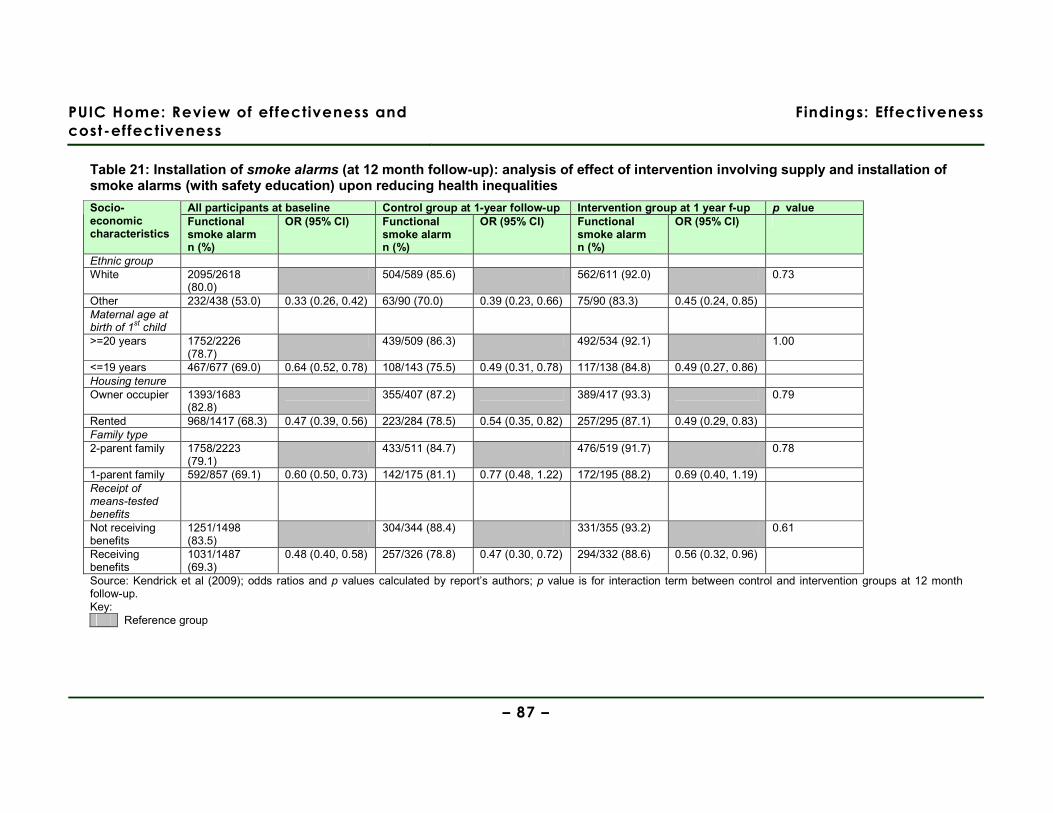
PUIC Home: Review of effectiveness and
cost-effectiveness
Findings: Effectiveness
– 87 –
Table 21: Installation of smoke alarms (at 12 month follow-up): analysis of effect of intervention involving supply and installation of smoke alarms (with safety education) upon reducing health inequalities
All participants at baseline Control group at 1-year follow-up Intervention group at 1 year f-up p value Socio-economic characteristics
Functional smoke alarm n (%)
OR (95% CI) Functional smoke alarm n (%)
OR (95% CI) Functional smoke alarm n (%)
OR (95% CI)
Ethnic group White 2095/2618
(80.0) 504/589 (85.6) 562/611 (92.0) 0.73
Other 232/438 (53.0) 0.33 (0.26, 0.42) 63/90 (70.0) 0.39 (0.23, 0.66) 75/90 (83.3) 0.45 (0.24, 0.85) Maternal age at birth of 1
st child
>=20 years 1752/2226 (78.7)
439/509 (86.3) 492/534 (92.1) 1.00
<=19 years 467/677 (69.0) 0.64 (0.52, 0.78) 108/143 (75.5) 0.49 (0.31, 0.78) 117/138 (84.8) 0.49 (0.27, 0.86) Housing tenure Owner occupier 1393/1683
(82.8) 355/407 (87.2) 389/417 (93.3) 0.79
Rented 968/1417 (68.3) 0.47 (0.39, 0.56) 223/284 (78.5) 0.54 (0.35, 0.82) 257/295 (87.1) 0.49 (0.29, 0.83) Family type 2-parent family 1758/2223
(79.1) 433/511 (84.7) 476/519 (91.7) 0.78
1-parent family 592/857 (69.1) 0.60 (0.50, 0.73) 142/175 (81.1) 0.77 (0.48, 1.22) 172/195 (88.2) 0.69 (0.40, 1.19) Receipt of means-tested benefits
Not receiving benefits
1251/1498 (83.5)
304/344 (88.4) 331/355 (93.2) 0.61
Receiving benefits
1031/1487 (69.3)
0.48 (0.40, 0.58) 257/326 (78.8) 0.47 (0.30, 0.72) 294/332 (88.6) 0.56 (0.32, 0.96)
Source: Kendrick et al (2009); odds ratios and p values calculated by report’s authors; p value is for interaction term between control and intervention groups at 12 month follow-up. Key:
Reference group

PUIC Home: Review of effectiveness
and cost-effectiveness
Findings: Effectiveness
– 88 –
Home safety knowledge and behaviour
One of the two reports presented data on improvements in home safety knowledge and
behaviour (self-reported by parents) after the supply and installation of home safety
equipment in conjunction with safety education (Watson et al 2005, RCT, IV++, EV++, UK)
(Table 22, p.89). A statistically significant difference that favoured the intervention group at
12 months follow-up was reported in knowledge and behaviour related to the safe storage of
cleaning products and sharp objects in the kitchen (OR 1.34 (95% CI 1.09, 1.66) and 1.34
(95% CI 1.09, 1.65), respectively). However, at the same time, no statistically significant
difference between intervention and control groups was found relating to the safe storage of
medicines in the kitchen, or cleaning products or sharp objects in the bathroom. At 24
months follow-up, the statistically significant difference that favoured the intervention group
only persisted for knowledge and behaviour related to the safe storage of cleaning products
in the kitchen (OR 1.31 (95% CI 1.07, 1.60)).
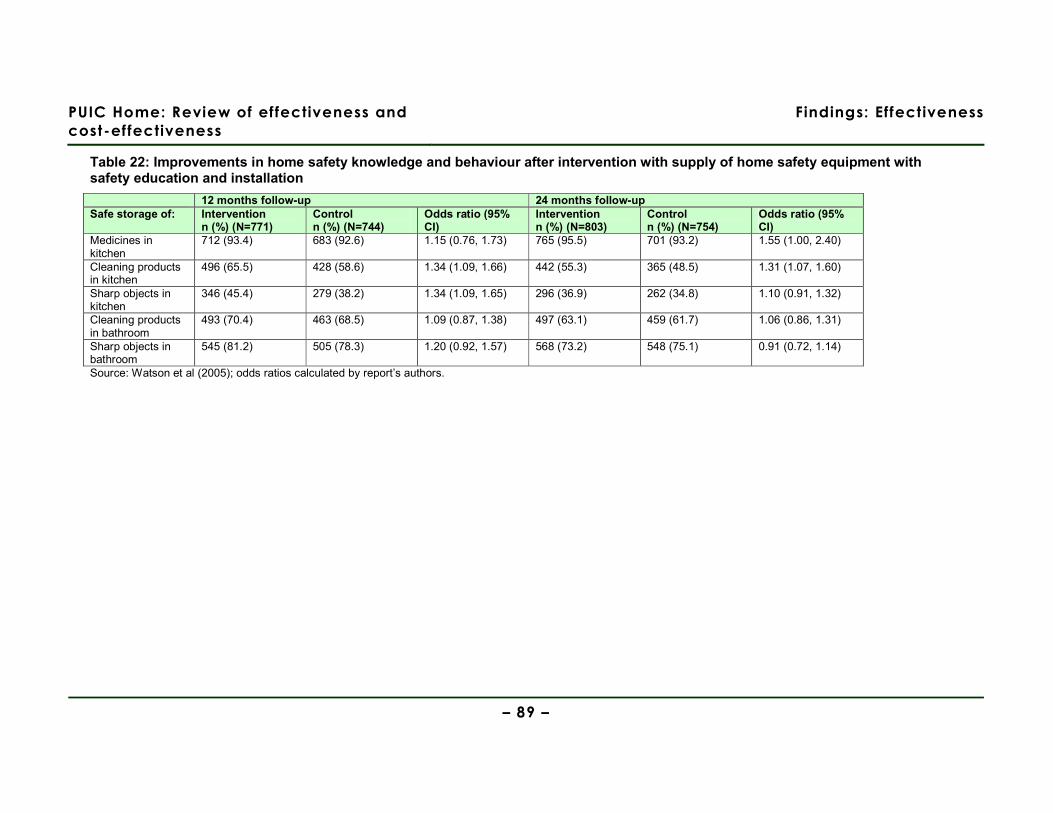
PUIC Home: Review of effectiveness and
cost-effectiveness
Findings: Effectiveness
– 89 –
Table 22: Improvements in home safety knowledge and behaviour after intervention with supply of home safety equipment with safety education and installation
12 months follow-up 24 months follow-up Safe storage of: Intervention
n (%) (N=771) Control n (%) (N=744)
Odds ratio (95% CI)
Intervention n (%) (N=803)
Control n (%) (N=754)
Odds ratio (95% CI)
Medicines in kitchen
712 (93.4) 683 (92.6) 1.15 (0.76, 1.73) 765 (95.5) 701 (93.2) 1.55 (1.00, 2.40)
Cleaning products in kitchen
496 (65.5) 428 (58.6) 1.34 (1.09, 1.66) 442 (55.3) 365 (48.5) 1.31 (1.07, 1.60)
Sharp objects in kitchen
346 (45.4) 279 (38.2) 1.34 (1.09, 1.65) 296 (36.9) 262 (34.8) 1.10 (0.91, 1.32)
Cleaning products in bathroom
493 (70.4) 463 (68.5) 1.09 (0.87, 1.38) 497 (63.1) 459 (61.7) 1.06 (0.86, 1.31)
Sharp objects in bathroom
545 (81.2) 505 (78.3) 1.20 (0.92, 1.57) 568 (73.2) 548 (75.1) 0.91 (0.72, 1.14)
Source: Watson et al (2005); odds ratios calculated by report’s authors.
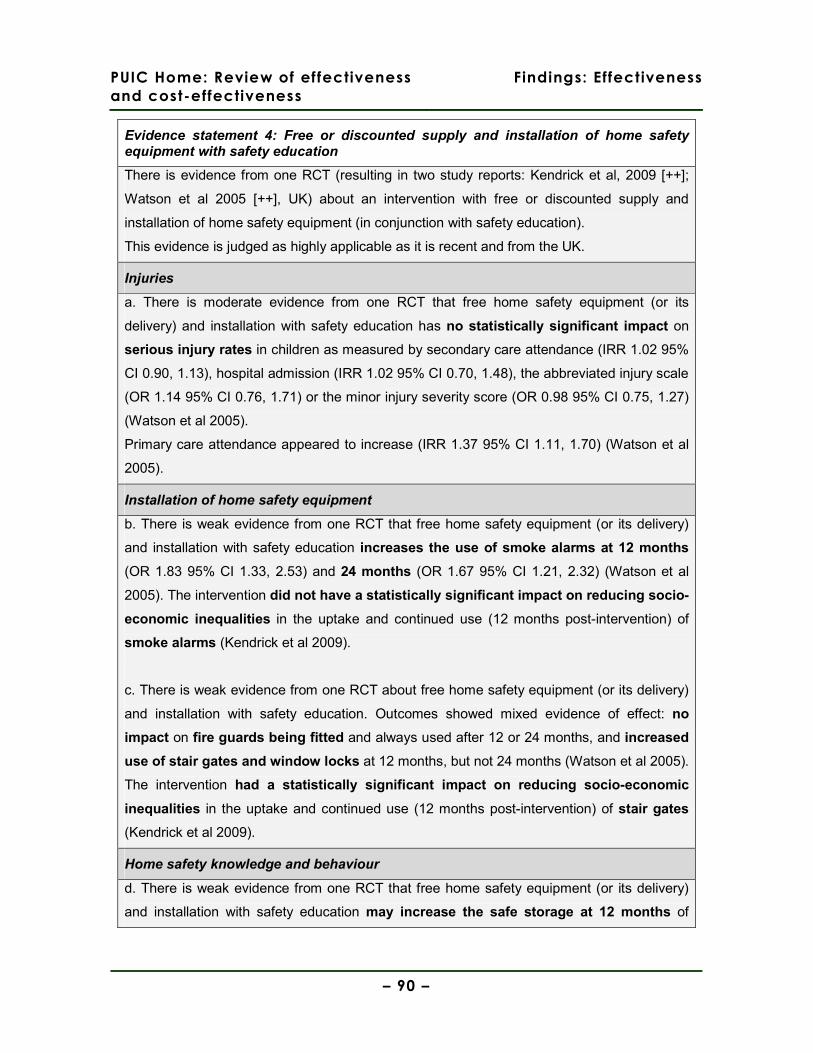
PUIC Home: Review of effectiveness
and cost-effectiveness
Findings: Effectiveness
– 90 –
Evidence statement 4: Free or discounted supply and installation of home safety equipment with safety education
There is evidence from one RCT (resulting in two study reports: Kendrick et al, 2009 [++];
Watson et al 2005 [++], UK) about an intervention with free or discounted supply and
installation of home safety equipment (in conjunction with safety education).
This evidence is judged as highly applicable as it is recent and from the UK.
Injuries
a. There is moderate evidence from one RCT that free home safety equipment (or its
delivery) and installation with safety education has no statistically significant impact on
serious injury rates in children as measured by secondary care attendance (IRR 1.02 95%
CI 0.90, 1.13), hospital admission (IRR 1.02 95% CI 0.70, 1.48), the abbreviated injury scale
(OR 1.14 95% CI 0.76, 1.71) or the minor injury severity score (OR 0.98 95% CI 0.75, 1.27)
(Watson et al 2005).
Primary care attendance appeared to increase (IRR 1.37 95% CI 1.11, 1.70) (Watson et al
2005).
Installation of home safety equipment
b. There is weak evidence from one RCT that free home safety equipment (or its delivery)
and installation with safety education increases the use of smoke alarms at 12 months
(OR 1.83 95% CI 1.33, 2.53) and 24 months (OR 1.67 95% CI 1.21, 2.32) (Watson et al
2005). The intervention did not have a statistically significant impact on reducing socio-
economic inequalities in the uptake and continued use (12 months post-intervention) of
smoke alarms (Kendrick et al 2009).
c. There is weak evidence from one RCT about free home safety equipment (or its delivery)
and installation with safety education. Outcomes showed mixed evidence of effect: no
impact on fire guards being fitted and always used after 12 or 24 months, and increased
use of stair gates and window locks at 12 months, but not 24 months (Watson et al 2005).
The intervention had a statistically significant impact on reducing socio-economic
inequalities in the uptake and continued use (12 months post-intervention) of stair gates
(Kendrick et al 2009).
Home safety knowledge and behaviour
d. There is weak evidence from one RCT that free home safety equipment (or its delivery)
and installation with safety education may increase the safe storage at 12 months of
PUIC Home: Review of effectiveness
and cost-effectiveness
Findings: Effectiveness
– 91 –
cleaning products and sharp objects, but that these effects are no longer seen after 24
months for safe storage of sharp objects (Watson et al 2005).
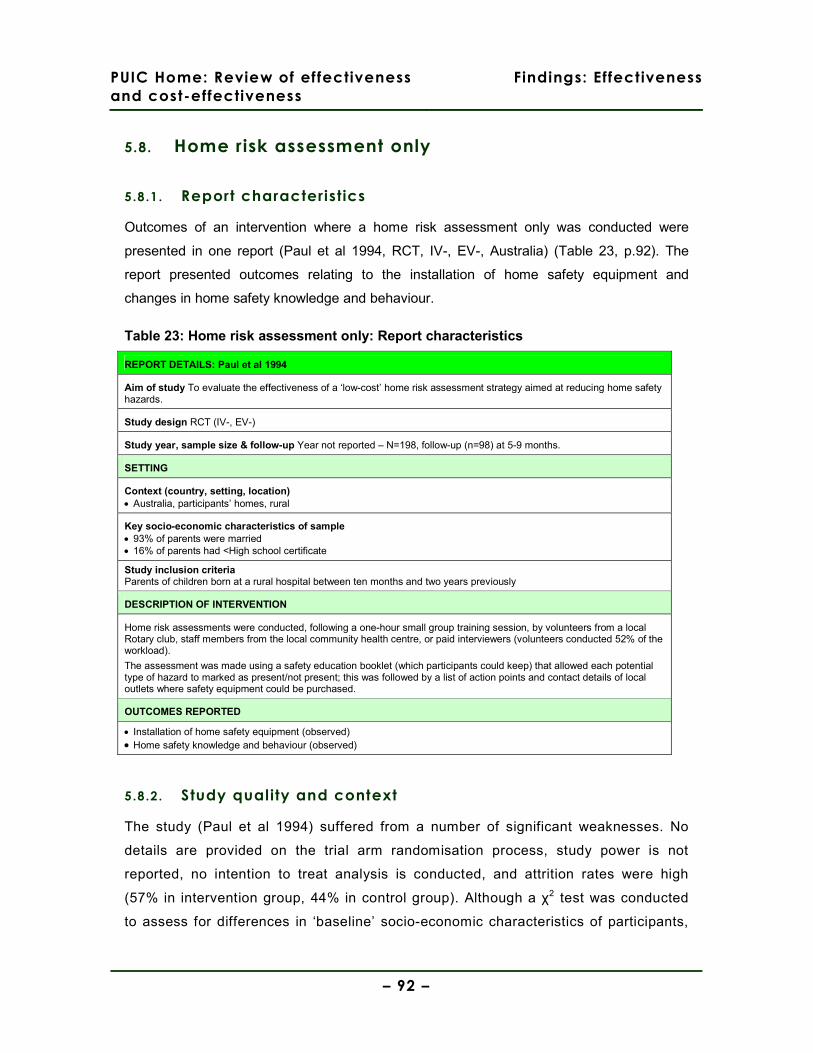
PUIC Home: Review of effectiveness
and cost-effectiveness
Findings: Effectiveness
– 92 –
5.8. Home risk assessment only
5.8.1. Report characteristics
Outcomes of an intervention where a home risk assessment only was conducted were
presented in one report (Paul et al 1994, RCT, IV-, EV-, Australia) (Table 23, p.92). The
report presented outcomes relating to the installation of home safety equipment and
changes in home safety knowledge and behaviour.
Table 23: Home risk assessment only: Report characteristics
REPORT DETAILS: Paul et al 1994
Aim of study To evaluate the effectiveness of a ‘low-cost’ home risk assessment strategy aimed at reducing home safety hazards.
Study design RCT (IV-, EV-)
Study year, sample size & follow-up Year not reported – N=198, follow-up (n=98) at 5-9 months.
SETTING
Context (country, setting, location) • Australia, participants’ homes, rural
Key socio-economic characteristics of sample • 93% of parents were married • 16% of parents had <High school certificate
Study inclusion criteria Parents of children born at a rural hospital between ten months and two years previously
DESCRIPTION OF INTERVENTION
Home risk assessments were conducted, following a one-hour small group training session, by volunteers from a local Rotary club, staff members from the local community health centre, or paid interviewers (volunteers conducted 52% of the workload).
The assessment was made using a safety education booklet (which participants could keep) that allowed each potential type of hazard to marked as present/not present; this was followed by a list of action points and contact details of local outlets where safety equipment could be purchased.
OUTCOMES REPORTED
• Installation of home safety equipment (observed) • Home safety knowledge and behaviour (observed)
5.8.2. Study quality and context
The study (Paul et al 1994) suffered from a number of significant weaknesses. No
details are provided on the trial arm randomisation process, study power is not
reported, no intention to treat analysis is conducted, and attrition rates were high
(57% in intervention group, 44% in control group). Although a χ2 test was conducted
to assess for differences in ‘baseline’ socio-economic characteristics of participants,
PUIC Home: Review of effectiveness
and cost-effectiveness
Findings: Effectiveness
– 93 –
this analysis was conducted only on those participants where follow-up was
successful, meaning that any systematic difference between the two groups that may
have resulted in higher rates of attrition will not be apparent in the analysis. There is
a substantial risk of reporting bias. The implementation of the intervention appears to
have been severely constrained by resources. A number of different attempts to enrol
community organisations and their members (with varying degrees of interest and
aptitude for the implementing the intervention) were made, and the authors
acknowledge that the intervention’s delivery was hampered by resource constraints.
The intervention, which took place in rural Australia, was unusual in that the home
risk assessment was a stand-alone intervention without the opportunity being taken to
supply free or discounted home safety equipment. Although the home risk assessors
(52% of whom were volunteers, the remainder being community health centre staff or
temporary project staff) recorded home safety hazards in a safety education booklet
that was given to participants and provided advice about home safety equipment and
behaviour, it was left to participants’ to source, fund, and install appropriate
equipment. The lack of methodological rigour in the study design and the particular
characteristics of rural areas in Australia severely limit the applicability of this study’s
findings to the UK.
5.8.3. Findings
Injuries
The study (Paul et al 1994) evaluating the effectiveness of home risk assessments
did not report injury outcomes.
Installation of home safety equipment
The report presented data (observed) on the installation of home safety equipment
following a home risk assessment (Paul et al 1994, RCT, IV-, EV-, Australia). Only
the statistically significant result comparing intervention and control group outcomes
is reported, and insufficient data is reported to allow calculation of odds ratios. The
report presented data showing that at follow-up at between 5 and 9 months, the use
of smooth table-top corners was statistically significantly greater in the intervention
group (χ2=40.695, df=1, p<0.001).
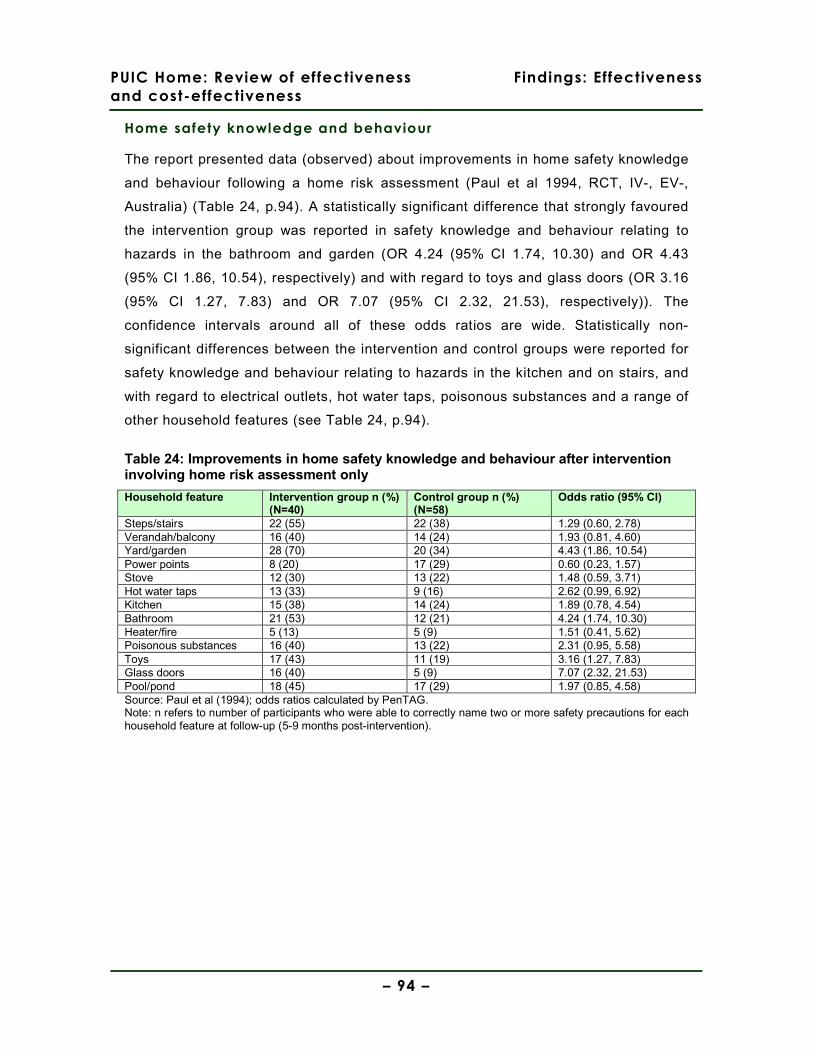
PUIC Home: Review of effectiveness
and cost-effectiveness
Findings: Effectiveness
– 94 –
Home safety knowledge and behaviour
The report presented data (observed) about improvements in home safety knowledge
and behaviour following a home risk assessment (Paul et al 1994, RCT, IV-, EV-,
Australia) (Table 24, p.94). A statistically significant difference that strongly favoured
the intervention group was reported in safety knowledge and behaviour relating to
hazards in the bathroom and garden (OR 4.24 (95% CI 1.74, 10.30) and OR 4.43
(95% CI 1.86, 10.54), respectively) and with regard to toys and glass doors (OR 3.16
(95% CI 1.27, 7.83) and OR 7.07 (95% CI 2.32, 21.53), respectively)). The
confidence intervals around all of these odds ratios are wide. Statistically non-
significant differences between the intervention and control groups were reported for
safety knowledge and behaviour relating to hazards in the kitchen and on stairs, and
with regard to electrical outlets, hot water taps, poisonous substances and a range of
other household features (see Table 24, p.94).
Table 24: Improvements in home safety knowledge and behaviour after intervention involving home risk assessment only
Household feature Intervention group n (%) (N=40)
Control group n (%) (N=58)
Odds ratio (95% CI)
Steps/stairs 22 (55) 22 (38) 1.29 (0.60, 2.78) Verandah/balcony 16 (40) 14 (24) 1.93 (0.81, 4.60) Yard/garden 28 (70) 20 (34) 4.43 (1.86, 10.54) Power points 8 (20) 17 (29) 0.60 (0.23, 1.57) Stove 12 (30) 13 (22) 1.48 (0.59, 3.71) Hot water taps 13 (33) 9 (16) 2.62 (0.99, 6.92) Kitchen 15 (38) 14 (24) 1.89 (0.78, 4.54) Bathroom 21 (53) 12 (21) 4.24 (1.74, 10.30) Heater/fire 5 (13) 5 (9) 1.51 (0.41, 5.62) Poisonous substances 16 (40) 13 (22) 2.31 (0.95, 5.58) Toys 17 (43) 11 (19) 3.16 (1.27, 7.83) Glass doors 16 (40) 5 (9) 7.07 (2.32, 21.53) Pool/pond 18 (45) 17 (29) 1.97 (0.85, 4.58) Source: Paul et al (1994); odds ratios calculated by PenTAG. Note: n refers to number of participants who were able to correctly name two or more safety precautions for each household feature at follow-up (5-9 months post-intervention).
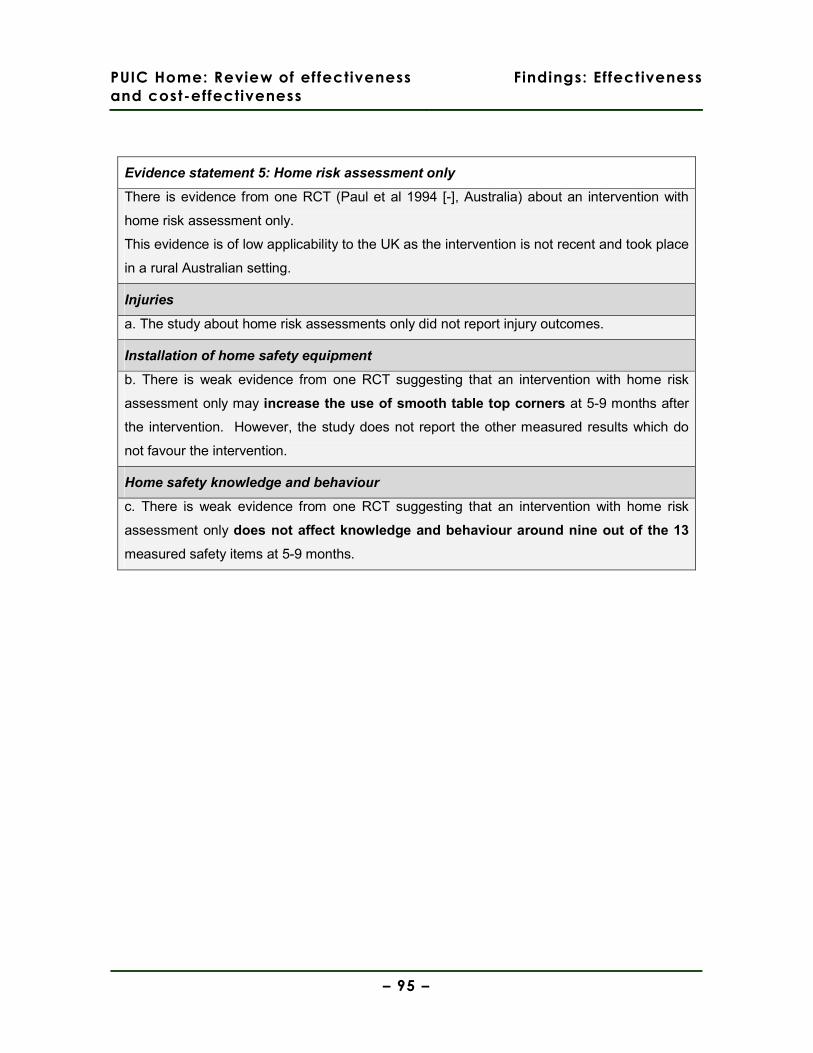
PUIC Home: Review of effectiveness
and cost-effectiveness
Findings: Effectiveness
– 95 –
Evidence statement 5: Home risk assessment only
There is evidence from one RCT (Paul et al 1994 [-], Australia) about an intervention with
home risk assessment only.
This evidence is of low applicability to the UK as the intervention is not recent and took place
in a rural Australian setting.
Injuries
a. The study about home risk assessments only did not report injury outcomes.
Installation of home safety equipment
b. There is weak evidence from one RCT suggesting that an intervention with home risk
assessment only may increase the use of smooth table top corners at 5-9 months after
the intervention. However, the study does not report the other measured results which do
not favour the intervention.
Home safety knowledge and behaviour
c. There is weak evidence from one RCT suggesting that an intervention with home risk
assessment only does not affect knowledge and behaviour around nine out of the 13
measured safety items at 5-9 months.
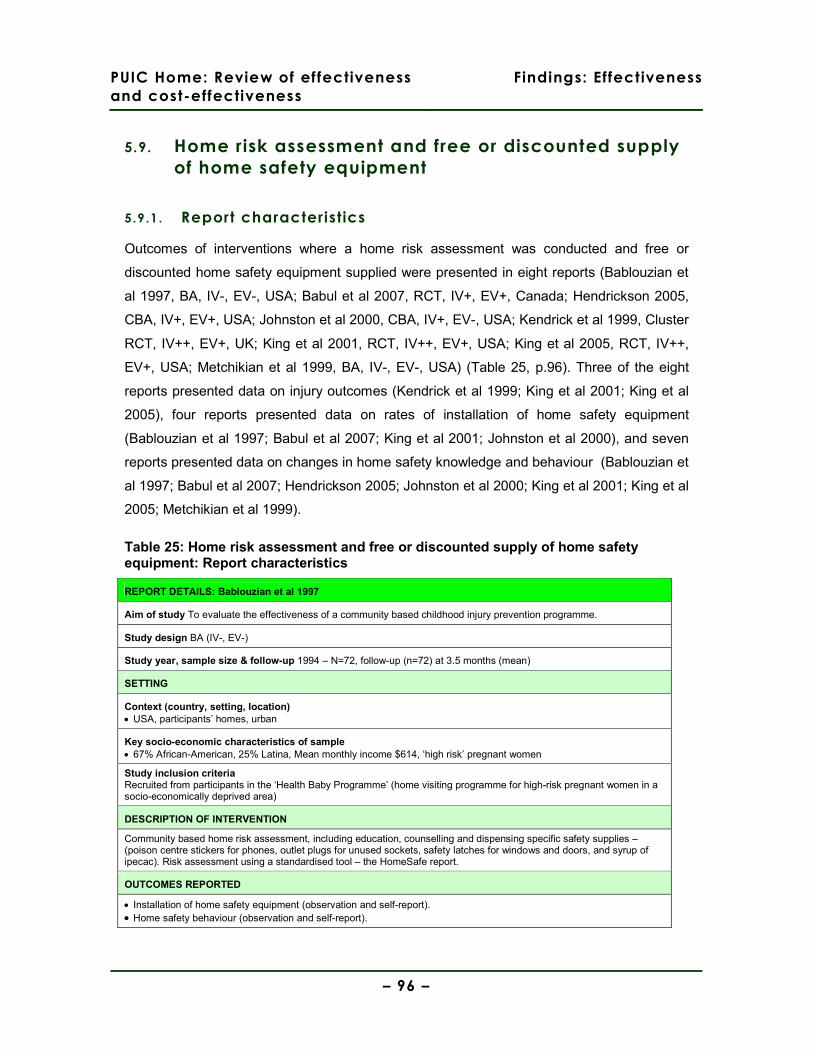
PUIC Home: Review of effectiveness
and cost-effectiveness
Findings: Effectiveness
– 96 –
5.9. Home risk assessment and free or discounted supply
of home safety equipment
5.9.1. Report characteristics
Outcomes of interventions where a home risk assessment was conducted and free or
discounted home safety equipment supplied were presented in eight reports (Bablouzian et
al 1997, BA, IV-, EV-, USA; Babul et al 2007, RCT, IV+, EV+, Canada; Hendrickson 2005,
CBA, IV+, EV+, USA; Johnston et al 2000, CBA, IV+, EV-, USA; Kendrick et al 1999, Cluster
RCT, IV++, EV+, UK; King et al 2001, RCT, IV++, EV+, USA; King et al 2005, RCT, IV++,
EV+, USA; Metchikian et al 1999, BA, IV-, EV-, USA) (Table 25, p.96). Three of the eight
reports presented data on injury outcomes (Kendrick et al 1999; King et al 2001; King et al
2005), four reports presented data on rates of installation of home safety equipment
(Bablouzian et al 1997; Babul et al 2007; King et al 2001; Johnston et al 2000), and seven
reports presented data on changes in home safety knowledge and behaviour (Bablouzian et
al 1997; Babul et al 2007; Hendrickson 2005; Johnston et al 2000; King et al 2001; King et al
2005; Metchikian et al 1999).
Table 25: Home risk assessment and free or discounted supply of home safety equipment: Report characteristics
REPORT DETAILS: Bablouzian et al 1997
Aim of study To evaluate the effectiveness of a community based childhood injury prevention programme.
Study design BA (IV-, EV-)
Study year, sample size & follow-up 1994 – N=72, follow-up (n=72) at 3.5 months (mean)
SETTING
Context (country, setting, location) • USA, participants’ homes, urban
Key socio-economic characteristics of sample • 67% African-American, 25% Latina, Mean monthly income $614, ‘high risk’ pregnant women
Study inclusion criteria Recruited from participants in the ‘Health Baby Programme’ (home visiting programme for high-risk pregnant women in a socio-economically deprived area)
DESCRIPTION OF INTERVENTION
Community based home risk assessment, including education, counselling and dispensing specific safety supplies – (poison centre stickers for phones, outlet plugs for unused sockets, safety latches for windows and doors, and syrup of ipecac). Risk assessment using a standardised tool – the HomeSafe report.
OUTCOMES REPORTED
• Installation of home safety equipment (observation and self-report). • Home safety behaviour (observation and self-report).
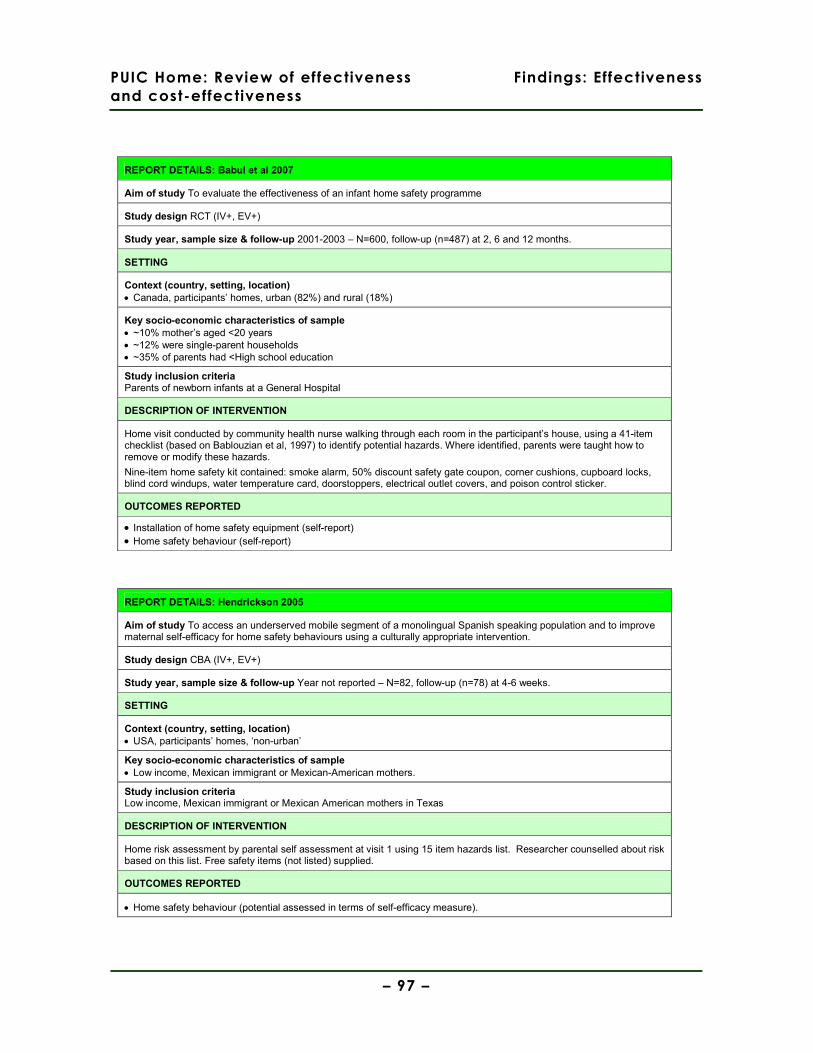
PUIC Home: Review of effectiveness
and cost-effectiveness
Findings: Effectiveness
– 97 –
REPORT DETAILS: Babul et al 2007
Aim of study To evaluate the effectiveness of an infant home safety programme
Study design RCT (IV+, EV+)
Study year, sample size & follow-up 2001-2003 – N=600, follow-up (n=487) at 2, 6 and 12 months.
SETTING
Context (country, setting, location) • Canada, participants’ homes, urban (82%) and rural (18%)
Key socio-economic characteristics of sample • ~10% mother’s aged <20 years • ~12% were single-parent households • ~35% of parents had <High school education
Study inclusion criteria Parents of newborn infants at a General Hospital
DESCRIPTION OF INTERVENTION
Home visit conducted by community health nurse walking through each room in the participant’s house, using a 41-item checklist (based on Bablouzian et al, 1997) to identify potential hazards. Where identified, parents were taught how to remove or modify these hazards.
Nine-item home safety kit contained: smoke alarm, 50% discount safety gate coupon, corner cushions, cupboard locks, blind cord windups, water temperature card, doorstoppers, electrical outlet covers, and poison control sticker.
OUTCOMES REPORTED
• Installation of home safety equipment (self-report) • Home safety behaviour (self-report)
REPORT DETAILS: Hendrickson 2005
Aim of study To access an underserved mobile segment of a monolingual Spanish speaking population and to improve maternal self-efficacy for home safety behaviours using a culturally appropriate intervention.
Study design CBA (IV+, EV+)
Study year, sample size & follow-up Year not reported – N=82, follow-up (n=78) at 4-6 weeks.
SETTING
Context (country, setting, location) • USA, participants’ homes, ‘non-urban’
Key socio-economic characteristics of sample • Low income, Mexican immigrant or Mexican-American mothers.
Study inclusion criteria Low income, Mexican immigrant or Mexican American mothers in Texas
DESCRIPTION OF INTERVENTION
Home risk assessment by parental self assessment at visit 1 using 15 item hazards list. Researcher counselled about risk based on this list. Free safety items (not listed) supplied.
OUTCOMES REPORTED
• Home safety behaviour (potential assessed in terms of self-efficacy measure).
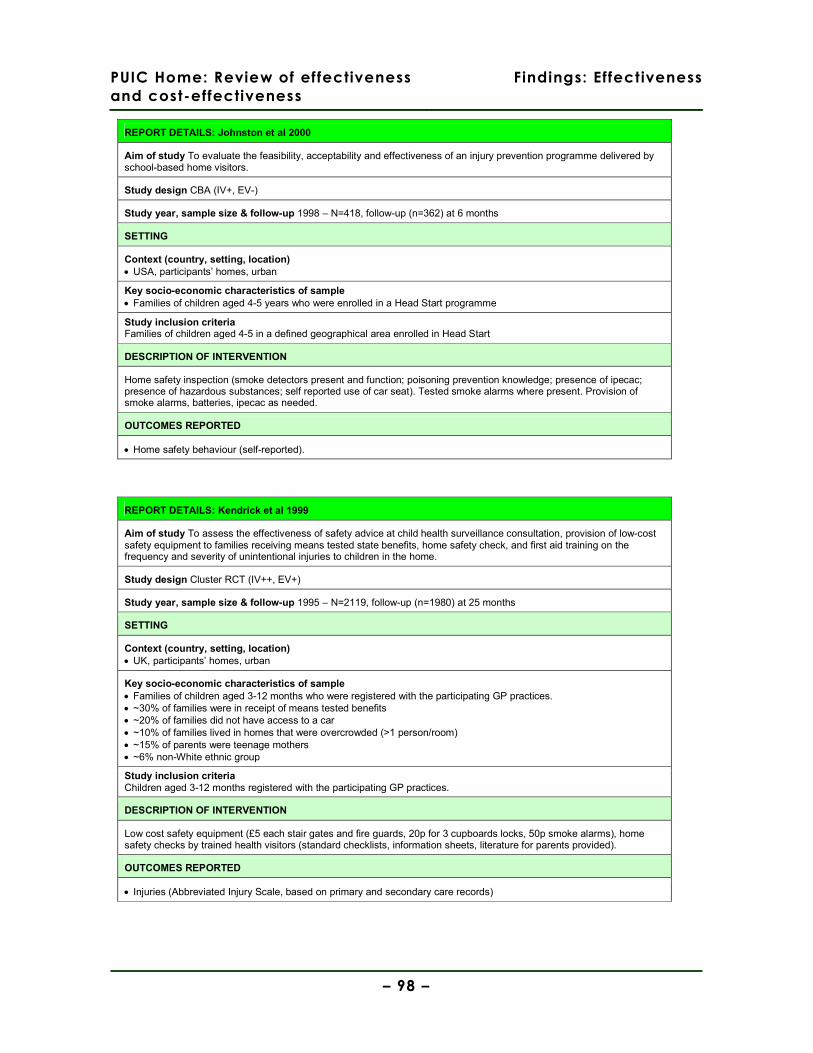
PUIC Home: Review of effectiveness
and cost-effectiveness
Findings: Effectiveness
– 98 –
REPORT DETAILS: Johnston et al 2000
Aim of study To evaluate the feasibility, acceptability and effectiveness of an injury prevention programme delivered by school-based home visitors.
Study design CBA (IV+, EV-)
Study year, sample size & follow-up 1998 – N=418, follow-up (n=362) at 6 months
SETTING
Context (country, setting, location) • USA, participants’ homes, urban
Key socio-economic characteristics of sample • Families of children aged 4-5 years who were enrolled in a Head Start programme
Study inclusion criteria Families of children aged 4-5 in a defined geographical area enrolled in Head Start
DESCRIPTION OF INTERVENTION
Home safety inspection (smoke detectors present and function; poisoning prevention knowledge; presence of ipecac; presence of hazardous substances; self reported use of car seat). Tested smoke alarms where present. Provision of smoke alarms, batteries, ipecac as needed.
OUTCOMES REPORTED
• Home safety behaviour (self-reported).
REPORT DETAILS: Kendrick et al 1999
Aim of study To assess the effectiveness of safety advice at child health surveillance consultation, provision of low-cost safety equipment to families receiving means tested state benefits, home safety check, and first aid training on the frequency and severity of unintentional injuries to children in the home.
Study design Cluster RCT (IV++, EV+)
Study year, sample size & follow-up 1995 – N=2119, follow-up (n=1980) at 25 months
SETTING
Context (country, setting, location) • UK, participants’ homes, urban
Key socio-economic characteristics of sample • Families of children aged 3-12 months who were registered with the participating GP practices. • ~30% of families were in receipt of means tested benefits • ~20% of families did not have access to a car • ~10% of families lived in homes that were overcrowded (>1 person/room) • ~15% of parents were teenage mothers • ~6% non-White ethnic group
Study inclusion criteria Children aged 3-12 months registered with the participating GP practices.
DESCRIPTION OF INTERVENTION
Low cost safety equipment (£5 each stair gates and fire guards, 20p for 3 cupboards locks, 50p smoke alarms), home safety checks by trained health visitors (standard checklists, information sheets, literature for parents provided).
OUTCOMES REPORTED
• Injuries (Abbreviated Injury Scale, based on primary and secondary care records)
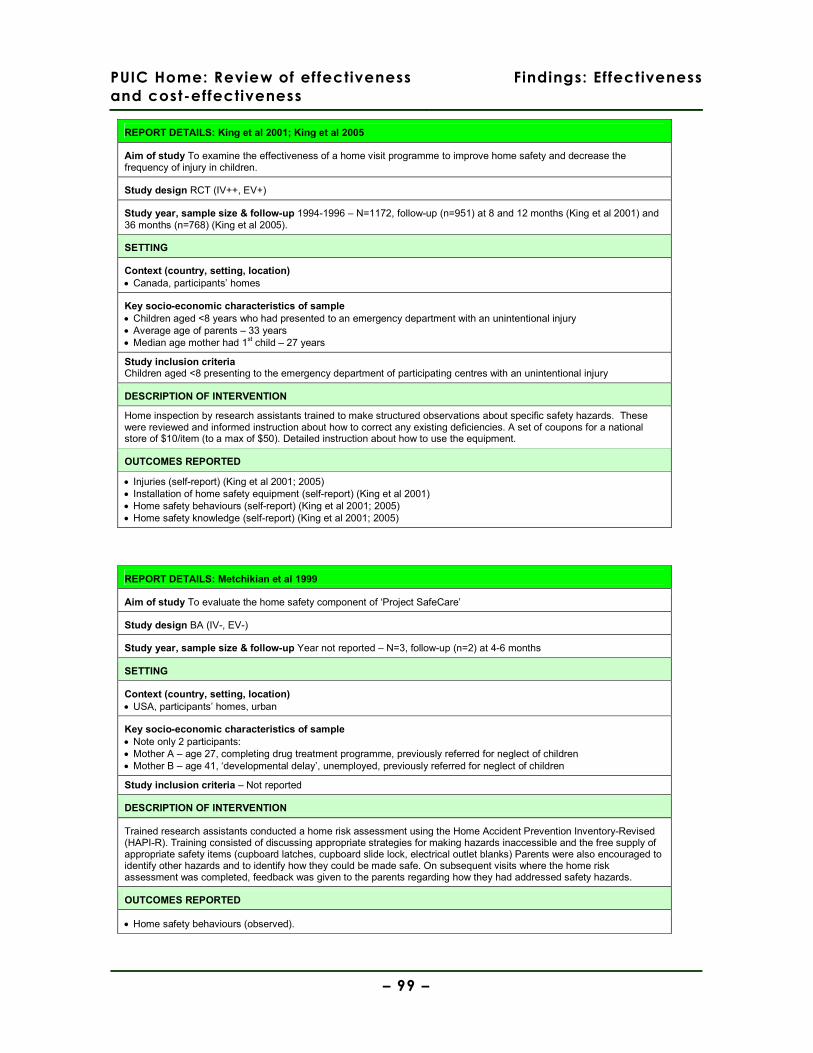
PUIC Home: Review of effectiveness
and cost-effectiveness
Findings: Effectiveness
– 99 –
REPORT DETAILS: King et al 2001; King et al 2005
Aim of study To examine the effectiveness of a home visit programme to improve home safety and decrease the frequency of injury in children.
Study design RCT (IV++, EV+)
Study year, sample size & follow-up 1994-1996 – N=1172, follow-up (n=951) at 8 and 12 months (King et al 2001) and 36 months (n=768) (King et al 2005).
SETTING
Context (country, setting, location) • Canada, participants’ homes
Key socio-economic characteristics of sample • Children aged <8 years who had presented to an emergency department with an unintentional injury • Average age of parents – 33 years • Median age mother had 1st child – 27 years
Study inclusion criteria Children aged <8 presenting to the emergency department of participating centres with an unintentional injury
DESCRIPTION OF INTERVENTION
Home inspection by research assistants trained to make structured observations about specific safety hazards. These were reviewed and informed instruction about how to correct any existing deficiencies. A set of coupons for a national store of $10/item (to a max of $50). Detailed instruction about how to use the equipment.
OUTCOMES REPORTED
• Injuries (self-report) (King et al 2001; 2005) • Installation of home safety equipment (self-report) (King et al 2001) • Home safety behaviours (self-report) (King et al 2001; 2005) • Home safety knowledge (self-report) (King et al 2001; 2005)
REPORT DETAILS: Metchikian et al 1999
Aim of study To evaluate the home safety component of ‘Project SafeCare’
Study design BA (IV-, EV-)
Study year, sample size & follow-up Year not reported – N=3, follow-up (n=2) at 4-6 months
SETTING
Context (country, setting, location) • USA, participants’ homes, urban
Key socio-economic characteristics of sample • Note only 2 participants: • Mother A – age 27, completing drug treatment programme, previously referred for neglect of children • Mother B – age 41, ‘developmental delay’, unemployed, previously referred for neglect of children
Study inclusion criteria – Not reported
DESCRIPTION OF INTERVENTION
Trained research assistants conducted a home risk assessment using the Home Accident Prevention Inventory-Revised (HAPI-R). Training consisted of discussing appropriate strategies for making hazards inaccessible and the free supply of appropriate safety items (cupboard latches, cupboard slide lock, electrical outlet blanks) Parents were also encouraged to identify other hazards and to identify how they could be made safe. On subsequent visits where the home risk assessment was completed, feedback was given to the parents regarding how they had addressed safety hazards.
OUTCOMES REPORTED
• Home safety behaviours (observed).
PUIC Home: Review of effectiveness
and cost-effectiveness
Findings: Effectiveness
– 100 –
5.9.2. Study quality and context
The before and after studies (Bablouzian et al 1997; Metchikian et al 1999) and one
of the two controlled before and after studies (Johnston et al 2000) contained a
number of significant methodological weaknesses; no study power calculations were
performed, convenience samples were obtained (with no rationale being provided for
doing so), and potential sources of bias (in particular, observation bias) in the
conduct and analysis of the research were not considered. Attrition was reasonable
(<20%) in the controlled study (Johnston et al 2000), but was either not reported
(Bablouzian et al 1997) or unacceptably high (33% (Metchikian et al 1999)) in the
uncontrolled studies. None of these three reports made any adjustments in their
analyses for what were potentially very important baseline differences in the socio-
economic characteristics of their participants. The very small sample size (n=2) in
one of the uncontrolled studies (Metchikian et al 1999), which may have allowed a
deeper understanding of participants’ characteristics and their home safety
behaviour, was not used in this way by the report’s authors.
The other controlled before and after study (Hendrickson 2005) was conducted to a
higher methodological standard; study power and the sample size required was
calculated, the selection of statistical tests was justified, an intention to treat analysis
was conducted, and attrition was less than 5%. However, details of the recruitment of
the sample are not supplied and the likelihood is that the sample was self-selected.
The researcher conducting the home visits at which self-efficacy was assessed was
also not blinded to the participant’s assignment to intervention or control group.
The four RCTs were all well-conducted (Babul et al 2007; Kendrick et al 1999; King et
al 2001; King et al 2005); randomisation procedures were clearly documented,
intervention and control groups were well-balanced at baseline on key socio-
economic characteristics, and intention to treat analyses (with the exception of Babul
et al 2007) were conducted. Kendrick et al (1999) report a large intraclass correlation
coefficient (0.017) that is greater than the sample size estimation and which may
indicate that the study was underpowered in its assessment of effect upon minor
injuries, but this weakness should not be considered serious. Attrition rates reported
by Babul et al (2007 – 14-22%) and King et al (2001 – 19%) were acceptable and
equally balanced between intervention and control groups; at 36 month follow-up,
King et al (2005) reported attrition of between 33 and 36% (broadly comparable in
PUIC Home: Review of effectiveness
and cost-effectiveness
Findings: Effectiveness
– 101 –
each trial arm), but again this is reasonable given the community-based nature of the
trial and the extended time period of the follow-up. With the exception of Kendrick et
al (1999) which utilised primary care records, the RCTs all contained the potential for
social desirability bias in the responses given by participants.
The majority of the studies used community health workers (usually health visitors or
community nurses) to conduct the home risk assessments, deliver home safety
education, and advise on equipment that could be supplied (Bablouzian et al 1997;
Babul et al 2007; Johnston et al 2000; Kendrick et al 1999). In three of the studies,
the intervention was integrated into wider child health programmes that were already
established, such as ‘Healthy Baby’ (Bablouzian et al 1997), ‘Project Safe Care’
(Metchikian et al 1999), and ‘Head Start’ (analagous to ‘Sure Start’ in the UK)
(Johnston et al 2000). Home safety equipment was supplied free of charge in all of
the studies except for Kendrick et al (1999) and King et al (2001; 2005), where it was
supplied at a discounted rate. In one study (Babul et al 2007), all equipment except
stair gates was supplied free of charge.
With the excetion of the study conducted in the UK (Kendrick et al 1999), the lack of
detail in the reports about the socio-economic characteristics of participants makes
judgement about their applicability to the UK problematic. Whilst all of the studies
made some effort to focus interventions on communities or households that were in
some way considered ‘at risk’, the basis upon which these judgements were made is
frequently unclear. The exception in this regard is King et al (2001; 2005), in which all
households sampled had a child who had previously presented to an emergency
department with an unintentional injury.
5.9.3. Findings
Injuries
Three of the eight reports presented data on medically attended injuries in children
over different follow-up periods after an intervention involving home risk assessment
and supply of home safety equipment (Kendrick et al 1999, Cluster RCT, IV++, EV+,
UK; King et al 2001, RCT, IV++, EV+, Canada; King et al 2005, RCT, IV++, EV+,
Canada) (Table 26, p.103).
PUIC Home: Review of effectiveness
and cost-effectiveness
Findings: Effectiveness
– 102 –
At 12 months follow-up, one report presented data (self-reported) showing a
statistically significant decrease in the incidence of medically attended injuries
between intervention and control groups (OR 0.75 (95% CI 0.58, 0.96) (King et al
2001)), whilst at 25 months follow-up, one report presented data (based on primary
and secondary care records) showing no statistically significant difference between
intervention and control groups (OR 0.97 (95% CI 0.72, 1.30) (Kendrick et al 1999)).
At 36 month follow-up, one report presented data (self-reported) showing a borderline
statistically non-significant difference between intervention and control groups in the
incidence of medically attended injuries (OR 0.80 (95% CI 0.64, 1.00) (King et al
2005)).
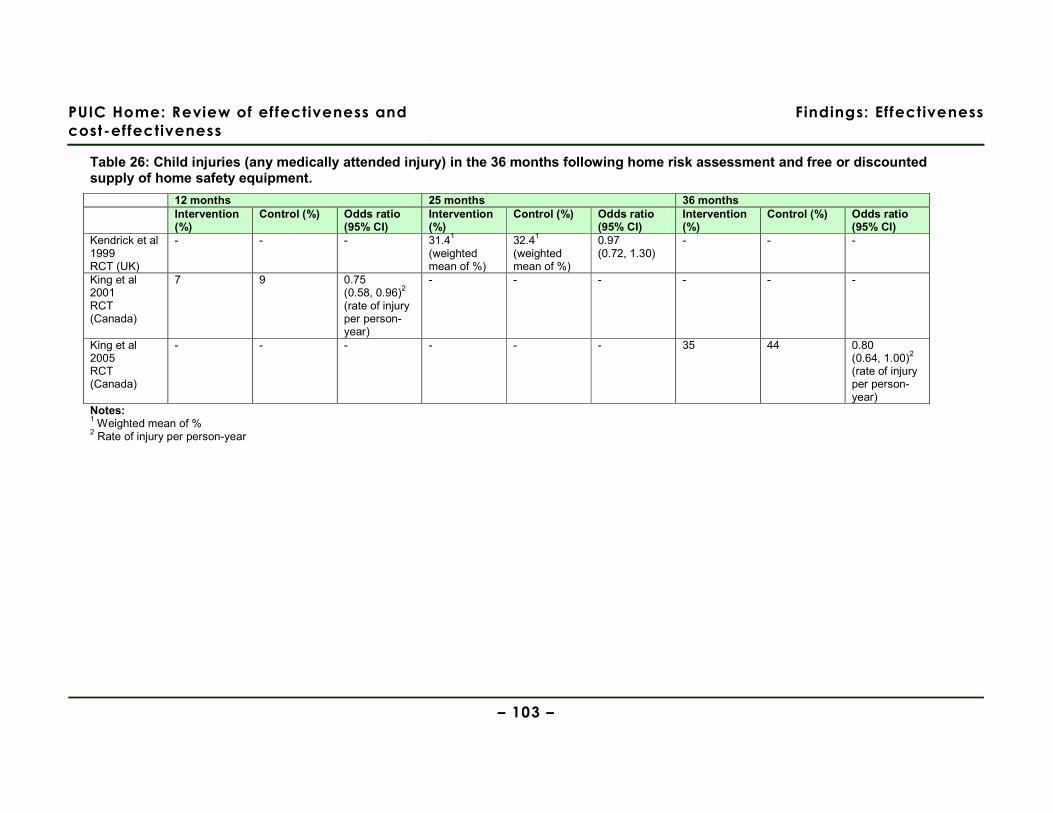
PUIC Home: Review of effectiveness and
cost-effectiveness
Findings: Effectiveness
– 103 –
Table 26: Child injuries (any medically attended injury) in the 36 months following home risk assessment and free or discounted supply of home safety equipment.
12 months 25 months 36 months Intervention
(%) Control (%) Odds ratio
(95% CI) Intervention (%)
Control (%) Odds ratio (95% CI)
Intervention (%)
Control (%) Odds ratio (95% CI)
Kendrick et al 1999 RCT (UK)
- - - 31.41 (weighted mean of %)
32.41 (weighted mean of %)
0.97 (0.72, 1.30)
- - -
King et al 2001 RCT (Canada)
7 9 0.75 (0.58, 0.96)2
(rate of injury per person-year)
- - - - - -
King et al 2005 RCT (Canada)
- - - - - - 35 44 0.80 (0.64, 1.00)2
(rate of injury per person-year)
Notes: 1 Weighted mean of % 2 Rate of injury per person-year
PUIC Home: Review of effectiveness
and cost-effectiveness
Findings: Effectiveness
– 104 –
Installation of home safety equipment
Four of the eight reports presented data about the rates of installation and use of
home safety equipment (Bablouzian et al 1997, BA, IV-, EV-, USA; Babul et al 2007,
RCT, IV+, EV+, Canada; Johnston et al 2000, CBA, IV+, EV-, USA; King et al 2001,
RCT, IV++, EV+, Canada) (Table 27, p.106). Three of these reports used upon
parents’ self-report to assess installation (Babul et al 2007; Johnston et al 2000; King
et al 2001) and one used both self-report and observation to assess installation, but
does not state what items were assessed using each method (Bablouzian et al 1997).
Across all the types of home safety equipment that was supplied and installed (smoke
alarms, stair gates, locks, latches and childproof caps, and electrical socket covers),
statistically significant effects were obtained only in studies that were uncontrolled
(Bablouzian et al 1997) or methodologically less rigorous (Johnston et al 2000).
Three of the eight reports presented data about the continuing use of smoke alarms
at between 6 and 12 months after the intervention (Babul et al 2007; Johnston et al
2000; King et al 2001). Two reports presented data showing no significant difference
between intervention and control groups (OR 1.15 (95% CI 0.72, 1.83) (Babul et al
2007); OR 1.45 (95% CI 0.94, 2.22) (King et al 2001)) and one study, in which the
confidence interval was wide, reported a statistically significant odds ratio that
strongly favoured the intervention group (OR 3.3 (95% CI 1.3, 8.6) (Johnston et al
2000)).
Two of the eight reports presented data about the continuing use of stair gates at 12
months after the intervention (Babul et al 2007; King et al 2001), both reporting no
statistically significant difference between intervention and control groups (OR 0.80
(95% CI 0.50, 1.27) (Babul et al 2007); OR 0.89 (95% CI 0.71, 1.13) (King et al
2001)).
Three of the eight reports presented data about the continuing use of locks or safety
latches to prevent the opening of windows or cupboards in which hazardous
substances were stored, or the use of childproof caps medicine bottles (Bablouzian et
al 2007; Babul et al 2007; King et al 2001) at 3-12 months after the intervention.
However, the two controlled studies reported no statistically significant difference
between intervention and control groups for using these pieces of safety equipment
PUIC Home: Review of effectiveness
and cost-effectiveness
Findings: Effectiveness
– 105 –
(OR 1.32 (95% CI 0.82, 2.13) (Babul et al 2007); OR 0.98 (95% CI 0.81, 1.19) (King
et al 2001)), whilst the uncontrolled study reported a highly statistically significant
before and after difference in the use of safety latches (p<0.01 (Bablouzian et al
1997)).
Two of the eight reports presented data about the continued use of electrical socket
covers at 3-12 months after the intervention (Bablouzian et al 1997; Babul et al
2007). The controlled study reported no statistically significant difference between
intervention and control groups (OR 1.51 (95% CI 0.74, 3.06) (Babul et al 2007)),
whilst the uncontrolled study reported a statistically significant before and after
difference in the use of the covers (p<0.05 (Bablouzian et al 1997)).
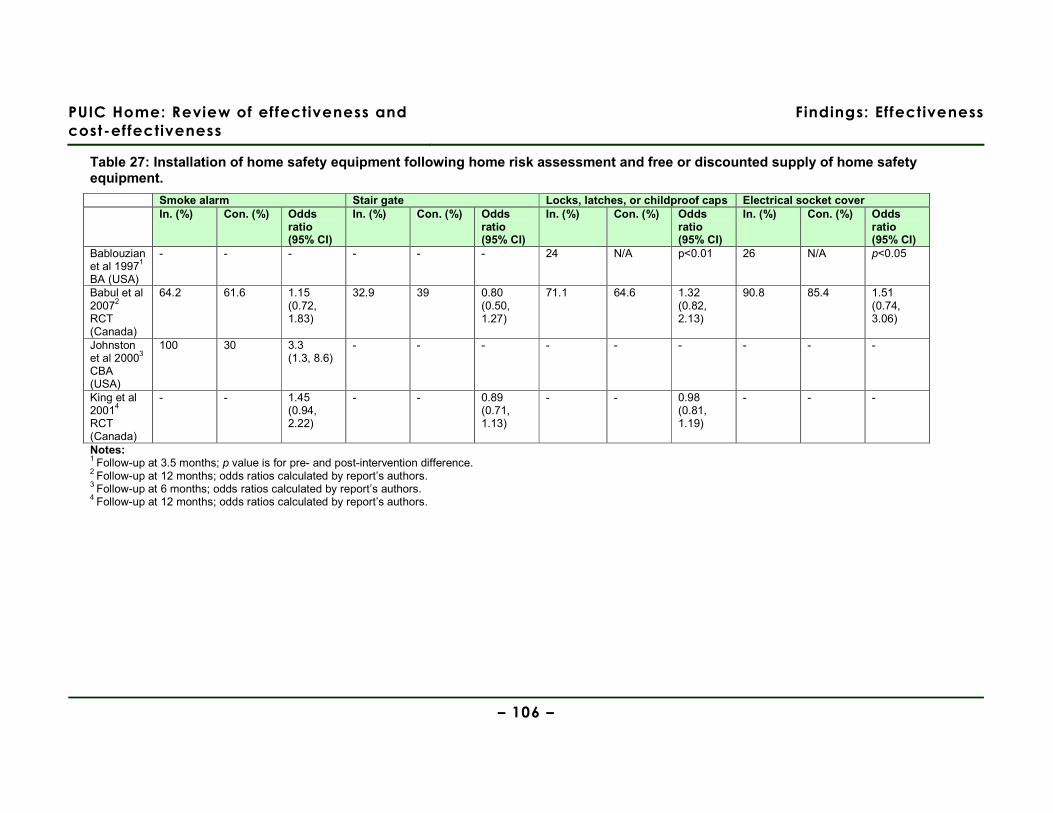
PUIC Home: Review of effectiveness and
cost-effectiveness
Findings: Effectiveness
– 106 –
Table 27: Installation of home safety equipment following home risk assessment and free or discounted supply of home safety equipment.
Smoke alarm Stair gate Locks, latches, or childproof caps Electrical socket cover In. (%) Con. (%) Odds
ratio (95% CI)
In. (%) Con. (%) Odds ratio (95% CI)
In. (%) Con. (%) Odds ratio (95% CI)
In. (%) Con. (%) Odds ratio (95% CI)
Bablouzian et al 19971
BA (USA)
- - - - - - 24 N/A p<0.01 26 N/A p<0.05
Babul et al 20072
RCT (Canada)
64.2 61.6 1.15 (0.72, 1.83)
32.9 39 0.80 (0.50, 1.27)
71.1 64.6 1.32 (0.82, 2.13)
90.8 85.4 1.51 (0.74, 3.06)
Johnston et al 20003
CBA (USA)
100 30 3.3 (1.3, 8.6)
- - - - - - - - -
King et al 20014
RCT (Canada)
- - 1.45 (0.94, 2.22)
- - 0.89 (0.71, 1.13)
- - 0.98 (0.81, 1.19)
- - -
Notes: 1 Follow-up at 3.5 months; p value is for pre- and post-intervention difference. 2 Follow-up at 12 months; odds ratios calculated by report’s authors. 3 Follow-up at 6 months; odds ratios calculated by report’s authors. 4 Follow-up at 12 months; odds ratios calculated by report’s authors.
PUIC Home: Review of effectiveness
and cost-effectiveness
Findings: Effectiveness
– 107 –
Home safety knowledge and behaviour
Seven of the eight reports presented data about changes in home safety knowledge
and behaviour (Bablouzian et al 1997, BA, IV-, EV-, USA; Babul et al 2007, RCT, IV+,
EV+, Canada; Hendrickson 2005, CBA, IV+, EV+, USA; Johnston et al 2000, CBA,
IV+, EV-, USA; King et al 2001, RCT, IV++, EV+, Canada; King et al 2005, RCT,
IV++, EV+, Canada; Metchikian et al 1999, BA, IV-, EV-, USA).
Four of these reports used parental self-report to assess changes in knowledge and
behaviour (Babul et al 2007; Johnston et al 2000; King et al 2001; King et al 2005),
and one used both self-report and observation to assess these changes, but does not
state what behaviours were assessed using each method (Bablouzian et al 1997).
Two reports used measures of self-efficacy to assess parental beliefs in the amount
of control they had to prevent unintentional injuries occurring to their children
(Hendrickson 2005; King et al 2005). One report used observation in the home to
assess changes in parental behaviour (Metchikian et al 1999).
Changes in home safety knowledge and behaviour relating to specific types of injury
are shown in Table 28 (p.109) and changes in perceived self-efficacy (the extent to
which parents feel they have the ability to prevent unintentional injuries occurring to
their children) are reported in the text.
Two of the eight reports presented data showing no statistically significant difference
between the intervention and control groups in changes to home safety knowledge
and behaviour about prevention of fires or falls (Bablouzian et al 1997; Babul et al
2007) and one about preventing drowning (Babul et al 2007). In one study there
appeared to be more fire extinguishers present in the control group than the
intervention group at twelve month follow up (OR 0.81 (95% CI 0.67, 0.97)) (King et
al 2001).
Two of the eight reports presented data showing statistically significant improvements
in the intervention group compared to the control group in knowledge and behaviour
relating to the prevention of scalds (OR 2.65 (95% CI 1.57, 4.46) (Babul et al 2007);
OR 1.31 (95% CI 1.14, 1.50) (King et al 2001)), whilst one uncontrolled study
reported no statistically significant pre- and post-intervention difference in the
intervention group (Bablouzian et al 1997) (Table 28, p.109). Three of the eight
PUIC Home: Review of effectiveness
and cost-effectiveness
Findings: Effectiveness
– 108 –
reports presented data showing mixed results regarding improvements in knowledge
about the prevention of poisoning (Babul et al 2007; Johnston et al 2000; King et al
2001). One of the eight reports presented data showing a statistically significant
difference between intervention and control groups (OR 2.1 (95% CI 1.3, 3.2)
(Johnston et al 2000)), whilst two of the eight reports presented data showing no
statistically significant difference between intervention and control groups (OR 1.20
(95% CI 0.16, 8.91) (Babul et al 2007); OR 1.04 (95% CI 0.89, 1.22) (King et al
2001)).
Two of the eight reports presented data comparing intervention and control groups’
knowledge and behaviour about the prevention of falls. This favoured the intervention
but was statistically non-significant (OR 1.25 (95% CI 0.17, 9.32) (Babul et al 2007);
OR 1.08 (95% CI 0.93, 1.25) (King et al 2001)). One uncontrolled study reported a
non-significant p value (odds ratio not reported or calculable) for the pre- and post-
intervention difference in knowledge and behaviour about the prevention of falls
(Bablouzian et al 1997).
One of the seven studies (Metchikian et al 1999) measured improvements in home
safety knowledge and behaviour by the researcher counting the number of hazards in
each room of the household (see shaded area of Table 28, p.109), meaning that the
results cannot be reported in terms of knowledge about preventing particular injury
types. The very small sample size (n=2) prohibits any meaningful transformation of
the data into a common metric. The study reports a dramatic reduction in both
participants’ households in the number of hazards present in each room (Metchikian
et al 1999).
Two of the eight reports presented data about parents’ perceived self-efficacy in
preventing their children from sustaining an unintentional injury (Hendrickson 2005;
King et al 2001). A statistically significant difference between intervention and control
groups (showing increased levels of self-efficacy in the intervention group) was
reported by Hendrickson (2005) (F (2, 77) = 7.50, p=0.01), whereas a statistically
non-significant difference between intervention and control groups was reported by
King et al (2001) (MD 5.1 (95% CI -1.3, 11.5)).
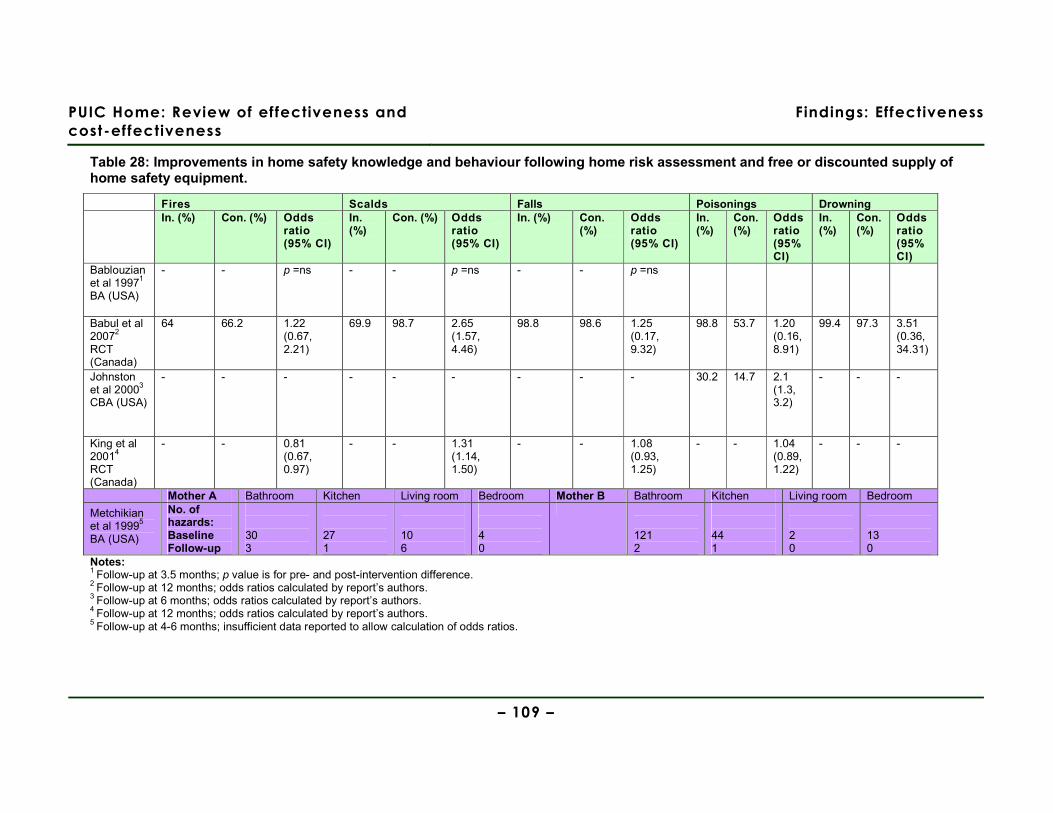
PUIC Home: Review of effectiveness and
cost-effectiveness
Findings: Effectiveness
– 109 –
Table 28: Improvements in home safety knowledge and behaviour following home risk assessment and free or discounted supply of home safety equipment.
Fires Scalds Falls Poisonings Drowning In. (%) Con. (%) Odds
ratio (95% CI)
In. (%)
Con. (%) Odds ratio (95% CI)
In. (%) Con. (%)
Odds ratio (95% CI)
In. (%)
Con. (%)
Odds ratio (95% CI)
In. (%)
Con. (%)
Odds ratio (95% CI)
Bablouzian et al 19971
BA (USA)
- - p =ns - - p =ns - - p =ns
Babul et al 20072
RCT (Canada)
64 66.2 1.22 (0.67, 2.21)
69.9 98.7 2.65 (1.57, 4.46)
98.8 98.6 1.25 (0.17, 9.32)
98.8 53.7 1.20 (0.16, 8.91)
99.4 97.3 3.51 (0.36, 34.31)
Johnston et al 20003
CBA (USA)
- - - - - - - - - 30.2 14.7 2.1 (1.3, 3.2)
- - -
King et al 20014
RCT (Canada)
- - 0.81 (0.67, 0.97)
- - 1.31 (1.14, 1.50)
- - 1.08 (0.93, 1.25)
- - 1.04 (0.89, 1.22)
- - -
Mother A Bathroom Kitchen Living room Bedroom Mother B Bathroom Kitchen Living room Bedroom
Metchikian et al 19995
BA (USA)
No. of hazards: Baseline Follow-up
30 3
27 1
10 6
4 0
121 2
44 1
2 0
13 0
Notes: 1 Follow-up at 3.5 months; p value is for pre- and post-intervention difference. 2 Follow-up at 12 months; odds ratios calculated by report’s authors. 3 Follow-up at 6 months; odds ratios calculated by report’s authors. 4 Follow-up at 12 months; odds ratios calculated by report’s authors. 5 Follow-up at 4-6 months; insufficient data reported to allow calculation of odds ratios.
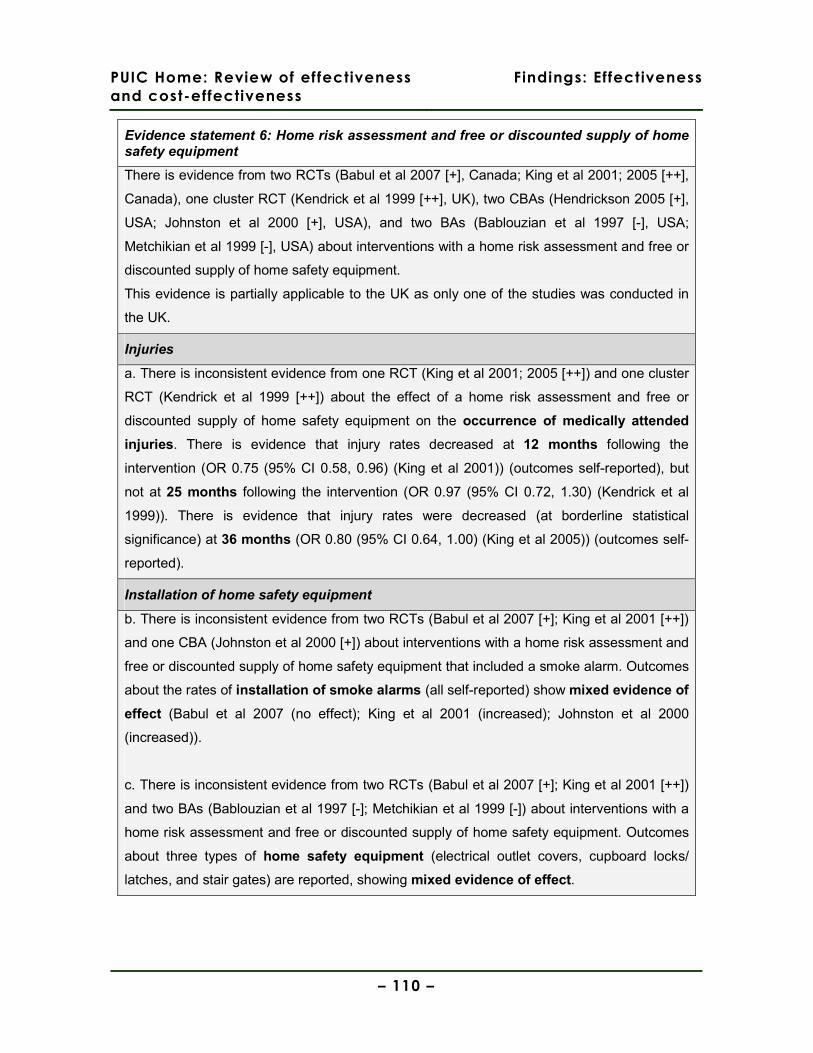
PUIC Home: Review of effectiveness
and cost-effectiveness
Findings: Effectiveness
– 110 –
Evidence statement 6: Home risk assessment and free or discounted supply of home safety equipment
There is evidence from two RCTs (Babul et al 2007 [+], Canada; King et al 2001; 2005 [++],
Canada), one cluster RCT (Kendrick et al 1999 [++], UK), two CBAs (Hendrickson 2005 [+],
USA; Johnston et al 2000 [+], USA), and two BAs (Bablouzian et al 1997 [-], USA;
Metchikian et al 1999 [-], USA) about interventions with a home risk assessment and free or
discounted supply of home safety equipment.
This evidence is partially applicable to the UK as only one of the studies was conducted in
the UK.
Injuries
a. There is inconsistent evidence from one RCT (King et al 2001; 2005 [++]) and one cluster
RCT (Kendrick et al 1999 [++]) about the effect of a home risk assessment and free or
discounted supply of home safety equipment on the occurrence of medically attended
injuries. There is evidence that injury rates decreased at 12 months following the
intervention (OR 0.75 (95% CI 0.58, 0.96) (King et al 2001)) (outcomes self-reported), but
not at 25 months following the intervention (OR 0.97 (95% CI 0.72, 1.30) (Kendrick et al
1999)). There is evidence that injury rates were decreased (at borderline statistical
significance) at 36 months (OR 0.80 (95% CI 0.64, 1.00) (King et al 2005)) (outcomes self-
reported).
Installation of home safety equipment
b. There is inconsistent evidence from two RCTs (Babul et al 2007 [+]; King et al 2001 [++])
and one CBA (Johnston et al 2000 [+]) about interventions with a home risk assessment and
free or discounted supply of home safety equipment that included a smoke alarm. Outcomes
about the rates of installation of smoke alarms (all self-reported) show mixed evidence of
effect (Babul et al 2007 (no effect); King et al 2001 (increased); Johnston et al 2000
(increased)).
c. There is inconsistent evidence from two RCTs (Babul et al 2007 [+]; King et al 2001 [++])
and two BAs (Bablouzian et al 1997 [-]; Metchikian et al 1999 [-]) about interventions with a
home risk assessment and free or discounted supply of home safety equipment. Outcomes
about three types of home safety equipment (electrical outlet covers, cupboard locks/
latches, and stair gates) are reported, showing mixed evidence of effect.
PUIC Home: Review of effectiveness
and cost-effectiveness
Findings: Effectiveness
– 111 –
Home safety knowledge and behaviour
d. There is moderate evidence from two RCTs (Babul et al 2007 [+]; King et al 2001 [++])
and one BA (Bablouzian et al 1997 [-]) that a home risk assessment and free or discounted
supply of home safety equipment does not improve home safety knowledge and
behaviour about preventing fires or falls (Bablouzian et al 1997; Babul et al 2007; King et al
2001 (fires only)).
e. There is inconsistent evidence from two RCTs (Babul et al 2007 [+]; King et al 2001 [++]),
one CBA (Johnston et al 2000 [+]) and one BA (Bablouzian et al 1997 [-]) about the effect of
a home risk assessment and free or discounted supply of home safety equipment on home
safety knowledge. Knowledge about preventing scalds was improved (Babul et al 2007;
King et al 2001), however there was mixed evidence of effect upon knowledge about the
prevention of poisoning (Babul et al 2007 (no effect); Johnston et al 2000 (improved); King
et al 2001 (no effect)).
f. There is weak evidence from one RCT (Babul et al 2007 [+]) that a home risk assessment
and free or discounted supply of home safety equipment does not improve home safety
knowledge and behaviour about preventing drowning (Babul et al 2007).
g. There is inconsistent evidence from one RCT (King et al 2001 [++]) and one CBA
(Hendrickson 2005 [+]) about the effect of a home risk assessment and free or discounted
supply of home safety equipment on parents’ perceived self-efficacy. There is evidence
from one CBA that there was a significant difference between intervention and control
groups in self-efficacy at 6 weeks follow-up (Hendrickson 2005). However, there is evidence
from one RCT that self-efficacy did not improve at 12 months follow-up (King et al 2001).
h. There is evidence from one BA (Metchikian et al 1999 [-]) that a home risk assessment
and free or discounted supply of home safety equipment improves home safety knowledge
and behaviour (as a whole) at 4-6 months follow-up (descriptive data only).
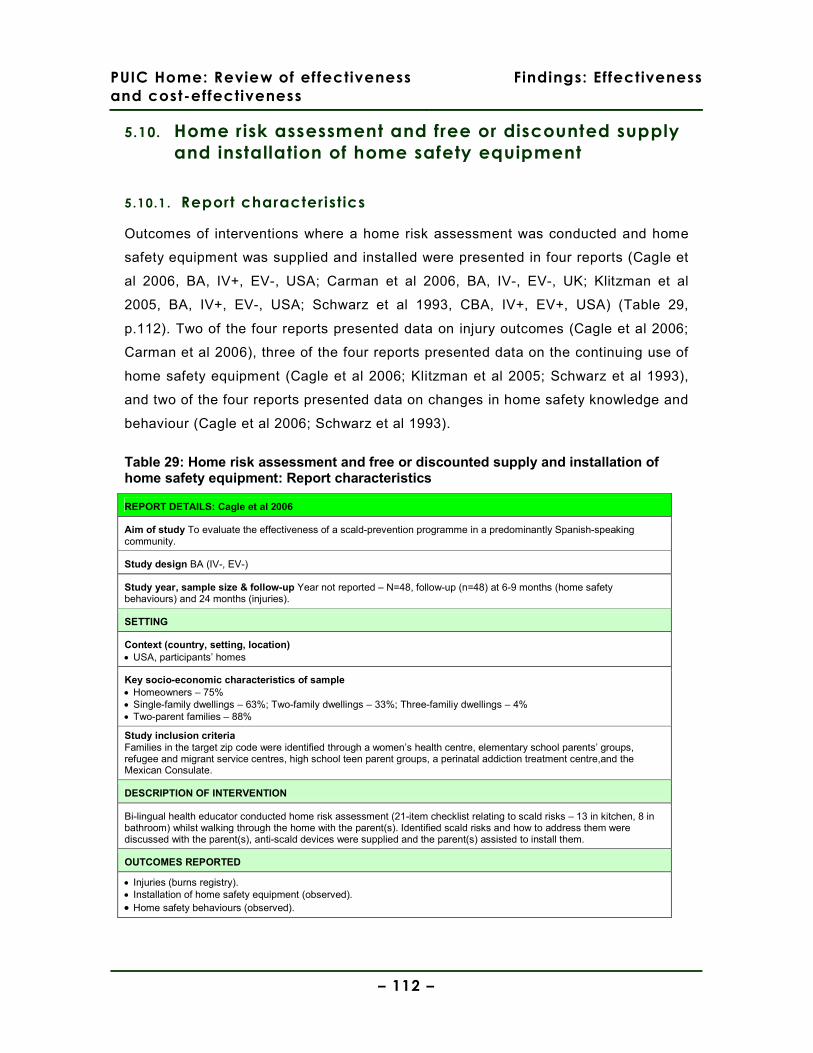
PUIC Home: Review of effectiveness
and cost-effectiveness
Findings: Effectiveness
– 112 –
5.10. Home risk assessment and free or discounted supply
and installation of home safety equipment
5.10.1 . Report characteristics
Outcomes of interventions where a home risk assessment was conducted and home
safety equipment was supplied and installed were presented in four reports (Cagle et
al 2006, BA, IV+, EV-, USA; Carman et al 2006, BA, IV-, EV-, UK; Klitzman et al
2005, BA, IV+, EV-, USA; Schwarz et al 1993, CBA, IV+, EV+, USA) (Table 29,
p.112). Two of the four reports presented data on injury outcomes (Cagle et al 2006;
Carman et al 2006), three of the four reports presented data on the continuing use of
home safety equipment (Cagle et al 2006; Klitzman et al 2005; Schwarz et al 1993),
and two of the four reports presented data on changes in home safety knowledge and
behaviour (Cagle et al 2006; Schwarz et al 1993).
Table 29: Home risk assessment and free or discounted supply and installation of home safety equipment: Report characteristics
REPORT DETAILS: Cagle et al 2006
Aim of study To evaluate the effectiveness of a scald-prevention programme in a predominantly Spanish-speaking community.
Study design BA (IV-, EV-)
Study year, sample size & follow-up Year not reported – N=48, follow-up (n=48) at 6-9 months (home safety behaviours) and 24 months (injuries).
SETTING
Context (country, setting, location) • USA, participants’ homes
Key socio-economic characteristics of sample • Homeowners – 75% • Single-family dwellings – 63%; Two-family dwellings – 33%; Three-familiy dwellings – 4% • Two-parent families – 88%
Study inclusion criteria Families in the target zip code were identified through a women’s health centre, elementary school parents’ groups, refugee and migrant service centres, high school teen parent groups, a perinatal addiction treatment centre,and the Mexican Consulate.
DESCRIPTION OF INTERVENTION
Bi-lingual health educator conducted home risk assessment (21-item checklist relating to scald risks – 13 in kitchen, 8 in bathroom) whilst walking through the home with the parent(s). Identified scald risks and how to address them were discussed with the parent(s), anti-scald devices were supplied and the parent(s) assisted to install them.
OUTCOMES REPORTED
• Injuries (burns registry). • Installation of home safety equipment (observed). • Home safety behaviours (observed).
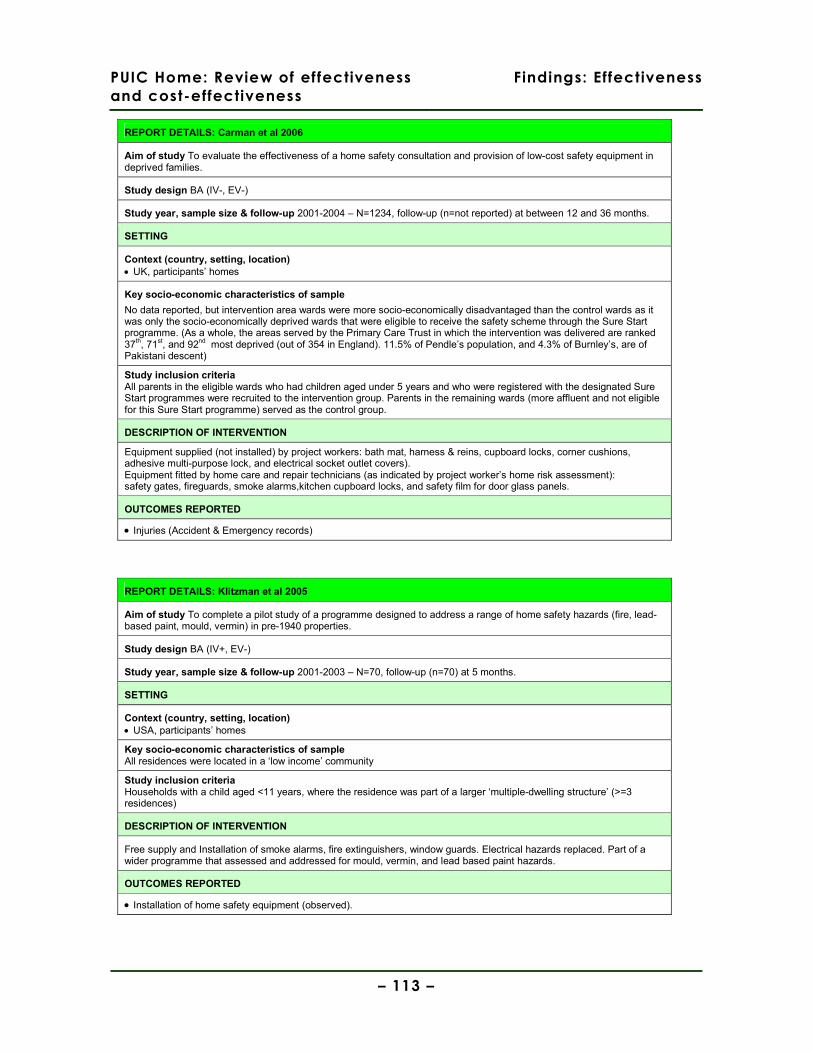
PUIC Home: Review of effectiveness
and cost-effectiveness
Findings: Effectiveness
– 113 –
REPORT DETAILS: Carman et al 2006
Aim of study To evaluate the effectiveness of a home safety consultation and provision of low-cost safety equipment in deprived families.
Study design BA (IV-, EV-)
Study year, sample size & follow-up 2001-2004 – N=1234, follow-up (n=not reported) at between 12 and 36 months.
SETTING
Context (country, setting, location) • UK, participants’ homes
Key socio-economic characteristics of sample
No data reported, but intervention area wards were more socio-economically disadvantaged than the control wards as it was only the socio-economically deprived wards that were eligible to receive the safety scheme through the Sure Start programme. (As a whole, the areas served by the Primary Care Trust in which the intervention was delivered are ranked 37th, 71st, and 92nd most deprived (out of 354 in England). 11.5% of Pendle’s population, and 4.3% of Burnley’s, are of Pakistani descent)
Study inclusion criteria All parents in the eligible wards who had children aged under 5 years and who were registered with the designated Sure Start programmes were recruited to the intervention group. Parents in the remaining wards (more affluent and not eligible for this Sure Start programme) served as the control group.
DESCRIPTION OF INTERVENTION
Equipment supplied (not installed) by project workers: bath mat, harness & reins, cupboard locks, corner cushions, adhesive multi-purpose lock, and electrical socket outlet covers). Equipment fitted by home care and repair technicians (as indicated by project worker’s home risk assessment): safety gates, fireguards, smoke alarms,kitchen cupboard locks, and safety film for door glass panels.
OUTCOMES REPORTED
• Injuries (Accident & Emergency records)
REPORT DETAILS: Klitzman et al 2005
Aim of study To complete a pilot study of a programme designed to address a range of home safety hazards (fire, lead-based paint, mould, vermin) in pre-1940 properties.
Study design BA (IV+, EV-)
Study year, sample size & follow-up 2001-2003 – N=70, follow-up (n=70) at 5 months.
SETTING
Context (country, setting, location) • USA, participants’ homes
Key socio-economic characteristics of sample All residences were located in a ‘low income’ community
Study inclusion criteria Households with a child aged <11 years, where the residence was part of a larger ‘multiple-dwelling structure’ (>=3 residences)
DESCRIPTION OF INTERVENTION
Free supply and Installation of smoke alarms, fire extinguishers, window guards. Electrical hazards replaced. Part of a wider programme that assessed and addressed for mould, vermin, and lead based paint hazards.
OUTCOMES REPORTED
• Installation of home safety equipment (observed).
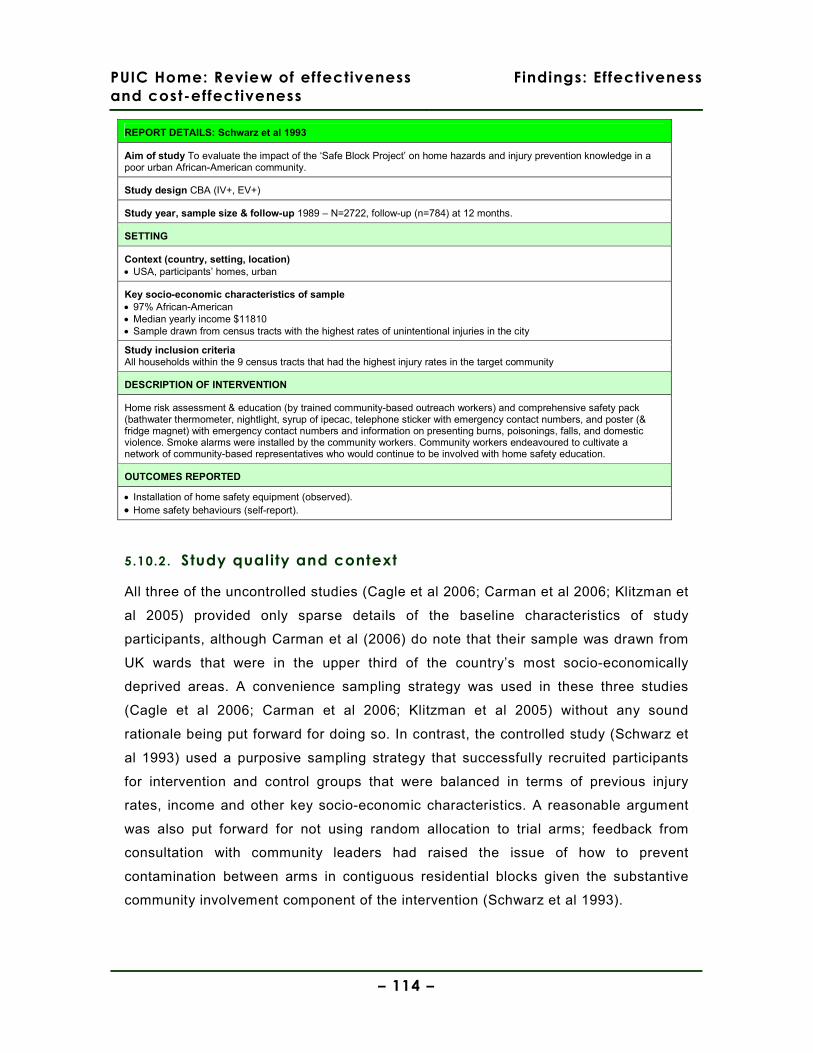
PUIC Home: Review of effectiveness
and cost-effectiveness
Findings: Effectiveness
– 114 –
REPORT DETAILS: Schwarz et al 1993
Aim of study To evaluate the impact of the ‘Safe Block Project’ on home hazards and injury prevention knowledge in a poor urban African-American community.
Study design CBA (IV+, EV+)
Study year, sample size & follow-up 1989 – N=2722, follow-up (n=784) at 12 months.
SETTING
Context (country, setting, location) • USA, participants’ homes, urban
Key socio-economic characteristics of sample • 97% African-American • Median yearly income $11810 • Sample drawn from census tracts with the highest rates of unintentional injuries in the city
Study inclusion criteria All households within the 9 census tracts that had the highest injury rates in the target community
DESCRIPTION OF INTERVENTION
Home risk assessment & education (by trained community-based outreach workers) and comprehensive safety pack (bathwater thermometer, nightlight, syrup of ipecac, telephone sticker with emergency contact numbers, and poster (& fridge magnet) with emergency contact numbers and information on presenting burns, poisonings, falls, and domestic violence. Smoke alarms were installed by the community workers. Community workers endeavoured to cultivate a network of community-based representatives who would continue to be involved with home safety education.
OUTCOMES REPORTED
• Installation of home safety equipment (observed). • Home safety behaviours (self-report).
5.10.2 . Study quality and context
All three of the uncontrolled studies (Cagle et al 2006; Carman et al 2006; Klitzman et
al 2005) provided only sparse details of the baseline characteristics of study
participants, although Carman et al (2006) do note that their sample was drawn from
UK wards that were in the upper third of the country’s most socio-economically
deprived areas. A convenience sampling strategy was used in these three studies
(Cagle et al 2006; Carman et al 2006; Klitzman et al 2005) without any sound
rationale being put forward for doing so. In contrast, the controlled study (Schwarz et
al 1993) used a purposive sampling strategy that successfully recruited participants
for intervention and control groups that were balanced in terms of previous injury
rates, income and other key socio-economic characteristics. A reasonable argument
was also put forward for not using random allocation to trial arms; feedback from
consultation with community leaders had raised the issue of how to prevent
contamination between arms in contiguous residential blocks given the substantive
community involvement component of the intervention (Schwarz et al 1993).

PUIC Home: Review of effectiveness
and cost-effectiveness
Findings: Effectiveness
– 115 –
Attrition rates were not reported in two of the three uncontrolled studies (Cagle et al
2006; Carman et al 2006), and was reported as 0% in Klitzman et al (2005). The
controlled study lost 28% of participants to follow-up (equally balanced between
intervention and control groups), which was not unreasonable given the nature of the
intervention and the length of follow-up (12 months) (Schwarz et al 1993).
One of the uncontrolled studies (Carman et al 2006) had significant weaknesses in
the methods used to evaluate outcomes (for example, it is unclear whether the
Accident & Emergency attendance measured related to unintentional injuries or all
reasons for attendance, and the numbers of children aged under 5 years attending is
estimated from proportions in area wards rather than using hospital data), meaning
that its findings should be treated with great caution.
Although the four studies (Cagle et al 2006; Carman et al 2006; Klitzman et al 2005;
Schwarz et al 1993) were similar in the sense that they all placed great importance
on gaining the trust of study participants (the likelihood of participants agreeing to
allow access to their homes for assessment and installation of home safety
equipment otherwise being very low), they differed considerably in the nature of the
communities in which they were conducted and the wider programmes of which they
were a part. The UK study (Carman et al 2006) was attached to a ‘Sure Start’ scheme
in an urban area of northern England that was socio-economically deprived and which
had substantive (c.5-12%) of Pakistani descent; the intervention supplied and
installed a wide range of home safety equipment, including smoke alarms. In
contrast, the three studies conducted in the USA (Cagle et al 2006; Klitzman et al
2005; Schwarz et al 1993) focused upon a much narrower spectrum of home safety
equipment, but did so within an approach that endeavoured to foster wider community
health. For example, Cagle et al (2006) supplied and installed only thermostatic
valves, but this was preceeded by community focus groups in which parents were
encouraged to discuss home safety issues. Klitzman et al’s (2005) home safety
equipment intervention was part of a much wider health programme in which hazards
such as mould and infestations in poorly-maintained housing stock were addressed.
Finally, Schwarz et al (1993), in an intervention that took place in a predominantly
African-American community resident in blocks of flats, adopted an approach to the
intervention that prioritised community involvement and therefore also endeavoured

PUIC Home: Review of effectiveness
and cost-effectiveness
Findings: Effectiveness
– 116 –
to address issues (such as violence and homicides in the community) that were not
directly related to unintentional injuries in children.
5.10.3 . Findings
Injuries
Two of the four reports presented data on child injury outcomes following an
intervention involving a home risk assessment and the free or discounted supply and
installation of home safety equipment (Cagle et al 2006, BA, IV-, EV-, USA; Carman
et al 2006, BA, IV-, IV-, UK). The data presented in these reports is based upon a
burns registry (Cagle et al 2006) and A&E records (Carman et al 2006), but its limited
presentation prevents synthesis using a common metric.
Admissions to hospital (as a result of scalds) for children aged under 5 years in the
intervention area were reported to have fallen from 137/100000 in the two years prior
to the intervention to 59/100000 chidren (aged 0-5 years) in the two years after the
intervention, a statistically significant difference (p<.01) (Cagle et al 2006).
Attendances at Accident & Emergency by children aged under 5 years (for all but
minor ailments) were reported to fall in both intervention and control groups over the
lifetime of the intervention (from 36% to 28.6%, and from 28.2% to 24.2%, in the
intervention and control groups respectively), but no analysis is attempted (nor
sufficient data presented to allow calculation by the review team) to test for
statistically significant differences between the groups (Carman et al 2006).
Installation of home safety equipment
Three of the four reports presented data (observed) on the continuing use of home
safety equipment following an intervention involving a home risk assessment and the
free or discounted supply and installation of home safety equipment (Cagle et al
2006, BA, IV-, EV-, USA; Klitzman et al 2005, BA, IV+, EV-, USA; Schwarz et al
1993, CBA, IV+, EV+, USA).
One report simply presents the percentage (60%) of installed thermostatic valves that
remained in-situ and functioning at follow-up at between 6 and 9 months (Cagle et al
2006). One report presented data showing a statistically significant (p<0.0001) pre-
and post-intervention difference for the installation of window guards, smoke alarms,
PUIC Home: Review of effectiveness
and cost-effectiveness
Findings: Effectiveness
– 117 –
and fire extinguishers (Klitzman et al 2005). Finally, the one controlled study that
reported odds ratios found a strong, statistically significant difference between
intervention and control groups in the installation of smoke alarms (OR 0.14 (95% CI
0.09, 0.20), indicating that the absence of smoke alarms was significantly reduced in
the intervention group (Schwarz et al 1993)
Home safety knowledge and behaviour
Two of the four reports presented data about changes in home safety knowledge and
behaviour following an intervention involving a home risk assessment and the free or
discounted supply and installation of home safety equipment (Cagle et al 2006, BA,
IV-, EV-, UK; Schwarz et al 1993, CBA, IV+, EV+, USA). One report used data based
on observation (Cagle et al 2006) and one used self-reported data (Schwarz et al
1993).
One study simply measured the average number of scald risks per household,
reporting a statistically significant (p<.01) pre- to post-intervention fall from 7 (+/-2) to
2 (+/-1) (Cagle et al 2006) (Table 30, p.118). The controlled study reported the
opposite effect, with the intervention group being statistically significantly more likely
to have not adjusted the household’s hot water temperature to below 125°F (OR 1.73
(95% CI 1.39, 2.15) (Schwarz et al 1993). An effect in the same direction, but which
was not statistically significant, was reported in the same study for the non-use of
childproof caps on medication bottles (OR 1.53 (95% CI 0.95, 2.46)). However, the
intervention was reported as having a statistically significant effect on the absence of
fire escape plans in the intervention group (OR 0.30 (95% CI 0.24, 0.38) Schwarz et
al 1993)).
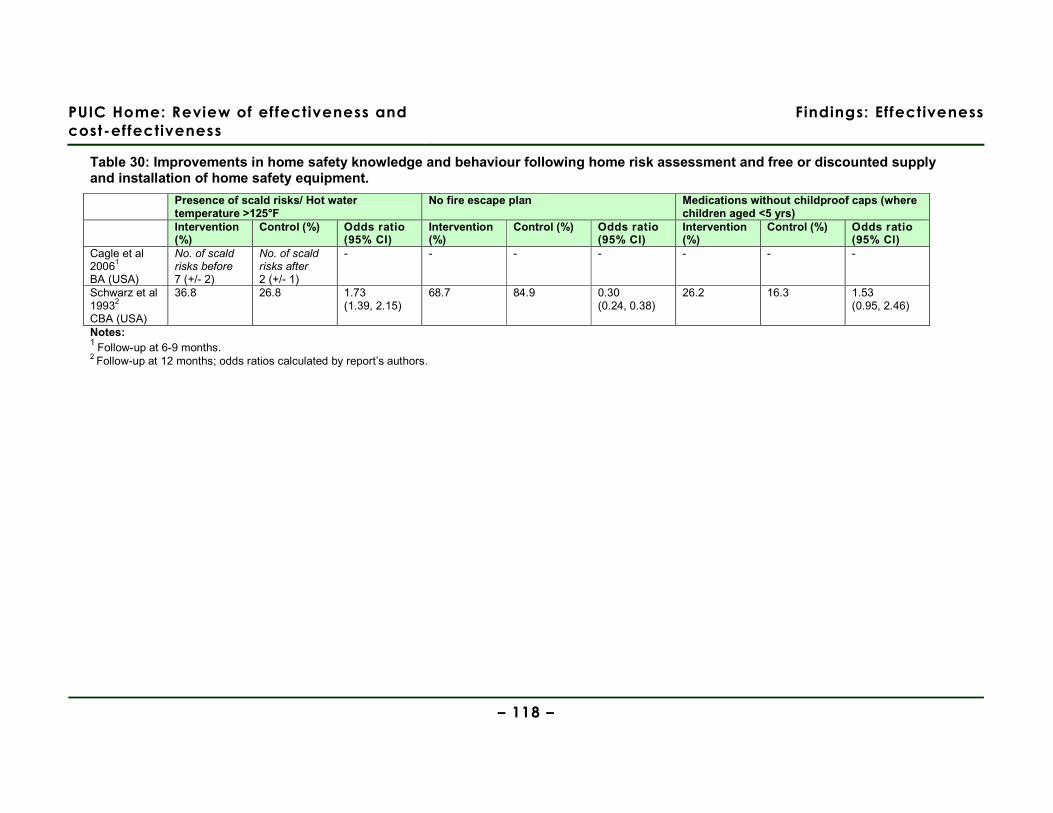
PUIC Home: Review of effectiveness and
cost-effectiveness
Findings: Effectiveness
– 118 –
Table 30: Improvements in home safety knowledge and behaviour following home risk assessment and free or discounted supply and installation of home safety equipment.
Presence of scald risks/ Hot water temperature >125°F
No fire escape plan Medications without childproof caps (where children aged <5 yrs)
Intervention (%)
Control (%) Odds ratio (95% CI)
Intervention (%)
Control (%) Odds ratio (95% CI)
Intervention (%)
Control (%) Odds ratio (95% CI)
Cagle et al 20061
BA (USA)
No. of scald risks before 7 (+/- 2)
No. of scald risks after 2 (+/- 1)
- - - - - - -
Schwarz et al 19932
CBA (USA)
36.8 26.8 1.73 (1.39, 2.15)
68.7 84.9 0.30 (0.24, 0.38)
26.2 16.3 1.53 (0.95, 2.46)
Notes: 1 Follow-up at 6-9 months. 2 Follow-up at 12 months; odds ratios calculated by report’s authors.
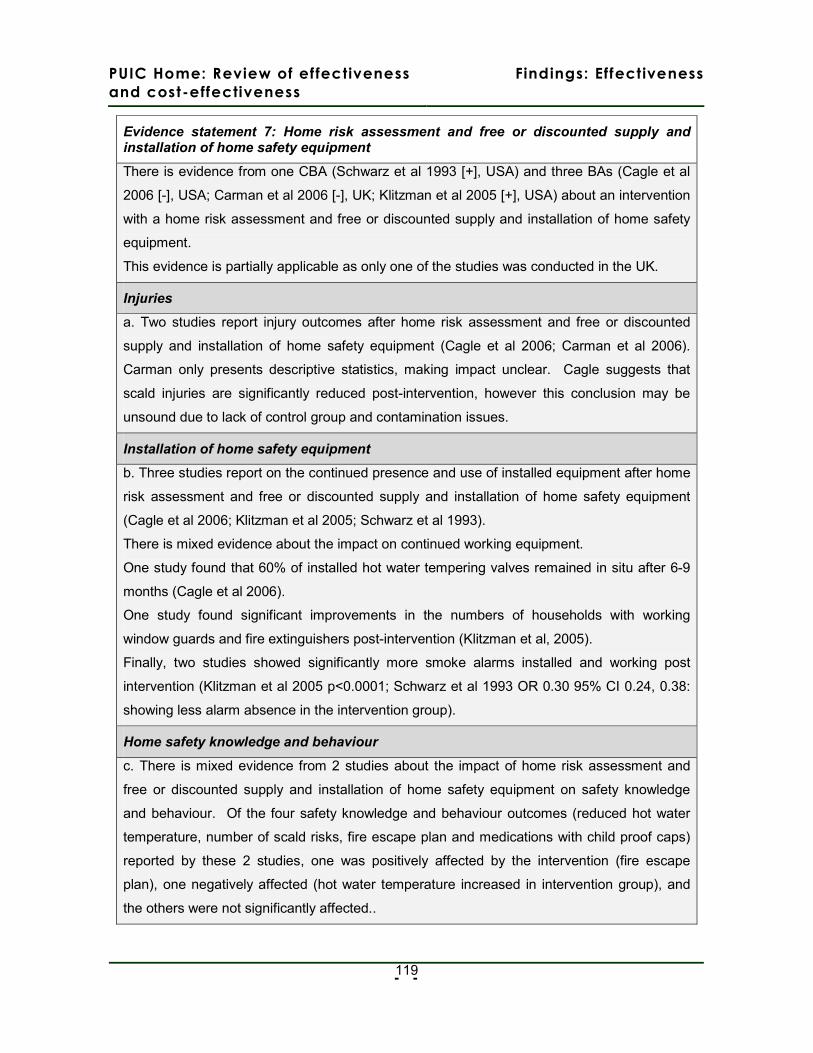
PUIC Home: Review of effectiveness
and cost-effectiveness
Findings: Effectiveness
- -
119
Evidence statement 7: Home risk assessment and free or discounted supply and installation of home safety equipment
There is evidence from one CBA (Schwarz et al 1993 [+], USA) and three BAs (Cagle et al
2006 [-], USA; Carman et al 2006 [-], UK; Klitzman et al 2005 [+], USA) about an intervention
with a home risk assessment and free or discounted supply and installation of home safety
equipment.
This evidence is partially applicable as only one of the studies was conducted in the UK.
Injuries
a. Two studies report injury outcomes after home risk assessment and free or discounted
supply and installation of home safety equipment (Cagle et al 2006; Carman et al 2006).
Carman only presents descriptive statistics, making impact unclear. Cagle suggests that
scald injuries are significantly reduced post-intervention, however this conclusion may be
unsound due to lack of control group and contamination issues.
Installation of home safety equipment
b. Three studies report on the continued presence and use of installed equipment after home
risk assessment and free or discounted supply and installation of home safety equipment
(Cagle et al 2006; Klitzman et al 2005; Schwarz et al 1993).
There is mixed evidence about the impact on continued working equipment.
One study found that 60% of installed hot water tempering valves remained in situ after 6-9
months (Cagle et al 2006).
One study found significant improvements in the numbers of households with working
window guards and fire extinguishers post-intervention (Klitzman et al, 2005).
Finally, two studies showed significantly more smoke alarms installed and working post
intervention (Klitzman et al 2005 p<0.0001; Schwarz et al 1993 OR 0.30 95% CI 0.24, 0.38:
showing less alarm absence in the intervention group).
Home safety knowledge and behaviour
c. There is mixed evidence from 2 studies about the impact of home risk assessment and
free or discounted supply and installation of home safety equipment on safety knowledge
and behaviour. Of the four safety knowledge and behaviour outcomes (reduced hot water
temperature, number of scald risks, fire escape plan and medications with child proof caps)
reported by these 2 studies, one was positively affected by the intervention (fire escape
plan), one negatively affected (hot water temperature increased in intervention group), and
the others were not significantly affected..
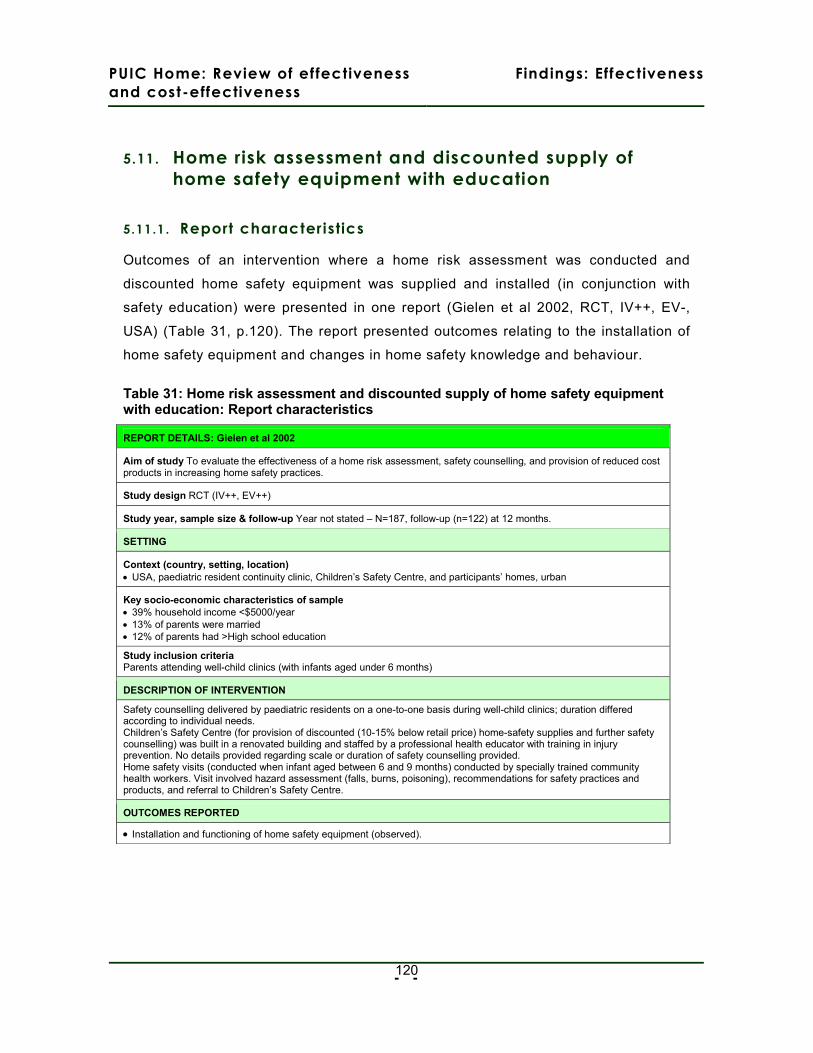
PUIC Home: Review of effectiveness
and cost-effectiveness
Findings: Effectiveness
- -
120
5.11. Home risk assessment and discounted supply of
home safety equipment with education
5.11.1 . Report characteristics
Outcomes of an intervention where a home risk assessment was conducted and
discounted home safety equipment was supplied and installed (in conjunction with
safety education) were presented in one report (Gielen et al 2002, RCT, IV++, EV-,
USA) (Table 31, p.120). The report presented outcomes relating to the installation of
home safety equipment and changes in home safety knowledge and behaviour.
Table 31: Home risk assessment and discounted supply of home safety equipment with education: Report characteristics
REPORT DETAILS: Gielen et al 2002
Aim of study To evaluate the effectiveness of a home risk assessment, safety counselling, and provision of reduced cost products in increasing home safety practices.
Study design RCT (IV++, EV++)
Study year, sample size & follow-up Year not stated – N=187, follow-up (n=122) at 12 months.
SETTING
Context (country, setting, location) • USA, paediatric resident continuity clinic, Children’s Safety Centre, and participants’ homes, urban
Key socio-economic characteristics of sample • 39% household income <$5000/year • 13% of parents were married • 12% of parents had >High school education
Study inclusion criteria Parents attending well-child clinics (with infants aged under 6 months)
DESCRIPTION OF INTERVENTION
Safety counselling delivered by paediatric residents on a one-to-one basis during well-child clinics; duration differed according to individual needs. Children’s Safety Centre (for provision of discounted (10-15% below retail price) home-safety supplies and further safety counselling) was built in a renovated building and staffed by a professional health educator with training in injury prevention. No details provided regarding scale or duration of safety counselling provided. Home safety visits (conducted when infant aged between 6 and 9 months) conducted by specially trained community health workers. Visit involved hazard assessment (falls, burns, poisoning), recommendations for safety practices and products, and referral to Children’s Safety Centre.
OUTCOMES REPORTED
• Installation and functioning of home safety equipment (observed).
PUIC Home: Review of effectiveness
and cost-effectiveness
Findings: Effectiveness
- -
121
5.11.2 . Study quality and context
The study (Gielen et al 2002) was conducted to a high standard; randomisation
procedures were clearly documented, intervention and control groups were well-
balanced at baseline on key socio-economic characteristics, the regression analysis
conducted adjusted for exposure to key intervention componenents, and the depth
and breadth of the intervention itself is described fully. However, it should also be
noted that an intention to treat analysis was not conducted and that difficulties in
contacting participants at follow-up meant that attrition was high (51% intervention,
49% control, although no significant differences were found between intervention and
control groups lost to follow-up). The study was moderately underpowered (using
α=.05 and β=.20) in obtaining a sample size of 93 and 94 in the intervention and
control groups respectively (100 participants in each group were required).
The intervention reported by Gielen et al (2002), in which 94% of the participants
were African American, is distinctive for its extent. Safety counselling was delivered
by paediatric residents (who had taken part in a 5-hour training programme on
childhood injuries and safety counselling) during well-child clinics, and was re-
enforced by a professional health educator at the Children’s Safety Centre which had
been specifically constructed as part of the intervention. This Centre also acted as an
outlet from which parents could obtain home safety equipment at 10-15% below retail
prices. In addition, families in the intervention arm received a home risk assessment
(conducted by a specially trained community health worker) at between 6 and 9
months following the initial safety counselling. The report’s authors note that a likely
self-selection bias existed in that families who visited the Centre and made use of the
opportunity to obtain home safety equipment and advice were socio-economically
more advantaged than those who did not.
5.11.3 . Findings
Injur ies
The study (Gielen et al 2002) evaluating the effectiveness of home risk assessments
and discounted supply of home safety equipment in conjunction with education did not
report injury outcomes.
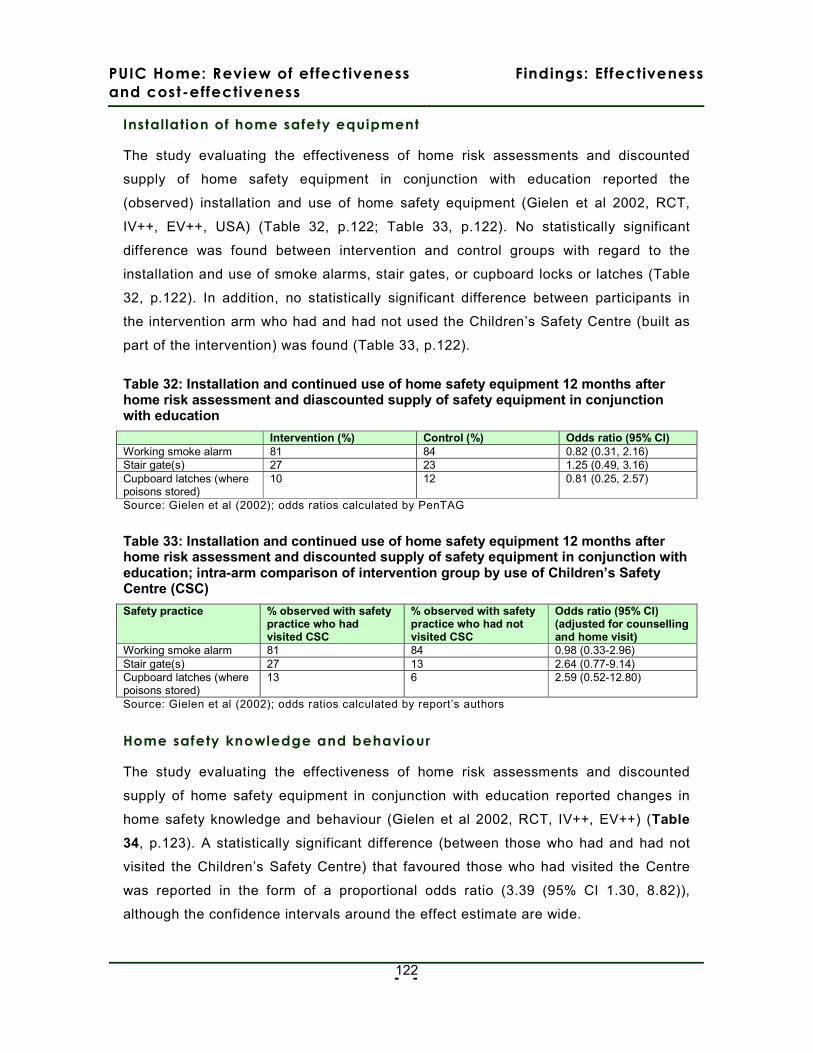
PUIC Home: Review of effectiveness
and cost-effectiveness
Findings: Effectiveness
- -
122
Installation of home safety equipment
The study evaluating the effectiveness of home risk assessments and discounted
supply of home safety equipment in conjunction with education reported the
(observed) installation and use of home safety equipment (Gielen et al 2002, RCT,
IV++, EV++, USA) (Table 32, p.122; Table 33, p.122). No statistically significant
difference was found between intervention and control groups with regard to the
installation and use of smoke alarms, stair gates, or cupboard locks or latches (Table
32, p.122). In addition, no statistically significant difference between participants in
the intervention arm who had and had not used the Children’s Safety Centre (built as
part of the intervention) was found (Table 33, p.122).
Table 32: Installation and continued use of home safety equipment 12 months after home risk assessment and diascounted supply of safety equipment in conjunction with education
Intervention (%) Control (%) Odds ratio (95% CI) Working smoke alarm 81 84 0.82 (0.31, 2.16) Stair gate(s) 27 23 1.25 (0.49, 3.16) Cupboard latches (where poisons stored)
10 12 0.81 (0.25, 2.57)
Source: Gielen et al (2002); odds ratios calculated by PenTAG
Table 33: Installation and continued use of home safety equipment 12 months after home risk assessment and discounted supply of safety equipment in conjunction with education; intra-arm comparison of intervention group by use of Children’s Safety Centre (CSC)
Safety practice % observed with safety practice who had visited CSC
% observed with safety practice who had not visited CSC
Odds ratio (95% CI) (adjusted for counselling and home visit)
Working smoke alarm 81 84 0.98 (0.33-2.96) Stair gate(s) 27 13 2.64 (0.77-9.14) Cupboard latches (where poisons stored)
13 6 2.59 (0.52-12.80)
Source: Gielen et al (2002); odds ratios calculated by report’s authors
Home safety knowledge and behaviour
The study evaluating the effectiveness of home risk assessments and discounted
supply of home safety equipment in conjunction with education reported changes in
home safety knowledge and behaviour (Gielen et al 2002, RCT, IV++, EV++) (Table
34, p.123). A statistically significant difference (between those who had and had not
visited the Children’s Safety Centre) that favoured those who had visited the Centre
was reported in the form of a proportional odds ratio (3.39 (95% CI 1.30, 8.82)),
although the confidence intervals around the effect estimate are wide.
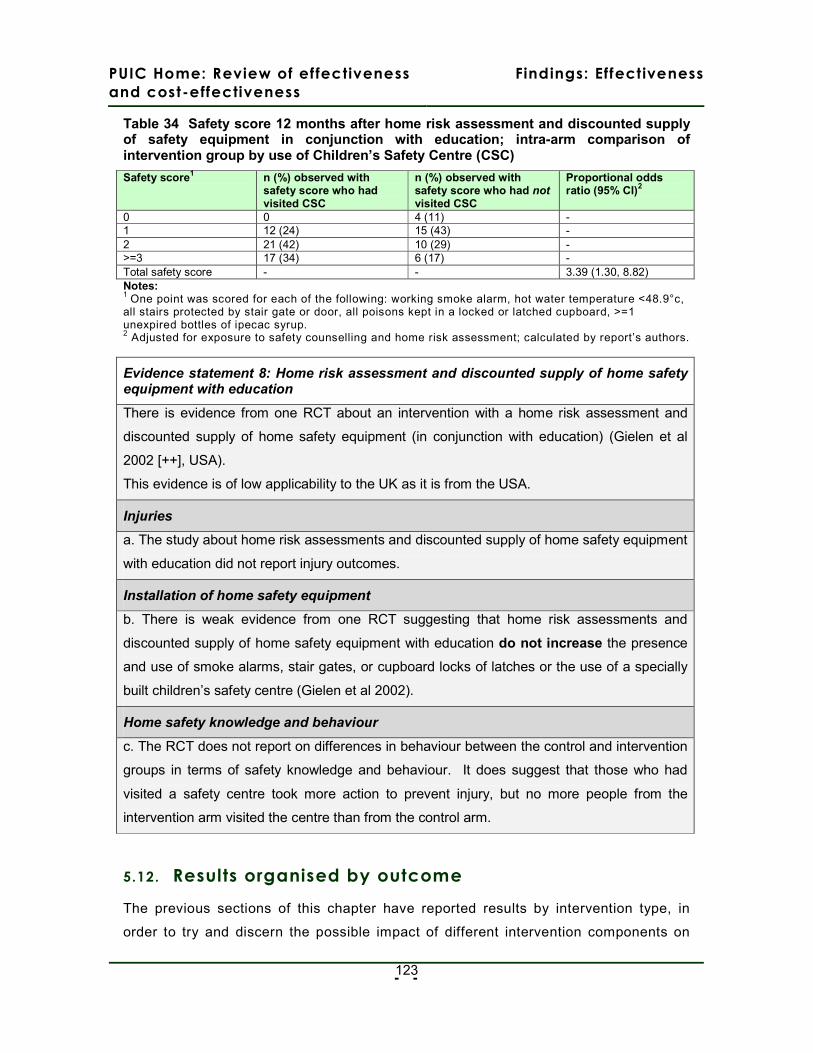
PUIC Home: Review of effectiveness
and cost-effectiveness
Findings: Effectiveness
- -
123
Table 34 Safety score 12 months after home risk assessment and discounted supply of safety equipment in conjunction with education; intra-arm comparison of intervention group by use of Children’s Safety Centre (CSC)
Safety score1 n (%) observed with safety score who had visited CSC
n (%) observed with safety score who had not visited CSC
Proportional odds ratio (95% CI)2
0 0 4 (11) - 1 12 (24) 15 (43) - 2 21 (42) 10 (29) - >=3 17 (34) 6 (17) - Total safety score - - 3.39 (1.30, 8.82) Notes: 1 One point was scored for each of the following: working smoke alarm, hot water temperature <48.9°c, all stairs protected by stair gate or door, all poisons kept in a locked or latched cupboard, >=1 unexpired bottles of ipecac syrup. 2 Adjusted for exposure to safety counselling and home risk assessment; calculated by report’s authors.
Evidence statement 8: Home risk assessment and discounted supply of home safety equipment with education
There is evidence from one RCT about an intervention with a home risk assessment and
discounted supply of home safety equipment (in conjunction with education) (Gielen et al
2002 [++], USA).
This evidence is of low applicability to the UK as it is from the USA.
Injuries
a. The study about home risk assessments and discounted supply of home safety equipment
with education did not report injury outcomes.
Installation of home safety equipment
b. There is weak evidence from one RCT suggesting that home risk assessments and
discounted supply of home safety equipment with education do not increase the presence
and use of smoke alarms, stair gates, or cupboard locks of latches or the use of a specially
built children’s safety centre (Gielen et al 2002).
Home safety knowledge and behaviour
c. The RCT does not report on differences in behaviour between the control and intervention
groups in terms of safety knowledge and behaviour. It does suggest that those who had
visited a safety centre took more action to prevent injury, but no more people from the
intervention arm visited the centre than from the control arm.
5.12. Results organised by outcome
The previous sections of this chapter have reported results by intervention type, in
order to try and discern the possible impact of different intervention components on
PUIC Home: Review of effectiveness
and cost-effectiveness
Findings: Effectiveness
- -
124
effectiveness. Given the extremely diverse nature of the findings, however, we
represent them here in summary form to show results by two key outcome groups:
injury outcomes and correctly installed, functioning presence of safety equipment. We
have not done this for the knowledge and behaviour outcomes as these are even
more diversely recorded and reported, and because there is no way of quantifying any
possible relationship in changing knowledge and ultimate impact on injury outcomes.
This section also considered the reliability of this evidence in terms of the study
design, external validity and applicability to a UK setting.
There are a number of dimensions of good study design. We believe that the best
quality evidence will come from studies in which an appropriate control group is
present, which has sufficient length of follow up, and which uses observed, rather
than self-reported, outcome measures. In reality, these dimensions may be traded
off, for example, longer follow up being desirable, but also likely to lead to greater
attrition, which may limit the meaningfulness of the findings.
5.12.1 . Impact of all interventions on injury rates
Of the 22 included studies, only seven directly measured the impact of their
interventions on injury rates (see Table 35). Of these seven studies, four found no
significant reduction in injury with any intervention (three RCTs - DiGuiseppi et al
1999, 2000; Watson et al, 2005; Kendrick et al, 1990; and one uncontrolled before
and after study – Carmen et al, 2006). Indeed the study by Watson et al suggest that
minor injuries (those for which GP consultation is sought) actually increased in the
intervention group. The three that did suggest injury rates are reduced all have
limitations, which are discussed below (Cagle et al, 2006; King et al, 2001, 2005;
Mallonee et al, 1996).
Cagle et al (2006 ) reported a significant reduction in scald injuries to children aged 0-
5, using an uncontrolled before and after study design with 24 month follow up. It
assessed a focused scald prevention programme among 48 households from a largely
Spanish-speaking community in USA (Cagle et al, 2006). This represented a self
selected sample from over 900 parents who attended an initial safety education
workshop and who agreed to have a home assessment and follow up. Data about
scald injury was taken from a burn registry and assessed scalds in children from the
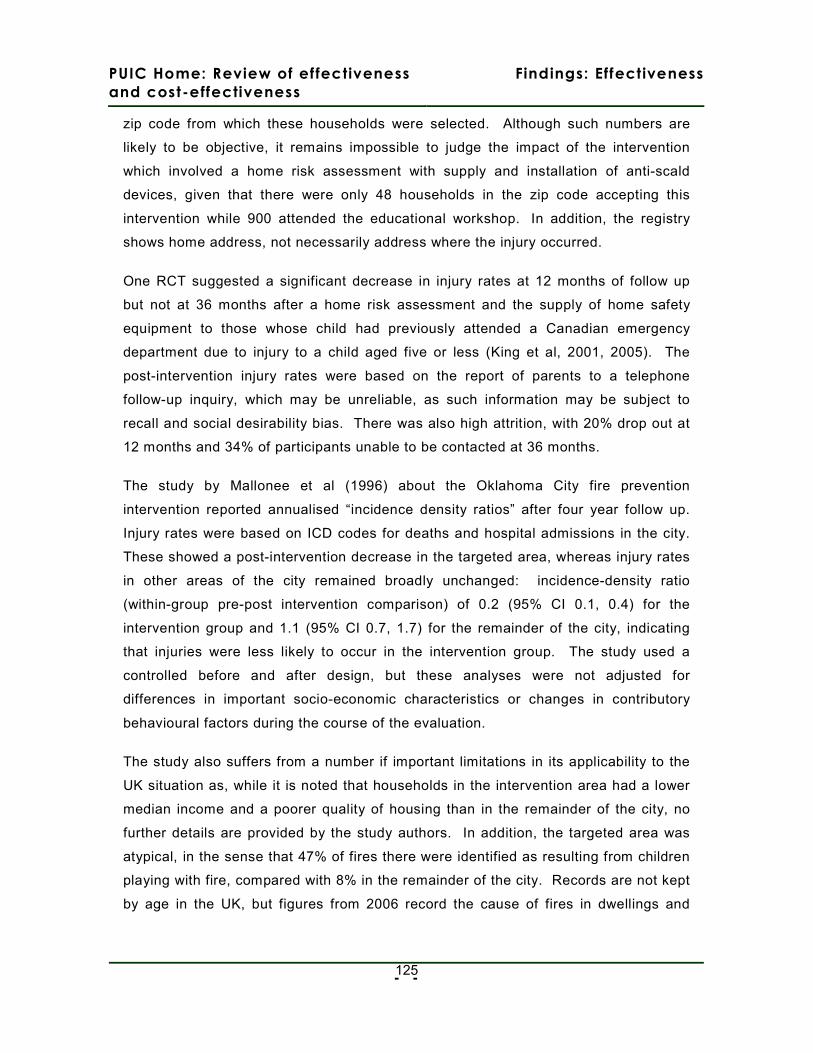
PUIC Home: Review of effectiveness
and cost-effectiveness
Findings: Effectiveness
- -
125
zip code from which these households were selected. Although such numbers are
likely to be objective, it remains impossible to judge the impact of the intervention
which involved a home risk assessment with supply and installation of anti-scald
devices, given that there were only 48 households in the zip code accepting this
intervention while 900 attended the educational workshop. In addition, the registry
shows home address, not necessarily address where the injury occurred.
One RCT suggested a significant decrease in injury rates at 12 months of follow up
but not at 36 months after a home risk assessment and the supply of home safety
equipment to those whose child had previously attended a Canadian emergency
department due to injury to a child aged five or less (King et al, 2001, 2005). The
post-intervention injury rates were based on the report of parents to a telephone
follow-up inquiry, which may be unreliable, as such information may be subject to
recall and social desirability bias. There was also high attrition, with 20% drop out at
12 months and 34% of participants unable to be contacted at 36 months.
The study by Mallonee et al (1996) about the Oklahoma City fire prevention
intervention reported annualised “incidence density ratios” after four year follow up.
Injury rates were based on ICD codes for deaths and hospital admissions in the city.
These showed a post-intervention decrease in the targeted area, whereas injury rates
in other areas of the city remained broadly unchanged: incidence-density ratio
(within-group pre-post intervention comparison) of 0.2 (95% CI 0.1, 0.4) for the
intervention group and 1.1 (95% CI 0.7, 1.7) for the remainder of the city, indicating
that injuries were less likely to occur in the intervention group. The study used a
controlled before and after design, but these analyses were not adjusted for
differences in important socio-economic characteristics or changes in contributory
behavioural factors during the course of the evaluation.
The study also suffers from a number if important limitations in its applicability to the
UK situation as, while it is noted that households in the intervention area had a lower
median income and a poorer quality of housing than in the remainder of the city, no
further details are provided by the study authors. In addition, the targeted area was
atypical, in the sense that 47% of fires there were identified as resulting from children
playing with fire, compared with 8% in the remainder of the city. Records are not kept
by age in the UK, but figures from 2006 record the cause of fires in dwellings and
PUIC Home: Review of effectiveness
and cost-effectiveness
Findings: Effectiveness
- -
126
other buildings as “playing with fire” in 400 out of a total of 45,700 fires
(0.88%).(Communities and Local Government 2008)
Disappointingly, we therefore suggest that there is no convincing evidence applicable
to the UK situation that any of the interventions included in this review reduced
unintentional injury to children in the home.
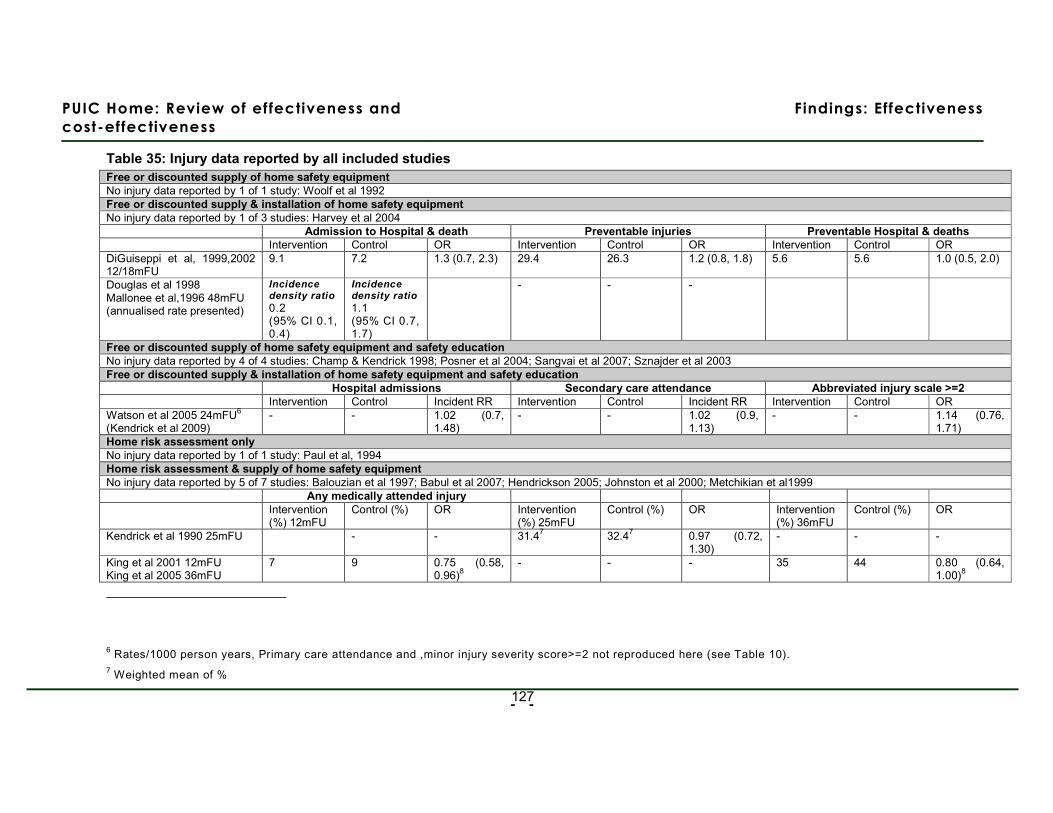
PUIC Home: Review of effectiveness and
cost-effectiveness
Findings: Effectiveness
- -
127
Table 35: Injury data reported by all included studies Free or discounted supply of home safety equipment No injury data reported by 1 of 1 study: Woolf et al 1992 Free or discounted supply & installation of home safety equipment No injury data reported by 1 of 3 studies: Harvey et al 2004 Admission to Hospital & death Preventable injuries Preventable Hospital & deaths Intervention Control OR Intervention Control OR Intervention Control OR DiGuiseppi et al, 1999,2002 12/18mFU
9.1 7.2 1.3 (0.7, 2.3) 29.4 26.3 1.2 (0.8, 1.8) 5.6 5.6 1.0 (0.5, 2.0)
Douglas et al 1998 Mallonee et al,1996 48mFU (annualised rate presented)
Incidence density ratio
0.2 (95% CI 0.1, 0.4)
Incidence density ratio
1.1 (95% CI 0.7, 1.7)
- - -
Free or discounted supply of home safety equipment and safety education No injury data reported by 4 of 4 studies: Champ & Kendrick 1998; Posner et al 2004; Sangvai et al 2007; Sznajder et al 2003 Free or discounted supply & installation of home safety equipment and safety education Hospital admissions Secondary care attendance Abbreviated injury scale >=2 Intervention Control Incident RR Intervention Control Incident RR Intervention Control OR Watson et al 2005 24mFU6 (Kendrick et al 2009)
- - 1.02 (0.7, 1.48)
- - 1.02 (0.9, 1.13)
- - 1.14 (0.76, 1.71)
Home risk assessment only No injury data reported by 1 of 1 study: Paul et al, 1994 Home risk assessment & supply of home safety equipment No injury data reported by 5 of 7 studies: Balouzian et al 1997; Babul et al 2007; Hendrickson 2005; Johnston et al 2000; Metchikian et al1999 Any medically attended injury Intervention
(%) 12mFU Control (%) OR Intervention
(%) 25mFU Control (%) OR Intervention
(%) 36mFU Control (%) OR
Kendrick et al 1990 25mFU - - 31.47 32.47 0.97 (0.72, 1.30)
- - -
King et al 2001 12mFU King et al 2005 36mFU
7 9 0.75 (0.58, 0.96)8
- - - 35 44 0.80 (0.64, 1.00)8
6 Rates/1000 person years, Primary care attendance and ,minor injury severity score>=2 not reproduced here (see Table 10). 7 Weighted mean of %
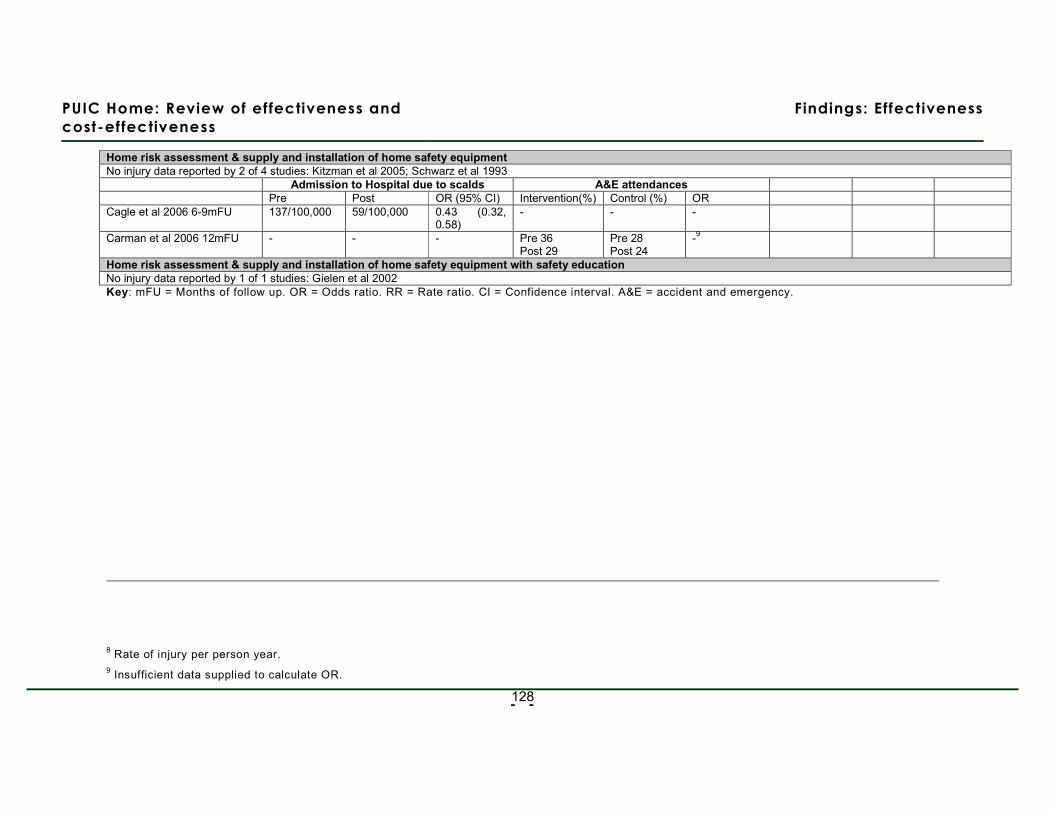
PUIC Home: Review of effectiveness and
cost-effectiveness
Findings: Effectiveness
- -
128
Home risk assessment & supply and installation of home safety equipment No injury data reported by 2 of 4 studies: Kitzman et al 2005; Schwarz et al 1993
Admission to Hospital due to scalds A&E attendances Pre Post OR (95% CI) Intervention(%) Control (%) OR Cagle et al 2006 6-9mFU 137/100,000 59/100,000 0.43 (0.32,
0.58) - - -
Carman et al 2006 12mFU - - - Pre 36 Post 29
Pre 28 Post 24
-9
Home risk assessment & supply and installation of home safety equipment with safety education No injury data reported by 1 of 1 studies: Gielen et al 2002 Key: mFU = Months of follow up. OR = Odds ratio. RR = Rate ratio. CI = Confidence interval. A&E = accident and emergency.
8 Rate of injury per person year. 9 Insufficient data supplied to calculate OR.
PUIC Home: Review of effectiveness
and cost-effectiveness
Findings: Effectiveness
– 129 –
5.12.2 . Impact of all interventions on the presence of correctly
installed safety equipment
Given the paucity of evidence reported about injuries in the included studies and the
difficulties of accurately measuring such changes, we were also interested in the
impact of interventions on intermediate indicators of change, such as the presence of
safety equipment. The absolute numbers of fatal and serious unintentional injuries to
children in the home may be small in the context of a trial, and may be considered as
“rare events”, on which it is difficult to measure an impact. Caution should be taken
when interpreting the results about presence of safety equipment however as,
although there is a logical link between the presence of such equipment and injury
reduction, this link was not explored in the studies and cannot be quantified.
Nineteen of the 22 included studies reported on outcomes related to the use of safety
equipment after an intervention, and these are summarised in Table 36. The way in
which such outcomes were measures varied widely, with some studies directly
assessing whether equipment was properly installed and/or functioning, while others
relied on the self-report of the householders. As with the self-reported injury
outcomes, there is a risk of social desirability bias with such reporting.
In each cell in Table 36, it is indicated if the results were in favour of the intervention
(+) or if no significant increase in the presence of safety equipment was seen post-
intervention (-). It also shows whether these outcomes were based on self-reported
measures (SR) or observed measures (Obs). Where cells are blank, the outcome
was not measured by the study. Where cells contain “NR”, this indicates that the
piece of safety equipment was supplied and or/fitted as part of the intervention, but
that the outcome was not reported. Table 36 also shows the study design.
We consider that the most reliable evidence will come from studies which both
included a control group in the design, and which used observed, rather than self-
reported, outcome measures. These findings have been highlighted as bold text in
Table 36.
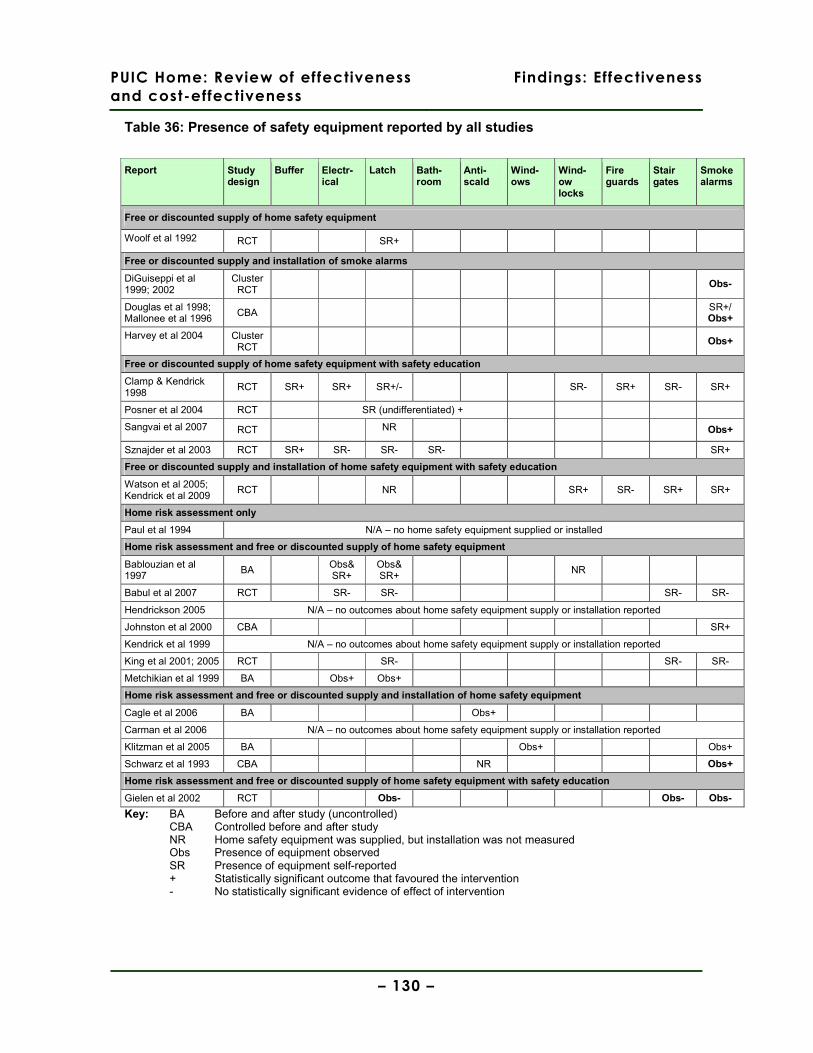
PUIC Home: Review of effectiveness
and cost-effectiveness
Findings: Effectiveness
– 130 –
Table 36: Presence of safety equipment reported by all studies
Report Study design
Buffer Electr-ical
Latch Bath-room
Anti-scald
Wind-ows
Wind-ow locks
Fire guards
Stair gates
Smoke alarms
Free or discounted supply of home safety equipment
Woolf et al 1992 RCT SR+
Free or discounted supply and installation of smoke alarms
DiGuiseppi et al 1999; 2002
Cluster RCT
Obs-
Douglas et al 1998; Mallonee et al 1996
CBA SR+/ Obs+
Harvey et al 2004 Cluster RCT
Obs+
Free or discounted supply of home safety equipment with safety education
Clamp & Kendrick 1998
RCT SR+ SR+ SR+/- SR- SR+ SR- SR+
Posner et al 2004 RCT SR (undifferentiated) +
Sangvai et al 2007 RCT NR Obs+
Sznajder et al 2003 RCT SR+ SR- SR- SR- SR+
Free or discounted supply and installation of home safety equipment with safety education
Watson et al 2005; Kendrick et al 2009
RCT NR SR+ SR- SR+ SR+
Home risk assessment only
Paul et al 1994 N/A – no home safety equipment supplied or installed
Home risk assessment and free or discounted supply of home safety equipment
Bablouzian et al 1997
BA Obs& SR+
Obs& SR+
NR
Babul et al 2007 RCT SR- SR- SR- SR-
Hendrickson 2005 N/A – no outcomes about home safety equipment supply or installation reported
Johnston et al 2000 CBA SR+
Kendrick et al 1999 N/A – no outcomes about home safety equipment supply or installation reported
King et al 2001; 2005 RCT SR- SR- SR-
Metchikian et al 1999 BA Obs+ Obs+
Home risk assessment and free or discounted supply and installation of home safety equipment
Cagle et al 2006 BA Obs+
Carman et al 2006 N/A – no outcomes about home safety equipment supply or installation reported
Klitzman et al 2005 BA Obs+ Obs+
Schwarz et al 1993 CBA NR Obs+
Home risk assessment and free or discounted supply of home safety equipment with safety education
Gielen et al 2002 RCT Obs- Obs- Obs-
Key: BA Before and after study (uncontrolled) CBA Controlled before and after study
NR Home safety equipment was supplied, but installation was not measured Obs Presence of equipment observed SR Presence of equipment self-reported + Statistically significant outcome that favoured the intervention - No statistically significant evidence of effect of intervention
PUIC Home: Review of effectiveness
and cost-effectiveness
Findings: Effectiveness
– 131 –
Of the 14 studies which reported on the presence of smoke alarms post-intervention,
six both use observed measures and used a controlled study design (Table 36). Four
suggest that the intervention increased functioning presence (Harvey et al, 2004 USA
[+] RCT 6-12 months FU; Mallonee et al, 1996 USA [+] CBA 48 months FU; Sangvai
et al 2007 USA [-] RCT 6 months FU; Schwarz et al, 1993 USA [+] CBA 12 months
FU) and two suggest that no significant impact was seen on smoke alarms
(DiGuiseppi et al, 1999; 2002 UK [++] RCT 24 months FU; Gielen et al, 2002 USA
[++] RCT 12 months FU).
Twelve of the 22 included studies also report on the presence of a range of other
safety equipment, sometimes a reporting a whole series of outcomes, sometimes
focussing on just one (see Table 36). A minority of studies (n=5) used observation
methods rather than self-report to measure these outcomes. Of these five, four
report an increase in the presence of measured outcomes (Bablouzian et al, 1997
USA [-] BA 3.5 months FU; Cagle et al 2006 USA [-] BA 6-9 months FU; Klitzman et
al 2005 USA [+] BA 5 months FU; Metchikian et al, 1999 USA [-] BA 4-6 months FU)
but none of these studies used a controlled study design. The only RCT to use
observed outcome measures found no significant increase in the functional presence
of latches or stair gates post intervention (Gielen et al, 2002 USA [++] RCT 12
months FU).
We therefore suggest that there is inconsistent evidence from robust studies about
the impact of interventions on fire alarms, although this is the most promising finding
in a disappointing picture. There is no evidence of increased functional use of other
safety equipment in the home post-intervention.

PUIC Home: Review of effectiveness
and cost-effectiveness
Findings: Effectiveness
– 132 –
Summary evidence statement 9: Overall impact of home based interventions on rates of injury and installation of safety equipment
Injuries
Of the 22 included studies, seven report the impact of interventions on injury rates.
a. There is inconsistent evidence about impact on injury rate from seven studies: four
found no significant reduction in injury with any intervention (three RCTs - DiGuiseppi
et al 1999, 2000, [++] UK; Kendrick et al, 1990 [+] UK; Watson et al, 2005, [++] UK;
and one uncontrolled before and after study – Carmen et al, 2006 [-] UK). The three
that did suggest injury rates were reduced have limitations due to difficulty in
attributing the change to the intervention (Cagle et al, 2006 USA [-], BA) the use of
self-reported outcomes and high attrition rates (King et al, 2001, 2005 Canada [++],
RCT) and the use of unadjusted analyses, and an atypical high risk setting (Mallonee
et al, 1996 USA [+], RCT).
The applicability of these findings is partial, with all the studies finding no impact
being set in the UK, and those suggesting positive results in North America.
Installation of smoke alarms
Of the 22 included studies, 14 provide information about the installation of smoke
detectors post intervention, however, only six used robust designs which both
reported observed outcomes and had a control group.
b. There is inconsistent evidence from six robust studies (which use both observed
outcome measures and a controlled study design) about the presence of functional
smoke alarms. Four suggest that the intervention increased functioning presence
(Harvey et al, 2004 RCT [+] USA; Mallonee et al, 1996 CBA [+] USA; Sangvai et al
2007 RCT [-] USA; Schwarz et al, 1993 CBA [+] USA) and two suggest that no
significant impact was seen on smoke alarms (DiGuiseppi et al, 1999; 2002 RCT [++]
UK; Gielen et al, 2002 RCT [++] USA).
Installation of other home safety equipment
Of the 22 included studies, 19 provide information about the installation of home
safety equipment post intervention, however, only one used a robust designs which
both reported observed outcomes and had a control group.
c. There is evidence from one RCT that home risk assessments with free or
discounted supply of home safety equipment with safety education does not increase
the functional presence of safety equipment (Gielen et al, 2002, RCT [++]USA).
PUIC Home: Review of effectiveness
and cost-effectiveness
Findings: Cost-effectiveness
– 133 –
6. Findings: Cost-effectiveness
6.1.1. Study reports identif ied
A single search strategy was designed to identify both effectiveness, cost-
effectiveness studies (see section 4.1.1) and the same screening procedures for
identifying potentially includable papers was used (section 4.1.2.2). Papers/reports
were flagged as being potentially includable economic evaluations or cost analyses.
These were obtained in full text for assessment against the inclusion criteria for the
cost-effectiveness review (see section 4.1.2.1). In addition, some papers obtained as
full text for possible inclusion in the review of effectiveness studies, were discovered
to also contain a section describing a cost analysis. Copies of these were also
forwarded to the review team’s health economist for assessment against the cost-
effectiveness review’s inclusion criteria.
In all 19 reports/papers were identified as potentially includable economic evaluations
or cost analyses and obtained in full text version (see QUORUM flowchart, Figure 1
(p.42)). Of these 15 were excluded, on the basis that they:
• Describing cost of illness studies (i.e. not economic evaluations or cost
analyses of specific hone safety interventions or programmes), mostly
assessing the economic impact of injury and child injury: in the USA (6
studies); 2 in Norway; 2 in France.
• Present intervention/programme costing studies from outside the UK (2 USA:
one of a smoke alarm installation and fire safety programme (Parmer et al.
2006), the other of a process for managing the admission of children with fall
injuries (Pillai et al. 2000).
• Describe a home visiting intervention targeting intentional rather than
unintentional injuries to young children (McIntosh et al. 2009).
The references of excluded studies and their reasons for exclusion are listed in
Appendix 8 (p.311).
PUIC Home: Review of effectiveness
and cost-effectiveness
Findings: Cost-effectiveness
– 134 –
6.1.2. Included studies
Three studies (described in four papers) were identified which met our inclusion
criteria of either being full economic evaluations or UK-based cost analyses of the
relevant interventions, all of which were found by the electronic literature searches.
These were identified from the electronic literature searches. Two of the economic
evaluations were of smoke alarm give-away programmes; in Oklahoma City, USA
(Haddix et al. 2001), and in a part of inner London in the UK (Ginnelly et al. 2005).
Information about the economic evaluation by Ginnelly et al was also supplemented
by an earlier cost analysis (DiGiuseppi et al. 1999). This study was data extracted
but not assessed against the quality assessment criteria for economic evaluations (it
mainly provides one table of detailed costs which feed into the Ginnelly et al cost-
effectiveness study). We only found one economic evaluation of a relevant child
safety programme involving home visits, which was conducted alongside an RCT in
four Canadian cities (King et al. 2001).
All three published economic evaluations are cost-effectiveness analyses, aiming to
report the incremental cost per injury prevented (although, both the smoke alarm
give-away programme studies one comparator was estimated to be both cost saving
and more effective than the other, so – correctly - no incremental cost-effectiveness
ratios were calculated or reported). Both the cost-effectiveness analyses of the
smoke alarm give-away programmes (Ginnelly et al, 2005 and Haddix et al 2001)
were conducted from a societal perspective, whereas the cost-effectiveness study of
the intensive home visiting programme appears to have been conducted from the
health sector perspective.
None of the included economic evaluations were based on a decision model, being
instead conducted alongside RCTs (Ginnelly et al, 2005 and King et al 2001) or a
controlled before-and-after study (Haddix et al. 2001).
All three included economic evaluations were published between 2001 and 2005.
The paper describing the intensive home visiting programme (King et al 2001) was
primarily reported as an effectiveness evaluation, including a relatively small
‘economic analysis’ paper sections. Therefore, in assessing the quality of this study,
an assessment of poor study quality may be more a reflection of limited reporting
rather than poor study design or conduct per se. (NB. The health economist author of
PUIC Home: Review of effectiveness
and cost-effectiveness
Findings: Cost-effectiveness
– 135 –
this study was contacted by e-mail to find out if the economic analysis has been
published or documented more fully elsewhere; however there is no fuller report of
this study (personal communication with Doug Coyle, University of Ottawa, 7th July
2009).
The assessment of the quality of each study against the CHEC criteria list is shown in
Appendix 6.
6.1.3. Findings: smoke alarm giveaway programmes
Table 37 below shows the study characteristics and study designs of the three
included economic studies of smoke alarm giveaway programmes (one cost analysis
and two cost-effectiveness analyses), and Table 40 shows their results.
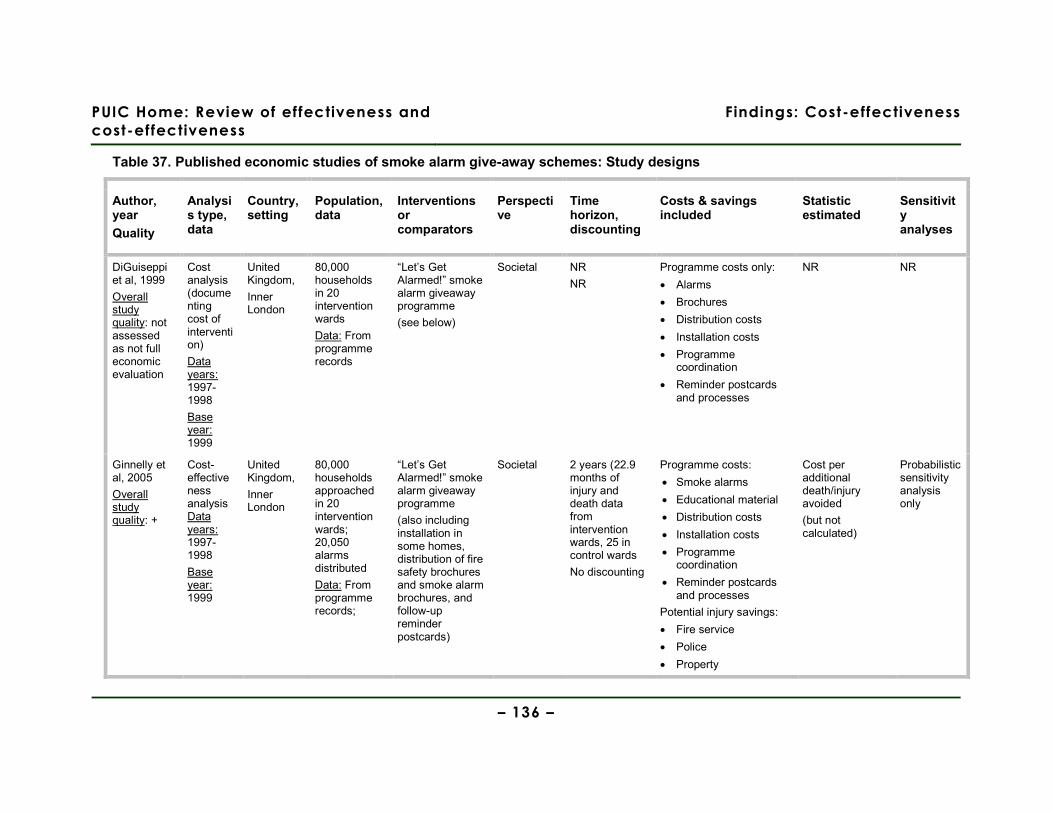
PUIC Home: Review of effectiveness and
cost-effectiveness
Findings: Cost-effectiveness
– 136 –
Table 37. Published economic studies of smoke alarm give-away schemes: Study designs
Author, year
Quality
Analysis type, data
Country, setting
Population, data
Interventions or comparators
Perspective
Time horizon, discounting
Costs & savings included
Statistic estimated
Sensitivity analyses
DiGuiseppi et al, 1999
Overall study quality: not assessed as not full economic evaluation
Cost analysis (documenting cost of intervention)
Data years: 1997-1998
Base year: 1999
United Kingdom,
Inner London
80,000 households in 20 intervention wards
Data: From programme records
“Let’s Get Alarmed!” smoke alarm giveaway programme
(see below)
Societal NR
NR
Programme costs only:
• Alarms
• Brochures
• Distribution costs
• Installation costs
• Programme coordination
• Reminder postcards and processes
NR NR
Ginnelly et al, 2005
Overall study quality: +
Cost-effectiveness analysis Data years: 1997-1998
Base year: 1999
United Kingdom,
Inner London
80,000 households approached in 20 intervention wards; 20,050 alarms distributed
Data: From programme records;
“Let’s Get Alarmed!” smoke alarm giveaway programme
(also including installation in some homes, distribution of fire safety brochures and smoke alarm brochures, and follow-up reminder postcards)
Societal 2 years (22.9 months of injury and death data from intervention wards, 25 in control wards
No discounting
Programme costs:
• Smoke alarms
• Educational material
• Distribution costs
• Installation costs
• Programme coordination
• Reminder postcards and processes
Potential injury savings:
• Fire service
• Police
• Property
Cost per additional death/injury avoided
(but not calculated)
Probabilistic sensitivity analysis only
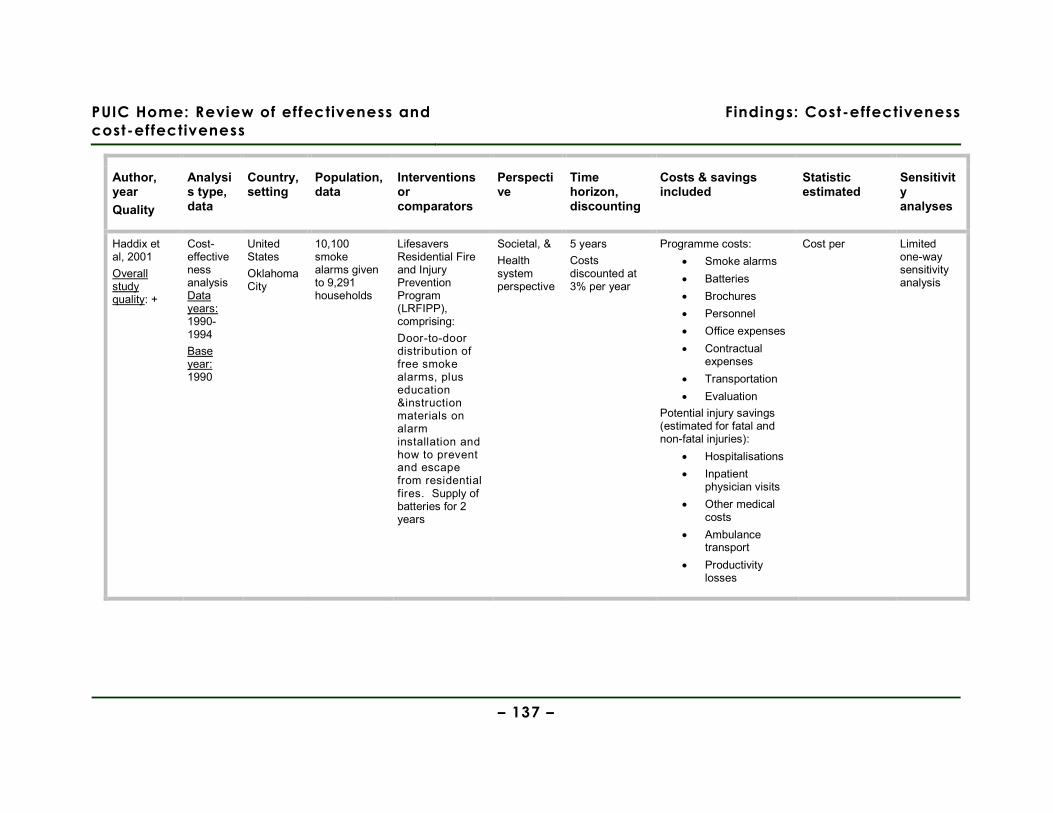
PUIC Home: Review of effectiveness and
cost-effectiveness
Findings: Cost-effectiveness
– 137 –
Author, year
Quality
Analysis type, data
Country, setting
Population, data
Interventions or comparators
Perspective
Time horizon, discounting
Costs & savings included
Statistic estimated
Sensitivity analyses
Haddix et al, 2001
Overall study quality: +
Cost-effectiveness analysis Data years: 1990-1994
Base year: 1990
United States
Oklahoma City
10,100 smoke alarms given to 9,291 households
Lifesavers Residential Fire and Injury Prevention Program (LRFIPP), comprising:
Door-to-door distribution of free smoke alarms, plus education &instruction materials on alarm installation and how to prevent and escape from residential fires. Supply of batteries for 2 years
Societal, &
Health system perspective
5 years
Costs discounted at 3% per year
Programme costs:
• Smoke alarms
• Batteries
• Brochures
• Personnel
• Office expenses
• Contractual expenses
• Transportation
• Evaluation
Potential injury savings (estimated for fatal and non-fatal injuries):
• Hospitalisations
• Inpatient physician visits
• Other medical costs
• Ambulance transport
• Productivity losses
Cost per Limited one-way sensitivity analysis
PUIC Home: Review of effectiveness
and cost-effectiveness
Findings: Cost-effectiveness
– 138 –
Table 38 (on the following pages) shows the main results of these studies. The programmes
evaluated, study designs and results are described and discussed more fully in the sections
following the table.
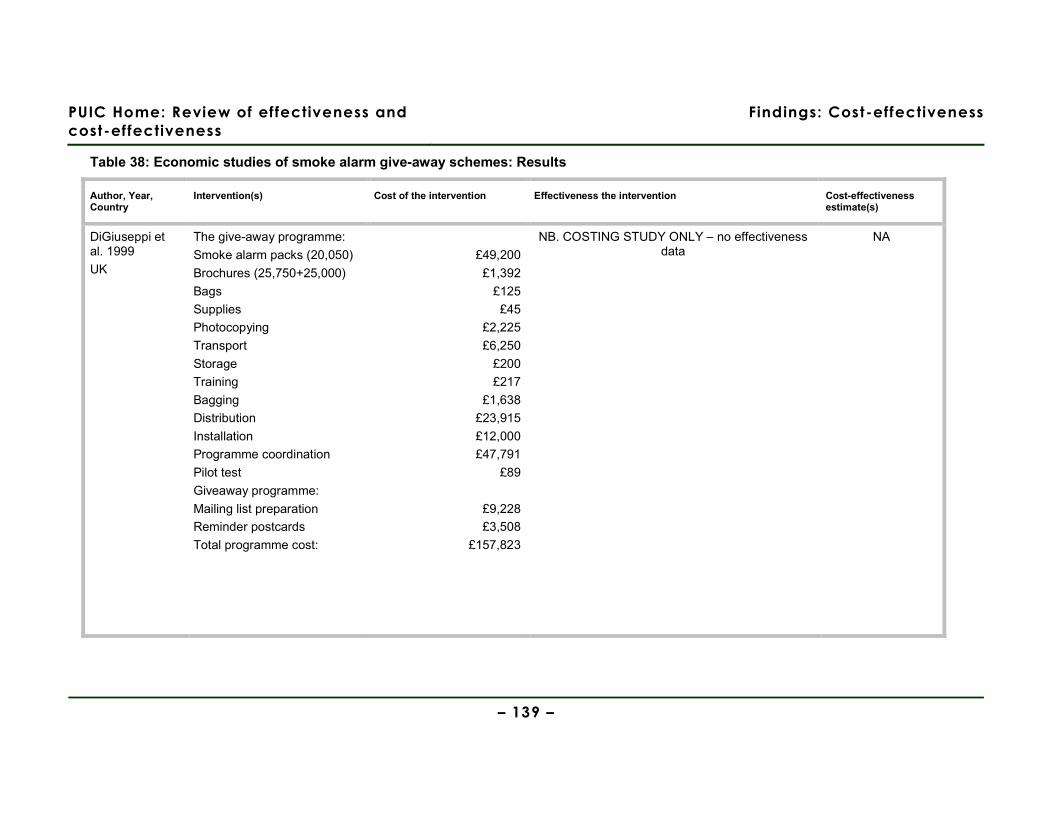
PUIC Home: Review of effectiveness and
cost-effectiveness
Findings: Cost-effectiveness
– 139 –
Table 38: Economic studies of smoke alarm give-away schemes: Results
Author, Year, Country
Intervention(s) Cost of the intervention Effectiveness the intervention Cost-effectiveness estimate(s)
DiGiuseppi et al. 1999
UK
The give-away programme:
Smoke alarm packs (20,050)
Brochures (25,750+25,000)
Bags
Supplies
Photocopying
Transport
Storage
Training
Bagging
Distribution
Installation
Programme coordination
Pilot test
Giveaway programme:
Mailing list preparation
Reminder postcards
Total programme cost:
£49,200
£1,392
£125
£45
£2,225
£6,250
£200
£217
£1,638
£23,915
£12,000
£47,791
£89
£9,228
£3,508
£157,823
NB. COSTING STUDY ONLY – no effectiveness data
NA

PUIC Home: Review of effectiveness and
cost-effectiveness
Findings: Cost-effectiveness
– 140 –
Author, Year, Country
Intervention(s) Cost of the intervention Effectiveness the intervention Cost-effectiveness estimate(s)
Programme cost per
household
Plus: mean fire-related costs per
householda:
(95% CI)
Expected* number of fires per warda
(95% CI)
Expected* fire-related
injuries/ deaths per
warda
(95% CI)
Expected* fire-related
injuries/deaths per
householda
(95% CI)
Give-away programme: £2.15 £10.61
(£9.48 to £11.87)
29.04
(27.67 to 30.48)
6.455
(5.627 to 7.418)
0.0018
(0.0015 to 0.0020)
Ginnelly et al. 2005
UK
No programme 0 £10.64
(£9.60 to £12.02)
26.03
(24.92 to 27.19)
5.172
(4.492 to 5.964)
0.0014
(0.0012 to 0.0016)
Giveaway programme is
dominated by the absence of the
programme
Undiscounted cost of delivering programme (over 5 years, by component)
Mean cost per fatal and non-fatal fire-related injury:
Change in each area, pre- to post-
Net changeb No. prevented per year
Personnel: paid
$288,701 Non-fatal:
Medical
$31,317
Fires: control
-17.58%
Personnel: voluntary
$17,578 Productivity $7,800 Fires: intervention
-23.66%
-6.08% 13.64
Office expenses
$45,858 Cost per non-fatal
injury
$39,117
Fatalities: Control
-22.96%
Haddix et al. 2001
USA
Contractual expenses
$46,250 Fatal:
Medical
$39,185
Fatalities: Intervention: -90%
-67.04 4.02
Giveaway programme
dominates absence of the programme
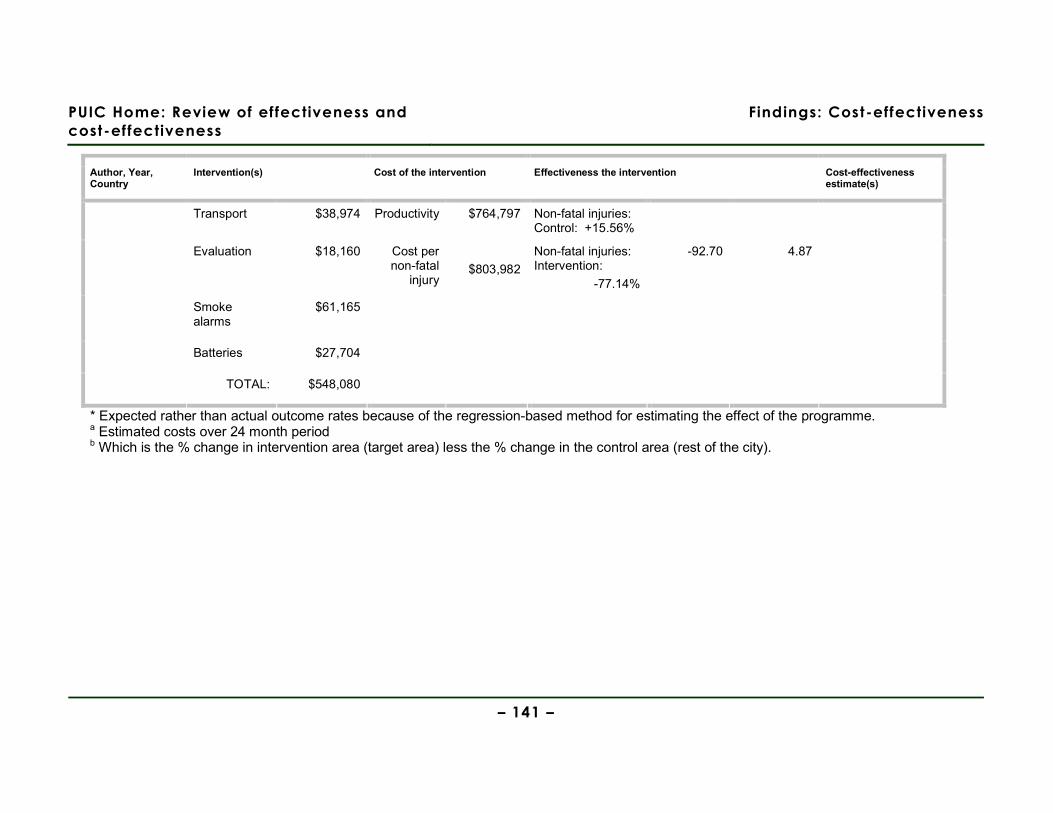
PUIC Home: Review of effectiveness and
cost-effectiveness
Findings: Cost-effectiveness
– 141 –
Author, Year, Country
Intervention(s) Cost of the intervention Effectiveness the intervention Cost-effectiveness estimate(s)
Transport $38,974 Productivity $764,797 Non-fatal injuries: Control: +15.56%
Evaluation $18,160 Cost per non-fatal
injury
$803,982
Non-fatal injuries: Intervention:
-77.14%
-92.70 4.87
Smoke alarms
$61,165
Batteries $27,704
TOTAL: $548,080
* Expected rather than actual outcome rates because of the regression-based method for estimating the effect of the programme. a Estimated costs over 24 month period b Which is the % change in intervention area (target area) less the % change in the control area (rest of the city).
PUIC Home: Review of effectiveness
and cost-effectiveness
Findings: Cost-effectiveness
– 142 –
Estimates of the cost-effectiveness of smoke alarm giveaway schemes are available
from one UK and one USA study, which were both conducted in parallel with the
effectiveness evaluations of these programmes. The relevant effectiveness studies
were included and assessed as part of the effectiveness systematic review (Section
5.5.3).
Let’s get alarmed!: programme description and study design
The study by Ginnelly et al (2005) reports the results of a cluster-randomised
controlled trial-based effectiveness and cost-effectiveness analysis of the ‘Let’s Get
Alarmed!’ smoke alarm giveaway scheme, which took place in the Camden and
Islington areas of inner London in the late 1990s. The design of the programme was
based on the successful Oklahoma City giveaway scheme which ran from 1990 to
1994 (Haddix et al 2001), but the London scheme used a mixed approach to
distributing the alarms and educational materials – both door-to-door distributors
(paid and voluntary) and collection from/distribution via community groups (e.g.
tenants and residents associations). It aimed to target ‘high risk’ households,
specifically: rental accommodation, low income households, elderly people and
families with children. Prior to the programme, it was estimated that only 47% of
homes in the intervention and control areas had a smoke alarm. The trial design and
results on which the cost-effectiveness study is based has been published elsewhere
(DiGuiseppi et al. 2000;DiGuiseppi et al. 2002), (and is also summarised in the
review of effectiveness in this Report: Section 5.5)
As well as distributing the free alarms and fire safety brochures, the programme
included the offer for the smoke alarm to be properly installed; however, only 8% of
those receiving smoke alarms took up this offer. Ultimately 20,050 smoke alarms
were distributed in the approximately 80,000 households which were contacted in the
intervention areas. Most (18,550) of these had been distributed by door-to-door
home visits, rather than by collection from community centres or health centres etc.
Also, year after receipt of the free smoke alarm a reminder postcard was sent (to
14,039 of the households) to encourage householders to change the alarm batteries
and check that the alarms still worked.
The cost-effectiveness analysis estimated the incremental cost per injury/death
avoided from a societal perspective, and with a two-year time horizon (the
PUIC Home: Review of effectiveness
and cost-effectiveness
Findings: Cost-effectiveness
– 143 –
approximate duration of fire-related injury data collection). Costs included were:
programme delivery costs; injury costs (both to NHS and coroners, funeral and
autopsy); Police and fire services costs; self-extinction costs (e.g. extinguisher use
and replacement), and: property damage. Injury and death data was obtained from
“A&E department registers”, hospital case records and coroners’ reports.
Econometric methods of data analysis were used to adjust for the clustered nature of
the data, the high number of zero counts (for costs and outcomes) in many wards,
and slight differences in baseline characteristics between the trial arms; as a result,
this analysis method produced estimates of the ‘expected’ numbers of fires and
‘expected’ numbers of injuries after adjusting for these factors. A comprehensive
assessment of the resource use and related costs of delivering the scheme
(presented in DiGiuseppi et al. 1999), was supplemented by the estimation of a range
of fire-related and fire-related injury costs (see Table 38). These fire-related potential
cost savings comprised: the cost of attending fires by the police and fire service; the
cost of property damage; and health service costs (ambulance, A&E, hospitalisation);
and costs related to deaths (funeral, coroners, and autopsy).
Let’s get alarmed!: results
The total cost (in 1999) of the programme was £157,823 (of which £49,200 was the
cost of the smoke alarm packs, and £12,736 was for the reminder postcards; the
remainder being for the distribution and installation of brochures and alarms). This
equates to a programme cost per household targeted (in the intervention areas) of
£2.15. The mean fire-related costs in the intervention and control wards were very
similar; £10.61 (95% CI: £9.48 to £11.87) in intervention wards, and £10.74 (95% CI:
£9.60 to £12.02) in control wards. This is due to a combination of intervention wards
experiencing a slightly higher probability of having a fire and a higher than expected
number of injuries and deaths, yet also a lower mean cost of a fire (£1,345 compared
with £1,520 – mostly due to differences in property damage costs). When the costs
of the programme and the fire-related costs/savings are added together, the mean
cost per household (over 24 months) was £12.86 (95% CI: £11.63 to £14.02.) in
intervention wards, and £10.74 (95% CI: £9.60 to £12.02) in control wards. These
complicated findings are summarised in Table 39 below.
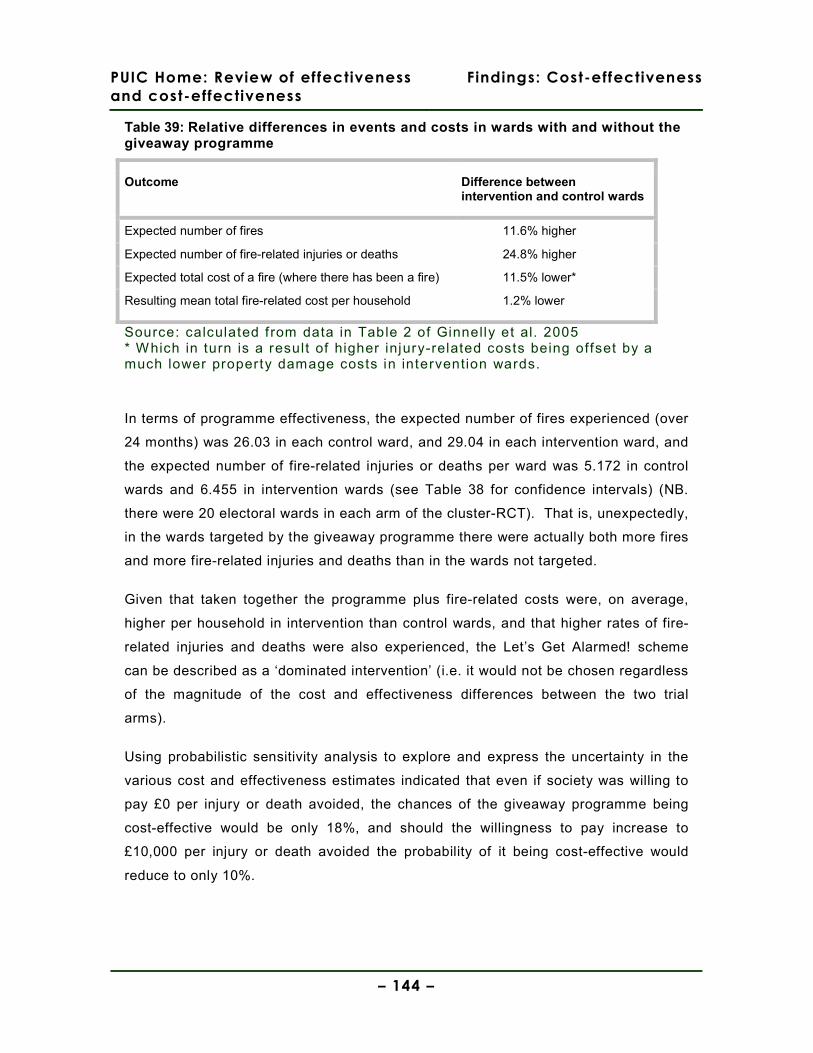
PUIC Home: Review of effectiveness
and cost-effectiveness
Findings: Cost-effectiveness
– 144 –
Table 39: Relative differences in events and costs in wards with and without the giveaway programme
Outcome Difference between intervention and control wards
Expected number of fires 11.6% higher
Expected number of fire-related injuries or deaths 24.8% higher
Expected total cost of a fire (where there has been a fire) 11.5% lower*
Resulting mean total fire-related cost per household 1.2% lower
Source: calculated f rom data in Table 2 of Ginnelly et al. 2005 * Which in turn is a result of higher injury-related costs being offset by a much lower property damage costs in intervention wards.
In terms of programme effectiveness, the expected number of fires experienced (over
24 months) was 26.03 in each control ward, and 29.04 in each intervention ward, and
the expected number of fire-related injuries or deaths per ward was 5.172 in control
wards and 6.455 in intervention wards (see Table 38 for confidence intervals) (NB.
there were 20 electoral wards in each arm of the cluster-RCT). That is, unexpectedly,
in the wards targeted by the giveaway programme there were actually both more fires
and more fire-related injuries and deaths than in the wards not targeted.
Given that taken together the programme plus fire-related costs were, on average,
higher per household in intervention than control wards, and that higher rates of fire-
related injuries and deaths were also experienced, the Let’s Get Alarmed! scheme
can be described as a ‘dominated intervention’ (i.e. it would not be chosen regardless
of the magnitude of the cost and effectiveness differences between the two trial
arms).
Using probabilistic sensitivity analysis to explore and express the uncertainty in the
various cost and effectiveness estimates indicated that even if society was willing to
pay £0 per injury or death avoided, the chances of the giveaway programme being
cost-effective would be only 18%, and should the willingness to pay increase to
£10,000 per injury or death avoided the probability of it being cost-effective would
reduce to only 10%.
PUIC Home: Review of effectiveness
and cost-effectiveness
Findings: Cost-effectiveness
– 145 –
LRFIPP: programme description and study design
The study by Haddix et al (2001) reports the results of a cost-effectiveness analysis
conducted alongside a before-and-after study of the Lifesavers Residential Fire and
Injury Prevention Program (LRFIPP) smoke alarm giveaway scheme, which took
place in Oklahoma City in 1990. The design of programme was based on door-to-
door distributors giving out smoke alarms and supporting education materials. Like
the later Lets’s Get Alarmed! scheme in the UK, it was also aimed at a ‘high risk’ area
(in south Oklahoma City) which experienced a disproportionately high number of the
residential fire-related injuries in the city (45% of the city’s fire-related injuries, in 16%
of the city’s dwellings). Notably, the authors reported that fires started by children
accounted for almost half (47%) of residential fire-related injuries in the targeted
area, but only 8% in the rest of the city. The area was characterised by lower
property values, lower median household income and poorer quality housing –
although similar numbers of people per occupied dwelling. Prior to the programme, it
was estimated (via a survey) that 66% of homes in the target area had a functioning
smoke alarm.
As well as distributing the free smoke alarms, smoke alarm recipients were given
education/instruction materials on alarm installation and how to prevent and escape
from residential fires. By the end of the programme 10,100 smoke alarms had been
distributed to 9,291 households (mean of 1.09 alarms per household); estimated to be
about 78% of the target households. The programme also included relatively intense
follow-up, with a number of repeat visits (up to four per household) over the five
years, including the provision of new batteries and the replacement of any faulty
smoke alarms identified.
The cost-effectiveness analysis estimated the incremental cost per injury/death
avoided from a societal perspective, and with a five-year time horizon (the
approximate duration of cost data and fire-related injury data collection, from May
1990 to April 1995). Again, an assessment of the resource use and related costs of
delivering the programme, was supplemented by the estimation of a range of fire-
related injury treatment costs (see Table 37, p.136). These fire-related injury costs
(or savings) comprised: the cost of ambulance retrieval and medical treatment of non-
fatal injuries; the cost of ambulance retrieval and medical treatment of fatal injuries;
PUIC Home: Review of effectiveness
and cost-effectiveness
Findings: Cost-effectiveness
– 146 –
and (lost) productivity costs for non-fatal and fatal injuries (respectively, for four
months, or for the expected remaining working life of fire victim).
LRFIPP: results
The undiscounted cost of providing the programme during the 5-year time horizon of
the analysis was $548,080 over half of which was staffing costs ($306,279) and about
11% of which ($61,165) was the cost of the smoke alarms (see Table 39). Also, over
half ($306,075) of this total programme cost was incurred in the first year of the
programme (when smoke alarms were distributed), and over 96% of which was
incurred in the first three years of the programme (with only battery purchases by
participants and some evaluation costs in years four and five). The discounted cost
of the programme over the five years was $530,611.
However, these programme costs were set against the substantial estimated savings
associated with the 20 fatal and 24 non-fatal injuries estimated to have been avoided
due to the giveaway programme. Each non-fatal fire-related injury was estimated to
have incurred medical costs of $31,317 and productivity losses of $7,800 (total
saving of $39,117), while fatal injuries were estimated to have incurred mean medical
costs of $39,185 and more substantial productivity losses of $764,797 (total saving of
$803,982). Thus the savings from a single fatal injury avoided would more than cover
the total cost of the programme.
Since the programme was assessed to be both more effective and less costly than
the absence of the programme, no cost-effectiveness ratios were calculated. This
was true from either a societal or a health care system perspective. One-way
sensitivity analyses showed that either programme costs would have to double or
programme effectiveness would have to decrease by 64% in order for the programme
to cost more than the fire injury-related savings (that is, if the net percentage
reduction in fatalities changed from 67 to 43 or less, and if the net percentage change
in non-fatal fire-related injuries changed from 92% to 59%). However, the very high
productivity savings ($0.75 million per death prevented) largely account for the
resilience of the main result to these alternative assumptions.
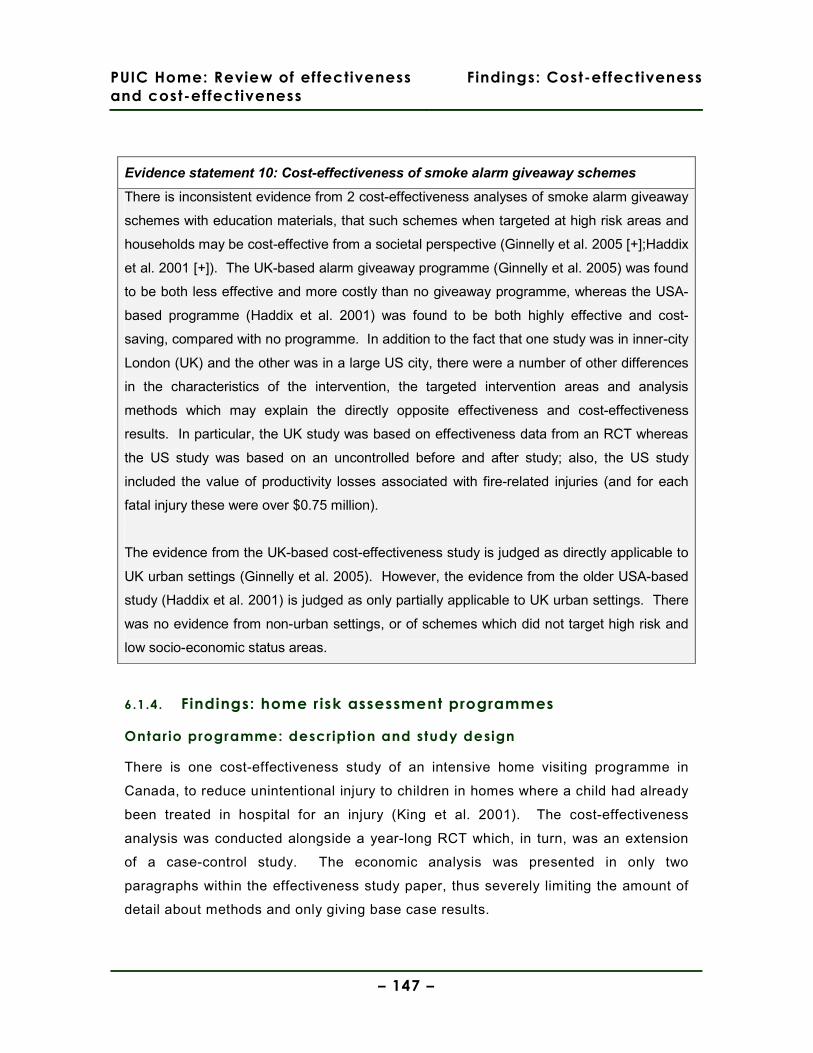
PUIC Home: Review of effectiveness
and cost-effectiveness
Findings: Cost-effectiveness
– 147 –
Evidence statement 10: Cost-effectiveness of smoke alarm giveaway schemes
There is inconsistent evidence from 2 cost-effectiveness analyses of smoke alarm giveaway
schemes with education materials, that such schemes when targeted at high risk areas and
households may be cost-effective from a societal perspective (Ginnelly et al. 2005 [+];Haddix
et al. 2001 [+]). The UK-based alarm giveaway programme (Ginnelly et al. 2005) was found
to be both less effective and more costly than no giveaway programme, whereas the USA-
based programme (Haddix et al. 2001) was found to be both highly effective and cost-
saving, compared with no programme. In addition to the fact that one study was in inner-city
London (UK) and the other was in a large US city, there were a number of other differences
in the characteristics of the intervention, the targeted intervention areas and analysis
methods which may explain the directly opposite effectiveness and cost-effectiveness
results. In particular, the UK study was based on effectiveness data from an RCT whereas
the US study was based on an uncontrolled before and after study; also, the US study
included the value of productivity losses associated with fire-related injuries (and for each
fatal injury these were over $0.75 million).
The evidence from the UK-based cost-effectiveness study is judged as directly applicable to
UK urban settings (Ginnelly et al. 2005). However, the evidence from the older USA-based
study (Haddix et al. 2001) is judged as only partially applicable to UK urban settings. There
was no evidence from non-urban settings, or of schemes which did not target high risk and
low socio-economic status areas.
6.1.4. Findings: home risk assessment programmes
Ontario programme: description and study design
There is one cost-effectiveness study of an intensive home visiting programme in
Canada, to reduce unintentional injury to children in homes where a child had already
been treated in hospital for an injury (King et al. 2001). The cost-effectiveness
analysis was conducted alongside a year-long RCT which, in turn, was an extension
of a case-control study. The economic analysis was presented in only two
paragraphs within the effectiveness study paper, thus severely limiting the amount of
detail about methods and only giving base case results.
PUIC Home: Review of effectiveness
and cost-effectiveness
Findings: Cost-effectiveness
– 148 –
The home visit itself involved the provision of a single home visit (although, not clear
from what type of worker) which included the provision of: an information package;
discount coupons for the purchase of home safety equipment; and specific instruction
on home safety measures based on reviewing an earlier (at trial baseline)
assessment of risks by a trained research assistant. The targeted homes had been
identified subsequent to a case-control study, and therefore were all households
where a child under 8 years of age had recently sustained an injury requiring
emergency department attendance (see footnote to Table 40 for relevant injuries).
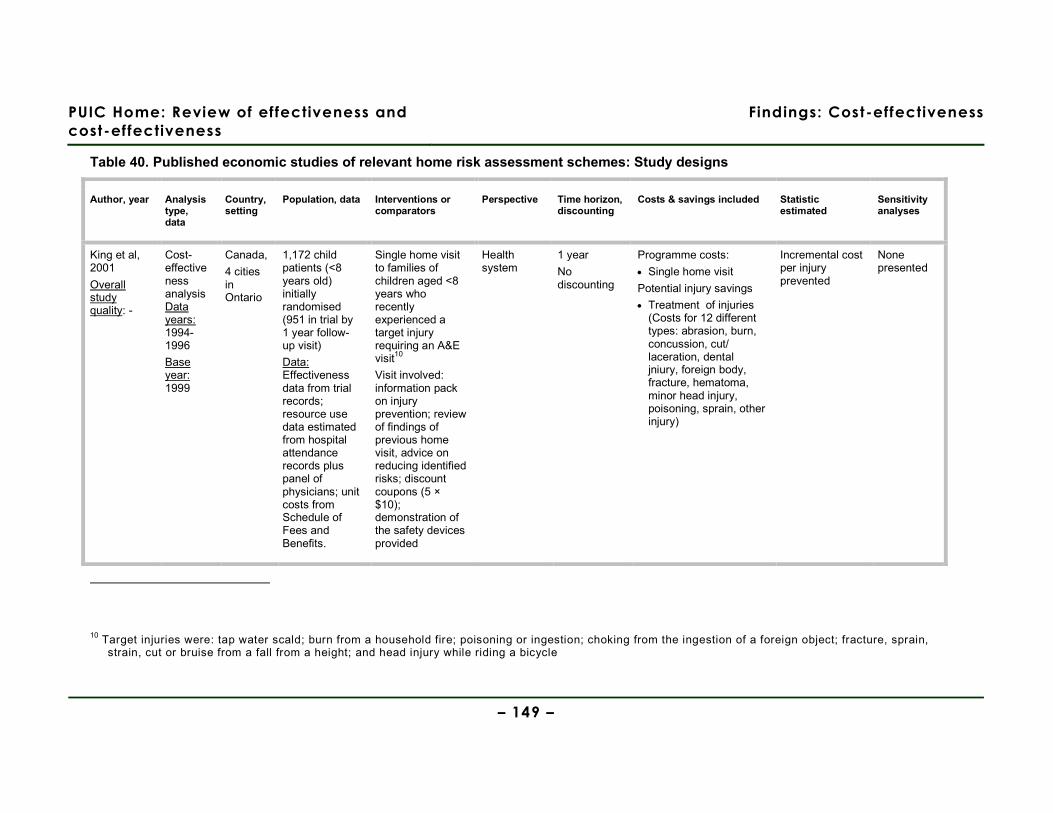
PUIC Home: Review of effectiveness and
cost-effectiveness
Findings: Cost-effectiveness
– 149 –
Table 40. Published economic studies of relevant home risk assessment schemes: Study designs
Author, year Analysis type, data
Country, setting
Population, data Interventions or comparators
Perspective Time horizon, discounting
Costs & savings included Statistic estimated
Sensitivity analyses
King et al, 2001
Overall study quality: -
Cost-effectiveness analysis Data years: 1994-1996
Base year: 1999
Canada,
4 cities in Ontario
1,172 child patients (<8 years old) initially randomised (951 in trial by 1 year follow-up visit)
Data: Effectiveness data from trial records; resource use data estimated from hospital attendance records plus panel of physicians; unit costs from Schedule of Fees and Benefits.
Single home visit to families of children aged <8 years who recently experienced a target injury requiring an A&E visit10
Visit involved: information pack on injury prevention; review of findings of previous home visit, advice on reducing identified risks; discount coupons (5 × $10); demonstration of the safety devices provided
Health system
1 year
No discounting
Programme costs:
• Single home visit
Potential injury savings
• Treatment of injuries (Costs for 12 different types: abrasion, burn, concussion, cut/ laceration, dental jniury, foreign body, fracture, hematoma, minor head injury, poisoning, sprain, other injury)
Incremental cost per injury prevented
None presented
10 Target injuries were: tap water scald; burn from a household fire; poisoning or ingestion; choking from the ingestion of a foreign object; fracture, sprain, strain, cut or bruise from a fall from a height; and head injury while riding a bicycle
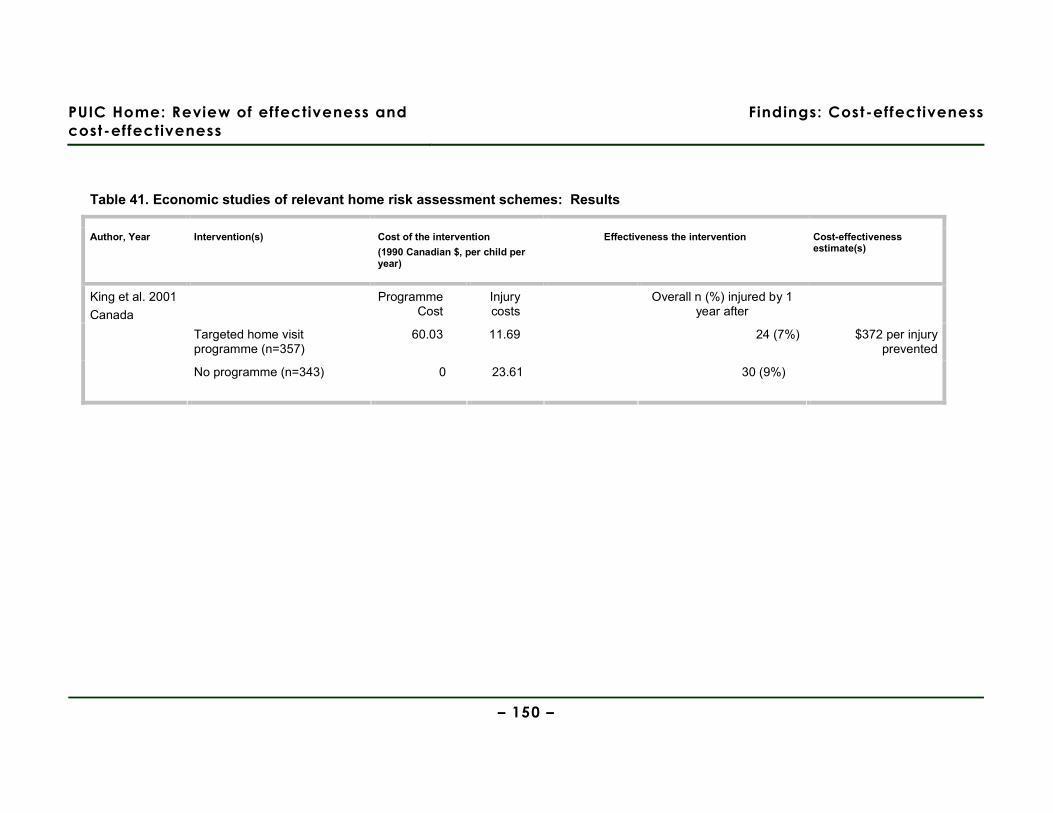
PUIC Home: Review of effectiveness and
cost-effectiveness
Findings: Cost-effectiveness
– 150 –
Table 41. Economic studies of relevant home risk assessment schemes: Results
Author, Year Intervention(s) Cost of the intervention
(1990 Canadian $, per child per year)
Effectiveness the intervention Cost-effectiveness estimate(s)
Programme Cost
Injury costs
Overall n (%) injured by 1 year after
Targeted home visit programme (n=357)
60.03 11.69 24 (7%) $372 per injury prevented
King et al. 2001
Canada
No programme (n=343) 0 23.61 30 (9%)
PUIC Home: Review of effectiveness and
cost-effectiveness
Findings: Cost-effectiveness
– 151 –
Ontario programme: results
Each home visit was estimated to cost C$60.03. Children in intervention areas
sustained injuries at lower rates than in control areas for all injury types other than
burns and dental injuries, and the treatment costs for the twelve different injury types
ranged from C$36.40 (for treating abrasions or haematomas) to C$214.33 for
concussion (these being based on typical resource profiles for treating each injury
type obtained from a panel of physicians). The injury types for which the rates were
lower in the intervention than control areas were: abrasions, concussion,
cut/laceration, foreign body, fracture, haematoma, minor head injury, poisoning,
sprain, other injury. While most of these types of injury relate to the home safety risks
targeted by the intervention, many might also be sustained outside the home. The
estimated total cost of health care for injuries in the intervention group (C$7,028) was
“significantly lower” than the cost for the control group (C$13,482; although no
p-values or confidence intervals were reported). The injury treatment cost per
participant over the trial year was therefore C$11.69 in the intervention group, and
C$23.61 in the control group. However, including the cost of the home visits, the
incremental cost per participant of the home visit programme was C$48.11 (= 11.69 +
60.03 – 23.61).
Then, applying the lower injury rate experienced in the intervention group (7% vs 9%;
a per person-year rate ratio of 0.75 [95% CI: 0.58 to 0.96]) gives an incremental cost
per injury prevented of C$372. No sensitivity analyses were presented to explore how
much this result would alter under different cost and effectiveness assumptions. The
authors suggest that this estimate “is likely to be small in proportion to the benefits
gained by society”, and point out that this estimate does not include the additional
direct and indirect savings due to things like the value of time and foregone earnings
of family members in caring for the injured child.
PUIC Home: Review of effectiveness and
cost-effectiveness
Findings: Cost-effectiveness
– 152 –
Evidence statement 11: Cost-effectiveness of home risk assessments
There is weak evidence from one cost-effectiveness study based on a randomised controlled
trial in Canadian cities, that a single home visit involving an information package, discount
vouchers, and home-specific risk-reduction advice (based on a previous risk assessment) is
cost-effective from a heath system perspective (King et al. 2001 [-]). This cost-effectiveness
conclusion either relies on the assumption that avoiding such injuries to children is worth
over C$372 to society, and/or that the value of other benefits to families and carers (e.g.
gained leisure or earnings not lost caring for the injured child) exceeds C$372. Assessment
of the quality of this study was highly compromised by the very small amount of space
devoted to describing it within the effectiveness paper.
The evidence is from a Canadian study which uses 15-year old data and is therefore judged
as only partially applicable to UK family homes; the generalisability of the study’s findings
beyond Canada is also hindered by the absence of sensitivity analyses.

PUIC Home: Review of effectiveness and
cost-effectiveness
Discussion
– 153 –
7. Discussion
7.1. Statement of principal findings
This review has systematically searched the literature, critically appraised included
study reports, and synthesised research evidence with the aim of answering the
following questions:
1. Which interventions involving the supply and/or installation of home safety
equipment (free of charge or at a reduced cost) are effective and cost effective in
preventing unintentional injuries among children and young people aged under 15
in the home?
2. Are home risk assessments effective and cost effective in preventing unintentional
injuries among children and young people aged under 15?
3. What are the factors which either enhance or reduce the effectiveness of
interventions involving the supply and/or installation of home safety equipment
and/or home risk assessments, or which help or hinder their implementation?
4. What are the main causal relationships which seem to explain how the different
combinations of resources (and levels of costs) of these interventions are related
to intended outcomes?
These are considered below.
Question 1: Which interventions involving the supply and/or installation of
home safety equipment (free of charge or at a reduced cost) are effective and
cost effective in preventing unintentional injuries among children and young
people aged under 15 in the home?
Effectiveness findings:
The results of the included studies are disappointing. Only seven of the 22 included
studies, directly measured the impact of their interventions on injury rates. Of these
seven, four found no significant reduction in injury with any intervention (three RCTs -
DiGuiseppi et al 1999, 2000; Watson et al, 2005; Kendrick et al, 1990; and one
uncontrolled before and after study – Carmen et al, 2006). The three that did suggest
PUIC Home: Review of effectiveness and
cost-effectiveness
Discussion
– 154 –
injury rates are reduced all have limitations relating to the difficulty of assigning any
change in injury to the impact of the intervention, the use of self-reported outcomes,
or unadjusted analyses in an atypical urban area (Cagle et al, 2006; King et al, 2001,
2005; Mallonee et al, 1996).
Although this review also sought to assess the impact of home safety equipment
interventions on measures such as increased installation rates and increased
knowledge, it is difficult to know how to interpret these findings without any empirical
evidence linking them to decrease in injury rates. Over-emphasis on proxy measures,
in the absence of primary outcomes being measured or in the event of non-significant
results for primary outcomes, may be the result of interpretation bias, which is a risk
in both individual research reports and reviews of such reports. Indeed, a recent
assessment of how trials interpret non-significant results (Hewitt et al. 2008) used one
of our included studies as an example of potential interpretation bias: Watson et al
(2005) are criticised for emphasising the possibility that free home safety equipment
might improve safety practices in families, whilst downplaying the main study results
which suggested an increase in minor medically attended injury among those
receiving the intervention.
We found some inconsistent evidence that intervention may increase the functional
presence of fire alarms but no robust evidence for increased use of other home safety
equipment.
Cost-effectiveness findings:
The two economic evaluations of the smoke alarm give-away schemes, one in the UK
(of the Let’s Get Alarmed! scheme) and one in the USA (of the LRFIPP), give opposite
results: the UK give-away scheme was estimated to be both less effective and more
costly than no scheme, while the LRFIPP scheme in Oklahoma City was estimated to
be both more effective and less costly than no scheme. However, these two studies
exhibit a number of important differences in terms of the nature of the programme
evaluated and how they were evaluated, which may explain their conflicting findings.
The UK study by Ginnelly et al. is based on an RCT which shows no significant
difference in injury rates between intervention and control, whereas the non-
randomised LRFIPP study reports a substantional injury reduction, based upon the
relative reductions in fatal and non-fatal injuries in an unmatched control area (the
PUIC Home: Review of effectiveness and
cost-effectiveness
Discussion
– 155 –
rest of Oklahoma City). This means that although the LRFIPP programme reports
impressive after-vs-before reductions in fatalities (90%) and non-fatal injuries (77%),
some of these changes may not be due to the programme but to other differences in
the causes of fires or the prior prevalence of fire-safety behaviours (i.e. the study is
subject to considerable potential biases and may overestimate the effectiveness of
the intervention). The LRFIPP Oklahoma City programme also appeared to be a
considerably more intensive programme, with a number of repeat visits (up to four per
household) over the five years, including the provision of new batteries and the
replacement of faulty smoke alarms. This may also partly explain the different
effectiveness estimates on which the two economic evaluations are based.
Both studies appear to have conducted comprehensive cost analyses of the
programme. Howver, there were some notable differences in cost structure. For
example, in the UK programme the cost of the smoke alarms comprised 31% of the
total programme cost, compared with 11% of the cost of the LRFIPP programme, and
“bagging and distribution comprised 16% of the UK programme, but paid and
voluntary personnel accounted for over 50% of the total cost of the LRFIPP
programme.
However it is the inclusion of productivity costs (savings) in the study by Haddix et al.
– that is, the value to the economy of lost productive outputs due to fatal and non-fatal
injuries – which explains why the LRFIPP programme in the USA is estimated to be so
overwhelmingly cost-saving. The inclusion of productivity costs or losses in economic
evaluations is, in any case, a fairly controversial aspect of economic evaluation
(Drummond et al. 2005;Garber et al. 1996). This is particularly true where it is not
clear by what method these costs have been estimated. The Haddix et al study, by
basing their productivity loss estimates on annual mean earnings (i.e. apparently
using the ‘human capital approach’) are likely to have over-estimated the true cost to
society of people who leave the workforce, or never enter it, because of their injuries
(p. 85, Drummond et al. 2005).
In addition to the fact that there were only two economic evaluation studies, with
conflicting findings, further caution is warranted given the very varied and uncertain
findings across the larger number of effectiveness studies found. In other words, had
there been more economic evaluations alongside these other effectiveness studies it
PUIC Home: Review of effectiveness and
cost-effectiveness
Discussion
– 156 –
seems likely that their assessed cost-effectiveness would give an equally mixed
pattern of results.
Question 2: Are home risk assessments effective and cost-effective in
preventing unintentional injuries among children and young people aged under
15?
Effectiveness findings:
Evidence for the effectiveness of home risk assessments alone is weak as it based on
one small, poor quality RCT which suggests no impact of the intervention across most
of the measured outcomes (Paul et al 1994). The addition of the supply of home
safety equipment does not appear to make a substantive difference to their
effectiveness in terms of the installation and use of stair gates, locks and latches, or
electrical outlet covers (Babul et al 2007; King et al 2001). An increase in the
installation of home safety equipment is reported in one study, but this relies on self-
reported outcome measures (Johnston et al 2000).
There was evidence for the effectiveness of home risk assessments (in conjunction
with the supply of home safety equipment) in reducing unintentional injuries at follow-
up at 12 months (King et al 2001), but this used self-reported outcomes and this effect
was anyway not maintained at 36 months (King et al 2005), and another trial showed
no impact at 25 months (Kendrick et al 1999). Finally, there is no evidence to suggest
that the addition of an explicit educational component (as well as the construction of a
Safety Centre) increases effectiveness and, in fact, this may increase health
inequalities through providing a resource that only the more socio-economically
advantaged and motivated may make use of (Gielen et al 2002).
There were considerable differences in who provided a home risk assessment ranging
from one-off visits from those trained for the research project, to health visitors who
also provided ongoing social support for new mothers, and may have already built a
relationship with those in the study. We speculate that such differences may be
important in supporting some vulnerable families and those who are unwilling to admit
unknown people to their home, although this was not demonstrated in the study
findings.
Cost-effectiveness findings:
PUIC Home: Review of effectiveness and
cost-effectiveness
Discussion
– 157 –
We found only one published economic evaluation of a child home safety programme
involving a home risk assessment and advice visit plus discount vouchers to buy
home safety devices (King et al., 2001). This study was reported primarily as an
effectiveness evaluation, with the economic evaluation part of the study only reported
in two short paragraphs which severely limited quality assessment of this study.
Although the study authors concluded a positive cost-effectiveness result, this relies
on assuming that the value of avoiding each injury to a child which requires a trip to
the doctor is greater than (Canadian) $372. In addition, as noted in the effectiveness
review, injury outcomes were parent-reported visits to the doctor for a child’s injury
(rather than actual primary care or hospital attendance records). For these and other
reasons therefore, and even though this study was based upon an RCT, this study
was assessed as both a poor quality economic evaluation and a poor quality
effectiveness study by our reviews.
It is therefore not possible, on the basis of this weak evidence, to conclude that this or
similar home safety visiting programmes would be cost-effective in the UK. This, and
the fact that it was based in Canada rather than the UK, also meant it was not used as
the basis for our economic modelling of general home safety assessment programmes
(see Report 3).
Question 3: What are the factors which either enhance or reduce the
effectiveness of interventions involving the supply and/or installation of home
safety equipment and/or home risk assessments, or which help or hinder their
implementation?
Most studies also reported a range of intermediate outcomes related to the presence
of correctly installed or correctly used safety equipment, and knowledge, behaviour or
observed injury risks within the home. This might be expected to influence injury to
children in the home, however, there is no evidence in this review that can quantify
any relation between these measures and injury rates. The evidence is also very
mixed for these outcomes.
At the most basic level, the supply alone of home safety equipment can be effective in
increasing its installation and use when such equipment is directly aimed at
preventing the re-occurrence of a recent unintentional injury such as poisoning (see
Woolf et al 1992, although this study uses self-reported outcomes).
PUIC Home: Review of effectiveness and
cost-effectiveness
Discussion
– 158 –
Although it may be that the supply and installation of smoke alarms results in greater
uptake than simply providing a discount voucher for an alarm (Harvey et al 2004), the
evidence from a key controlled study suggests that supply and installation has no
greater effect on rates of installation and fire-related injuries than no intervention
(DiGuiseppi et al 2002). This may be partly explained by the very low uptake by
households of the offer of installation in this study, which may be linked to resistance
to strangers entering the home (see below).
An educational component may result in greater uptake of an intervention involving
the supply and installation of home safety equipment (smoke alarms, stair gates, and
window locks; Watson et al 2005, although these were based in self-reported
outcomes). Other evidence suggests, however, that where interventions were
embedded within wider community programmes, interventions that supplied and
installed home safety equipment without an explicit educational component could be
effective (Klitzman et al 2005 – smoke alarms, fire extinguishers, and window guards
using observed outcomes although this study had no control group; Schwarz et al
1993 – smoke alarms, controlled design and observed outcomes). It is difficult to
weight the validity of these different findings by study design: while the latter studies
may be less reliable as they use before and after study designs (one controlled),
whilst the Watson was an RCT, they do use observed outcomes (rather than the self-
reported outcomes of the Watson study.)
Evidence for the effectiveness of the supply (without installation) of home safety
equipment in conjunction with an educational component is highly mixed and does not
appear to be linked to the ease (or otherwise) of installing the equipment (for
example, Clamp & Kendrick 1998, and Sznajder et al 2003 – cupboard locks and
latches, and electrical outlet covers, although both are RCTs they use self-reported
outcome measures). This suggests that there may be other key factors that influence
parents’ behaviour beyond a lack of access to (or funds for) home safety equipment
and the skills necessary for its proper installation. The exception here is smoke
alarms, where interventions involving the supply of smoke alarms in conjunction with
education were reported uniformly as being effective (Clamp & Kendrick 1998;
Sangvai et al 2004; Sznajder et al 2003).
Previous studies have highlighted the steep social gradients in child injury, which are
evident using a range of measures of deprivation including occupational class,
PUIC Home: Review of effectiveness and
cost-effectiveness
Discussion
– 159 –
deprivation of residential area, family make-up, income and maternal age (Kendrick et
al. 2009). However, a trial aimed at reducing inequalities in the possession and use
of various safety equipment, through home safety visits and free or low cost supply of
equipment had mixed results. No evidence of reduced inequalities seen in smoke
alarms but increases in stair gates recorded post-intervention in those with low
income and those in rented accommodation (Kendrick et al. 2009).
A previous review of interventions to promote smoke alarm ownership and function
used innovative narrative synthesis methods to try and explain the very mixed results
from the RCTs that had informed both it, and a previous Cochrane review ((Arai et al.
2007;DiGuiseppi & Higgins 2000)). The authors of the narrative review identify a
range of possible questions about what elements of the intervention might impact on
the effectiveness of smoke alarm promotion interventions, which included safety
education as well as provision of safety equipment. They used information provided
by study authors which attempted to explain the results to identify possible barriers
and facilitators to successful programmes and their implementation although this
information is not fully reported. Similarly, we extracted information provided by study
authors, usually in the discussion section of the effectiveness papers, and reported it
in the evidence tables. These are reported briefly below in Table 42, where we also
show where similar barriers and facilitators were noted in the qualitative research
reviewed for Report 2. Note that other potential factors were also identified by the
review of qualitative research, and the fact that a theme is present only in the review
of effectiveness, or only in the review of qualitative research, does not necessarily
weaken its validity as an observation.
Most of the factors identified by authors of the effectiveness review were around the
barriers and facilitators to householders acquiring safety equipment, and none related
to maintaining such equipment. This may be a reflection of the studies experiences in
gaining access to households as part of the trial, and the relatively short term follow
up of many of the studies.
Themes which came up repeatedly included the suggestion that home risk
assessment programmes may be more successful where they use those, like health
visitors, who already have an ongoing, supportive relationship with parents and where
these relationships addressed other needs as well as unintentional injury. However,
for some, the prospect of allowing home visits, perhaps repeatedly, was a barrier to
PUIC Home: Review of effectiveness and
cost-effectiveness
Discussion
– 160 –
participation. We note that the study by Watson et al (2005) found an increase in GP
attendances for unintentional injury among those intervention group (but not for more
serious injuries). A possible interpretation of this is that those who received the
safety counselling from a health visitor became more confident that they would not be
judged if their child had been hurt accidentally.
Similarly, the involvement of community groups in interventions may help to promote
and legitimise it, and may help to allay any suspicion of officials or mistrust of
apparently free equipment.
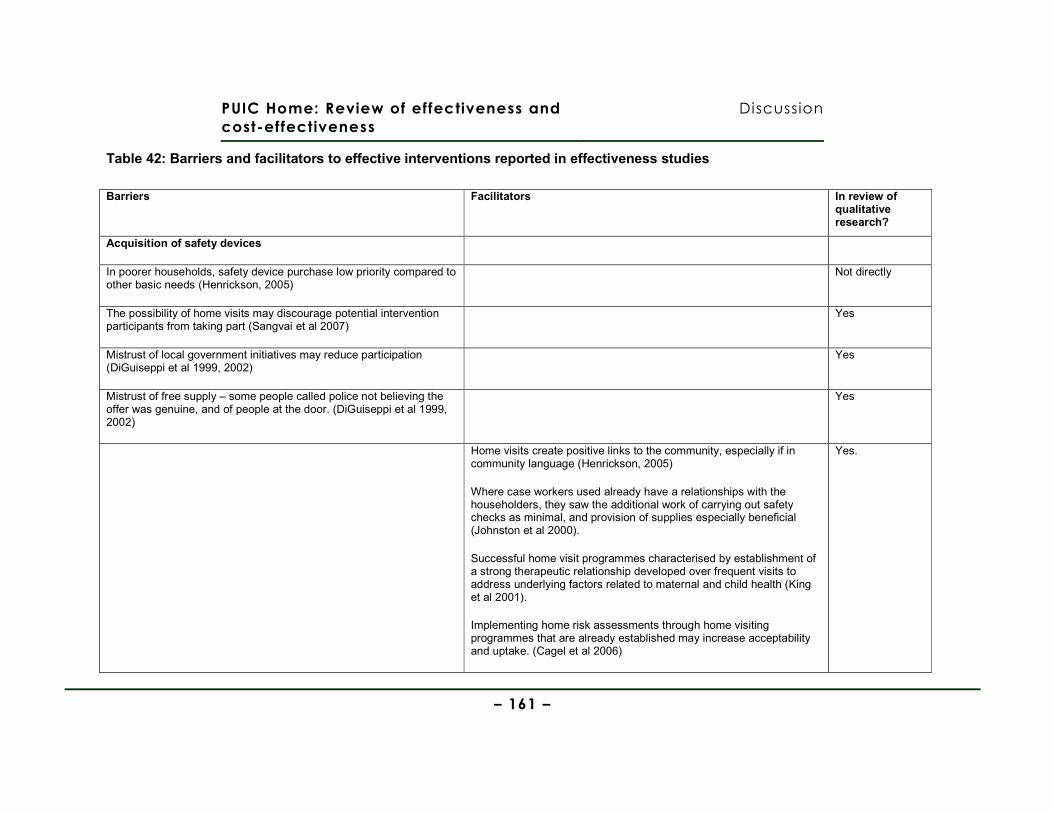
PUIC Home: Review of effectiveness and
cost-effectiveness
Discussion
– 161 –
Table 42: Barriers and facilitators to effective interventions reported in effectiveness studies
Barriers Facilitators In review of qualitative research?
Acquisition of safety devices
In poorer households, safety device purchase low priority compared to other basic needs (Henrickson, 2005)
Not directly
The possibility of home visits may discourage potential intervention participants from taking part (Sangvai et al 2007)
Yes
Mistrust of local government initiatives may reduce participation (DiGuiseppi et al 1999, 2002)
Yes
Mistrust of free supply – some people called police not believing the offer was genuine, and of people at the door. (DiGuiseppi et al 1999, 2002)
Yes
Home visits create positive links to the community, especially if in community language (Henrickson, 2005)
Where case workers used already have a relationships with the householders, they saw the additional work of carrying out safety checks as minimal, and provision of supplies especially beneficial (Johnston et al 2000).
Successful home visit programmes characterised by establishment of a strong therapeutic relationship developed over frequent visits to address underlying factors related to maternal and child health (King et al 2001).
Implementing home risk assessments through home visiting programmes that are already established may increase acceptability and uptake. (Cagel et al 2006)
Yes.
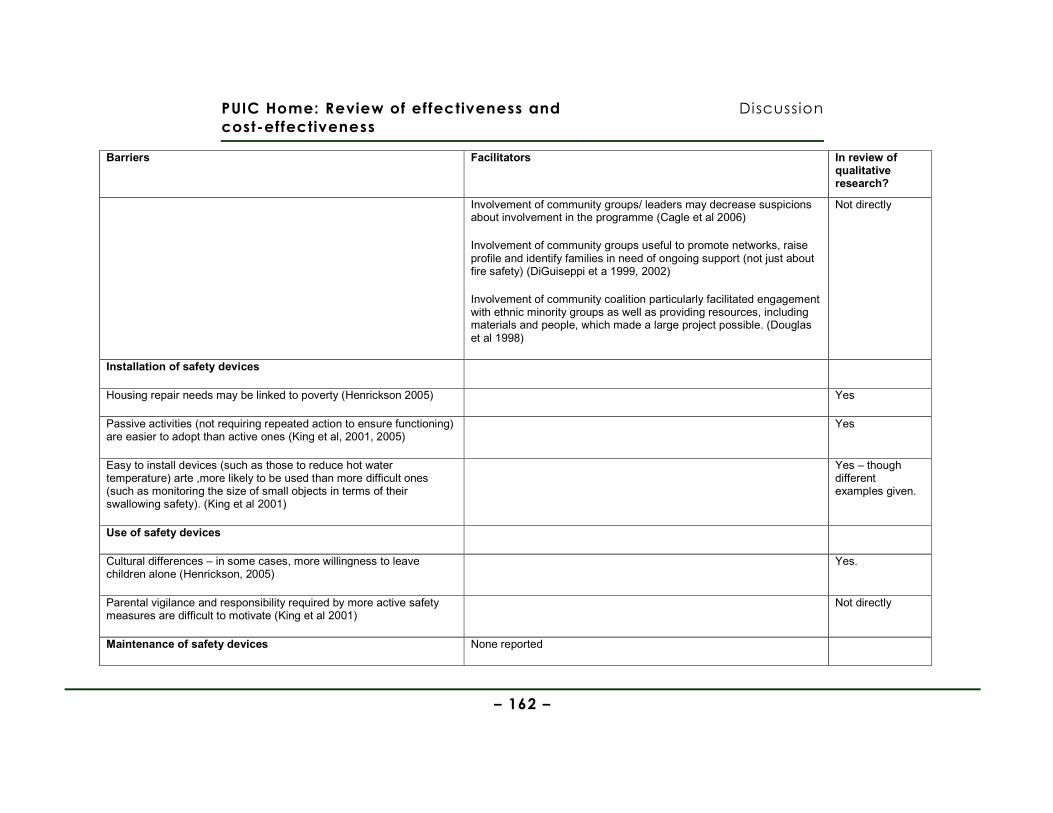
PUIC Home: Review of effectiveness and
cost-effectiveness
Discussion
– 162 –
Barriers Facilitators In review of qualitative research?
Involvement of community groups/ leaders may decrease suspicions about involvement in the programme (Cagle et al 2006)
Involvement of community groups useful to promote networks, raise profile and identify families in need of ongoing support (not just about fire safety) (DiGuiseppi et a 1999, 2002)
Involvement of community coalition particularly facilitated engagement with ethnic minority groups as well as providing resources, including materials and people, which made a large project possible. (Douglas et al 1998)
Not directly
Installation of safety devices
Housing repair needs may be linked to poverty (Henrickson 2005) Yes
Passive activities (not requiring repeated action to ensure functioning) are easier to adopt than active ones (King et al, 2001, 2005)
Yes
Easy to install devices (such as those to reduce hot water temperature) arte ,more likely to be used than more difficult ones (such as monitoring the size of small objects in terms of their swallowing safety). (King et al 2001)
Yes – though different examples given.
Use of safety devices
Cultural differences – in some cases, more willingness to leave children alone (Henrickson, 2005)
Yes.
Parental vigilance and responsibility required by more active safety measures are difficult to motivate (King et al 2001)
Not directly
Maintenance of safety devices None reported
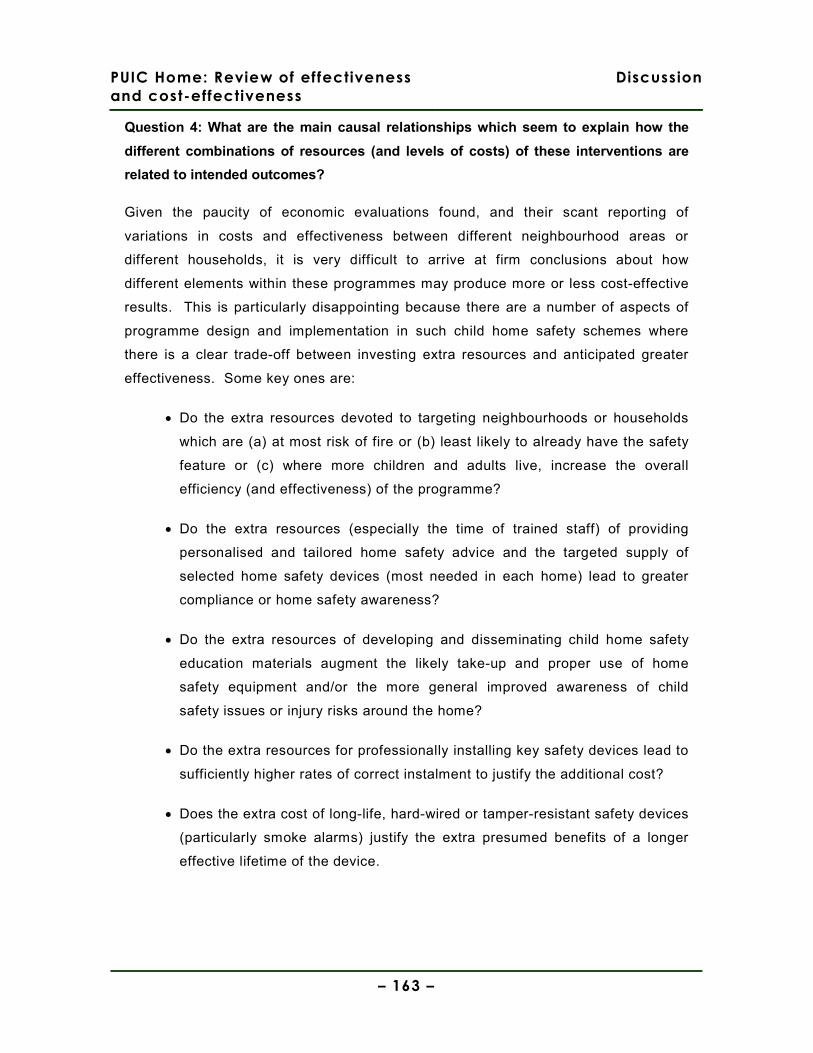
PUIC Home: Review of effectiveness
and cost-effectiveness
Discussion
– 163 –
Question 4: What are the main causal relationships which seem to explain how the
different combinations of resources (and levels of costs) of these interventions are
related to intended outcomes?
Given the paucity of economic evaluations found, and their scant reporting of
variations in costs and effectiveness between different neighbourhood areas or
different households, it is very difficult to arrive at firm conclusions about how
different elements within these programmes may produce more or less cost-effective
results. This is particularly disappointing because there are a number of aspects of
programme design and implementation in such child home safety schemes where
there is a clear trade-off between investing extra resources and anticipated greater
effectiveness. Some key ones are:
• Do the extra resources devoted to targeting neighbourhoods or households
which are (a) at most risk of fire or (b) least likely to already have the safety
feature or (c) where more children and adults live, increase the overall
efficiency (and effectiveness) of the programme?
• Do the extra resources (especially the time of trained staff) of providing
personalised and tailored home safety advice and the targeted supply of
selected home safety devices (most needed in each home) lead to greater
compliance or home safety awareness?
• Do the extra resources of developing and disseminating child home safety
education materials augment the likely take-up and proper use of home
safety equipment and/or the more general improved awareness of child
safety issues or injury risks around the home?
• Do the extra resources for professionally installing key safety devices lead to
sufficiently higher rates of correct instalment to justify the additional cost?
• Does the extra cost of long-life, hard-wired or tamper-resistant safety devices
(particularly smoke alarms) justify the extra presumed benefits of a longer
effective lifetime of the device.
PUIC Home: Review of effectiveness
and cost-effectiveness
Discussion
– 164 –
• Are the extra resources of having a much larger (e.g. city-wide) programme
largely offset by economies of scale, and attributing the fixed costs of
programmes across a larger number of potential beneficiaries?
This is not an exhaustive list of the many “economic” trade-offs inherent within each
instance of home safety programme design and implementation.
Unfortunately, the costing and other studies excluded at full-text stage only provided
a few additional insights. The evaluation of a home safety equipment scheme, linked
to a Sure Start programme in East Lancashire, presented such scant details of its
cost-savings estimates that it was impossible to draw reliable insights (Carman et al.
2006). However, a recent economic evaluation of an intensive home visiting
programme for vulnerable families – to prevent intentional injuries to children –
conducted from both a societal and a health service perspective, showed the large
difference that analyses from these different perspectives can make (McIntosh et al.
2009). This study also highlighted the importance of observing or estimating long-
term impacts. Finally, the very comprehensive cost analysis by Parmer et al, of a
smoke alarm and fire safety education programme in four USA states, highlighted that
the more intensive the intervention (and, perhaps, the more thorough the costing
methods), then the more expensive the programme may be estimated to cost (e.g.
they included all training, canvassing, installation and follow-up costs, arriving at a
cost per alarm installed of $132) (Parmer et al. 2006). They also highlighted the
marginal cost advantages of having larger schemes (i.e. economies of scale).
7.2. Effectiveness review strengths and limitations
7.2.1. Strengths of the review
This systematic review has been based on explicit and policy-relevant review
questions, according to a pre-defined review protocol, and used search strategies
developed by an information specialist which were specifically designed to identify
potentially relevant studies. A wide range of electronic databases has been
searched, including some which are specific to the area of safety policy/research.
These searches have also been supplemented by other targeted searches, and
searches of relevant websites and the reference lists of included studies.
PUIC Home: Review of effectiveness
and cost-effectiveness
Discussion
– 165 –
7.2.2. Limitations of the review
Limitations of the systematic review methods used
Resource limitations meant that we did not use double data extraction or double
check quality assessment which may limit the reliability of the review. However,
multiple reviewers did discuss issues throughout the project and this led to some
reassessment of the quality of some studies and to noted corrections in the extracted
data. Despite this, it remains possible that inaccuracies may remain.
There are a number of limitations with the methodological checklist for quality that
was applied to this body of research. Using the same checklist to assess a number
of different study designs means that a large number of the questions may be
inappropriate, particularly for uncontrolled studies. In addition, much of the language
used in the checklist comes from clinical studies, and may not be clearly transferable
to public health interventions. Many studies also included several strands of data
collection – for example, registry or hospital data relating to injuries, observations of
safety measures taken in the home and a questionnaire to assess knowledge, while
the quality appraisal checklist makes no provision for such different strands which
may all have different strengths and weaknesses, although clearly it is impractical to
provide lengthy assessment of every part of the study. In addition, some key
elements which relate to the intervention itself rather than research conduct may be
important when considering quality, such as: recruitment rates; the presence of other
community based safety interventions or simply the level of detail provided about the
intervention itself.
Limitations of the included studies
In many instances, evidence for the effectiveness of interventions is inconsistent; with
some studies showing effectiveness across some of their measured outcomes, but
not for other outcomes in the same study, and/or across studies. In order to
rationalise this picture, we have summarised the data which is based on the most
robust designs, using a control group, and which used observed measurements
rather than self-report for the outcomes.
Few of the studies report injury outcomes, and where they do, they are reported in
disparate ways precluding pooling. This is particularly limiting where outcomes, such
PUIC Home: Review of effectiveness
and cost-effectiveness
Discussion
– 166 –
as severe or fatal injuries, are relatively rare events, and so pooling across studies
may enhance the power of studies to detect actual differences. Within individual
studies, this could be addressed by longer term follow up although this is clearly
complicated by implications for attrition. However, in nearly half of the studies
(11/23) follow-up was for six months or less, and only six studies had follow up of
more than one year. Longer follow up may also be important because devices may
fail, stop being used or get broken over time. Family composition may also change,
with some children growing out of the need for some devices, while newly born
children may have continued or new safety needs.
Outcomes used to assess the impact of interventions on either the continued
presence and use of safety equipment, or changes in safety knowledge and
behaviour, also use many different measures, preventing meaningful pooling.
In some cases, it is difficult to understand from the study reports exactly which
components made up the intervention. In addition, there may be references to other
ongoing activities in the wider community that may also have had an impact on safety
related behaviour in the home. This is clearly most important in studies with no
control group, making nay changes difficult to attribute to the intervention alone.
There were low levels of uptake for the intervention offered by some studies, and
there may be problems in gaining the trust of parents required to allow access to
households.
Contamination may be a problem where control groups are based on the same, or
nearby communities to those receiving the intervention.
We are aware that there are a number of local initiatives, such as those offered by
local authorities and the fire service in the UK, which provide information and smoke
alarms to householders but we did not identify any evaluations of these programmes
for inclusion in this review.
PUIC Home: Review of effectiveness
and cost-effectiveness
Discussion
– 167 –
7.3. Cost-effectiveness review strengths and limitations
7.3.1. Strengths of the review
This systematic review has been based on explicit and policy-relevant review
questions, according to a pre-defined review protocol, and used search strategies
developed by an information specialist which were specifically designed to identify
potentially relevant studies. A wide range of electronic databases has been
searched, including some which are specific to the area of safety policy/research.
These searches have also been supplemented by other targeted searches, and
searches of relevant websites and the reference lists of included studies.
The study inclusion/exclusion decisions, study data extraction and quality
assessment has been conducted by a health economist who is experienced in both
conducting economic evaluations and in conducting systematic reviews of economic
evaluations. Also, the main bibliographic searches which supplied potentially
includable papers/reports for all three linked systematic reviews, was run in
appropriate economic literature databases such as NHSEED and EconLit.
7.3.2. Limitations of the review
Limitations of the systematic review methods used
Due to unavoidable time and other resource constraints, this systematic review was
largely conducted by one person (the team’s health economist). There was therefore
little time available for checking study inclusion/exclusion choices or for checking
data extraction and study quality assessment. Nevertheless, given the small number
of papers included, and therefore the number of times they were re-read, we feel it is
unlikely that errors of data extraction would not have come to light.
The initial searches were not restricted by study design, so the identification of
economic evaluations (or UK-based cost analyses) were either identified in the initial
full search results (i.e. by title and abstract), or on retrieval of full-text effectiveness
studies (some of which turned out to incorporate an economic analysis). This should
actually be a strength of our approach, because we did not rely upon dedicated
search terms or study design filters to identify potential economic evaluations, which
may miss relevant studies.
PUIC Home: Review of effectiveness
and cost-effectiveness
Discussion
– 168 –
Main limitations of the included studies
• There were only 3 published and relevant economic studies of these types of home
safety programmes. This is in contrast to the relatively large number of cost analysis
and cost-of-illness studies of childhood injury (e.g. seven from the USA)
• Sometimes very brief descriptions of economic analysis methods used, in most
studies. This is especially the case for the cost-effectiveness analysis reported as a
part of a paper mainly reporting effectiveness evaluation and results.
• Of the three studies, two had quite short time horizons (1 to 4 years), which may – if
the effectiveness results are extrapolated into the future – overestimate the
effectiveness (and cost-effectiveness) of the programmes; in particular the smoke-
alarm giveaway programmes, where both the function of the device and batteries may
deteriorate over time.
• No or very limited sensitivity analyses (only one study conducted a probabilistic
sensitivity analysis; Ginnelly et al. 2005).
7.4. Further research
Further research is required of robust study design and sufficiently long term,
preferably repeated follow up, which relates to the actual impact of interventions on
injury rates in children.
It would be useful for future studies to use consistent measures for injury rates,
installations rates, and knowledge and behaviour which may facilitate synthesis in the
future. Where possible, these should not be self-reported measures although if these
are to be used, their accuracy should tested in a sub-sample or pilot study.
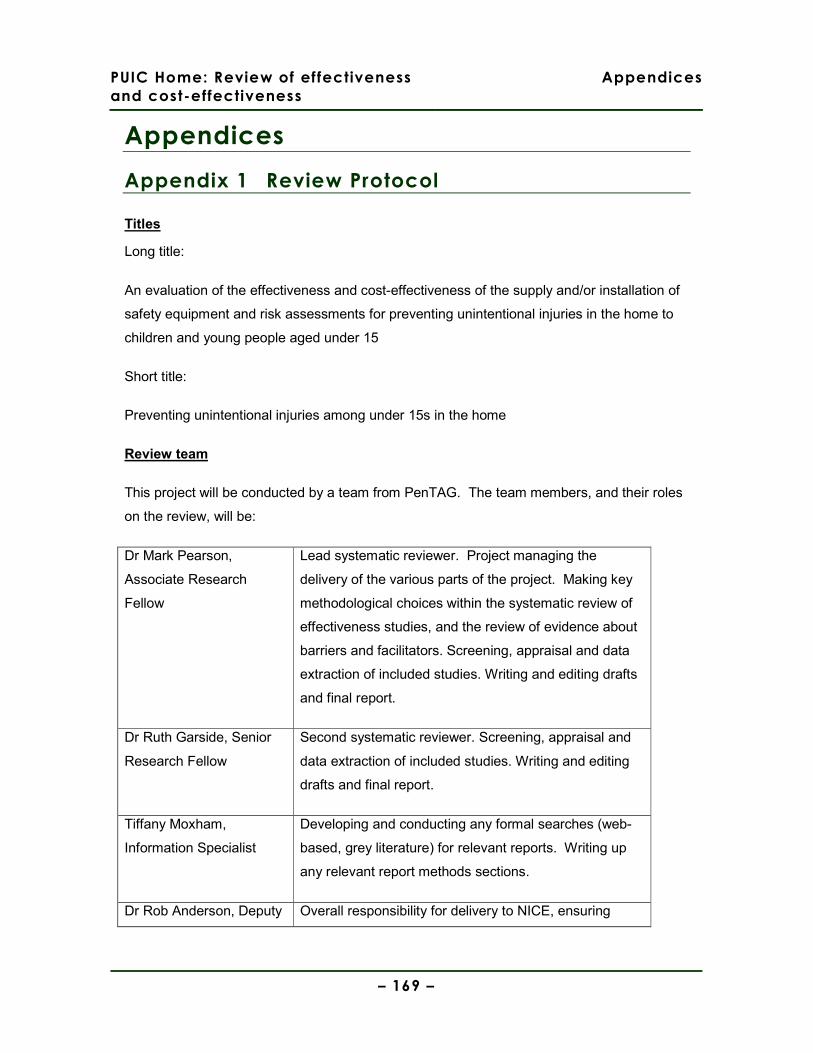
PUIC Home: Review of effectiveness
and cost-effectiveness
Appendices
– 169 –
Appendices
Appendix 1 Review Protocol
Titles
Long title:
An evaluation of the effectiveness and cost-effectiveness of the supply and/or installation of
safety equipment and risk assessments for preventing unintentional injuries in the home to
children and young people aged under 15
Short title:
Preventing unintentional injuries among under 15s in the home
Review team
This project will be conducted by a team from PenTAG. The team members, and their roles
on the review, will be:
Dr Mark Pearson,
Associate Research
Fellow
Lead systematic reviewer. Project managing the
delivery of the various parts of the project. Making key
methodological choices within the systematic review of
effectiveness studies, and the review of evidence about
barriers and facilitators. Screening, appraisal and data
extraction of included studies. Writing and editing drafts
and final report.
Dr Ruth Garside, Senior
Research Fellow
Second systematic reviewer. Screening, appraisal and
data extraction of included studies. Writing and editing
drafts and final report.
Tiffany Moxham,
Information Specialist
Developing and conducting any formal searches (web-
based, grey literature) for relevant reports. Writing up
any relevant report methods sections.
Dr Rob Anderson, Deputy Overall responsibility for delivery to NICE, ensuring

PUIC Home: Review of effectiveness
and cost-effectiveness
Appendices
– 170 –
Director (PenTAG) report meets agreed protocol, discussing and agreeing
with NICE any divergences from protocol. Conducting
any original economic analysis, and leading the
systematic review of cost-effectiveness evidence.
Writing and editing drafts and final report.
Key deliverables and dates
Deliverable Date Comments back from NICE CPHE by:
Draft review protocol 19th February 25th February
Draft search strategy 27th February 4th March
Signing-off of review protocol and search strategy
5th March
Interim progress meeting/ teleconference (1) – Including discussion of the feasibility, value and focus of a review of barriers and facilitators and any economic modelling
8th May
(2:00-3:30pm)
Interim progress meeting/ teleconference (2) – Including discussion of the nature of the emerging evidence and issues to do with how best to summarise and synthesise it
16th June
(2:00-3:30pm)
Draft Reports (main reviews, including cost-effectiveness, with draft evidence statements)
13th July 20th July
Draft Report11 (barriers & facilitators) 29th July 5th August
Draft Report12 (economic modelling) 29th July 5th August
11 Where a review of barriers and facilitators is agreed to be feasible and useful, via discussion between the Collaborating Centre and the relevant lead analyst and associate director at CPHE (see Interim progress meeting (1))
12 Where an original economic analysis is agreed to be feasible and useful, via discussion between the Collaborating Centre and the relevant lead analyst and associate director at CPHE (see Interim
PUIC Home: Review of effectiveness
and cost-effectiveness
Appendices
– 171 –
Final Report (main reviews with final evidence statements)
12th August
Final report (barriers & facilitators) 12th August
Final Report (economic modelling) 12th August
PHIAC 1st meeting 11th September
Clarification of scope
Populations
Groups that will be covered
Children and young people aged under 15, particularly those in disadvantaged
circumstances (for example, those living with families on a low income, living in
overcrowded housing or with a lone parent).
Parents and carers of children and young people aged under 15.
Groups that will not be covered
Anyone aged 15 or older, except parents and carers of children and young people
aged under 15 (where they are the focus of research about their children, or where
they are targeted as key agents to reduce unintentional injuries in their children).
Interventions /Activities that will be covered
Activities
Activities/measures that will be covered
progress meeting (1)). If no economic analysis is deemed to be feasible or useful, the timelines for the other reviews may be renegotiated.
PUIC Home: Review of effectiveness
and cost-effectiveness
Appendices
– 172 –
NICE is developing a range of public health guidance to prevent unintentional
injuries among children and young people aged under 15. This protocol relates to
producing evidence about interventions which prevent such injuries in the home.
In parallel with this work, NICE will also be developing public health guidance (also
developed using the intervention development process) to prevent unintentional
injuries on road, street and other external environments. There will also be public
health guidance (developed through the programme guidance process) focusing on
the broader legislative/regulatory and related activities which aim to prevent
unintentional injuries in children. The present guidance will complement these
publications and will focus on the following interventions in the home, either
combined or delivered separately:
a) Supply and/or installation of safety equipment (free of charge or at a reduced
cost) inside of a home
b) Home risk assessments13, where the unintentional injury outcomes in children
and young people aged under 15 can be disaggregated
Activities/measures that will not be covered
a) Policy and legislative interventions
b) National and local media campaigns
c) Educational interventions (unless delivered alongside the included activities
listed above)
d) Reward and incentive schemes, hazard and risk counselling (unless delivered
alongside the included activities listed above)
13 Defined as: A systematic assessment of a home to identify potential hazards, evaluate the risk, and provide information or advice on appropriate actions to reduce those risks. The assessment may either be by a trained assessor visiting the home, or by a householder assessing their own home
PUIC Home: Review of effectiveness
and cost-effectiveness
Appendices
– 173 –
e) Design, manufacture and measures of efficacy of safety equipment
PUIC Home: Review of effectiveness
and cost-effectiveness
Appendices
– 174 –
Key questions
Question 1: Which interventions involving the supply and/or installation of home
safety equipment are effective and cost effective in preventing unintentional injuries
among children and young people aged under 15 in the home?
Question 2: Are home risk assessments effective and cost effective in preventing
unintentional injuries among children and young people aged under 15?
Question 3: What are the barriers to, and facilitators of, interventions involving the
supply and/or installation of home safety equipment, and/or home risk assessments?
Reports
Report 1 will include Reviews 1 (effectiveness) and 2 (cost-effectiveness). Report 2
will include Review 3 (barriers and facilitators) if it is to be included as a separate
review. Report 3 will include an economic analysis of one or more types of
intervention (if deemed feasible and useful). The division of resources for the
production of each of the reports will be finalised in discussion with the relevant lead
analyst and associate director at NICE CPHE in accordance with what is deemed
feasible and useful.
Reviews
Aims, key review questions and key outcomes
Report 1: Systematic review of effectiveness and cost-effectiveness studies
a) Aim
To identify, critically appraise, summarise and synthesise evidence relating to the
effectiveness (review 1) and cost-effectiveness (review 2) of the specified types of
interventions in the home aimed at reducing unintentional injuries in children and
young people aged under 15.

PUIC Home: Review of effectiveness
and cost-effectiveness
Appendices
– 175 –
b) Key review questions
Review 1 (effectiveness)
a. What is the effectiveness (in terms of preventing and reducing
unintentional injuries in children) of interventions involving the supply
(free of charge or at a reduced cost) and/or installation of home safety
equipment or devices?
b. What is the effectiveness (in terms of reducing the number or severity
of unintentional injuries in children) of home risk assessments?
c. What are the factors which either enhance or reduce the effectiveness
of interventions involving the supply and/or installation of home safety
equipment and/or home risk assessments, or which help or hinder their
implementation?
Expected outcomes:
a) Changes in injuries and deaths in children and young people aged under 15.
b) Changes in knowledge, attitude, skills and behaviour in relation to preventing
unintentional injuries among children and young people aged under 15 in the
home.
c) The rates of supply, correct installation and proper maintenance of safety
equipment resulting in a reduction in unintentional injuries among children and
young people aged under 15 in the home.
Review 2 (cost-effectiveness)
a. What is the cost-effectiveness of interventions involving the supply
and/or installation of home safety equipment?
b. What is the cost-effectiveness of home risk assessments?
PUIC Home: Review of effectiveness
and cost-effectiveness
Appendices
– 176 –
c. What are the main causal relationships which seem to explain how the
different combinations of resources (and levels of costs) of these
interventions are related to intended outcomes?
In addition, for Review 2:
• costs and/or resource use
• cost-benefit estimates
• cost-effectiveness ratios
Report 2: Systematic review of evidence about ‘barriers and facilitators’
Production of a separate review of barriers and facilitators is conditional upon (a) the
number of studies identified for inclusion in the effectiveness and cost-effectiveness
reviews (the “main reviews”); and (b) the number of studies eligible for inclusion in a
“barriers and facilitators” review. The number, range, and complexity of the identified
studies will be discussed at the first interim progress meeting (8th May) with regard to
the feasibility of producing a separate barriers and facilitators reviews. If the
production of a set of high quality reviews under each of these headings is deemed
unmanageable given the time and resources available, then a separate review of
barriers and facilitators will not be conducted. However, in order to still answer the
“barriers and facilitators” review question – it is proposed that relevant observations
from the ‘Discussion’ and ‘Conclusion’ sections of all the included effectiveness
papers will be extracted as part of that review (e.g. where authors try to explain why
their evaluated outcomes differed from others, or differed from what they expected).
a) Aim
To identify, critically appraise, summarise and synthesise qualitative and/or
quantitative evidence relating to contextual or other factors which either enhance or
reduce the effectiveness of interventions involving the supply and/or installation of
home safety equipment and/or home risk assessments, or which help or hinder their
implementation.
PUIC Home: Review of effectiveness
and cost-effectiveness
Appendices
– 177 –
b) Key review questions
What are the factors which either enhance or reduce the effectiveness of
interventions involving the supply and/or installation of home safety equipment
and/or home risk assessments, or which help or hinder their implementation?
Methods
1.1 Overview
An electronic search of relevant bibliographic databases, and also selected websites,
will be conducted in order to identify relevant primary research (to be supplemented
by communication with experts and/or organisations involved in the relevant
research or policy areas).
1.2 Search process and methods
• To review published literature and relevant unpublished/grey literature in order
to identify ineffective as well as effective interventions and approaches, as far
as time and other resources allow.
• To include all relevant primary research that meet the inclusion criteria (see
section 1.3). Searches will be conducted in the following databases:
The following databases will be searched.
From the “core databases”:
• ASSIA (Applied Social Science Index and Abstracts)
• CINAHL
• Database of Abstracts of Reviews of Effectiveness (DARE); NHS EED;
HTA (all in the CRD database)
• HMIC (or Kings Fund catalogue and DH data)
• MEDLINE
PUIC Home: Review of effectiveness
and cost-effectiveness
Appendices
– 178 –
• PsycINFO
• Social Science Citation Index
• Cochrane Database of Systematic Reviews [predominantly for
reference checking]
• EconLit
From the “topic-specific databases”:
• SafetyLit
• EPPI Centre databases
o Bibliomap
o DoPHER
o TRoPHI
• The Campbell Collaboration
• Search terms – See Annex A
Websites of the following relevant organisations will also be searched for
published and unpublished research:
• Child Accident Prevention Trust (http://www.capt.org.uk)
• Children in Wales (http://www.childreninwales.org.uk/areasofwork/childsafety)
• Injury Observatory for Britain & Ireland (http://www.injuryobservatory.net)
• Public Health Observatory website for the South West (lead on Injuries)
http://www.swpho.nhs.uk/)
• The Royal Society for the Prevention of Accidents (http://www.rospa.org)
• International Society for Child and Adolescent Injury Prevention
(http://www.iscaip.net/)
PUIC Home: Review of effectiveness
and cost-effectiveness
Appendices
– 179 –
• Integris (EU Injuries programme for coordinating injury data)
(http://www.rp7integris.eu/en/pages/home-1.aspx)
• Eurosafe
And may include the following, should time and resources allow:
• Scottish Executive
• Welsh Assembly Government
• Expert contacts in the relevant policy/practice areas as well as key researchers
of these types of intervention will also be consulted
1.3 Study selection
Inclusion criteria (common to all reviews):
Studies published from 1990
Studies published in English language
Studies conducted in OECD countries
Criteria specific to Review 1 (effectiveness):
Inclusion criteria:
Evaluations (prospective or retrospective) of interventions involving the supply
and/or installation of home safety equipment and/or home risk assessments
using comparative designs (randomized controlled trials, non-randomized
controlled trials, before and after studies, or natural experiments)
Studies reporting the relevant injury outcomes (see page 8) in children (or in both
adults and children but with the outcomes for children shown separately). This
inclusion criteria will only be applied at full-text assessment stage. In other words, no
papers will be excluded on the basis of age at the title and abstract screening stage.
PUIC Home: Review of effectiveness
and cost-effectiveness
Appendices
– 180 –
Where a study reports relevant outcomes related to an age range which overlaps
with, but is not restricted to, the focus for this review (for example, aged 5-18 rather
than under 15), it will be included only where the majority are of the appropriate age.
Exclusion criteria:
Empirical studies which only document interventions and related outcomes
without evidence regarding injury outcomes (see page 8) prior to or without
the intervention.
Empirical studies which do not separately report injury-related outcomes for
children or young people aged under 15.
Criteria specific to Review 2 (cost-effectiveness):
Inclusion criteria:
Full economic evaluations of relevant types of intervention, and high quality
costing studies conducted in the UK or countries of a similar level of economic
development.
Exclusion criteria:
Cost-of-illness studies, or other studies which do not involve assessing the
cost and related benefits/effectiveness of particular interventions (or class of
intervention).
Criteria specific to Review 3 (barriers & facilitators):
Inclusion criteria:
Primary qualitative research involving the analysis of written or spoken
speech/evidence, regarding attitudes towards, or experiences of, the relevant
interventions; OR
Quantitative or qualitative surveys of attitudes towards, or experiences of the
relevant interventions.
PUIC Home: Review of effectiveness
and cost-effectiveness
Appendices
– 181 –
Exclusion criteria:
Research which does not involve the collection and analysis of qualitative
data using established qualitative research methods14.
Study selection process
Assessment for inclusion will be undertaken initially at title and/or abstract level (to
identify potential papers/reports for inclusion) by a single reviewer (and a sample
checked by a second reviewer), and then by examination of full papers. Where the
research methods used are not clear from the abstract, assessment will be based
upon a reading of the full paper. Any relevant systematic reviews will be used first as
a further source of references for primary studies, but where there is a recent and
high quality systematic review that substantively answers an aspect of the review
question(s), we shall include the review, updating and extending it if it is considered
feasible to do so. All such decisions regarding the utilisation of systematic reviews
will be made in consultation with the NICE CPHE team.
If there are a large number of includable studies, such that a high quality review of
them all would not be feasible within the time and resources available, then studies
may be excluded from the full review on the basis of the study quality and/or
applicability to the UK context. The reasons for such exclusions will be discussed
and agreed with the CPHE team at the interim progress meeting (8th May).
1.4 Quality assessment and data extraction
All included studies will be quality assessed using the checklists in the Methods for
development of NICE public health guidance 2006 where these are appropriate (so
14 Primary qualitative research designs which use recognised methods of data collection and analysis (including, but not limited to, observational methods, interviews and focus groups for the former and grounded theory, thematic analysis, hermeneutic phenomenological analysis, discourse analysis etc. for the latter).
PUIC Home: Review of effectiveness
and cost-effectiveness
Appendices
– 182 –
if, for example, one is not available for a particular included study design we will seek
a valid checklist from other sources such as CRD or CASP). Any departure from the
methods manual will be discussed and agreed with the NICE CPHE Team. Data
extraction and quality assessment will be conducted by a single reviewer, and
checked by a second reviewer for a sample of studies, as agreed with the NICE
CPHE team.
1.5 Data synthesis and presentation, including evidence statements
Data synthesis and presentation, including evidence statements will be conducted
according to the procedures outlined in the Methods for development of NICE public
health guidance 2006. Key choices in how to synthesise the included evidence, or in
how to develop evidence statements, will be discussed with the relevant analysts at
CPHE.
Report 3: Economic analysis of a selected type of
intervention
(IF FEASIBLE AND USEFUL)
c) Aim
For a specific type(s) of intervention(s), to assess the relationship between the
amounts and combinations of resources and costs, and the levels of resulting
benefits and/or effectiveness (related to avoiding unintentional injuries to, and death
in, children).(ie. To look at the costs and benefits of all impacts of an intervention in
relation to unintentional injuries including death in children).
d) Perspective
The analysis will adopt both a health and Personal Social Services perspective, and a
broader public sector perspective in relation to costs and benefits (as in Methods for
development of NICE public health guidance 2006). Injury-related health outcomes will be
expressed in terms of QALYs or life-years gained/lost wherever possible. If good data are
PUIC Home: Review of effectiveness
and cost-effectiveness
Appendices
– 183 –
available, and where appropriate, impacts in terms of other outcomes, such as lost school
days may also be part of a broader cost-consequence approach to analysis. Also, if
sufficient good data are available, outcomes may be expressed in monetary terms and an
assessment of whether benefits exceed costs made.

PUIC Home: Review of effectiveness
and cost-effectiveness
Appendices
– 184 –
Appendix 2 Search Strategy
Searches were performed to find relevant primary research using a comparative
design, qualitative studies, and cost-effectiveness studies. The reference list of
systematic reviews of found studies will also be utilised. Searches were conducted in
medical, social science and policy databases along with a search for grey literature.
All searches were limited to those in English published since 1990, where possible.
No study design filters were applied.
PART 1: Bibliographic Databases
The following databases were searched. Use of “core and topic specific” based on
NICE guidance wording:
From the “core databases”:
• ASSIA (Applied Social Science Index and Abstracts)
• CINAHL
• Database of Abstracts of Reviews of Effectiveness (DARE); NHS EED;
HTA (all in the CRD database)
• HMIC (or Kings Fund catalogue and DH data)
• MEDLINE
• PsycINFO
• Social Science Citation Index
• Cochrane Database of Systematic Reviews [predominantly for
reference checking]
• EconLit
From the “topic-specific databases”:
• SafetyLit
• EPPI Centre databases
• Bibliomap
• DoPHER
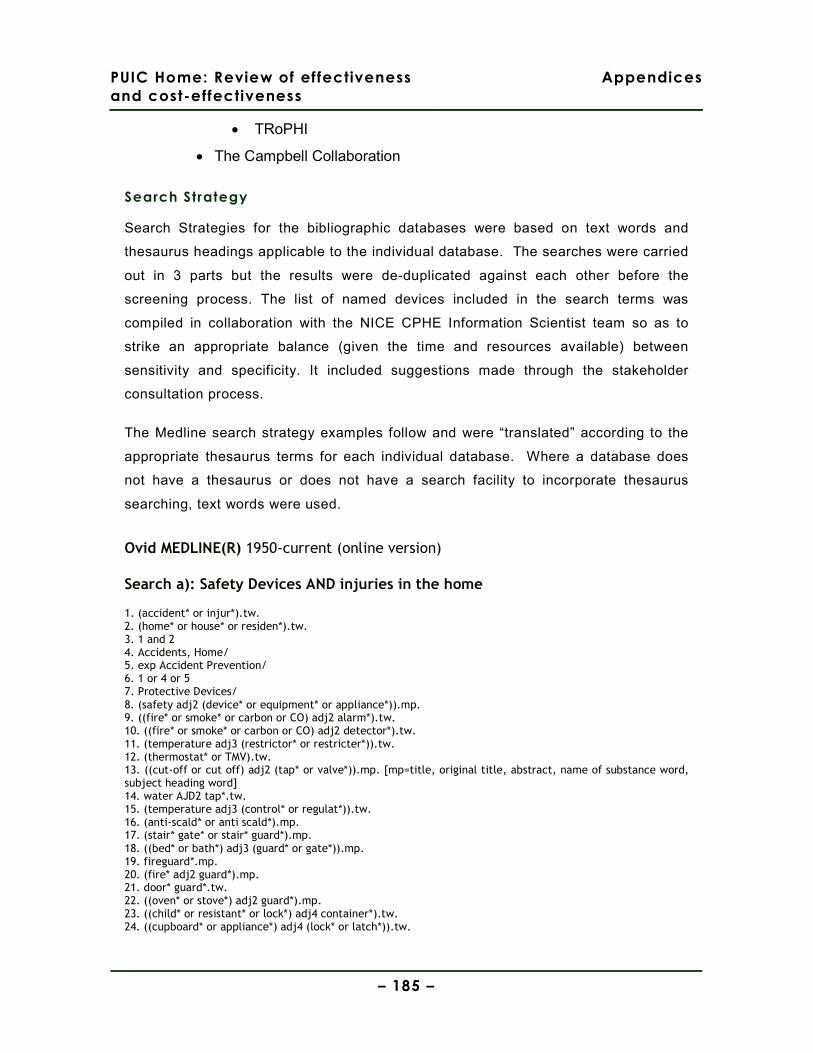
PUIC Home: Review of effectiveness
and cost-effectiveness
Appendices
– 185 –
• TRoPHI
• The Campbell Collaboration
Search Strategy
Search Strategies for the bibliographic databases were based on text words and
thesaurus headings applicable to the individual database. The searches were carried
out in 3 parts but the results were de-duplicated against each other before the
screening process. The list of named devices included in the search terms was
compiled in collaboration with the NICE CPHE Information Scientist team so as to
strike an appropriate balance (given the time and resources available) between
sensitivity and specificity. It included suggestions made through the stakeholder
consultation process.
The Medline search strategy examples follow and were “translated” according to the
appropriate thesaurus terms for each individual database. Where a database does
not have a thesaurus or does not have a search facility to incorporate thesaurus
searching, text words were used.
Ovid MEDLINE(R) 1950-current (online version)
Search a): Safety Devices AND injuries in the home
1. (accident* or injur*).tw. 2. (home* or house* or residen*).tw. 3. 1 and 2 4. Accidents, Home/ 5. exp Accident Prevention/ 6. 1 or 4 or 5 7. Protective Devices/ 8. (safety adj2 (device* or equipment* or appliance*)).mp. 9. ((fire* or smoke* or carbon or CO) adj2 alarm*).tw. 10. ((fire* or smoke* or carbon or CO) adj2 detector*).tw. 11. (temperature adj3 (restrictor* or restricter*)).tw. 12. (thermostat* or TMV).tw. 13. ((cut-off or cut off) adj2 (tap* or valve*)).mp. [mp=title, original title, abstract, name of substance word, subject heading word] 14. water AJD2 tap*.tw. 15. (temperature adj3 (control* or regulat*)).tw. 16. (anti-scald* or anti scald*).mp. 17. (stair* gate* or stair* guard*).mp. 18. ((bed* or bath*) adj3 (guard* or gate*)).mp. 19. fireguard*.mp. 20. (fire* adj2 guard*).mp. 21. door* guard*.tw. 22. ((oven* or stove*) adj2 guard*).mp. 23. ((child* or resistant* or lock*) adj4 container*).tw. 24. ((cupboard* or appliance*) adj4 (lock* or latch*)).tw.
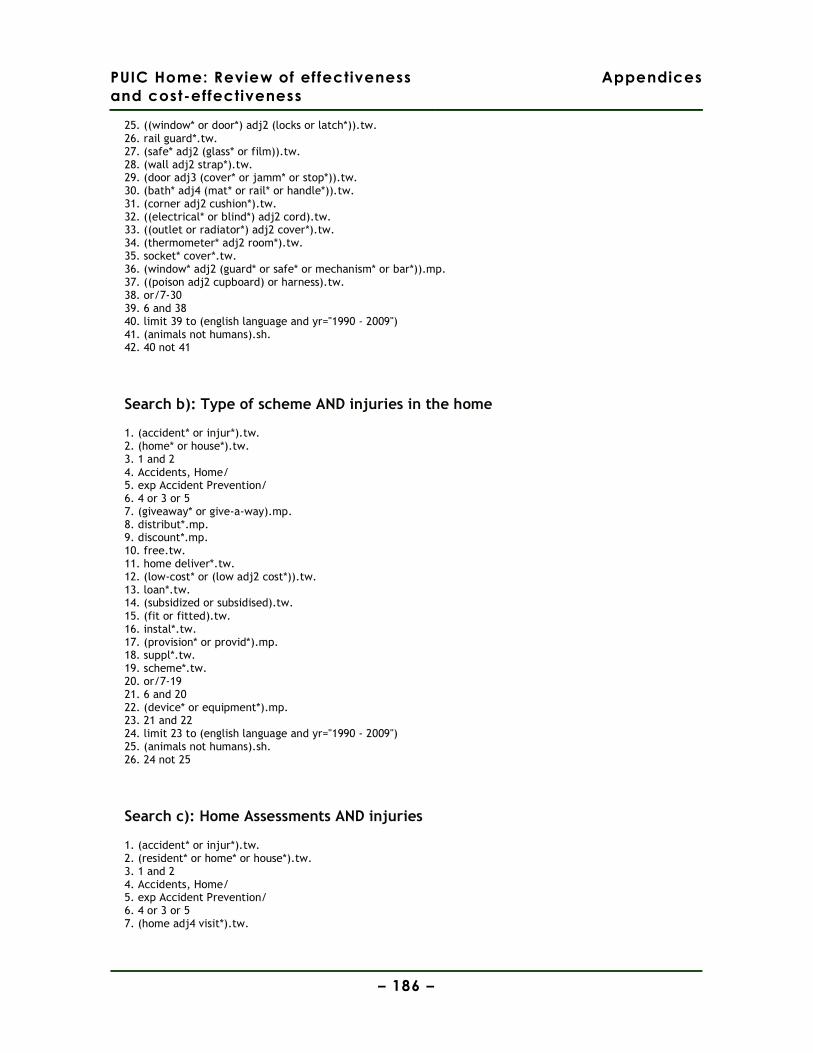
PUIC Home: Review of effectiveness
and cost-effectiveness
Appendices
– 186 –
25. ((window* or door*) adj2 (locks or latch*)).tw. 26. rail guard*.tw. 27. (safe* adj2 (glass* or film)).tw. 28. (wall adj2 strap*).tw. 29. (door adj3 (cover* or jamm* or stop*)).tw. 30. (bath* adj4 (mat* or rail* or handle*)).tw. 31. (corner adj2 cushion*).tw. 32. ((electrical* or blind*) adj2 cord).tw. 33. ((outlet or radiator*) adj2 cover*).tw. 34. (thermometer* adj2 room*).tw. 35. socket* cover*.tw. 36. (window* adj2 (guard* or safe* or mechanism* or bar*)).mp. 37. ((poison adj2 cupboard) or harness).tw. 38. or/7-30 39. 6 and 38 40. limit 39 to (english language and yr="1990 - 2009") 41. (animals not humans).sh. 42. 40 not 41
Search b): Type of scheme AND injuries in the home
1. (accident* or injur*).tw. 2. (home* or house*).tw. 3. 1 and 2 4. Accidents, Home/ 5. exp Accident Prevention/ 6. 4 or 3 or 5 7. (giveaway* or give-a-way).mp. 8. distribut*.mp. 9. discount*.mp. 10. free.tw. 11. home deliver*.tw. 12. (low-cost* or (low adj2 cost*)).tw. 13. loan*.tw. 14. (subsidized or subsidised).tw. 15. (fit or fitted).tw. 16. instal*.tw. 17. (provision* or provid*).mp. 18. suppl*.tw. 19. scheme*.tw. 20. or/7-19 21. 6 and 20 22. (device* or equipment*).mp. 23. 21 and 22 24. limit 23 to (english language and yr="1990 - 2009") 25. (animals not humans).sh. 26. 24 not 25
Search c): Home Assessments AND injuries
1. (accident* or injur*).tw. 2. (resident* or home* or house*).tw. 3. 1 and 2 4. Accidents, Home/ 5. exp Accident Prevention/ 6. 4 or 3 or 5 7. (home adj4 visit*).tw.
PUIC Home: Review of effectiveness
and cost-effectiveness
Appendices
– 187 –
8. inspect*.tw. 9. visit.tw. 10. (safety adj2 (assessment* or check*)).tw. 11. home visit*.tw. 12. safety consult*.tw. 13. (home adj2 (assessment* or evaluation*)).tw. 14. 8 or 13 or 9 or 11 or 7 or 12 or 10 15. 6 and 14 16. limit 15 to (english language and yr="1990 - 2009") 17. (animals not humans).sh. 18. 16 not 17 19. (1 or 5) and 2 20. 19 or 4 21. (visit* or inspection* or assessment* or check* or evaluation* or (safety adj consult*)).tw. 22. 20 and 21 23. limit 22 to (english language and yr="1990 - 2009") 24. 23 not 17 25. 18 or 24
Part 2: Organisation web-sites and in-house databases:
Websites of the following relevant organisations were searched for published and
unpublished research:
• Child Accident Prevention Trust (http://www.capt.org.uk)
• Children in Wales (http://www.childreninwales.org.uk/areasofwork/childsafety)
• Injury Observatory for Britain & Ireland (http://www.injuryobservatory.net)
• Public Health Observatory website for the South West (lead on Injuries) (http://www.swpho.nhs.uk/)
• The Royal Society for the Prevention of Accidents (http://www.rospa.org)
• International Society for Child and Adolescent Injury Prevention (http://www.iscaip.net/)
• Integris (EU Injuries programme for coordinating injury data) (http//www.rp7integris.eu/en/pages/home-1.aspx)
• Department for children schools and families (http://www.dcsf.gov.uk/pns/DisplayPN.cgi?pn_id=2009_0036)
• Eurosafe (http://www.eurosafe.eu.com/csi/eurosafe2006.nsf/wwwvwcontent/l3childsafety-cxvbcx.htm)
• Vauxhall home safety initiative (http://www.vnc.org.uk/vhsi/vhsi.htm)
PUIC Home: Review of effectiveness
and cost-effectiveness
Appendices
– 188 –
• Collaboration for Accident Prevention and Injury Control (CAPIC) (http://www.capic.org.uk/)
• Health and Safety Executive (http://www.hse.gov.uk/)
• Communities and Local Government (http://www.communities.gov.uk/fire/firesafety/prevention/)
PART 3: Additional Searches
Additional “targeted” searches were performed of the following named programmes
on Medline and using an Internet search engine (Google):
safe block, dangerpoint, care and repair, sure start, early start, project safe care, safe
at home, child injury prevention program (SCIPP), Let’s Get Alarmed!, family safety
scheme, safe place project, eastside childsafe project, Care and Repair Programme,
Handy Person Scheme, Lifetime Homes, Lifetime Neighbourhoods, Safe @home,
child safe: safer Cardiff.
PART 4: Citation and Reference Searching
The reference lists of systematic reviews, key reports, and included studies were
searched for additional papers.
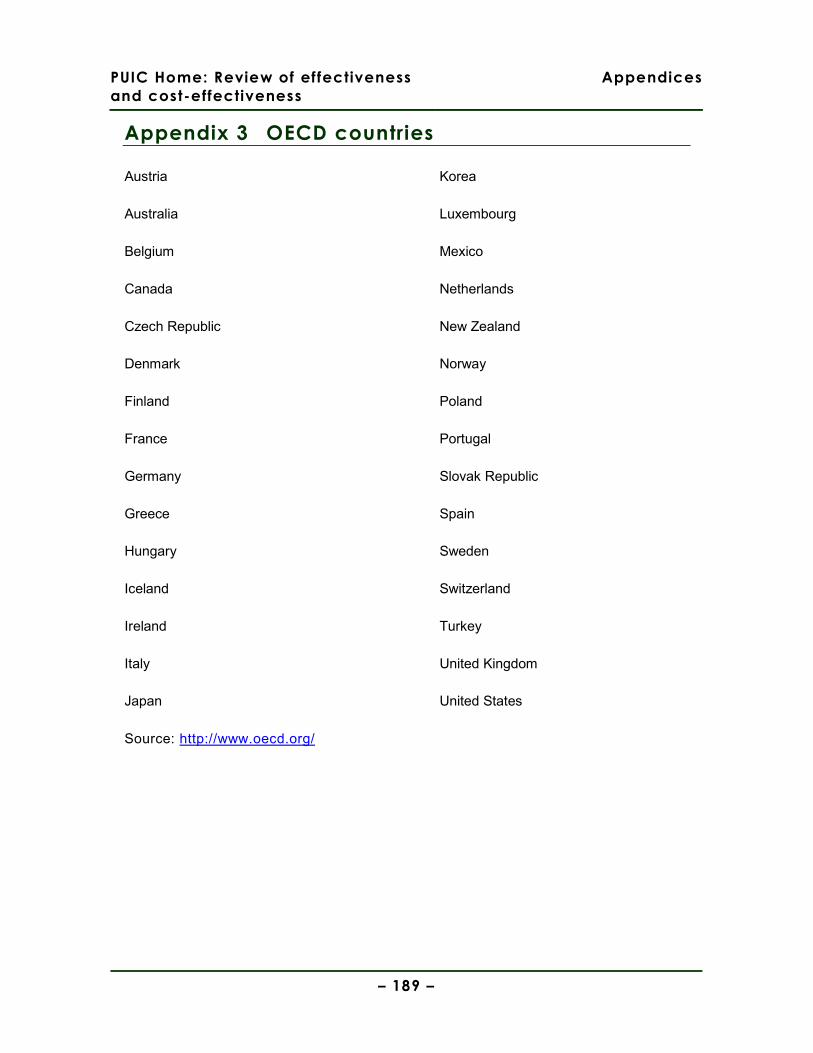
PUIC Home: Review of effectiveness
and cost-effectiveness
Appendices
– 189 –
Appendix 3 OECD countries
Austria Korea
Australia Luxembourg
Belgium Mexico
Canada Netherlands
Czech Republic New Zealand
Denmark Norway
Finland Poland
France Portugal
Germany Slovak Republic
Greece Spain
Hungary Sweden
Iceland Switzerland
Ireland Turkey
Italy United Kingdom
Japan United States
Source: http://www.oecd.org/

PUIC Home: Review of effectiveness
and cost-effectiveness
Appendices
– 190 –
Appendix 4 Screening checklist
Title/abstract criteria 1 Not addressing the supply and/or installation of home safety equipment (free of
charge or at a reduced cost) inside of a home OR the provision of home risk assessments15
2 Not addressing admissions to hospital or preventable deaths (in children under 15) related to unintentional injuries in the home OR changes in knowledge, skills and behaviour in relation to preventing unintentional injuries OR the rates of supply, correct installation and proper maintenance of safety equipment OR the costs associated with interventions to prevent such outcomes OR barriers & facilitators to such interventions
4 Not a comparative design OR full economic evaluation OR high quality costing study OR primary qualitative research OR survey of attitudes/experiences
5 Not set in an OECD country 6 Published prior to 1990 7 Not in English 8 Duplicate 9 Applicability fatally flawed (e.g. setting completely inappropriate) 10 Maybe (Discuss with 2nd reviewer) A Review for refs [this must be applied in addition to an exclusion criteria] Further criteria at full text stage 1 Outcomes not reported separately for children under 15 years (or where the
majority are not under 15 years) 2 Not a comparative design
OR economic evaluation OR high quality costing study OR findings do not relate to barriers and facilitators
3 Unobtainable
15 Defined as: A systematic assessment of a home to identify potential hazards, evaluate the risk, and provide information or advice on appropriate actions to reduce those risks. The assessment may either be by a trained assessor visiting the home, or by a householder assessing their own home
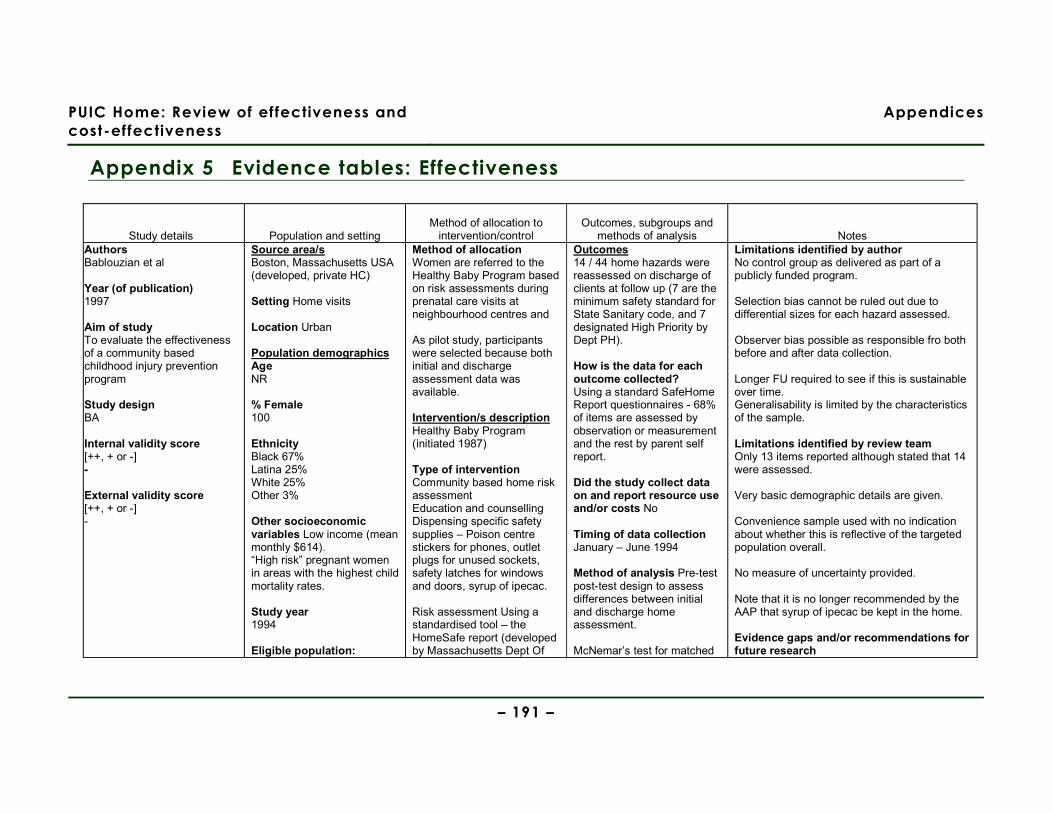
PUIC Home: Review of effectiveness and
cost-effectiveness
Appendices
– 191 –
Appendix 5 Evidence tables: Effectiveness
Study details Population and setting Method of allocation to
intervention/control Outcomes, subgroups and
methods of analysis Notes Authors Bablouzian et al Year (of publication) 1997
Aim of study To evaluate the effectiveness of a community based childhood injury prevention program Study design BA Internal validity score [++, + or -] -
External validity score [++, + or -] -
Source area/s Boston, Massachusetts USA (developed, private HC) Setting Home visits Location Urban Population demographics Age NR % Female 100 Ethnicity Black 67% Latina 25% White 25% Other 3% Other socioeconomic variables Low income (mean monthly $614). “High risk” pregnant women in areas with the highest child mortality rates. Study year 1994 Eligible population:
Method of allocation Women are referred to the Healthy Baby Program based on risk assessments during prenatal care visits at neighbourhood centres and As pilot study, participants were selected because both initial and discharge assessment data was available. Intervention/s description Healthy Baby Program (initiated 1987) Type of intervention Community based home risk assessment Education and counselling Dispensing specific safety supplies – Poison centre stickers for phones, outlet plugs for unused sockets, safety latches for windows and doors, syrup of ipecac. Risk assessment Using a standardised tool – the HomeSafe report (developed by Massachusetts Dept Of
Outcomes 14 / 44 home hazards were reassessed on discharge of clients at follow up (7 are the minimum safety standard for State Sanitary code, and 7 designated High Priority by Dept PH). How is the data for each outcome collected? Using a standard SafeHome Report questionnaires - 68% of items are assessed by observation or measurement and the rest by parent self report. Did the study collect data on and report resource use and/or costs No Timing of data collection January – June 1994 Method of analysis Pre-test post-test design to assess differences between initial and discharge home assessment. McNemar’s test for matched
Limitations identified by author No control group as delivered as part of a publicly funded program. Selection bias cannot be ruled out due to differential sizes for each hazard assessed. Observer bias possible as responsible fro both before and after data collection. Longer FU required to see if this is sustainable over time. Generalisability is limited by the characteristics of the sample. Limitations identified by review team Only 13 items reported although stated that 14 were assessed. Very basic demographic details are given. Convenience sample used with no indication about whether this is reflective of the targeted population overall. No measure of uncertainty provided. Note that it is no longer recommended by the AAP that syrup of ipecac be kept in the home. Evidence gaps and/or recommendations for future research

PUIC Home: Review of effectiveness and
cost-effectiveness
Appendices
– 192 –
Study details Population and setting Method of allocation to
intervention/control Outcomes, subgroups and
methods of analysis Notes Those receiving Health Baby programme. Selected population: Receiving healthy baby programme. Having initial and discharge data for 14 key questions on a Risk assessment questionnaire. No data about people on the program who failed to meet this criteria. Excluded population/s: (as above) NR
PH) which asses 44 potential home hazards in 6 categories – kitchen safety, bathroom safety, child area safety, general safety, safety supplies & safety practices. Other components of scheme/intervention? Undertaken as part of routine home visits for pregnant women. Home visitors also promoted the use of child restraint systems in cars and referred to a car seat loan service for new mothers. Intervention delivered:
− When/where At home
− By whom Nurses and advocates
− How often Once Mean time to follow up was 3.5 months Control/comparison/s description Before and after study Sample sizes Total n= 72
pairs of dichotomous data conducted for each hazard. All analyses conducted using SAS. Were there any subgroups for which outcomes were reported? No If so, which subgroups were outcomes reported for? NA Were the subgroup analyses prespecified? NA
Cost effectiveness of the program Source of funding NR Did the study collect data on and report information about barriers and facilitators to/of effectiveness? No Observations from the Discussion section regarding barriers & facilitators None
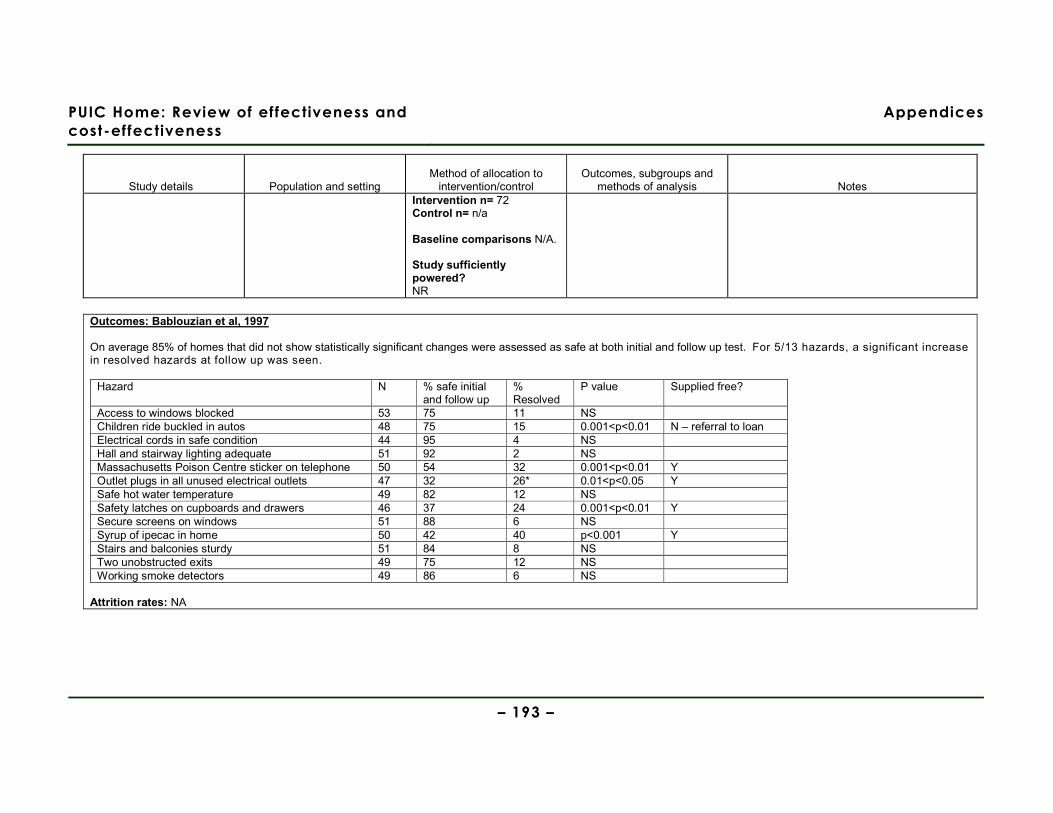
PUIC Home: Review of effectiveness and
cost-effectiveness
Appendices
– 193 –
Study details Population and setting Method of allocation to
intervention/control Outcomes, subgroups and
methods of analysis Notes Intervention n= 72 Control n= n/a Baseline comparisons N/A. Study sufficiently powered? NR
Outcomes: Bablouzian et al, 1997 On average 85% of homes that did not show statistically significant changes were assessed as safe at both initial and follow up test. For 5/13 hazards, a significant increase in resolved hazards at follow up was seen.
Hazard N % safe initial and follow up
% Resolved
P value Supplied free?
Access to windows blocked 53 75 11 NS Children ride buckled in autos 48 75 15 0.001<p<0.01 N – referral to loan Electrical cords in safe condition 44 95 4 NS Hall and stairway lighting adequate 51 92 2 NS Massachusetts Poison Centre sticker on telephone 50 54 32 0.001<p<0.01 Y Outlet plugs in all unused electrical outlets 47 32 26* 0.01<p<0.05 Y Safe hot water temperature 49 82 12 NS Safety latches on cupboards and drawers 46 37 24 0.001<p<0.01 Y Secure screens on windows 51 88 6 NS Syrup of ipecac in home 50 42 40 p<0.001 Y Stairs and balconies sturdy 51 84 8 NS Two unobstructed exits 49 75 12 NS Working smoke detectors 49 86 6 NS
Attrition rates: NA
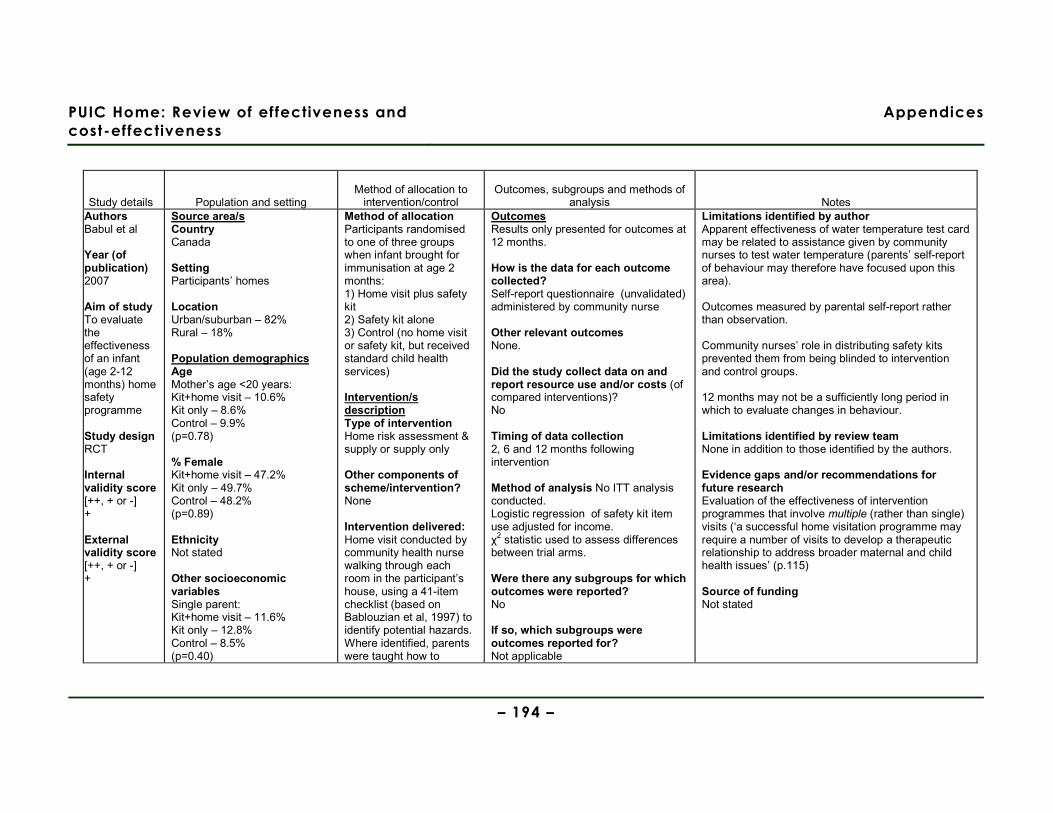
PUIC Home: Review of effectiveness and
cost-effectiveness
Appendices
– 194 –
Study details Population and setting Method of allocation to
intervention/control Outcomes, subgroups and methods of
analysis Notes Authors Babul et al Year (of publication) 2007
Aim of study To evaluate the effectiveness of an infant (age 2-12 months) home safety programme Study design RCT Internal validity score [++, + or -] + External validity score [++, + or -] +
Source area/s Country Canada Setting Participants’ homes Location Urban/suburban – 82% Rural – 18% Population demographics Age Mother’s age <20 years: Kit+home visit – 10.6% Kit only – 8.6% Control – 9.9% (p=0.78) % Female Kit+home visit – 47.2% Kit only – 49.7% Control – 48.2% (p=0.89) Ethnicity Not stated Other socioeconomic variables Single parent: Kit+home visit – 11.6% Kit only – 12.8% Control – 8.5% (p=0.40)
Method of allocation Participants randomised to one of three groups when infant brought for immunisation at age 2 months: 1) Home visit plus safety kit 2) Safety kit alone 3) Control (no home visit or safety kit, but received standard child health services) Intervention/s description Type of intervention Home risk assessment & supply or supply only
Other components of scheme/intervention? None Intervention delivered: Home visit conducted by community health nurse walking through each room in the participant’s house, using a 41-item checklist (based on Bablouzian et al, 1997) to identify potential hazards. Where identified, parents were taught how to
Outcomes Results only presented for outcomes at 12 months. How is the data for each outcome collected? Self-report questionnaire (unvalidated) administered by community nurse Other relevant outcomes None. Did the study collect data on and report resource use and/or costs (of compared interventions)? No Timing of data collection 2, 6 and 12 months following intervention Method of analysis No ITT analysis conducted. Logistic regression of safety kit item use adjusted for income. χ2 statistic used to assess differences between trial arms. Were there any subgroups for which outcomes were reported? No If so, which subgroups were outcomes reported for? Not applicable
Limitations identified by author Apparent effectiveness of water temperature test card may be related to assistance given by community nurses to test water temperature (parents’ self-report of behaviour may therefore have focused upon this area). Outcomes measured by parental self-report rather than observation. Community nurses’ role in distributing safety kits prevented them from being blinded to intervention and control groups. 12 months may not be a sufficiently long period in which to evaluate changes in behaviour. Limitations identified by review team None in addition to those identified by the authors. Evidence gaps and/or recommendations for future research Evaluation of the effectiveness of intervention programmes that involve multiple (rather than single) visits (‘a successful home visitation programme may require a number of visits to develop a therapeutic relationship to address broader maternal and child health issues’ (p.115) Source of funding Not stated

PUIC Home: Review of effectiveness and
cost-effectiveness
Appendices
– 195 –
Study details Population and setting Method of allocation to
intervention/control Outcomes, subgroups and methods of
analysis Notes First baby: Kit+home visit – 49.7% Kit only – 51.0% Control – 47.8% (p=0.82) <High school education: Kit+home visit – 36.4% Kit only – 41.4% Control – 33.0% (p=0.255) Rent home: Kit+home visit – 37.2% Kit only – 38.0% Control – 43.1% (p=0.45) Household income <$20000 Kit+home visit – 14.3% Kit only – 21.7% Control – 14.5% (p=0.36) Study year 2001-2003 Eligible population: Parents of a new infant born at Chilliwack General Hospital and resided in the district of Chilliwack in the period April 2001 to August 2003.
remove or modify these hazards. Nine-item home safety kit contained: smoke alarm, 50% discount safety gate coupon, corner cushions, cupboard locks, blind cord windups, water temperature card, doorstoppers, electrical outlet covers, and poison control sticker. Control/comparison/s description Standard community health unit services for families with newborns (including growth assessment, advice and information on feeding, child development and immunisation) Sample sizes Total n= 600 Intervention (Kit + HV) n= 202 Intervention (Kit only) n= 206 Control n= 192 Baseline comparisons No statistically significant differences between trial
Were the subgroup analyses prespecified? Not applicable
Did the study collect data on and report information about barriers and facilitators to/of effectiveness? No Observations from the Discussion section regarding barriers & facilitators None

PUIC Home: Review of effectiveness and
cost-effectiveness
Appendices
– 196 –
Study details Population and setting Method of allocation to
intervention/control Outcomes, subgroups and methods of
analysis Notes Selected population: Attempts were made to recruit all eligible parents within the study period (26% declined to participate) Excluded population/s: Non-English speakers Residents of a First Nations reserve Parents of infants who were transferred to a tertiary facility in the neonatal period.
arms on a range of socio-economic indicators. Study sufficiently powered? Yes. Sample size of 200 per trial arm achieved so as to allow 80% power and type I error of p=0.05 in detecting an absolute increase of 15% from a baseline of 30%.
Outcomes Question numbers in tables below refer to the following questions (obtained from study lead author, as these details not provided in the published paper): 1. Are halls and stairway lighting adequate (to prevent falls)? 2. Are hall and stairways cluttered? 3. Many injuries to babies have resulted from falls from high surfaces (i.e. change tables). Despite your best efforts, have you ever left your baby unattended for a split second? 4. How often, if ever, does your baby use a babywalker? 5. Does your toy chest have a lightweight lid, no lid or a safe closing mechanism? 6. Do you always keep small items and food that can choke your child out of his or her reach? 7. Do your blinds have long blind-cords that are accessible to your child? 8. Are coffee, hot liquids and hot foods placed out of your childs reach? 9. Do you have a working fire extinguisher? 10. Is your home hot water adjusted to a safe temperature? 11. Are medicine and vitamins stored beyond your childs reach? 12. Are plants placed out of your childs reach? 13. Is your child always watched by an adult while in the tub? 14. Are pools on your property or neighbourhood fully protected (i.e. fenced) from use by unsupervised children? Parental self-reported safety behaviours and removal of hazards at 12 months (adjusted for income and baseline measure of dependent variable) - Kit only vs. control:
Question no. Intervention (Kit only) n (%) Control n (%) Odds ratio (95% CI) 1 161 (91%) 144 (98.6%) 2.90 (0.25, 34.10) 2 152 (93.8%) 135 (93.8%) 0.91 (0.34, 2.42)
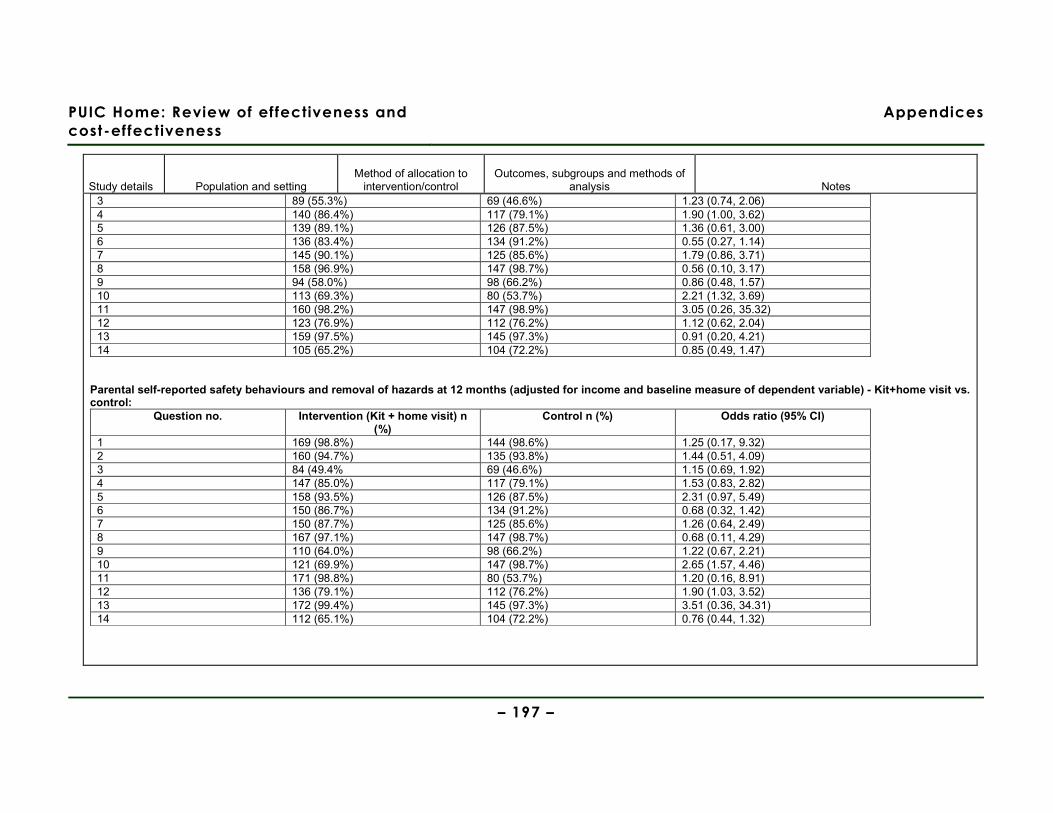
PUIC Home: Review of effectiveness and
cost-effectiveness
Appendices
– 197 –
Study details Population and setting Method of allocation to
intervention/control Outcomes, subgroups and methods of
analysis Notes 3 89 (55.3%) 69 (46.6%) 1.23 (0.74, 2.06) 4 140 (86.4%) 117 (79.1%) 1.90 (1.00, 3.62) 5 139 (89.1%) 126 (87.5%) 1.36 (0.61, 3.00) 6 136 (83.4%) 134 (91.2%) 0.55 (0.27, 1.14) 7 145 (90.1%) 125 (85.6%) 1.79 (0.86, 3.71) 8 158 (96.9%) 147 (98.7%) 0.56 (0.10, 3.17) 9 94 (58.0%) 98 (66.2%) 0.86 (0.48, 1.57) 10 113 (69.3%) 80 (53.7%) 2.21 (1.32, 3.69) 11 160 (98.2%) 147 (98.9%) 3.05 (0.26, 35.32) 12 123 (76.9%) 112 (76.2%) 1.12 (0.62, 2.04) 13 159 (97.5%) 145 (97.3%) 0.91 (0.20, 4.21) 14 105 (65.2%) 104 (72.2%) 0.85 (0.49, 1.47)
Parental self-reported safety behaviours and removal of hazards at 12 months (adjusted for income and baseline measure of dependent variable) - Kit+home visit vs. control:
Question no. Intervention (Kit + home visit) n (%)
Control n (%) Odds ratio (95% CI)
1 169 (98.8%) 144 (98.6%) 1.25 (0.17, 9.32) 2 160 (94.7%) 135 (93.8%) 1.44 (0.51, 4.09) 3 84 (49.4% 69 (46.6%) 1.15 (0.69, 1.92) 4 147 (85.0%) 117 (79.1%) 1.53 (0.83, 2.82) 5 158 (93.5%) 126 (87.5%) 2.31 (0.97, 5.49) 6 150 (86.7%) 134 (91.2%) 0.68 (0.32, 1.42) 7 150 (87.7%) 125 (85.6%) 1.26 (0.64, 2.49) 8 167 (97.1%) 147 (98.7%) 0.68 (0.11, 4.29) 9 110 (64.0%) 98 (66.2%) 1.22 (0.67, 2.21) 10 121 (69.9%) 147 (98.7%) 2.65 (1.57, 4.46) 11 171 (98.8%) 80 (53.7%) 1.20 (0.16, 8.91) 12 136 (79.1%) 112 (76.2%) 1.90 (1.03, 3.52) 13 172 (99.4%) 145 (97.3%) 3.51 (0.36, 34.31) 14 112 (65.1%) 104 (72.2%) 0.76 (0.44, 1.32)
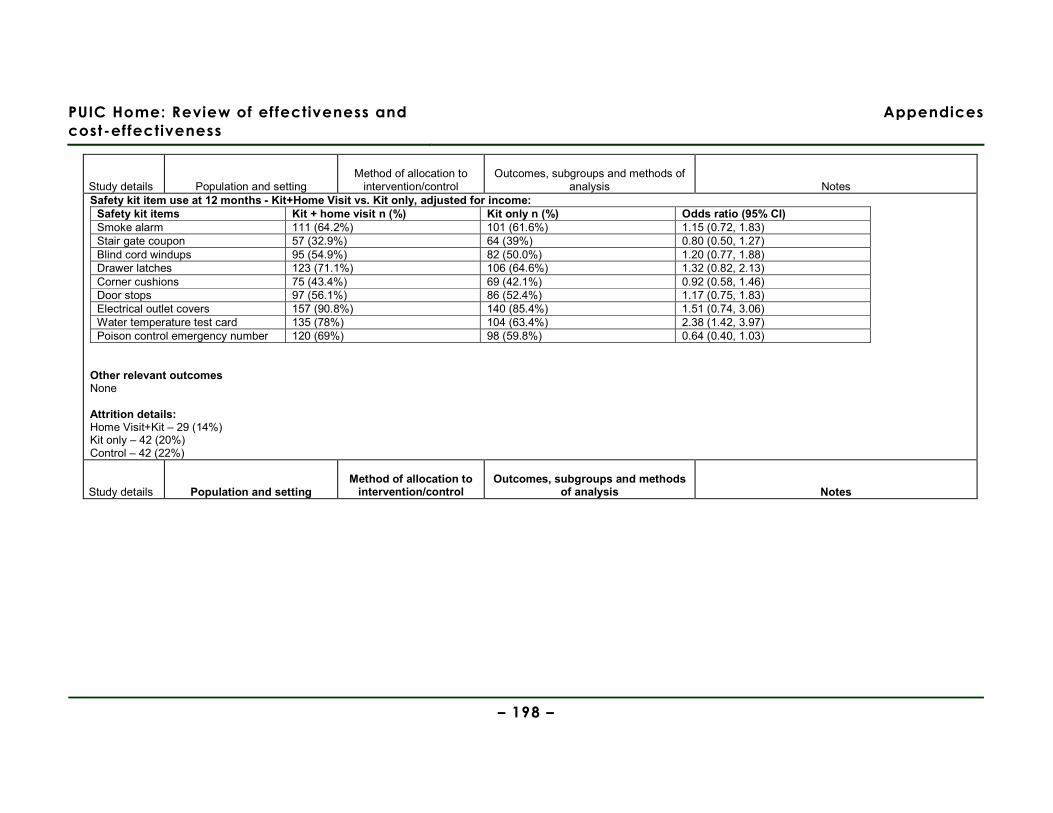
PUIC Home: Review of effectiveness and
cost-effectiveness
Appendices
– 198 –
Study details Population and setting Method of allocation to
intervention/control Outcomes, subgroups and methods of
analysis Notes Safety kit item use at 12 months - Kit+Home Visit vs. Kit only, adjusted for income:
Safety kit items Kit + home visit n (%) Kit only n (%) Odds ratio (95% CI) Smoke alarm 111 (64.2%) 101 (61.6%) 1.15 (0.72, 1.83) Stair gate coupon 57 (32.9%) 64 (39%) 0.80 (0.50, 1.27) Blind cord windups 95 (54.9%) 82 (50.0%) 1.20 (0.77, 1.88) Drawer latches 123 (71.1%) 106 (64.6%) 1.32 (0.82, 2.13) Corner cushions 75 (43.4%) 69 (42.1%) 0.92 (0.58, 1.46) Door stops 97 (56.1%) 86 (52.4%) 1.17 (0.75, 1.83) Electrical outlet covers 157 (90.8%) 140 (85.4%) 1.51 (0.74, 3.06) Water temperature test card 135 (78%) 104 (63.4%) 2.38 (1.42, 3.97) Poison control emergency number 120 (69%) 98 (59.8%) 0.64 (0.40, 1.03)
Other relevant outcomes None Attrition details: Home Visit+Kit – 29 (14%) Kit only – 42 (20%) Control – 42 (22%)
Study details Population and setting Method of allocation to
intervention/control Outcomes, subgroups and methods
of analysis Notes
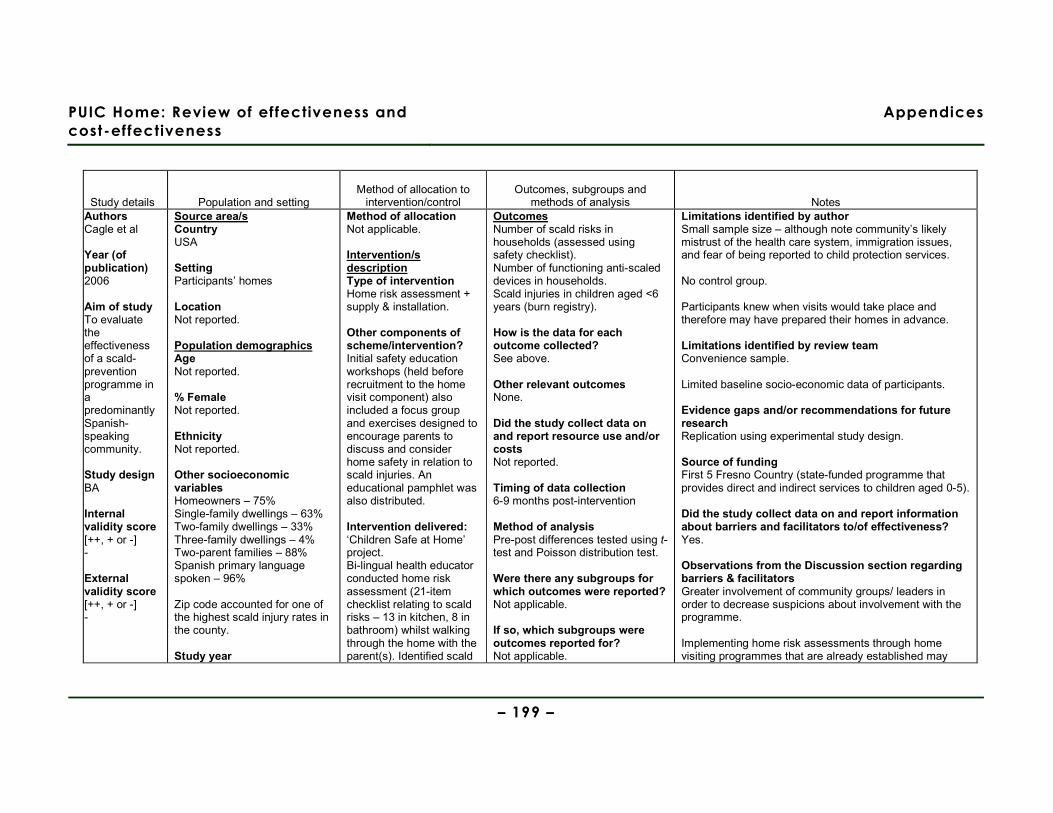
PUIC Home: Review of effectiveness and
cost-effectiveness
Appendices
– 199 –
Study details Population and setting Method of allocation to
intervention/control Outcomes, subgroups and
methods of analysis Notes Authors Cagle et al Year (of publication) 2006
Aim of study To evaluate the effectiveness of a scald-prevention programme in a predominantly Spanish-speaking community. Study design BA Internal validity score [++, + or -] - External validity score [++, + or -] -
Source area/s Country USA Setting Participants’ homes Location Not reported. Population demographics Age Not reported. % Female Not reported. Ethnicity Not reported. Other socioeconomic variables Homeowners – 75% Single-family dwellings – 63% Two-family dwellings – 33% Three-family dwellings – 4% Two-parent families – 88% Spanish primary language spoken – 96% Zip code accounted for one of the highest scald injury rates in the county. Study year
Method of allocation Not applicable. Intervention/s description Type of intervention Home risk assessment + supply & installation. Other components of scheme/intervention? Initial safety education workshops (held before recruitment to the home visit component) also included a focus group and exercises designed to encourage parents to discuss and consider home safety in relation to scald injuries. An educational pamphlet was also distributed. Intervention delivered: ‘Children Safe at Home’ project. Bi-lingual health educator conducted home risk assessment (21-item checklist relating to scald risks – 13 in kitchen, 8 in bathroom) whilst walking through the home with the parent(s). Identified scald
Outcomes Number of scald risks in households (assessed using safety checklist). Number of functioning anti-scaled devices in households. Scald injuries in children aged <6 years (burn registry). How is the data for each outcome collected? See above. Other relevant outcomes None. Did the study collect data on and report resource use and/or costs Not reported. Timing of data collection 6-9 months post-intervention Method of analysis Pre-post differences tested using t-test and Poisson distribution test. Were there any subgroups for which outcomes were reported? Not applicable. If so, which subgroups were outcomes reported for? Not applicable.
Limitations identified by author Small sample size – although note community’s likely mistrust of the health care system, immigration issues, and fear of being reported to child protection services. No control group. Participants knew when visits would take place and therefore may have prepared their homes in advance. Limitations identified by review team Convenience sample. Limited baseline socio-economic data of participants. Evidence gaps and/or recommendations for future research Replication using experimental study design. Source of funding First 5 Fresno Country (state-funded programme that provides direct and indirect services to children aged 0-5). Did the study collect data on and report information about barriers and facilitators to/of effectiveness? Yes. Observations from the Discussion section regarding barriers & facilitators Greater involvement of community groups/ leaders in order to decrease suspicions about involvement with the programme. Implementing home risk assessments through home visiting programmes that are already established may
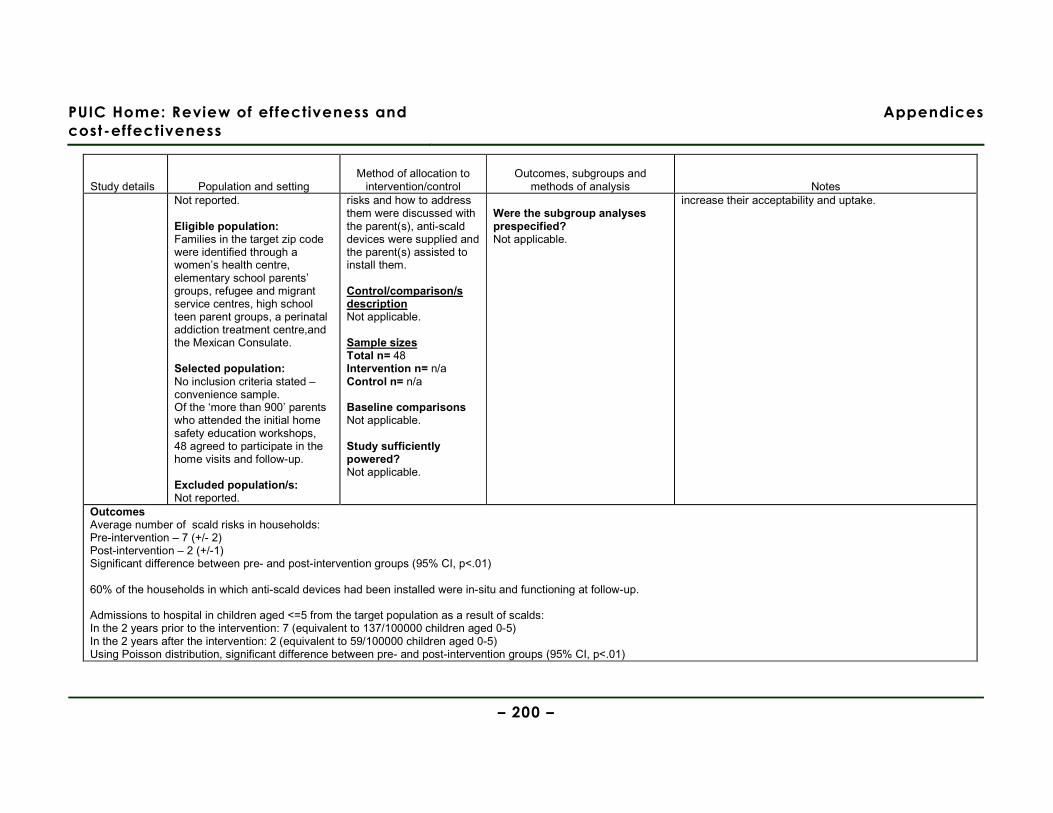
PUIC Home: Review of effectiveness and
cost-effectiveness
Appendices
– 200 –
Study details Population and setting Method of allocation to
intervention/control Outcomes, subgroups and
methods of analysis Notes Not reported. Eligible population: Families in the target zip code were identified through a women’s health centre, elementary school parents’ groups, refugee and migrant service centres, high school teen parent groups, a perinatal addiction treatment centre,and the Mexican Consulate. Selected population: No inclusion criteria stated – convenience sample. Of the ‘more than 900’ parents who attended the initial home safety education workshops, 48 agreed to participate in the home visits and follow-up. Excluded population/s: Not reported.
risks and how to address them were discussed with the parent(s), anti-scald devices were supplied and the parent(s) assisted to install them. Control/comparison/s description Not applicable. Sample sizes Total n= 48 Intervention n= n/a Control n= n/a Baseline comparisons Not applicable. Study sufficiently powered? Not applicable.
Were the subgroup analyses prespecified? Not applicable.
increase their acceptability and uptake.
Outcomes Average number of scald risks in households: Pre-intervention – 7 (+/- 2) Post-intervention – 2 (+/-1) Significant difference between pre- and post-intervention groups (95% CI, p<.01) 60% of the households in which anti-scald devices had been installed were in-situ and functioning at follow-up. Admissions to hospital in children aged <=5 from the target population as a result of scalds: In the 2 years prior to the intervention: 7 (equivalent to 137/100000 children aged 0-5) In the 2 years after the intervention: 2 (equivalent to 59/100000 children aged 0-5) Using Poisson distribution, significant difference between pre- and post-intervention groups (95% CI, p<.01)

PUIC Home: Review of effectiveness and
cost-effectiveness
Appendices
– 201 –
Study details Population and setting Method of allocation to
intervention/control Outcomes, subgroups and
methods of analysis Notes Other relevant outcomes None. Attrition details: Not applicable.

PUIC Home: Review of effectiveness and
cost-effectiveness
Appendices
– 202 –
Authors Carman et al Year (of publication) 2006
Aim of study To evaluate the effectiveness of a home safety consultation and provision of low-cost safety equipment in deprived localities. Study design BA Internal validity score [++, + or -] - External validity score [++, + or -] -
Source area/s Country England. Setting Parents’ homes. Location (urban, rural) Not reported. Population demographics Age Not reported. % Female Not reported. Ethnicity Not reported. Other socioeconomic variables (where available) No data reported, but intervention area wards were more socio-economically disadvantaged than the control wards as it was only the socio-economically deprived wards that were eligible to receive the safety scheme through the Sure Start programme. (As a whole, the areas served by the Primary Care Trust in which the intervention was delivered are ranked 37th, 71st,
Method of allocation All parents with children aged under 5 who were registered with Sure Start in the eligible wards were allocated to the intervention group. No measures taken to address confounding. Intervention/s description Type of intervention Home safety assessment, supply & installation of safety equipment. Equipment supplied (not installed) by project workers: Bath mat, harness & reins, cupboard locks, corner cushions, adhesive multi-purpose lock, and electrical socket outlet covers. Equipment fitted by home care and repair technicians (as indicated by project worker’s home risk assessment): Safety gates, fireguards, smoke alarms, kitchen cupboard locks, and
Outcomes How is the data for each outcome collected? A&E attendance data (excluding minor ailments) to the General Hospital within the study area. Other relevant outcomes None. Did the study collect data on and report resource use and/or costs (of compared interventions)? Yes. Timing of data collection Varied (between 1 and 3 years), as the intervention was implemented in different wards over a period of 3 years. Method of analysis ITT not conducted. No adjustments made for potential confounding variables. Were there any subgroups for which outcomes were reported? No. If so, which subgroups were outcomes reported for? Not applicable. Were the subgroup analyses
Limitations identified by author Families in both the intervention and control groups may have received home safety advice and education via national and local media, word of mouth and local safety events, thereby contaminating the groups’ exposure. Limitations identified by review team Significant doubts over the methods used to evaluate outcomes: Unclear whether outcome data (A&E attendance, excluding ‘minor ailments’) is specifically for injuries resulting from unintentional injuries in the home or for all child attendances at A&E (whatever the aetiology). Attempting to link A&E attendances to the postcodes of the wards in which the intervention was delivered is a method with a high risk of inaccuracy. A&E attendance data for the under-5s is calculated from data pertaining to children (possibly aged up to 16, although this is not stated), i.e. the percentage of under-5s within each ward is used to calculate the percentage of A&E attendances from the raw data (by postcode) that would have been accounted for by under-5s – this assumes that A&E attendances are equally distributed throughout the childhood age range. Using only A&E attendance data alone is likely to miss out on less serious, but nevertheless important, childhood injuries incurred in the home. Evidence gaps and/or recommendations for future research None.
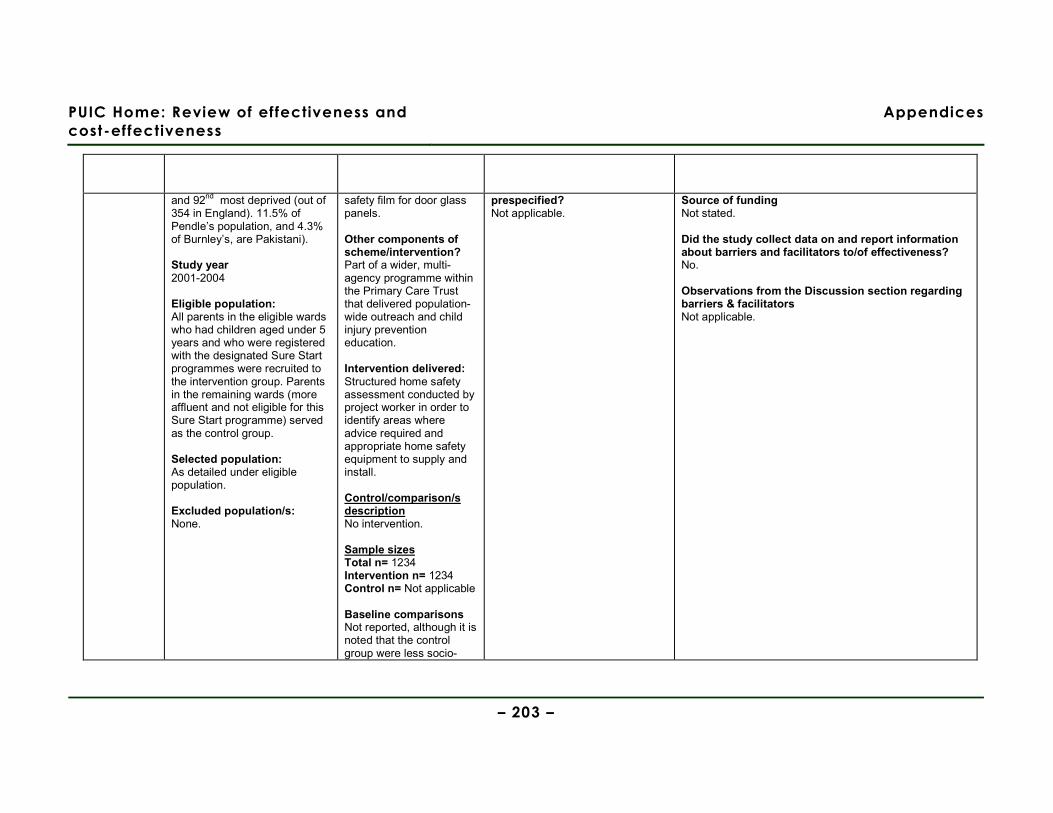
PUIC Home: Review of effectiveness and
cost-effectiveness
Appendices
– 203 –
and 92nd most deprived (out of 354 in England). 11.5% of Pendle’s population, and 4.3% of Burnley’s, are Pakistani). Study year 2001-2004 Eligible population: All parents in the eligible wards who had children aged under 5 years and who were registered with the designated Sure Start programmes were recruited to the intervention group. Parents in the remaining wards (more affluent and not eligible for this Sure Start programme) served as the control group. Selected population: As detailed under eligible population. Excluded population/s: None.
safety film for door glass panels. Other components of scheme/intervention? Part of a wider, multi-agency programme within the Primary Care Trust that delivered population-wide outreach and child injury prevention education. Intervention delivered: Structured home safety assessment conducted by project worker in order to identify areas where advice required and appropriate home safety equipment to supply and install. Control/comparison/s description No intervention. Sample sizes Total n= 1234 Intervention n= 1234 Control n= Not applicable Baseline comparisons Not reported, although it is noted that the control group were less socio-
prespecified? Not applicable.
Source of funding Not stated. Did the study collect data on and report information about barriers and facilitators to/of effectiveness? No. Observations from the Discussion section regarding barriers & facilitators Not applicable.
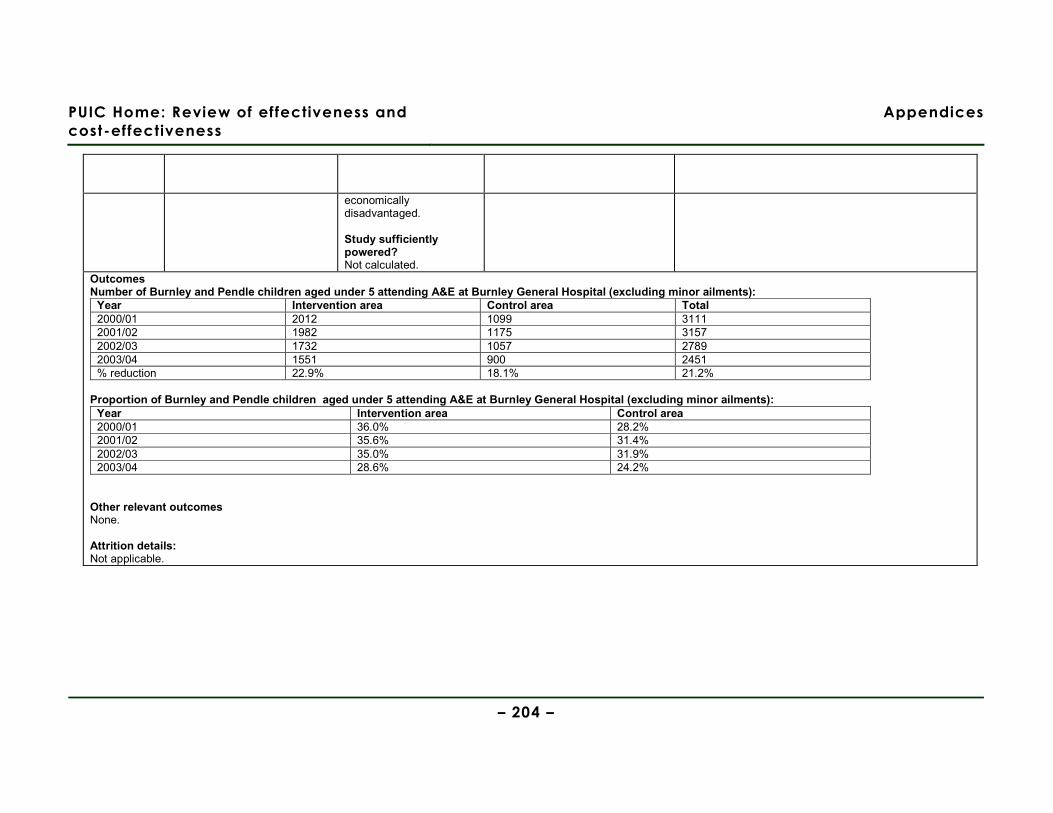
PUIC Home: Review of effectiveness and
cost-effectiveness
Appendices
– 204 –
economically disadvantaged. Study sufficiently powered? Not calculated.
Outcomes Number of Burnley and Pendle children aged under 5 attending A&E at Burnley General Hospital (excluding minor ailments):
Year Intervention area Control area Total 2000/01 2012 1099 3111 2001/02 1982 1175 3157 2002/03 1732 1057 2789 2003/04 1551 900 2451 % reduction 22.9% 18.1% 21.2%
Proportion of Burnley and Pendle children aged under 5 attending A&E at Burnley General Hospital (excluding minor ailments):
Year Intervention area Control area 2000/01 36.0% 28.2% 2001/02 35.6% 31.4% 2002/03 35.0% 31.9% 2003/04 28.6% 24.2%
Other relevant outcomes None. Attrition details: Not applicable.
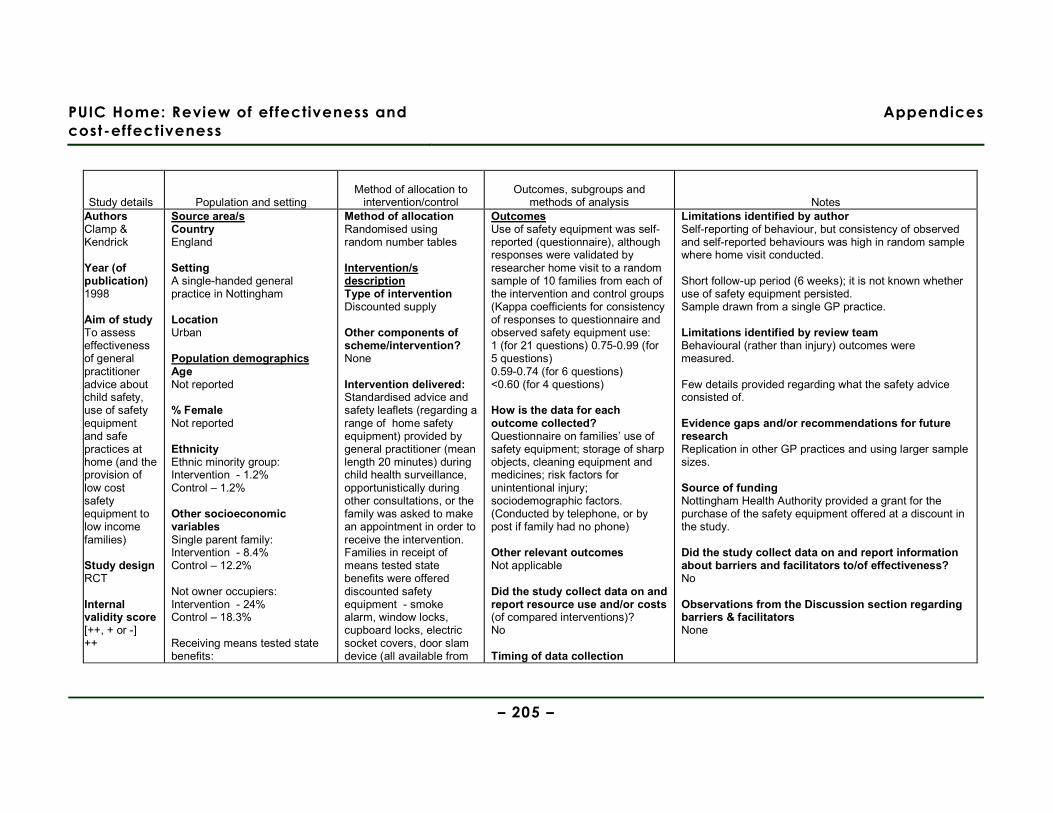
PUIC Home: Review of effectiveness and
cost-effectiveness
Appendices
– 205 –
Study details Population and setting Method of allocation to
intervention/control Outcomes, subgroups and
methods of analysis Notes Authors Clamp & Kendrick Year (of publication) 1998 Aim of study To assess effectiveness of general practitioner advice about child safety, use of safety equipment and safe practices at home (and the provision of low cost safety equipment to low income families) Study design RCT Internal validity score [++, + or -] ++
Source area/s Country England Setting A single-handed general practice in Nottingham Location Urban Population demographics Age Not reported % Female Not reported Ethnicity Ethnic minority group: Intervention - 1.2% Control – 1.2% Other socioeconomic variables Single parent family: Intervention - 8.4% Control – 12.2% Not owner occupiers: Intervention - 24% Control – 18.3% Receiving means tested state benefits:
Method of allocation Randomised using random number tables Intervention/s description Type of intervention Discounted supply
Other components of scheme/intervention? None Intervention delivered: Standardised advice and safety leaflets (regarding a range of home safety equipment) provided by general practitioner (mean length 20 minutes) during child health surveillance, opportunistically during other consultations, or the family was asked to make an appointment in order to receive the intervention. Families in receipt of means tested state benefits were offered discounted safety equipment - smoke alarm, window locks, cupboard locks, electric socket covers, door slam device (all available from
Outcomes Use of safety equipment was self-reported (questionnaire), although responses were validated by researcher home visit to a random sample of 10 families from each of the intervention and control groups (Kappa coefficients for consistency of responses to questionnaire and observed safety equipment use: 1 (for 21 questions) 0.75-0.99 (for 5 questions) 0.59-0.74 (for 6 questions) <0.60 (for 4 questions) How is the data for each outcome collected? Questionnaire on families’ use of safety equipment; storage of sharp objects, cleaning equipment and medicines; risk factors for unintentional injury; sociodemographic factors. (Conducted by telephone, or by post if family had no phone) Other relevant outcomes Not applicable Did the study collect data on and report resource use and/or costs (of compared interventions)? No Timing of data collection
Limitations identified by author Self-reporting of behaviour, but consistency of observed and self-reported behaviours was high in random sample where home visit conducted. Short follow-up period (6 weeks); it is not known whether use of safety equipment persisted. Sample drawn from a single GP practice. Limitations identified by review team Behavioural (rather than injury) outcomes were measured. Few details provided regarding what the safety advice consisted of. Evidence gaps and/or recommendations for future research Replication in other GP practices and using larger sample sizes. Source of funding Nottingham Health Authority provided a grant for the purchase of the safety equipment offered at a discount in the study. Did the study collect data on and report information about barriers and facilitators to/of effectiveness? No Observations from the Discussion section regarding barriers & facilitators None
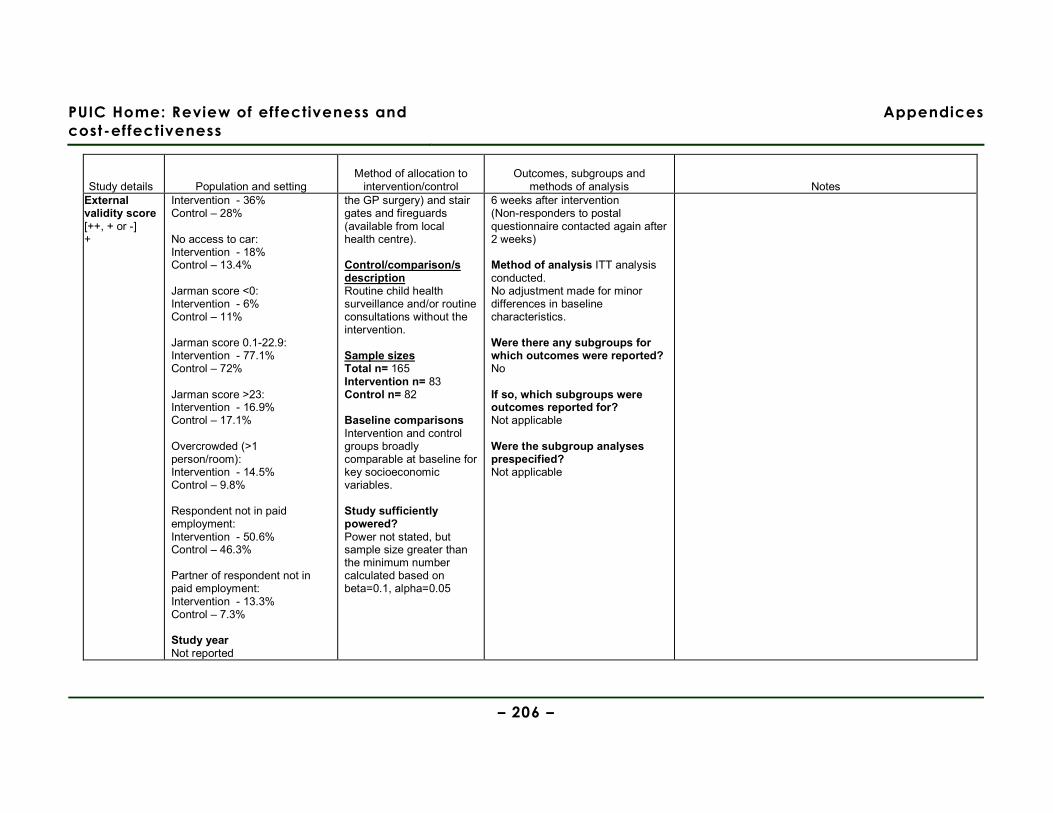
PUIC Home: Review of effectiveness and
cost-effectiveness
Appendices
– 206 –
Study details Population and setting Method of allocation to
intervention/control Outcomes, subgroups and
methods of analysis Notes External validity score [++, + or -] +
Intervention - 36% Control – 28% No access to car: Intervention - 18% Control – 13.4% Jarman score <0: Intervention - 6% Control – 11% Jarman score 0.1-22.9: Intervention - 77.1% Control – 72% Jarman score >23: Intervention - 16.9% Control – 17.1% Overcrowded (>1 person/room): Intervention - 14.5% Control – 9.8% Respondent not in paid employment: Intervention - 50.6% Control – 46.3% Partner of respondent not in paid employment: Intervention - 13.3% Control – 7.3% Study year Not reported
the GP surgery) and stair gates and fireguards (available from local health centre). Control/comparison/s description Routine child health surveillance and/or routine consultations without the intervention. Sample sizes Total n= 165 Intervention n= 83 Control n= 82 Baseline comparisons Intervention and control groups broadly comparable at baseline for key socioeconomic variables. Study sufficiently powered? Power not stated, but sample size greater than the minimum number calculated based on beta=0.1, alpha=0.05
6 weeks after intervention (Non-responders to postal questionnaire contacted again after 2 weeks) Method of analysis ITT analysis conducted. No adjustment made for minor differences in baseline characteristics. Were there any subgroups for which outcomes were reported? No If so, which subgroups were outcomes reported for? Not applicable Were the subgroup analyses prespecified? Not applicable
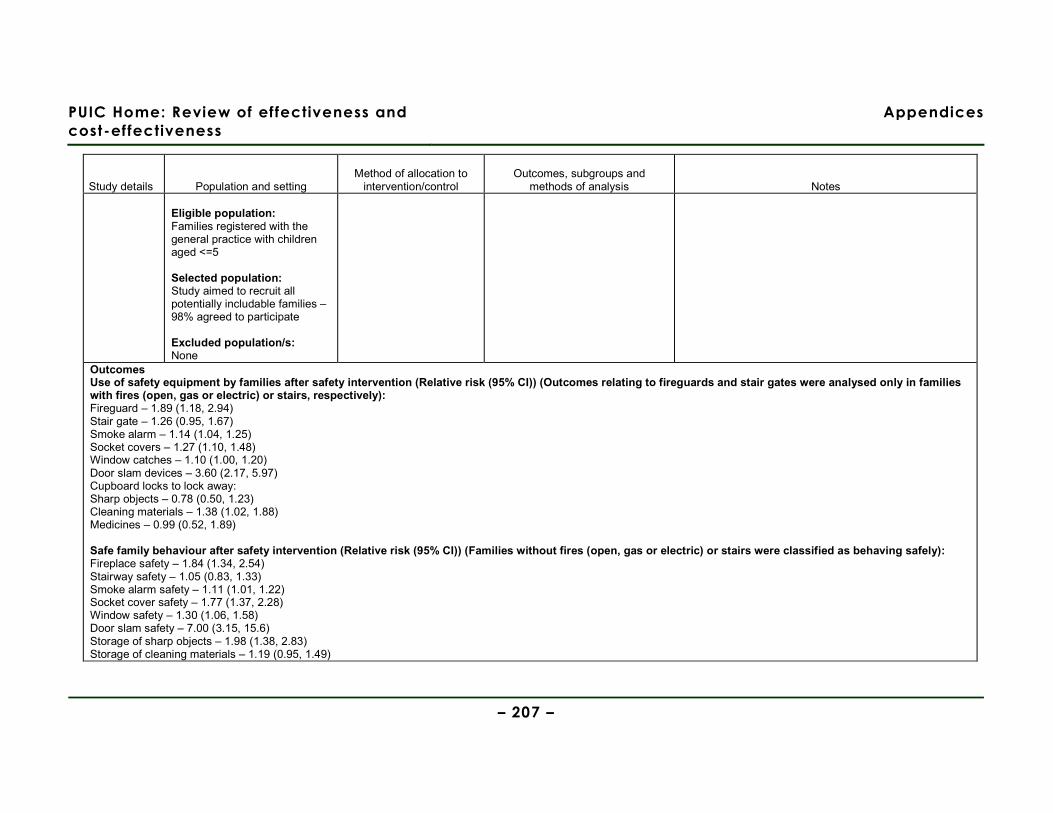
PUIC Home: Review of effectiveness and
cost-effectiveness
Appendices
– 207 –
Study details Population and setting Method of allocation to
intervention/control Outcomes, subgroups and
methods of analysis Notes Eligible population: Families registered with the general practice with children aged <=5 Selected population: Study aimed to recruit all potentially includable families – 98% agreed to participate Excluded population/s: None
Outcomes Use of safety equipment by families after safety intervention (Relative risk (95% CI)) (Outcomes relating to fireguards and stair gates were analysed only in families with fires (open, gas or electric) or stairs, respectively): Fireguard – 1.89 (1.18, 2.94) Stair gate – 1.26 (0.95, 1.67) Smoke alarm – 1.14 (1.04, 1.25) Socket covers – 1.27 (1.10, 1.48) Window catches – 1.10 (1.00, 1.20) Door slam devices – 3.60 (2.17, 5.97) Cupboard locks to lock away: Sharp objects – 0.78 (0.50, 1.23) Cleaning materials – 1.38 (1.02, 1.88) Medicines – 0.99 (0.52, 1.89) Safe family behaviour after safety intervention (Relative risk (95% CI)) (Families without fires (open, gas or electric) or stairs were classified as behaving safely): Fireplace safety – 1.84 (1.34, 2.54) Stairway safety – 1.05 (0.83, 1.33) Smoke alarm safety – 1.11 (1.01, 1.22) Socket cover safety – 1.77 (1.37, 2.28) Window safety – 1.30 (1.06, 1.58) Door slam safety – 7.00 (3.15, 15.6) Storage of sharp objects – 1.98 (1.38, 2.83) Storage of cleaning materials – 1.19 (0.95, 1.49)
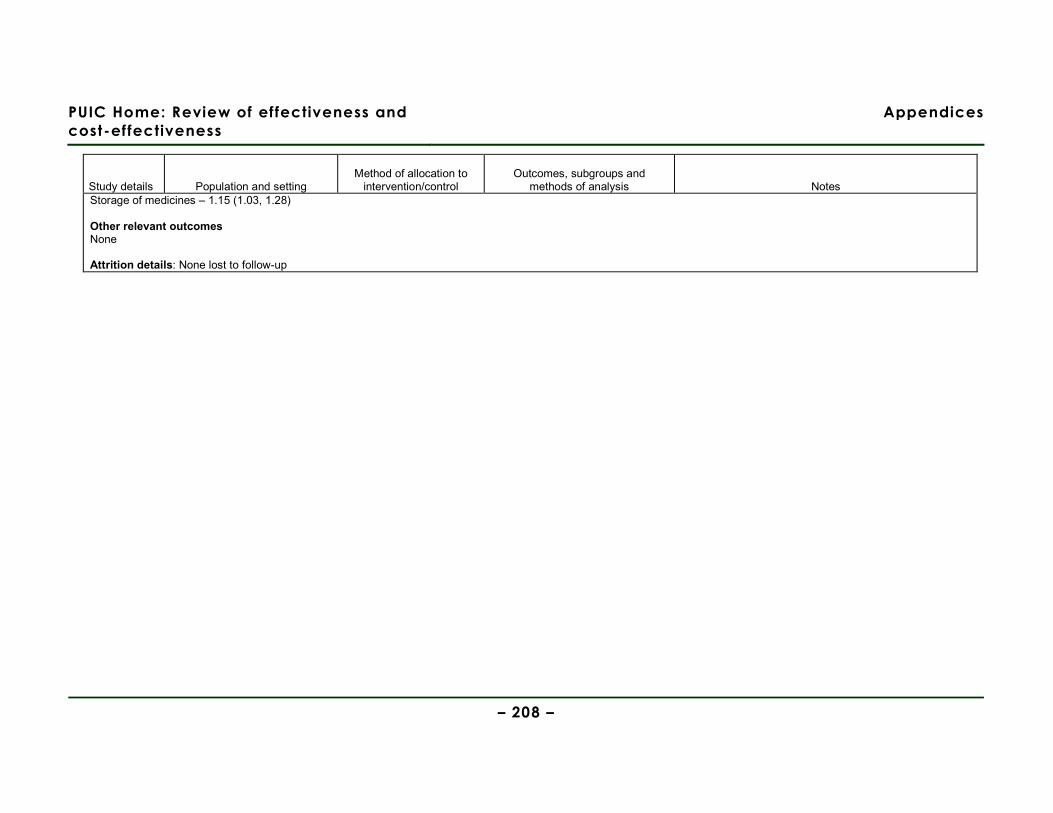
PUIC Home: Review of effectiveness and
cost-effectiveness
Appendices
– 208 –
Study details Population and setting Method of allocation to
intervention/control Outcomes, subgroups and
methods of analysis Notes Storage of medicines – 1.15 (1.03, 1.28) Other relevant outcomes None Attrition details: None lost to follow-up
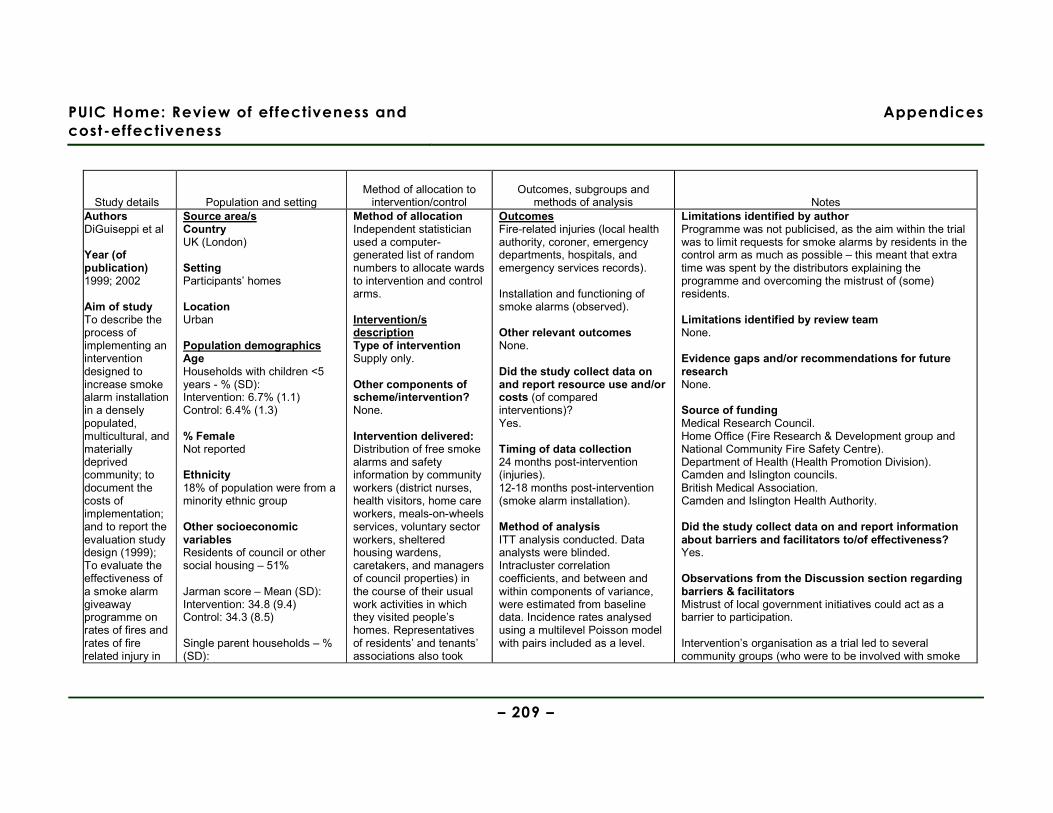
PUIC Home: Review of effectiveness and
cost-effectiveness
Appendices
– 209 –
Study details Population and setting Method of allocation to
intervention/control Outcomes, subgroups and
methods of analysis Notes Authors DiGuiseppi et al Year (of publication) 1999; 2002
Aim of study To describe the process of implementing an intervention designed to increase smoke alarm installation in a densely populated, multicultural, and materially deprived community; to document the costs of implementation; and to report the evaluation study design (1999); To evaluate the effectiveness of a smoke alarm giveaway programme on rates of fires and rates of fire related injury in
Source area/s Country UK (London) Setting Participants’ homes Location Urban Population demographics Age Households with children <5 years - % (SD): Intervention: 6.7% (1.1) Control: 6.4% (1.3) % Female Not reported Ethnicity 18% of population were from a minority ethnic group Other socioeconomic variables Residents of council or other social housing – 51% Jarman score – Mean (SD): Intervention: 34.8 (9.4) Control: 34.3 (8.5) Single parent households – % (SD):
Method of allocation Independent statistician used a computer-generated list of random numbers to allocate wards to intervention and control arms. Intervention/s description Type of intervention Supply only.
Other components of scheme/intervention? None. Intervention delivered: Distribution of free smoke alarms and safety information by community workers (district nurses, health visitors, home care workers, meals-on-wheels services, voluntary sector workers, sheltered housing wardens, caretakers, and managers of council properties) in the course of their usual work activities in which they visited people’s homes. Representatives of residents’ and tenants’ associations also took
Outcomes Fire-related injuries (local health authority, coroner, emergency departments, hospitals, and emergency services records). Installation and functioning of smoke alarms (observed). Other relevant outcomes None. Did the study collect data on and report resource use and/or costs (of compared interventions)? Yes. Timing of data collection 24 months post-intervention (injuries). 12-18 months post-intervention (smoke alarm installation). Method of analysis ITT analysis conducted. Data analysts were blinded. Intracluster correlation coefficients, and between and within components of variance, were estimated from baseline data. Incidence rates analysed using a multilevel Poisson model with pairs included as a level.
Limitations identified by author Programme was not publicised, as the aim within the trial was to limit requests for smoke alarms by residents in the control arm as much as possible – this meant that extra time was spent by the distributors explaining the programme and overcoming the mistrust of (some) residents. Limitations identified by review team None. Evidence gaps and/or recommendations for future research None. Source of funding Medical Research Council. Home Office (Fire Research & Development group and National Community Fire Safety Centre). Department of Health (Health Promotion Division). Camden and Islington councils. British Medical Association. Camden and Islington Health Authority. Did the study collect data on and report information about barriers and facilitators to/of effectiveness? Yes. Observations from the Discussion section regarding barriers & facilitators Mistrust of local government initiatives could act as a barrier to participation. Intervention’s organisation as a trial led to several community groups (who were to be involved with smoke
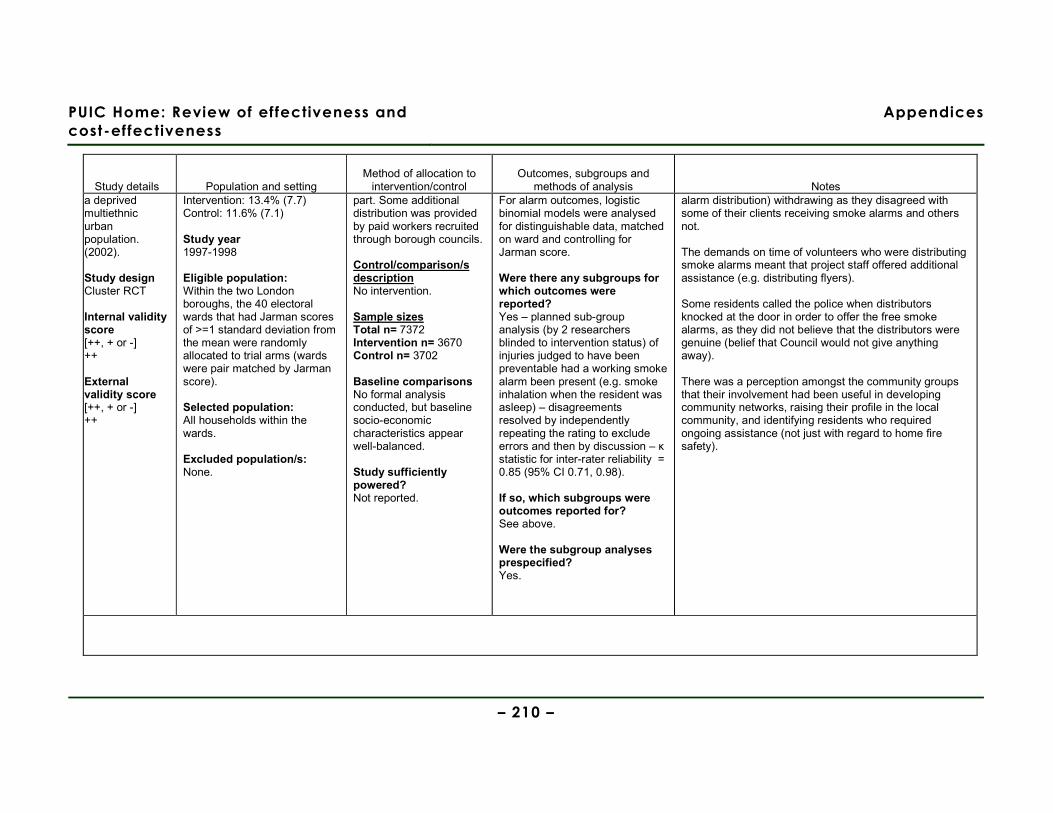
PUIC Home: Review of effectiveness and
cost-effectiveness
Appendices
– 210 –
Study details Population and setting Method of allocation to
intervention/control Outcomes, subgroups and
methods of analysis Notes a deprived multiethnic urban population. (2002).
Study design Cluster RCT Internal validity score [++, + or -] ++ External validity score [++, + or -] ++
Intervention: 13.4% (7.7) Control: 11.6% (7.1) Study year 1997-1998 Eligible population: Within the two London boroughs, the 40 electoral wards that had Jarman scores of >=1 standard deviation from the mean were randomly allocated to trial arms (wards were pair matched by Jarman score). Selected population: All households within the wards. Excluded population/s: None.
part. Some additional distribution was provided by paid workers recruited through borough councils. Control/comparison/s description No intervention. Sample sizes Total n= 7372 Intervention n= 3670 Control n= 3702 Baseline comparisons No formal analysis conducted, but baseline socio-economic characteristics appear well-balanced. Study sufficiently powered? Not reported.
For alarm outcomes, logistic binomial models were analysed for distinguishable data, matched on ward and controlling for Jarman score. Were there any subgroups for which outcomes were reported? Yes – planned sub-group analysis (by 2 researchers blinded to intervention status) of injuries judged to have been preventable had a working smoke alarm been present (e.g. smoke inhalation when the resident was asleep) – disagreements resolved by independently repeating the rating to exclude errors and then by discussion – κ statistic for inter-rater reliability = 0.85 (95% CI 0.71, 0.98). If so, which subgroups were outcomes reported for? See above. Were the subgroup analyses prespecified? Yes.
alarm distribution) withdrawing as they disagreed with some of their clients receiving smoke alarms and others not. The demands on time of volunteers who were distributing smoke alarms meant that project staff offered additional assistance (e.g. distributing flyers). Some residents called the police when distributors knocked at the door in order to offer the free smoke alarms, as they did not believe that the distributors were genuine (belief that Council would not give anything away). There was a perception amongst the community groups that their involvement had been useful in developing community networks, raising their profile in the local community, and identifying residents who required ongoing assistance (not just with regard to home fire safety).
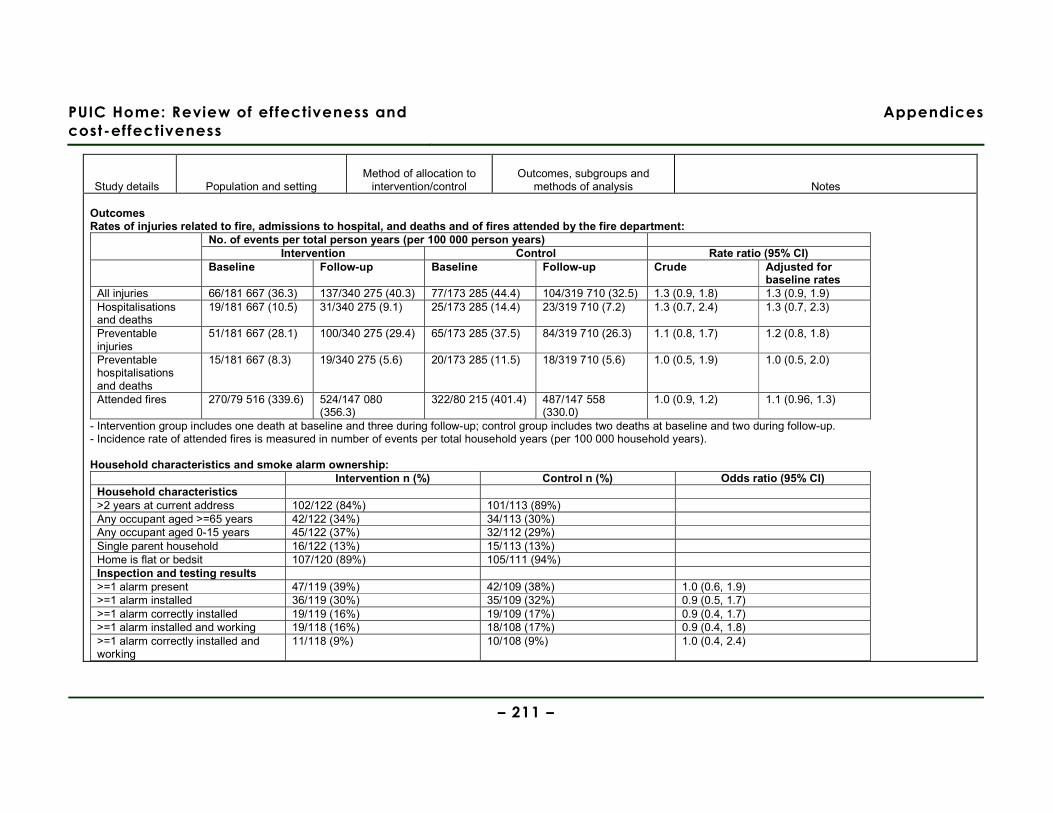
PUIC Home: Review of effectiveness and
cost-effectiveness
Appendices
– 211 –
Study details Population and setting Method of allocation to
intervention/control Outcomes, subgroups and
methods of analysis Notes Outcomes Rates of injuries related to fire, admissions to hospital, and deaths and of fires attended by the fire department:
No. of events per total person years (per 100 000 person years) Intervention Control Rate ratio (95% CI)
Baseline Follow-up Baseline Follow-up Crude Adjusted for baseline rates
All injuries 66/181 667 (36.3) 137/340 275 (40.3) 77/173 285 (44.4) 104/319 710 (32.5) 1.3 (0.9, 1.8) 1.3 (0.9, 1.9) Hospitalisations and deaths
19/181 667 (10.5) 31/340 275 (9.1) 25/173 285 (14.4) 23/319 710 (7.2) 1.3 (0.7, 2.4) 1.3 (0.7, 2.3)
Preventable injuries
51/181 667 (28.1) 100/340 275 (29.4) 65/173 285 (37.5) 84/319 710 (26.3) 1.1 (0.8, 1.7) 1.2 (0.8, 1.8)
Preventable hospitalisations and deaths
15/181 667 (8.3) 19/340 275 (5.6) 20/173 285 (11.5) 18/319 710 (5.6) 1.0 (0.5, 1.9) 1.0 (0.5, 2.0)
Attended fires 270/79 516 (339.6) 524/147 080 (356.3)
322/80 215 (401.4) 487/147 558 (330.0)
1.0 (0.9, 1.2) 1.1 (0.96, 1.3)
- Intervention group includes one death at baseline and three during follow-up; control group includes two deaths at baseline and two during follow-up. - Incidence rate of attended fires is measured in number of events per total household years (per 100 000 household years). Household characteristics and smoke alarm ownership:
Intervention n (%) Control n (%) Odds ratio (95% CI) Household characteristics >2 years at current address 102/122 (84%) 101/113 (89%) Any occupant aged >=65 years 42/122 (34%) 34/113 (30%) Any occupant aged 0-15 years 45/122 (37%) 32/112 (29%) Single parent household 16/122 (13%) 15/113 (13%) Home is flat or bedsit 107/120 (89%) 105/111 (94%) Inspection and testing results >=1 alarm present 47/119 (39%) 42/109 (38%) 1.0 (0.6, 1.9) >=1 alarm installed 36/119 (30%) 35/109 (32%) 0.9 (0.5, 1.7) >=1 alarm correctly installed 19/119 (16%) 19/109 (17%) 0.9 (0.4, 1.7) >=1 alarm installed and working 19/118 (16%) 18/108 (17%) 0.9 (0.4, 1.8) >=1 alarm correctly installed and working
11/118 (9%) 10/108 (9%) 1.0 (0.4, 2.4)
PUIC Home: Review of effectiveness and
cost-effectiveness
Appendices
– 212 –
Study details Population and setting Method of allocation to
intervention/control Outcomes, subgroups and
methods of analysis Notes Other relevant outcomes None. Attrition details: Not reported.

PUIC Home: Review of effectiveness and
cost-effectiveness
Appendices
– 213 –
Study details Population and setting Method of allocation to
intervention/control Outcomes, subgroups and
methods of analysis Notes Authors Douglas et al Year (of publication) 1998
Aim of study To evaluate the effectiveness of different methods of distributing free smoke alarms in a high risk urban population.
Study design CBA Internal validity score [++, + or -] + External validity score [++, + or -] -
Source area/s Country USA (Oklahoma City) Setting Participants’ homes Location Urban Population demographics Age Not reported. % Female Not reported. Ethnicity Not reported. Other socioeconomic variables Source: Mallonee et al (1996) Intervention took place in an area of Oklahoma City described as having a fire-related injury rate over four times that of other areas in the city. This area had a distinctive pattern of fire causation compared with the rest of the city: % of fires by different causes in intervention area (% in remainder of Oklahoma City):
Method of allocation Not applicable. Intervention/s description Type of intervention Free supply of smoke alarms. Other components of scheme/intervention? No. Intervention delivered: Free smoke alarms - advertised through canvassing (including the use of a fire engine sounding its siren and announcing the giveaway over a loudspeaker), flyers in public places, mailed flyers, and hand- delivered flyers, but smoke alarms had to be collected from local fire stations (although a number were also distributed door-to-door and some (9%) were installed) Control/comparison/s description Not applicable.
Outcomes Installation and functioning of smoke alarms (telephone survey). How is the data for each outcome collected? Telephone survey. Other relevant outcomes None. Did the study collect data on and report resource use and/or costs (of compared interventions)? Only costs of pay per hour for personnel distributing the smoke alarms. Timing of data collection 1 month post-intervention. Method of analysis No statistical analysis conducted – descriptive data only reported. Were there any subgroups for which outcomes were reported? No. If so, which subgroups were outcomes reported for? Not applicable. Were the subgroup analyses prespecified? Not applicable.
Limitations identified by author Survey analysis did not adjust for those homes which did not have a telephone. Random sample drawn from a population for which 30% of the applications from a canvassing area did not report a home telephone number. Self-report of functioning of smoke alarms – participants did not test the alarms whilst the phone survey was taking place and therefore may have been under the impression that the alarms were correctly functioning when this was not in fact the case. Limitations identified by review team No baseline data of sample socio-economic characteristics given (only data for the intervention area as a whole). Follow-up at 1 month can only give an initial indication of the effectiveness of the intervention. Analysis of descriptive data only conducted. Evidence gaps and/or recommendations for future research None. Source of funding Centers for Disease Control & Prevention. Observations from the Discussion section regarding barriers & facilitators ‘Community coalition’ approach, which involved community groups and organisations, facilitated
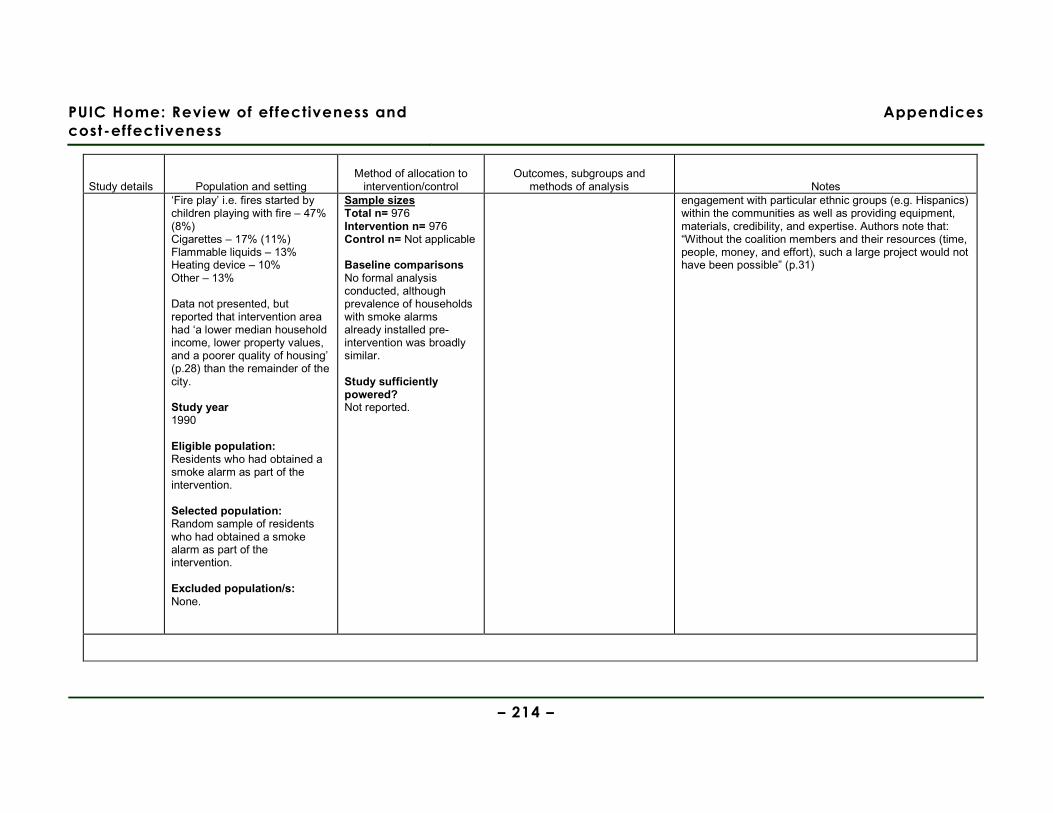
PUIC Home: Review of effectiveness and
cost-effectiveness
Appendices
– 214 –
Study details Population and setting Method of allocation to
intervention/control Outcomes, subgroups and
methods of analysis Notes ‘Fire play’ i.e. fires started by children playing with fire – 47% (8%) Cigarettes – 17% (11%) Flammable liquids – 13% Heating device – 10% Other – 13% Data not presented, but reported that intervention area had ‘a lower median household income, lower property values, and a poorer quality of housing’ (p.28) than the remainder of the city. Study year 1990 Eligible population: Residents who had obtained a smoke alarm as part of the intervention. Selected population: Random sample of residents who had obtained a smoke alarm as part of the intervention. Excluded population/s: None.
Sample sizes Total n= 976 Intervention n= 976 Control n= Not applicable Baseline comparisons No formal analysis conducted, although prevalence of households with smoke alarms already installed pre-intervention was broadly similar. Study sufficiently powered? Not reported.
engagement with particular ethnic groups (e.g. Hispanics) within the communities as well as providing equipment, materials, credibility, and expertise. Authors note that: “Without the coalition members and their resources (time, people, money, and effort), such a large project would not have been possible” (p.31)
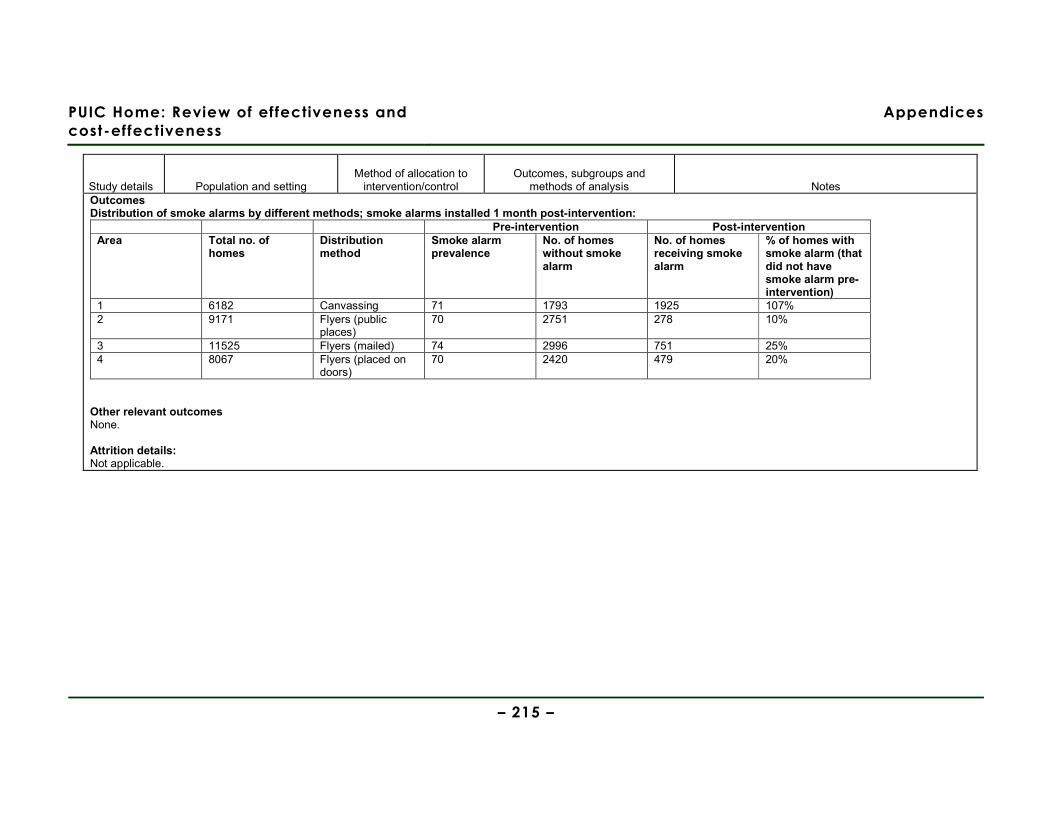
PUIC Home: Review of effectiveness and
cost-effectiveness
Appendices
– 215 –
Study details Population and setting Method of allocation to
intervention/control Outcomes, subgroups and
methods of analysis Notes Outcomes Distribution of smoke alarms by different methods; smoke alarms installed 1 month post-intervention:
Pre-intervention Post-intervention Area Total no. of
homes Distribution method
Smoke alarm prevalence
No. of homes without smoke alarm
No. of homes receiving smoke alarm
% of homes with smoke alarm (that did not have smoke alarm pre-intervention)
1 6182 Canvassing 71 1793 1925 107% 2 9171 Flyers (public
places) 70 2751 278 10%
3 11525 Flyers (mailed) 74 2996 751 25% 4 8067 Flyers (placed on
doors) 70 2420 479 20%
Other relevant outcomes None. Attrition details: Not applicable.

PUIC Home: Review of effectiveness and
cost-effectiveness
Appendices
– 216 –
Study details Population and setting Method of allocation to
intervention/control Outcomes, subgroups and
methods of analysis Notes Authors Gielen et al Year (of publication) 2002 Aim of study To evaluate the effectiveness of a home risk assessment, safety counselling, and provision of reduced cost products in increasing home safety practices. Study design RCT Internal validity score [++, + or -] ++ External validity score [++, + or -] ++
Source area/s Country USA Setting Paediatric resident continuity clinic, Children’s Safety Centre, and participants’ homes. Location Urban Population demographics Note: Only baseline data on participants who completed the study are reported: Age Mean age of mother (years) 24 Mean age of infant (months) 3 % Female Not reported. Ethnicity African American 94% Other socioeconomic variables Only 1 child younger than 5 years 66% <5 people in the home 60% Previous child injury 4% Employed (full or part-time) 23%
Method of allocation Random number table used to assign paediatric residents to intervention and control arms (the parents and children were assigned to the same arm that their Doctor had been assigned to). Intervention/s description Type of intervention Home risk assessment & discounted supply Other components of scheme/intervention? Paediatric residents (responsible for referral of participants) received a 5-hour training programme on childhood injuries and safety counselling (both intervention and control groups received this counselling). Intervention delivered: Safety counselling delivered by paediatric residents on a one-to-one basis during well-child clinics; duration differed according to individual
Outcomes Home safety practices. How is the data for each outcome collected? Measured/ assessed by trained community worker visiting the parents’ home. ‘Safe’ was defined as: Hot water temperature <=48.9°C Smoke alarm working (tested) Stairs – access protected by safety gate or door Poison storage – kept in a locked or latched cupboard Ipecac syrup – at least 1 bottle within expiry date. Other relevant outcomes None. Did the study collect data on and report resource use and/or costs (of compared interventions)? No. Timing of data collection 12 months post-intervention Method of analysis Student’s t test and χ2 analyses conducted to test for between group differences. Regression analysis conducted to compare between-group safety
Limitations identified by author Finding of no effect may have been as a result of safety products only being supplied, not installed (authors cite concern over liability if study had also installed safety equipment). Final sample size smaller than anticipated in original sample-size calculations. Use of the Children’s Safety Centre primarily used upon self-report, as the day-to-day pressures on workers running the Centres made keeping records on attendance problematic. All safety practices were scored as having equal impact on the reduction on incidence or severity of injuries; authors acknowledge that such practices may have differential impacts, but note that evidence lacking in how to more precisely assign a weighting to the different practices. Families visiting the Children’s Safety Centre were more advantaged (e.g. higher income, smaller families, better educated) than those who did not (i.e. a self-selection bias may exist as attendance at the CSC was not randomised). Limitations identified by review team Blinding of researchers observing safety practices to trial arm allocation not reported. High rate of attrition (35%) which was not further investigated.
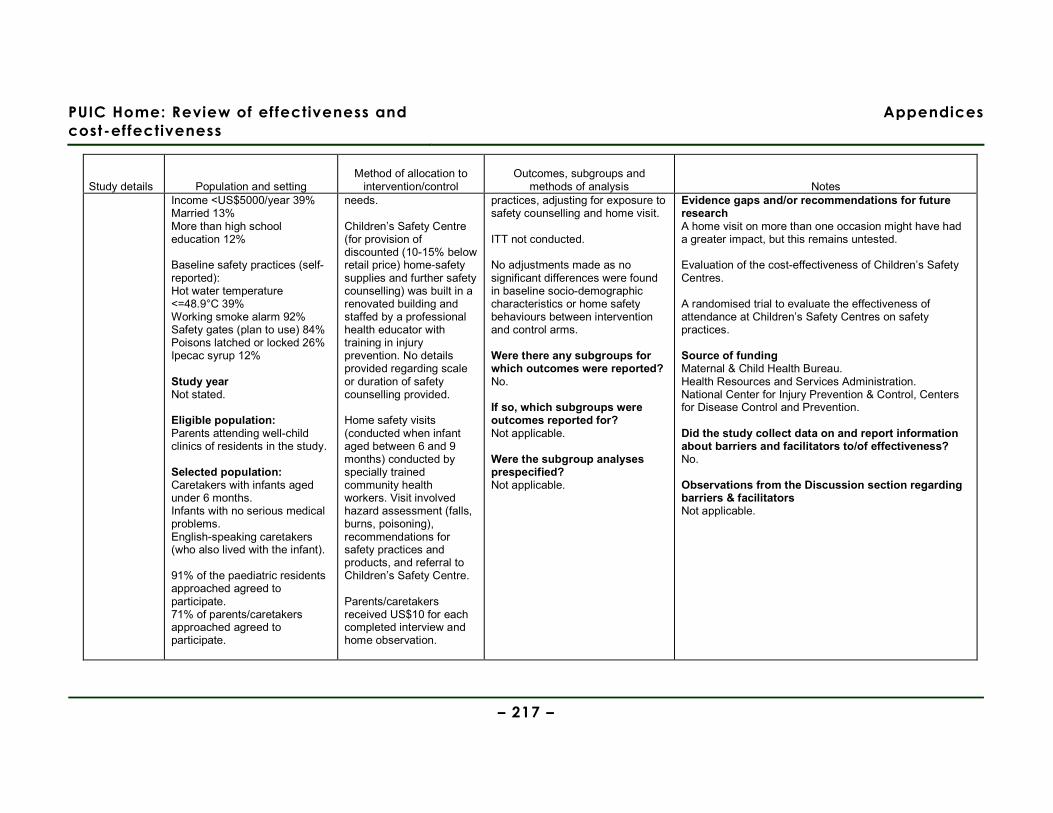
PUIC Home: Review of effectiveness and
cost-effectiveness
Appendices
– 217 –
Study details Population and setting Method of allocation to
intervention/control Outcomes, subgroups and
methods of analysis Notes Income <US$5000/year 39% Married 13% More than high school education 12% Baseline safety practices (self-reported): Hot water temperature <=48.9°C 39% Working smoke alarm 92% Safety gates (plan to use) 84% Poisons latched or locked 26% Ipecac syrup 12% Study year Not stated. Eligible population: Parents attending well-child clinics of residents in the study. Selected population: Caretakers with infants aged under 6 months. Infants with no serious medical problems. English-speaking caretakers (who also lived with the infant). 91% of the paediatric residents approached agreed to participate. 71% of parents/caretakers approached agreed to participate.
needs. Children’s Safety Centre (for provision of discounted (10-15% below retail price) home-safety supplies and further safety counselling) was built in a renovated building and staffed by a professional health educator with training in injury prevention. No details provided regarding scale or duration of safety counselling provided. Home safety visits (conducted when infant aged between 6 and 9 months) conducted by specially trained community health workers. Visit involved hazard assessment (falls, burns, poisoning), recommendations for safety practices and products, and referral to Children’s Safety Centre. Parents/caretakers received US$10 for each completed interview and home observation.
practices, adjusting for exposure to safety counselling and home visit.
ITT not conducted. No adjustments made as no significant differences were found in baseline socio-demographic characteristics or home safety behaviours between intervention and control arms. Were there any subgroups for which outcomes were reported? No. If so, which subgroups were outcomes reported for? Not applicable. Were the subgroup analyses prespecified? Not applicable.
Evidence gaps and/or recommendations for future research A home visit on more than one occasion might have had a greater impact, but this remains untested. Evaluation of the cost-effectiveness of Children’s Safety Centres. A randomised trial to evaluate the effectiveness of attendance at Children’s Safety Centres on safety practices. Source of funding Maternal & Child Health Bureau. Health Resources and Services Administration. National Center for Injury Prevention & Control, Centers for Disease Control and Prevention. Did the study collect data on and report information about barriers and facilitators to/of effectiveness? No. Observations from the Discussion section regarding barriers & facilitators Not applicable.
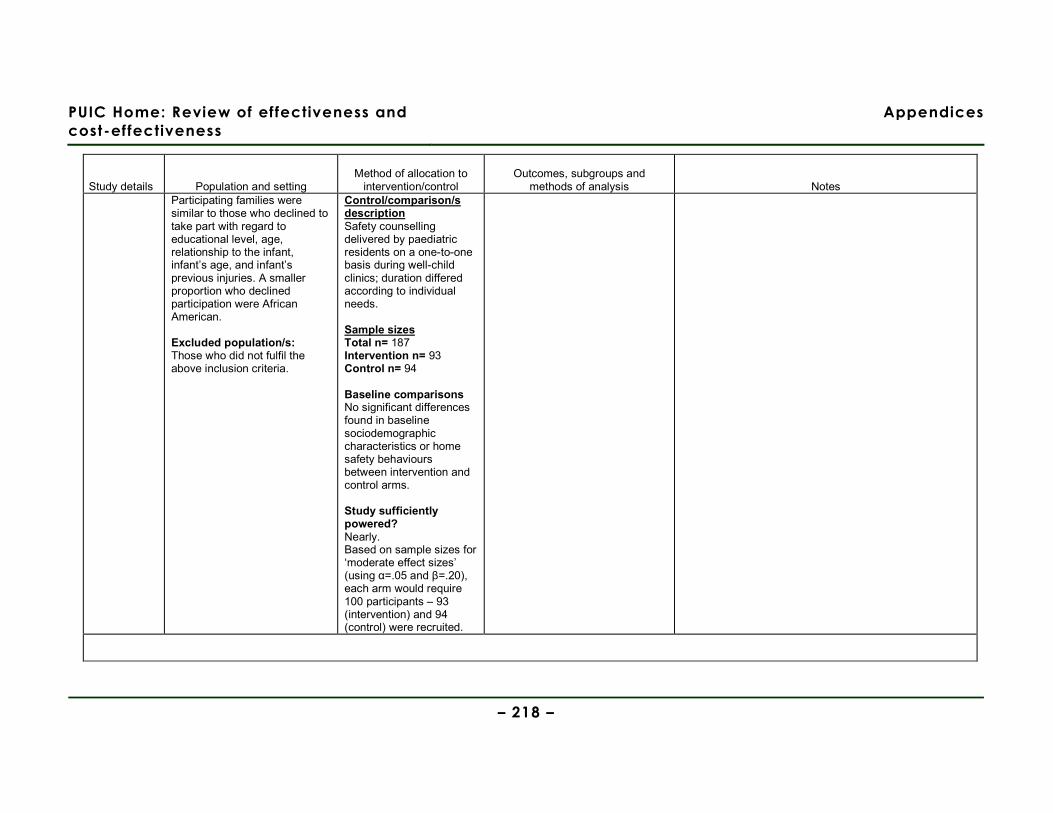
PUIC Home: Review of effectiveness and
cost-effectiveness
Appendices
– 218 –
Study details Population and setting Method of allocation to
intervention/control Outcomes, subgroups and
methods of analysis Notes Participating families were similar to those who declined to take part with regard to educational level, age, relationship to the infant, infant’s age, and infant’s previous injuries. A smaller proportion who declined participation were African American. Excluded population/s: Those who did not fulfil the above inclusion criteria.
Control/comparison/s description Safety counselling delivered by paediatric residents on a one-to-one basis during well-child clinics; duration differed according to individual needs. Sample sizes Total n= 187 Intervention n= 93 Control n= 94 Baseline comparisons No significant differences found in baseline sociodemographic characteristics or home safety behaviours between intervention and control arms. Study sufficiently powered? Nearly. Based on sample sizes for ‘moderate effect sizes’ (using α=.05 and β=.20), each arm would require 100 participants – 93 (intervention) and 94 (control) were recruited.
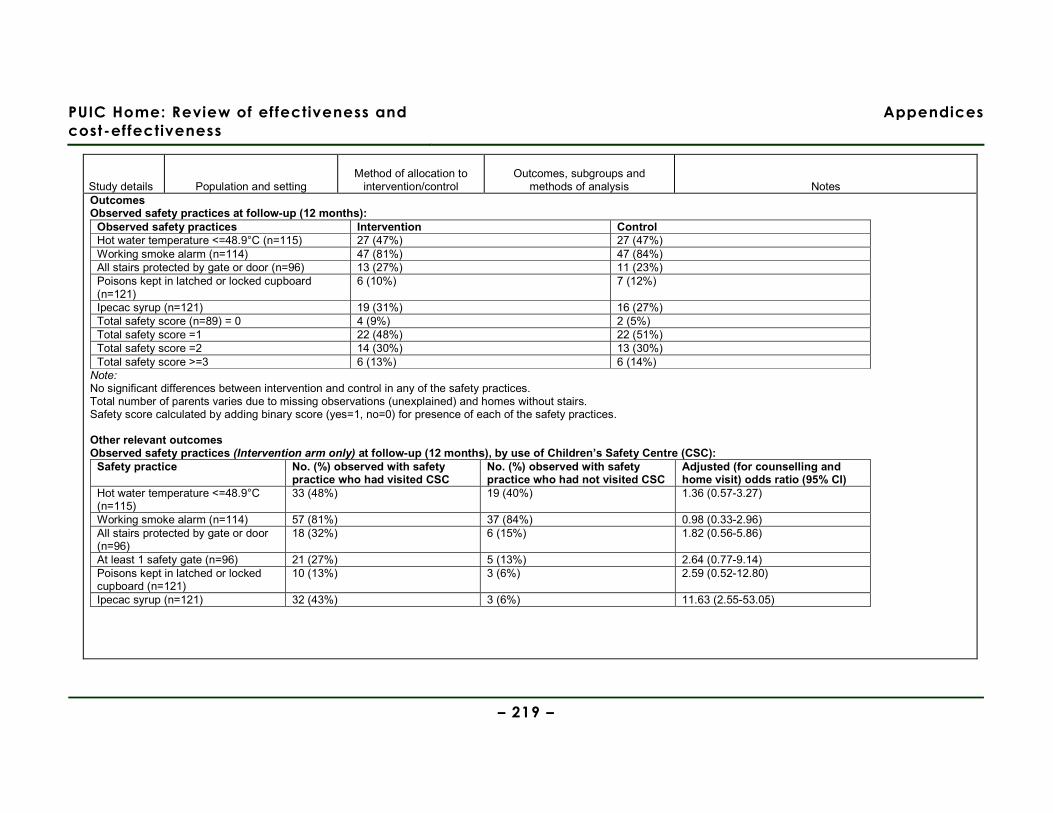
PUIC Home: Review of effectiveness and
cost-effectiveness
Appendices
– 219 –
Study details Population and setting Method of allocation to
intervention/control Outcomes, subgroups and
methods of analysis Notes Outcomes Observed safety practices at follow-up (12 months):
Observed safety practices Intervention Control Hot water temperature <=48.9°C (n=115) 27 (47%) 27 (47%) Working smoke alarm (n=114) 47 (81%) 47 (84%) All stairs protected by gate or door (n=96) 13 (27%) 11 (23%) Poisons kept in latched or locked cupboard (n=121)
6 (10%) 7 (12%)
Ipecac syrup (n=121) 19 (31%) 16 (27%) Total safety score (n=89) = 0 4 (9%) 2 (5%) Total safety score =1 22 (48%) 22 (51%) Total safety score =2 14 (30%) 13 (30%) Total safety score >=3 6 (13%) 6 (14%) Note: No significant differences between intervention and control in any of the safety practices. Total number of parents varies due to missing observations (unexplained) and homes without stairs. Safety score calculated by adding binary score (yes=1, no=0) for presence of each of the safety practices. Other relevant outcomes Observed safety practices (Intervention arm only) at follow-up (12 months), by use of Children’s Safety Centre (CSC):
Safety practice No. (%) observed with safety practice who had visited CSC
No. (%) observed with safety practice who had not visited CSC
Adjusted (for counselling and home visit) odds ratio (95% CI)
Hot water temperature <=48.9°C (n=115)
33 (48%) 19 (40%) 1.36 (0.57-3.27)
Working smoke alarm (n=114) 57 (81%) 37 (84%) 0.98 (0.33-2.96) All stairs protected by gate or door (n=96)
18 (32%) 6 (15%) 1.82 (0.56-5.86)
At least 1 safety gate (n=96) 21 (27%) 5 (13%) 2.64 (0.77-9.14) Poisons kept in latched or locked cupboard (n=121)
10 (13%) 3 (6%) 2.59 (0.52-12.80)
Ipecac syrup (n=121) 32 (43%) 3 (6%) 11.63 (2.55-53.05)
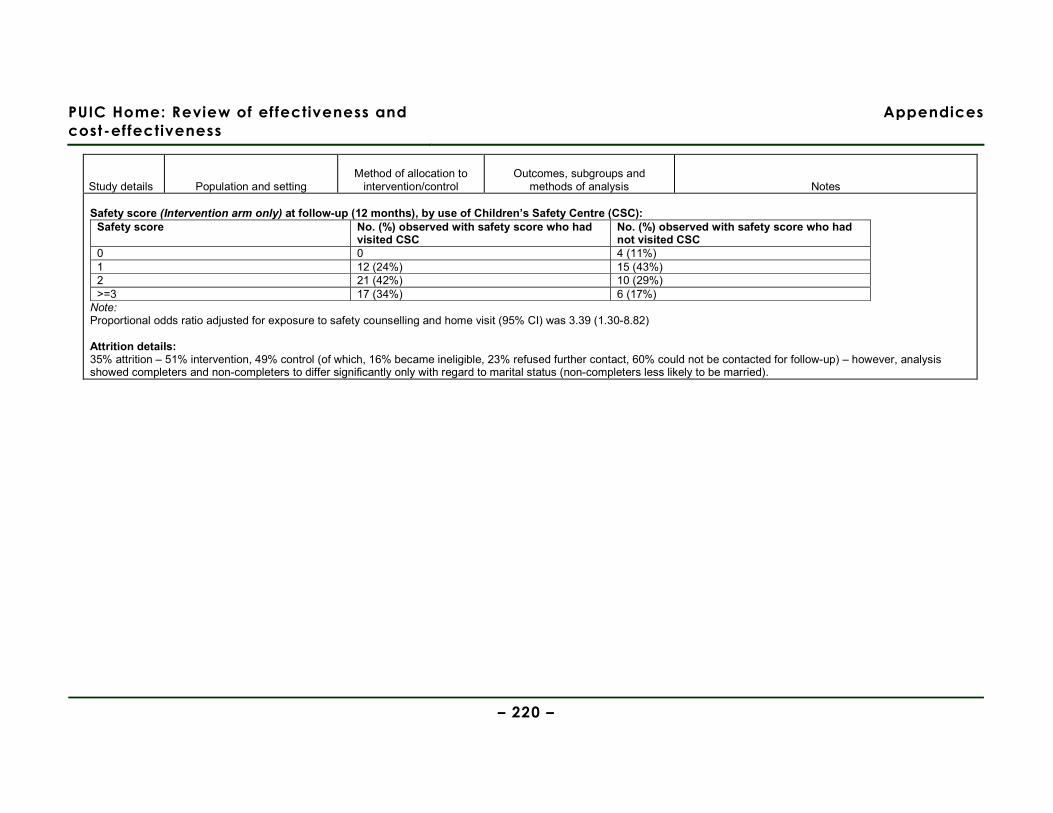
PUIC Home: Review of effectiveness and
cost-effectiveness
Appendices
– 220 –
Study details Population and setting Method of allocation to
intervention/control Outcomes, subgroups and
methods of analysis Notes Safety score (Intervention arm only) at follow-up (12 months), by use of Children’s Safety Centre (CSC):
Safety score No. (%) observed with safety score who had visited CSC
No. (%) observed with safety score who had not visited CSC
0 0 4 (11%) 1 12 (24%) 15 (43%) 2 21 (42%) 10 (29%) >=3 17 (34%) 6 (17%) Note: Proportional odds ratio adjusted for exposure to safety counselling and home visit (95% CI) was 3.39 (1.30-8.82) Attrition details: 35% attrition – 51% intervention, 49% control (of which, 16% became ineligible, 23% refused further contact, 60% could not be contacted for follow-up) – however, analysis showed completers and non-completers to differ significantly only with regard to marital status (non-completers less likely to be married).

PUIC Home: Review of effectiveness and
cost-effectiveness
Appendices
– 221 –
Study details Population and setting Method of allocation to
intervention/control Outcomes, subgroups and
methods of analysis Notes Authors Harvey et al Year (of publication) 2004
Aim of study To evaluate two methods (direct installation and distribution of vouchers) of promoting residential smoke alarm installation and maintenance in high risk households across five US states.
Study design Cluster RCT Internal validity score [++, + or -] +
Source area/s Country USA Setting Participants’ homes Location Not stated. Population demographics Age Not reported. % Female Not reported. Ethnicity See table below. Other socioeconomic variables See table below. Study year Not stated. Eligible population: Households with >=1 individual aged <5 years and/or >65 years within ‘high-risk’ areas of Arkansas, Maine, Maryland, Massachusetts, and North Carolina. High-risk areas were defined as:
Method of allocation Areas, counties, or census tracts were randomly allocated to trial arms. Intervention/s description Type of intervention Supply & installation of smoke alarms. Other components of scheme/intervention? None. Intervention delivered: Programme staff (firefighters, nurses, welfare-to-work recipients, neighbourhood representatives) canvassed door-to-door and provided a free smoke alarm (which was installed). Control/comparison/s description Programme staff (firefighters, nurses, welfare-to-work recipients, neighbourhood representatives) canvassed door-to-door and provided a voucher
Outcomes Installation and functioning of smoke alarms (observed). How is the data for each outcome collected? Observed. Other relevant outcomes None. Did the study collect data on and report resource use and/or costs (of compared interventions)? No. Timing of data collection Between 6 and 12 months post-intervention. Method of analysis ITT not conducted. No adjustments made for baseline differences in confounders. χ2 test for proportions conducted to compare trial arm outcome data. Were there any subgroups for which outcomes were reported? No. If so, which subgroups were outcomes reported for? Not applicable.
Limitations identified by author In a small number of homes, study personnel redeemed the vouchers on behalf of the participants and brought the smoke alarm to them, thereby artificially inflating the proportion of voucher households with functioning smoke alarms at follow-up. Limitations identified by review team No formal analysis of the baseline differences in socio-demographic characteristics of participants. It is unclear how the home heating fuel sources in participants’ households impacted upon the effectiveness of the intervention. Unable to assess whether or not the analysis (unadjusted for potentially important baseline differences in confounders) is justified, as baseline characteristics data by trial arm are not presented. Differences in the way that intervention was delivered in different states and the way that these interacted with the different socio-demographic baseline characteristics of participants are not controlled for or explored in the analysis. Odds ratios are only presented for the aggregate of all the states where the intervention was implemented, rather than disaggregated (even though the characteristics of participants in different states differed considerably). Evidence gaps and/or recommendations for future research
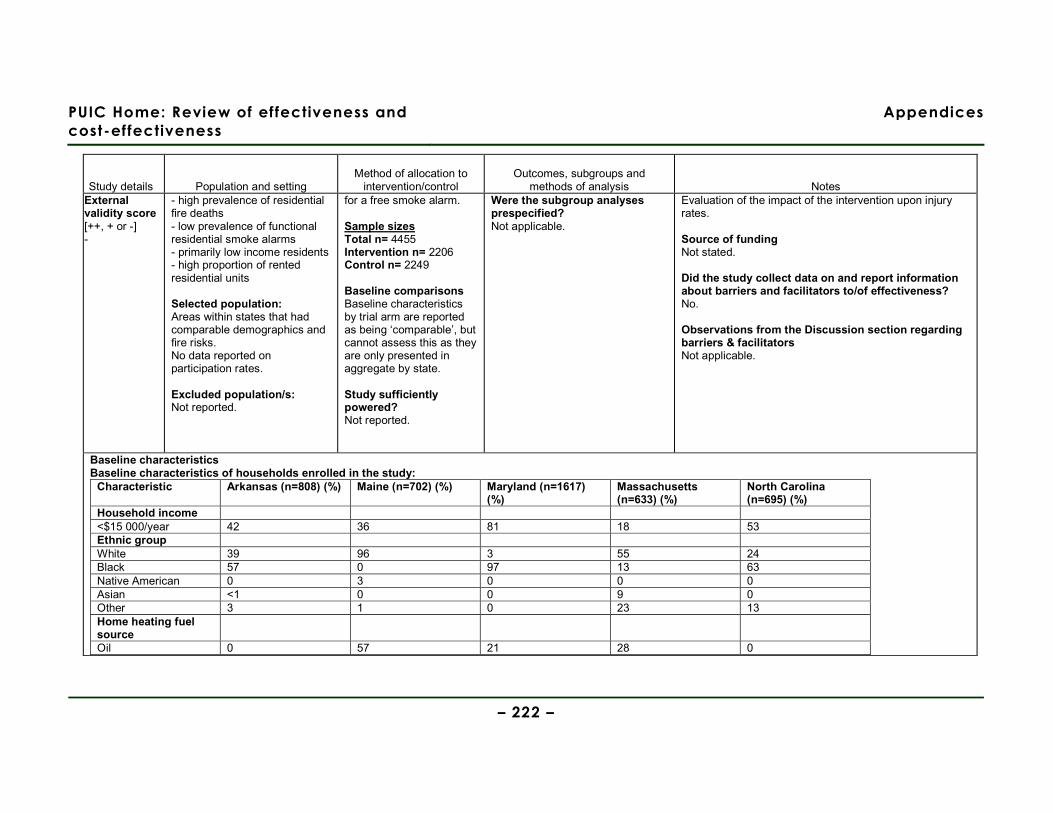
PUIC Home: Review of effectiveness and
cost-effectiveness
Appendices
– 222 –
Study details Population and setting Method of allocation to
intervention/control Outcomes, subgroups and
methods of analysis Notes External validity score [++, + or -] -
- high prevalence of residential fire deaths - low prevalence of functional residential smoke alarms - primarily low income residents - high proportion of rented residential units Selected population: Areas within states that had comparable demographics and fire risks. No data reported on participation rates. Excluded population/s: Not reported.
for a free smoke alarm. Sample sizes Total n= 4455 Intervention n= 2206 Control n= 2249 Baseline comparisons Baseline characteristics by trial arm are reported as being ‘comparable’, but cannot assess this as they are only presented in aggregate by state. Study sufficiently powered? Not reported.
Were the subgroup analyses prespecified? Not applicable.
Evaluation of the impact of the intervention upon injury rates. Source of funding Not stated. Did the study collect data on and report information about barriers and facilitators to/of effectiveness? No. Observations from the Discussion section regarding barriers & facilitators Not applicable.
Baseline characteristics Baseline characteristics of households enrolled in the study:
Characteristic Arkansas (n=808) (%) Maine (n=702) (%) Maryland (n=1617) (%)
Massachusetts (n=633) (%)
North Carolina (n=695) (%)
Household income <$15 000/year 42 36 81 18 53 Ethnic group White 39 96 3 55 24 Black 57 0 97 13 63 Native American 0 3 0 0 0 Asian <1 0 0 9 0 Other 3 1 0 23 13 Home heating fuel source
Oil 0 57 21 28 0
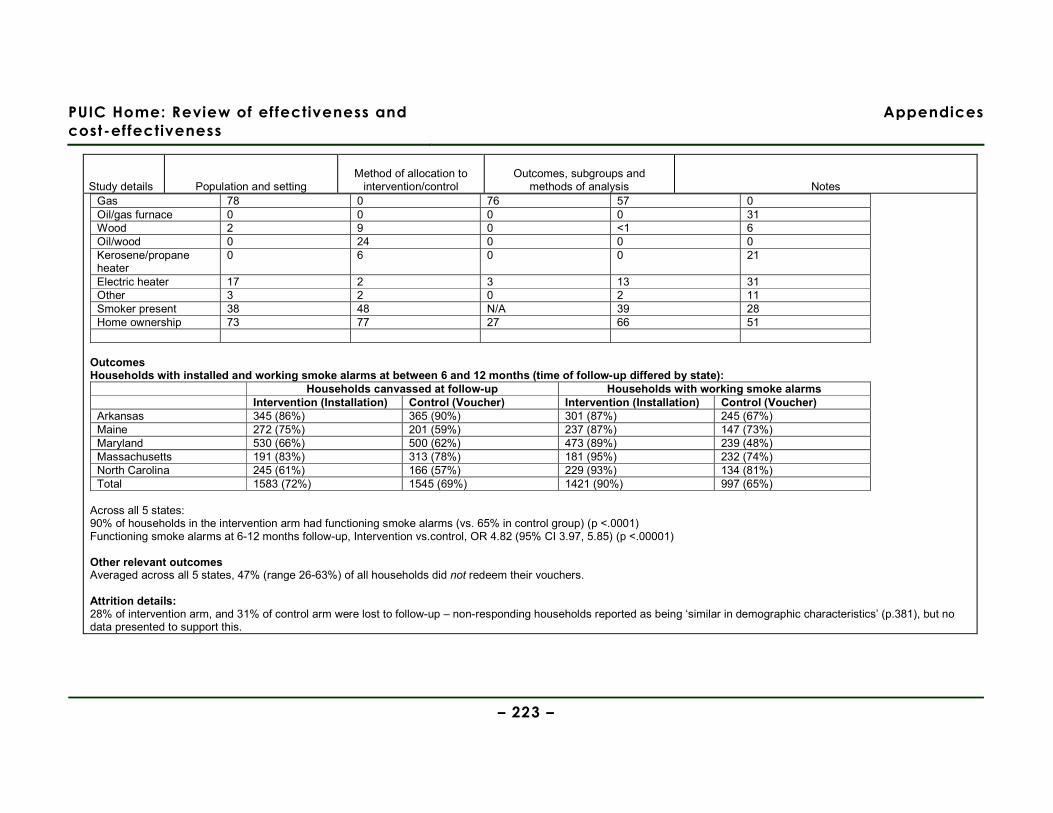
PUIC Home: Review of effectiveness and
cost-effectiveness
Appendices
– 223 –
Study details Population and setting Method of allocation to
intervention/control Outcomes, subgroups and
methods of analysis Notes Gas 78 0 76 57 0 Oil/gas furnace 0 0 0 0 31 Wood 2 9 0 <1 6 Oil/wood 0 24 0 0 0 Kerosene/propane heater
0 6 0 0 21
Electric heater 17 2 3 13 31 Other 3 2 0 2 11 Smoker present 38 48 N/A 39 28 Home ownership 73 77 27 66 51
Outcomes Households with installed and working smoke alarms at between 6 and 12 months (time of follow-up differed by state):
Households canvassed at follow-up Households with working smoke alarms Intervention (Installation) Control (Voucher) Intervention (Installation) Control (Voucher) Arkansas 345 (86%) 365 (90%) 301 (87%) 245 (67%) Maine 272 (75%) 201 (59%) 237 (87%) 147 (73%) Maryland 530 (66%) 500 (62%) 473 (89%) 239 (48%) Massachusetts 191 (83%) 313 (78%) 181 (95%) 232 (74%) North Carolina 245 (61%) 166 (57%) 229 (93%) 134 (81%) Total 1583 (72%) 1545 (69%) 1421 (90%) 997 (65%)
Across all 5 states: 90% of households in the intervention arm had functioning smoke alarms (vs. 65% in control group) (p <.0001) Functioning smoke alarms at 6-12 months follow-up, Intervention vs.control, OR 4.82 (95% CI 3.97, 5.85) (p <.00001) Other relevant outcomes Averaged across all 5 states, 47% (range 26-63%) of all households did not redeem their vouchers. Attrition details: 28% of intervention arm, and 31% of control arm were lost to follow-up – non-responding households reported as being ‘similar in demographic characteristics’ (p.381), but no data presented to support this.
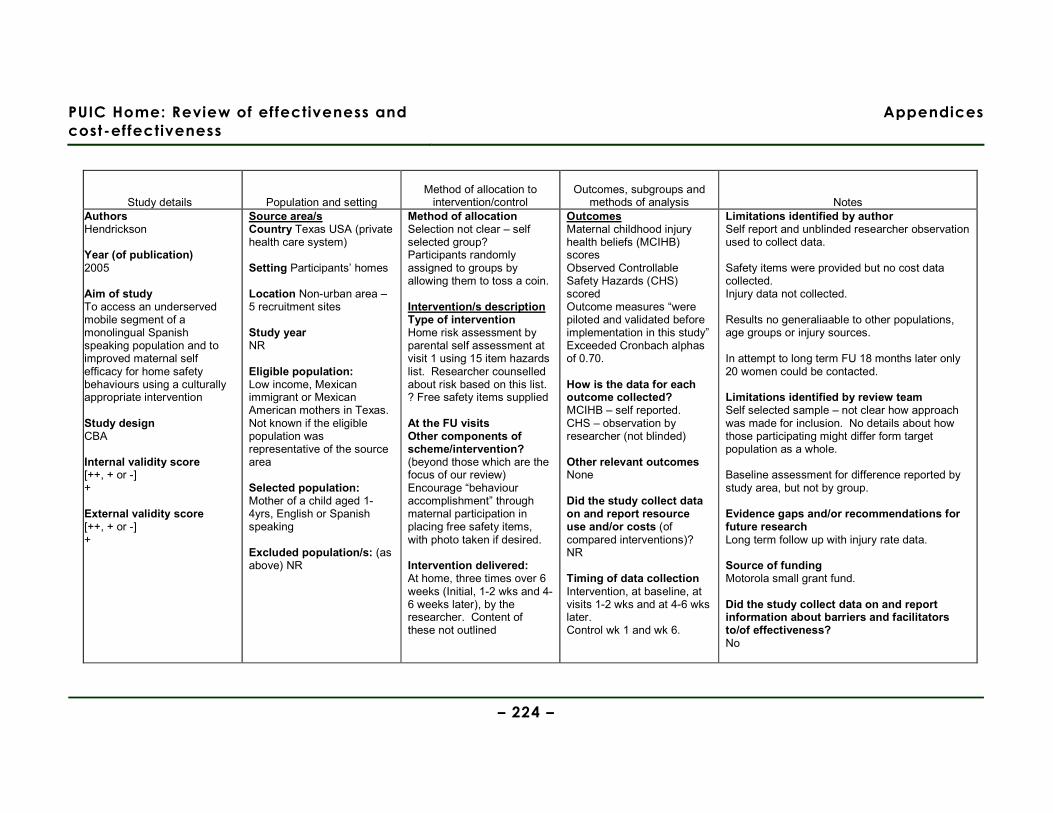
PUIC Home: Review of effectiveness and
cost-effectiveness
Appendices
– 224 –
Study details Population and setting Method of allocation to
intervention/control Outcomes, subgroups and
methods of analysis Notes Authors Hendrickson Year (of publication) 2005 Aim of study To access an underserved mobile segment of a monolingual Spanish speaking population and to improved maternal self efficacy for home safety behaviours using a culturally appropriate intervention Study design CBA Internal validity score [++, + or -] + External validity score [++, + or -] +
Source area/s Country Texas USA (private health care system) Setting Participants’ homes Location Non-urban area – 5 recruitment sites Study year NR Eligible population: Low income, Mexican immigrant or Mexican American mothers in Texas. Not known if the eligible population was representative of the source area Selected population: Mother of a child aged 1-4yrs, English or Spanish speaking Excluded population/s: (as above) NR
Method of allocation Selection not clear – self selected group? Participants randomly assigned to groups by allowing them to toss a coin. Intervention/s description Type of intervention Home risk assessment by parental self assessment at visit 1 using 15 item hazards list. Researcher counselled about risk based on this list. ? Free safety items supplied At the FU visits Other components of scheme/intervention? (beyond those which are the focus of our review) Encourage “behaviour accomplishment” through maternal participation in placing free safety items, with photo taken if desired. Intervention delivered: At home, three times over 6 weeks (Initial, 1-2 wks and 4-6 weeks later), by the researcher. Content of these not outlined
Outcomes Maternal childhood injury health beliefs (MCIHB) scores Observed Controllable Safety Hazards (CHS) scored Outcome measures “were piloted and validated before implementation in this study” Exceeded Cronbach alphas of 0.70. How is the data for each outcome collected? MCIHB – self reported. CHS – observation by researcher (not blinded) Other relevant outcomes None Did the study collect data on and report resource use and/or costs (of compared interventions)? NR Timing of data collection Intervention, at baseline, at visits 1-2 wks and at 4-6 wks later. Control wk 1 and wk 6.
Limitations identified by author Self report and unblinded researcher observation used to collect data. Safety items were provided but no cost data collected. Injury data not collected. Results no generaliaable to other populations, age groups or injury sources. In attempt to long term FU 18 months later only 20 women could be contacted. Limitations identified by review team Self selected sample – not clear how approach was made for inclusion. No details about how those participating might differ form target population as a whole. Baseline assessment for difference reported by study area, but not by group. Evidence gaps and/or recommendations for future research Long term follow up with injury rate data. Source of funding Motorola small grant fund. Did the study collect data on and report information about barriers and facilitators to/of effectiveness? No
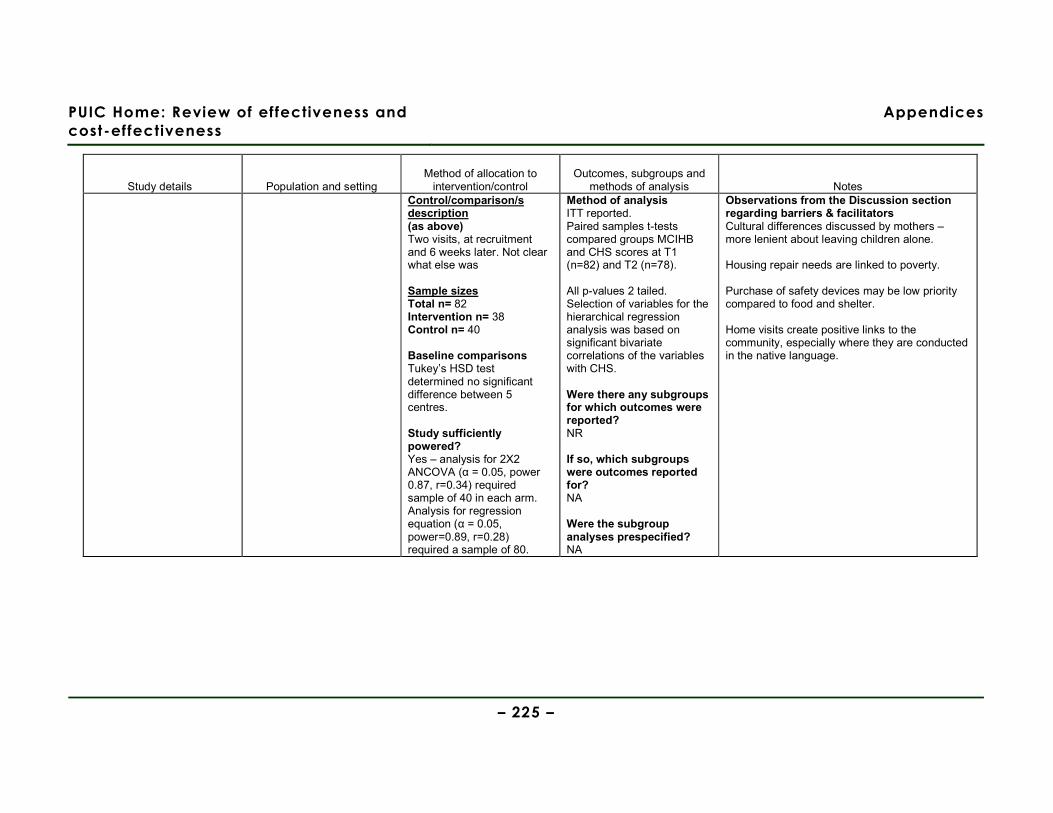
PUIC Home: Review of effectiveness and
cost-effectiveness
Appendices
– 225 –
Study details Population and setting Method of allocation to
intervention/control Outcomes, subgroups and
methods of analysis Notes Control/comparison/s description (as above) Two visits, at recruitment and 6 weeks later. Not clear what else was Sample sizes Total n= 82 Intervention n= 38 Control n= 40 Baseline comparisons Tukey’s HSD test determined no significant difference between 5 centres. Study sufficiently powered? Yes – analysis for 2X2 ANCOVA (α = 0.05, power 0.87, r=0.34) required sample of 40 in each arm. Analysis for regression equation (α = 0.05, power=0.89, r=0.28) required a sample of 80.
Method of analysis ITT reported. Paired samples t-tests compared groups MCIHB and CHS scores at T1 (n=82) and T2 (n=78). All p-values 2 tailed. Selection of variables for the hierarchical regression analysis was based on significant bivariate correlations of the variables with CHS. Were there any subgroups for which outcomes were reported? NR If so, which subgroups were outcomes reported for? NA Were the subgroup analyses prespecified? NA
Observations from the Discussion section regarding barriers & facilitators Cultural differences discussed by mothers – more lenient about leaving children alone. Housing repair needs are linked to poverty. Purchase of safety devices may be low priority compared to food and shelter. Home visits create positive links to the community, especially where they are conducted in the native language.
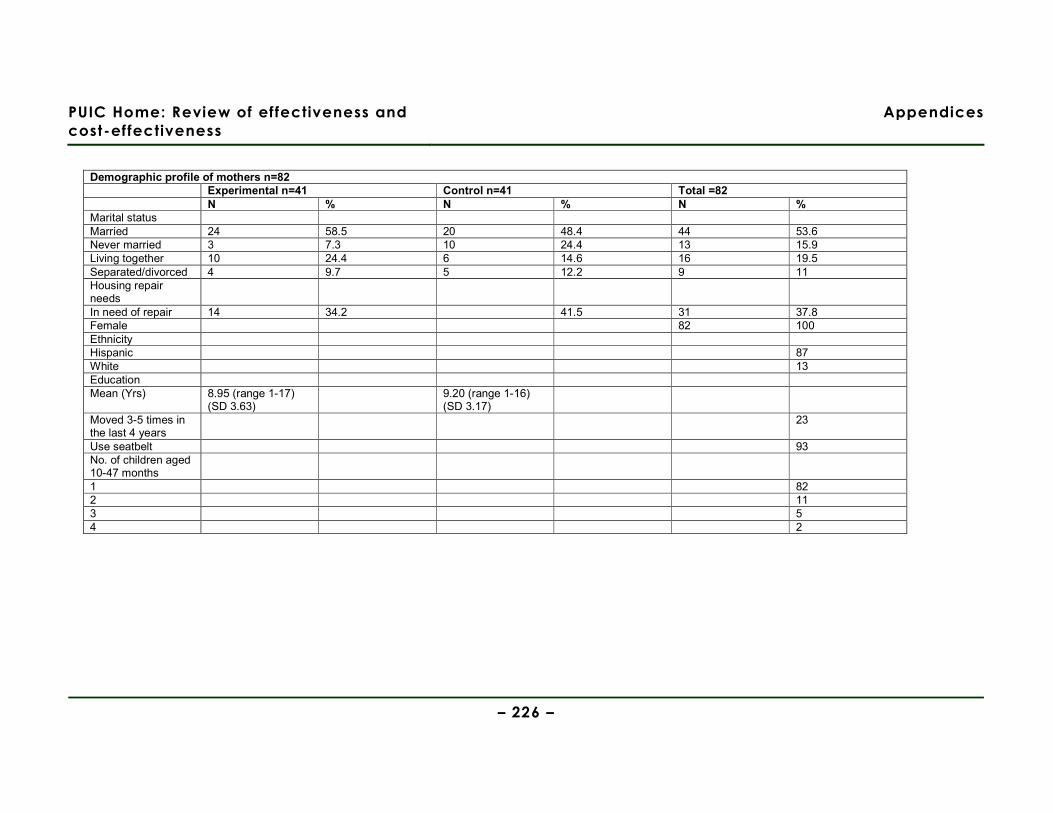
PUIC Home: Review of effectiveness and
cost-effectiveness
Appendices
– 226 –
Demographic profile of mothers n=82 Experimental n=41 Control n=41 Total =82 N % N % N % Marital status Married 24 58.5 20 48.4 44 53.6 Never married 3 7.3 10 24.4 13 15.9 Living together 10 24.4 6 14.6 16 19.5 Separated/divorced 4 9.7 5 12.2 9 11 Housing repair needs
In need of repair 14 34.2 41.5 31 37.8 Female 82 100 Ethnicity Hispanic 87 White 13 Education Mean (Yrs) 8.95 (range 1-17)
(SD 3.63) 9.20 (range 1-16)
(SD 3.17)
Moved 3-5 times in the last 4 years
23
Use seatbelt 93 No. of children aged 10-47 months
1 82 2 11 3 5 4 2
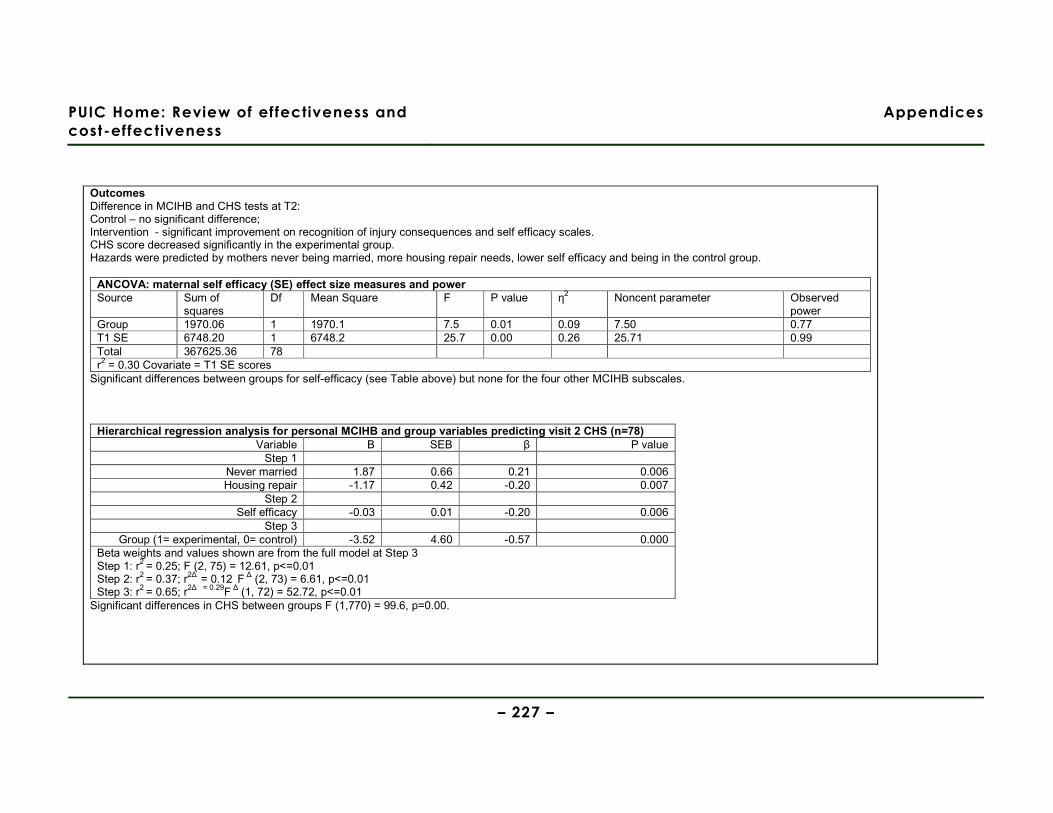
PUIC Home: Review of effectiveness and
cost-effectiveness
Appendices
– 227 –
Outcomes Difference in MCIHB and CHS tests at T2: Control – no significant difference; Intervention - significant improvement on recognition of injury consequences and self efficacy scales. CHS score decreased significantly in the experimental group. Hazards were predicted by mothers never being married, more housing repair needs, lower self efficacy and being in the control group.
ANCOVA: maternal self efficacy (SE) effect size measures and power Source Sum of
squares Df Mean Square F P value η2 Noncent parameter Observed
power Group 1970.06 1 1970.1 7.5 0.01 0.09 7.50 0.77 T1 SE 6748.20 1 6748.2 25.7 0.00 0.26 25.71 0.99 Total 367625.36 78 r2 = 0.30 Covariate = T1 SE scores
Significant differences between groups for self-efficacy (see Table above) but none for the four other MCIHB subscales.
Hierarchical regression analysis for personal MCIHB and group variables predicting visit 2 CHS (n=78) Variable B SEB β P value
Step 1 Never married 1.87 0.66 0.21 0.006 Housing repair -1.17 0.42 -0.20 0.007
Step 2 Self efficacy -0.03 0.01 -0.20 0.006
Step 3 Group (1= experimental, 0= control) -3.52 4.60 -0.57 0.000
Beta weights and values shown are from the full model at Step 3 Step 1: r2 = 0.25; F (2, 75) = 12.61, p<=0.01 Step 2: r2 = 0.37; r2∆ = 0.12 F ∆ (2, 73) = 6.61, p<=0.01 Step 3: r2 = 0.65; r2∆ = 0.29F ∆ (1, 72) = 52.72, p<=0.01
Significant differences in CHS between groups F (1,770) = 99.6, p=0.00.
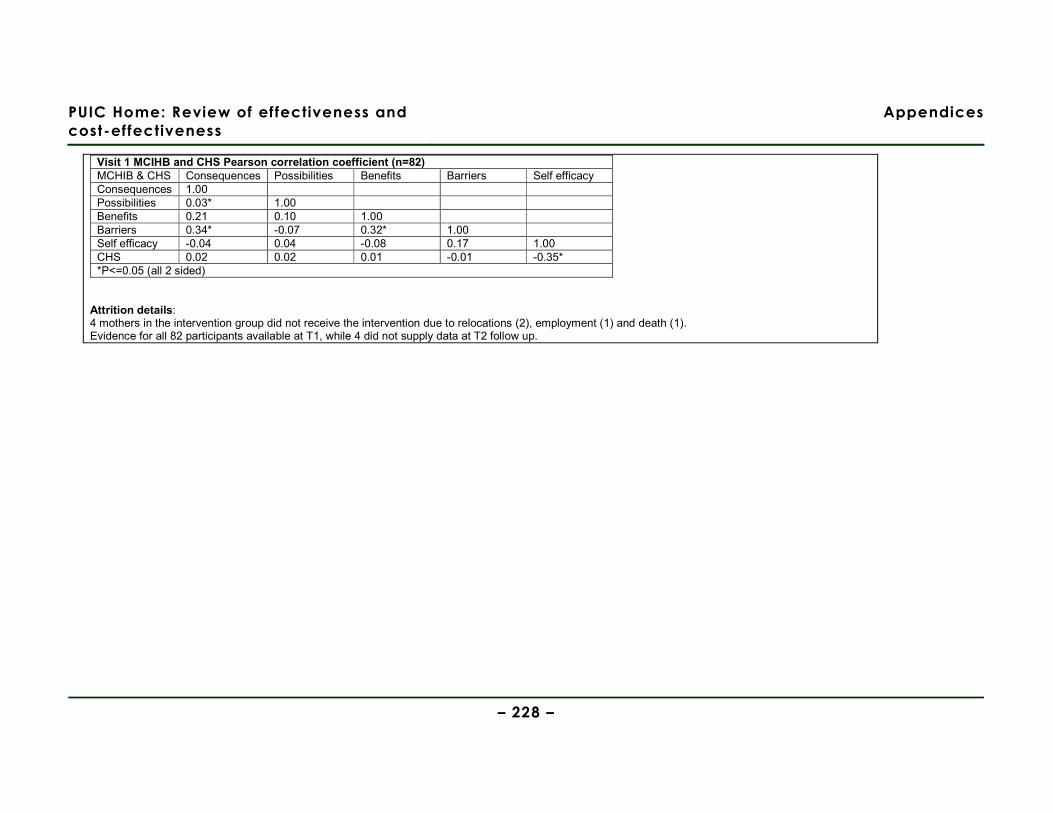
PUIC Home: Review of effectiveness and
cost-effectiveness
Appendices
– 228 –
Visit 1 MCIHB and CHS Pearson correlation coefficient (n=82) MCHIB & CHS Consequences Possibilities Benefits Barriers Self efficacy Consequences 1.00 Possibilities 0.03* 1.00 Benefits 0.21 0.10 1.00 Barriers 0.34* -0.07 0.32* 1.00 Self efficacy -0.04 0.04 -0.08 0.17 1.00 CHS 0.02 0.02 0.01 -0.01 -0.35* *P<=0.05 (all 2 sided)
Attrition details: 4 mothers in the intervention group did not receive the intervention due to relocations (2), employment (1) and death (1). Evidence for all 82 participants available at T1, while 4 did not supply data at T2 follow up.
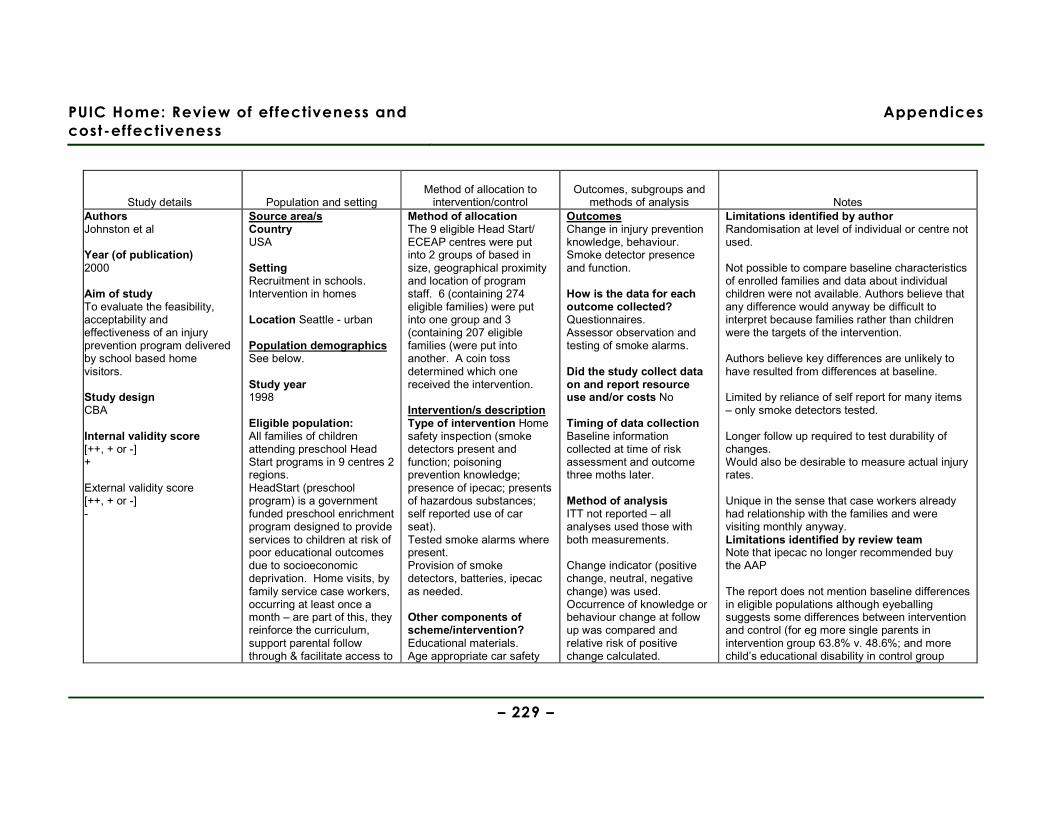
PUIC Home: Review of effectiveness and
cost-effectiveness
Appendices
– 229 –
Study details Population and setting Method of allocation to
intervention/control Outcomes, subgroups and
methods of analysis Notes Authors Johnston et al Year (of publication) 2000 Aim of study To evaluate the feasibility, acceptability and effectiveness of an injury prevention program delivered by school based home visitors. Study design CBA Internal validity score [++, + or -] + External validity score [++, + or -] -
Source area/s Country USA Setting Recruitment in schools. Intervention in homes Location Seattle - urban Population demographics See below. Study year 1998 Eligible population: All families of children attending preschool Head Start programs in 9 centres 2 regions. HeadStart (preschool program) is a government funded preschool enrichment program designed to provide services to children at risk of poor educational outcomes due to socioeconomic deprivation. Home visits, by family service case workers, occurring at least once a month – are part of this, they reinforce the curriculum, support parental follow through & facilitate access to
Method of allocation The 9 eligible Head Start/ ECEAP centres were put into 2 groups of based in size, geographical proximity and location of program staff. 6 (containing 274 eligible families) were put into one group and 3 (containing 207 eligible families (were put into another. A coin toss determined which one received the intervention. Intervention/s description Type of intervention Home safety inspection (smoke detectors present and function; poisoning prevention knowledge; presence of ipecac; presents of hazardous substances; self reported use of car seat). Tested smoke alarms where present. Provision of smoke detectors, batteries, ipecac as needed.
Other components of scheme/intervention? Educational materials. Age appropriate car safety
Outcomes Change in injury prevention knowledge, behaviour. Smoke detector presence and function. How is the data for each outcome collected? Questionnaires. Assessor observation and testing of smoke alarms. Did the study collect data on and report resource use and/or costs No Timing of data collection Baseline information collected at time of risk assessment and outcome three moths later. Method of analysis ITT not reported – all analyses used those with both measurements. Change indicator (positive change, neutral, negative change) was used. Occurrence of knowledge or behaviour change at follow up was compared and relative risk of positive change calculated.
Limitations identified by author Randomisation at level of individual or centre not used. Not possible to compare baseline characteristics of enrolled families and data about individual children were not available. Authors believe that any difference would anyway be difficult to interpret because families rather than children were the targets of the intervention. Authors believe key differences are unlikely to have resulted from differences at baseline. Limited by reliance of self report for many items – only smoke detectors tested. Longer follow up required to test durability of changes. Would also be desirable to measure actual injury rates. Unique in the sense that case workers already had relationship with the families and were visiting monthly anyway. Limitations identified by review team Note that ipecac no longer recommended buy the AAP The report does not mention baseline differences in eligible populations although eyeballing suggests some differences between intervention and control (for eg more single parents in intervention group 63.8% v. 48.6%; and more child’s educational disability in control group
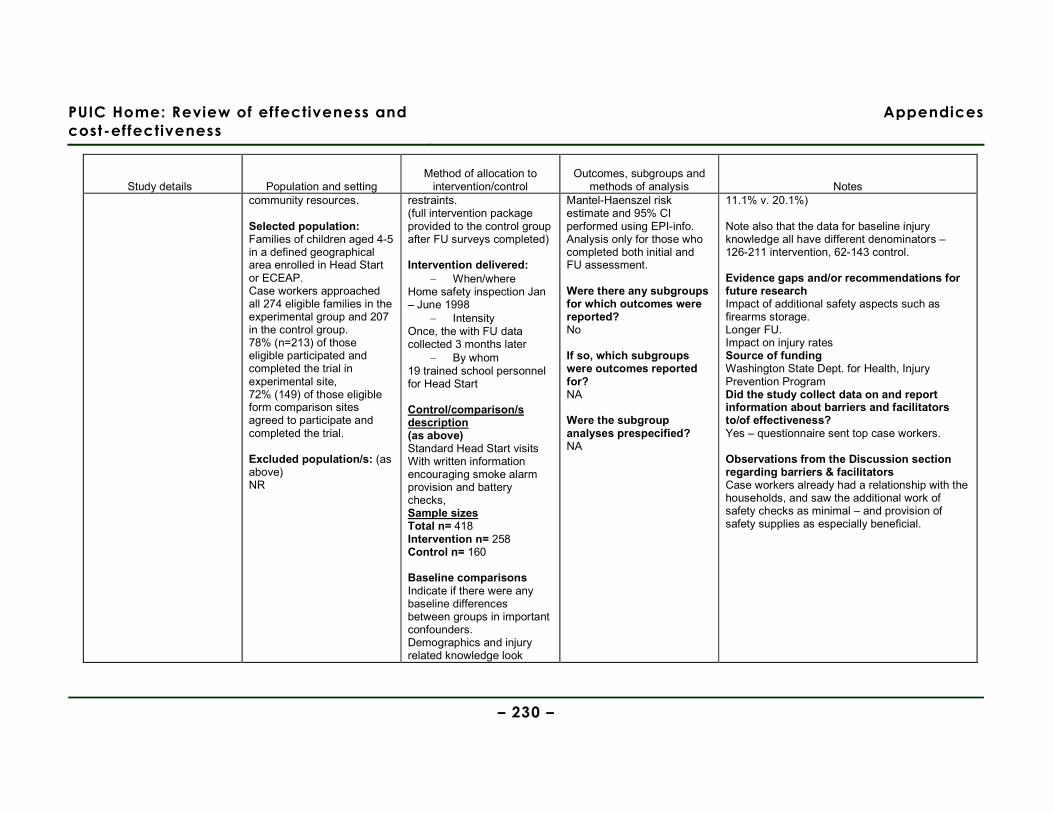
PUIC Home: Review of effectiveness and
cost-effectiveness
Appendices
– 230 –
Study details Population and setting Method of allocation to
intervention/control Outcomes, subgroups and
methods of analysis Notes community resources. Selected population: Families of children aged 4-5 in a defined geographical area enrolled in Head Start or ECEAP. Case workers approached all 274 eligible families in the experimental group and 207 in the control group. 78% (n=213) of those eligible participated and completed the trial in experimental site, 72% (149) of those eligible form comparison sites agreed to participate and completed the trial. Excluded population/s: (as above) NR
restraints. (full intervention package provided to the control group after FU surveys completed) Intervention delivered:
− When/where Home safety inspection Jan – June 1998
− Intensity Once, the with FU data collected 3 months later
− By whom 19 trained school personnel for Head Start Control/comparison/s description (as above) Standard Head Start visits With written information encouraging smoke alarm provision and battery checks, Sample sizes Total n= 418 Intervention n= 258 Control n= 160 Baseline comparisons Indicate if there were any baseline differences between groups in important confounders. Demographics and injury related knowledge look
Mantel-Haenszel risk estimate and 95% CI performed using EPI-info. Analysis only for those who completed both initial and FU assessment. Were there any subgroups for which outcomes were reported? No If so, which subgroups were outcomes reported for? NA Were the subgroup analyses prespecified? NA
11.1% v. 20.1%) Note also that the data for baseline injury knowledge all have different denominators – 126-211 intervention, 62-143 control. Evidence gaps and/or recommendations for future research Impact of additional safety aspects such as firearms storage. Longer FU. Impact on injury rates Source of funding Washington State Dept. for Health, Injury Prevention Program Did the study collect data on and report information about barriers and facilitators to/of effectiveness? Yes – questionnaire sent top case workers. Observations from the Discussion section regarding barriers & facilitators Case workers already had a relationship with the households, and saw the additional work of safety checks as minimal – and provision of safety supplies as especially beneficial.
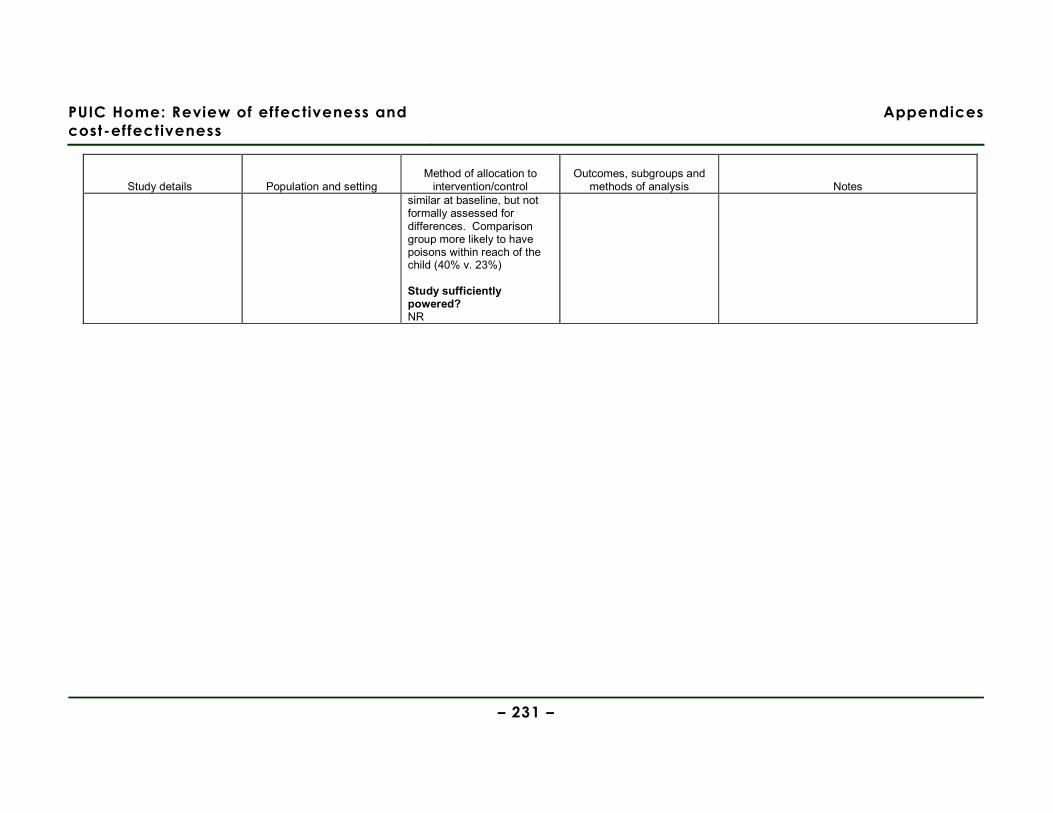
PUIC Home: Review of effectiveness and
cost-effectiveness
Appendices
– 231 –
Study details Population and setting Method of allocation to
intervention/control Outcomes, subgroups and
methods of analysis Notes similar at baseline, but not formally assessed for differences. Comparison group more likely to have poisons within reach of the child (40% v. 23%) Study sufficiently powered? NR
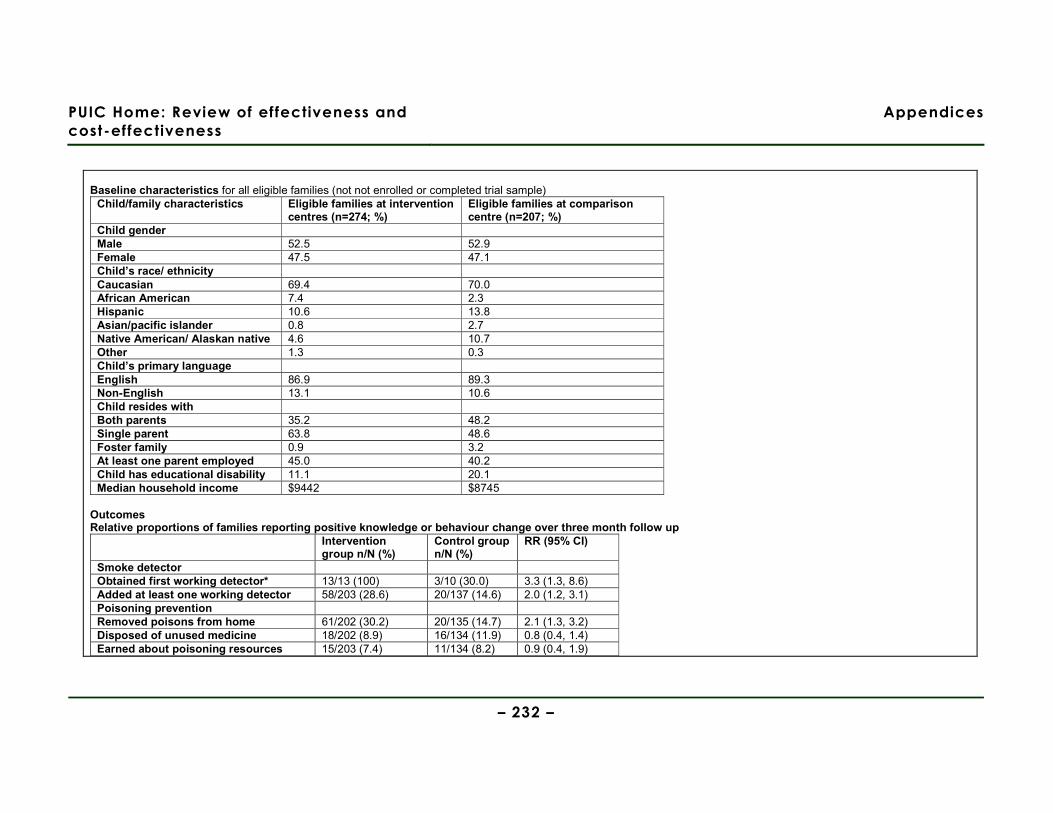
PUIC Home: Review of effectiveness and
cost-effectiveness
Appendices
– 232 –
Baseline characteristics for all eligible families (not not enrolled or completed trial sample)
Child/family characteristics Eligible families at intervention centres (n=274; %)
Eligible families at comparison centre (n=207; %)
Child gender Male 52.5 52.9 Female 47.5 47.1 Child’s race/ ethnicity Caucasian 69.4 70.0 African American 7.4 2.3 Hispanic 10.6 13.8 Asian/pacific islander 0.8 2.7 Native American/ Alaskan native 4.6 10.7 Other 1.3 0.3 Child’s primary language English 86.9 89.3 Non-English 13.1 10.6 Child resides with Both parents 35.2 48.2 Single parent 63.8 48.6 Foster family 0.9 3.2 At least one parent employed 45.0 40.2 Child has educational disability 11.1 20.1 Median household income $9442 $8745
Outcomes Relative proportions of families reporting positive knowledge or behaviour change over three month follow up
Intervention group n/N (%)
Control group n/N (%)
RR (95% CI)
Smoke detector Obtained first working detector* 13/13 (100) 3/10 (30.0) 3.3 (1.3, 8.6) Added at least one working detector 58/203 (28.6) 20/137 (14.6) 2.0 (1.2, 3.1) Poisoning prevention Removed poisons from home 61/202 (30.2) 20/135 (14.7) 2.1 (1.3, 3.2) Disposed of unused medicine 18/202 (8.9) 16/134 (11.9) 0.8 (0.4, 1.4) Earned about poisoning resources 15/203 (7.4) 11/134 (8.2) 0.9 (0.4, 1.9)
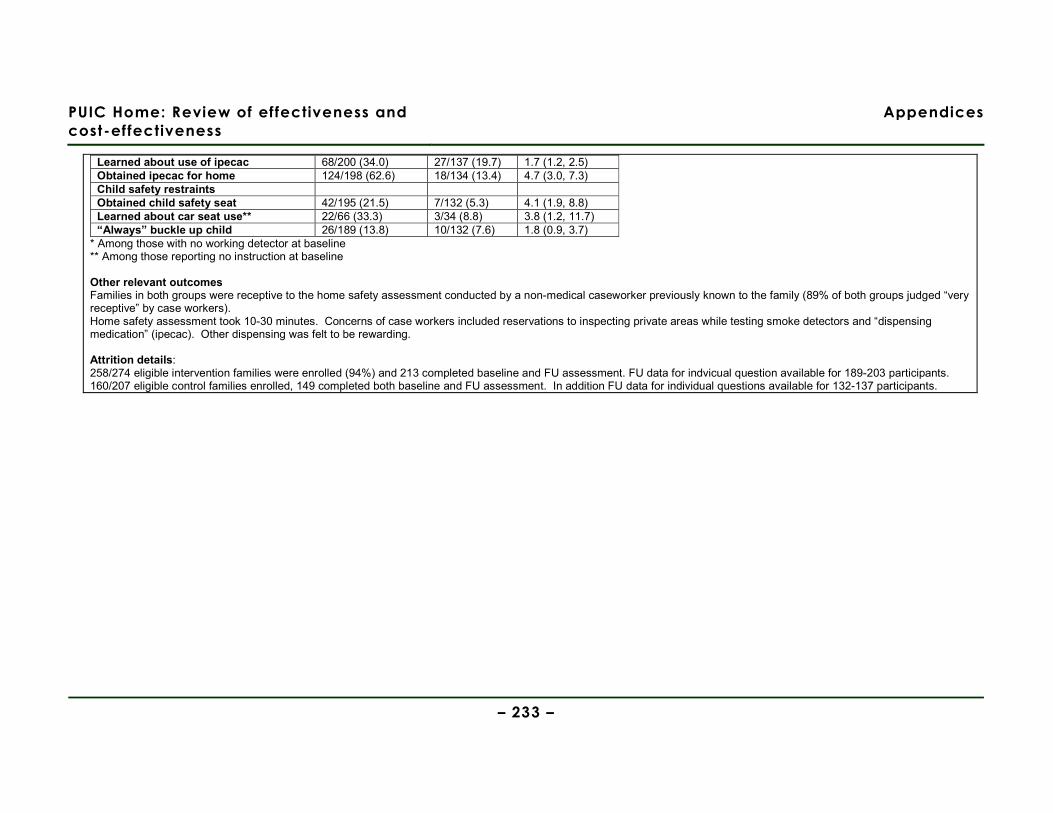
PUIC Home: Review of effectiveness and
cost-effectiveness
Appendices
– 233 –
Learned about use of ipecac 68/200 (34.0) 27/137 (19.7) 1.7 (1.2, 2.5) Obtained ipecac for home 124/198 (62.6) 18/134 (13.4) 4.7 (3.0, 7.3) Child safety restraints Obtained child safety seat 42/195 (21.5) 7/132 (5.3) 4.1 (1.9, 8.8) Learned about car seat use** 22/66 (33.3) 3/34 (8.8) 3.8 (1.2, 11.7) “Always” buckle up child 26/189 (13.8) 10/132 (7.6) 1.8 (0.9, 3.7)
* Among those with no working detector at baseline ** Among those reporting no instruction at baseline Other relevant outcomes Families in both groups were receptive to the home safety assessment conducted by a non-medical caseworker previously known to the family (89% of both groups judged “very receptive” by case workers). Home safety assessment took 10-30 minutes. Concerns of case workers included reservations to inspecting private areas while testing smoke detectors and “dispensing medication” (ipecac). Other dispensing was felt to be rewarding. Attrition details: 258/274 eligible intervention families were enrolled (94%) and 213 completed baseline and FU assessment. FU data for indvicual question available for 189-203 participants. 160/207 eligible control families enrolled, 149 completed both baseline and FU assessment. In addition FU data for individual questions available for 132-137 participants.
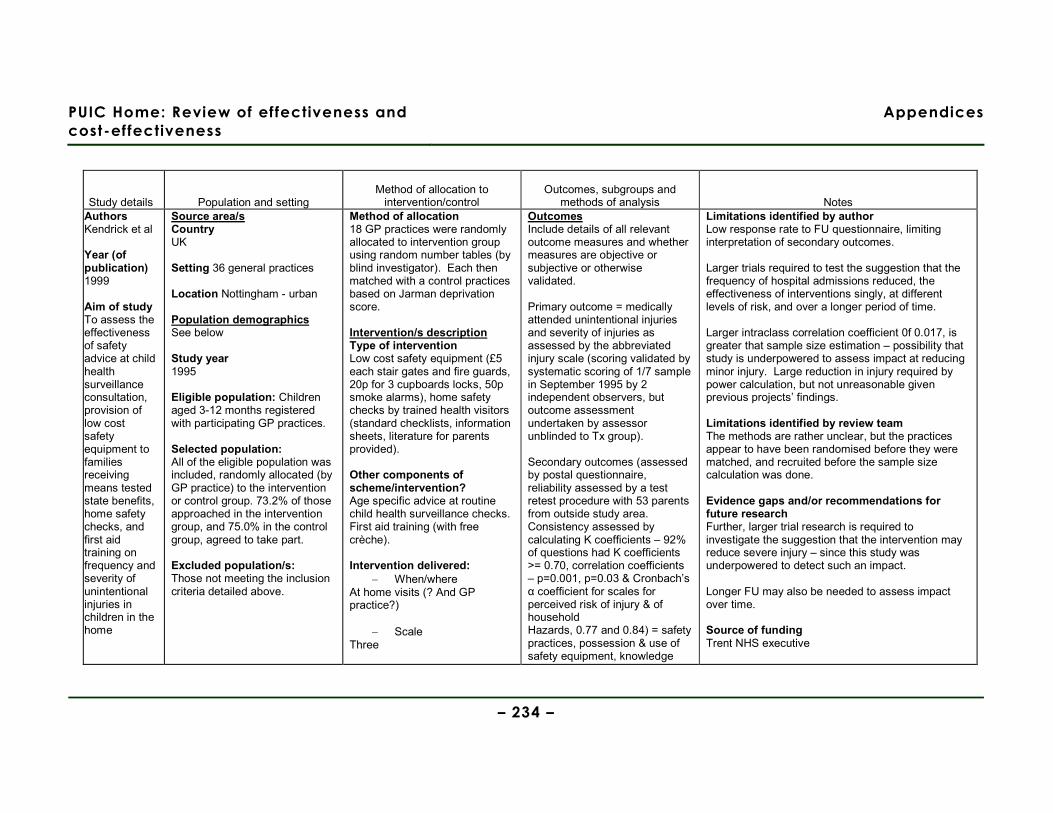
PUIC Home: Review of effectiveness and
cost-effectiveness
Appendices
– 234 –
Study details Population and setting Method of allocation to
intervention/control Outcomes, subgroups and
methods of analysis Notes Authors Kendrick et al Year (of publication) 1999 Aim of study To assess the effectiveness of safety advice at child health surveillance consultation, provision of low cost safety equipment to families receiving means tested state benefits, home safety checks, and first aid training on frequency and severity of unintentional injuries in children in the home
Source area/s Country UK Setting 36 general practices Location Nottingham - urban Population demographics See below Study year 1995 Eligible population: Children aged 3-12 months registered with participating GP practices. Selected population: All of the eligible population was included, randomly allocated (by GP practice) to the intervention or control group. 73.2% of those approached in the intervention group, and 75.0% in the control group, agreed to take part. Excluded population/s: Those not meeting the inclusion criteria detailed above.
Method of allocation 18 GP practices were randomly allocated to intervention group using random number tables (by blind investigator). Each then matched with a control practices based on Jarman deprivation score. Intervention/s description Type of intervention Low cost safety equipment (£5 each stair gates and fire guards, 20p for 3 cupboards locks, 50p smoke alarms), home safety checks by trained health visitors (standard checklists, information sheets, literature for parents provided).
Other components of scheme/intervention? Age specific advice at routine child health surveillance checks. First aid training (with free crèche). Intervention delivered:
− When/where At home visits (? And GP practice?)
− Scale Three
Outcomes Include details of all relevant outcome measures and whether measures are objective or subjective or otherwise validated. Primary outcome = medically attended unintentional injuries and severity of injuries as assessed by the abbreviated injury scale (scoring validated by systematic scoring of 1/7 sample in September 1995 by 2 independent observers, but outcome assessment undertaken by assessor unblinded to Tx group). Secondary outcomes (assessed by postal questionnaire, reliability assessed by a test retest procedure with 53 parents from outside study area. Consistency assessed by calculating K coefficients – 92% of questions had K coefficients >= 0.70, correlation coefficients – p=0.001, p=0.03 & Cronbach’s α coefficient for scales for perceived risk of injury & of household Hazards, 0.77 and 0.84) = safety practices, possession & use of safety equipment, knowledge
Limitations identified by author Low response rate to FU questionnaire, limiting interpretation of secondary outcomes. Larger trials required to test the suggestion that the frequency of hospital admissions reduced, the effectiveness of interventions singly, at different levels of risk, and over a longer period of time. Larger intraclass correlation coefficient 0f 0.017, is greater that sample size estimation – possibility that study is underpowered to assess impact at reducing minor injury. Large reduction in injury required by power calculation, but not unreasonable given previous projects’ findings. Limitations identified by review team The methods are rather unclear, but the practices appear to have been randomised before they were matched, and recruited before the sample size calculation was done. Evidence gaps and/or recommendations for future research Further, larger trial research is required to investigate the suggestion that the intervention may reduce severe injury – since this study was underpowered to detect such an impact. Longer FU may also be needed to assess impact over time. Source of funding Trent NHS executive

PUIC Home: Review of effectiveness and
cost-effectiveness
Appendices
– 235 –
Study details Population and setting Method of allocation to
intervention/control Outcomes, subgroups and
methods of analysis Notes Study design Cluster RCT with matching Internal validity score [++, + or -] ++ External validity score [++, + or -] +
− Intensity NR
− By whom Health visitors and nurses
− How often At 6-9, 18-24 months HV 12-15 months Nurses
− How long for etc NR Control/comparison/s description (as above) Usual care (not defined) Sample sizes Total n= 2119 Intervention ITT = 1100 (baseline data on 823, requested interventions 286, primary outcome data on 1020) Control ITT = 1019 (baseline data on 771; primary outcome data on 960) Baseline comparisons Similar at baseline Study sufficiently powered? Using child as the unit of analysis, determined that 785 children were needed in each arm to show a 25% reduction in A&E dept. attendances based on
and confidence in undertaking first aid. How is the data for each outcome collected? See above Other relevant outcomes N/A Did the study collect data on and report resource use and/or costs No Timing of data collection Injury data 1995-1997. Survey data collected at baseline and 25 months FU. Method of analysis Categorical data analysed by Chi-sq tests and ORs, continuous data and ordinal data by Mann-Whitney U tests. All ITT. Using practice as unit of analysis, mean injury rates compared using sample t test weighted by the number of children in each practice. Using child as unit of analysis, a random effects logistic model, using the MLn macro, was used to allow for clustering.
Did the study collect data on and report information about barriers and facilitators to/of effectiveness? Little Observations from the Discussion section regarding barriers & facilitators Contact with the intervention may encourage more consultations with the doctors, confounding the impact.
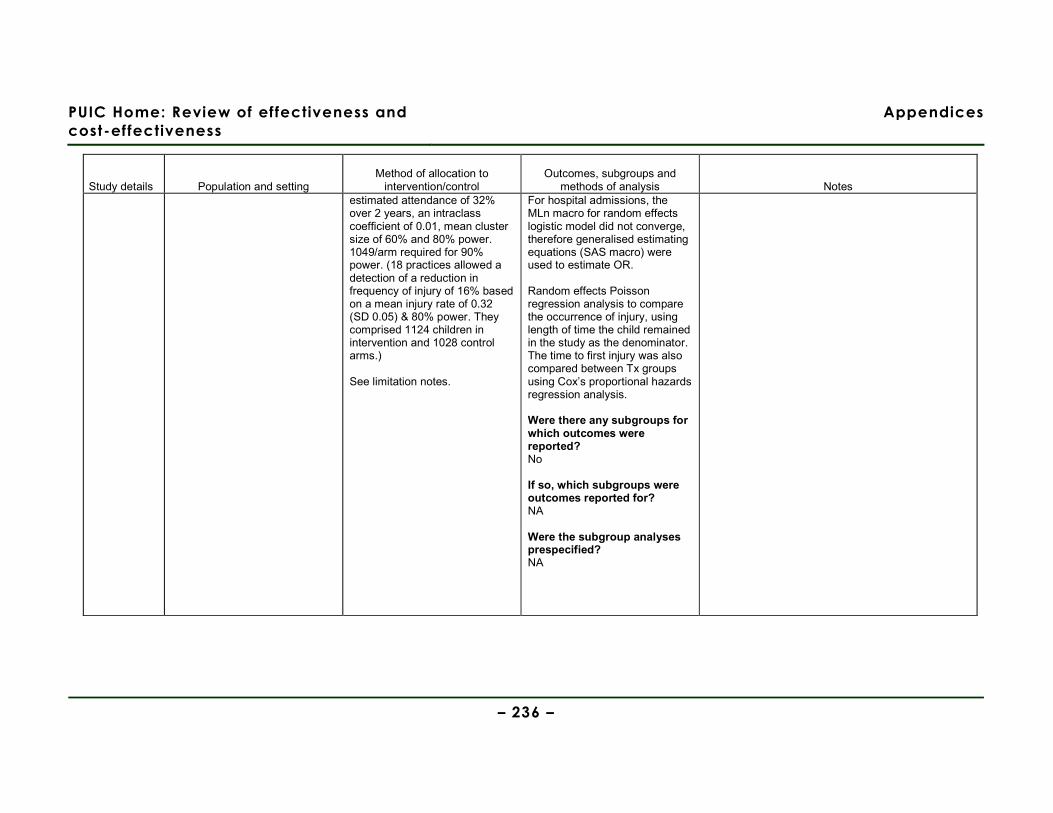
PUIC Home: Review of effectiveness and
cost-effectiveness
Appendices
– 236 –
Study details Population and setting Method of allocation to
intervention/control Outcomes, subgroups and
methods of analysis Notes estimated attendance of 32% over 2 years, an intraclass coefficient of 0.01, mean cluster size of 60% and 80% power. 1049/arm required for 90% power. (18 practices allowed a detection of a reduction in frequency of injury of 16% based on a mean injury rate of 0.32 (SD 0.05) & 80% power. They comprised 1124 children in intervention and 1028 control arms.) See limitation notes.
For hospital admissions, the MLn macro for random effects logistic model did not converge, therefore generalised estimating equations (SAS macro) were used to estimate OR. Random effects Poisson regression analysis to compare the occurrence of injury, using length of time the child remained in the study as the denominator. The time to first injury was also compared between Tx groups using Cox’s proportional hazards regression analysis. Were there any subgroups for which outcomes were reported? No If so, which subgroups were outcomes reported for? NA Were the subgroup analyses prespecified? NA
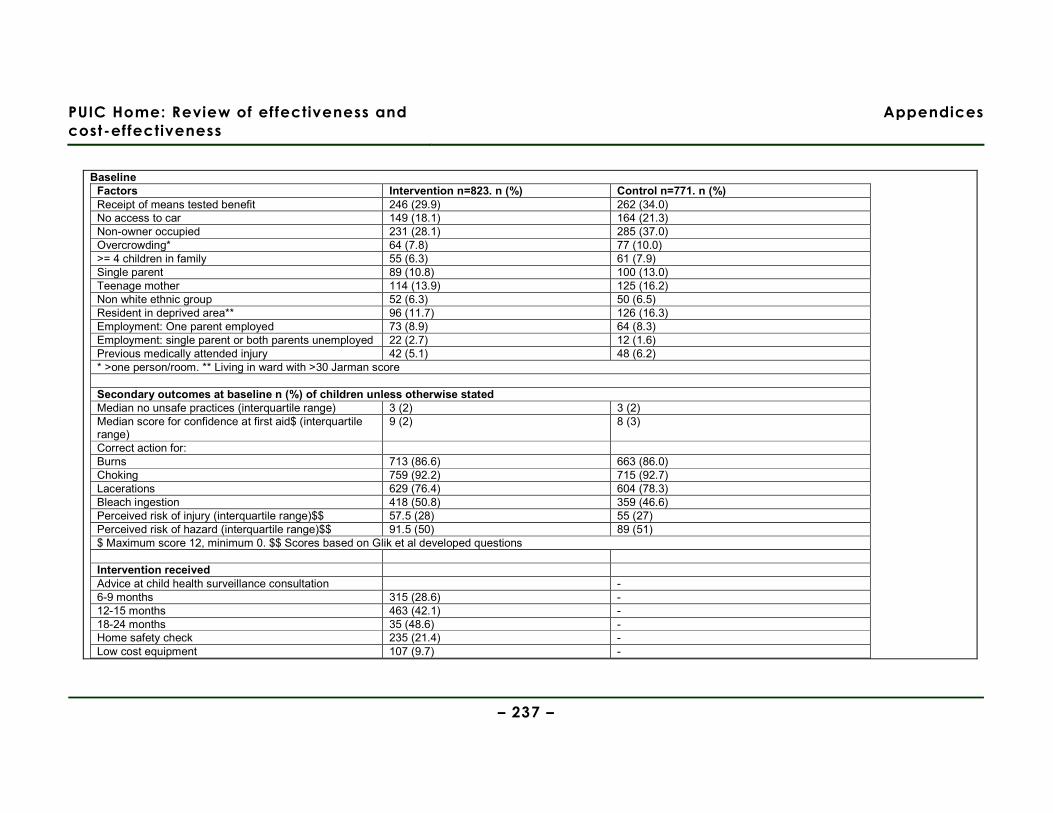
PUIC Home: Review of effectiveness and
cost-effectiveness
Appendices
– 237 –
Baseline
Factors Intervention n=823. n (%) Control n=771. n (%) Receipt of means tested benefit 246 (29.9) 262 (34.0) No access to car 149 (18.1) 164 (21.3) Non-owner occupied 231 (28.1) 285 (37.0) Overcrowding* 64 (7.8) 77 (10.0) >= 4 children in family 55 (6.3) 61 (7.9) Single parent 89 (10.8) 100 (13.0) Teenage mother 114 (13.9) 125 (16.2) Non white ethnic group 52 (6.3) 50 (6.5) Resident in deprived area** 96 (11.7) 126 (16.3) Employment: One parent employed 73 (8.9) 64 (8.3) Employment: single parent or both parents unemployed 22 (2.7) 12 (1.6) Previous medically attended injury 42 (5.1) 48 (6.2) * >one person/room. ** Living in ward with >30 Jarman score Secondary outcomes at baseline n (%) of children unless otherwise stated Median no unsafe practices (interquartile range) 3 (2) 3 (2) Median score for confidence at first aid$ (interquartile range)
9 (2) 8 (3)
Correct action for: Burns 713 (86.6) 663 (86.0) Choking 759 (92.2) 715 (92.7) Lacerations 629 (76.4) 604 (78.3) Bleach ingestion 418 (50.8) 359 (46.6) Perceived risk of injury (interquartile range)$$ 57.5 (28) 55 (27) Perceived risk of hazard (interquartile range)$$ 91.5 (50) 89 (51) $ Maximum score 12, minimum 0. $$ Scores based on Glik et al developed questions Intervention received Advice at child health surveillance consultation - 6-9 months 315 (28.6) - 12-15 months 463 (42.1) - 18-24 months 35 (48.6) - Home safety check 235 (21.4) - Low cost equipment 107 (9.7) -
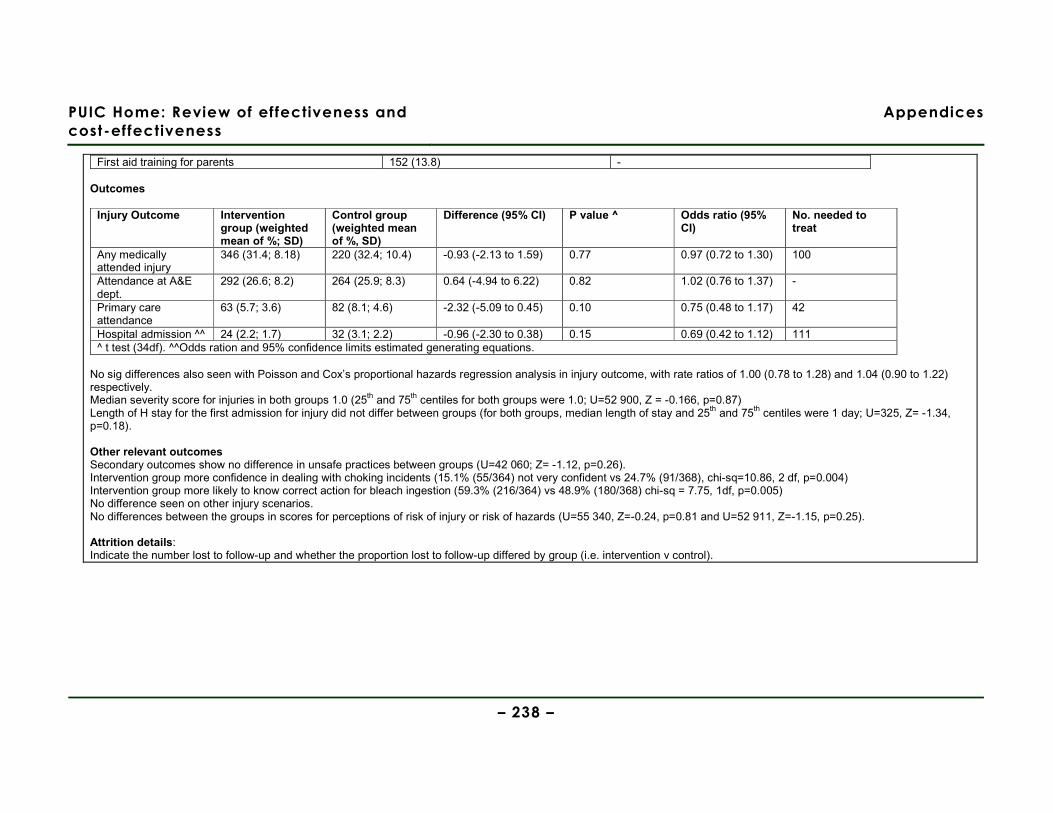
PUIC Home: Review of effectiveness and
cost-effectiveness
Appendices
– 238 –
First aid training for parents 152 (13.8) - Outcomes
Injury Outcome Intervention group (weighted mean of %; SD)
Control group (weighted mean of %, SD)
Difference (95% CI) P value ^ Odds ratio (95% CI)
No. needed to treat
Any medically attended injury
346 (31.4; 8.18) 220 (32.4; 10.4) -0.93 (-2.13 to 1.59) 0.77 0.97 (0.72 to 1.30) 100
Attendance at A&E dept.
292 (26.6; 8.2) 264 (25.9; 8.3) 0.64 (-4.94 to 6.22) 0.82 1.02 (0.76 to 1.37) -
Primary care attendance
63 (5.7; 3.6) 82 (8.1; 4.6) -2.32 (-5.09 to 0.45) 0.10 0.75 (0.48 to 1.17) 42
Hospital admission ^^ 24 (2.2; 1.7) 32 (3.1; 2.2) -0.96 (-2.30 to 0.38) 0.15 0.69 (0.42 to 1.12) 111 ^ t test (34df). ^^Odds ration and 95% confidence limits estimated generating equations.
No sig differences also seen with Poisson and Cox’s proportional hazards regression analysis in injury outcome, with rate ratios of 1.00 (0.78 to 1.28) and 1.04 (0.90 to 1.22) respectively. Median severity score for injuries in both groups 1.0 (25th and 75th centiles for both groups were 1.0; U=52 900, Z = -0.166, p=0.87) Length of H stay for the first admission for injury did not differ between groups (for both groups, median length of stay and 25th and 75th centiles were 1 day; U=325, Z= -1.34, p=0.18). Other relevant outcomes Secondary outcomes show no difference in unsafe practices between groups (U=42 060; Z= -1.12, p=0.26). Intervention group more confidence in dealing with choking incidents (15.1% (55/364) not very confident vs 24.7% (91/368), chi-sq=10.86, 2 df, p=0.004) Intervention group more likely to know correct action for bleach ingestion (59.3% (216/364) vs 48.9% (180/368) chi-sq = 7.75, 1df, p=0.005) No difference seen on other injury scenarios. No differences between the groups in scores for perceptions of risk of injury or risk of hazards (U=55 340, Z=-0.24, p=0.81 and U=52 911, Z=-1.15, p=0.25). Attrition details: Indicate the number lost to follow-up and whether the proportion lost to follow-up differed by group (i.e. intervention v control).
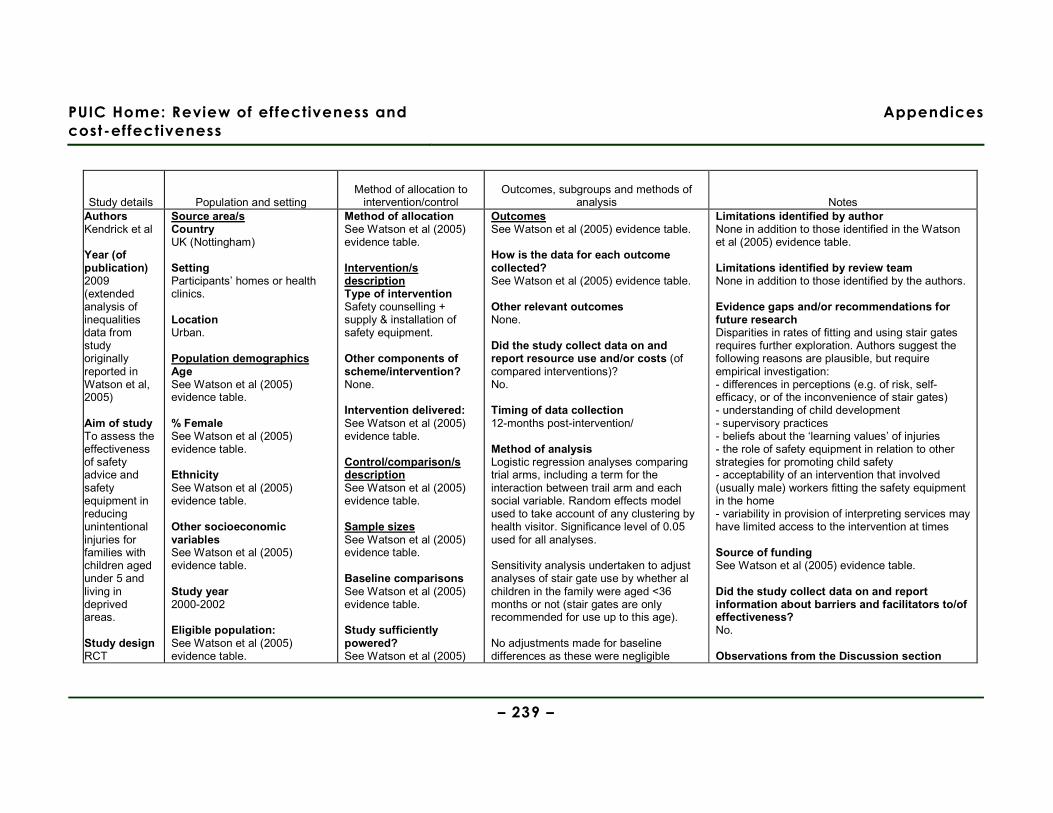
PUIC Home: Review of effectiveness and
cost-effectiveness
Appendices
– 239 –
Study details Population and setting Method of allocation to
intervention/control Outcomes, subgroups and methods of
analysis Notes Authors Kendrick et al Year (of publication) 2009 (extended analysis of inequalities data from study originally reported in Watson et al, 2005)
Aim of study To assess the effectiveness of safety advice and safety equipment in reducing unintentional injuries for families with children aged under 5 and living in deprived areas. Study design RCT
Source area/s Country UK (Nottingham) Setting Participants’ homes or health clinics. Location Urban. Population demographics Age See Watson et al (2005) evidence table. % Female See Watson et al (2005) evidence table. Ethnicity See Watson et al (2005) evidence table. Other socioeconomic variables See Watson et al (2005) evidence table. Study year 2000-2002 Eligible population: See Watson et al (2005) evidence table.
Method of allocation See Watson et al (2005) evidence table. Intervention/s description Type of intervention Safety counselling + supply & installation of safety equipment.
Other components of scheme/intervention? None. Intervention delivered: See Watson et al (2005) evidence table. Control/comparison/s description See Watson et al (2005) evidence table. Sample sizes See Watson et al (2005) evidence table. Baseline comparisons See Watson et al (2005) evidence table. Study sufficiently powered? See Watson et al (2005)
Outcomes See Watson et al (2005) evidence table. How is the data for each outcome collected? See Watson et al (2005) evidence table. Other relevant outcomes None. Did the study collect data on and report resource use and/or costs (of compared interventions)? No. Timing of data collection 12-months post-intervention/ Method of analysis Logistic regression analyses comparing trial arms, including a term for the interaction between trail arm and each social variable. Random effects model used to take account of any clustering by health visitor. Significance level of 0.05 used for all analyses. Sensitivity analysis undertaken to adjust analyses of stair gate use by whether al children in the family were aged <36 months or not (stair gates are only recommended for use up to this age). No adjustments made for baseline differences as these were negligible
Limitations identified by author None in addition to those identified in the Watson et al (2005) evidence table. Limitations identified by review team None in addition to those identified by the authors. Evidence gaps and/or recommendations for future research Disparities in rates of fitting and using stair gates requires further exploration. Authors suggest the following reasons are plausible, but require empirical investigation: - differences in perceptions (e.g. of risk, self-efficacy, or of the inconvenience of stair gates) - understanding of child development - supervisory practices - beliefs about the ‘learning values’ of injuries - the role of safety equipment in relation to other strategies for promoting child safety - acceptability of an intervention that involved (usually male) workers fitting the safety equipment in the home - variability in provision of interpreting services may have limited access to the intervention at times Source of funding See Watson et al (2005) evidence table. Did the study collect data on and report information about barriers and facilitators to/of effectiveness? No. Observations from the Discussion section
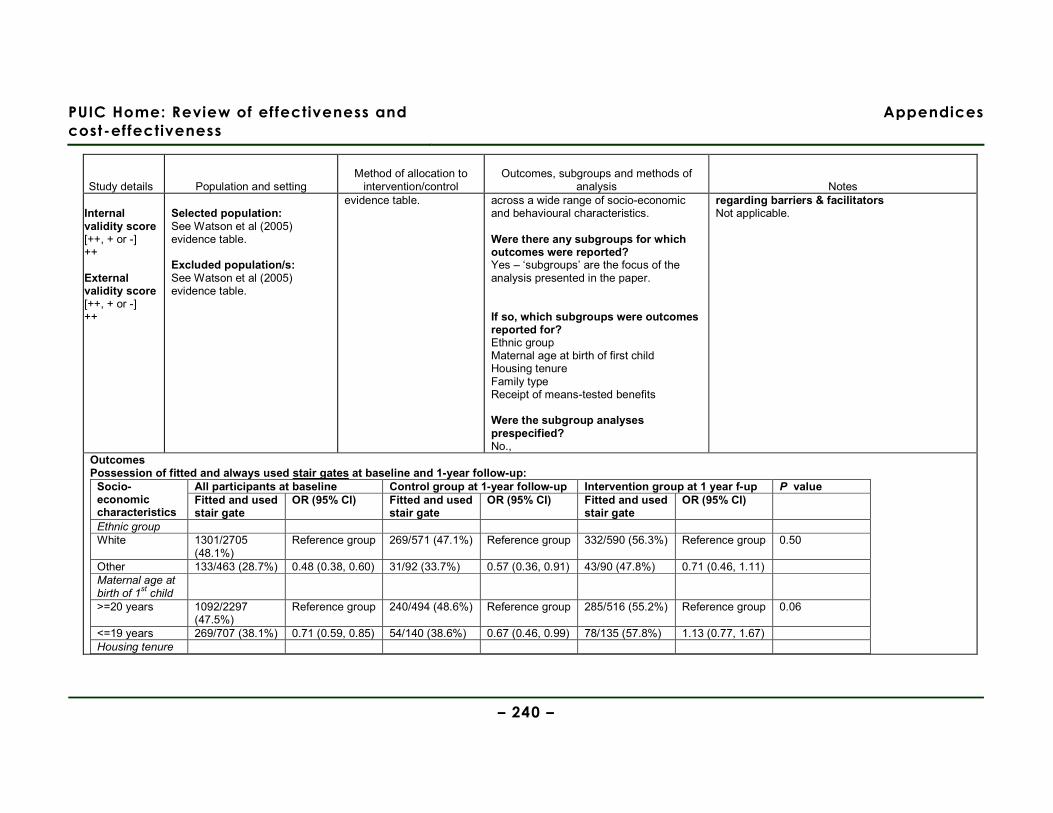
PUIC Home: Review of effectiveness and
cost-effectiveness
Appendices
– 240 –
Study details Population and setting Method of allocation to
intervention/control Outcomes, subgroups and methods of
analysis Notes Internal validity score [++, + or -] ++ External validity score [++, + or -] ++
Selected population: See Watson et al (2005) evidence table. Excluded population/s: See Watson et al (2005) evidence table.
evidence table.
across a wide range of socio-economic and behavioural characteristics. Were there any subgroups for which outcomes were reported? Yes – ‘subgroups’ are the focus of the analysis presented in the paper. If so, which subgroups were outcomes reported for? Ethnic group Maternal age at birth of first child Housing tenure Family type Receipt of means-tested benefits Were the subgroup analyses prespecified? No.,
regarding barriers & facilitators Not applicable.
Outcomes Possession of fitted and always used stair gates at baseline and 1-year follow-up:
All participants at baseline Control group at 1-year follow-up Intervention group at 1 year f-up P value Socio-economic characteristics
Fitted and used stair gate
OR (95% CI) Fitted and used stair gate
OR (95% CI) Fitted and used stair gate
OR (95% CI)
Ethnic group White 1301/2705
(48.1%) Reference group 269/571 (47.1%) Reference group 332/590 (56.3%) Reference group 0.50
Other 133/463 (28.7%) 0.48 (0.38, 0.60) 31/92 (33.7%) 0.57 (0.36, 0.91) 43/90 (47.8%) 0.71 (0.46, 1.11) Maternal age at birth of 1
st child
>=20 years 1092/2297 (47.5%)
Reference group 240/494 (48.6%) Reference group 285/516 (55.2%) Reference group 0.06
<=19 years 269/707 (38.1%) 0.71 (0.59, 0.85) 54/140 (38.6%) 0.67 (0.46, 0.99) 78/135 (57.8%) 1.13 (0.77, 1.67) Housing tenure
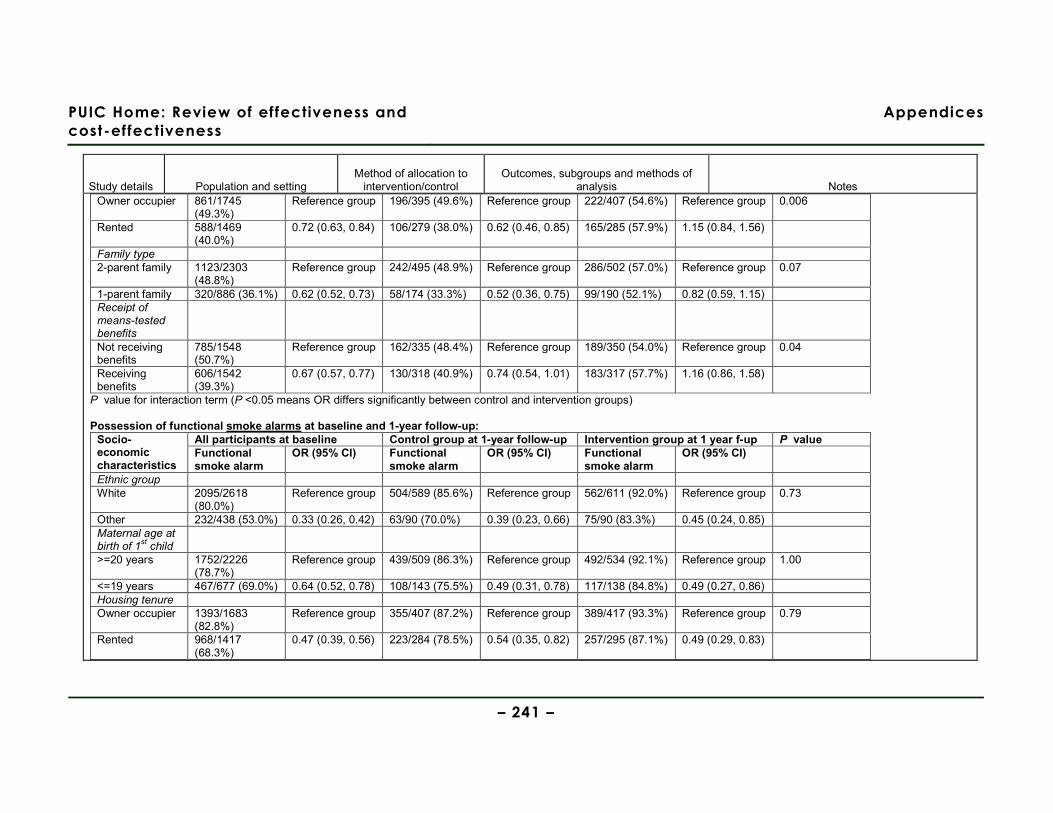
PUIC Home: Review of effectiveness and
cost-effectiveness
Appendices
– 241 –
Study details Population and setting Method of allocation to
intervention/control Outcomes, subgroups and methods of
analysis Notes Owner occupier 861/1745
(49.3%) Reference group 196/395 (49.6%) Reference group 222/407 (54.6%) Reference group 0.006
Rented 588/1469 (40.0%)
0.72 (0.63, 0.84) 106/279 (38.0%) 0.62 (0.46, 0.85) 165/285 (57.9%) 1.15 (0.84, 1.56)
Family type 2-parent family 1123/2303
(48.8%) Reference group 242/495 (48.9%) Reference group 286/502 (57.0%) Reference group 0.07
1-parent family 320/886 (36.1%) 0.62 (0.52, 0.73) 58/174 (33.3%) 0.52 (0.36, 0.75) 99/190 (52.1%) 0.82 (0.59, 1.15) Receipt of means-tested benefits
Not receiving benefits
785/1548 (50.7%)
Reference group 162/335 (48.4%) Reference group 189/350 (54.0%) Reference group 0.04
Receiving benefits
606/1542 (39.3%)
0.67 (0.57, 0.77) 130/318 (40.9%) 0.74 (0.54, 1.01) 183/317 (57.7%) 1.16 (0.86, 1.58)
P value for interaction term (P <0.05 means OR differs significantly between control and intervention groups) Possession of functional smoke alarms at baseline and 1-year follow-up:
All participants at baseline Control group at 1-year follow-up Intervention group at 1 year f-up P value Socio-economic characteristics
Functional smoke alarm
OR (95% CI) Functional smoke alarm
OR (95% CI) Functional smoke alarm
OR (95% CI)
Ethnic group White 2095/2618
(80.0%) Reference group 504/589 (85.6%) Reference group 562/611 (92.0%) Reference group 0.73
Other 232/438 (53.0%) 0.33 (0.26, 0.42) 63/90 (70.0%) 0.39 (0.23, 0.66) 75/90 (83.3%) 0.45 (0.24, 0.85) Maternal age at birth of 1
st child
>=20 years 1752/2226 (78.7%)
Reference group 439/509 (86.3%) Reference group 492/534 (92.1%) Reference group 1.00
<=19 years 467/677 (69.0%) 0.64 (0.52, 0.78) 108/143 (75.5%) 0.49 (0.31, 0.78) 117/138 (84.8%) 0.49 (0.27, 0.86) Housing tenure Owner occupier 1393/1683
(82.8%) Reference group 355/407 (87.2%) Reference group 389/417 (93.3%) Reference group 0.79
Rented 968/1417 (68.3%)
0.47 (0.39, 0.56) 223/284 (78.5%) 0.54 (0.35, 0.82) 257/295 (87.1%) 0.49 (0.29, 0.83)
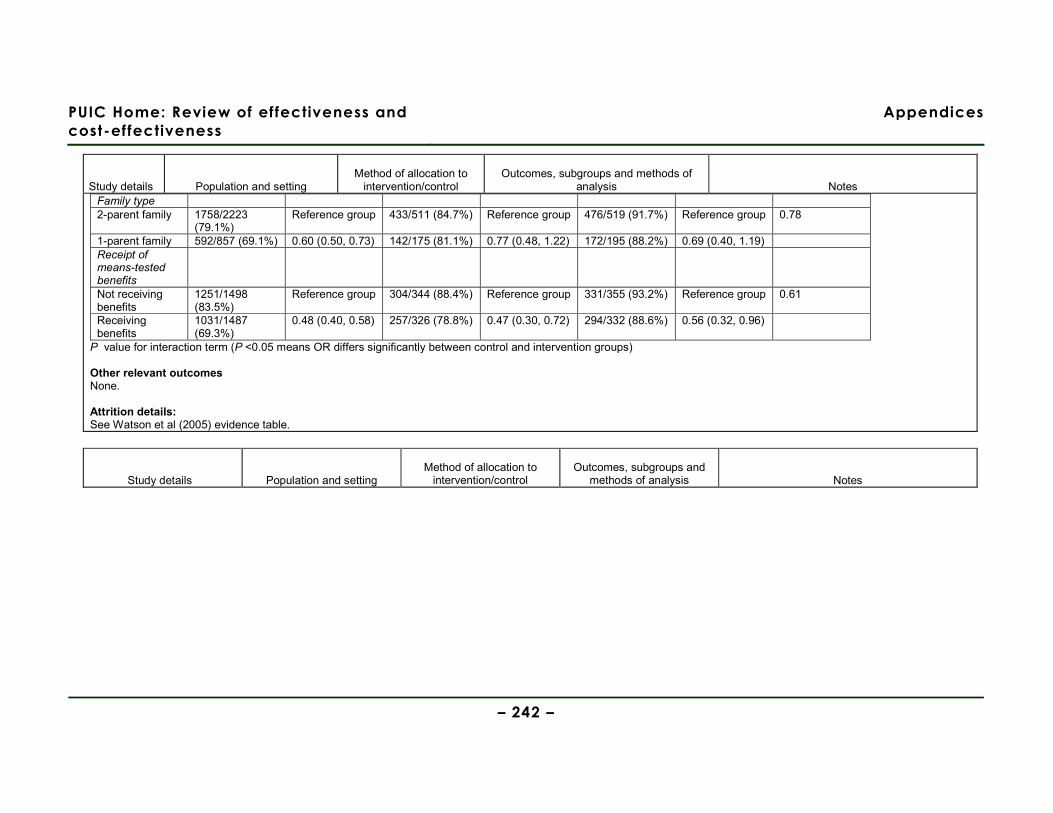
PUIC Home: Review of effectiveness and
cost-effectiveness
Appendices
– 242 –
Study details Population and setting Method of allocation to
intervention/control Outcomes, subgroups and methods of
analysis Notes Family type 2-parent family 1758/2223
(79.1%) Reference group 433/511 (84.7%) Reference group 476/519 (91.7%) Reference group 0.78
1-parent family 592/857 (69.1%) 0.60 (0.50, 0.73) 142/175 (81.1%) 0.77 (0.48, 1.22) 172/195 (88.2%) 0.69 (0.40, 1.19) Receipt of means-tested benefits
Not receiving benefits
1251/1498 (83.5%)
Reference group 304/344 (88.4%) Reference group 331/355 (93.2%) Reference group 0.61
Receiving benefits
1031/1487 (69.3%)
0.48 (0.40, 0.58) 257/326 (78.8%) 0.47 (0.30, 0.72) 294/332 (88.6%) 0.56 (0.32, 0.96)
P value for interaction term (P <0.05 means OR differs significantly between control and intervention groups) Other relevant outcomes None. Attrition details: See Watson et al (2005) evidence table.
Study details Population and setting Method of allocation to
intervention/control Outcomes, subgroups and
methods of analysis Notes
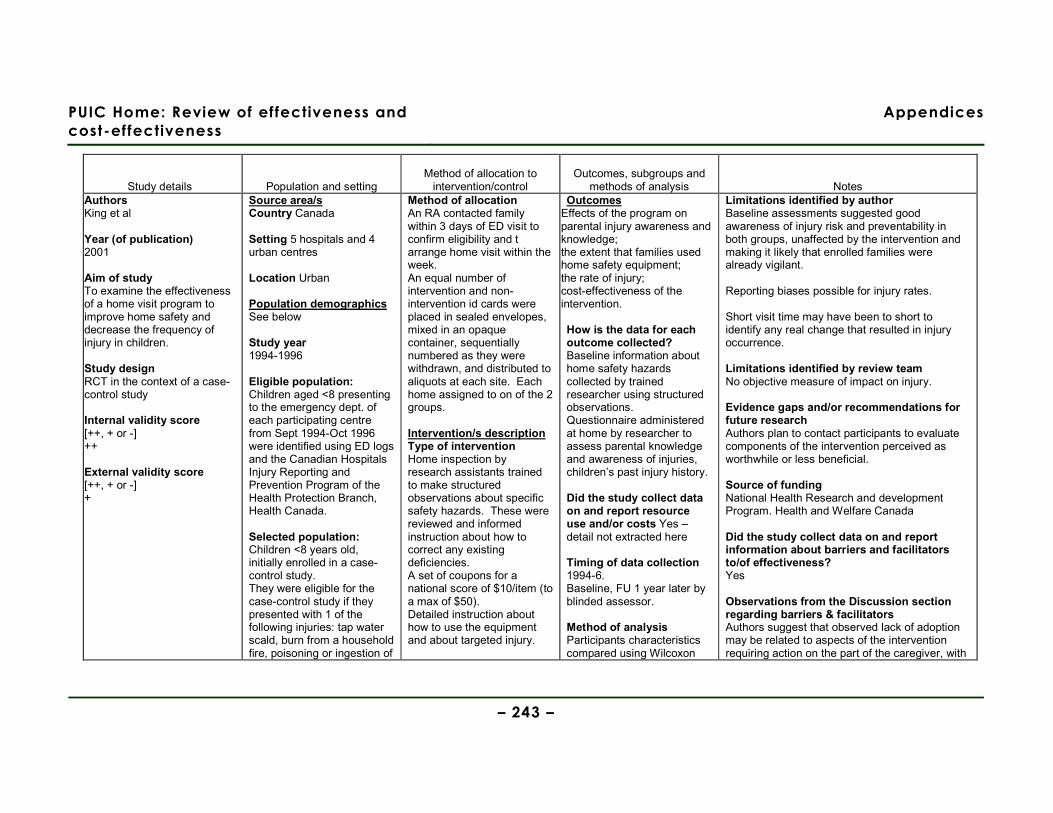
PUIC Home: Review of effectiveness and
cost-effectiveness
Appendices
– 243 –
Study details Population and setting Method of allocation to
intervention/control Outcomes, subgroups and
methods of analysis Notes Authors King et al Year (of publication) 2001 Aim of study To examine the effectiveness of a home visit program to improve home safety and decrease the frequency of injury in children. Study design RCT in the context of a case-control study Internal validity score [++, + or -] ++ External validity score [++, + or -] +
Source area/s Country Canada Setting 5 hospitals and 4 urban centres Location Urban Population demographics See below Study year 1994-1996 Eligible population: Children aged <8 presenting to the emergency dept. of each participating centre from Sept 1994-Oct 1996 were identified using ED logs and the Canadian Hospitals Injury Reporting and Prevention Program of the Health Protection Branch, Health Canada. Selected population: Children <8 years old, initially enrolled in a case-control study. They were eligible for the case-control study if they presented with 1 of the following injuries: tap water scald, burn from a household fire, poisoning or ingestion of
Method of allocation An RA contacted family within 3 days of ED visit to confirm eligibility and t arrange home visit within the week. An equal number of intervention and non-intervention id cards were placed in sealed envelopes, mixed in an opaque container, sequentially numbered as they were withdrawn, and distributed to aliquots at each site. Each home assigned to on of the 2 groups. Intervention/s description Type of intervention Home inspection by research assistants trained to make structured observations about specific safety hazards. These were reviewed and informed instruction about how to correct any existing deficiencies. A set of coupons for a national score of $10/item (to a max of $50). Detailed instruction about how to use the equipment and about targeted injury.
Outcomes Effects of the program on parental injury awareness and knowledge; the extent that families used home safety equipment; the rate of injury; cost-effectiveness of the intervention. How is the data for each outcome collected? Baseline information about home safety hazards collected by trained researcher using structured observations. Questionnaire administered at home by researcher to assess parental knowledge and awareness of injuries, children’s past injury history. Did the study collect data on and report resource use and/or costs Yes – detail not extracted here Timing of data collection 1994-6. Baseline, FU 1 year later by blinded assessor. Method of analysis Participants characteristics compared using Wilcoxon
Limitations identified by author Baseline assessments suggested good awareness of injury risk and preventability in both groups, unaffected by the intervention and making it likely that enrolled families were already vigilant. Reporting biases possible for injury rates. Short visit time may have been to short to identify any real change that resulted in injury occurrence. Limitations identified by review team No objective measure of impact on injury. Evidence gaps and/or recommendations for future research Authors plan to contact participants to evaluate components of the intervention perceived as worthwhile or less beneficial. Source of funding National Health Research and development Program. Health and Welfare Canada Did the study collect data on and report information about barriers and facilitators to/of effectiveness? Yes Observations from the Discussion section regarding barriers & facilitators Authors suggest that observed lack of adoption may be related to aspects of the intervention requiring action on the part of the caregiver, with

PUIC Home: Review of effectiveness and
cost-effectiveness
Appendices
– 244 –
Study details Population and setting Method of allocation to
intervention/control Outcomes, subgroups and
methods of analysis Notes a foreign object. Fracture, sprain, strain, cut or bruise from a fall from a height, head injury while riding a bicycle. 2 controls, matched for gender within 6 months of age, were selected for each target case. The first was selected with a non targeted injury (ie one occurring outside the home or a home injury not listed) the 2nd control was chosen form the patients with a medical illness presenting at the same ED. Consent for the RCT was ob trained after the baseline visit to assess home safety and parental knowledge. Excluded population/s: Those not meeting the inclusion criteria.
Other components of scheme/intervention? Provision of an information package on injury prevention. FU calls at 4 and 8 months. Intervention delivered:
− When/where At home, within 1 week of the ED visit.
− Scale Structured observations about home safety and questionnaire administered. Timing not reported
− Intensity 2 visits of < 1hr. FU phone call 4-8 months after initial visit.
− By whom Research assistant
− How often Twice – baseline and one year later, plus the 2 phone calls and 1 letter reminding families about how the importance of maintaining preventative behaviours. Control/comparison/s description Received a general pamphlet about home safety. The observation about
rank sum test for ordinal and interval data and chi-sq test for categorical variables. Drop outs and completers compared for differences in baseline characteristics. Injury knowledge and awareness compared using analysis of variance (including intervention, centre, and their interaction) with the dependent variable at 1 yr expressed as % of baseline score. Least square estimates of intervention effect were derived from the fitted models. Standard residual diagnostics were used for model goodness of fit. Likelihood of adopting a given prevention strategy compared using the desired outcomes of a reduction in potential hazards in various home areas targeted by the intervention. Each outcome was calculated separately, taking into account its baseline hazard rate, intervention, centre, mechanism of injury, age, and gender using logistic regression models.
passive and active changes required. Passive activities (not requiring repeated action) are easier to adopt than active ones. Parental vigilance and responsibility demanded by more active measures are notoriously difficult to motivate. Easily installed devices (lowering hot water temperature) more likely to be used than more difficult ones (monitoring small object accessibility). Successful home visit programs are characterised by the establishment of a strong therapeutic relationship developed over frequent visits to address underlying factors associated with maternal and child health outcomes.
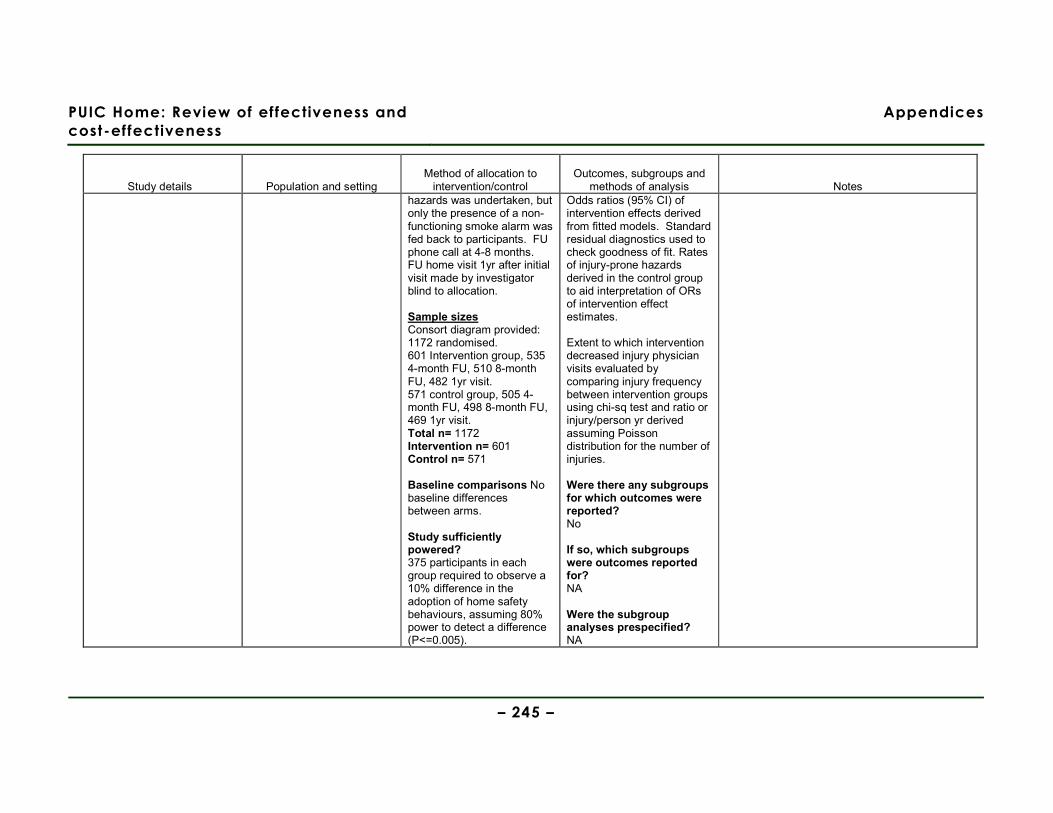
PUIC Home: Review of effectiveness and
cost-effectiveness
Appendices
– 245 –
Study details Population and setting Method of allocation to
intervention/control Outcomes, subgroups and
methods of analysis Notes hazards was undertaken, but only the presence of a non-functioning smoke alarm was fed back to participants. FU phone call at 4-8 months. FU home visit 1yr after initial visit made by investigator blind to allocation. Sample sizes Consort diagram provided: 1172 randomised. 601 Intervention group, 535 4-month FU, 510 8-month FU, 482 1yr visit. 571 control group, 505 4-month FU, 498 8-month FU, 469 1yr visit. Total n= 1172 Intervention n= 601 Control n= 571 Baseline comparisons No baseline differences between arms. Study sufficiently powered? 375 participants in each group required to observe a 10% difference in the adoption of home safety behaviours, assuming 80% power to detect a difference (P<=0.005).
Odds ratios (95% CI) of intervention effects derived from fitted models. Standard residual diagnostics used to check goodness of fit. Rates of injury-prone hazards derived in the control group to aid interpretation of ORs of intervention effect estimates. Extent to which intervention decreased injury physician visits evaluated by comparing injury frequency between intervention groups using chi-sq test and ratio or injury/person yr derived assuming Poisson distribution for the number of injuries. Were there any subgroups for which outcomes were reported? No If so, which subgroups were outcomes reported for? NA Were the subgroup analyses prespecified? NA
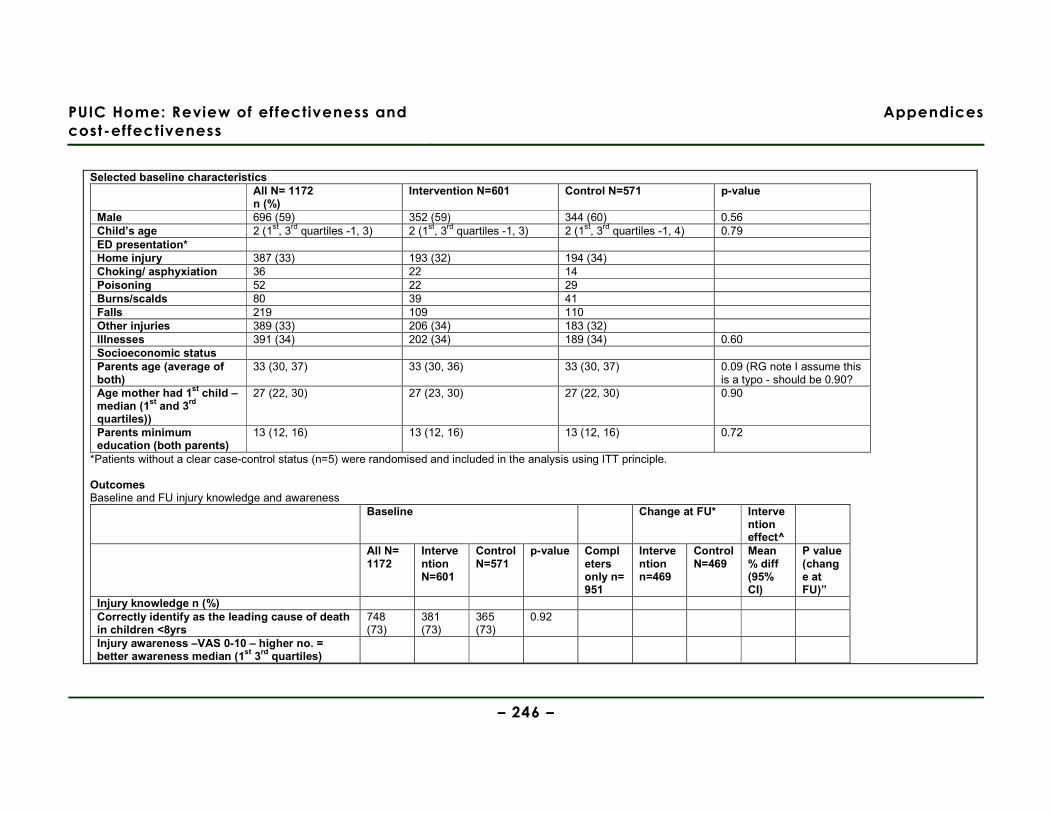
PUIC Home: Review of effectiveness and
cost-effectiveness
Appendices
– 246 –
Selected baseline characteristics
All N= 1172 n (%)
Intervention N=601 Control N=571 p-value
Male 696 (59) 352 (59) 344 (60) 0.56 Child’s age 2 (1st, 3rd quartiles -1, 3) 2 (1st, 3rd quartiles -1, 3) 2 (1st, 3rd quartiles -1, 4) 0.79 ED presentation* Home injury 387 (33) 193 (32) 194 (34) Choking/ asphyxiation 36 22 14 Poisoning 52 22 29 Burns/scalds 80 39 41 Falls 219 109 110 Other injuries 389 (33) 206 (34) 183 (32) Illnesses 391 (34) 202 (34) 189 (34) 0.60 Socioeconomic status Parents age (average of both)
33 (30, 37) 33 (30, 36) 33 (30, 37) 0.09 (RG note I assume this is a typo - should be 0.90?
Age mother had 1st child – median (1st and 3rd quartiles))
27 (22, 30) 27 (23, 30) 27 (22, 30) 0.90
Parents minimum education (both parents)
13 (12, 16) 13 (12, 16) 13 (12, 16) 0.72
*Patients without a clear case-control status (n=5) were randomised and included in the analysis using ITT principle. Outcomes Baseline and FU injury knowledge and awareness
Baseline Change at FU* Intervention effect^
All N= 1172
Intervention N=601
Control N=571
p-value Completers only n= 951
Intervention n=469
Control N=469
Mean % diff (95% CI)
P value (change at FU)”
Injury knowledge n (%) Correctly identify as the leading cause of death in children <8yrs
748 (73)
381 (73)
365 (73)
0.92
Injury awareness –VAS 0-10 – higher no. = better awareness median (1st 3rd quartiles)
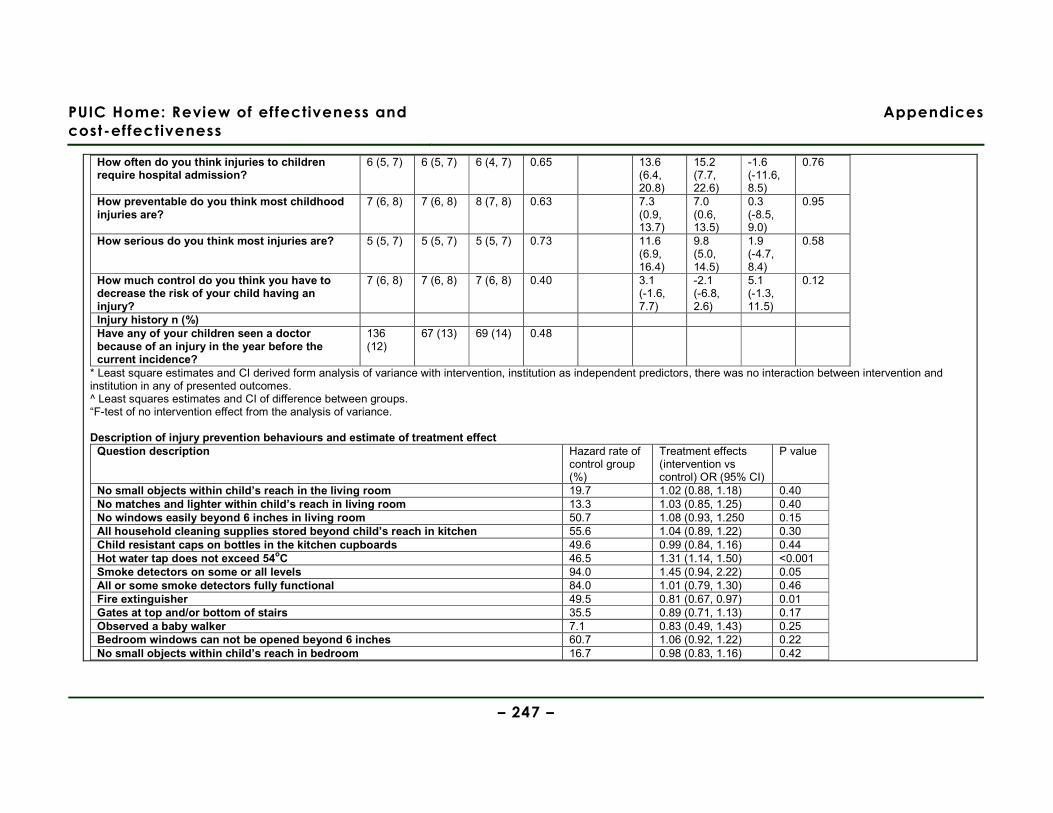
PUIC Home: Review of effectiveness and
cost-effectiveness
Appendices
– 247 –
How often do you think injuries to children require hospital admission?
6 (5, 7) 6 (5, 7) 6 (4, 7) 0.65 13.6 (6.4, 20.8)
15.2 (7.7, 22.6)
-1.6 (-11.6, 8.5)
0.76
How preventable do you think most childhood injuries are?
7 (6, 8) 7 (6, 8) 8 (7, 8) 0.63 7.3 (0.9, 13.7)
7.0 (0.6, 13.5)
0.3 (-8.5, 9.0)
0.95
How serious do you think most injuries are? 5 (5, 7) 5 (5, 7) 5 (5, 7) 0.73 11.6 (6.9, 16.4)
9.8 (5.0, 14.5)
1.9 (-4.7, 8.4)
0.58
How much control do you think you have to decrease the risk of your child having an injury?
7 (6, 8) 7 (6, 8) 7 (6, 8) 0.40 3.1 (-1.6, 7.7)
-2.1 (-6.8, 2.6)
5.1 (-1.3, 11.5)
0.12
Injury history n (%) Have any of your children seen a doctor because of an injury in the year before the current incidence?
136 (12)
67 (13) 69 (14) 0.48
* Least square estimates and CI derived form analysis of variance with intervention, institution as independent predictors, there was no interaction between intervention and institution in any of presented outcomes. ^ Least squares estimates and CI of difference between groups. “F-test of no intervention effect from the analysis of variance. Description of injury prevention behaviours and estimate of treatment effect
Question description Hazard rate of control group (%)
Treatment effects (intervention vs control) OR (95% CI)
P value
No small objects within child’s reach in the living room 19.7 1.02 (0.88, 1.18) 0.40 No matches and lighter within child’s reach in living room 13.3 1.03 (0.85, 1.25) 0.40 No windows easily beyond 6 inches in living room 50.7 1.08 (0.93, 1.250 0.15 All household cleaning supplies stored beyond child’s reach in kitchen 55.6 1.04 (0.89, 1.22) 0.30 Child resistant caps on bottles in the kitchen cupboards 49.6 0.99 (0.84, 1.16) 0.44 Hot water tap does not exceed 54oC 46.5 1.31 (1.14, 1.50) <0.001 Smoke detectors on some or all levels 94.0 1.45 (0.94, 2.22) 0.05 All or some smoke detectors fully functional 84.0 1.01 (0.79, 1.30) 0.46 Fire extinguisher 49.5 0.81 (0.67, 0.97) 0.01 Gates at top and/or bottom of stairs 35.5 0.89 (0.71, 1.13) 0.17 Observed a baby walker 7.1 0.83 (0.49, 1.43) 0.25 Bedroom windows can not be opened beyond 6 inches 60.7 1.06 (0.92, 1.22) 0.22 No small objects within child’s reach in bedroom 16.7 0.98 (0.83, 1.16) 0.42
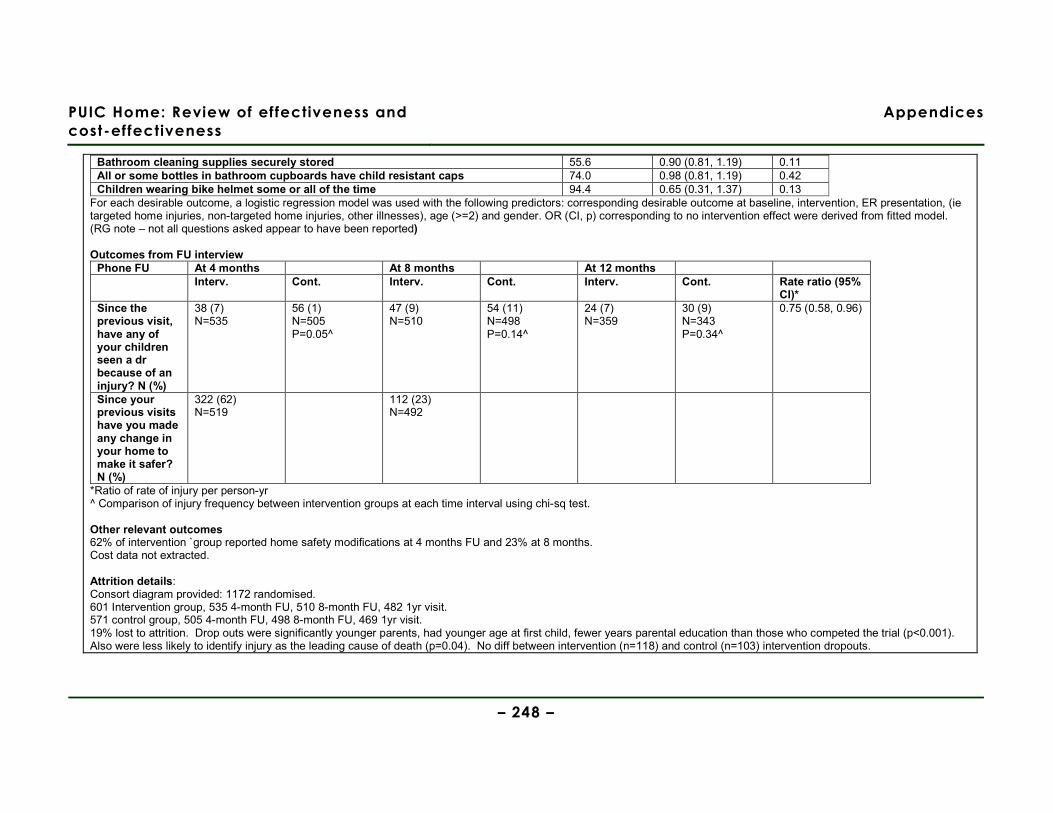
PUIC Home: Review of effectiveness and
cost-effectiveness
Appendices
– 248 –
Bathroom cleaning supplies securely stored 55.6 0.90 (0.81, 1.19) 0.11 All or some bottles in bathroom cupboards have child resistant caps 74.0 0.98 (0.81, 1.19) 0.42 Children wearing bike helmet some or all of the time 94.4 0.65 (0.31, 1.37) 0.13
For each desirable outcome, a logistic regression model was used with the following predictors: corresponding desirable outcome at baseline, intervention, ER presentation, (ie targeted home injuries, non-targeted home injuries, other illnesses), age (>=2) and gender. OR (CI, p) corresponding to no intervention effect were derived from fitted model. (RG note – not all questions asked appear to have been reported) Outcomes from FU interview
Phone FU At 4 months At 8 months At 12 months Interv. Cont. Interv. Cont. Interv. Cont. Rate ratio (95%
CI)* Since the previous visit, have any of your children seen a dr because of an injury? N (%)
38 (7) N=535
56 (1) N=505 P=0.05^
47 (9) N=510
54 (11) N=498 P=0.14^
24 (7) N=359
30 (9) N=343 P=0.34^
0.75 (0.58, 0.96)
Since your previous visits have you made any change in your home to make it safer? N (%)
322 (62) N=519
112 (23) N=492
*Ratio of rate of injury per person-yr ^ Comparison of injury frequency between intervention groups at each time interval using chi-sq test. Other relevant outcomes 62% of intervention `group reported home safety modifications at 4 months FU and 23% at 8 months. Cost data not extracted. Attrition details: Consort diagram provided: 1172 randomised. 601 Intervention group, 535 4-month FU, 510 8-month FU, 482 1yr visit. 571 control group, 505 4-month FU, 498 8-month FU, 469 1yr visit. 19% lost to attrition. Drop outs were significantly younger parents, had younger age at first child, fewer years parental education than those who competed the trial (p<0.001). Also were less likely to identify injury as the leading cause of death (p=0.04). No diff between intervention (n=118) and control (n=103) intervention dropouts.

PUIC Home: Review of effectiveness and
cost-effectiveness
Appendices
– 249 –
Study details Population and setting Method of allocation to
intervention/control Outcomes, subgroups and methods of
analysis Notes Authors King et al Year (of publication) 2005 (follow-up of King et al 2001)
Aim of study To assess the long-term effect of a home safety visit on the rate of home injury Study design RCT Internal validity score [++, + or -] ++ External validity score [++, + or -] +
Source area/s Country Canada Setting 5 paediatric teaching hospitals in 4 urban centres Location Urban Population demographics Age See King et al (2001) evidence table % Female See King et al (2001) evidence table Ethnicity Not reported Other socioeconomic variables See King et al (2001) evidence table Study year 1994-1996 (36 month follow-up of study) Eligible population: See King et al (2001) evidence table
Method of allocation See King et al (2001) evidence table Intervention/s description Type of intervention See King et al (2001) evidence table
Other components of scheme/intervention? See King et al (2001) evidence table Intervention delivered: See King et al (2001) evidence table Control/comparison/s description See King et al (2001) evidence table Sample sizes Total n= 1172 Intervention n= 601 Control n= 571 Baseline comparisons See King et al (2001) evidence table
Outcomes Safety knowledge and practices Injuries (self-reported) How is the data for each outcome collected? Structured telephone interview using the following questions: 1) Since the last home visit, have any of your children gone to the emergency department because of an injury? 2) Since the last home visit, have you made any changes to make your home safer? 3) Which of the following had the greatest impact on your knowledge and practices?: participation in this study, media, advice from family or friends, family doctor, or other sources. 4) How much did each of the following items change your knowledge, beliefs or practices around the prevention of home injuries? (safety equipment discount coupons, home visits, pamphlets, phone calls) 5) On a scale of 1 to 10: a) How preventable do you think most children’s injuries are? b) How much control do you think you have to decrease the risk of your child having an accident? Other relevant outcomes None
Limitations identified by author Self-report of injuries subject to recall bias. Interviewers were blinded to arm allocation, but participants had been made aware of their allocation upon the completion of the original trial. High attrition rate (34%), despite at least 5 attempts being made to contact each participant. Limitations identified by review team Telephone interview not validated. Reliance on self-reported changes in behaviour and perceived usefulness of different intervention components is subject to social desirability bias on part of participants. Evidence gaps and/or recommendations for future research Suggest evaluation programmes where >1 home visit is made. Source of funding National Health Research and Development Programme, Health and Welfare Canada Did the study collect data on and report information about barriers and facilitators to/of effectiveness? No. Observations from the Discussion section regarding barriers & facilitators Participants were more willing to follow through
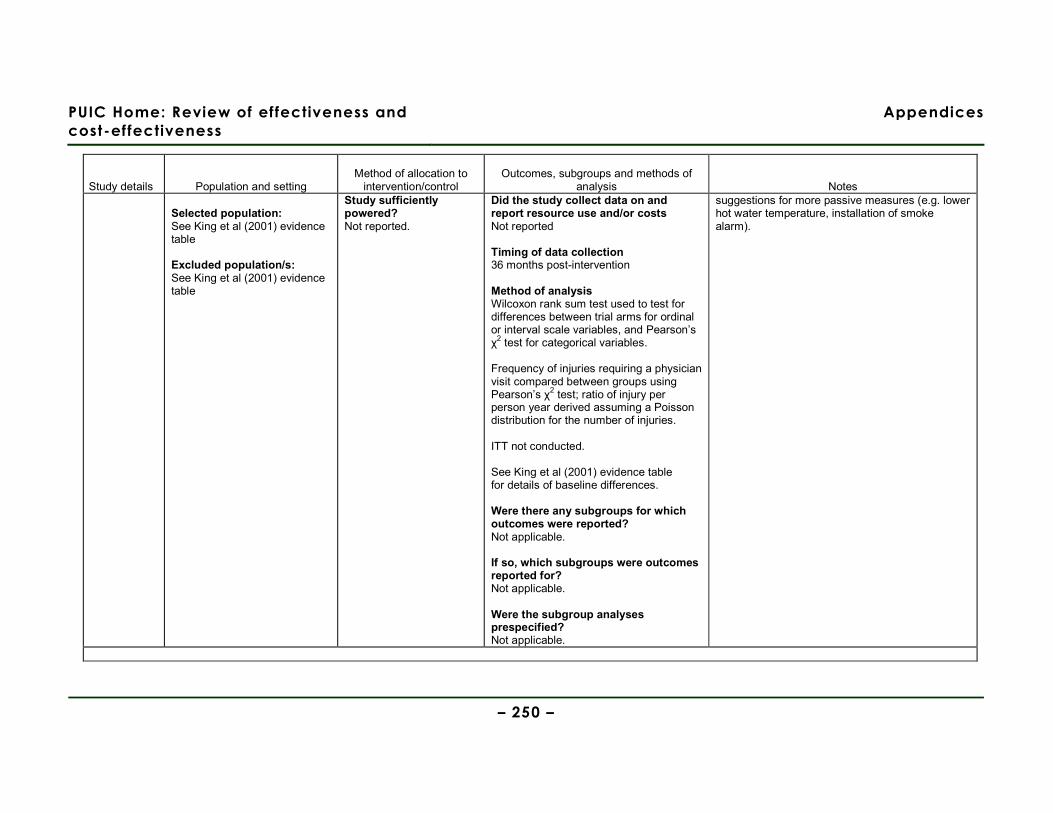
PUIC Home: Review of effectiveness and
cost-effectiveness
Appendices
– 250 –
Study details Population and setting Method of allocation to
intervention/control Outcomes, subgroups and methods of
analysis Notes Selected population: See King et al (2001) evidence table Excluded population/s: See King et al (2001) evidence table
Study sufficiently powered? Not reported.
Did the study collect data on and report resource use and/or costs Not reported Timing of data collection 36 months post-intervention Method of analysis Wilcoxon rank sum test used to test for differences between trial arms for ordinal or interval scale variables, and Pearson’s χ2 test for categorical variables. Frequency of injuries requiring a physician visit compared between groups using Pearson’s χ2 test; ratio of injury per person year derived assuming a Poisson distribution for the number of injuries. ITT not conducted. See King et al (2001) evidence table for details of baseline differences. Were there any subgroups for which outcomes were reported? Not applicable. If so, which subgroups were outcomes reported for? Not applicable. Were the subgroup analyses prespecified? Not applicable.
suggestions for more passive measures (e.g. lower hot water temperature, installation of smoke alarm).
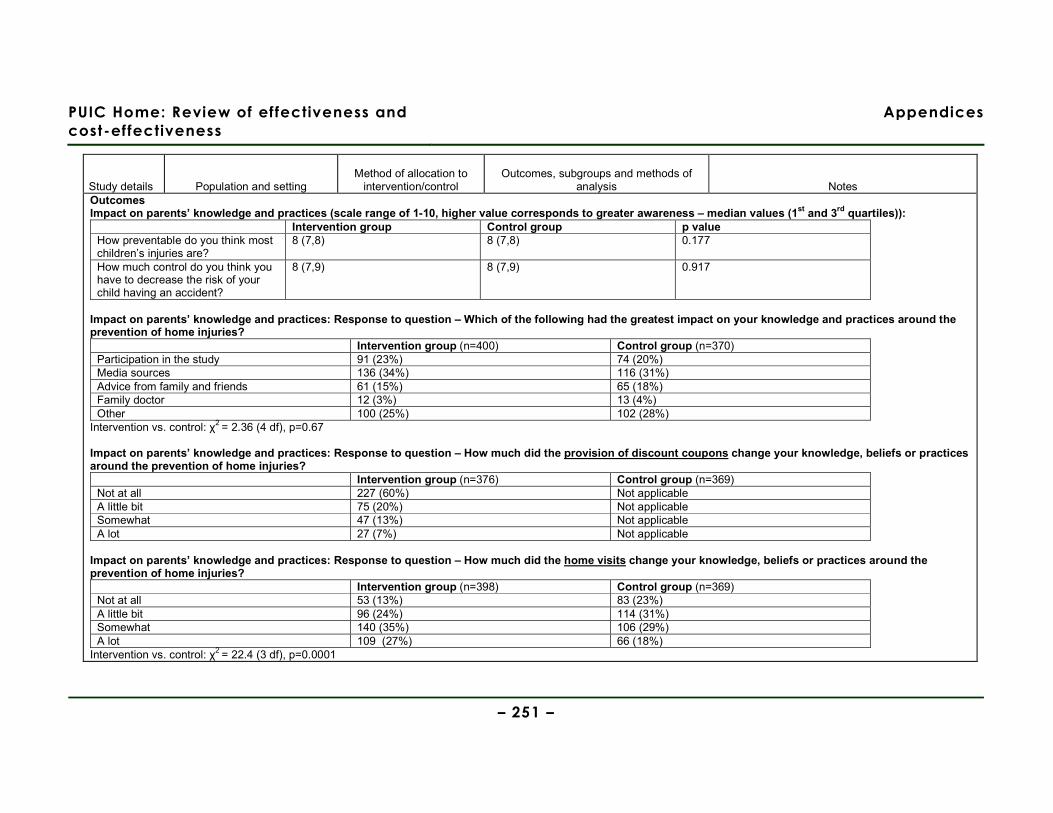
PUIC Home: Review of effectiveness and
cost-effectiveness
Appendices
– 251 –
Study details Population and setting Method of allocation to
intervention/control Outcomes, subgroups and methods of
analysis Notes Outcomes Impact on parents’ knowledge and practices (scale range of 1-10, higher value corresponds to greater awareness – median values (1st and 3rd quartiles)):
Intervention group Control group p value How preventable do you think most children’s injuries are?
8 (7,8) 8 (7,8) 0.177
How much control do you think you have to decrease the risk of your child having an accident?
8 (7,9) 8 (7,9) 0.917
Impact on parents’ knowledge and practices: Response to question – Which of the following had the greatest impact on your knowledge and practices around the prevention of home injuries?
Intervention group (n=400) Control group (n=370) Participation in the study 91 (23%) 74 (20%) Media sources 136 (34%) 116 (31%) Advice from family and friends 61 (15%) 65 (18%) Family doctor 12 (3%) 13 (4%) Other 100 (25%) 102 (28%)
Intervention vs. control: χ2 = 2.36 (4 df), p=0.67 Impact on parents’ knowledge and practices: Response to question – How much did the provision of discount coupons change your knowledge, beliefs or practices around the prevention of home injuries?
Intervention group (n=376) Control group (n=369) Not at all 227 (60%) Not applicable A little bit 75 (20%) Not applicable Somewhat 47 (13%) Not applicable A lot 27 (7%) Not applicable
Impact on parents’ knowledge and practices: Response to question – How much did the home visits change your knowledge, beliefs or practices around the prevention of home injuries?
Intervention group (n=398) Control group (n=369) Not at all 53 (13%) 83 (23%) A little bit 96 (24%) 114 (31%) Somewhat 140 (35%) 106 (29%) A lot 109 (27%) 66 (18%)
Intervention vs. control: χ2 = 22.4 (3 df), p=0.0001
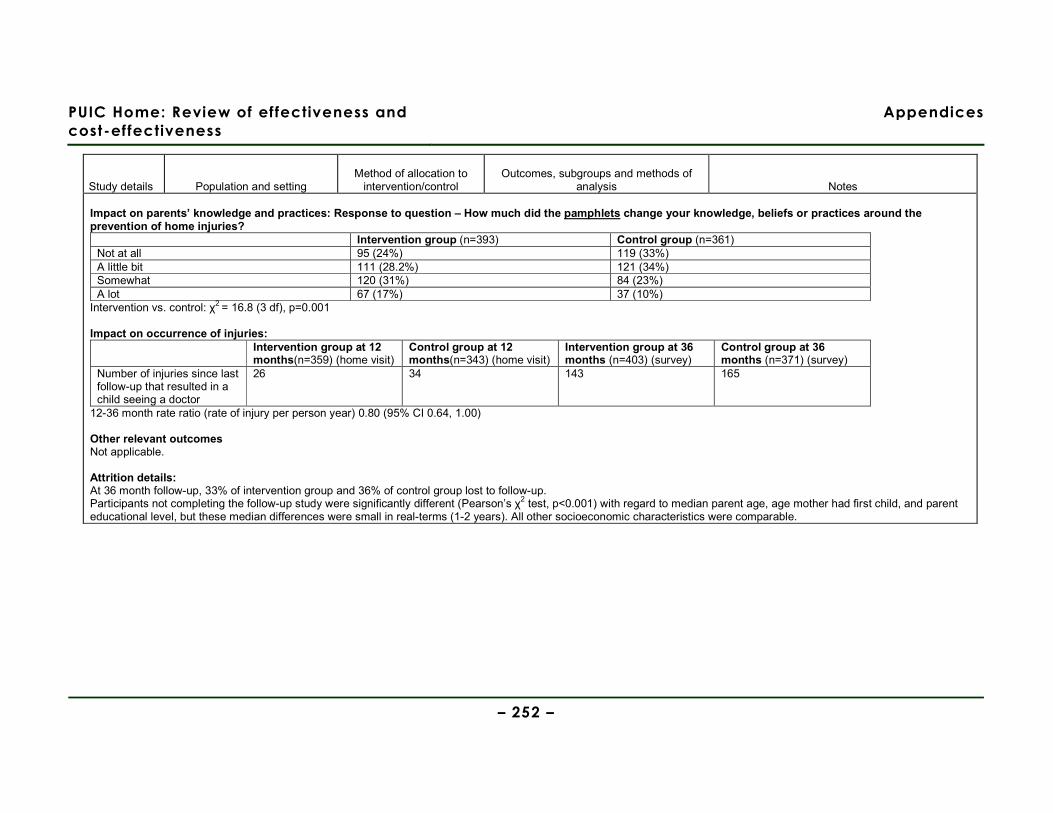
PUIC Home: Review of effectiveness and
cost-effectiveness
Appendices
– 252 –
Study details Population and setting Method of allocation to
intervention/control Outcomes, subgroups and methods of
analysis Notes Impact on parents’ knowledge and practices: Response to question – How much did the pamphlets change your knowledge, beliefs or practices around the prevention of home injuries?
Intervention group (n=393) Control group (n=361) Not at all 95 (24%) 119 (33%) A little bit 111 (28.2%) 121 (34%) Somewhat 120 (31%) 84 (23%) A lot 67 (17%) 37 (10%)
Intervention vs. control: χ2 = 16.8 (3 df), p=0.001 Impact on occurrence of injuries:
Intervention group at 12 months(n=359) (home visit)
Control group at 12 months(n=343) (home visit)
Intervention group at 36 months (n=403) (survey)
Control group at 36 months (n=371) (survey)
Number of injuries since last follow-up that resulted in a child seeing a doctor
26 34 143 165
12-36 month rate ratio (rate of injury per person year) 0.80 (95% CI 0.64, 1.00) Other relevant outcomes Not applicable. Attrition details: At 36 month follow-up, 33% of intervention group and 36% of control group lost to follow-up. Participants not completing the follow-up study were significantly different (Pearson’s χ2 test, p<0.001) with regard to median parent age, age mother had first child, and parent educational level, but these median differences were small in real-terms (1-2 years). All other socioeconomic characteristics were comparable.
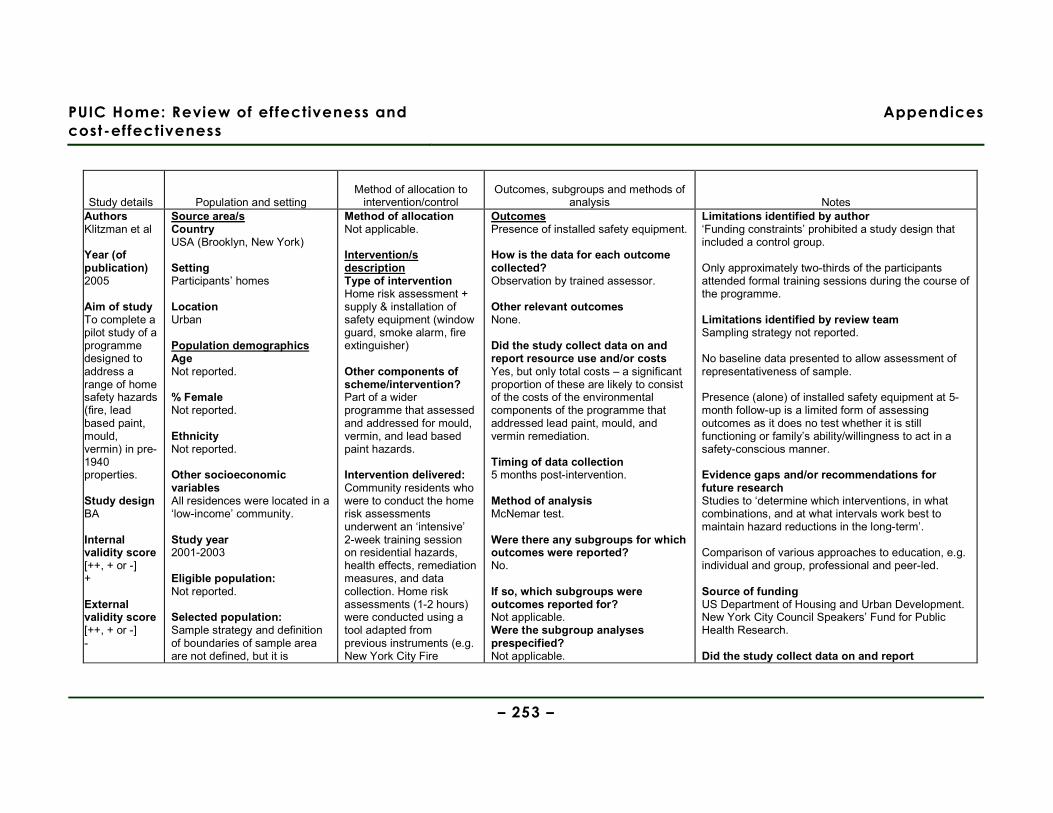
PUIC Home: Review of effectiveness and
cost-effectiveness
Appendices
– 253 –
Study details Population and setting Method of allocation to
intervention/control Outcomes, subgroups and methods of
analysis Notes Authors Klitzman et al Year (of publication) 2005
Aim of study To complete a pilot study of a programme designed to address a range of home safety hazards (fire, lead based paint, mould, vermin) in pre-1940 properties. Study design BA Internal validity score [++, + or -] + External validity score [++, + or -] -
Source area/s Country USA (Brooklyn, New York) Setting Participants’ homes Location Urban Population demographics Age Not reported. % Female Not reported. Ethnicity Not reported. Other socioeconomic variables All residences were located in a ‘low-income’ community. Study year 2001-2003 Eligible population: Not reported. Selected population: Sample strategy and definition of boundaries of sample area are not defined, but it is
Method of allocation Not applicable. Intervention/s description Type of intervention Home risk assessment + supply & installation of safety equipment (window guard, smoke alarm, fire extinguisher)
Other components of scheme/intervention? Part of a wider programme that assessed and addressed for mould, vermin, and lead based paint hazards. Intervention delivered: Community residents who were to conduct the home risk assessments underwent an ‘intensive’ 2-week training session on residential hazards, health effects, remediation measures, and data collection. Home risk assessments (1-2 hours) were conducted using a tool adapted from previous instruments (e.g. New York City Fire
Outcomes Presence of installed safety equipment. How is the data for each outcome collected? Observation by trained assessor. Other relevant outcomes None. Did the study collect data on and report resource use and/or costs Yes, but only total costs – a significant proportion of these are likely to consist of the costs of the environmental components of the programme that addressed lead paint, mould, and vermin remediation. Timing of data collection 5 months post-intervention. Method of analysis McNemar test. Were there any subgroups for which outcomes were reported? No. If so, which subgroups were outcomes reported for? Not applicable. Were the subgroup analyses prespecified? Not applicable.
Limitations identified by author ‘Funding constraints’ prohibited a study design that included a control group. Only approximately two-thirds of the participants attended formal training sessions during the course of the programme. Limitations identified by review team Sampling strategy not reported. No baseline data presented to allow assessment of representativeness of sample. Presence (alone) of installed safety equipment at 5-month follow-up is a limited form of assessing outcomes as it does no test whether it is still functioning or family’s ability/willingness to act in a safety-conscious manner. Evidence gaps and/or recommendations for future research Studies to ‘determine which interventions, in what combinations, and at what intervals work best to maintain hazard reductions in the long-term’. Comparison of various approaches to education, e.g. individual and group, professional and peer-led. Source of funding US Department of Housing and Urban Development. New York City Council Speakers’ Fund for Public Health Research. Did the study collect data on and report
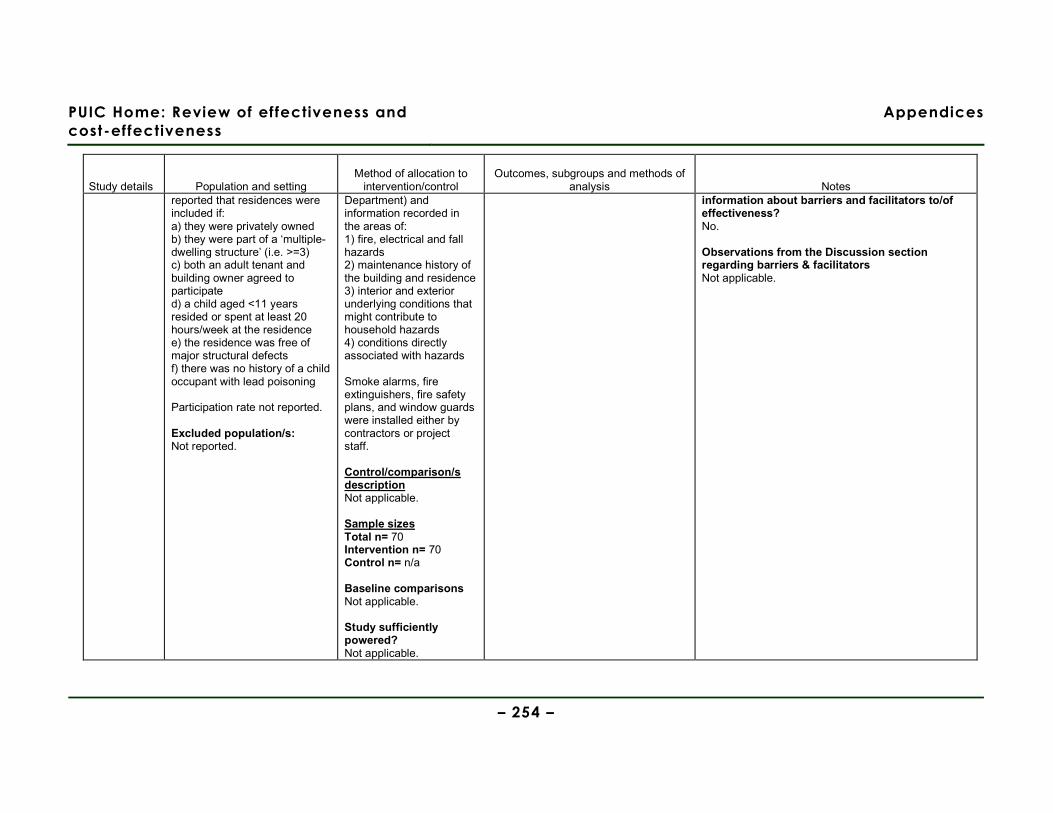
PUIC Home: Review of effectiveness and
cost-effectiveness
Appendices
– 254 –
Study details Population and setting Method of allocation to
intervention/control Outcomes, subgroups and methods of
analysis Notes reported that residences were included if: a) they were privately owned b) they were part of a ‘multiple-dwelling structure’ (i.e. >=3) c) both an adult tenant and building owner agreed to participate d) a child aged <11 years resided or spent at least 20 hours/week at the residence e) the residence was free of major structural defects f) there was no history of a child occupant with lead poisoning Participation rate not reported. Excluded population/s: Not reported.
Department) and information recorded in the areas of: 1) fire, electrical and fall hazards 2) maintenance history of the building and residence 3) interior and exterior underlying conditions that might contribute to household hazards 4) conditions directly associated with hazards Smoke alarms, fire extinguishers, fire safety plans, and window guards were installed either by contractors or project staff. Control/comparison/s description Not applicable. Sample sizes Total n= 70 Intervention n= 70 Control n= n/a Baseline comparisons Not applicable. Study sufficiently powered? Not applicable.
information about barriers and facilitators to/of effectiveness? No. Observations from the Discussion section regarding barriers & facilitators Not applicable.
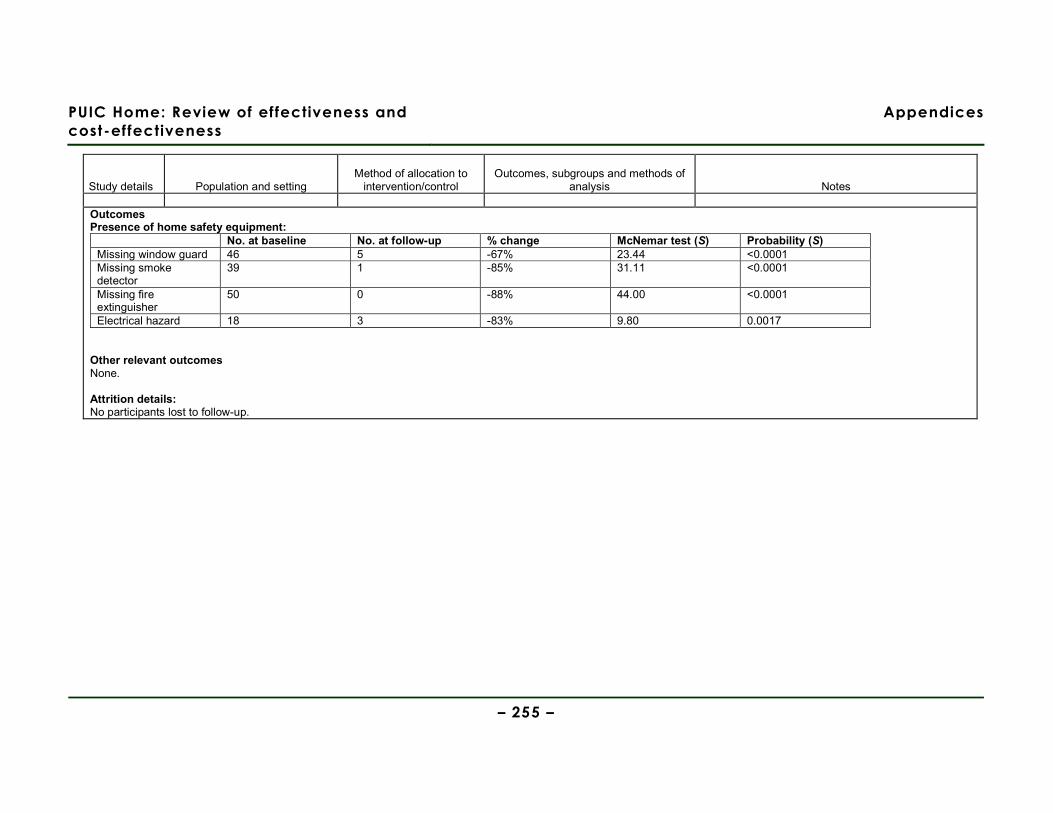
PUIC Home: Review of effectiveness and
cost-effectiveness
Appendices
– 255 –
Study details Population and setting Method of allocation to
intervention/control Outcomes, subgroups and methods of
analysis Notes
Outcomes Presence of home safety equipment:
No. at baseline No. at follow-up % change McNemar test (S) Probability (S) Missing window guard 46 5 -67% 23.44 <0.0001 Missing smoke detector
39 1 -85% 31.11 <0.0001
Missing fire extinguisher
50 0 -88% 44.00 <0.0001
Electrical hazard 18 3 -83% 9.80 0.0017 Other relevant outcomes None. Attrition details: No participants lost to follow-up.
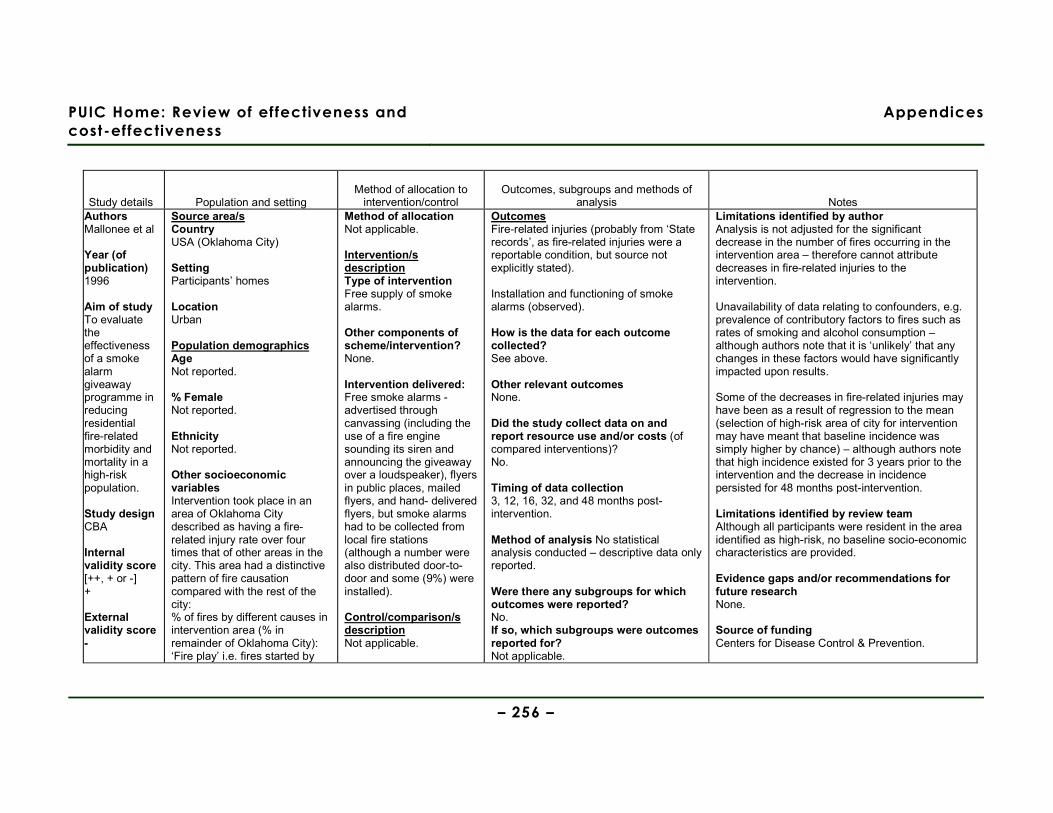
PUIC Home: Review of effectiveness and
cost-effectiveness
Appendices
– 256 –
Study details Population and setting Method of allocation to
intervention/control Outcomes, subgroups and methods of
analysis Notes Authors Mallonee et al Year (of publication) 1996
Aim of study To evaluate the effectiveness of a smoke alarm giveaway programme in reducing residential fire-related morbidity and mortality in a high-risk population.
Study design CBA Internal validity score [++, + or -] + External validity score -
Source area/s Country USA (Oklahoma City) Setting Participants’ homes Location Urban Population demographics Age Not reported. % Female Not reported. Ethnicity Not reported. Other socioeconomic variables Intervention took place in an area of Oklahoma City described as having a fire-related injury rate over four times that of other areas in the city. This area had a distinctive pattern of fire causation compared with the rest of the city: % of fires by different causes in intervention area (% in remainder of Oklahoma City): ‘Fire play’ i.e. fires started by
Method of allocation Not applicable. Intervention/s description Type of intervention Free supply of smoke alarms. Other components of scheme/intervention? None. Intervention delivered: Free smoke alarms - advertised through canvassing (including the use of a fire engine sounding its siren and announcing the giveaway over a loudspeaker), flyers in public places, mailed flyers, and hand- delivered flyers, but smoke alarms had to be collected from local fire stations (although a number were also distributed door-to-door and some (9%) were installed). Control/comparison/s description Not applicable.
Outcomes Fire-related injuries (probably from ‘State records’, as fire-related injuries were a reportable condition, but source not explicitly stated). Installation and functioning of smoke alarms (observed). How is the data for each outcome collected? See above. Other relevant outcomes None. Did the study collect data on and report resource use and/or costs (of compared interventions)? No. Timing of data collection 3, 12, 16, 32, and 48 months post-intervention. Method of analysis No statistical analysis conducted – descriptive data only reported. Were there any subgroups for which outcomes were reported? No. If so, which subgroups were outcomes reported for? Not applicable.
Limitations identified by author Analysis is not adjusted for the significant decrease in the number of fires occurring in the intervention area – therefore cannot attribute decreases in fire-related injuries to the intervention. Unavailability of data relating to confounders, e.g. prevalence of contributory factors to fires such as rates of smoking and alcohol consumption – although authors note that it is ‘unlikely’ that any changes in these factors would have significantly impacted upon results. Some of the decreases in fire-related injuries may have been as a result of regression to the mean (selection of high-risk area of city for intervention may have meant that baseline incidence was simply higher by chance) – although authors note that high incidence existed for 3 years prior to the intervention and the decrease in incidence persisted for 48 months post-intervention. Limitations identified by review team Although all participants were resident in the area identified as high-risk, no baseline socio-economic characteristics are provided. Evidence gaps and/or recommendations for future research None. Source of funding Centers for Disease Control & Prevention.
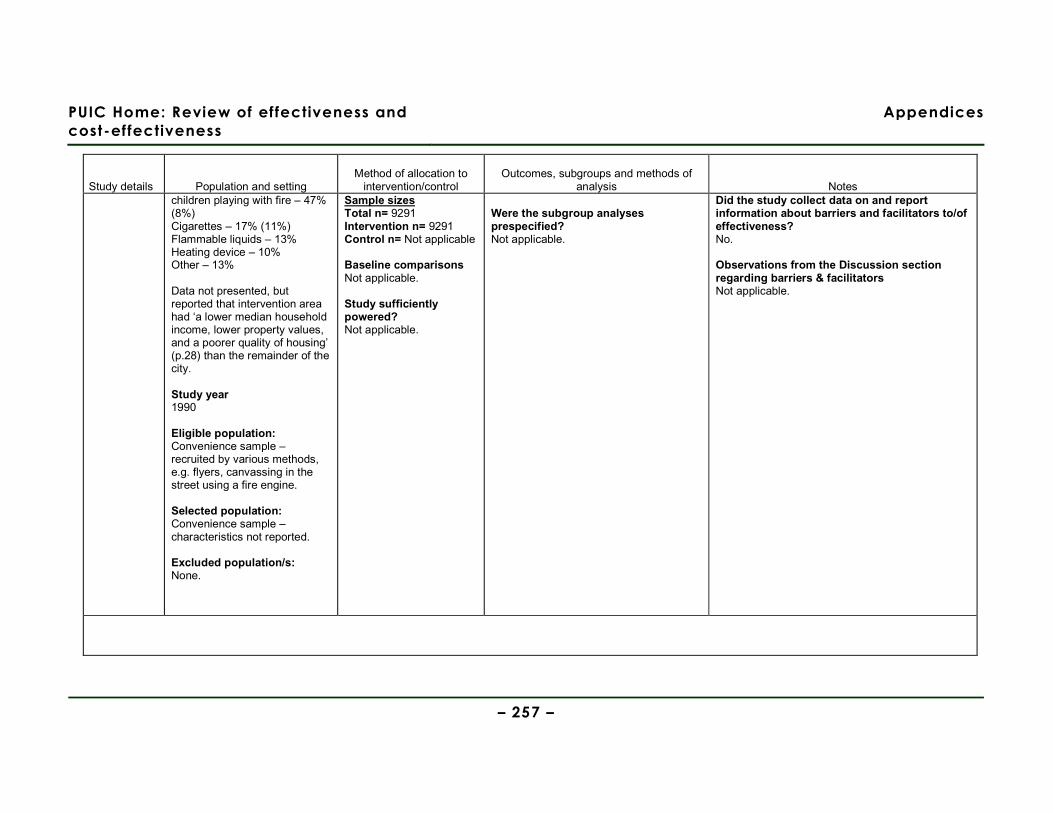
PUIC Home: Review of effectiveness and
cost-effectiveness
Appendices
– 257 –
Study details Population and setting Method of allocation to
intervention/control Outcomes, subgroups and methods of
analysis Notes children playing with fire – 47% (8%) Cigarettes – 17% (11%) Flammable liquids – 13% Heating device – 10% Other – 13% Data not presented, but reported that intervention area had ‘a lower median household income, lower property values, and a poorer quality of housing’ (p.28) than the remainder of the city. Study year 1990 Eligible population: Convenience sample – recruited by various methods, e.g. flyers, canvassing in the street using a fire engine. Selected population: Convenience sample – characteristics not reported. Excluded population/s: None.
Sample sizes Total n= 9291 Intervention n= 9291 Control n= Not applicable Baseline comparisons Not applicable. Study sufficiently powered? Not applicable.
Were the subgroup analyses prespecified? Not applicable.
Did the study collect data on and report information about barriers and facilitators to/of effectiveness? No. Observations from the Discussion section regarding barriers & facilitators Not applicable.
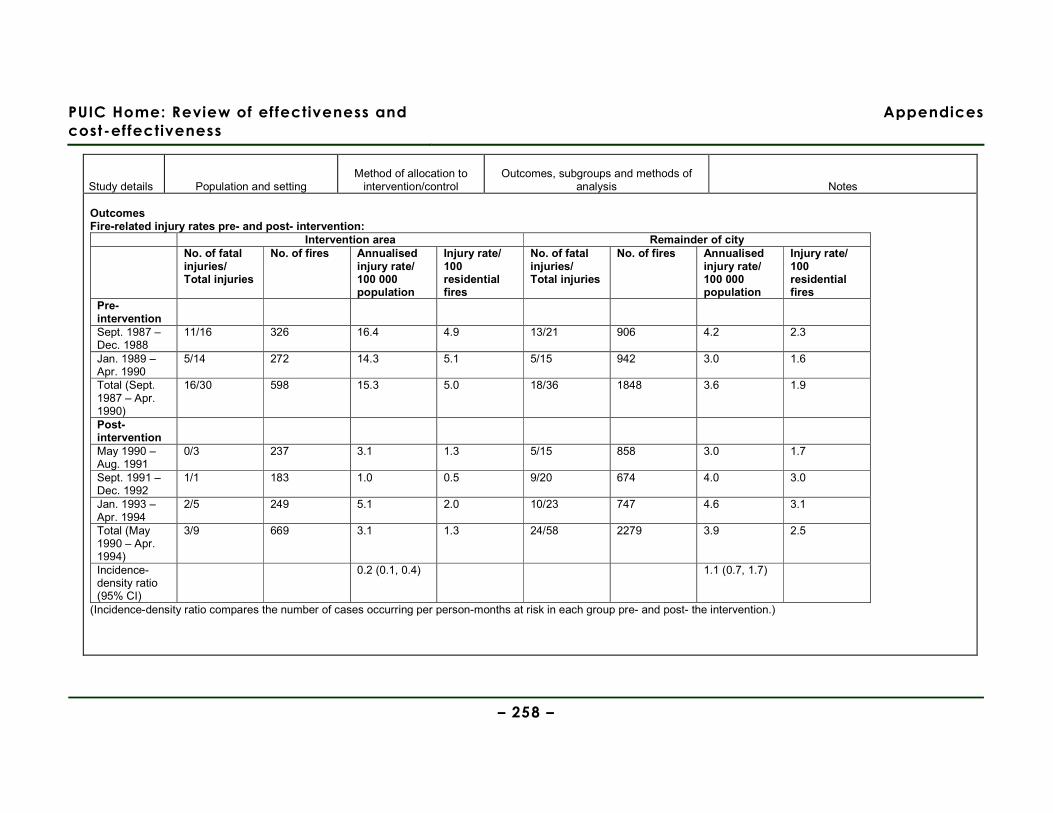
PUIC Home: Review of effectiveness and
cost-effectiveness
Appendices
– 258 –
Study details Population and setting Method of allocation to
intervention/control Outcomes, subgroups and methods of
analysis Notes Outcomes Fire-related injury rates pre- and post- intervention:
Intervention area Remainder of city No. of fatal
injuries/ Total injuries
No. of fires Annualised injury rate/ 100 000 population
Injury rate/ 100 residential fires
No. of fatal injuries/ Total injuries
No. of fires Annualised injury rate/ 100 000 population
Injury rate/ 100 residential fires
Pre-intervention
Sept. 1987 – Dec. 1988
11/16 326 16.4 4.9 13/21 906 4.2 2.3
Jan. 1989 – Apr. 1990
5/14 272 14.3 5.1 5/15 942 3.0 1.6
Total (Sept. 1987 – Apr. 1990)
16/30 598 15.3 5.0 18/36 1848 3.6 1.9
Post-intervention
May 1990 – Aug. 1991
0/3 237 3.1 1.3 5/15 858 3.0 1.7
Sept. 1991 – Dec. 1992
1/1 183 1.0 0.5 9/20 674 4.0 3.0
Jan. 1993 – Apr. 1994
2/5 249 5.1 2.0 10/23 747 4.6 3.1
Total (May 1990 – Apr. 1994)
3/9 669 3.1 1.3 24/58 2279 3.9 2.5
Incidence-density ratio (95% CI)
0.2 (0.1, 0.4) 1.1 (0.7, 1.7)
(Incidence-density ratio compares the number of cases occurring per person-months at risk in each group pre- and post- the intervention.)
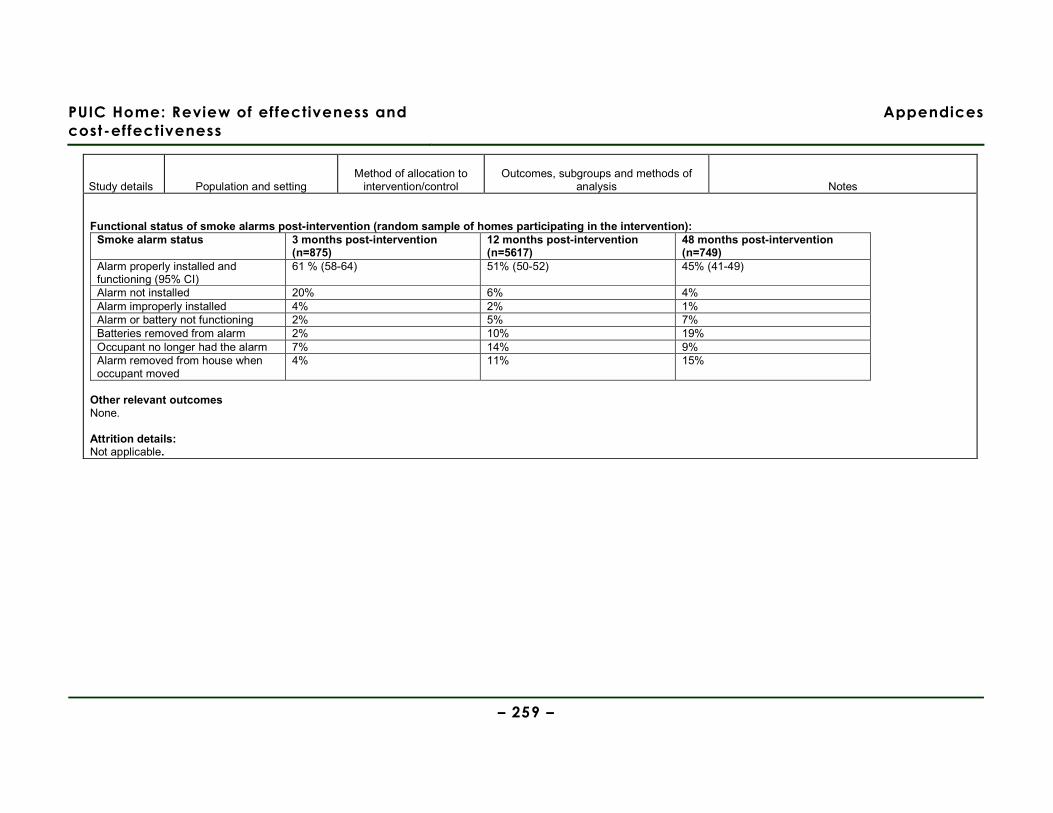
PUIC Home: Review of effectiveness and
cost-effectiveness
Appendices
– 259 –
Study details Population and setting Method of allocation to
intervention/control Outcomes, subgroups and methods of
analysis Notes Functional status of smoke alarms post-intervention (random sample of homes participating in the intervention):
Smoke alarm status 3 months post-intervention (n=875)
12 months post-intervention (n=5617)
48 months post-intervention (n=749)
Alarm properly installed and functioning (95% CI)
61 % (58-64) 51% (50-52) 45% (41-49)
Alarm not installed 20% 6% 4% Alarm improperly installed 4% 2% 1% Alarm or battery not functioning 2% 5% 7% Batteries removed from alarm 2% 10% 19% Occupant no longer had the alarm 7% 14% 9% Alarm removed from house when occupant moved
4% 11% 15%
Other relevant outcomes None. Attrition details: Not applicable.
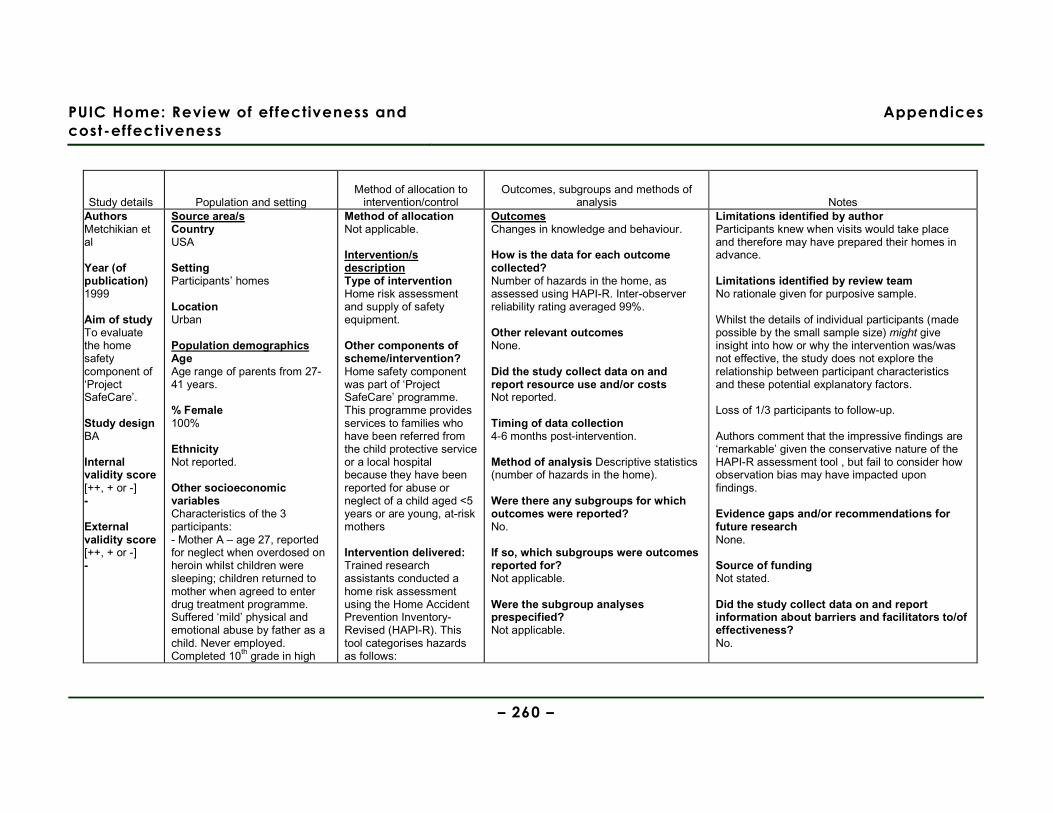
PUIC Home: Review of effectiveness and
cost-effectiveness
Appendices
– 260 –
Study details Population and setting Method of allocation to
intervention/control Outcomes, subgroups and methods of
analysis Notes Authors Metchikian et al Year (of publication) 1999 Aim of study To evaluate the home safety component of ‘Project SafeCare’. Study design BA Internal validity score [++, + or -] - External validity score [++, + or -] -
Source area/s Country USA Setting Participants’ homes Location Urban Population demographics Age Age range of parents from 27-41 years. % Female 100% Ethnicity Not reported. Other socioeconomic variables Characteristics of the 3 participants: - Mother A – age 27, reported for neglect when overdosed on heroin whilst children were sleeping; children returned to mother when agreed to enter drug treatment programme. Suffered ‘mild’ physical and emotional abuse by father as a child. Never employed. Completed 10th grade in high
Method of allocation Not applicable. Intervention/s description Type of intervention Home risk assessment and supply of safety equipment.
Other components of scheme/intervention? Home safety component was part of ‘Project SafeCare’ programme. This programme provides services to families who have been referred from the child protective service or a local hospital because they have been reported for abuse or neglect of a child aged <5 years or are young, at-risk mothers Intervention delivered: Trained research assistants conducted a home risk assessment using the Home Accident Prevention Inventory-Revised (HAPI-R). This tool categorises hazards as follows:
Outcomes Changes in knowledge and behaviour. How is the data for each outcome collected? Number of hazards in the home, as assessed using HAPI-R. Inter-observer reliability rating averaged 99%. Other relevant outcomes None. Did the study collect data on and report resource use and/or costs Not reported. Timing of data collection 4-6 months post-intervention. Method of analysis Descriptive statistics (number of hazards in the home). Were there any subgroups for which outcomes were reported? No. If so, which subgroups were outcomes reported for? Not applicable. Were the subgroup analyses prespecified? Not applicable.
Limitations identified by author Participants knew when visits would take place and therefore may have prepared their homes in advance. Limitations identified by review team No rationale given for purposive sample. Whilst the details of individual participants (made possible by the small sample size) might give insight into how or why the intervention was/was not effective, the study does not explore the relationship between participant characteristics and these potential explanatory factors. Loss of 1/3 participants to follow-up. Authors comment that the impressive findings are ‘remarkable’ given the conservative nature of the HAPI-R assessment tool , but fail to consider how observation bias may have impacted upon findings. Evidence gaps and/or recommendations for future research None. Source of funding Not stated. Did the study collect data on and report information about barriers and facilitators to/of effectiveness? No.
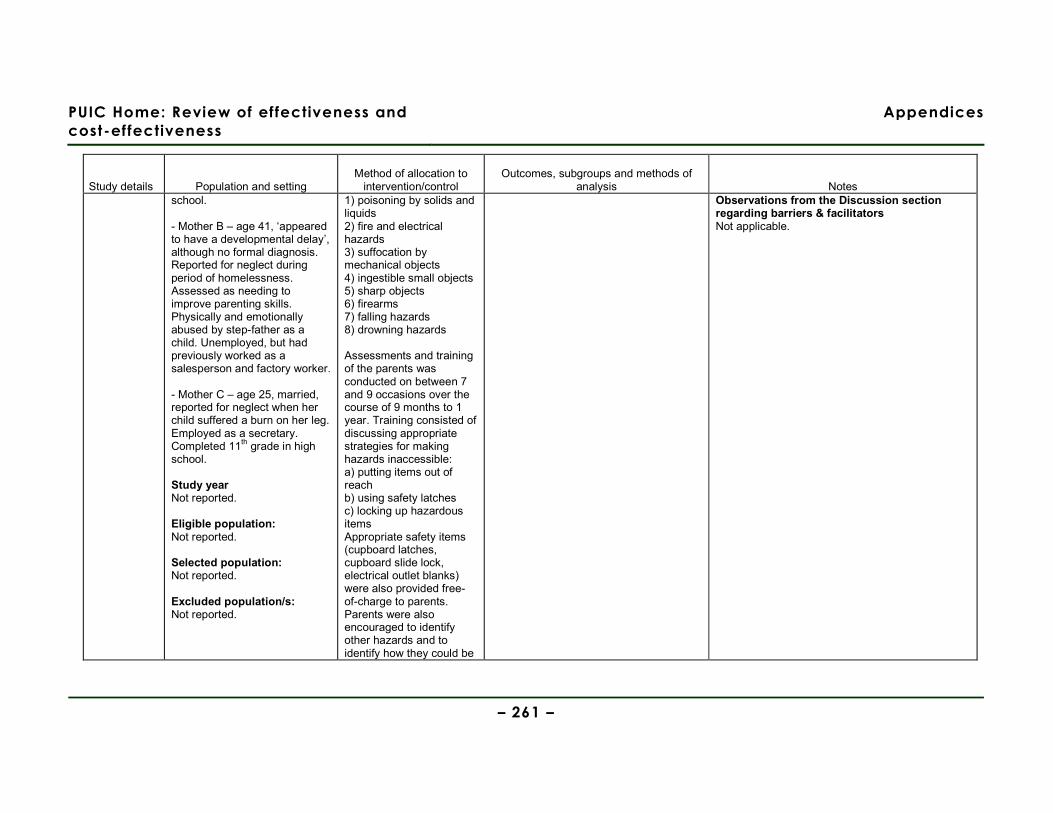
PUIC Home: Review of effectiveness and
cost-effectiveness
Appendices
– 261 –
Study details Population and setting Method of allocation to
intervention/control Outcomes, subgroups and methods of
analysis Notes school. - Mother B – age 41, ‘appeared to have a developmental delay’, although no formal diagnosis. Reported for neglect during period of homelessness. Assessed as needing to improve parenting skills. Physically and emotionally abused by step-father as a child. Unemployed, but had previously worked as a salesperson and factory worker. - Mother C – age 25, married, reported for neglect when her child suffered a burn on her leg. Employed as a secretary. Completed 11th grade in high school. Study year Not reported. Eligible population: Not reported. Selected population: Not reported. Excluded population/s: Not reported.
1) poisoning by solids and liquids 2) fire and electrical hazards 3) suffocation by mechanical objects 4) ingestible small objects 5) sharp objects 6) firearms 7) falling hazards 8) drowning hazards Assessments and training of the parents was conducted on between 7 and 9 occasions over the course of 9 months to 1 year. Training consisted of discussing appropriate strategies for making hazards inaccessible: a) putting items out of reach b) using safety latches c) locking up hazardous items Appropriate safety items (cupboard latches, cupboard slide lock, electrical outlet blanks) were also provided free-of-charge to parents. Parents were also encouraged to identify other hazards and to identify how they could be
Observations from the Discussion section regarding barriers & facilitators Not applicable.

PUIC Home: Review of effectiveness and
cost-effectiveness
Appendices
– 262 –
Study details Population and setting Method of allocation to
intervention/control Outcomes, subgroups and methods of
analysis Notes made safe. On subsequent visits where the home risk assessment was completed, feedback was given to the parents regarding how they had addressed safety hazards. Control/comparison/s description Not applicable. Sample sizes Total n= 3 Intervention n= n/a Control n= n/a Baseline comparisons Not applicable. Study sufficiently powered? Not applicable.
Outcomes Number of hazards in the home (NOTE: data extracted by eye from line graphs; mean number of hazards calculated for each timeframe):
Baseline Training Follow-up Mother A Bathroom 30 5 3 Kitchen 27 11 1.5 Living room 10 6 6 Bedroom 4 2 0 Mother B Bathroom #1 121 10 2 Kitchen 44 4 1 Bathroom #2 16 0 0
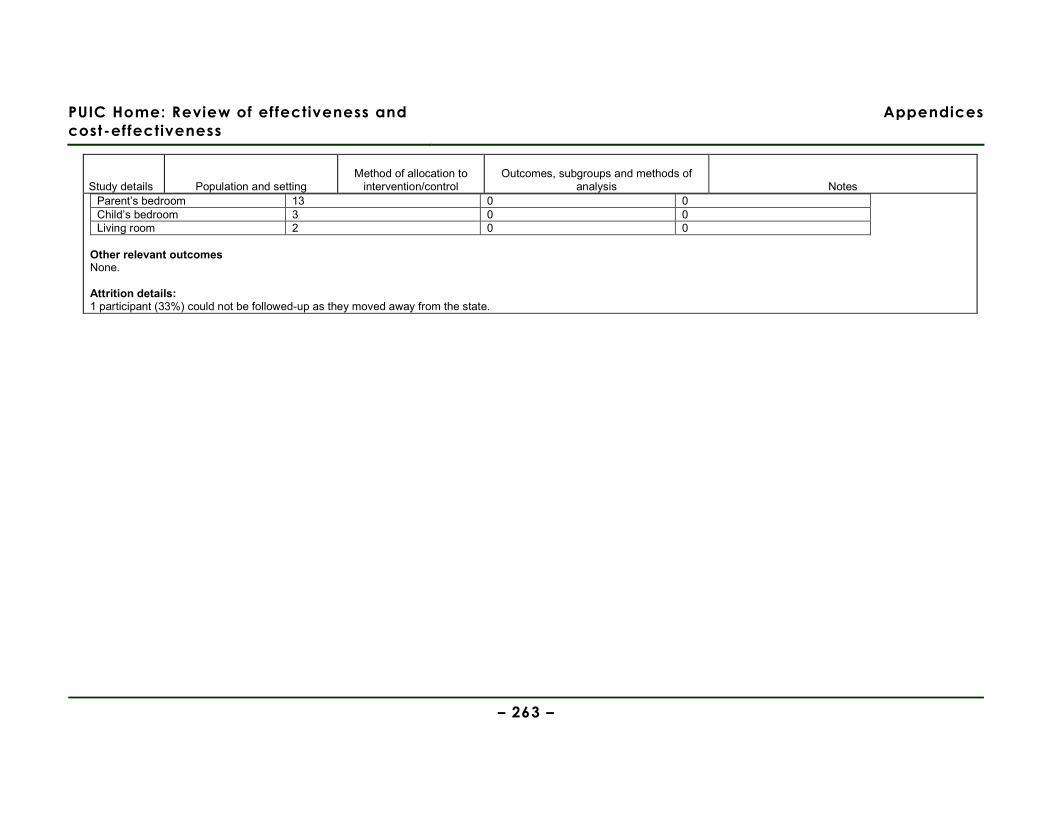
PUIC Home: Review of effectiveness and
cost-effectiveness
Appendices
– 263 –
Study details Population and setting Method of allocation to
intervention/control Outcomes, subgroups and methods of
analysis Notes Parent’s bedroom 13 0 0 Child’s bedroom 3 0 0 Living room 2 0 0
Other relevant outcomes None. Attrition details: 1 participant (33%) could not be followed-up as they moved away from the state.
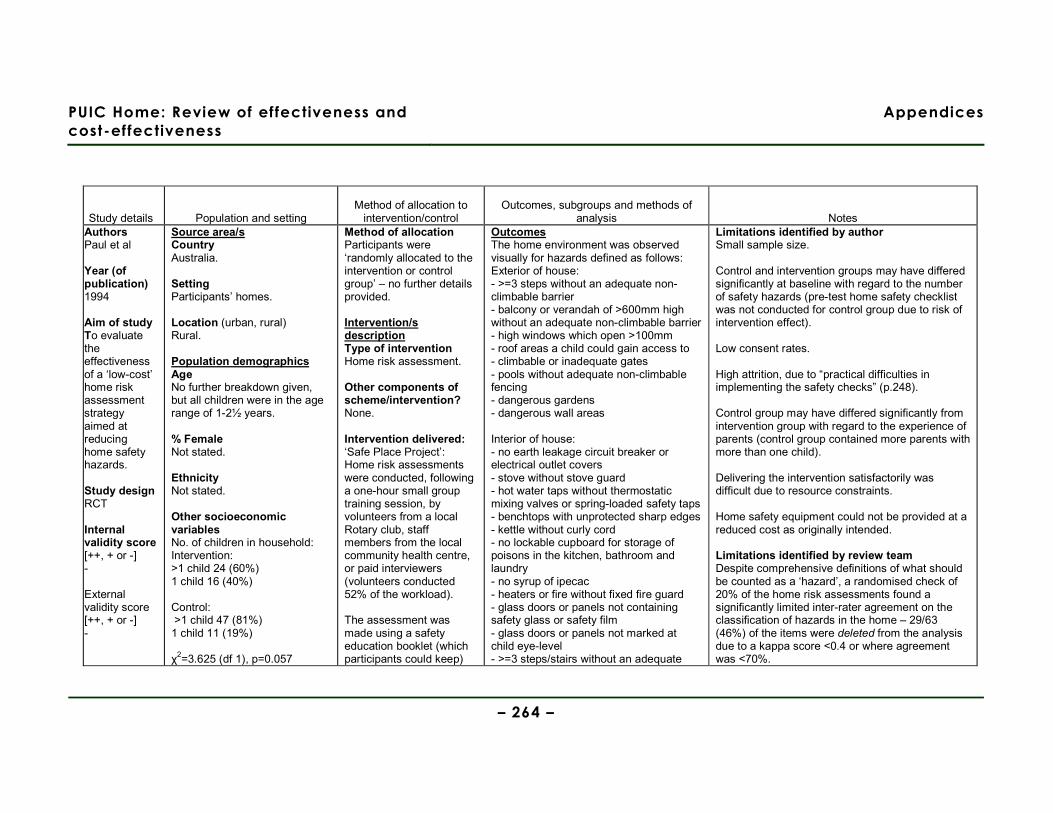
PUIC Home: Review of effectiveness and
cost-effectiveness
Appendices
– 264 –
Study details Population and setting Method of allocation to
intervention/control Outcomes, subgroups and methods of
analysis Notes Authors Paul et al Year (of publication) 1994
Aim of study To evaluate the effectiveness of a ‘low-cost’ home risk assessment strategy aimed at reducing home safety hazards. Study design RCT Internal validity score [++, + or -] - External validity score [++, + or -] -
Source area/s Country Australia. Setting Participants’ homes. Location (urban, rural) Rural. Population demographics Age No further breakdown given, but all children were in the age range of 1-2½ years. % Female Not stated. Ethnicity Not stated. Other socioeconomic variables No. of children in household: Intervention: >1 child 24 (60%) 1 child 16 (40%) Control: >1 child 47 (81%) 1 child 11 (19%) χ2=3.625 (df 1), p=0.057
Method of allocation Participants were ‘randomly allocated to the intervention or control group’ – no further details provided. Intervention/s description Type of intervention Home risk assessment. Other components of scheme/intervention? None. Intervention delivered: ‘Safe Place Project’: Home risk assessments were conducted, following a one-hour small group training session, by volunteers from a local Rotary club, staff members from the local community health centre, or paid interviewers (volunteers conducted 52% of the workload). The assessment was made using a safety education booklet (which participants could keep)
Outcomes The home environment was observed visually for hazards defined as follows: Exterior of house: - >=3 steps without an adequate non-climbable barrier - balcony or verandah of >600mm high without an adequate non-climbable barrier - high windows which open >100mm - roof areas a child could gain access to - climbable or inadequate gates - pools without adequate non-climbable fencing - dangerous gardens - dangerous wall areas Interior of house: - no earth leakage circuit breaker or electrical outlet covers - stove without stove guard - hot water taps without thermostatic mixing valves or spring-loaded safety taps - benchtops with unprotected sharp edges - kettle without curly cord - no lockable cupboard for storage of poisons in the kitchen, bathroom and laundry - no syrup of ipecac - heaters or fire without fixed fire guard - glass doors or panels not containing safety glass or safety film - glass doors or panels not marked at child eye-level - >=3 steps/stairs without an adequate
Limitations identified by author Small sample size. Control and intervention groups may have differed significantly at baseline with regard to the number of safety hazards (pre-test home safety checklist was not conducted for control group due to risk of intervention effect). Low consent rates. High attrition, due to “practical difficulties in implementing the safety checks” (p.248). Control group may have differed significantly from intervention group with regard to the experience of parents (control group contained more parents with more than one child). Delivering the intervention satisfactorily was difficult due to resource constraints. Home safety equipment could not be provided at a reduced cost as originally intended. Limitations identified by review team Despite comprehensive definitions of what should be counted as a ‘hazard’, a randomised check of 20% of the home risk assessments found a significantly limited inter-rater agreement on the classification of hazards in the home – 29/63 (46%) of the items were deleted from the analysis due to a kappa score <0.4 or where agreement was <70%.
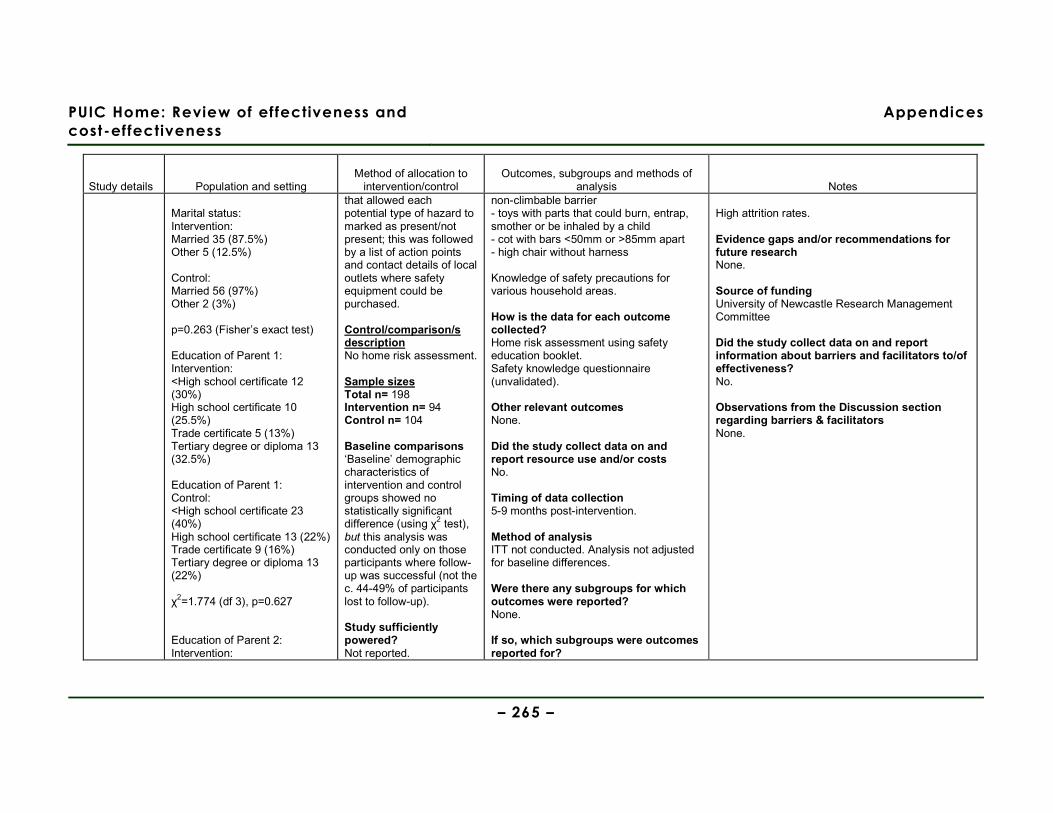
PUIC Home: Review of effectiveness and
cost-effectiveness
Appendices
– 265 –
Study details Population and setting Method of allocation to
intervention/control Outcomes, subgroups and methods of
analysis Notes Marital status: Intervention: Married 35 (87.5%) Other 5 (12.5%) Control: Married 56 (97%) Other 2 (3%) p=0.263 (Fisher’s exact test) Education of Parent 1: Intervention: <High school certificate 12 (30%) High school certificate 10 (25.5%) Trade certificate 5 (13%) Tertiary degree or diploma 13 (32.5%) Education of Parent 1: Control: <High school certificate 23 (40%) High school certificate 13 (22%) Trade certificate 9 (16%) Tertiary degree or diploma 13 (22%) χ2=1.774 (df 3), p=0.627 Education of Parent 2: Intervention:
that allowed each potential type of hazard to marked as present/not present; this was followed by a list of action points and contact details of local outlets where safety equipment could be purchased. Control/comparison/s description No home risk assessment. Sample sizes Total n= 198 Intervention n= 94 Control n= 104 Baseline comparisons ‘Baseline’ demographic characteristics of intervention and control groups showed no statistically significant difference (using χ2 test), but this analysis was conducted only on those participants where follow-up was successful (not the c. 44-49% of participants lost to follow-up). Study sufficiently powered? Not reported.
non-climbable barrier - toys with parts that could burn, entrap, smother or be inhaled by a child - cot with bars <50mm or >85mm apart - high chair without harness Knowledge of safety precautions for various household areas. How is the data for each outcome collected? Home risk assessment using safety education booklet. Safety knowledge questionnaire (unvalidated). Other relevant outcomes None. Did the study collect data on and report resource use and/or costs No. Timing of data collection 5-9 months post-intervention. Method of analysis ITT not conducted. Analysis not adjusted for baseline differences. Were there any subgroups for which outcomes were reported? None. If so, which subgroups were outcomes reported for?
High attrition rates. Evidence gaps and/or recommendations for future research None. Source of funding University of Newcastle Research Management Committee Did the study collect data on and report information about barriers and facilitators to/of effectiveness? No. Observations from the Discussion section regarding barriers & facilitators None.
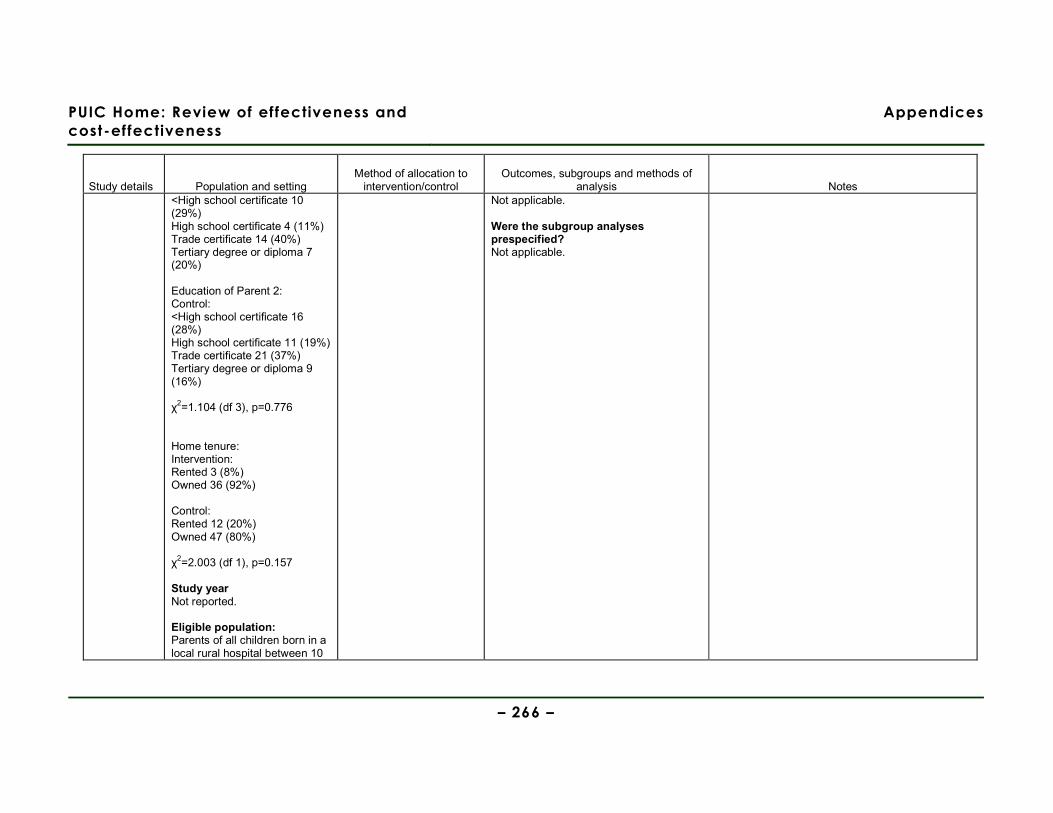
PUIC Home: Review of effectiveness and
cost-effectiveness
Appendices
– 266 –
Study details Population and setting Method of allocation to
intervention/control Outcomes, subgroups and methods of
analysis Notes <High school certificate 10 (29%) High school certificate 4 (11%) Trade certificate 14 (40%) Tertiary degree or diploma 7 (20%) Education of Parent 2: Control: <High school certificate 16 (28%) High school certificate 11 (19%) Trade certificate 21 (37%) Tertiary degree or diploma 9 (16%) χ2=1.104 (df 3), p=0.776 Home tenure: Intervention: Rented 3 (8%) Owned 36 (92%) Control: Rented 12 (20%) Owned 47 (80%) χ2=2.003 (df 1), p=0.157 Study year Not reported. Eligible population: Parents of all children born in a local rural hospital between 10
Not applicable. Were the subgroup analyses prespecified? Not applicable.
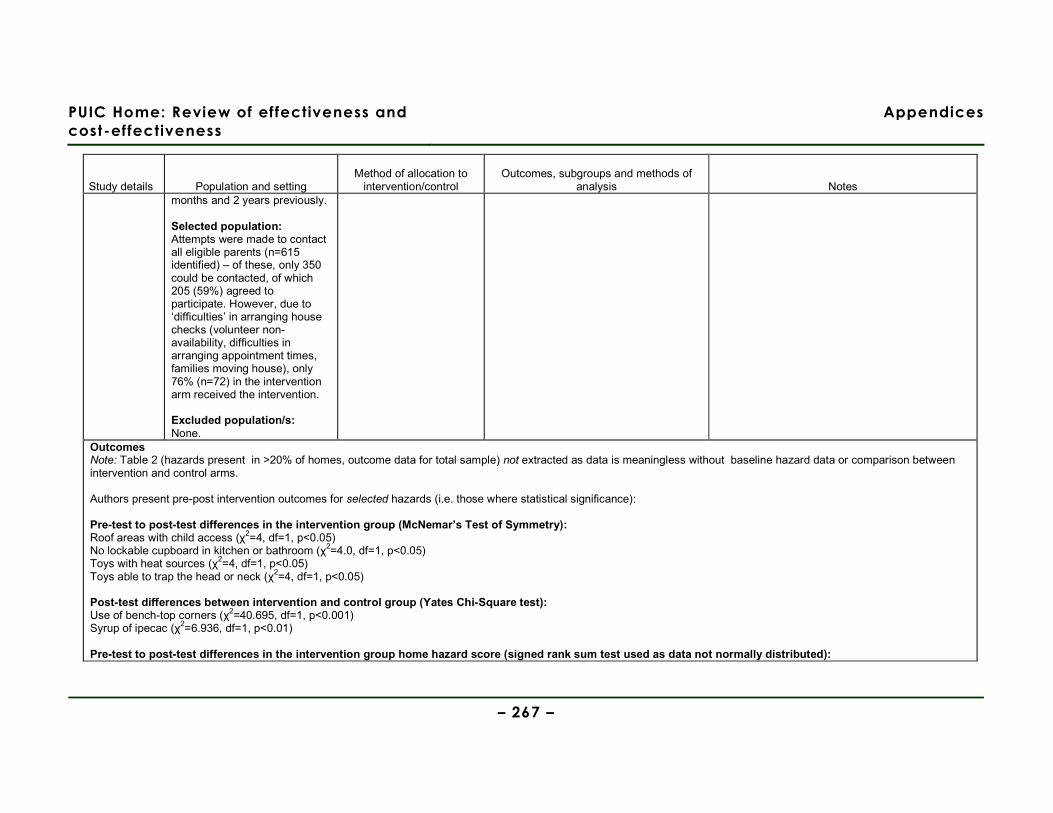
PUIC Home: Review of effectiveness and
cost-effectiveness
Appendices
– 267 –
Study details Population and setting Method of allocation to
intervention/control Outcomes, subgroups and methods of
analysis Notes months and 2 years previously. Selected population: Attempts were made to contact all eligible parents (n=615 identified) – of these, only 350 could be contacted, of which 205 (59%) agreed to participate. However, due to ‘difficulties’ in arranging house checks (volunteer non-availability, difficulties in arranging appointment times, families moving house), only 76% (n=72) in the intervention arm received the intervention. Excluded population/s: None.
Outcomes Note: Table 2 (hazards present in >20% of homes, outcome data for total sample) not extracted as data is meaningless without baseline hazard data or comparison between intervention and control arms. Authors present pre-post intervention outcomes for selected hazards (i.e. those where statistical significance): Pre-test to post-test differences in the intervention group (McNemar’s Test of Symmetry): Roof areas with child access (χ2=4, df=1, p<0.05) No lockable cupboard in kitchen or bathroom (χ2=4.0, df=1, p<0.05) Toys with heat sources (χ2=4, df=1, p<0.05) Toys able to trap the head or neck (χ2=4, df=1, p<0.05) Post-test differences between intervention and control group (Yates Chi-Square test): Use of bench-top corners (χ2=40.695, df=1, p<0.001) Syrup of ipecac (χ2=6.936, df=1, p<0.01) Pre-test to post-test differences in the intervention group home hazard score (signed rank sum test used as data not normally distributed):
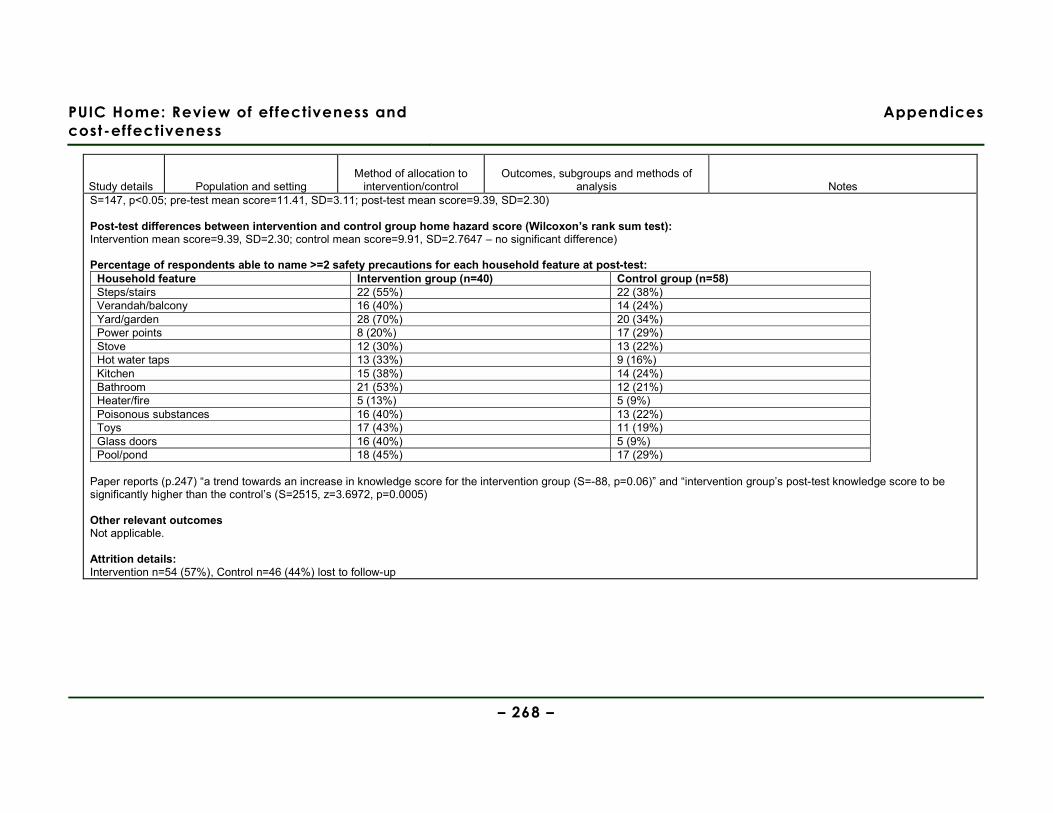
PUIC Home: Review of effectiveness and
cost-effectiveness
Appendices
– 268 –
Study details Population and setting Method of allocation to
intervention/control Outcomes, subgroups and methods of
analysis Notes S=147, p<0.05; pre-test mean score=11.41, SD=3.11; post-test mean score=9.39, SD=2.30) Post-test differences between intervention and control group home hazard score (Wilcoxon’s rank sum test): Intervention mean score=9.39, SD=2.30; control mean score=9.91, SD=2.7647 – no significant difference) Percentage of respondents able to name >=2 safety precautions for each household feature at post-test:
Household feature Intervention group (n=40) Control group (n=58) Steps/stairs 22 (55%) 22 (38%) Verandah/balcony 16 (40%) 14 (24%) Yard/garden 28 (70%) 20 (34%) Power points 8 (20%) 17 (29%) Stove 12 (30%) 13 (22%) Hot water taps 13 (33%) 9 (16%) Kitchen 15 (38%) 14 (24%) Bathroom 21 (53%) 12 (21%) Heater/fire 5 (13%) 5 (9%) Poisonous substances 16 (40%) 13 (22%) Toys 17 (43%) 11 (19%) Glass doors 16 (40%) 5 (9%) Pool/pond 18 (45%) 17 (29%)
Paper reports (p.247) “a trend towards an increase in knowledge score for the intervention group (S=-88, p=0.06)” and “intervention group’s post-test knowledge score to be significantly higher than the control’s (S=2515, z=3.6972, p=0.0005) Other relevant outcomes Not applicable. Attrition details: Intervention n=54 (57%), Control n=46 (44%) lost to follow-up
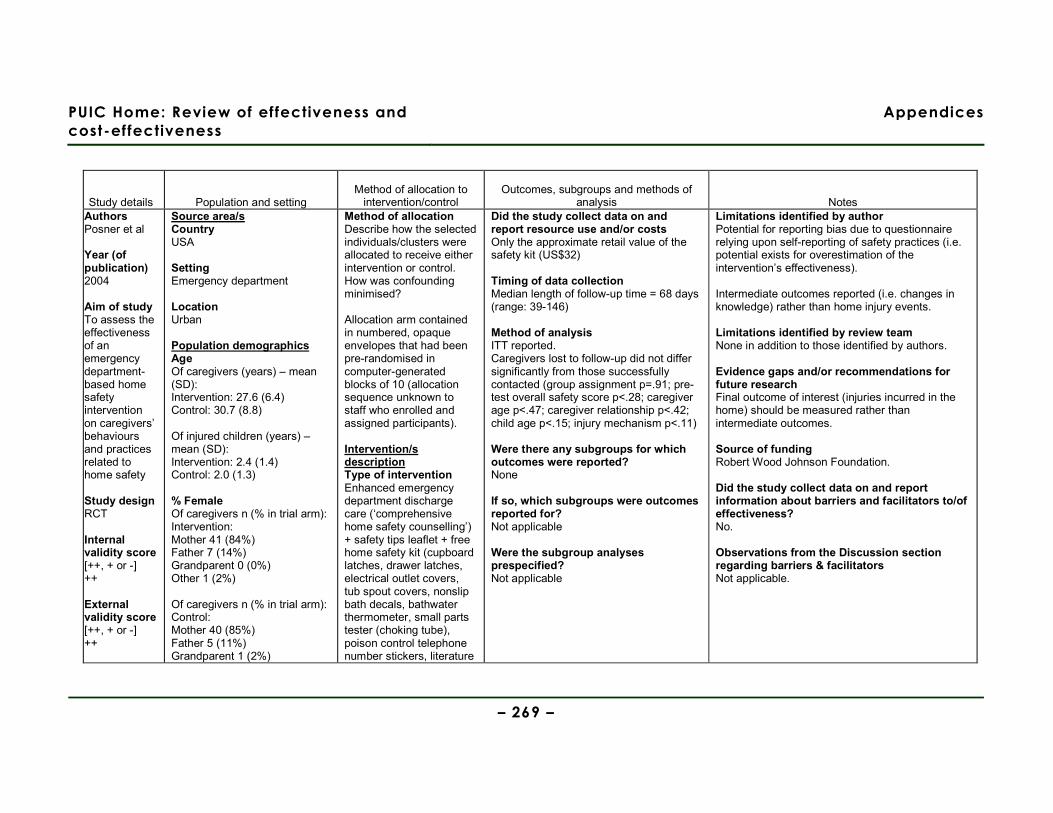
PUIC Home: Review of effectiveness and
cost-effectiveness
Appendices
– 269 –
Study details Population and setting Method of allocation to
intervention/control Outcomes, subgroups and methods of
analysis Notes Authors Posner et al Year (of publication) 2004 Aim of study To assess the effectiveness of an emergency department-based home safety intervention on caregivers’ behaviours and practices related to home safety Study design RCT Internal validity score [++, + or -] ++ External validity score [++, + or -] ++
Source area/s Country USA Setting Emergency department Location Urban Population demographics Age Of caregivers (years) – mean (SD): Intervention: 27.6 (6.4) Control: 30.7 (8.8) Of injured children (years) – mean (SD): Intervention: 2.4 (1.4) Control: 2.0 (1.3) % Female Of caregivers n (% in trial arm): Intervention: Mother 41 (84%) Father 7 (14%) Grandparent 0 (0%) Other 1 (2%) Of caregivers n (% in trial arm): Control: Mother 40 (85%) Father 5 (11%) Grandparent 1 (2%)
Method of allocation Describe how the selected individuals/clusters were allocated to receive either intervention or control. How was confounding minimised? Allocation arm contained in numbered, opaque envelopes that had been pre-randomised in computer-generated blocks of 10 (allocation sequence unknown to staff who enrolled and assigned participants). Intervention/s description Type of intervention Enhanced emergency department discharge care (‘comprehensive home safety counselling’) + safety tips leaflet + free home safety kit (cupboard latches, drawer latches, electrical outlet covers, tub spout covers, nonslip bath decals, bathwater thermometer, small parts tester (choking tube), poison control telephone number stickers, literature
Did the study collect data on and report resource use and/or costs Only the approximate retail value of the safety kit (US$32) Timing of data collection Median length of follow-up time = 68 days (range: 39-146) Method of analysis ITT reported. Caregivers lost to follow-up did not differ significantly from those successfully contacted (group assignment p=.91; pre-test overall safety score p<.28; caregiver age p<.47; caregiver relationship p<.42; child age p<.15; injury mechanism p<.11) Were there any subgroups for which outcomes were reported? None If so, which subgroups were outcomes reported for? Not applicable Were the subgroup analyses prespecified? Not applicable
Limitations identified by author Potential for reporting bias due to questionnaire relying upon self-reporting of safety practices (i.e. potential exists for overestimation of the intervention’s effectiveness). Intermediate outcomes reported (i.e. changes in knowledge) rather than home injury events. Limitations identified by review team None in addition to those identified by authors. Evidence gaps and/or recommendations for future research Final outcome of interest (injuries incurred in the home) should be measured rather than intermediate outcomes. Source of funding Robert Wood Johnson Foundation. Did the study collect data on and report information about barriers and facilitators to/of effectiveness? No. Observations from the Discussion section regarding barriers & facilitators Not applicable.

PUIC Home: Review of effectiveness and
cost-effectiveness
Appendices
– 270 –
Study details Population and setting Method of allocation to
intervention/control Outcomes, subgroups and methods of
analysis Notes Other 1 (2%) Of children n (% in trial arm): Intervention: Female 21 (43%) Control: Female 26 (55%) Ethnicity Of children n (% in trial arm): Intervention: Black 39 (80%) Hispanic 0 (0%) White 6 (12%) Other 4 (8%) Of children n (% in trial arm): Control: Black 34 (72%) Hispanic 1 (2%) White 8 (17%) Other 4 (8%) Other socioeconomic variables Educational attainment of caregivers n (% in trial arm): Intervention: <High school 4 (8%) High school 15 (31%) >High school 18 (37%) No response 12 (24%) Educational attainment of caregivers n (% in trial arm):
related to fire and window safety). Other components of scheme/intervention? None Intervention delivered: Comprehensive safety counselling delivered by trained lay personnel. Safety discharge advice described as ‘comprehensive’ (i.e. covering all child safety risks, not just those that caused the injury) and followed a scripted review of the safety leaflet. Control/comparison/s description Usual emergency department discharge care (verbal safety information) + safety tips leaflet. Sample sizes Total n= 136 Intervention n= 69 Control n= 67 Baseline comparisons No formal test upon baseline demographic
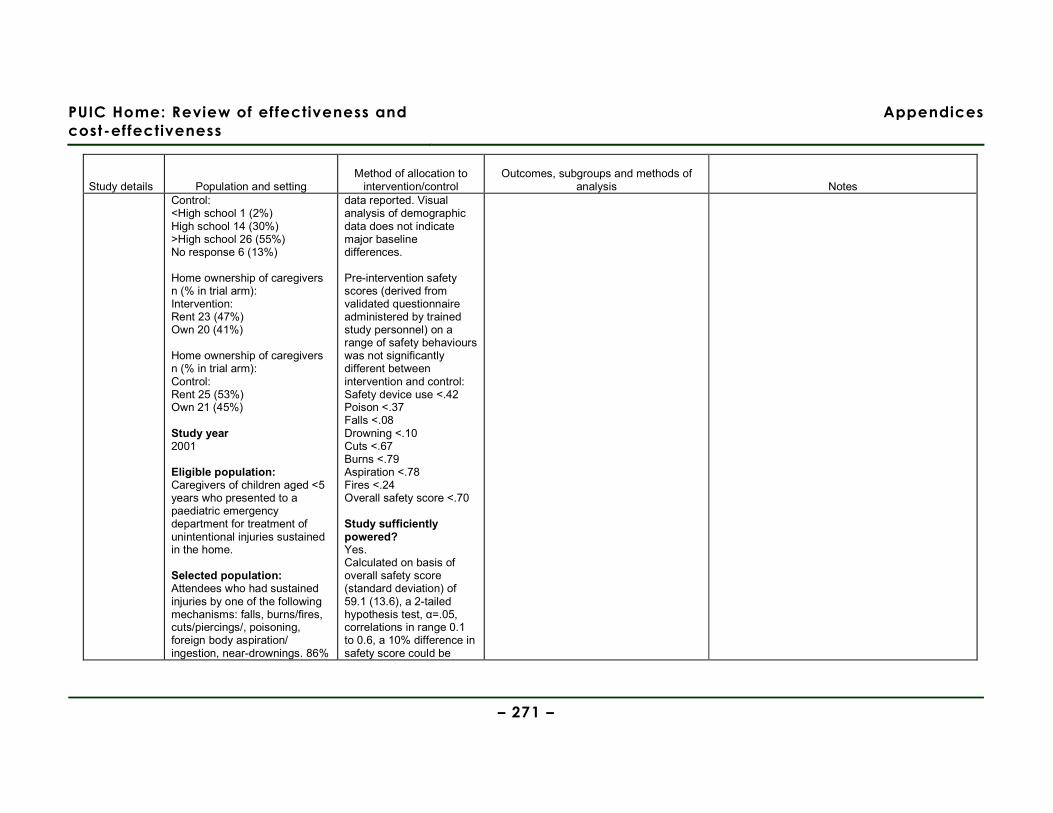
PUIC Home: Review of effectiveness and
cost-effectiveness
Appendices
– 271 –
Study details Population and setting Method of allocation to
intervention/control Outcomes, subgroups and methods of
analysis Notes Control: <High school 1 (2%) High school 14 (30%) >High school 26 (55%) No response 6 (13%) Home ownership of caregivers n (% in trial arm): Intervention: Rent 23 (47%) Own 20 (41%) Home ownership of caregivers n (% in trial arm): Control: Rent 25 (53%) Own 21 (45%) Study year 2001 Eligible population: Caregivers of children aged <5 years who presented to a paediatric emergency department for treatment of unintentional injuries sustained in the home. Selected population: Attendees who had sustained injuries by one of the following mechanisms: falls, burns/fires, cuts/piercings/, poisoning, foreign body aspiration/ ingestion, near-drownings. 86%
data reported. Visual analysis of demographic data does not indicate major baseline differences. Pre-intervention safety scores (derived from validated questionnaire administered by trained study personnel) on a range of safety behaviours was not significantly different between intervention and control: Safety device use <.42 Poison <.37 Falls <.08 Drowning <.10 Cuts <.67 Burns <.79 Aspiration <.78 Fires <.24 Overall safety score <.70 Study sufficiently powered? Yes. Calculated on basis of overall safety score (standard deviation) of 59.1 (13.6), a 2-tailed hypothesis test, α=.05, correlations in range 0.1 to 0.6, a 10% difference in safety score could be
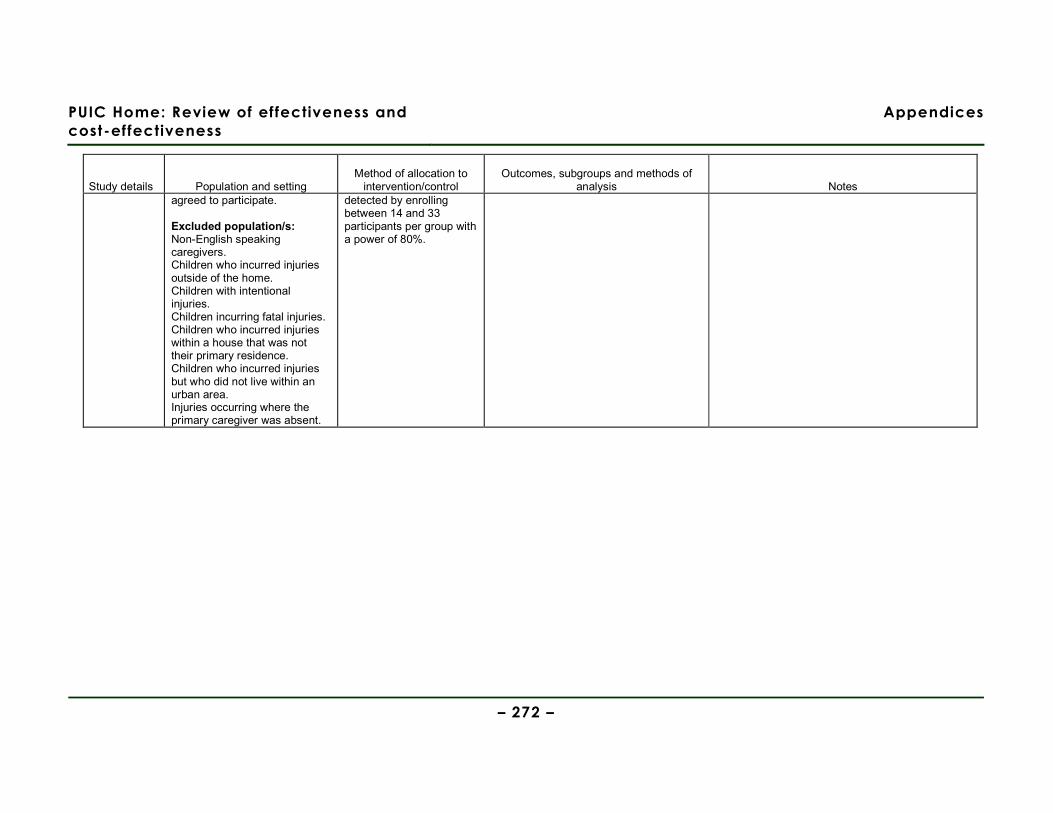
PUIC Home: Review of effectiveness and
cost-effectiveness
Appendices
– 272 –
Study details Population and setting Method of allocation to
intervention/control Outcomes, subgroups and methods of
analysis Notes agreed to participate. Excluded population/s: Non-English speaking caregivers. Children who incurred injuries outside of the home. Children with intentional injuries. Children incurring fatal injuries. Children who incurred injuries within a house that was not their primary residence. Children who incurred injuries but who did not live within an urban area. Injuries occurring where the primary caregiver was absent.
detected by enrolling between 14 and 33 participants per group with a power of 80%.
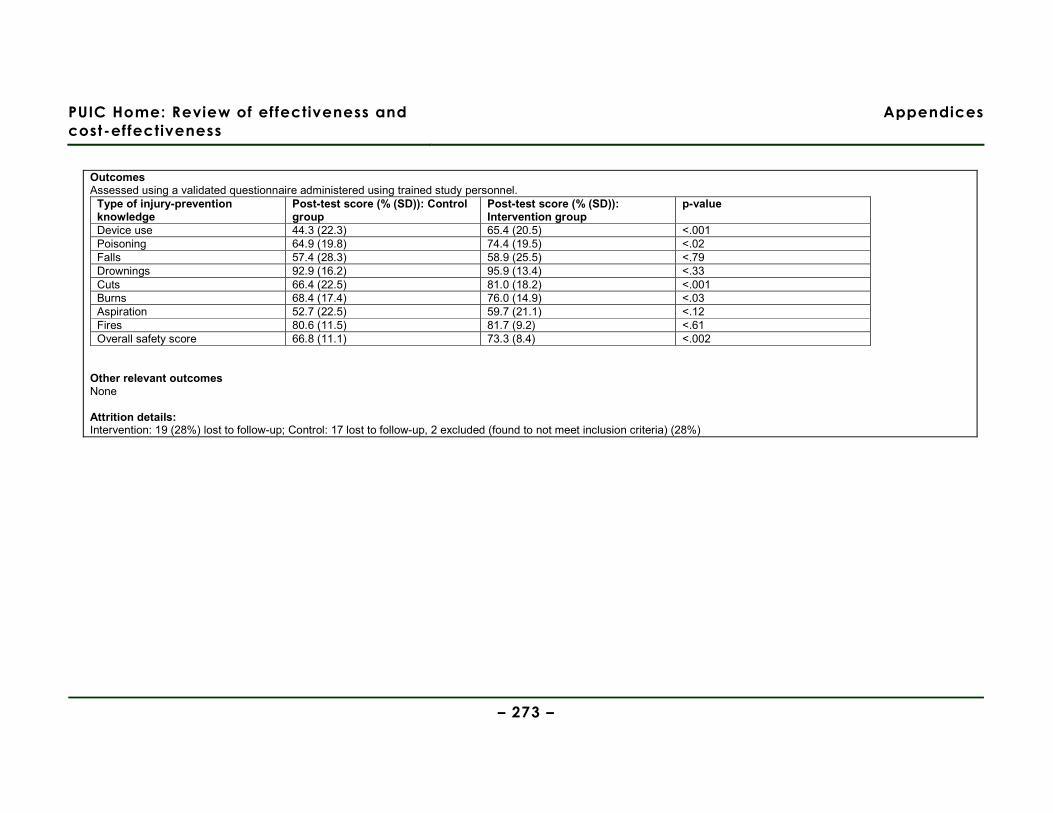
PUIC Home: Review of effectiveness and
cost-effectiveness
Appendices
– 273 –
Outcomes Assessed using a validated questionnaire administered using trained study personnel.
Type of injury-prevention knowledge
Post-test score (% (SD)): Control group
Post-test score (% (SD)): Intervention group
p-value
Device use 44.3 (22.3) 65.4 (20.5) <.001 Poisoning 64.9 (19.8) 74.4 (19.5) <.02 Falls 57.4 (28.3) 58.9 (25.5) <.79 Drownings 92.9 (16.2) 95.9 (13.4) <.33 Cuts 66.4 (22.5) 81.0 (18.2) <.001 Burns 68.4 (17.4) 76.0 (14.9) <.03 Aspiration 52.7 (22.5) 59.7 (21.1) <.12 Fires 80.6 (11.5) 81.7 (9.2) <.61 Overall safety score 66.8 (11.1) 73.3 (8.4) <.002
Other relevant outcomes None Attrition details: Intervention: 19 (28%) lost to follow-up; Control: 17 lost to follow-up, 2 excluded (found to not meet inclusion criteria) (28%)

PUIC Home: Review of effectiveness and
cost-effectiveness
Appendices
– 274 –
Study details Population and setting Method of allocation to
intervention/control Outcomes, subgroups and methods of
analysis Notes Authors Sangvai et al Year (of publication) 2007 Aim of study To evaluate the effectiveness of a Chronic Care Model approach to injury prevention in primary care settings (providing decision support and clinical information systems, and redesigning the health care delivery system with the aim of facilitating health promoting family behaviours).
Source area/s Country USA Setting Private and academic family practices Practice 1: Private, rural Practice 2: Private, urban Practice 3: Academic, urban Location (urban, rural) Both urban and rural Practice 1: Private, rural Practice 2: Private, urban Practice 3: Academic, urban Population demographics Age Children aged 0-5 % Female Not reported Ethnicity Practice 1: White 94% African American 2% Other 4% Practice 2: White 60% African American 34%
Method of allocation Randomised allocation sequence contained in sequentially numbered envelopes. Intervention/s description Type of intervention Education + supply of safety kit only
Other components of scheme/intervention? Counselling regarding use of car safety seats & safe storage of guns (outcomes not extracted in this table) Intervention delivered: Counselling (10-15 minutes) regarding the use of smoke detectors, safe storage of hazardous household materials, and setting of safe hot water tap temperature delivered by family practice medical staff, based upon a computerised 6-question assessment of parent’s home safety knowledge. A research health assistant
Outcomes Outcomes for the 3 practices are presented separately by the authors as there are significant differences between with regard to participants’ insurance status, ethnic group, maternal education and dwelling type. How is the data for each outcome collected? Authors intended to assess safety behaviour by observation (by research assistant blinded to arm allocation) during home visits, but only 27 participants (8%) agreed to this assessment of outcomes. Other relevant outcomes Not applicable Did the study collect data on and report resource use and/or costs No Timing of data collection Approximately 6 months post-intervention. Method of analysis No adjustments made for confounding variables. Presentation of analyses unclear, e.g. comparing intervention vs. control for some outcomes, but practice vs. practice for others. ITT analysis conducted for outcomes
Limitations identified by author Low recruitment rate. Potential for social-desirability bias in self-report. Potential home visit significantly discouraged participation in the study, although it is not clear why this was such a strong disincentive to participation. Limitations identified by review team Recruitment fell substantially short of stated ‘study feasibility’ sample size; n=319 (stated required n=1200 for adequate statistical power) and home visits (to observe outcomes) n=27 (stated required n=420). Reasons for substantial differences in successful recruitment to study within the different practices (e.g. Practice 1: 86%, Practice 2: 36% declined to participate) remain unacknowledged and unexplained. No details provided regarding the distribution of various items within the safety kits (according to need) between the three practices (and therefore to communities with differing socio-economic characteristics). Majority of outcomes compared by practice rather than by intervention vs. control groups – no rationale given, but possibly due to extremely low rate of agreement of participants to assessment of outcomes by home visit.

PUIC Home: Review of effectiveness and
cost-effectiveness
Appendices
– 275 –
Study details Population and setting Method of allocation to
intervention/control Outcomes, subgroups and methods of
analysis Notes Study design RCT Internal validity score [++, + or -] - External validity score [++, + or -] -
Other 6% Practice 3: White 14% African American 81% Other 5% Other socioeconomic variables (where available) Medical insurance: Practice 1: Private 63% Public 37% Practice 2: Private 64% Public 36% Practice 3: Private 11% Public 89% Maternal education: Practice 1: <High school 43% High school + any college 28% >College graduate 28% Unknown 0% Practice 2: <High school 25% High school + any college 28% >College graduate 45% Unknown 2% Practice 3:
also delivered generic safety counselling. A free, tailored safety equipment pack comprising (as indicated) smoke alarm, cupboard locks, and/or water temperature information cards was provided Control/comparison/s description ‘Standard physician counselling’ Sample sizes Total n= 319 Intervention n= 160 Control n= 159 Baseline comparisons Sociodemographic characteristics of participants are presented by family practice, but not by intervention/control group – so cannot assess if important baseline differences in this regard. Study sufficiently powered? No. Authors report that sample size of 1200 would be necessary to detect 40%
observed at home visit, but this is only a very small (8%) sub-set of the sample due to attrition. Were there any subgroups for which outcomes were reported? No If so, which subgroups were outcomes reported for? Not applicable. Were the subgroup analyses prespecified? Not applicable.
Self-reporting of home safety behaviours during telephone call not elicited using validated survey instrument. Evidence gaps and/or recommendations for future research None identified. Source of funding Agency for Health Care Research & Quality Did the study collect data on and report information about barriers and facilitators to/of effectiveness? Yes. Observations from the Discussion section regarding barriers & facilitators Authors hypothesise that possibility of home visits taking place discouraged many potential participants from taking part.
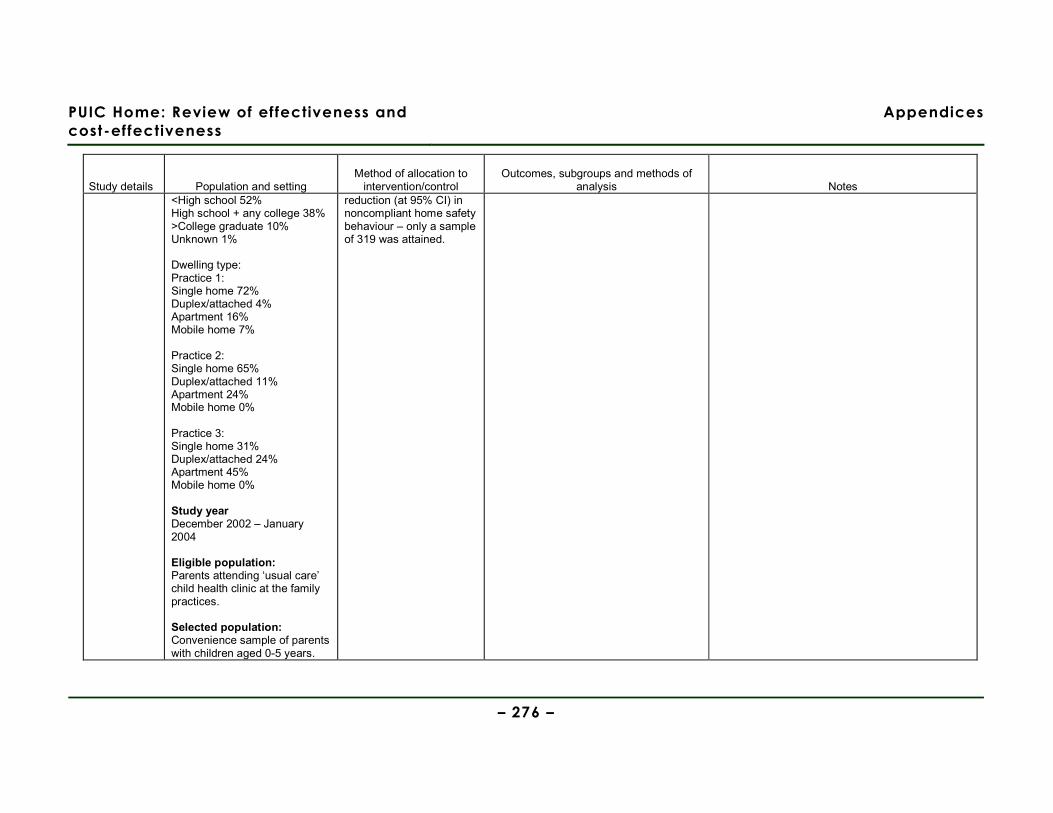
PUIC Home: Review of effectiveness and
cost-effectiveness
Appendices
– 276 –
Study details Population and setting Method of allocation to
intervention/control Outcomes, subgroups and methods of
analysis Notes <High school 52% High school + any college 38% >College graduate 10% Unknown 1% Dwelling type: Practice 1: Single home 72% Duplex/attached 4% Apartment 16% Mobile home 7% Practice 2: Single home 65% Duplex/attached 11% Apartment 24% Mobile home 0% Practice 3: Single home 31% Duplex/attached 24% Apartment 45% Mobile home 0% Study year December 2002 – January 2004 Eligible population: Parents attending ‘usual care’ child health clinic at the family practices. Selected population: Convenience sample of parents with children aged 0-5 years.
reduction (at 95% CI) in noncompliant home safety behaviour – only a sample of 319 was attained.
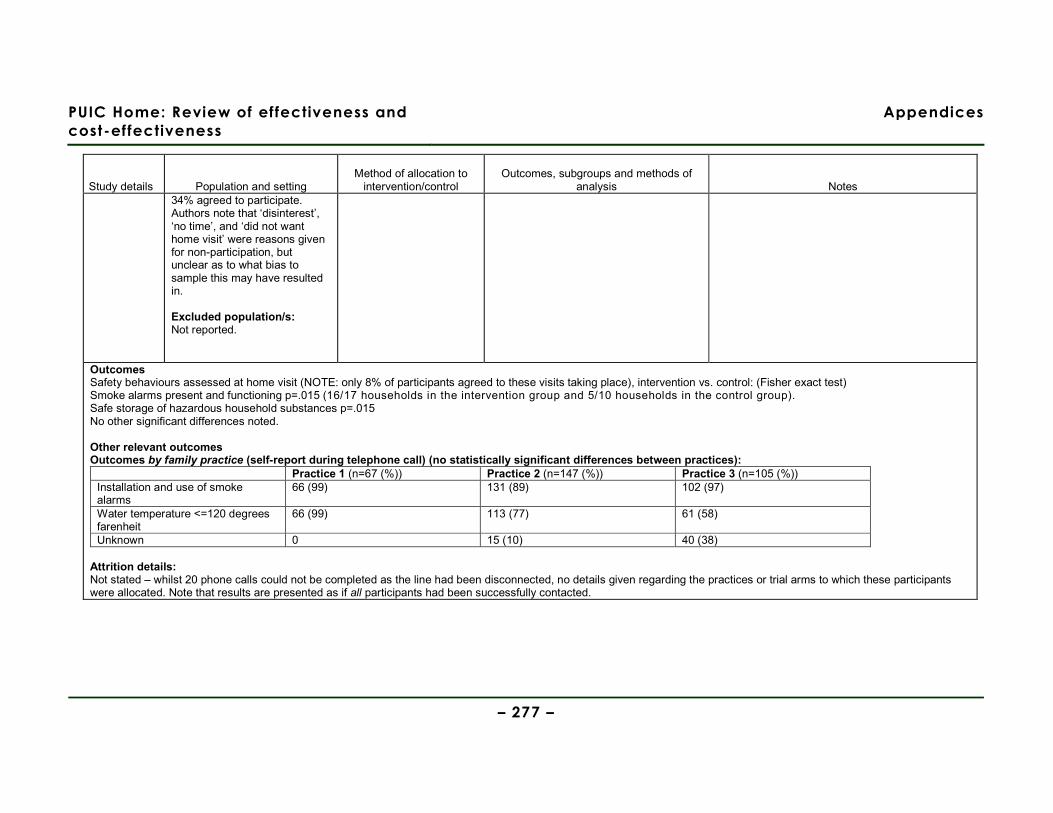
PUIC Home: Review of effectiveness and
cost-effectiveness
Appendices
– 277 –
Study details Population and setting Method of allocation to
intervention/control Outcomes, subgroups and methods of
analysis Notes 34% agreed to participate. Authors note that ‘disinterest’, ‘no time’, and ‘did not want home visit’ were reasons given for non-participation, but unclear as to what bias to sample this may have resulted in. Excluded population/s: Not reported.
Outcomes Safety behaviours assessed at home visit (NOTE: only 8% of participants agreed to these visits taking place), intervention vs. control: (Fisher exact test) Smoke alarms present and functioning p=.015 (16/17 households in the intervention group and 5/10 households in the control group). Safe storage of hazardous household substances p=.015 No other significant differences noted. Other relevant outcomes Outcomes by family practice (self-report during telephone call) (no statistically significant differences between practices):
Practice 1 (n=67 (%)) Practice 2 (n=147 (%)) Practice 3 (n=105 (%)) Installation and use of smoke alarms
66 (99) 131 (89) 102 (97)
Water temperature <=120 degrees farenheit
66 (99) 113 (77) 61 (58)
Unknown 0 15 (10) 40 (38) Attrition details: Not stated – whilst 20 phone calls could not be completed as the line had been disconnected, no details given regarding the practices or trial arms to which these participants were allocated. Note that results are presented as if all participants had been successfully contacted.
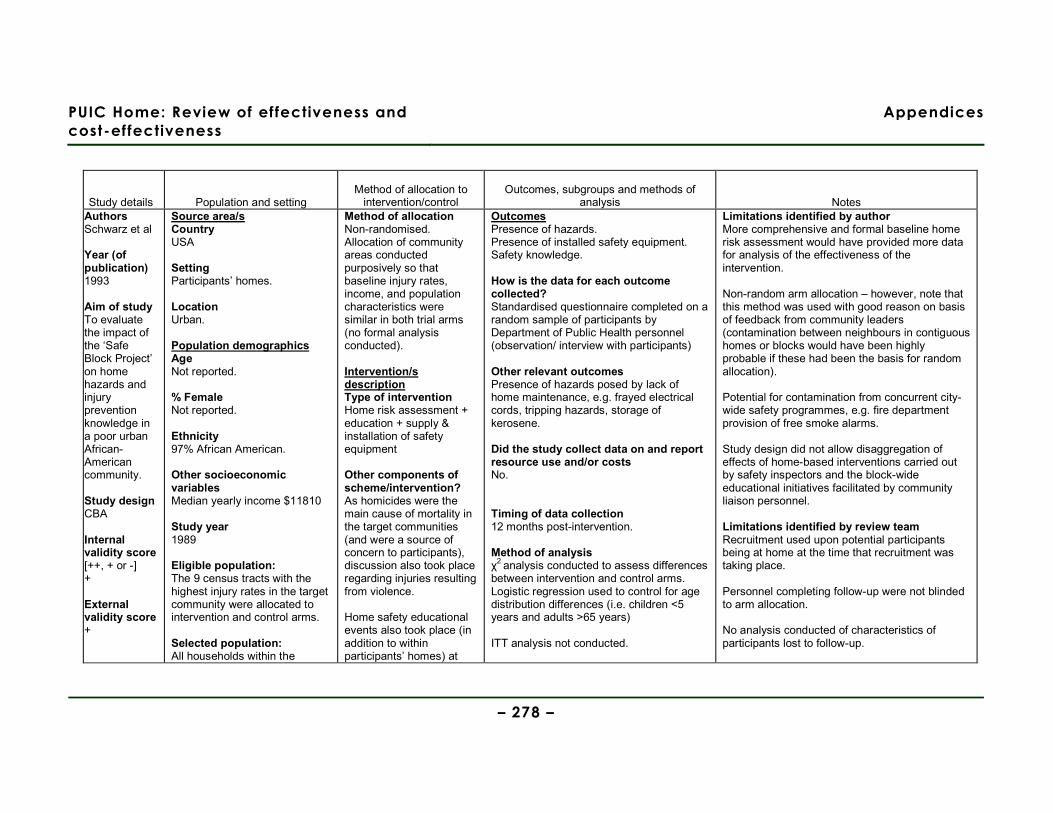
PUIC Home: Review of effectiveness and
cost-effectiveness
Appendices
– 278 –
Study details Population and setting Method of allocation to
intervention/control Outcomes, subgroups and methods of
analysis Notes Authors Schwarz et al Year (of publication) 1993
Aim of study To evaluate the impact of the ‘Safe Block Project’ on home hazards and injury prevention knowledge in a poor urban African-American community. Study design CBA Internal validity score [++, + or -] + External validity score +
Source area/s Country USA Setting Participants’ homes. Location Urban. Population demographics Age Not reported. % Female Not reported. Ethnicity 97% African American. Other socioeconomic variables Median yearly income $11810 Study year 1989 Eligible population: The 9 census tracts with the highest injury rates in the target community were allocated to intervention and control arms. Selected population: All households within the
Method of allocation Non-randomised. Allocation of community areas conducted purposively so that baseline injury rates, income, and population characteristics were similar in both trial arms (no formal analysis conducted). Intervention/s description Type of intervention Home risk assessment + education + supply & installation of safety equipment Other components of scheme/intervention? As homicides were the main cause of mortality in the target communities (and were a source of concern to participants), discussion also took place regarding injuries resulting from violence. Home safety educational events also took place (in addition to within participants’ homes) at
Outcomes Presence of hazards. Presence of installed safety equipment. Safety knowledge. How is the data for each outcome collected? Standardised questionnaire completed on a random sample of participants by Department of Public Health personnel (observation/ interview with participants) Other relevant outcomes Presence of hazards posed by lack of home maintenance, e.g. frayed electrical cords, tripping hazards, storage of kerosene. Did the study collect data on and report resource use and/or costs No. Timing of data collection 12 months post-intervention. Method of analysis χ2 analysis conducted to assess differences between intervention and control arms. Logistic regression used to control for age distribution differences (i.e. children <5 years and adults >65 years) ITT analysis not conducted.
Limitations identified by author More comprehensive and formal baseline home risk assessment would have provided more data for analysis of the effectiveness of the intervention. Non-random arm allocation – however, note that this method was used with good reason on basis of feedback from community leaders (contamination between neighbours in contiguous homes or blocks would have been highly probable if these had been the basis for random allocation). Potential for contamination from concurrent city-wide safety programmes, e.g. fire department provision of free smoke alarms. Study design did not allow disaggregation of effects of home-based interventions carried out by safety inspectors and the block-wide educational initiatives facilitated by community liaison personnel. Limitations identified by review team Recruitment used upon potential participants being at home at the time that recruitment was taking place. Personnel completing follow-up were not blinded to arm allocation. No analysis conducted of characteristics of participants lost to follow-up.
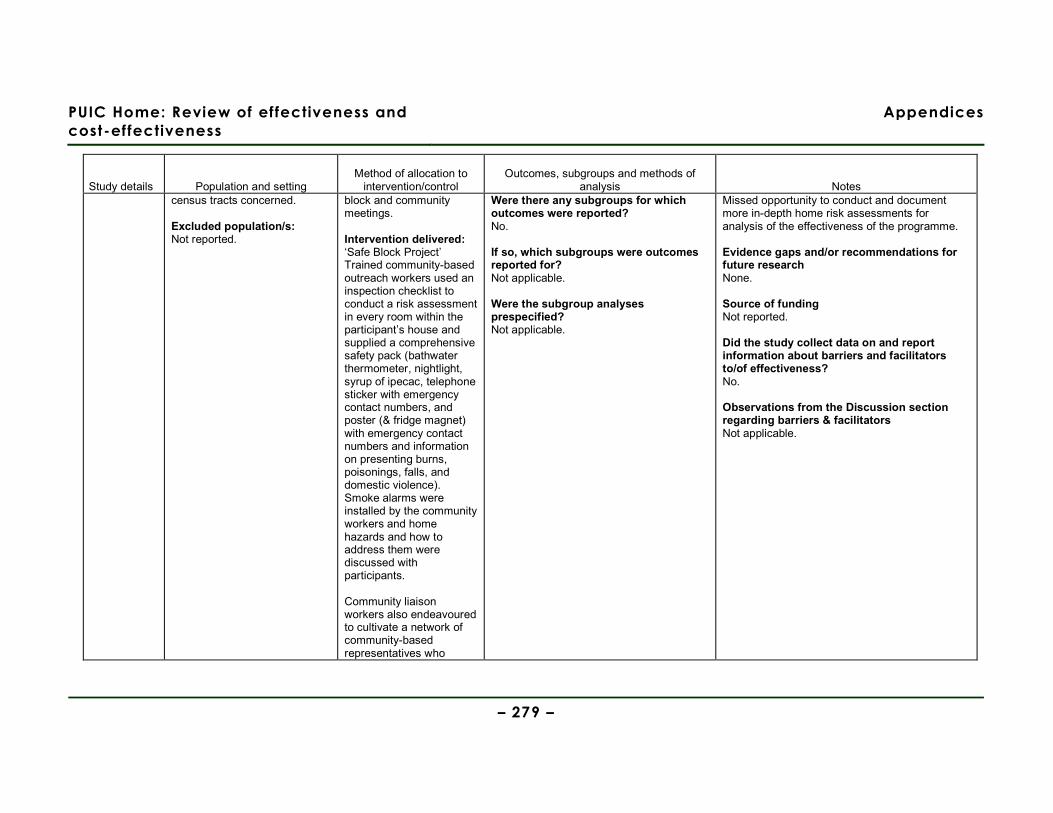
PUIC Home: Review of effectiveness and
cost-effectiveness
Appendices
– 279 –
Study details Population and setting Method of allocation to
intervention/control Outcomes, subgroups and methods of
analysis Notes census tracts concerned. Excluded population/s: Not reported.
block and community meetings. Intervention delivered: ‘Safe Block Project’ Trained community-based outreach workers used an inspection checklist to conduct a risk assessment in every room within the participant’s house and supplied a comprehensive safety pack (bathwater thermometer, nightlight, syrup of ipecac, telephone sticker with emergency contact numbers, and poster (& fridge magnet) with emergency contact numbers and information on presenting burns, poisonings, falls, and domestic violence). Smoke alarms were installed by the community workers and home hazards and how to address them were discussed with participants. Community liaison workers also endeavoured to cultivate a network of community-based representatives who
Were there any subgroups for which outcomes were reported? No. If so, which subgroups were outcomes reported for? Not applicable. Were the subgroup analyses prespecified? Not applicable.
Missed opportunity to conduct and document more in-depth home risk assessments for analysis of the effectiveness of the programme. Evidence gaps and/or recommendations for future research None. Source of funding Not reported. Did the study collect data on and report information about barriers and facilitators to/of effectiveness? No. Observations from the Discussion section regarding barriers & facilitators Not applicable.

PUIC Home: Review of effectiveness and
cost-effectiveness
Appendices
– 280 –
Study details Population and setting Method of allocation to
intervention/control Outcomes, subgroups and methods of
analysis Notes would continue to be involved with home safety education Control/comparison/s description No intervention. Sample sizes Total n= 2722 Intervention n= 1250 Control n= 1472 Baseline comparisons No formal analysis conducted, but intervention and control arms were purposively allocated so that baseline injury rates, income, and population characteristics were similar. Study sufficiently powered? Not reported.
Outcomes Hazards in the home that required minimal effort to correct:
Intervention group (%) Control group (%) p Adjusted odds ratio (95% CI)
No syrup of ipecac for children aged <5 years
29.0 90.2 <.001 0.04 (0.02, 0.07)
No smoke alarm 4.0 23.0 <.001 0.14 (0.09, 0.20) Hot water temperature >125°F
36.8 26.8 <.001 1.73 (1.39, 2.15)
Inadequate lighting on stairs 17.9 19.9 .41 0.90 (0.69, 1.16)

PUIC Home: Review of effectiveness and
cost-effectiveness
Appendices
– 281 –
Study details Population and setting Method of allocation to
intervention/control Outcomes, subgroups and methods of
analysis Notes Hazard in the home that required moderate effort to correct:
Intervention group (%) Control group (%) p Adjusted odds ratio (95% CI)
No fire escape plan 68.7 84.9 <.001 0.30 (0.24, 0.38) Medications within reach (where children aged <5 y)
48.4 64.4 <.001 0.48 (0.33, 0.71)
Medications without childproof caps (where children aged <5 y)
26.2 16.3 .08 1.53 (0.95, 2.46)
Medications either within reach or without childproof caps (where children aged <5 y)
24.8 15.4 .08 1.54 (0.95, 2.50)
Other relevant outcomes None. Attrition details: Approximately 40% of the sample were randomly selected for follow-up; of these, 28% of both the intervention and control arms were lost to follow-up.
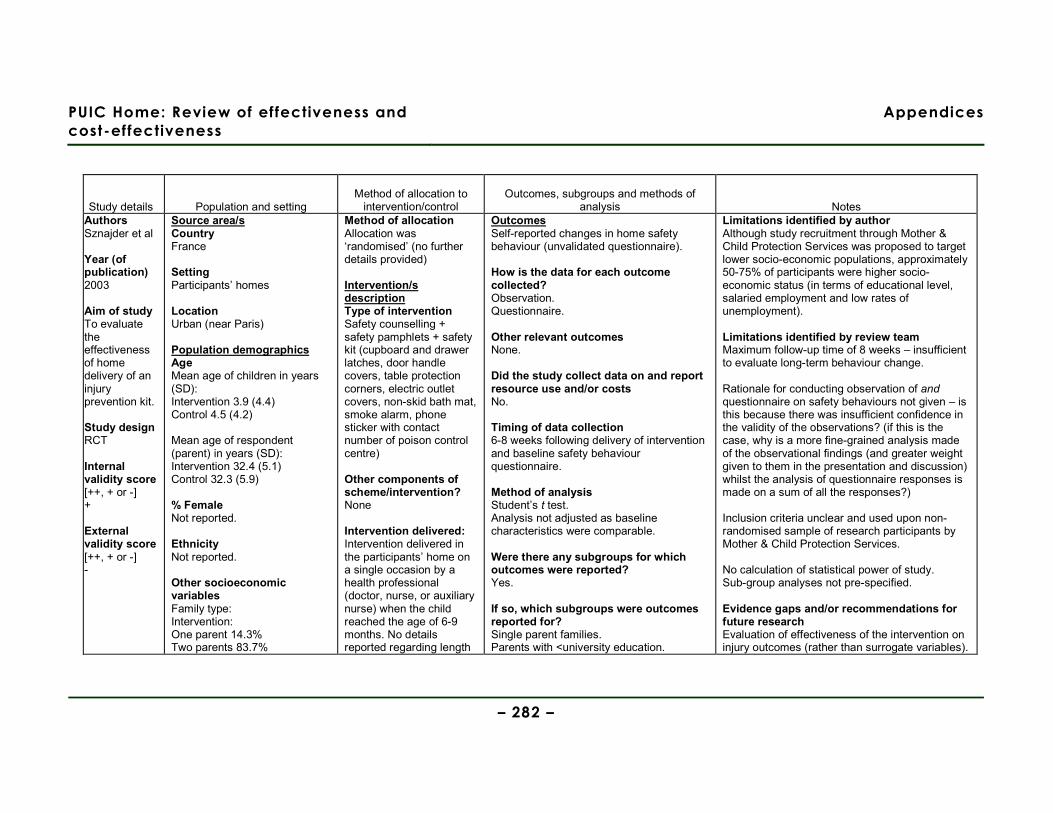
PUIC Home: Review of effectiveness and
cost-effectiveness
Appendices
– 282 –
Study details Population and setting Method of allocation to
intervention/control Outcomes, subgroups and methods of
analysis Notes Authors Sznajder et al Year (of publication) 2003 Aim of study To evaluate the effectiveness of home delivery of an injury prevention kit. Study design RCT
Internal validity score [++, + or -] + External validity score [++, + or -] -
Source area/s Country France Setting Participants’ homes Location Urban (near Paris) Population demographics Age Mean age of children in years (SD): Intervention 3.9 (4.4) Control 4.5 (4.2) Mean age of respondent (parent) in years (SD): Intervention 32.4 (5.1) Control 32.3 (5.9) % Female Not reported. Ethnicity Not reported. Other socioeconomic variables Family type: Intervention: One parent 14.3% Two parents 83.7%
Method of allocation Allocation was ‘randomised’ (no further details provided) Intervention/s description Type of intervention Safety counselling + safety pamphlets + safety kit (cupboard and drawer latches, door handle covers, table protection corners, electric outlet covers, non-skid bath mat, smoke alarm, phone sticker with contact number of poison control centre)
Other components of scheme/intervention? None Intervention delivered: Intervention delivered in the participants’ home on a single occasion by a health professional (doctor, nurse, or auxiliary nurse) when the child reached the age of 6-9 months. No details reported regarding length
Outcomes Self-reported changes in home safety behaviour (unvalidated questionnaire). How is the data for each outcome collected? Observation. Questionnaire. Other relevant outcomes None. Did the study collect data on and report resource use and/or costs No. Timing of data collection 6-8 weeks following delivery of intervention and baseline safety behaviour questionnaire. Method of analysis Student’s t test. Analysis not adjusted as baseline characteristics were comparable. Were there any subgroups for which outcomes were reported? Yes. If so, which subgroups were outcomes reported for? Single parent families. Parents with <university education.
Limitations identified by author Although study recruitment through Mother & Child Protection Services was proposed to target lower socio-economic populations, approximately 50-75% of participants were higher socio-economic status (in terms of educational level, salaried employment and low rates of unemployment). Limitations identified by review team Maximum follow-up time of 8 weeks – insufficient to evaluate long-term behaviour change. Rationale for conducting observation of and questionnaire on safety behaviours not given – is this because there was insufficient confidence in the validity of the observations? (if this is the case, why is a more fine-grained analysis made of the observational findings (and greater weight given to them in the presentation and discussion) whilst the analysis of questionnaire responses is made on a sum of all the responses?) Inclusion criteria unclear and used upon non-randomised sample of research participants by Mother & Child Protection Services. No calculation of statistical power of study. Sub-group analyses not pre-specified. Evidence gaps and/or recommendations for future research Evaluation of effectiveness of the intervention on injury outcomes (rather than surrogate variables).
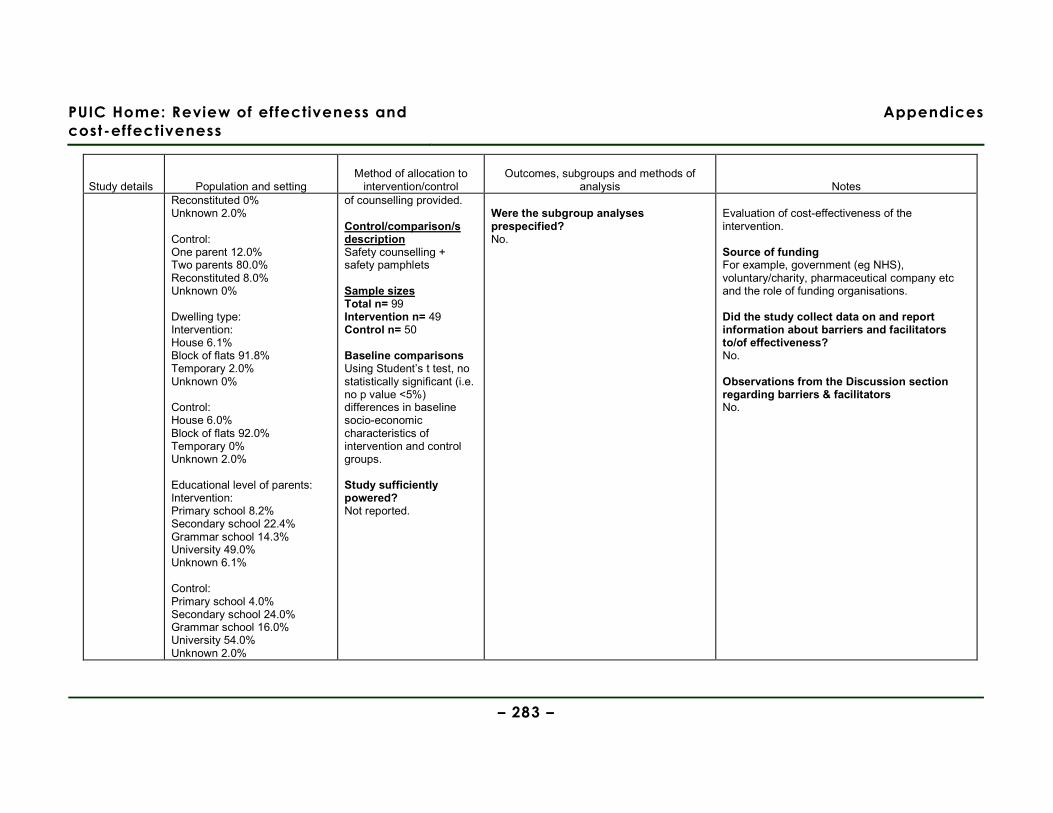
PUIC Home: Review of effectiveness and
cost-effectiveness
Appendices
– 283 –
Study details Population and setting Method of allocation to
intervention/control Outcomes, subgroups and methods of
analysis Notes Reconstituted 0% Unknown 2.0% Control: One parent 12.0% Two parents 80.0% Reconstituted 8.0% Unknown 0% Dwelling type: Intervention: House 6.1% Block of flats 91.8% Temporary 2.0% Unknown 0% Control: House 6.0% Block of flats 92.0% Temporary 0% Unknown 2.0% Educational level of parents: Intervention: Primary school 8.2% Secondary school 22.4% Grammar school 14.3% University 49.0% Unknown 6.1% Control: Primary school 4.0% Secondary school 24.0% Grammar school 16.0% University 54.0% Unknown 2.0%
of counselling provided. Control/comparison/s description Safety counselling + safety pamphlets Sample sizes Total n= 99 Intervention n= 49 Control n= 50 Baseline comparisons Using Student’s t test, no statistically significant (i.e. no p value <5%) differences in baseline socio-economic characteristics of intervention and control groups. Study sufficiently powered? Not reported.
Were the subgroup analyses prespecified? No.
Evaluation of cost-effectiveness of the intervention. Source of funding For example, government (eg NHS), voluntary/charity, pharmaceutical company etc and the role of funding organisations. Did the study collect data on and report information about barriers and facilitators to/of effectiveness? No. Observations from the Discussion section regarding barriers & facilitators No.

PUIC Home: Review of effectiveness and
cost-effectiveness
Appendices
– 284 –
Study details Population and setting Method of allocation to
intervention/control Outcomes, subgroups and methods of
analysis Notes Employment: Intervention: Salaried post 63.3% Independent 0% Training 2.0% Unemployed 4.0% Homemaker 30.7% Control: Salaried post 58.0% Independent 2.0% Training 0% Unemployed 2.0% Homemaker 32.0% Mean number of children in household (SD): Intervention 1.7 (0.8) Control 1.9 (1.0) Primipara: Intervention 49% Control 42% Study year October 2000 – April 2001 Eligible population: Families selected by Mother & Child Protection Services; this service’s usual criteria for involvement are primipara, medical, psychological, and/or socioeconomic difficulties. No formal comparison of
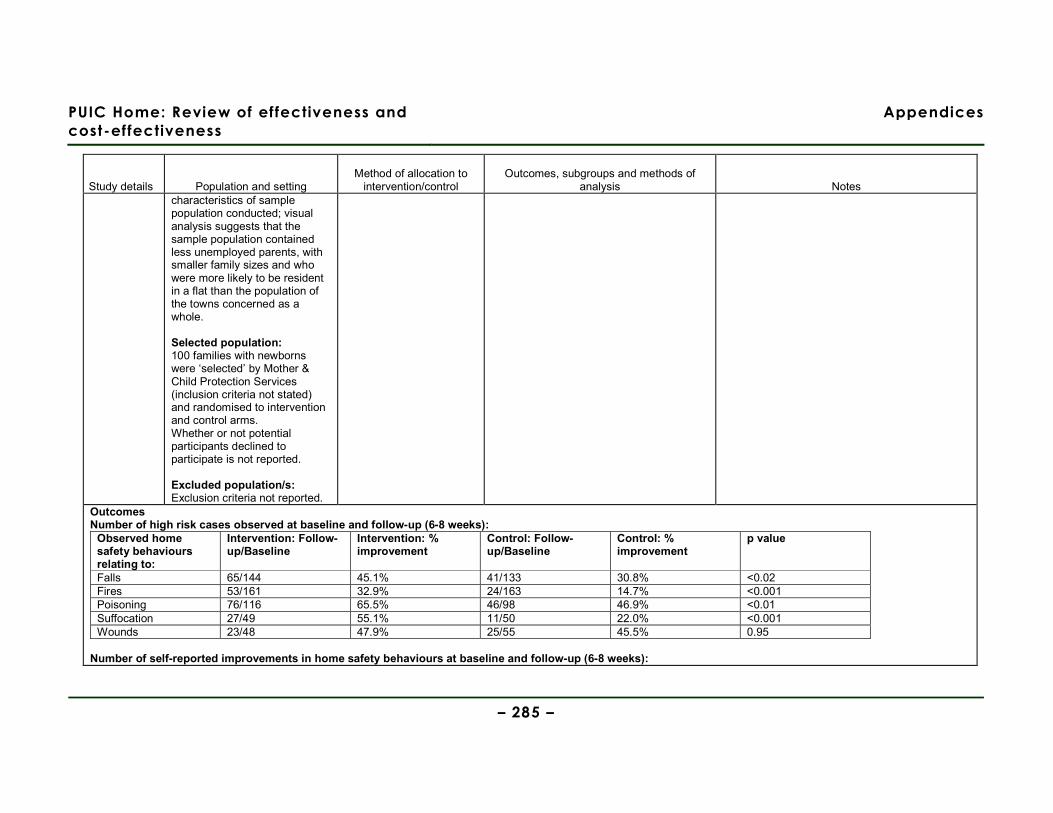
PUIC Home: Review of effectiveness and
cost-effectiveness
Appendices
– 285 –
Study details Population and setting Method of allocation to
intervention/control Outcomes, subgroups and methods of
analysis Notes characteristics of sample population conducted; visual analysis suggests that the sample population contained less unemployed parents, with smaller family sizes and who were more likely to be resident in a flat than the population of the towns concerned as a whole. Selected population: 100 families with newborns were ‘selected’ by Mother & Child Protection Services (inclusion criteria not stated) and randomised to intervention and control arms. Whether or not potential participants declined to participate is not reported. Excluded population/s: Exclusion criteria not reported.
Outcomes Number of high risk cases observed at baseline and follow-up (6-8 weeks):
Observed home safety behaviours relating to:
Intervention: Follow-up/Baseline
Intervention: % improvement
Control: Follow-up/Baseline
Control: % improvement
p value
Falls 65/144 45.1% 41/133 30.8% <0.02 Fires 53/161 32.9% 24/163 14.7% <0.001 Poisoning 76/116 65.5% 46/98 46.9% <0.01 Suffocation 27/49 55.1% 11/50 22.0% <0.001 Wounds 23/48 47.9% 25/55 45.5% 0.95
Number of self-reported improvements in home safety behaviours at baseline and follow-up (6-8 weeks):
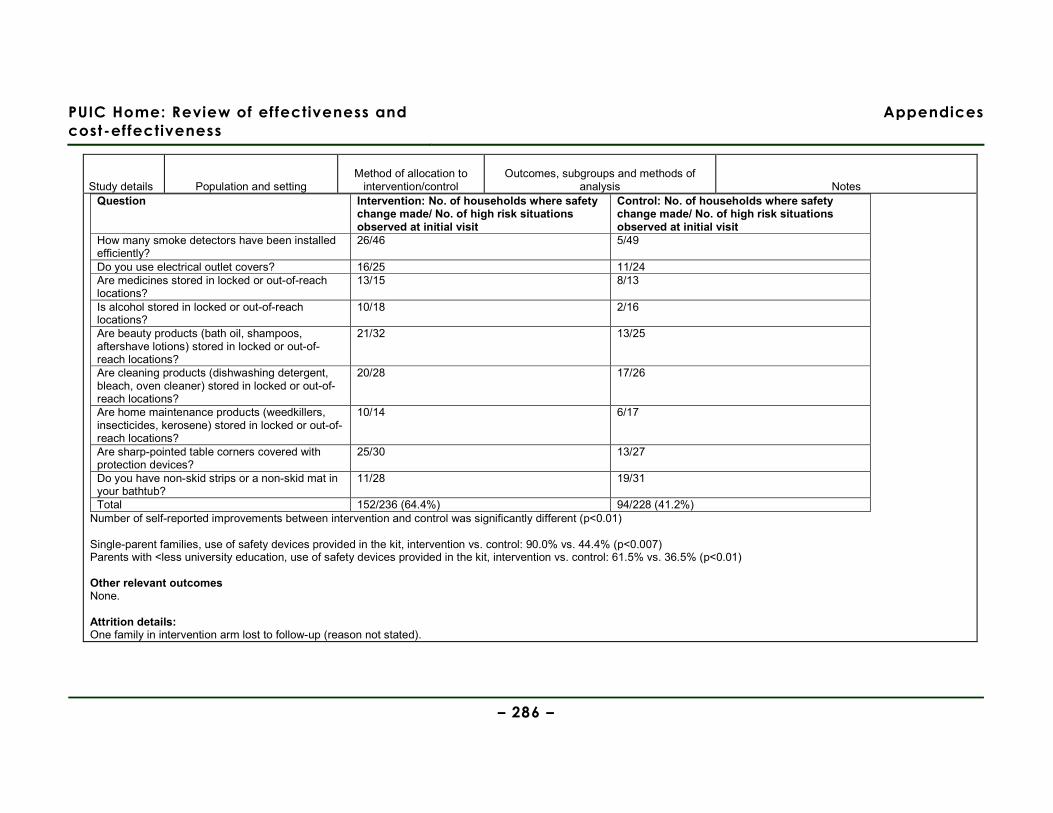
PUIC Home: Review of effectiveness and
cost-effectiveness
Appendices
– 286 –
Study details Population and setting Method of allocation to
intervention/control Outcomes, subgroups and methods of
analysis Notes Question Intervention: No. of households where safety
change made/ No. of high risk situations observed at initial visit
Control: No. of households where safety change made/ No. of high risk situations observed at initial visit
How many smoke detectors have been installed efficiently?
26/46 5/49
Do you use electrical outlet covers? 16/25 11/24 Are medicines stored in locked or out-of-reach locations?
13/15 8/13
Is alcohol stored in locked or out-of-reach locations?
10/18 2/16
Are beauty products (bath oil, shampoos, aftershave lotions) stored in locked or out-of-reach locations?
21/32 13/25
Are cleaning products (dishwashing detergent, bleach, oven cleaner) stored in locked or out-of-reach locations?
20/28 17/26
Are home maintenance products (weedkillers, insecticides, kerosene) stored in locked or out-of-reach locations?
10/14 6/17
Are sharp-pointed table corners covered with protection devices?
25/30 13/27
Do you have non-skid strips or a non-skid mat in your bathtub?
11/28 19/31
Total 152/236 (64.4%) 94/228 (41.2%) Number of self-reported improvements between intervention and control was significantly different (p<0.01) Single-parent families, use of safety devices provided in the kit, intervention vs. control: 90.0% vs. 44.4% (p<0.007) Parents with <less university education, use of safety devices provided in the kit, intervention vs. control: 61.5% vs. 36.5% (p<0.01) Other relevant outcomes None. Attrition details: One family in intervention arm lost to follow-up (reason not stated).
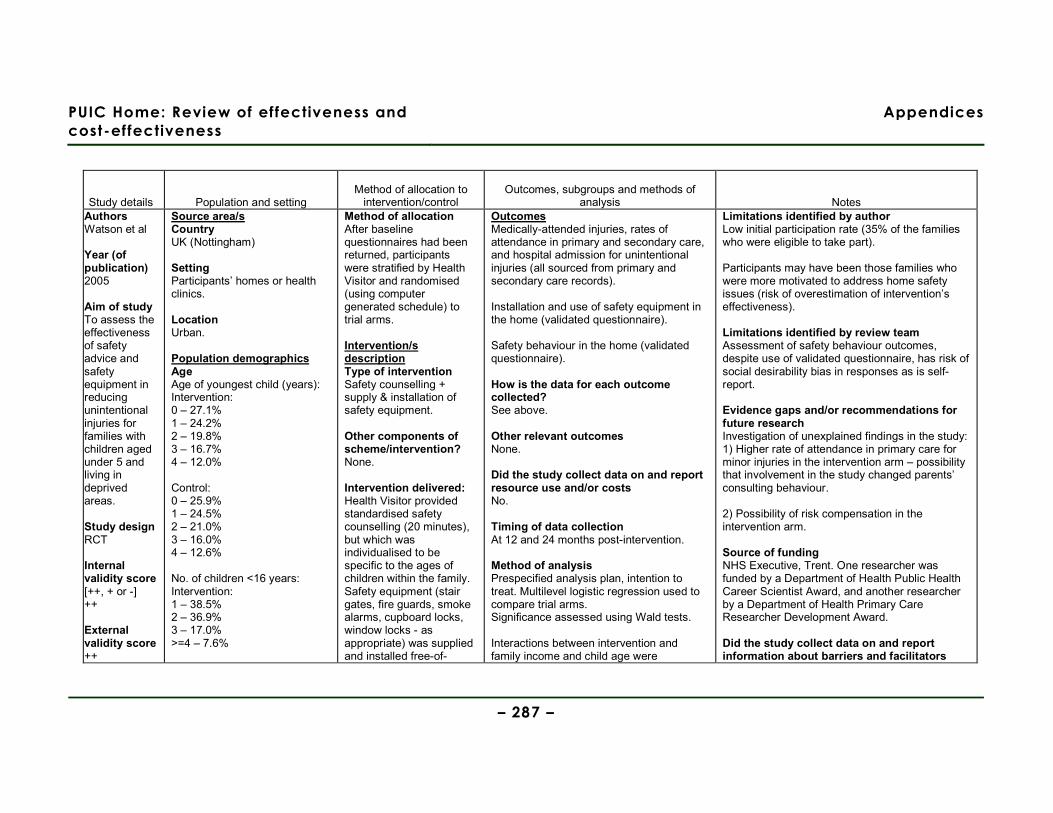
PUIC Home: Review of effectiveness and
cost-effectiveness
Appendices
– 287 –
Study details Population and setting Method of allocation to
intervention/control Outcomes, subgroups and methods of
analysis Notes Authors Watson et al Year (of publication) 2005
Aim of study To assess the effectiveness of safety advice and safety equipment in reducing unintentional injuries for families with children aged under 5 and living in deprived areas. Study design RCT Internal validity score [++, + or -] ++ External validity score ++
Source area/s Country UK (Nottingham) Setting Participants’ homes or health clinics. Location Urban. Population demographics Age Age of youngest child (years): Intervention: 0 – 27.1% 1 – 24.2% 2 – 19.8% 3 – 16.7% 4 – 12.0% Control: 0 – 25.9% 1 – 24.5% 2 – 21.0% 3 – 16.0% 4 – 12.6% No. of children <16 years: Intervention: 1 – 38.5% 2 – 36.9% 3 – 17.0% >=4 – 7.6%
Method of allocation After baseline questionnaires had been returned, participants were stratified by Health Visitor and randomised (using computer generated schedule) to trial arms. Intervention/s description Type of intervention Safety counselling + supply & installation of safety equipment. Other components of scheme/intervention? None. Intervention delivered: Health Visitor provided standardised safety counselling (20 minutes), but which was individualised to be specific to the ages of children within the family. Safety equipment (stair gates, fire guards, smoke alarms, cupboard locks, window locks - as appropriate) was supplied and installed free-of-
Outcomes Medically-attended injuries, rates of attendance in primary and secondary care, and hospital admission for unintentional injuries (all sourced from primary and secondary care records). Installation and use of safety equipment in the home (validated questionnaire). Safety behaviour in the home (validated questionnaire). How is the data for each outcome collected? See above. Other relevant outcomes None. Did the study collect data on and report resource use and/or costs No. Timing of data collection At 12 and 24 months post-intervention. Method of analysis Prespecified analysis plan, intention to treat. Multilevel logistic regression used to compare trial arms. Significance assessed using Wald tests. Interactions between intervention and family income and child age were
Limitations identified by author Low initial participation rate (35% of the families who were eligible to take part). Participants may have been those families who were more motivated to address home safety issues (risk of overestimation of intervention’s effectiveness). Limitations identified by review team Assessment of safety behaviour outcomes, despite use of validated questionnaire, has risk of social desirability bias in responses as is self-report. Evidence gaps and/or recommendations for future research Investigation of unexplained findings in the study: 1) Higher rate of attendance in primary care for minor injuries in the intervention arm – possibility that involvement in the study changed parents’ consulting behaviour. 2) Possibility of risk compensation in the intervention arm. Source of funding NHS Executive, Trent. One researcher was funded by a Department of Health Public Health Career Scientist Award, and another researcher by a Department of Health Primary Care Researcher Development Award. Did the study collect data on and report information about barriers and facilitators
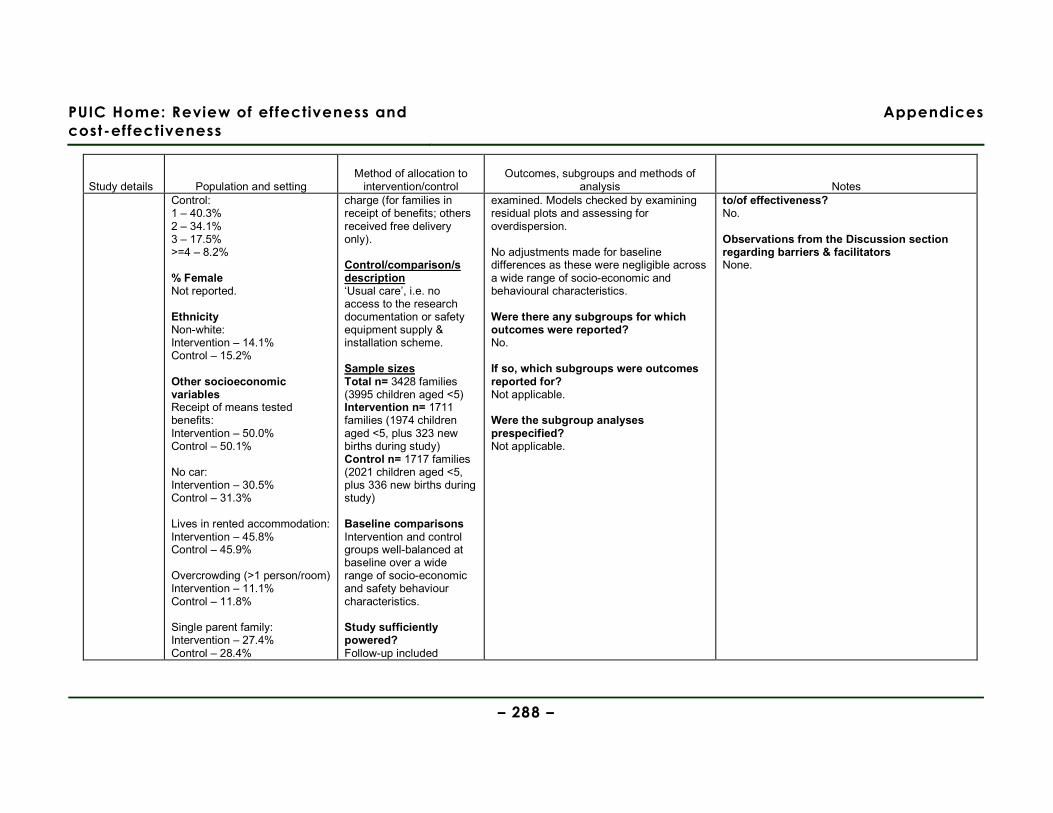
PUIC Home: Review of effectiveness and
cost-effectiveness
Appendices
– 288 –
Study details Population and setting Method of allocation to
intervention/control Outcomes, subgroups and methods of
analysis Notes Control: 1 – 40.3% 2 – 34.1% 3 – 17.5% >=4 – 8.2% % Female Not reported. Ethnicity Non-white: Intervention – 14.1% Control – 15.2% Other socioeconomic variables Receipt of means tested benefits: Intervention – 50.0% Control – 50.1% No car: Intervention – 30.5% Control – 31.3% Lives in rented accommodation: Intervention – 45.8% Control – 45.9% Overcrowding (>1 person/room) Intervention – 11.1% Control – 11.8% Single parent family: Intervention – 27.4% Control – 28.4%
charge (for families in receipt of benefits; others received free delivery only). Control/comparison/s description ‘Usual care’, i.e. no access to the research documentation or safety equipment supply & installation scheme. Sample sizes Total n= 3428 families (3995 children aged <5) Intervention n= 1711 families (1974 children aged <5, plus 323 new births during study) Control n= 1717 families (2021 children aged <5, plus 336 new births during study) Baseline comparisons Intervention and control groups well-balanced at baseline over a wide range of socio-economic and safety behaviour characteristics. Study sufficiently powered? Follow-up included
examined. Models checked by examining residual plots and assessing for overdispersion. No adjustments made for baseline differences as these were negligible across a wide range of socio-economic and behavioural characteristics. Were there any subgroups for which outcomes were reported? No. If so, which subgroups were outcomes reported for? Not applicable. Were the subgroup analyses prespecified? Not applicable.
to/of effectiveness? No. Observations from the Discussion section regarding barriers & facilitators None.
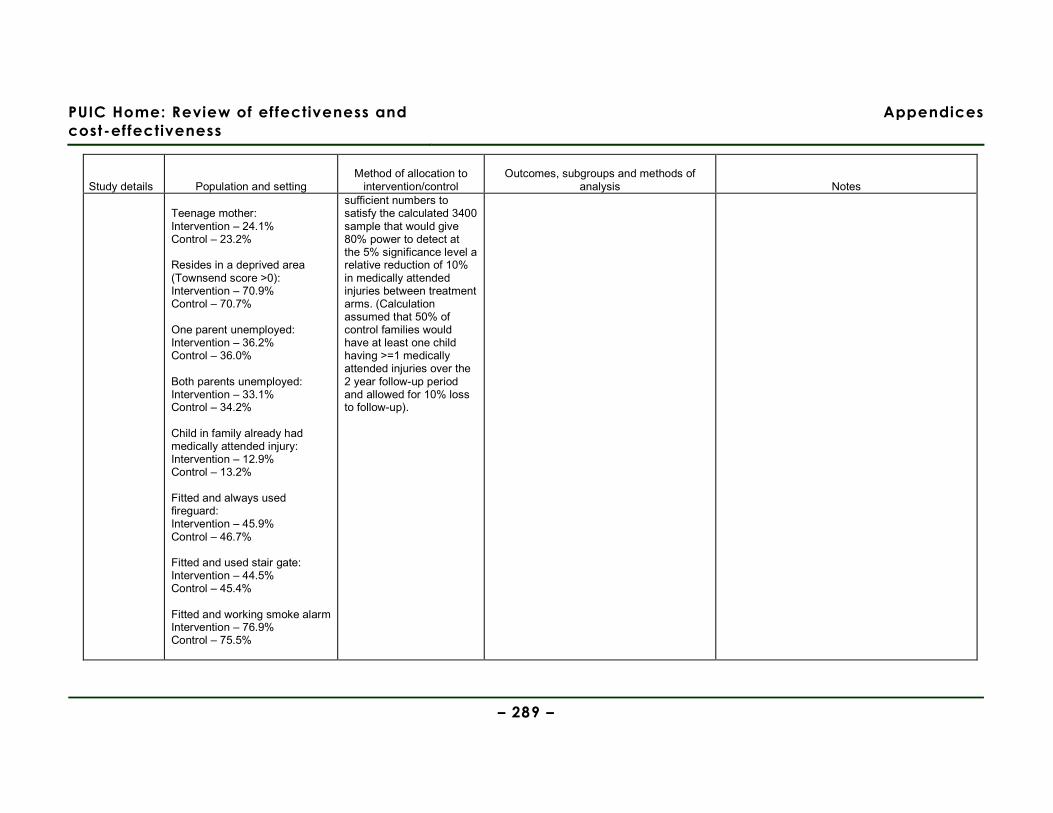
PUIC Home: Review of effectiveness and
cost-effectiveness
Appendices
– 289 –
Study details Population and setting Method of allocation to
intervention/control Outcomes, subgroups and methods of
analysis Notes Teenage mother: Intervention – 24.1% Control – 23.2% Resides in a deprived area (Townsend score >0): Intervention – 70.9% Control – 70.7% One parent unemployed: Intervention – 36.2% Control – 36.0% Both parents unemployed: Intervention – 33.1% Control – 34.2% Child in family already had medically attended injury: Intervention – 12.9% Control – 13.2% Fitted and always used fireguard: Intervention – 45.9% Control – 46.7% Fitted and used stair gate: Intervention – 44.5% Control – 45.4% Fitted and working smoke alarm Intervention – 76.9% Control – 75.5%
sufficient numbers to satisfy the calculated 3400 sample that would give 80% power to detect at the 5% significance level a relative reduction of 10% in medically attended injuries between treatment arms. (Calculation assumed that 50% of control families would have at least one child having >=1 medically attended injuries over the 2 year follow-up period and allowed for 10% loss to follow-up).
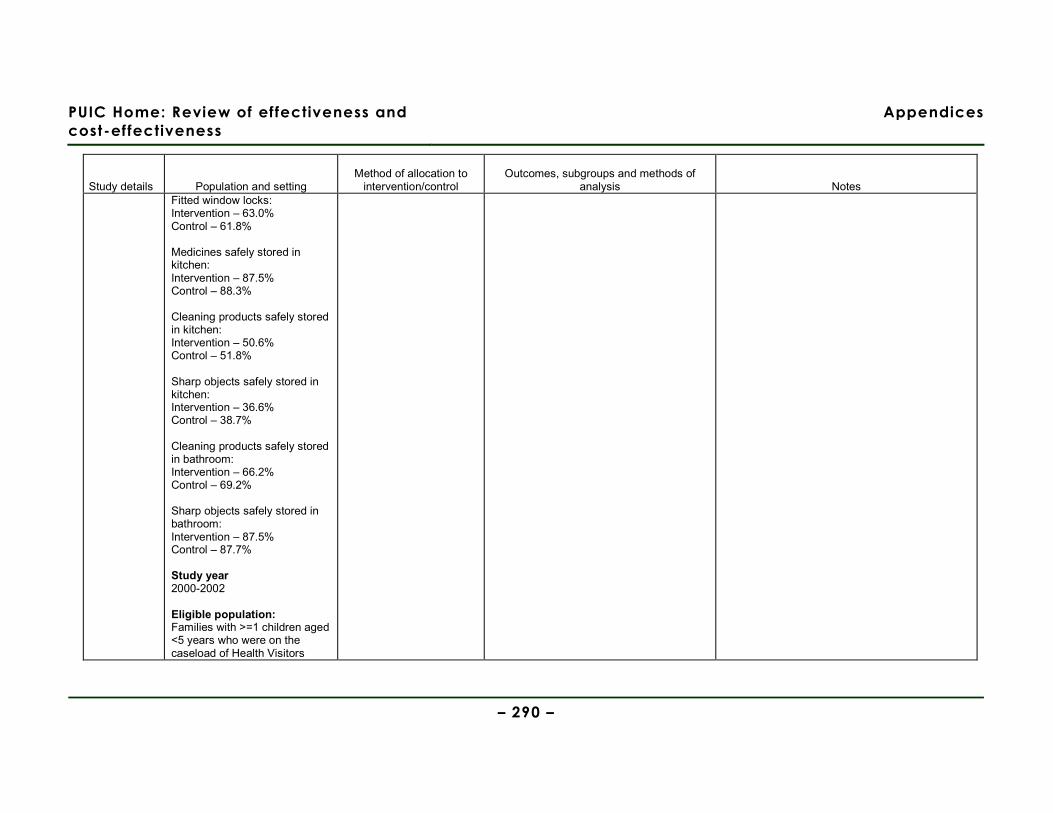
PUIC Home: Review of effectiveness and
cost-effectiveness
Appendices
– 290 –
Study details Population and setting Method of allocation to
intervention/control Outcomes, subgroups and methods of
analysis Notes Fitted window locks: Intervention – 63.0% Control – 61.8% Medicines safely stored in kitchen: Intervention – 87.5% Control – 88.3% Cleaning products safely stored in kitchen: Intervention – 50.6% Control – 51.8% Sharp objects safely stored in kitchen: Intervention – 36.6% Control – 38.7% Cleaning products safely stored in bathroom: Intervention – 66.2% Control – 69.2% Sharp objects safely stored in bathroom: Intervention – 87.5% Control – 87.7% Study year 2000-2002 Eligible population: Families with >=1 children aged <5 years who were on the caseload of Health Visitors

PUIC Home: Review of effectiveness and
cost-effectiveness
Appendices
– 291 –
Study details Population and setting Method of allocation to
intervention/control Outcomes, subgroups and methods of
analysis Notes within the 47 participating practices. Selected population: Families with >=1 children aged <5 years. 35% of the families approached agreed to participate. Excluded population/s: Families where >=1 children were on the Child Protection Register. Families where a child had experienced a fatal unintentional injury.
Outcomes Injury outcomes at the level of the family or child at 24-months follow-up:
Intervention arm Control arm Effect size Injury outcomes
No. (%) Denominator
Rate/1000 person years
Person years
No. (%) Denominator
Rate/1000 person years
Person years
Odds ratio (95% CI)
Incidence rate ratio (95% CI)
At family level:
Child in family had medically attended injury
593 (40.5%)
1463 - - 574 (37.5%)
1532 - - 1.14 (0.98, 1.50)
-
Phoned NHS Direct after an injury
77 (10.0%) 769 - - 67 (9.3%) 719 - - 1.08 (0.76, 1.52)
-
Attended walk-in centre after
29 (3.8%) 767 - - 28 (3.9%) 712 - - 0.94 (0.53, 1.60)
-

PUIC Home: Review of effectiveness and
cost-effectiveness
Appendices
– 292 –
Study details Population and setting Method of allocation to
intervention/control Outcomes, subgroups and methods of
analysis Notes an injury At child level:
Primary care attendance
220 - 61.2 3595.1 172 - 44.2 3887.7 1.37 (1.11, 1.70)
Secondary care attendance
685 - 175.9 3895.0 743 - 174.1 4267.8 - 1.02 (0.90, 1.13)
Hospital admission
54 - 13.9 3895.0 58 - 13.6 4267.8 - 1.02 (0.70, 1.48)
Abbreviated injury scale >=2
57 (12.1%) 472 - - 49 (10.8%) 456 - - 1.14 (0.76, 1.71)
-
Minor injury severity score >=2
215 (45%) 478 - - 206 (45.3%)
455 - - 0.98 (0.75, 1.27)
-
Prevalence of safety practices at 12 and 24 months follow-up (number of families):
12 months follow-up 24 months follow-up Safety practices Intervention
(n=771) Control (n=744) Odds ratio (95%
CI) Intervention (n=803)
Control (n=754) Odds ratio (95% CI)
Fitted and always used fire guard
414 (54.3%) 374 (50.9%) 1.14 (0.93, 1.40) 328 (42.1%) 299 (40.0%) 1.09 (0.88, 1.33)
Fitted and used stair gate
408 (55.0%) 328 (45.7%) 1.46 (1.19, 1.80) 239 (30.1%) 240 (31.9%) 0.92 (0.74, 1.14)
Fitted and working smoke alarm
692 (90.6%) 619 (84.0%) 1.83 (1.33, 2.52) 728 (91.5%) 648 (86.5%) 1.67 (1.21, 2.32)
Fitted window locks 550 (71.7%) 493 (66.5%) 1.28 (1.02, 1.59) 577 (72.4%) 525 (72.0%) 1.12 (0.90, 1.40) Safe storage Medicines in kitchen
712 (93.4%) 683 (92.6%) 1.15 (0.76, 1.73) 765 (95.5%) 701 (93.2%) 1.55 (1.00, 2.40)
Cleaning products 496 (65.5%) 428 (58.6%) 1.34 (1.09, 1.66) 442 (55.3%) 365 (48.5%) 1.31 (1.07, 1.60)
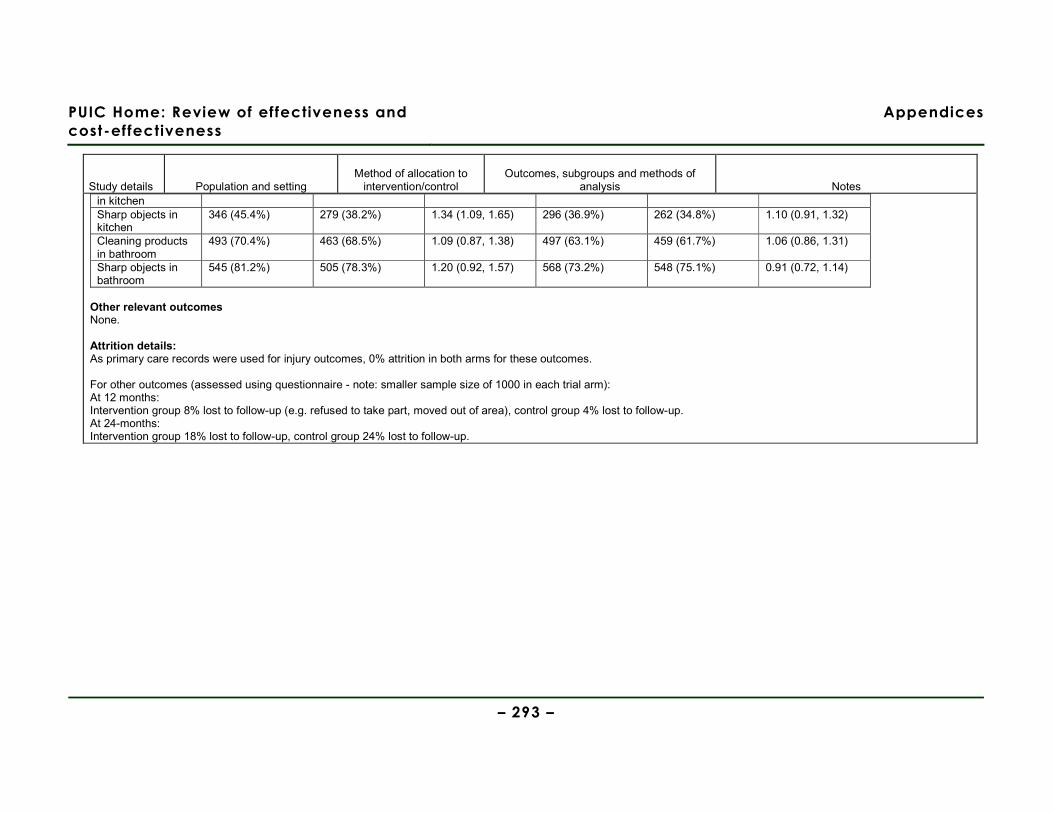
PUIC Home: Review of effectiveness and
cost-effectiveness
Appendices
– 293 –
Study details Population and setting Method of allocation to
intervention/control Outcomes, subgroups and methods of
analysis Notes in kitchen Sharp objects in kitchen
346 (45.4%) 279 (38.2%) 1.34 (1.09, 1.65) 296 (36.9%) 262 (34.8%) 1.10 (0.91, 1.32)
Cleaning products in bathroom
493 (70.4%) 463 (68.5%) 1.09 (0.87, 1.38) 497 (63.1%) 459 (61.7%) 1.06 (0.86, 1.31)
Sharp objects in bathroom
545 (81.2%) 505 (78.3%) 1.20 (0.92, 1.57) 568 (73.2%) 548 (75.1%) 0.91 (0.72, 1.14)
Other relevant outcomes None. Attrition details: As primary care records were used for injury outcomes, 0% attrition in both arms for these outcomes. For other outcomes (assessed using questionnaire - note: smaller sample size of 1000 in each trial arm): At 12 months: Intervention group 8% lost to follow-up (e.g. refused to take part, moved out of area), control group 4% lost to follow-up. At 24-months: Intervention group 18% lost to follow-up, control group 24% lost to follow-up.
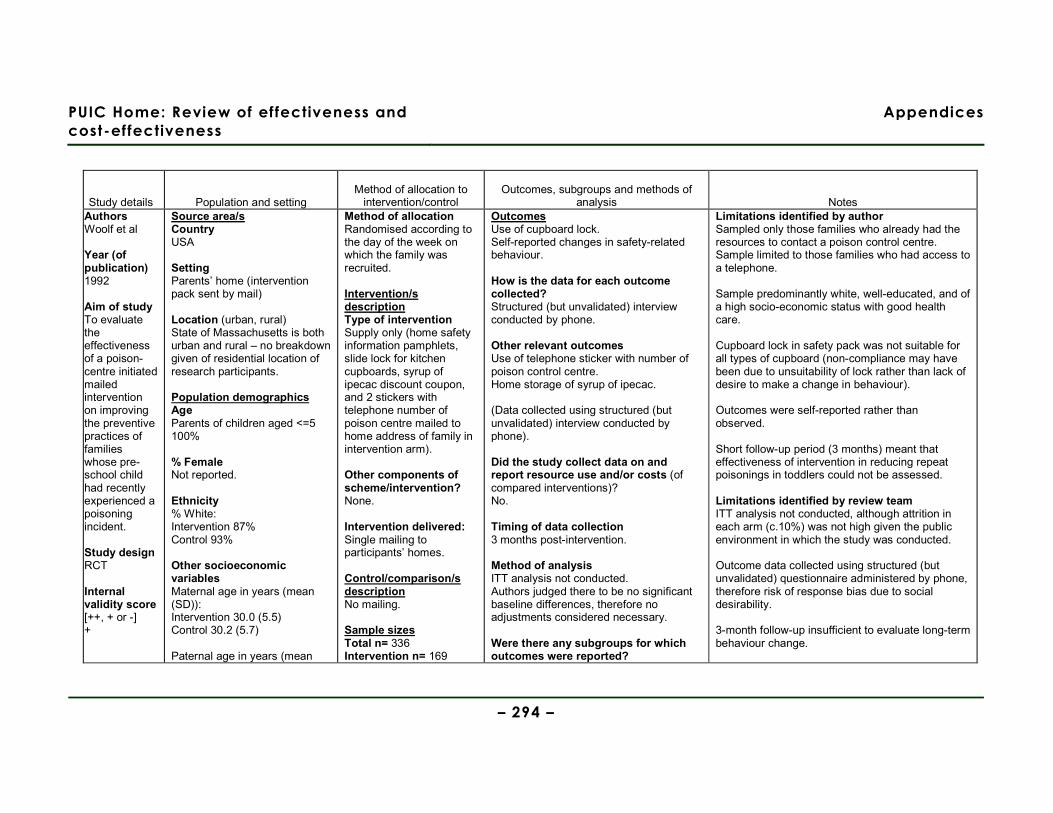
PUIC Home: Review of effectiveness and
cost-effectiveness
Appendices
– 294 –
Study details Population and setting Method of allocation to
intervention/control Outcomes, subgroups and methods of
analysis Notes Authors Woolf et al Year (of publication) 1992
Aim of study To evaluate the effectiveness of a poison-centre initiated mailed intervention on improving the preventive practices of families whose pre-school child had recently experienced a poisoning incident. Study design RCT Internal validity score [++, + or -] +
Source area/s Country USA Setting Parents’ home (intervention pack sent by mail) Location (urban, rural) State of Massachusetts is both urban and rural – no breakdown given of residential location of research participants. Population demographics Age Parents of children aged <=5 100% % Female Not reported. Ethnicity % White: Intervention 87% Control 93% Other socioeconomic variables Maternal age in years (mean (SD)): Intervention 30.0 (5.5) Control 30.2 (5.7) Paternal age in years (mean
Method of allocation Randomised according to the day of the week on which the family was recruited. Intervention/s description Type of intervention Supply only (home safety information pamphlets, slide lock for kitchen cupboards, syrup of ipecac discount coupon, and 2 stickers with telephone number of poison centre mailed to home address of family in intervention arm).
Other components of scheme/intervention? None. Intervention delivered: Single mailing to participants’ homes. Control/comparison/s description No mailing. Sample sizes Total n= 336 Intervention n= 169
Outcomes Use of cupboard lock. Self-reported changes in safety-related behaviour. How is the data for each outcome collected? Structured (but unvalidated) interview conducted by phone. Other relevant outcomes Use of telephone sticker with number of poison control centre. Home storage of syrup of ipecac. (Data collected using structured (but unvalidated) interview conducted by phone). Did the study collect data on and report resource use and/or costs (of compared interventions)? No. Timing of data collection 3 months post-intervention. Method of analysis ITT analysis not conducted. Authors judged there to be no significant baseline differences, therefore no adjustments considered necessary. Were there any subgroups for which outcomes were reported?
Limitations identified by author Sampled only those families who already had the resources to contact a poison control centre. Sample limited to those families who had access to a telephone. Sample predominantly white, well-educated, and of a high socio-economic status with good health care. Cupboard lock in safety pack was not suitable for all types of cupboard (non-compliance may have been due to unsuitability of lock rather than lack of desire to make a change in behaviour). Outcomes were self-reported rather than observed. Short follow-up period (3 months) meant that effectiveness of intervention in reducing repeat poisonings in toddlers could not be assessed. Limitations identified by review team ITT analysis not conducted, although attrition in each arm (c.10%) was not high given the public environment in which the study was conducted. Outcome data collected using structured (but unvalidated) questionnaire administered by phone, therefore risk of response bias due to social desirability. 3-month follow-up insufficient to evaluate long-term behaviour change.

PUIC Home: Review of effectiveness and
cost-effectiveness
Appendices
– 295 –
Study details Population and setting Method of allocation to
intervention/control Outcomes, subgroups and methods of
analysis Notes External validity score [++, + or -] +
(SD)): Intervention 32.6 (6.1) Control 32.1 (6.1) Maternal education in years (mean (SD)): Intervention 13.4 (2.1) Control 13.7 (2.1) Paternal education in years (mean (SD)): Intervention 13.8 (2.2) Control 13.8 (2.1) % of children with a regular physician: Intervention 98% Control 99% % who had received ipecac from a physician: Intervention 8% Control 14% % who had received advice about poisonings: Intervention 37% Control 37% % of children who had experienced a subsequent poisoning within prior 3 months: Intervention 3% Control 5%
Control n= 167 Baseline comparisons No formal analysis conducted, but visual inspection of baseline characteristics shows no significant differences between intervention and control groups. Study sufficiently powered? Yes. Sample size of 150 in each trial arm calculated to have a 95% probability (2-tailed) of detecting a 20% between-group difference.
No. If so, which subgroups were outcomes reported for? Not applicable. Were the subgroup analyses prespecified? Not applicable.
Evidence gaps and/or recommendations for future research None. Source of funding Milton Fund (Harvard Medical School). Dyson Foundation. Did the study collect data on and report information about barriers and facilitators to/of effectiveness? No. Observations from the Discussion section regarding barriers & facilitators Not applicable.
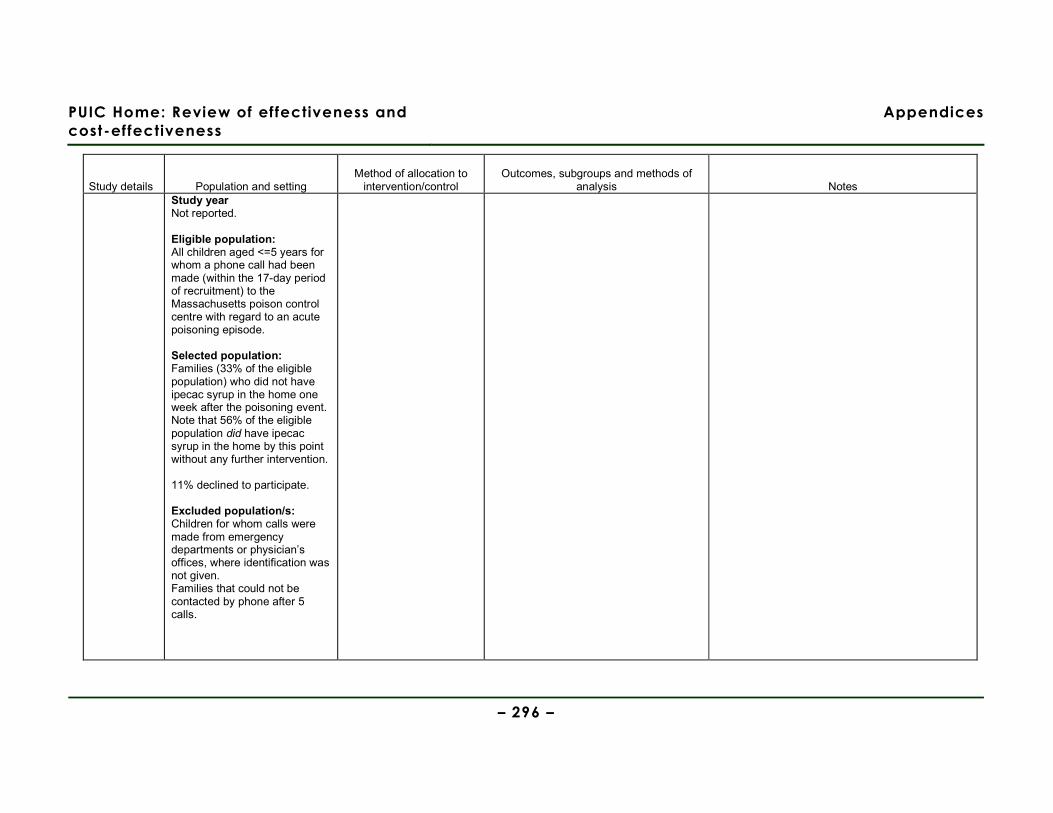
PUIC Home: Review of effectiveness and
cost-effectiveness
Appendices
– 296 –
Study details Population and setting Method of allocation to
intervention/control Outcomes, subgroups and methods of
analysis Notes Study year Not reported. Eligible population: All children aged <=5 years for whom a phone call had been made (within the 17-day period of recruitment) to the Massachusetts poison control centre with regard to an acute poisoning episode. Selected population: Families (33% of the eligible population) who did not have ipecac syrup in the home one week after the poisoning event. Note that 56% of the eligible population did have ipecac syrup in the home by this point without any further intervention. 11% declined to participate. Excluded population/s: Children for whom calls were made from emergency departments or physician’s offices, where identification was not given. Families that could not be contacted by phone after 5 calls.
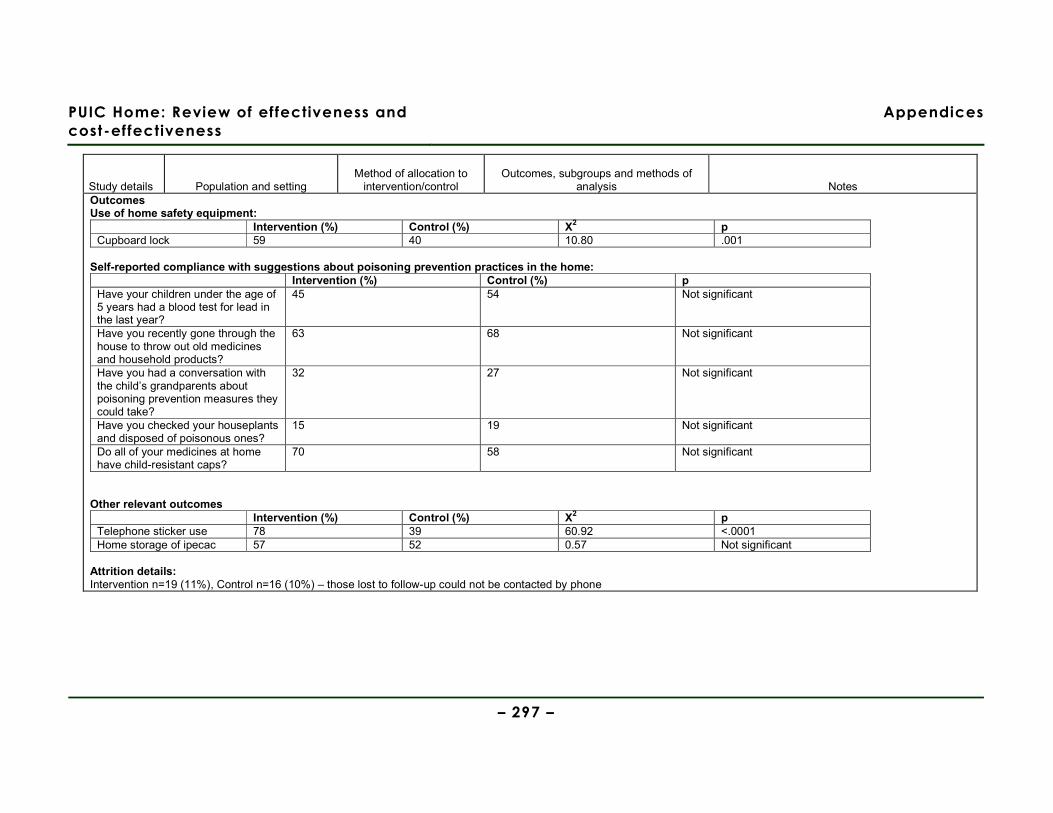
PUIC Home: Review of effectiveness and
cost-effectiveness
Appendices
– 297 –
Study details Population and setting Method of allocation to
intervention/control Outcomes, subgroups and methods of
analysis Notes Outcomes Use of home safety equipment:
Intervention (%) Control (%) Χ2 p Cupboard lock 59 40 10.80 .001
Self-reported compliance with suggestions about poisoning prevention practices in the home:
Intervention (%) Control (%) p Have your children under the age of 5 years had a blood test for lead in the last year?
45 54 Not significant
Have you recently gone through the house to throw out old medicines and household products?
63 68 Not significant
Have you had a conversation with the child’s grandparents about poisoning prevention measures they could take?
32 27 Not significant
Have you checked your houseplants and disposed of poisonous ones?
15 19 Not significant
Do all of your medicines at home have child-resistant caps?
70 58 Not significant
Other relevant outcomes
Intervention (%) Control (%) Χ2 p Telephone sticker use 78 39 60.92 <.0001 Home storage of ipecac 57 52 0.57 Not significant
Attrition details: Intervention n=19 (11%), Control n=16 (10%) – those lost to follow-up could not be contacted by phone
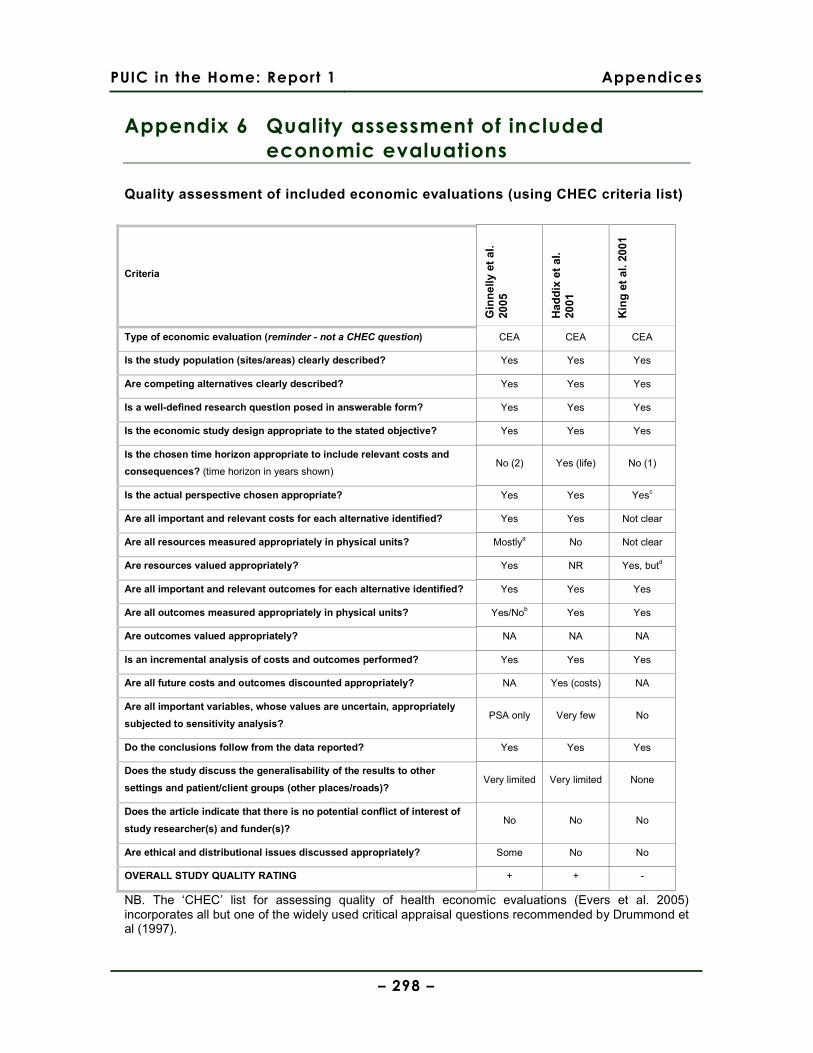
PUIC in the Home: Report 1 Appendices
– 298 –
Appendix 6 Quality assessment of included
economic evaluations
Quality assessment of included economic evaluations (using CHEC criteria list)
Criteria
Gin
nel
ly e
t al
. 20
05
Had
dix
et
al.
2001
Kin
g e
t al
. 20
01
Type of economic evaluation (reminder - not a CHEC question) CEA CEA CEA
Is the study population (sites/areas) clearly described? Yes Yes Yes
Are competing alternatives clearly described? Yes Yes Yes
Is a well-defined research question posed in answerable form? Yes Yes Yes
Is the economic study design appropriate to the stated objective? Yes Yes Yes
Is the chosen time horizon appropriate to include relevant costs and
consequences? (time horizon in years shown) No (2) Yes (life) No (1)
Is the actual perspective chosen appropriate? Yes Yes Yesc
Are all important and relevant costs for each alternative identified? Yes Yes Not clear
Are all resources measured appropriately in physical units? Mostlya No Not clear
Are resources valued appropriately? Yes NR Yes, butd
Are all important and relevant outcomes for each alternative identified? Yes Yes Yes
Are all outcomes measured appropriately in physical units? Yes/Nob Yes Yes
Are outcomes valued appropriately? NA NA NA
Is an incremental analysis of costs and outcomes performed? Yes Yes Yes
Are all future costs and outcomes discounted appropriately? NA Yes (costs) NA
Are all important variables, whose values are uncertain, appropriately
subjected to sensitivity analysis? PSA only Very few No
Do the conclusions follow from the data reported? Yes Yes Yes
Does the study discuss the generalisability of the results to other
settings and patient/client groups (other places/roads)? Very limited Very limited None
Does the article indicate that there is no potential conflict of interest of
study researcher(s) and funder(s)? No No No
Are ethical and distributional issues discussed appropriately? Some No No
OVERALL STUDY QUALITY RATING + + -
NB. The ‘CHEC’ list for assessing quality of health economic evaluations (Evers et al. 2005) incorporates all but one of the widely used critical appraisal questions recommended by Drummond et al (1997).
PUIC in the Home: Report 1 Appendices
– 299 –
a Except resources like police presence at fires b Combining both non-fatal and fatal injuries is not ideal, given how differently their avoidance would be relatively valued. c Assuming that such home risk assessment programmes would be funded and provided by health services, and that external impacts on fire and police services are minimal relative to health service cost impacts. d Costs for particular injury treatments were from either Hospital standard costs or Ontario Health Insurance Plan Schedule of Fees & Benefits; not usually regarded as good proxies for opportunity costs.
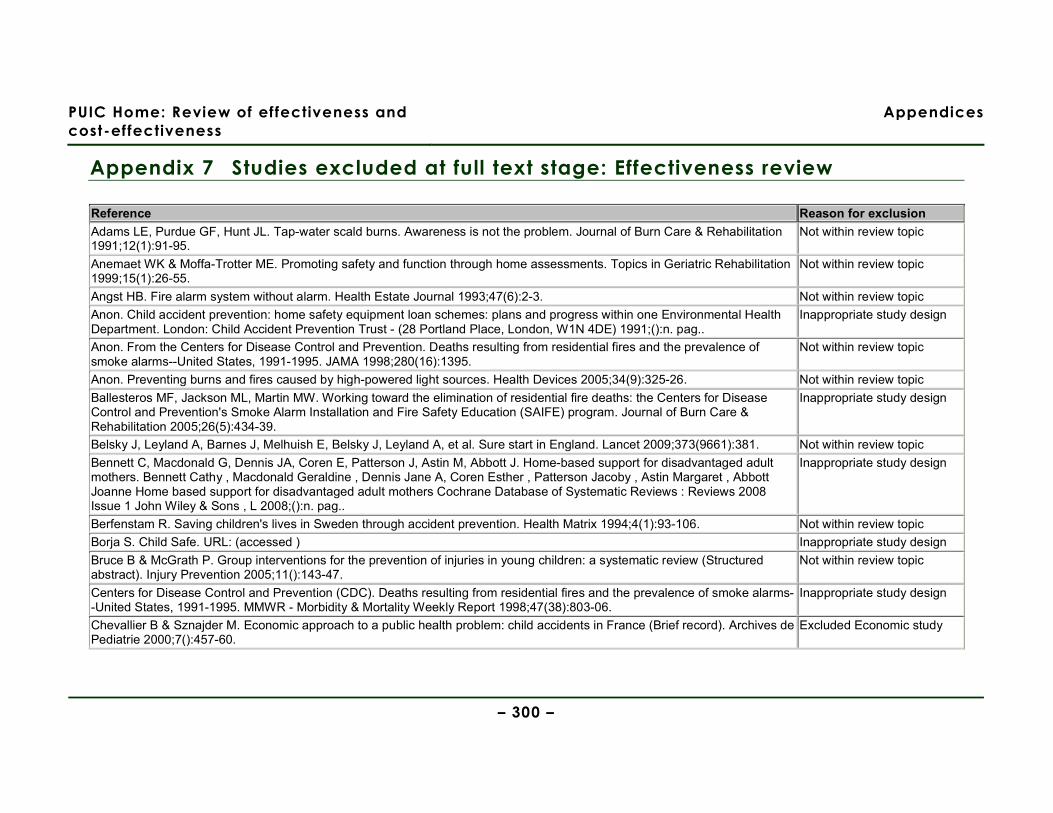
PUIC Home: Review of effectiveness and
cost-effectiveness
Appendices
– 300 –
Appendix 7 Studies excluded at full text stage: Effectiveness review
Reference Reason for exclusion Adams LE, Purdue GF, Hunt JL. Tap-water scald burns. Awareness is not the problem. Journal of Burn Care & Rehabilitation 1991;12(1):91-95.
Not within review topic
Anemaet WK & Moffa-Trotter ME. Promoting safety and function through home assessments. Topics in Geriatric Rehabilitation 1999;15(1):26-55.
Not within review topic
Angst HB. Fire alarm system without alarm. Health Estate Journal 1993;47(6):2-3. Not within review topic Anon. Child accident prevention: home safety equipment loan schemes: plans and progress within one Environmental Health Department. London: Child Accident Prevention Trust - (28 Portland Place, London, W1N 4DE) 1991;():n. pag..
Inappropriate study design
Anon. From the Centers for Disease Control and Prevention. Deaths resulting from residential fires and the prevalence of smoke alarms--United States, 1991-1995. JAMA 1998;280(16):1395.
Not within review topic
Anon. Preventing burns and fires caused by high-powered light sources. Health Devices 2005;34(9):325-26. Not within review topic Ballesteros MF, Jackson ML, Martin MW. Working toward the elimination of residential fire deaths: the Centers for Disease Control and Prevention's Smoke Alarm Installation and Fire Safety Education (SAIFE) program. Journal of Burn Care & Rehabilitation 2005;26(5):434-39.
Inappropriate study design
Belsky J, Leyland A, Barnes J, Melhuish E, Belsky J, Leyland A, et al. Sure start in England. Lancet 2009;373(9661):381. Not within review topic Bennett C, Macdonald G, Dennis JA, Coren E, Patterson J, Astin M, Abbott J. Home-based support for disadvantaged adult mothers. Bennett Cathy , Macdonald Geraldine , Dennis Jane A, Coren Esther , Patterson Jacoby , Astin Margaret , Abbott Joanne Home based support for disadvantaged adult mothers Cochrane Database of Systematic Reviews : Reviews 2008 Issue 1 John Wiley & Sons , L 2008;():n. pag..
Inappropriate study design
Berfenstam R. Saving children's lives in Sweden through accident prevention. Health Matrix 1994;4(1):93-106. Not within review topic Borja S. Child Safe. URL: (accessed ) Inappropriate study design Bruce B & McGrath P. Group interventions for the prevention of injuries in young children: a systematic review (Structured abstract). Injury Prevention 2005;11():143-47.
Not within review topic
Centers for Disease Control and Prevention (CDC). Deaths resulting from residential fires and the prevalence of smoke alarms--United States, 1991-1995. MMWR - Morbidity & Mortality Weekly Report 1998;47(38):803-06.
Inappropriate study design
Chevallier B & Sznajder M. Economic approach to a public health problem: child accidents in France (Brief record). Archives de Pediatrie 2000;7():457-60.
Excluded Economic study

PUIC Home: Review of effectiveness and
cost-effectiveness
Appendices
– 301 –
Reference Reason for exclusion Children in Wales. Working Towards a Child Safety Strategy for Wales. ;():n. pag.. Inappropriate study design Claudet I, Toubal K, Carnet C, Rekhroukh H, Zelmat B, Debuisson C, Cahuzac JP. When doors slam, fingers jam! (Brief record). Archives de Pediatrie 2007;14():958-63.
Not within review topic
Coggan C, Patterson P, Brewin M, Hooper R, Robinson E. Evaluation of the Waitakere Community Injury Prevention Project. Inj Prev 2000;6(2):130-34.
Not within review topic
Coggan C, Patterson P, Brewin M. Process evaluation report of the Waitakere community injury prevention project. Auckland: Injury Prevention Research Centre, 1998.
Not within review topic
Cohen LR, Runyan CW, Downs SM, Bowling JM. Pediatric injury prevention counseling priorities. Pediatrics 1997;99(5):704-10.
Not within review topic
Conners GP, Veenema TG, Kavanagh CA, Ricci J, Callahan CM. Still falling: a community-wide infant walker injury prevention initiative. Patient Education & Counseling 2002;46(3):169-73.
Not within review topic
Culp AM, Culp RE, Anderson JW, Carter S. Health and safety intervention with first-time mothers. Health Education Research 2007;22(2):285-94.
Not within review topic
Culp AM, Culp RE, Blankemeyer M, Passmark L. Parent education home visitation program: adolescent and nonadolescent mother comparison after six months of intervention. Infant Mental Health Journal 1998;19(2):111-23.
Not within review topic
Danseco ER, Miller TR, Spicer RS. Incidence and costs of 1987-1994 childhood injuries: demographic breakdowns (Brief record). Pediatrics 2000;105():E271-78.
Excluded Economic study
Dickinson H & Dickinson H. Evaluating sure start - by nigel malin and gillian morrow. Health & Social Care in the Community 2009;17(3):321.
Not within review topic
DiGuiseppi C & Higgins JPT. Systematic review of controlled trials of interventions to promote smoke alarms. Archives of Disease in Childhood 2000;82(5):341-48.
Systematic or non-systematic review - reviewed for references
DiGuiseppi C, Goss CW, Higgins JP. Interventions for promoting smoke alarm ownership and function. Cochrane Database of Systematic Reviews 2001;(2):CD002246-NaNaN.
Systematic or non-systematic review - reviewed for references
Dowswell T, Towner EM, Simpson G, Jarvis SN. Preventing childhood unintentional injuries - what works? A literature review (Structured abstract). Injury Prevention 1996;2():140-49.
Systematic or non-systematic review - reviewed for references
Duggan AK, McFarlane EC, Windham AM, Rohde CA, Salkever DS, Fuddy L, et al. Evaluation of Hawaii's Healthy Start Program. Future of Children 177 ;9(1):66-90.
Not within review topic
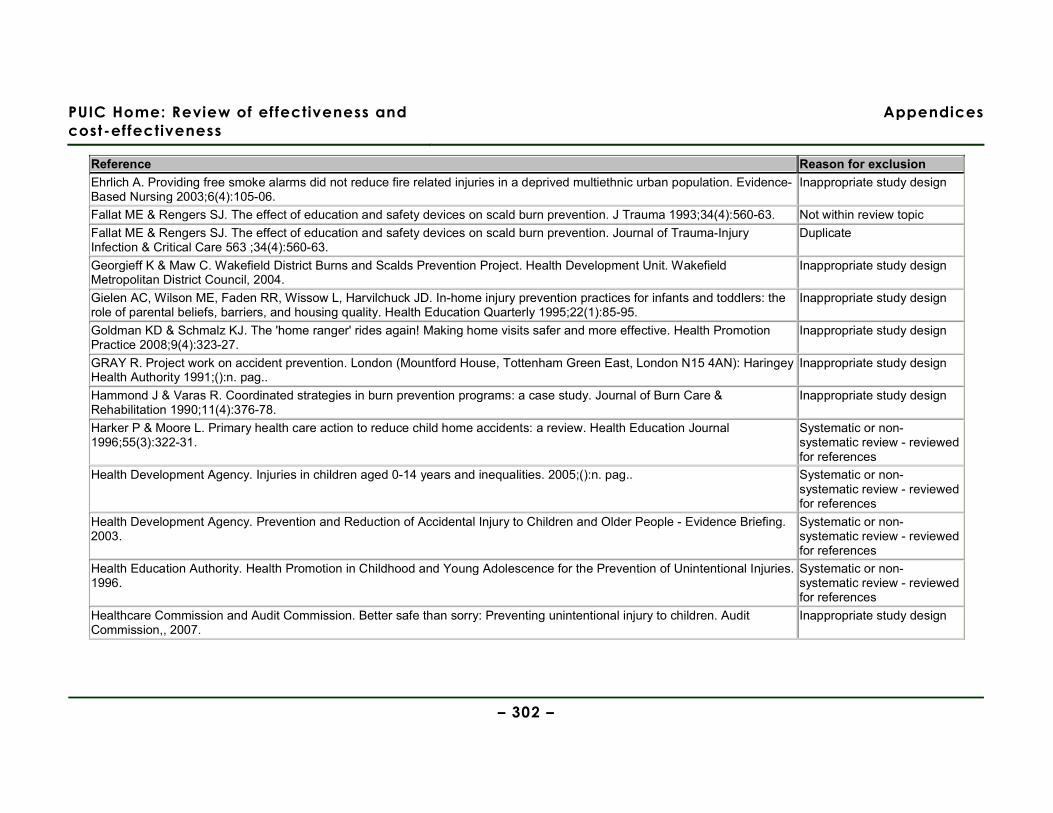
PUIC Home: Review of effectiveness and
cost-effectiveness
Appendices
– 302 –
Reference Reason for exclusion Ehrlich A. Providing free smoke alarms did not reduce fire related injuries in a deprived multiethnic urban population. Evidence-Based Nursing 2003;6(4):105-06.
Inappropriate study design
Fallat ME & Rengers SJ. The effect of education and safety devices on scald burn prevention. J Trauma 1993;34(4):560-63. Not within review topic Fallat ME & Rengers SJ. The effect of education and safety devices on scald burn prevention. Journal of Trauma-Injury Infection & Critical Care 563 ;34(4):560-63.
Duplicate
Georgieff K & Maw C. Wakefield District Burns and Scalds Prevention Project. Health Development Unit. Wakefield Metropolitan District Council, 2004.
Inappropriate study design
Gielen AC, Wilson ME, Faden RR, Wissow L, Harvilchuck JD. In-home injury prevention practices for infants and toddlers: the role of parental beliefs, barriers, and housing quality. Health Education Quarterly 1995;22(1):85-95.
Inappropriate study design
Goldman KD & Schmalz KJ. The 'home ranger' rides again! Making home visits safer and more effective. Health Promotion Practice 2008;9(4):323-27.
Inappropriate study design
GRAY R. Project work on accident prevention. London (Mountford House, Tottenham Green East, London N15 4AN): Haringey Health Authority 1991;():n. pag..
Inappropriate study design
Hammond J & Varas R. Coordinated strategies in burn prevention programs: a case study. Journal of Burn Care & Rehabilitation 1990;11(4):376-78.
Inappropriate study design
Harker P & Moore L. Primary health care action to reduce child home accidents: a review. Health Education Journal 1996;55(3):322-31.
Systematic or non-systematic review - reviewed for references
Health Development Agency. Injuries in children aged 0-14 years and inequalities. 2005;():n. pag.. Systematic or non-systematic review - reviewed for references
Health Development Agency. Prevention and Reduction of Accidental Injury to Children and Older People - Evidence Briefing. 2003.
Systematic or non-systematic review - reviewed for references
Health Education Authority. Health Promotion in Childhood and Young Adolescence for the Prevention of Unintentional Injuries. 1996.
Systematic or non-systematic review - reviewed for references
Healthcare Commission and Audit Commission. Better safe than sorry: Preventing unintentional injury to children. Audit Commission,, 2007.
Inappropriate study design
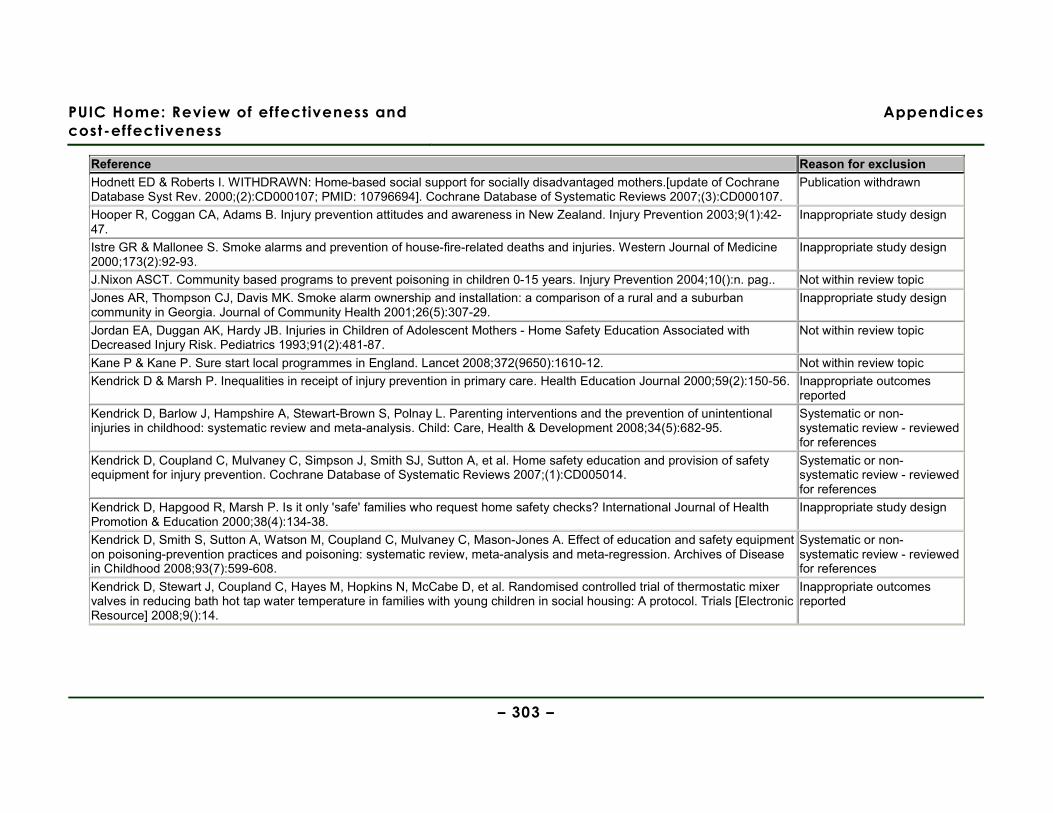
PUIC Home: Review of effectiveness and
cost-effectiveness
Appendices
– 303 –
Reference Reason for exclusion Hodnett ED & Roberts I. WITHDRAWN: Home-based social support for socially disadvantaged mothers.[update of Cochrane Database Syst Rev. 2000;(2):CD000107; PMID: 10796694]. Cochrane Database of Systematic Reviews 2007;(3):CD000107.
Publication withdrawn
Hooper R, Coggan CA, Adams B. Injury prevention attitudes and awareness in New Zealand. Injury Prevention 2003;9(1):42-47.
Inappropriate study design
Istre GR & Mallonee S. Smoke alarms and prevention of house-fire-related deaths and injuries. Western Journal of Medicine 2000;173(2):92-93.
Inappropriate study design
J.Nixon ASCT. Community based programs to prevent poisoning in children 0-15 years. Injury Prevention 2004;10():n. pag.. Not within review topic Jones AR, Thompson CJ, Davis MK. Smoke alarm ownership and installation: a comparison of a rural and a suburban community in Georgia. Journal of Community Health 2001;26(5):307-29.
Inappropriate study design
Jordan EA, Duggan AK, Hardy JB. Injuries in Children of Adolescent Mothers - Home Safety Education Associated with Decreased Injury Risk. Pediatrics 1993;91(2):481-87.
Not within review topic
Kane P & Kane P. Sure start local programmes in England. Lancet 2008;372(9650):1610-12. Not within review topic Kendrick D & Marsh P. Inequalities in receipt of injury prevention in primary care. Health Education Journal 2000;59(2):150-56. Inappropriate outcomes
reported Kendrick D, Barlow J, Hampshire A, Stewart-Brown S, Polnay L. Parenting interventions and the prevention of unintentional injuries in childhood: systematic review and meta-analysis. Child: Care, Health & Development 2008;34(5):682-95.
Systematic or non-systematic review - reviewed for references
Kendrick D, Coupland C, Mulvaney C, Simpson J, Smith SJ, Sutton A, et al. Home safety education and provision of safety equipment for injury prevention. Cochrane Database of Systematic Reviews 2007;(1):CD005014.
Systematic or non-systematic review - reviewed for references
Kendrick D, Hapgood R, Marsh P. Is it only 'safe' families who request home safety checks? International Journal of Health Promotion & Education 2000;38(4):134-38.
Inappropriate study design
Kendrick D, Smith S, Sutton A, Watson M, Coupland C, Mulvaney C, Mason-Jones A. Effect of education and safety equipment on poisoning-prevention practices and poisoning: systematic review, meta-analysis and meta-regression. Archives of Disease in Childhood 2008;93(7):599-608.
Systematic or non-systematic review - reviewed for references
Kendrick D, Stewart J, Coupland C, Hayes M, Hopkins N, McCabe D, et al. Randomised controlled trial of thermostatic mixer valves in reducing bath hot tap water temperature in families with young children in social housing: A protocol. Trials [Electronic Resource] 2008;9():14.
Inappropriate outcomes reported
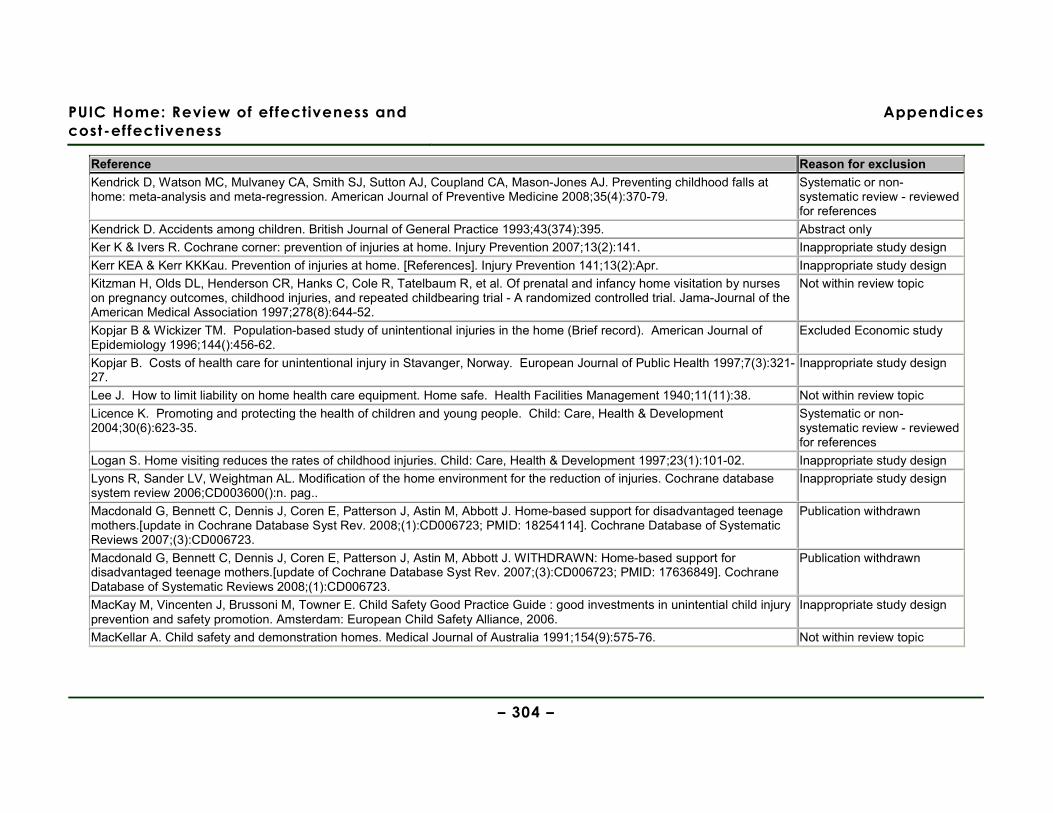
PUIC Home: Review of effectiveness and
cost-effectiveness
Appendices
– 304 –
Reference Reason for exclusion Kendrick D, Watson MC, Mulvaney CA, Smith SJ, Sutton AJ, Coupland CA, Mason-Jones AJ. Preventing childhood falls at home: meta-analysis and meta-regression. American Journal of Preventive Medicine 2008;35(4):370-79.
Systematic or non-systematic review - reviewed for references
Kendrick D. Accidents among children. British Journal of General Practice 1993;43(374):395. Abstract only Ker K & Ivers R. Cochrane corner: prevention of injuries at home. Injury Prevention 2007;13(2):141. Inappropriate study design Kerr KEA & Kerr KKKau. Prevention of injuries at home. [References]. Injury Prevention 141;13(2):Apr. Inappropriate study design Kitzman H, Olds DL, Henderson CR, Hanks C, Cole R, Tatelbaum R, et al. Of prenatal and infancy home visitation by nurses on pregnancy outcomes, childhood injuries, and repeated childbearing trial - A randomized controlled trial. Jama-Journal of the American Medical Association 1997;278(8):644-52.
Not within review topic
Kopjar B & Wickizer TM. Population-based study of unintentional injuries in the home (Brief record). American Journal of Epidemiology 1996;144():456-62.
Excluded Economic study
Kopjar B. Costs of health care for unintentional injury in Stavanger, Norway. European Journal of Public Health 1997;7(3):321-27.
Inappropriate study design
Lee J. How to limit liability on home health care equipment. Home safe. Health Facilities Management 1940;11(11):38. Not within review topic
Licence K. Promoting and protecting the health of children and young people. Child: Care, Health & Development 2004;30(6):623-35.
Systematic or non-systematic review - reviewed for references
Logan S. Home visiting reduces the rates of childhood injuries. Child: Care, Health & Development 1997;23(1):101-02. Inappropriate study design Lyons R, Sander LV, Weightman AL. Modification of the home environment for the reduction of injuries. Cochrane database system review 2006;CD003600():n. pag..
Inappropriate study design
Macdonald G, Bennett C, Dennis J, Coren E, Patterson J, Astin M, Abbott J. Home-based support for disadvantaged teenage mothers.[update in Cochrane Database Syst Rev. 2008;(1):CD006723; PMID: 18254114]. Cochrane Database of Systematic Reviews 2007;(3):CD006723.
Publication withdrawn
Macdonald G, Bennett C, Dennis J, Coren E, Patterson J, Astin M, Abbott J. WITHDRAWN: Home-based support for disadvantaged teenage mothers.[update of Cochrane Database Syst Rev. 2007;(3):CD006723; PMID: 17636849]. Cochrane Database of Systematic Reviews 2008;(1):CD006723.
Publication withdrawn
MacKay M, Vincenten J, Brussoni M, Towner E. Child Safety Good Practice Guide : good investments in unintential child injury prevention and safety promotion. Amsterdam: European Child Safety Alliance, 2006.
Inappropriate study design
MacKellar A. Child safety and demonstration homes. Medical Journal of Australia 1991;154(9):575-76. Not within review topic
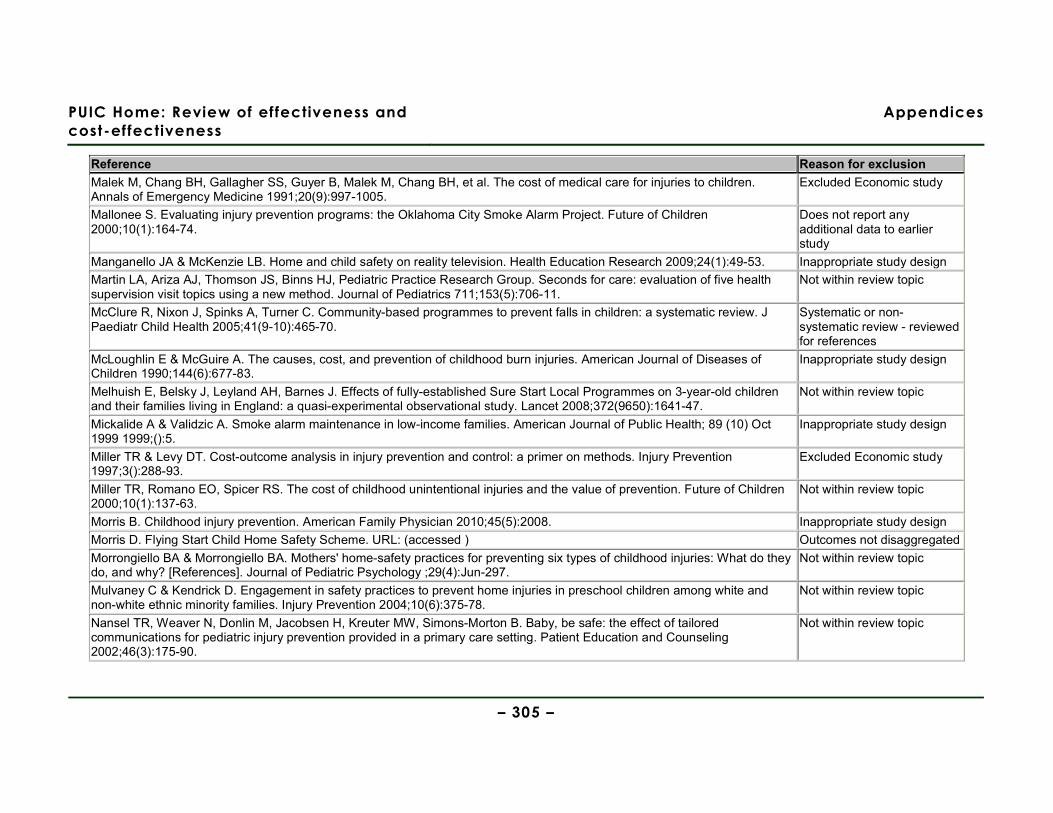
PUIC Home: Review of effectiveness and
cost-effectiveness
Appendices
– 305 –
Reference Reason for exclusion Malek M, Chang BH, Gallagher SS, Guyer B, Malek M, Chang BH, et al. The cost of medical care for injuries to children. Annals of Emergency Medicine 1991;20(9):997-1005.
Excluded Economic study
Mallonee S. Evaluating injury prevention programs: the Oklahoma City Smoke Alarm Project. Future of Children 2000;10(1):164-74.
Does not report any additional data to earlier study
Manganello JA & McKenzie LB. Home and child safety on reality television. Health Education Research 2009;24(1):49-53. Inappropriate study design Martin LA, Ariza AJ, Thomson JS, Binns HJ, Pediatric Practice Research Group. Seconds for care: evaluation of five health supervision visit topics using a new method. Journal of Pediatrics 711;153(5):706-11.
Not within review topic
McClure R, Nixon J, Spinks A, Turner C. Community-based programmes to prevent falls in children: a systematic review. J Paediatr Child Health 2005;41(9-10):465-70.
Systematic or non-systematic review - reviewed for references
McLoughlin E & McGuire A. The causes, cost, and prevention of childhood burn injuries. American Journal of Diseases of Children 1990;144(6):677-83.
Inappropriate study design
Melhuish E, Belsky J, Leyland AH, Barnes J. Effects of fully-established Sure Start Local Programmes on 3-year-old children and their families living in England: a quasi-experimental observational study. Lancet 2008;372(9650):1641-47.
Not within review topic
Mickalide A & Validzic A. Smoke alarm maintenance in low-income families. American Journal of Public Health; 89 (10) Oct 1999 1999;():5.
Inappropriate study design
Miller TR & Levy DT. Cost-outcome analysis in injury prevention and control: a primer on methods. Injury Prevention 1997;3():288-93.
Excluded Economic study
Miller TR, Romano EO, Spicer RS. The cost of childhood unintentional injuries and the value of prevention. Future of Children 2000;10(1):137-63.
Not within review topic
Morris B. Childhood injury prevention. American Family Physician 2010;45(5):2008. Inappropriate study design Morris D. Flying Start Child Home Safety Scheme. URL: (accessed ) Outcomes not disaggregated Morrongiello BA & Morrongiello BA. Mothers' home-safety practices for preventing six types of childhood injuries: What do they do, and why? [References]. Journal of Pediatric Psychology ;29(4):Jun-297.
Not within review topic
Mulvaney C & Kendrick D. Engagement in safety practices to prevent home injuries in preschool children among white and non-white ethnic minority families. Injury Prevention 2004;10(6):375-78.
Not within review topic
Nansel TR, Weaver N, Donlin M, Jacobsen H, Kreuter MW, Simons-Morton B. Baby, be safe: the effect of tailored communications for pediatric injury prevention provided in a primary care setting. Patient Education and Counseling 2002;46(3):175-90.
Not within review topic

PUIC Home: Review of effectiveness and
cost-effectiveness
Appendices
– 306 –
Reference Reason for exclusion Nilsen P. What makes community based injury prevention work? In search of evidence of effectiveness. Inj Prev 2004;10(5):268-74.
Systematic or non-systematic review - reviewed for references
O'Brien R, Ruthazer R, Robiteau R, Lee J. Injury prevention for pregnant and parenting teens: A home visiting model. Journal of Adolescent Health 1999;24(2):106.
Abstract only
Odendaal W, van NA, Jordaan E, Seedat M. The impact of a home visitation programme on household hazards associated with unintentional childhood injuries: a randomised controlled trial. Accident Analysis & Prevention 2009;41(1):183-90.
Not set in an OECD country
Olds DL & Kitzman H. Can home visitation improve the health of women and children at environmental risk? Pediatrics 1990;86(1):108-16.
Inappropriate study design
Olds DL, Henderson CR, Kitzman H. Does prenatal and infancy nurse home visitation have enduring effects on qualities of parental caregiving and child health at 25 to 50 months of life? Pediatrics 1994;93(1):89-98.
Not within review topic
Olds DL, Henderson CR, Kitzman HJ, Eckenrode JJ, Cole RE, Tatelbaum RC. Prenatal and infancy home visitation by nurses: recent findings. Future of Children 190 ;9(1):44-65.
Not within review topic
Olds DL. Prenatal and infancy home visiting by nurses: from randomized trials to community replication. Prevention Science 2002;3(3):153-72.
Systematic or non-systematic review - reviewed for references
Olds DL. The nurse-family partnership: An evidence-based preventive intervention. Infant Mental Health Journal 2006;27(1):5-25.
Not within review topic
Ozanne-Smith J, Day L, Stathakis V, Sherrard J. Controlled evaluation of a community based injury prevention program in Australia. Injury Prevention 2002;8(1):18-22.
Outcomes not disaggregated
Ozanne-Smith Jea. Community based injury prevention evaluation report: Shire of Bulla Safe Living Program. Canberra: Monash University Accident Research Centre, 1994.
Not within review topic
Parmer JE, Corso PS, Ballesteros MF. A cost analysis of a smoke alarm installation and fire safety education program. Journal of Safety Research 2006;37(4):367-73.
Inappropriate study design
Parry C. Eastside Childsafe Project. URL: (accessed ) Inappropriate study design Peden M, Oyegbite K, Ozanne-Smith J, Hyder A, Branche C, Rahman F, et al. World Report on Child Injury Prevention. WHO, 2008.
Inappropriate study design
Petridou E, Tolma E, Dessypris N, Trichopoulos D. A controlled evaluation of a community injury prevention project in two Greek islands. International Journal of Epidemiology 1997;26(1):173-79.
Not within review topic
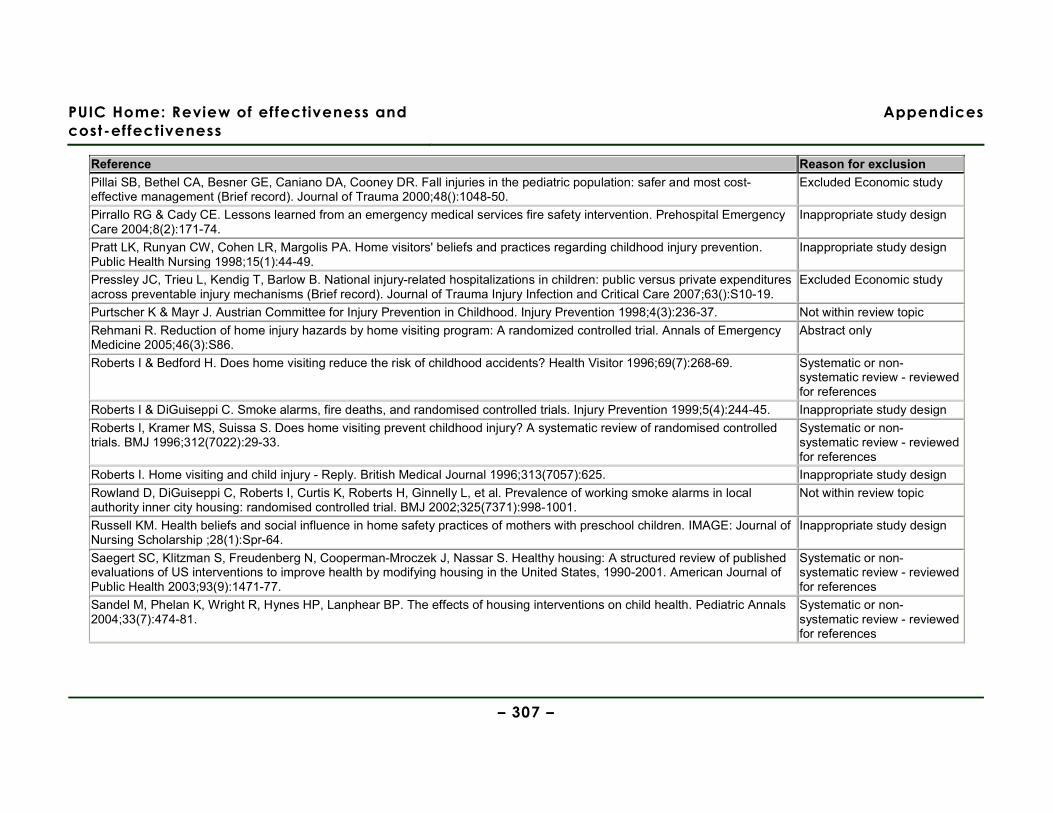
PUIC Home: Review of effectiveness and
cost-effectiveness
Appendices
– 307 –
Reference Reason for exclusion Pillai SB, Bethel CA, Besner GE, Caniano DA, Cooney DR. Fall injuries in the pediatric population: safer and most cost-effective management (Brief record). Journal of Trauma 2000;48():1048-50.
Excluded Economic study
Pirrallo RG & Cady CE. Lessons learned from an emergency medical services fire safety intervention. Prehospital Emergency Care 2004;8(2):171-74.
Inappropriate study design
Pratt LK, Runyan CW, Cohen LR, Margolis PA. Home visitors' beliefs and practices regarding childhood injury prevention. Public Health Nursing 1998;15(1):44-49.
Inappropriate study design
Pressley JC, Trieu L, Kendig T, Barlow B. National injury-related hospitalizations in children: public versus private expenditures across preventable injury mechanisms (Brief record). Journal of Trauma Injury Infection and Critical Care 2007;63():S10-19.
Excluded Economic study
Purtscher K & Mayr J. Austrian Committee for Injury Prevention in Childhood. Injury Prevention 1998;4(3):236-37. Not within review topic Rehmani R. Reduction of home injury hazards by home visiting program: A randomized controlled trial. Annals of Emergency Medicine 2005;46(3):S86.
Abstract only
Roberts I & Bedford H. Does home visiting reduce the risk of childhood accidents? Health Visitor 1996;69(7):268-69. Systematic or non-systematic review - reviewed for references
Roberts I & DiGuiseppi C. Smoke alarms, fire deaths, and randomised controlled trials. Injury Prevention 1999;5(4):244-45. Inappropriate study design Roberts I, Kramer MS, Suissa S. Does home visiting prevent childhood injury? A systematic review of randomised controlled trials. BMJ 1996;312(7022):29-33.
Systematic or non-systematic review - reviewed for references
Roberts I. Home visiting and child injury - Reply. British Medical Journal 1996;313(7057):625. Inappropriate study design Rowland D, DiGuiseppi C, Roberts I, Curtis K, Roberts H, Ginnelly L, et al. Prevalence of working smoke alarms in local authority inner city housing: randomised controlled trial. BMJ 2002;325(7371):998-1001.
Not within review topic
Russell KM. Health beliefs and social influence in home safety practices of mothers with preschool children. IMAGE: Journal of Nursing Scholarship ;28(1):Spr-64.
Inappropriate study design
Saegert SC, Klitzman S, Freudenberg N, Cooperman-Mroczek J, Nassar S. Healthy housing: A structured review of published evaluations of US interventions to improve health by modifying housing in the United States, 1990-2001. American Journal of Public Health 2003;93(9):1471-77.
Systematic or non-systematic review - reviewed for references
Sandel M, Phelan K, Wright R, Hynes HP, Lanphear BP. The effects of housing interventions on child health. Pediatric Annals 2004;33(7):474-81.
Systematic or non-systematic review - reviewed for references
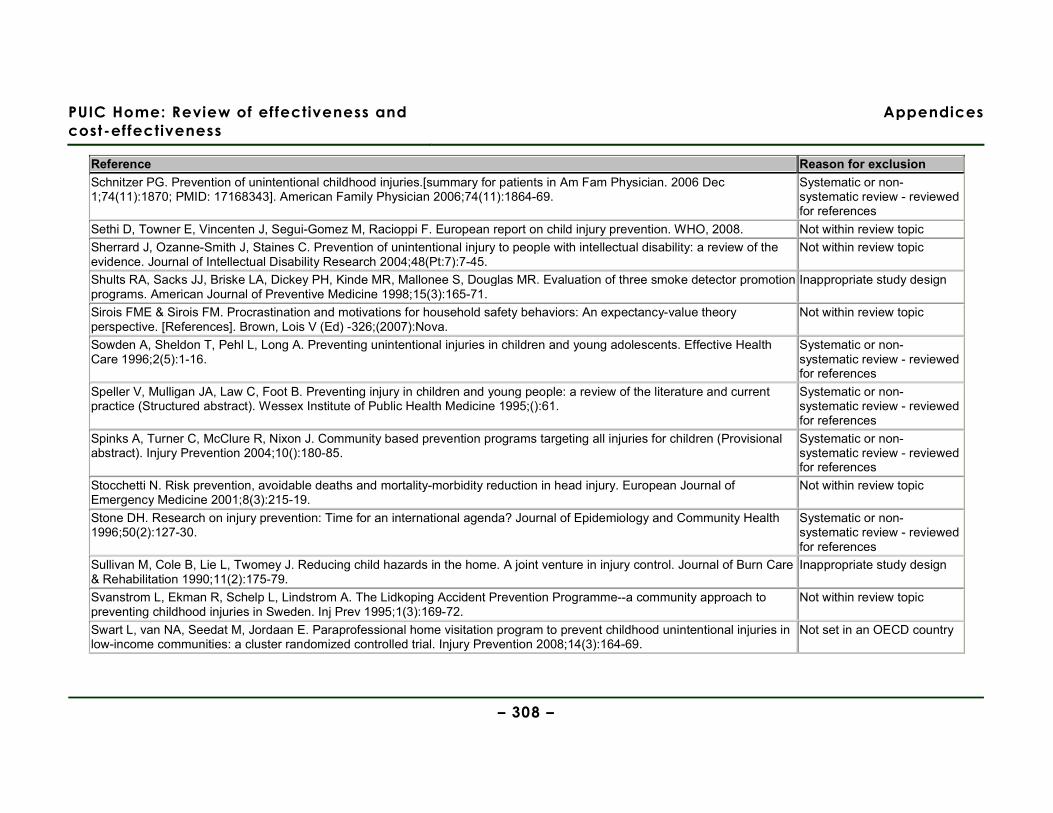
PUIC Home: Review of effectiveness and
cost-effectiveness
Appendices
– 308 –
Reference Reason for exclusion Schnitzer PG. Prevention of unintentional childhood injuries.[summary for patients in Am Fam Physician. 2006 Dec 1;74(11):1870; PMID: 17168343]. American Family Physician 2006;74(11):1864-69.
Systematic or non-systematic review - reviewed for references
Sethi D, Towner E, Vincenten J, Segui-Gomez M, Racioppi F. European report on child injury prevention. WHO, 2008. Not within review topic Sherrard J, Ozanne-Smith J, Staines C. Prevention of unintentional injury to people with intellectual disability: a review of the evidence. Journal of Intellectual Disability Research 2004;48(Pt:7):7-45.
Not within review topic
Shults RA, Sacks JJ, Briske LA, Dickey PH, Kinde MR, Mallonee S, Douglas MR. Evaluation of three smoke detector promotion programs. American Journal of Preventive Medicine 1998;15(3):165-71.
Inappropriate study design
Sirois FME & Sirois FM. Procrastination and motivations for household safety behaviors: An expectancy-value theory perspective. [References]. Brown, Lois V (Ed) -326;(2007):Nova.
Not within review topic
Sowden A, Sheldon T, Pehl L, Long A. Preventing unintentional injuries in children and young adolescents. Effective Health Care 1996;2(5):1-16.
Systematic or non-systematic review - reviewed for references
Speller V, Mulligan JA, Law C, Foot B. Preventing injury in children and young people: a review of the literature and current practice (Structured abstract). Wessex Institute of Public Health Medicine 1995;():61.
Systematic or non-systematic review - reviewed for references
Spinks A, Turner C, McClure R, Nixon J. Community based prevention programs targeting all injuries for children (Provisional abstract). Injury Prevention 2004;10():180-85.
Systematic or non-systematic review - reviewed for references
Stocchetti N. Risk prevention, avoidable deaths and mortality-morbidity reduction in head injury. European Journal of Emergency Medicine 2001;8(3):215-19.
Not within review topic
Stone DH. Research on injury prevention: Time for an international agenda? Journal of Epidemiology and Community Health 1996;50(2):127-30.
Systematic or non-systematic review - reviewed for references
Sullivan M, Cole B, Lie L, Twomey J. Reducing child hazards in the home. A joint venture in injury control. Journal of Burn Care & Rehabilitation 1990;11(2):175-79.
Inappropriate study design
Svanstrom L, Ekman R, Schelp L, Lindstrom A. The Lidkoping Accident Prevention Programme--a community approach to preventing childhood injuries in Sweden. Inj Prev 1995;1(3):169-72.
Not within review topic
Swart L, van NA, Seedat M, Jordaan E. Paraprofessional home visitation program to prevent childhood unintentional injuries in low-income communities: a cluster randomized controlled trial. Injury Prevention 2008;14(3):164-69.
Not set in an OECD country
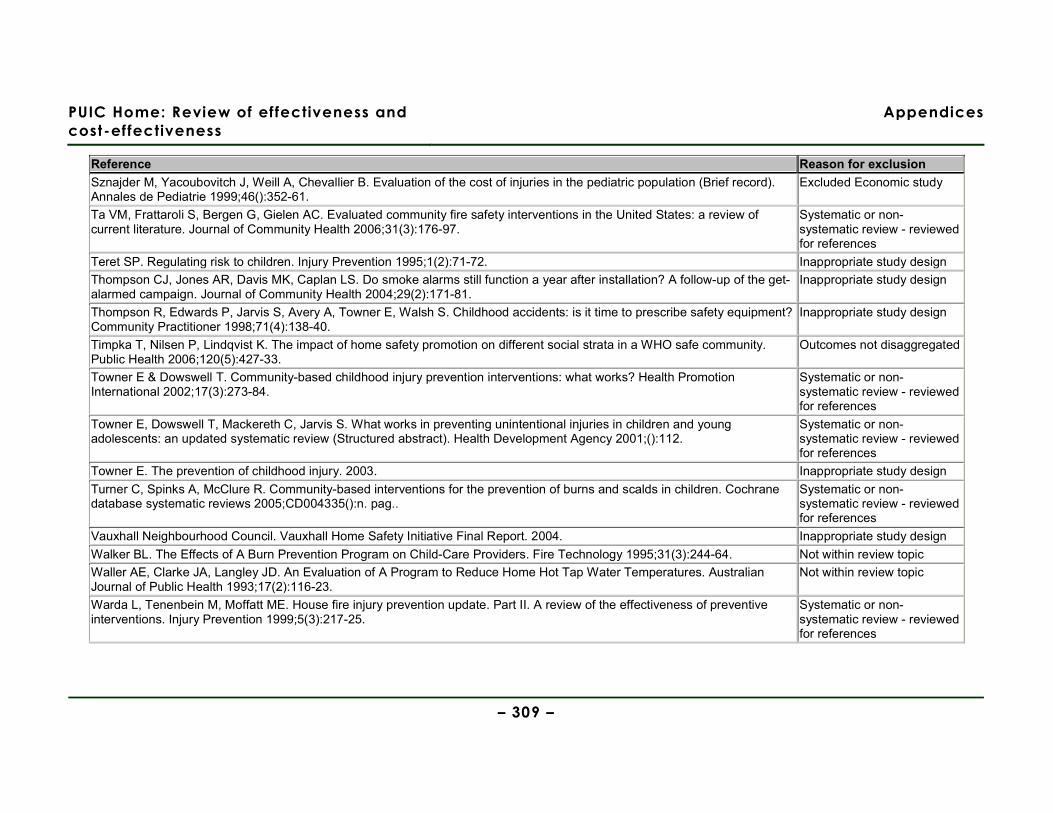
PUIC Home: Review of effectiveness and
cost-effectiveness
Appendices
– 309 –
Reference Reason for exclusion Sznajder M, Yacoubovitch J, Weill A, Chevallier B. Evaluation of the cost of injuries in the pediatric population (Brief record). Annales de Pediatrie 1999;46():352-61.
Excluded Economic study
Ta VM, Frattaroli S, Bergen G, Gielen AC. Evaluated community fire safety interventions in the United States: a review of current literature. Journal of Community Health 2006;31(3):176-97.
Systematic or non-systematic review - reviewed for references
Teret SP. Regulating risk to children. Injury Prevention 1995;1(2):71-72. Inappropriate study design Thompson CJ, Jones AR, Davis MK, Caplan LS. Do smoke alarms still function a year after installation? A follow-up of the get-alarmed campaign. Journal of Community Health 2004;29(2):171-81.
Inappropriate study design
Thompson R, Edwards P, Jarvis S, Avery A, Towner E, Walsh S. Childhood accidents: is it time to prescribe safety equipment? Community Practitioner 1998;71(4):138-40.
Inappropriate study design
Timpka T, Nilsen P, Lindqvist K. The impact of home safety promotion on different social strata in a WHO safe community. Public Health 2006;120(5):427-33.
Outcomes not disaggregated
Towner E & Dowswell T. Community-based childhood injury prevention interventions: what works? Health Promotion International 2002;17(3):273-84.
Systematic or non-systematic review - reviewed for references
Towner E, Dowswell T, Mackereth C, Jarvis S. What works in preventing unintentional injuries in children and young adolescents: an updated systematic review (Structured abstract). Health Development Agency 2001;():112.
Systematic or non-systematic review - reviewed for references
Towner E. The prevention of childhood injury. 2003. Inappropriate study design Turner C, Spinks A, McClure R. Community-based interventions for the prevention of burns and scalds in children. Cochrane database systematic reviews 2005;CD004335():n. pag..
Systematic or non-systematic review - reviewed for references
Vauxhall Neighbourhood Council. Vauxhall Home Safety Initiative Final Report. 2004. Inappropriate study design Walker BL. The Effects of A Burn Prevention Program on Child-Care Providers. Fire Technology 1995;31(3):244-64. Not within review topic Waller AE, Clarke JA, Langley JD. An Evaluation of A Program to Reduce Home Hot Tap Water Temperatures. Australian Journal of Public Health 1993;17(2):116-23.
Not within review topic
Warda L, Tenenbein M, Moffatt ME. House fire injury prevention update. Part II. A review of the effectiveness of preventive interventions. Injury Prevention 1999;5(3):217-25.
Systematic or non-systematic review - reviewed for references
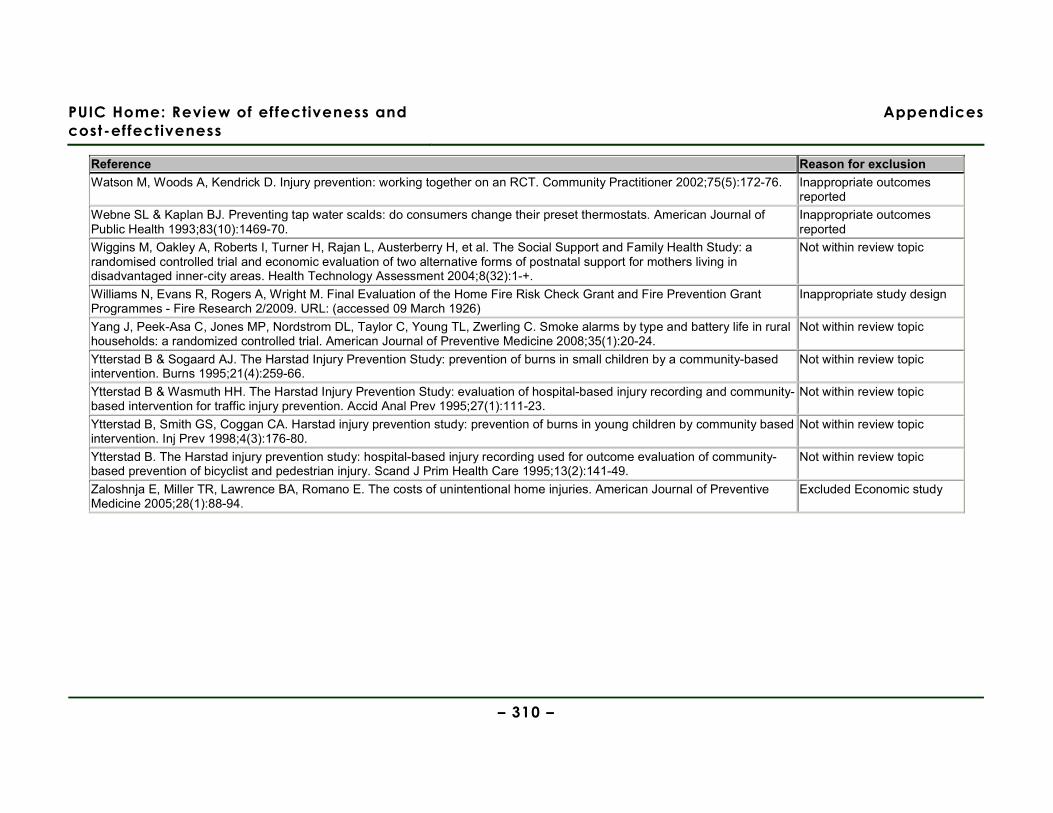
PUIC Home: Review of effectiveness and
cost-effectiveness
Appendices
– 310 –
Reference Reason for exclusion Watson M, Woods A, Kendrick D. Injury prevention: working together on an RCT. Community Practitioner 2002;75(5):172-76. Inappropriate outcomes
reported Webne SL & Kaplan BJ. Preventing tap water scalds: do consumers change their preset thermostats. American Journal of Public Health 1993;83(10):1469-70.
Inappropriate outcomes reported
Wiggins M, Oakley A, Roberts I, Turner H, Rajan L, Austerberry H, et al. The Social Support and Family Health Study: a randomised controlled trial and economic evaluation of two alternative forms of postnatal support for mothers living in disadvantaged inner-city areas. Health Technology Assessment 2004;8(32):1-+.
Not within review topic
Williams N, Evans R, Rogers A, Wright M. Final Evaluation of the Home Fire Risk Check Grant and Fire Prevention Grant Programmes - Fire Research 2/2009. URL: (accessed 09 March 1926)
Inappropriate study design
Yang J, Peek-Asa C, Jones MP, Nordstrom DL, Taylor C, Young TL, Zwerling C. Smoke alarms by type and battery life in rural households: a randomized controlled trial. American Journal of Preventive Medicine 2008;35(1):20-24.
Not within review topic
Ytterstad B & Sogaard AJ. The Harstad Injury Prevention Study: prevention of burns in small children by a community-based intervention. Burns 1995;21(4):259-66.
Not within review topic
Ytterstad B & Wasmuth HH. The Harstad Injury Prevention Study: evaluation of hospital-based injury recording and community-based intervention for traffic injury prevention. Accid Anal Prev 1995;27(1):111-23.
Not within review topic
Ytterstad B, Smith GS, Coggan CA. Harstad injury prevention study: prevention of burns in young children by community based intervention. Inj Prev 1998;4(3):176-80.
Not within review topic
Ytterstad B. The Harstad injury prevention study: hospital-based injury recording used for outcome evaluation of community-based prevention of bicyclist and pedestrian injury. Scand J Prim Health Care 1995;13(2):141-49.
Not within review topic
Zaloshnja E, Miller TR, Lawrence BA, Romano E. The costs of unintentional home injuries. American Journal of Preventive Medicine 2005;28(1):88-94.
Excluded Economic study
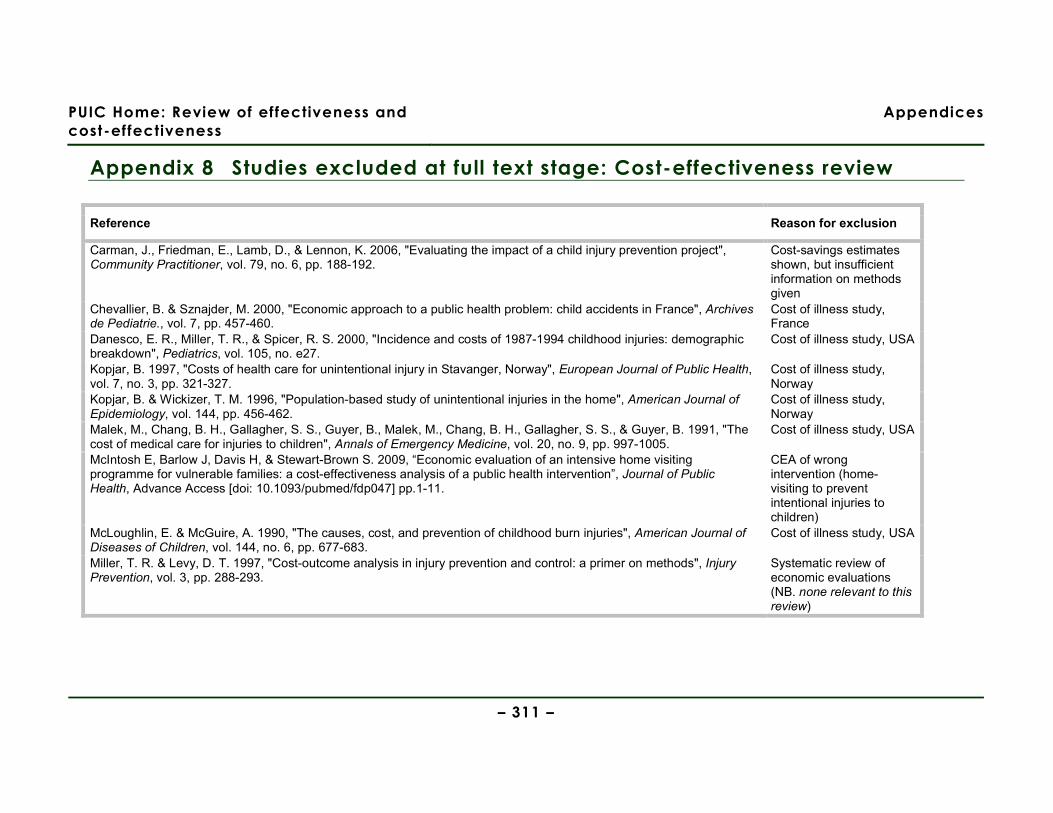
PUIC Home: Review of effectiveness and
cost-effectiveness
Appendices
– 311 –
Appendix 8 Studies excluded at full text stage: Cost-effectiveness review
Reference Reason for exclusion
Carman, J., Friedman, E., Lamb, D., & Lennon, K. 2006, "Evaluating the impact of a child injury prevention project", Community Practitioner, vol. 79, no. 6, pp. 188-192.
Cost-savings estimates shown, but insufficient information on methods given
Chevallier, B. & Sznajder, M. 2000, "Economic approach to a public health problem: child accidents in France", Archives de Pediatrie., vol. 7, pp. 457-460.
Cost of illness study, France
Danesco, E. R., Miller, T. R., & Spicer, R. S. 2000, "Incidence and costs of 1987-1994 childhood injuries: demographic breakdown", Pediatrics, vol. 105, no. e27.
Cost of illness study, USA
Kopjar, B. 1997, "Costs of health care for unintentional injury in Stavanger, Norway", European Journal of Public Health, vol. 7, no. 3, pp. 321-327.
Cost of illness study, Norway
Kopjar, B. & Wickizer, T. M. 1996, "Population-based study of unintentional injuries in the home", American Journal of Epidemiology, vol. 144, pp. 456-462.
Cost of illness study, Norway
Malek, M., Chang, B. H., Gallagher, S. S., Guyer, B., Malek, M., Chang, B. H., Gallagher, S. S., & Guyer, B. 1991, "The cost of medical care for injuries to children", Annals of Emergency Medicine, vol. 20, no. 9, pp. 997-1005.
Cost of illness study, USA
McIntosh E, Barlow J, Davis H, & Stewart-Brown S. 2009, “Economic evaluation of an intensive home visiting programme for vulnerable families: a cost-effectiveness analysis of a public health intervention”, Journal of Public Health, Advance Access [doi: 10.1093/pubmed/fdp047] pp.1-11.
CEA of wrong intervention (home-visiting to prevent intentional injuries to children)
McLoughlin, E. & McGuire, A. 1990, "The causes, cost, and prevention of childhood burn injuries", American Journal of Diseases of Children, vol. 144, no. 6, pp. 677-683.
Cost of illness study, USA
Miller, T. R. & Levy, D. T. 1997, "Cost-outcome analysis in injury prevention and control: a primer on methods", Injury Prevention, vol. 3, pp. 288-293.
Systematic review of economic evaluations (NB. none relevant to this review)
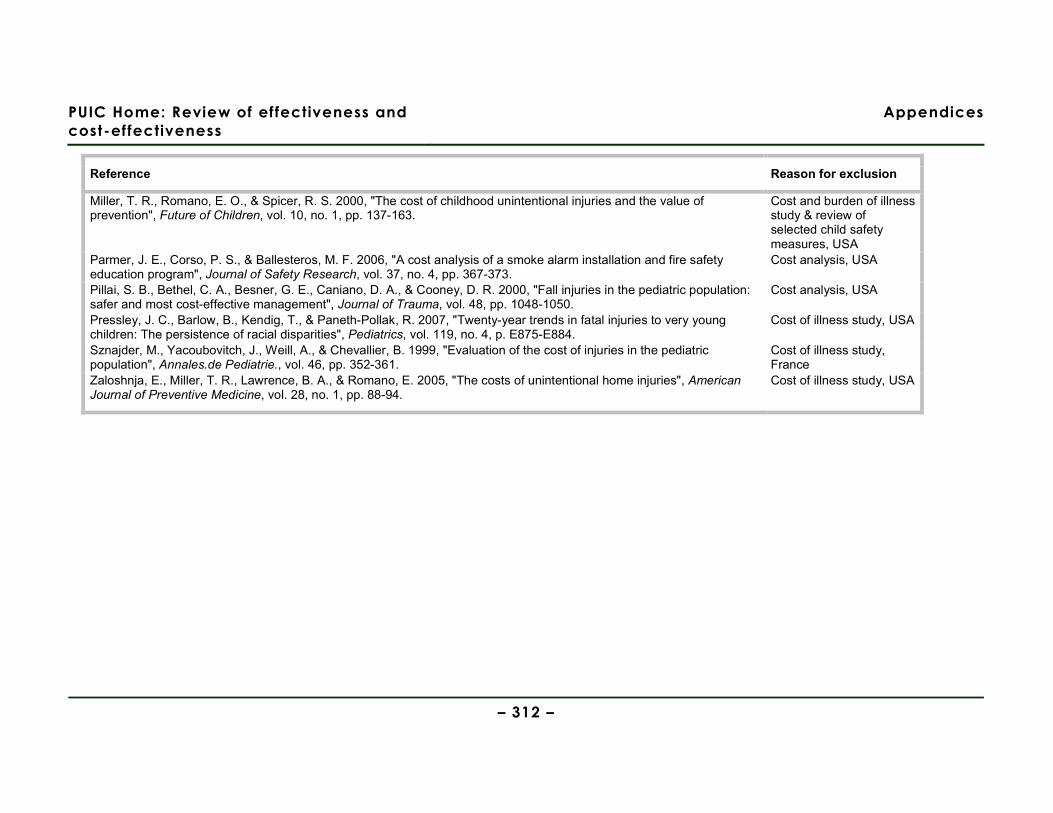
PUIC Home: Review of effectiveness and
cost-effectiveness
Appendices
– 312 –
Reference Reason for exclusion
Miller, T. R., Romano, E. O., & Spicer, R. S. 2000, "The cost of childhood unintentional injuries and the value of prevention", Future of Children, vol. 10, no. 1, pp. 137-163.
Cost and burden of illness study & review of selected child safety measures, USA
Parmer, J. E., Corso, P. S., & Ballesteros, M. F. 2006, "A cost analysis of a smoke alarm installation and fire safety education program", Journal of Safety Research, vol. 37, no. 4, pp. 367-373.
Cost analysis, USA
Pillai, S. B., Bethel, C. A., Besner, G. E., Caniano, D. A., & Cooney, D. R. 2000, "Fall injuries in the pediatric population: safer and most cost-effective management", Journal of Trauma, vol. 48, pp. 1048-1050.
Cost analysis, USA
Pressley, J. C., Barlow, B., Kendig, T., & Paneth-Pollak, R. 2007, "Twenty-year trends in fatal injuries to very young children: The persistence of racial disparities", Pediatrics, vol. 119, no. 4, p. E875-E884.
Cost of illness study, USA
Sznajder, M., Yacoubovitch, J., Weill, A., & Chevallier, B. 1999, "Evaluation of the cost of injuries in the pediatric population", Annales.de Pediatrie., vol. 46, pp. 352-361.
Cost of illness study, France
Zaloshnja, E., Miller, T. R., Lawrence, B. A., & Romano, E. 2005, "The costs of unintentional home injuries", American Journal of Preventive Medicine, vol. 28, no. 1, pp. 88-94.
Cost of illness study, USA
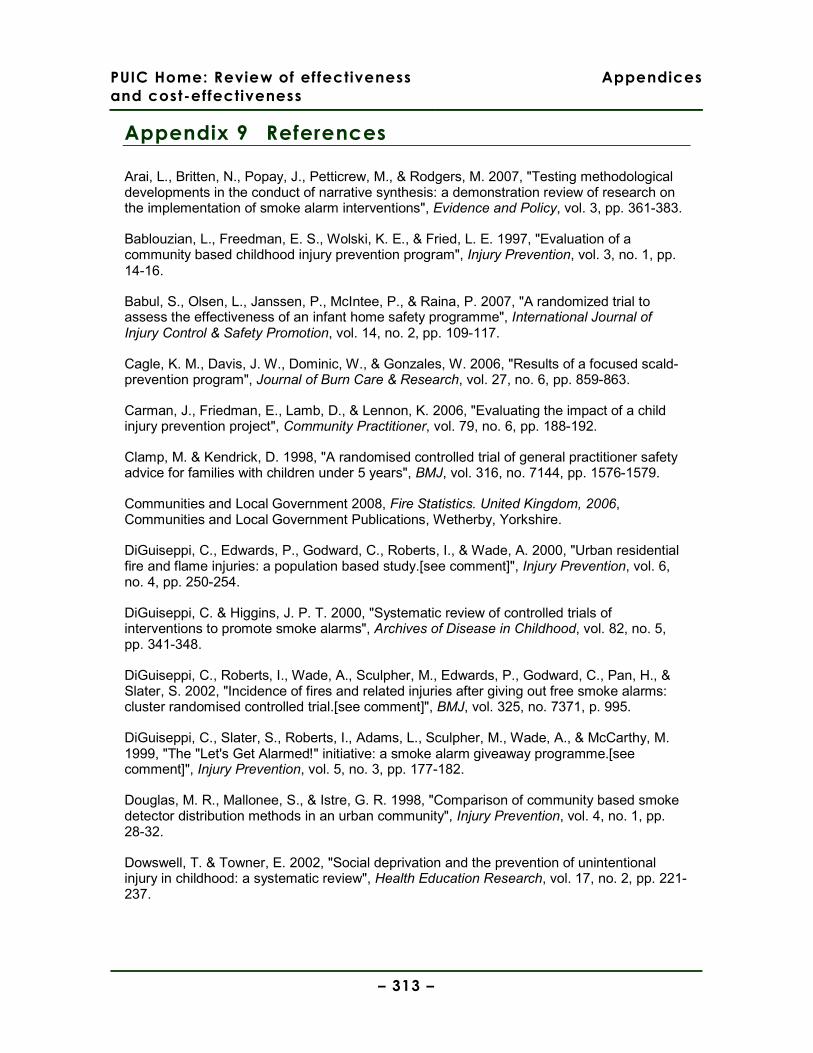
PUIC Home: Review of effectiveness
and cost-effectiveness
Appendices
– 313 –
Appendix 9 References
Arai, L., Britten, N., Popay, J., Petticrew, M., & Rodgers, M. 2007, "Testing methodological developments in the conduct of narrative synthesis: a demonstration review of research on the implementation of smoke alarm interventions", Evidence and Policy, vol. 3, pp. 361-383.
Bablouzian, L., Freedman, E. S., Wolski, K. E., & Fried, L. E. 1997, "Evaluation of a community based childhood injury prevention program", Injury Prevention, vol. 3, no. 1, pp. 14-16.
Babul, S., Olsen, L., Janssen, P., McIntee, P., & Raina, P. 2007, "A randomized trial to assess the effectiveness of an infant home safety programme", International Journal of Injury Control & Safety Promotion, vol. 14, no. 2, pp. 109-117.
Cagle, K. M., Davis, J. W., Dominic, W., & Gonzales, W. 2006, "Results of a focused scald-prevention program", Journal of Burn Care & Research, vol. 27, no. 6, pp. 859-863.
Carman, J., Friedman, E., Lamb, D., & Lennon, K. 2006, "Evaluating the impact of a child injury prevention project", Community Practitioner, vol. 79, no. 6, pp. 188-192.
Clamp, M. & Kendrick, D. 1998, "A randomised controlled trial of general practitioner safety advice for families with children under 5 years", BMJ, vol. 316, no. 7144, pp. 1576-1579.
Communities and Local Government 2008, Fire Statistics. United Kingdom, 2006, Communities and Local Government Publications, Wetherby, Yorkshire.
DiGuiseppi, C., Edwards, P., Godward, C., Roberts, I., & Wade, A. 2000, "Urban residential fire and flame injuries: a population based study.[see comment]", Injury Prevention, vol. 6, no. 4, pp. 250-254.
DiGuiseppi, C. & Higgins, J. P. T. 2000, "Systematic review of controlled trials of interventions to promote smoke alarms", Archives of Disease in Childhood, vol. 82, no. 5, pp. 341-348.
DiGuiseppi, C., Roberts, I., Wade, A., Sculpher, M., Edwards, P., Godward, C., Pan, H., & Slater, S. 2002, "Incidence of fires and related injuries after giving out free smoke alarms: cluster randomised controlled trial.[see comment]", BMJ, vol. 325, no. 7371, p. 995.
DiGuiseppi, C., Slater, S., Roberts, I., Adams, L., Sculpher, M., Wade, A., & McCarthy, M. 1999, "The "Let's Get Alarmed!" initiative: a smoke alarm giveaway programme.[see comment]", Injury Prevention, vol. 5, no. 3, pp. 177-182.
Douglas, M. R., Mallonee, S., & Istre, G. R. 1998, "Comparison of community based smoke detector distribution methods in an urban community", Injury Prevention, vol. 4, no. 1, pp. 28-32.
Dowswell, T. & Towner, E. 2002, "Social deprivation and the prevention of unintentional injury in childhood: a systematic review", Health Education Research, vol. 17, no. 2, pp. 221-237.
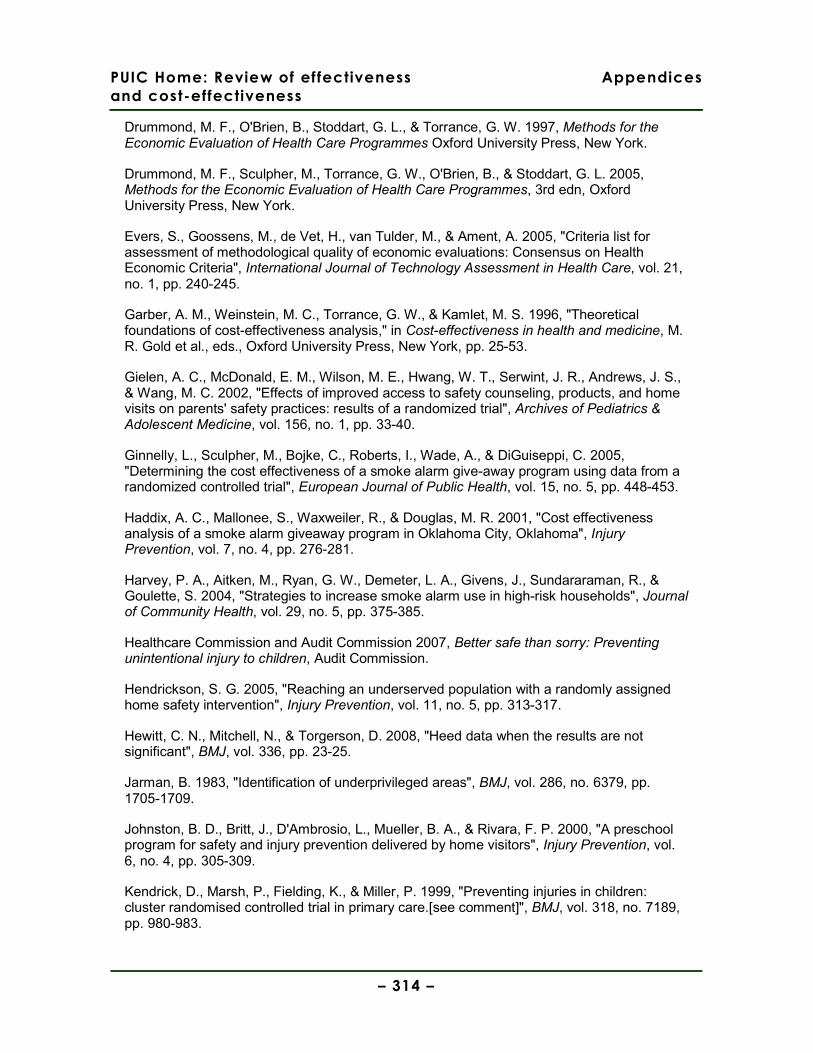
PUIC Home: Review of effectiveness
and cost-effectiveness
Appendices
– 314 –
Drummond, M. F., O'Brien, B., Stoddart, G. L., & Torrance, G. W. 1997, Methods for the Economic Evaluation of Health Care Programmes Oxford University Press, New York.
Drummond, M. F., Sculpher, M., Torrance, G. W., O'Brien, B., & Stoddart, G. L. 2005, Methods for the Economic Evaluation of Health Care Programmes, 3rd edn, Oxford University Press, New York.
Evers, S., Goossens, M., de Vet, H., van Tulder, M., & Ament, A. 2005, "Criteria list for assessment of methodological quality of economic evaluations: Consensus on Health Economic Criteria", International Journal of Technology Assessment in Health Care, vol. 21, no. 1, pp. 240-245.
Garber, A. M., Weinstein, M. C., Torrance, G. W., & Kamlet, M. S. 1996, "Theoretical foundations of cost-effectiveness analysis," in Cost-effectiveness in health and medicine, M. R. Gold et al., eds., Oxford University Press, New York, pp. 25-53.
Gielen, A. C., McDonald, E. M., Wilson, M. E., Hwang, W. T., Serwint, J. R., Andrews, J. S., & Wang, M. C. 2002, "Effects of improved access to safety counseling, products, and home visits on parents' safety practices: results of a randomized trial", Archives of Pediatrics & Adolescent Medicine, vol. 156, no. 1, pp. 33-40.
Ginnelly, L., Sculpher, M., Bojke, C., Roberts, I., Wade, A., & DiGuiseppi, C. 2005, "Determining the cost effectiveness of a smoke alarm give-away program using data from a randomized controlled trial", European Journal of Public Health, vol. 15, no. 5, pp. 448-453.
Haddix, A. C., Mallonee, S., Waxweiler, R., & Douglas, M. R. 2001, "Cost effectiveness analysis of a smoke alarm giveaway program in Oklahoma City, Oklahoma", Injury Prevention, vol. 7, no. 4, pp. 276-281.
Harvey, P. A., Aitken, M., Ryan, G. W., Demeter, L. A., Givens, J., Sundararaman, R., & Goulette, S. 2004, "Strategies to increase smoke alarm use in high-risk households", Journal of Community Health, vol. 29, no. 5, pp. 375-385.
Healthcare Commission and Audit Commission 2007, Better safe than sorry: Preventing unintentional injury to children, Audit Commission.
Hendrickson, S. G. 2005, "Reaching an underserved population with a randomly assigned home safety intervention", Injury Prevention, vol. 11, no. 5, pp. 313-317.
Hewitt, C. N., Mitchell, N., & Torgerson, D. 2008, "Heed data when the results are not significant", BMJ, vol. 336, pp. 23-25.
Jarman, B. 1983, "Identification of underprivileged areas", BMJ, vol. 286, no. 6379, pp. 1705-1709.
Johnston, B. D., Britt, J., D'Ambrosio, L., Mueller, B. A., & Rivara, F. P. 2000, "A preschool program for safety and injury prevention delivered by home visitors", Injury Prevention, vol. 6, no. 4, pp. 305-309.
Kendrick, D., Marsh, P., Fielding, K., & Miller, P. 1999, "Preventing injuries in children: cluster randomised controlled trial in primary care.[see comment]", BMJ, vol. 318, no. 7189, pp. 980-983.
PUIC Home: Review of effectiveness
and cost-effectiveness
Appendices
– 315 –
Kendrick, D., Mulvaney, C., & Watson, M. 2009, "Does targeting injury prevention towards families in disadvantaged areas reduce inequalities in safety practices?", Health Education Research, vol. 24, no. 1, pp. 32-41.
King, W. J., Klassen, T. P., LeBlanc, J., Bernard-Bonnin, A. C., Robitaille, Y., Pham, B., Coyle, D., Tenenbein, M., & Pless, I. B. 2001, "The effectiveness of a home visit to prevent childhood injury", Pediatrics, vol. 108, no. 2, pp. 382-388.
King, W. J., LeBlanc, J. C., Barrowman, N. J., Klassen, T. P., Bernard-Bonnin, A. C., Robitaille, Y., Tenenbein, M., & Pless, I. B. 2005, "Long term effects of a home visit to prevent childhood injury: three year follow up of a randomized trial", Injury Prevention, vol. 11, no. 2, pp. 106-109.
Klitzman, S., Caravanos, J., Belanoff, C., & Rothenberg, L. 2005, "A multihazard, multistrategy approach to home remediation: results of a pilot study", Environmental Research, vol. 99, no. 3, pp. 294-306.
Mallonee, S., Istre, G. R., Rosenberg, M., Reddish-Douglas, M., Jordan, F., Silverstein, P., & Tunell, W. 1996, "Surveillance and prevention of residential-fire injuries", New England Journal of Medicine, vol. 335, no. 1, pp. 27-31.
McIntosh, E., Barlow, J., Davis, H., & Stewart-Brown, S. 2009, "Economic evaluation of an intensive home visiting programme for vulnerable families: a cost-effectiveness analysis of a public health intervention", Journal of Public Health, vol. Advance Access [doi: 10.1093/pubmed/fdp047], no. 1-11.
Metchikian, K. L., Mink, J. M., Bigelow, K. M., Lutzker, J. R., & Doctor, R. M. 1999, "Reducing home safety hazards in the homes of parents reported for neglect", Child & Family Behavior Therapy, vol. 21, no. 3, pp. 23-34.
National Institute for Health and Clinical Excellence. Methods for the development of NICE public health guidance (second edition). 282pp. 2009. Ref Type: Generic
Office for National Statistics. Mortality Statitics. Deaths Registered in 2007. www.ons.gov.uk . 22-7-2009. Ref Type: Electronic Citation
Parmer, J. E., Corso, P. S., & Ballesteros, M. F. 2006, "A cost analysis of a smoke alarm installation and fire safety education program", Journal of Safety Research, vol. 37, no. 4, pp. 367-373.
Paul, C. L., Sansonfisher, R. W., Redman, S., & Carter, S. 1994, "Preventing Accidental Injury to Young-Children in the Home Using Volunteers", Health Promotion International, vol. 9, no. 4, pp. 241-249.
Peden, M., Oyegbite, K., Ozanne-Smith, J., Hyder, A., Branche, C., Rahman, F., Rivara, F., & Bartolomeos, K. 2008, World Report on Child Injury Prevention, WHO.
Pillai, S. B., Bethel, C. A., Besner, G. E., Caniano, D. A., & Cooney, D. R. 2000, "Fall injuries in the pediatric population: safer and most cost-effective management (Brief record)", Journal of Trauma, vol. 48, pp. 1048-1050.
PUIC Home: Review of effectiveness
and cost-effectiveness
Appendices
– 316 –
Posner, J. C., Hawkins, L. A., Garcia-Espana, F., & Durbin, D. R. 2004, "A randomized, clinical trial of a home safety intervention based in an emergency department setting", Pediatrics, vol. 113, no. 6, pp. 1603-1608.
Sangvai, S., Cipriani, L., Colborn, D. K., & Wald, E. R. 2007, "Studying injury prevention: practices, problems, and pitfalls in implementation", Clinical Pediatrics, vol. 46, no. 3, pp. 228-235.
Schwarz, D. F., Grisso, J. A., Miles, C., Holmes, J. H., & Sutton, R. L. 1993, "An injury prevention program in an urban African-American community", American Journal of Public Health, vol. 83, no. 5, pp. 675-680.
Sznajder, M., Leduc, S., Janvrin, M. P., Bonnin, M. H., Aegerter, P., Baudier, F., & Chevallier, B. 265, "Home delivery of an injury prevention kit for children in four French cities: a controlled randomized trial", Injury Prevention, vol. 9, no. 3, pp. 261-265.
Walsh, S., Jarvis, S. N., Towner E.N., & Aynsley-Green, A. 1996, "Annual incidence of unintentional injury among 54,000 children", Injury Prevention, vol. 2, pp. 16-20.
Watson, M., Kendrick, D., Coupland, C., Woods, A., Futers, D., & Robinson, J. 2005, "Providing child safety equipment to prevent injuries: randomised controlled trial", BMJ, vol. 330, no. 7484, p. 178.
Woolf, A. D., Saperstein, A., & Forjuoh, S. 1992, "Poisoning Prevention Knowledge and Practices of Parents After A Childhood Poisoning Incident", Pediatrics, vol. 90, no. 6, pp. 867-870.