Influence of an Expanded Framework of Shopping Motivations ...
Upload
independentCategory
view
0download
0
RESEARCH ARTICLE
Cost-Effectiveness Analysis of Brief andExpanded Evidence-Based Risk ReductionInterventions for HIV-Infected People WhoInject Drugs in the United StatesDahye L. Song1*, Frederick L. Altice2, Michael M. Copenhaver3,4, Elisa F. Long5
1 PhD Program in Health Policy, Harvard University, Cambridge, Massachusetts, United States of America,2 AIDS Program, Section of Infectious Diseases, Yale University School of Medicine, New Haven,Connecticut, United States of America, 3 Division of Epidemiology of Microbial Diseases, Yale UniversitySchool of Public Health, New Haven, Connecticut, United States of America, 4 Department of Allied HealthSciences, University of Connecticut, Storrs, Connecticut, United States of America, 5 UCLA AndersonSchool of Management, Los Angeles, California, United States of America
Abstract
AimsTwo behavioral HIV prevention interventions for people who inject drugs (PWID) infectedwith HIV include the Holistic Health Recovery Program for HIV+ (HHRP+), a comprehensiveevidence-based CDC-supported program, and an abbreviated Holistic Health for HIV (3H+)Program, an adapted HHRP+ version in treatment settings. We compared the projectedhealth benefits and cost-effectiveness of both programs, in addition to opioid substitutiontherapy (OST), to the status quo in the U.S.
MethodsA dynamic HIV transmission model calibrated to epidemic data of current US populationswas created. Projected outcomes include future HIV incidence, HIV prevalence, and quali-ty-adjusted life years (QALYs) gained under alternative strategies. Total medical costs wereestimated to compare the cost-effectiveness of each strategy.
ResultsOver 10 years, expanding HHRP+ access to 80% of PWID could avert up to 29,000 HIV in-fections, or 6% of the projected total, at a cost of $7,777/QALY gained. Alternatively, 3H+could avert 19,000 infections, but is slightly more cost-effective ($7,707/QALY), and re-mains so under widely varying effectiveness and cost assumptions. Nearly two-thirds of in-fections averted with either program are among non-PWIDs, due to reduced sexualtransmission from PWID to their partners. Expanding these programs with broader OSTcoverage could avert up to 74,000 HIV infections over 10 years and reduce HIV prevalencefrom 16.5% to 14.1%, but is substantially more expensive than HHRP+ or 3H+ alone.
PLOS ONE | DOI:10.1371/journal.pone.0116694 February 6, 2015 1 / 19
OPEN ACCESS
Citation: Song DL, Altice FL, Copenhaver MM, LongEF (2015) Cost-Effectiveness Analysis of Brief andExpanded Evidence-Based Risk ReductionInterventions for HIV-Infected People Who InjectDrugs in the United States. PLoS ONE 10(2):e0116694. doi:10.1371/journal.pone.0116694
Academic Editor: Koustuv Dalal, Örebro University,SWEDEN
Received: September 26, 2014
Accepted: December 14, 2014
Published: February 6, 2015
Copyright: © 2015 Song et al. This is an openaccess article distributed under the terms of theCreative Commons Attribution License, which permitsunrestricted use, distribution, and reproduction in anymedium, provided the original author and source arecredited.
Data Availability Statement: All relevant data arewithin the paper and its Supporting Information files.
Funding: The study was funded by the NationalInstitute on Drug Abuse (http://www.drugabuse.gov/)for research (R01 DA032290 for FLA and MMC) andcareer development awards (K24 DA017072 for FLAand K02 DA033139 for MMC.) The funding sourcesplayed no role in study design, data collection,analysis, or interpretation, writing of the manuscript,or the decision to submit the paper for publication.
ConclusionsBoth behavioral interventions were effective and cost-effective at reducing HIV incidenceamong both PWID and the general adult population; however, 3H+, the economical HHRP+version, was slightly more cost-effective than HHRP+.
IntroductionDespite numerous evidence-based HIV prevention interventions, HIV incidence in the U.S.has remained unchanged over the past 15 years, with approximately 50,000 new infections oc-curring annually [1]. People who inject drugs (PWID), including male PWID who have sexwith men (MSM), comprise nearly 20% of people living with HIV (PLHIV) and 11–13% ofnew infections [1–2]. PWID engage in increased injection-related and sexual risk behaviorsthat can transmit HIV to others, fueling HIV transmission to the general population [3].
Increased access to combination antiretroviral therapy (ART) markedly reduces HIV-relat-ed morbidity and mortality. Consistent ART access and optimal adherence suppresses viralreplication, conferring benefits to uninfected populations by reducing sexual HIV transmission[4–5]. Additionally, several mathematical modeling analyses estimate substantial reductions infuture HIV incidence with increased linkage to care and ART utilization [6–8]. Given concernsthat the benefits of expanded ART might be offset by risk behavior disinhibition and the corre-sponding increase in sexually transmitted infections (STIs) that facilitate transmission, the roleof evidence-based interventions (EBIs) for high-risk populations as part of a comprehensiveHIV prevention and treatment approach has become exceedingly important [9].
EBIs that reduce needle-sharing, promote condom use, and improve ART adherenceamong PWID have demonstrated effectiveness [10], and a number of EBIs are widely availablefor PLHIV through the CDC's Diffusion of Effective Behavioral Interventions (DEBI) program[11]. Among these, the Holistic Health Recovery Program for HIV+s (HHRP+) serves as a`gold standard' among interventions targeting HIV-infected PWID [11]. HHRP+ is a compre-hensive manual-guided risk reduction and health promotion intervention for HIV-infectedPWID that centers on theory-based behavioral change [12]. Unlike most EBIs, HHRP+ poten-tially reduces HIV transmission by both improving ART adherence and by reducing sexual-and drug-related HIV risk behaviors [12–13].
Widespread implementation of EBIs has been constrained by limited resources necessaryfor proper implementation. A recent review comparing multiple-session EBIs with briefer in-terventions suggests that brief programs are likely to be more cost-effective and easier to imple-ment [14]. Thus, an abbreviated Holistic Health for HIV (3H+) Program, an adapted HHRP+version delivered in treatment settings, has been developed. The 3H+ is a theory driven, manu-al-guided, behavioral intervention that consists of four 45-minute weekly group meetings thatare specifically designed to address sex- and drug-related transmission risk behavior and ARTadherence among HIV-infected PWIDs [15]. A pilot study of 3H+ demonstrated significantimprovement in both sexual- and drug-related risk measures [15]. To address this gap, a non-inferiority randomized controlled trial (RCT) comparing the briefer Holistic Health for HIVprogram (3H+) with HHRP+ is currently underway [15].
In the absence of findings from an ongoing randomized controlled trial (80 of 256 projectedparticipants are enrolled), our goal is to estimate the projected health benefits and costs of im-plementing HHRP+ versus 3H+, through use of a mathematical epidemic model, at variouslevels of implementation, based on results from the original studies compared to treatment as
Cost-Effectiveness of Risk Reduction Interventions for HIV+ PWID
PLOSONE | DOI:10.1371/journal.pone.0116694 February 6, 2015 2 / 19
Competing Interests: The authors have declaredthat no competing interests exist.
usual. In the current HIV prevention and treatment era and in the absence of empirical data,we sought to model parameters that may markedly influence the outcomes of both expandedand abbreviated behavioral interventions. Modeling studies allow us to address the uncertaintyof a number of outcome parameters in the short-term, yet allow for the eventual results of ourproposed RCT to guide public health preventive recommendations. Further, our modelingstudy examines justification for the allocation of resources on briefer behavioral interventionsfrom an economic perspective. Given the increasing constrained funding environment for HIVprevention efforts with a particularly challenging patient population, evaluating the cost-effec-tiveness of briefer interventions will provide support for their deployment of HIV preventioninterventions for PWID until findings from the RCT become available. Thus, understandingthe potential population-wide health gains and costs of secondary HIV prevention from theseinterventions through modeling will help translate observed risk behavior into meaningful,long-term health outcomes and help policymakers optimally allocate resources among compet-ing HIV prevention programs.
Materials and MethodsOverviewWe developed a customized HIV epidemic model to estimate the effectiveness and relativecost-effectiveness of two behavioral intervention programs (3H+ and HHRP+) for PWID inthe U.S. The model used HIV transmission probabilities and contact rates among PWID andbetween PWID and the general adult population to project HIV incidence, prevalence, andHIV-related mortality over a 10-year horizon. Health benefits and costs were computed foreach strategy considered. The model was calibrated to epidemic data of current U.S. popula-tions and the natural history of HIV (Table 1). Published results from the original HHRP+RCT and 3H+ pilot study were used for behavioral intervention parameters (Table 1) [12–13,15]. Sensitivity analyses were conducted on all parameters (S3 Table, S4 Table). The modelwas implemented in MATLAB (details available in S1 Appendix).
Strategies AnalyzedWe considered six different HIV prevention strategies for PWID and compared their relativeeffectiveness against the status quo. In the U.S., opioid substitution therapy (OST) using meth-adone or buprenorphine maintenance is currently available to only 13% of PWID [16]. Fur-thermore, only 30% of non-PWID and 33% of PWID are receiving ART [17–18]. Theseassumptions form the basis of our “status quo” scenario.
We first considered expanding either "HHRP+" or "3H+" to 80% of PWID. 3H+ is anadapted and shortened version of HHRP+ in treatment settings to improve the feasibility ofimplementation. Because HHRP+ is estimated to be twice as expensive as 3H+ [13,19], we alsoevaluated an "HHRP+ Low" strategy, which would reach 40% of PWID and cost approximatelythe same as 80% coverage of "3H+". In addition, we considered simultaneously expanding OSTand a behavioral intervention ("OST/HHRP+", "OST/3H+"), since augmenting a behavioralprogram with OST was found to be effective [12–13]. For comparison, we modeled OST ex-pansion alone ("OST"). Table 2 summarizes the coverage of each strategy.
Antiretroviral Therapy and Opioid Substitution TherapyThe most recent (2013) U.S. guidelines recommend that all patients with chronic HIVinfection be considered for ART initiation regardless of CD4 count [20–21]. After consideringdelays in early ART roll-out and uncertainty in the long-term health benefits of initiating
Cost-Effectiveness of Risk Reduction Interventions for HIV+ PWID
PLOSONE | DOI:10.1371/journal.pone.0116694 February 6, 2015 3 / 19
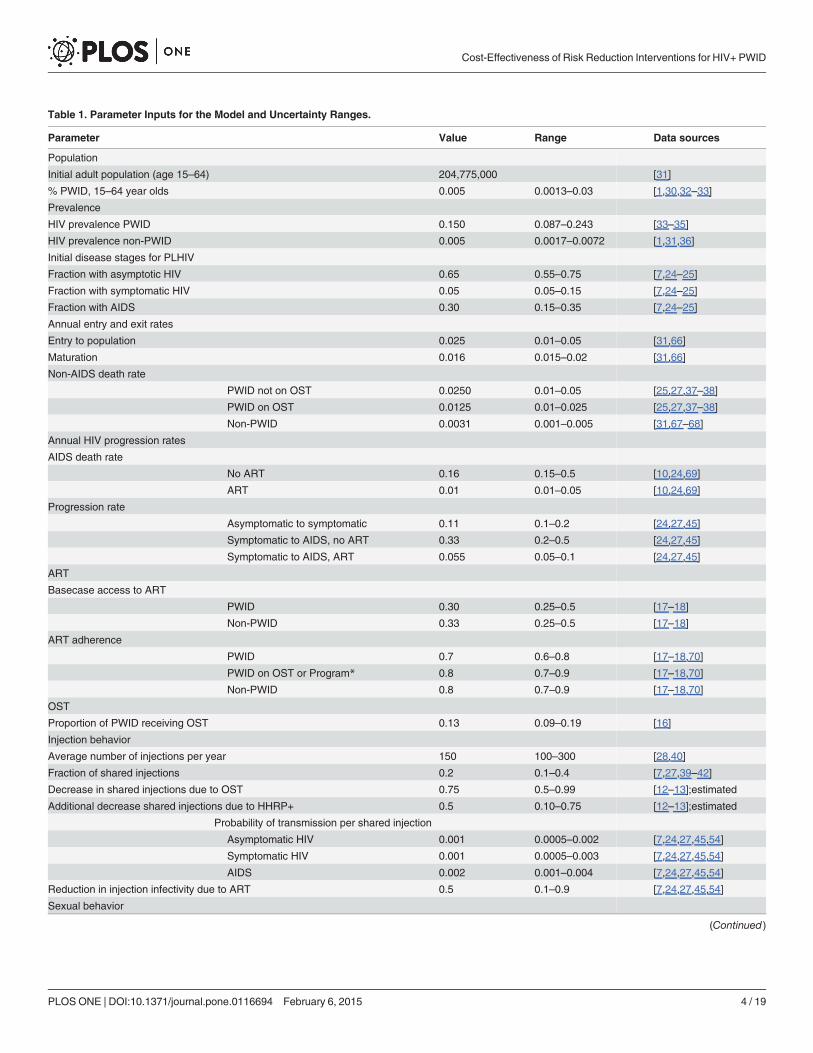
Table 1. Parameter Inputs for the Model and Uncertainty Ranges.
Parameter Value Range Data sources
Population
Initial adult population (age 15–64) 204,775,000 [31]
% PWID, 15–64 year olds 0.005 0.0013–0.03 [1,30,32–33]
Prevalence
HIV prevalence PWID 0.150 0.087–0.243 [33–35]
HIV prevalence non-PWID 0.005 0.0017–0.0072 [1,31,36]
Initial disease stages for PLHIV
Fraction with asymptotic HIV 0.65 0.55–0.75 [7,24–25]
Fraction with symptomatic HIV 0.05 0.05–0.15 [7,24–25]
Fraction with AIDS 0.30 0.15–0.35 [7,24–25]
Annual entry and exit rates
Entry to population 0.025 0.01–0.05 [31,66]
Maturation 0.016 0.015–0.02 [31,66]
Non-AIDS death rate
PWID not on OST 0.0250 0.01–0.05 [25,27,37–38]
PWID on OST 0.0125 0.01–0.025 [25,27,37–38]
Non-PWID 0.0031 0.001–0.005 [31,67–68]
Annual HIV progression rates
AIDS death rate
No ART 0.16 0.15–0.5 [10,24,69]
ART 0.01 0.01–0.05 [10,24,69]
Progression rate
Asymptomatic to symptomatic 0.11 0.1–0.2 [24,27,45]
Symptomatic to AIDS, no ART 0.33 0.2–0.5 [24,27,45]
Symptomatic to AIDS, ART 0.055 0.05–0.1 [24,27,45]
ART
Basecase access to ART
PWID 0.30 0.25–0.5 [17–18]
Non-PWID 0.33 0.25–0.5 [17–18]
ART adherence
PWID 0.7 0.6–0.8 [17–18,70]
PWID on OST or Program* 0.8 0.7–0.9 [17–18,70]
Non-PWID 0.8 0.7–0.9 [17–18,70]
OST
Proportion of PWID receiving OST 0.13 0.09–0.19 [16]
Injection behavior
Average number of injections per year 150 100–300 [28,40]
Fraction of shared injections 0.2 0.1–0.4 [7,27,39–42]
Decrease in shared injections due to OST 0.75 0.5–0.99 [12–13];estimated
Additional decrease shared injections due to HHRP+ 0.5 0.10–0.75 [12–13];estimated
Probability of transmission per shared injection
Asymptomatic HIV 0.001 0.0005–0.002 [7,24,27,45,54]
Symptomatic HIV 0.001 0.0005–0.003 [7,24,27,45,54]
AIDS 0.002 0.001–0.004 [7,24,27,45,54]
Reduction in injection infectivity due to ART 0.5 0.1–0.9 [7,24,27,45,54]
Sexual behavior
(Continued)
Cost-Effectiveness of Risk Reduction Interventions for HIV+ PWID
PLOSONE | DOI:10.1371/journal.pone.0116694 February 6, 2015 4 / 19
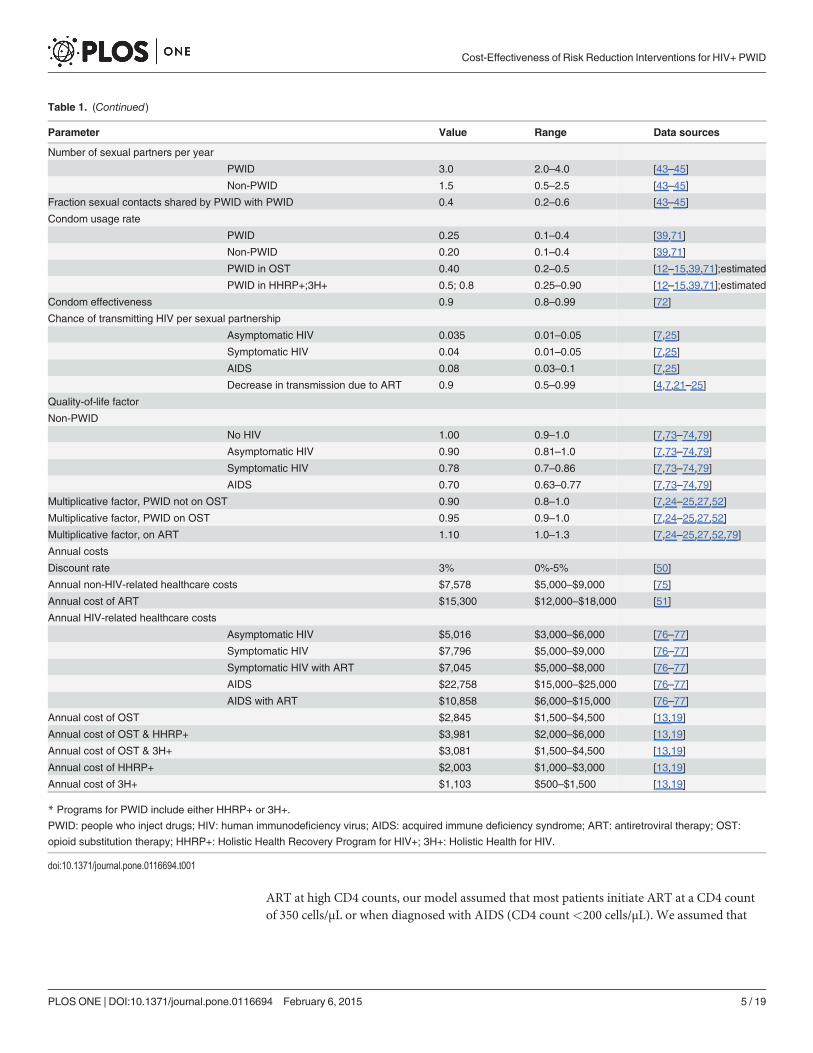
ART at high CD4 counts, our model assumed that most patients initiate ART at a CD4 countof 350 cells/μL or when diagnosed with AIDS (CD4 count<200 cells/μL). We assumed that
Table 1. (Continued)
Parameter Value Range Data sources
Number of sexual partners per year
PWID 3.0 2.0–4.0 [43–45]
Non-PWID 1.5 0.5–2.5 [43–45]
Fraction sexual contacts shared by PWID with PWID 0.4 0.2–0.6 [43–45]
Condom usage rate
PWID 0.25 0.1–0.4 [39,71]
Non-PWID 0.20 0.1–0.4 [39,71]
PWID in OST 0.40 0.2–0.5 [12–15,39,71];estimated
PWID in HHRP+;3H+ 0.5; 0.8 0.25–0.90 [12–15,39,71];estimated
Condom effectiveness 0.9 0.8–0.99 [72]
Chance of transmitting HIV per sexual partnership
Asymptomatic HIV 0.035 0.01–0.05 [7,25]
Symptomatic HIV 0.04 0.01–0.05 [7,25]
AIDS 0.08 0.03–0.1 [7,25]
Decrease in transmission due to ART 0.9 0.5–0.99 [4,7,21–25]
Quality-of-life factor
Non-PWID
No HIV 1.00 0.9–1.0 [7,73–74,79]
Asymptomatic HIV 0.90 0.81–1.0 [7,73–74,79]
Symptomatic HIV 0.78 0.7–0.86 [7,73–74,79]
AIDS 0.70 0.63–0.77 [7,73–74,79]
Multiplicative factor, PWID not on OST 0.90 0.8–1.0 [7,24–25,27,52]
Multiplicative factor, PWID on OST 0.95 0.9–1.0 [7,24–25,27,52]
Multiplicative factor, on ART 1.10 1.0–1.3 [7,24–25,27,52,79]
Annual costs
Discount rate 3% 0%-5% [50]
Annual non-HIV-related healthcare costs $7,578 $5,000–$9,000 [75]
Annual cost of ART $15,300 $12,000–$18,000 [51]
Annual HIV-related healthcare costs
Asymptomatic HIV $5,016 $3,000–$6,000 [76–77]
Symptomatic HIV $7,796 $5,000–$9,000 [76–77]
Symptomatic HIV with ART $7,045 $5,000–$8,000 [76–77]
AIDS $22,758 $15,000–$25,000 [76–77]
AIDS with ART $10,858 $6,000–$15,000 [76–77]
Annual cost of OST $2,845 $1,500–$4,500 [13,19]
Annual cost of OST & HHRP+ $3,981 $2,000–$6,000 [13,19]
Annual cost of OST & 3H+ $3,081 $1,500–$4,500 [13,19]
Annual cost of HHRP+ $2,003 $1,000–$3,000 [13,19]
Annual cost of 3H+ $1,103 $500–$1,500 [13,19]
* Programs for PWID include either HHRP+ or 3H+.PWID: people who inject drugs; HIV: human immunodeficiency virus; AIDS: acquired immune deficiency syndrome; ART: antiretroviral therapy; OST:opioid substitution therapy; HHRP+: Holistic Health Recovery Program for HIV+; 3H+: Holistic Health for HIV.
doi:10.1371/journal.pone.0116694.t001
Cost-Effectiveness of Risk Reduction Interventions for HIV+ PWID
PLOSONE | DOI:10.1371/journal.pone.0116694 February 6, 2015 5 / 19
70% of PWID and 80% of non-PWID receiving ART had sufficient adherence to achieve viralsuppression [18].
With high levels of adherence, ART suppresses viral replication to undetectable levels, andmarkedly reduces the likelihood of sexual transmission from infected individuals to their sexualpartners [4–5,22]. We assumed that ART reduces sexual transmission by 90% with optimal ad-herence [7,23–25] and by 58% for all patients with non-monogamous relationships, subopti-mal ART adherence, or the presence of STIs [5]. Studies have also demonstrated that ART useamong PWID is associated with reduced HIV incidence [26], but the extent to which ART re-duces injection infectivity is not clear; thus, we assumed a 50% reduction in the chance of HIVtransmission per shared injection, similar to other modeling studies [7,25,27].
Studies and systematic reviews have demonstrated the efficacy of OST for treating opioiddependence and preventing HIV infection [28–29]. PWID on OST share injecting equipmentless frequently, both from less drug injection and a greater awareness of risk reduction strate-gies, but the estimated risk reduction range varies widely [28]. We assumed that PWID partici-pating in OST will decrease needle sharing by 75%, based on the previous RCT results ofHHRP+ [12]. OST potentially alters the number of sexual partnerships [28], but we conserva-tively estimated no changes in sexual behavior stemming directly from OST. We assumed thatlimited OST slots are filled immediately when a participant is lost, and thus a fixed proportionof PWID are assigned to OST slots at any given time.
Recent trends have suggested a decrease in HIV incidence among PWID, potentially as a re-sult of various factors such as expanded OST, needle/syringe exchange programs (NEP), or ashift from injectable to non-injectable opioids. Although the availability of these harm reduc-tion efforts might gradually increase, for our analysis we assumed that their availability
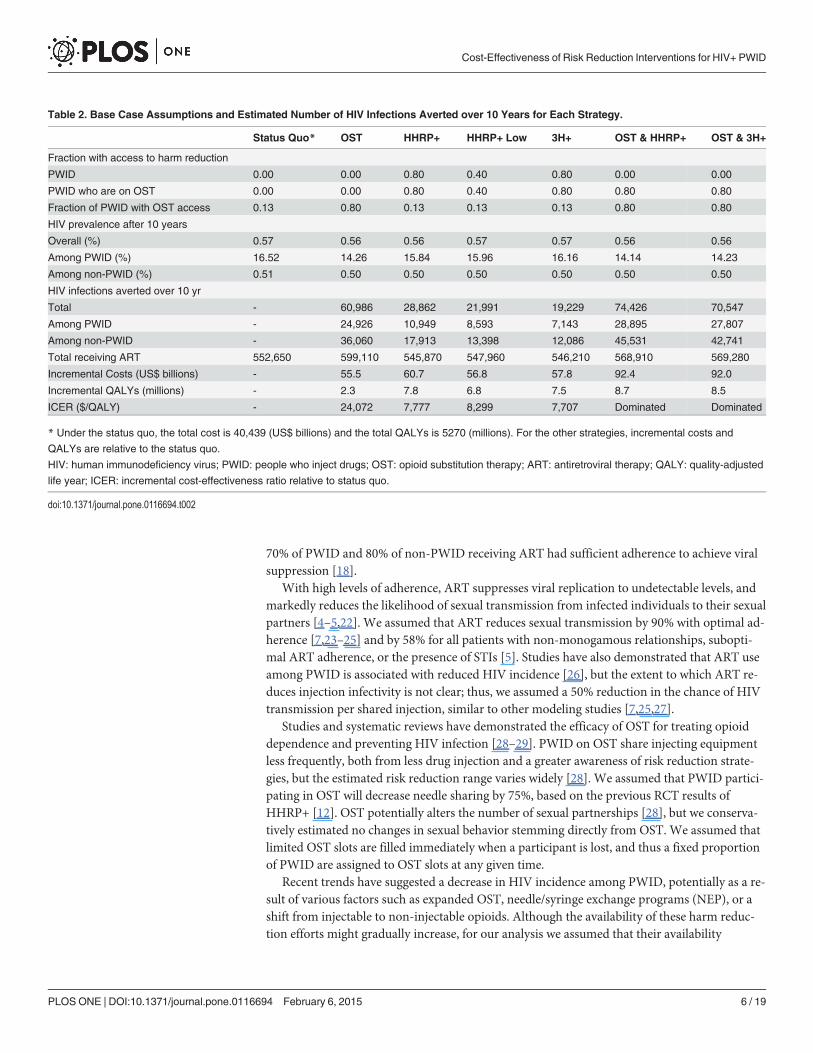
Table 2. Base Case Assumptions and Estimated Number of HIV Infections Averted over 10 Years for Each Strategy.
Status Quo* OST HHRP+ HHRP+ Low 3H+ OST & HHRP+ OST & 3H+
Fraction with access to harm reduction
PWID 0.00 0.00 0.80 0.40 0.80 0.00 0.00
PWID who are on OST 0.00 0.00 0.80 0.40 0.80 0.80 0.80
Fraction of PWID with OST access 0.13 0.80 0.13 0.13 0.13 0.80 0.80
HIV prevalence after 10 years
Overall (%) 0.57 0.56 0.56 0.57 0.57 0.56 0.56
Among PWID (%) 16.52 14.26 15.84 15.96 16.16 14.14 14.23
Among non-PWID (%) 0.51 0.50 0.50 0.50 0.50 0.50 0.50
HIV infections averted over 10 yr
Total - 60,986 28,862 21,991 19,229 74,426 70,547
Among PWID - 24,926 10,949 8,593 7,143 28,895 27,807
Among non-PWID - 36,060 17,913 13,398 12,086 45,531 42,741
Total receiving ART 552,650 599,110 545,870 547,960 546,210 568,910 569,280
Incremental Costs (US$ billions) - 55.5 60.7 56.8 57.8 92.4 92.0
Incremental QALYs (millions) - 2.3 7.8 6.8 7.5 8.7 8.5
ICER ($/QALY) - 24,072 7,777 8,299 7,707 Dominated Dominated
* Under the status quo, the total cost is 40,439 (US$ billions) and the total QALYs is 5270 (millions). For the other strategies, incremental costs andQALYs are relative to the status quo.HIV: human immunodeficiency virus; PWID: people who inject drugs; OST: opioid substitution therapy; ART: antiretroviral therapy; QALY: quality-adjustedlife year; ICER: incremental cost-effectiveness ratio relative to status quo.
doi:10.1371/journal.pone.0116694.t002
Cost-Effectiveness of Risk Reduction Interventions for HIV+ PWID
PLOSONE | DOI:10.1371/journal.pone.0116694 February 6, 2015 6 / 19
remained constant. For comparison, our "OST" strategy qualitatively reflects a scale-up of suchharm reduction efforts.
Behavioral InterventionsHHRP+ involves 12 two-hour weekly manual-guided group sessions with comprehensive HIVrisk reduction content that addresses the medical, emotional, and spiritual needs of drug-in-volved PLHIV [12]. HHRP+ participants significantly reduce self-reported and objective sexu-al- and drug-related behaviors and increase ART adherence compared to an enhancedMethadone Maintenance Program (MMP) alone [12–13]. These intervention benefits are re-flected in our model by varying the number of risky injections and condom use (Table 1).
The 3H+ participants receive standard MMP and four 45-minute abbreviated sessionsadapted from HHRP+. A pilot study of 3H+ demonstrated reduced drug- and sex-related HIVrisk behaviors, and improved self-reported medical adherence skills [15]. We therefore as-sumed that 3H+ will have similar effects as HHRP+, but to an equal or lesser degree [15]. Forthe base-case analysis, we assumed that 3H+ effectiveness falls between no treatment andHHRP+ as specified in Table 1, but we varied this assumption in sensitivity analysis. (Table 1,S3 Table, S4 Table)
PopulationOur dynamic model divides the population into 22 compartments to account for variations inbehaviors and disease status. The population is segmented by risk group: PWID, PWID onOST, and non-PWID. Each group is further stratified by their HIV infection status (uninfected,asymptomatic HIV, symptomatic HIV, or AIDS) and ART treatment status for those who areeligible (on ART, or not on ART). A schematic diagram and additional details are provided inS1 Fig.
We considered the adult population in the US in 2010 aged 15 to 64 years, which accountsfor 96% of new HIV infections [1,31]. Approximately 0.5% of adults were PWID or PWID/MSM [1,30–32]. Initial HIV prevalence was estimated to be 15% among PWID [33–35] and0.5% among non-PWID [1,31,36].
All individuals enter an uninfected state as either a PWID, PWID on OST, or non-PWIDbased on the national distribution of PWID. Individuals may exit from any compartment dueto maturation when they reach 64 years, non-AIDS-related death, or AIDS-related death. Thenon-AIDS-related death rate is higher for PWID, due to excess mortality associated with opi-oid use [37–38], and OST was assumed to decrease the death rate by 50% [25,27]. The parame-ters used for analysis were determined from published sources (Table 1, S1 Table).
Disease Transmission and ProgressionIn our model, HIV transmission occurs via shared injections between PWID, or via sexual con-tact between an uninfected and an infected individual. The overall transmission rate via nee-dle-sharing was based on (1) the transmission probability per shared injection, (2) thelikelihood of selecting an HIV-infected needle-sharing partner, and (3) the needle-sharing fre-quency among PWID, estimated from North American studies on injection behavior [39–42].
Similarly, the HIV transmission rate via sexual contact depended on the number of sexualpartnerships between uninfected and infected individuals, as well as the chance of transmissionper partnership. We allowed for preferential mixing between PWID and non-PWID, sincePWID are more likely to select a PWID as a partner [43–44].
Once infected, the disease status of a patient can progress from asymptomatic to symptom-atic HIV to AIDS. Without ART, the disease progression rates were estimated by natural-
Cost-Effectiveness of Risk Reduction Interventions for HIV+ PWID
PLOSONE | DOI:10.1371/journal.pone.0116694 February 6, 2015 7 / 19
history data [24,45]. We assumed that the rate of disease progression is the same for PWID,PWID on OST, and non-PWID, and that ART slows disease progression from symptomaticHIV to AIDS by 80% [23,46–49].
Model ValidationWe validated our model externally using available U.S. demographic and epidemiological datafrom 2007 to 2010, adjusting only for initial adult populations, and lower levels of treatmentaccess; the model closely approximated the total adult population, HIV prevalence, total HIVincidence, and HIV incidence among PWID (S2 Fig.).
Health Outcomes and CostsPopulation-level health benefits over 10 years, measured in quality-adjusted life years(QALYs), were calculated by summing the time spent in each health state and adjusting by aquality-of-life factor with lower values associated with more severe HIV status. Patients onART had increased quality than those not receiving any treatment (Table 1). We also includedfuture (discounted) QALYs accrued for all individuals alive at the end of the time horizon to in-clude QALYs accrued at the end of the program up to death assuming individual remained inthe same status.
Total costs included the direct costs of each intervention over the time horizon, as well ascurrent and future healthcare costs throughout lifetime for the entire population. All costs andQALYs were discounted to the present time at 3% annually, following recommendations fromthe World Health Organization (WHO) guide to cost-effectiveness analyses [50]. Followingstandard cost-effectiveness analyses for health-related interventions, we considered all healthcare costs, including costs of HIV care and other health care, as well as the cost of methadonemaintenance. The costs for providing the assessed interventions include labor, consumablessuch as medical supplies and medications. We did not take into account the capital costs suchas building space and overhead costs, since the intervention is relatively short and does not re-quire purchasing new medical devices or building a special facility. The annual cost for brandedART was estimated as $15,300 [51] and the costs of OST and HHRP+ were estimated from theavailable literature [13,52]. The 3H+, OST/HHRP+, and OST/3H+ strategies were assumed tohave the same baseline costs (e.g., urine screens, medical care, case management, etc.) and in-formation on unit cost for each component is provided elsewhere [13]. Each strategy was as-sumed to have different costs for the group sessions, however, due to differential timerequirements. A detailed breakdown of costs is summarized in S2 Table. All costs were adjustedto 2012 US dollars according to the Medical Care component of the Consumer Price Index[19].
Finally, we computed the incremental cost-effectiveness ratio (ICER) of each strategy rela-tive to the status quo, so that the cost-effectiveness of each program could be compared.
ResultsHIV Infections PreventedUnder the status quo, we projected that 512,514 new infections (66,284 among PWID and446,230 among non-PWID) would occur over 10 years (Fig. 1). With 80% HHRP+ coverage,28,862 infections were averted, including 17,913 among non-PWID. Although the interven-tions targeted PWID only, this substantial benefit accrued to the general population because ofreductions in risky sexual behavior by PWID, and due to reduced secondary transmission (i.e.,preventing one PWID from acquiring HIV also eliminates the risk of infection to his/her future
Cost-Effectiveness of Risk Reduction Interventions for HIV+ PWID
PLOSONE | DOI:10.1371/journal.pone.0116694 February 6, 2015 8 / 19
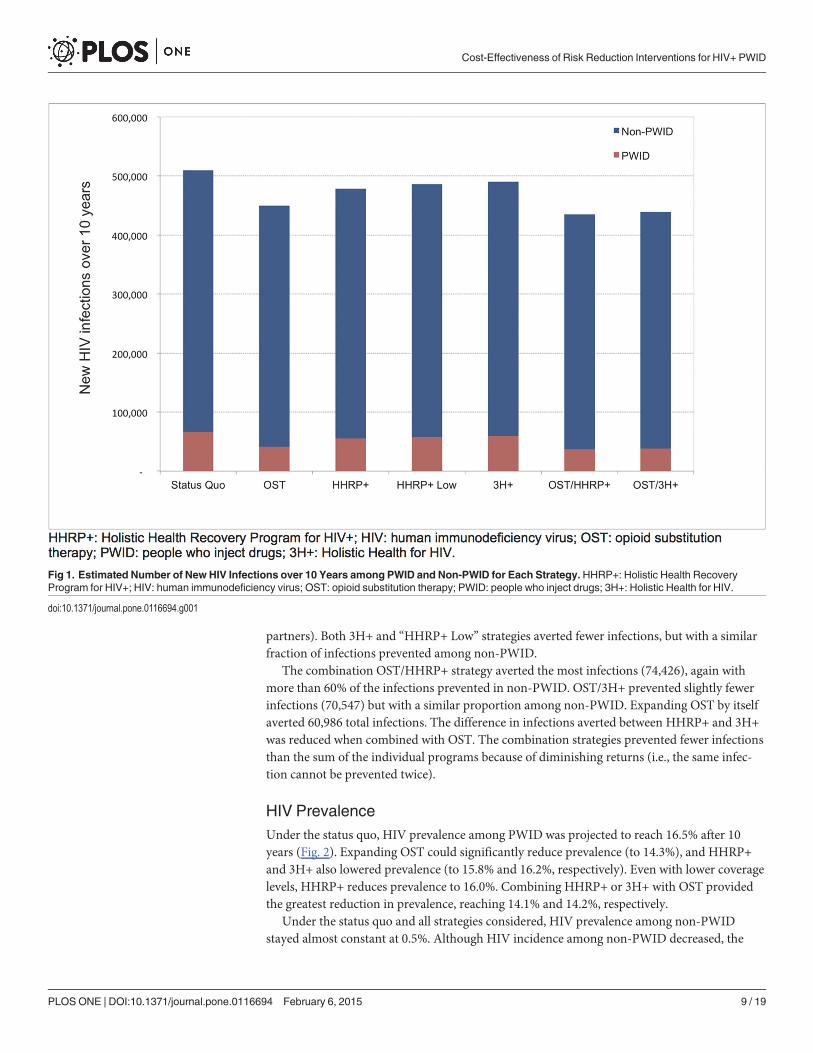
partners). Both 3H+ and “HHRP+ Low” strategies averted fewer infections, but with a similarfraction of infections prevented among non-PWID.
The combination OST/HHRP+ strategy averted the most infections (74,426), again withmore than 60% of the infections prevented in non-PWID. OST/3H+ prevented slightly fewerinfections (70,547) but with a similar proportion among non-PWID. Expanding OST by itselfaverted 60,986 total infections. The difference in infections averted between HHRP+ and 3H+was reduced when combined with OST. The combination strategies prevented fewer infectionsthan the sum of the individual programs because of diminishing returns (i.e., the same infec-tion cannot be prevented twice).
HIV PrevalenceUnder the status quo, HIV prevalence among PWID was projected to reach 16.5% after 10years (Fig. 2). Expanding OST could significantly reduce prevalence (to 14.3%), and HHRP+and 3H+ also lowered prevalence (to 15.8% and 16.2%, respectively). Even with lower coveragelevels, HHRP+ reduces prevalence to 16.0%. Combining HHRP+ or 3H+ with OST providedthe greatest reduction in prevalence, reaching 14.1% and 14.2%, respectively.
Under the status quo and all strategies considered, HIV prevalence among non-PWIDstayed almost constant at 0.5%. Although HIV incidence among non-PWID decreased, the
Fig 1. Estimated Number of New HIV Infections over 10 Years among PWID and Non-PWID for Each Strategy.HHRP+: Holistic Health RecoveryProgram for HIV+; HIV: human immunodeficiency virus; OST: opioid substitution therapy; PWID: people who inject drugs; 3H+: Holistic Health for HIV.
doi:10.1371/journal.pone.0116694.g001
Cost-Effectiveness of Risk Reduction Interventions for HIV+ PWID
PLOSONE | DOI:10.1371/journal.pone.0116694 February 6, 2015 9 / 19
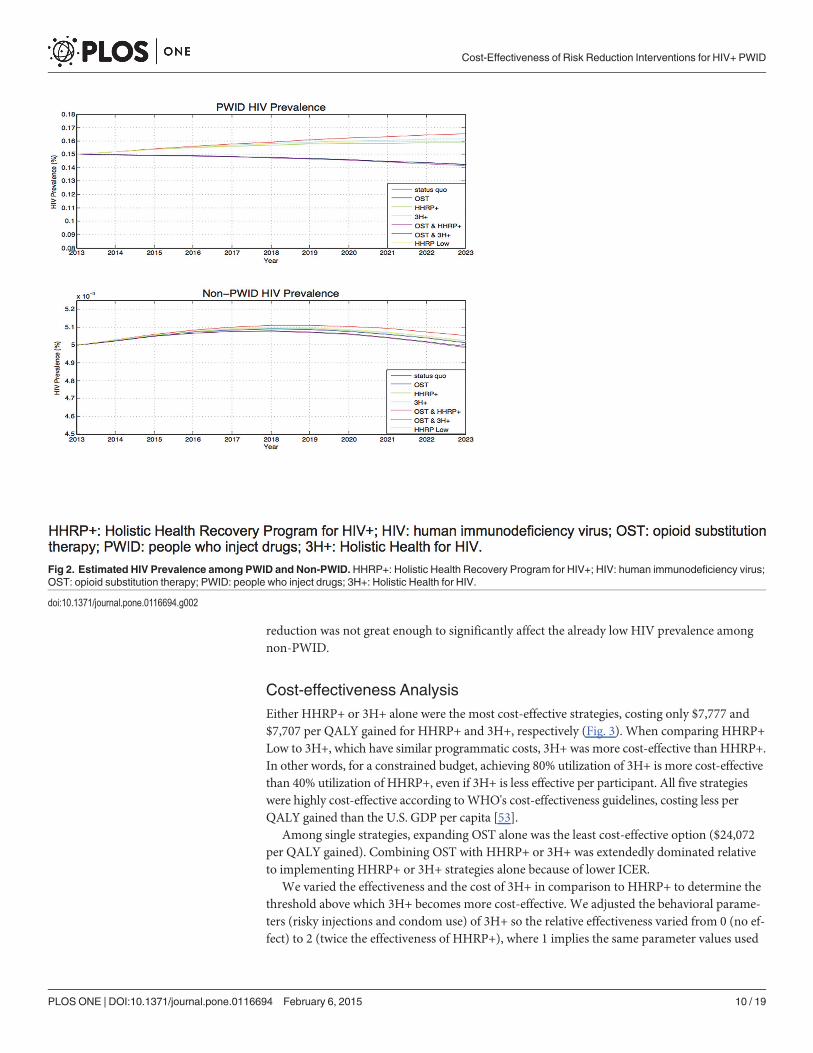
reduction was not great enough to significantly affect the already low HIV prevalence amongnon-PWID.
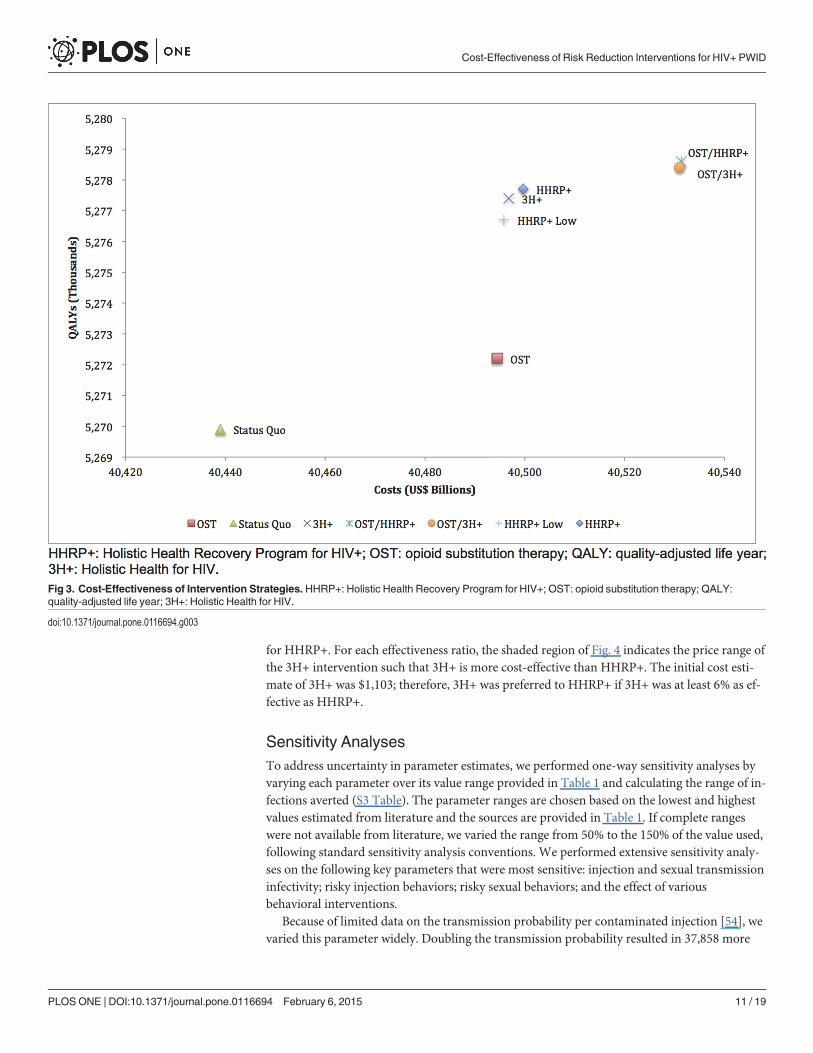
Cost-effectiveness AnalysisEither HHRP+ or 3H+ alone were the most cost-effective strategies, costing only $7,777 and$7,707 per QALY gained for HHRP+ and 3H+, respectively (Fig. 3). When comparing HHRP+Low to 3H+, which have similar programmatic costs, 3H+ was more cost-effective than HHRP+.In other words, for a constrained budget, achieving 80% utilization of 3H+ is more cost-effectivethan 40% utilization of HHRP+, even if 3H+ is less effective per participant. All five strategieswere highly cost-effective according toWHO's cost-effectiveness guidelines, costing less perQALY gained than the U.S. GDP per capita [53].
Among single strategies, expanding OST alone was the least cost-effective option ($24,072per QALY gained). Combining OST with HHRP+ or 3H+ was extendedly dominated relativeto implementing HHRP+ or 3H+ strategies alone because of lower ICER.
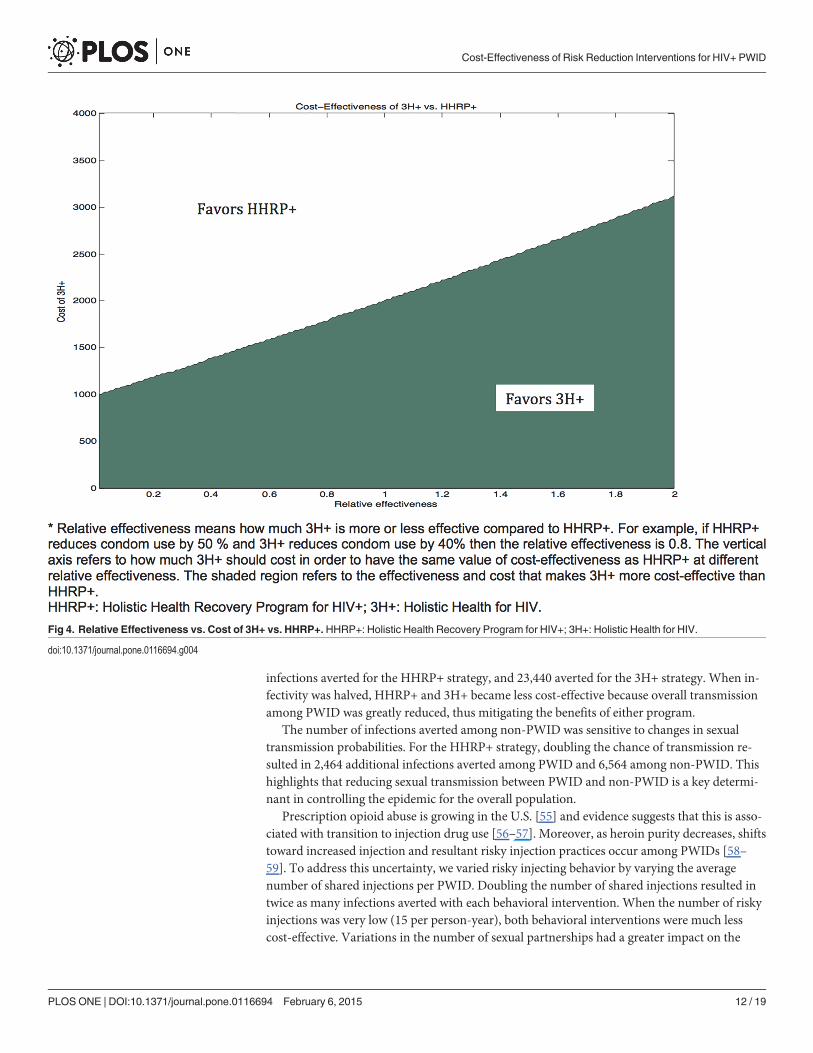
We varied the effectiveness and the cost of 3H+ in comparison to HHRP+ to determine thethreshold above which 3H+ becomes more cost-effective. We adjusted the behavioral parame-ters (risky injections and condom use) of 3H+ so the relative effectiveness varied from 0 (no ef-fect) to 2 (twice the effectiveness of HHRP+), where 1 implies the same parameter values used
Fig 2. Estimated HIV Prevalence among PWID and Non-PWID. HHRP+: Holistic Health Recovery Program for HIV+; HIV: human immunodeficiency virus;OST: opioid substitution therapy; PWID: people who inject drugs; 3H+: Holistic Health for HIV.
doi:10.1371/journal.pone.0116694.g002
Cost-Effectiveness of Risk Reduction Interventions for HIV+ PWID
PLOSONE | DOI:10.1371/journal.pone.0116694 February 6, 2015 10 / 19
for HHRP+. For each effectiveness ratio, the shaded region of Fig. 4 indicates the price range ofthe 3H+ intervention such that 3H+ is more cost-effective than HHRP+. The initial cost esti-mate of 3H+ was $1,103; therefore, 3H+ was preferred to HHRP+ if 3H+ was at least 6% as ef-fective as HHRP+.
Sensitivity AnalysesTo address uncertainty in parameter estimates, we performed one-way sensitivity analyses byvarying each parameter over its value range provided in Table 1 and calculating the range of in-fections averted (S3 Table). The parameter ranges are chosen based on the lowest and highestvalues estimated from literature and the sources are provided in Table 1. If complete rangeswere not available from literature, we varied the range from 50% to the 150% of the value used,following standard sensitivity analysis conventions. We performed extensive sensitivity analy-ses on the following key parameters that were most sensitive: injection and sexual transmissioninfectivity; risky injection behaviors; risky sexual behaviors; and the effect of variousbehavioral interventions.
Because of limited data on the transmission probability per contaminated injection [54], wevaried this parameter widely. Doubling the transmission probability resulted in 37,858 more
Fig 3. Cost-Effectiveness of Intervention Strategies. HHRP+: Holistic Health Recovery Program for HIV+; OST: opioid substitution therapy; QALY:quality-adjusted life year; 3H+: Holistic Health for HIV.
doi:10.1371/journal.pone.0116694.g003
Cost-Effectiveness of Risk Reduction Interventions for HIV+ PWID
PLOSONE | DOI:10.1371/journal.pone.0116694 February 6, 2015 11 / 19
infections averted for the HHRP+ strategy, and 23,440 averted for the 3H+ strategy. When in-fectivity was halved, HHRP+ and 3H+ became less cost-effective because overall transmissionamong PWID was greatly reduced, thus mitigating the benefits of either program.
The number of infections averted among non-PWID was sensitive to changes in sexualtransmission probabilities. For the HHRP+ strategy, doubling the chance of transmission re-sulted in 2,464 additional infections averted among PWID and 6,564 among non-PWID. Thishighlights that reducing sexual transmission between PWID and non-PWID is a key determi-nant in controlling the epidemic for the overall population.
Prescription opioid abuse is growing in the U.S. [55] and evidence suggests that this is asso-ciated with transition to injection drug use [56–57]. Moreover, as heroin purity decreases, shiftstoward increased injection and resultant risky injection practices occur among PWIDs [58–59]. To address this uncertainty, we varied risky injecting behavior by varying the averagenumber of shared injections per PWID. Doubling the number of shared injections resulted intwice as many infections averted with each behavioral intervention. When the number of riskyinjections was very low (15 per person-year), both behavioral interventions were much lesscost-effective. Variations in the number of sexual partnerships had a greater impact on the
Fig 4. Relative Effectiveness vs. Cost of 3H+ vs. HHRP+. HHRP+: Holistic Health Recovery Program for HIV+; 3H+: Holistic Health for HIV.
doi:10.1371/journal.pone.0116694.g004
Cost-Effectiveness of Risk Reduction Interventions for HIV+ PWID
PLOSONE | DOI:10.1371/journal.pone.0116694 February 6, 2015 12 / 19
number of infections averted among non-PWID than among PWID, because sexual contactcauses the majority of new infections in non-PWID. Variations in condom use and ART effec-tiveness at reducing injection and sexual infectivity did not change the relative ranking ofeach intervention.
In general, HHRP+ and 3H+ were more cost-effective than OST in all sensitivity analyses,and 3H+ was always more cost-effective than HHRP+. Finally, we varied the cost of OST to seeif a lower cost would make the intervention more cost-effective than behavioral interventions.Even when we considered a $1,500 annual cost of OST, lower than the cost of HHRP+($2,003), OST was still the least cost-effective among all the individual strategies.
DiscussionOur study used a tailored HIV epidemic model to examine the potential population-widehealth gains and costs of HIV prevention through behavioral interventions (HHRP+ vs. 3H+)for HIV-infected PWID. Although prior studies found that psychological and behavioral inter-ventions for reducing injection and sexual risk behavior are effective at preventing HIV inPWID [12,14,60–61], our study is the first to evaluate the broader epidemic impact and cost-ef-fectiveness of a targeted behavioral intervention for HIV-infected PWID in the U.S.
We compared six different intervention strategies and found that both HHRP+ and 3H+were effective at averting HIV infections and lowering HIV prevalence among PWIDs. Nota-bly, these interventions were also very effective at averting infections among the general popu-lation, reducing projected HIV incidence among non-PWID by 10%. Thus, an effectivebehavioral intervention that broadly reaches HIV+ PWID could substantially bend the epi-demic curve downward. Combining HHRP+ or 3H+ with OST averted more infections thanexpanding OST alone. These results support other findings that combination prevention pro-grams are most effective [62]. We showed that HIV prevalence among PWID is expected tosteadily increase without further interventions, but OST/HHRP+ or OST/3H+ would reversethis trend if widely implemented.
Our findings underscore how behavioral interventions for HIV-infected PWID can be botheffective and cost-effective. Alone, these interventions prevented fewer infections than whencombined with OST, yet both were more cost-effective. This is because the same degree of de-crease in transmission risk behavior that can be accomplished via OST can be achieved with be-havioral interventions at a lower cost. Furthermore, given a fixed budget, 3H+ is more cost-effective than HHRP+, across a range of parameter assumptions. The threshold for which 3H+became more cost-effective than HHRP+ was very low: even if we assumed 3H+ is only half aseffective as HHRP+ in preventing HIV transmission, it would remain the preferred approachas long as its price remained less than 75% that of HHRP+. Overall, investing in any of the fivestrategies could be highly economically efficient. The WHO cost-effectiveness guidelines definehighly cost-effective interventions as ones that that cost less than the per capita gross domesticproduct (GDP) per QALY gained [53]. The U.S. GDP per capita was $53,143 in 2013 [78] andtherefore, expansion of OST, behavioral interventions or combination of both are highly cost-effective and justify the comparative effectiveness study that is now underway.
Our results also demonstrate that even with 80% coverage among PWID, neither behavioralinterventions nor OST alone significantly impact overall U.S. HIV prevalence, likely due to in-creased life expectancy for individuals on ART, and the relatively low HIV prevalence amongthe general population. In order to eliminate the U.S. HIV epidemic, reducing risk behaviorsfrom other risk groups (e.g., MSM and high-risk heterosexuals) concurrently with PWID iscrucial. Our assumptions are more conservative than other modeling studies that examinedhigher HIV prevalence settings and found more dramatic reductions from expanding OST
Cost-Effectiveness of Risk Reduction Interventions for HIV+ PWID
PLOSONE | DOI:10.1371/journal.pone.0116694 February 6, 2015 13 / 19

[25,27,63]; however, these studies assumed lower ART access, and our study projected asmaller impact of OST on HIV prevalence due to higher ART use.
Our study has limitations that must be noted. First, the behavioral parameters were estimat-ed from available RCTs, with some outcomes measuring patients' knowledge and motivation,which may not always translate into actual behavior change, although there is a documentedcorrelation between these variables [64–65]. Sensitivity analyses examined this variation. Find-ings from the completed RCT comparing 3H+ with HHRP+ will refine these assumptions. Sec-ond, we assumed constant behavior and cost throughout the time horizon, assuming that theinterventions’ effect is durable throughout the course of the patients' lifetime. Long-term out-comes from the RCT would refine our assumptions. The cost of ART, OST and the harm re-duction programs might also decrease with the anticipated approval of generic drugs. Thoughwe found through sensitivity analysis that varying the cost of OST did not change the resultssignificantly, better estimates of HIV-related intervention costs would be helpful. Third, NEPcoverage was not modeled, but in the absence of federal funding, it is not likely to change ap-preciably in the near future. Last, we did not take into account the productivity gains and lossesdue to interventions in the CEA, following the recommendation fromWHO guide to cost-ef-fectiveness analyses [50]. We conservatively assumed that the productivity loss of PWID due toany intervention is not significant, given the intermittent and short duration of interventions.Although productivity gains may arise from improved health as an outcome of the interven-tion, we did not include such gains in our analysis, since estimation of the amount is out of thescope of this analysis, and underestimates the maximal benefit afforded by either intervention.Consequently, inclusion of potential productivity gains in the analysis would likely shift theICER of the interventions to be even more favorable compared to the status quo.
For generalizability, we used the average data representative of the U.S., and our sensitivityanalyses indicate that the general pattern of our findings remained the same under variation ofthe HIV prevalence among PWIDs. It is important to note, however, that the epidemiology ofHIV and AIDS in the United States is not evenly distributed across regions. We also expectthat there would be some variation in costs of the program by location, and the benefits of thetreatment may also vary depending on the characteristics of the PWID receiving the various in-terventions. Thus, generalization of our results to any specific regions or settings should bemade with caution after assessing the local drug use context.
In conclusion, these findings suggest that behavioral intervention programs targeting HIV-infected PWID (HHRP+ or 3H+) are both effective and cost-effective at reducing HIV inci-dence among both PWID and the general adult US population. It is a commonly addressedconcern that feasibility of implementing behavioral interventions among PWID is challenging,as these are a marginalized and stigmatized group who are challenging to engage, least able toaccess and arguably less likely to utilize HIV prevention, care, and treatment services in the ab-sence of supportive services. Consequently, this supports the need for developing and tailoringHIV prevention programs to effectively target, reach, and address the particular needs ofPWID. If 3H+ is confirmed to show comparable effectiveness to HHRP+ based on the ongoingRCT, our study supports the potential population-wide benefits of 3H+ as a more cost-effectivealternative to HHRP+ and OST.
Supporting InformationS1 Fig. Simplified Schematic Diagram of Dynamic Compartmental Model. PWID: peoplewho inject drugs; HIV: human immunodeficiency virus; AIDS: acquired immune deficiencysyndrome; ART: antiretroviral therapy; OST: opioid substitution therapy; HHRP+: Holistic
Cost-Effectiveness of Risk Reduction Interventions for HIV+ PWID
PLOSONE | DOI:10.1371/journal.pone.0116694 February 6, 2015 14 / 19
Health Recovery Program for HIV+; 3H+: Holistic Health for HIV.(TIFF)
S2 Fig. Results fromModel Calibration. PWID: people who inject drugs; HIV: human immu-nodeficiency virus; AIDS: acquired immune deficiency syndrome.(TIFF)
S1 Table. Summary of Notations.HIV: human immunodeficiency virus; AIDS: acquired im-mune deficiency syndrome; ART: antiretroviral therapy; OST: opioid substitution therapy;HHRP+: Holistic Health Recovery Program for HIV+; 3H+: Holistic Health for HIV.(TIFF)
S2 Table. Utilization and Cost of Services per Person. OST: opioid substitution therapy;HHRP+: Holistic Health Recovery Program for HIV+; 3H+: Holistic Health for HIV.(TIFF)
S3 Table. Changes in Infections Averted of the "HHRP" Strategy Compared to the StatusQuo for Each Parameter. PWID: people who inject drugs; HIV: human immunodeficiencyvirus; AIDS: acquired immune deficiency syndrome; ART: antiretroviral therapy; OST: opioidsubstitution therapy; HHRP+: Holistic Health Recovery Program for HIV+; 3H+: HolisticHealth for HIV.(TIFF)
S4 Table. Results of Sensitivity Analysis on Key Parameters. PWID: people who inject drugs;HIV: human immunodeficiency virus; AIDS: acquired immune deficiency syndrome; ART: an-tiretroviral therapy; OST: opioid substitution therapy; HHRP+: Holistic Health Recovery Pro-gram for HIV+; 3H+: Holistic Health for HIV.(TIFF)
S1 Appendix. Technical Appendix.(TIFF)
Author ContributionsConceived and designed the experiments: DLS EFL. Performed the experiments: DLS EFL. An-alyzed the data: DLS EFL FLAMMC. Wrote the paper: DLS.
References1. Centers for Disease Control and Prevention (CDC) (2012) Estimated HIV incidence in the United
States, 2007–2010. Available: http://www.cdc.gov/hiv/pdf/statistics_hssr_vol_17_no_4.pdf. Accessed7 October 2013.
2. Centers for Disease Control and Prevention (CDC) (2009) HIV infection among injection-drug users—34 states, 2004–2007. MMWRMorb Mortal Wkly Rep 58: 1291–1295. PMID: 19940834
3. Rachlis B, Brouwer KC, Mills EJ, Hayes M, Kerr T, et al. (2007) Migration and transmission of blood-borne infections among injection drug users: understanding the epidemiologic bridge. Drug Alcohol De-pend 90: 107–119. doi:10.1016/j.drugalcdep.2007.03.014 PMID: 17485179
4. Cohen MS, Chen YQ, McCauley M, Gamble T, Hosseinipour MC, et al. (2011) Prevention of HIV-1 in-fection with early antiretroviral therapy. N Engl J Med 365: 493–505. doi:10.1056/NEJMoa1105243PMID: 21767103
5. Anglemyer A, Rutherford GW, Egger M, Siegfried N (2011) Antiretroviral therapy for prevention of HIVtransmission in HIV-discordant couples. Cochrane Database Syst Rev. doi:10.1002/14651858.CD009153.
6. Blower SM, Gershengorn HB, Grant RM (2000) A tale of two futures: HIV and antiretroviral therapy inSan Francisco. Science 287: 650–654. doi:10.1126/science.287.5453.650 PMID: 10649998
Cost-Effectiveness of Risk Reduction Interventions for HIV+ PWID
PLOSONE | DOI:10.1371/journal.pone.0116694 February 6, 2015 15 / 19

7. Long EF, Brandeau ML, Galvin CM, Vinichenko T, Tole SP, et al. (2006) Effectiveness and cost-effec-tiveness of strategies to expand antiretroviral therapy in St. Petersburg, Russia. AIDS 20: 2207–2215.doi:10.1097/QAD.0b013e328010c7d0 PMID: 17086061
8. Granich RM, Gilks CF, Dye C, De Cock KM,Williams BG (2009) Universal voluntary HIV testing withimmediate antiretroviral therapy as a strategy for elimination of HIV transmission: a mathematicalmodel. The Lancet 373: 48–57.
9. Centers for Disease Control and Prevention (CDC) (2009) Effect of antiretroviral therapy on risk of sex-ual transmission of HIV infection and superinfection. Available: http://www.cdc.gov/hiv/prevention/research/art/. Accessed 7 October 2013.
10. Vlahov D, Robertson AM, Strathdee SA (2010) Prevention of HIV infection among injection drug usersin resource-limited settings. Clinical Infectious Diseases 50: S114–S121. doi:10.1086/651482 PMID:20397939
11. Effective Interventions (2012) High Impact HIV/AIDS Prevention Project (HIP) is CDC's approach to re-ducing HIV infections in the United States. Available: http://www.effectiveinterventions.org/en/HighImpactPrevention/Interventions.aspx. Accessed 7 October 2013.
12. Margolin A, Avants SK, Warburton LA, Hawkins KA, Shi J (2003) A randomized clinical trial of a manu-al-guided risk reduction intervention for HIV-positive injection drug users. Health Psychol 22: 223–228.PMID: 12683743
13. Avants SK, Margolin A, Usubiaga MH, Doebrick C (2004) Targeting HIV-related outcomes with intrave-nous drug users maintained on methadone: a randomized clinical trial of a harm reduction group thera-py. Journal of Substance Abuse Treatment 26: 67–78. doi:10.1016/S0740-5472(03)00159-4 PMID:15050083
14. Meader N, Li R, Jarlais Des DC, Pilling S (2010) Psychosocial interventions for reducing injection andsexual risk behaviour for preventing HIV in drug users. Cochrane Database Syst Rev. doi:10.1002/14651858.CD007192.pub2.
15. Copenhaver MM, Lee I-C, Margolin A, Bruce RD, Altice FL (2011) Testing an optimized community-based Human Immunodeficiency Virus (HIV) risk reduction and antiretroviral adherence interventionfor HIV-infected injection drug users. Substance Abuse 32: 16–26. doi:10.1080/08897077.2011.540466 PMID: 21302180
16. Mathers BM, Degenhardt L, Ali H, Wiessing LG, Hickman M, et al. (2010) HIV prevention, treatment,and care services for people who inject drugs: a systematic review of global, regional, and national cov-erage. Lancet 375: 1014–1028. doi:10.1016/S0140-6736(10)60232-2 PMID: 20189638
17. Centers for Disease Control and Prevention (CDC) (2012) HIV in the United States: the stages of care.CDC Fact Sheet. Available: http://www.cdc.gov/hiv/pdf/research_mmp_stagesofcare.pdf. Accessed 7October 2013.
18. Gardner EM, McLees MP, Steiner JF, del Rio C, BurmanWJ (2011) The spectrum of engagement inHIV care and its relevance to test-and-treat strategies for prevention of HIV infection. Clinical InfectiousDiseases 52: 793–800. doi:10.1093/cid/ciq243 PMID: 21367734
19. U.S. Bureau of Labor Statistics (24 July 2014) Consumer Price Index—All Urban Consumers. Avail-able: http://data.bls.gov/timeseries/CUUR0000SAM?output_view = pct_12mths. Accessed 7 October2013.
20. Panel on Antiretroviral Guidelines for Adults and Adolescents (12 February 2013) Guidelines for theuse of antiretroviral agents in HIV-1-infected adults and adolescents. Available: http://aidsinfo.nih.gov/ContentFiles/AdultandAdolescentGL.pdf. Accessed 7 October 2013.
21. Thompson MA, Aberg JA, Hoy JF, Telenti A, Benson C, et al. (2012) Antiretroviral treatment of adultHIV infection: 2012 recommendations of the International Antiviral Society–USA panel. JAMA 308:387–402. doi:10.1001/jama.2012.7961 PMID: 22820792
22. Quinn TC, Wawer MJ, Sewankambo N, Serwadda D, Li CJ, et al. (2000) Viral load and heterosexualtransmission of human immunodeficiency virus type 1. N Engl J Med 342: 921–929. doi:10.1056/NEJM200003303421303 PMID: 10738050
23. Castilla J, Del Romero J, Hernando V, Marincovich B, García S, et al. (2005) Effectiveness of highly ac-tive antiretroviral therapy in reducing heterosexual transmission of HIV. JAIDS Journal of Acquired Im-mune Deficiency Syndromes 40: 96–101. doi: 10.1186/1472-6963-7-164 PMID: 16123689
24. Sanders GD, Bayoumi AM, Sundaram V, Bilir SP, Neukermans CP, et al. (2005) Cost-effectiveness ofscreening for HIV in the era of highly active antiretroviral therapy. N Engl J Med 352: 570–585. doi:10.1056/NEJMsa042657 PMID: 15703422
25. Alistar SS, Owens DK, Brandeau ML (2011) Effectiveness and cost effectiveness of expanding harmreduction and antiretroviral therapy in a mixed HIV epidemic: a modeling analysis for Ukraine. PLoSMed 8: e1000423. doi:10.1371/journal.pmed.1000423.t006 PMID: 21390264
Cost-Effectiveness of Risk Reduction Interventions for HIV+ PWID
PLOSONE | DOI:10.1371/journal.pone.0116694 February 6, 2015 16 / 19
26. Wood E, Milloy MJ, Montaner JSG (2012) HIV treatment as prevention among injection drug users.Current Opinion in HIV and AIDS 7: 151–156. doi:10.1097/COH.0b013e32834f9927 PMID: 22227587
27. Zaric GS, Barnett PG, Brandeau ML (2000) HIV transmission and the cost-effectiveness of methadonemaintenance. Am J Public Health 90: 1100–1111. PMID: 10897189
28. Gowing L, Farrell MF, Bornemann R, Sullivan LE, Ali R (2011) Oral substitution treatment of injectingopioid users for prevention of HIV infection. Cochrane Database Syst Rev. doi:10.1002/14651858.CD004145.
29. MacArthur GJ, Minozzi S, Martin N, Vickerman P, Deren S, et al. (2012) Opiate substitution treatmentand HIV transmission in people who inject drugs: systematic review and meta-analysis. BMJ 345:e5945–e5945. doi:10.1136/bmj.e5945 PMID: 23038795
30. Armstrong GL (2007) Injection Drug Users in the United States, 1979–2002. Archives of internal medi-cine. 167:166–173. PMID: 17242318
31. Howden LM, Meyer JA (May 2011) Age and sex composition: 2010. U.S. Census Bureau. Available:http://www.census.gov/prod/cen2010/briefs/c2010br-03.pdf. Accessed 7 October 2013. doi: 10.1080/17437199.2011.587961 PMID: 25473706
32. Friedman SR (2004) Estimating numbers of injecting drug users in metropolitan areas for structuralanalyses of community vulnerability and for assessing relative degrees of service provision for injectingdrug users. J Urban Health 81: 377–400. doi:10.1093/jurban/jth125 PMID: 15273263
33. Mathers BM, Degenhardt L, Phillips B, Wiessing LG, Hickman M, et al. (2008) Global epidemiology ofinjecting drug use and HIV among people who inject drugs: a systematic review. Lancet 372: 1733–1745. doi:10.1016/S0140-6736(08)61311-2 PMID: 18817968
34. Hall HI, Song R, Rhodes P, Prejean J, An Q, et al. (2008) Estimation of HIV incidence in the UnitedStates. JAMA 300: 520–529. doi:10.1001/jama.300.5.520 PMID: 18677024
35. Strathdee SA, Stockman JK (2010) Epidemiology of HIV among injecting and non-injecting drug users:current trends and implications for interventions. Curr HIV/AIDS Rep 7: 99–106. doi:10.1007/s11904-010-0043-7 PMID: 20425564
36. Joint United Nations Programme on HIV/AIDS (UNAIDS) (2013) UNAIDS report on the global AIDS epi-demic 2013. Available: http://www.unaids.org/en/media/unaids/contentassets/documents/epidemiology/2013/gr2013/unaids_global_report_2013_en.pdf. Accessed 7 October 2013.
37. Degenhardt L (2006) Using cohort studies to estimate mortality among injecting drug users that is notattributable to AIDS. Sexually Transmitted Infections 82: iii56–iii63. doi:10.1136/sti.2005.019273PMID: 16735295
38. Mathers BM, Degenhardt L, Bucello C, Lemon J, Wiessing LG, et al. (2013) Mortality among peoplewho inject drugs: a systematic review and meta-analysis. Bull World Health Org 91: 102–123. doi: 10.2471/BLT.12.108282 PMID: 23554523
39. Spittal PM, Craib KJP, Wood E, Laliberté N, Li K, et al. (2002) Risk factors for elevated HIV incidencerates among female injection drug users in Vancouver. CMAJ 166: 894–899. PMID: 11949985
40. Dolan KA, Shearer J, MacDonald M, Mattick RP, Hall W, et al. (2003) A randomised controlled trial ofmethadone maintenance treatment versus wait list control in an Australian prison system. Drug AlcoholDepend 72: 59–65. PMID: 14563543
41. Kral AH, Lorvick J, Ciccarone D, Wenger L, Gee L, et al. (2005) HIV prevalence and risk behaviorsamong men who have sex with men and inject drugs in San Francisco. J Urban Health 82: i43–i50.doi:10.1093/jurban/jti023 PMID: 15738321
42. Harris ZK (2006) Efficient allocation of resources to prevent HIV infection among injection drug users:the Prevention Point Philadelphia (PPP) needle exchange program. Health Econ 15: 147–158. doi:10.1002/hec.1021 PMID: 16145716
43. Booth RE, Watters JK, Chitwood DD (1993) HIV risk-related sex behaviors among injection drug users,crack smokers, and injection drug users who smoke crack. Am J Public Health 83: 1144–1148. doi:10.2105/AJPH.83.8.1144 PMID: 8342724
44. Evans JL (2003) Gender differences in sexual and injection risk behavior among active young injectiondrug users in San Francisco (the UFO study). J Urban Health 80: 137–146. doi:10.1093/jurban/jtg137PMID: 12612103
45. Long EF, Brandeau ML, Owens DK (2010) The cost-effectiveness and population outcomes of expand-ed HIV screening and antiretroviral treatment in the United States. Ann Intern Med 153: 778–789. doi:10.7326/0003-4819-153-12-201012210-00004 PMID: 21173412
46. Grabar S, Le Moing V, Goujard C, Leport C, Kazatchkine MD, et al. (2000) Clinical outcome of patientswith HIV-1 infection according to immunologic and virologic response after 6 months of highly active an-tiretroviral therapy. Ann Intern Med 133: 401–410. PMID: 10975957
Cost-Effectiveness of Risk Reduction Interventions for HIV+ PWID
PLOSONE | DOI:10.1371/journal.pone.0116694 February 6, 2015 17 / 19
47. Egger M, May M, Chêne G, Phillips AN, Ledergerber B, et al. (2002) Prognosis of HIV-1-infected pa-tients starting highly active antiretroviral therapy: a collaborative analysis of prospective studies. Lancet360: 119–129. PMID: 12126821
48. Wood E, Hogg RS, Yip B, Harrigan PR, O'Shaughnessy MV, et al. (2003) Effect of medication adher-ence on survival of HIV-infected adults who start highly active antiretroviral therapy when the CD4+ cellcount is 0.200 to 0.350 x 10(9) cells/L. Ann Intern Med 139: 810–816. PMID: 14623618
49. Vlahov D, Galai N, Safaeian M, Galea S, Kirk GD, et al. (2005) Effectiveness of highly active antiretrovi-ral therapy among injection drug users with late-stage human immunodeficiency virus infection. Am JEpidemiol 161: 999–1012. doi:10.1093/aje/kwi133 PMID: 15901620
50. World Health Organization (2003) Making choices in health: WHO guide to cost-effectiveness analysis.Available: http://www.who.int/choice/publications/p_2003_generalised_cea.pdf. Accessed 7 October2013.
51. Walensky RP, Sax PE, Nakamura YM,Weinstein MC, Pei PP, et al. (2013) Economic savings versushealth losses: the cost-effectiveness of generic antiretroviral therapy in the United States. Ann InternMed 158: 84–92. doi:10.7326/0003-4819-158-2-201301150-00002 PMID: 23318310
52. Connock M, Juarez-Garcia A, Jowett S, Frew E, Liu Z, et al. (2007) Methadone and buprenorphine forthe management of opioid dependence: a systematic review and economic evaluation. Health TechnolAssess 11: 1–171–iii–iv. PMID: 17927921
53. World Health Organization (2014) Table: Threshold values for intervention cost-effectiveness by Re-gion. World Health Organization. Available: http://www.who.int/choice/costs/CER_levels/en/index.html. Accessed 7 November 2013. doi: 10.3928/01913913-20140923-03 PMID: 25608285
54. Baggaley RF, Boily M-C, White RG, Alary M (2006) Risk of HIV-1 transmission for parenteral exposureand blood transfusion: a systematic review and meta-analysis. AIDS 20: 805–812. doi:10.1097/01.aids.0000218543.46963.6d PMID: 16549963
55. Substance Abuse and Mental Health Services Administration (SAMHSA) (2012) Results from the 2011National Survey on Drug Use and Health: Summary of National Findings. Available: http://www.samhsa.gov/data/nsduh/2k11results/nsduhresults2011.htm
56. Substance Abuse and Mental Health Services Administration (SAMHSA) (2011) Results from the 2010National Survey on Drug Use and Health: Summary of National Findings. Available: http://www.samhsa.gov/data/nsduh/2k10nsduh/2k10results.htm
57. Lankenau SE, Teti M, Silva K, Bloom JJ, Harocopos A, et al. (2012) Initiation into prescription opioidmisuse amongst young injection drug users. International Journal of Drug Policy 23: 37–44. doi:10.1016/j.drugpo.2011.05.014 PMID: 21689917
58. Valdez A, Neaigus A, Kaplan C, Cepeda A (2011) High rates of transitions to injecting drug use amongMexican American non-injecting heroin users in San Antonio, Texas (never and former injectors). DrugAlcohol Depend 114: 233–236. doi:10.1016/j.drugalcdep.2010.09.014 PMID: 21075561
59. Neaigus A, Miller M, Friedman SR, Hagen DL, Sifaneck SJ, et al. (2001) Potential risk factors for thetransition to injecting among non-injecting heroin users: a comparison of former injectors and never in-jectors. Addiction 96: 847–860. doi:10.1080/09652140020050960 PMID: 11399216
60. Coyle SL, Needle RH, Normand J (1998) Outreach-based HIV prevention for injecting drug users: a re-view of published outcome data. Public Health Rep 113 Suppl 1: 19–30. PMID: 9722807
61. Latkin CA, Sherman S, Knowlton A (2003) HIV prevention among drug users: outcome of a network-ori-ented peer outreach intervention. Health Psychol 22: 332–339. PMID: 12940388
62. Strathdee SA, Shoptaw S, Dyer TP, Quan VM, Aramrattana A, et al. (2012) Towards combination HIVprevention for injection drug users: addressing addictophobia, apathy and inattention. Current Opinionin HIV and AIDS 7: 320–325. doi:10.1097/COH.0b013e32835369ad PMID: 22498479
63. Barnett PG, Zaric GS, Brandeau ML (2001) The cost-effectiveness of buprenorphine maintenance ther-apy for opiate addiction in the United States. Addiction 96: 1267–1278. doi:10.1080/09652140120070328 PMID: 11672491
64. Fisher JD, Fisher WA (1992) Changing AIDS-risk behavior. Psychol Bull 111: 455–474. PMID:1594721
65. Fisher JD, Fisher WA, Cornman DH, Amico RK, Bryan A, et al. (2006) Clinician-delivered interventionduring routine clinical care reduces unprotected sexual behavior among HIV-infected patients. JAIDSJournal of Acquired Immune Deficiency Syndromes 41: 44–52. PMID: 16340472
66. Martin JA, Hamilton BE, Ventura SJ, Osterman MJ, Wilson EC et al. (2012) Births: final data for 2010.Natl Vital Stat Rep. 61(1): 1–71. PMID: 24974589
67. Murphy SL, Xu J, Kochanek KD (2013) Deaths: final data for 2010. Natl Vital Stat Rep 61(4): 1–117.PMID: 24979972
68. Arias E (2012) United States life tables, 2008. Natl Vital Stat Rep 61(3): 1–63. PMID: 24974590
Cost-Effectiveness of Risk Reduction Interventions for HIV+ PWID
PLOSONE | DOI:10.1371/journal.pone.0116694 February 6, 2015 18 / 19

69. Centers for Disease Control and Prevention (CDC) (2013) HIV surveillance report, 2011. Available:http://www.cdc.gov/hiv/topics/surveillance/resources/reports/. Accessed 7 October 2013.
70. Binford MC, Kahana SY, Altice FL (2012) A systematic review of antiretroviral adherence interventionsfor HIV-infected people who use drugs. Curr HIV/AIDS Rep 9: 287–312. doi:10.1007/s11904-012-0134-8 PMID: 22936463
71. Tyndall MW, Patrick D, Spittal P, Li K, O'Shaughnessy MV, et al. (2002) Risky sexual behavioursamong injection drugs users with high HIV prevalence: implications for STD control. Sexually Transmit-ted Infections 78 Suppl 1: i170–i175. PMID: 12083439
72. Pinkerton SD, Abramson PR (1997) Effectiveness of condoms in preventing HIV transmission. Soc SciMed 44: 1303–1312. PMID: 9141163
73. Tengs TO, Lin TH (2002) A meta-analysis of utility estimates for HIV/AIDS. Medical Decision Making22: 475–481. doi:10.1177/0272989X02238300 PMID: 12458977
74. Holtgrave DR, Pinkerton SD (1997) Updates of cost of illness and quality of life estimates for use in eco-nomic evaluations of HIV prevention programs. J Acquir Immune Defic Syndr Hum Retrovirol 16: 54–62. PMID: 9377126
75. World Health Organization (2013) Global Health Observatory Data Repository. Available: http://apps.who.int/gho/data/node.main?lang = en. Accessed 7 October 2013.
76. Gebo KA, Fleishman JA, Conviser R, Hellinger J, Hellinger FJ, et al. (2010) Contemporary costs of HIVhealthcare in the HAART era. AIDS 24: 2705–2715. doi:10.1097/QAD.0b013e32833f3c14 PMID:20859193
77. Krentz HB, Gill MJ (2008) Cost of medical care for HIV-infected patients within a regional populationfrom 1997 to 2006. HIV Medicine 9: 721–730. doi:10.1111/j.1468-1293.2008.00613.x PMID:18643856
78. TheWorld Bank (2013) GDP per capita (current US$). Available: http://data.worldbank.org/indicator/NY.GDP.PCAP.CD?cid=DEC_SS_WBGDataEmail_EXT. Accessed 7 October 2013.
79. Schackman BR, Goldie SJ, Freedberg KA, Losina E, Brazier J, et al. (2002) Comparison of health stateutilities using community and patient preference weights derived from a survey of patients with HIV/AIDS. Medical Decision Making 22: 27–38. PMID: 11833663
Cost-Effectiveness of Risk Reduction Interventions for HIV+ PWID
PLOSONE | DOI:10.1371/journal.pone.0116694 February 6, 2015 19 / 19
Copyright © 2022 FDOKUMEN