Influence of an Expanded Framework of Shopping Motivations ...
403
Louisiana State University LSU Digital Commons LSU Historical Dissertations and eses Graduate School 1989 Influence of an Expanded Framework of Shopping Motivations and Inclusion of Non-Store Retailers on the Choice Set Formation Process. Jill Suzanne Aaway Louisiana State University and Agricultural & Mechanical College Follow this and additional works at: hps://digitalcommons.lsu.edu/gradschool_disstheses is Dissertation is brought to you for free and open access by the Graduate School at LSU Digital Commons. It has been accepted for inclusion in LSU Historical Dissertations and eses by an authorized administrator of LSU Digital Commons. For more information, please contact [email protected]. Recommended Citation Aaway, Jill Suzanne, "Influence of an Expanded Framework of Shopping Motivations and Inclusion of Non-Store Retailers on the Choice Set Formation Process." (1989). LSU Historical Dissertations and eses. 4758. hps://digitalcommons.lsu.edu/gradschool_disstheses/4758
-
Upload
khangminh22 -
Category
Documents
-
view
3 -
download
0
Transcript of Influence of an Expanded Framework of Shopping Motivations ...
Louisiana State UniversityLSU Digital Commons
LSU Historical Dissertations and Theses Graduate School
1989
Influence of an Expanded Framework of ShoppingMotivations and Inclusion of Non-Store Retailerson the Choice Set Formation Process.Jill Suzanne AttawayLouisiana State University and Agricultural & Mechanical College
Follow this and additional works at: https://digitalcommons.lsu.edu/gradschool_disstheses
This Dissertation is brought to you for free and open access by the Graduate School at LSU Digital Commons. It has been accepted for inclusion inLSU Historical Dissertations and Theses by an authorized administrator of LSU Digital Commons. For more information, please [email protected].
Recommended CitationAttaway, Jill Suzanne, "Influence of an Expanded Framework of Shopping Motivations and Inclusion of Non-Store Retailers on theChoice Set Formation Process." (1989). LSU Historical Dissertations and Theses. 4758.https://digitalcommons.lsu.edu/gradschool_disstheses/4758
INFORMATION TO USERS
The most advanced technology has been used to photograph and reproduce this manuscript from the microfilm master. UMI films the text directly from the original or copy submitted. Thus, some thesis and dissertation copies are in typewriter face, while others may be from any type of computer printer.
The quality of th is reproduction is dependent upon the quality of the copy submitted. Broken or indistinct print, colored or poor quality illustrations and photographs, print bleedthrough, substandard margins, and improper alignment can adversely affect reproduction.
In the unlikely event that the author did not send UMI a complete manuscript and there are missing pages, these will be noted. Also, if unauthorized copyright m aterial had to be removed, a note will indicate the deletion.
Oversize m aterials (e.g., maps, drawings, charts) are reproduced by sectioning the original, beginning a t the upper left-hand corner and continuing from left to right in equal sections with small overlaps. Each original is also photographed in one exposure and is included in reduced form at the back of the book. These are also available as one exposure on a standard 35mm slide or as a 17" x 23" black and w hite photographic p rin t for an additional charge.
Photographs included in the original m anuscript have been reproduced xerographically in th is copy. H igher quality 6" x 9" black and w hite photographic p rin ts are available for any photographs or illustrations appearing in this copy for an additional charge. Contact UMI directly to order.
University Microfilms International A Bell & Howell Information Company
300 North Zeeb Road, Ann Arbor, Ml 48106-1346 USA 313/761-4700 800/521-0600

Order N um ber 9017242
Influence of an expanded framework o f shopping m otivations and inclusion of non-store retailers on the choice set formation process
Attaway, Jill Suzanne, Ph.D.
The Louisiana State University and Agricultural and Mechanical Col., 1989
Copyright ©1990 by Attaway, Jill Suzanne. All rights reserved.
UMI300 N. Zeeb Rd.Ann Arbor, MI 48106

INFLUENCE OF AN EXPANDED FRAMEWORK OF SHOPPING MOTIVATIONS AND INCLUSION OF NON-STORE RETAILERS
ON THE CHOICE SET FORMATION PROCESS
A Dissertation
Submitted to the Graduate Faculty of the Louisiana State University and
Agricultural and Mechanical College in partial fulfillment of the
requirements for the degree of Doctor of Philosophy
in the
Interdepartmental Program in Business Administration
byJill Suzanne Attaway
B.B.A., Texas A&M University, 1982 M.S., Louisiana State University, 1985
August 1989

ACKNOWLEDGEMENTS
There are many individuals who have contributed to my personal and
professional development as well as this research project. First and
foremost, I would like to thank my parents, Al and Sally Attaway for
instilling in me a drive for success and the confidence that I could
accomplish anything. Throughout my life you have been my best advocates
and provided abiding support and confidence. I will always be thankful
that I have parents who are so loving and understanding.
I would also like to express my appreciation to my dissertation
chairman. Bill Black. Thank you so much for all of the time and effort
you expended in this research project. I know you worked many days and
nights making sure this research did not have any critical flaws. I
also savor the times you were so encouraging when I was floundering and
in need of help. I would like to thank your family as well for being so
compassionate and will always remember Deborah1s kind words and
sympathy. I am indeed very fortunate to have worked with you and look
forward to future collaborations.
This dissertation would not have been possible but for the
direction of the committee members. I would like to thank Scot Burton,
Joe Hair, Dan Sherrell and Dirk Steiner for your willingness to read
such a lengthy manuscript as well as your helpful comments. Your
insights and expertise truly improved the dissertation work and I am
indebted to you for your guidance.
I must also thank my fellow graduate students for providing much
comfort, support, and fun during my graduate school tenure and the
dissertation process. You have each uniquely contributed and helped me
more than you will ever know.
I would finally like to thank my partner and friend, Mitch
Griffin. I only wish that words could express how much your love and
support mean to me. Thank you for listening when I needed to talk, for
comforting me when times were rough, for sharing your hopes and dreams
with me, and for always loving me.
In conclusion, I would like to dedicate this work in memory of my
brother Jeff Attaway. His death allowed me to see how inconsequential
much of our existence is... for it is life and living that truly
matters.
TABLE OF CONTENTS
Page
Acknowledgements ....................................... ii
List of Tables......................................... x
List of Fi g u r e s ....................................... xv
Abstract................................................. xvii
Chapter
1. THE RESEARCH TOPIC......................... 1
Overview of the Topic....................... 1Introduction ............................. 1Impact on Patronage Research .............. 4Determinants of Patronage................ 5Measures of Patronage .................. 7
Models of the Patronage Process.............. 8S ummary ................................. 10
Proposed Patronage Model .................... 11Shopping Motivations and Patronage ........ 11Additional Determinants of Patronage . . . . 13
Involvement........................... 13Experience and Knowledge ................ 14Contextual Influences .................. 15Su m m a r y ............................... 17
Research Questions ......................... 19
The Dissertation Research.................... 19
Contributions of the Research................ 21
2. LITERATURE REVIEW........................... 25
Major Areas of Patronage Research.......... 27Determinant Attributes .................. 27Store L o y a l t y ......................... 30Socialization ......................... 32Shopping Orientation .................... 34Summary of Consumer PatronageResearch............................. 37
Omitted Constructs ..................... 39
iv
Chapter Page
Proposed Patronage Model ................... 41Motivations............................. 41Involvement............................. 41Product Experience and Knowledge ......... 45Contextual Influences ................... 45
Motivation Research ....................... 47Theories of Motivation .................. 49Instinct Theories...................... 49Drive and Reinforcement Theories . . . . 50Cognitive Theories .................... 50S u m m a r y ............................. 51
Motivation Taxonomies .................. 52Motivation and Marketing ................ 56Marketing Motives ...................... 57Neglected Motives ...................... 59Proposed Motivation Structure .......... 62Functional............................. 64Symbolic............................... 66Experiential ........................... 67
Attribute Importance ...................... 71
Involvement............................. 73Product Involvement...................... 74Shopping Process Involvement ............ 77Involvement Relationships .............. 79
Knowledge................................. 82
Contextual Influences...................... 84Situational Influences and Patronage . . . 85
Choice Set Formation...................... 86Evoked Set Conceptualizations............ 88Howard (1963, 1977) 88Narayana and Markin (1975) ............ 89Brisoux and Laroche (1980)......... . 90Su m m a r y ............................. 92
Choice Sets and Patronage................ 93
Choice Set Formation Process Model ........ 99Perspectives of Choice Set Formation . . . 100Relationship to Other Constructs ......... 101
Summary and Hypotheses ..................... 103
v

Chapter Page
3. METHODOLOGY.................................. 110
Design of the Study.......................... 110Data Collection Procedure.................. 110
Population, Sample Size, and SampleDesign.................................. IllPopulation.............................. IllSample S i z e ............................ 112Sample Design ........................ 112
The Survey Instrument .................... 116Shopping Motivations .................... 116Product Involvement .................... 119Shopping Process Involvement ............ 120Other Variables and Constructs............ 122
Experience............................ 122Knowledge............................ 122Attribute Importance ................ 123Choice Set Structure.................. 123Contextual Variables ................ 127Demographics ........................ 127
Data Analysis................................ 128Scale Development Process................ 128Reliability Assessment .................. 129Validity Assessment .................... 133Confirmatory Factor Anlaysis and
Structural Equation Modeling .......... 136Assessing Overall Model Fit .......... 136Internal Structure Model Fit ........... 139
Hypothesis Tests .......................... 141Individual Hypothesis Tests ............ 141Hypotheses HI to H4...................... 141Hypotheses H5 and H 6 .................... 144Hypothesis H 7 .......................... 144Hypotheses H8, H9, and H 1 0 ...............145Hypotheses Hll and H 1 2 ...................145Hypothesis H 1 3 .......................... 146Hypotheses H14 and H 1 5 ...................146Hypothesis H 1 6 .......................... 146Hypotheses H17 and H 1 8 ...................147Hypothesis H 1 9 .......................... 147Hypothesis H 2 0 .......................... 147Hypothesis H 2 1 .......................... 147
Structural Model Tests ............... 148Presentation of Results.................. 148
vi
Chapter Page
4. SAMPLE CHARACTERISTICS AND SCALE DEVELOPMENTRES U L T S ................................. 151
Sample Characteristics ................... 151
Scale Development Analyses ................ 155Shopping Motivation Scale Analyses . . . . 155Stage 1 ................................155Stage 2 ................................174Reliability Assessment .............. 174Model F i t ......................... 175Validity Assessment ................ 177
Stage 3 ............................. 178Reliability Assessment .............. 178Model Fit........................... 181Validity Assessment................. 183
Product Involvement Analyses ............ 186Stage 1..................................186Reliability Assessment .............. 186
Stage 3............................... 188Reliability Assessment ............. 192Validity Assessment ................ 192
Shopping Process Involvement (SPI) ScaleDevelopment........................... 195Stage 1 ............................... 195Reliability Assessment................195
Stage 2 ............................... 198Reliability Assessment................198Validity Assessment ................. 198
Stage 3 ............................... 203Reliability Assessment .............. 203Validity Assessment ................. 210
Summary of Analysis Chapter ................ 212
5. CHOICE SET FORMATION PROCESS RESULTS ........ 214
Choice Set Formation Process .............. 214Overview................................. 214Aggregate Choice Sets................... 217
Number of Retailers................... 217Types of Retailers................... 219Market Share ......................... 222
Reduction Measures ..................... 227Specific Retailers ..................... 228Choice Set Profiles..................... 237Summary................................. 245
vii
Chapter Page
6. HYPOTHESIS TESTS RESULTS .................... 249
Separate Hypothesis Tests .................. 249HI to H4: Structure of ShoppingMotivations.............................249
Proposed Second-Order Factor Model:Overall Model F i t ................... 250
Structural Model ..................... 253Respecified Model .................... 253Overall Model F i t ..................... 254Structural Model .................... 254Summary...............................254
H5 and H6: Motivations and StoreAttributes.............................257
H7: Motivations and Choice Sets............ 259H8, H9, and H10: Retailer Types and
Choice Sets ...........................265Hll and H12: Motivations and Choice
Heuristics.............................266.H13: Shopping Process Involvement . . . . 268H14 and H15: Motivations, Product
Involvement and Shopping ProcessInvolvement............................268
H16: Product Involvement and Knowledge. . 269H17 and H18: Involvement and Choice Sets. 272H19: Shopping Experience and Retailer
Knowledge...............................277H20: Retailer Knowledge and Choice Sets. . 277H21: Influence of Contextual Variables . . 281
Structural Model Results .................. 283Overall Model F i t ......................... 284Structural Model ........................ 286
Summary.....................................294Proposed Motivation Dimensionality . . . . 294Relationship ......................... 294
Shopping Process InvolvementDimensionality...........................294
Knowledge Relationships .................. 295Shopping Process Involvement Relationships. 295 Choice Set Formation Process Relationships. 296
viii
Chapter Page
7. CONCLUSIONS, IMPLICATIONS, AND RECOMMENDATIONSFOR FUTURE RESEARCH.......................... 301
Conclusions.................................301Consumer Shopping Motivations ............ 301Characteristics of the Choice SetFormation Process ...................... 305
Shopping Motivation Relationships . . . .310
Limitations of the Present Study .......... 313
Implications and Recommendations forFuture Research ......................... 316Are the Proposed Shopping Motivations
Comprehensive?........................... 317What Else Can Be Learned From Choice Set
Research?............................... 318How Can the Patronage Model Be Improved?. . 320 Summary................................... 320
Bibliography ........................... 322
Appendix A: Dissertation Questionnaire................ 337
Appendix B: Shopping Motivation Scale DevelopmentResults (Stages 2 and 3).................................. 351
V i t a .....................................................379
ix
LIST OF TABLES
Table Page
2.1 Conceptual Definitions and Support ofConstructs..................................43
2.2 A Structuring of 16 General Paradigms ofHuman Motivation............................ 55
3.1 Sample Size and Response Rates for SelectedPatronage Research Studies ................ 115
3.2 Operationalizations of Constructs...............117
3.3 Model Fit Evaluation Criteria .............. 140
3.4 Research Hypotheses and Required Analysis. . . 142
4.1 Demographic Characteristics of Populationand S a m p l e ........... 154
4.2 Shopping Motivation Scale Development Summary . 156
4.3 Shopping Motivation Scale Item Analysis . . . . 157
4.4 Stage 2: Consumer Shopping MotivationsComparison of Coefficient Alpha and LISREL Reliabilities ............................. 176
4.5 Stage 2: Relationships Between SummedMotivation Dimensions, SPI and Motivation Descriptions................................. 179
4.6 Stage 3: Shopping Motivations Comparison ofCoefficient Alpha and LISREL Reliabilities. . 182
4.7 Subscale Reliability Analysis: CronbachAlpha Across S tudies....................... 184
4.8 Stage 3: Relationship Between SummedMotivation Dimensions, SPI and Motivation Descriptions ............................. 185
4.9 Stage 3: Relationship Between Motivation andInvolvement Constructs and BehavioralMeasures................................... 187
4.10 Stage 1: Clothing Involvement Scale ItemAnalysis (13 Items)......................... 189
x
Table Page
4.11 Stage 1: Clothing Involvement Scale ItemAnalysis (10 Items)......................... 190
4.12 Stage 1: Factor Analysis - ClothingInvolvement Scale (10 Items) .............. 191
4.13 Stage 3: Clothing Involvement Scale ItemAnalysis (10 Items)......................... 193
4.14 Stage 3: Clothing Involvement Scale ItemAnalysis (8 I t e m s ) ......................... 194
4.15 Stage 1: Shopping Process InvolvementScale Item Analysis (22 I t e m s ) ............. 196
4.16 Stage 1: Shopping Process InvolvementScale Item Analysis (15 I t e m s ) ............. 199
4.17 Stage 2: Shopping Process InvolvementScale Item Analysis (12 Items) ............. 200
4.18 Stage 2: Factor Structure of ShoppingProcess Involvement Scale ................ 201
4.19 Stage 3: Factor Structure of ShoppingProcess Involvement Scale .................. 204
4.20 Stage 3: Shopping Process InvolvementScale Item Analysis......................... 205
4.21 Stage 3: Shopping Process InvolvementScale Item Analysis......................... 206
4.22 Stage 3: Shopping Process InvolvementLISREL Item Reliabilities, Factor Loadingsand Subscale Reliabilities ................ 208
4.23 Stage 3: Shopping Process InvolvementComparison of Coefficient Alpha andLISREL Reliabilities......................... 211
4.24 Summary Table of Measures: AssessingReliability and Validity..................... 213
5.1 Total Number of Retailers at Each Stage . . . .218
5.2 Number of Firms by Retailer Type at EachChoice Set Stage.............................220
xi
Table
5.3
5.4
5.5
5.6
5.7
5.8
5.9
5.10
6.1
6.2
6.3
6.4
6.5
6.6
6.7
Page
Distribution of Retailers: Calculation ofHerfindahl Index for Two Sample Respondents. 223
Concentration of Retailers: Total Sample. . . 226
Percentage Reduction in Choice SetsAcross Choice Set Stages .................. 229
Number of Respondents Including SpecificRetailers By Choice Set S t a g e .............. 231
Average Choice Set Size by SelectedDemographic Characteristics ................ 240
ANCOVA Results with Choice Set Structure as Dependent Variables, Income as Independent Variable and Ethnic Origin as Covariate . . . 243
ANCOVA Results with Choice Set Structure as Dependent Variables, Ethnic Origin as Independent Variable and Income as Covariate. 244
ANCOVA Results with Choice Set Structure as Dependent Variables, Demographic Variables as Independent Variables and Income as Covariate...................................246
Standardized Structural Parameter Estimatesfor Proposed Second-Order Factor Model . . . 251
Standardized Structural Parameter Estimatesfor Respecified Second-Order Factor Model . . 255
Correlations Between Shopping Motivations andRetail Attribute Importance Ratings.......... 258
Regression Analysis of Overall ShoppingMotivation as Predictor of Choice Set Size . 260
Regression Analysis of Shopping Motivation and Other Explanatory Variables as Predictors of Choice Set Size........................... 261
Effects of Shopping Motivation on Choice SetStructure................................. 263
Effects of Shopping Motivation on Choice Set (/ Structure with Clothing Involvement and Contextual Influences as Control Variables. . 264
xii
Table Page
6.8 Effects of Shopping Motivation on Choice SetSpecialization: Number of Retailers byMotivation T y p e .............................267
6.9 Regression Analysis of Shopping Motivationand Clothing Involvement as Predictors of Shopping Process Involvement .............. 270
6.10 Regression Analysis of Clothing Involvementand Experience as Predictors of Shopping Process Involvement ....................... 271
6.11 Regression Analysis Predicting Awareness SetSize.........................................274
6.12 Effects of Clothing Involvement and ShoppingProcess Involvement on Choice SetStructure .................................275
6.13 Effects of Clothing Involvement and ShoppingProcess Involvement on Choice Set Structure with Knowledge, Contextual Influences,Shopping Motivation, and SPI as Control Variables...................................276
6.14 Effects of Knowledge on Choice Set Structure. . 279
6.15 Effects of Knowledge on Choice Set Structurewith Clothing Involvement, Contextual Influences, and SPI as Control Variables. . . 280
6.16 Regression Analysis of Contextual Influencesas Predictor of Choice Set Size............. 282
6.17 Summed Scale Reliabilities ................. 285
6.18 Standardized Structural Parameter Estimates forProposed Patronage Model .................. 287
6.19 Summary of Tests of Hypotheses Using StructuralEquation Modeling ......................... 290
6.20 Summary of Hypotheses Tests: Univariate,Multivatiate and Structural Model Tests. . . 299
6.21 Comparison of Hypothesis Tests Across Univariate,Multivariate and Structural Model Methods by Choice Set Stage...................... 300
xiii

Table Page
B.l Stage 2: Shopping Motivation Scale LISRELItem Reliabilities, Factor Loadings, and Subscale Reliabilities .................... 352
B.2 Stage 3: Shopping Motivation Item Analysis. . 361
B.3 Stage 3: Shopping Motivations LISREL ItemReliabilities, Factor Loadings, and
Subscale Reliabilities .................. 370
xiv

LIST OF FIGURES
Figure Page
1.1 Simplified Model of the Decision Process . . . 8
1.2 Choice-Set Formation Process Model forRetail Outlets ........................... 9
1.3 Simplified Patronage Model .................. 11
1.4 Proposed Patronage Model .................... 18
2.1 Proposed Consumer Patronage Model .......... 42
2.2 A Model of the Motivation Pr o c e s s.......... 57
2.3 Proposed Motivation Dimensionality andStructure....................................65
2.4 The Howard Model. ............................ 89
2.5 The Narayana and Markin Model.................. 90
2.6 The Brisoux and Laroche Model...................91
2.7 The Spiggle and Sewall M o d e l ...................97
2.8 Choice Set Formation Process Model .......... 99
2.9 Patronage Model of Choice Set Structure . . . . 102
2.10 Proposed Patronage Model and HypothesisLinkages...................................109
3.1 Procedure for Measure Development ............ 130
3.2 Scale Development Procedure Employed............ 131
3.3 Proposed Consumer Patronage Model andHypothesized Linkages ..................... 150
6.1 Proposed Higher-Order Motivational Structure. . 252
6.2 Respecified Higher-Order MotivationalStructure...................................256
6.3 Proposed Patronage Model and SignificantStructural Parameters for AwarenessSet S t a g e ..................................291
xv
Figure Page
6.4 Proposed Patronage Model and SignificantStructural Parameters for ConsiderationSet S t a g e .................................. 292
6.5 Proposed Patronage Model and SignificantStructural Parameters for Action Set Stage . 293
xvi
ABSTRACT
Much of the research in marketing involves the study of consumer
choice behavior. This study is concerned with the development and
testing of a theory of retail choice or patronage. The last several
years have witnessed dramatic changes in the retailing industry. In
addition to the traditional department, discount, and specialty stores,
consumers may increasingly choose from a wide variety of non-store
retailers. Thus, any comprehensive study of retail outlet choice
behavior should incorporate all of the alternatives available to the
consumer.
This research developed a model of patronage which extended
previous research with the addition of alternative retail outlets and
the explication of important determinant variables. The inclusion of
all available retail outlets presents a more comprehensive view of
consumers1 retail choice decisions and aids researchers in understanding
the varied choice behavior of individuals. Consumer shopping
motivations, involvement, experience, knowledge, and contextual
influences were proposed as primary determinants of retail outlet
choice.
A large focus of the dissertation research involved the
construction and validation of a consumer shopping motivation scale.
Three stages of data collection were conducted to develop a
comprehensive, reliable and valid measure. Motivations were proposed to
represent underlying forces that stimulate and compel individuals to
interact with the retailing community. The research proposed
xvii

motivations to greatly influence the number and types of retailers
consumers patronize.
In operationalizing retail choice, this dissertation employed a
choice set process paradigm. Herein, the research considered store or
outlet choice to be a complex decision process. The choice set
formation process recognizes consumers have manv alternatives to choose
from in selecting a retail outlet and is concerned with the cognitive
process of alternative evaluation and the derivation of choice sets.
The dissertation proposes consumers categorize retail alternatives into
four groups.
The results of the dissertation demonstrate the proposed shopping
motivation scale to be a reliable and valid indicator of consumers'
underlying needs. In addition, the results demonstrate how the various
determinants of patronage are related to each other as well as their
influence on the size of consumers' choice sets.
xviii
CHAPTER ONE
The Research Topic
Chapter One begins with an introduction to the dissertation
research topic area. The research questions are then presented, and the
design of the dissertation study is briefly described. Anticipated
contributions of the research are discussed in a final section of the
chapter.
Overview of the Topic
Introduction
The last several years have witnessed dramatic changes in the
retailing industry. In addition to the traditional department,
discount, and specialty stores, consumers may increasingly choose from a
wide variety of non-store retailers. Methods of non-store retailing
include general merchandise catalogs, specialty catalogs, direct-
response advertising, at-home personal selling, electronic retailing and
institutionalized product marketing. While some have speculated that
at-home shopping will replace in-store shopping, it is more likely the
two distribution systems will combine into a new type of integrated
retailing system.
The retailer which takes advantage of an integrated retailing
system will have unlimited options to reach consumers both in-store and
at-home. For example, at many Sears stores you can buy a house, pick
out all the furniture and pots and pans you need...take out
1
insurance...and if you have any money left over — buy stocks and bonds
or invest in a money market fund. Sears is America's leading retailer
with annual sales of 44 billion a year (Fortune 1987) as well as
America's leading direct marketer. Twelve million homes receive the
Sears big books and specialty catalogs. There is a database for
Allstate...Coldwell Banker...The Sears Savings Bank...Dean Witter — all
linked together and each accessible to the other. Now when you buy a
home through Coldwell Banker, you get bonus certificates good for
furnishings from the Sears catalog or at a Sears store.
Retailers of the 1990's must recognize that the primary
determinant of success is the ability to meet and satisfy consumer's
wants and needs. The consumer is increasingly moving between at-home
shopping to in-store shopping. According to the U.S. Department of
Commerce, 1986 retail store sales (including some mail-order sales by
store retailers) were almost $1.5 trillion. During 1986, at-home and
vending machine sales generated an additional $200 billion in revenues
(Berman and Evans 1989). The amount of both in-store and at-home sales
is quite overwhelming.
In addition, retailers who once believed catalogs were good only
for building store traffic have come to consider catalogs as a separate
profit center. For instance, Bloomingdale1s has created a separate
catalog store within the store which has its own inventory and even its
own name -- Bloomingdale's By Mail Limited. Traditional catalog
retailers are also beginning to rethink how they do business. Once you
were either a specialty catalog or a specialty store. Now we have Eddie
Bauer coming out of the woods to move into 34 store locations, Laura
Ashley with 165 shops in 12 countries and Williams Sonoma opening retail
operations in Boston, Atlanta, Dallas and other cities.
It is estimated that the average household will receive at least
50 different catalogs a year with many companies offering several
editions. In 1982, the number of mail order houses in operation was
7,433 while there were 1,330,316 retail establishments (Rapp 1984). The
Direct Marketing Association reported 11.8 billion catalog units,
representing 8500 catalogs, were mailed in 1986. This compares to 1983
figures of 6.7 billion units (6500 catalogs) and 1981 counts of 5.3
billion pieces (4000 catalogs). Television shopping has also mushroomed
and is a 1.3 billion dollar per year industry. Simmons research reports
at-home sales for July 1984 were 12 billion dollars, which is a 27%
market share when compared to in-store sales of 32 billion dollars.
In recent estimates, Sales and Marketing Management (1987) reports
that in 1990 consumers will spend an estimated 49.37% of their effective
buying income on retail sales. It is not surprising then that interest
has shifted to understanding the retail choice decisions of consumers.
In-store marketers as well as at-home marketers are responding to
changes in the retailing industry and also to changes in consumer's
purchasing patterns. However, little is known about how consumers
perceive changes which have resulted in a greater number of alternative
retailers and how these alternatives have affected their choice
behavior. This greater diversity represents increased complexity for
consumers as they must make decisions regarding the type of alternatives
to choose from in their retail choice decisions.
4
Impact on Patronage Research
Researchers also are faced with increased complexity in studying
patronage behavior in the 19801s and 19901s. Given the wide variety
from which individuals may choose, academicians must incorporate the
varied alternatives in their studies of consumer's retail choice. As it
is unlikely that at-home shopping will replace in-store shopping, effort
must be expended to understand the effects that the varied alternatives
have on consumer's choice behavior. Additionally, their reasons for
choosing a particular retailer type must be explicated.
The empirical study of patronage behavior dates back to the 1920's
(Sheth 1983) where finding solutions to specific problems of retail
management was a major concern. Since that time considerable knowledge
has developed concerning retail competitive structures, operational and
tactical aspects of retail store management, the impact of product
characteristics, personal characteristics of shoppers and buyers, and
the impact of general economic variables as related to patronage
behavior. Sheth (1983) notes "what is conspicuously lacking in this
impressive research tradition is the development of a theory of
patronage behavior.... Still, what seems to be needed is some attempt at
integrating existing substantive knowledge in terms of at least a
conceptual framework, or better yet, of a theory of patronage behavior"
(1983, p. 10).
Patronage analysis is concerned with how individuals choose an
outlet in which to shop (Monroe and Guiltinan 1975). Given the
complexity of the retail marketplace today, consumers may choose from a
wide range of alternative retail outlets - from mail order catalogs to
exclusive retail stores. Much of the research on patronage behavior has
concentrated on consumers' patronage of traditional retail outlets -
grocery stores, department stores, specialty stores, and discount
stores. Thus, this research stream has ignored a large segment of
retail outlet alternatives available to consumers which include mail
order catalogs, direct mail, cable television shopping and computer
network shopping. Since at-home sales are reported to hold a 27% share
of the market, these outlets must be considered in any comprehensive
view of retail choice (Simmons 1985).
Researchers have primarily focused upon the determinants of
patronage - those factors leading individuals to choose the outlets they
do. For instance, do individuals prefer department stores or discount
stores? What type of individuals are more likely to shop at major malls
versus strip centers? For the most part, research in patronage behavior
can be summarized as primarily descriptive in nature with a decisive
lack of theory development (Sheth 1983).
Determinants of Patronage. Studies investigating consumers'
retail patronage have explored many different constructs which are
proposed to influence individual behavior with regard to store choice.
Retail outlet attributes have been proposed by many to be of critical
importance to individuals when deciding among alternative outlets (c.f.
Achabal, Kriewall and McIntyre 1983; Arnold and Tigert 1973-1974).
Moreover, these attributes are proposed to form the basis of consumers'
overall "image" of the retail outlet (Bellenger, Steinberg and Stanton
1976; Dolich and Shilling 1971). However, this research does not
esqplore the process of determinant attribute formation. By what means
do consumers derive the set of attributes they deem important? Do they
develop a list based on past experience or advice from others? As a
complement, individual difference variables such as consumers'
socioeconomic status, stage in the family life cycle, ethnicity, age,
and sex have also been related to patronage behavior (Bearden, Teel and
Durand 1978; Bellenger and Moschis 1982; Bellenger, Robertson, and
Hirschman 1976-1977; Darian 1987).
While studies utilizing retail outlet attribute perceptions and/or
individual characteristics lead to models which are parsimonious and
helpful to the retail executive, they ignore the fact that store choice
decisions may be complex. The decision outcome may not be fully
explained just by the identification of determinant attributes or the
individual's demographic characteristics.
Other research in patronage has explored consumers' attitudes
toward shopping, interests, and opinions as primary antecedent variables
(Bellenger and Korgaonkar 1980; Darden and Ashton 1974-1975; Williams,
Painter and Nicholas 1978). Typically, these studies grouped
respondents according to their attitudes into various shopper types
which were hypothesized to influence patronage behavior. Although the
idea of a basic shopper style or orientation is appealing, this research
stream is questioned as many taxonomies have been proposed which were
based on various forms of responses. For instance, classifications have
been based on store attribute importance ratings (Darden and Ashton
1974-1975), store image characteristics (Williams, Painter and Nicholas
1978), psychographic scales (Crask and Reynolds 1978; Darden and
Reynolds 1971), and global expressions about shopping (Bellenger and
Korgaonkar 1980). These studies proposed many different types of
shoppers with only a few appearing consistently across studies.
This research stream is also questioned as investigators have
relied upon indirect indicators of shopping orientations. Thus, the
relationship between attitudes and orientation may not be as high as
commonly thought (Westbrook and Black 1985). Therefore, much remains to
be learned regarding possible antecedent variables which determine
individuals' retail outlet choice.
Measures of Patronage. Just as determinants of patronage have
been viewed simplistically, so too have the measures of patronage
themselves. Researchers investigating retail choice have focused on the
outlet choice decision by obtaining measures of store last shopped,
stores most preferred, mall last shopped, etc. In this light, the
patronage decision is a static one and the resultant behavior (outlet
choice) is more important than those processes which led to the final
outcome.
It is widely recognized that individuals narrow their choice of
retail alternatives in some manner and rarely make use of all available
alternatives. Consumers are moved to simplify their decision processes
by limiting the number and types of retailers considered. How and why
consumers simplify and limit the number of alternatives evaluated is of
major concern to marketing practitioners and theorists.
8
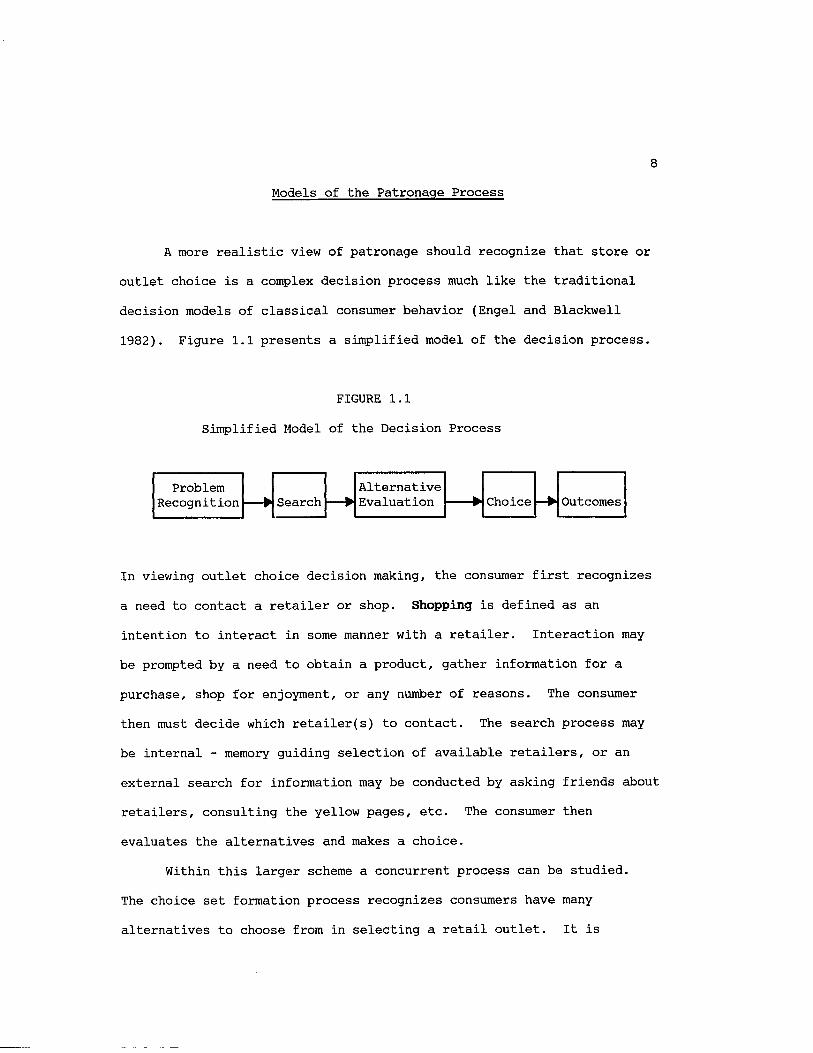
Models of the Patronage Process
A more realistic view of patronage should recognize that store or
outlet choice is a complex decision process much like the traditional
decision models of classical consumer behavior (Engel and Blackwell
1982). Figure 1.1 presents a simplified model of the decision process.
FIGURE 1.1
Simplified Model of the Decision Process
ChoiceSearch OutcomesProblem
RecognitionAlternativeEvaluation
In viewing outlet choice decision making, the consumer first recognizes
a need to contact a retailer or shop. Shopping is defined as an
intention to interact in some manner with a retailer. Interaction may
be prompted by a need to obtain a product, gather information for a
purchase, shop for enjoyment, or any number of reasons. The consumer
then must decide which retailer(s) to contact. The search process may
be internal - memory guiding selection of available retailers, or an
external search for information may be conducted by asking friends about
retailers, consulting the yellow pages, etc. The consumer then
evaluates the alternatives and makes a choice.
Within this larger scheme a concurrent process can be studied.
The choice set formation process recognizes consumers have many
alternatives to choose from in selecting a retail outlet. It is

concerned with the cognitive process of alternative evaluation and the
derivation of choice sets of retail outlets (Spiggle and Sewall 1987).
Figure 1.2 depicts the choice set process for retail outlets.
FIGURE 1.2
Choice Set Formation Process for Retail Outlets
OutletChoice
ActionSet
AwarenessSet
ConsiderationSet
The choice set formation process describes a method in which
consumers may categorize various retail alternatives. This notion is
similar to the "evoked set" concept put forth by Howard (1977). Howard
defined the evoked set as, "the subset of brands that a consumer
considers buying out of the set of brands that he or she is aware of in
a given product class" (1977, p. 306). In a patronage context, the
proposed choice set formation process recognizes the many and varied
retail alternatives available to individuals and categorizes them into
four groups: awareness, consideration, action, and outlet choice.
The aw areness set is comprised of all retail alternatives of which
the consumer has some knowledge. This knowledge may consist of
information regarding the location, products carried, and type of
shoppers of the retailer or simply that the consumer has "heard of" the
alternative. The c o n s id e r a t io n set is composed of those retail
alternatives the individual would regard as possible choices for
retailer interaction. The a c t io n set represents those retail

alternatives toward which the consumer would take some action— such as
visiting the outlet, watching cable network shopping, browsing through a
catalog, etc. Final o u t l e t c h o ic e represents the retail alternative(s)
chosen by the individual. Individuals may engage in such a process when
making selections among various retail alternatives. The choice set
formation process provides a useful model for conceptualizing the
alternative evaluation activity.
Summary. As evidenced by this review of patronage research, a
variety of concepts have been related to consumer patronage behavior.
This brief discussion suggests four major deficiencies in consumer
patronage research:
- Patronage research has failed to include non-store
retailers thus omitting a large number of available alternatives
and ignoring the increased complexity of the retail marketplace;
- Determinant store attributes are used as important links to
store choice with no regard as to how consumers derive this set of
retailer characteristics;
- Patronage research has studied consumer shopping behavior as
static and has ignored that the selection of a retail alternative
represents a decision p r o c e s s ; and
- Previous research has failed to develop a comprehensive theory
of patronage behavior subject to empirical validation.
11
Proposed Patronage Model
The dissertation attempts to address areas of patronage behavior
research which have not been explored and need further development. The
dissertation (1) expands the patronage literature with the inclusion of
alternative retail types, (2) extends the study of patronage through the
exploration of additional constructs, and (3) integrates elements of
traditional patronage literature in a proposed model.
Shopping Motivations and Patronage
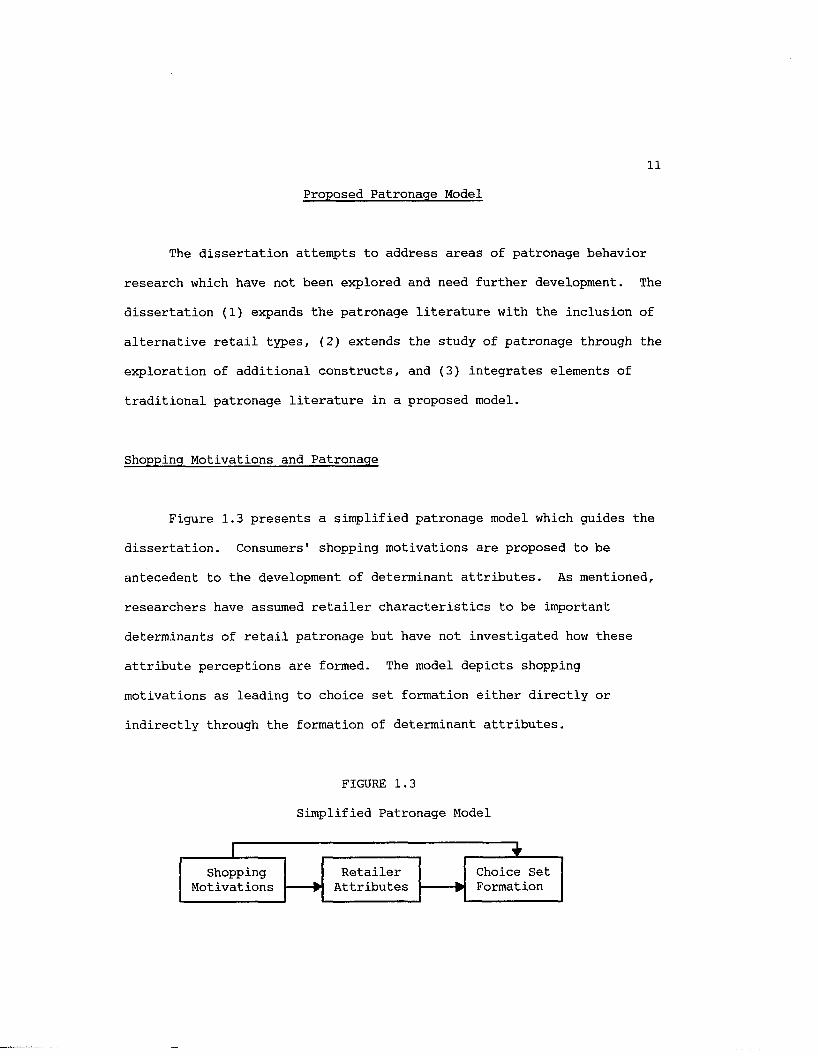
Figure 1.3 presents a simplified patronage model which guides the
dissertation. Consumers' shopping motivations are proposed to be
antecedent to the development of determinant attributes. As mentioned,
researchers have assumed retailer characteristics to be important
determinants of retail patronage but have not investigated how these
attribute perceptions are formed. The model depicts shopping
motivations as leading to choice set formation either directly or
indirectly through the formation of determinant attributes.
FIGURE 1.3
Simplified Patronage Model
Choice Set Formation
RetailerAttributes
ShoppingMotivations

12
In this study, shopp ing m o tiv a t io n s are defined as the
unobservable inner force(s) that stimulates and compels an individual to
interact with the retailing community and provides specific direction to
his/her behavior. As will be discussed in a later section of this paper
(Chapter 2), these motivations can be described as being of three basic
types: functional, symbolic, and experiential.
The patronage model presented here suggests that a consumers'
shopping motivations may impact directly on the formation of choice
sets. In this situation, a consumers behavior is directed by the
recognition that engaging in shopping behavior and selecting retailers
can result in the satisfaction of a particular need state. Individual's
may seek specific types of retailers such as department stores,
specialty stores, flea markets, or catalog retailers which may
inherently satisfy certain underlying needs. It is presumed that
motivations will directly influence the ty p e of retail alternative
considered by an individual.
For instance, if a consumer is motivated to shop or contact a
retailer to fulfill informational needs, a specific retailer or a set of
retailers may be recognized which can solve these needs. In this case,
department or specialty outlets may be able to provide more information
to an individual than a catalog or discount alternative. The individual
is thus directed to consider the ty p e of retail outlet which may fulfill
the various motivational states.
Concurrently, a consumers' shopping motivations may lead to the
composition of determinant attributes which influences choice set
formation. In this instance, motivations guide the consumer to search

13
for and demand that retailers possess certain characteristics in order
to be considered as possible alternatives. Individuals under this
circumstance begin evaluating s p e c i f i c retail alternatives with regard
to certain determinant attributes. The retailer attributes considered
are derived from the various motivations which impel an individual's
behavior. Specific retail alternatives are evaluated along the
dimensions and a decision is made regarding their inclusion/exclusion in
the individual's choice set.
Using the example of a consumer wishing to fulfill informational
needs, a retailer's ability to provide information by having
knowledgeable salespeople and product information available would form
the basis for that specific retailer being included in the consumers'
choice set. It is likely that past knowledge and experience regarding
interactions with the retailer or expectations about the service level
will influence the choice set formation process as well.
It should be clear that this simplified model of patronage does
not attempt to fully describe the retail outlet selection process. Its
purpose is to show that shopping motivations may be an important link to
the choice set formation process either as a direct influence or through
the development of determinant attributes.
Additional Determinants of Patronage
Involvement. While shopping motivations may influence consumers'
retail choice behavior, it is likely that other variables may also be
significant determinants. Involvement is one construct which has

14
received much attention in recent consumer research (c.f. Bloch 1981;
Laurent and Kapferer 1985). The concept of involvement stems from the
recognition that many individuals exhibit an interest in a product or
activity which transcends the purchasing process. For instance, early
consumer research attempted to categorize products or situations as
either high or low involving to the consumer.
Thus, when an individual encountered a purchasing situation
concerning a particular product, differential decision processes were
proposed to be in effect depending upon whether the product was high or
low in involvement. Traditionally, products such as major consumer
durables - automobiles and home appliances were considered to be high in
involvement, while most consumer products were low.
However, this dichotomy does not always account for individuals'
behaviors and interest has begun to focus on the concept of involvement
as an individual difference variable. It is likely that the concept of
product involvement as well as activity involvement could influence
individuals' patronage behavior. Whether an individual maintains an
interest in a particular product such as clothing, automobiles, or wine
is likely to affect the types and numbers of retail outlets considered.
Additionally, consumers may become involved wi'th an activity -
such as golf, hunting, shopping — where engaging in the endeavor itself
is satisfying and rewarding. Exploring the extent to which individuals
engage in shopping activities as a result of an enduring interest in the
behavior itself is also likely to impact the outlet choice decision.
Experience and Knowledge. Other variables which may determine the
outlet choice decision of individuals is their level of experience and
15
knowledge. For many, the tasks of shopping and procuring products are
learned behaviors. From the time individuals are very young, they are
taught the value of money and how money may be used to purchase the
products and services one desires. Thus, it is realistic to assume that
the level of experience an individual has in the purchase process may
indeed affect the number of retail outlets considered and perhaps the
types of retail outlets patronized.
For instance, the first time an individual purchases an automobile
is often very difficult - the consumer may worry about the car's
performance, service requirements, whether or not they are paying a fair
price, etc. Additionally, the consumer may not know which dealerships
are reputable or where within the city the outlets are located.
It is expected that individuals' experience in the purchase
process or with particular products will influence store patronage
behavior. Experience is also likely to contribute to the level of
knowledge an individual has concerning the product and available retail
outlets.
Contextual Influences. One variable which has been proposed as a
possible explanation for weak relationships between individual
characteristics and store choice is context or the situation (Mattson
1982). Thus, factors outside the individuals' control may affect their
behavior, making researchers' attempts to predict behavior based on
personal variables more difficult. In patronage, three contextual
influences are likely to affect the type and number of retail outlet(s)
considered: the retail competitive structure or availability of retail
outlets (Bucklin 1967; Sturdivant 1970); the amount of time individuals
16
have to spend shopping and purchasing products (Berkowitz, Walton, and
Walker 1979), and the financial position of the individual (Belk 1975).
To the extent these contextual influences are in operation, they are
expected to exert a substantial impact on patronage behavior.
Individuals who are constricted in terms of amount of time or
money will engage in fewer shopping or purchasing trips and may be very
careful in choosing the particular retail outlet. For example, if
consumers are pressed for time, they may prefer to shop at a retail
outlet that is close to their home or work. Therefore, the number of
outlets considered will be restricted to those that are within a certain
acceptable distance range. Likewise, consumers who do not have as much
discretionary income may be very discriminating in the types of outlets
considered. These individuals are very concerned about price and value
for their money and will therefore choose retailers likely to provide
this value. Similarly, their choice sets will be restricted to
retailers who can provide good value such as discount retailers.
Consumers who are time-poor may also patronize non-store retailers
as a way to conserve on time spent in shopping related activities.
Individuals who shop by phone or mail have the convenience of previewing
products at any time while at home or the office. Most direct marketing
companies maintain toll-free telephone numbers and offer 24 hour
service.
A final contextual variable which may impact individual retail
choice behavior is their perceptions of the acceptability of available
retail outlets. If consumers feel that the choice of retail outlets in
their area is not acceptable, they may engage in outshopping behaviors
17
where they visit other cities or perhaps rely on non-store retailers.
In either case, the individuals' choice sets will contain fewer numbers
of local retail outlets.
Summary. Consumer shopping motivations, product involvement,
involvement with shopping, experience, knowledge, and contextual
influences are proposed to be additional determinants of patronage.
Motivations are expected to influence outlet choice behavior both
directly and indirectly through the formation of determinant attributes.
Involvement, experience, knowledge and context are each proposed to
exert a direct influence on retail choice behavior as well. The
specific relationships among these constructs and to the choice set
formation process are discussed in greater detail in Chapter Two.
In addition to assessing the impact of these additional constructs
on patronage behavior, this work extends past research by including a
wide variety of alternative retail outlets - both non-store and
traditional store retailers. Moreover, the patronage decision is viewed
as a choice process composed of the stages of awareness, consideration,
action, and final outlet choice. Figure 1.4 presents the proposed
patronage model which is tested in this research.

18
FIGURE 1.4
Proposed Patronage Model
ProductKnowledge
ProductExperience
Choice Set Formation
ProductInvolvement
ShoppingMotivations
ContextualInfluences
Shopping Process Involvement

19
Research Questions
The research questions focus first on the identification of
motivational dimensions which are viewed as antecedents to the
development of determinant attributes, then on the choice set formation
process, and finally on the relationship of shopping motivations to the
choice set formation process. Specifically, the dissertation research
seeks to answer the following questions:
- What motivation taxonomy describes the antecedent states which
form consumers' perceptions of retailer attributes and give rise
to the varied patronage behavior of store and non-store retailer
choice?
- How is the choice set formation process characterized with
the inclusion of non-store retailers?
- How do shopping motivations relate to the choice set formation
process and other explanatory variables?
The Dissertation Research
The dissertation research investigates consumer patronage behavior
in a dynamic context whereby individuals' choice sets for retail
alternatives are elicited. The dissertation proposes a model of
patronage which specifies consumer shopping motivations, product
involvement, shopping process involvement, product experience, product
knowledge, and contextual influences to be antecedents to determinant
attributes and choice. Shopping motivation and involvement scales are

20
developed for the dissertation and require the use of survey
methodology. Specifically, the present research conceptualizes the
patronage decision process as a function of many factors - motivation,
involvement, experience, knowledge and perceived retailer attribute
importance perceptions and contextual influences.
The population from which the sample was drawn consisted of adult
females aged 18 or older in the Baton Rouge metropolitan area. As the
dissertation research involved an assessment of consumer shopping
motivations and resulting patronage behavior, it became necessary to
limit the respondents to either male or female. Female respondents were
chosen since they have been studied in previous research (c.f.
Bellenger, Robertson and Greenberg 1977), and it was felt they would
demonstrate greater variability on the motivation and involvement
measures.
A judgment sample was employed to obtain a sample of 245 women.
In obtaining respondents several sources were utilized. The primary
source of data collection was the Baton Rouge YMCA located on Foster
Drive. In an effort to ensure sample representiveness, other groups of
individuals were selected through the use of a modification of the
"drop-off" method. Selected neighborhoods of the Baton Rouge
metropolitan area were chosen and respondents were solicited to
participate in the research.
The survey questionnaire assessed respondents' underlying shopping
motivations using a 65-item Likert-type scale. In addition, clothing
involvement and shopping-process involvement were assessed using a 10
and 12 item Likert-type scale, respectively. Other measured constructs
21
included consumers' product and purchase experience and knowledge,
retailer attribute importance perceptions, and contextual items. These
constructs and their relationships are explicitly defined in Chapter 2.
The questionnaire also involved a choice-set task where
individuals' awareness set of retailers was first elicited. They were
next provided with a purchase scenario and asked to indicate which
retailers would comprise their consideration and action sets.
Contributions of the Research
This dissertation attempts to address areas of patronage behavior
research which have not been examined and need further development. The
research addressed four basic needs in patronage research. First, the
dissertation study includes all types of retail outlets rather than
focusing on traditional store retailers. This provides a more
comprehensive view of consumers' patronage behavior by recognizing that
consumers may well consider and shop all types of retail outlets.
Previous patronage studies concentrated on traditional retail
outlets such as grocery stores, department stores, specialty stores, and
discount stores. However, the retail marketplace today is very
competitive with new forms of retailing such as catalogs and cable
television shopping networks striving for their own share of the market.
Therefore, the inclusion of alternative retail outlets presents a more
comprehensive view of consumers' retail choice decision and aids
researchers in understanding the varied choice behavior of individuals.
The retail practitioner on the other hand must study the patronage
22
choice behavior of consumers in order to develop effective marketing
strategies. This includes understanding how consumers make decisions —
specifically which retailer to patronize. The dissertation research
provides information regarding consumers' preference for specific types
of retailers and reports the percentage of respondents who patronize
certain types of retailers such as catalogs or discount outlets. This
yields important competitive figures which can be used in planning and
implementing marketing strategies.
Second, consumers' shopping motivations are proposed to be
antecedent to the development of determinant attributes. As mentioned,
researchers have assumed retailer characteristics to be important
determinants of retail patronage but have not investigated how these
attribute perceptions and preferences are formed. The exploration of
antecedents of attribute importance perceptions is germane since these
perceptions may change over time and are regarded as unstable.
Moreover, if stable individual characteristics could be linked to
attribute perceptions, conceptual clarity would be provided and retail
marketers would be better able to influence long-term consumer patronage
behavior. Shopping motivations were found to relate to attribute
importance perceptions which addresses the need expressed in prior
patronage research for inclusion of stable individual characteristics
relating to attribute importance perceptions and choice behavior.
Third, the choice-set formation process is explored. Just as
store choice has become an important dependent variable in patronage
studies, viewing outlet choice as a decision process will provide a
wealth of information regarding the p r o c e ss a consumer undergoes when
23
making an outlet choice decision. Understanding how consumers choose
retail outlets from those that they have knowledge of can provide
important strategic information to retail management as well as insights
to academicians regarding consumers' decision processes.
The dissertation research demonstrates that there is wide
variation in consumers' choice sets and that individuals do in some
manner reduce the number of alternatives considered to some subset of
those available. Viewing the outlet choice decision as a multi-stage
process extends the theoretical base of patronage research since typical
patronage studies have utilized measures such as store last shopped,
stores most preferred, mall last shopped, etc., as indicants of overall
choice behavior. The traditional perspective ignores the true cognitive
simplification process that occurs prior to final outlet choice.
Viewing the patronage decision as a process also provides
managerial benefit. Retailers can utilize this approach to determine
the percentage of individuals who are aware of their outlet in addition
to ascertaining those who are current customers. Since individuals must
have knowledge of a retail outlet before they can become a customer,
retailers should focus on developing awareness and building outlet
loyalty.
Finally, a model of patronage behavior is proposed which attempts
to describe the retail outlet choice process of consumers as well as
relate individual characteristics and perceptions to choice behavior.
The proposed model provides conceptual benefit as consumer shopping
motivations are found to be related to choice behavior. Additionally,
the impact of product involvement, shopping process involvement,
experience, knowledge, and contextual influences on retail choice
behavior is determined.

CHAPTER TWO
Literature Review
The dissertation research investigates and proposes a model of
consumer retail patronage behavior. The research defines patronage
analysis as concerned with the process of how consumers choose retail
outlets in which to shop and purchase products. Contrasted to other
studies dealing with this issue, the present research views the retail
choice decision as comprised of many stages: awareness of available
alternatives, consideration of acceptable alternatives, determination of
alternatives in which the consumer might visit or contact, and final
outlet choice {See Figure 1.2). In examining the retail choice
decision, the process by which individuals choose the outlet and
determine acceptable alternatives will be studied rather than final
choice behavior.
Several determinants of retail patronage are proposed in addition
to those currently employed. The first, consumers' shopping motivations
are suggested to influence choice set processes both directly and
indirectly through the formation of determinant attributes. Other
constructs of interest include consumers' shopping process and product
involvement, product experience, product knowledge, and contextual
influences. The full model and relationships among variables will be
presented and discussed in a later section of this chapter. Therefore,
this research expands the patronage literature by including alternative
retailers, extends the study of patronage through the exploration of
25
26
additional constructs and integrates these variables in a proposed
model.
The purpose of this chapter is to review the literature relevant
to the dissertation topic, identify major issues in the body of research
to date, and state hypotheses which indicate in what area and by what
means the present research will contribute to resolving these issues.
The plan of Chapter Two is as follows:
1) Review major areas of patronage behavior research,
emphasizing conceptual and methodological issues of this
research stream. The proposed patronage model and its role
in conceptual development will be presented following a
critical discussion of this literature.
2) Examine model constructs focusing on conceptual and
methodological issues. Motivation research will first be
reviewed followed by a discussion of choice-set research.
Other explanatory variables will then be reviewed including
product and shopping process involvement, product
experience, and product knowledge. These constructs will be
reviewed in light of their relation to consumer patronage
behavior.
3) Summarize the findings and issues of the literature reviewed
in the chapter and identify needed research. Dissertation
hypotheses are stated in this section.
27
Major Areas of Patronage Research
A wide range of studies come under the rubric of patronage
analysis and this diversity of empirical knowledge has served to foster
lack of consistency on the part of academics as to what patronage is.
For the purposes of this research, p atron age a n a ly s is is defined as how
individuals choose the outlet in which to shop (Monroe and Quiltinan
1975).
The present research is concerned with the development of a theory
of patronage behavior which views retail choice as a decision process.
Before the proposed patronage model is presented, several theoretical
models of patronage will be reviewed. The topics chosen for inclusion
in this review relate specifically to the topic of consumer patronage
behavior and focus primarily on determinants of choice. These broad
areas of patronage include a discussion of determinant attributes, store
loyalty, socialization, and shopping orientation.
Determinant Attributes
Perhaps the most fundamental linkage in patronage research is
between determinant store attributes and store choice. Researchers
cannot deny the importance retailer characteristics play in outlet
selection and patronage. However, while the relationship has been
studied extensively (e.g. Achabal, Kriewall, and McIntyre 1977; Arnold,
Ma and Tigert 1978; Arnold, Oum and Tigert 1983; Arnold and Tigert 1973-
74; Cavusgil 1981; Gentry and Burns 1977-78; Tigert and Arnold 1981),
28
the simplified nature of this paradigm has led to models of store choice
which do little but describe behavior of individuals. These models
assume consumers make decisions regarding choice of retail outlet by
noting and demanding certain retailer characteristics to be present.
Attribute importance and perception scores are also utilized to
study consumers' impressions of stores, brands, and manufacturers. It
is believed these impressions can later exert a major impact on shopping
behavior; hence retailers and manufacturers alike are concerned with
developing and maintaining positive images which are apt to influence
patronage behavior. However, despite an extensive literature on store
image (e.g. Bellenger, Steinberg and Stanton 1976; Dolich and Shilling
1971; Lessig 1973; Rich and Portis 1964; Schiffman, Dash and Dillon
1977), little is known of the process of image formation and the impact
of image considerations on consumers' retail choice behavior.
Peterson and Kerin (1981) categorize the store image literature as
composed of two principal research streams. The first includes
conceptual efforts designed to identify the existence and determinants
of store image. The second consists of behavioral research efforts
designed to demonstrate image differences among retail stores and relate
store image to patronage behavior. Researchers have often identified
lists of store characteristics thought to be relevant to retail
customers. These dimensions were then used to discover respondents'
images of stores.
Examples of store attributes commonly identified include 35
dimensions grouped into nine categories: merchandise, service,
clientele, physical facilities, convenience, promotion, store
29
atmosphere, institutional attributes, and posttransaction satisfaction
(Lindquist 1974-75). Researchers assume consumers rely on these
attributes to form overall impressions of the outlet or an image. As
store image is implicitly linked to a retailer's attributes, it is not
surprising research investigations have failed to account for variation
in patronage by relying solely on these variables.
The ability to identify important attributes is difficult since
attributes differ by type of store, consumer segment and type of product
(Hansen and Deutscher 1977-78). It is also reasonable to assume these
attributes are subject to change and may be somewhat unstable. As
Mason, Durand and Taylor (1981) note, if a stable and generalizable
model of patronage is to be developed, the antecedents to these traits
must be identified.
In an effort to discover how consumers develop or derive the set
of attributes they deem important, Mason, Durand and Taylor (1981)
postulate personal values to be an antecedent variable. Their proposed
model hypothesizes values to affect shopping orientation both directly
and indirectly through life styles. Shopping orientations are then
proposed to influence attribute importance ratings directly as are
terminal and instrumental values. Path analysis revealed weak
relationships among the variables with shopping orientations and values
measures explaining 34 percent of the importance of any attribute. Life
style explained a maximum of 43 percent of the variation in shopping
orientation.
Although Mason, Durand and Taylor (1981) did not find the
empirical support they were seeking, the marginal usefulness of values
30
in explaining attribute importance suggests stable internal
characteristics of individuals may be useful in predicting patronage
behavior. Additional research is warranted to identify possible
antecedent variables of determinant attributes. Since attribute
importance may change, knowledge of specific individual characteristics
which shape attribute importance perceptions will aid management in its
efforts to influence long-term consumer patronage behavior. Further,
explication of important individual difference variables will provide
much needed theoretical development to models of patronage.
Store Loyalty
Whether concerned with marketing a product or a retail outlet,
management attempts to nurture an ever increasing group of loyal
consumers. Store loyalty denotes an individuals' pledge to continue
shopping or a preference to patronize a particular retailer. It has
been suggested that store loyalty for a retailer is perhaps the single,
most important concept in terms of determining ability to survive and
indicates the retailers' competitive advantage (Samli and Sirgy 1981).
If retailers could determine the nature and degree of loyalty, attempts
could be made to segment markets more carefully and/or manipulate store
image accordingly.
Store loyalty is often measured as frequency of shopping visits to
a particular retailer, propensity to "shop around", or willingness to
visit a particular retailer when the need arises (Bellenger, Steinberg
and Stanton 1976). The problem of defining loyalty arises when trying
31
to delineate cut-off points between loyal and non-loyal behavior.
Further, loyalty may be only a manifestation of an individuals behavior
and n o t a representation of their devotion to patronize a given
retailer.
For example, an individual may report a large number of visits to
a particular retailer - which might be evidence of loyalty. However,
the individual may not internalize the behavior to be an indication of
their preference or devotion to the retailer. They may visit because
the retailer has a convenient location, their knowledge of the store
reduces shopping time and frustration, or any number of reasons.
To understand this concept, the determinants of loyalty and also
an individual1s behavior with regard to other retailers in a dynamic
environment must be understood. To assume frequency of purchase, or
willingness to visit a particular retailer is evidence of loyalty is
naive and ignores the possible myriad of processes an individual
exhibits. The construct as measured might more appropriately be termed
"experience" as an individual’s interactions with various retailers
results in knowledge and skills which may be related to future patronage
behavior.
Measures employed to assess "loyalty" more accurately define an
individuals experience with retailers. Further, these measures may also
assess elements of variety seeking behavior (propensity to shop around),
or a need for simplicity in decision making or a routinized response
behavior (frequency of visits and willingness to patronize). It is
reasonable to assume individuals past experience with the retail
community will exert influence on their future patronage behavior and
32
will shape their choice sets. Moreover, experience results in knowledge
regarding generalized information of the purchase process, specific
retailers, and retailer's characteristics which will also influence
patronage behavior.
Socialization
Socialization refers to the process by which persons acquire the
knowledge, skills, and dispositions that make them more or less able
members of their society (Brim and Wheeler 1966). Primary antecedents
in the socialization models are social/structural variables and
developmental/experience variables (Moschis and Churchill 1978).
Social/structural variables which may influence patronage include
socioeconomic variables such as occupation, income, sex, and ethnicity
(Bellenger and Moschis 1982). Developmental variables may also impact
patronage. As reported by Bellenger and Moschis (1982) experience, age,
and life cycle have been found to have some effect on cognitive
orientations toward shopping.
In the context of consumer retail patronage behavior,
socialization refers to the process individuals undergo in their
cognitive and behavioral interactions with retailers and the fact that
these patterns are learned and may change over a person's lifecycle.
Consumer retail socialization has been studied regarding adolescents'
acquisition of market-related skills (MacNeal 1969; Wells 1966) as well
as adults' (Bellenger and Moschis 1982; Darden, Darden, Howell, and
Miller 1981).

33
In patronage models incorporating socialization, this variable is
seen to have an indirect influence on choice through individual's values
and shopping orientation (Darden et al. 1981), individual's cognitive
orientation toward stores and shopping, their evaluation of retailer
attributes, and development of store image perceptions (Bellenger and
Moschis 1982). A major limitation of these models is socialization
agents and variables exert influence on variables which are determinants
of patronage, not patronage directly.
An adequate understanding of the relationship between
socialization agents and patronage can best be determined by studying
long-term behavior of individuals. Additional information should be
obtained regarding persons' interactions with others and occurring
changes in their lives. Examining certain social or developmental
variables with regard to an individual's outlet choice can provide only
associative evidence concerning consumer socialization and its impact on
patronage. At best, these models provide descriptive evidence that
retail choice behavior may differ for individuals of different ages,
life cycle, occupational status, income, sex, or ethnicity.
Since socialization agents are proposed to impact perceptions of
retailer attributes directly and patronage indirectly, knowledge
regarding how determinant attributes are formed and their antecedents
would provide a basis for evaluating and measuring socialization
effects. As will be discussed in a later section of this chapter, a
persons' motivation to shop is proposed to form the basis for the
derivation of important retailer attributes. These attributes are then
used to compare retailers and make patronage decisions among the
34
retailing community.
These motivations are proposed to represent underlying needs and
wants which direct individuals to interact with the retailing
environment. Further, it is likely that motivations may be influenced
by both social and developmental agents. For example, through repeated
and learned shopping experiences, persons may recognize or realize the
fulfillment of certain needs and desires - such as one's need to
affiliate with others. At times of loneliness or when individual's
experience a desire to be around others, they may satisfy this need by
going shopping. The individual was socialized to perceive the retail
atmosphere as conducive to many types of interpersonal interaction
whereby he could feel positive about their contacts with others. By
assessing motivations researchers may be able to capture the influences
certain socialization agents exert on the consumer.
Shopping Orientation
The concept shopping orientation was introduced in the seminal
work of Stone (1954). Individuals were classified into groups based on
their responses to the question "why would you rather do business with
local independent merchants (or large chain stores, depending on a prior
choice)?" Four basic patterns of consumer shopping behavior were found:
economic, personalizing, ethical, and apathetic.
In Stone's (1954) typology, orientation refers to the "theme
underlying the complex of social roles performed by an individual. It
is the (tacit or explicit) theme which finds expression in each of the
35
complex of social roles in which the individual is implicated" (1954, p.
37). Since the publication of this work, much empirical research has
been conducted in the area of shopper typologies and its relationship to
consumer patronage behavior (e.g. Bellenger, Robertson and Greenberg
1977; Darden and Ashton 1974-75; Darden and Reynolds 1971).
Although research investigating consumer typologies has continued
for the past 30 years, little is known about the importance of shopping
orientation to consumer retail patronage behavior. This lack of
knowledge exists primarily because researchers have failed to define and
measure shopping orientation in the same manner. Stone's (1954)
conceptualization of orientation denoted a classification based on an
individuals behavior toward retailers and a recognition of store
attributes which were deemed of value. In this manner, shopping
orientation is nothing more than an individual's recognition that
certain retailer characteristics are important to her and are utilized
to discriminate among various retailers.
Darden and Reynolds (1971) interpreted Stone's shopper
orientations as equivalent to shopping p e r s o n a l i t i e s and constructed a
20 item scale to measure them. This definition implicitly gives new
meaning to the term shopping orientation as proposed by Stone (1954).
Personality makes reference to an internal state of being rather than
overt behavior manifested in retail choice.
Shopper taxonomies have been proposed for individual product
classes (Moschis 1976), broad product assortments (Darden and Ashton
1975), shopping centers (Bellenger, Robertson and Greenberg 1977), and
shopping as a general activity (Bellenger and Korgaonkar 1980). These
36
classifications have been based on a variety of different forms of
shopper response: store attribute importance ratings (Darden and Ashton
1974-75), store image characteristics (Williams, Painter and Nicholas
1978), psychographic scales measuring attitudes, interests, and opinions
(AIO) (Crask and Reynolds 1978; Darden and Ashton 1974-75; Darden and
Reynolds 1971; Mason, Durand and Taylor 1983; Moschis 1976), and global
expressions about shopping (Bellenger and Korgaonkar 1980). Typologies
were then developed by grouping individuals who were similar on the
measured dimension.
Given such diversity in methodology and research setting, a number
of typologies have been proposed. As noted by Westbrook and Black
(1985), only a few shopper types appear consistently across studies:
the economic, social, and apathetic shoppers. These researchers state
generalizations about shopper types would be improved were investigators
to employ consistent conceptual definitions and methodologies. Further,
generalizations regarding shopper typologies cannot be made since
researchers have relied on indirect indicators of shopping orientations.
The relationship between shoppers' underlying orientation and their
responses to generalized AIO statements or attribute ratings may not be
as high as commonly assumed (Westbrook and Black 1985).
This methodology represents a "backward" attempt to measure an
individual's underlying orientation to shop. These studies utilize
indirect measures of orientations to profile respondents into distinct
types that purport to indicate their underlying orientation to shop.
The shopping orientations inferred may be considered similar to the
concept of shopping motivations, as will be discussed in greater detail
37
in a later section of this chapter. If a consumer's underlying
motivations to shop can be studied directly, then typologies of
consumers can be developed based on direct measures rather than the
indirect measures employed by orientation researchers.
Summary of Consumer Patronage Research
As evidenced by this brief review of selected topics in patronage
research, the extent of empirical knowledge is overwhelming both in the
amount of research on the topic and also the la c k of theory development
in the area. Many researchers have noted this void and begged that
additional studies be conducted which might integrate concepts and work
toward developing a theory of patronage behavior or at least a thorough
conceptual model (Rosenbloom and Schiffman 1981; Sheth 1983).
The primary thread linking patronage research together is the
pervasiveness of determinant store attributes. In all models discussed,
a major assumption is consumers utilize retailer attributes in some way
to discriminate among outlets and to aid in retail selection decisions.
Whether research has as its focus to describe the patronage behavior of
individuals or to explain differences across consumers, attribute
importance perceptions or rankings are often obtained.
As mentioned, problems arise in linking attributes to choice
behavior since attributes may change over time and might be regarded as
unstable. Therefore, attention must be placed on delineating specific
individual characteristics which influence attribute importance rankings
and form image perceptions. Consumer shopping motivations are proposed
38
to provide conceptual clarity to patronage research by wielding both a
direct and indirect influence on patronage behavior. Motivations are
suggested to be antecedent to the development of determinant attributes
and relatively stable over time.
Consumer shopping motivations direct individuals to search for
retailers who can provide specific satisfactions. Individuals not only
shop to obtain a product but may engage in shopping behaviors to
alleviate loneliness, reduce boredom, escape from everyday tasks, reduce
tension, or any number of reasons. A retailer's characteristics are
used both by the retailer and the consumer as a way to differentiate or
distinguish the outlet from others. In fact, retailers regard these
attributes as fundamental to their marketing strategy. When looking for
ways to satisfy the needs of its target market, retailers invariably use
some unique combination of outlet characteristics to entice customers
and gain their patronage. Consumers use retailer characteristics as a
basis for comparing two or more retailer alternatives and ensuring that
the one(s) chosen will most likely satisfy their needs.
When the retailer gears its strategy toward satisfying consumer
needs, it is appealing to their motives (Berman and Evans 1989). Retailers who are capable of addressing the needs of their target market
will find customers to be more motivated (likely) to patronize them.
For example, much has been written about the "time poor" consumer.
These persons are described as being devoted to their job and family but
experience a shortage of time with which to engage in leisure activities
or shopping behaviors.
Retailers can respond to this segment by placing greater emphasis

39
on service, convenience, quality products and knowledgeable sales
personnel. These individuals are interested in obtaining the products
they want without wasting time over the decision. Therefore, they are
not interested in devoting time to comparing prices and finding the best
buy. Retailers who wish to attract this segment, should maintain a
convenient location with accessible parking, stress knowledgeable sales
personnel, quality products, and offer somewhat higher prices. These
consumers will pay a premium for the convenience and expertise of the
services provided.
Omitted Constructs
Research in patronage has also ignored several factors which may
exert an influence on retail outlet choice behavior. Specifically, the
level of involvement individuals have with either a product or the
process of shopping is likely to affect their outlet choice behavior.
Involvement with a product such as cars, for example, may lead an
individual to subscribe to car magazines, belong to a car club, or visit
car showrooms on a continuous basis without any intention to purchase
(Richins and Bloch 1986). Also, individuals who are involved with
shopping as an activity may spend large amounts of time browsing in
shopping malls, looking through catalogs, watching cable shopping,
without any defined product purchase.
Similar to shopping motivation, product and shopping process
involvement may be a critical link to the formation of determinant
attributes and choice behavior. Individuals who are involved with a
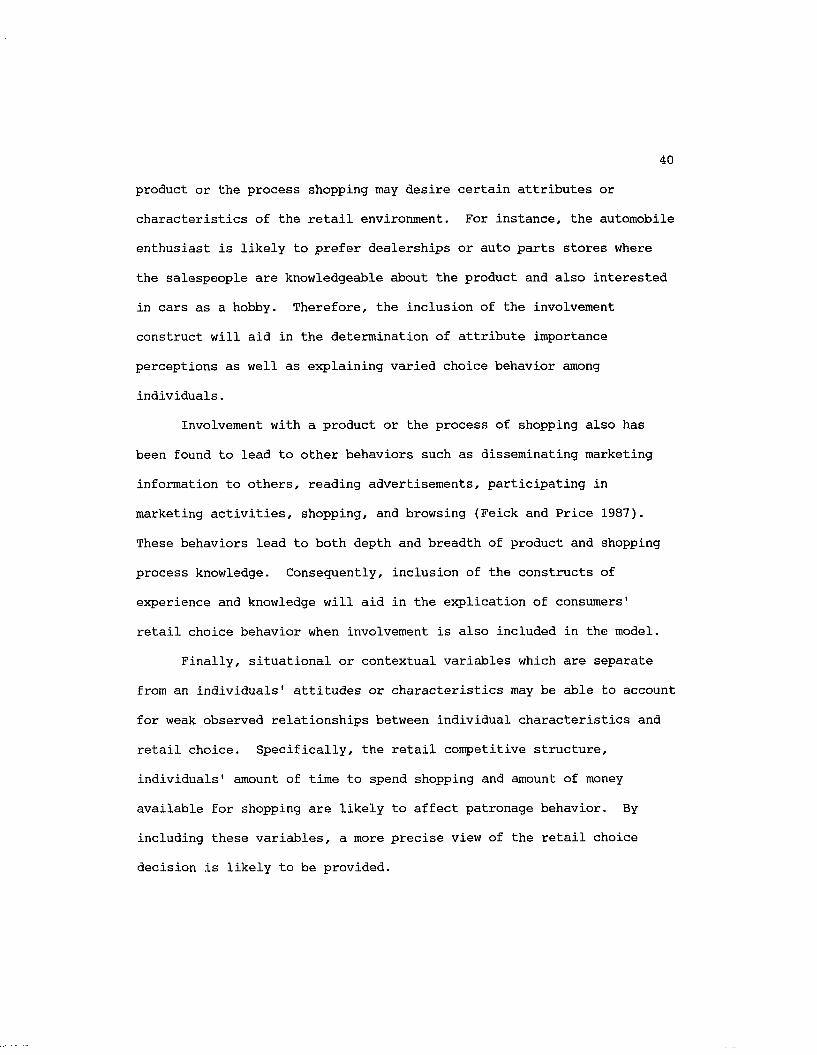
40
product or the process shopping may desire certain attributes or
characteristics of the retail environment. For instance, the automobile
enthusiast is likely to prefer dealerships or auto parts stores where
the salespeople are knowledgeable about the product and also interested
in cars as a hobby. Therefore, the inclusion of the involvement
construct will aid in the determination of attribute importance
perceptions as well as explaining varied choice behavior among
individuals.
Involvement with a product or the process of shopping also has
been found to lead to other behaviors such as disseminating marketing
information to others, reading advertisements, participating in
marketing activities, shopping, and browsing (Feick and Price 1987).
These behaviors lead to both depth and breadth of product and shopping
process knowledge. Consequently, inclusion of the constructs of
experience and knowledge will aid in the explication of consumers'
retail choice behavior when involvement is also included in the model.
Finally, situational or contextual variables which are separate
from an individuals1 attitudes or characteristics may be able to account
for weak observed relationships between individual characteristics and
retail choice. Specifically, the retail competitive structure,
individuals1 amount of time to spend shopping and amount of money
available for shopping are likely to affect patronage behavior. By
including these variables, a more precise view of the retail choice
decision is likely to be provided.
41
Proposed Patronage Model
Figure 2.1 depicts the proposed patronage model. Specific
explication of model relationships and hypotheses is provided later in
this chapter. However, a brief summary of the constructs and their
relationships is presently provided. Construct definitions, references
and support for each construct and prior studies where the construct has
been applied in a patronage context are given in Table 2.1.
Motivations
Consumer shopping motivations are proposed to affect patronage
behavior both directly and indirectly through the formation of
determinant attributes. While this explication is expected to provide a
sound theoretical base to patronage research, it is proposed that other
variables may also influence consumers' patronage behavior.
Involvement
One construct which has received increasing attention in the
marketing literature is the role of involvement in consumer behavior
(c.f. Bloch 1981; Kassarjian 1981; King, Ring and Tigert 1980; Richins
and Bloch 1986; Slama and Tashchian 1985). Both product and shopping-
process involvement are expected to influence patronage behavior.
Consumers1 involvement with products as well as the activity of shopping
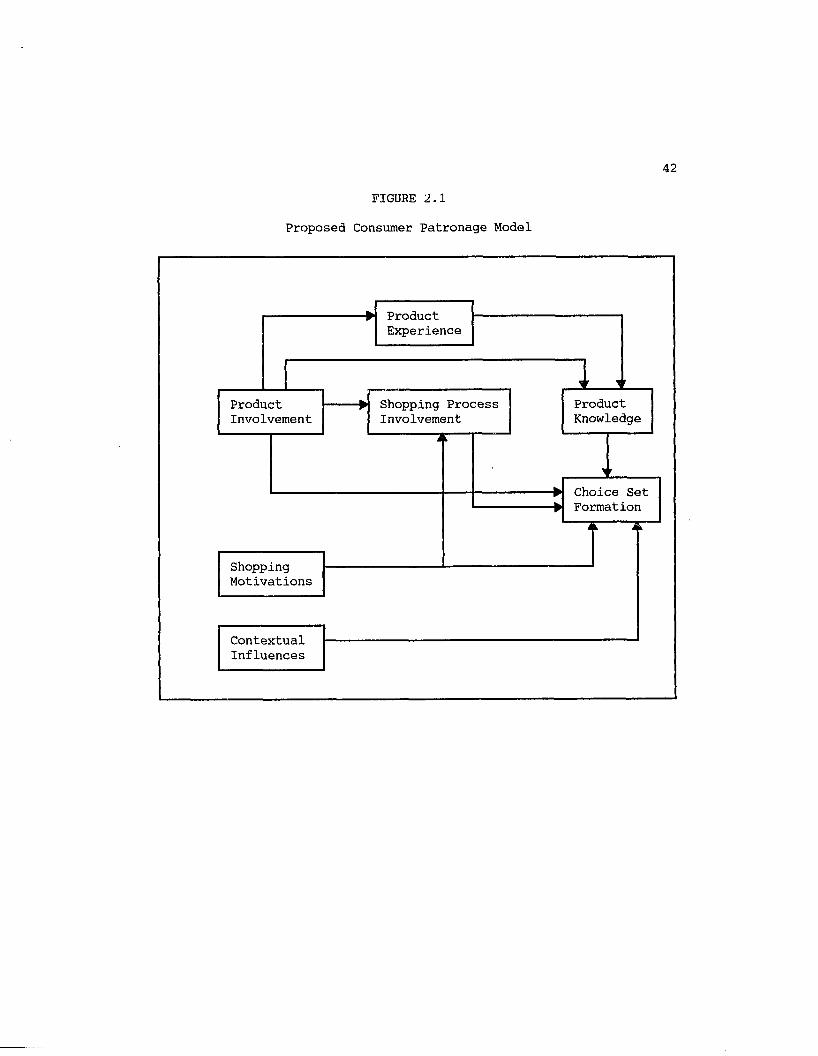
42
FIGURE 2.1
Proposed Consumer Patronage Model
ProductKnowledge
ProductExperience
Choice Set Formation
ProductInvolvement
ShoppingMotivations
ContextualInfluences
Shopping Process Involvement

43TABLE 2.1
Conceptual Definitions and Support of Constructs
ConstructConceptualDefinition
ConceptualSupport
Prior Patronage Studies Employed
ShoppingMotivation
- Unobservable inner force(s) that stimulates and compels an individual to interact with the retailing community and provides direction to his/her behavior.
Bayton (1958) Maslow (1974) McGuire (1974) McGuire (1976)
Stone (1954) Tauber (1972) Westbrook and Black (1985)
EnduringProductInvolvement
- An ongoing concern with a product that transcends situational influence.
Bloch (1981)Laurent and Kapferer (1984)
Richins and Bloch (1986) Houston and Rothschild (1978; 1979)
King, Ring and Tigert (1983)
Shopping-ProcessInvolvement
- An ongoing concern with shopping as an activity.
Kassarjian (1981) Slama and Tashchian (1985)
Experience - The sum total of the knowledge and skills acquired through interaction with retailers.
Bellenger, Steinberg, and Stanton (1976)
Knowledge - The information a consumer gains from using or learning about a product or engaging in interactions with retailers.
Bettman and Park (1980a) Johnson and Russo (1981) Marks and Olson (1981) Mitchell (1982)Park (1978)
AttributeImportance
- Specific retailer characteristics which are deemed important to the consumer and used to discriminate betweer alternative retailers.
Myers and Alpert (1968)
i
Achabal,Kriewall and McIntyre (1977)
Arnold, Ma and Tigert (1978)
Choice Set Formation
- The many and varied retail alternatives available to individuals and the construction of categories of retailers: awareness, consideration, action, and outlet choice.
Brisoux and Black (1987) Laroche (1980) Spiggle and
Howard (1963; 1977) Sewall (1987) Narayana and Markin (1975)Potter (1979)Sheppard (1978)
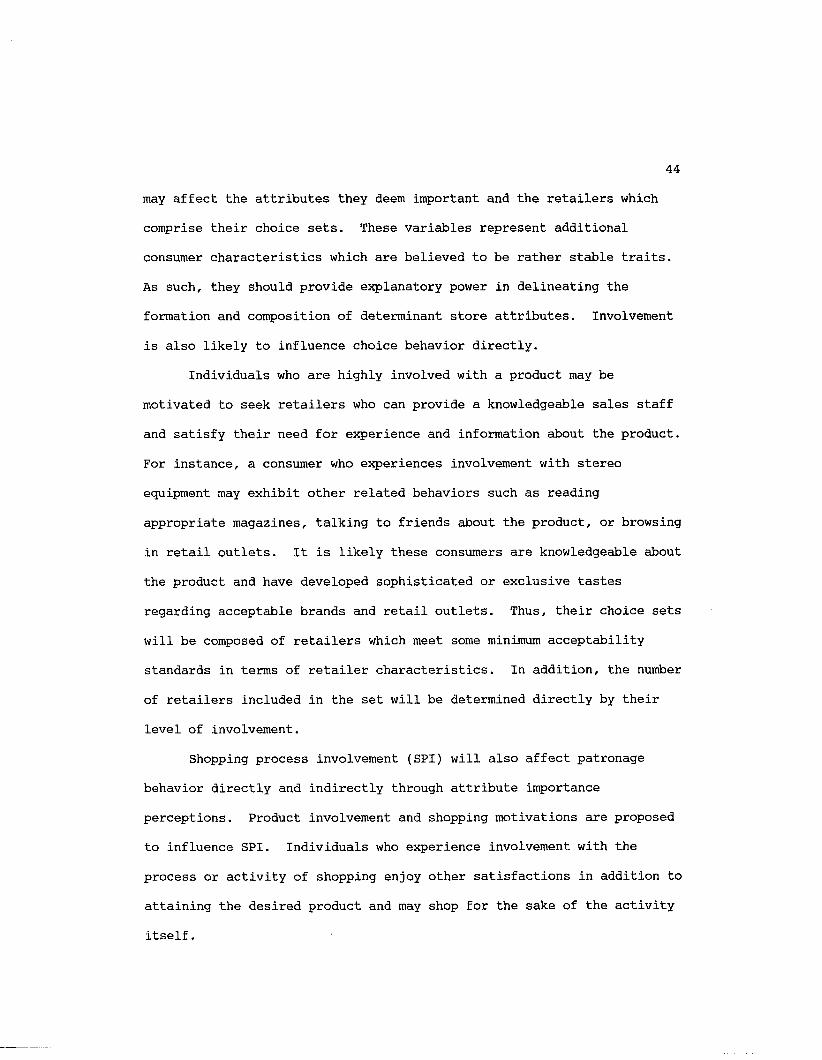
44
may affect the attributes they deem important and the retailers which
comprise their choice sets. These variables represent additional
consumer characteristics which are believed to be rather stable traits.
As such, they should provide explanatory power in delineating the
formation and composition of determinant store attributes. Involvement
is also likely to influence choice behavior directly.
Individuals who are highly involved with a product may be
motivated to seek retailers who can provide a knowledgeable sales staff
and satisfy their need for experience and information about the product.
For instance, a consumer who experiences involvement with stereo
equipment may exhibit other related behaviors such as reading
appropriate magazines, talking to friends about the product, or browsing
in retail outlets. It is likely these consumers are knowledgeable about
the product and have developed sophisticated or exclusive tastes
regarding acceptable brands and retail outlets. Thus, their choice sets
will be composed of retailers which meet some minimum acceptability
standards in terms of retailer characteristics. In addition, the number
of retailers included in the set will be determined directly by their
level of involvement.
Shopping process involvement (SPI) will also affect patronage
behavior directly and indirectly through attribute importance
perceptions. Product involvement and shopping motivations are proposed
to influence SPI. Individuals who experience involvement with the
process or activity of shopping enjoy other satisfactions in addition to
attaining the desired product and may shop for the sake of the activity
itself.

45
Product Experience and Knowledge
The model proposes persons' product experience to result in
knowledge and skills which may be related to future patronage behavior.
For instance, experience with stereo equipment may be obtained through
owning a unit, browsing in stereo shops, reading pertinent magazines,
talking with friends or coworkers, etc. As persons acquire additional
experience with the product they gain knowledge. The model proposes
this knowledge to be an important determinant to patronage as these
highly knowledgeable individuals will have skills in locating an
acceptable retailer.
Contextual Influences
The final construct proposes contextual influences to directly
affect patronage behavior. These influences which include the amount of
time an individual has to shop, the amount of money available for
purchases, and the selection of retailers in the area. These factors
may directly affect the formation and composition of consumers' choice
sets. These variables are important because they may be able to account
for differences in consumer's actual retail interaction and their
desired levels of interaction.
For example, some consumers may exhibit low levels of shopping
activity although they are involved with shopping or a specific product.
A possible explanation is they may not have the time or the money they
desire to devote to shopping or purchasing (Belk 1975; Berkowitz,
Walton, and Walker 1979). They may also feel retailers available to
them are inadequate for their purposes and thus engage in lower levels
of interaction with retailers in the area (Bucklin 1967; Sturdivant
1970).
Model constructs will be reviewed in later sections of this
chapter. The remainder of this chapter will be divided into three major
sections. Motivation research and the proposed shopping motivation
construct will be reviewed first followed by a discussion of other
antecedent variables. Research on choice set formation will conclude
the literature review section of this chapter. The chapter concludes
with the presentation of specific hypotheses to be tested by the
dissertation.

47
Motivation Research
McClelland (1955) prefaces his text on motivation by writing "The psychology of motivation is in its infancy. In fact, it can hardly be
said to exist as a separate discipline or field of study within
psychology today" (1955, p. v). Were McClelland alive today, he would
find quite a different state of affairs as the field of motivation has
received extensive interest from various disciplines. Anthropologists,
sociologists, biologists, management scientists, and marketers, are just
a few examples of the fields which have incorporated research on
motivation into their major field of study.
The term "motivation" was originally derived from the Latin word
movere, which means "to move" (Steers and Porter 1983). Motivation
research is concerned with the question of why people behave as they do.
A motive is a construct representing an unobservable inner force that stimulates and compels a behavioral response and provides specific
direction to that response (Madsen 1968). Definitions of motivation
appear to have two common denominators which may be said to characterize
the phenomenon of motivation: (1) what energizes human behavior; and
(2) what directs or channels such behavior.
Motivation is viewed as an inner force and is commonly referred to
as an urge, wish, feeling, need, or more appropriately motive (Coffer
and Appley 1964). The word force implies a dynamic, active nature as
well as the power and ability to stimulate and compel behavior. When
individuals are motivated, their physical and/or mental systems are
activated. Since individuals behavior is directed toward something, a

48
goal orientation is implied. Individuals use goal-directed behavior to
resolve problems and fulfill personal needs. For motivation to be
useful in marketing practice or research, it must be understood what
motives (inner forces) stimulate what types of behavior (direction) and
how these motives and behaviors are influenced by the specific
situations in which consumers engage in goal-directed behavior (Hawkins,
Best and Coney 1983).
For the researcher interested in consumer patronage behavior, an
understanding of consumers' inner drives (motives) which give rise to
varied behavior reflected in their interactions (direction) with the
retail community is of prime importance. From a patronage perspective,
the question becomes why do people choose to patronize certain retailers
and not others? In order to answer this question, consumers' underlying
shopping motivations must be discerned and an understanding of their
goal orientation obtained.
For example, consider consumer motives in the purchase of
clothing. At one level, many clothing purchases are partly motivated by
a base need to obtain the product since in our society, clothing is
required. In addition, consumers may be motivated to purchase clothing
that expresses or symbolizes status because of an inherent need to
express that part of themselves to others. Alternatively, individuals
may purchase clothing that helps to make them more comfortable in the
group in which they belong or desire to belong.
Just as consumers can have inner drives which guide their behavior
in the purchase of products, they may also have motives which direct their retail choice behavior - or choice of stores. Tauber (1972)

49
recognized individuals may shop for other purposes than to merely obtain
a product. He noted that assuming the shopping motive is a simple
function of the buying motive is inadequate in explaining why people
shop.
This section will present a brief review of selected theories of
motivation, applications to consumer patronage behavior, and a proposed
structure of consumer shopping motivation.
Theories of Motivation
There are many theories of motivation which demonstrates
motivation is an important concept in modern research. It is not
possible to understand, explain or predict human behavior without some
knowledge of motivation - the driving force behind behavior. But the
importance of motivation coupled with the existence of many different
theories creates a major problem for researchers. Which theory or
combination of theories best describes the problem at hand? A brief
history of motivation theories followed by a discussion of theories
which are applicable to consumer patronage behavior is warranted.
Instinct Theories. The evolution of motivational psychology can
be traced to the conception of "instinct" where instincts explained the
almost rational behavior of animals which were not supposed to possess
faculties for reasoning or thinking. But instincts were supposed to
have inbuilt "driving forces" of their own (Madsen 1974). Thus this
concept conceived of instincts as having both dynamic and directive
effects which is common to our theories of motivation. Also associated
50
with instinct theories is the concept of unconscious motivation. Freud
(1916) postulated individuals were not always aware of all their desires
and needs. Further, a major factor in human motivation was a result of
forces unknown to the individual himself. These theories persisted
until the early 19201s when it was attacked by those who questioned
whether motives were unconscious, instinctual or learned behaviors.
Drive and Reinforcement Theories. Researchers who have been
associated with drive theory typically base their work on the influence
that learning has on subsequent behavior. Drive theories generally
assume decisions concerning present behavior are based in large part on
the consequences, or rewards, of past behavior (Steers and Porter 1983).
Past learning is seen as a principal causal variable of behavior.
Theorists became concerned with understanding the driving forces of
behavior as well as predicting the direction of behavior.
Reinforcement theorists place total emphasis on the consequences
of behavior rather than internal need states (drives) of the individual.
Behavior is distributed across classes of responses as a function of the
contingencies of reinforcement of those responses. Positive reinforcers
strengthen and make more probable, the responses which immediately
precede these consequences in a particular situation. These theories
ignore the inner state of the individual and concentrate solely on the
consequences of their action. Thus, it is concerned primarily with the
second component of motivation: the question of what controls behavior
- or the direction of behavior.
Cognitive Theories. The third major school of thought in
approaches to motivation is the cognitive view. Cognitive theorists
51
believe a major determinant of behavior are the beliefs, expectations,
and anticipations individuals have concerning future events. Behavior
is viewed as purposeful and goal-directed and based on conscious
intentions. In general, cognitive theories, or expectancy/valence
theories view motivational force as a multiplicative function of two key
variables: expectancies and valences. Expectancy theory states the
desire or motive to engage in a certain behavior is a composite of the
expected outcome of that behavior and the value or evaluation of that
behavior (Tolman 1951).
Tolman (1951) identified three types of mediating variables:
need, belief and value. The level of these constructs at a point in
time is said to determine the magnitude of a performance tendency which
immediately precedes and is directly related to overt performance.
Tolman operationally defined need as "the propensity of an individual to
perform a characteristic type of consummatory response" (1951, p. 362).
The response is defined in terms of the goal which satisfies it.
Associated with each need is a value - positive or negative valence
which is placed on the outcomes of the behavior. The belief construct
accounts for the expectation that performing a particular behavior with
respect to a need state will lead to goal attainment.
Summary■ When researchers first became intrigued with
understanding the behavior of animals and man, instinctual theories were
proposed. These instincts to satisfy certain needs directed persons to
engage in certain types of behavior. As motivation research became more
sophisticated and as learning theory began to develop, reinforcement
theories of motivation were proposed to account for why individuals
52
behave as they do. Finally, cognitive theories recognize individuals
are moved to engage in certain behaviors so that specific goals may be
attained. They are further guided by the types of outcomes they will
receive (valence).
Instinctual models are inadequate as they ignore the rational and
cognitive side of human nature. People do have the capacity to think
and are not totally guided by base drives. The reinforcement theorists
ignore the drives of the individual and assume people behave as they do
as a result of various consequences. The cognitive theories recognize
that human behavior is often motivated by needs and is goal directed.
Further, both positive and negative outcomes may be associated with the
enactment of behavior which is expected to fulfill their needs.
Just as there has been an evolutionary process in psychological
theories of motivation, there have also been major developments in the
way marketing researchers and practitioners approach motivation in
attempting to understand the behavior of consumers. With these major
psychological theories in mind, the remainder of this section will
discuss and review some of the approaches to understanding the motives
underlying consumer behavior.
Motivation Taxonomies
For many years, psychologists and others interested in human
behavior have attempted to develop exhaustive lists of human needs or
motives. These lists have proven to be as diverse in content as they
are in length. Probably the most frequently used system of human

53
motivation was proposed by Murray (1965). Murray believed everyone has
the same basic set of needs. He describes 28 basic psychogenic needs,
including such well-known ones as achievement, affiliation, power, and
abasement and groups them into six classes.
Bayton (1958) proposed a tripartite classification of motives:
affectional needs, ego-bolstering needs, and ego-defensive needs.
Affectional needs are described as needs to form and maintain warm,
harmonious, and emotionally satisfying relations with others. Ego-
bolstering needs are needs to enhance or promote the personality or
achieve, gain prestige, or recognition. Ego-defensive needs are needs
to protect the personality, avoid physical and psychological harm.
While some have proposed individuals have different need
priorities based on their personality or environment, others contend
individuals rank or prioritize needs with regard to their basic needs.
Maslow (1970) proposed a hierarchical structure of needs in which
satisfaction of lower level needs leads to activation of higher order
needs in the hierarchy.
In the hierarchy of needs theory, the first and most basic level
of needs is physiological and are required to sustain biological life.
These needs include food, water, air, shelter, clothing, and sex. After
the first level of needs is satisfied, safety and security needs become
prominent. These include stability, routine, familiarity and certainty
needs. The third level includes needs such as love, affection,
belonging, and acceptance and are termed social needs. Once social
needs are satisfied, egoistic needs become the driving force behind an
individual's behavior. Examples of ego needs include an individual's
54
need for achievement, personal satisfaction, status, success, and
independence. The final level in the hierarchy is concerned with one's
need for self-actualization or self-fulfillment.
McGuire (1974) developed a motive classification system which is
more specific than Maslow's. Basically, a detailed set of motives is
provided that coincide with Maslow's social and ego needs. McGuire
presents a system of 16 motives divided based on four criteria. The
first division among the motives is between cognitive and affective
types. Cognitive motives are driving forces of the personality that
stress a persons' need for being adaptively oriented toward the
environment and for achieving a sense of meaning. Affective motives
stress individuals need to reach satisfying feeling states and attain
emotional goals.
Cognitive and affective motives are further subdivided into those
which stress an individual striving to maintain equilibrium versus those
dealing with a person's desire for further growth. McGuire next divides
each class on the basis of two further dichotomous dimension. The third
basis for division is whether the person's behavior is actively
initiated or represents passive response to circumstances. The final,
fourth dichotomy is based on whether motives are directed toward
achieving a new internal state or a new external relationship to the
environment (McGuire 1976). These four dichotomies generate a matrix of
16 cells, representing motives which are shown in Table 2.2.
Although McGuire (1974) distinguishes between these 16 motives,
there is actually quite a bit of overlap between them and some are at
different levels of abstraction. As mentioned, these motives correspond

55TABLE 2.2
A Structuring of 16 General Paradigms of Human Motivation1
Initiation ACTIVE PASSIVE
Orientation
Internal External Internal External
Stability
C Preser Consistency Attribution Categori Objectifi0 vation zation cationGNITIV Growth Autonomy Stimulation Teleological UtilitarianE
A Preser Tension-F vation Reduction Expressive Ego-Defensive ReinforcementFECTIV Growth Assertion Affiliation Identifi ModelingE cation
1 Adapted from McGuire (1976, p. 316)

56
to Maslow's ego and social needs although the stimulation and expressive
theories represent an individual's desire to have varied experiences and
enjoy life — or experiential needs. The functional motives commonly
thought of in patronage as utility maximizing or optimizing, are
subsumed in the utilitarian theories which view the individual as a
problem solver seeking opportunities to acquire information or skills to
cope more effectively with life's challenges.
These motives can more effectively be classified into three basic
groups: those dealing with needs for utility optimization or
maximization, social and ego-enhancement needs, and needs to experience
life through cognitive and sensory stimulation. As the theories McGuire
presents as motivational bases are quite related, they will be
conceptualized using this tripartite classification scheme rather than
the 16 presented by McGuire for the purposes of this research.
Motivation and Marketing
As psychologists and others have attempted to understand the cause
and direction of individuals behavior, so too have marketers. As
discussed, motivation represents a driving force within individuals
which impels them to action. This force is produced by a state of
tension, which exists as a result of unfilled needs. Following from
Cannon (1939) individuals strive to reduce the discrepancy between their
present state and desired state. They are moved to engage in behavior
which they anticipate will enable them to achieve their goals. The
specific goals they select and the patterns of behavior produced are the
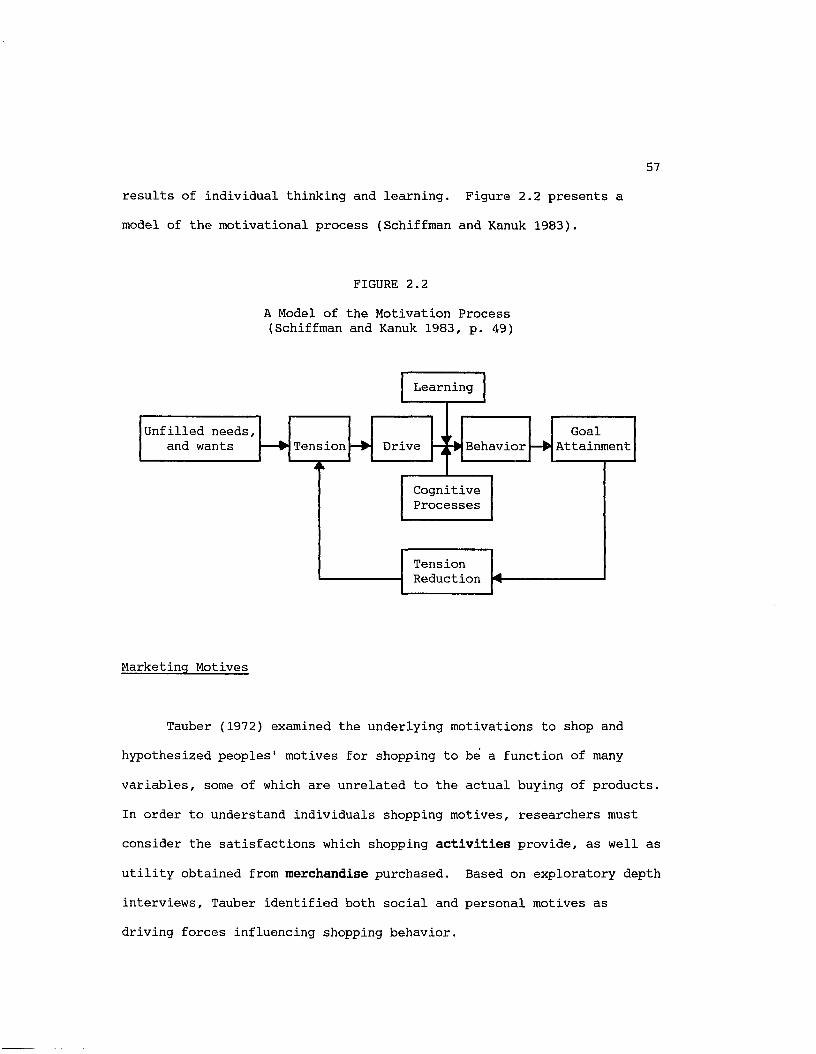
57
results of individual thinking and learning. Figure 2.2 presents a
model of the motivational process (Schiffman and Kanuk 1983).
FIGURE 2.2
A Model of the Motivation Process (Schiffman and Kanuk 1983, p. 49)
Learning
Tension Drive BehaviorGoal
Attainment
TensionReduction
CognitiveProcesses
Unfilled needs, and wants
Marketing Motives
Tauber (1972) examined the underlying motivations to shop and
hypothesized peoples' motives for shopping to be a function of many
variables, some of which are unrelated to the actual buying of products.
In order to understand individuals shopping motives, researchers must
consider the satisfactions which shopping activities provide, as well as utility obtained from merchandise purchased. Based on exploratory depth
interviews, Tauber identified both social and personal motives as
driving forces influencing shopping behavior.
58
Hypothesized social motives include a need to interact with others
outside the home, communicate with others who have similar interests,
affiliation with reference and peer groups, obtaining increases in
social status, and achieving success in bargaining and negotiation.
Personal motives include opportunity to engage in a culturally
prescribed role, diversion from daily routine, provision of self-
gratification, learning about new trends or innovations, obtaining
physical exercise, and receiving sensory stimulation.
If the shopping motive is a function of the buying motive, the
decision to shop will occur when a persons' need for particular products
becomes sufficiently strong that time, money and effort are allocated in
visiting a retailer. However, other motives may also exist which
suggests that a person may go shopping when he "needs attention, wants
to be with peers, desires to meet people with similar interests, feels a
need to exercise, or has leisure time" (Tauber 1972, p. 48). Consistent
with motivation theories, this discussion indicates that a person
experiences a need and recognizes that engaging in shopping behavior may
satisfy that need.
Westbrook and Black (1985) propose a taxonomy of shoppers based on
their underlying shopping motivation is appropriate to the development
of patronage research and of use to marketing practitioners. In
developing their classification of motives, Westbrook and Black reviewed
other classification schemes of motives and chose to use those proposed
by McGuire (1974) and Tauber (1972) as conceptual bases.
Shopping motivations have been proposed to represent relatively
enduring characteristics of individuals which manifest themselves in
59
consumer's interactions with retailers. Noting that consumers may be
usefully distinguished along dimensions of shopping motivation,
Westbrook and Black (1985) proposed seven major dimensions: (1)
anticipated utility, (2) role enactment, (3) negotiation, (4) choice
optimization, (5) affiliation, (6) power and authority, and (7)
stimulation. In an empirical study designed to test the hypothesized
dimensions of motivation, underlying motives were assumed to be
"indicated by the level of satisfaction received by consumers from
various outcomes and aspects of shopping behavior" (1985, p. 89).
This study represents the first empirical attempt to determine the
various motivational dimensions underlying consumer shopping behavior.
While Westbrook and Black (1985) found support for the existence of the
seven hypothesized motivational dimensions, they recommend additional
research be conducted to improve the measurement of shopping motivation.
Neglected Motives
The research conducted in the area of motivation is quite
extensive. Though many classifications of motives exist (e.g. Murray
1965; Maslow 1970; McGuire 1974; Tauber 1972; and Westbrook and Black
1985), the question remains whether all the underlying dimensions are
captured by the respective classifications. Further, while Westbrook
and Black (1985) examined the satisfactions associated with shopping and
then derived motivations, the question of why people shop or what motivates their interactions with retailers still remains to be
answered.
Although Westbrook and Black (1985) and Tauber (1972) suggest many
distinct shopping motivations, several motivations are neglected. The
first pertains to an individual's need to feel important and to be
treated well by others. Stone (1954) recognized that many consumers
view the retail interaction as highly personal and enjoy being treated
well by store personnel. It is highly likely that individuals who have
a need to "personalize" with others, will be driven to interact with
retailers who can provide the quality of service and care the individual
needs. Retailers seem to have recognized this need and is reflected in
their emphasis on service and customer satisfaction. Nordstrom's has
done such a good job in this area they are receiving accolades from the
retailing community and serve as role models for aspiring retailers.
There also seems to be a trend to provide "personal shoppers" and
"surrogate consumers" who assist customers in whatever they need
(Solomon 1986; Solomon 1987).
The classification schemes to date neglect individual's inherent
needs for arousal and variety. Individuals are often driven to engage
in varied or different behavior. The field of psychology has developed
an extensive research tradition on optimal stimulation patterns and
arousal seeking tendencies. Further, marketing academicians have
explored the relationship between variety seeking behavior and product
purchase (e.g. Lattin and McAlister 1985; Mehrabian and Russell 1974;
McAlister and Pessemier 1982; Raju 1980). Handelsman and Munson (1985)
explored the relationship between individual's variety drive and
retailer assortment decisions. They conclude knowledge of consumer's
variety drive can aid retailers in making assortment decisions. It is

61
reasonable to assume individuals may be able to fulfill this need for
variety through interaction with retailers. Specific retailer
interaction may indeed be sought so the goal of obtaining variety is
achieved.
A third motivational dimension neglected by previous research is
an individual's desire to engage in recreational activities as a way to
spend their leisure time. Although the society of today works hard,
they want to play hard too. For some consumers, shopping represents a
recreational activity and is viewed as a pleasant way for them to spend
their leisure time. Bellenger and Korgaonkar (1980) attempted to assess
the degree to which individuals considered shopping activity as
recreational. Although these researchers did indeed identify a segment
of consumers who could be regarded as recreational in nature, their
results must be questioned as a single item measure of shopping
enjoyment was employed.
Many individuals are motivated by a desire to be perceived by
others as belonging to a certain social class or having elevated status.
For these persons, the image they portray to others is very important as
well as how others perceive them. Our society has become increasingly
materialistic, and products and possessions have become status symbols.
It is believed that many are motivated by a need for prestige in which
certain products are sought or retailers patronized. Dawson (1988)
explored the prestige hierarchy for retail stores and discovered
individuals showed high levels of agreement in ordering or ranking
stores along prestige dimensions. Individuals desire for prestige
should be included as a possible shopping motivation base.
62
Other motivational bases were hypothesized by Tauber (1972) and
not investigated by Westbrook and Black (1985). These bases are an
individual's desire for physical exercise, the seeking of self
gratification, diversion from daily tasks, and a desire to learn about
new trends or innovations. It is believed these motivations should be
explored and tested empirically.
Proposed Motivation Structure
The present paper proposes a structure of shopping motivation
which attempts to further explicate the dimensionality of motivation and
identify possible gratifications from interactions with retailers that
drive an individual to action and toward goal attainment. The research
will employ the motivation paradigm of Schiffman and Kanuk (1983) and
regards the consumer as motivated to act when their current state is in
disequilibrium (experience unmet needs). An individual's past
experience (learning) and cognitive processes (expectancy-value
paradigm) direct their behavior which is expected to lead to goal
attainment (See Figure 2.2).
One should note this model is a synthesis of two primary theories
of motivation: drive and expectancy/valence theories. In a patronage
context, individuals are regarded as having unfilled needs. These
desires could be to obtain a specific product, gather information,
engage in a culturally prescribed role, elevate status perceptions, or
engage in physical exercise. The individual also has certain
expectations regarding how and in what manner these needs may be
63
satisfied. Ejqpectations are derived through cognitive processing or
learning. The individual then engages in interactions with a retailer
with the hopes that their needs will be met, thus goal attainment.
The present discussion suggests shopping motivation can be
usefully employed to understand why people shop and a basis for
understanding individual's drives leading to varied patronage behavior.
The shopping motivations of consumers is assumed to be a relatively
enduring trait of the individual and is therefore reflected in their
interactions with retailers. This research hypothesizes three major
dimensions of shopping motivation: (1) functional needs, (2) symbolic
needs, and (3) experiential needs (Park, Jaworski and Maclnnis 1986).
Functional needs are described as needs to solve consumption- related problems. When these needs arise, the individual engages in
retailer interaction specifically to fulfill a purpose. These needs can
be simply to obtain a product, obtain the best value for their money,
gather market-related information, or experience success in bargaining
or negotiation.
Symbolic needs represent one's desire to enhance their self-image, engage in appropriate social behavior, obtain social rewards and receive
recognition through association with retailers. An individual motivated
by symbolic needs may have desires to engage in culturally prescribed
role patterns, receive self-gratification, power, prestige, and
affiliation, as well as needs to learn about new trends and personalize
with retail personnel.
Experiential needs derive from an individual's desire to directly participate in life's events. These motivations may include a need to
64
obtain physical exercise, cognitive and sensory stimulation, variety,
recreation, and diversion from daily activities.
Each major dimension is composed of several subdimensions
capturing the various need states which drive consumer's behavior with
respect to retailers. The proposed dimensionality and structure is
presented in Figure 2.3. Each subdimension will briefly be described.
Functional
P rod u ct— For many individuals the principal reason to engage in
interactions with retailers is to obtain a specific product. The
need to contact a retailer in this instance is motivated by a
desire to receive satisfactions from the purchase of a particular
product which is desired.
Price— Patronage research has successfully identified a segment of
consumers who are price-conscious with regard to the amount of
money which is allotted to product purchases. Individual's
motivated to obtain the best possible price will engage in
interactions with retailers in order to fulfill this desire.
Information— This describes the motivation to seek information
regarding a purchase. Certain consumers desire to obtain as much
information as they can before making a purchase to insure that
the best decision is made.
Negotiation— Many shoppers enjoy the process of bargaining or
negotiation with a retailer regarding a product purchase. These
individuals engage in negotiations with the belief that with
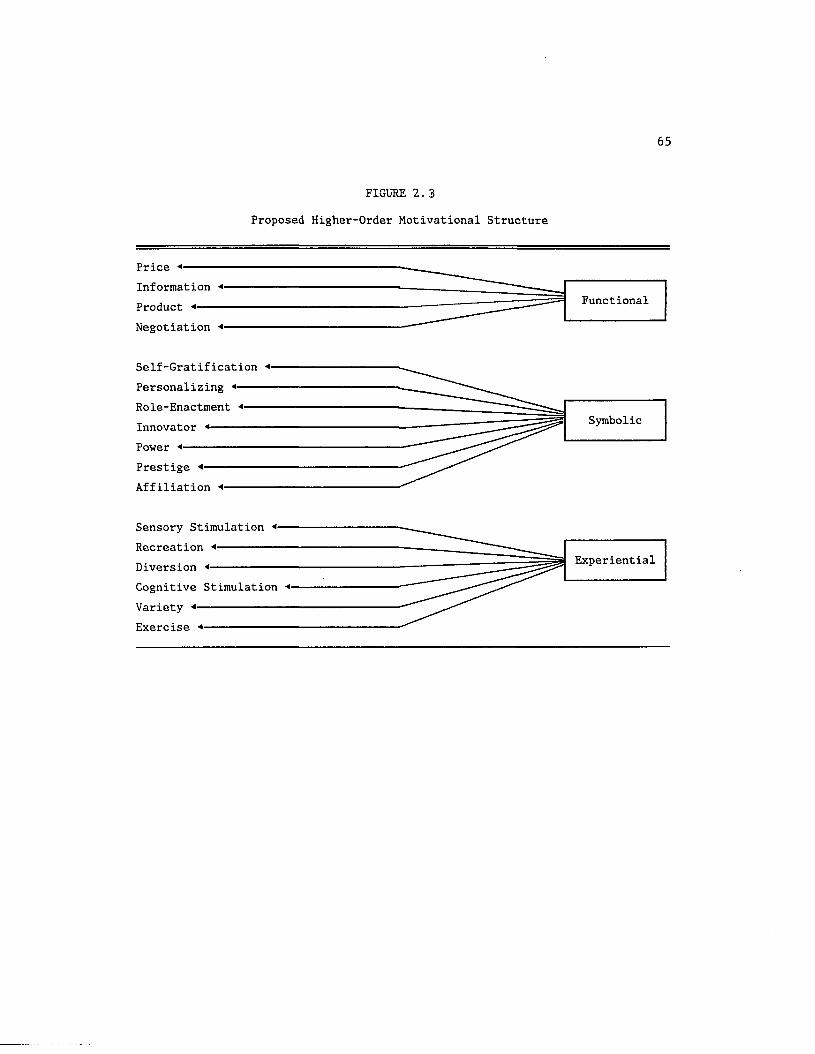
65
FIGURE 2.3
Proposed Higher-Order Motivational Structure
PriceInformation *
FunctionalProduct «-----Negotiation ♦
Self-GratificationPersonalizing ■«— Role-Enactment <■
SymbolicInnovator «•Power ♦Prestige 4---Affiliation ♦
Sensory Stimulation «• Recreation ♦ Diversion * Experiential
Cognitive Stimulation < Variety <Exercise
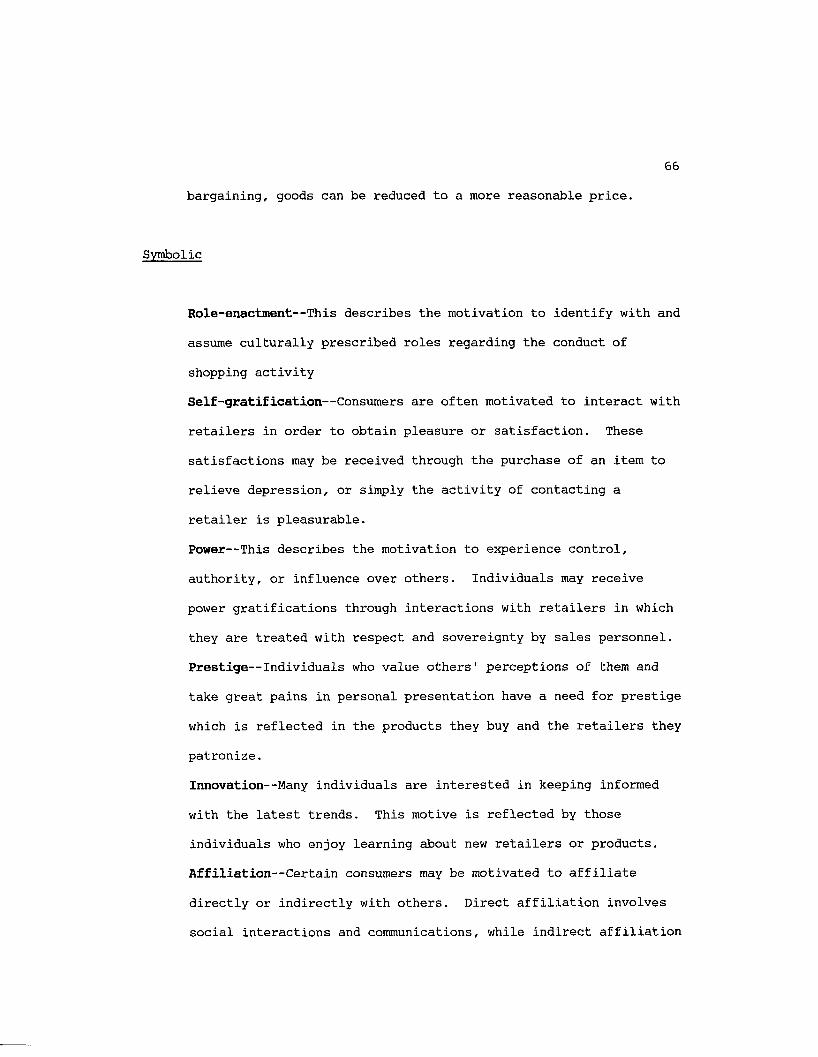
66
bargaining, goods can be reduced to a more reasonable price.
Symbolic
Role-enactment— This describes the motivation to identify with and
assume culturally prescribed roles regarding the conduct of
shopping activity
Self-gratification— Consumers are often motivated to interact with
retailers in order to obtain pleasure or satisfaction. These
satisfactions may be received through the purchase of an item to
relieve depression, or simply the activity of contacting a
retailer is pleasurable.
Power— This describes the motivation to experience control,
authority, or influence over others. Individuals may receive
power gratifications through interactions with retailers in which
they are treated with respect and sovereignty by sales personnel.
Prestige— Individuals who value others' perceptions of them and
take great pains in personal presentation have a need for prestige
which is reflected in the products they buy and the retailers they
patronize.
Innovation— Many individuals are interested in keeping informed
with the latest trends. This motive is reflected by those
individuals who enjoy learning about new retailers or products.
Affiliation— Certain consumers may be motivated to affiliate
directly or indirectly with others. Direct affiliation involves
social interactions and communications, while indirect affiliation
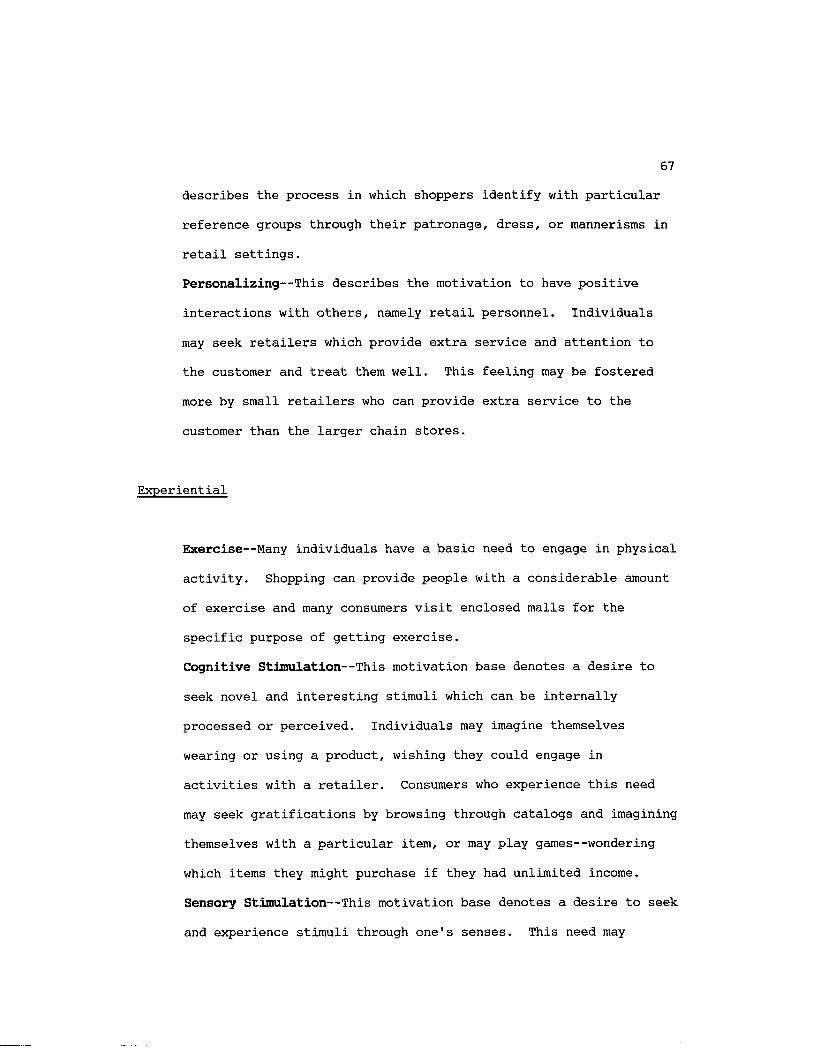
67
describes the process in which shoppers identify with particular
reference groups through their patronage, dress, or mannerisms in
retail settings.
Personalizing— This describes the motivation to have positive
interactions with others, namely retail personnel. Individuals
may seek retailers which provide extra service and attention to
the customer and treat them well. This feeling may be fostered
more by small retailers who can provide extra service to the
customer than the larger chain stores.
Experiential
Exercise— Many individuals have a basic need to engage in physical
activity. Shopping can provide people with a considerable amount
of exercise and many consumers visit enclosed malls for the
specific purpose of getting exercise.
Cognitive Stimulation— This motivation base denotes a desire to
seek novel and interesting stimuli which can be internally
processed or perceived. Individuals may imagine themselves
wearing or using a product, wishing they could engage in
activities with a retailer. Consumers who experience this need
may seek gratifications by browsing through catalogs and imagining
themselves with a particular item, or may play games— wondering
which items they might purchase if they had unlimited income.
Sensory Stimulation— This motivation base denotes a desire to seek
and experience stimuli through one1s senses. This need may

68
manifest itself in a consumer's desire to visit a crowded,
brightly lit store, or to touch and feel the merchandise.
Individuals may also receive sensory pleasure from the store's
atmosphere— lighting, background music, decorations.
Variety— Many individuals have a need to be exposed to new and
different experiences and stimuli. The need to have varied
experiences may be satisfied by patronizing different retailers or
purchasing different products or brands of products.
Diversion— Individuals also have a desire to obtain experiences
that are different from the daily routine. People often enjoy new
environments as it allows them to forget their problems at work or
home and is pleasant to experience a different setting.
Individual's interaction with retailers either in the form of
store visits, catalog shopping, or cable TV shopping can provide
diversion from daily tasks.
Recreation— This describes a motivation to refresh oneself or
renew the spirits. This motivation is manifested in the manner in
which individuals spend their leisure time and for some consumers
the activity of shopping and interacting with retailers may indeed
by recreational. For instance, some consumers view catalogs more
as magazines and enjoy browsing through them even if no purchase
is made.
The proposed motivation dimensions and sub-dimensions are
hypothesized to be relatively stable and enduring characteristics of
individuals. Variation in motivations are expected across individuals
due to basic individual differences and personality dimensions. It is
69
expected however, that the present motivation structure adequately
captures the basic needs which influence individuals to interact with
retailers, and can therefore be used as a determinant variable to
explain and predict consumer patronage behavior.
Shopping motivations are proposed to be of principal importance in
developing consumer's preference for certain retailer attributes.
Depending on an individual's needs, they will seek various retailer
characteristics and demand they be present in order for patronage to
develop. Shopping motivations thus represent an antecedent variable to
individual's attribute preferences. The addition of the construct
shopping motivation to the patronage model improves the model's ability
to explain behavior and measure the relationship of attributes to store
choice. Shopping motivations are expected to influence attribute
importance ratings which directly affect choice set formation processes
or store choice.
Motivation structure is further proposed to be directly related to
choice set processes or consumer patronage behavior. An individual's
underlying shopping motivations may directly determine choice of retail
outlet patronized. For example, a consumer may recognize an unmet need
and seek satisfaction of the drive through interaction with a retailer.
If the need is for prestige, an individual through learning and
experience may realize certain retailers to have higher status ratings
than others (Dawson 1988), and thus may choose to patronize Neiman-
Marcus rather than Sears.
Further, shopping motivations are presumed to affect shopping
process involvement. Individuals who experience greater levels of
overall motivations will be likely to engage in greater levels of
shopping activity. These individuals may also perceive shopping to be
enjoyable for other aspects in addition to attaining a product or
service. The construct shopping process involvement represents the
level of enjoyment or satisfactions the shopping activity can provide an
individual. It can be thought of as an outgrowth of such motives as
stimulation, variety, diversion, and recreation needs.
Specific hypotheses regarding the structure of motivations and its
relationship to other variables in the patronage model will be presented
in the concluding section of this chapter.
Attribute Importance
In patronage models exploring the relationship between store
attribute importance perceptions and patronage behavior, many attributes
have been explored. Researchers attempt to discover those attributes
which are "determinant" to the individual. As defined by Myers and
Alpert (1968), the term determinance reflects the fact that certain
product features or attributes are more influential in determining
preferences and choices than are others. Examples of the types of store
attributes commonly identified in the literature include 30 dimensions
grouped into six categories: locational convenience, merchandise
suitability, value for price, sales effort and store service,
congeniality of store, and post-transaction satisfaction (Fisk 1961),
and 35 items representing eight very similar categories (Kelly and
Stephenson 1967). Lindquist (1974-75) reviewed 26 studies and concluded
there were nine basic attributes: merchandise, service, clientele,
physical facilities, convenience, promotion, store atmosphere,
institutional factors, and post-transaction satisfaction.
Mazursky and Jacoby (1986) updated the Lindquist (1974-75) review
using 26 studies and the same categories. In these store image studies,
the following attributes were most frequently examined: merchandise
quality, merchandise pricing, merchandise assortment, locational
convenience, salesclerk service, and service in general. They concluded
that merchandise related aspects (such as quality, pricing, and
assortment), service related aspects (such as quality in general and
salespersons' service), and pleasantness of shopping at the store are
72
among the most important attributes.
Overall, there appears to be much agreement regarding the
attributes of retailers considered important by consumers. The present
research will include representative attributes of the major dimensions
discussed above. Several methods of determining salient store
attributes have been reported. Respondents are often asked questions
such as "What do you like most about shopping at Store X? What do you
like least about shopping at Store X? What are the major reasons why
you think other people shop at Store X?" (Berry 1969, p. 9). Gentry and
Burns (1977-78) used a five-point importance scale to assess the
importance of 17 attributes in selecting shopping centers to patronize.
As an alternative measure, semantic differential scales have been
employed as a methodology to rank retailers on store criteria or
characteristics (Doyle and Fenwick 1974-75; McDougal and Fry 1974;
Mindak 1961). The semantic differential scale has been used to develop
an understanding of how one retailer compares with the competition, by
having the respondent evaluate each retailer using the same set of
attribute scales.
Myers and Alpert (1968) discuss three methodologies to be employed
in identifying determinant attitudes: direct questioning, indirect
questioning, and observation and experimentation. These authors note
individuals may overstate attribute importance when direct questioning
methods are used and suggests that a "dual questioning" approach be
employed. This involves asking consumers to first identify those
factors they consider important in a purchasing decision, and then how
they perceive these factors as differing among the various products,

73
brands, or retailers. The authors feel that by exploring the importance
ratings together with the rankings, a more reliable measure of
determinance will be obtained. This data may also be used to identify
which attributes are most influential in choice processes or the most
determinant.
The fundamental linkage in patronage research is between
determinant store attributes and store choice. Most patronage models,
however, fail to explore antecedent variables or situational or temporal
stability of attribute perceptions. It is not known what variables
influence consumers1 attribute perceptions and how these impressions are
developed. Therefore, shopping motivations are proposed to be an
antecedent variable to determinant attributes which are relatively
enduring individual traits and may drive an individual to demand that
retailers possess certain characteristics.
Involvement
Research on consumer involvement dates back to Sherif and
Cantril's (1947) early work where involvement is thought to exist
whenever an issue or object is related to the unique cluster of
attitudes and values that constitute a person's ego. In theory,
involvement is considered an individual difference variable that has
motivational qualities. Depending on their level of involvement,
consumers may differ greatly in the extensiveness of their purchase
decision process. Extensiveness may be indicated by the number of
attributes used to evaluate brands and the length of the choice process.

74
Differences may also be found regarding the amount of external search
effort and the number and type of cognitive responses generated during
exposure to advertising (Krugman 1965, 1966).
There is little doubt the involvement concept is important in
consumer research. Antil (1984) refers not only to the amount of
research that has been conducted regarding the involvement construct but
also to the countless uses and references of involvement in a wide
variety of consumer related research. He notes "whether the topic is
information processing, brand choice behavior, brand loyalty, attitude
measurement, cognitive structure and responses, involvement is
frequently mentioned as an important (or potentially significant)
variable" (1984, p. 203).
Product Involvement
Although many definitions of involvement have been offered (e.g.
Bloch 1981; Bowen and Chaffee 1974; Day 1970; Houston and Rothschild
1978; Krugman 1966; Robertson 1976), there seems to be agreement that
product involvement is of two types: situational involvement and
enduring involvement. Situational involvement (SI) reflects product
involvement that occurs only in specific situations, such as a purchase
while enduring involvement (El) represents an ongoing concern with a
product that transcends situational influences (Houston and Rothschild
1978; Laurent and Kapferer 1985; Rothschild 1979). Richins and Bloch
(1986) note that different motivations and temporal patterns may be
exhibited by SI and El.
75
Consumers may exhibit SI during the purchase process for high-risk
products. Under these conditions, the consumer is motivated to maximize
the outcome that satisfaction will be received. The individual may
engage in search activities, extensive brand evaluations, and word-of-
mouth activity to assure a well-informed decision is made. However,
once the purchase is made, consumer arousal and time spent thinking
about the product decline (Richins and Bloch 1986).
Contrary to SI, El is independent of purchase situations and is
motivated by the degree to which the product relates to the self and/or
hedonic pleasure received from the product (Bloch and Richins 1983;
Kapferer and Laurent 1985). Individual's will exhibit low levels of El
with most products; however, high levels of El may be demonstrated with
a few products on an ongoing basis. At very high levels, enduring
involvement may be termed product enthusiasm and is characteristic of
product fanatics such as car buffs, wine connoisseurs, or clothes
horses. For example, some consumers maintain a strong general interest
and involvement in fashion clothing. This involvement continues without
purchase and may manifest itself in the consumer's search for additional
product knowledge— by reading magazines and catalogs, browsing in retail
outlets, and disseminating information regarding the product to others.
As controversy has emerged in the literature regarding the
nature and definition of involvement, so have questions regarding its
measurement. Mitchell (1979) has argued the first priority in future
field research in involvement is the development of a scale to measure
consumers' involvement with a particular product class or brand. He
further stated the measure would not be usefully related to other

76
aspects of consumer behavior until the psychometric properties of the
scale were tested and validated. Since this time, many researchers have
attempted to develop measures of the product involvement construct.
These measures have been of either a general nature or concerned with a
specific product class.
Lastovicka and Gardner (1979) proposed a scale designed to assess
individual differences in involvement for any product class. Although a
generalizable scale is of interest to researchers, the present measure
has received criticism for being too general and containing items which
are "ambiguous and may not capture how a consumer really feels about any
one product" (Bloch 1981, p. 61). Ray (1979) was very concerned with
this issue and concluded: "Measures and applications of involvement
should be developed in individual consumer research application
situations" (1979, p. 198).
More recently, Zaichkowsky (1985a) proposed a generalized
involvement measure composed of 20 semantic-differential items. This
researcher defined involvement as "a person's perceived relevance of the
object based on inherent needs, values, and interests" (1985, p. 342).
While the scale is purported to be useful in measuring involvement
across product classes and purchase situations, questions remain as to
its ability to actually measure enduring involvement.
Measures which are specific to a product class have also been
proposed. Bloch (1981) reports the development of a scale measuring a
consumer's level of involvement with automobiles. Items from the scale
are employed to assess differences in market-related behaviors of
individuals exhibiting situational and enduring involvement (Richins and

77
Bloch 1986). King, Ring and Tigert (1980) propose a scale measuring
fashion involvement.
Noting the considerable amount of effort reguired in developing a
scale for each research application, Antil (1984) suggests researchers
strive to develop more "standardized" measures of involvement. He
states that eventually, through modifications and replications of
previously used scales, quality involvement measures can be attained.
While individuals are known to exhibit product involvement, they
may become engrossed with an activity such as golf, hunting, shopping —
where engaging in the endeavor itself is satisfying and rewarding.
Shopping Process Involvement
In addition to research investigating product involvement,
purchase involvement has been studied. Purchasing involvement as
conceptualized by Slama and Tashchian (1985) is a measure of the self-
relevance of purchasing activities to the individual. These authors
believe purchasing involvement is a promising variable in marketing
because (1) it may be combined with product involvement to better
explain buying behavior, (2) may be related to personality variables,
and (3) may be related to a number of purchasing activities which are
not product specific and significantly impact marketing strategy.
Kassarjian (1981) suggests purchasing involvement may influence a
person's general approach to the consumer decision process as well as
explain consumer behaviors that are not product specific. Examples of
purchase activities not product specific in nature include searching for
78
and taking advantage of sales by retail stores, opening and reading
direct mail advertisements, collecting and reading catalogs, watching
cable network shopping shows, visiting garage sales and flea markets,
and shopping regularly in particular types of retail outlets.
Slama and Tashchian (1985) developed a measure of purchasing
involvement and test hypotheses regarding its relationship with selected
demographic characteristics. Results indicate that certain demographic
variables are related to purchase involvement. Specifically, families
with children at home reported higher levels of purchasing involvement
than families without children at home; and a positive relationship
between education and purchasing involvement was found. The authors
found a curvilinear relationship to exist regarding income and
purchasing involvement with moderate levels of income leading to the
highest levels of involvement; and women were found to have higher
levels of involvement than men.
Although Slama and Tashchian (1985) define purchasing involvement
in terms of the self-relevance of purchasing activities to the
individual, their measures and hypotheses regarding the relationship to
demographic characteristics refer to the expected utility involvement
related behaviors might have to the individual. For example, high
income consumers are expected to exhibit low levels of purchasing
involvement "since they can purchase almost anything they want and value
their free time more than the money that they could save by wise
purchasing" (1985, p. 75). The authors thus ignore the possible hedonic
and experiential or recreational benefits that may accrue as a result of
involvement with purchasing or shopping activities.
79
It is expected that many individuals may receive a great deal of
satisfaction from the shopping activity itself— even if a purchase is
not made. These individuals who are truly involved with shopping
activities may be termed shopping process involved. They view the
activity itself as rewarding and recreational (Bellenger and Korgaonkar
1980; Richins and Bloch 1986). It is further suggested individual's
will exhibit shopping process involvement (SPI) across a wide range of
demographic and socioeconomic conditions. In other words, satisfactions
or pleasures derived from shopping activities may be seen in individuals
of all types of income, education, race, family life cycle, and sex
dimensions.
Involvement Relationships
Although much research in this area has centered upon the
definitional aspects of involvement and the antecedents of involvement,
some research has investigated the relationship of involvement to other
constructs of interest. In the present research, interest lies in
consumer's level of enduring involvement with the product class clothing
as well as individual's shopping process involvement.
The product category was chosen for study as consumers typically
are very familiar with clothing products and because it was assumed
respondents would exhibit a relatively wide range of enduring
involvement levels with respect to this product. This research is
interested in levels of shopping process involvement as this construct
may be affected by an individual's product involvement as well as other
80
variables in the patronage model.
The construct product involvement is included in the patronage
model because of its potential to differentially impact the retail
choice process of consumers (c.f. Dawson 1988; Richins and Bloch 1986).
As product involvement is an individual difference variable with
motivational qualities, it is expected to influence an individual's
attribute preferences, choice set formation processes, and level of
product and retailer knowledge. In a similar manner, shopping process
involvement will also affect these variables.
Product involvement as well as shopping process involvement are
proposed to influence an individual1s attribute importance perceptions.
It is expected individual1s who exhibit enduring involvement with the
product will perceive a greater number of retailer attributes to be
important to them. Since these consumers may derive satisfaction from
the use of the product, a sense of mastery, feelings of uniqueness and
affiliation with others (Bloch 1985), they will demand that the retailer
possess certain characteristics and deem these to be relatively more
important than others. For example, the involved consumer may judge
attributes such as salesperson knowledge and friendliness and the
merchandise assortment to be very important. As involved consumers,
they have a great deal of knowledge regarding the product and ejqoect the
retailer to provide salespeople who are just as knowledgeable or more,
and an adequate assortment of products.
Individuals who exhibit shopping process involvement will also
perceive a greater number of retailer attributes to be important to
them. These consumers have a great deal of skill and mastery in the
81
"art" of shopping and therefore will view more characteristics of the
retailer to be important to them. As they have learned about the
shopping process, they have also developed a more defined and larger set
of determinant attributes.
In a study of consumer browsing— where individual's examine a
store's merchandise for recreational or informational purposes without a
current intent to buy, Bloch and Richins (1983) suggest high levels of
involvement generally stimulate a desire to browse. They are motivated
to see the latest models or styles and keep up with new developments in
the product category. These authors note individuals may be "selective"
in browsing— they are discriminating in the retailers they choose to
patronize. Further, this selectivity may be a function of the retailer
attributes. For instance, if an individual is visiting a retail store
to obtain information regarding a new product development, they may
choose a retailer where they know the salespeople are knowledgeable and
can provide them with the requisite information. This would be
especially important for technically complex products where the consumer
may not be able to discern all of the product benefits or attributes
without the help of a salesperson. This suggests that there may well be
an involvement— attribute importance— retail choice linkage, as well as
an involvement— retail choice relationship.
Involvement has also been found to exert an influence on
consumer's knowledge structure (the specifics of these variables will be
discussed in a later section of this chapter). Zaichkowsky (1985b)
proposes involvement may motivate consumers to gather information and in
time become increasingly knowledgeable about the product or activity.

82
In an empirical study, consumer's expertise was assessed using an
objective measure of knowledge. The relationship between involvement
and expertise was non-significant, contrary to the hypothesis.
Zaichkowsky accounts for this finding by noting there may be a great
deal of difference investigating "true experts" and "self-reported
experts"— had a self-report measure of knowledge been used, a direct
relationship might have been discovered. Antil (1984) suggests high
involvement may be one variable which may influence the extent and form
of information processing which may lead to increased knowledge
regarding the product.
Knowledge
As discussed in earlier sections of this chapter, the construct
knowledge can be viewed as an outcome of an individual1s experience and
involvement with a product class. As such, it is an important variable
in the proposed patronage model as it is likely to exert influence on
the choice set formation process. Knowledge can be defined as the
information a consumer gains from using or learning about a product or
engaging in interactions with retailers. The role knowledge plays in
retail choice processes of consumers is intuitively appealing given the
general agreement among researchers that choice outcomes are often based
on past behavior and importance of choice criteria— which implies the
use of experience and knowledge. However, the role of knowledge has not
been studied in a patronage context.
While the knowledge construct has not been incorporated in

83
research investigating consumer patronage behavior, it has received
recent interest among those assessing product purchase behavior and has
evolved into its own area of study. Theoretical and methodological
advances in the field of cognitive psychology have been made in the
study of memory which have spurred interest among consumer behaviorists
to assess individual's knowledge structures. Marks and Olson (1981)
noted the need for a theoretical framework to understand the influence
that familiarity and knowledge play and suggested researchers adopt a
cognitive structure perspective.
A cognitive structure paradigm proposes the information a consumer
gains from using or learning about a product or engaging in market-
related behaviors (retailer interactions) is stored in a permanent
memory which maintains that knowledge for future use. A basic
characteristic of the consumer's permanent memory is that the
information contained is highly organized for efficient retrieval. Of
interest to cognitive psychologists as well as marketers is the
structure of this knowledge and how the structure may change as a result
of new information and experiences. Mitchell (1982) proposes that the
study of consumers knowledge structures for product related information
will become an important area of research in consumer behavior. In much
the same way, the study of consumers knowledge structures for retail
related behavior is also a worthwhile area of study.
The construct product familiarity has also been used as a measure
of a consumer's knowledge about a product category (Bettman and Park
1980a; Johnson and Russo 1981). Measures of familiarity include the
number of purchases within a product category (Park 1978), self-report

84
measures of familiarity (Bettman and Park 1980b), and self-report
measures of relative familiarity (Johnson and Russo 1981). As noted by
Mitchell (1982), however, few attempts have been made to validate these
measures or to determine if the different measures are measuring the
same construct.
Contextual Influences
A preponderance of research in marketing and patronage has
utilized individual difference variables as primary explanatory
variables in predicting or describing behavior. While researchers have
employed variables hypothesized to be related to behaviors, results are
often less than enlightening. A common explanation proposed to account
for this empirical problem is the possible influence of situational or
contextual variables. For instance. Ward and Robertson (1973) suggest
that "situational variables may account for considerably more variance
than actor-related variables" (1973, p. 26). Furthermore, Miller and
Ginter (1979) state that identification of situation-related variables
that are specific to consumers' decision-making may reduce the
unexplained variance and increase'the managerial value of the research.
As previously discussed, store choice research has emphasized
individual difference variables — such as demographic and psychological
variables as predictors of store choice. While relationships have been
found between these variables and patronage, the strength of the
relationship is often weak. Several reasons have been suggested for the
poor performance of these indicators: inadequate measurement (Mischel
85
1973), omission of key variables and analytic fragilities (Jacoby 1978),
and situational influences (Mattson 1982).
Belk (1974) defines situation as "all those factors particular to
a time and place of observation which do not follow from a knowledge of
personal (intra-individual) and stimulus (choice alternative)
attributes, and which have a demonstrable and systematic effect on
current behavior" (1974, p. 157). This definition separates the
influences of the person, the situation, and the object on consumer
behavior thus establishing situation as external to the individual's
psychological nature.
Situational Influences and Patronage
Concerning patronage research, several exogenous factors may
influence an individual's store choice — the retail competitive
structure (Bucklin 1967; Sturdivant 1970); financial state (Belk 1975);
shopping for self/others (Ryans 1977; Heeler, Francis, Okechuka and Reid
1979; Lastovicka 1979; Mattson 1982); and time available for shopping
(Berkowitz, Walton, and Walker 1979; Jacoby, Szybillo, and Berning
1976).
The present research primarily utilizes individual characteristics
as predictors of store choice. To assess the importance the true
importance of these factors, various contextual or situational
influences should also be included. Of principal import in this study
are respondents' perceptions of the adequacy of the retail store
environment. Should consumers perceive the available retail
86
alternatives to be inadequate, they may engage in increased amounts of
non-store shopping or outshopping. Thus, their choice sets would
include fewer numbers of local retail outlets.
A second contextual influence is the amount of discretionary time
a consumer has to spend in the shopping process. As previous research
has shown, time scarcity does influence consumers' patronage behavior
(Berkowitz, Walton and Walker 1979; Mattson 1982). The amount of time
individuals have available to spend shopping will affect choice sets by
reducing the number of retailers included in the consideration and
action sets.
Similarly, the amount of money consumers have available to spend
will influence the size of the choice sets and the type(s) of retailers
chosen. One assumption is that individuals experiencing a shortage of
cash will be interested in making the "best" purchase decision and
obtaining good value for their money. These individuals can be expected
to spend greater amounts of time in the purchase process; it is likely
they will consider and visit a greater number of retailers so financial
utility is maximized. Therefore, individuals will engage in extensive
retail choice to obtain the best possible buy.
Choice Set Formation
The construct choice set formation stems from realizing consumers
rarely consider all available alternatives when making a decision. This
is true whether the decision is to purchase a particular product,
patronize a retailer, decide which college to attend, or which doctor to
87
visit. The wide range of alternatives available to individuals is quite
numerous and often the decision task is so complex the individual cannot
possibly process all of the available information. As a result,
individuals may strive to reduce the amount of cognitive processing
necessary to arrive at a decision. One way individuals may simplify
their decision processes is to reduce the number of alternatives
actually evaluated wherein the individual considers only a specific
subset of alternatives through the construction of a choice set.
Thus, there are limits to individual's cognitive capacity in
simultaneously evaluating many alternatives. This limit refers both to
the number of alternatives which can be considered (Miller 1956) as well
as the number of dimensions along which each can be judged. Therefore,
the question of why consumers form choice sets is readily apparent; however, the question of how consumers simplify their decision process through the formation of choice sets has received less research interest
and is the central focus of this research. This research is interested
in consumer's choice process for evaluating and selecting retail
alternatives.
This section will present a brief review of alternative
conceptualizations of the evoked set concept, a discussion of its
relation to patronage, and concludes with a proposed model of the choice
set formation process.
88
Evoked Set Conceptualizations
Studies exploring consumer's decision making processes have
focused both on functional and structural issues (Belonax and
Mittelstaedt 1977). Functional issues of information processing often
involves studying choice heuristics or decision rules employed by
individuals given a choice task. Structural issues investigated include
the types and number of product attributes used in making product
evaluations or choices and the number of brands (evoked set) actually
considered by consumers when making a choice. Several
conceptualizations of the evoked set concept have been proposed in the
consumer behavior literature. These include those of Howard
(1963;1977), Narayana and Markin (1975), and Brisoux and Laroche (1980).
Each of these is discussed below.
Howard (1963, 1977). The Howard (1963, 1977) conceptualization is
shown in Figure 2.4. This model was developed to depict consumer's
decision making process when motivated to purchase a product. Howard
proposed that as a consumer engages in purchase activity for a
particular product and becomes familiar with the brands available an
evoked set is formed. Howard defined the evoked set as, "the subset of
brands that a consumer considers buying out of the set of brands that he
or she is aware of in a given product class" (1977: 306). Howard then
proposed that the individual will engage in routinized response behavior
when making a particular purchase.
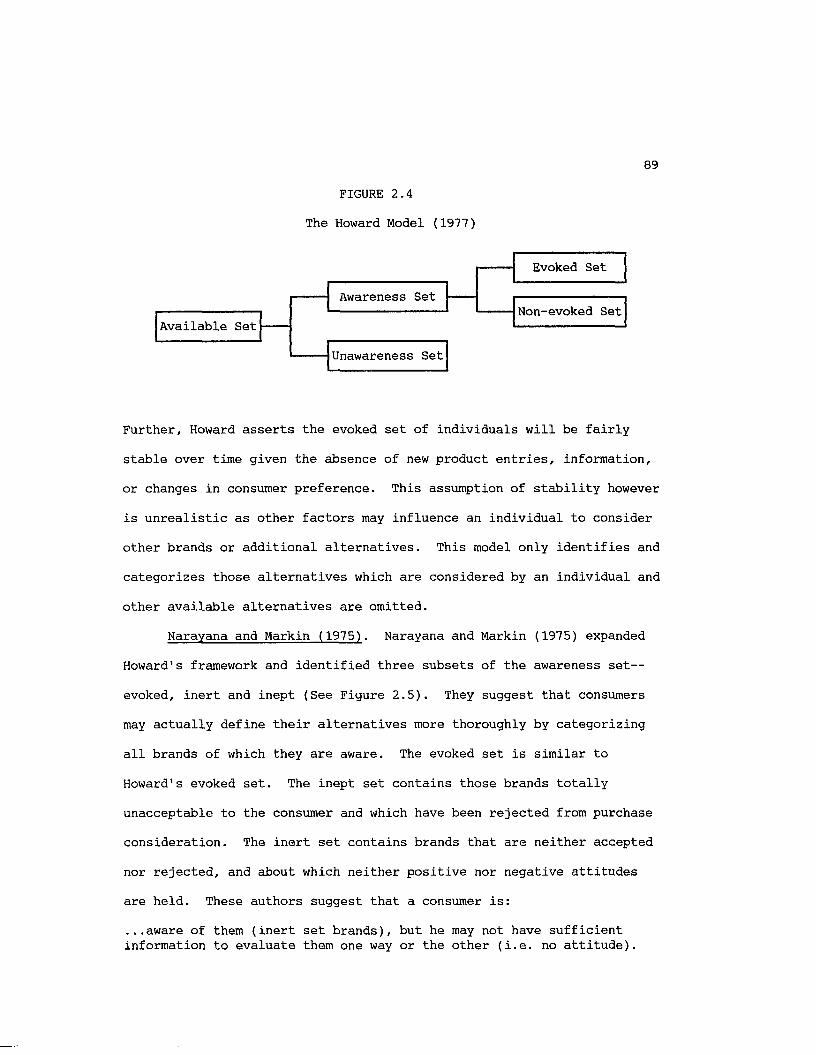
89
FIGURE 2.4
The Howard Model (1977)
Available Set
Evoked Set
Non-evoked SetAwareness Set
Unawareness Set
Further, Howard asserts the evoked set of individuals will be fairly
stable over time given the absence of new product entries, information,
or changes in consumer preference. This assumption of stability however
is unrealistic as other factors may influence an individual to consider
other brands or additional alternatives. This model only identifies and
categorizes those alternatives which are considered by an individual and
other available alternatives are omitted.
Narayana and Markin (1975). Narayana and Markin (1975) expanded
Howard's framework and identified three subsets of the awareness set—
evoked, inert and inept (See Figure 2.5). They suggest that consumers
may actually define their alternatives more thoroughly by categorizing
all brands of which they are aware. The evoked set is similar to
Howard's evoked set. The inept set contains those brands totally
unacceptable to the consumer and which have been rejected from purchase
consideration. The inert set contains brands that are neither accepted
nor rejected, and about which neither positive nor negative attitudes
are held. These authors suggest that a consumer is:
...aware of them (inert set brands), but he may not have sufficient information to evaluate them one way or the other (i.e. no attitude).
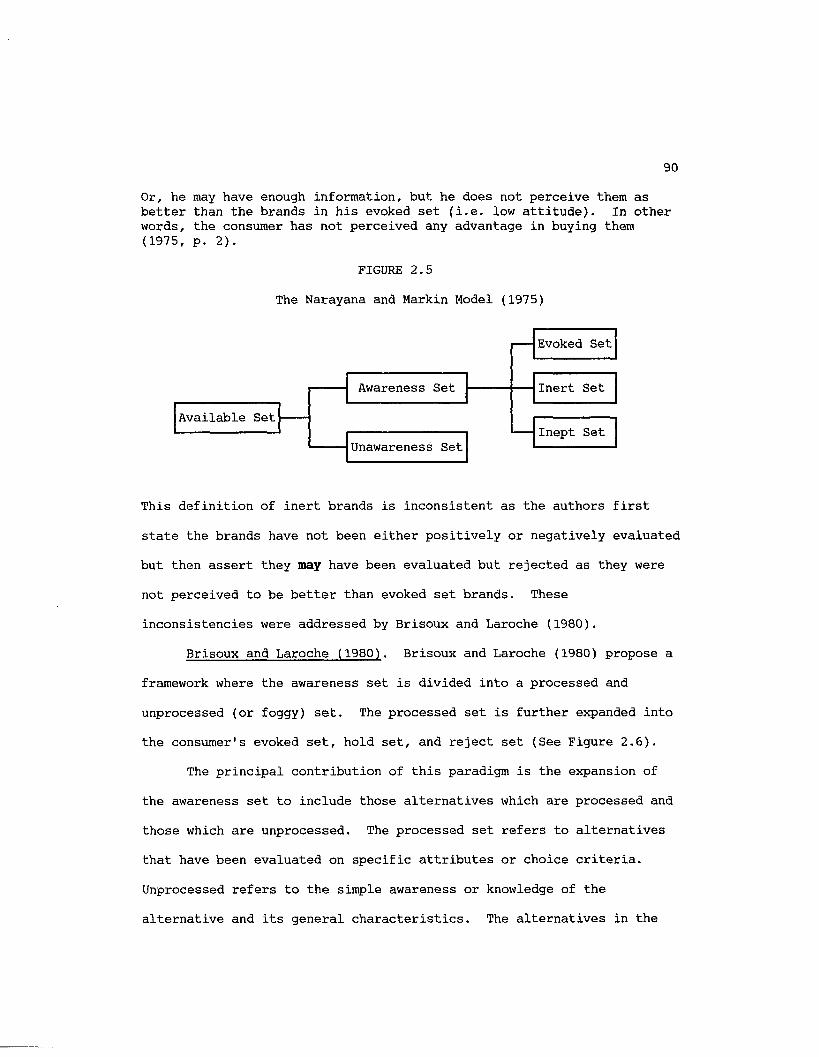
90
Or, he may have enough information, but he does not perceive them as better than the brands in his evoked set (i.e. low attitude). In other words, the consumer has not perceived any advantage in buying them (1975, p. 2).
FIGURE 2.5
The Narayana and Markin Model (1975)
Evoked Set
Inert Set
Inept SetAvailable Set
Unawareness Set
Awareness Set
This definition of inert brands is inconsistent as the authors first
state the brands have not been either positively or negatively evaluated
but then assert they may have been evaluated but rejected as they were not perceived to be better than evoked set brands. These
inconsistencies were addressed by Brisoux and Laroche (1980).
Brisoux and Laroche (1980). Brisoux and Laroche (1980) propose a
framework where the awareness set is divided into a processed and
unprocessed (or foggy) set. The processed set is further ejqpanded into
the consumer's evoked set, hold set, and reject set (See Figure 2.6).
The principal contribution of this paradigm is the expansion of
the awareness set to include those alternatives which are processed and
those which are unprocessed. The processed set refers to alternatives
that have been evaluated on specific attributes or choice criteria.
Unprocessed refers to the simple awareness or knowledge of the
alternative and its general characteristics. The alternatives in the
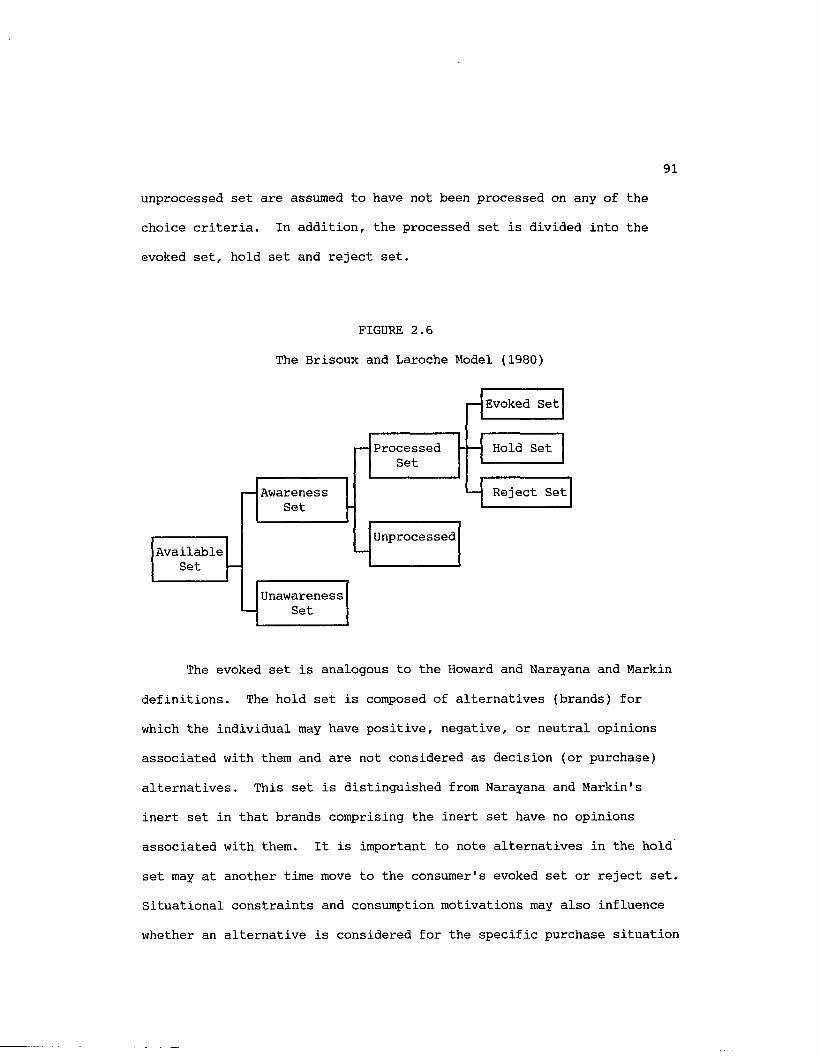
unprocessed set are assumed to have not been processed on any of the
choice criteria. In addition, the processed set is divided into the
evoked set, hold set and reject set.
FIGURE 2.6
The Brisoux and Laroche Model (1980)
Hold Set
— Evoked Set
— Reject Set
AvailableSet
ProcessedSet
Unprocessed
AwarenessSet
UnawarenessSet
The evoked set is analogous to the Howard and Narayana and Markin
definitions. The hold set is composed of alternatives (brands) for
which the individual may have positive, negative, or neutral opinions
associated with them and are not considered as decision (or purchase)
alternatives. This set is distinguished from Narayana and Markin's
inert set in that brands comprising the inert set have no opinions
associated with them. It is important to note alternatives in the hold
set may at another time move to the consumer's evoked set or reject set.
Situational constraints and consumption motivations may also influence
whether an alternative is considered for the specific purchase situation
92
or not. The reject set is similar to Narayana and Markin's inept set
and simply contains those alternatives (brands) the consumer will not
consider when making a (purchase) decision.
Summary. The research conducted exploring consumers evoked sets
has typically involved a study of brand or product purchase
deliberation. These studies have employed a variety of research
methodologies, product classes, and attributes as well as examining
effects of related variables. Experimental designs where subjects are
presented with an information matrix of attributes and brands are
typical of research investigating consumer's evoked set (e.g. Belonax
1978; Belonax and Mittelstaedt 1977; Parkinson and Reilly 1979). Others
have employed self-report questionnaires and personal interviews where
respondents categorize brands into the various sets (e.g. Brisoux and
Laroche 1981; Laroche, Rosenblatt and Sinclair 1984; Laroche,
Rosenblatt, Brisoux and Shimotakahara 1983).
Researchers have investigated evoked sets for universities
(Laroche, Rosenblatt and Sinclair 1984), microwave ovens (Belonax 1978;
Belonax and Mittelstaedt 1977), personal care products (Laroche,
Rosenblatt, Brisoux and Shimotakahara 1983; Parkinson and Reilly 1979;
Reilly and Parkinson 1985), and beer (Brisoux and Laroche 1981). These
studies focus primarily on the categorization of the various brands into
an evoked set or using the Brisoux and Laroche (1980) paradigm, a hold,
reject or foggy set. Moreover, these studies have centered upon the
presence of a classification system rather than an analysis of the
composition of the consumer's sets.
Studies of consumer's evoked sets have also focused on individual
93
use of decision rules or choice heuristics. While knowledge regarding
how alternatives are categorized by consumers is important, the method
in which various sets are constructed and their composition is also of
critical import. Therefore, the rule or strategy which the consumer
employs to construct the various choice sets is important. Various
decision rules have been proposed to be utilized by the consumer in
making product/brand evaluations (e.g. compensatory, conjunctive,
disjunctive, elimination-by-aspects and lexicographic; see Hawkins, Best
and Coney 1983 for a brief discussion) as well as categorization
strategies (e.g. prototype model, exemplar-based model, and free
classification; see Troye 1984 for discussion). Studies exploring
evoked set formation have attempted to investigate and assess the
decision rule employed.
While consumer behaviorists have focused primarily upon brand
choice and the categorization of alternatives, researchers in the field
of urban geography have explored the existence and formation of choice
sets for retail alternatives (e.g. Timmermans 1983). This research has
recently been integrated in studies of patronage behavior (e.g. Black
1984).
Choice Sets and Patronage
Similar to brand-choice decisions, the consumer when faced with an
array of retail alternatives is likely to simplify the decision process
by reducing in some manner the number of alternatives considered. One
area where retail choice set formation is apparent is the spatial

94
analysis of stores visited and patronized. Working from a theoretical
model of spatial influences and their effects on choice behavior,
geographers have studied consumers' retail outlet selection behavior.
Specifically, spatial choice models generally aim at predicting the
probability that an individual will choose an alternative from among all
the possible alternatives, given the location of the individual and the
locations and attributes of the set of alternatives (Timmermans, Van Der
Heijdan, and Westerveld 1982). These researchers have also incorporated
individual demographic characteristics into models of retail choice
(e.g. Potter 1979).
These researchers have coined their own terminology for describing
choice sets. Sheppard (1978) described the choice set as composed of
those options that represent feasible choices, given certain constraints
upon the individual. Further, individual's knowledge regarding retail
alternatives is thought to be differentiated into information (Hanson
1977) and usage fields (Potter 1979). Information fields were
conceptualized to consist of those alternatives from which choices are
made, those known but not patronized, and the total set available. As
discussed by Black (1987) "the resulting proposition was that patronage
choice was actually a series of choice processes reducing the total set
of outlets to a reasonable and realistic set of choices, similar to the
process of defining evoked sets" (1987, p. 6).
Additional studies have distinguished between those alternatives
known to the individual (information fields) and those actually
patronized (usage fields). Potter (1977a,1977b,1979) found support for
the existence of separate sets while investigating the influence of
95
spatial, personal, and outlet characteristics on information and usage
fields. Results indicated wide variations in information fields based
on various consumer characteristics (Potter 1979).
For example, in one study the total number of outlets comprising
the information field ranged from one to fourteen while the mean
information total for respondents was 4.12. When totals were compared
across respondents on personal characteristics of age, social class, and
mobility, differences in the size of sets were also found. Information
sets were smaller for older consumers and individuals of lower
socioeconomic status. Similarly, usage fields varied from one to seven
with a mean of 3.05 outlets. Thus, it appears individuals do indeed
reduce in some manner the set of alternatives actually considered or
patronized. Spatial influences have also been found to exert a dominant
influence upon consumer's choice of outlet (Cadwallader 1975).
While this research provides empirical support to the notion of
various choice sets, its focus has been primarily descriptive or
predictive in nature. For example, Timmermans et al. (1982)
investigated the information and usage fields of consumers and related
these fields to various personal characteristics of the respondents. A
model was then tested to predict the shopping areas which would be
chosen by consumers. Although this knowledge contributes to
researchers' and marketers' understanding of consumer choice behavior,
it fails to investigate the process and delineate determinants of choice
set formation. Additionally, the structure (e.g. the types of
alternatives and market share concentration) of consumers information
and usage sets is not examined. Only demographic and spatial
96
characteristics are considered and individual difference variables such
as motivations, values, shopping orientations, etc. have not been
included in studies of retail choice set formation.
A recent marketing study utilized the evoked set concept to
categorize the retail choice process of consumers. Spiggle and Sewall
(1987) studied the retail choice of consumers who had recently purchased
an engagement ring. These authors conceptualized retail choice as a
series of potential decision outcomes rather than a single binary
outcome. The Narayana and Markin (1975) model of evoked sets was
utilized with the evoked sets of consumers further divided into action
and inaction sets. The action set was comprised of the retailers which
the individual actually visited with distinctions made between those
where the consumer talked with a salesperson (interaction), and those
which were simply visited or window shopped. The inaction set was
composed of those retailers the individual considered but did not visit.
Respondents were asked to reflect upon the decision process and then
categorize the various retailers into one of the various sets. The
model employed by Spiggle and Sewall is depicted in Figure 2.7.

FIGURE 2.7
The Spiggle and Sewall Model (1987)
UnawarenessSet
InactionSet
Available Set
AwarenessSet
Evoked IneptSet SetI 1
ActionSet
Quiet InteractionSet Set
InertSet
98
Spiggle and Sewall categorized the available retailers into one of
the above sets by asking respondents to indicate their actions toward a
predefined list of 19 major competitors. In addition, demographic
information as well as attribute importance data was obtained. The
authors proceeded to develop competitive profiles for the retailers
based on the composition of individual's sets or the specific retailers
chosen for inclusion. The model can be useful to retailers as a
competitive information tool in assessing their own and competitors'
strengths and weaknesses.
A curious finding was the lack of relationship between individual
and retailer characteristics and choice sets. A key determinant of
retail choice are salient store attributes; therefore it is surprising
this variable did not explain variations in choice set formation. The
authors suggest other psychological state variables may influence the
choice set formation process and are therefore worthy of study.
In reviewing the literature on evoked sets and choice set
formation, several questions arise. First, what are the stages of the choice set formation process? Can choice set formation be characterized
by one of the models discussed above? and How do consumers categorize
the various retail alternatives that are available to them? Secondly,
how are the various choice sets formed? What variables exert an
influence on the types and numbers of retailers considered for inclusion
and what influences whether or not a specific retailer is chosen?
Finally, how can we characterize and define the structure and
composition of individual's choice sets?
These issues will be discussed presently in the context of a

99
proposed model to capture the various influences on choice set formation
and to describe the stages of the choice set formation process.
Choice Set Formation Process Model
The choice-set formation process recognizes that consumers have
many alternatives to choose from in selecting a retail outlet and is
concerned with the cognitive process of alternative evaluation and the
derivation of choice sets of retail outlets (Spiggle and Sewall 1987).
Figure 2.8 depicts the choice-set process for retail outlets that will
be utilized in this research.
FIGURE 2.8
Choice-Set Formation Process for Retail Outlets
OutletChoice
ActionSet
AwarenessSet
ConsiderationSet
The choice-set formation process depicts a method in which
consumers may categorize the various retail alternatives. In a
patronage context, the choice-set formation process recognizes the many
and varied retail alternatives available to individuals and categorizes
them into four groups: awareness, consideration, action, and outlet
choice.
The awareness set is comprised of all retail alternatives of which the consumer has some knowledge. This knowledge may consist of
100
information regarding the location, products carried, type of shoppers
of the retailer or simply that the consumer has "heard of" the
alternative. The consideration set is composed of those retail alternatives the individual would regard as possible choices for
retailer interaction. The action set represents those retail alternatives toward which the consumer would take some action— such as
visiting the outlet, watching cable network shopping, browsing through a
catalog, etc. Final outlet choice represents the retail alternative(s) chosen by the individual. Some individuals may exhibit such a cognitive
process when making selections among various retail alternatives and the
choice-set formation process provides a useful model for conceptualizing
the alternative evaluation activity.
Perspectives of Choice Set Formation
The choice set formation process can be viewed from two broad
perspectives. The first considers the decision regarding the type of retail outlet to patronize as well as the number of alternatives that
might be considered to be of primary importance. The second perspective
regards the consideration of the specific retailers to be included'in the various sets to be most meaningful. These two positions can be
termed choice set structure and composition, respectively.
Choice set structure is concerned with the general makeup of an
individual's set. Therefore, it is a macro-based perspective and is
interested in the aggregate design or makeup of consumers' choice sets.
Structure can be assessed by measuring the total number of alternatives
101
and the types of alternatives within each choice set.
Alternatively, composition is a more specific or micro measure of
choice set and is concerned with the exact retailers which comprise an
individual1s set and whether or not these same retailers are retained at
later stages in the choice process. While both perspectives have merit,
this dissertation research will only investigate the structure of
individual's retail outlet choice sets.
Relationship to Other Constructs
The patronage model presented here (See Figure 2.9) suggests that
a consumers' shopping motivations, involvement, and knowledge may impact
directly on the formation of choice sets. A consumer's purchase
experience with the retailing community will influence their degree of
knowledge which will then affect the types and number of retailers
considered. As discussed previously, involvement will also affect
knowledge so involvement will have both a direct and indirect influence
on structure.

102
FIGURE 2.9
Patronage Model of Choice Set Structure
KnowledgeExperience
Involvement
Choice Set Structure
ShoppingMotivation
ContextualInfluences
In this model, a consumer's behavior is directed by the
recognition that engagement in shopping behavior and the selection of
types of retailers can result in the satisfaction of a particular need
state. Individuals may seek specific types and numbers of retailers
such as department stores, specialty stores, flea markets, or catalog
retailers. It is presumed that motivations will directly influence the
type of retail alternative considered by an individual. Moreover, an
individual1s level of involvement with the activity of shopping will
exert both a direct and indirect influence on structure.
For instance, if a consumer is motivated to shop or contact a
retailer to fulfill informational needs, a specific retailer or a set of
retailers may be recognized which can solve these needs. In this case,
103
department or specialty outlets may be able to provide more information
to an individual than a catalog or discount alternative. The individual
is directed to consider the type of retail outlet which may fulfill the
various motivational states. An individual's experience and involvement
with shopping as an activity will influence their knowledge regarding
the types of retailers which can satisfy their desire for information.
These in turn will influence the structure. Additionally, involvement
will have a direct impact as individuals who are highly involved may
consider more types of retailers and a larger number of retailers.
Summary and Hypotheses
As noted by Rosenbloom and Schiffman (1981) and echoed by Sheth
(1983) the study of consumer patronage behavior has failed in its
efforts to develop a model or theory of retail patronage. Researchers
have at present preferred to concentrate their research inguiries upon
specific issues dealing with retailing and consumer patronage rather
than integrate the concepts into a theoretical model. In addition,
previous research has (1) failed to include non-store retailers, (2)
included determinant store attributes as an important link to store
choice without explicating the formation of attribute importance
ratings, and (3) viewed consumer patronage behavior as static and has
ignored that selection of retail alternatives may represent a decision
process.
The present research attempts to address these issues through the
inclusion of non-store retailers and the proposal of a conceptual model
104
of patronage. Additional explanatory variables will also be included
which may affect consumer patronage behavior. Retail patronage is
viewed as a process whereby individuals reduce the number of alternative
retailers considered through the construction of choice sets.
Specifically, as presented in Figure 1.3, consumer shopping
motivations are proposed to influence choice set formation directly and
indirectly through the formation of determinant attributes. As
discussed, previous research has failed to fully explicate the formation
of determinant retailer attributes. Motivations are proposed to be
antecedent states which form consumer's perceptions and preferences of
retailer attributes in addition to exerting a direct influence on choice
behavior. It is therefore hypothesized that:
HI. The motivation taxonomy describing the antecedent states
which form consumer1s perceptions of retailer attributes and
give rise to varied patronage behavior is composed of three
dimensions: functional, symbolic, and experiential.
Each primary motivational dimension is proposed to represent
several distinct subdimensions. It is hypothesized that:
H2. The functional dimension is composed of four subdimensions:
product, price, information, and negotiation.
H3. The symbolic dimension is composed of seven subdimensions:
role-enactment, self-gratification, innovation, prestige,
power, affiliation, and personalizing.
H4. The experiential dimension is composed of six subdimensions:
exercise, cognitive stimulation, sensory stimulation,
variety, diversion, and recreation.

105
The various motivational dimensions will influence the formation
of determinant attributes as individuals with different need states
(motives) will demand that retailers possess certain characteristics.
Therefore, it is hypothesized that:
H5. Self-described functional shoppers will perceive price,
product variety, and sales staff to be important store
attributes.
H6. Self-described symbolic and experiential shoppers will
perceive sales staff, type of store, and atmosphere to be
important store attributes.
Consumer's shopping motivations will also have a direct influence
on the types of retail alternatives considered or the choice set
structure. The following hypotheses are offered:
H7. Higher levels of summed motivation scores will be reflected
in broader choice set measures.
H8. Self-described functional shoppers will exhibit varied
choice sets composed of all types of retailers.
H9. Self-described symbolic shoppers will exhibit more selective
or specialized sets composed of greater numbers of
traditional retailers such as department and discount
stores.
H10. Self-described experiential shoppers will exhibit more
selective or specialized choice sets composed of greater
numbers of specialty and non-store retailers.
As the study of choice set formation describes the way in which
individuals categorize the various alternatives, also of import to
106
researchers is the manner in which alternatives are narrowed to final
choice. It is proposed the various motivational dimensions will
influence the degree to which individuals reduce the number of
alternatives considered at each stage of the choice process. It is
postulated that:
Hll. Self-described functional shoppers will exhibit greater
reduction from each stage of the choice process and the
number of retailers retained at subsequent stages will
be smaller.
H12. Self-described symbolic and experiential shoppers will
exhibit less reduction from each stage of the choice process
and the number of retailers retained at subsequent stages
will be greater.
A patronage model is proposed (Figure 2.1) which includes the
integration of constructs from previous research and the addition of
other explanatory variables. These other variables are product
involvement, shopping process involvement, product experience, product
knowledge and contextual influences. Involvement and motivation are
expected to be positively related and to exert similar influences upon
formation of determinant attributes and choice set formation. Two types
of involvement are expected to influence patronage: shopping process
involvement and product involvement. It is proposed that:
H13. The structure of shopping process involvement is composed of
three dimensions: general enjoyment/recreation of shopping,
catalog shopping enjoyment, and non-traditional outlet
involvement.
107
H14. Individuals exhibiting high levels of overall shopping
motivation will exhibit high levels of shopping process
involvement.
H15. Individuals exhibiting high levels of product involvement
will exhibit high levels of shopping process involvement.
Product involvement is additionally thought to influence the
amount of knowledge an individual has regarding both the shopping
activity and product specific information.
H16. Individuals exhibiting high product involvement will have
greater amounts of knowledge regarding the product category
and available retail outlets.
It is expected that product involvement and shopping process
involvement will directly influence the structure of choice sets as
reflected in the types and numbers of alternatives considered. It is
proposed that:
H17. and H18. Individuals who possess high levels of product
involvement and high levels of shopping process involvement
will have broader structural measures at the early
(awareness) stages of the choice process.
An individual's level of experience with the product and shopping
will increase their level of knowledge which will subsequently exert an
influence on choice set structure. It is hypothesized that:
H19. Individuals who have greater product experience will have
more knowledge regarding the product category and available
retail outlets than individuals with less experience.
H20. Individuals exhibiting high levels of product knowledge will

108
have greater numbers of outlets in their awareness choice
sets than individuals who are low in knowledge.
Contextual influences are also proposed to influence the structure
of choice sets. Specifically, these variables reflect the amount of
money and individual has available for purchasing and the amount of
discretionary time available for shopping activities. It is therefore
hypothesized that:
H21. Contextual variables will affect the structure of choice
sets by reducing the size of the consideration and
action sets and increasing the percent reduction from
each stage of the process to the next stage.
In summary, the dissertation research focuses on integrating
various concepts presumed to be related to patronage. The
conceptualization of patronage is extended through the explication of a
model which views the choice decision as a process and incorporates
individual characteristics as determinants of choice. Specifically,
consumer motivations and involvement are proposed to be antecedent
variables to the development of determinant attributes as well as
directly related to choice set formation. Experience, knowledge, and
contextual influences are expected to affect choice set structure and
the choice set formation process. Figure 2.11 presents the patronage
model to be tested and indicates hypothesized linkages.

109
FIGURE 2.10
Proposed Consumer Patronage Model and Hypothesis Linkages
H19
H16
H15
H18 H20H14H17
H7
H21
ProductKnowledge
Choice Set Formation
ProductExperience
ShoppingMotivations
ProductInvolvement
ContextualInfluences
Shopping Process Involvement
CHAPTER THREE
Methodology
The research questions that prompted the dissertation research
were stated in Chapter One. Hypotheses to be tested by the dissertation
research were stated at the conclusion of Chapter Two. Chapter Three
describes research methods and is divided into three sections:
- the design of the study;
- the survey instrument, and
- data analysis.
Design of the Study
This section discusses the population, sample size, sample design,
data collection procedures and analysis of the study. These topics are
covered in four sections, one describing the stages of the dissertation
research, one discussing the population, one relating to the sample, and
a final section on sample design.
Data Collection Procedure
The dissertation research consisted of three stages of data
collection. During Stage 1 of research a student sample of 78
undergraduates at a southeastern university participated. The purpose
of this stage was to perform an initial test of the motivation and
involvement instruments. Respondents completed a questionnaire composed
110

Ill
of 154 motivation items, 13 product involvement items, and 22 shopping
process involvement items. All items were scaled strongly disagree to
strongly agree (whereby 5=strongly agree and l=strongly disagree).
A second pretest was conducted to purify and test the validity of
the proposed scales. Stage 2 research consisted of a combined sample of
both students (n=118) and non-students (n=122). Motivation was assessed
using a 90-item Likert-type scale and three items which measured self
described motivation types. Shopping process involvement was measured
using a 12-item scale. Respondents were additionally questioned about
their shopping habits and store attribute importance perceptions.
The dissertation research in Stage 3 consisted of a questionnaire
which was distributed to adult females at the Baton Rouge YMCA and
dispersed to women in their homes by personal contact. The final sample
resulted in a total of 245 women. Sample characteristics and the
questionnaire will be discussed in later sections of this chapter.
Population, Sample Size, and Sample Design
Population. The population from which the dissertation sample was
drawn consisted of adult females aged 18 or older in the Baton Rouge,
Louisiana, metropolitan area. In order to maximize the potential for
uncovering the hypothesized effects (Calder, Phillips and Tybout 1982),
the population was defined as women 18 years of age or older. Female
respondents were chosen as they have been studied in past research
investigating patronage (e.g. Bellenger, Robertson and Greenberg 1977;
Hirschman 1981; King, Tigert and Ring 1980; Stone 1954) and it was felt

112
that they would demonstrate greater variability on the motivation and
involvement measures. Women, as a group, display greater interest in
clothing than do men and tend to shop in clothing stores more often
(Tigert, Ring and King 1976; Bloch and Richins 1983).
Sample Size. A judgmental sampling method was utilized resulting
in a sample of 245 women. This type of non-probability sampling method
was chosen since a specific segment of respondents were sought.
Respondents were recruited by interviews subject to the following
constraints:
- respondents should not be full-time students;
- respondents should not be personally acquainted with the
researcher;
- respondents should not be employed by the university in an
administrative or academic position.
Additionally, the research required individuals who engaged in shopping
activities and had fairly high discretionary income. However, the
sample design attempted to sample across demographic characteristics
with respect to age, education, and race.
Sample Design. In obtaining respondents, several sources were
utilized. The primary source of study participants was the Baton Rouge
YMCA located on Foster Drive. This YMCA was selected as it is centrally
located, has a membership population composed of professional, family
and retired persons and a diversity of socioeconomic groups represented.
Study respondents were elicited by asking women participating in
activities at the YMCA to volunteer to complete the study questionnaire
and return it using a prepaid postage envelope. A total of 200 surveys

113
were given to the YMCA for distribution. All questionnaires were
disbursed, however it is not possible to ascertain the actual response
rate of this group.
In an effort to ensure sample representativeness, other groups of
individuals were specifically selected. Four Baton Rouge neighborhoods
were targeted for sampling and a modification of the "drop-off" method
described by Sudman, Greely and Pinto (1965) and utilized by Lovelock,
Stiff, Culwick and Kaufman (1976) was employed. Interviewers were
instructed to ask the female adult of the household to complete the
questionnaire. The interviewer was instructed to leave the surveys with
only those respondents who agreed to fulfill the requirements of the
study. These neighborhoods were expected to consist of middle and upper-
middle black and white respondents. Interviewers canvassed these
neighborhoods and asked respondents if they would be willing to
participate in the study.
Individuals were asked to complete the questionnaire and return it
using a stamped and addressed envelope. It was hoped the personal
contact would improve the usual poor response rate of mail surveys.
Five hundred surveys were disseminated by interviewers to the
households.
In total 700 surveys were prepared and distributed. Of those, 245
questionnaires were returned resulting in a response rate of 35 percent.
Compared to similar patronage research studies, it is believed that this
sample size is adequate. As shown in Table 3.1, the average sample size
of comparable studies is 236 with a range of 110 to 324. However, the
response rate of 35 percent is lower than reported in similar patronage
studies. A possible explanation for a lower response rate involves the
length of the questionnaire. Potential respondents may not have been
willing to exert the time and effort necessary to complete the survey.
Thus, this sample is subject to non-response bias as it is unknown
whether sample respondents differ from non- respondents. The sample
obtained is considered acceptable however since the focus of the
dissertation is methodological (primarily construct validation) rather
than applied as Calder, Phillips and Tybout (1981, 1982, 1983) have
argued.
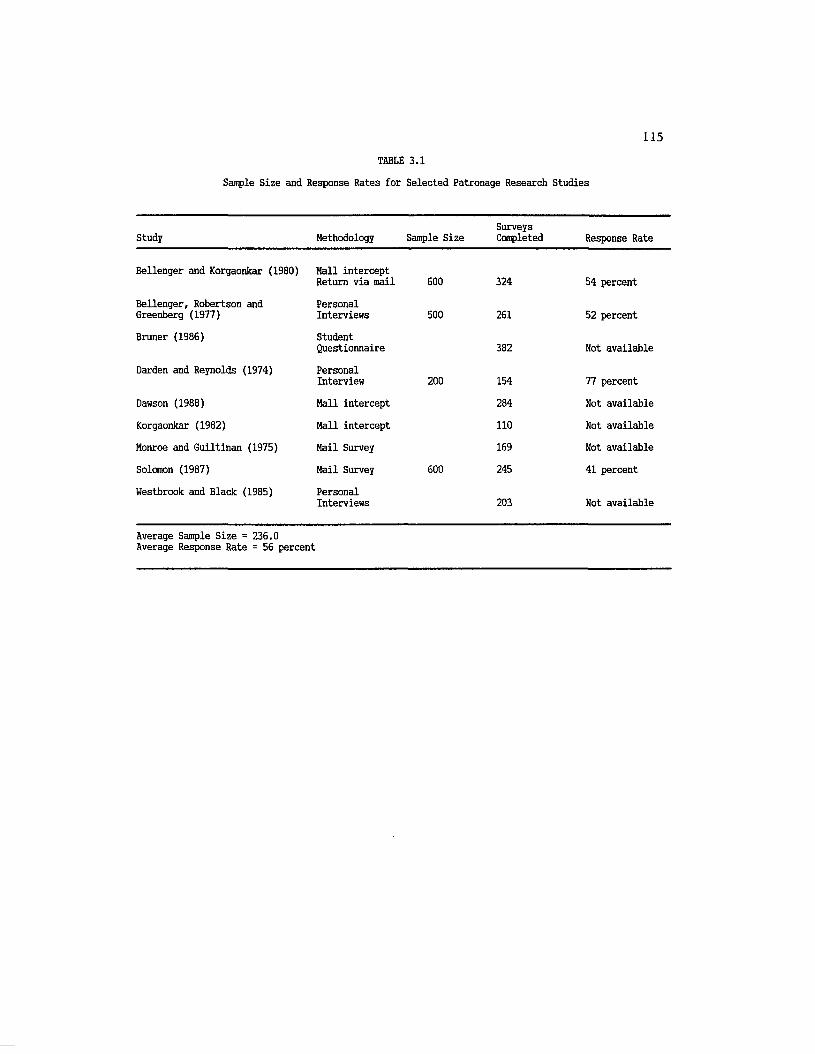
115TABLE 3.1
Sample Size and Response Rates for Selected Patronage Research Studies
Study Methodology Sample SizeSurveysCompleted Response Rate
Bellenger and Korgaonkar (1980) Mall intercept Return via mail 600 324 54 percent
Bellenger, Robertson and Greenberg (1977)
PersonalInterviews 500 261 52 percent
Bruner (1986) StudentQuestionnaire 382 Not available
Darden and Reynolds (1974) PersonalInterview 200 154 77 percent
Dawson (1988) Mall intercept 284 Not available
Korgaonkar (1982) Mall intercept 110 Not available
Monroe and Guiltinan (1975) Mail Survey 169 Not available
Solomon (1987) Mail Survey 600 245 41 percent
Westbrook and Black (1985) PersonalInterviews 203 Not available
Average Sample Size = 236.0 Average Response Rate = 56 percent

116
The Survey Instrument
This section discusses the constructs of interest and their
operationalization in the final questionnaire. Each concept is
discussed in relation both to the conceptual definitions provided in
Chapter Two and its actual measurement. The dissertation questionnaire
is presented in Appendix A. Measures of shopping motivation and
involvement are described separately. Operationalizations of other
variables and constructs of interest are discussed as a group in the
last part of this section. Table 3.2 summarizes operationalizations
used in the dissertation research.
Shopping Motivations
Shopping motivations are defined as unobservable forces
stimulating individuals to interact with the retailing community and
providing direction to their behavior. These are measured in two ways -
- by a Likert scale designed to capture each hypothesized subdimension
and by a four-item scale describing motivation types. The Likert scale
was developed specifically for this research and consists of 67 items
designed to measure the three hypothesized dimensions of motivation:
functional, symbolic, and experiential.
These primary dimensions are proposed to represent 17 specific
subdimensions of motivation which were described in Chapter Two. The
categories of motivation were derived from a review of research on
motivation and patronage and exploratory research consisting of focus
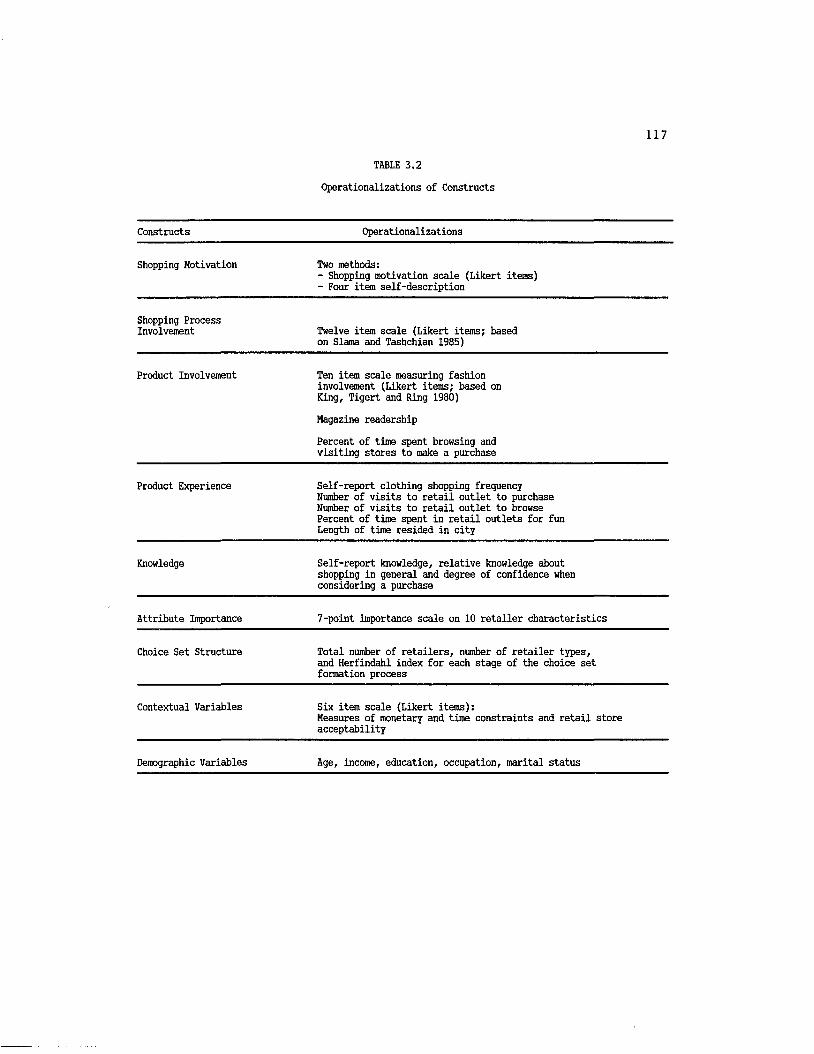
117
TABLE 3.2
Operationalizations of Constructs
Constructs Operationalizations
Shopping Motivation Two methods:- Shopping motivation scale (Likert items)- Four item self-description
Shopping ProcessInvolvement Twelve item scale (Likert items; based
on Slama and Tashchian 1985)
Product Involvement Ten item scale measuring fashion involvement (Likert items; based on King, Tigert and Ring 1980)
Magazine readership
Percent of time spent browsing and visiting stores to make a purchase
Product Experience Self-report clothing shopping frequency Number of visits to retail outlet to purchase Number of visits to retail outlet to browse Percent of time spent in retail outlets for fun Length of time resided in city
Knowledge Self-report knowledge, relative knowledge about shopping in general and degree of confidence when considering a purchase
Attribute Importance 7-point importance scale on 10 retailer characteristics
Choice Set Structure Total number of retailers, number of retailer types, and Herfindahl index for each stage of the choice set formation process
Contextual Variables Six item scale (Likert items):Measures of monetary and time constraints and retail store acceptability
Demographic Variables Age, income, education, occupation, marital status
118
group discussions with a total of 15 females. An initial battery of 154
items was developed to assess the 17 subdimensions of motivation. Where
possible, an attempt was made to employ items developed from other
patronage studies (Darden and Ashton 1974-1975; Darden and Reynolds
1971; Korgaonkar 1984; Monroe and Guiltinan 1975; Raju 1980; Sproles and
Kendall 1986; and Westbrook and Black 1985), however, a majority of
items were composed by the author. All items were scaled according to a
5-point Likert-type format (whereby 5 = strongly agree and 1 = strongly
disagree). These items were tested during Stage 1 of research.
New items were composed for constructs demonstrating poor internal
consistency in Stage 1 and several items were reworded. The resulting
90 item scale was then administered during Stage 2. Following the Stage
2 analyses, several items were deleted and some were written to account
for low internal consistency of the information and power subscales.
The final motivation scale utilized in the dissertation questionnaire
consists of 67 items. This 67 item scale was administered during Stage
3.
Shopping motivation was also assessed using a four-item self
description measure. These items were developed for use during Stage 2
of the research. Respondents were presented with three descriptions,
each pertaining to the hypothesized dimensions of motivation, and asked
to rate how well each description represents them personally using a 7-
item scale (whereby 1 = not at all like me and 7 = very much like me).
For the dissertation questionnaire, a fourth item was added to assess
which of the three descriptions best applied to the respondent.

119
Product Involvement
Product involvement was defined as an ongoing concern with a
product transcending situational influences. Individual1s clothing
involvement was measured initially using a 13-item Likert scale. The
product category, clothing, was selected for several reasons. First,
more research has been reported on clothing purchases in this context
than any other product category (c.f. Bruner 1986; Dawson 1988; Gutman
and Mills 1982). This makes the results reported here more comparable
to past research. Further, clothing retail outlets exhibit tremendous
variability. Individuals involved with clothing and fashion or
exhibiting shopping process involvement are likely to use different
criteria in evaluating stores than those who are less involved. It is
expected that their involvement will be reflected in their choice set
structure. Lastly, products such as clothing are more likely to involve
recreational or browsing behavior which is one component of the
involvement construct.
As used in this research, product involvement is a construct which
affects consumer behavior on an ongoing basis. Further, involvement
varies across individuals, ranging from minimal levels to the extremely
high levels exhibited by consumers such as car enthusiasts, wine
connoisseurs, or clothes horses. In order to achieve content validity
for the scale, the item development process was based on a review of the
product involvement literature. In addition, interviews were held with
clothing conscious individuals, persons presumed to be highly interested
and involved in clothing and therefore able to shed light on the nature
120
of the construct.
This exploratory work resulted in the construction of 13
statements which captured several aspects of involvement noted in the
literature. Items dealt with (1) interest in clothing and fashion (Day
1970; Mitchell 1979) and accompanying readiness to talk about clothing,
(2) the relatedness of clothing to important needs or values (Houston
and Rothschild 1978), and (3) use of one's clothing to express the self-
concept (Lastovicka and Gardner 1979). Several items were obtained from
King, Ring and Tigert (1980), while others were developed by the author.
The scale consisted of items scored according to a five-point Likert-
type format (whereby 5 = strongly agree and 1 = strongly disagree).
This preliminary version of the involvement scale was administered
during Stage 1 of the research process. Based on the results of these
analyses, the scale was reduced to 10 items which was employed in the
dissertation research - Stage 3, to measure clothing involvement.
Shopping Process Involvement (SPI)
While individuals may be differentially involved with product
categories, they may also demonstrate involvement in activities.
Shopping process involvement represents an ongoing concern with shopping
as an activity. Bloch (1981) discusses product involvement as leisure
behavior and notes product involvement may occur in a secondary fashion.
In this case, "the recreational activity or sport is most important and
the motivator for possible involvement in activity-related goods" (1981,
p. 198). Bloch gives as an example the avid hunter who is also a gun
121
collector. In relation to the current research, an avid shopper may
also exhibit involvement in product classes such as clothing. Thus, the
constructs of shopping process involvement and clothing involvement may
be considered complementary constructs which in tandem more completely
explain consumer patronage behavior.
Development of the shopping involvement of consumers has not
advanced as far as research in product involvement. Thus, it was deemed
necessary to develop a measure which captured the dimensions of shopping
process involvement. SPI was proposed in Chapter Two to consist of
three dimensions: recreational involvement, non-traditional outlet
involvement, and catalog shopping involvement. Following a review of
the involvement literature and a careful analysis of the scale developed
by Slama and Tashchian (1985), an initial instrument of 22 items was
developed to capture the proposed dimensions of shopping involvement.
As Slama and Tashchian (1985) propose a unidimensional structure of
purchasing involvement, additional items were written to assess the
extent of non-traditional outlet involvement and catalog shopping
involvement. The scale consisted of items scored according to a five-
point Likert-type format (whereby 5=strongly agree and l=strongly
disagree).
This preliminary version of the SPI scale was administered during
Stage 1 of data collection. During Stage 2 the SPI scale was reduced to
12 items, all of which were employed in Stage 3 as the measure of
shopping process involvement.
122
Other Variables and Constructs
Other variables which were examined in the dissertation research
include: product experience, product knowledge, attribute importance,
choice set structure, contextual items, and demographics. These
measures and their operationalizations will briefly be described.
Experience. Product ejqperience was defined as the sum total of
the knowledge and skills acquired through individual's interaction with
retailers. Measures of product experience consisted of four items: (1)
average annual clothing shopping frequency, (2) number of visits in the
last month to a clothing outlet to make a purchase, (3) number of visits
to a clothing outlet just to browse, and (4) percent of time spent in
clothing stores where the purpose is to have fun or gather information
without a specific purchase objective. A fith indicant of experience
was the length of time an individual had lived in the city. This
measure is a proxy variable for experience as it was thought that a
direct relationship existed between length of time residing and
knowledge of retail outlets. Individuals who had resided in the city
for a long time were expected to have greater knowledge and exposure to
the available retail outlets than those who had recently moved to the
city.
Knowledge. Product knowledge refers to the information a consumer
gains from using or learning about a product or engaging in interactions
with retailers. Measures of product knowledge consisted of nine items
designed to capture (1) respondents general knowledge regarding clothing
retail outlets, (2) respondents' relative knowledge of retail outlets
123
when compared to others, and (3) respondents' degree of confidence when
making a decision regarding the choice of a clothing retail outlet. The
scale consisted of 6 retail knowledge items scored according to a five-
point Likert-type format (whereby 5=extremely knowledgeable and l=not at
all knowledgeable) and 3 shopping confidence items (whereby 5=extremely
confident and l=not at all confident).
Attribute Importance. Retailer characteristics which are
important to individuals in evaluating alternatives were assessed using
a 7-point importance scale of 10 retailer attributes (whereby 1 =
extremely important and 7 = extremely unimportant).
This scale was utilized in Stage 2 of the research. Individuals
were asked how important a set of 21 retailer characteristics were when
deciding where to purchase their clothing. The set of 21 attributes
were derived from a review of the literature on determinant attributes
and attribute importance studies in patronage. The final dissertation
questionnaire included 10 of these attributes.
Choice Set Structure. The choice set formation process represents
the decision process individuals employ to reduce the many and varied
retail alternatives available to a manageable set. The process was
proposed to consist of sets of retail outlets representing awareness,
consideration, action and final outlet choice.
The choice set formation process was studied in Stage 3 by
presenting consumers with a list of 162 available retail outlets. The
outlets consisted of 46 catalog retailers, 7 department store retailers,
22 discount retailers, 77 specialty retailers, and 10 other retailers.
This list was derived after consulting the city Yellow Pages and a list
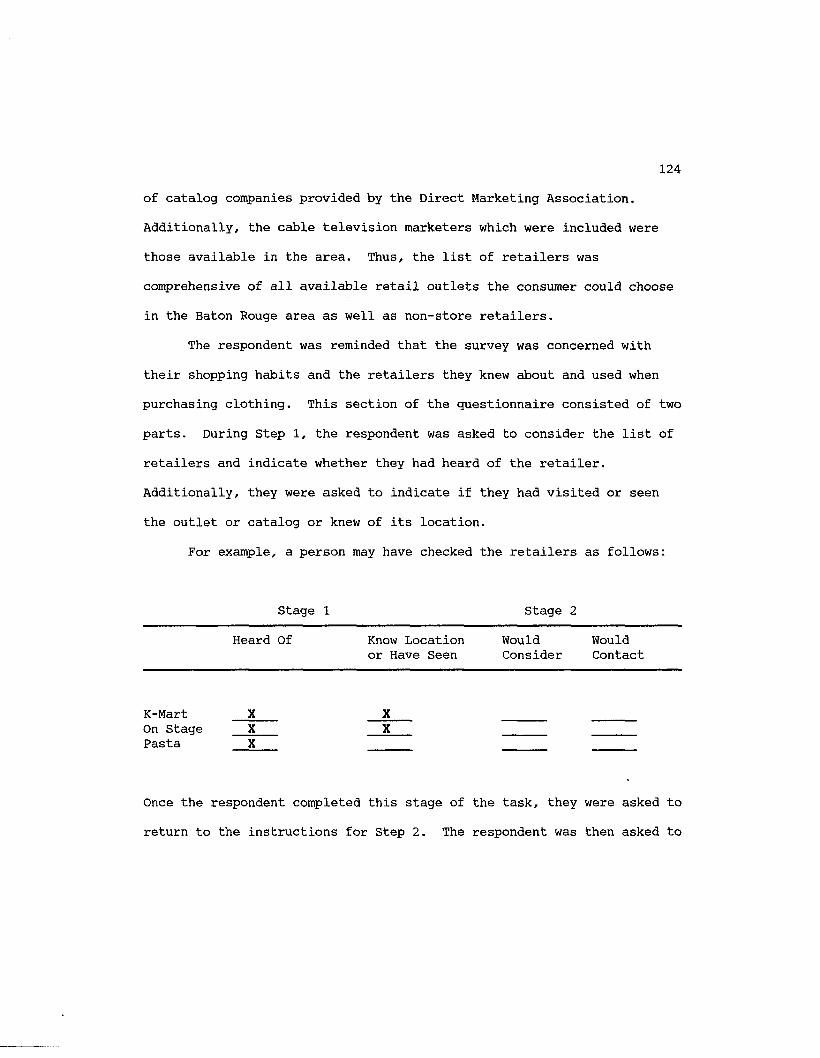
124
of catalog companies provided by the Direct Marketing Association.
Additionally, the cable television marketers which were included were
those available in the area. Thus, the list of retailers was
comprehensive of all available retail outlets the consumer could choose
in the Baton Rouge area as well as non-store retailers.
The respondent was reminded that the survey was concerned with
their shopping habits and the retailers they knew about and used when
purchasing clothing. This section of the questionnaire consisted of two
parts. During Step 1, the respondent was asked to consider the list of
retailers and indicate whether they had heard of the retailer.
Additionally, they were asked to indicate if they had visited or seen
the outlet or catalog or knew of its location.
For example, a person may have checked the retailers as follows:
Stage 1 Stage 2
Heard Of Know Location or Have Seen
WouldConsider
WouldContact
K-Mart On Stage Pasta
XXX
XX
Once the respondent completed this stage of the task, they were asked to
return to the instructions for Step 2. The respondent was then asked to

125
read the following shopping situation:
Shopping Situation
Imagine that you recently celebrated a birthday. A good friend sent you a card along with a check for $150.00 with the strict instructions that you are to spend the money on you. This means that you are to shop for yourself and no one else.
Since the fall season is rapidly approaching, you've decided that this is a good chance for you to buy something in the new fall colors and fabrics. You've decided that this $150.00 will be a good way to purchase some casual clothing items.
The respondent was then asked to review the list of retailers checked in
Step 1 and indicate if they (1) would consider the retailer for this
purchase, and (2) would attempt to contact the retailer — either by
visiting the outlet, browsing through a catalog, watching the cable
shopping network, etc.
For instance, a respondent may have checked the retailers as follows:
Stage 1 Stage 2
Heard Of Know Location Would Wouldor Have Seen Consider Contact
K-Mart X X X ___On Stage X X X_________________ _XPasta X
Thus, respondents' awareness, consideration, and action sets for a
hypothetical shopping situation were elicited. Based on focus group
interviews, the dollar amount of $150.00 was chosen to represent an
amount typically spent on clothing items. While some consumers may

126
spend less and certain consumers might spend more, this amount was
deemed appropriate as an average figure. Target Marketing (1989)
reports average order purchases for leading direct marketers. Sales for
clothing retailers ranged from $40 an order for Night n1 Day Intimates
to $106 an order for Spiegel. The dollar amount chosen was higher to
reduce any financial risk the respondent might have associated with the
purchase. The respondent received the money as a gift and was
instructed to spend the money on themselves. Therefore, financial
constraints were reduced for this purchase situation to ensure the
widest possible selection of retailers in each choice set.
Measures of an individual's choice set structure for each type of
choice set consists of three indicator variables. These measures have
been used in studies exploring the evoked sets of consumers as well as
choice sets (e.g. Brisoux and Laroche 1980; Potter 1979). Specifically,
choice set structure will be assessed by: (1) the number of total
retailers, (2) the number of types of retailers, and (3) the Herfindahl
index of relative market share. The number of total retailers is found
by summing the columns — the number of retailers each respondent
included in their awareness, consideration, and action sets. The number
of types of retailers reflects the number of catalogs, department,
discount, specialty, and other retailers which comprised individuals'
sets.
The Herfindahl index represents the relative market share a set of
retailers has when all available retailers are considered. The
Herfindahl index (H) is calculated by summing the squares of the share
of purchases going to each retailer. The formula is

127
nH = S (SO2
where:
H = the Herfindahl index.
S± = share of purchases given by a group of respondents to store i.
n = total number of stores available.
The minimum level of the index is:
Hir, = 1/n
This level occurs when each of the n retail outlets achieves an equal
share of the purchases. The maximum of the index, H™* = 1 when one
retail outlet receives all product purchases.
For example, when a consumer has 3 retail outlets available and
patronizes each store equally, each retailer receives a 33.3 percent
share of the consumer's purchases. The value of the Herfindahl index
for this consumer would be found by squaring the shares and adding them
across the stores: H = [(.333)z + (,333)z + (.333)z] = .33. The
minimum level of the index for this example would be Hml„ = 1/3 = .33.
Contextual Variables. Contextual or situational items were
employed to measure the influence of three factors: (1) the amount of
time available to devote to shopping related activities, (2) the amount
of money available for purchasing, and (3) the acceptability of retail
alternatives. A six item scale was developed to capture these
influences and employs a five-point Likert-type format (whereby 5 =
strongly agree and 1 = strongly disagree).
Demographics. Standard demographic measures were utilized to
determine age, education, occupation, income and marital status of
respondents.
128
Data Analysis
This section is divided into five sections. The first describes
the scale development procedures employed for the motivation and
involvement constructs. Then, reliability and validity assessment are
presented, followed by discussions of confirmatory factor analysis and
structural equation models. The final section describes how the
research hypotheses will be tested.
Scale Development Process
Development of the shopping motivation, product involvement and
shopping process involvement scales represents a multistage process as
depicted in Figure 3.1. Churchill (1979) presents a methodology for
developing better measures of marketing constructs employing
standardized psychometric procedures. In developing the measures in
this study, every effort was made to follow the procedures as outlined
to ensure construct reliability and to test for validity.
As discussed earlier, the research consisted of three stages of
data collection. These stages are summarized in Figure 3.2. In Stage
1, an initial pool of items were tested using standard psychometric
procedures. During Stage 2, additional items were constructed and
administered to a sample of respondents. Following scale item analysis,
final measures were constructed and given to a third sample of
respondents. The criteria utilized for evaluating the scales for
internal consistency and validity will be discussed in the following
129
section.
Reliability Assessment
Reliability can be defined as the degree to which measures are
free from random or chance error (Peter 1979). It is important that
scales be reliable so that they may be repeated with consistent results
— using various samples and situations. There are three basic methods
for assessing the reliability of a measurement scale: test-retest,
alternative forms and internal consistency. For the measures used in
the dissertation research, internal consistency reliability was
assessed. Coefficient alpha is the basic criterion for determining the
reliability based on internal consistency. Alpha typically provides an
appropriate estimate of reliability since the major source of
measurement error is because of the sampling of content (Nunnally 1978).
There are no established standards of reliability assessment but
some guidelines do exist. Nunnally (1978) suggests that reliability
coefficients of .70 in the early stages of research to be acceptable.
Peter (1979) surveyed reliability assessment in five marketing
publications over approximately a five-year period. Most of the studies
reported estimates of internal consistency although some used test-
retest reliability coefficients. The median test-retest correlation was
approximately .68 and the median internal consistency correlation
(primarily Cronbach's alpha) was .72. These coefficients cannot be
considered strict guidelines but represent typical reliability
coefficients found in marketing research.
With the increased use of structural equation models (primarily
LISREL), researchers have begun to utilize individual item reliabilities
130FIGURE 3.1
Procedure for Measure Development1
Recommended Coefficients or Techniques
Specify domain» of construct + Literature search
Generate sample Literature searchof items Focus group interviews*
Collectdata
Purify Coefficient alpha“ measure Factor analysis
+Collectdata*
Assess Coefficient alphareliability Confirmatory factor analysis*
Assess Criterion validityvalidity Nomological validity
3EDevelopnorms Average and other statistics
— — ——— * summarizing distribution of -scores
1 Adapted from Churchill (1979, p. 66)
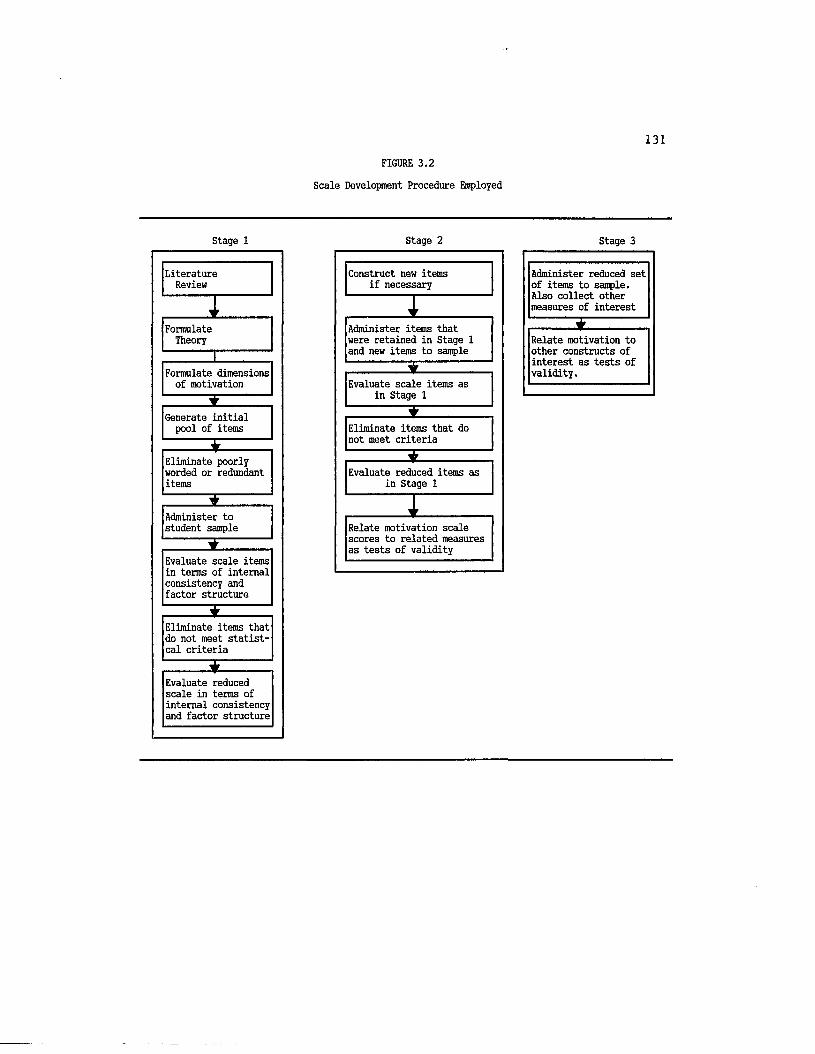
FIGURE 3.2
Scale Development Procedure Employed
131
Stage 1
Formulate dimensions of motivation
Administer to student sample
LiteratureReview
Generate initial pool of items
FormulateTheory
Eliminate poorly worded or redundant items
Eliminate items that do not meet statist- cal criteria
Evaluate reduced scale in terms of internal consistency and factor structure
Evaluate scale items in terms of internal consistency and factor structure
Stage 2
Eliminate items that do not meet criteria
Construct new items if necessary
Evaluate scale items as in Stage 1
Evaluate reduced items as in Stage 1
Relate motivation scale scores to related measures as tests of validity
Administer items that were retained in Stage 1 and new items to sample
Stage 3
Administer reduced set of items to sample. Also collect other measures of interest
t. , . , . . .
Relate motivation to other constructs of interest as tests of validity.
132
provided by the programs. Reliability is calculated as the squared
multiple correlation and estimates the internal consistency of each
construct indicator. The LISREL reliability estimates are actually the
squared reliability coefficients. Therefore, a LISREL reliability
coefficient of .50 corresponds to an alpha value of .70.
The computation of coefficient alpha assumes the items form a
unidimensional set and also have equal reliabilities. Thus, computing
alpha with unequal reliabilities will lead to the underestimation of the
reliability of the total score (Gerbing and Anderson 1988). The LISREL
computation of reliability does not assume equal reliability. However,
the difference is not significant and as noted by Gerbing and Anderson
(1988) "In practice, unless the number of items on the scale is very
small and/or the item reliabilities are very discrepant, the
underestimation of the composite reliability by alpha is likely to be of
no practical consequence" (p. 190).
For this research, the guidelines established in marketing and
psychology were utilized in assessing reliability. Construct
reliability coefficients in range of .70 to .80 are considered
sufficient. When scales reach this level of reliability, no additional
effort was made to increase their internal consistency. As Nunnally
(1978) notes, increasing reliabilities much beyond .80 is often an
inefficient use of time and research funds. Further, the primary way to
make tests more reliable is to make them longer. However, one rule of
scientific theory is parsimony — or simplicity (Zeller and Carmines
1980). Thus, an effort was made to achieve internally consistent
measures with the fewest number of indicators per construct.

133
Validity Assessment
In addition to testing the reliability of a measure, validity
assessment must also be conducted. Validity refers to the degree to
which instruments measure the constructs which they are purported to
measure. Thus, a measure is said to be valid when the differences in observed scores reflect true differences on the characteristic being
assessed and nothing else. While the definition of validity seems
straightforward, there are many different types of validity within this
broad definition.
Content validity concerns the extent to which a set of items taps the content of some domain of interest. The degree to which the items
reflect the full domain of content represents the content validity of
the scale. As stated by Zeller and Carmines (1980), obtaining content
validity involves two interrelated steps: (1) specifying the domain of
content, and (2) construction and/or selecting items associated with the
domain of content (1980, p. 78). The major problem with this type of
validity is that there are no agreed-upon criteria for establishing
whether, in fact, a measure has attained content validity. Nunnally
(1967, p. 82) further asserts "Inevitably content validity rests mainly
on appeals to reason regarding the adequacy with which important content
has been cast in the form of test items." For this research, the items
utilized were examined with regard to the extent to which they are
associated with the relevant domain.
A second measure of validity is criterion-related validity. Criterion-related validity concerns the correlation between a measure

134
and some criterion variable of interest. For example, the shopping
motivation scale could be validated by demonstrating that for a sample
of respondents, there is a high correlation between their scores on the
measure and their actual shopping frequency. Notice that criterion-
related validity is solely determined by the degree of correspondence
between the measure and its criterion(s). If the correlation is high,
the measure is considered to be valid for that criterion.
Few guidelines exist for evaluating validity coefficients.
Campbell and Fiske (1959), for example, suggest:
. . . that the validation process be viewed as an aspect of an ongoing program for improving measuring procedures and that the 'validity coefficients' obtained at any one stage in the process be interpreted in terms of gains over preceding stages and as indicators of where further effort is needed (p. 120).
A common guideline used in marketing studies of scale validation is
whether the correlation coefficient achieves statistical significance
(c.f. Szybillo, Binstock and Buchanan 1979; Lundstrom and Lamont 1976;
Zaichkowsky 1985a). This guideline is not sufficient however, since
statistical significance can be achieved with small correlations if the
sample size is large enough. Ajzen and Fishbein (1980) suggest general
guidelines to use in evaluating correlations. In the social sciences,
they suggest correlations around .30 to be acceptable and correlations
below this level (even if statistically significant) to be of little
practical value.
Therefore, for this research, in testing criterion-related
validity, significant correlations of .30 or above will provide evidence
that the measure is indeed assessing the construct of interest and
135
related to the criterion.
Additional evidence of validity is provided by a measures'
construct validity. Cronbach and Meehl (1955) note that "Construct
validiation takes place when an investigator believes his instrument
reflects a particular construct to which are attached certain meanings"
(p. 290). Zeller and Carmines (1980) propose construct validation to
consist of three stages. First, theoretical relationships between
constructs must be specified, then empirical relationships between the
measures of the constructs can be examined. Finally, the empirical
evidence must be interpreted in terms of how it clarifies the construct
validity of the particular measure. Thus, the process of construct
validation is theory-laden.
Peter (1981) states construct validity to be a necessary condition
for theory development and testing since it pertains to the degree of
correspondence between constructs and their measures. One must note,
however that a single study does not establish construct validity.
Cronbach (1951) notes that construct validation is an ever-extending
process of investigation and development and perhaps more stringently
tested through the development and testing of a "nomological network".
In this manner, constructs are related to each other in an increasingly
complex network of hypotheses and relationships.
The primary means of validity assessment for the dissertation
research involves the testing for construct validity. Evidence of
construct validity will be provided to the extent hypothesized
relationships between constructs are statistically significant and when
correlations are used, greater than .30.
136
Confirmatory Factor Analysis and Structural Equation Modeling
In marketing and the social sciences, confirmatory factor analysis
is rapidly replacing the use of exploratory factor analysis. Using a
confirmatory factor model, the researcher may impose constraints to
determine (1) which pairs of factors are correlated, (2) which observed
variables are affected by which common factors, (3) which observed
variables are affected by a unique factor, and (4) which pairs of unique
factors are correlated. Additionally, statistical tests can be used to
determine if the sample data are consistent with the constraints or
theory — whether the data confirm the substantively generated model (Long 1983).
Structural equation modeling represents an extension of
confirmatory factor analysis. A model is provided which attempts to
explain the relationships among a set of observed variables in terms of
a generally smaller number of unobserved, or latent variables. First,
the observed variables are linked to latent variables through a factor
analytic model. Second, the causal relationships among these latent
variables are specified through a structural equation model. Thus, the
testing of the model involves an examination of the measurement model
and the structure (or specified relationships) of the constructs.
In the dissertation research, confirmatory factor analysis and
structural equation modeling will be employed to test certain
hypotheses. The LISREL VI program (Joreskog and Sorbom 1984) will serve
as the estimation program for all analyses.
Assessing Overall Model Fit. In evaluating the adequacy of the
137
factor and structural equation models several indicators will be used.
First, the results should be examined to see if any anomolies exist.
The most common problems are negative error variances, correlations
greater than one, and extremely large parameter estimates. Should these
arise, one should check for proper specification, identification, or
input errors. When one is assured the output is free of these problems,
global measures of fit can be examined.
The chi-square goodness of fit statistic allows a test of the null
hypothesis that a given model provides an acceptable fit of the observed
data. Values of the chi-square larger than the critical value result in
the rejection of the null hypothesis and the conclusion that the
proposed model did not generate the observed data; values smaller than
the critical value result in the acceptance of the null hypohtesis and
the conclusion that the proposed model did generate the observed data.
The use of the chi-square goodness-of-fit index in evaluating
models has been criticized by many (c.f. Darden 1981; Fornell and
Larcker 1981; Fornell 1983). Specifically, this statistic is not
appropriate for evaluating model fit because it reverses the traditional
role of hypotheses in statistical theory. If the null hypothesis is
rejected, the research hypothesis is also rejected. As Fornell (1983)
notes, the real problem with this is that the ability (power) to reject
the research hypothesis is not known. The implication of low power in
traditional hypothesis testing is that one's model may be rejected when
it is correct. Moreover, in structual equation modeling (SEM), a model
may find support when it is incorrect.
It should be noted that the chi-square goodness-of-fit test refers
138
only to a comparison between two covariance matrices; it does not
support conclusions about the significance of variable relationships in
the model. More perplexing is the fact that low and insignificant chi-
squares that indicate a good fit may also imply low and insignificant
construct relationships. As Fornell and Larcker (1981) observed, weak
observed relationships among variables increase the probability of
obtaining a good fit. Therefore, if correlations are low enough to
start with, there is high probability that an incorrect model will be
retained.
Joreskog and Sorbom (1984) propose an adjusted goodness-of-fit
index (AGFI) which indicates the relative amount of variances and
covariances jointly accounted for by the hypothesized model. Bagozzi
and Yi (1988) suggest values equal to or greater than about .9 suggest
meaningful models from a pragmatic point of view, but caution that this
is only a rough guideline.
Another measure of overall fit is provided by the root mean square
residual (RMSR). This index indicates the average of the residual
variances and covariances and can be used to compare the fits of
different models to the same data. Bagozzi and Yi (1988) assert that
these values should be "low". In marketing studies, RMSR values in
range of .03 to .09 are often considered acceptable (c.f. Han 1989;
McQuiston 1989).
A final measure of overall model fit is the normed fit index (NFI)
developed by Bentler and Bonett (1980). This index provides the
relative decrease in lack of fit between two nested models, one less
restricted than the other. This model is often termed a "null" model
139
which represents the most restricted model where the variance/covariance
matrix of the observed variables is hypothesized as a diagonal matrix
with all off-diagonal elements equal to zero.
In evaluating the model fits of the dissertation data, AGFI and
NFI values of .90 or higher and RMSR values less than .07 will be
considered acceptable evidence for model fit even if the chi-square
value is large and significant.
Internal Structure Model Fit. While the global measures of fit
attest to the overall adequacy of a model, they do not provide explicit
information as to the nature of individual parameters and other aspects
of the internal structure of a model. Assessing the internal structure
primarily involves the inspection of the measurement equations and their
associated reliabilities. Reliability is provided by individual item
reliabilities, composite reliabilities, and the average variance
extracted from a set of measures of a latent variable. Bagozzi and Yi
(1988) assert that internal structure model fit is provided when items
exhibit high individual item reliabilities (e.g. > .5) and composite
reliabilities (e.g. > .6). Additionally, the average variance extracted
from the set of indicators should be greater than .5. Further,
significant parameter estimates which confirm hypotheses provide
evidence of model fit as well as normalized residuals less than 2.0.
Table 3.3 provides a review of evaluation criteria which will be used in
evaluating the proposed model fits.
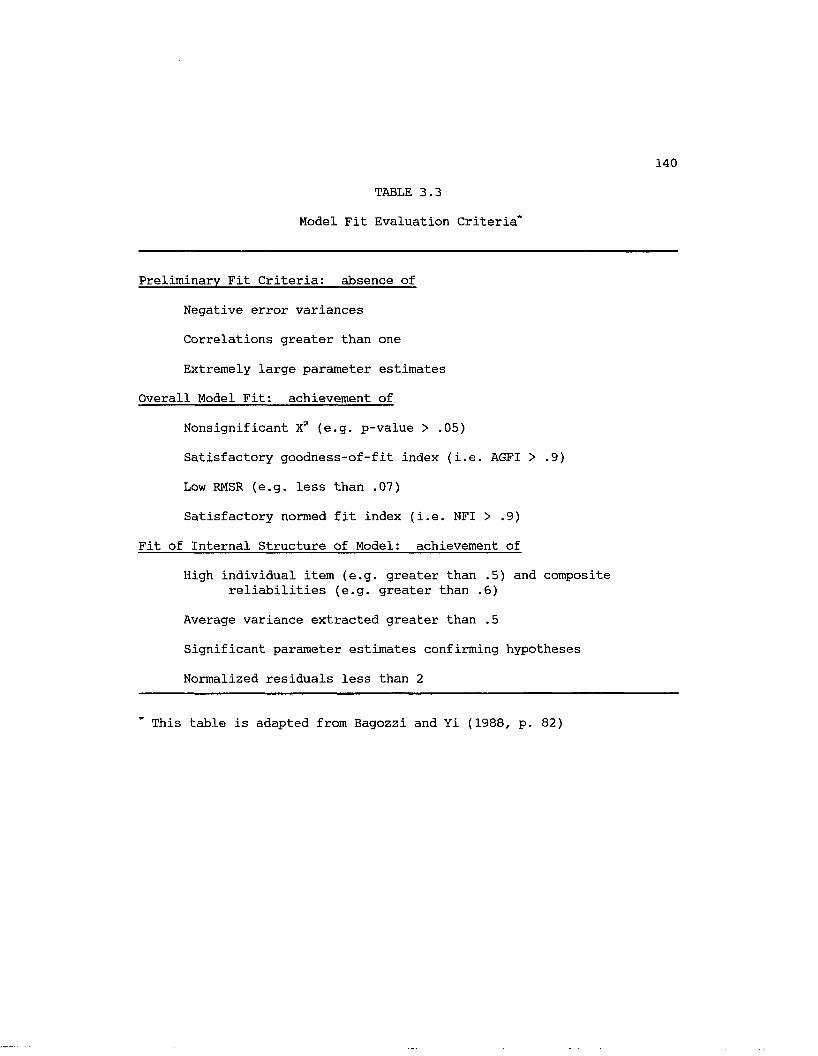
140
TABLE 3.3
Model Fit Evaluation Criteria*
Preliminary Fit Criteria: absence of
Negative error variances
Correlations greater than one
Extremely large parameter estimates
Overall Model Fit: achievement of
Nonsignificant X2 (e.g. p-value > .05)
Satisfactory goodness-of-fit index (i.e. AGFI > .9)
Low RMSR (e.g. less than .07)
Satisfactory normed fit index (i.e. NFI > .9)
Fit of Internal Structure of Model: achievement of
High individual item (e.g. greater than .5) and composite reliabilities (e.g. greater than .6)
Average variance extracted greater than .5
Significant parameter estimates confirming hypotheses
Normalized residuals less than 2
This table is adapted from Bagozzi and Yi (1988, p. 82)
Hypothesis Tests
141
Analysis of the dissertation research will be discussed for each
stated hypothesis. Individual hypothesis test analyses will be
discussed first followed by a section on joint hypothesis testing
utilizing structural equation modeling. When the analyses involve
assessment of reliability, validity, or the testing of a structural or
confirmatory factor model, the criteria given earlier in this chapter
will be used to evaluate their appropriateness. Otherwise, statistical
criteria will be discussed separately for each hypothesis. Table 3.4
summarizes each research hypothesis and requisite statistical analysis
to be conducted.
Individual Hypothesis Tests
Hypotheses HI to H4. The hypotheses proposing the dimensionality
of consumer shopping motivation will be tested using confirmatory factor
analysis. Prior to analysis, principal components factor analysis and
Cronbach's alpha will be conducted to determine the internal consistency
of each subdimension. If any items require deletion or placement in
other subscales, changes will be made before confirmatory analysis is
undertaken. The Chi-square goodness of fit index, adjusted goodness of
fit, and root mean square residual will be utilized as measures of
factor structure. In addition, item and construct reliabilities will be
calculated (Fornell and Larcker 1981).
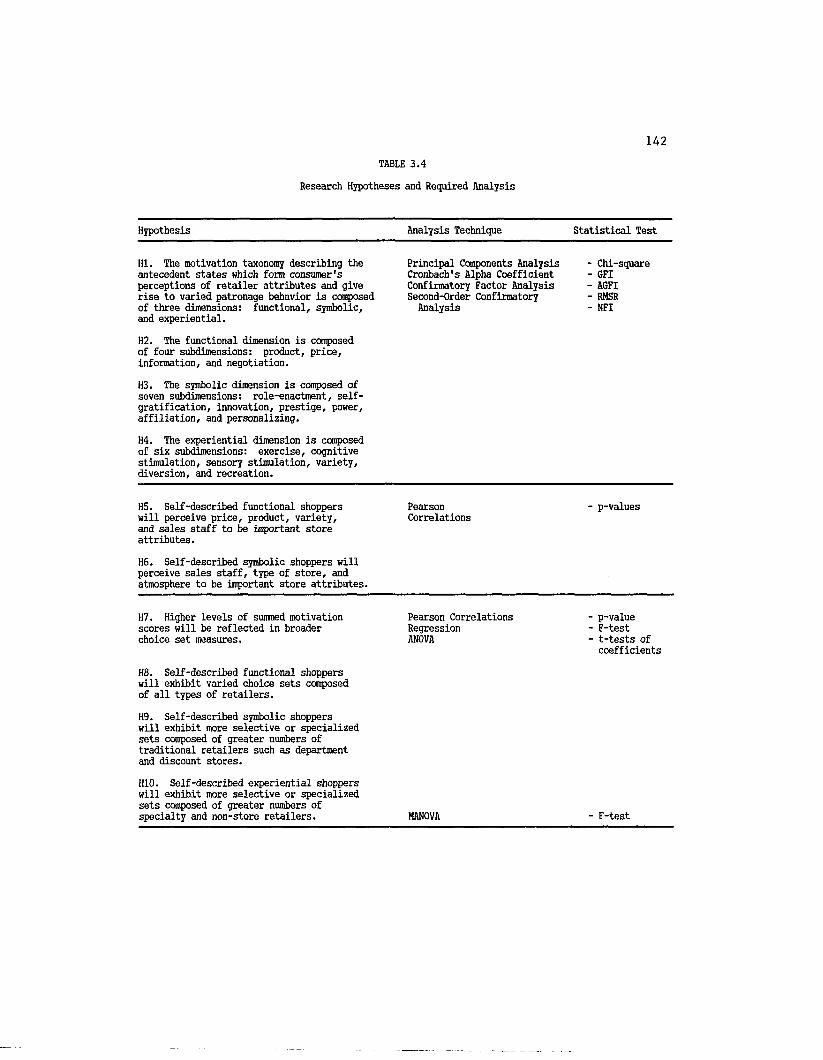
142TABLE 3.4
Research Hypotheses and Required Analysis
Hypothesis Analysis Technique Statistical Test
HI. The motivation taxonomy describing the antecedent states which form consumer's perceptions of retailer attributes and give rise to varied patronage behavior is composed of three dimensions: functional, symbolic, and experiential.
Principal Components Analysis Cronbach's Alpha Coefficient Confirmatory Factor Analysis Second-Order Confirmatory Analysis
- Chi-square- GFI- AGFI- RMSR- NFI
H2. The functional dimension is composed of four subdimensions: product, price, information, and negotiation.
H3. The symbolic dimension is composed of seven subdimensions: role-enactment, self- gratification, innovation, prestige, power, affiliation, and personalizing.
H4. The experiential dimension is composed of six subdimensions: exercise, cognitive stimulation, sensory stimulation, variety, diversion, and recreation.
H5. Self-described functional shoppers will perceive price, product, variety, and sales staff to be important store attributes.
PearsonCorrelations
- p-values
H6. Self-described symbolic shoppers will perceive sales staff, type of store, and atmosphere to be important store attributes.
H7. Higher levels of summed motivation scores will be reflected in broader choice set measures.
Pearson CorrelationsRegressionANOVA
- p-value- F-test- t-tests of coefficients
H8. Self-described functional shoppers will exhibit varied choice sets composed of all types of retailers.
H9. Self-described symbolic shoppers will exhibit more selective or specialized sets composed of greater numbers of traditional retailers such as department and discount stores.
H10. Self-described experiential shoppers will exhibit more selective or specialized sets composed of greater numbers of specialty and non-store retailers. MANOVA - F-test
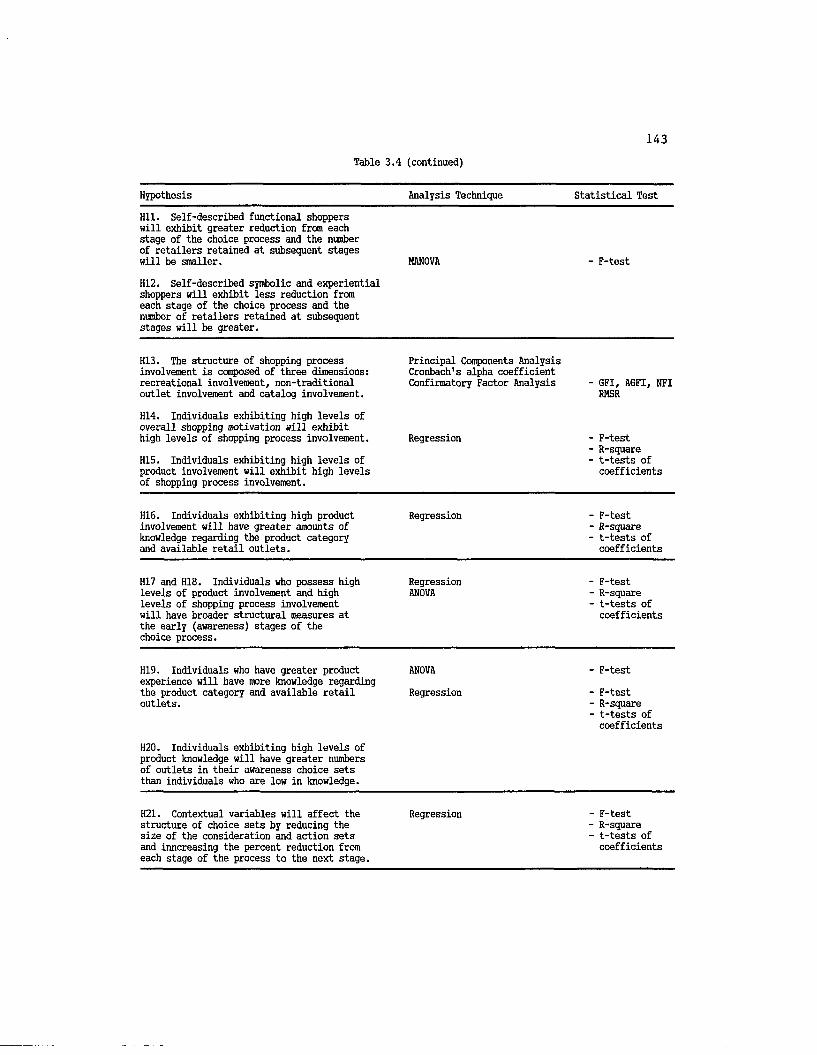
143Table 3.4 (continued)
Hypothesis Analysis Technique Statistical Test
Hll. Self-described functional shoppers will exhibit greater reduction from each stage of the choice process and the number of retailers retained at subsequent stages will be smaller. MANOVA - F-test
H12. Self-described symbolic and experiential shoppers will exhibit less reduction from each stage of the choice process and the number of retailers retained at subsequent stages will be greater.
H13. The structure of shopping process involvement is composed of three dimensions: recreational involvement, non-traditional outlet involvement and catalog involvement.
Principal Components Analysis Cronbach's alpha coefficient Confirmatory Factor Analysis - GFI, AGFI, NFI
RMSR
H14. Individuals exhibiting high levels of overall shopping motivation will exhibit high levels of shopping process involvement.
H15. Individuals exhibiting high levels of product involvement will exhibit high levels of shopping process involvement.
Regression - F-test- R-square- t-tests of coefficients
H16. Individuals exhibiting high product involvement will have greater amounts of knowledge regarding the product category and available retail outlets.
Regression - F-test- R-square- t-tests of coefficients
H17 and H18. Individuals who possess high levels of product involvement and high levels of shopping process involvement will have broader structural measures at the early (awareness) stages of the choice process.
RegressionANOVA
- F-test- R-square- t-tests of coefficients
H19. Individuals who have greater product experience will have more knowledge regarding the product category and available retail outlets.
ANOVA
Regression
- F-test
- F-test- R-square- t-tests of coefficients
H20. Individuals exhibiting high levels of product knowledge will have greater numbers of outlets in their awareness choice sets than individuals who are low in knowledge.
H21. Contextual variables will affect the structure of choice sets by reducing the size of the consideration and action sets and inncreasing the percent reduction from each stage of the process to the next stage.
Regression - F-test- R-square- t-tests of coefficients
144
Hypotheses H5 and H6. These hypotheses relate the three
motivation dimensions to attribute importance ratings. The hypotheses
state that depending upon the dominance of specific motivation
dimensions, certain attributes will be considered important by these
individuals. To test this hypothesis, individuals' summed motivational
scores will be correlated with the 10 attribute importance measures.
Significant correlations greater than .30 will signify meaningful
relationships and support for the hypotheses.
Hypothesis H7. Higher levels of overall motivation are proposed
to be reflected in broader choice set structure measures. Individuals
exhibiting higher levels of overall motivation are expected to include a
greater number of alternative retailers at each stage in the choice
process. Summated motivation scores will be related to the three
measures of choice set structure discussed in a previous section. These
analyses will be correlational in nature.
Regression analysis will be utilized to determine if higher levels
of overall motivation influence the size of individuals' choice sets.
Choice set structure measures will be the dependent variables in the
analysis with summed motivation as the independent variable. Using a
stepwise approach, the effects of motivation will be analyzed while also
controlling for other possible explanatory variables. The standard F-
test and coefficient of determination (R3) as well as the Rz change
percentage will reflect the significance of the selected independent
variables in predicting structure.
A second analysis will consist of segmenting the respondents into
two groups based on their motivation score. The sample will be divided
145
based on a median-split into approximately equal groups denoting low and
high overall motivation. Using the choice set measures as dependent
variables, motivation group differences will be investigated using
analysis of variance (ANOVA). Additionally, the effects of other
possible explanatory variables will be determined using analysis of
covariance (ANCOVA).
Hypotheses H8, H9 and H10. These hypotheses relate dominant
motivation dimensions to choice set structure specialization. Dominant
motivations will be assessed in Hypotheses H8 to H10 by again utilizing
respondents' self-described motivation type. Specialization will be
reflected by individuals' measures of structure denoting the number of
types of retailers, the number of retailers per type included in each
choice set, and the Herfindahl index. Small values will indicate
greater specialization as individuals exhibit choice preference for
fewer types of retailers or a larger number of retailers for a specific
type of alternative. MANOVA will be utilized to determine differences
in choice set structure for the three motivation groups.
Hypotheses Hll and H12. These hypotheses relate dominant
motivation dimensions to measures which indicate reduction in choice set
structure from one stage to the next. The structural measure which will
be used is the number of total retailers per stage of the choice
process. Reduction percentage will be calculated as the difference
between the sizes of these numbers at later stages in the choice
process. Reduction will be assessed as the individual moves from
awareness to consideration, consideration to action, and awareness to
action. Thus three measures of reduction will be obtained. MANOVA will
146
be used to determine if differences in reduction are significant between
the three motivation groups.
Hypothesis H13. This hypothesis concerns the proposed
dimensionality of shopping process involvement. Shopping process
involvement is proposed to consist of three dimensions: recreational
involvement, non-traditional outlet involvement, and catalog
involvement. Principal components factor analysis using both orthogonal
and oblique rotations will be employed to determine the structure of
shopping process involvement. In addition, scale reliability will be
calculated for each subscale and the total scale. Amount of variance
explained by the factor analysis will provide evidence for the existence
of the proposed structure. Confirmatory factor analysis will also be
conducted to assess the internal structure of the measures as well as
the overall fit of the data to the proposed three-factor model
structure.
Hypothesis H14 and H15. These hypothesess specify the
relationship between shopping motivation and product involvement and
shopping process involvement. Individuals exhibiting high levels of
overall motivation are ejected to exhibit high levels of shopping
process involvement. Similarly, individuals exhibiting high levels of
product involvement are expected to be shopping process involved. These
hypotheses will be tested using regression analysis.
Hypothesis H16. This hypothesis states individuals who exhibit
high product involvement will have greater amounts of knowledge
regarding the product category and available retail outlets. Regression
analysis will be performed with knowledge as the dependent variable to
147
test this hypothesis. Stepwise regression will also be used to
determine the significance of clothing involvement when other variables
are included in the model.
Hypothesis H17 and H18. These hypotheses predict individuals
possessing high levels of product involvement and shopping process
involvement will have broader structural measures at the early
(awareness) stage of the choice process. Simple regression analysis and
a stepwise regression analysis which controls for other variables will
be employed to test these hypotheses.
In addition ANOVA will be used to determine if differences in
choice set size if found for high and low clothing involved individuals.
The median clothing involvement score will be utilized to divide
respondents into the two groups.
Hypothesis H19. This hypothesis states individuals who have
greater product experience will have more knowledge regarding the
product category and available retail outlets. Regression analysis will
be used to predict knowledge level with experience as the independent
variable.
Hypothesis H20. This hypothesis states individuals exhibiting
high levels of product knowledge will have greater numbers of stores in
their awareness set than individuals who are low in knowledge.
Regression analysis will be used to predict the number of retailers
included in the awareness set using knowledge measures as independent
variables.
Hypothesis H21. This hypothesis states that contextual variables
will affect the structure of choice sets by reducing the size of the
148
sets and increasing the percentage of reduction from each stage of the
process to the next stage. Contextual influences are measured using a
six item scale. Choice set size will be measured by the number of
retailers and the number of types of retailers in each choice set. The
percent reduction will be assessed using the three measures discussed
for hypotheses Hll and H12. As tests of this hypothesis, regression
analysis will be performed using the measures of structure and reduction
as dependent variables and the contextual measures as independent
variables.
Structural Model Tests
Many of these hypotheses can be tested jointly through the use of
a structural equation model which specifies the linkages between
observed variable indicators and latent constructs as well as causal
paths between constructs. The proposed patronage model will be tested
using LISREL VI. Model fit and internal structure will be assessed
using the guidelines established earlier in this chapter. Figure 3.3
depicts the model to be tested and the specific hypotheses which will be
examined.
Presentation of Results. The primary findings of this research
will be presented in three separate results chapters. Chapter Four will
discuss sample characteristics, the scale development of the shopping
motivation, product involvement and clothing involvement measures.
Reliability and validity statistics will also be reported. Chapter Five
presents descriptive statistics and a discussion of choice set structure
149
findings. The final results chapter. Chapter Six will present tests of
the dissertation hypotheses.
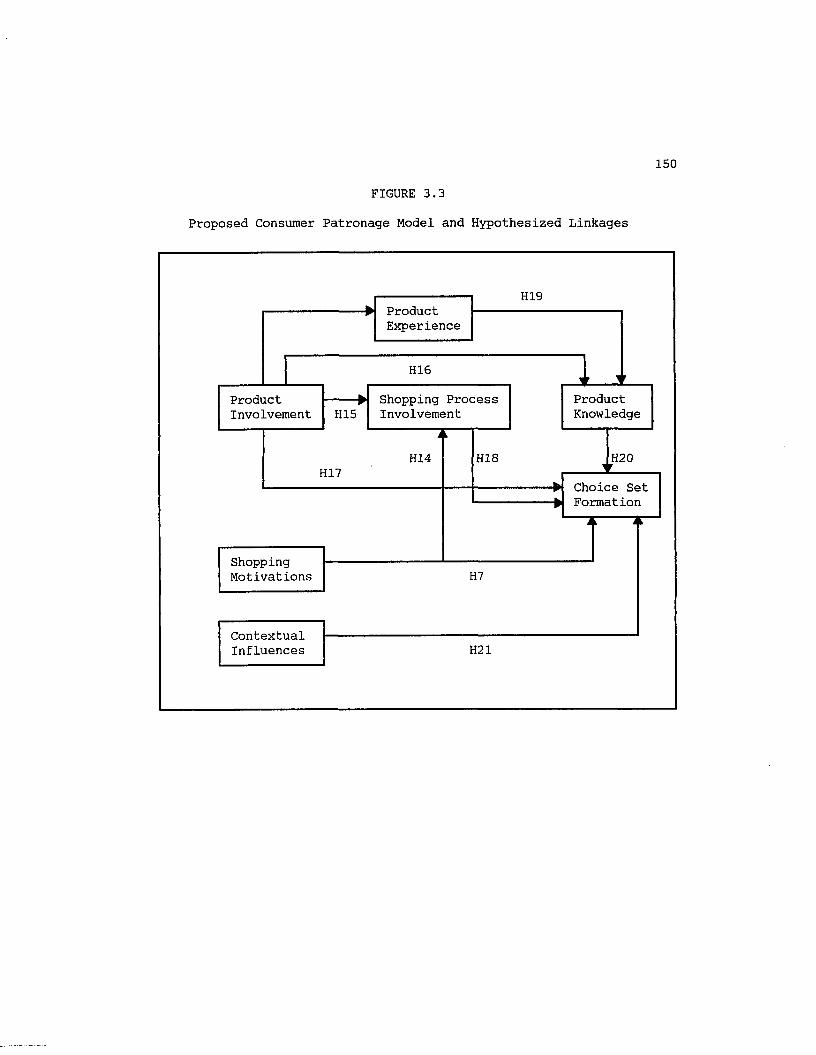
150
FIGURE 3.3
Proposed Consumer Patronage Model and Hypothesized Linkages
H19
H16
H15i i
H14 H18 H20H17
H7
H21
ProductKnowledge
ProductExperience
Choice Set Formation
ProductInvolvement
ContextualInfluences
ShoppingMotivations
Shopping Process Involvement

CHAPTER FOUR
Sample Characteristics and Scale Development Results
This chapter begins with a section assessing the characteristics
and representativeness of the obtained sample. This is followed by a
section which presents an overview of reliability and validity
assessment. Scale development analyses for the motivation and
involvement measures are then discussed highlighting tests of
reliability and validity. The chapter concludes with a summary of the
findings.
Sample Characteristics
The population from which the sample was drawn consisted of adult
females aged 18 or older in the Baton Rouge, Louisiana, metropolitan
area. According to 1984 U.S. Census reports, the population for this
area is 537,972. The population is approximately equal in
representation of males to females with 95 males per 100 females. The
Baton Rouge metropolitan area is predominantly white (71%) with black's
representing 28% of the population. Most of the households are composed
of married couples (80.7%). Single adult households represent 20% of
the population and 15.7% of households are headed by a single female.
In 1982, 52% of families had two or more workers and the median family
income was $19,109. These characteristics are presented in Table 4.1
and compared to the dissertation sample to assess representativeness.
Where possible, chi-square tests were calculated to test for differences
151
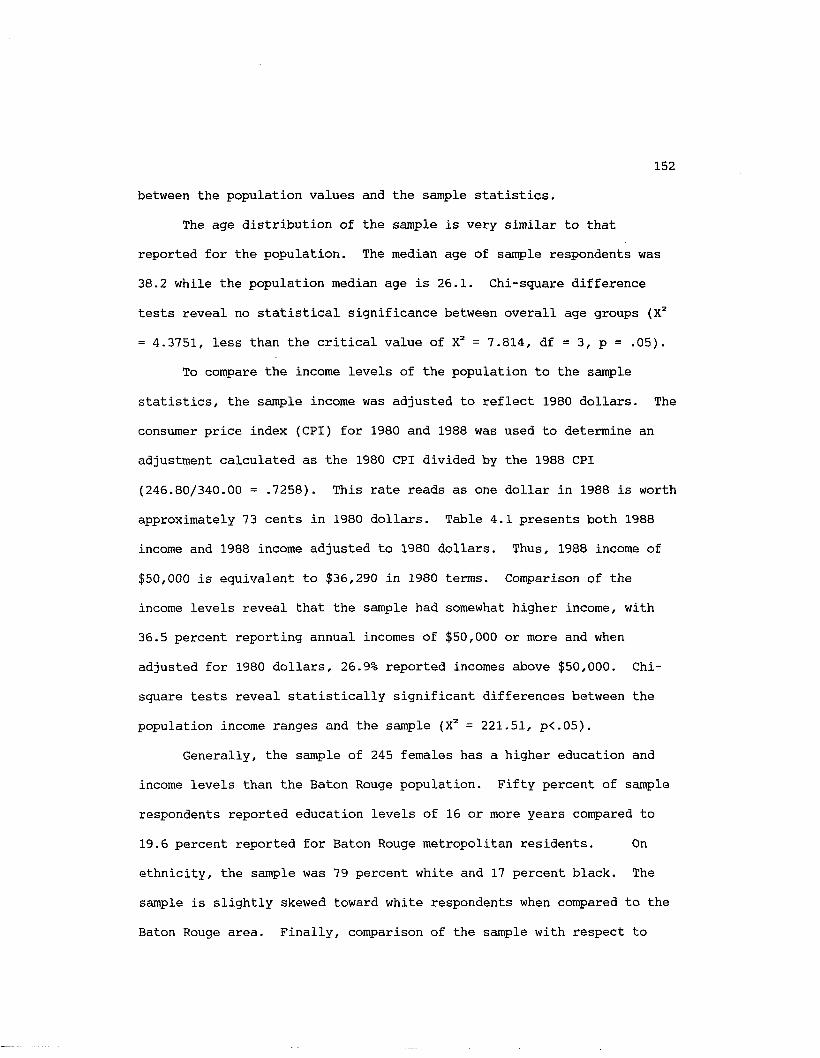
152
between the population values and the sample statistics.
The age distribution of the sample is very similar to that
reported for the population. The median age of sample respondents was
38.2 while the population median age is 26.1. Chi-square difference
tests reveal no statistical significance between overall age groups (X2
= 4.3751, less than the critical value of X2 = 7.814, df = 3, p = .05).
To compare the income levels of the population to the sample
statistics, the sample income was adjusted to reflect 1980 dollars. The
consumer price index (CPI) for 1980 and 1988 was used to determine an
adjustment calculated as the 1980 CPI divided by the 1988 CPI
(246.80/340.00 = .7258). This rate reads as one dollar in 1988 is worth
approximately 73 cents in 1980 dollars. Table 4.1 presents both 1988
income and 1988 income adjusted to 1980 dollars. Thus, 1988 income of
$50,000 is equivalent to $36,290 in 1980 terms. Comparison of the
income levels reveal that the sample had somewhat higher income, with
36.5 percent reporting annual incomes of $50,000 or more and when
adjusted for 1980 dollars, 26.9% reported incomes above $50,000. Chi-
square tests reveal statistically significant differences between the
population income ranges and the sample (X2 = 221.51, p<.05).
Generally, the sample of 245 females has a higher education and
income levels than the Baton Rouge population. Fifty percent of sample
respondents reported education levels of 16 or more years compared to
19.6 percent reported for Baton Rouge metropolitan residents. On
ethnicity, the sample was 79 percent white and 17 percent black. The
sample is slightly skewed toward white respondents when compared to the
Baton Rouge area. Finally, comparison of the sample with respect to
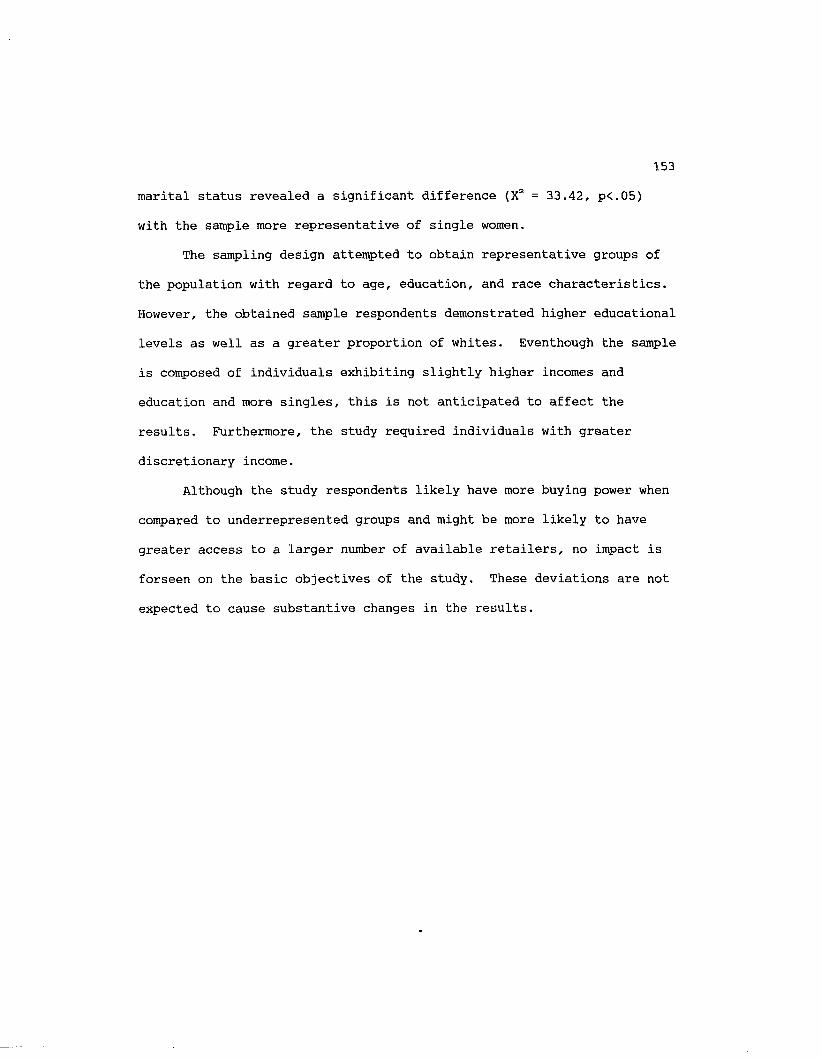
153
marital status revealed a significant difference (X2 = 33.42, p<.05)
with the sample more representative of single women.
The sampling design attempted to obtain representative groups of
the population with regard to age, education, and race characteristics.
However, the obtained sample respondents demonstrated higher educational
levels as well as a greater proportion of whites. Eventhough the sample
is composed of individuals exhibiting slightly higher incomes and
education and more singles, this is not anticipated to affect the
results. Furthermore, the study required individuals with greater
discretionary income.
Although the study respondents likely have more buying power when
compared to underrepresented groups and might be more likely to have
greater access to a larger number of available retailers, no impact is
forseen on the basic objectives of the study. These deviations are not
expected to cause substantive changes in the results.
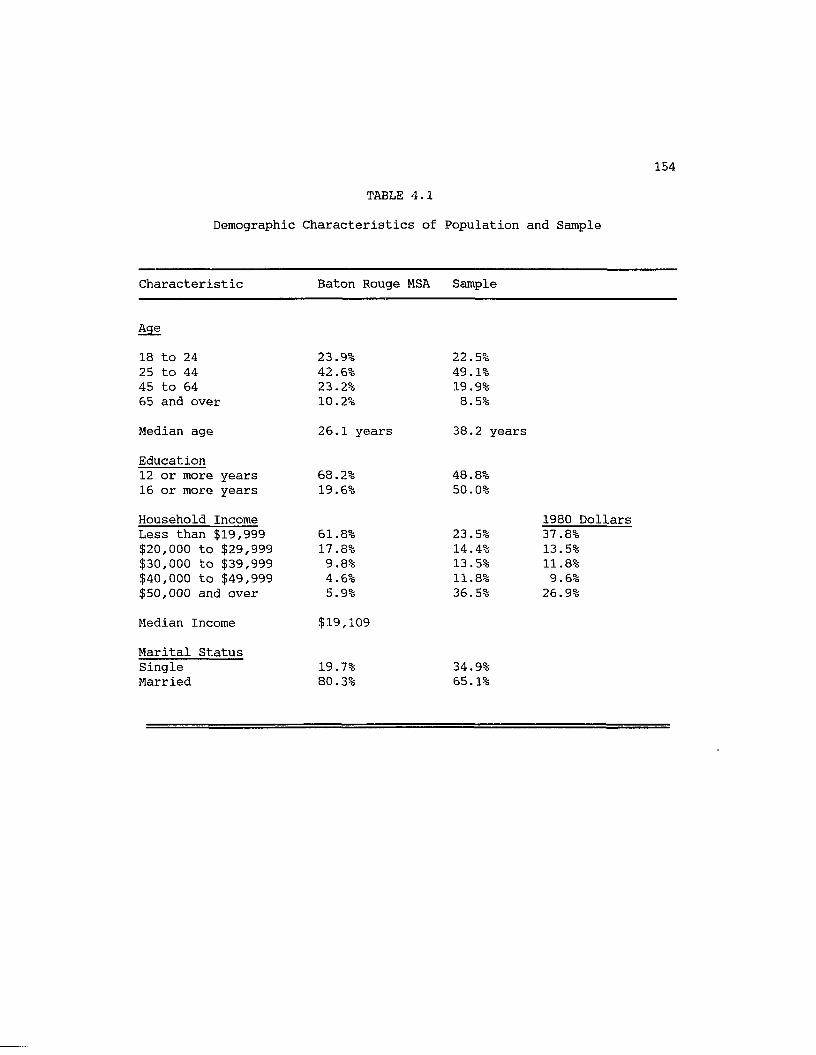
154
TABLE 4.1
Demographic Characteristics of Population and Sample
Characteristic Baton Rouge MSA Sample
Age
18 to 24 23.9% 22.5%25 to 44 42.6% 49.1%45 to 64 23.2% 19.9%65 and over 10.2% 8.5%
Median age 26.1 years 38.2 years
Education12 or more years 68.2% 48.8%16 or more years 19.6% 50.0%
Household Income 1980 DollarsLess than $19,999 61.8% 23.5% 37.8%$20,000 to $29,999 17.8% 14.4% 13.5%$30,000 to $39,999 9.8% 13.5% 11.8%$40,000 to $49,999 4.6% 11.8% 9.6%$50,000 and over 5.9% 36.5% 26.9%
Median Income $19,109
Marital StatusSingle 19.7% 34.9%Married 80.3% 65.1%
155
Scale Development Analyses
Shopping Motivation Scale Analyses
The consumer shopping motivation scale development procedure
consisted of three data collection stages to purify and test the
reliability and validity of the measure. These analyses are briefly
discussed as Stage 1, Stage 2 and Stage 3 research findings. Tables 4.2
and 4.3 are summary tables referred to throughout this section. Table
4.2 presents a summary of the number of items per subscale utilized
during each stage of scale development. Table 4.3 presents each
construct item and corresponding item-total correlation statistics for
each stage of scale development. In developing the scale, the inclusion
criteria employed were those discussed in Chapter 3 (i.e., low
correlations with the total scale e.g. < .45 or low factor loadings e.g.
< .5).
Stage 1. The original 154-item shopping motivation scale was
administered to a sample of 78 undergraduate students. Item analysis of
the scale indicated which items to retain and the need for further
development. The overall objective of this stage was to purify the
shopping motivation scale. As discussed in Chapter 2, the scale
consists of 17 subscales which measure three primary motivation
dimensions: functional, symbolic, and experiential. Item-to-total
correlations ranged from -0.23 to 0.76 (refer to Table 4.3) and
coefficient alpha values ranged from 0.11 to 0.84 .
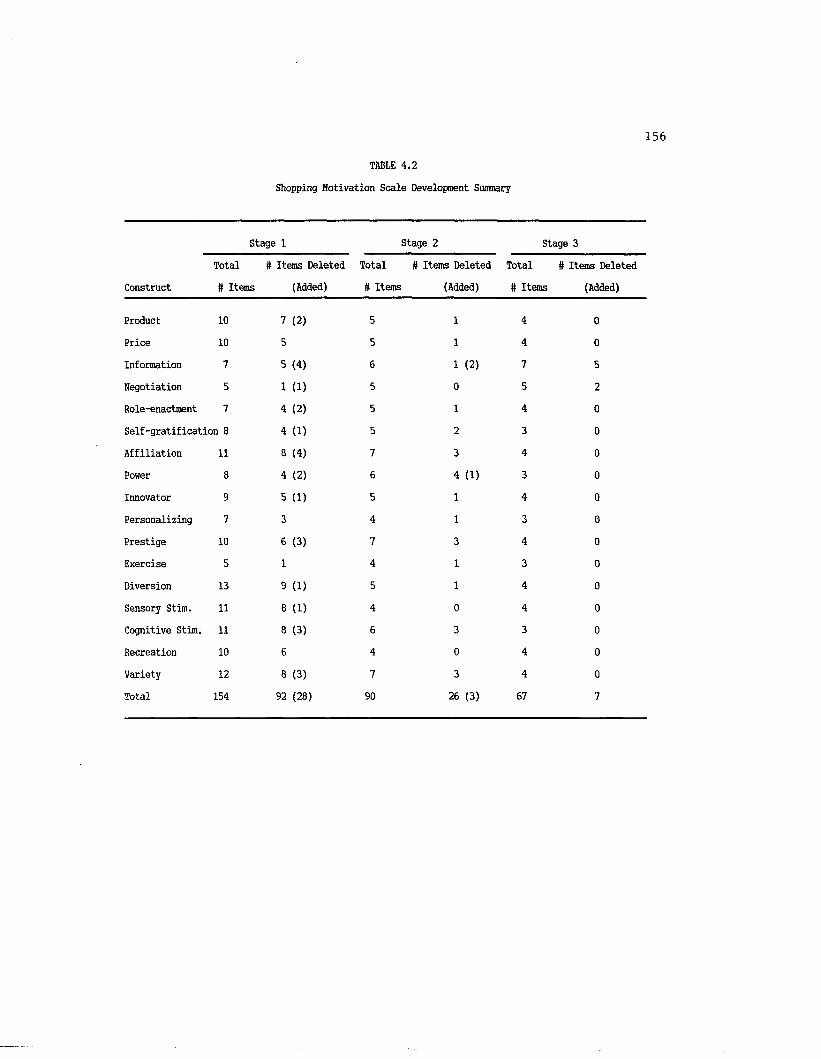
156
TABLE 4.2
Shopping Motivation Scale Development Summary
Stage 1 Stage 2 Stage 3
Total # Items Deleted Total # Items Deleted Total # Items Deleted
Construct # Items (Added) # Items (Added) # Items (Added)
Product 10 7 (2) 5 1 4 0
Price 10 5 5 1 4 0
Information 7 5 (4) 6 1 (2) 7 5
Negotiation 5 1 (1) 5 0 5 2
Role-enactment 7 4 (2) 5 1 4 0
Self-gratification 8 4 (1) 5 2 3 0
Affiliation 11 8 (4) 7 3 4 0
Power 8 4 (2) 6 4 (1) 3 0
Innovator 9 5 (1) 5 1 4 0
Personalizing 7 3 4 1 3 0
Prestige 10 6 (3) 7 3 4 0
Exercise 5 1 4 1 3 0
Diversion 13 9 (1) 5 1 4 0
Sensory Stim. 11 8 (1) 4 0 4 0
Cognitive Stim. 11 8 (3) 6 3 3 0
Recreation 10 6 4 0 4 0
Variety 12 8 (3) 7 3 4 0
Total 154 92 (28) 90 26 (3) 67 7

157TABLE 4.3
Shopping Motivation Scale Item Analysis (Corrected Item-Total Correlations)
PPSCTIOHM. Stage 1 Stage 2Product
I usually shop around until I findthe exact product I want. -.0253
I don't go to shop, I go to buy. .1733 .6528
I only go shopping if I need tobuy something. .4007 .7980
My only reason to shop is to purchasea specific item. .5620 .7734
I find myself going to stores eventhough I don't need anything. .2078
Shopping the stores allows me to find the hard-to-locate products that I've been looking for. -.0541
I never consult friends or coworkersabout which retailers might stock aparticular item. -.0240
I make every attempt to find a retailerwho has the product in stock beforeI visit the outlet. .1834
I find myself browsing through catalogs in search of a particular item. -.0457
While watching cable shopping I'lloften see an item that I want topurchase. -.0547
I enjoy shopping whether or not Ipurchase an item. .7096
People who believe that the only reason to shop is to purchase an item are missing out on the realjoy of shopping. .7000
Stage 3
.7097
.7452
.6875
.5562

TABLE 4.3 (continued)
158
KUMCTiOMLPrice
Stage 1
I usually shop around until I findthe store with the lowest price(s). .5425
I often spend time searching overthe brands carried by a store tofind the best possible price. .5951
I try to always get the best buyfor my money. .5379
I usually buy the product or brandwhich offers the best dollar value. .5537
I find myself checking the pricesof even small items. .5397
I never watch advertisements for announcements of sales. .3716
When shopping, I compare pricesbefore I make my selection. .6070
I often browse through catalogs orcontact direct mail merchants insearch of the lowest possible price. .0963
I purchase the product or brand whichsuits my needs, regardless of price. .3130
Stage 2
.6216
.6897
.5705
.7207
Stage 3
.6126
.6710
.5215
.5827
Comparing prices and finding the "bestbuy" is a waste of time. .4892 .5337
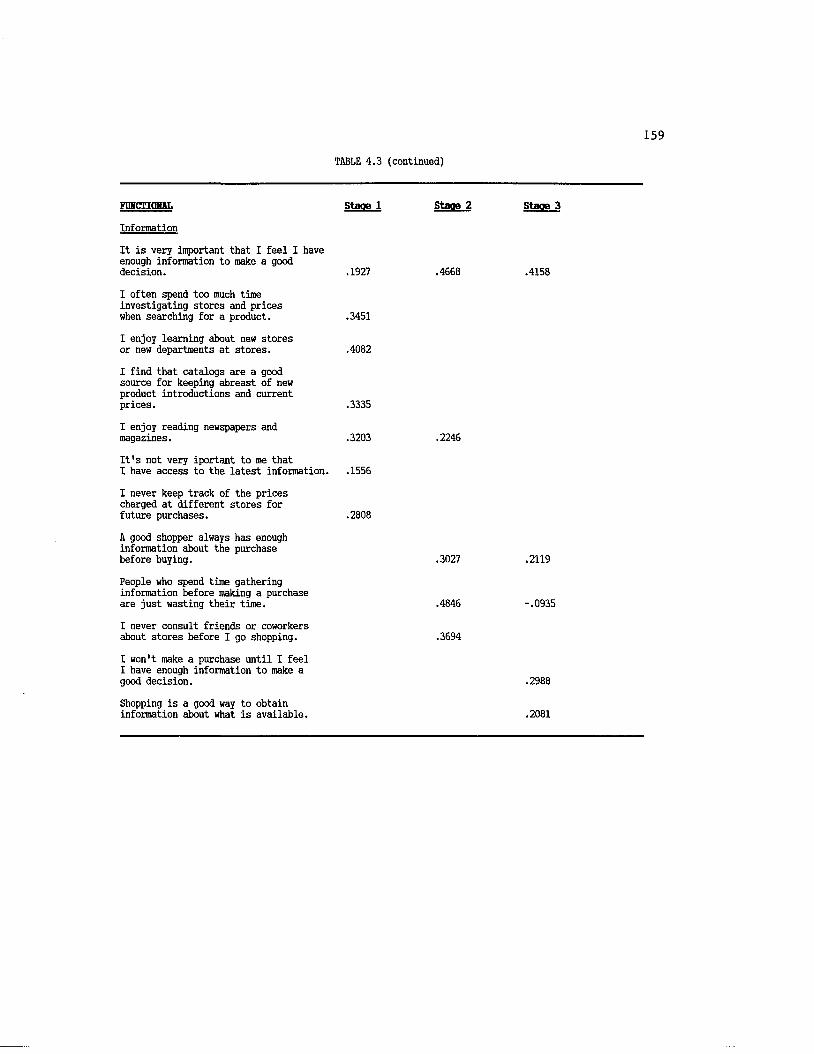
TABLE 4.3 (continued)
159
PUHCl'lCML Stage 1 Stage 2Information
It is very important that I feel I have enough information to make a gooddecision. .1927 .4668
I often spend too much timeinvestigating stores and priceswhen searching for a product. .3451
I enjoy learning about new storesor new departments at stores. .4082
I find that catalogs are a goodsource for keeping abreast of newproduct introductions and currentprices. .3335
I enjoy reading newspapers andmagazines. .3203 .2246
It's not very iportant to me that I have access to the latest information. .1556
I never keep track of the pricescharged at different stores forfuture purchases. .2808
A good shopper always has enough information about the purchasebefore buying. .3027
People who spend time gathering information before making a purchaseare just wasting their time. .4846
I never consult friends or coworkersabout stores before I go shopping. .3694
I won't make a purchase until I feel I have enough information to make a good decision.
Shopping is a good way to obtain information about what is available.
Stage 3
.4158
.2119
-.0935
.2988
.2081
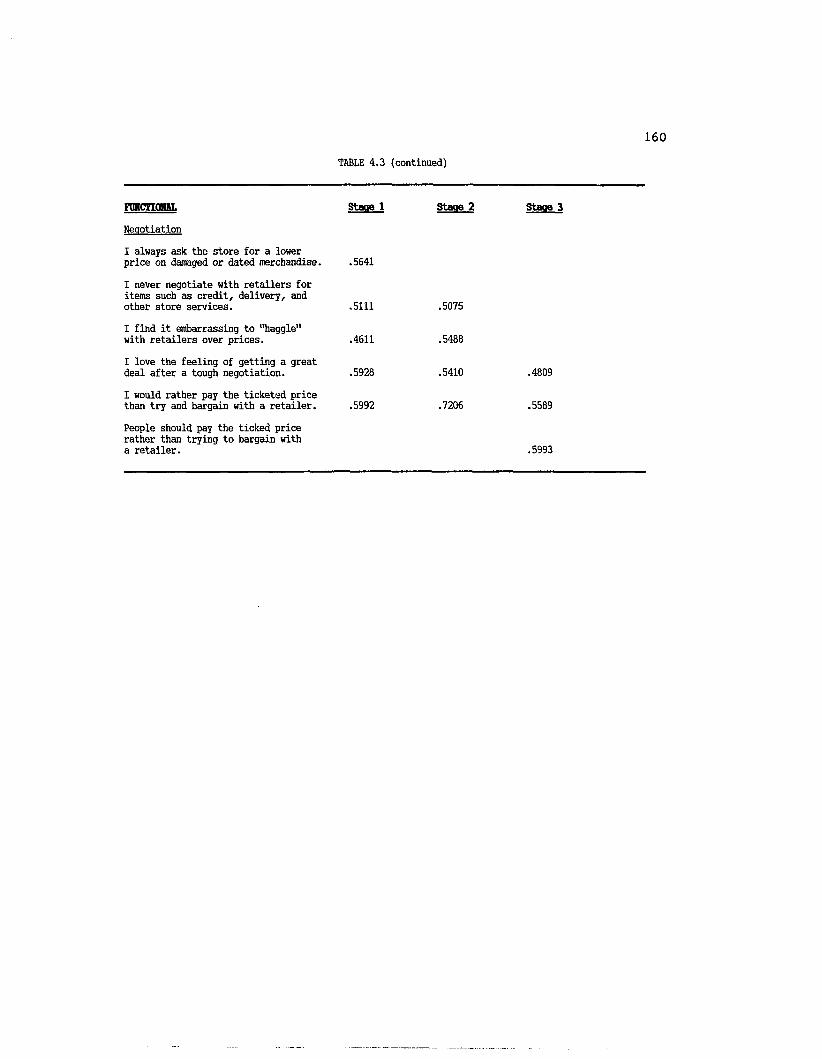
TABLE 4.3 (continued)
160
EUHCTIOHAL Stage 1 Stage 2 Stage 3Negotiation
I always ask the store for a lower price on damaged or dated merchandise.
I never negotiate with retailers for items such as credit, delivery, and other store services.
I find it embarrassing to "haggle" with retailers over prices.
I love the feeling of getting a great deal after a tough negotiation.
I would rather pay the ticketed price than try and bargain with a retailer.
People should pay the ticked price rather than trying to bargain with a retailer.
.5641
.5111 .5075
.4611 .5488
.5928 . 5410 . 4809
.5992 .7206 .5589
.5993
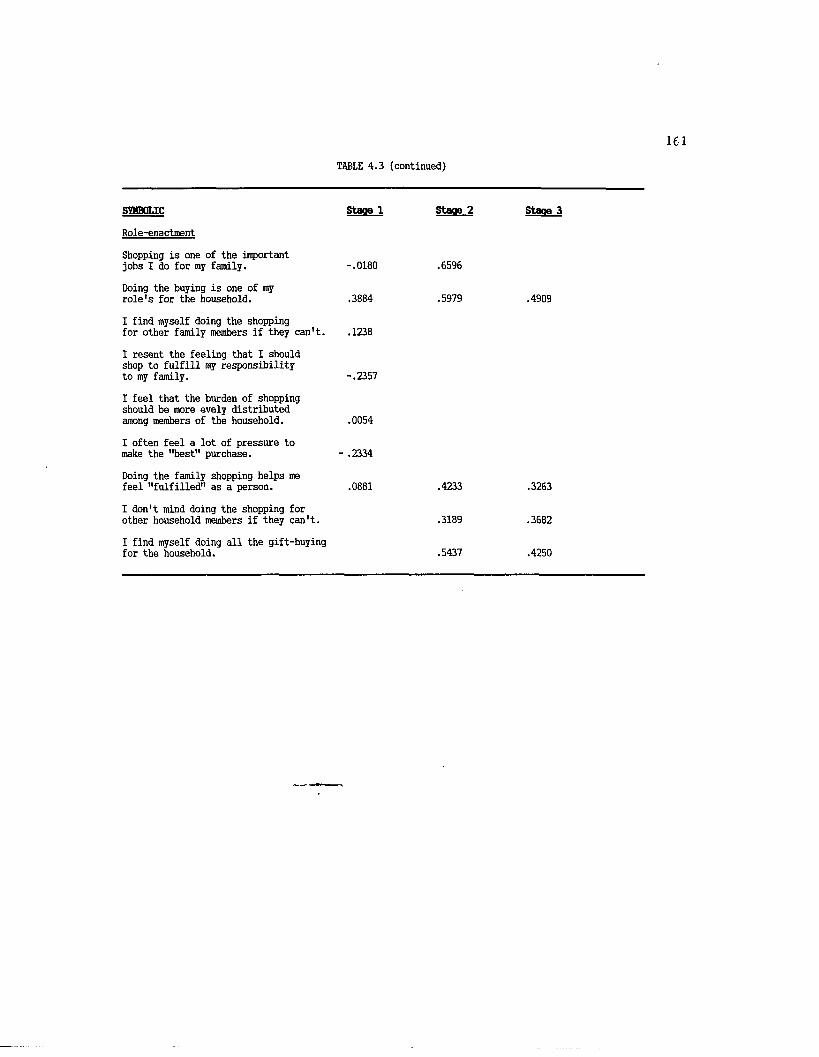
TABLE 4.3 (continued)
SYMBOLICRole-enactment
Shopping is one of the important jobs I do for my family.
Doing the buying is one of my role's for the household.
I find myself doing the shopping for other family members if they can't.
I resent the feeling that I should shop to fulfill my responsibility to my family.
I feel that the burden of shopping should be more evely distributed among members of the household.
I often feel a lot of pressure to make the "best" purchase.
Doing the family shopping helps me feel "fulfilled" as a person.
I don't mind doing the shopping for other household members if they can't.
I find myself doing all the gift-buying for the household.
Stage 1 Stage 2 Stage 3
-.0180 .6596
.3884 . 5979 . 4909
.1238
-.2357
.0054
- .2334
.0881 .4233 .3263
.3189 .3682
.5437 . 4250

TABLE 4.3 (continued)
SVHBOLICSelf-gratification
Going shopping does not help me feel better when I'm depressed.
I often "give myself a treat" by going shopping.
When I've had a bad day, I find that buying something nice for myself makes me feel better.
If I'm feeling lonely, I'll go shopping to mix with others.
Browsing through a catalog while at home or at the office satisfies my urge to go shopping.
While looking through a catalog, I often imagine myself wearing or using a particular item.
Sometimes just the thought of going shopping helps me feel better.
I don't have to buy something to consider my shopping trip a successful one.
When I'm feeling down, going shopping makes me feel worse.
Stacie 1 Stage 2 Stage 3
.7505 .6654
.8186 .7083 .7207
.6677 .6510 .7218
.4233
.2135
.4617
.6822 .6764 .6655
.0436
.5493
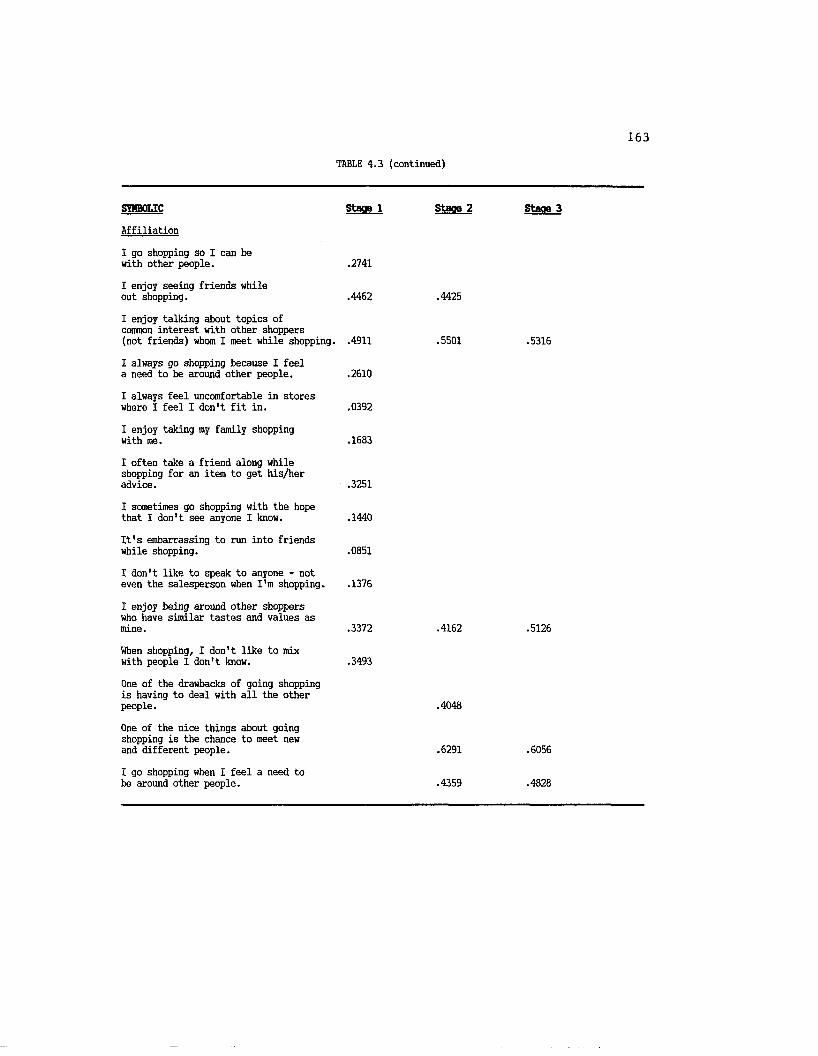
TRBLE 4.3 (continued)
163
SYMBOLIC Stage 1 Stage 2Affiliation
I go shopping so I can bewith other people. .2741
I enjoy seeing friends whileout shopping. .4462 .4425
I enjoy talking about topics of cotrmon interest with other shoppers(not friends) whom I meet while shopping. .4911 .5501
I always go shopping because I feel a need to be around other people. .2610
I always feel uncomfortable in storeswhere I feel I don't fit in. .0392
I enjoy taking my family shoppingwith me. .1683
I often take a friend along whileshopping for an item to get his/heradvice. .3251
1 sometimes go shopping with the hopethat I don't see anyone I know. .1440
It's embarrassing to run into friendswhile shopping. .0851
I don't like to speak to anyone - noteven the salesperson when I'm shopping. .1376
I enjoy being around other shoppers who have similar tastes and values asmine. .3372 .4162
When shopping, I don't like to mixwith people I don't know. .3493
One of the drawbacks of going shopping is having to deal with all the otherpeople. .4048
One of the nice things about going shopping is the chance to meet newand different people. .6291
I go shopping when I feel a need tobe around other people. .4359
Stage 3
.5316
.5126
.6056
.4828

TABLE 4.3 (continued)
164
SYMBOLICPower
I like making others feel that I'm superior in some way.
I enjoy being treated with respect by store personnel.
I like being waited on by a salesperson who is anxious to please me.
I expect salespeople to find the items for which I'm looking.
I expect the store to treat me as an important and valued customer.
I often make suggestions which improve how the store is run or serves its customers.
I enjoy the feeling of power I have when being served by a salesperson.
1 always make salespeople drop what they're doing to cater to my needs.
People should treat salespersons as equals.
A salesperson should perform any reasonable request I have.
I often feel superior to the sales people that wait on me.
Stage 1 Stage 2 Stage 3
.4266 .3317
.1805
.2794
.3890 .4601
.2763
.2019
.4948 .4571 .5431
.3165 .4155 .4861
.0751
.3170
.4686
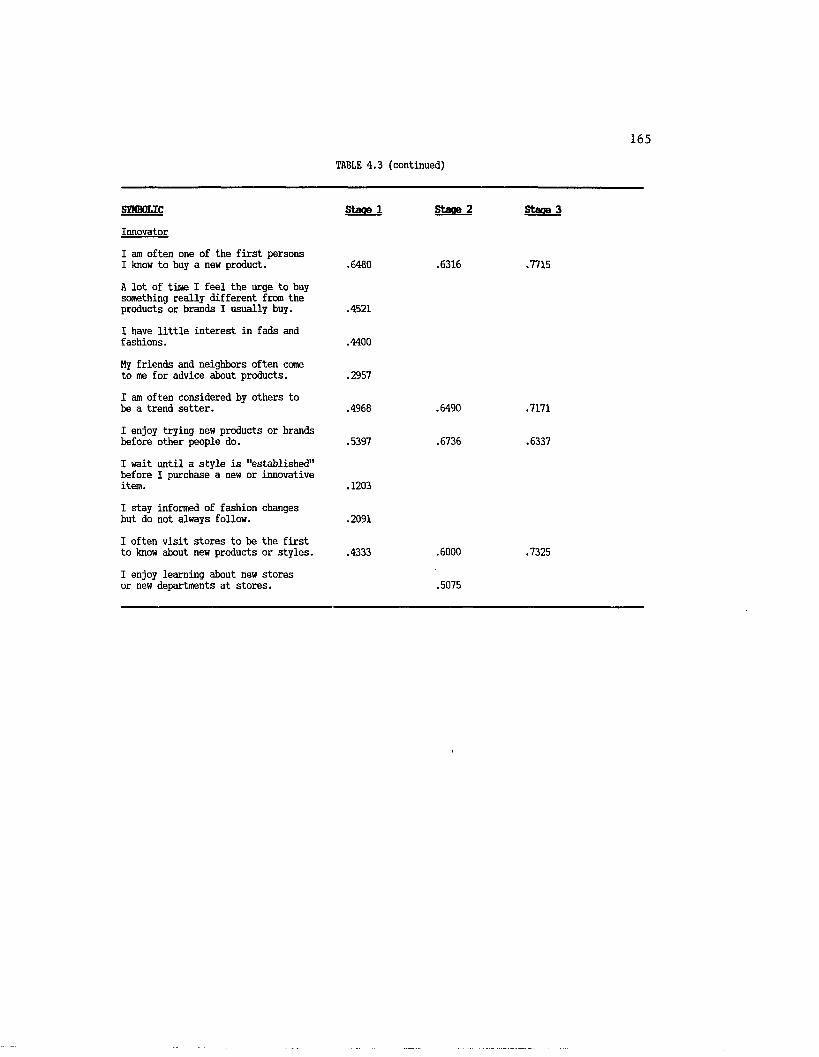
TABLE 4.3 (continued)
165
SYMBOLICInnovator
Staoe 1
I am often one of the first persons I know to buy a new product. .6480
A lot of time I feel the urge to buysomething really different from theproducts or brands I usually buy. .4521
I have little interest in fads andfashions. .4400
My friends and neighbors often cometo me for advice about products. .2957
I am often considered by others tobe a trend setter. .4968
I enjoy trying new products or brandsbefore other people do. .5397
I wait until a style is "established" before I purchase a new or innovative item. .1203
I stay informed of fashion changesbut do not always follow. .2091
I often visit stores to be the firstto know about new products or styles. .4333
I enjoy learning about new stores or new departments at stores.
Stage 2
.6316
.6490
.6736
.6000
.5075
Stage 3
.7715
.7171
.6337
.7325
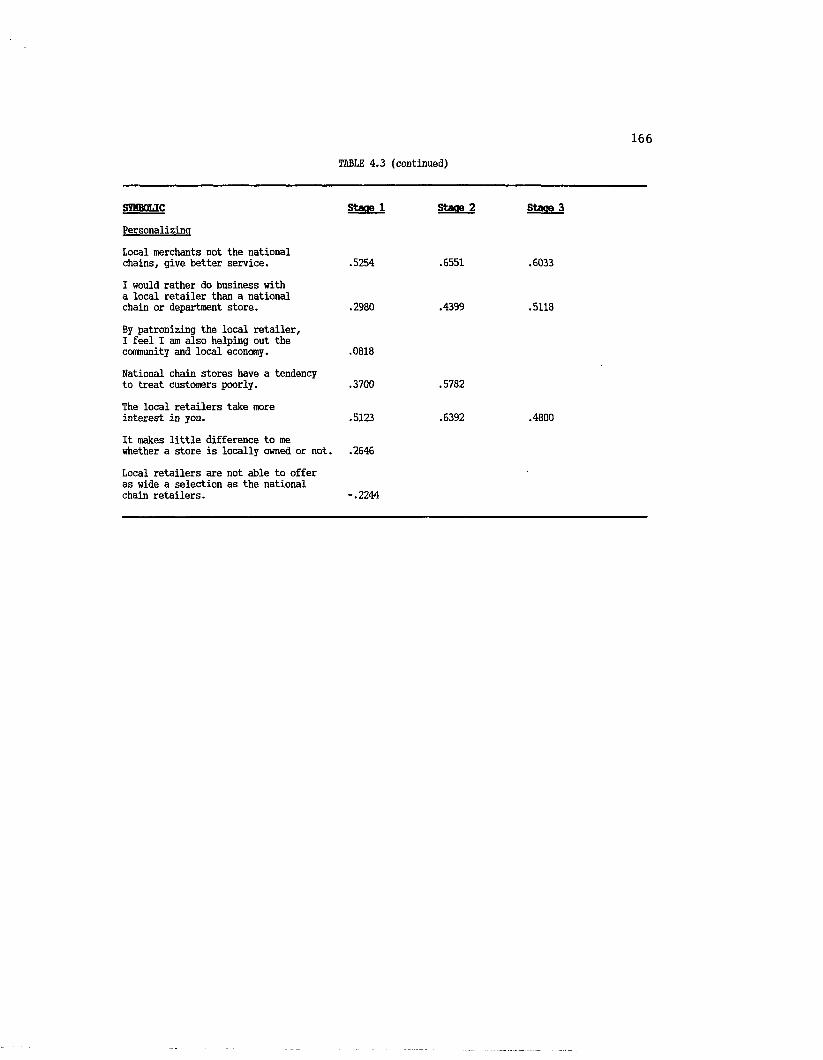
TABLE 4.3 (continued)
166
SYMBOLICPersonalizing
Local merchants not the national chains, give better service.
I would rather do business with a local retailer than a national chain or department store.
By patronizing the local retailer,I feel I am also helping out the community and local economy.
National chain stores have a tendency to treat customers poorly.
The local retailers take more interest in you.
It makes little difference to me whether a store is locally owned or not.
Local retailers are not able to offer as wide a selection as the national chain retailers.
Stage 1 Stage 2 Stage 3
.5254 .6551 .6033
.2980 .4399 .5118
.0818
.3700 .5782
.5123 .6392 .4800
.2646
-.2244
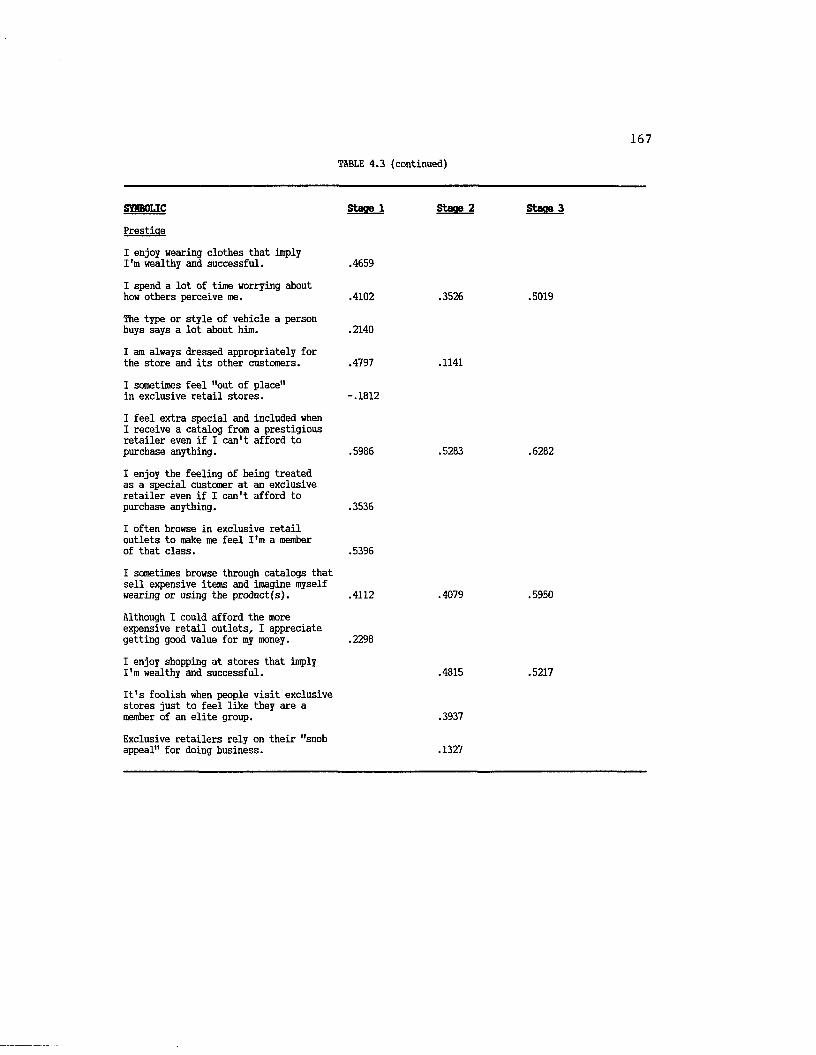
TABLE 4.3 (continued)
167
SYMBOLICPrestige
I enjoy wearing clothes that imply I'm wealthy and successful.
I spend a lot of time worrying about how others perceive me.
The type or style of vehicle a person buys says a lot about him.
I am always dressed appropriately for the store and its other customers.
I sometimes feel "out of place" in exclusive retail stores.
I feel extra special and included when I receive a catalog from a prestigious retailer even if I can't afford to purchase anything.
I enjoy the feeling of being treated as a special customer at an exclusive retailer even if I can't afford to purchase anything.
I often browse in exclusive retail outlets to make me feel I'm a member of that class.
I sometimes browse through catalogs that sell expensive items and imagine myself wearing or using the product(s).
Although I could afford the more expensive retail outlets, I appreciate getting good value for my money.
I enjoy shopping at stores that imply I'm wealthy and successful.
It's foolish when people visit exclusive stores just to feel like they are a member of an elite group.
Exclusive retailers rely on their "snob appeal" for doing business.
Stage 1 Stage 2 Stage 3
.4659
.4102 .3526 .5019
.2140
.4797 .1141
-.1812
.5986 .5283 .6282
.3536
.5396
.4112 .4079 .5950
.2298
.4815 .5217
.3937
.1327
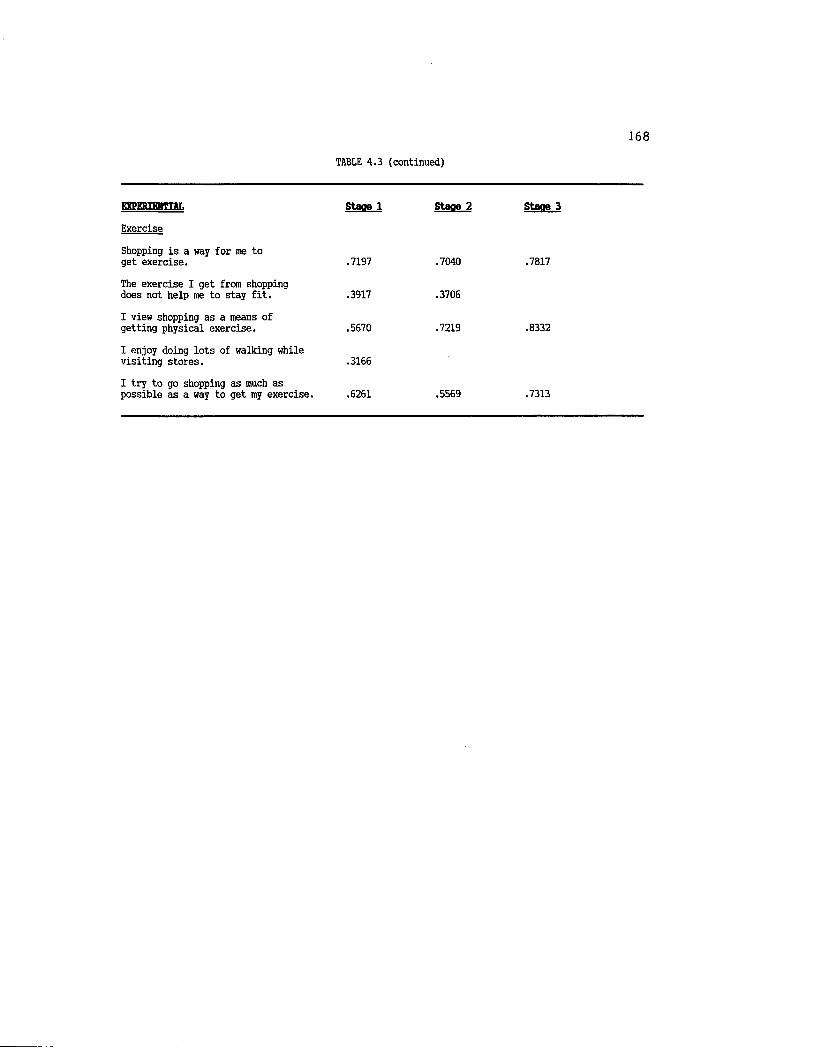
TABLE 4.3 (continued)
168
mtPnmwTTM.Exercise
Shopping is a way for me to get exercise.
The exercise I get from shopping does not help me to stay fit.
I view shopping as a means of getting physical exercise.
1 enjoy doing lots of walking while visiting stores.
I try to go shopping as much as possible as a way to get my exercise.
Stage 1 Stage 2 Stage 3
.7197 .7040 .7817
.3917 .3706
.5670 .7219 .8332
.3166
.6261 .5569 .7313

169
TABLE 4.3 (continued)
RtpmngnTM. Stage 1 Stage 2Diversion
Shopping helps me forget aboutmy problems. .7365 .6781
I often go shopping to escape from my world. .2154 .8056
I enjoy being out and about withother people while shopping. .0953
I sometimes go shopping as a wayto get privacy from other people. - .0152
I enjoy being in a store which isalmost empty of other shoppers. .2276
While at home or the office, I oftenfind myself browsing through catalogsas a quick change from my daily routine. .4588
The best part about ordering by mail or telephone is waiting in eager anticipation for the package to arrive. .3198
When I receive a package I've orderedby mail or telephone, I feel like I'vebeen given a present. .2651
Half the fun of ordering by mail or telephone is unwrapping the package. .4821
I feel a sense of excitement when Ireceive a package from a catalogor mail order company. .6535
After ordering a product by mail ortelephone, I look forward to eachday, thinking "today might be theday it will arrive!" .5816
Shopping is a way to experience new and different things to keep life frombecoming boring. .7003 .7587
I enjoy spending evenings at homebrowsing through all of my catalogs. .4542
Stage 3
.7135
.7097
.7216
Shopping is not just an everyday task but something new and different. .5538 .6043

TRBLE 4.3 (continued)
120
EXPKRIEHTiai. Stage 1 Stage 2Sensory Stimulation
I enjoy looking at interesting orattractive store displays. .5309 .6529
I really miss it if I go to a storethat doesn't have background music. .4729 .6225
I find it pleasurable visiting a storewhich has a tasteful and nicelydecorated store interior. .4780
X love the "feel" of a store whichis in tune with my needs and desires. .5191 .5769
Stores can have a distinctive "smell”that I like. .3114
I don't really notice backgroundmusic when I'm in a store. .3663
I love all the sights and soundsexperienced while shopping. .4110
Shopping just wouldn't be the sameif I couldn't touch and feel themerchandise. .0788
I don't enjoy catalog shopping becauseI'm unable to see and feel themerchandise. -.0527
I can feel the excitement in the airwhen a big store sale first begins. .3565
Sometimes I find myself drawn to a particular store because of its"atmosphere". .4412 .5746
Stage 3
.6763
.5602
It's pleasurable visiting a store which has a tasteful and nicely decorated store interior. .5627 .5791

TABLE 4.3 (continued)
171
KTPKR-mmiL Stage 1Cognitive Stimulation
I like to browse through catalogseven when I don't plan to buyanything. .4641
I sometimes imagine which product(s)I might buy if I had unlimitedmonetary resources. .3327
I sometimes will fill out an orderblank for an item from a catalogbut never make the purchase. .0391
I never find myself thinking aboutproducts I would like to purchaseor own. .2501
I enjoy imagining myself wearing orusing certain products. .3517
I find myself reading the detailed descriptions of products in advertisements or catalogs. .3764
I generally read even my junk mail just to know what it is about. .2634
I often read the information on thepackage of products just out of curoisity .2832
I usually throw away mail advertisements without reading them. .2866
I rarely read advertisements that justseem to contain a lot of information. .1396
A catalog is really a wishbook filled with items I might want to purchase.
I find myself thinking about products 1 would like to purchase or own.
Stage 2
.5954
.6389
.2633
.6958
.6328
Stage 3
.7465
.8019
.8152
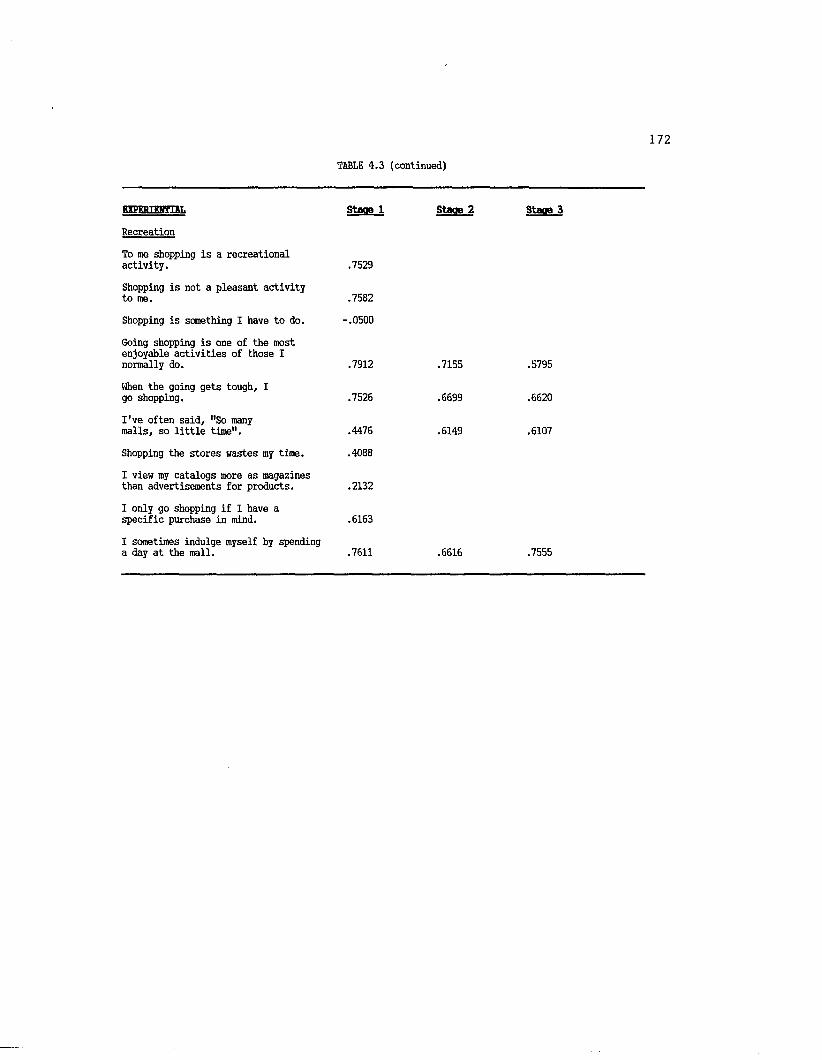
TABLE 4.3 (continued)
172
BIPKRiRUTiiL Stage 1 Stage 2Recreation
To me shopping is a recreationalactivity. .7529
Shopping is not a pleasant activityto me. .7582
Shopping is something I have to do. -.0500
Going shopping is one of the most enjoyable activities of those Inormally do. .7912 .7155
When the going gets tough, Igo shopping. .7525 .6699
I've often said, "So manymalls, so little time". .4476 .6149
Shopping the stores wastes my time. .4088
I view my catalogs more as magazinesthan advertisements for products. .2132
I only go shopping if I have aspecific purchase in mind. .6163
I sometimes indulge myself by spendinga day at the mall. .7611 .6616
Stage 3
.5795
.6620
.6107
.7555
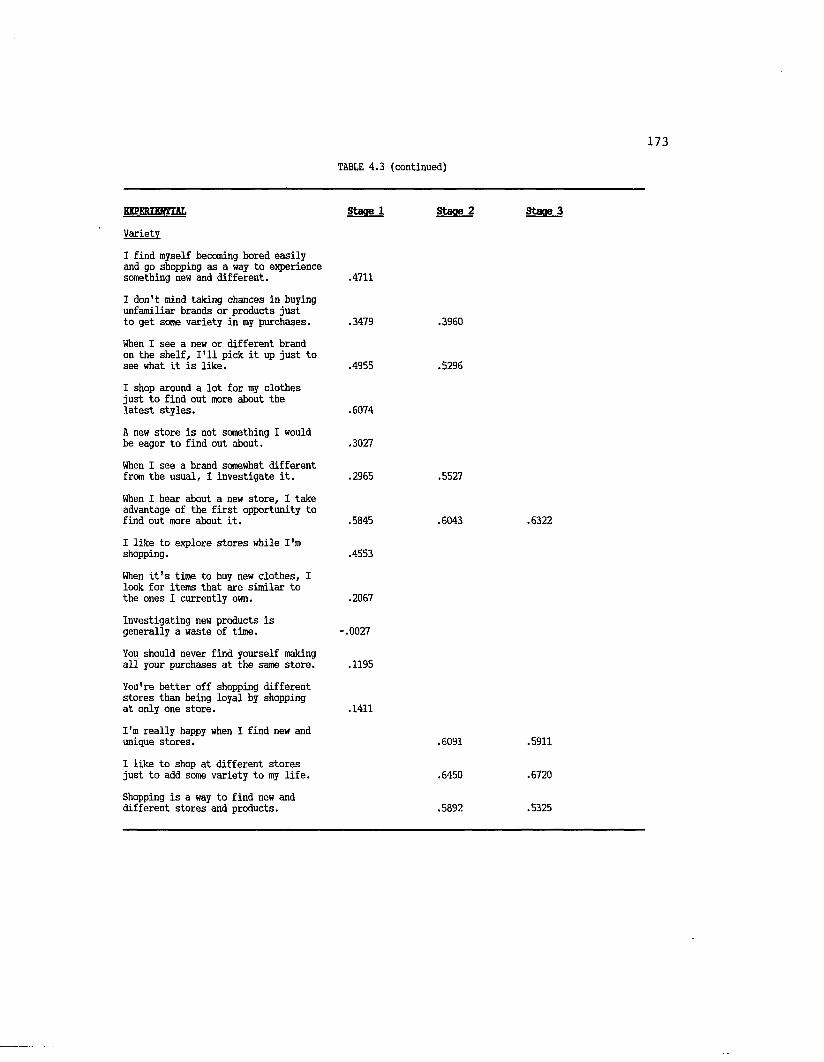
TABLE 4.3 (continued)
173
EKPKRIEBTIAL Stage 1 Stage 2Variety
I find myself becoming bored easily and go shopping as a way to experience something new and different. .4711
I don't mind taking chances in buying unfamiliar brands or products justto get some variety in ray purchases. .3479 .3960
When I see a new or different brand on the shelf, I'll pick it up just tosee what it is like. .4955 .5296
I shop around a lot for my clothesjust to find out more about thelatest styles. .6074
A new store is not something I wouldbe eager to find out about. .3027
When I see a brand somewhat differentfrom the usual, I investigate it. .2965 .5527
When I hear about a new store, I take advantage of the first opportunity tofind out more about it. .5845 .6043
I like to explore stores while I'mshopping. .4553
When it's time to buy new clothes, Ilook for items that are similar tothe ones I currently own. .2067
Investigating new products isgenerally a waste of time. -.0027
You should never find yourself makingall your purchases at the same store. .1195
You're better off shopping differentstores than being loyal by shoppingat only one store. .1411
I'm really happy when I find new andunique stores. .6091
I like to shop at different storesjust to add some variety to my life. .6450
Stage 3
.6322
.5911
.6720
Shopping is a way to find new and different stores and products. .5892 .5325
174
Based on these analyses, items were either eliminated, reassigned
to a subscale other than the one originally hypothesized or left in the
original scale. This resulted in a reduced scale containing 62 items.
Most scale reliabilities were improved ranging from 0.46 for the
information subscale to 0.81 for the self-gratification subscale.
Stage 2. Twenty-eight additional items were composed for constructs
which demonstrated poor internal consistency and some items were
reworded. The resulting 90 item scale was administered to a combined
student (n=118) and nonstudent (n=122) sample of 240 respondents.
Principal components factor analysis with varimax rotation was performed
on each individual subscale as a test for unidimensionality. Factor
analysis for each subscale produced one factor with eigenvalue greater
than 1.0, indicating the subscale items are consistent and homogeneous.
Reliability Assessment. Cronbach alpha coefficients were
computed for individual scale items and the total subscales. Overall,
reliability was improved from Stage 1 testing as demonstrated by alpha
values in range of 0.60 to 0.88.
Following traditional item-total reliability analysis of the 90-
item shopping motivation scale, the measure was reduced to a 59 item
scale after items which demonstrated low correlations or factor loadings
were deleted (refer to Table 4.3). The resulting 59-item scale was then
analyzed using confirmatory factor analysis (CFA) as a stronger test of
the hypothesized factor structure and reliability of individual items.
The item reliabilities and factor loadings from the CFA for the 17
subscales are presented in Appendix B (Table B.l). Construct
reliabilities were calculated following the procedure outlined by

175
Fornell and Larker (1981) and are also contained in Table B.l. In
addition, measures of goodness of fit for the three factor models are
presented.
In viewing the item reliabilities, most appear to be good
indicators for each measured construct with reliabilities above 0.50 and
therefore meet the criteria for acceptability discussed in Chapter 3.
Moreover, the construct reliabilities range from 0.62 to 0.88 and when
compared with the Cronbach alpha reliabilities differ very little as
shown in Table 4.4. The results of the traditional item analysis and
LISREL analysis suggest the motivation scale to possess good internal
consistency and to be a reliable measure of individual's underlying
shopping motivations.
Model Fit. The three factor (CFA) models tested for the shopping
motivation scale exhibit adjusted goodness-of-fit (AGFI) values of .885
for the functional dimension, .806 for symbolic and .863 for
experiential. These values are significant (p<.001) which indicates
rejection of the proposed factor models. The root mean square residual
(RMSR) statistics for the three factors are .062, .088 and .052 for the
functional, symbolic and experiential dimensions. Guidelines for
determining the acceptability of a proposed factor model require AGFI
values to be .90 or greater and RMSR to be less than .07. The AGFI
values fall somewhat short of these criteria while the RMSR are within
the stated bounds.
However, Fornell (1983) asserts that a priori theory is extremely
important for covariance structure models; the obtained models should be
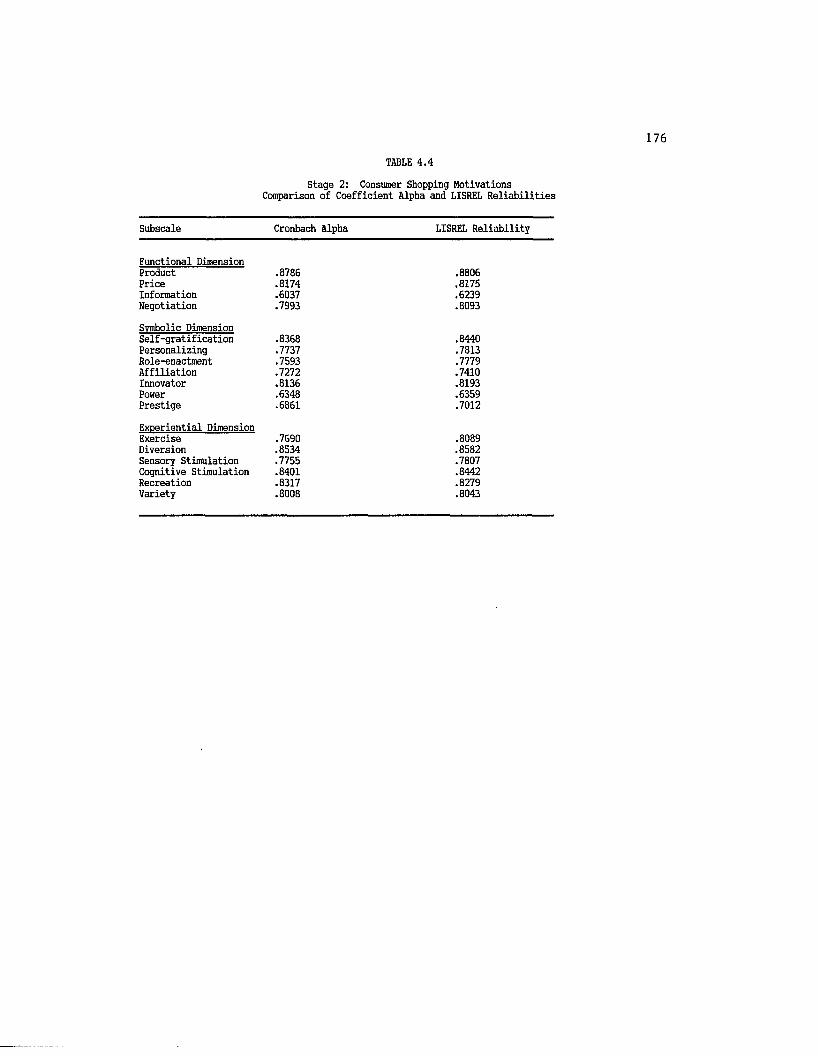
TABLE 4.4
Stage 2: Consumer Shopping Motivations Comparison of Coefficient Alpha and LISREL Reliabilities
Subscale Cronbach Alpha LISREL Reliability
Functional DimensionProduct .8786 .8806Price .8174 .8175Information .6037 .6239Negotiation .7993 .8093
Symbolic DimensionSelf-gratification .8368 .8440Personalizing .7737 .7813Role-enactment .7593 .7779Affiliation .7272 .7410Innovator .8136 .8193Power .6348 .6359Prestige .6861 .7012
Experiential DimensionExercise .7690 .8089Diversion .8534 .8582Sensory Stimulation .7755 .7807Cognitive Stimulation .8401 .8442Recreation .8317 .8279Variety .8008 .8043
177
interpreted based upon the developed theory. Therefore, in evaluating
the factor models in light of the proposed theory, evidence is provided
for the existence of three dimensions of shopping motivation:
functional, symbolic and experiential. The construct reliabilities are
high and subscale items load highly on the hypothesized factor. It
should be evident that chi-square could be improved were items
exhibiting low reliability were deleted from the model. Further tests
of motivation dimensionality will be provided by the Stage 3 data.
Validity Assessment. In addition to testing the reliability of a
measure, validity assessment must also be conducted. One test of
validity is the degree to which scale items are representative of the
domain of interest. The item domain was specified in Chapter Two and
definitions of the motivation subdimensions were given. In light of
these definitions and the specific items constructed, evidence is
provided for content validity. A more complete test of validity however
is provided by construct validity.
One indication of construct validity is a measure's ability to
perform as postulated by substantive theory. One hypothesis states that
the construct shopping motivation has three dimensions: functional,
symbolic and experiential. The confirmatory factor analysis results
reported in Table B.l provides evidence of construct validity as the
hypothesized factors are easily interpreted.
In addition measures must also demonstrate nomological validity.
Nomological (lawlike) validity is based on the explicit investigation of
constructs and measures in terms of formal hypotheses derived from
theory. It has been proposed that shopping motivation will influence an
178
individual's involvement with shopping as a process. Pearson
correlations between the three motivation dimensions, overall motivation
score and summed shopping process involvement (SPI) scales indicate a
significant relationship as reported in Table 4.5. The correlation
between the total motivation summed scale and the total SPI scale is
0.678 (p-value < .001). Evidence is therefore provided that shopping
motivations and shopping process involvement are related. At this time
it remains unknown as to causality, however the correlation is further
evidence of construct validity.
Additional evidence of construct validity is provided by examining
the relationship between the two proposed measures of motivation:
summed motivation scale scores and self-descriptions. The Pearson
correlations are reported in Table 4.5 and all are significant (p-value
<.001) and greater than the minimum standard of .30.
At this time, evidence is provided in terms of scale validity and
reliability which verifies the use of the motivation measure in Stage 3
of the research.
Stage 3. Following Stage 2 analyses, three additional shopping
motivation items were composed for the information and power subscales
in an effort to improve the reliability of these construct measures.
The resulting scale consisted of 67 items and was administered to a
sample of 245 women.
Reliability Assessment. As in Stages 1 and 2, analyses were
conducted to assess factor structure and reliability of the scale items.
Principal components factor analysis with varimax rotation was again
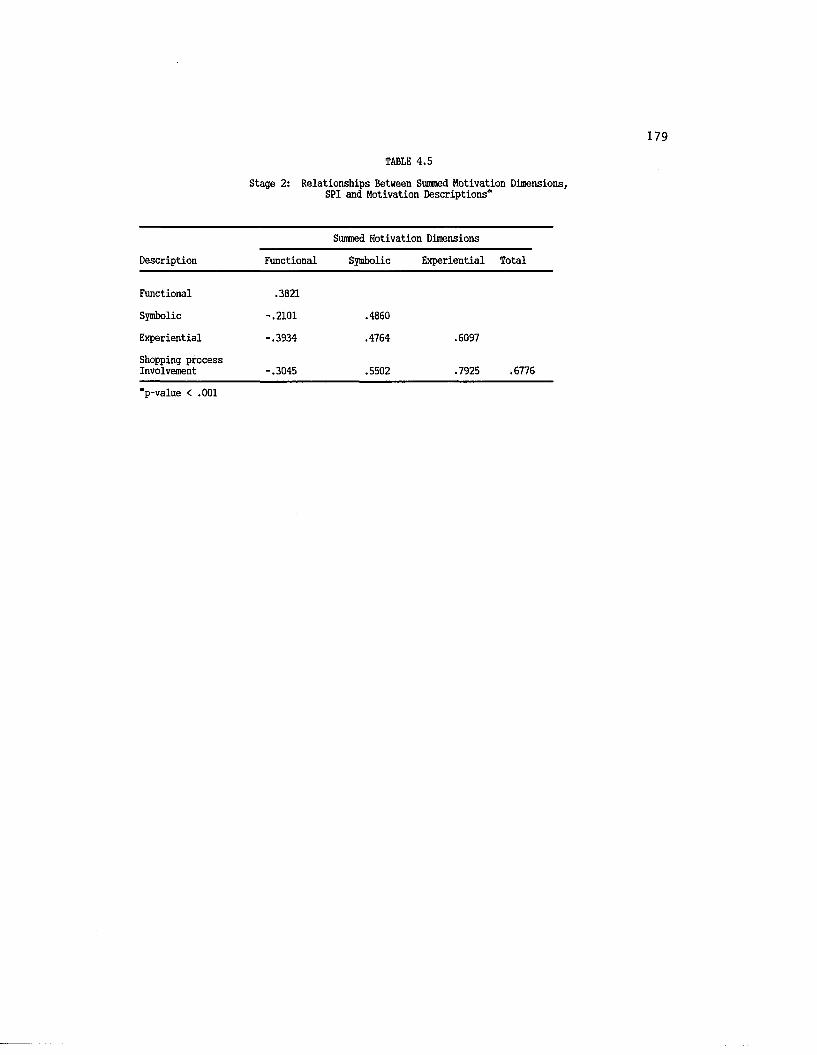
TABLE 4.5
Stage 2: Relationships Between Sunned Motivation Dimensions, SPI and Motivation Descriptions"
Sunned Motivation Dimensions
Description Functional Symbolic Experiential Total
Functional .3821
Symbolic -.2101 .4860
Experiential -.3934 .4764 .6097
Shopping process Involvement -.3045 .5502 .7925 .6776
"p-value < .001
180
employed to assess unidimensionality of motivation subscales. Factor
analysis for each subscale produced one factor with an eigenvalue
greater than 1.0, indicating the subscale items are consistent and
homogeneous.
Cronbach alpha coefficients were then computed for individual
scale items and the total subscales. Overall, reliability was improved
over previous data collections as demonstrated by alpha values in range
of .62 to .89. Based on item-total correlations and factor loadings,
items were either deleted or retained in the original subscale. This
resulted in a reduced shopping motivation scale of 60 items (Means,
standard deviations, correlations, and alpha values for the items are
presented in Table B.2).
To compare these scale items with those of previous stages, refer
to Tables 4.2 and 4.3. Table 4.2 summarizes the number of items used at
each stage of the scale development process as well as the number of
items added or deleted. Table 4.3 reports item-total correlations for
every scale item utilized during the three stages of data collection.
In all, 185 items were employed and there was an average of 10 items per
subscale. The final measure employed for Stage 3 consisted of an
average of four-item subscales for each construct.
Following traditional reliability analyses of the 60-item
shopping motivation scale, confirmatory factor analysis was performed.
Again, as in Stage 2, this analysis is a stronger test of the
hypothesized factor structure and internal consistency of scale items.
The LISREL item reliabilities, factor loadings, construct reliabilities,
and measures of model fit are presented in Table B.3.
181
In viewing the item reliabilities, most appear to be good
indicators for the construct with reliabilities above 0.50. However,
several constructs have items with alarmingly low reliability. The
information subscale continues to be difficult to measure — only two
items were able to show adequate reliability. Thus, the other
information subscale items were dropped from the analysis.
Additionally, items purported to measure role-enactment fail to exhibit
acceptable reliability. Only one item truly loads highly on this factor
as evidenced by a factor loading of .908 and item reliability of .824.
The construct reliability for this subscale is quite low (0 .52) and it
appears further testing is needed to improve its measurement.
Nevertheless, the 15 remaining subscales are acceptable indicators
with construct reliabilities of .71 and higher. Table 4.6 provides a
comparison of the LISREL construct reliabilities and Cronbach alpha
coefficients. Again, little difference is found between the two
measures.
Model Fit. Assessment of the overall confirmatory factor model
fit is provided in Table B.3. The three factor models tested for the
shopping motivation scale exhibit adjusted goodness-of-fit values of
.881 for the functional dimension, .801 for symbolic and .816 for
experiential. Root mean square residual (RMSR) values are .058 for
functional, .072 for symbolic and .057 for experiential. These values
are similar to those reported in Stage 2 analyses and are significant
(p<.001) which indicates a rejection of the proposed factor models.
However, as discussed many problems exist in using the model fit

182TABLE 4.6
Stage 3: Shopping Motivations Comparison of Coefficient Alpha and LISREL Reliabilities
Subscale Cronbach Alpha LISREL Reliability
Functional Dimension
Product .8403 .8446Price .7867 .7870Information .7355 .7687Negotiation .7262 .7349
Symbolic Dimension
Role-Enactment .6187 .5179Self-Gratification .8382 .8395Affiliation .7410 .7395Power .6863 .6889Innovator .8648 .8661Personalizing .7141 .7224Prestige .7616 .7661
ExDeriential Dimension
Exercise .8875 .8902Diversion .8479 .8497Sensory Stimulation .8015 .8029Cognitive Stimulation .8923 .8915Recreation .8480 .8511Variety .7944 .7981
183
statistics and in light of theory and consistency across research
stages, support is found for the dimensionality of the motivation
construct. As a summary of the coefficient alpha reliability across the
three data collections, Table 4.7 is provided. As can be seen,
reliability improved throughout the scale development process with all
but two subscales demonstrating acceptable internal consistency at Stage
3.
Validity Assessment. Confirmatory factor analysis also provides
evidence to support the proposition of a three-dimensional motivation
construct as the factor models are easily interpretable and within
acceptable ranges.
Further assessment of validity is provided by the relationship
between the motivation scale and other related constructs. Table 4.8
presents Pearson correlations between the summed motivation measures and
related constructs. Pearson correlations between summed motivation
subdimensions and summed shopping process involvement (SPI) scales
indicate a significant relationship as evidenced by correlations of -.47
for functional, .78 for symbolic and .83 for experiential (all p-
valuesC.OOl). The correlation between the total motivation summed scale
and the total SPI scale is .81 (p-value<.001). Confirmation is thus
provided as to a significant relationship between shopping motivation
and SPI.
As in Stage 2 analyses, additional evidence of construct validity
is provided by examining the relationship between the two proposed
measures of motivation: summed motivation scale scores and self-
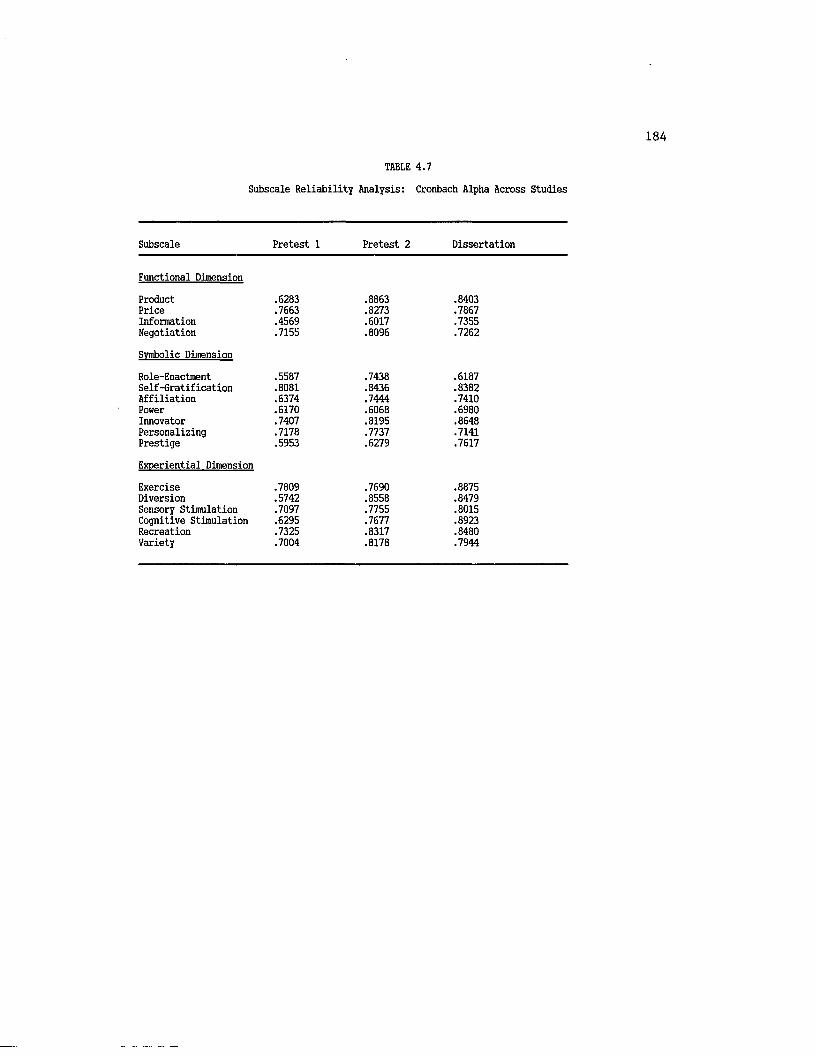
TABLE 4.7
Subscale Reliability Analysis: Cronbach Alpha Across Studies
Subscale Pretest 1 Pretest 2 Dissertation
Functional Dimension
Product .6283 .8863 .8403Price .7663 .8273 .7867Information .4569 .6017 .7355Negotiation .7155 .8096 .7262
Svmbolic Dimension
Role-Enactment .5587 .7438 .6187Self-Gratification .8081 .8436 .8382Affiliation .6374 .7444 .7410Power .6170 .6068 .6980Innovator .7407 .8195 .8648Personalizing .7178 .7737 .7141Prestige .5953 .6279 .7617
Exneriential Dimension
Exercise .7809 .7690 .8875Diversion .5742 .8558 .8479Sensory Stimulation .7097 .7755 .8015Cognitive Stimulation .6295 .7677 .8923Recreation .7325 .8317 .8480Variety .7004 .8178 .7944
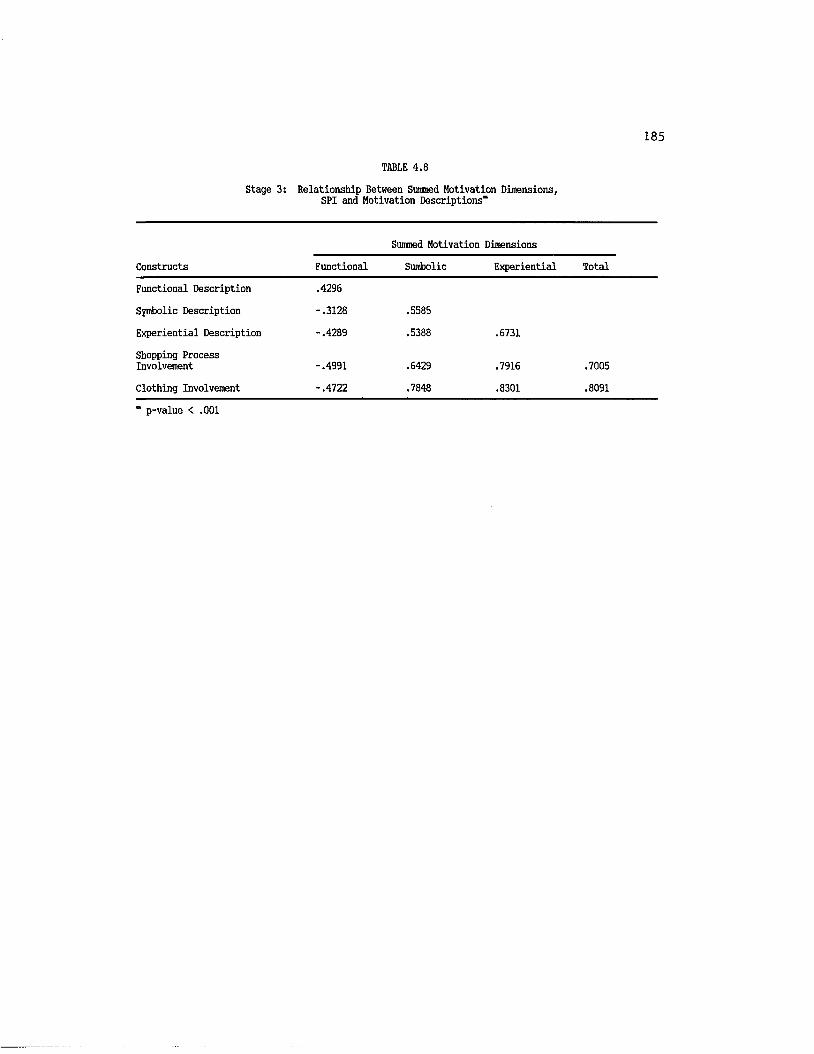
185
TABLE 4.8
Stage 3: Relationship Between Summed Motivation Dimensions, SPI and Motivation Descriptions"
Summed Motivation Dimensions
Constructs Functional Sumbolic Experiential Total
Functional Description .4296
Symbolic Description -.3128 .5585
Experiential Description -.4289 .5388 .6731
Shopping Process Involvement -.4991 .6429 .7916 .7005
Clothing Involvement -.4722 .7848 .8301 .8091
" p-value < .001

186
descriptions. The Pearson correlations are reported in Table 4.8 and
all are significant (p-value<.001) and above the criterion of .30.
To test for criterion-related validity the shopping motivation
scale was correlated with behavioral items expected to represent
outcomes of an individuals' motivation. Table 4.9 reports the
correlations between shopping motivation and the number of times an
individual visited stores to either purchase or browse in the last
month. The correlations are significant and high enough to be of
practical significance (i.e. greater then .30).
To summarize, the shopping motivation scale demonstrates
acceptable validity as measured by content, criterion and construct
validity. The validity coefficients are significant and above .30 and
the measure correlates with other constructs of interest. Therefore,
the shopping motivation subscales are deemed to adequately represent the
specified constructs.
Product Involvement Scale Analyses
The development of the product involvement scale followed the
procedure outlined for the shopping motivation scale. This construct is
to represent an individual's ongoing concern or interest in a specific
product, clothing.
Stage 1. Individual's enduring involvement with the product class
clothing was assessed using a 13-item Likert-type scale.
Reliability Assessment. Several analyses were utilized to
evaluate the 13 clothing involvement scale items. Based on the results
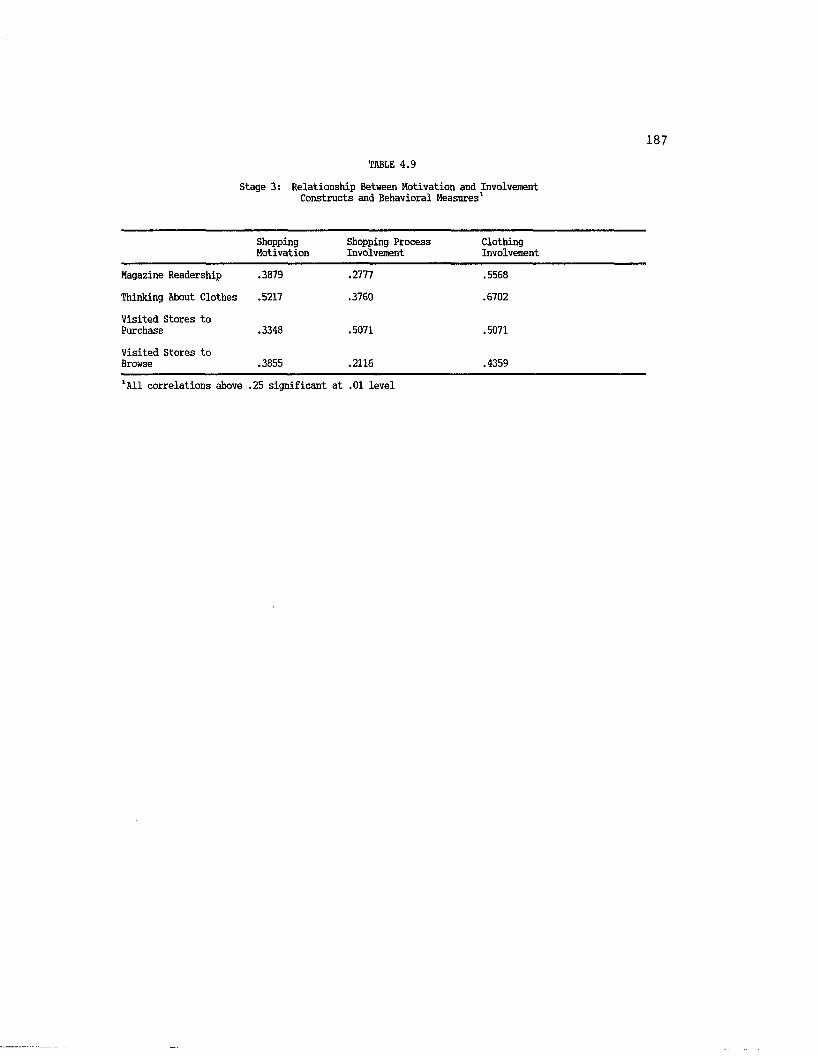
187TABLE 4.9
Stage 3: Relationship Between Motivation and Involvement Constructs and Behavioral Measures'
ShoppingMotivation
Shopping Process Involvement
ClothingInvolvement
Magazine Readership .3879 .2777 .5568
Thinking About Clothes .5217 .3760 .6702
Visited Stores to Purchase .3348 .5071 .5071
Visited Stores to Browse .3855 .2116 .4359
lAll correlations above .25 significant at .01 level
188
of descriptive statistics, item-subscale and item-total correlations,
factor analysis and Cronbach1s alpha coefficients on the total scale,
items were either eliminated, reworded, or retained in the original
scale. Item-to-total correlations for the scale range from -0.08 to
0.67, and coefficient alpha for the scale was 0.83. Means, standard
deviations, correlations, and alpha values for the initial instrument
are presented in Table 4.10.
Based on the results of these analyses, the scale was reduced to
10 items with a total scale alpha of .85 (means, standard deviations,
correlations, and alpha values for the reduced scale appear in Table
4.11). A factor analysis of the 10 item involvement measure produced
two factors with eigenvalues greater than one, which explained 51% of
the variance. The first factor consists of six items and appears to
reflect an individual's "fashion awareness". The highest loading
variables capture the degree to which individuals feel knowledgeable
about fashion and their concern for how others view them.
Factor 2 corresponds to an individuals1 concern with their
appearance and is labeled "fashion appearance". These items reflect how
clothing may be used by individual's to express the self-concept or is
related to important needs or values. Factor loadings for the two
factors are shown in Table 4.12. Overall, the factors are easily
interpreted and appear to reflect individuals' level of involvement with
clothing. The reliability of the scale is quite good (0.83) which
justifies its use in future research.
Stage 3. The 10-item product involvement scale was administered during
Stage 3. Additional analyses were conducted to evaluate scale
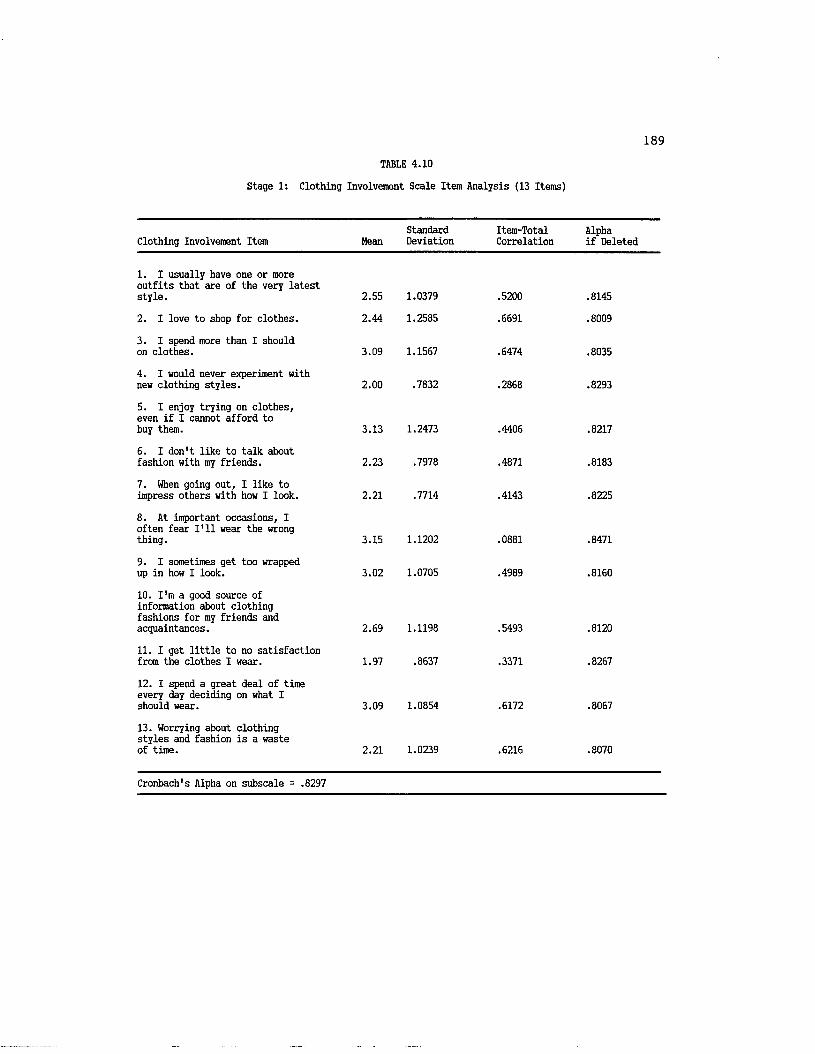
189TABLE 4.10
Stage 1: Clothing Involvement Scale Item Analysis (13 Items)
Clothing Involvement Item MeanStandardDeviation
Item-TotalCorrelation
Alpha if Deleted
1. I usually have one or more outfits that are of the very latest style. 2.55 1.0379 .5200 .8145
2. I love to shop for clothes. 2.44 1.2585 .6691 .8009
3. I spend more than I should on clothes. 3.09 1.1567 .6474 .8035
4. I would never experiment with new clothing styles. 2.00 .7832 .2868 .8293
5. I enjoy trying on clothes, even if I cannot afford to buy them. 3.13 1.2473 .4406 .8217
6. I don't like to talk about fashion with my friends. 2.23 .7978 .4871 .8183
7. When going out, I like to impress others with how I look. 2.21 .7714 .4143 .8225
8. At important occasions, I often fear I'll wear the wrong thing. 3.15 1.1202 .0881 .8471
9. I sometimes get too wrapped up in how I look. 3.02 1.0705 .4989 .8160
10. I'm a good source of information about clothing fashions for my friends and acquaintances. 2.69 1.1198 .5493 .8120
11. I get little to no satisfaction from the clothes I wear. 1.97 .8637 .3371 .8267
12. I spend a great deal of time every day deciding on what I should wear. 3.09 1.0854 .6172 .8067
13. Worrying about clothing styles and fashion is a waste of time. 2.21 1.0239 .6216 .8070
Cronbach's Alpha on subscale = .8297

190TABLE 4.11
Stage 1: Clothing Involvement Scale Item Analysis (10 Items)
Clothing Involvement Item MeanStandardDeviation
Item-TotalCorrelation
Alpha if Deleted
1. I usually have one or more outfits that are of the very latest style. 2.55 1.0379 .5204 .8337
2. I love to shop for clothes. 2.44 1.2585 .6812 .8174
3. I spend more than I should on clothes. 3.09 1.1567 .6466 .8214
5. I enjoy trying on clothes, even if I cannot afford to buy them. 3.13 1.2473 .4550 .8418
6. I don't like to talk about fashion with my friends. 2.23 .7978 .4776 .8379
7. When going out, I like to impress others with how I look. 2.21 .7714 .4225 .8416
9. I sometimes get too wrapped up in how I look. 3.02 1.0705 .4703 .8382
10. I'm a good source of information about clothing fashions for my friends and acquaintances. 2.69 1.1198 .5605 .8300
12. I spend a great deal of time every day deciding on what I should wear. 3.09 1.0854 .6165 .8248
13. Worrying about clothing styles and fashion is a waste of time. 2.21 1.0239 .6049 .8262
Cronbach's Alpha on subscale = .8459

TABLE 4.12
Stage 1: Factor Analysis - Clothing Involvement Scale (10 Items)
Factor 1: "Fashion Awareness" Factor 2: "Fashion Appearance"(Variance Explained = 51.0%)
Scale Item Factor 1 Factor 2
I'm a good source of information about clothing fashions for my friends and acquaintances..........
I spend more than I should on clothes.............
When going out, I like to impress others with how I look.
I love to shop for clothes.
I usually have one or more outfits that are of the very latest style................... .5862
I don't like to talk about fashion with my friends... .5744
I sometimes get too wrapped up in how I look.........
I enjoy trying on clothes, even if I cannot afford to buy them...............
Worrying about clothing styles and fashion is a waste of time.................
I spend a great deal of time every day deciding on what I should wear.............. .5432 .4845
.7374
.5045
.5461
.7689
.7603
.7414
.7444
192
reliability and validity.
Reliability Assessment. An initial factor analysis resulted in
two factors, one containing 8 items and the second composed of the two
reverse-scored items. Based on the results of descriptive statistics,
item-subscale and item-total correlation, and alpha coefficients on the
total scale, the two negatively-worded statements were deleted from the
scale. The original 10-item scale means, standard deviations,
correlations, and alpha values are presented in Table 4.13. While the
standardized alpha value is high (.87) the two negatively worded
statements exhibit low item-total correlations.
The reduced 8-item scale exhibits slightly improved reliability
(.88), and all items show relatively high item-total correlations
(means, standard deviations, correlations, and alpha values are
presented in Table 4.14). The reduced scale was factor analyzed using
principal components analysis. One factor was extracted and explained
approximately 55% of the variance.
Validity Assessment. To assess the validity of the clothing
involvement scale, the measure was correlated with other constructs and
behavioral measures. As shown in Tables 4.8 and 4.9, clothing
involvement is significantly correlated wi'th the shopping motivation
scale (.81) and the shopping process involvement measure (.51). This
provides evidence of construct validity for the measure. Clothing
involvement is also correlated with certain behavioral measures. Table
4.9 shows these for magazine readership, time spent thinking about
clothing, and amount of time spent in clothing stores in the last month
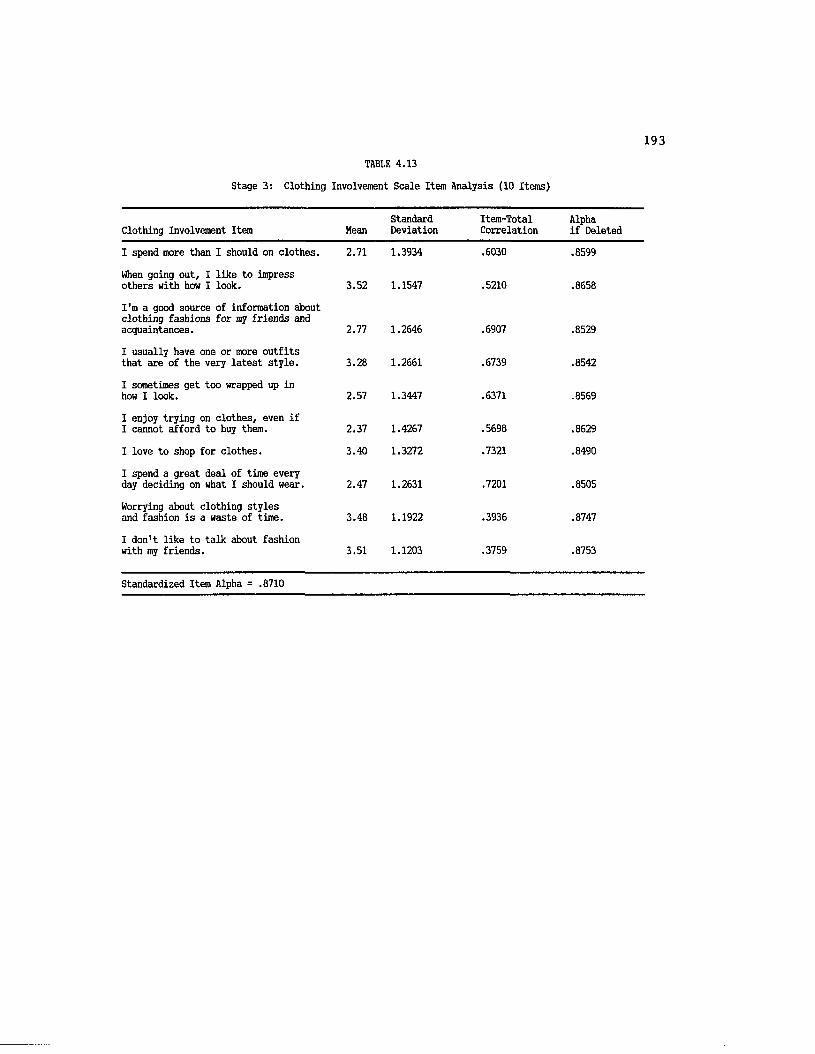
193TABLE 4.13
Stage 3: Clothing Involvement Scale Item Analysis (10 Items)
Clothing Involvement Item MeanStandardDeviation
Item-TotalCorrelation
Alpha if Deleted
I spend more than I should on clothes. 2.71 1.3934 .6030 .8599
When going out, I like to impress others with how I look. 3.52 1.1547 .5210 .8658
I'm a good source of information about clothing fashions for ray friends and acquaintances. 2.77 1.2646 .6907 .8529
I usually have one or more outfits that are of the very latest style. 3.28 1.2661 .6739 .8542
I sometimes get too wrapped up in how I look. 2.57 1.3447 .6371 .8569
I enjoy trying on clothes, even if I cannot afford to buy them. 2.37 1.4267 .5698 .8629
I love to shop for clothes. 3.40 1.3272 .7321 .8490
I spend a great deal of time every day deciding on what I should wear. 2.47 1.2631 .7201 .8505
Worrying about clothing styles and fashion is a waste of time. 3.48 1.1922 .3936 .8747
I don't like to talk about fashion with my friends. 3.51 1.1203 .3759 .8753
Standardized Item Alpha = .8710

194TABLE 4.14
Stage 3: Clothing Involvement Scale Item Analysis (8 Items)
Clothing Involvement Item MeanStandardDeviation
Item-TotalCorrelation
Alphaif Deleted
I spend more than I should on clothes. 2.72 1.3934 .6182 .8696
When going out, I like to impress others with how I look. 3.52 1.1547 .5161 .8785
I'm a good source of information about clothing fashions for my friends and acquaintances. 2.77 1.2646 .6762 .8635
I usually have one or more outfits that are of the very latest style. 3.28 1.2661 .6645 .8646
I sometimes get too wrapped up in how I look. 2.57 1.3447 .6516 .8659
I enjoy trying on clothes, even if I cannot afford to buy them. 2.37 1.4267 .5945 .8725
I love to shop for clothes. 3.40 1.3272 .7125 .8595
I spend a great deal of time every day deciding on what I should wear. 2.47 1.2631 .7460 .8564
Standardized Item Alpha = .8817
195
to either make a purchase or browse. Clothing involvement is
significantly related to each of these measures providing further
evidence of construct validity. Individuals who exhibit ongoing concern
with the product clothing are also expected to be interested in reading
about clothing and fashions and engaging in shopping or browsing
behavior.
Based on the results of the two stages of data collection and
analysis, evidence is provided for the reliability of the clothing
involvement measure and its validity. Both criterion-related and
construct validity are tested and provide acceptable results.
Shopping Process Involvement (SPI) Scale Development
The shopping process involvement scale development procedure
consisted of three stages of data collection to purify and test the
reliability and validity of the measure. This construct represents an
individual's interest or concern with the process or activity of
shopping.
Stage 1. An initial measure of 22 Likert-type items was administered
during Stage 1. Several analyses were utilized to evaluate the 22 SPI
scale items.
Reliability Assessment. Based on the results of descriptive
statistics, item-total correlations, factor analysis and Cronbach's
alpha coefficients, items were either eliminated or retained. Item-to-
total correlations for the scales ranged from -0.13 to 0.74 and
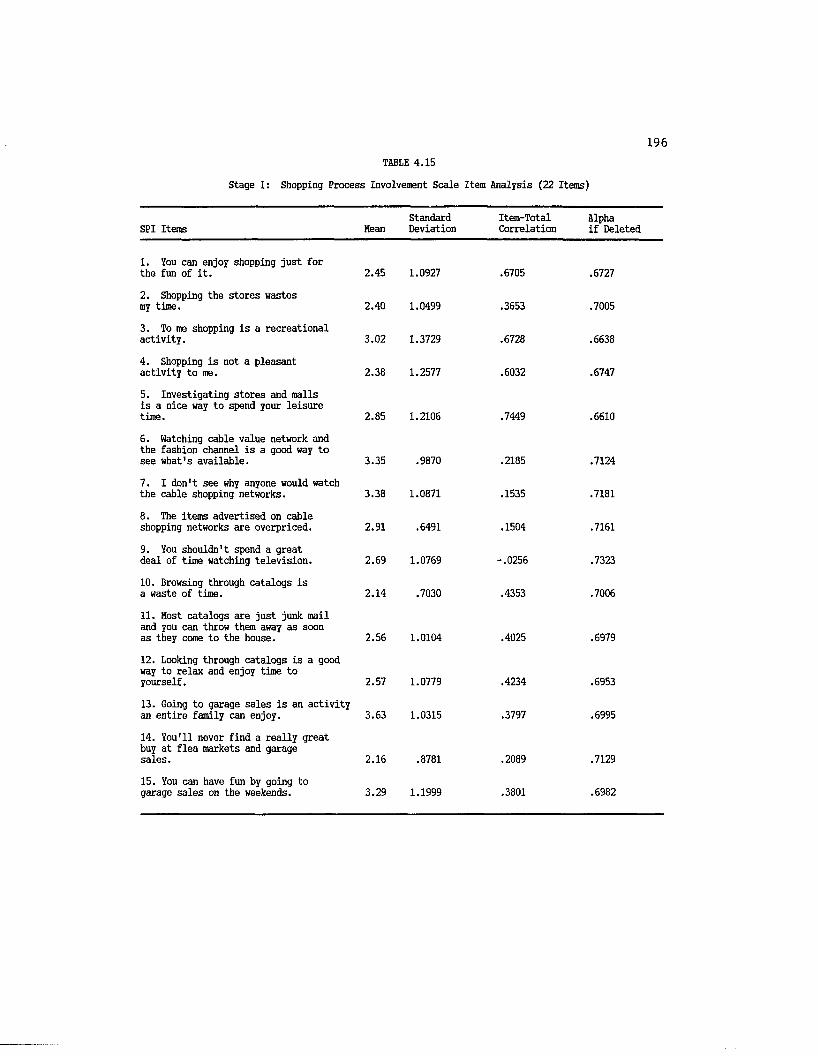
TABLE 4.15
Stage 1: Shopping Process Involvement Scale Item Analysis (22 Items)
196
Standard Item-Total AlphaSPI Items Mean Deviation Correlation if Deleted
1. You can enjoy shopping just forthe fun of it. 2.45 1.0927 .6705 .6727
2. Shopping the stores Hastesmy time. 2.40 1.0499 .3653 .7005
3. To me shopping is a recreationalactivity. 3.02 1.3729 .6728 .6638
4. Shopping is not a pleasantactivity to me. 2.38 1.2577 .6032 .6747
5. Investigating stores and malls is a nice way to spend your leisuretime. 2.85 1.2106 .7449 .6610
6. Hatching cable value network and the fashion channel is a good way tosee what's available. 3.35 .9870 .2185 .7124
7. I don't see why anyone would watchthe cable shopping networks. 3.38 1.0871 .1535 .7181
8. The items advertised on cableshopping networks are overpriced. 2.91 .6491 .1504 .7161
9. You shouldn't spend a greatdeal of time watching television. 2.69 1.0769 -.0256 .7323
10. Browsing through catalogs isa waste of time. 2.14 .7030 .4353 .7006
11. Host catalogs are just junk mail and you can throw them away as soonas they come to the house. 2.56 1.0104 .4025 .6979
12. Looking through catalogs is a good way to relax and enjoy time toyourself. 2.57 1.0779 .4234 .6953
13. Going to garage sales is an activityan entire family can enjoy. 3.63 1.0315 .3797 .6995
14. You'll never find a really great buy at flea markets and garagesales. 2.16 .8781 .2089 .7129
15. You can have fun by going togarage sales on the weekends. 3.29 1.1999 .3801 .6982

TABLE 4.15 (continued)
SPI Items MeanStandardDeviation
Item-TotalCorrelation
Alpha if Deleted
16. My family and friends would not approve of my purchasing items at a garage sale or flea market. 2.32 1.0389 -.1392 .7399
17. I use credit cards for convenience only. 2.74 1.1553 -.1248 .7422
18. Having a high credit card balance is the "American" way. 3.67 1.1560 .0888 .7244
19. Buying with a credit card is like getting the merchandise for free. 4.01 .9782 .2621 .7091
20. It's not important to keep track of my credit card balances. 4.11 1.1026 .1083 .7220
21. Anytime you buy a product by mail or phone, you're asking for trouble. 2.83 .8617 .0365 .7240
22. The only way you can be assured you are getting what you want is by actually seeing the product. 2.14 1.0323 -.0212 .7310
Cronbach's Alpha on subscale = .7178

198
coefficient alpha for the scale was 0.72. These statistics are reported
in Table 4.15.
Based on these results, the scale was reduced to 15 items with a
total scale alpha of 0.81 (means, standard deviations, correlations and
alpha values for the reduced instrument are presented in Table 4.16).
Stage 2. During Stage 2 the SPI scale was reduced to 12 items which
exhibited the highest item-total correlations and Cronbach alpha values.
This 12 item scale was then administered to a combined sample of 240
students and nonstudents.
Reliability Assessment. Overall item statistics are reported in
Table 4.17 and indicate the items are internally consistent. Item-
total correlations range from .27 to .69. The coefficient alpha for the
total scale is .8037.
Principal components factor analysis with varimax rotation was
performed to assess the dimensionality of the SPI construct. As
hypothesized, the factor analysis resulted in three factors with
eigenvalues greater than one. These factors were labeled "Recreational
Involvement", "Non-traditional Outlet Involvement", and "Catalog
Involvement". The factor loadings for the SPI items are contained in
Table 4.18.
Validity Assessment. The items appear to measure the domain of
interest thus content validity is established. In addition, the
significant positive correlation with shopping motivation also indicates
the SPI scale has construct validity (Pearson correlations are provided
in Table 4.8).
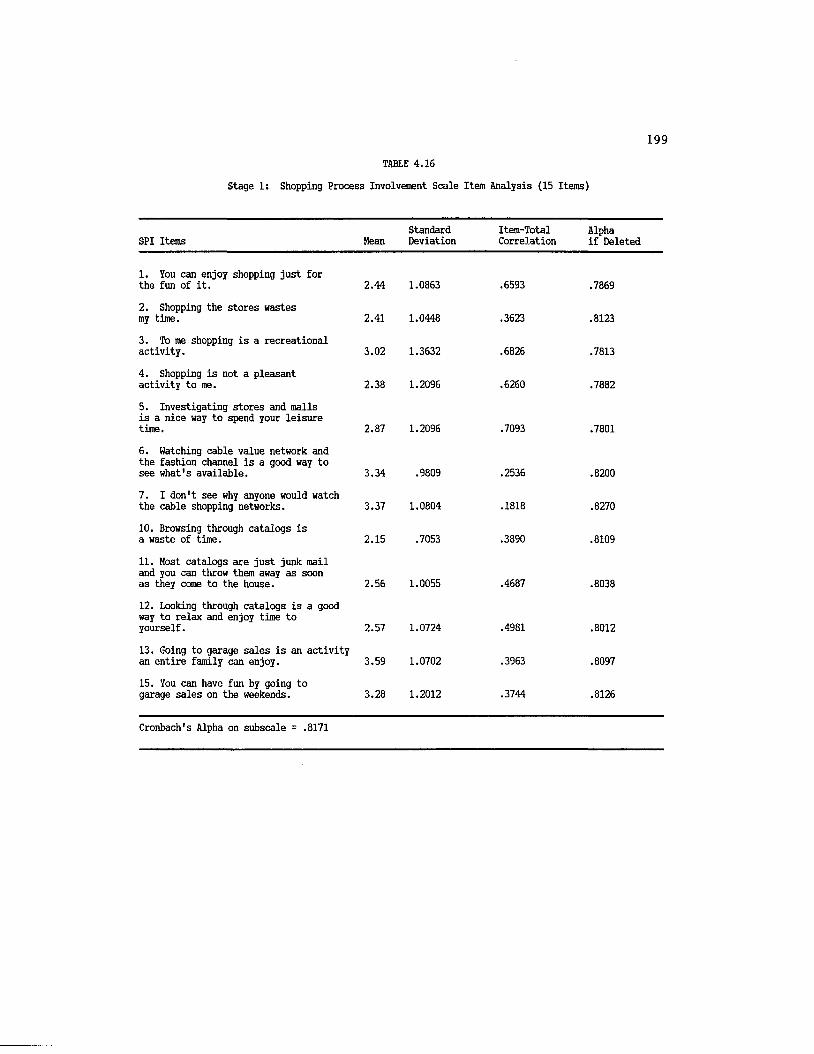
199TABLE 4.16
Stage 1: Shopping Process Involvement Scale Item Analysis (15 Items)
SPI Items MeanStandardDeviation
Item-TotalCorrelation
Alpha if Deleted
1. You can enjoy shopping just for the fun of it. 2.44 1.0863 .6593 .7869
2. Shopping the stores wastes my time. 2.41 1.0448 .3623 .8123
3. To me shopping is a recreational activity. 3.02 1.3632 .6826 .7813
4. Shopping is not a pleasant activity to me. 2.38 1.2096 .6260 .7882
5. Investigating stores and malls is a nice way to spend your leisure time. 2.87 1.2096 .7093 .7801
6. Watching cable value network and the fashion channel is a good way to see what's available. 3.34 .9809 .2536 .8200
7. I don't see why anyone would watch the cable shopping networks. 3.37 1.0804 .1818 .8270
10. Browsing through catalogs is a waste of time. 2.15 .7053 .3890 .8109
11. Host catalogs are just junk mail and you can throw them away as soon as they come to the house. 2.56 1.0055 .4687 .8038
12. Looking through catalogs is a good way to relax and enjoy time to yourself. 2.57 1.0724 .4981 .8012
13. Going to garage sales is an activity an entire family can enjoy. 3.59 1.0702 .3963 .8097
15. You can have fun by going to garage sales on the weekends. 3.28 1.2012 .3744 .8126
Cronbach's Alpha on subscale = .8171
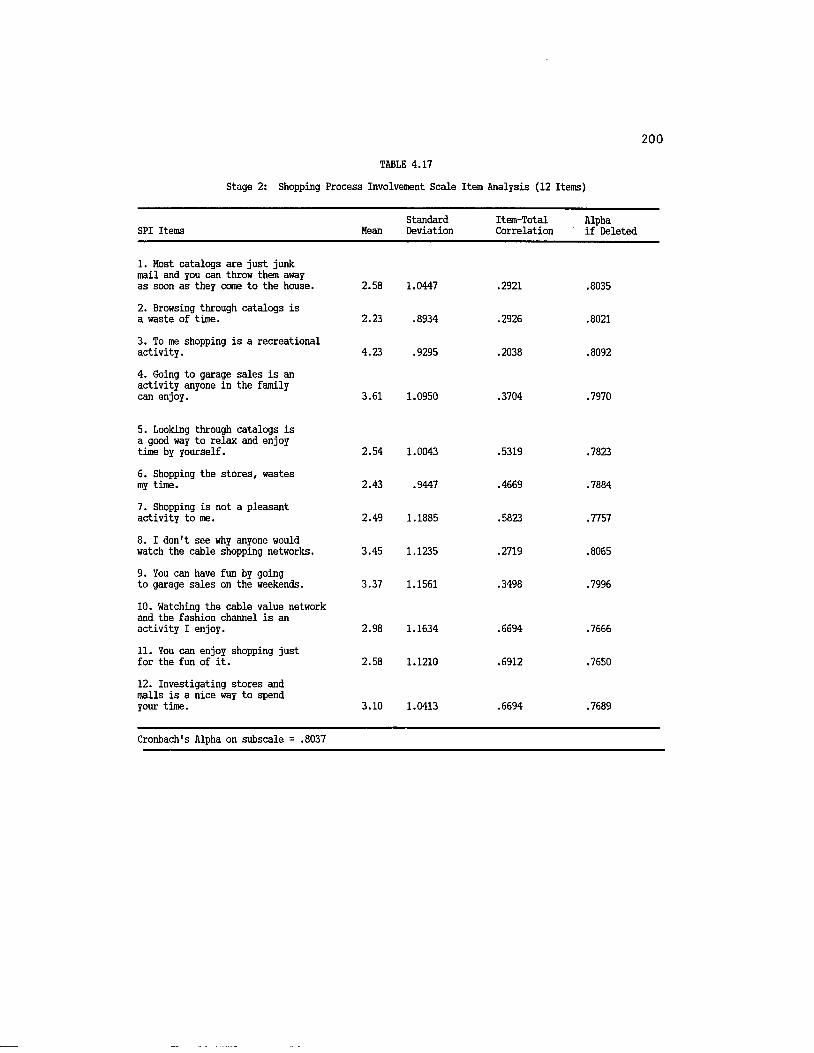
200TABLE 4.17
Stage 2: Shopping Process Involvement Scale Item Analysis (12 Items)
SPI Items MeanStandardDeviation
Item-TotalCorrelation
Alphaif Deleted
1. Host catalogs are just junk mail and you can throw them away as soon as they come to the house. 2.58 1.0447 .2921 .8035
2. Browsing through catalogs is a waste of time. 2.23 .8934 .2926 .8021
3. To me shopping is a recreational activity. 4.23 .9295 .2038 .8092
4. Going to garage sales is an activity anyone in the family can enjoy. 3.61 1.0950 .3704 .7970
5. Looking through catalogs is a good way to relax and enjoy time by yourself. 2.54 1.0043 .5319 .7823
6. Shopping the stores, wastes my time. 2.43 .9447 .4669 .7884
7. Shopping is not a pleasant activity to me. 2.49 1.1885 .5823 .7757
8. I don't see why anyone would watch the cable shopping networks. 3.45 1.1235 .2719 .8065
9. You can have fun by going to garage sales on the weekends. 3.37 1.1561 .3498 .7996
10. Hatching the cable value network and the fashion channel is an activity I enjoy. 2.98 1.1634 .6694 .7666
11. You can enjoy shopping just for the fun of it. 2.58 1.1210 .6912 .7650
12. Investigating stores and malls is a nice way to spend your time. 3.10 1.0413 .6694 .7689
Cronbach's Alpha on subscale = .8037
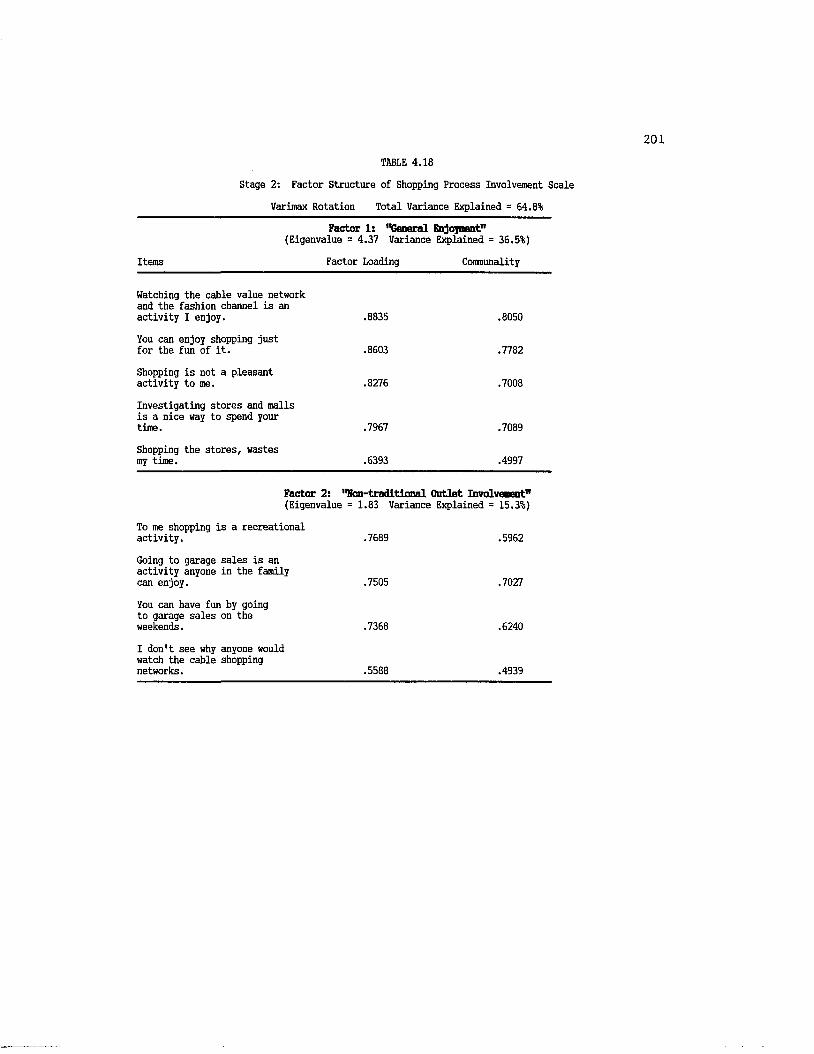
TABLE 4.18
Stage 2: Factor Structure of Shopping Process Involvement Scale
Varimax Rotation Total Variance Explained = 64.8%
Factor 1: "General Enjoyment"(Eigenvalue = 4.37 Variance Explained = 36.5%)
Items Factor Loading Communality
Watching the cable value network and the fashion channel is an activity I enjoy. .8835 .8050
You can enjoy shopping just for the fun of it. .8603 .7782
Shopping is not a pleasant activity to me. .8276 .7008
Investigating stores and malls is a nice way to spend your time. .7967 .7089
Shopping the stores, wastes my time. .6393 .4997
Factor 2: "Han-traditional Outlet Involvement"(Eigenvalue = 1.83 Variance Explained = 15.3%)
To me shopping is a recreational activity. .7689 .5962
Going to garage sales is an activity anyone in the family can enjoy. .7505 .7027
You can have fun by going to garage sales on the weekends. .7368 .6240
I don't see why anyone would watch the cable shopping networks. .5588 .4939
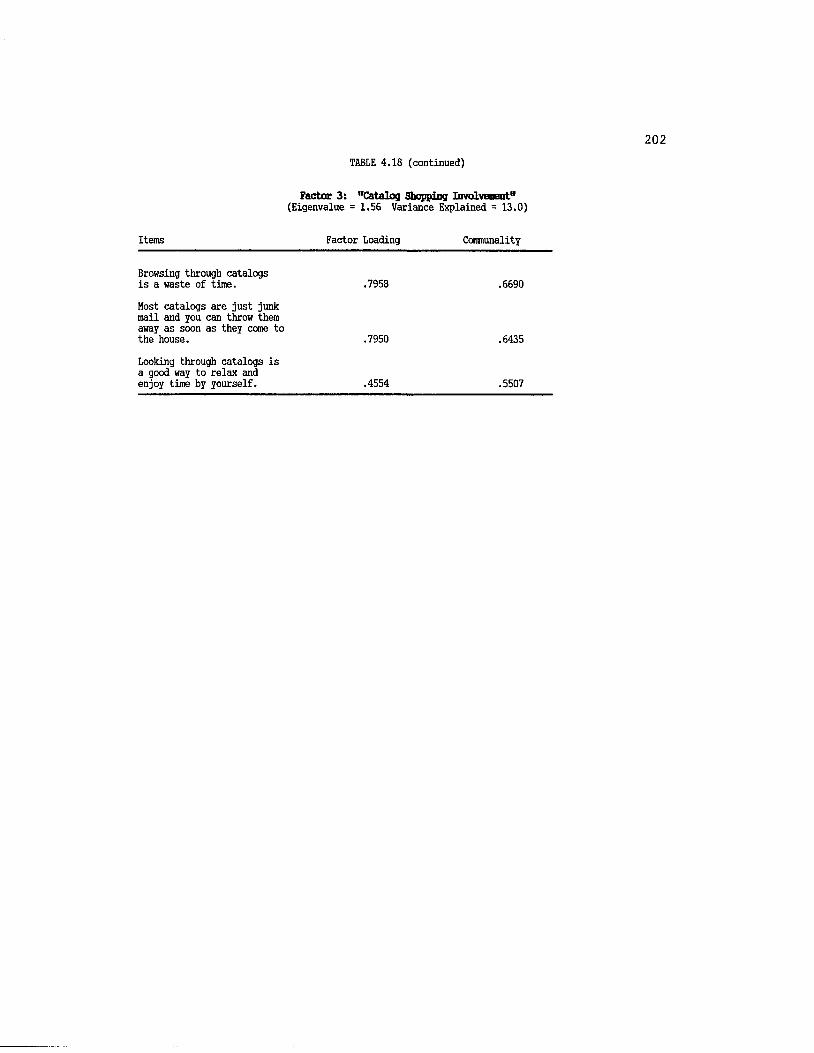
TABLE 4.18 (continued)
Factor 3: "Catalog Shopping Involvement"(Eigenvalue =1.56 Variance Explained = 13.0)
Items Factor Loading Commonality
Browsing through catalogsis a waste of time. .7958
Most catalogs are just junkmail and you can throw themaway as soon as they come tothe house. .7950
Looking through catalogs is a good way to relax andenjoy time by yourself. .4554
.6690
.6435
.5507

203
Stage 3. During Stage 3 of data collection, the 12 item SPI scale was
administered to 245 women. Principal components factor analysis with
varimax rotation was performed to assess the dimensionality of the
construct. As found in Stage 2 and as hypothesized, the factor analysis
resulted in three factors with eigenvalues greater than one. These
factors are easily interpretable as "Recreational Involvement", "Non-
traditional Outlet Involvement" and "Catalog Involvement". The analysis
accounts for 62 percent of the variance and factor loadings, communality
and variance explained statistics are reported in Table 4.19. This
provides additional evidence of trait validity of the SPI construct.
Reliability Assessment. To assess the internal consistency of the
SPI scale, Cronbach alpha coefficients were computed. As in Stage 1 and
Stage 2, reliability of the total 12 item scale was high (.79). Item
statistics for this analysis are reported in Table 4.20. Cronbach alpha
coefficients were also calculated for the three subscales. These
results are reported in Table 4.21. As can be seen, the Recreational
Involvement measure has very high reliability (.87). The Non-
traditional Outlet Involvement subscale and Catalog Involvement subscale
have acceptable reliabilities of .66 and .69 respectively.
Confirmatory factor analysis using LISREL was also conducted to
explore the dimensionality of the SPI scale. Table 4.22 presents the
results from this analysis. Most item reliabilities are acceptable
(greater than .5), however a few items do not meet this criteria. The
items purported to measure non-traditional outlet involvement appear to
have two primary indicators which explain most of the variance in the
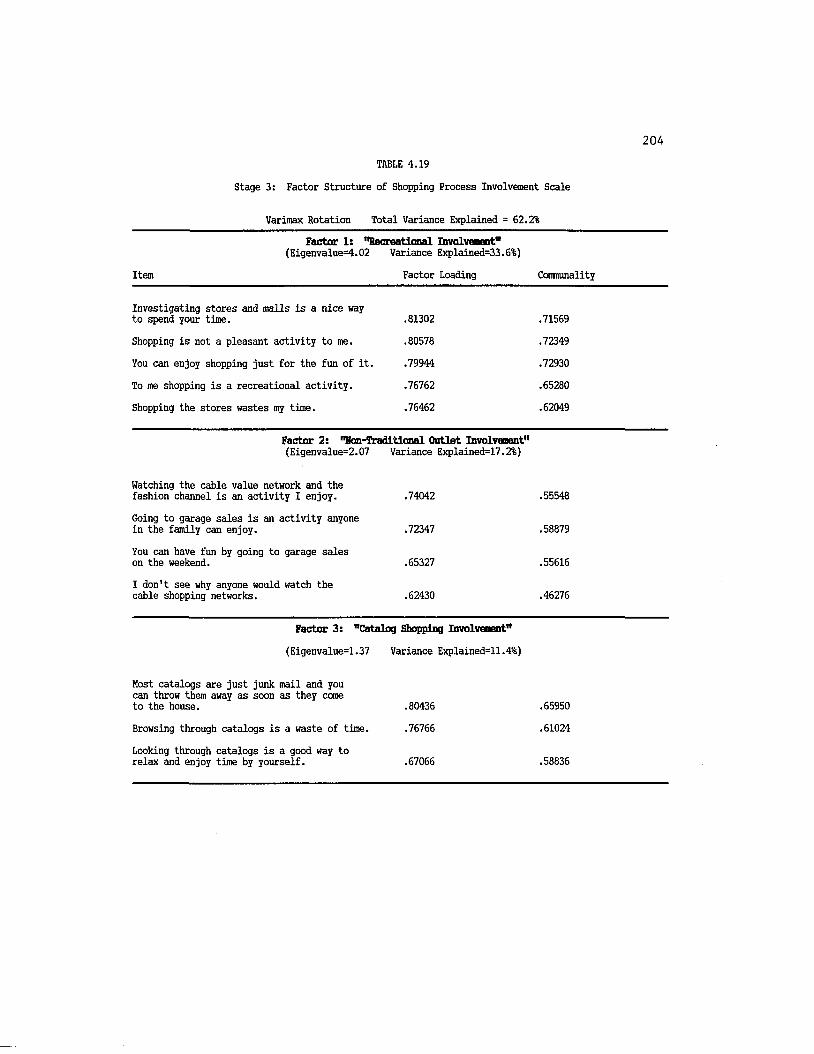
204TABLE 4.19
Stage 3: Factor Structure of Shopping Process Involvement Scale
Varimax Rotation Total Variance Explained = 62.2%
Factor 1: "Recreational Involvement"(Eigenvalue=4.02 Variance Explained=33.6%)
Item Factor Loading Coninunality
Investigating stores and malls is a nice way to spend your time. .81302 .71569
Shopping is not a pleasant activity to me. .80578 .72349
You can enjoy shopping just for the fun of it. .79944 .72930
To me shopping is a recreational activity. .76762 .65280
Shopping the stores wastes my time. .76462 .62049
Factor 2: "Ban-Traditional Outlet Involvement"(Eigenvalue=2.07 Variance Explained=17.2%)
Watching the cable value network and the fashion channel is an activity I enjoy. .74042 .55548
Going to garage sales is an activity anyone in the family can enjoy. .72347 .58879
You can have fun by going to garage sales on the weekend. .65327 .55616
I don't see why anyone would watch the cable shopping networks. .62430 .46276
Factor 3: "Catalog Shopping Involvement"(Eigenvalue^. 37 Variance Explained=11.4%)
Host catalogs are just junk mail and you can throw them away as soon as they come to the house. .80436 .65950
Browsing through catalogs is a waste of time. .76766 .61024
Looking through catalogs is a good way to relax and enjoy time by yourself. .67066 .58836

205TABLE 4.20
Stage 3: Shopping Process Involvement Scale Item Analysis
Subscale Items MeanStandardDeviation
Item-TotalCorrelation
Alpha if Item Deleted
Investigating stores and malls is a nice way to spend your time. 3.03 1.2277 .6677 .7584
Shopping is not a pleasant activity to me. 3.67 1.2442 .5638 .7691
To me shopping is a recreational activity. 2.63 1.3348 .6104 .7631
You can enjoy shopping just for the fun of it. 3.56 1.1859 .7206 .7537
Shopping the stores wastes my time. 3.64 1.1864 .5276 .7732
Watching the cable value network and the fashion channel is an activity I enjoy. 1.60 .9779 .3234 .7916
Going to garage sales is an activity anyone in the family can enjoy. 2.52 1.3478 .2895 .7981
You can have fun by going to garage sales on the weekends. 2.97 1.3352 .4115 .7851
I don't see why anyone would watch the cable shopping networks. 2.47 1.2167 .2461 .7998
Host catalogs are just junk mail and you can throw them away as soon as they come to the house.
3.77 1.1269 .2461 .7990
Browsing through catalogs is a waste of time. 4.06 .9776 .1951 .8012
Looking through catalogs is a good way to relax and enjoy time by yourself. 3.80 1.0851 .4741 .7789
Standardized Item Alpha = .7930

206TABLE 4.21
Stage 3: Shopping Process Involvement Subscale Item Analysis
Subscale Items MeanStandardDeviation
Item-TotalCorrelation
Alpha if Item Deleted
Recreational Involvement
Investigating stores and malls is a nice way to spend your time. 3.03 1.2277 .7494 .8306
Shopping is not a pleasant activity to me. 3.67 1.2442 .6931 .8445
To me shopping is a recreational activity. 2.63 1.3348 .6861 .8473
You can enjoy shopping just for the fun of it. 3.56 1.1859 .7329 .8353
Shopping the stores wastes my time. 3.64 1.1864 .6269 .8600
Standardized Item Alpha = .8716
Subscale Items MeanStandardDeviation
Item-TotalCorrelation
Alpha if Item Deleted
Non-Traditional Outlet Involvement
Watching the cable value network and the fashion channel is an activity I enjoy. 1.60 .9779 .4460 .6017
Going to garage sales is an activity anyone in the family can enjoy. 2.53 1.3478 .5417 .5191
You can have fun by going to garage sales on the weekends. 2.97 1.3352 .5171 .5388
I don't see why anyone would watch the cable shopping networks. 2.47 1.2167 .2942 .6885
Standardized Item Alpha = .6638
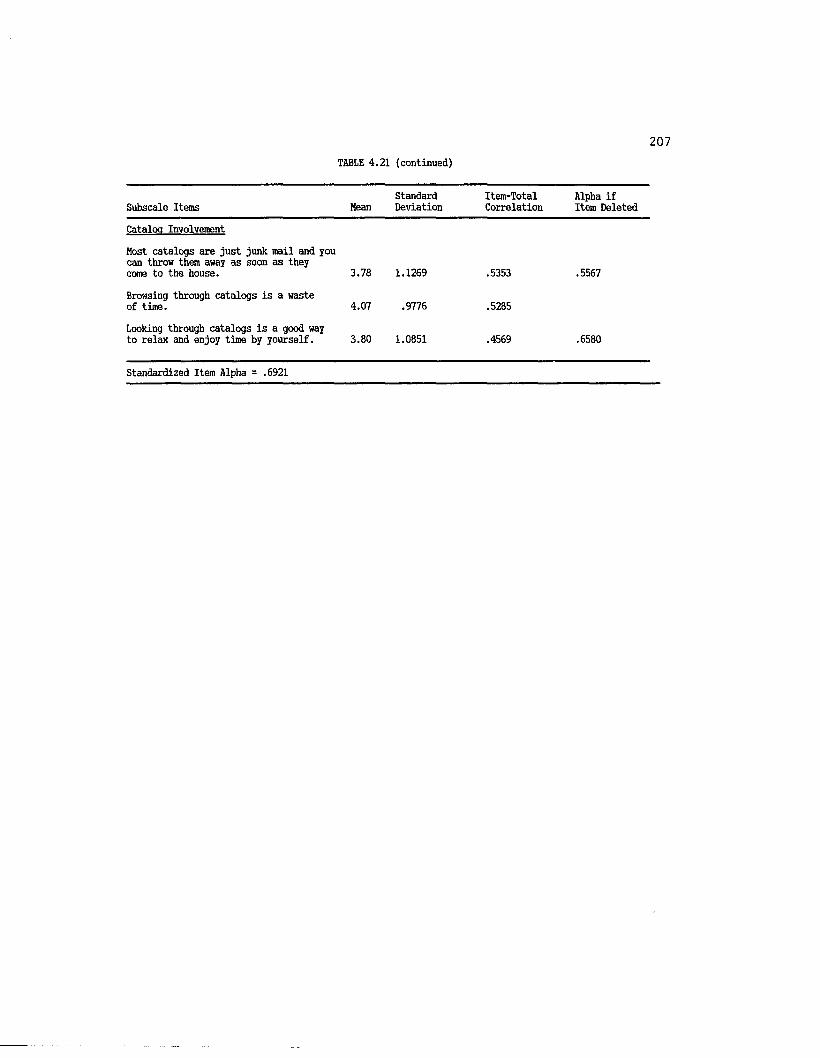
207TABLE 4.21 (continued)
Standard Item-Total Alpha ifSubscale Items Mean Deviation Correlation Item Deleted
Catalog Involvement
Host catalogs are just junk mail and you can throw them away as scon as theycome to the house. 3.78 1.1269 .5353 .5567
Browsing through catalogs is a wasteof time. 4.07 . 9776 . 5285
Looking through catalogs is a good wayto relax and enjoy time by yourself. 3.80 1.0851 .4569 .6580
Standardized Item Alpha = .6921

208TABLE 4.22
Stage 3: Shopping Process Involvement Scale LISREL Item Reliabilities, Factor Loadings and
Subscale Reliabilities
Recreational Involvement Item Reliabilities Factor Loadings
Investigating stores and malls is a nice way to spend your time. .662 .814
Shopping is not a pleasant activity to me. .525 .725
To me shopping is a recreational activity. .591 .769
You can enjoy shopping just for the fun of it. .665 .815
Shopping the stores wastes my time. .444 .667
Construct Reliability = .8718
Non-traditional Outlet Involvement Item Reliabilities Factor Loadings
Watching the cable value network and the fashion channel is an activity I enjoy. .164 .405
Going to garage sales is an activity anyone in the family can enjoy. .577 .760
You can have fun by going to garage sales on the weekends. .677 .823
I don't see why anyone would watch the cable shopping networks. .066 .257
Construct Reliability = .6670
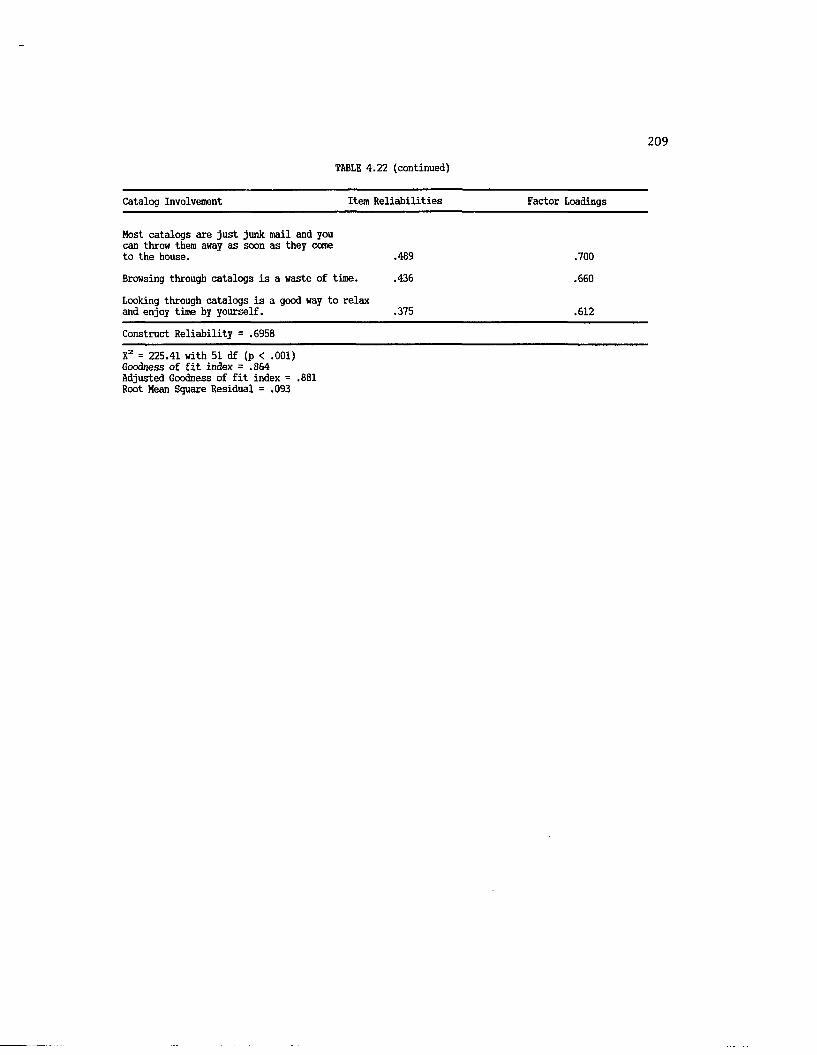
209TftBLE 4.22 (continued)
Catalog Involvement Item Reliabilities Factor Loadings
Most catalogs are just junk mail and you can throw them away as soon as they come to the house. .489 .700
Browsing through catalogs is a waste of time. .436 .660
Looking through catalogs is a good way to relax and enjoy time by yourself. .375 .612
Construct Reliability = .6958
X2 = 225.41 with 51 df (p < .001) Goodness of fit index = .864 adjusted Goodness of fit index = .881 Root Mean Square Residual = .093
210
factor. The remaining two indicators exhibit very poor item
reliabilities which contributes to the relatively low construct
reliability (.6670). The construct reliability of the recreational
involvement factor is .8718 and the construct reliability for catalog
involvement is .6958. The only subscale which meets the established
criteria for acceptable reliability is the recreational involvement
measure.
Tests of overall model fit of the confirmatory analysis reveal a
significant chi-square value (p < .001) and AGFI of .88 and RMSR of .09.
These values are not within the acceptable limits in assessing a good
fit since the AGFI value should be greater than .90 and RMSR should be
less than .07. However, the obtained statistics are very close to those
required.
Table 4.23 provides a comparison of the subscale reliabilities
obtained by Cronbach alpha and LISREL. The estimates are very close
with only the recreational involvement subscale meeting the established
criteria for acceptable reliability. However, for the purposes of this
research and given the exploratory nature of the scale development, the
obtained reliabilities are deemed adequate and the full scale will be
employed in further analyses.
Validity Assessment. Table 4.9 provides correlations between the
SPI scale and certain behavioral items to measure criterion-related
validity. Shopping process involvement is strongly correlated (r = .51)
with the number of times an individual visits a store to purchase. This
provides further evidence of validity for the this measure.
Interestingly, this construct is not significantly correlated with the

211
TABLE 4.23
Stage 3: Shopping Process Involvement Comparison of Coefficient and LISREL Reliabilities
Subscale Cronbach Alpha LISREL Reliability
Recreational Involvement .8716 .8718
Non-traditional Outlet Involvement .6638 .6670
Catalog Involvement .6921 .6958
212
number of times individuals visit stores to browse. However, it is
likely that certain constraints may be present such that individuals who
are involved with shopping are not able to spend as much time as they
would like engaging in such behaviors. These individuals may also
fulfill their need to browse by looking at catalogs in their own home,
or watching cable shopping shows.
To summarize, the three stages of data collection demonstrate the
SPI scale to be a reliable and valid measure of an individuals' ongoing
interest or concern with the shopping activity.
Summary of the Analysis Chapter
The results from the three data collections are quite promising.
The proposed shopping motivation scale has been shown to consist of
three dimensions as hypothesized and is composed of the proposed
subdimensions as well. Evidence was provided for the reliability of the
scale as well as content, criterion and construct validity. The
involvement measures developed for use in testing the dissertation
hypotheses also demonstrate demonstrate acceptable levels of reliability
and validity. Table 4.24 presents a summary of the scale development
process and highlights the number of items utilized, the obtained
reliabities and tests of validity.
The results reported in this section justify the use of these
measures in testing the dissertation hypotheses. Additional evidence of
construct validity will be obtained for these measures when their
relationship to other variables of interest is tested in Chapter Six.
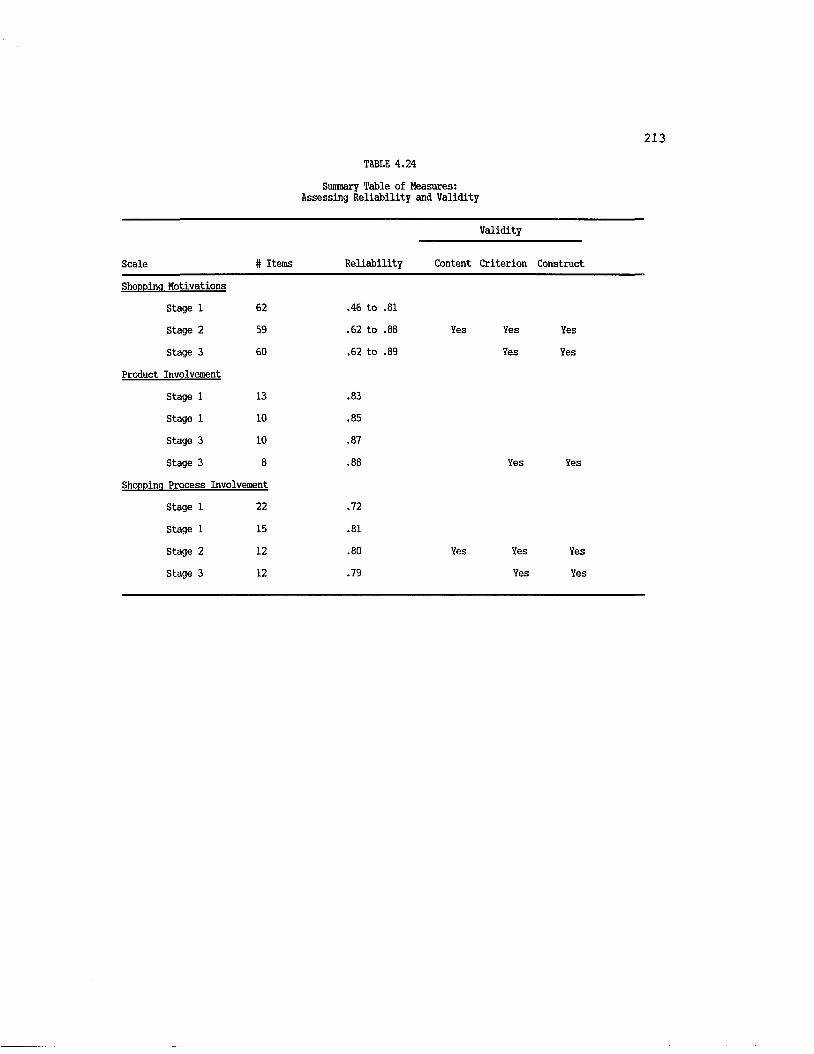
213TABLE 4.24
Sumnary Table of Measures: Assessing Reliability and Validity
Validity
Scale # Items Reliability Content Criterion Construct
Shopping Motivations
Stage 1 62
Stage 2 59
Stage 3 60
Product Involvement
Stage 1 13
Stage 1 10
Stage 3 10
Stage 3 8
Shopping Process Involvement
Stage 1 22
Stage 1 15
Stage 2 12
Stage 3 12
.46 to .81
.62 to .88
.62 to .89
.83
.85
.87
.88
.72
.81
.80
.79
Yes Yes Yes
Yes Yes
Yes
Yes
Yes
Yes
Yes
Yes
Yes
CHAPTER FIVE
Choice Set Formation Process Results
Chapter Five begins with a brief review of the choice set
formation process. Descriptive analyses are provided which depict the
ways in which individuals define various sets of retail alternatives. A
summary section concludes this chapter.
Choice Set Formation Process
Overview
As discussed in Chapter Two, the choice set formation process is
concerned with the ways in which individuals reduce the number of
available alternatives to a manageable set under decision making
conditions. The process recognizes the many and varied alternatives
available to consumers and proposes that the process will consist of
four stages. The choice sets found in these stages are the awareness,
consideration, action, and choice sets, respectively.
This research explored the choice set process of consumers for a
personal clothing purchase. Individuals were initially provided with a
list of 162 retail alternatives available locally ranging from catalogs
to discount stores to flea markets. Respondents were first instructed
to indicate whether or not they were aware of the specific retail
alternative, thus defining their awareness set. Sample consumers were
then given a scenario wherein they were instructed to imagine they were
214
215
considering the purchase of a clothing item. Individuals were asked to
simulate the process they might undergo when searching for acceptable
retail outlets by (1) checking those alternatives they would consider
for this purchase (consideration set) and (2) those alternatives for
which they would make some attempt to contact or visit (action set).
For each of these sets, respondents were reminded to select only those
alternatives which they had checked in previous sections. Thus, if a
retailer was not in a respondents' awareness set, it was not included in
subsequent sets.
The primarily cognitive process individuals experience when
choosing among various alternatives can provide valuable insights which
aid marketers and academicians alike. The data elicited from the choice
set task is valuable in providing researchers with information regarding
the numbers of alternatives individuals typically include in their
choice sets. A process of cognitive simplificationjoccurs, but how many
alternatives are they capable or willing to evaluate during the decision
process? Further, do individuals concentrate their shopping behavior
with certain specific types of retailers such as exclusively department
or discount stores? Finally, are there similarities among individuals
in the ways in which they simplify this decision?
Similarly, the research data provides valuable information for
retail management. For instance, retailing companies benefit from
determining the percent of consumers who have heard of their outlet.
Without awareness, retailers have little hope of gaining the patronage
of these valuable consumers. Secondly, if the retailer is present in
the awareness set, but is omitted at the consideration stage or action
216
stage, how can this be explained? Again, retailing enterprises rely on
customer patronage to survive. Assuming the action set leads to store
choice, whether or not a specific alternative is included in the action
set is also crucial. Finally, insight can be provided regarding the
competitive structure of the marketplace. The alternatives in
consumers' consideration and action sets represent true competition —
and much could be gained by analyzing the profiles of individuals choice
sets with regard to specific retailer inclusion/exclusion.
The major premise of this discussion is that consumers1 choice
sets alone can provide meaningful knowledge to both the academician and
practitioner. Even without examining the antecedents of choice set
formation, information contained in the sets themselves can be quite
revealing. The purpose of this chapter is to discuss choice set
formation processes and present analyses which describe their structure,
composition, and differences across demographic groupings. While there
are no hypotheses to be tested in this chapter, the descriptive results
will provide greater understanding of the information available and aid
interpretation of the results when choice set structure is used as a
dependent variable in Chapter Six of this manuscript.
This Chapter will first present results of the aggregate measures
of choice set: the number of retailers at each stage, the number of
types of retailers at each stage, and a market share measure reflecting
retail choice concentration. Secondly, analyses which capture the
reduction or simplification process will be presented. Descriptive
results of specific retailers included at each stage of the choice
process will follow. The analyses conclude with a presentation of
217
choice set differences for consumer profiles.
Aggregate Choice Sets
Number of Retailers. As discussed in Chapter Three, this research
will examine the choice set formation process as measured in three
primary ways: (1) the number of retailers at each stage, (2) the number
of types of retailers at each stage, and (3) a measure of market share -
the Herfindahl index. These measures describe choice sets in an
aggregate fashion which capture the breadth and concentration of choice
sets exhibited by individuals.
Results for the total number of retailers at each stage are
presented in Table 5.1. At the awareness set stage, individuals
included from 17 to 143 alternatives in their set. Thus, there is wide
variation in the number of different retailers consumers have
knowledge about. The mean number of retailers comprising the awareness
set was 62.75 with a median value of 61.0.
As expected, respondents demonstrated narrower sets at the
consideration stage. Individuals reported that they would consider 1 to
128 alternative retailers. Again, there seems to be much diversity in
the number of retailers included. Respondents averaged 25.64 retailers
in the consideration set with a median value of 21. Hence, we truly see
that most individuals do not consider all of the alternatives available
to them.
The action set typically included some smaller set of the
retailers than the consideration sets. Individual's action sets ranged

218TABLE 5.1
Total Number of Retailers at Each Stage
Action Set
Mean
Median
Range
Awareness Set Consideration Set Acl
62.75 25.64 16.
61.00 21.00 13.
Minimum 17 1 1Maximum 143 128 66
if Respondents Reporting0 to 10 0 42 8911 to 20 3 79 8921 to 30 5 51 3631 to 40 15 30 1741 to 50 44 21 851 to 60 44 8 261 to 70 52 5 371 to 80 34 6 081 to 90 14 1 091 to 100 10 1 0101 to 110 6 0 0111 to 120 5 0 0121 to 130 0 0 0131 to 140 2 0 0141 to 150 1 0 0
219
from 1 to 66 retailers. The mean number of retailers included was 16.96
with a median number of 13. As anticipated most respondents further
restricted their choice sets at this stage.
Hence, evidence is indeed provided that individuals do not
consider all available alternatives when making a decision. As shown in
Table 5.1, most respondents included some smaller number of retailers
from those available to them at each stage of the choice process.
However, some respondents exhibited quite large sets at each stage.
Types of Retailers. A second descriptor of the choice set
formation process is the number of types of retailers included at each
stage. Table 5.2 provides these figures. These results also
demonstrate that most respondents do not consider all available
alternatives. For each type of retailer, the mean number included at
each stage of the process is less than found in the previous set. At
the awareness set stage, respondents included a large number of
specialty stores (mean=26) and most were aware of the seven available
department stores. At the consideration and action set stages, the mean
number of specialty stores (9.84 and 6.36 respectively) included was
higher than the other retailer types. However the department stores
demonstrated the highest level of retention in subsequent stages.
Many attempt to categorize the retailing market structure by
retailer type. The assumption is that consumers use these broad
classifications to help them in their retailer choice decisions. For
instance, it is much simpler for an individual to remember that a
certain retail outlet is a "department" store or a "specialty" store

220TABLE 5.2
Number of Firms By Retailer Type At Each Choice Set Stage
Types of Retailers1
Awareness Set Consideration Set Action Set
Mean Range Mean Range Mean Range
Catalogs (46) 14.83 0 to 46 6.65 0 to 46 3.99 0 to 43
Department Stores (7) 6.52 0 to 7 4.24 0 to 7 3.33 0 to 7
Discount Stores (22) 12.19 0 to 22 4.11 0 to 22 2.82 0 to 22
Specialty Stores (77) 26.00 2 to 64 9.84 0 to 57 6.36 0 to 55
Other Retailers (10) 3.07 0 to 10 .743 0 to 10 .437 0 to 10
1 Numbers in parentheses represent the total number of retailers available for each type.

221
rather then try and retain individual bits of information about the
specific retail outlets. These classifications therefore represent a
bundle of facts the consumer can use when making the decision of which
retailer to patronize.
When the consumer is faced with a retail choice decision, a
particular type of retail outlet may be more likely to satisfy their
needs than another. If the consumer desires to receive special
treatment and wants to be pampered, then exclusive department or
specialty retailers may more adequately fulfill these needs.
Alternatively, if the individual's shopping agenda includes purchasing
products for many different members of their family, a department or
discount retailer may be preferred.
Knowledge of retail type specialization is also helpful to the
retail executive in planning marketing campaigns. For instance, if the
retailer is aware that consumers desire special care and attention when
shopping then they can attempt to satisfy these needs and acknowledge
this attribute in their promotional campaigns. Since the specialty and
catalog retailers have gained such high market share, many traditional
department store retailers are striving to retain their present customer
base as well as attract additional customers. One way the department
store retailer is currently competing with the catalog and specialty
retailer is by promoting personal shopping services. This issue is
extremely important to practitioners as the retail market place has
become so competitive.
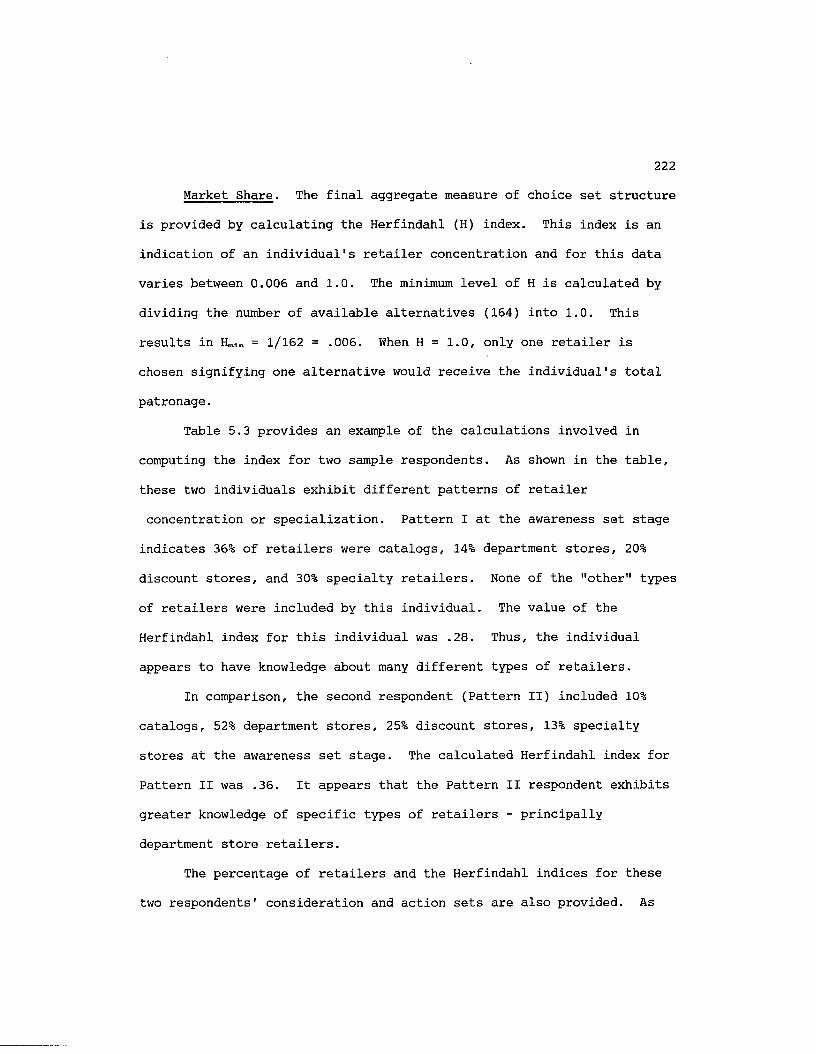
222
Market Share. The final aggregate measure of choice set structure
is provided by calculating the Herfindahl (H) index. This index is an
indication of an individual's retailer concentration and for this data
varies between 0.006 and 1.0. The minimum level of H is calculated by
dividing the number of available alternatives (164) into 1.0. This
results in H ^ = 1/162 = .006. When H = 1.0, only one retailer is
chosen signifying one alternative would receive the individual1s total
patronage.
Table 5.3 provides an example of the calculations involved in
computing the index for two sample respondents. As shown in the table,
these two individuals exhibit different patterns of retailer
concentration or specialization. Pattern I at the awareness set stage
indicates 36% of retailers were catalogs, 14% department stores, 20%
discount stores, and 30% specialty retailers. None of the "other" types
of retailers were included by this individual. The value of the
Herfindahl index for this individual was .28. Thus, the individual
appears to have knowledge about many different types of retailers.
In comparison, the second respondent (Pattern II) included 10%
catalogs, 52% department stores, 25% discount stores, 13% specialty
stores at the awareness set stage. The calculated Herfindahl index for
Pattern II was .36. It appears that the Pattern II respondent exhibits
greater knowledge of specific types of retailers - principally
department store retailers.
The percentage of retailers and the Herfindahl indices for these
two respondents' consideration and action sets are also provided. As
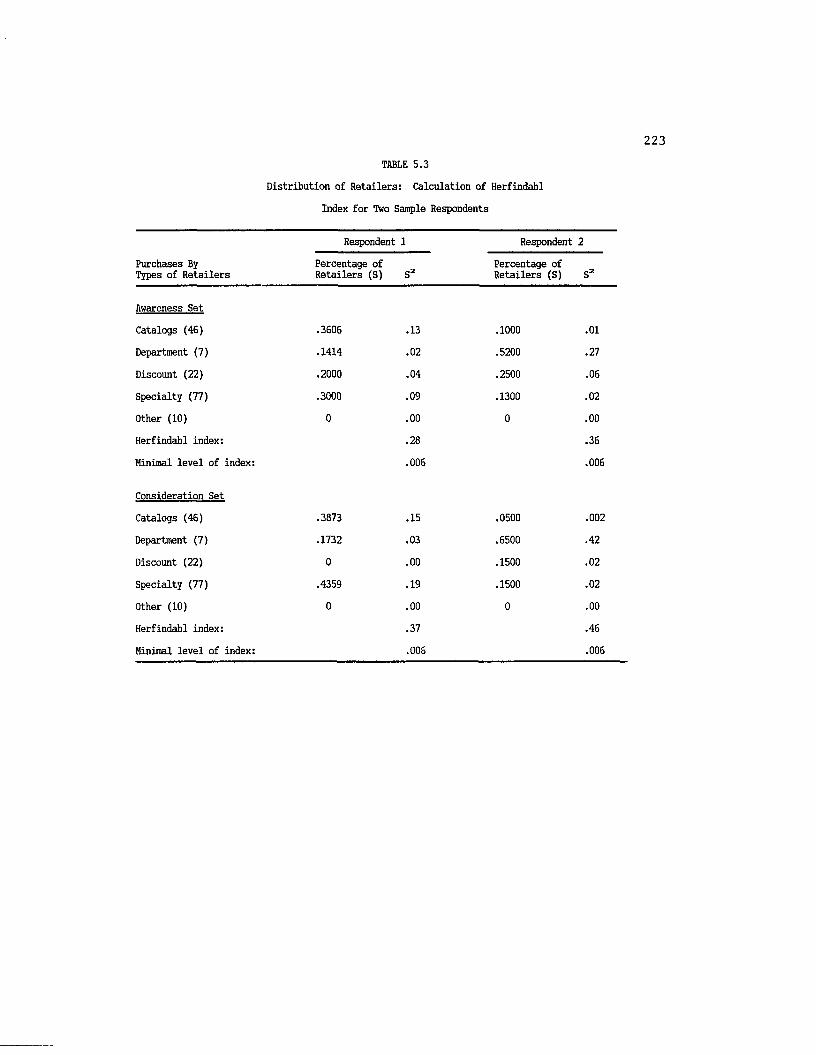
TABLE 5.3
Distribution of Retailers: Calculation of Herfindahl
Index for Two Sample Respondents
Purchases By Types of Retailers
Respondent 1 Respondent 2
Percentage of Retailers (S) S2
Percentage of Retailers (S) S2
Awareness Set
Catalogs (46) .3606 .13 .1000 .01
Department (7) .1414 .02 .5200 .27
Discount (22) .2000 .04 .2500 .06
Specialty (77) .3000 .09 .1300 .02
Other (10) 0 .00 0 .00
Herfindahl index: .28 .36
Minimal level of index: .006 .006
Consideration Set
Catalogs (46) .3873 .15 .0500 .002
Department (7) .1732 .03 .6500 .42
Discount (22) 0 .00 .1500 .02
Specialty (77) .4359 .19 .1500 .02
Other (10) 0 .00 0 .00
Herfindahl index: .37 .46
Minimal level of index: .006 .006
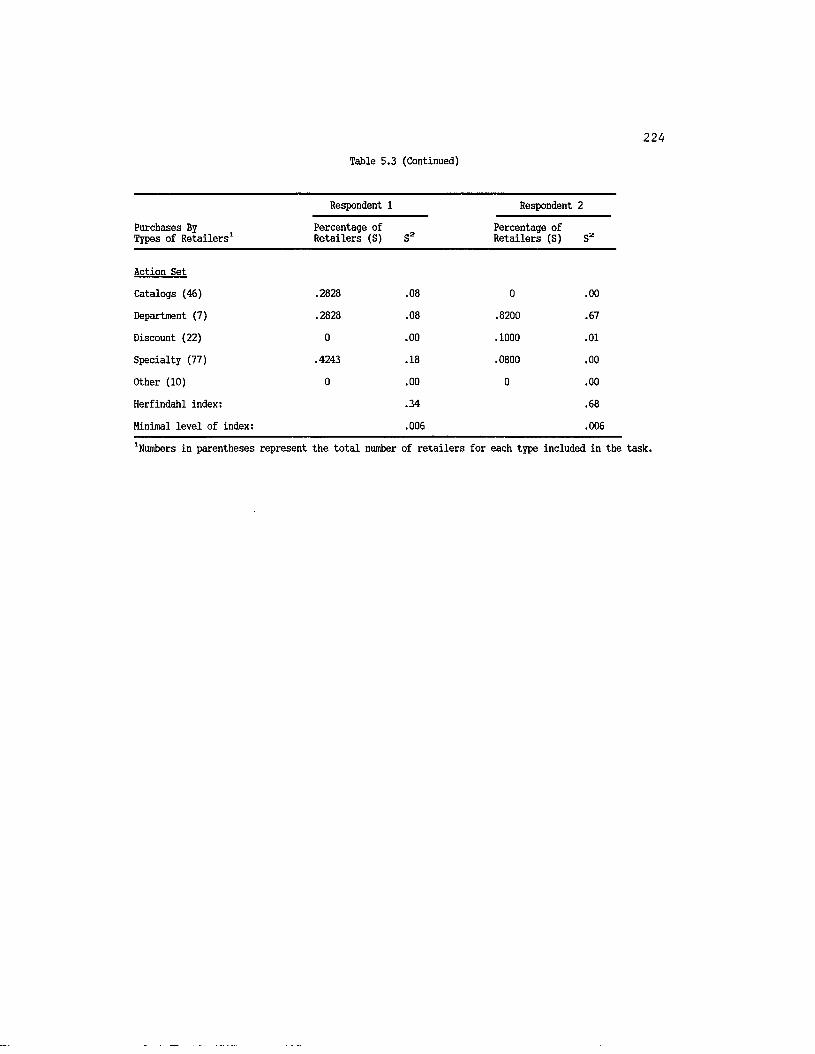
224Table 5.3 (Continued)
Purchases By Types of Retailers1
Respondent 1 Respondent 2
Percentage of Retailers (S) S2
Percentage of Retailers (S) s2
Action Set
Catalogs (46) .2828 .08 0 .00
Department (7) .2828 .08 .8200 .67
Discount (22) 0 .00 .1000 .01
Specialty (77) .4243 .18 .0800 .00
Other (10) 0 .00 0 .00
Herfindahl index: .34 .68
Minimal level of index: .006 .006
1Numbers in parentheses represent the total number of retailers for each type included in the task.
225
shown in Table 5.3, both respondents exhibit greater concentration as
they proceed from the awareness set to the action set. Additionally,
respondent 1 includes a greater proportion of specialty retailers than
any other retailer type while respondent 2 restricts the choice sets to
a greater percentage of department store retailers.
The Herfindahl indices were calculated each stage of the choice
set process. At the awareness set stage, the mean Herfindahl index was
.305 with a range of .21 to .69 across individuals. Thus, even at the
earliest stage, some individuals seem to have knowledge of only
particular types of retailers. Again, concentration is indicated by
values closer to 1.0. The mean Herfindahl index value increases to .378
at the consideration set stage with a range of .23 to 1.0. Here we
first see maximum concentration - whereby an individual has included
only one retailer in her consideration set. At the action set stage,
the mean Herfindahl index value is .438 and ranges from .23 to 1.0. The
Herfindahl index mean values, range, and frequency distribution are
provided in Table 5.4.
Most individuals do indeed limit their choice sets to particular
types of retailers at later stages of the choice set formation process.
As indicated in Table 5.4, no respondents exhibited a Herfindahl index
value less than .20. Throughout the three stages, the majority of
respondents demonstrated concentrations between .25 and .60. At the
awareness set stage, 119 of the respondents' Herfindahl index was
between .26 and .30 indicating that their choice sets were composed of a
varied set of retailers. Individuals are expected to demonstrate
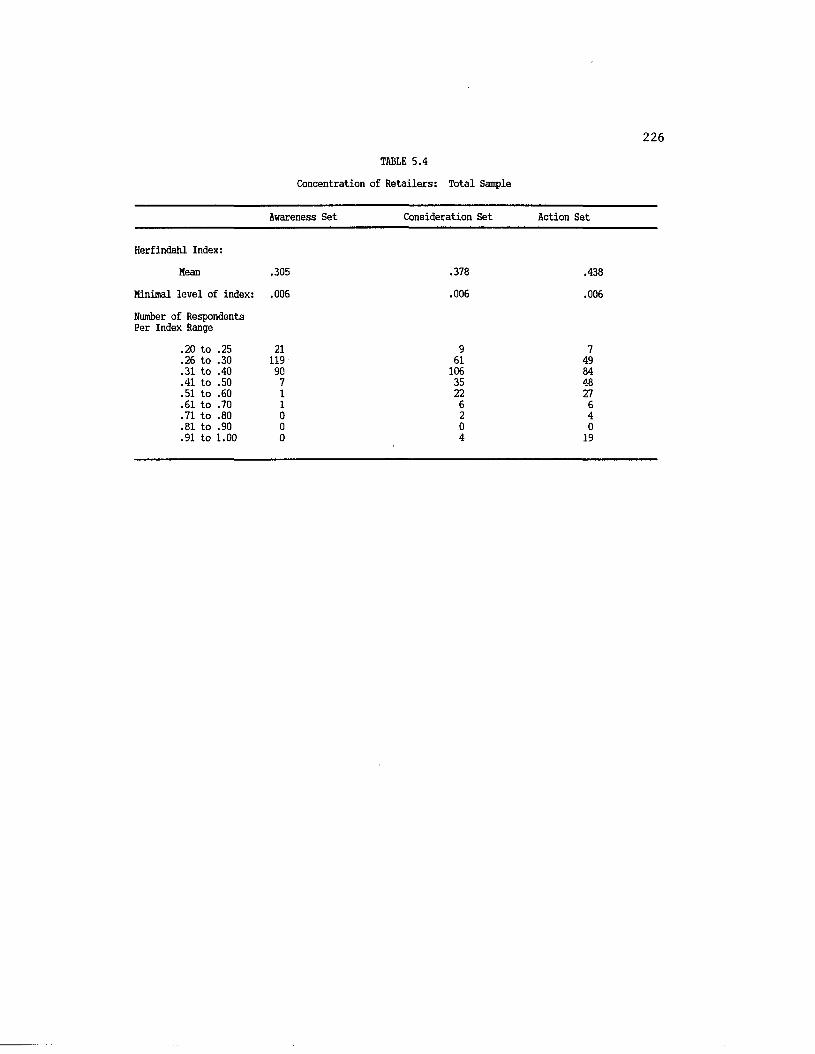
226TABLE 5.4
Concentration of Retailers: Total Sample
Awareness Set Consideration Set Action Set
Herfindahl Index:
Mean
Minimal level of index:
Number of Respondents Per Index Range
.20 to
.26 to
.31 to
.41 to
.51 to
.61 to
.71 to
.81 to .90
.91 to 1.00
.25
.30
.40
.50
.60
.70
.80
.305
.006
21119907I1000
.378
.006
96110635226204
.438
.006
74984482764019
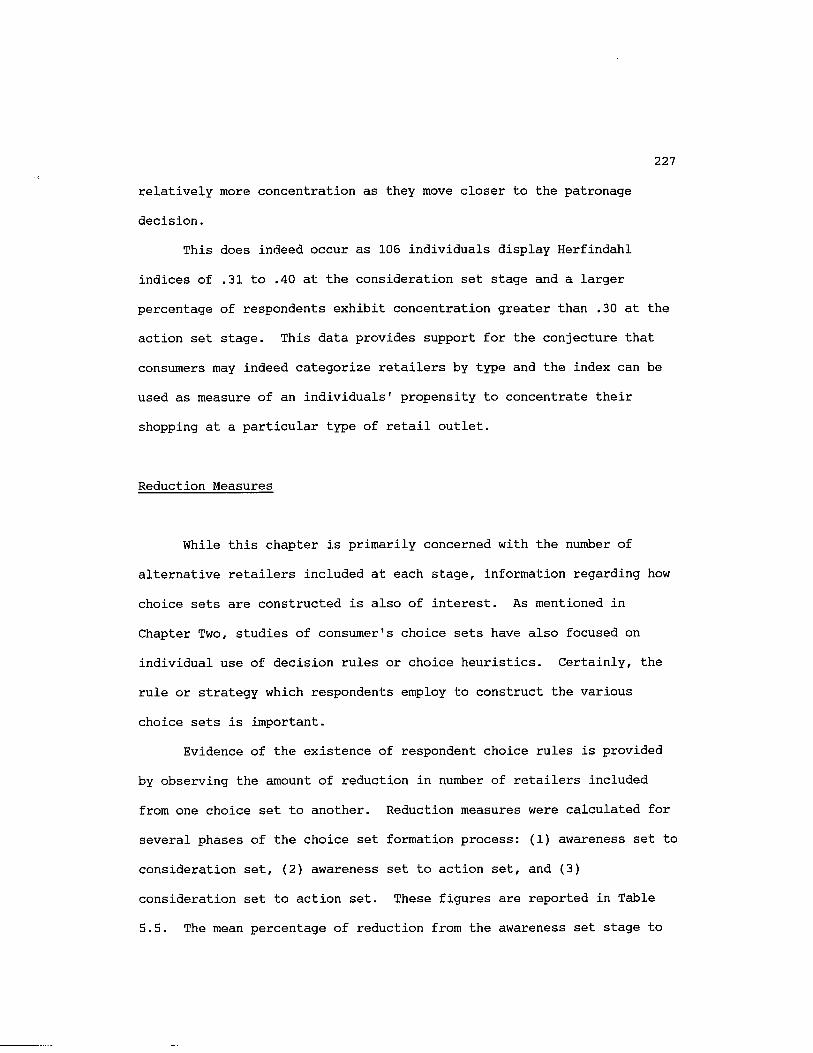
227
relatively more concentration as they move closer to the patronage
decision.
This does indeed occur as 106 individuals display Herfindahl
indices of .31 to .40 at the consideration set stage and a larger
percentage of respondents exhibit concentration greater than .30 at the
action set stage. This data provides support for the conjecture that
consumers may indeed categorize retailers by type and the index can be
used as measure of an individuals1 propensity to concentrate their
shopping at a particular type of retail outlet.
Reduction Measures
While this chapter is primarily concerned with the number of
alternative retailers included at each stage, information regarding how
choice sets are constructed is also of interest. As mentioned in
Chapter Two, studies of consumer's choice sets have also focused on
individual use of decision rules or choice heuristics. Certainly, the
rule or strategy which respondents employ to construct the various
choice sets is important.
Evidence of the existence of respondent choice rules is provided
by observing the amount of reduction in number of retailers included
from one choice set to another. Reduction measures were calculated for
several phases of the choice set formation process: (1) awareness set to
consideration set, (2) awareness set to action set, and (3)
consideration set to action set. These figures are reported in Table
5.5. The mean percentage of reduction from the awareness set stage to

228
the consideration set stage was 58.9% with a range from 0 to .97. This
provides further evidence that individuals do attempt to simplify their
decision process by reducing the number of retailers retained at
subsequent stages. The mean percentage reduction from the awareness set
to the action set was 72.5% with a range of 0 to 1.0. Lastly, the mean
percentage reduction from the consideration set stage to the action set
stage was 32.6% with a range of -.03 to 1.0.
These measures indicate most respondents did indeed reduce the
number of retailers retained at subsequent stages. However, a more
interesting finding is provided by examining the wide variation in
reduction measures. Some individuals exhibit very little reduction,
while others reduce the number of retailers considered quite
drastically. The number of retailers retained at later stages in the
choice process and individuals preference for cognitive simplicity (as
evidenced by larger reduction percentages) represents a type of decision
rule. Individuals could be usefully segmented based upon these
reduction measures. While this type of analysis is not the focus of
this research, it would provide insight into consumer's retail patronage
behavior and is a fruitful area for further research.
Specific Retailers
The choice set formation process can also be characterized by the
specific retailers included at each stage. As discussed in Chapter Two,
this provides an indication of the composition of individual's sets
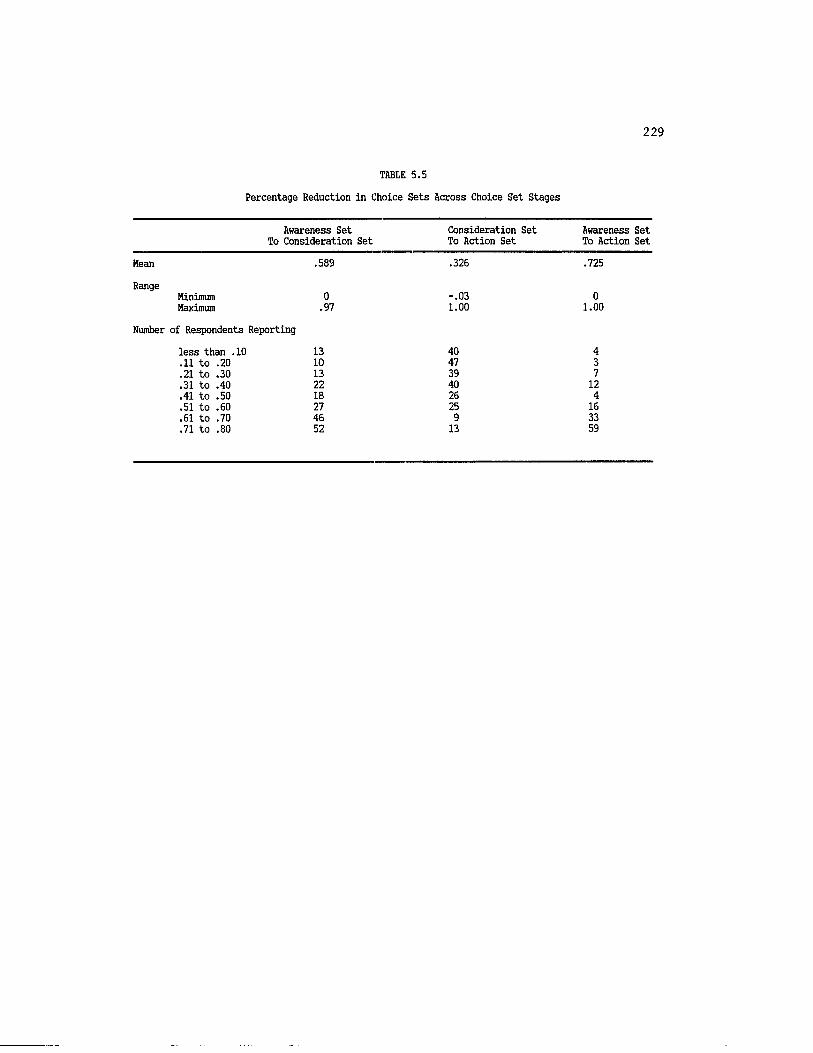
229
TABLE 5.5
Percentage Reduction in Choice Sets Across Choice Set Stages
Awareness Set To Consideration Set
Consideration Set To Action Set
Awareness Set To Action Set
Mean .589 .326 .725
RangeMinimum 0 -.03 0Maximum .97 1.00 1.00
Number of Respondents Reporting
less than .10 13 40 4.11 to .20 10 47 3.21 to .30 13 39 7.31 to .40 22 40 12.41 to .50 18 26 4.51 to .60 27 25 16.61 to .70 46 9 33.71 to .80 52 13 59
230
rather than structure. Table 5.6 reports the number of respondents who
included a specific retailer at each stage of the process. Also, a
rough measure of retailer retention percentage was calculated as the
number of retailers retained at the action set divided by the number of
retailers included at the awareness set stage.
As can be seen, all retailers were included in at least one
awareness set. Further, for each retailer, the simplification process
discussed earlier is apparent. For example, 226 of the 245 respondents
were aware of Sears. Eighty of these respondents included Sears in
their consideration set and 63 respondents included Sears in their
action set. Thus, the retention percentage from awareness to action set
was 28% for Sears.
The retention measures provide very intriguing information.
Variation in retention percentages is not as pronounced in this analysis
as many of the retailers exhibit similar percentages even though the
number of individuals who chose the retailer is quite variant.
Retention measures ranged from 4% for Kay's Fashions to 71% for
Goudchaux/Maison Blanche. However, the majority of the retention
measures were between 20 and 40 percent with a mean of 15.24 percent.
For catalog retailers. The Finals and Maryland Square captured the
highest percentage of respondents in the action set with a retention
measure of 60%. Interestingly, for these retail outlets, only 10
respondents were aware of the retailer but six of these retained the
retailer in the action set stage. Retailers which were known by more
respondents such as Avon Fashions and Spiegel, were only able to retain
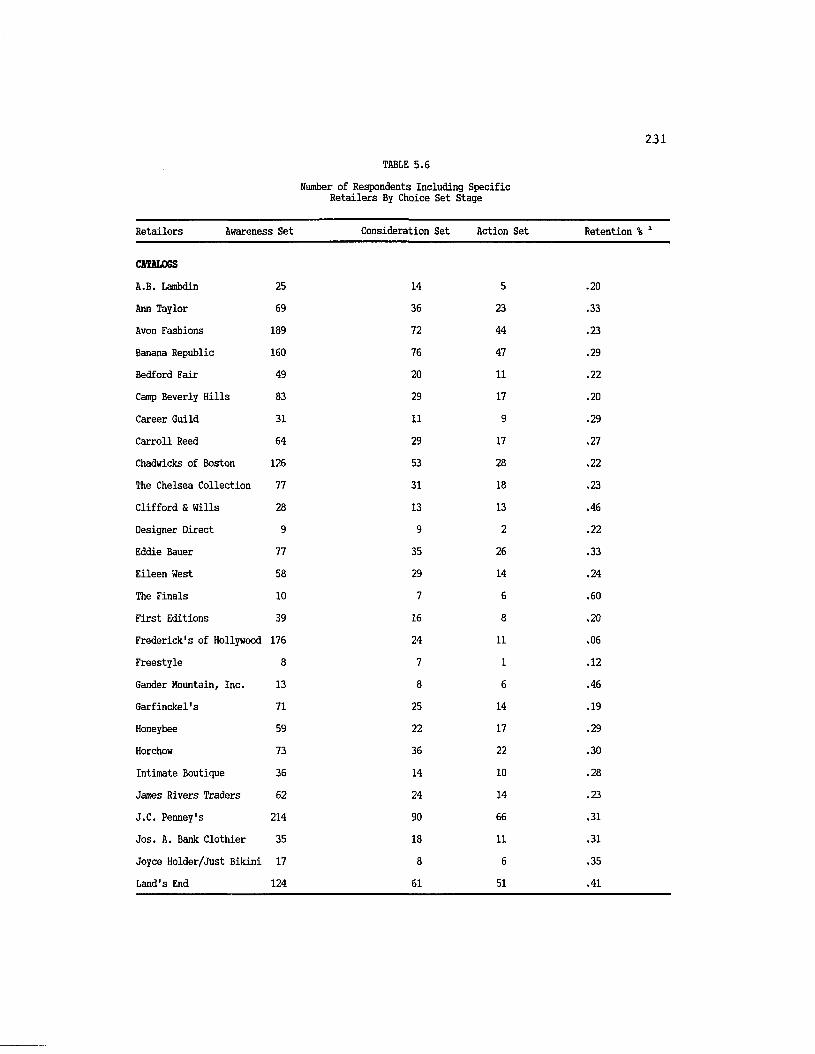
231TABLE 5.6
Number of Respondents Including Specific Retailers By Choice Set Stage
Retailers Awareness Set Consideration Set Action Set Retention % 1
CATALOGSA.B. Lambdin 25 14 5 .20
Ann Taylor 69 36 23 .33
Avon Fashions 189 72 44 .23
Banana Republic 160 76 47 .29
Bedford Fair 49 20 11 .22
Camp Beverly Hills 83 29 17 .20
Career Guild 31 11 9 .29
Carroll Reed 64 29 17 .27
Chadwicks of Boston 126 53 28 .22
The Chelsea Collection 77 31 18 .23
Clifford & Wills 28 13 13 .46
Designer Direct 9 9 2 .22
Eddie Bauer 77 35 26 .33
Eileen West 58 29 14 .24
The Finals 10 7 6 .60
First Editions 39 16 8 .20
Frederick's of Hollywood 176 24 11 .06
Freestyle 8 7 1 .12
Gander Mountain, Inc. 13 8 6 .46
Garfinckel's 71 25 14 .19
Honeybee 59 22 17 .29
Horchow 73 36 22 .30
Intimate Boutique 36 14 10 .28
James Rivers Traders 62 24 14 .23
J.C. Penney's 214 90 66 .31
Jos. A. Bank Clothier 35 18 11 .31
Joyce Holder/Just Bikini 17 8 6 .35
Land's End 124 61 51 .41
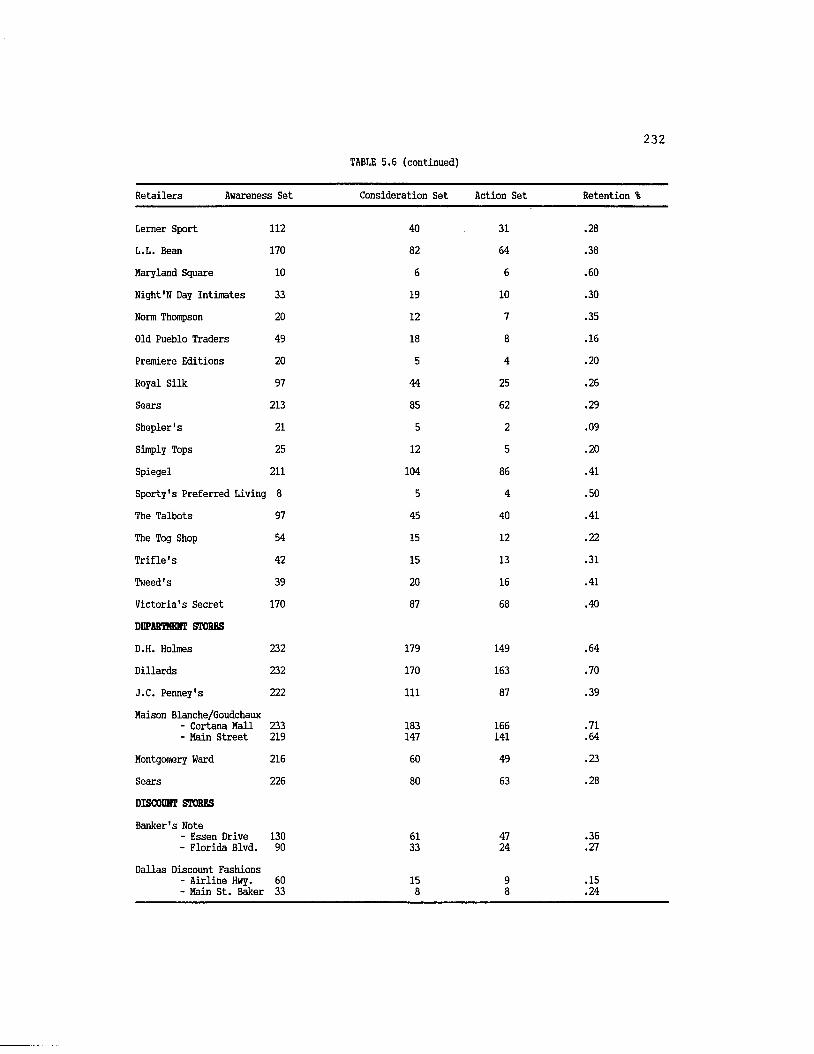
TABLE 5.6 (continued)
232
Retailers Awareness Set Consideration Set Action Set Retention %
Lerner Sport 112 40 31 .28
L.L. Bean 170 82 64 OJ 00
Maryland Square 10 6 6 .60
Night'N Day Intimates 33 19 10 .30
Norm Thompson 20 12 7 .35
Old Pueblo Traders 49 18 8 .16
Premiere Editions 20 5 4 .20
Royal Silk 97 44 25 .26
Sears 213 85 62 .29
Shepler's 21 5 2 .09
Simply Tops 25 12 5 oCN
Spiegel 211 104 86 .41
Sporty's Preferred Living 8 5 4 .50
The Talbots 97 45 40 .41
The Tog Shop 54 15 12 .22
Trifle's 42 15 13 .31
Tweed's 39 20 16 .41
Victoria's Secret 170 87 68 .40
DEPARTMENT STORES D.H. Holmes 232 179 149 .64
Dillards 232 170 163 .70
J.C. Penney's 222 111 87 .39
Maison Blanche/Goudchaux - Cortana Mall 233 183 166 .71- Main Street 219 147 141 .64
Montgomery Ward 216 60 49 .23
Sears 226 80 63 .28
DISCOUNT STORESBanker's Note
- Essen Drive 130 61 47 .36- Florida Blvd. 90 33 24 .27
Dallas Discount Fashions - Airline Hwy. 60
oo15 9
O.15
- Main St. Baker 33 8 8 .24
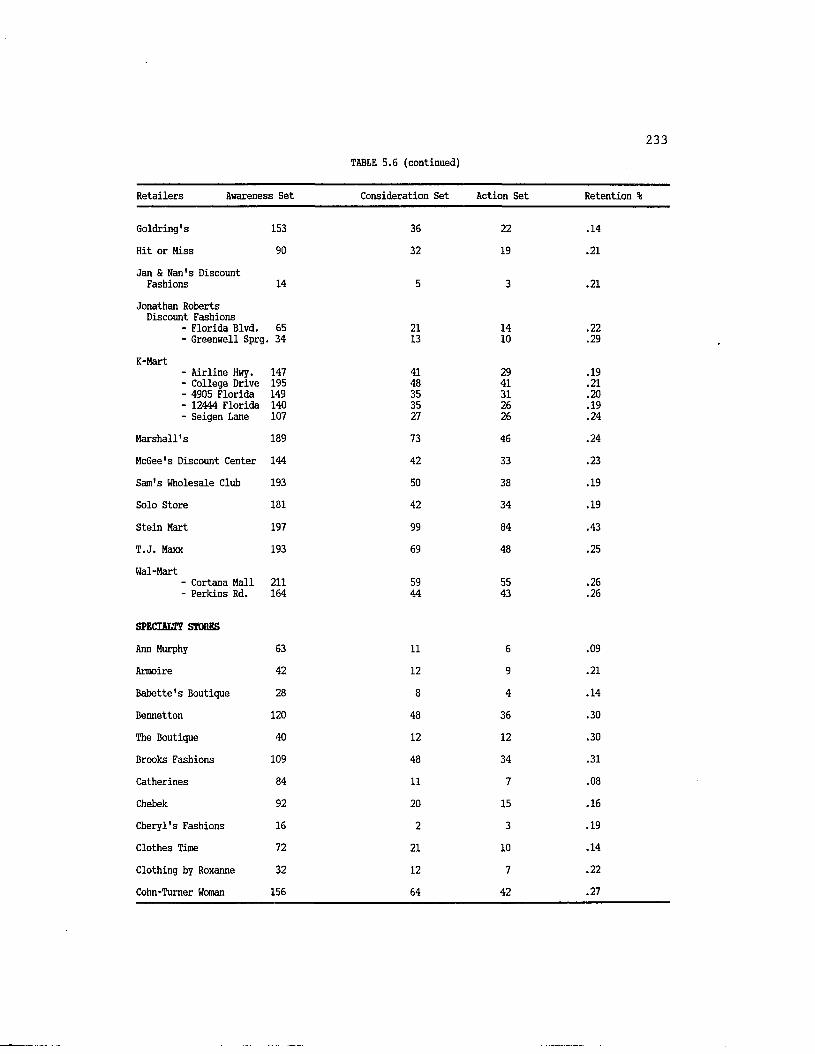
233TABLE 5.6 (continued)
Retailers Awareness Set Consideration Set Action Set Retention %
Goldring's 153 36 22 .14
Hit or Hiss 90 32 19 .21
Jan & Nan's Discount Fashions 14 5 3 .21
Jonathan Roberts Discount Fashions
- Florida Blvd. 65 21 14 .22- Greenwell Sprg. 34 13 10 .29
K-Mart- Airline Hwy. 147 41 29 .19- College Drive 195 48 41 .21- 4905 Florida 149 35 31 .20- 12444 Florida 140 35 26 .19- Seigen Lane 107 27 26 .24
Marshall's 189 73 46 .24
McGee's Discount Center 144 42 33 .23
Sam's Wholesale Club 193 50 38 .19
Solo Store 181 42 34 .19
Stein Mart 197 99 84 .43
T.J. Maxx 193 69 48 .25
Wal-Mart- Cortana Mall 211 59 55 .26- Perkins Rd. 164 44 43 .26
SPECIALTY STORESAnn Murphy 63 11 6 .09
Armoire 42 12 9 .21
Babette's Boutique 28 8 4 .14
Bennetton 120 48 36 .30
The Boutique 40 12 12 .30
Brooks Fashions 109 48 34 .31
Catherines 84 11 7 .08
Chebek 92 20 15 .16
Cheryl's Fashions 16 2 3 .19
Clothes Time 72 21 10 .14
Clothing by Roxanne 32 12 7 .22
Cohn-Tumer Woman 156 64 42 .27

234TABLE 5.6 (continued)
Retailers Awareness Set Consideration Set Action Set Retention %
D1Lei's Fashions 71 29 18 .25
Double Exposure 9 8 5 .55
18 Karat Boutique 26 8 5 .19
Evelyn's 22 8 4 .18
Fashion Conspiracy- Bon Marche 139 41 33 .24- Cortana Mall 139 40 36 .26
Fashion Gal- Hooper Rd. 96 37 29 .30- Staring Ln. 124 52 39 .31
Fashion World 26 12 6 .23
Finity LTD 13 7 7 .54
Four Comers for Her 24 11 7 .29
Foxmoor Casuals 134 44 24 .18
Freya's 92 27 16 .17
Gate House LTD 35 17 19 .54
Geo-Je's Apparels 109 23 10 .09
Georgette's 31 12 8 .26
Glenray Inc. 24 12 12 .50
Helen Guenard 71 24 15 .21
Gus Mayer 176 48 29 .16
Hudson Bay Co. 96 37 23 .24
Innovator 102 32 18 1—» 00
Italia Couture LTD 11 6 3 .27
Janelle's Petite Fashions 86 29 21 .24
Janice Fashions 34 11 6 .18
Jean Nicole 137 37 30 .22
Jolie 33 11 9 .27
Kay's Fashions 26 9 6 .04
Klimax 17 7 2 .12
Lady Eve 47 10 7 .15
Lady Jayne's Fashion 21 9 3 .14
Lafrancine Dress Salon 38 10 11 .29

235TABLE 5.6 (continued)
Retailers Awareness Set Consideration Set Action Set Retention %
Lane Bryant 138 29 17 .12
Lemer Shops- Bon Marche 185 50 44 .24- Cortana Mall 189 50 42 .22
Limited Express 112 53 47 .42
The Limited- Bon Marche 160 77 70 .44- Cortana Mall 202 118 102 .50
Loraine's Dress Shop 63 12 6 .09
MP II Dress Shoppe 56 13 7 .13
Ma Petite 56 16 11 .19
Mangels 40 5 5 .13
My Sister's Closet 35 9 2 .06
On Stage 73 31 24 .33
Other Dimensions 57 21 17 .29
Partner's LTD 70 29 24 .34
Pasta 89 34 26 .29
Poise'N Ivy- Highland Rd. 163 54 38 .23- Jefferson Hwy. 90 30 18 .20
RFD Inc.- Cortana Mall 200 107 84 .42- Esplanade Mall 154 74 59 .38
San-Carlin Coutours 24 10 10 .42
Sandra's Boutique 7 5 4 .57
Sherwood Fashions Inc. 22 10 9 .41
Size 5-7-9 Shops 165 48 38 .23
Slaydon's LTD 121 52 44 .36
Spencer N & Company 43 17 8 .19
Stuarts 135 38 34 .25
Susie's Casuals 113 39 30 .27
T Edwards 141 60 45 .32
Tall Fashions 62 14 9 .15
Teedie's Boutique 15 4 7 .47
Three Sisters Inc. 51 13 8 .16
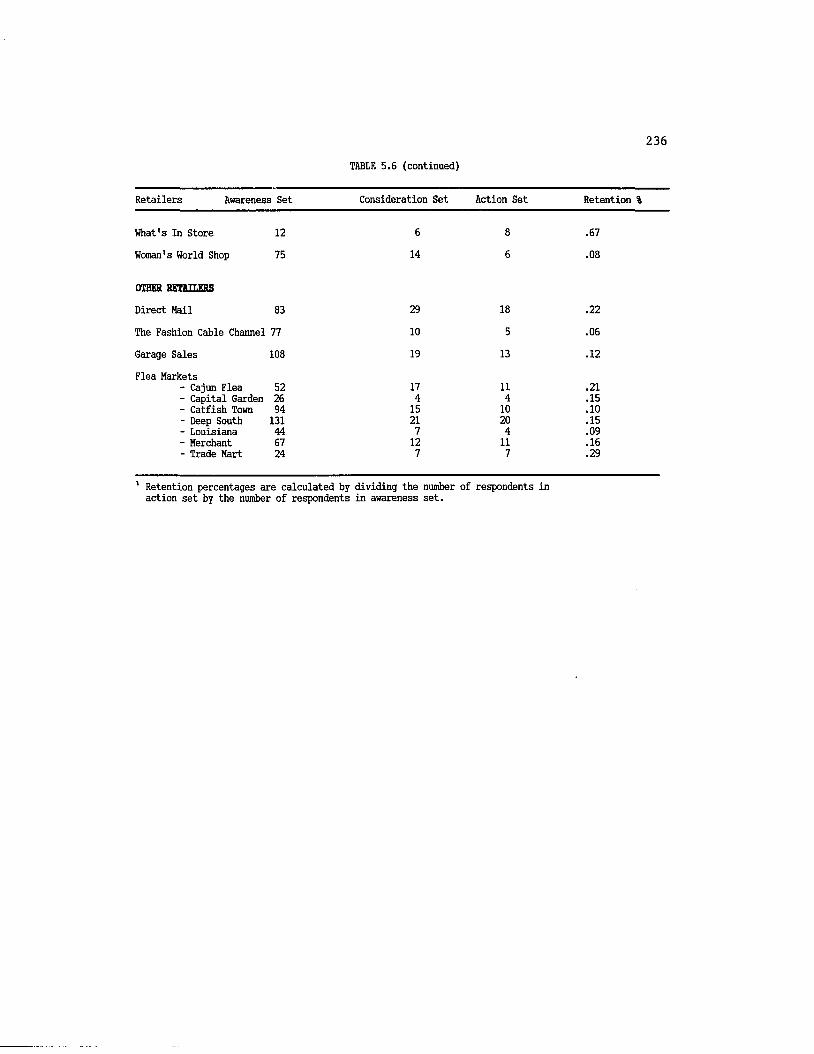
236TABLE 5.6 (continued)
Retailers Awareness Set Consideration Set Action Set Retention %
What's In Store 12 6 8 .67
Woman's World Shop 75 14 6 .08
OTHER RETAILERSDirect Hail 83 29 18 .22
The Fashion Cable Channel 77 10 5 .06
Garage Sales 108 19 13 .12
Flea Markets- Cajun Flea 52 17 11 .21- Capital Garden 26 4 4 .15- Catfish Town 94 15 10 .10- Deep South 131 21 20 .15- Louisiana 44 7 4 .09- Merchant 67 12 11 .16- Trade Mart 24 7 7 .29
1 Retention percentages are calculated by dividing the number of respondents in action set by the number of respondents in awareness set.
237
23 and 41 percent, respectively.
Similar results are obtained for the other retailer types.
Therefore, this measure indicates both how important awareness building
and customer satisfaction are to the retailer. If retailers could
transfer the customers who are aware of the store into customers sales
and profitability would increase.
Further examination of the composition of individual's choice sets
provides much information regarding their retail patronage patterns.
For instance, the specific retailers included at each stage and their
likelihood of retention in subsequent stages could yield important
competitive information. Spiggle and Sewall (1986) present a framework
for examining a retailers' relative competition which aids in the
development of marketing strategy. Additionally, for those retailers
exhibiting low levels of awareness, advertising or promotional efforts
could be used to increase consumers' knowledge level. This would
increase awareness set levels and provide a chance that the retailer
would be included at later stages of the choice process. Although this
analysis is not a part of the present research, it will be examined in
future studies.
Choice Set Profiles
Choice sets can also be differentiated based on respondent
demographic characteristics. As discussed in Chapter Two many choice
set studies have examined the relationship between size of choice set
and selected individual characteristics.
238
Potter (1979) found choice sets for older consumers and of lower
socioeconomic status to be smaller. Goldman (1976, 1978) also tested
the hypothesis that lower-income consumers have more restricted shopping
scopes. Goldman (1978) explicitly tested the hypothesis that lower-
income consumers would exhibit lower knowledge levels against an
alternative hypothesis that they would have higher knowledge levels.
The assumptions regarding the theory of restricted knowledge are that
these consumers tend to shop closer to home and thus know less about the
various market opportunities. Secondly, the retailing structure in
their community may be very different and restricted shopping patterns
would generate differing knowledge levels.
The alternative hypothesis is based upon the thoughts that these
individuals have greater time to spend in the shopping process and are
more willing to expend effort to maximize financial utilities. Thus,
they will spend greater shopping effort in the search of monetary
savings. Higher-income consumers on the other hand value their time
much more and are not as concerned about value. Their time is much more
important. Therefore, according to this approach, lower-income
consumers can be expected to invest more effort in their shopping, to
know more about the market, and to have a wider shopping scope.
These hypotheses regarding consumers' demographic characteristics
and choice set size were explored using oneway analysis of variance and
ANOVA. Table 5.7 presents the means, F-ratios, significance levels, and
post hoc tests for the various demographic variables which were related
to choice set size. The dependent measure utilized in these analyses
was the number of retailers at each stage of the choice process. The
239
oneway analysis of variance resulted in four basic models which reached
statistical significance. Group differences were explored for each
significant model using the Scheffe test. Four demographic variables:
age, education, income, and ethnic origin, were related to choice set
structure.
At the awareness set stage, age of the respondent was the only
demographic variable significantly related to choice set size. As
demonstrated by the group means in Table 5.7, older consumers exhibited
smaller choice sets (mean=45) when compared to the other groups. This
group was significantly different from the other three age groups.
Thus, Potter's (1979) finding that older consumers have smaller choice
sets is confirmed. An interesting finding at the awareness set stage is
the lack of significance of the other independent variables. If Goldman
(1976, 1978) is correct, one would expect to find differences in
knowledge level (or awareness) for lower-income, less-educated
individuals. However, no significant differences were found for these
variables at this stage. Individuals' choice sets do not show any
differences as a result of income, education, or ethnic background.
At the consideration set stage, all demographic variables are
significantly related to choice set size. However, when post hoc
analyses were conducted, no significant differences were found for the
separate income classes. As shown in Table 5.7, cell means ranged from
30.81 for the lowest income category to 21.05 for the highest. While
lower income respondents so report larger consideration sets than
wealthier respondents, this difference is not statistically different.
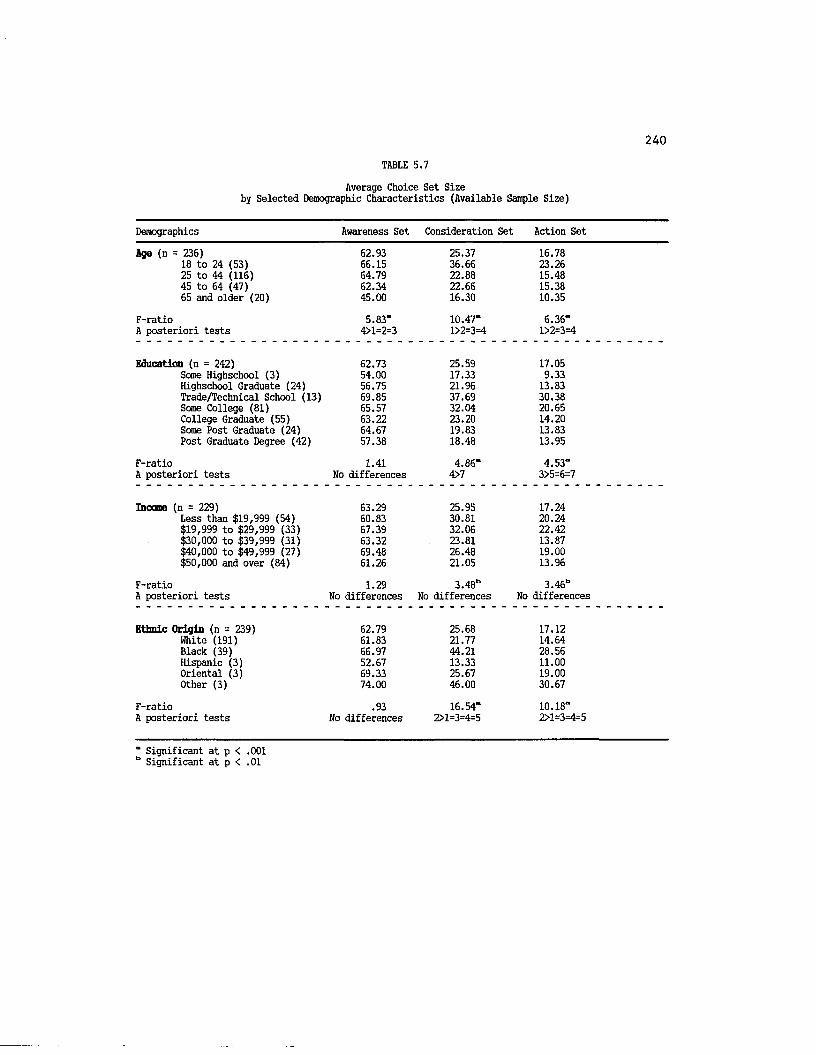
240TABLE 5.7
Average Choice Set Size by Selected Demographic Characteristics (Available Sample Size)
Demographics Awareness Set Consideration Set Action Set
Age (n = 236) 62.93 25.37 16.7818 to 24 (53) 66.15 36.66 23.2625 to 44 (116) 64.79 22.88 15.4845 to 64 (47) 62.34 22.66 15.3865 and older (20) 45.00 16.30 10.35
F-ratio 5.83" 10.47" 6.36“A posteriori tests 4>1=2=3 1>2=3=4 1>2=3=4
Education (n = 242) 62.73 25.59 17.05Some Highschool (3) 54.00 17.33 9.33Highschool Graduate (24) 56.75 21.96 13.83Trade/Technical School (13) 69.85 37.69 30.38Some College (81) 65.57 32.04 20.65College Graduate (55) 63.22 23.20 14.20Some Post Graduate (24) 64.67 19.83 13.83Post Graduate Degree (42) 57.38 18.48 13.95
F-ratio 1.41 4.86" 4.53"A posteriori tests No differences 4>7 3>5=6=7
Incone (n = 229) 63.29 25.95 17.24Less than $19,999 (54) 60.83 30.81 20.24$19,999 to $29,999 (33) 67.39 32.06 22.42$30,000 to $39,999 (31) 63.32 23.81 13.87$40,000 to $49,999 (27) 69.48 26.48 19.00$50,000 and over (84) 61.26 21.05 13.96
F-ratio 1.29 3.48* 3.46bA posteriori tests No differences No differences No differences
Ethnic Origin (n = 239) 62.79 25.68 17.12White (191) 61.83 21.77 14.64Black (39) 66.97 44.21 28.56Hispanic (3) 52.67 13.33 11.00Oriental (3) 69.33 25.67 19.00Other (3) 74.00 46.00 30.67
F-ratio .93 16.54“ 10.18"A posteriori tests No differences 2>1=3=4=5 2>1=3=4=5
" Significant at p < .001 b Significant at p < .01

241
In analyzing the a posteriori tests, respondents' age was found to
be significantly related to consideration set size. Younger respondents
(18-24) exhibited larger choice sets than the other three groups. These
respondents averaged consideration sets of 36.66 compared to 22.88 for
25-44 year olds, 22.66 for 45-64 year olds, and 16.30 for respondents 65
and older. This group likely has more discretionary time available to
shop and may enjoy shopping as a recreational activity.
Significant differences in consideration set size were also
observed for respondents of different educational background.
Respondents who reported attending college had larger choice sets than
individuals with a post graduate degree. Ethnic origin of the
respondent was also significantly related to size of the consideration
set. Black respondents exhibited larger choice sets than white
respondents. In fact, the mean number of alternative retailers included
in the consideration set stage for black respondents was more than twice
that found for white respondents (44.21 and 21.77 respectively).
Demographic differences were also found at the action set stage.
Post hoc analyses revealed statistically significant group differences
for age, ethnic origin, and education. Younger respondents (18-24)
again reported more retailers in the action set than the other three age
groups. Additionally, individuals who had received trade/technical
school training included a larger number of retailers (30.38) than those
who had a college degree or higher education (14.20, 13.83 and 13.95
respectively). Black respondents were again found to have larger action
sets than white respondents (28.56 and 14.64 respectively).
While these results are interesting, how important are each of
242
these variables in relation to choice set size? Specifically, this
researcher was interested in examining differences in choice set size as
a result of income when the effects of ethnic origin was controlled and
vice versa. Results from these two analysis of covariance (ANCOVA) are
presented in Table 5.8 and 5.9. Similar to the oneway analysis of
variance results, no differences are found at the awareness set stage.
However, for both analyses, the covariates and main effects are
significant. Whether income or ethnic origin is controlled, significant
results are obtained.
These analyses indicate both income and ethnic origin to be
important in predicting differences in consideration and action set
size. An interesting finding is the size of black respondents' sets in
comparison to white respondents and the fact that lower income groups
appear to have larger choice sets. One possible explanation for this
result is these lower-income groups include a greater number of
retailers because they are financially constrained. Therefore, when
making a purchase decision these individuals may consider and visit a
large number of retail outlets so that financial utility is maximized.
An alternative explanation is that these respondents may receive
other satisfactions from the shopping experience in addition to the
purchase of a product. For them, shopping gratifies many other needs
such as providing entertainment and recreation or affiliation. Thus,
they include a larger number of retailers in these later choice sets.
A final analysis of covariance was conducted which employed the
choice set measures as dependent variables and ethnic origin, education,

TABLE 5.8
ANCOVA Results with Choice Set Structure AsDependent Variables, Income As Independent Variable
and Ethnic Origin as Covariate
Awareness Set Consideration Set Action Set
CovariateEthnic Origin 2.292 23.68" 17.38"
Rain EffectIncome 1.500 2.23b 2.35b
OverallTotal 1.660 6.52 " 5.35"
" F-values significant at p < .001 b F-values significant at p < .01
TABLE 5.9
ANCOVA Results with Choice Set Structure asDependent Variables, Ethnic Origin as Independent Variable
and Income as Covariate
Awareness Set Consideration Set Action Set
CovariateIncome .001 13.929* 8.97b
Rain EffectEthnic Origin .948 14.059“ 8.57"
OverallTotal .759 14.033" 8.55"
“ F-values significant at p < .001 b F-values significant at p < .01
245
and age as independent variables. Income was utilized here as a
blocking factor or covariate. F-values and significance levels are
reported in Table 5.10. Again, no differences are found at the
awareness set stage, while all variables are significantly related to
choice set size at the consideration and action set stages.
This finding supports previous tests which observed younger, lower
income, less educated and black respondents to report larger choice
sets. These results can aid retail management in planning target
marketing strategies as demographic variables can be usefully employed
as a segmentation variable. Additionally, if the consumer has knowledge
of the retail outlet, then for these retailers there is increased
probability that they will be retained at later choice stages for the
specific demographic groups discussed.
Summary
Respondents exhibit extreme variation in the numbers of retailers
included at each stage of the choice set formation process. This is an
interesting finding by itself as it demonstrates that individuals do
behave differently with respect to the retail choice decision process.
Some individuals have knowledge of a great number of retailers while
others display relatively small awareness sets.
To explain this finding, a number of questions arise.
Specifically, what variables influence consumers' knowledge of available
retail outlets? Are certain consumers more persuaded by marketer-
dominated sources of information, such as advertising and promotion?
Or, do they learn of alternative retailers through more informal sources
TABLE 5.10
ANCOVA Results with Choice Set Structure asDependent Variables, Demographic Variables as Independent
Variables with Income as Covariate
Awareness Set Consideration Set Action Set
CovariateIncome .018 17.368" 12.249"
Halo EffectEthnic Origin 1.389 13.667" 8.731*
Education 1.562 3.372b 3.887"
Age 6.098" 3.385b 2.699"
OverallTotal 2.332 8.679’ 6.386"
" F-values significant at p < .001b F-values significant at p < .01° F-values significant at p < .05
247
such as their friends, neighbors, or coworkers? Additional research is
needed to identify how awareness sets are formed.
In examining the size of choice sets at later stages in the
process, this variation is again observed. Certain consumers seem to
very quickly narrow their range of choice, while others retain a
relatively large proportion of available outlets. One possible
explanation for the reduction in choice set size is that over time,
consumers become accustomed to patronizing a specific group or set of
retailers. For these individuals, their retail choice decision is
simplified by relying on this predefined set for their shopping needs.
A related interpretation is that these consumers may consider only
those retailers for which they have a credit card. Retail management
certainly expects the availability of store credit to be a major
determinant of consumers' patronage behavior. Other explanations could
be that consumers simply shop where their parents shopped, where their
friends currently shop, or where their reference groups shop. Thus, the
group of retail outlets considered and contacted is restricted to this
set. Obviously, more attention to these issues is needed to determine
how consumers construct these sets.
Further, as implied in the discussion above, the results of this
chapter confirm the assumption that individuals rarely make use of all
available alternatives when making a decision. Each choice set measure
discussed explicitly demonstrated that individuals reduce the number of
retailers included during the choice set process. Whether moving from
awareness set to consideration set, consideration set to action set, or
awareness set to action set, some individuals display no reduction while
248
others decrease the number of retailers included by 100%.
Further empirical work is needed to determine if reduction
measures could be utilized to categorize and group respondents. Cluster
analysis could be employed to classify individuals based on their
reduction percentages. These groups would then represent the decision
styles of the individuals. Following the grouping analysis, various
explanatory variables could be applied to determine if the individual
groups could be differentiated. This analysis is similar to that
employed by patronage researchers to obtain shopper typologies.
Additionally, differences in choice set size were found across
demographic profiles. This finding could provide useful information to
retailers as they make decisions regarding the desired target market.
Knowledge about the size of individuals1 sets could aid management in
positioning their outlet and determining sales or demand forecasts.
CHAPTER SIX
Hypothesis Tests Results
Chapter Six begins with a presentation of the results testing the
stated hypotheses. These hypotheses deal with six general areas: the
dimensionality of motivations (HI to H4), the relationship between
motivation and attribute importance (H5 and H6), dimensionality of
shopping process involvement (H13), knowledge relationships (H16 and
H19), shopping process involvement relationships (H14 and H15), and
choice set formation process relationships (H7, H8, H9, H10, Hll, H12,
H17, H18, H20 and H21). Individual hypotheses (HI to H21) and their
tests are presented first, followed by a presentation of a simultaneous
test through structural model results. The chapter concludes with a
summary section1 providing an overview of the results.
Separate Hypothesis Tests
HI to H4: Structure of Shopping Motivations
The proposed motivation subscales were analyzed using structural
equation models (SEM) and a confirmatory factor model. Three separate
factor models as well as a second-order factor model were utilized to
test the dimensionality of shopping motivations. Seventeen dimensions
of shopping motivations were described in Chapter Four. The seventeen
subscales were proposed to be related to three second-order motivation
factors: functional, symbolic, and experiential.
249

250
Proposed Second-Order Factor Model: Overall Model Fit. The
following confirmatory factor analyses provide empirical evidence as to
the appropriate motivational structure. Results of the second-order
confirmatory factor analysis using LISREL VI (Joreskog and Sorbom 1983)
reveal a moderate fit of the hypothesized motivation dimensionality.
Goodness-of-fit statistics and parameter estimates are presented in
Table 6.1 and depicted in Figure 6.1. One construct in the symbolic
dimension, prestige, was omitted from the analysis because it induced
instabilities in the estimation of structural coefficients. The chi-
square statistic was significant (Xz = 744.55, p < .001). However, this
statistic is very sensitive to sample size, confounding the hypothesis
test and making rejection of the model inappropriate based only on this
evidence (Bagozzi 1980). Relative fit indices (GFI = .770, AGFI = .693,
RMSR = .248, NFI = .63) were lower than the stated criteria for
acceptable model fit (AGFI greater than .90, RMSR less than .07 and NFI
greater than .90). The overall model explained 99.8 percent of the
variance which indicates the proposed factor model does indeed account
for most of the variance in the second order factors.
However, these fit statistics are based on a model with no
correlations between the three second-order factors. Theory suggests
correlations between these factors, yet the correlation between the
functional and symbolic dimension is so large that the LISREL program
was unable to estimate the relationships due to parameter instability.
Fit of the proposed model would increase greatly if correlations were
estimated between the three factors, as the modification index for the
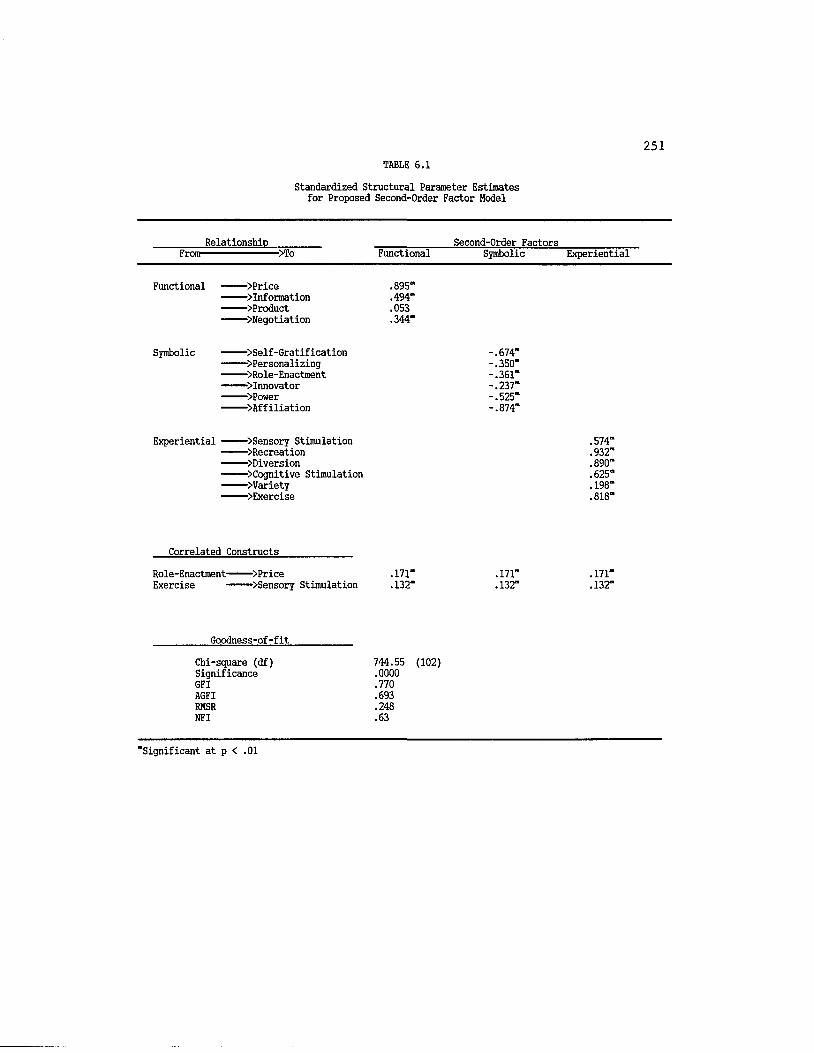
251TABLE 6.1
Standardized Structural Parameter Estimates for Proposed Second-Order Factor Model
Relationshio Second-Order FactorsFrom ..... ..>To Functional Symbolic Experiential
Functional ....... >Price .895"information .494"
---- >Product .053---- Negotiation .344"
Symbolic — —>Self-Gratification -.674"---- >Personalizing -.350"---- >Role-Enactment -.361"- — ■innovator -.237“---- >Power -.525"---->Affiliation -.874“
Experiential ---->Sensory Stimulation .574“>Recreation .932"
---- >Diversion .890"— — >Cognitive Stimulation .625"---->Variety .198“---- >Exercise .818"
Correlated Constructs
Role-Enactment 1 >Price .171“ .171" .171"Exercise — — >Sensory Stimulation .132" .132" .132"
Goodness-of-fit
Chi-square (df) 744.55 (102)Significance .0000GFI .770AGFI .693RMSR .248NFI .63
"Significant at p < .01
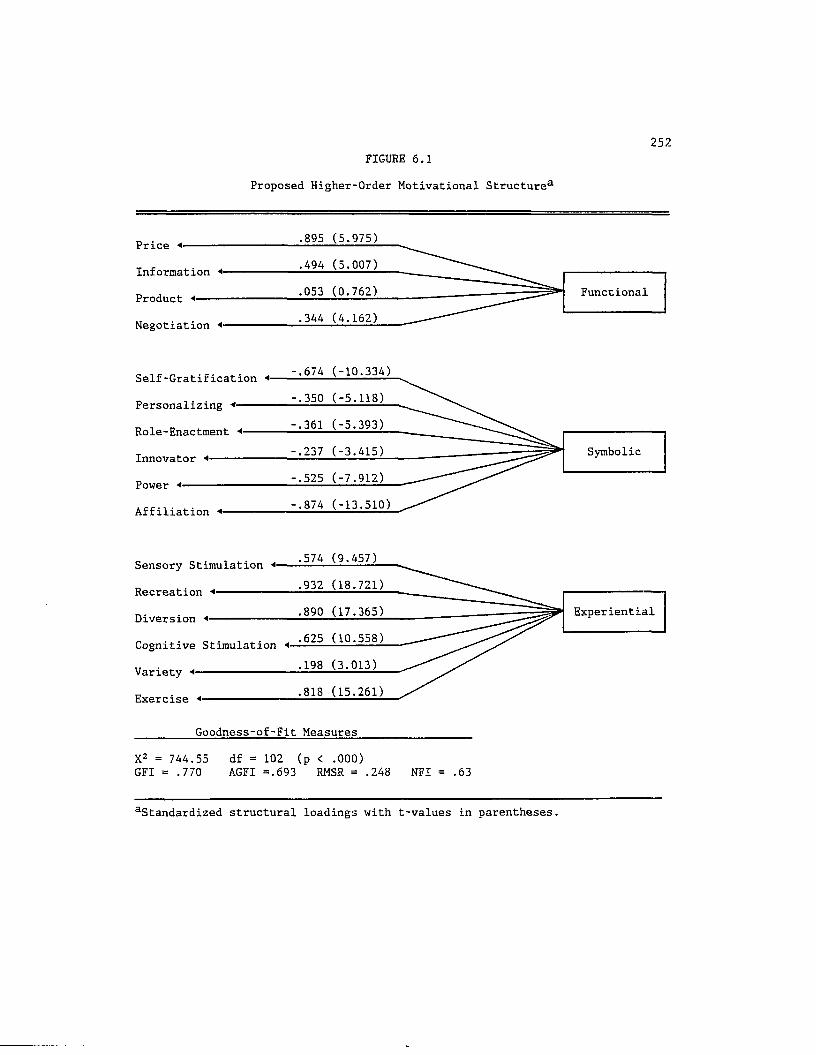
FIGURE 6.1Proposed Higher-Order Motivational Structure3
252
5.975).895Price5.007).494Information ♦0.762).053 FunctionalProduct <
4.162)Negotiation «■
-10.334)-.674Self-Gratification <
-5.118)-.350Personalizing «■-5.393)-.361Role-Enactment «•-3.415)-.237 SymbolicInnovator-7.912)-.525Power «■-13.510)-.874Affiliation ♦
9.457).574Sensory Stimulation18.721).932Recreation *
17.365) Experiential.890Diversion ♦10.558).625Cognitive Stimulation3.013).198Variety *
15.261).818Exercise <
Goodness-of-Fit Measures
X 2 = 744.55 df = 102 (p < .000)GFI = .770 AGFI =.693 RMSR = .248 NFI = .63
S t a ndardized structural loadings with t-values in parentheses.

253
correlation between symbolic and experiential was 185.0, indicating that
the overall chi-square statistic could be reduced by this number if the
correlation was estimated. Obviously, the overall fit indices would
also be improved by this addition. Even with these fit indices,
however, the structural model warrants examination.
Structural Model. The standardized parameter estimates for the
proposed second-order factor model are also presented in Table 6.1 and
Figure 6.1. All of the coefficients are significant except the loading
of product to the functional dimension. The signs of the loadings occur
primarily because of the product factor. This factor exhibits little
association to the functional dimension and affects the signs of the
other factor coefficients. The functional dimension is negatively
correlated with symbolic and experiential higher-order motives, however,
the product factor particularly is positively related to the symbolic
dimension while negatively related to the experiential dimension. This
suggests the product factor captures more of a motivation to shop for
personal or psychological reasons rather than shopping purely for
functional benefits. To examine these relationships more closely, the
second-order factor model was respecified allowing for cross-loadings
between many of the 16 first-order factors.
Respecified Model. The respecified second-order model allowed
eight of the 16 first-order factors to load on more than one second-
order factor. This change was allowed since correlations were
hypothesized between the three second-order factors. However, since the
LISREL program could not estimate the function when the constructs were
allowed to correlate, individual factor cross-loadings were allowed.
254
Specifically/ the product dimension was allowed to load on all
three higher-order factors. Negotiation was also allowed to load on the
experiential dimension. Four of the symbolic factors were allowed to
load on the experiential dimension: self-gratification, role-enactment,
power, and affiliation, and two of the experiential factors were allowed
to load on the symbolic dimension: diversion and cognitive stimulation.
Overall Model Fit. Results of the respecified second-order factor
analysis reveal a good fit of the motivation dimensionality. Goodness-
of-fit statistics and parameter estimates are presented in Table 6.2 and
depicted in Figure 6.2. The chi-square statistic was significant (X2 =
169.04, p < .001), however relative fit indices were within acceptable
ranges (GFI = .920, AGFI = .883, RMSR = .099, NFI = .92). The overall
model explained 99.5 percent of the variance which indicates the
proposed factor model does indeed account for most of the variance in
the second order factors.
Structural Model. All structural model coefficients were
significant at the .01 level and the product factor does indeed exhibit
a negative relationship to the functional and experiential dimensions
and a positive relationship to the symbolic dimension.
Summary. Based on the confirmatory factor analyses (see Chapter
Four) and second-order analysis described above, partial support is
provided for these hypotheses. The instability contained in the model
when correlations between second-order factors are estimated seriously
affects the empirical testing of these hypotheses. While the
respecified model improves the overall fit statistics, it results in a
model which does not discriminate well between the symbolic and

255TABLE 6.2
Standardized Structural Parameter Estimates for Respecified Second-Order Factor Model
First-Order Factors FunctionalSecond-Order Factors
Symbolic Experiential
Price .751"Information .590"Product -.153" Iin -.695"Negotiation .322" -.208“
Self-Gratification -.037 -.881"Personalizing -.384" -.219“Role-Enactment -.279“Innovator -.137*"Power -.660" -.279“Affiliation -.399" -.675“
Sensory Stimulation -.586"Recreation -.945“Diversion -.184" -.876*Cognitive Stimulation -.265" -.595“Variety -.200"Exercise -.814"
Correlated Constructs
Role-Enactment— >Price .171"Exercise ---- >Sensory Stimulation .132"
Goodness-of-fit
Chi-square (df) 169.04 (93)Significance .0000GFI .920AGFI .883RMSR .099NFI .92
"Significant at p < .01 bSignificant at p < .05

FIGURE 6.2
Respecified Higher-Order Motivational Structure3
256
.751Price +590Information <■
153 FunctionalProduct <■
A. 202)322Negotiation *
5.896).345Product *■
-0.872)037Self-Gratification *-5.057)-.384Personalizing «■-3.814)-.279Role-Enactment *
-1.769)-.137Innovator «■Symbolic-9.074)-.660Power *■
-7.024)399Affiliation ♦-4.393)-.184Diversion «■-4.220)-.265Cognitive Stimulation
-12.450)-.695Product <■-3.320)-.208Negotiation ♦-17.364)-.881Self-Gratification ♦-3.495)-.219Role-Enactment «•
-.279Power «•-11.917)-.675Affiliation <■-9.841) Experiential-.586Sensory Stimulation ♦-19.600)Recreation ♦-17.260)-.876Diversion-10.091)-.595Cognitive Stimulation-3.083)-.200Variety <
-15.330)Exercise +
Goodness-of-Fit Measures
R 2 = .995 X 2 = 169.04 df = 9 3 (p < .000)GFI = .920 AGFI =.883 RMSR = .099 NFI = .92
S t a n d a r d i z e d structural loadings with t-values in parentheses.
257
experiential dimensions as many of the first-order factors have multiple
loadings on these two factors. Thus, additional empirical testing would
help in determining the dimensionality of the shopping motivations
scale. The results do, however, provide a strong basis for additional
conceptual development and empirical investigation.
H5 and H6: Motivations and Store Attributes
It was hypothesized that motivation dominance would be related to
attribute importance ratings. The correlations between shopping
motivations (summed across the three subdimensions) and retail attribute
importance ratings partially support these hypotheses. Table 6.3
presents the correlations. Hypothesis H5 is partially confirmed since
the functional motivation dimension is significantly correlated with the
hypothesized attributes of price, product variety, and sales staff.
However, only the correlations for price are larger than .30 which is
the established cut-off level for practical significance.
Hypothesis H6 is also partially supported by significant
correlations greater than .30 between type of store and atmosphere
attributes and symbolic and experiential motivation dimensions. The
correlations between sales staff and the motivation subscales are
statistically significant, but do not meet the .30 criterion for
practical significance.
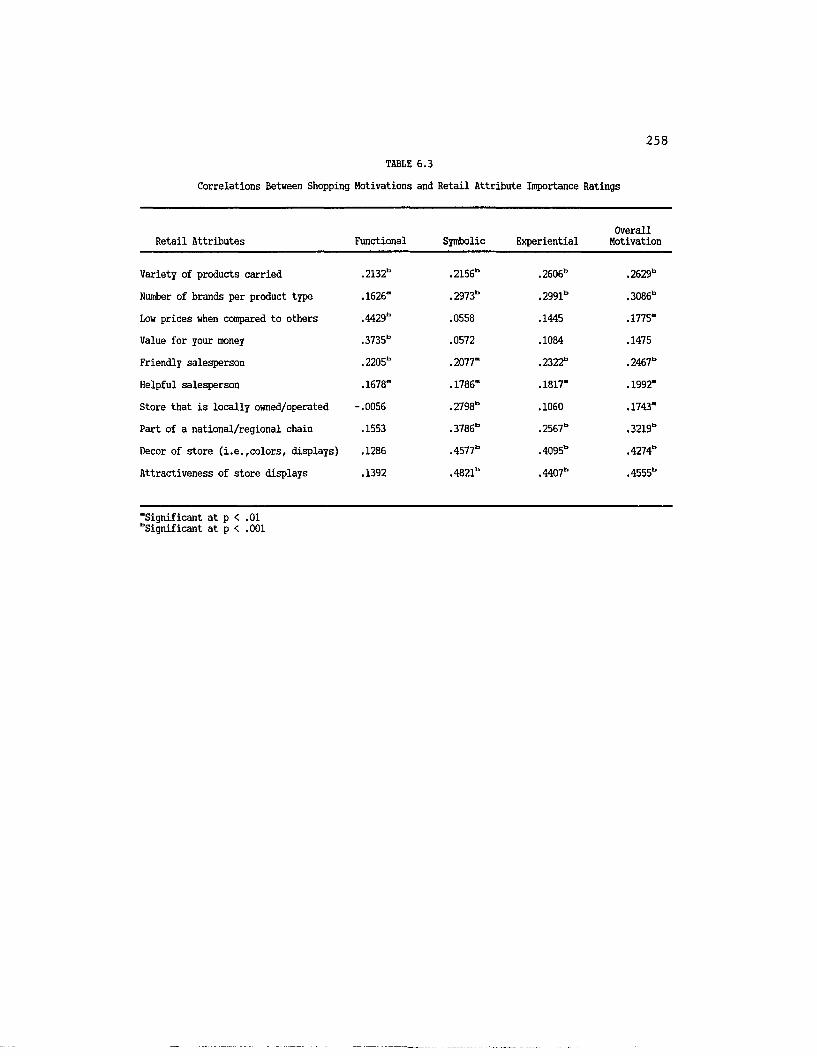
258TABLE 6.3
Correlations Between Shopping Motivations and Retail Attribute Importance Ratings
Retail Attributes Functional Symbolic ExperientialOverallMotivation
Variety of products carried .2132" .2156" .2606" .2629"
Number of brands per product type .1626" .2973" .2991" .3086"
Low prices when compared to others .4429" .0558 .1445 .1775“
Value for your money .3735" .0572 .1084 .1475
Friendly salesperson .2205" .2077" .2322" .2467"
Helpful salesperson .1678“ .1786" .1817" .1992"
Store that is locally owned/operated -.0056 .2798" .1060 .1743"
Part of a national/regional chain .1553 .3786" .2567" .3219"
Decor of store (i.e.,colors, displays) .1286 .4577" .4095" .4274"
Attractiveness of store displays .1392 .4821" .4407" .4555"
"Significant at p < .01 "Significant at p < .001
259
H7: Motivations and Choice Sets
Higher levels of overall motivation are proposed to be reflected
in broader choice set structure measures. Individuals exhibiting higher
levels of overall motivation are expected to include a greater number of
alternative retailers at each stage in the choice process.
Regression analysis was utilized to determine if motivations
influence the size of individuals' choice sets. Results support the
hypothesis since overall motivation is significantly related to choice
set size. Regression was performed using the overall summed motivation
score as an independent variable. These results are presented in Table
6.4. All equations and coefficients are significant with adjusted Rz
values of 4%, 16%, and 15% for the awareness set, consideration set, and
action set stages, respectively.
A second regression analysis was performed to analyze the effects
of motivation on choice set size when other possible explanatory
variables were included in the equation using a stepwise approach.
Clothing involvement, contextual variables, and knowledge were first
entered into the equation followed by motivation. For each equation the
models were trimmed and regression performed again using only those
variables which were significant. Table 6.5 presents the beta
coefficients, significance levels, Rz and adjusted Rz values for the
analyses. At the awareness set stage, only motivation was significantly
related to choice set size and the other variables were not included.
However, the adjusted Rz is only 5.5%, indicating that motivation does

260TABLE 6.4
Regression Analysis of Overall Shopping Motivation As Predictor of Choice Set Size
Choice Set Process StageVariable Beta Significance
Awareness Set Stage
Summed Motivation .1158 .0025Constant 40.6525 .0000
Adjusted Rz = .0402 F = 9.4134Significance = .0025
Consideration Set Stage
Sunned Motivation .1991 .0000Constant -13.7658 .0298
Adjusted Rz = .1598 F = 39.2256 Significance = .0000
Action Set Stage
Sunned Motivation .1553 .0000Constant -13.3991 .0088
Adjusted Rz = .1513 F = 36.8198 Significance = .0000
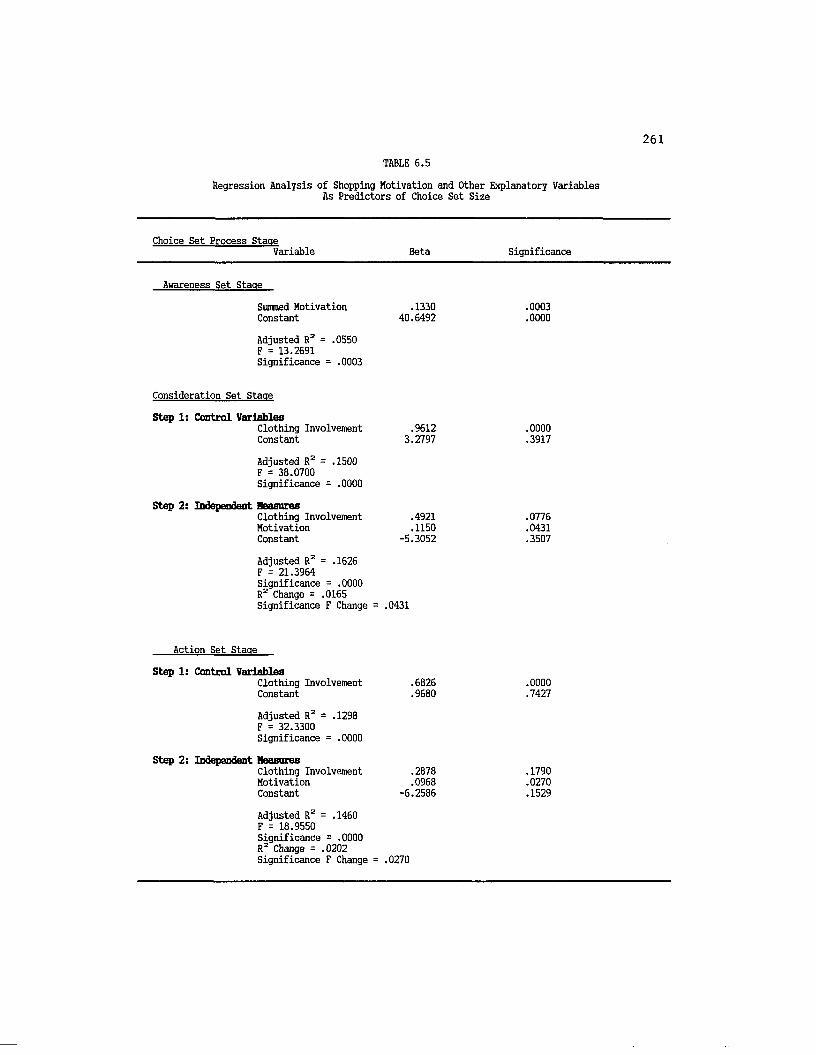
261TABLE 6.5
Regression Analysis of Shopping Motivation and Other Explanatory Variables As Predictors of Choice Set Size
Choice Set Process StageVariable Beta Significance
Awareness Set Stage
Sunned Motivation .1330 .0003Constant 40.6492 .0000
Adjusted Rz = .0550 F = 13.2691 Significance = .0003
Consideration Set Stage
Step 1: Control VariablesClothing Involvement .9612 .0000Constant 3.2797 .3917
Adjusted Rz = .1500 F = 38.0700 Significance = .0000
Step 2: Independent MeasuresClothing Involvement .4921 .0776Motivation .1150 .0431Constant -5.3052 .3507
Adjusted Rz = .1626 F = 21.3964 Significance = .0000 Rz Change = .0165 Significance F Change = .0431
Action Set Stage
Step 1: Control VariablesClothing Involvement .6826 .0000Constant .9680 .7427
Adjusted Rz = .1298 F = 32.3300 Significance = .0000
Step 2: Independent MeasuresClothing Involvement .2878 .1790Motivation .0968 .0270Constant -6.2586 .1529
Adjusted Rz = .1460 F = 18.9550 Significance = .0000 Rz Change = .0202 Significance F Change = .0270
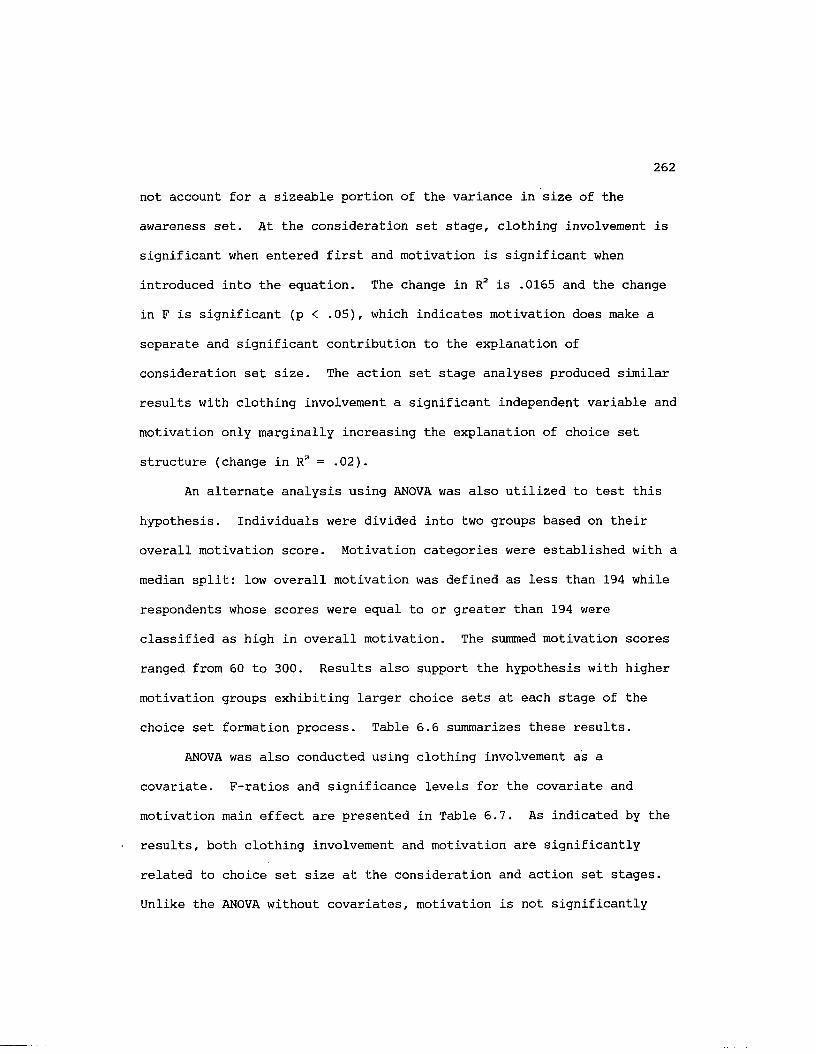
262
not account for a sizeable portion of the variance in size of the
awareness set. At the consideration set stage, clothing involvement is
significant when entered first and motivation is significant when
introduced into the equation. The change in R2 is .0165 and the change
in F is significant (p < .05), which indicates motivation does make a
separate and significant contribution to the explanation of
consideration set size. The action set stage analyses produced similar
results with clothing involvement a significant independent variable and
motivation only marginally increasing the explanation of choice set
structure (change in R2 = .02).
An alternate analysis using ANOVA was also utilized to test this
hypothesis. Individuals were divided into two groups based on their
overall motivation score. Motivation categories were established with a
median split: low overall motivation was defined as less than 194 while
respondents whose scores were equal to or greater than 194 were
classified as high in overall motivation. The summed motivation scores
ranged from 60 to 300. Results also support the hypothesis with higher
motivation groups exhibiting larger choice sets at each stage of the
choice set formation process. Table 6.6 summarizes these results.
ANOVA was also conducted using clothing involvement as a
covariate. F-ratios and significance levels for the covariate and
motivation main effect are presented in Table 6.7. As indicated by the
results, both clothing involvement and motivation are significantly
related to choice set size at the consideration and action set stages.
Unlike the ANOVA without covariates, motivation is not significantly

263TABLE 6.6
Effects of Shopping Motivation on Choice Set Structure
Average Choice Set Size
Overall Motivation Category Awareness Consideration Action
Low Motivation 58.85 20.55 12.72High Motivation 67.74 30.85 21.11
Statistical Significance
F-Ratio 10.75 17.77 20.67Level of Significance .0012 .0000 .0000
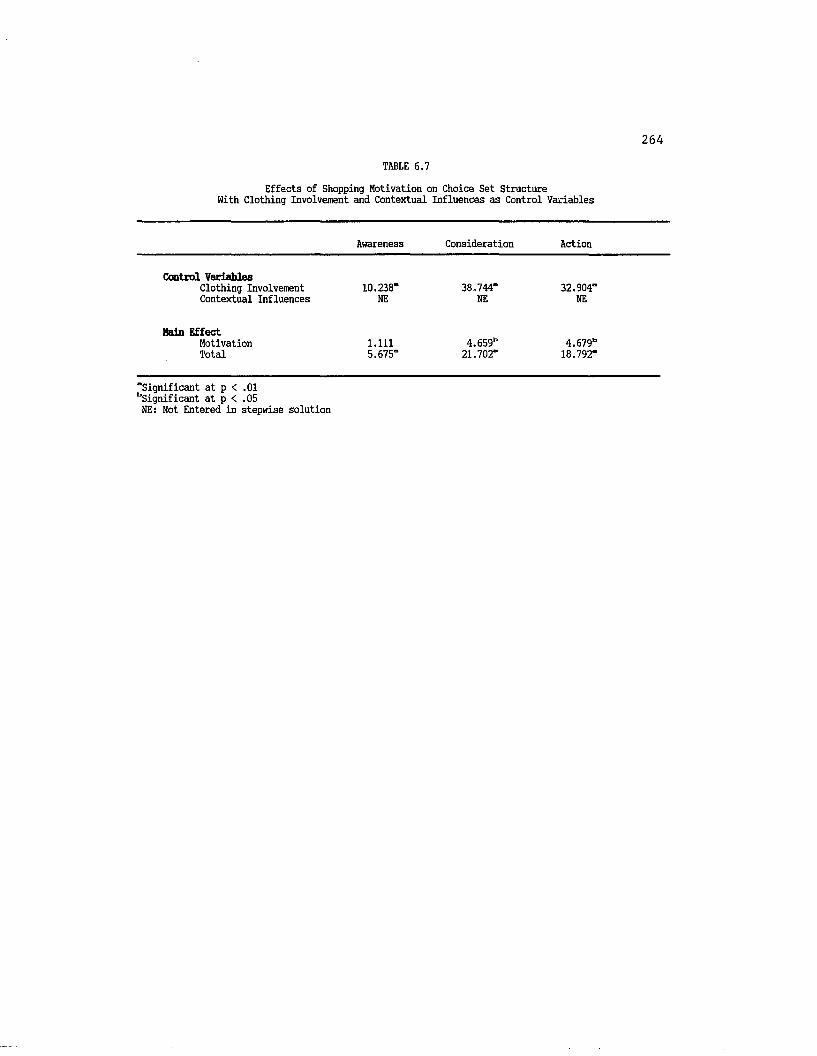
264TABLE 6.7
Effects of Shopping Motivation on Choice Set Structure With Clothing Involvement and Contextual Influences as Control Variables
Awareness Consideration Action
Control VariablesClothing Involvement 10.238" 38.744" 32.904"Contextual Influences NE NE NE
Main EffectMotivation 1.111 4.659b 4.679bTotal 5.675" 21.702" 18.792"
"Significant at p < .01 “"Significant at p < .05 NE: Not Entered in stepwise solution

265
related to awareness set size when clothing involvement is included.
To summarize, while the regression results indicate motivation
explains a smaller than expected proportion of the variance in choice
sets, the ANOVA results demonstrate that individuals who are either high
or low in overall motivation exhibit different sizes of choice sets.
More specifically, individuals high in motivation include greater
numbers of stores in their choice sets at each stage of the choice set
formation process. Additionally, when the effects of clothing
involvement are accounted for, motivation is still significantly related
to choice set size. Overall, this hypothesis is supported and higher
levels of motivation are reflected in broader choice set measures.
H8, H9, and H1Q: Retailer Types and Choice Sets
Hypotheses regarding the type of retailers included in
individuals' choice sets were not supported. It was hypothesized that
functional shoppers would exhibit more varied choice sets (i.e., include
retailers of all types) while symbolic and experiential shoppers would
be more selective and tend to "specialize" in one or more retailer
types. ANOVA was conducted to determine if the three motivation groups
were statistically different from one another in the types of retailers
included at each stage of the choice process. The mean number of types
of retailers included at each stage is presented in Table 6.8 for each
motivational type. In no instance were the groups statistically
different from each other and thus the hypotheses are rejected.
266
Hll and H12: Motivations and Decision Heuristics
MANOVA was performed to test the hypotheses that self-described
motivation type is related to the reduction in number of retailers
retained at later stages in the choice set formation process. The
overall MANOVA was not significant, thus it is not necessary to examine
the univariate tests. Therefore, the hypotheses are not supported and
individuals exhibiting functional, symbolic, and experiential dominant
motivations do not differ in the amount of reduction from either
awareness set to consideration set, awareness set to action set, or
consideration set to action set.
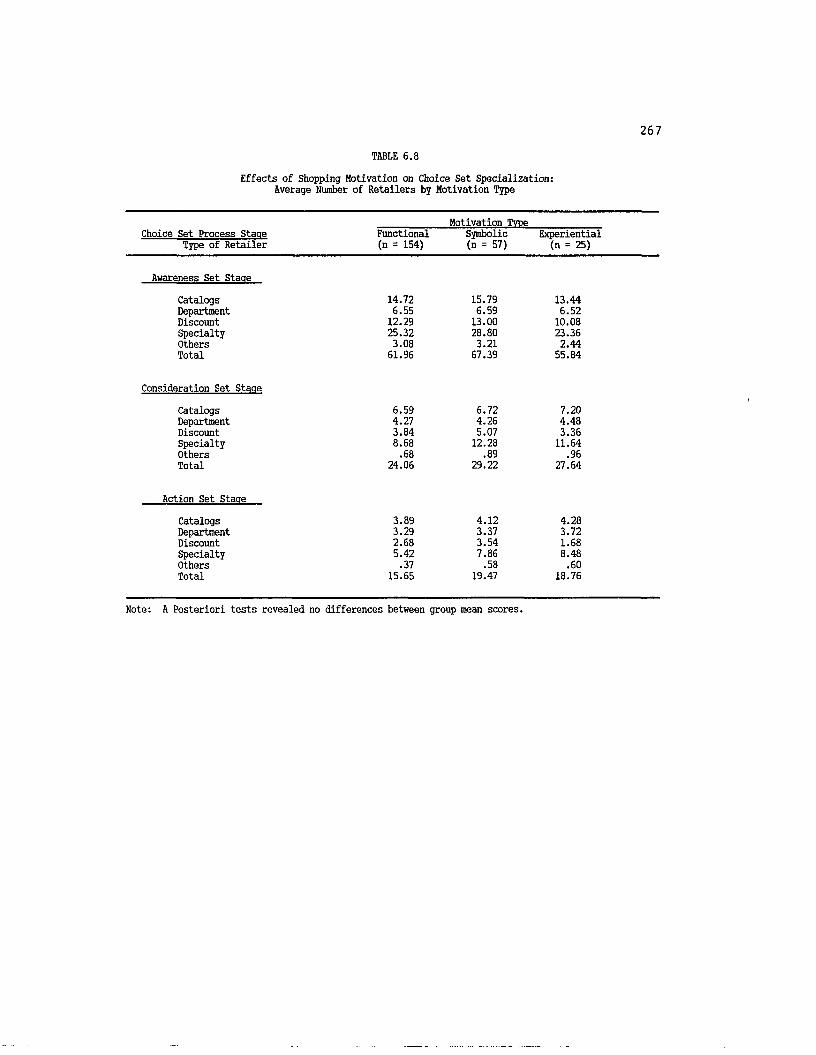
267TABLE 6.8
Effects of Shopping Motivation on Choice Set Specialization: Average Number of Retailers by Motivation Type
Choice Set Process Stage Type of Retailer
Functional (n = 154)
Motivation Troe Symbolic (n = 57)
Experiential (n = 25)
Awareness Set Staae
Catalogs 14.72 15.79 13.44Department 6.55 6.59 6.52Discount 12.29 13.00 10.08Specialty 25.32 28.80 23.36Others 3.08 3.21 2.44Total 61.96 67.39 55.84
Consideration Set Stage
Catalogs 6.59 6.72 7.20Department 4.27 4.26 4.48Discount 3.84 5.07 3.36Specialty 8.68 12.28 11.64Others .68 .89 .96Total 24.06 29.22 27.64
Action Set Stage
Catalogs 3.89 4.12 4.28Department 3.29 3.37 3.72Discount 2.68 3.54 1.68Specialty 5.42 7.86 8.48Others .37 .58 .60Total 15.65 19.47 18.76
Note: A Posteriori tests revealed no differences between group mean scores.
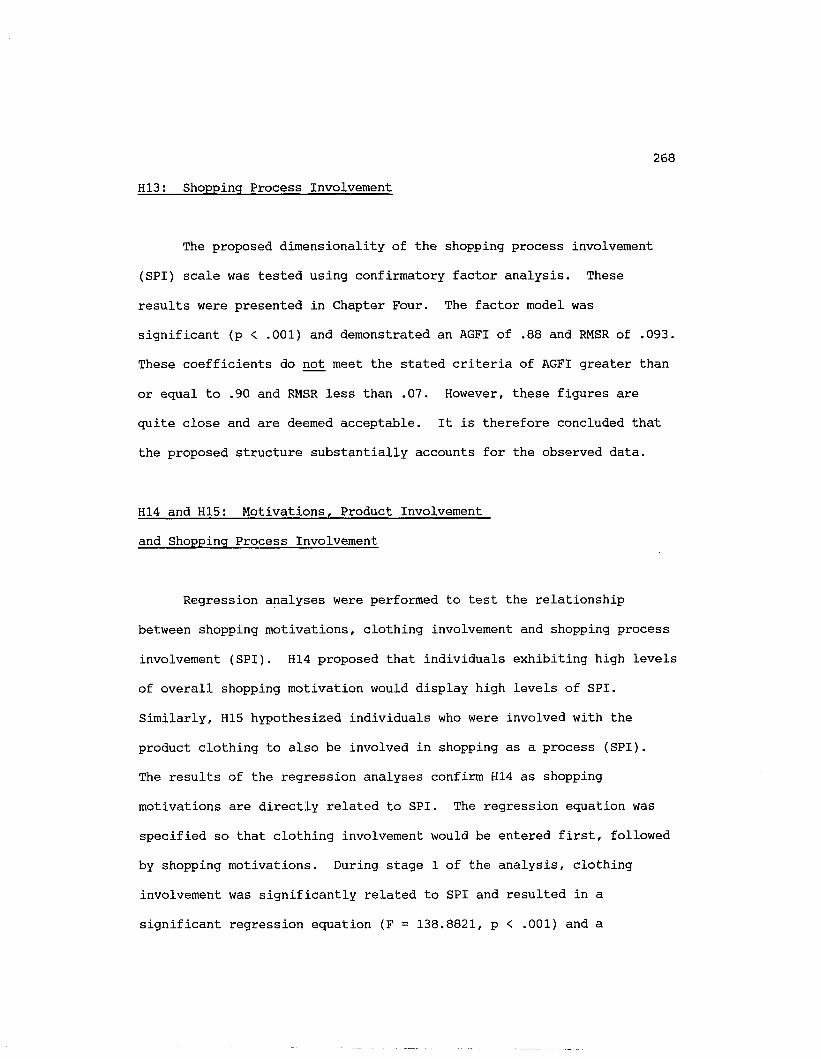
268
H13: Shopping Process Involvement
The proposed dimensionality of the shopping process involvement
(SPI) scale was tested using confirmatory factor analysis. These
results were presented in Chapter Four. The factor model was
significant (p < .001) and demonstrated an AGFI of .88 and RMSR of .093.
These coefficients do not meet the stated criteria of AGFI greater than
or equal to .90 and RMSR less than .07. However, these figures are
quite close and are deemed acceptable. It is therefore concluded that
the proposed structure substantially accounts for the observed data.
H14 and H15: Motivations, Product Involvement
and Shopping Process Involvement
Regression analyses were performed to test the relationship
between shopping motivations, clothing involvement and shopping process
involvement (SPI). H14 proposed that individuals exhibiting high levels
of overall shopping motivation would display high levels of SPI.
Similarly, H15 hypothesized individuals who were involved with the
product clothing to also be involved in shopping as a process (SPI).
The results of the regression analyses confirm H14 as shopping
motivations are directly related to SPI. The regression equation was
specified so that clothing involvement would be entered first, followed
by shopping motivations. During stage 1 of the analysis, clothing
involvement was significantly related to SPI and resulted in a
significant regression equation (F = 138.8821, p < .001) and a

269
coefficient of determination of 57.36%. The beta coefficient is
significant at the .001 level. However, when motivations were entered
at step 2, clothing involvement did not reach significance. Motivations
were highly related to SPI and when this variable was entered into the
equation the change in Rz was 18.4% and significant. The beta
coefficients, significance levels and Rz statistics are reported in
Table 6.9.
Thus, it is concluded that shopping motivations are indeed related
to SPI with individuals who exhibit high overall shopping motivations to
also enjoy shopping as a process and H14 is supported. However, the
relationship between product involvement and SPI is not significant when
other important variables such as motivation are included in the
analysis. Therefore, H15 receives partial support since clothing
involvement is significantly related to SPI when considered alone.
H16: Product Involvement and Knowledge
This hypothesis proposed individuals demonstrating high product
involvement to have greater amounts of knowledge regarding the product
category and available retail outlets. This proposition was tested
using regression analysis. A regression equation was estimated using
product involvement and experience as predictors of knowledge.
Experience was operationalized as the amount of time the individual had
resided in the city. Since product involvement was the focus of this
test, experience was entered in the equation first. Table 6.10 presents
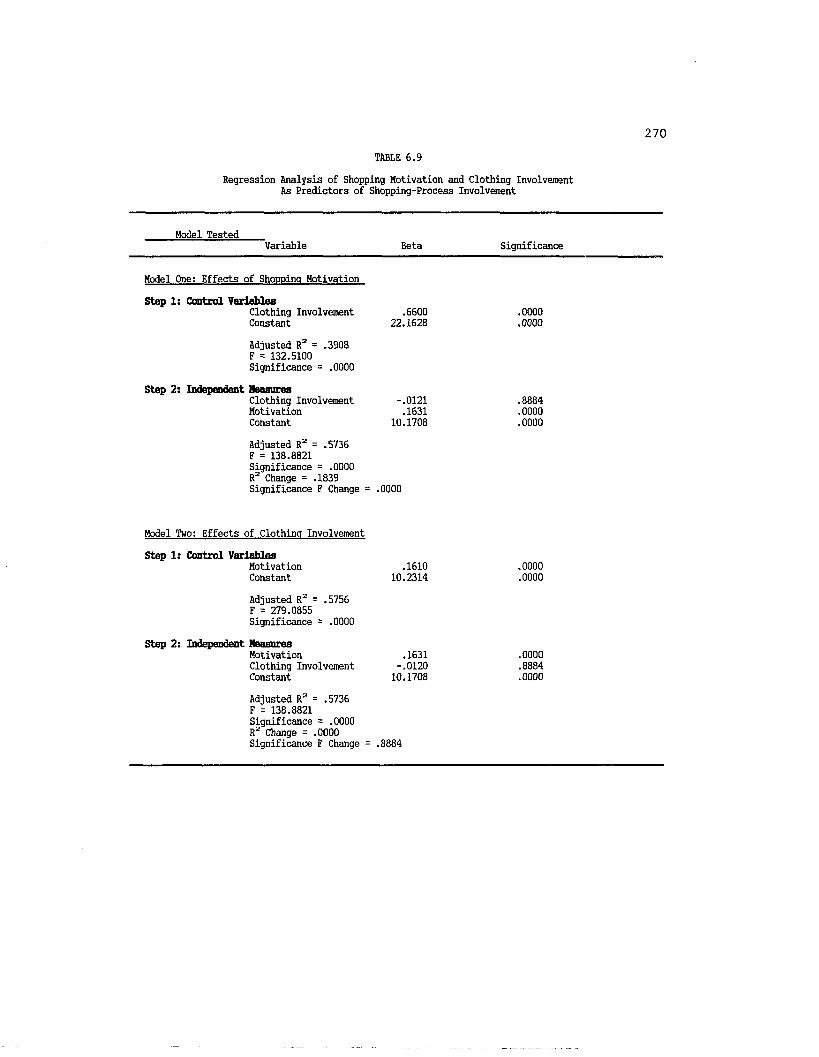
270TABLE 6.9
Regression Analysis of Shopping Motivation and Clothing Involvement As Predictors of Shopping-Process Involvement
Model TestedVariable Beta Significance
Model One: Effects of Shopping Motivation
Step 1: Control VariablesClothing Involvement .6600 .0000Constant 22.1628 .0000
Adjusted R2 = .3908 F = 132.5100 Significance = .0000
Step 2: Independent MeasuresClothing Involvement -.0121 .8884Motivation .1631 .0000Constant 10.1708 .0000
Adjusted R2 = .5736 F = 138.8821 Significance = .0000 R2 Change = .1839 Significance F Change = .0000
Model Two: Effects of Clothing Involvement
Step 1: Control VariablesMotivation .1610 .0000Constant 10.2314 .0000
Adjusted R2 = .5756 F = 279.0855 Significance = .0000
Step 2: Independent MeasuresMotivation .1631 .0000Clothing Involvement -.0120 .8884Constant 10.1708 .0000
Adjusted R2 = .5736 F = 138.8821 Significance = .0000 R2 Change = .0000 Significance F Change = .8884
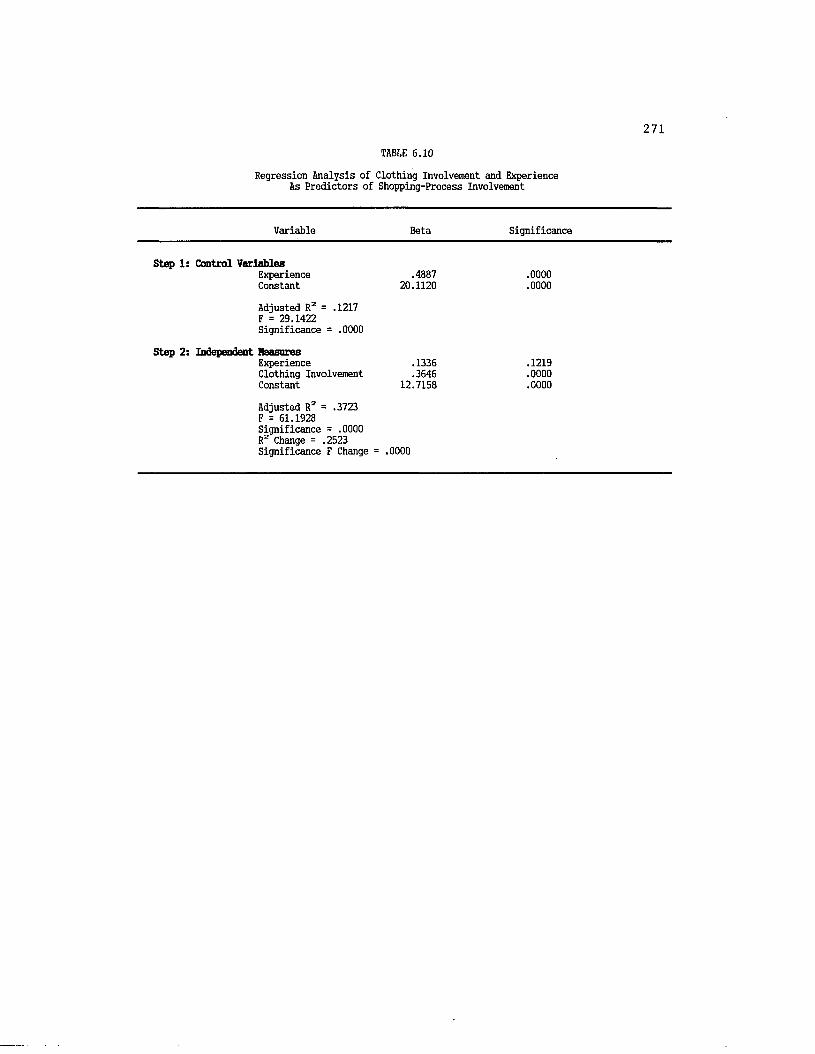
271TABLE 6.10
Regression Analysis of Clothing Involvement and Experience As Predictors of Shopping-Process Involvement
Variable Beta Significance
Step 1: Control VariablesExperience .4887 .0000Constant 20.1120 .0000
Adjusted R2 = .1217 F = 29.1422 Significance = .0000
Step 2: Independent MeasuresExperience .1336 .1219Clothing Involvement .3646 .0000Constant 12.7158 .0000
Adjusted R2 = .3723 F = 61.1928 Significance = .0000 R2 Change = .2523 Significance F Change = .0000
272
F-ratios, significance levels and R2 statistics for this analysis.
Experience was significant in predicting knowledge and accounted for
approximately 12% of the variance. However, when clothing involvement
was entered, the effects of experience were nullified. The change in R2
produced by the introduction of clothing involvement was 25.23% and
resulted in an overall adjusted R2 of 37.23%. Thus, clothing
involvement does indeed significantly relate to knowledge and this
hypothesis is supported.
H17 and H18: Involvement and Choice Sets
Regression analyses were performed to test the relationship
between choice set size and involvement. Specifically, individuals
exhibiting high levels of shopping process involvement (SPI) and
clothing involvement were expected to report larger choice sets at the
awareness set stage. As shown in Table 6.11, the regression equations
are significant and the estimates are in the expected direction for
Model One and Model Two.
However, as shown in Models Three and Four, when other variables
are also included in the model, the effects of both clothing involvement
and SPI are not significant and produce very marginal changes in
explained variance. In both models, knowledge is a significant
predictor of awareness set size while the other variables are not. It
is concluded that while there is a relationship between involvement and
size of choice set, the involvement constructs do not account for the
variation in awareness set size since knowledge is highly related.
273
ANOVA was also utilized to test the two hypotheses. Respondents
were divided into two groups based on their clothing involvement and SPI
summed scale scores. The median score was utilized as the cut-off point
for determining the high and low groups. Individuals scoring 23 or less
on the clothing involvement scale were considered to be low in product
involvement, while high product involved individuals were those scoring
above 24. The product involvement summed measure ranged from 8 to 40.
Table 6.12 presents the F-ratios and significance levels for the
effects of clothing involvement on choice set size. Each ANOVA is
significant with individuals high in clothing involvement exhibiting
larger choice sets at each stage of the process. Table 6.13 presents
the results of an ANCOVA where other variables are included in the model
as covariates. Specifically, at each choice set stage, motivation has a
significant effect as a covariate and nullifies the effects of clothing
involvement on choice set size.
Table 6.12 also presents the F-ratios and significance levels for
the effects of SPI on choice set size. Individuals scoring 38 or less
on the SPI scale were considered to be low in SPI, while high SPI
individuals were those scoring above 39. The SPI summed measure ranged
from 12 to 60. Each ANOVA is significant with individuals high in SPI
exhibiting larger choice sets at each stage of the process. Similar to
the analysis concerning clothing involvement, ANCOVA was performed for
SPI with other variables included as covariates. Motivation again
appears to have a substantial effect on choice set size which voids the
effects of SPI. These results are presented in Table 6.13.

274TABLE 6.11
Regression Analysis Predicting Awareness Set Size
Model TestedVariable Beta Significance
Model One: ShoDDina Process Involvement (SPI)
SPI .5498 .0009Constant 42.0471 .0000
Adjusted R2 = .0459 F = 11.3495 Significance = .0009
Model Two: Clothina Involvement (Cl)
Cl .6297 .0005Constant 47.9067 .0000
Adjusted R2 = .0504 F = 12.4074 Significance = .0005
Model Three: Cl and KnowledgeStep 1: Control Variables
Knowledge .9935 .0003Constant 41.6809 .0000
Adjusted R2 = .0517 F = 13.4351 Significance = .0003
Step 2: Independent MeasuresKnowledge .5799 .1028Cl .4239 .0727Constant 40.6754 .0000
Adjusted R2 = .0610 F = 8.4010Significance = .0003 R2 Change = .0134 Significance F Change = .0727
Model Four: SPI and Knowledae Step 1: Control Variables
Knowledge .8872 .0013Constant 43.9099 .0000
Adjusted R2 = .0409 F = 10.5637 Significance = .0013
Step 2: Independent MeasuresKnowledge .6407 .0333SPI .3681 .0521Constant 35.3440 .0000
Adjusted R2 = .0529 F = 7.2555Significance = .0009 R2 Change = .0161 Significance F Change = .0521

275TABLE 6.12
Effects of Clothing Involvement and Shopping Process Involvement on Choice Set Structure
Level of Involvement By Type Average Choice Set Size By Stage
nothing Involvement Awareness Consideration Action
LowHigh
59.7567.00
20.3432.23
13.4421.77
Statistical Significance
F-RatloLevel of Significance
6.73.0100
25.59.0000
20.37.0000
Shopping Process Involvement Awareness Consideration Action
LowHigh
59.8167.55
22.2131.32
13.8721.80
Statistical Significance
F-RatioLevel of Significance
7.38.0007
13.18.0000
17.39.0000
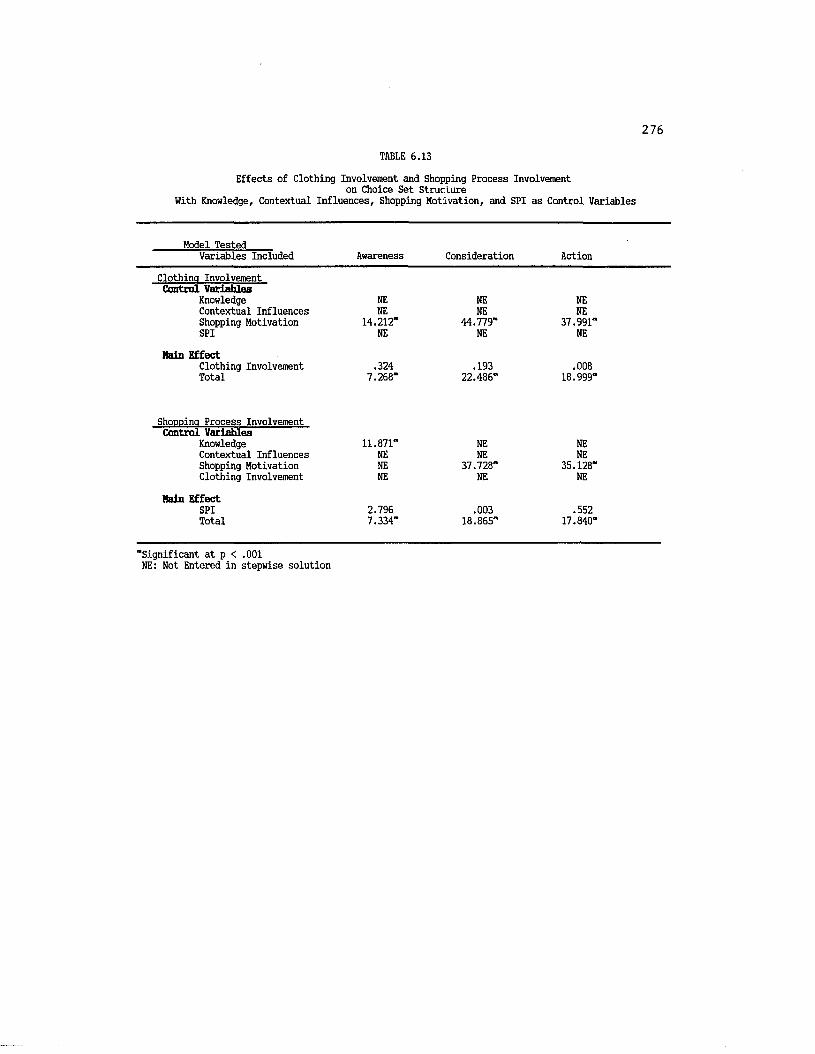
276TABLE 6.13
Effects of Clothing Involvement and Shopping Process Involvement on Choice Set Structure
With Knowledge, Contextual Influences, Shopping Motivation, and SPI as Control Variables
Model TestedVariables Included Awareness Consideration Action
Clothina Involvement Central Variables
Knowledge NE NE NEContextual Influences NE NE NEShopping Motivation 14.212" 44.779* 37.991*SPI NE NE NE
Main EffectClothing Involvement .324 .193 .008Total 7.268* 22.486* 18.999*
Shonnina Process Involvement Control Variables
Knowledge 11.871* NE NEContextual Influences NE NE NEShopping Motivation NE 37.728“ 35.128*Clothing Involvement NE NE NE
Main EffectSPI 2.796 .003 .552Total 7.334* 18.865" 17.840"
"Significant at p < .001 NE: Not Entered in stepwise solution
277
To summarize, involvement is related to size of awareness set as
shown by the regression and ANOVA analyses. However, when other
important explanatory variables are included, particularly motivation
and knowledge, the effects of involvement are not significant. Using
the stepwise regressions and ANCOVAs as stronger tests of these
hypotheses, the hypotheses are rejected. However, partial support is
provided by the simple regressions and ANOVAs which indicate involvement
to be related to awareness set size.
H19: Shopping Experience and Retailer Knowledge
This hypothesis states individuals who have greater experience
will also have more knowledge. As in Hypothesis H16, experience was
operationalized as the length of time the respondent had lived in the
city. Regression analyses supported this hypothesis (F-ratio = 5.8242,
p < .001) and approximately 9.8% of the variance in knowledge was
accounted for by the amount of time the individual had lived in the
city. Hence, this hypothesis is supported.
H20: Retailer Knowledge and Choice Sets
Individuals exhibiting high levels of knowledge are also expected
to have greater numbers of retailers in their awareness set. Regression
analyses reveal a significant relationship (F-ratio = 12.7031, p < .001)
with knowledge explaining approximately 5% of the variance in size of
awareness set. The beta coefficient is positive and significant and
278
supports the hypothesis.
An alternative analysis was performed by analyzing the differences
in individuals' choice sets who are either high or low in product
knowledge. As shown in Table 6.14, knowledge is significantly related
to size of awareness set with individuals high in knowledge exhibiting
larger awareness sets. However, when other possible explanatory
variables are introduced and controlled for as covariates, the effect of
knowledge on choice set size is nullified. Table 6.15 presents ANCOVA
results when contextual influences and clothing involvement are also
included in the model. At the awareness set stage, contextual
influences are significantly related to awareness set size and knowledge
is not significant. At the consideration and action set stages,
clothing involvement is significant and knowledge no longer has a
significant effect.
Thus, in conclusion, the hypothesis is supported by separate
analyses which examine only the relationship between knowledge and size
of awareness set. However, when other variables are introduced,
knowledge is not significantly related to awareness set size.
Therefore, this hypothesis is partially supported knowledge is judged to
exert a marginal effect on size of awareness set.
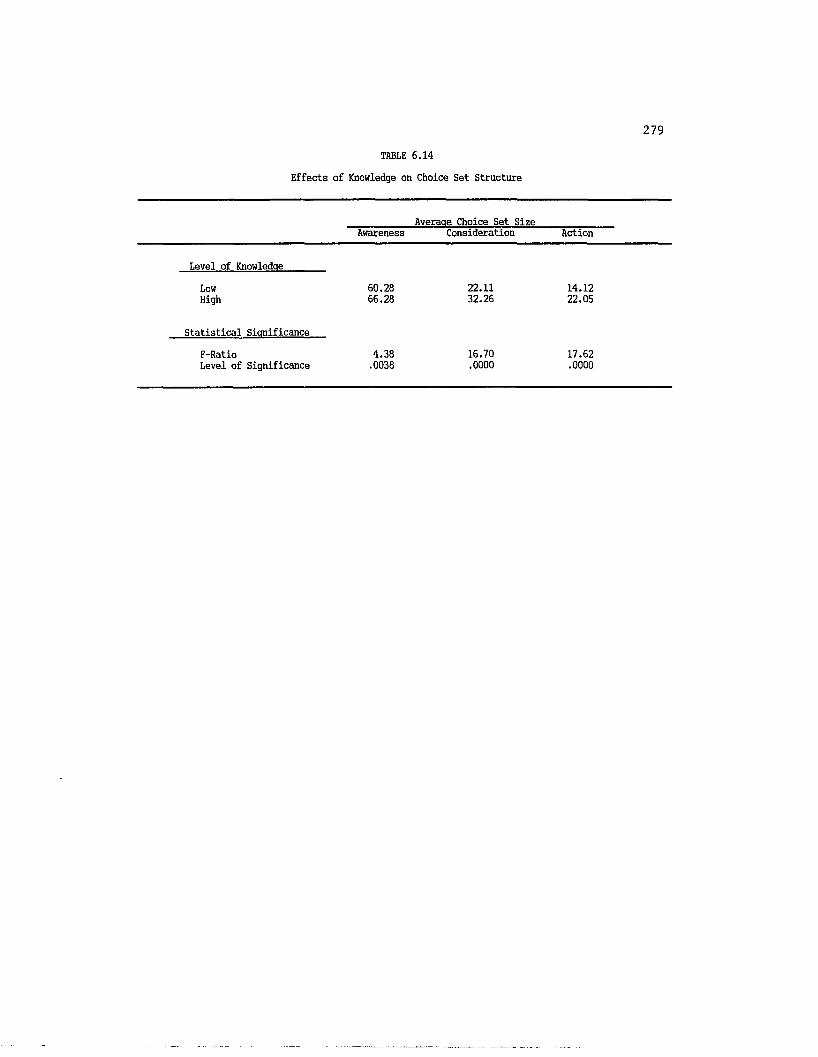
279TABLE 6.14
Effects of Knowledge on Choice Set Structure
Average Choice Set SizeAwareness Consideration Action
Level of Knowledge_______
Low 60.28 22.11 14.12High 66.28 32.26 22.05
Statistical Significance
F-Ratio 4.38 16.70 17.62Level of Significance .0038 .0000 .0000
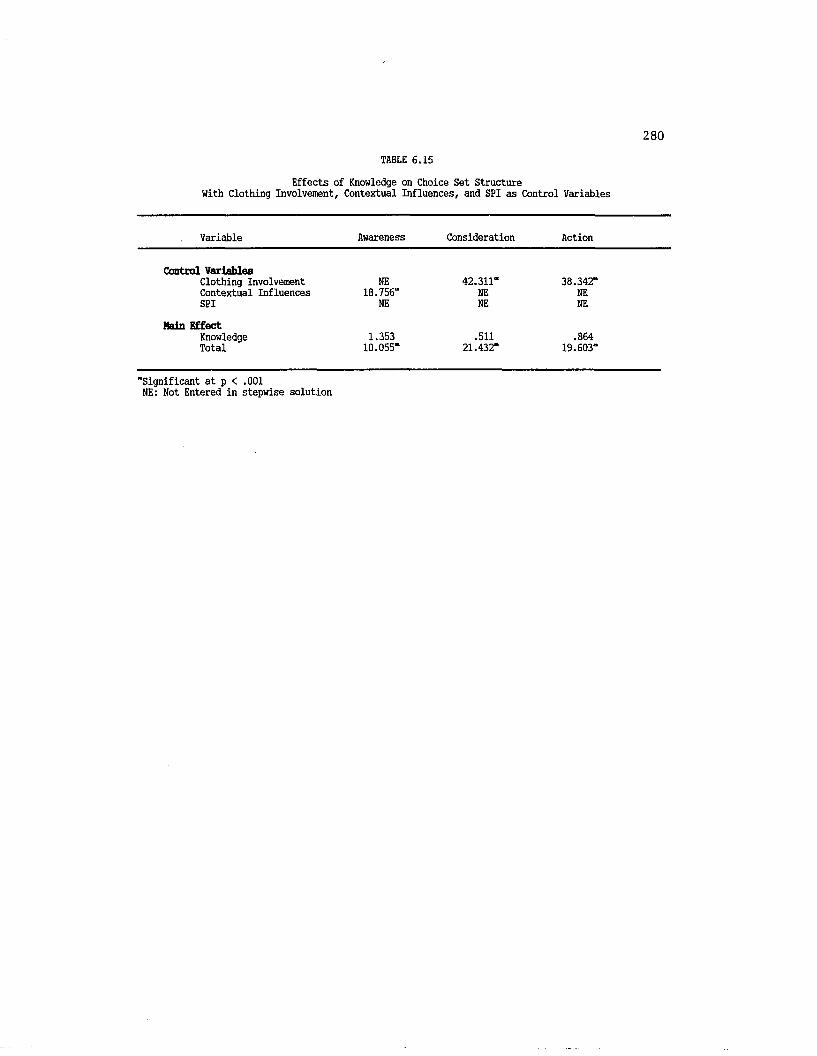
280TABLE 6.15
Effects of Knowledge on Choice Set Structure With Clothing Involvement, Contextual Influences, and SPI as Control Variables
Variable Awareness Consideration Action
Control VariablesClothing Involvement NE 42.311" 38.342"Contextual Influences 18.756“ NE NESPI NE NE NE
Main EffectKnowledge 1.353 .511 .864Total 10.055* 21.432“ 19.603“
"Significant at p < .001 NE: Not Entered in stepwise solution
281
H21: Influence of Contextual Variables
This hypothesis predicted contextual influences to be
significantly related to the amount of reduction in size of choice set
as well as aggregate choice set size. Regression analysis was performed
to observe the effects of contextual variables on the amount of
reduction from one stage of the choice set formation process to the
next. Results from these analyses show contextual influences to be non
significant in predicting reduction in choice sets.
However, contextual influences are significantly related to
aggregate choice set size. As reflected in the sign of the beta
coefficients presented in Table 6.16, time available for shopping,
consumer1s perceptions of the acceptability of stores, and the amount of
money they have available for shopping influence the number of stores
included in the choice sets as predicted.
Therefore, this hypothesis is partially supported as contextual
influences are related to overall choice set size but not significantly
related to the amount of reduction in choice sets.

282TABLE 6.16
Regression Analysis of Contextual Influences As Predictor of Choice Set Size
Choice Set Process Stage Variable Beta Significance
Awareness Set Stage
Time and Retail Outlet Availability -.9383 .0046Monetary Constraint -1.7329 .0156Constant 83.9344 .0000
Adjusted R2 = .07 F = 9.4400Significance = .0001
Consideration Set Stage
Time and Retail Outlet Availability -.7159 .0146Monetary Constraint -1.7205 .0069Constant 44.3311 .0000
Adjusted R2 = .06 F = 9.0483Significance = .0002
Action Set Stage
Time and Retail Outlet Availability -.5134 .0227Monetary Constraint -1.1519 .0184Constant 29.8715 .0000
Adjusted R2 = .05 F = 7.3171Significance = .0008
283
Structural Model Results
Several of the hypotheses and the proposed patronage structural
model presented in Chapter Two were tested using LISREL VI (Joreskog and
Sorbom 1983). Model estimation was conducted using a correlation matrix
since the objective of the research was to assess associative
relationships as opposed to making causal inferences.
The constructs were measured using single indicators since most of
the concepts contained a large number of indicators (ranging from 4 to
17 per construct) making estimation difficult. Therefore, for product
involvement, shopping process involvement (SPI), shopping motivations,
knowledge and contextual influences summed scale scores were utilized as
single indicators of the constructs. Experience was operationalized as
the amount of time the individual had lived in the city and was chosen
as this variable would account for differences in knowledge regarding
available retail outlets. It was assumed that individuals living in the
city for a greater length of time would have greater cognizance of the
retail market structure of the city. The final construct, choice set
formation process was measured using the total number of retailers
chosen for individuals' awareness, consideration, and action sets.
Using these variables, three structural models were estimated.
All models are identical except the choice set formation process
variable is changed depending on the stage of the process being studied.
All measurement indicators were set to 1.0 and corresponding error
matrices were fixed to 0.0. While it is admitted that these constructs
do contain error, this method was chosen to allow for the best

284
possibility of uncovering hypothesized relationships. All of the summed
scales demonstrated adequate reliability with all measures displaying
Cronbach alpha of .70 or greater (refer to Table 6.17 for a summary of
summed scale reliabilities). Since these constructs do have good
reliability, the addition of measurement error was not expected to
substantially change the model estimates.
Overall Model Fit
The overall fit of the proposed patronage model was estimated by
four criteria. The first step was an examination of the chi-square
statistic which indicates the correspondence between the observed and
reproduced correlation matrices. The second test was based on the
reported goodness-of-fit measures (GFI and AGFI) proposed by Joreskog
and Sorbom (1983) and the normed fit index (NFI) developed by Bentler
and Bonett (1980). As discussed in Chapter Three, the GFI and AGFI
indicate the amount of variances and covariances jointly accounted for
by the hypothesized model while the NFI gives the relative decrease in
lack of fit between two nested models, one less restricted than the
other.) Thus, these indices signify the incremental fit of the model and
the reported index values can be interpreted as similar to coefficients
of determination for regression models. The root mean square residual
which indicates the average of the residual variances and covariances
was also used. The final measure was to calculate R2 values for the
overall model and each structural equation to assess the explanatory
power of the structural equations.

285TABLE 6.17
Summed Scale Reliabilities
Scale Cronbach Alpha
Product Involvement (8 items) .88
Shopping-Process Involvement (12 items) .79
Shopping Motivations (60 items) .82
Knowledge (6 items) .96
Contextual Influences (6 items) .72
286
As shown in Table 6.18 overall model fit was quite good as
revealed by the chi-square statistic, fit indices, and Ra values.
Additionally, the measures of relative fit (GFI = .980, AGFI = .930, NFI
= .97 for each model) were all above the established criterions. The
RMSR values were low (RMSR = .025 for each model) and within the stated
range of less than .07. The Rz values were quite high with an overall
fit of .72. Since the comprehensive models of patronage behavior have
been conceptual rather than empirical, there are no comparisons which
can be made to prior patronage model studies. However, the amount of
variance accounted for by the proposed model is indeed an indication
that the proposed relationships exist and contribute to the developed
knowledge base.
Structural Model
The standardized parameter estimates are also presented in Table
6.18. Examination of the coefficients for each model reveal a
substantial number of significant relationships. While the linkage
between product involvement and experience was not formally
hypothesized, the direction and magnitude of the relationship is
supported. For each model, individuals' level of product involvement is
highly related to their experience. In testing the knowledge
relationships, H16 and H19 posited that product involvement and
experience, respectively, would be positively related to knowledge. The
models reveal product involvement to be related to knowledge for each
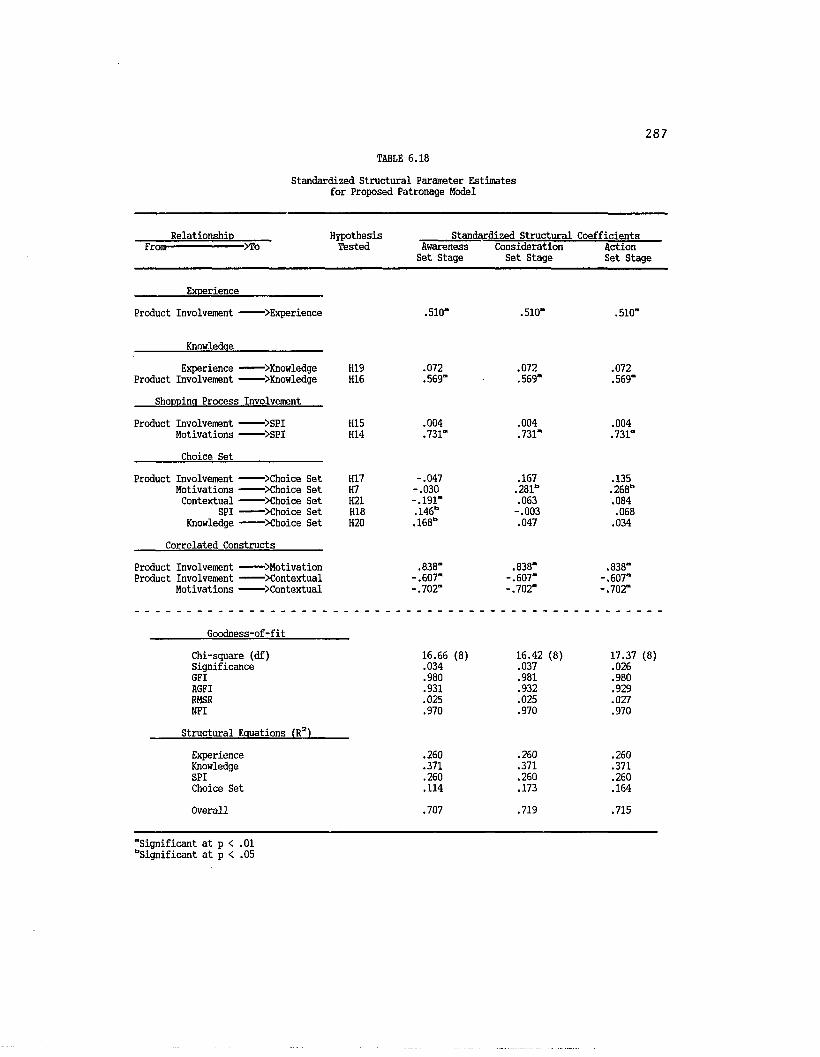
287TABLE 6.18
Standardized Structural Parameter Estimates for Proposed Patronage Model
RelationshiD HypothesisTested
Standardized Structural CoefficientsAwareness Set Stage
Consideration Set Stage
Action Set Stage
Exoerience
Product Involvement---- Experience .510" .510" .510"
Knowledae
Experience >Knowledge H19 .072 .072 .072Product Involvement >Knowledge H16 .569" .569" .569"
ShoDDina Process Involvement
Product Involvement ---- >SPI H15 .004 .004 .004Motivations---- >SPI H14 .731" .731" .731"
Choice Set
Product Involvement — >Choice Set H17 -.047 .167 .135Motivations 1 >Choice Set H7 -.030 .281b .268*"Contextual Choice Set H21 -.191" .063 .084
SPI — — >Choice Set H18 .146b -.003 .068Knowledge---->Choice Set H20 .168b .047 .034
Correlated Constructs
Product Involvement ■■ ^Motivation .838" .838" .838"Product Involvement >Contextual -.607“ -.607“ -.607"
Motivations---- Contextual -.702" -.702" -.702"
Goodness-of-fit
Chi-square (df) 16.66 (8) 16.42 (8) 17.37 (8)Significance .034 .037 .026GFI .980 .981 .980AGFI .931 .932 .929RMSR .025 .025 .027NFI .970 .970 .970
Structural Eauations (Rz)
Experience .260 .260 .260Knowledge .371 .371 .371SPI .260 .260 .260Choice Set .114 .173 .164
Overall .707 .719 .715
"Significant at p < .01 “"Significant at p < .05

288
stage of the choice set process, however the relationship between
experience and knowledge was not supported.
H14 and H15 concerned the relationships between shopping
motivations, product involvement and shopping process involvement (SPI).
It was proposed that shopping motivations and product involvement would
be directly related to SPI. H14 which proposed the relationship between
motivations and SPI was confirmed for the three models while the linkage
between product involvement and SPI was not supported.
Five hypotheses were proposed to link other constructs to choice
set formation. Specifically, H7 proposed shopping motivations to be
positively related to size of choice set. Individuals who exhibited
greater overall motivations to shop were expected to report larger
choice sets. This proposition was supported for the consideration and
action set models, however, no relationship was found between
motivations and awareness set size.
Shopping process involvement was also proposed to be related to
choice set size (H18). This hypothesis received partial support as SPI
was found to be related to size of awareness set but not to
consideration or action sets. Additionally, H17 proposed product
involvement to be positively related to choice sets. This hypothesis
was rejected for each of the choice set models and it is concluded that
product involvement is not directly related to size of the choice sets.
Knowledge was also proposed to be positively related to size of
choice sets (H20). This hypothesis received partial support as
knowledge was significantly related to awareness set size but not
significantly related to size of consideration or action sets. Finally,

289
contextual influences were further hypothesized to be related to size of
choice sets (H21). Contextual influences were proposed to reduce the
size of individuals' choice sets as a result of time, money, or retail
structure constraints. This hypothesis was supported only for the
awareness set stage and contextual influences do indeed reduce the size
of individuals' awareness sets. However, contextual influences are not
significantly related to size of consideration or action sets.
Table 6.19 provides a summary of the hypotheses which were tested
by the structural equation models. Indication is given for each model
whether the proposed relationship was supported or rejected. To
summarize, the relationships between product involvement and SPI;
product involvement and choice set size; and product experience to
knowledge were rejected for each of the three choice set stages. Thus,
H15, H17, and H19 were not supported by the structural equation models.
The relationships between product involvement and knowledge (H16);
and motivations and SPI (H14) were confirmed for each of the three
choice set stages. Therefore, these hypotheses are supported. All
other hypothesized relationships received mixed support depending upon
the choice set stage considered. The significant relationships and the
structural coefficients are presented in Figures 6.3, 6.4 and 6.5.
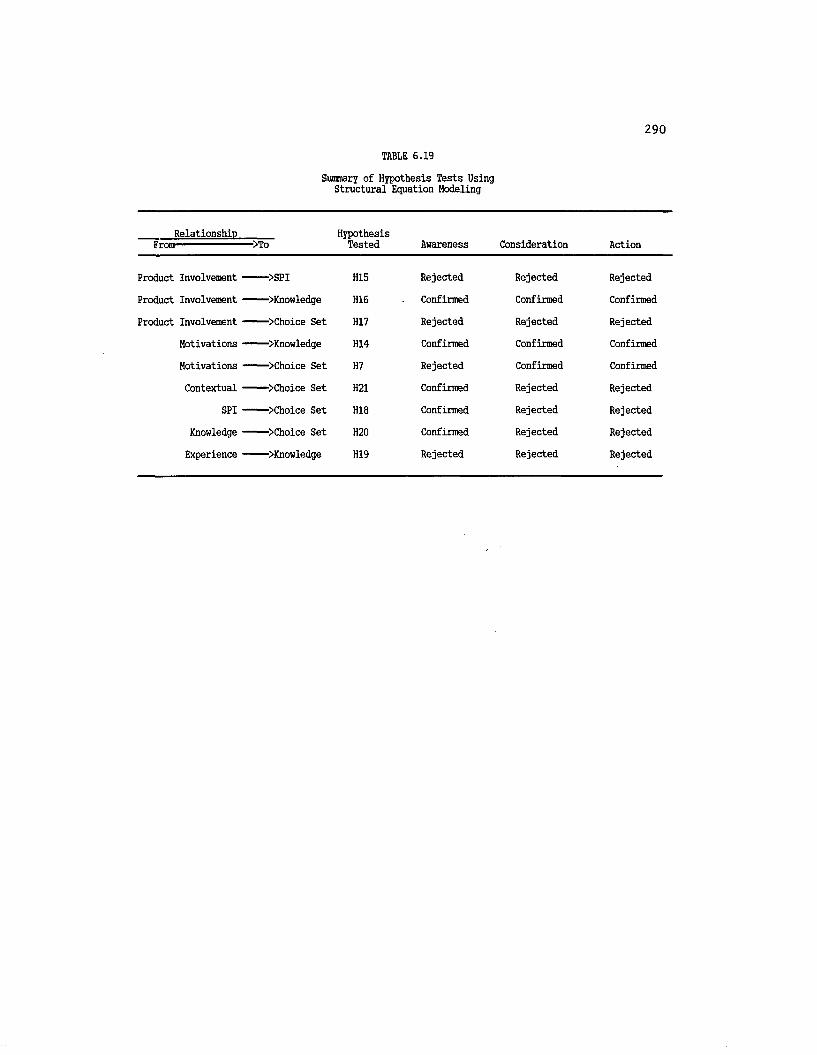
290TABLE 6.19
Summary of Hypothesis Tests Using Structural Equation Modeling
Relationship______ HypothesisFrom- — >To Tested Awareness Consideration Action
Product Involvement ---- >SPI H15 Rejected Rejected Rejected
Product Involvement >Knowledge H16 Confirmed Confirmed Confirmed
Product Involvement >Choice Set H17 Rejected Rejected Rejected
Motivations — — >Knowledge H14 Confirmed Confirmed Confirmed
Motivations ■— >Choice Set H7 Rejected Confirmed Confirmed
Contextual >Choice Set H21 Confirmed Rejected Rejected
SPI ■■■" >Choice Set H18 Confirmed Rejected Rejected
Knowledge ---- >Choice Set H20 Confirmed Rejected Rejected
Experience — >Knowledge H19 Rejected Rejected Rejected
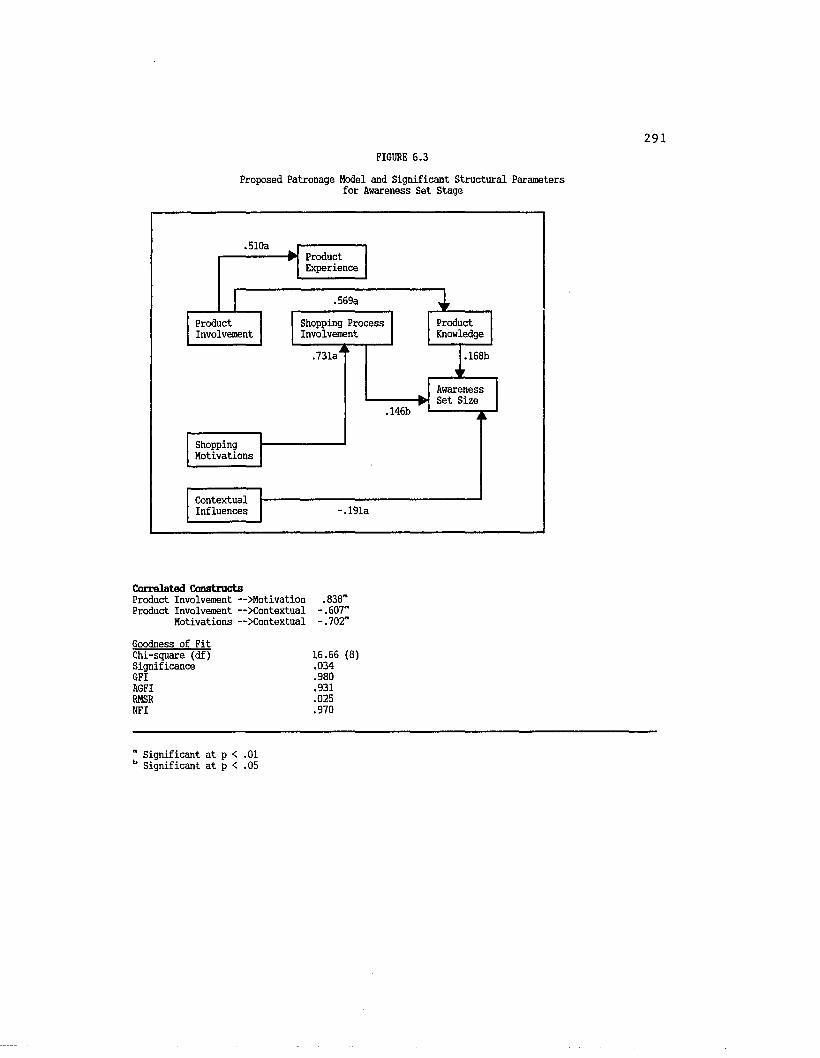
291FIGURE 6.3
Proposed Patronage Model and Significant Structural Parametersfor Awareness Set Stage
510a
569a
.731a 168b
-.191a
ProductKnowledge
Awareness Set Size
ProductExperience
ProductInvolvement
ContextualInfluences
ShoppingMotivations
Shopping Process Involvement
Correlated ConstructsProduct Involvement — Motivation .838“Product Involvement -->Contextual -.607"
Motivations — >Contextual -.702“
Goodness of FitChi-square (df) 16.66 (8)Significance .034GFI .980AGFI .931RMSR .025NFI .970
" Significant at p < .01b Significant at p < .05
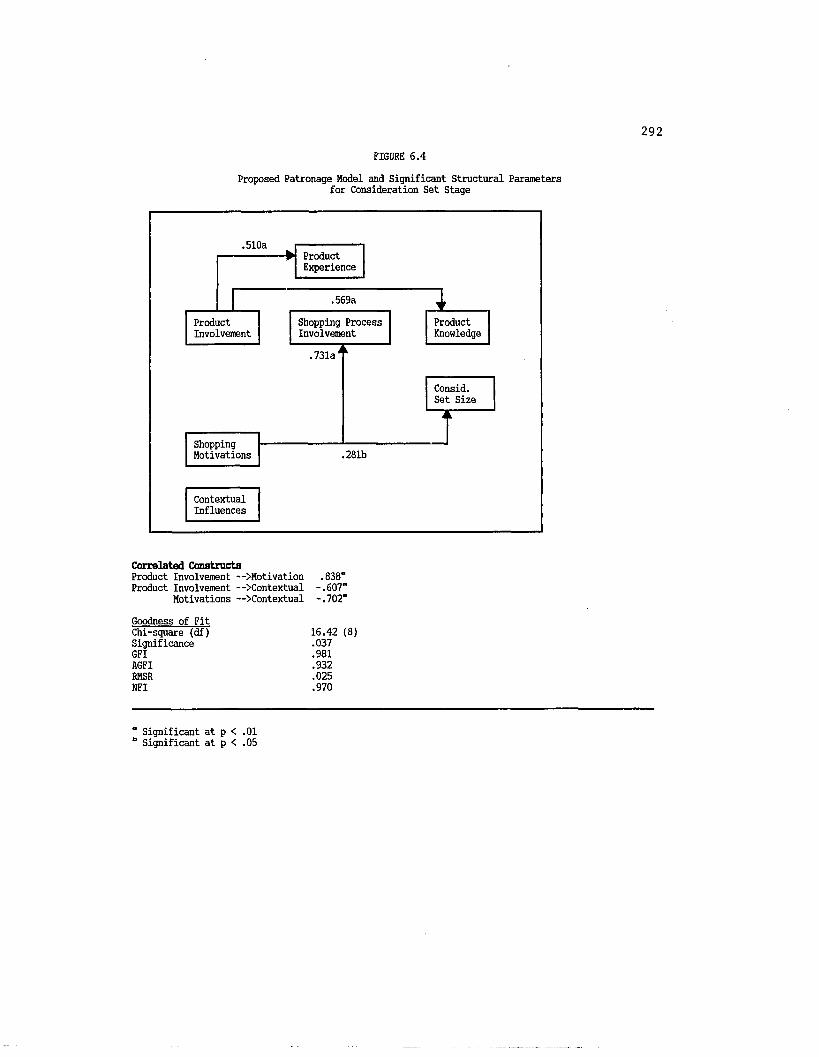
292FIGURE 6.4
Proposed Patronage Model and Significant Structural Parametersfor Consideration Set Stage
510a
.569a
281b
ProductKnowledge
ProductExperience
Consid. Set Size
ShoppingMotivations
ProductInvolvement
Shopping Process Involvement
Correlated ConstructsProduct Involvement — Motivation .838“Product Involvement — Contextual -.607“
Motivations — Contextual -.702“
Goodness of FitChi-square (df) 16.42 (8)Significance .037GFI .981AGFI .932RMSR .025NFI .970
“ Significant at p < .01b Significant at p < .05
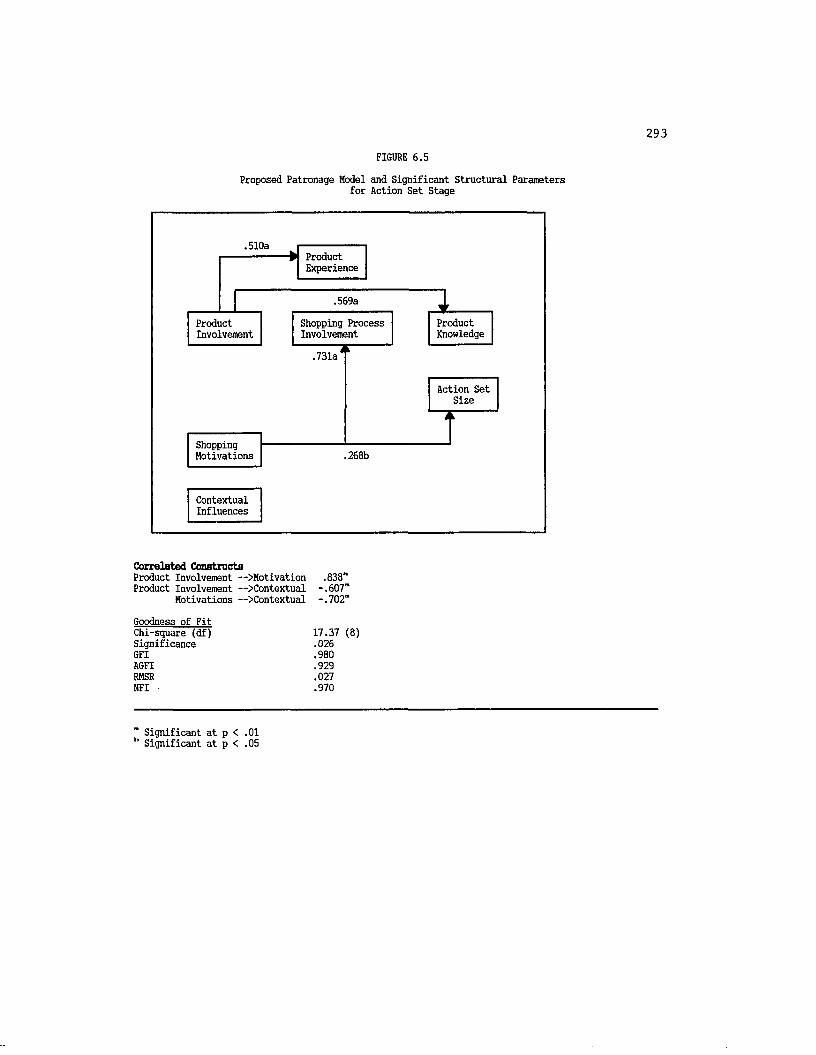
293FIGURE 6.5
Proposed Patronage Model and Significant Structural Parametersfor Action Set Stage
510a
.569a
■ 731a
■ 268b
ProductKnowledge
ProductExperience
Action Set Size
ProductInvolvement
ShoppingMotivations
ContextualInfluences
Shopping Process Involvement
Correlated ConstructsProduct Involvement — Motivation .838"Product Involvement --Contextual -.607“
Motivations — Contextual -.702"
Goodness of FitChi-square (df) 17.37 (8)Significance .026GFI .980AGFI .929RMSR .027NFI ■ .970
" Significant at p < .01b Significant at p < .05
294
Summary
Proposed Motivation Dimensionality
Specifically, hypotheses HI to H4 proposed the dimensionality of
motivations and were partially confirmed by three independent
confirmatory factor models and a second-order confirmatory factor model.
Therefore, it is concluded that the hypothesized dimensions of
functional, symbolic, and experiential do indeed exist and account for
variations among the 17 hypothesized factors.
Motivation and Attribute Importance Relationship
Hypotheses H5 and H6 related motivation dominance to attribute
importance ratings and were partially supported by a correlation
analysis. Many of the hypothesized relationships were confirmed. The
functional motivation types reported product variety, and sales staff
attributes to be important to them. Therefore, H5 is partially
confirmed since the price correlation does not achieve practical
significance. Symbolic and experiential motivation types reported sales
staff attributes to be important which again partially confirms H6.
Shopping Process Involvement Dimensionality
Hypothesis H13 proposed the dimensionality of the shopping process
involvement scale and was partially confirmed by confirmatory factor
analysis. H14, testing the relationship between motivations and SPI,
was confirmed by both individual tests and the structural model.

295
Knowledge Relationships
Two hypotheses were proposed to relate model constructs to amount
of knowledge about the product. Specifically, H16 posited that
individuals who are involved with the product class will exhibit greater
knowledge. Similarly, H19 proposed that individuals who had greater
experience would also display greater knowledge about the product.
These hypotheses were tested using both regression analysis as well as
the structural model. The relationship between product involvement and
knowledge was confirmed in both empirical tests, however the linkage
between experience and knowledge was only supported using simple
regression. Accordingly, H16 is confirmed while H19 is only partially
confirmed.
Shopping Process Involvement Relationships
Hypotheses H14 and H15 proposed shopping motivations and product
involvement, respectively to be related to SPI. H14 which related
motivations to SPI was tested using regression and the structural model.
Results indicate the hypothesis is confirmed by individual tests as well
as the structural model. Hypothesis H15 was also tested using
regression analysis and the structural model, however, the relationship
between product involvement and SPI was only partially supported by the
regression analyses and rejected by the structural model. Therefore, it
is concluded that the relationship between motivations and SPI is
supported but the linkage between product involvement and SPI is not.

296
Choice Set Formation Process Relationships
The remaining ten hypotheses relate the model constructs to the
choice set formation process. Hypotheses H8, H9, and H10 pertained to
the relationships between dominant motivations and choice set structure
specialization. No differences were found between motivation dominance
groups in the types of retailers which were included in their choice
sets.
Hypotheses Hll and H12 postulated that dominant motivations would
be related to the amount of reduction exhibited by individuals at each
stage of the choice process. Again, no differences were found between
motivation types. Thus, it appears that dominant motivations are not
related to either the types of retailers included in choice sets nor to
the amount of reduction individuals' display.
The proposed relationship between overall shopping motivation and
size of choice set was tested both independently and with the structural
model. Overall, this hypothesis (H7) was confirmed in independent
testing but received only partial support in the structural model. In
the structural models, shopping motivations were directly related to the
size of the consideration and action sets but not significant to size of
the awareness set. Therefore, it is concluded that motivations are
indeed related to size of choice sets, however, when other variables are
included in the model at the awareness set stage, motivations are not
significantly related.
Both shopping process involvement (SPI) and product involvement
were proposed to be related to the size of the choice sets.
297
Specifically, H17 and H18, respectively, proposed SPI and product
involvement to be directly related to size of choice sets. These
hypotheses were tested using regression, ANOVA, ANCOVA, and the
structural model. To review, the relationship between SPI and choice
sets partially supported in individual testing but were rejected by the
structural models. Hypothesis H18 was partially supported by the
individual analyses and the awareness set structural model, but rejected
by the consideration and action set structural models. Therefore, using
the structural models as stronger tests of these hypotheses, it is
concluded that involvement does not exhibit a relationship with size of
choice sets and these hypotheses are rejected.
It was further proposed that knowledge would be directly related
to size of the awareness set with individuals who have greater knowledge
to also report larger numbers of retailers in their awareness sets.
This hypothesis (H20) was tested independently as well as with the
structural models and it is concluded that the hypothesis receives
partial support. In individual analyses, knowledge was found to be
related to size of choice set and this relationship was observed for the
awareness set model. Since the hypothesis referred only to the
association between knowledge and awareness set, this hypothesis is
accepted. However, knowledge does not exhibit a significant
relationship to size of consideration or action sets.
The final model relationship posited contextual influences to be
related to choice set size with context reducing the numbers of
retailers included in the choice sets. Again, this hypothesis was
tested independently and with the structural models. In the awareness

set structural model, this relationship was supported as context did
indeed demonstrate a negative linkage to number of retailers included in
the awareness set. However, this hypothesis was not supported for the
consideration or action sets. Individual regression analyses which
tested this relationship resulted in partial support of the hypothesis.
Therefore, hypothesis H21 is supported.
Tables 6.20 and 6.21 report summary results of the hypothesis
tests for both individual and structural model analyses. Table 6.20
reviews the results for all tested hypotheses while Table 6.21
summarizes only those hypotheses which were tested both individually and
with the structural models.
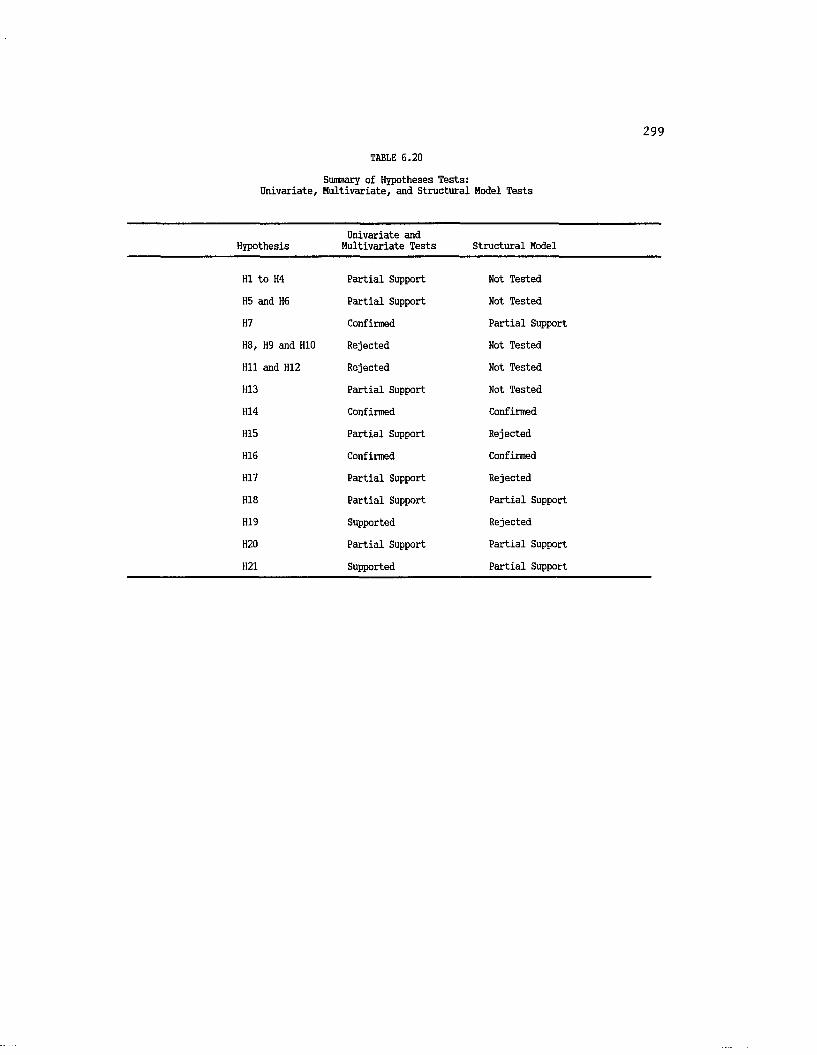
299TABLE 6.20
Summary of Hypotheses Tests:Univariate, Multivariate, and Structural Model Tests
HypothesisUnivariate and Multivariate Tests Structural Model
HI to H4 Partial Support Not Tested
H5 and H6 Partial Support Not Tested
H7 Confirmed Partial Support
H8, H9 and H10 Rejected Not Tested
Hll and H12 Rejected Not Tested
H13 Partial Support Not Tested
H14 Confirmed Confirmed
H15 Partial Support Rejected
H16 Confirmed Confirmed
H17 Partial Support Rejected
H18 Partial Support Partial Support
H19 Supported Rejected
H20 Partial Support Partial Support
H21 Supported Partial Support
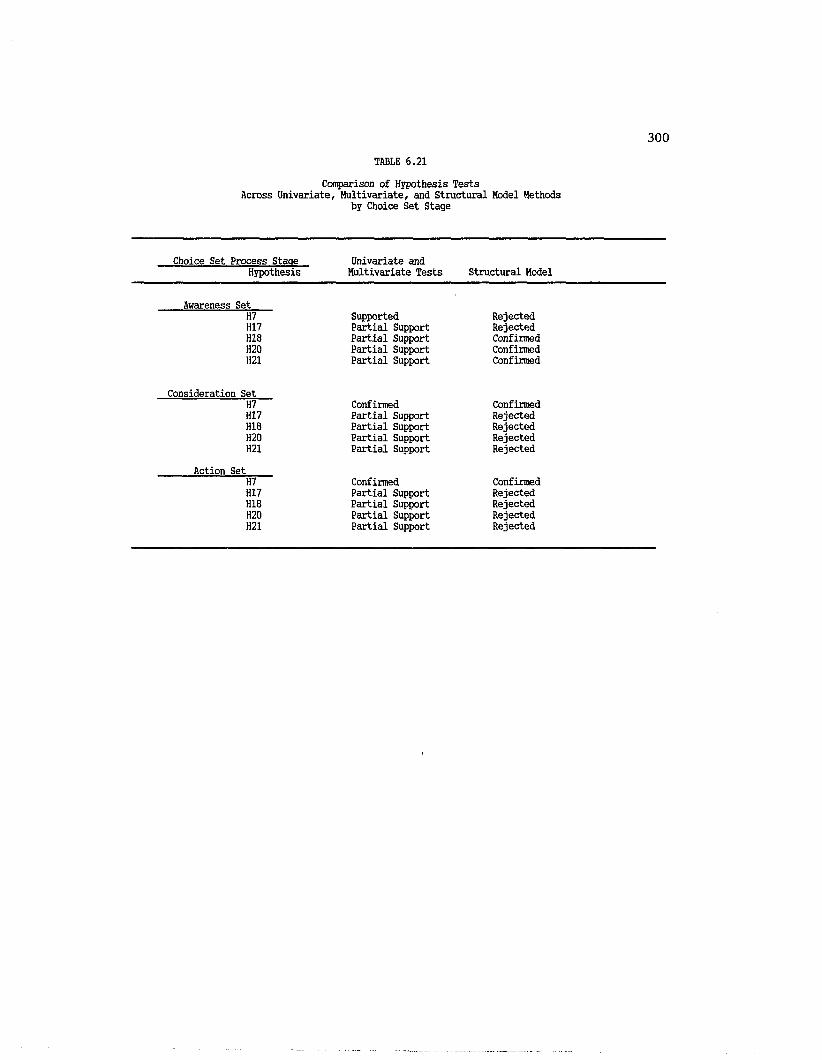
300TABLE 6.21
Comparison of Hypothesis Tests Across Univariate, Multivariate, and Structural Model Methods
by Choice Set Stage
Choice Set Process Stage Univariate andHypothesis Multivariate Tests Structural Model
Awareness SetH7H17H18H20H21
Supported Partial Support Partial Support Partial Support Partial Support
RejectedRejectedConfirmedConfirmedConfirmed
Consideration Set H7 H17 H18 H20 H21
Confirmed Partial Support Partial Support Partial Support Partial Support
ConfirmedRejectedRejectedRejectedRejected
Action SetH7H17H18H20H21
Confirmed Partial Support Partial Support Partial Support Partial Support
ConfirmedRejectedRejectedRejectedRejected
CHAPTER SEVEN
Conclusions, Implications, and Recommendations for Future Research
Chapter Seven summarizes first the results of the dissertation
research. The research questions which prompted the study are discussed
in the conclusions section. Limitations of the dissertation are
addressed followed by implications of the research and recommendations
for future research.
Conclusions
Consumer Shopping Motivations
The dissertation attempted to answer three research questions.
The first investigated the motivation taxonomy and the antecedent states
which form consumers' perceptions of retailer attributes, giving rise to
the varied patronage behavior of store and non-store retailer choice.
Before this research question could be specifically addressed it was
necessary to first develop a comprehensive measure of shopping
motivations.
The scale development process consisted of focus group interviews
and three stages of data collection. During focus group interviews,
consumers' incentives to shop, read catalogs and visit retailers were
explored. Based on these results as well as an exhaustive review of the
literature on motivations and patronage behavior, an initial measure
composed of 154 items was developed.
301
302
This scale was refined and tested through subsequent data
collections and analyses. The final shopping motivation scale consisted
of 60 items measuring 17 subdimensions. The subscales and overall
measure meet all reliability and validity criteria which justified its
use in further analyses.
The domain of shopping motivations was proposed to include three
primary motivations: functional, symbolic, and experiential. Functional
needs are those which arise from a consumption-related problem. For
instance, consumers' who are in the purchase decision process for a
major durable item, such as an automobile, are expected to exhibit an
extended decision process which includes information search, alternative
generation and evaluation and final product (outlet) choice. If the
consumer is primarily motivated by functional drives, the individual engages in the purchase process to obtain the product, receive price and
other information, and/or to engage in the negotiation process with
retailers.
Symbolic motivations represent the consumer's desire to enhance
self-image, engage in appropriate social behavior, obtain social rewards
and receive recognition through association with retailers. Thus, for
the consumer shopping for an automobile, if symbolic drives or needs are present the consumer will visit certain dealerships who can provide them
with differing satisfactions than described above. For example, if a
consumer wishes to receive gratification of affiliation needs, they may
choose a dealership that is known for its friendly sales staff and warm,
low pressure atmosphere. Thus, other needs can be fulfilled through
shopping behavior in addition to the attainment of a product or other

303
functional needs.
The final dimension, experiential needs, derive from an individual's desire to directly participate in life's events. These
drives include a need for physical exercise, cognitive and sensory
stimulation, variety, recreation, and diversion from everyday
activities. Just as an individual may derive functional or symbolic
fulfillment from shopping, experiential motives can also be gratified.
For instance, the consumer shopping for an automobile may perceive the
retailer interactions to fulfill the individuals' need for recreation.
They may enjoy the purchase process and view it as a form of recreation.
Motivations were employed as determinants of attribute importance
perceptions and retail choice. A major void in patronage research stems
from the inability to explain how attribute importance perceptions are
formed. Problems arise when only attributes are used to predict choice
behavior since these attributes may change over time and are regarded as
unstable. In this research, shopping motivations were found to be
related to attribute importance perceptions. Therefore, motivations
provide conceptual clarity to patronage models by extending the scope of
individual determinants leading to shopping and patronage behavior.
Moreover, consumer shopping motivations represent enduring traits of the
individual, meeting the needs expressed in prior patronage research for
inclusion of stable individual characteristics relating to attribute
importance perceptions and choice behavior.
Finally, the construct of shopping motivations broadens the
knowledge base in patronage research. By examining individuals' drives
or motivations to shop, this study truly measures an underlying
304
structure which has often been termed shopping orientations. A
limitation of the orientation studies is their failure to use direct
measures of an individuals' impetus to engage in shopping behaviors.
However, the shopping motivation construct allows a true measure of
these underlying drives or motives.
The dissertation proposed the three principal dimensions of
motivation to contain certain subdimensions which were analyzed using
three individual confirmatory factor analyses. Additionally, since a
second-order factor model was hypothesized with 17 proposed
subdimensions derived from three primary dimensions, a second-order
confirmatory factor analysis was performed. These analyses resulted in
general support of the proposed models.
Specifically, the three confirmatory factor models discussed in
Chapter Four revealed adequate fit of the proposed models and supported
the proposed hypotheses. However, the second-order factor analysis was
not unequivocal, providing only partial support for the proposed
structure. The functional dimension was adequately accounted for by the
proposed subdimensions. Many of the remaining subdimensions, however,
exhibited cross-loadings to unhypothesized primary factors.
Additionally, instabilities were encountered when the second-order model
contained primary factor correlations as well as cross-loadings. Thus,
the proposed dimensionality of motivations is partially supported but
additional research is needed to further specify the higher-order factor
structure.
In conclusion, motivations do indeed provide a representation of
an individual difference construct which can be employed to understand
305
why people shop. Motivations can also be used as a basis for
understanding individual's drives which lead to varied retail choice
behavior. This research links patronage behavior to stable individual
characteristics which can then be related to attribute importance
ratings and retail outlet choice.
Characteristics of the Choice Set Formation Process
A second research question asked how the choice set formation
process is characterized when non-store retailers are included. Before
the choice set formation process can be described with respect to non
store retailer inclusion, it is first necessary to discuss choice sets
from a general perspective. This question was addressed in Chapter Five
where aggregate measures of choice set structure were presented and
related to demographic variables.
Viewing the patronage decision as partly a cognitive process
results in many advantages for the academician and retailer.
Specifically, the number of alternative retailers consumers typically
include in their choice sets can be elicited. Secondly, the choice sets
can be examined with respect to the types of retailers individuals
include. Do consumers concentrate their shopping behavior with certain
specific types of retailers or do they display a full range of
alternative retailer types? Finally, the cognitive simplification
process exhibited by individuals who reduce the number of alternatives
considered at each consecutive choice stage can be analyzed. Are there
any similarities among individuals in the ways in which they simplify
306
the retail choice decision?
The choice set formation process consists of four-stages:
awareness of available alternatives, consideration of acceptable
alternatives, enumeration of alternatives the individual would be likely
to contact, and final outlet choice. The first three stages of this
process were elicited from respondents in the dissertation research.
These stages were termed awareness, consideration and action.
In analyzing the choice set results an intriguing finding across
choice set stages is the amount of variance individuals exhibit in the
total number of retailers which comprise their sets. Respondents were
allowed to choose from among 162 available retail outlets. The variance
demonstrated by individuals1 choice sets is exemplified by both the mean
numbers of retailers included as well as the range of responses. At the
awareness set stage, the average number of retailers included was 63
while sets ranged from 17 to 143. At the consideration set stage, an
average of 26 retailers were included although individuals reported from
1 to 128 retailers in their sets. Finally, at the action set stage, the
mean number of retailers included was 17 with a range of 1 to 66.
Therefore, from an inspection of these numbers alone, it is clear
individuals demonstrate extreme variation in the number of retailers
contained in their choice sets. A fruitful area for exploration
concerns the ability of retailers to incorporate this finding in their
marketing strategy plans. For instance, some individuals do indeed
include a small number of retailers in their choice sets. This is an
indication that many consumers develop a set of retailers to patronize
and perhaps represents retail outlet loyalty.
307
Wide variation across consumers is also observed in the types of retailers individuals include in their choice sets. Research
propositions specified functional shoppers to exhibit varied choice sets
while symbolic and experiential shoppers would display more selective
choice sets. These hypotheses were not supported as no differences were
found across the motivation groups in the types of retailers which
comprised their choice sets. For each motivation group, the number of
retailers of each type included were very similar and the symbolic and
experiential groups did not exhibit greater selectivity as proposed.
The catalog retail outlets were acceptable to many consumers. All
of the outlets were known to at least a few respondents and certain
catalog retailers were known to the majority of the sample. For
instance 170 respondents reported they were familiar with L.L. Bean and
211 were aware of Spiegel. These awareness numbers are comparable to
those of the regional department stores and specialty outlets located in
the area. Thus, it appears that the larger catalog outlets have
generated a high level of awareness among the sample population.
But, retailers are concerned with transferring awareness to
patronage. The rate of retention for catalog retailers from the
awareness set to the action set was quite high. Retention percentages
were in range from .06 to .60 and the mean retention percentage was 30
percent while department store retailers averaged 50 percent. Hence, it
is clear that many respondents view catalog retailers as viable
alternatives and are interested in patronizing them.
The inclusion of non-store retailers, particularly catalog
marketers, increases the external validity of the study. Indeed, a
308
consumer in today's competitive marketplace may choose from a wide range
of alternative retailers. The dissertation research broadens the scope
of patronage research by including all types of alternative retailers in
a comprehensive study. However, more empirical analysis is needed to
test for effects on the choice set when these non-store retailers are
included.
Another finding concerning choice sets is that individuals do
indeed reduce the number of alternatives considered at consecutive
stages in the choice process. Similar to the other measures of the
choice process previously discussed, wide variation in the decrease in
size of choice sets was also observed. Whether moving from awareness
set to consideration set, consideration set to action set, or awareness
set to action set, some individuals display no reduction while others
decrease the number of retailers included by 100%. Individuals may be
profitably segmented based on their reduction percentages. Respondents
could be categorized based on the amount of reduction exhibited which
would yield information pertaining to the decision styles.
A final result concerning the choice set formation process is the
finding that certain demographic variables may be usefully employed to
segment and target specific consumers. Specifically, older consumers
reported smaller choice sets at the awareness set stage. For retailers
hoping to appeal to this group, more attention should focus on creating
awareness and increasing the knowledge that the retailer exists. If the
consumer does not have knowledge of the retail outlet, they can not
patronize it.
Ethnic origin was also related to choice set size. At both the
309
consideration and action set stages, black respondents reported larger
choice sets than white respondents. This finding is not directly
accounted for and further exploration of this groups' shopping behavior
is warranted. On the surface however, it appears that retailers have a
greater chance of being included in black respondents' consideration and
action sets.
Additionally, younger respondents (aged 18 to 24) exhibited larger
consideration and action choice sets than the other age groups. Again,
it appears retailers have a greater probability of being included in
younger respondents choice sets. Both black respondents and younger
respondents seem willing to consider and attempt to contact a larger
number of retailers than other demographic groups. They may be willing
to consider a larger subset of stores for many reasons. One reason
might be that these groups derive other satisfactions from shopping in
addition to obtaining the product. In addition, the individuals may
shop for recreational or leisure purposes and may have more
discretionary time to spend in the shopping process.
In conclusion, individuals do indeed display much diversity in the
derived choice set structure measures. Thus, the choice set formation
process is a useful tool to both academicians and practitioners. This
perspective views the patronage decision as a process and suggests the
stages the individual exhibits that lead to final retail outlet choice
are also important. Moreover, the analysis of choice sets provides
empirical support to the widely found result that individuals narrow
their choice of retailers in some manner and rarely make use of all
available alternatives.
310
For the retail executive, the.recognition that final outlet choice
is a result of a cognitive process of alternative generation and
evaluation can aid in developing marketing strategies. Retailers should
be concerned with the number of individuals who are aware of their store
in addition those who actually patronize them currently. Additionally,
a consumer can not patronize a retailer they do not know about.
Therefore, greater attention should be placed on building awareness and
striving to develop an ever increasing group of loyal customers.
Shopping Motivation Relationships
The final research question sought to describe how shopping
motivations relate to the choice set formation process and other
explanatory variables. Dissertation hypotheses and the proposed
patronage models attempted to answer this question using both individual
hypothesis tests and structural equation modeling.
Overall, consumer shopping motivations were found to be
significantly related to the size of the choice set. Specifically,
individuals who displayed greater overall motivation reported larger
choice sets. This finding validates the motivation scale since
motivations are proposed to be based on needs which can be fulfilled
through interactions with a retailer. Thus, for those consumers who
have greater needs, choice sets composed of a large number of outlets
increases the probability that these needs will be satisfied.
Moreover, the importance of the motivation linkage to choice set
size is evident in almost all of the analyses conducted. In the
311
consideration and action set structural models, motivation is the only
significant linkage to choice set size. However, for the awareness set
structural model contextual influences, shopping process involvement
(SPI), and knowledge demonstrate significant associations with choice
set size.
The non-significant linkage of motivation to awareness set in the
structural model is not surprising. It is likely that the determinants
of the awareness set are based simply in the amount of exposure. For
example, whether the consumer has actually seen the retail outlet, been
exposed to advertisements, etc. The significance of SPI is expected
since those individuals who are involved with shopping as an activity
are likely to have knowledge of a greater number of stores. Similarly,
knowledge is also expected to be significant as the awareness set
structure is really a measure of retail outlet information. It is
surprising, however, that contextual influences are not significantly
related to individual's consideration and action sets. It is at these
later stages of the choice process that constraints such as amount of
available money and time would seem to exert an influence. However, the
significance of motivations may overshadow the effects context wields on
the size of these sets.
Shopping motivations are also related to other model constructs.
In each of the structural models, shopping motivations and SPI display a
significant linkage as hypothesized. Involvement has been discussed as
having motivational qualities and it is not surprising the relationship
between shopping motivations and SPI is observed. Further, SPI can
perhaps be considered one result of motivations — individuals1 motives
312
may lead them to become immersed with shopping as an activity. This
could occur particularly if the consumer displayed motives for
recreation, variety, diversion — which might also explain their
involvement with shopping.
Additionally, motivations are significantly correlated with
product involvement and contextual influences. Product involvement is
positively associated with motivations as expected. Thus, individuals
who exhibit high overall motivations are also likely to be involved with
the product. Contextual influences demonstrate a negative correlation
to motivations as proposed. These influences are really constraints
which limit individuals' behavior. Therefore, if individuals are highly
motivated to engage in shopping but experience time constraints, their
shopping behavior will be reduced.
As mentioned the patronage models were tested using structural
equation maximum likelihood estimation procedures. The models were
identical except the dependent variable of choice set was varied
according to the choice set process stage. All three patronage models
resulted in similar overall goodness-of-fit measures and percent of
variance explained. This result further aids confirmation of the model
as consistent significant relationships were observed.
The dissertation research succeeded in developing and validating a
comprehensive model of patronage behavior. Furthermore, unlike other
patronage studies which examined the store last shopped or most
frequently shopped, the dependent variable which was utilized here
captured the process individuals exhibit when making a retail choice decision. The information gained by the inclusion of the stages of the

313
choice process are rich with meaning for both the academic and the
retail executive. Additionally/ the proposed model expanded the
patronage literature by including all alternative retail types, and
incorporated additional constructs which had not been related to retail
choice behavior.
Limitations of the Present Study
This section summarizes three major factors which must be
considered in viewing the results of the dissertation research by
academicians and retail practitioners alike.
The first limitation concerns the impact of judgmental sampling.
The present study attempted to ensure representativeness of the
population with respect to age, education and race, however, the sample
was slightly skewed. Study respondents were generally better educated,
wealthier, and contained more singles than the population average, and
in general were upper middle class. However, these sample
characteristics match the usual attributes of patronage research
respondents and these deviations are not expected to cause substantive
changes in the results. While the study respondents likely have more
buying power than under-represented groups and might have access to a
larger number of available retailers, no impact is seen on the basic
objective of understanding and explaining the patronage decision process
in general. As long as the sample demonstrates adequate variation,
theory and concept testing can be performed (Calder, Phillips and Tybout
1981). Also, given the lower than average response rate of 35 percent,
314
the sample is subject to nonresponse bias to the extent the sample is
different from those who chose not to respond. It is likely the
respondents were more interested in the subject matter or possibly more
willing to participate in the survey because of some felt obligation.
A second limitation of the dissertation research lies in its
methodology and, most specifically, in its reliance on the choice set
task manipulation. Methods for elicitation of choice sets have been
little used in marketing research and most often require the consumer to
reflect upon a past decision and recount the stages in the choice
process. Therefore, there is no empirical basis with which to compare
the obtained choice set information with regards to the typicality of
size of sets, types of retailers within sets, and relative market share
information.
Some might question the veridity of choice set data by asking how
likely is it that a respondent would truly attempt to contact the number
of outlets reported in their action set. For instance, 15 percent of
the sample reported from 21 to 30 retail outlets in their action set and
36 percent reported action sets ranging from 11 to 20 retail outlets.
Would a typical consumer when faced with a real outlet choice decision
actually contemplate this many outlets? Since many consumers do a large
percentage of their shopping at major regional malls which offer from 25
to 30 retail outlets, a consumer could very well contact (by window
shopping, browsing, etc) most of the retail outlets located in the mall.
Thus, the number of retailers composing the action set seems credible.
Moreover, given the large numbers of catalogs consumers receive, a
consumer could browse through several catalogs without leaving their
315
home or office.
Another question which must be raised concerns the use of an aided
recall response measure. Respondents were provided with an extensive
list of retailers from which to choose and this in itself is quite
different from how they might proceed in a real-life patronage decision
context. Typically the choice of a retail outlet involves the mental
search for information rather than consulting a list provided by some
source, such as the Yellow Pages. Therefore, would the sizes of the
choice sets differ if an unaided recall measure had been employed? This
is obviously an empirical question which deserves testing and further
analysis.
It is likely however, that had an unaided recall measure been
employed, respondents' choice sets would have been smaller. It is
probable that the awareness set would have been most effected by the use
of an aided measure, since individuals were prompted for their recall of
outlets of which they were knowledgeable. Given an unaided task,
respondents might have been able to remember only those outlets they had
visited or had experience with. Thus, the aided measure employed
enables us to have an accurate measure of the critical awareness set.
Additionally, it is likely that individuals viewed the choice set
task differentially and may account for differences found in the choice
set measures. Respondents may have overstated their retail outlet
choice behavior or been unable to view the choice scenario as a
realistic problem. These issues thus suggest that the choice set
results be analyzed with these limitations in mind. However, it is felt
that most respondents acted as though they were in a real purchase

316
situation and that they chose those outlets they would normally
patronize or had patronized in the past.
Furthermore, it is not known how accurately this process mirrors
the cognitive and behavioral process individuals exhibit when they are
engaged in the patronage decision process. First, do individuals
exhibit the proposed choice set formation process when selecting among
available retail outlets or is an alternative process more appropriate?
Secondly, were individuals' choice sets a result of repeated patronage
decisions? Specifically, did individuals merely select those retailers
they typically patronize or did they construct their choice sets
especially for the simulated choice task?
An additional limitation concerns the construct validity of length
of time residing in the city as a measure of experience. This indicator
was employed since it was expected that individuals who had lived in the
city a longer period of time would have greater awareness of the
available retail outlets. This was desired since the study sought
individuals who were familiar with retail outlets and engaged in
shopping activity. However, this measure may not fully account for the
sum total of knowledge and experience acquired through individuals'
interactions with retailers.
The final limitation on this research's contribution lies in the
interpretation of the proposed patronage model results. Since the focus
of this research was primarily to explore model relationships and
observe associations among model constructs, the use of linear
structural equation analysis was sanctioned.
However, causal interpretation of the model can not be justified.
317
It is expected that many of the proposed constructs may be a result of
other influences not included in the model. For instance, an
individuals' life experiences such as learning, socialization processes,
stage in the family life cycle, as well as other variables may be
antecedents or associated to each of the proposed constructs.
Additionally, to examine the causal linkage between many of the
variables, a longitudinal study would be necessary. For example, does
an individual initially become involved with a product class and then
demonstrate involvement with the activity as hypothesized - or vice
versa?
Implications and Recommendations for Future Research
Directions for future research in retail choice decision making
are suggested by both the dissertation findings and the problems it
encountered. The dissertation research demonstrated that:
1) Consumer shopping motivations exist, are multidimensional
and represent higher-order motivation constructs;
2) There is wide variation among individuals in the structure
of their choice sets;
3) Individuals do indeed reduce the number of alternatives
considered to a more "manageable" set;
4) Choice set size is related to certain demographic variables;
5) Consumer shopping motivations are related to the choice set
formation process; and
6) The proposed patronage model is moderately supported.

The dissertation findings and its limitations raise broad
questions around which suggestions for future research are organized.
These are:
- Are the proposed shopping motivations comprehensive?,
- What else can be learned from choice set research?, and
- How can the patronage model be improved?
Are the Proposed Shopping Motivations Comprehensive?
While the shopping motivation scale measures 17 basic incentives
to engage in interactions with the retailer, additional empirical
research is needed to ensure that all possible motivations are included.
Further research effort should also be expended to examine the enduring
nature of the shopping motivation scale. While shopping motivations are
proposed to represent stable characteristics of the individual, this
assumption is not empirically tested. Of particular interest would be
the effects of changing life-styles on shopping motivations. For
instance, do consumers' motivations remain constant when they marry,
have children, move to a new city, become career involved, etc.?
It is highly likely that these events may indeed exert an
influence on motivations as well as choice behavior. How many mothers
or fathers were once "shopaholics"? How does the busy career person
adjust to less discretionary time to devote to shopping activities?
Spiegel would like to think the busy career woman chooses them as their
new advertising campaign appeals to the woman who has everything but
time. Direct marketers and retailers who offer special services such as
319
24 hour service, personalized shoppers, and home delivery are beginning
to recognize the unique problems of today's consumers and trying to
address these issues by developing special services.
What Else Can Be Learned From Choice Set Research?
Future research employing a choice set process framework is needed
to address several issues. First, what is the "typical" number of
retailers individuals include in their choice sets. Does the number of
retailers included vary depending on the product class examined and the
number of available retail outlets? It might be proposed that the
number of available retail outlets available would impact the choice set
structure. However, there may be individuals or groups of consumers who
are willing and/or able to process only a limited number of outlets.
For these consumers, this critical number may stay relatively constant
even though the size of the total available set changes.
Additionally, from a practical perspective, can retailers change
or influence the number of alternatives individuals consider or are
willing to contact or visit? How can the retailer ensure that his/her
retail outlet is not eliminated during the choice set formation process?
Furthermore, how do spatial constraints or the location of the
outlet affect the movement of the retail outlet from awareness to
action? What types of consumers are influenced by these constraits and
how far are they willing to travel? Are individuals1 action sets
composed of retailers who are close to where they work or live? Future
research should also address individuals' desires to specialize or

320
concentrate their shopping among a few selected retailers or types of
retailers. What factors lead consumers to narrow their focus and
concentrate on a specific subset of alternative retail outlets?
Additional research effort is needed to assess the impact of the
manipulation variables used in the scenario. What effects would
alternative products, amount of money, amount of discretionary time have
on the consumer's choice sets?
Finally, choice set research should further examine the
relationship between choice set size, amount of reduction, and
concentration and consumer demographic variables. It would be of much
practical significance if a set of demographic characteristics could be
usefully related to the choice set formation process. Retail management
could then use demographics in a marketing segmentation program to
increase awareness and patronage.
How Can the Patronage Model Be Improved?
While the proposed patronage model is supported and provides
theoretical additions to the existing knowledge base, it is likely that
other factors may also influence patronage behavior. For example,
demographic variables were found to be related to the choice set
formation process. If these demographic variables were included in the
proposed model, would the relationships change?
Additionally, a considerable amount of patronage research has
concentrated on the spatial aspects of consumer choice behavior. How
might the patronage model be specified with the inclusion of such
321
factors as distance between the consumer and the retail outlet? Would
the location of the outlet in terms of a shopping mall, strip center, or
stand alone location influence or help to predict choice set size?
Finally, the importance of retail attributes should be examined
with respect to other model constructs. This research would demand
respondents to rate all of the retailers included in their choice sets
on a set of characteristics. While cumbersome for respondents, the
addition of this data would provide an analysis of the importance of
retailer characteristics when other variables are included in the model.
Summary
In conclusion, this dissertation research provided an extension in
three primary areas: (1) the scope of motivations was broadened;
(2) the choice set formation process was explored incorporating all
types of retailers; and (3) patronage research was extended by
assimilating additional constructs, conceptualizing patronage as a
process, and testing a comprehensive model. Additionally, areas for
future research are discussed.
The research suggested in this concluding section will not by
itself lead to perfect understanding of patronage behavior — a great
deal still remains to be learned. However, the research ventures
suggested, represent a potentially productive direction for research in
patronage behavior.

BIBLIOGRAPHY
Achabal, Dale D., Mary Anne Odegaard Kriewall, and Shelby H. McIntyre(1983), "The Effect of Time and Situational Factors on Food Store
Patronage," in Patronage Behavior and Retail Management, eds. William R. Darden and Robert F. Lusch, New York, NY: ElsevierScience Publishing Co., Inc.
Ajzen, Icek and Martin Fishbein (1980), Understanding Attitudes andPredicting Social Behavior, Englewood Cliffs, NJ: Prentice-Hall,Inc.
Antil, John H. (1984), "Conceptualization and Operationalization of Involvement," in Advances in Consumer Research, Vol. 11, ed.Thomas C. Kinnear, Provo, Ut: Association for Consumer Research,203-209.
Arnold, Stephen J., Sylvia Ma, and Douglas J. Tigert (1978), "AComparative Analysis of Determinant Attributes in Retail Store Selection," in Advances in Consumer Research, Vol. 5, ed. H. Keith Hunt, Ann Arbor, MI: Association for Consumer Research, 663-667.
___________ and Douglas J. Tigert (1973-1974), "Market MonitoringThrough Attitude Research," Journal of Retailing, 49 (Winter), 3- 22.
___________ , Tae H. Oum, and Douglas J. Tigert (1983), "DeterminantAttributes in Retail Patronage: Seasonal, Temporal, Regional, andInternational Comparisons," Journal of Marketing Research, 20 (May), 149-157.
Bagozzi, Richard P. and Youjae Yi (1988), "On the Evaluation ofStructural Equation Models," Journal of the Academy of Marketing Science, 16 (1), 74-94.
Bayton, James A. (1958), "Motivation, Cognition, Learning - BasicFactors in Consumer Behavior," Journal of Marketing, 23 (January), 282-289.
Bearden, William O., Jesse E. Teel, and Richard M. Durand (1978),"Media Usage, Psychographic, and Demographic Dimensions of Retail Shoppers," Journal of Retailing, 54 (Spring), 65-74.
Belk, Russell W. (1974), "An Exploratory Assessment of Situational Effects in Buyer Behavior," Journal of Marketing Research, 11 (May), 156-163.
___________ (1975), "Situational Variables and Consumer Behavior,"Journal of Consumer Research, 2 (December), 157-164.
322

323
Bellenger, Danny N. and Pradeep K. Korgaonkar (1980), "Profiling the Recreational Shopper," Journal of Retailing, 56 (3), 77-92.
____________, and George P. Moschis (1982), "A Socialization Modelof Retail Patronage," in Advances in Consumer Research, Vol. 9, ed. Andrew Mitchell, Ann Arbor, MI: Association for ConsumerResearch, 373-378.
____________, Dan H. Robertson and Barnett A. Greenberg (1977),"Shopping Center Patronage Motives," Journal of Retailing, 53 (Summer), 29-38.
____________, Dan H. Robertson, and Elizabeth C. Hirschman (1976-1977),"Age and Education as Key Correlates of Store Selection for Female Shoppers," Journal of Retailing, 52 (Winter), 71-78.
____________, Earle Steinberg and Wilbur Stanton (1976), "Congruenceof Store Image and Self Image," Journal of Retailing, 52 (Spring), 17-32.
Belonax, Joseph J., Jr. (1978), "Decision Rule Uncertainty, EvokedSet Size, and Task Difficulty as a Function of Number of Choice Criteria and Information Variability," in Advances in Consumer Research, Vol. 6, ed. William L. Wilkie, Ann Arbor, MI:Association for Consumer Research, 232-235.
____________, and Robert A. Mittelstaedt (1977), "Evoked Set Size as aFunction of Number of Choice Criteria and Information Variability," in Advances in Consumer Research, Vol. 5, ed. H. Keith Hunt, Ann Arbor, MI: Association for Consumer Research, 48-51.
Bentler, P.M. and Douglas G. Bonett (1980), "Significance Tests and Goodness of Fit in the Analysis of Covariance Structures," Psychological Bulletin, 88, 588-606.
Berkowitz, E.N., J.R. Walton, and O.C. Walker (1979), "In-Home Shoppers: The Market for Innovative Distributive Systems," Journal of Retailing, 55 (Summer), 15-33.
Berman, Barry and Joel R. Evans (1989), Retail Management, 4th Edition, New York, NY: Macmillan Publishing Co.
Berry, Leonard L. (1969), "The Time-Buying Consumer," Journal of Retailing, 55 (4), 58-69.
Bettman, James R. and C. Whan Park (1980a), "Effects of Prior Knowledge, Exposure, and Phase of the Choice Process on Consumer Decision Processes: A Protocol Analysis," Journal of Consumer Research, 7 (March), 234-248.

324
, and C. Whan Park (1980b), "Implications of a ConstructiveView of Choice for Analysis of Protocol Data: A Coding Scheme forElements of Choice Processes," in Advances in Consumer Research, Vol. 7, ed. Jerry C. Olson, Ann Arbor, MI: Association forConsumer Research, 148-153.
Black, William C. (1984), "Choice-set Definition in Patronage Modeling," Journal of Retailing, 60 (Summer), 63-85.
_____ (1987), "A Conceptual Model of Retail Store Patronage," workingpaper. Marketing Department, College of Business Administration, Louisiana State University, Baton Rouge, LA 70803.
Bloch, Peter H. (1981), "An Exploration into the Scaling of Consumers' Involvement with a Product Class," in Advances in Consumer Research, Vol. 8, ed. Kent B. Monroe, Ann Arbor, MI: Associationfor Consumer Research, 61-65.
___________ (1985), "The Product Enthusiast: Implications forMarketing Strategy," Journal of Consumer Marketing, 3 (Summer), 51-62.
, and Marsha L. Richins (1983), "Shopping Without Purchase:An Investigation of Consumer Browsing Behavior," in Advances in Consumer Research, Vol. 10, eds. Richard P. Bagozzi and Alice M. Tybout, Ann Arbor, MI: Association for Consumer Research, 389-393.
Bowen, Lawrence and Steven H. Chaffee (1974), "Product Involvementand Pertinent Advertising Appeals," Journalism Quarterly, 51, 613- 621.
Brim, Orville G. and Stanton Wheeler (1966), Socialization AfterChildhood: Two Essays, New York, NY: John Wiley & Sons, Inc.
Brisoux, Jacques E. and Michel Laroche (1980), "A Proposed ConsumerStrategy of Simplification for Categorizing Brands," in Evolving Marketing Thought for 1980, eds. John D. Summey and R.D. Taylor, Southern Marketing Association, 112-114.
, and Michel Laroche (1981), "Evoked Set Formation andComposition: An Empirical Investigation Under a RoutinizedResponse Behavior Situation," in Advances in Consumer Research, Vol. 8, ed. Kent B. Monroe, Ann Arbor, MI: Association forConsumer Research, 357-361.
Bruner, Gordon C. (1986), "Problem Recognition Styles and SearchPatterns: An Empirical Investigation," Journal of Retailing, 62(3), 281-297.
325
Bucklin, Louis P. (1967), Shopping Patterns in an Intra-Urban Area, University of California, Institute of Business and Economic Research.
Cadwallader, M. (1975), "A Behavioral Model of Consumer Spatial Decision Making," Economic Geography, 51, 339-349.
Calder, Bobby J., Lynn W. Phillips, and Alice M. Tybout (1981), "Designing Research for Application,” Journal of Consumer Research, 8 (September), 197-207.
___________ , Lynn W. Phillips, and Alice M. Tybout (1982), "TheConcept of External Validity," Journal of Consumer Research, 9 (December), 240-244.
___________ , Lynn W. Phillips, and Alice M. Tybout (1983), "BeyondExternal Validity," Journal of Consumer Research, 10 (June), 112- 114.
Campbell, Donald T. and Donald W. Fiske (1959), "Convergent andDiscriminant Validation by the Multitrait - Multimethod Matrix," Psychological Bulletin, 56, 81-105.
Cavusgil, S. Tamer (1981), "Retail Patronage Patterns Among Consumers in the Auto-Care Market and Correlates of Patronage," in Retail Patronage Theory 1981 Workshop Proceedings, eds. Robert F. Lusch and William R. Darden, Norman, OK: Center for Economic andManagement Research, School of Business Administration, The University of Oklahoma, 131-134.
Churchill, Gilbert A., Jr. (1979), "A Paradigm for Developing BetterMeasures of Marketing Constructs," Journal of Marketing Research, 16 (February), 64-73.
Coffer, C.N. and M.H. Appley (1964), Motivation: Theory and Research,New York, NY: John Wiley & Sons.
Crask, Melvin R. and Fred D. Reynolds (1978), "An Indepth Profile of the Department Store Shopper," Journal of Retailing, 54 (Summer), 23- 32.
Cronbach, L.J. (1951), "Coefficient Alpha and the Internal Structure of Tests," Psychometrika, 16, 297-334.
___________ , and P.E. Meehl (1955), "Construct Validity inPsychological Tests," Psychological Bulletin, 52 (May), 281-302.
Darden, William R. (1981), "Review of Behavioral Modeling in Marketing," Annual Review of Marketing, Chicago, IL: American MarketingAssociation, 21-30.
326
___________ and Dub Ashton (1974-1975), "Psychographic Profiles ofPatronage Preference Groups," Journal of Retailing, 50 (Winter), 99-112.
___________ , Donna K. Darden, Roy Howell, and Shirley J. Miller (1981),"Consumer Socialization Factors in a Patronage Model of Consumer Behavior," in Advances in Consumer Research, Vol. 8, ed. Kent B. Monroe, Ann Arbor, MI: Association for Consumer Research, 655-661.
___________ and Fred D. Reynolds (1971), "Shopping Orientations andShopping Usage Rates," Journal of Marketing Research, 8 (November), 505-508.
Darian, Jean C. (1987), "In-Home Shopping: Are There ConsumerSegments?,” Journal of Retailing, 63 (Summer), 163-186.
Dawson, Scott (1988), "An Exploration of the Store Prestige Hierarchy: Reification, Power, and Perceptions," Journal of Retailing, 64 (2), 133-152.
Day, George S. (1970), Buyer Attitudes and Brand Choice, New York, NY: Free Press.
Dolich, Ira and Ned Shilling (1971), "A Critical Evaluation of 'The Problem of Self-Concept in Store Image Studies'," Journal of Marketing, 35 (January), 71-73.
Doyle, Peter and Ira Fenwick (1974-1975), "How Store Image Affects Shopping Habits in Grocery Stores," Journal of Retailing, 50 (Winter), 39-52.
Engel, James F. and Roger D. Blackwell (1982), Consumer Behavior, Fourth Edition, New York, NY: The Dryden Press.
Feick, Lawrence and Linda L. Price (1987), "The Market Maven: ADiffuser of Marketplace Information," Journal of Marketing, 51 (January), 83-97.
Fisk, George (1961), "A Conceptual Model for Studying Consumer Image," Journal of Retailing, 37 (Winter), 1-8, 54.
Fornell, Claes (1983), "Issues in the Application of CovarianceStructure Analysis: A Comment," Journal of Consumer Research, 9(March), 443-448.
___________ and David F. Larcker (1981), "Evaluating StructuralEquation Models with Unobservable Variables and Measurement Error," Journal of Marketing Research, 18 (February), 39-50.
Fortune (1987), "The 50 Largest Retailing Companies," June 8, 210-211.
327
Freud, Sigmund (1916), Wit and Its Relation to the Unconscious,New York, Moffat, Yard, & Co.
Gentry, James W. and Alvin C. Burns (1977-1978), "How 'Important' Are Evaluative Criteria in Shopping Center Patronage?," Journal of Retailing, 53 (Winter), 73-86.
Gerbing, David W. and James C. Anderson (1988), "An Updated Paradigm for Scale Development Incorporating Unidimensionality and Its Assessment," Journal of Marketing Research, 25 (May), 186-192.
Goldman, Arieh (1976), "Do Lower-Income Consumers Have a More Restricted Shopping Scope?," Journal of Marketing, 40 (January), 46-54.
Goldman, Arieh (1978), "Confined Shopping Behavior Among Low IncomeConsumers: An Empirical Test," Journal of Marketing Research, 15(February), 11-19.
Gutman, Jonathan and Michael K. Mills (1982), "Fashion Life Style, Self-Concept, Shopping Orientation, and Store Patronage: AnIntegrative Analysis," Journal of Retailing, 58 (2), 65-86.
Han, C. Min (1989), "Country Image: Halo or Summary Construct?,"Journal of Marketing Research, 26 (May), 222-229.
Handelsman, Moshe and J. Michael Munson (1985), "On Integrating Consumer Needs for Variety with Retailer Assortment Decisions," in Advances in Consumer Research, Vol. 12, eds. Elizabeth C. Hirschman and Morris B. Holbrook, Provo, UT: Association for Consumer Research,108-112.
Hansen, Robert A. and Terry Deutscher (1977-1978), "An EmpiricalInvestigation of Attribute Importance in Retail Store Selection," Journal of Retailing, 53(Winter), 59-72. . _ _
Hanson, Susan (1977), "Measuring the Cognitive Levels of Urban Residents," Geografiska Annaler B, 59, 67-81.
Hawkins, Del I., Roger J. Best and Kenneth A. Coney (1983), Consumer Behavior: Implications for Marketing Strategy, Plano, TX:Business Publications, Inc.
Heeler, R., J. Francis, C. Okechuku and S. Reid (1979), "Gift versusPersonal Use Brand Selection," in Advances in Consumer Research, Vol. 6 ed. William Wilkie, Ann Arbor, MI: Association forConsumer Research, 325-328.
Hirschman, Elizabeth C. (1981), "Women's Self-Ascribed OccupationalStatus and Retail Patronage," in Advances in Consumer Research, Vol. 8, ed. Kent B. Monroe, Ann Arbor, MI: Association forConsumer Research, 108-111.
328
Houston, Michael J. and Michael L. Rothschild (1978), "Conceptual and Methodological Perspectives in Involvement," in Research Frontiers in Marketing: Dialogues and Directions, ed. S. Jain,Chicago, IL: American Marketing Association, 184-187.
Howard, John A. (1963), Marketing Management: Analysis and Planning,Homewood, IL: Irwin.
____________ (1977), Consumer Behavior: Application of Theory, NewYork, NY: McGraw-Hill.
Jacoby, Jacob (1978), "Consumer Research: A State of the Art Review,"Journal of Marketing, 42 (April), 87-96.
Johnson, Eric J. and J.Edward Russo (1981), "Product Familiarity andLearning New Information," in Advances in Consumer Research, Vol. 8, ed. Kent B. Monroe, Ann Arbor, MI: Association for ConsumerResearch, 79-86.
Joreskog, Karl G. and Dag Sorbom (1984), Lisrel: Analysis ofLinear Structure Relationships by the Method of Maximum Likelihood, Mooresville, IN: Scientific Software.
Kapferer, Jean-Noel and Gilles Laurent (1985), "Consumers' Involvement Profile: New Impirical Results," in Advances in ConsumerResearch, Vol. 12, eds. Elizabeth C. Hirschman and Morris B. Holbrook, Provo, UT: Association for Consumer Research, 290-295.
Kassarjian, Harold H. (1981), "Low Involvement: A Second Look," inAdvances in Consumer Research, Vol. 8, ed. Kent B. Monroe, Ann Arbor, MI: Association for Consumer Research, 31-34.
Kelly, Robert and Ronald Stephenson (1967), "The Semantic Differential: An Information Source for Designing Retail Patronage Appeals," Journal of Marketing, 31 (October), 43-47.
King,Charles W., Lawrence J. Ring and Douglas J. Tigert (1980), "Fashion Involvement and Retail Shopping Behavior," in Competitive Structure in Retail Markets: The Department Store Perspective,eds. Ron Stampfl and Elizabeth Hirschman, Chicago, IL: AmericanMarketing Association, 88-99.
Krugman, Herbert (1965), "The Impact of Television Advertising:Learning Without Involvement," Public Opinion Quarterly, 29, 349- 356.
____________ (1966), "The Measurement of Advertising Involvement,"Public Opinion Quarterly, 30 (Winter), 583-596.
329
Laroche, Michel, Jerry Rosenblatt, Jacques E. Brisoux and RobertShimotakahara (1983), "Brand Categorization Strategies in RRB Situations: Some Empirical Results," in Advances in ConsumerResearch, eds. Richard P. Bagozzi and Alice M. Tybout, Provo, UT: Association for Consumer Research, 549-554.
___________ , Jerry A. Rosenblatt and Ian Sinclair (1984), "BrandCategorization Strategies in an Extensive Problem Solving Situation: A Study of University Choice," in Advances in ConsumerResearch, Vol. 11, ed. Thomas C. Kinnear, Provo, UT: Associationfor Consumer Research, 175-179.
Lastovicka, John L. (1979), "Question the Concept of Involvement Defined Product Classes," in Advances in Consumer Research, Vol., eds.B.W. Becker and H. Becker, Chicago, IL: American MarketingAssociation, 174-179.
___________ and David M. Gardner (1979), "Components ofInvolvement," in Attitude Research Plays for High Stakes, eds.John Maloney and Bernard Silverman, Chicago, IL: AmericanMarketing Association, 53-73.
Lattin, James M. and Leigh McAlister (1985), "Using A Variety- Seeking Model to Identify Substitute and Complementary Relationships Among Competing Products," Journal of Marketing Research, 22 (August), 330-339.
Laurent, Gilles and Jean-Noel Kapferer (1985), "Measuring Consumer Involvement Profiles," Journal of Marketing Research, 22 (February), 41-53.
Lessig, V. Parker (1973), "Consumer Store Images and Store Loyalties," Journal of Marketing, 38 (October), 72-74.
Lindquist, Jay D. (1974-1975), "Meaning of Image: A Survey of EmpiricalHypothetical Evidence," Journal of Retailing, 50 (Winter), 29-38.
Long, J. Scott (1983), Confirmatory Factor Analysis, Beverly Hills, CA: Sage Publications, Inc.
Lovelock, Christopher H., Ronald Stiff, David Cullwick and Ira M.Kaufman (1976), "An Evaluation of the Effectiveness of Drop-Off Questionnaire Delivery," Journal of Marketing Research, 13 (November), 358-364.
Lundstrom, William J. and Lawrence M. Lamont (1976), "The Development of a Scale to Measure Consumer Discontent," Journal of Marketing Research, 13 (November), 373-381.
MacNeal, James U. (1969), "An Exploratory Study of the Consumer Behavior of Children," in Dimensions of Consumer Behavior, ed. James U. Mac Neal, New York, NY: Appleton-Century-Crofts, 255-275.
330
Madsen, K.B. (1968), Theories of Motivation, Kent State University Press, Kent, Ohio.
___________ (1974), Modern Theories of Motivation: A ComparativeMultiscientific Study, New York, NY: Wiley.
Marks, Larry J. and Jerry C. Olson (1981), "Toward a Cognitive Structure Conceptualization of Product Familiarity," in Advances in Consumer Research, Vol. 8, ed. Kent B. Monroe, Ann Arbor, MI: Associationfor Consumer Research, 145-150.
Maslow, Abraham H. (1970), Motivation and Personality, 2nd Edition, New York: Harper & Row.
Mason, J. Barry, Richard M. Durand and James L. Taylor (1981), "The Role of Consumer Values in Retail Patronage," in Retail Patronage Theory 1981 Workshop Proceedings, eds. Robert F. Lusch and William R. Darden, Norman, OK: Center for Economic and ManagementResearch,, School of Business Administration, University of Oklahoma, 161-168.
Mattson, Bruce E. (1982), "Situational Influences on Store Choice," Journal of Retailing, 58 (Fall), 46-38.
Mazursky, David and Jacob Jacoby (1986), "Exploring the Development of Store Images," Journal of Retailing, 62 (2), 145-165.
McAlister, Leigh and Edgar Pessemier (1982), "Variety Seeking Behavior: An Interdisciplinary Review," Journal of Consumer Research, 9, 311-322.
McClelland, David C. (1955), Studies in Motivation, New York, NY: Appleton-Century-Crofts.
McDougal, G.H. and J.N. Fry (1974-1975), "Combining Two Methods of Image Measurement," Journal of Retailing, 50 (Winter), 53-61.
McGuire, W.J. (1974), "Psychological Motives and CommunicationGratification," in The Uses of Mass Communications, eds. J.G. Blumler and C. Katz, Beverly Hills, CA: Sage Publications.
___________ (1976), "Some Internal Psychological Factors InfluencingConsumer Choice," Journal of Consumer Research, (March), 302-319.
McQuiston, Daniel H. (1989), "Novelty, Complexity, and Importance as Causal Determinants of Industrial Buyer Behavior," Journal of Marketing, 53 (April), 66-79.
Mehrabian, Albert and James A. Russell (1974), An Approach to Environmental Psychology, Cambridge, MA: The MIT Press.

331
Miller, F.A. (1956), "The Magic Number Seven, Plus or Minus Two: SomeLimits On Our Capacity for Processing Information," Psychological Review, 63 (March), 81-97.
Miller, Kenneth E. and James L. Ginter (1979), "An Investigation of Situational Variation in Brand Choice Behavior and Attitude," Journal of Marketing Research, 16 (February), 111-123.
Mindak, William A. (1961), "Fitting the Semantic Differential to the Marketing Problem," Journal of Marketing, 25 (April), 69-72.
Mischel, W. (1973), "Toward a Cognitive Social LearningReconceptualization of Personality," Psychological Review, 80 (July), 252-283.
Mitchell, Andrew A. (1979), "Involvement: A Potentially ImportantMediator of Consumer Behavior," in Advances in Consumer Research, Vol. 6, ed. William L. Wilkie, Ann Arbor, MI: Association forConsumer Research, 191-196.
___________ (1982), "Models of Memory: Implications forMeasuring Knowledge Structures," in Advances in Consumer Research, Vol. 9, ed. Andrew Mitchell, Ann Arbor, MI: Association forConsumer Research, 45-51.
Monroe, Kent B. and Joseph P. Guiltinan (1975), "A Path-AnalyticExploration of Retail Patronage Influences," Journal of Consumer Research, 2 (June), 19-28.
Moschis, George P. (1976), "Shopping Orientations and Consumer Use of Information," Journal of Retailing, 52 (Summer), 61-70.
___________ and Gilbert A. Churchill (1978), "Consumer Socialization:A Theoretical and Empirical Analysis," Journal of Marketing Research, 15 (November), 599-609.
Murray, Edward J. (1965), Sleep, Dreams, and Arousal, New York, Appleton-Century-Crofts.
Myers, James H. and Mark I. Alpert (1968), "Determinant BuyingAttitudes: Meaning and Measurement," Journal of Marketing, 32(October), 13-20.
Narayana, Chem L. and Rom Markin (1975), "Consumer Behavior andProduct Performance: An Alternative Conceptualization," Journalof Marketing, 39 (October), 1-6.
Nunnally, Jum C. (1967), Psychometric Theory, New York, NY: McGraw-Hill, Inc.
___________ (1978), Psychometric Theory, New York, NY: McGraw-Hill,Inc.
332
Park, C. Whan (1978), "A Conflict Resolution Choice Model," Journal of Consumer Research, 5 (March), 124-137.
___________ , Bernard J. Jaworski and Deborah J. Maclnnis (1986),Strategic Brand Concept-Image Management," Journal of Marketing,50 (October), 135-145.
Parkinson, Thomas L. and Michael Reilly (1979), "An InformationProcessing Approach to Evoked Set Formation," in Advances in Consumer Research, Vol.6, ed. William L. Wilkie, Ann Arbor, MI: Association for Consumer Research, 227-231.
Peter, J. Paul (1979), "Reliability: A Review of Psychometric Basicsand Recent Marketing Practices," Journal of Marketing Research, 16 (November), 6-17.
___________ (1981), "Construct Validity: A Review of Basic Issues andMarketing Practices," Journal of Marketing Research, 28 (May), 133-145.
Peterson, Robert A. and Roger A. Kerin (1981), "Image Measurement and Patronage Behavior: Fact and Artifact," in Retail PatronageTheory 1981 Workshop Proceedings, eds. Robert F. Lusch and William R. Darden, Norman, OK: Center for Economic and ManagementResearch, School of Business Administration, The University of Oklahoma.
Potter, Robert B. (1977a), "Spatial Patterns of Consumer Behaviour and Perception in Relation to the Social Class Variable," Area, 9, 153-156.
___________ (1977b), "The Nature of Consumer Usage Fields in an UrbanEnvironment: Theoretical and Empirical Perspectives," Tijdschriftvoor Econ. en Soc. Geoqrafie, 68 (3), 168-176.
___________ (1979), "Perception of Urban Retailing Facilities: AnAnalysis of Consumer Information Fields," Geoqrafiska Annaler B, 61, 19-29.
Raju, P.S. (1980), "Optimum Stimulation Level: Its Relationship toPersonality, Demographics, and Exploratory Behavior," Journal of Consumer Research, 7 (December), 272-282.
Rapp, Stan (1984), "A New Mission for A New Breed of Direct Marketers," 67th Direct Marketing Association Annual Conference.
Ray, Michael L. (1979), "Involvement and Other Variables Mediating Communication Effects as Opposed to Explaining All Consumer Behavior," in Advances in Consumer Research, Vol. 6, ed. William L. Wilkie, Ann Arbor, MI: Association for Consumer Research, 197-199.
333
Reilly, Michael and Thomas L. Parkinson (1985), "Individual and Product Correlates of Evoked Set Size for Consumer Package Goods," in Advances in Consumer Research, Vol.12, eds. Elizabeth Cl Hirschman and Morris B. Holbrook, Provo, UT: Association for ConsumerResearch, 492-496.
Rich, Stuart U. and Bernard D. Portis (1964), "The 'Imageries' of Department Stores," Journal of Marketing, 28 (April), 10-15.
Richins, Marsha L. and Peter H. Bloch (1986), "After the New Wears Off: The Temporal Context of Product Involvement," Journal of Consumer Research, 13 (September), 280-285.
Robertson, T. S. (1976), "Low Commitment Consumer Behavior," Journal of Advertising Research, 16 (April), 19-24.
Rosenbloom, Bert and Leon G. Schiffman (1981), "Retailing Theory:Perspectives and Approaches," in Theory in Retailing: Traditionaland Nontraditional Sources, eds. Ron Stampfl and Elizabeth Hirschman, Chicago, IL: American Marketing Association, 168-179.
Rothschild, Michael L. (1979), "Advertising Strategies for High andLow Involvement Situations," in Attitude Research Plays for High Stakes, eds. J. Maloney and B. Silverman, Chicago, IL: AmericanMarketing Association, 74-93.
Ryans, A. (1977), "Consumer Gift-Buying: An Exploratory Analysis,"in Contemporary Marketing Thought, eds. Barnett A. Greenberg and Danny N. Bellenger, Chicago, IL: American Marketing Association,99-115.
Sales and Marketing Management (1987), October 27, 8-30.
Samli, A. Coskun and M. Joseph Sirgy (1981), "A Multidimensional Approach to Analyzing Store Loyalty: A Predictive Model,"in Advances in Consumer Research, Vol. 6, ed. Kent B. Monroe, Ann Arbor, MI: Association for Consumer Research, 357-361.
Schiffman, Leon, Joseph Dash and William Dillon (1977), "TheContribution of Store-Image Characteristics to Store-Type Choice," Journal of Retailing, 53 (Summer), 3-14, 46.
____________ and Leslie K. Kanuk (1983), Consumer Behavior, EnglewoodCliffs, NJ: Prentice-Hall, Inc.
Sheppard, Eric S. (1978), "The Ideology of Spatial Choice," Proceedings, Regional Science Association, 45, 193-213.
Sherif, Muzafer and Hadley Cantril (1947), The Psychology of Ego- Involvement, New York, NY: Wiley.
334
Sheth, Jagdish N. (1983), "An Integrative Theory of Patronage Preference and Behavior," in Patronage Behavior and Retail Management, eds. William R. Darden and Robert F. Lusch, New York, NY: ElsevierScience Publishing Co., Inc., 9-28.
Simmons Market Research Bureau (1985), Study of Media and Markets.
Slama, Mark and Armen Tashchian (1985), "Selected Socioeconomic and Demographic Characteristics Associated with Purchasing Involvement," Journal of Marketing, 49 (January), 72-82.
Solomon, Michael R. (1986), "The Missing Link: Surrogate Consumersin the Marketing Chain, "Journal of Marketing, 50 (October), 208- 218.
____________ (1987), "The Wardrobe Consultant: Exploring the Role of aNew Retailing Partner," Journal of Retailing, 63 (2), 110-128.
Spiggle, Susan and Murphy Sewall (1987), "A Choice Sets Model of Retail Selection," Journal of Marketing, 51 (April), 97-111.
Sproles, George B. and Elizabeth L. Kendall (1986), "A Methodology for Profiling Consumers' Decision-Making Styles," Journal of Consumer Affairs, 20 (2), 267-279.
Statistical Abstract of the U.S. 1988, 108th Edition, U.S. Department of Commerce, Bureau of Census, Washington, D.C., Table 738.
Steers, R. M. and L.W. Porter (1983), Motivation and Work Behavior, 3rd Edition, New York, NY: McGraw-Hill, Inc.
Stone, Gregory P. (1954), "City Shoppers and Urban Identification: Observations on the Social Psychology of City Life," American Journal of Sociology, 60 (July), 36-45.
Sturdivant, F.D. (1970), "Distribution in American Society: SomeQuestions of Efficiency and Relevance," in Vertical Marketing Systems, ed. Louis P. Bucklin, Glenview, IL: Scott Foresmen.
Sudman, S., A. Greely and L. Pinto (1965), "The Effectiveness of Self- Administered Questionnaires," Journal of Marketing Research, 2 (August), 293-297.
Szybillo, George J. Sharon Binstok and Lauranne Buchanan (1979),Measure Validation of Leisure Time Activities: Time Budgets andPsychographics," Journal of Marketing Research, 16 (February), 74- 79.

335
Tan, Chin Tiong and Ira J. Dolich (1981), "The Moderating Effects of Cognitive Complexity and Prior Product Familiarity on the Predictive Ability of Selected Multi-Attribute Choice Models for Three Consumer Products," in Advances in Consumer Research, Vol.8, ed. Kent B. Monroe, Ann Arbor, MI: Association for ConsumerResearch, 140-144.
Target Marketing (1989), "51 Leading Catalogs: Ranked by Number of12-Month Buyers," April, 21.
Tauber, Edward M. (1972), "Why Do People Shop?," Journal of Marketing,36 (October), 46-59.
Tigert, Douglas J., Lawrence Ring and Charles King (1976), "FashionInvolvement in Buyer Behavior," in Advances in Consumer Research, Vol. 3, ed. Beverlee B. Anderson, Ann Arbor, MI: Association forConsumer Research, 46-52.
____________ and Stephen J. Arnold (1981), "Comparative Analysisof Determinants of Patronage," in Retail Patronage Theory 1981 Workshop Proceedings, eds. Robert F. Lusch and William R. Darden, Norman, OK: Center for Economic and Management Research, Schoolof Business Administration, University of Oklahoma, 118-124.
Timmermans, H. (1983), "Non-Compensatory Decision Rules and Consumer Spatial Choice Behavior: A Test of Predictive Accuracy,"Professional Geographer, 35 (4), 449-455.
____________, R. Van Der Heijdan and H. Westerveld (1982), "Perceptionof Urban Retailing Environments: An Empirical Analysis ofConsumer Information and Usage Fields," Geoforum, 13 (1), 27-37.
Tolman, E.C. (1951), "A Psychological Model," in Toward a General Theory of Action, eds. T. Parsons and E.A. Shils, Cambridge, MA: HarvardUniversity Press.
Troye, Sigurd Villads (1984), "Evoked Set Formation as a Categorization Process," in Advances in Consumer Research, Vol. 11, ed. Thomas C. Kinnear, Provo, UT: Association for Consumer Research, 180-186.
Ward, Scott and Thomas S. Robertson (1973), "Consumer Behavior Research: Promise and Prospects," in Consumer Behavior: TheoreticalSources, eds. Scott Ward and Thomas S. Robertson, Engelwood Cliffs, NJ: Prentice-Hall, Inc., 3-42.
Wells, William D. (1966), "Children as Consumers," in On Knowing the Consumer, ed. Joseph W. Newman, New York, NY: Wiley, 138-145.
Westbrook, Robert A. and William C. Black (1985), "A Motivation-Based Shopper Typology," Journal of Retailing, 61 (1), 78-103.

336
Williams, Robert H., John J. Painter and Herbert Nicholas (1978), "A Policy-Oriented Typology of Grocery Shoppers," Journal of Retailing, 54 (1), 27-42.
Zaichkowsky, Judity Lynn (1985a), "Measuring the Involvement Construct", Journal of Consumer Research, 12 (December), 341-352.
___________ (1985b), "Familiarity: Product Use, Involvementor Expertise?," in Advances in Consumer Research, Vol. 12, Association for Consumer Research, 296-299.
Zeller, Richard A. and Edward G. Carmines (1980), Measurement in theSocial Sciences: The Link Between Theory and Data, New York, NY:Cambridge University Press.
4
Appendix A: Dissertation Questionnaire
337
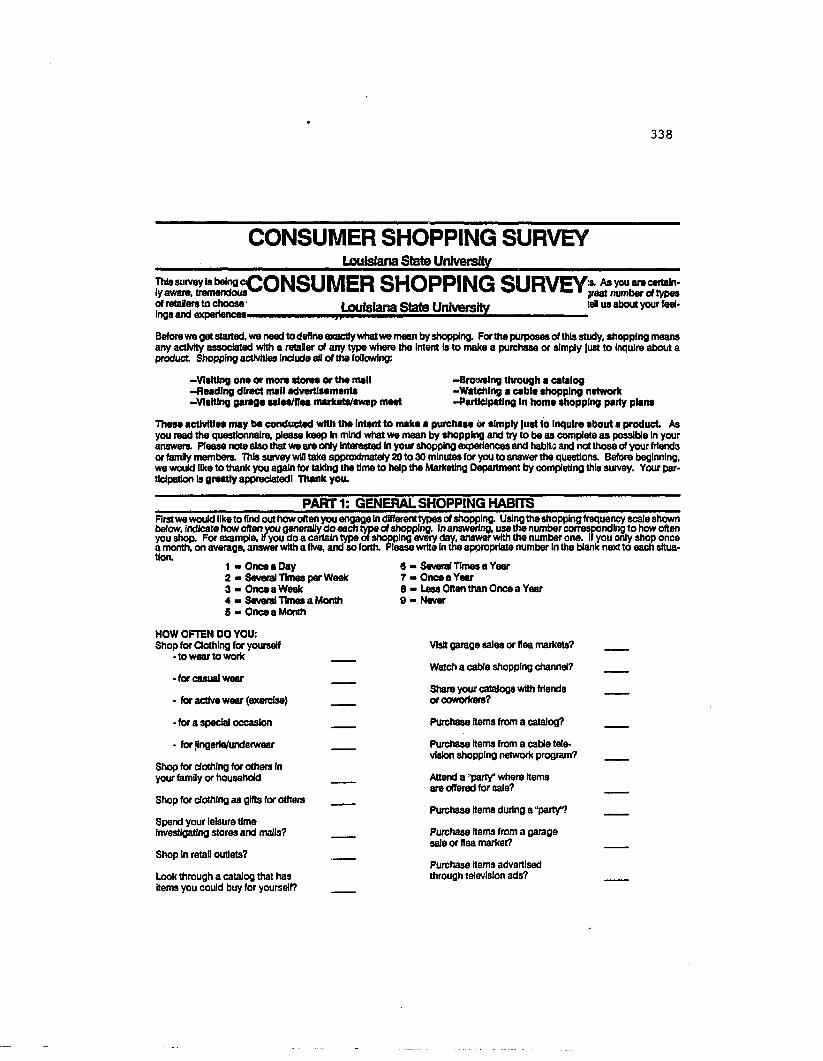
338
CONSUMER SHOPPING SURVEYLouisiana State University
This survey Is being conducted through thoLSU Department o( M arking and concerns shopping habits. As you ore certainly aware, tremendous changes are taking place In the retailing Industry. You have at your disposal a great number of types of retailers to choose from when shopping for the products you buy. This survey Is Intended to let you tell us about your feelings and experiences wtth these different types of retalera.
Before we get started, we need to define exactly what we mean by shopping. For the purposes of this study, shopping means any activity associated with a retafler of any type where the Intent Is to make a purchase or simply Just to Inquire about a product Shopping activities Indude ail of the following:
-V is iting one or more stores or the mall -Browsing through a catalog-Reading direct mall advertisements -W atching a cable shopping network-V is iting garage sales/flea markets/swap meet -Participating In home shopping party plans
These activities may be conducted w ith the Intent to make a purchase Or simply Just to Inquire about a product As you read the questionnaire, please keep In mind what we mean by shopping and try to be as complete as possible In your answers. Please note also that we are only Interested In your shopping experiences and habits and not those of your friends or family members. This survey win take approximately 20 to 30 minutes for you to answer the questions. Before beginning, we would like to thank you again for taking the time to help the Marketing Department by completing this survey. Your par- tidpatlon Is greatly appreciated! Thank you.
First we would like to find out how often you engage In different types of shopping. Using the shopping frequency scale shown below, indicate how often you generally do each type of shopping. In answering, use the number corresponding to how often you shop. For example. If you do a certain type of shopping every day, answer with the number one. If you only shop once a month, on average, answer with a five, and so forth. Please write In the appropriate number In the blank next to each sltua-
PART1: GENERAL SHOPPING HABfTS
tlon.1 - Once a Day2 - Several Times per Week3 - Once a Week4 - Several Times a Month5 - Once a Month
6 - Several Times a Year7 - Once a Year0 - Less Often than Once a Year 9 - Never
HOW OFTEN DO YOU:Shop for Clothing for yourself
-to wear to workVia# garage sales or flea markets?
Watch a cable shopping channel?
Share your catalogs wtth friends orcoMforkers?
- for casual wear
• for active wear (exercise)
- for a special occasion Purchase Items from a catalog?
• for jlngerle/underwear
Shop for dothlng for others In your family or household
Shop for dothlng as gtfts for others
Spend your leisure time Investigating stores and malls?
Shop In retail outlets?
Look through a catalog that has Items you could buy for yourself?
Purchase Items from a cable television shopping network program?
Attend a "party where items are offered for sale?
Purchase Items during a "party"?
Purchase items from a garage sale or Ilea market?
Purchase Items advertised through television ads?

339
PART 2: CLOTHING SHOPPING HABITSThe next part of this survey Is concerned with your clothing shopping habits specifically. Pteaso keep this In mind as you complete the questionnaire. Now, we are Interested In your knowledge and confidence regarding your clothing shopping. Please read each item and circle the appropriate answer. For Instance, If you are extremely knowledgeable, you would circle a 5, somewhat knowledgeable a 3, and so forth.
Compared to other women your age, rate your knowledge of dothlng retail outlets.
ExtremelyKnowledgeable
SomewhatKnowledgeable
Not At A ll Knowledgeable
How knowledgeable do you foal regarding the locations of various dothlng retailers?
How knowledgeable are you concerning today's fashion: '
In general, rate your knowledge of dothlng retail outlets. 5
5Compared to other women your age, rate your knowledge of dothlng fashions.
Compared to other women y ju know, rate your knowledge of the products carried by particular retailers. 5
ExtremelyConfident
When making a decision regarding the choiceof a dothlng ratal outlet how confident are youthat you w if choose an appropriate outlet? 5
If you were asked to find a particular product how confident do you feel In your ability to locate a dothlng retaler which carries the Item? 5
When purchasing dothlng Items, how confidentare you In your decision? 5
SomewhatConfident
Not At All Confidant
How much time do you spend thinking about dothlng fashions?
a great deal of time a moderate amount of time very little time
almost no time
In the past month, how many times have you visited dothlng stores to make a purchase?
times
In the past month, how many times have you visited dothlng stores just to browse?
times
Which fashion magazines do you currently subscribe to or read regularly? Please check all that apply.
Vogue Mademoiselle Glamour Ble Harper's Bazaar Seventeen Vanity Fair Other __ W Other, specify___________ Do not look dt fashion magazines
How thoroughly do you look through fashion magazines?
Extremely thoroughly Somewhat thoroughly Only slightly Do not look at fashion magazines
Approximately, what percentage of the time you spend In dothlng stores Is devoted to browsing for fun or to get Information without a specific purchase objective?
Have your shopping activities for dothlng items changed In the last year? Yes No
If yes, how so and why?
2
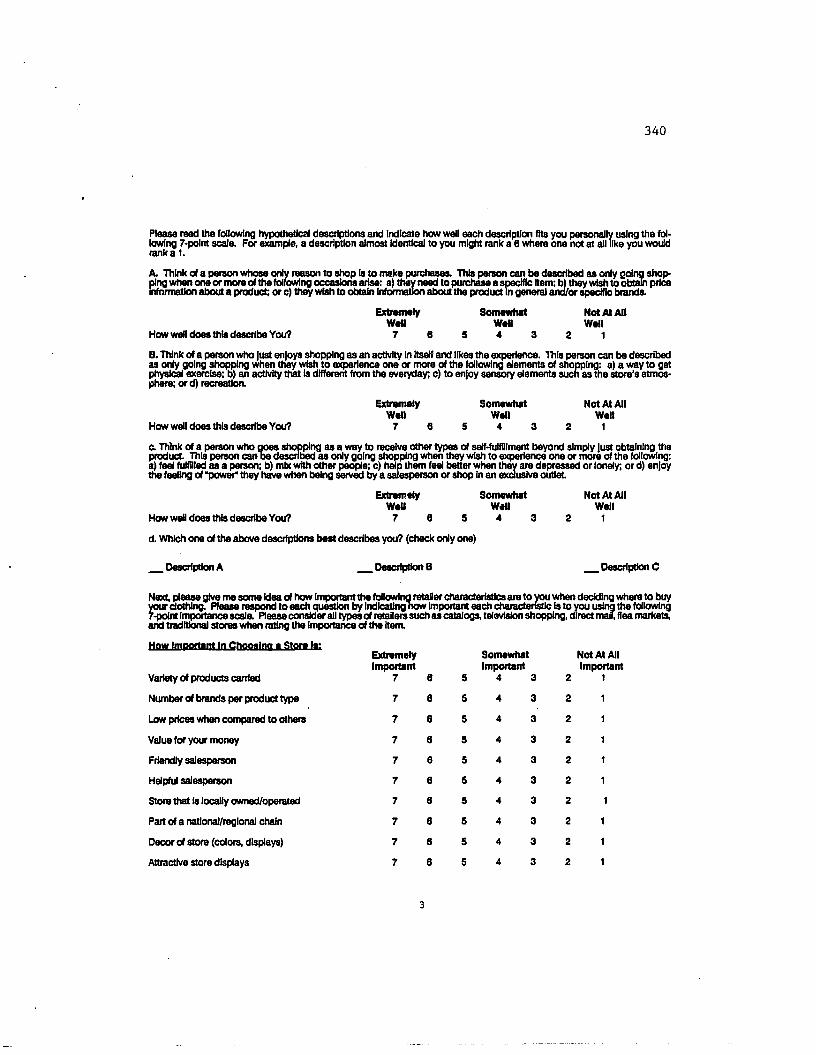
340
Please read the following hypothetical descriptions and Indicate how well each description fits you personally using the following 7-point scale. For example, a description almost Identical to you might rank a 6 where one not at all like you would rank a 1.
A. Think of a person whose only reason to shop la to make purchases. This person can be described as only going shopping when one or more of the following occasions arise: a) they need to purchase a specific Item; b) they wish to obtain price Information about a product; or c) they wish to obtain Information about the product In general and/or specific brands.
How weD does this describe You?
Extremely Weil
7 6
Somewhat WeU
5 4 3
Not At AOWell
2 1
B. Think of a person who just enjoys shopping as an activity In Itself and likes the experience. This person can be described as only going shopping when they wish to experience one or more of the following elements of shopping: a) a way to get physical exercise; b) an activity that is different from the everyday; c) to enjoy sensory elements sucn as the store's atmosphere; or d) recreation.
How well does this describe You?
Extremely Well
7 6
Somewhat Well
5 4 3
Not At A ll Well
2 1
c. Think of a person who goes shopping as a way to receive other types of self-fulfillment beyond simply Just obtaining the product. This person can be described as only going shopping when they wish to experience one or more of the following: a) feel fulfilled as a person; b) mix with other people; c) help them feel better when they are depressed or lonely; or d) enjoy the feeling of ‘power* they have when being served by a salesperson or shop In an exclusive outlet
Extremity Well
7 6How well does this describe You?
d. Which one of the above descriptions best describes you? (check only one)
SomewhatWell
5 4 3
Not At A ll Well
2 1
Description A Description B . Description C
Next please give me some Idea of how Important the following retailer characteristics are to you when deciding where to buy your dothlng. Please respond to each question by Indicating now Important each characteristic Is to you using the following 7-point Importance scale. Please consider ail types of retalers such as catalogs, television shopping, direct mail, flea markets,7-point Importance scale. Please consider ail types of retalers such as catalogs, television shopping, i and traditional stores when rating the Importance of the Item.
How Important In Choosing a Store la:
Variety of products carried
Number of brands per product type
Low prices when compared to others
Value for your money
Friendly salesperson
Helpful salesperson
Store that Is locally owned/operated
Part of a national/regional chain
Decor of store (colors, displays)
Attractive store displays
ExtremelyImportant
SomewhatImportant
Not At All Important
2 1
3
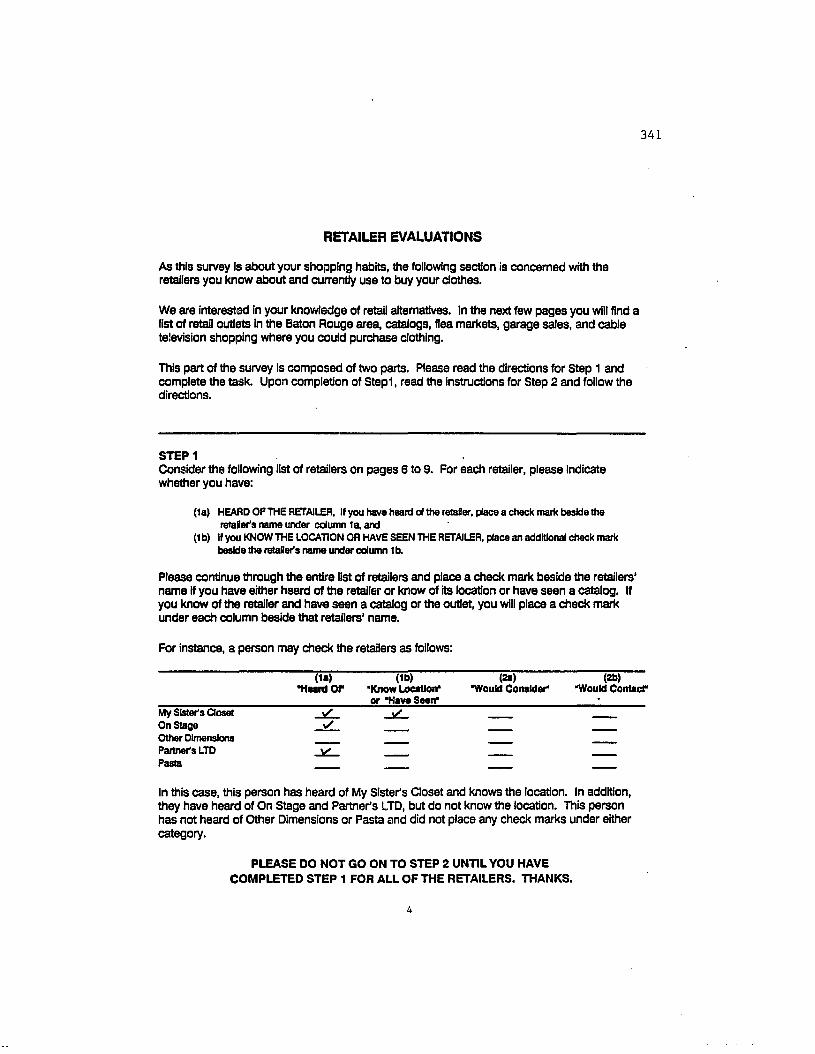
341
RETAILER EVALUATIONS
As this survey is about your shopping habits, the following section is concerned with the retailers you know about and currently use to buy your clothes.
We are interested in your knowledge of retail alternatives. In the next few pages you will find a list of retail outlets in the Baton Rouge area, catalogs, flea markets, garage sales, and cable television shopping where you could purchase clothing.
This part of the survey is composed of two parts. Please read the directions for Step 1 and complete the task. Upon completion of Stepl, read the instructions for Step 2 and follow the directions.
STEP 1Consider the following list of retailers on pages 6 to 9. For each retailer, please indicate whether you have:
(1a) HEARD OF THE RETAILER, If you have heard of the retailer, place a check mark beside the retaler's name under column 1a, and
(1 b) If you KNOW THE LOCATION OR HAVE SEEN THE RETAILER, place an additional check mark beside the retailer's name under column 1b.
Please continue through the entire list of retailers and place a check mark beside the retailers* name if you have either heard of the retailer or know of its location or have seen a catalog, if you know of the retailer and have seen a catalog or the outlet, you will place a check mark under each column beside that retailers* name.
For instance, a person may check the retailers as follows:
(la ) (lb ) (2a) (2b)"Hoard O f "Know Location* ‘Would Consider" "Would Contacr
________________________ or "Hav* Sean"____________________________ ;________My Sister's Closet OnStage Other Dimensions Partner's LTD Pasta
In this case, this person has heard of My Sister's Closet and knows the location. In addition, they have heard of On Stage and Partner’s LTD, but do not know the location. This person has not heard of Other Dimensions or Pasta and did not place any check marks under either category.
PLEASE DO NOT GO ON TO STEP 2 UNTIL YOU HAVE COMPLETED STEP 1 FOR ALL OF THE RETAILERS. THANKS.
4
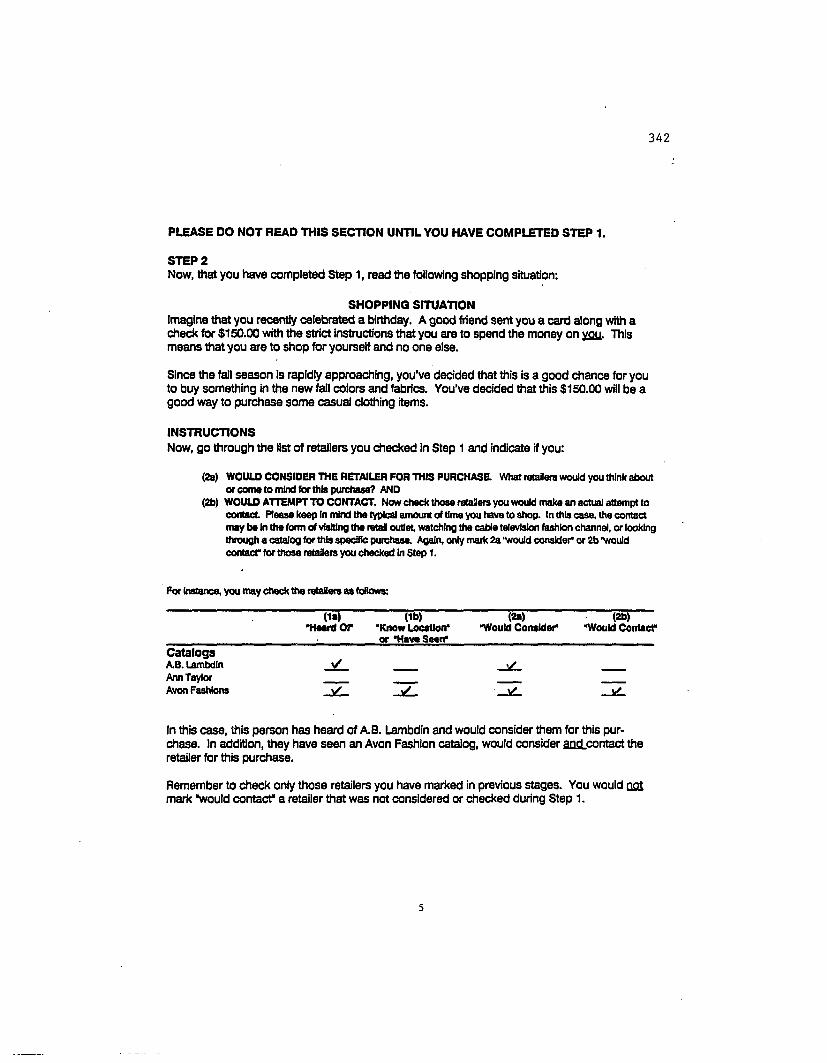
342
PLEASE DO NOT READ THIS SECTION UNTIL YOU HAVE COMPLETED STEP 1.
STEP 2Now, that you have completed Step 1, read the following shopping situation:
SHOPPING SITUATIONImagine that you recently celebrated a birthday. A good friend sent you a card along with a check for $150.00 with the strict instructions that you are to spend the money on you. This means that you are to shop for yourself and no one else.
Since the fall season is rapidly approaching, you've decided that this is a good chance for you to buy something in the new fall colors and fabrics. You’ve decided that this $150.00 will be a good way to purchase some casual clothing items.
INSTRUCTIONSNow, go through the list of retailers you checked in Step 1 and indicate if you:
(2a) WOULD CONSIDER THE RETAILER FOR THIS PURCHASE. What retailers would you think about or come to mind for this purchase? AND
(2b) WOULD ATTEMPT TO CONTACT. Now check those retailers you would make an actual attempt to contact Plaasa keep In mind the typical amount of time you have to shop. In this case, the contact may be In the form of visiting the ratal outlet watching the cable television fashion channel, or looking through a catalog for this specific purchase. Again, only mark 2a "would consider* or 2b "would contact" for those retalers you checked In Step 1.
For Instance, you may check the retalers as foRows:
( !• ) d«» (2a) (2b)"Heard Of ‘Know Location* "Would Consider* "Would Contact*
or “Have Seen*CatalogsA.B. Lambdln < / ____ i / ___________________Ann Taylor ____ ____ ____ ____Avon Fashions t / ✓ i / v /
In this case, this person has heard of A.B. Lambdin and would consider them for this purchase. In addition, they have seen an Avon Fashion catalog, would consider and contact the retailer for this purchase.
Remember to check only those retailers you have marked in previous stages. You would oat mark "would contact" a retailer that was not considered or checked during Step 1.
5

343
RETAILERS Stepl Step 2(1a) (lb ) (2a) (2b)
'Heard O f 'Know Location* "Would Consider* "Would Contact* or ‘Hava Sean*_____________________________________CatalogsA.B. Lambdln ____ ____ ____ ____Ann Taylor ____ ____ ____ ____Avon Fashions ____ ____ ____ ____Banana Republic______________________________ __ ___Bedford Fair__________________ ____ ____ ____ ____Camp Beverly Hills ____ ____ ____ ____Career Guild ____ ____ ____ ____Carroll Reed ____ ____ ____ ____Chadwicks of Boston ____ ____ ____ ____The Chelsea Collection ____ ____ ____ ____Clifford & Wills ____ ____ ____ ____Designer Direct ____ ____ ____ ____Eddie Bauer__________________ ____ ____ ____ ____E9een West___________________ ____ ____ ____ ____The Finals ____ ____ ____ ____First Editions___________________________________ ,_______ ________Frederick’s of Hollywood_____________ ____ ____ ____Freestyle ____ ____ ____ ____Gander Mountain, Inc__________________________ • ___ ___Garflnckel's ____ ____ ____ ____Honeybee____________________ ____ ____ ____ ____Horchow ____ ____ ____ ____Intimate Boutique ____ ____ ____ ____James Rivers Traders ____ ____ ____ ____J.C. Permeny’s ____ ____ ____ ____Jos. A. Bank Clothier ____ ___ _ ____ ____Joyce Holder/Just Bikini ____ ____ ____ ____Land's End _ _ ________Lemer Sport ____ ____ ____ ____L L Bean_________________________ ____ ____ ____Maryland Square___________________ ____ ____ ____NlghfN Day Intimates ____ ____ ____ ____Norm Thompson___________________ ____ ____ ____Old Pueblo Traders_____________ ____ ____ ____ ____Premiere Editions______________ ____ ____ ____ ____Royal Silk____________________ ____ ____ ____ ____Sears 1Shepler’s ____ ____ ____ ____Simply Tops ____ ____ ____ ____Spiegel______________________ ____ ____ ____ ____Sporty’s Preferred Living_________ ____ ____ ____ ____The Talbots ____ ____ ____ ____The Tog Shop ____ ____ ____ ____Trifle's ____ ____ ____ ____Tweed's ____ ____ ____ ____Victoria’s Secret ____ ____ ____ ____
Continue to next page
I
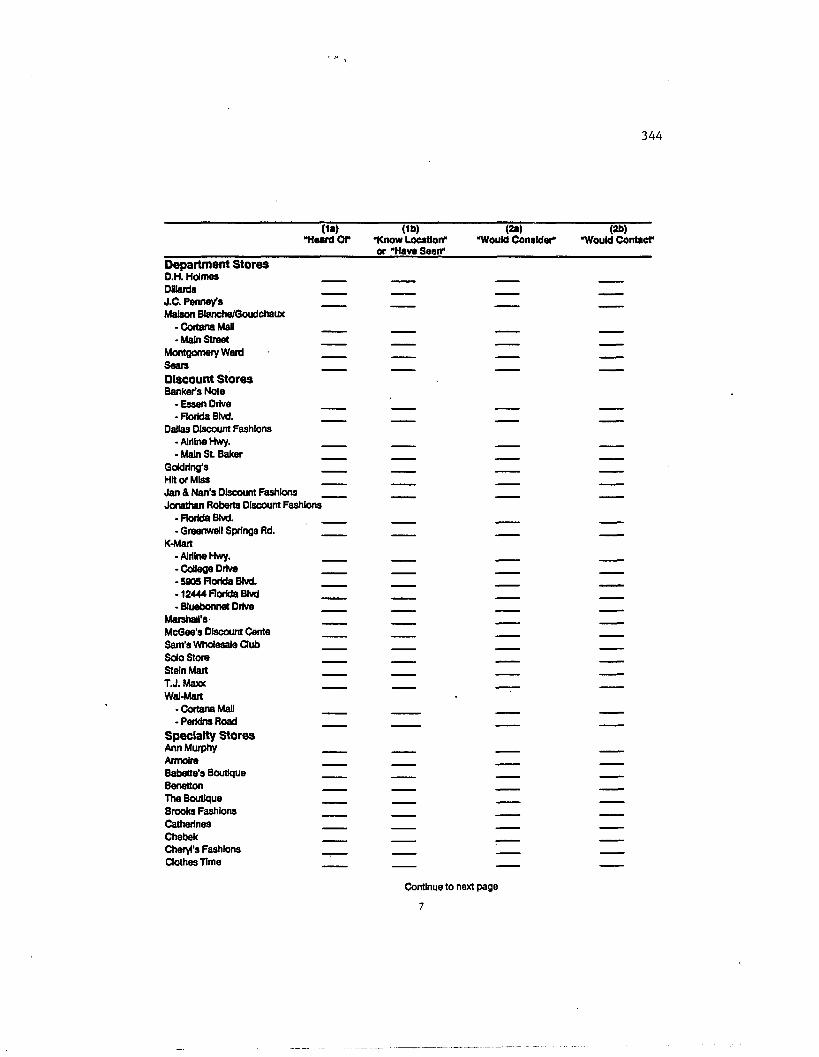
344
(la ) (1b) (2a) (2b)‘Heard O f ‘ Know Location* "Would Consider* "Would Contact* _____________ or ‘Have Seen*_____________________________________
Department StoresD.H. Holmes Dllards J.C. Penne/sMalson Blanche/Goudchaux
-CoftanaMaU- Main Street
Montgomery Ward SearsDiscount StoresBanker's Note
- Essen Drive- Florida Blvd.
Dallas Discount Fashions- Airline Hwy.- Main S t Baker
Goidrlng’sHit or MissJan & Nan’s Discount Fashions Jonathan Roberts Discount Fashions
• Florida Blvd.• Greenwell Springs Rd.
K-Mart- Airline Hwy.-College Drive- 5905 Florida Blvd.-12444 Florida Btvd- Bluebonnet Drive
Marshall'sMcGee's Discount Cente Sam's Wholesale Club Solo Store Stein Mart T.J. Maxx Wal-Mart
-CortanaMall• Perkins Road
Specialty Stores Arm Murphy ArmolreBabette's BoutiqueBenettonThe BoutiqueBrooks FashionsCatherinesCh9bskCheryl's Fashions Clothes Time
Continue to next page
7
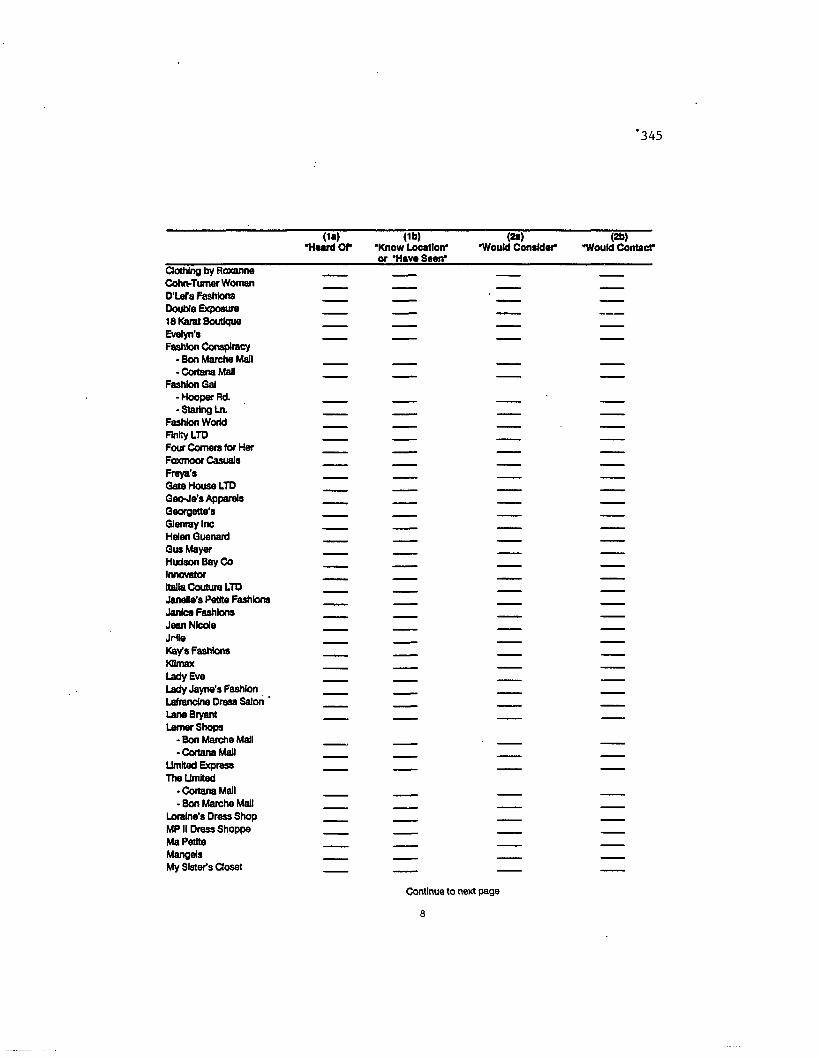
<1«) "Heard O r
(lb )"Know Location" or ‘Have Seen"
(2a)"Would Consider"
Clothing by Roxanne Cohn-Tumer Woman D ia l's Fashions Double Exposure 18 Karat Boutique Evelyn'sFashion Conspiracy
- Bon Marche Mall -CortanaMaJI
Fashion Gai- Hooper Rd.- Staring Ln.
Fashion World Flnlty LTDFour Corners for Her Faxmoor Casuals Freya'sGate House LTDGeo-Je's ApparelsGeorgette'sGlenray IncHelen GuenardGus MayerHudson Bay CoInnovatorItalia Couture LTDJanette's Petite FashionsJanice FashionsJean NicoleJrtleKay’s Fashions Kllmax Lady EveLady Jayne’s Fashion Laftandne Dress Salon ' Lane Bryant Lemer Shops
- Bon Marche Mall• CortanaMaU
Limited Express The Limited
• CottanaMall- Bon Marche Mall
Loraine's Dress Shop MPII Dress Shoppe Ma Petite MangelsMy Sister’s Closet
Continue to next page
8
(2b)"Would Contact"
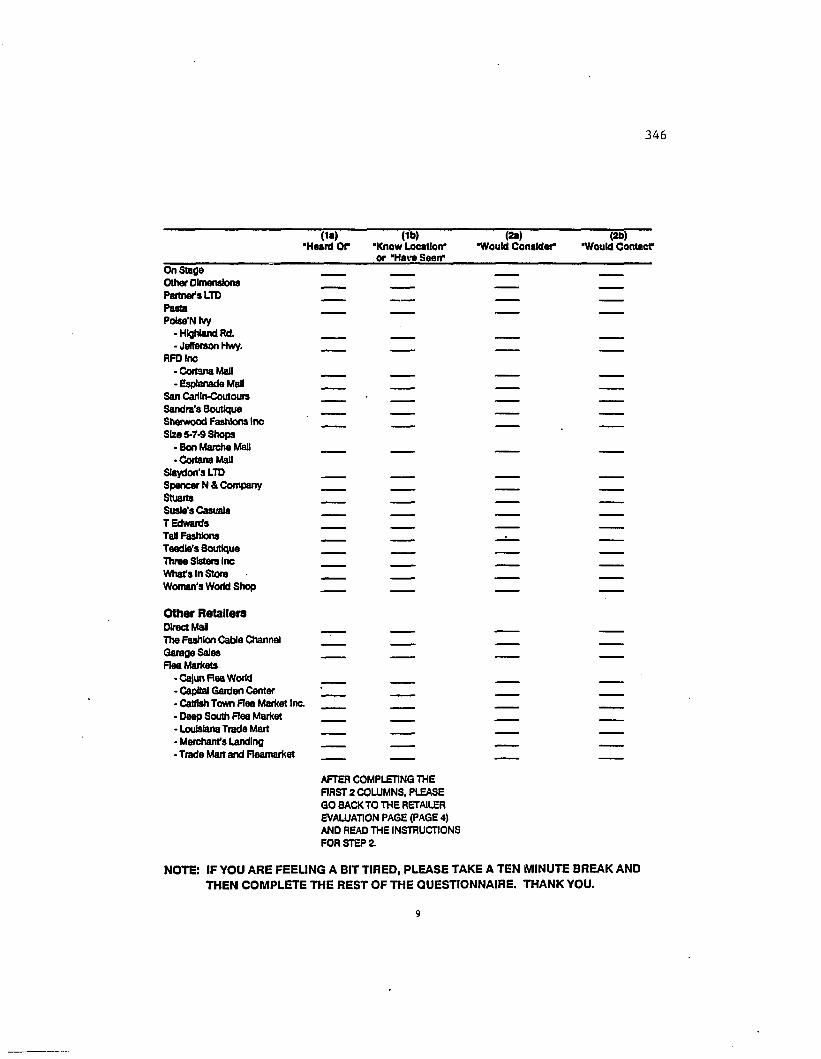
346
(is)■Heard O r
(lb )■Know Location* or “Have Seen*
(2a)■Would Consider
(2b)■Would Contact"
OnStage Other Dimensions Partner's LTD Pasta Polae'NIvy
- Highland Rd.- Jefferson Hwy.
RFD Inc-CortanaMall- Esplanade Mall
San Cart In-Coutoura Sandra's Boutique Sherwood Fashions Inc Size 5-7-9 Shops
- Bon Marche Mall• CortanaMall
Slaydon’s LTD Spencer N & Company StuartsSusie’s Casuals T Edwards Tall Fashions Teedle’s Boutique Three Sisters Inc What's In Store Woman’s World Shop
Other RetailersDirect MaiThe Fashion Cable Channel Garage Sales Flea Markets
•Cajun Rea World• Cajtfal Garden Center- Catfish Town Rea Market Inc.- Deep South Rea Market- Louisiana Trade Mart• Merchant's Landing- Trade Mart and Heamarket
AFTER COMPLETING THE RRST 2 COLUMNS. PLEASE GO BACK TO THE RETAILER EVALUATION PAGE (PAGE 4) AND READ THE INSTRUCTIONS FOR STEP 2.
NOTE: IF YOU ARE FEELING A BIT TIRED, PLEASE TAKE A TEN MINUTE BREAK AND THEN COMPLETE THE REST OF THE QUESTIONNAIRE. THANK YOU.
9

347
______________PART 3: ATTTTUDES ABOUT SHOPPING IN GENERAL_____________Now, I'd like you to consider the following statements about shopping In general, not just clothing shopping. Please tell me how much you personally agree or disagree with each one using the following scale.
Strongly Agree Neutral Disagree StronglyAgree Disagree5 4 3 2 1As an example, suppose that a statement was 1 And shopping to be a waste of time." If you strongly agreed with the statement, you would circle the numbers. If you disagree, answer with a 2 and so forth. Remember, we are only Interested In what you personally feel and think; there are no right or wrong answers.
Strongly StronglyStrongly Strongly Agree DisagreeAgree Disagree The stores In this area are not
acceptable to me. 5 4 3 2 1I usually buy the product or brandwhich Offers the best dollar value. 5 4 3 2 1
Browsing through catalogs Isawasteoftlm a 5 4 3 2 1
A salesperson should perform anyreasonable request I have. 5 4 3 2 1
A good shopper always hasenough Information about thepurchase before buying. 5 4 3 2 1
Worrying about clothing styles andfashion Is aw asteoftlm a 5 4 3 2 1
When shopping, I compare pricesbefore I make my selection. 5 4 3 2 1
I go shopping when I feel a needto be around other peopla 5 4 3 2 1
I enjoy looking at Interesting orattractive 3tore displays. 5 4 3 2 1
I love the "feel" of a store which IsIn tune with my needs and desires. 5 4 3 2 1
When the going gets tough,I go shopping. 5 4 3 2 1
When I’ve had a bad day, I And that buying something nice for myself makes me feel better. 5 4 3 2 1
I always make salespeople dropwhat they're doing to cater tomy needs. 5 4 3 2 1
I often daydream about theproducts I might buy. 5 4 3 2 1
The local retailers take more >Interest In you. 5 4 3 2 1
The exercise I get from shoppingdoes not help me to stay fit. 5 4 3 2 1
Sometimes just the thought of goingshopping helps me feel better. 5 4 3 2 1
Shopping Is a way to find newand different stores and products. 5 4 3 2 1
People should pay the ticketedprice rather than trying to bargainwith a retailer. 5 4 3 2 1
I often feel superior to the salespeople that wait on ma 5 4 3 2 1
People who believe that the onlyreason to shop Is to purchase anItem are missing out on the realjoy of shopping. 5 4 3 2 1
You can have fun by going togarage sales on the weekends. 5 4 3 2 1
You can enjoy shopping Justfor the fun of It 5 4 3 2 1
People who spend time gathering Information before making a purchase are just wasting their tlm a 5 4 3 2 1
One of the nice things about goingshopping Is the chance to meetnew and different peopla 5 4 3 2 1
National chain stores have atendency to treat customers poorly. 5 4 3 2 1
Watching the cable value networkand the fashion channel Is anactivity I en|oy. 5 4 3 2 1
To me shopping Is a recreational •activity. 5 4 3 2 1
I enjoy shopping at stores thatImply I’m wealthy and successful. 5 4 3 2 1
10
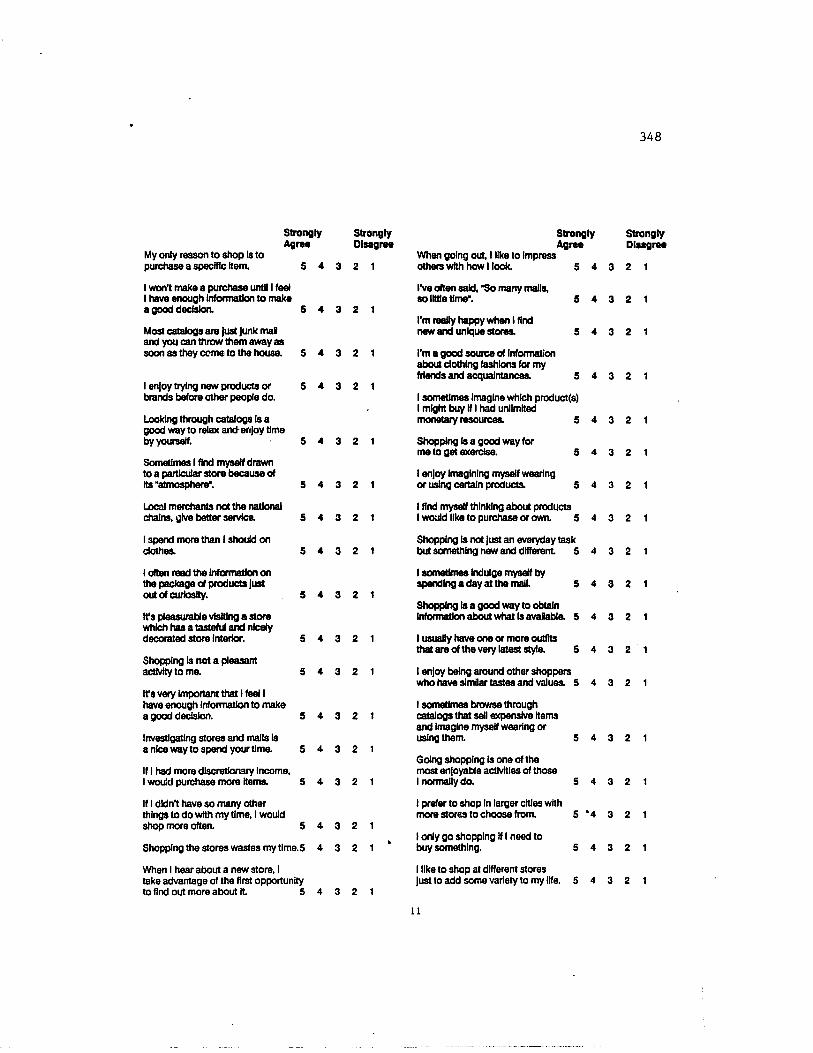
348
My only reason to shop Is to purchase a specific item.
StronglyAgree
I won't make a purchase until I feel I have enough Information to make a good decision. 5 4
StronglyDisagree
5 4 3 2 1
3 2 1
Most catalogs are just junk maland you can throw them away assoon as they come to the house. 5 4 3 2 1
I enjoy trying new products or 5 4 3 2 1brands before other people do.
Looking through catalogs Is agood way to relax and- enjoy timeby yourself. 5 4 3 2 1
Sometimes I And myself drawn to a particular store because of its 'atmosphere'. 5 4 3 2 1
Local merchants not the nationalchains, give better service. 5 4 3 2 1
I spend more than I should ondottles. 5 4 3 2 1
I often read the Information onthe package of products justout of curiosity. 5 4 3 2 1
It’s pleasurable visiting a store which has a tasteful and nicely decorated store interior. 5 4 3 2 1
Shopping l3 not a pleasantactivity to me. 5 4 3 2 1
It's very Important that I feel Ihave enough Information to makea good decision. 5 4 3 2 1
Investigating stores and malls Is a nice way to spend your time. 5 4 3 2 1
If I had more discretionary Income,I would purchase more Items. 5 4 3 2 1
If I didn't have so many otherthings to do with my time, I wouldshop more often. 5 4 3 2 1
Shopping the stores wastes my time.5 4 3 2 1
When I hear about a new store, Itake advantage of the first opportunityto And out more about it 5 4 3 2 1
When going out I like to Impress others with how I look.
I've often said, "So many malls, so little time'.
I'm really happy when I And new and unique stores.
I'm a good source of Information about dothlng fashions for my friends and acquaintances.
StronglyAgree
Shopping Is a good way for me to get exercise.
I enjoy Imagining myself wearing or using certain products.
I And myself thinking about products I would like to purchase or own. 5
Shopping Is not just an everyday task but something new and dffferent 5
I sometimes Indulge myself by spending a day at the mall 5 4
Shopping Is a good way to obtain Information about what Is avaBable. 5
I usually have one or more outfits that are of the very latest style. 5 4
I enjoy being around other shoppers who have simflar tastes and values. 5
I sometimes browse through catalogs that sell expensive items and Imagine myself wearing or using them.
Going shopping Is one of the most enjoyable activities of those I normally do.
I prefer to shop In larger cities with more stores to choose from.
I only go shopping AI need to buy something.
I like to shop at different stores Just to add some variety to my life.
5 4
5 4
StronglyDisagree
5 4 3 2 1
5 4 3 2 1
5 4 3 2 1
5 4 3 2 1
I sometimes Imagine which produces)I might buy if I had unlimitedmonetary resources. 5 4 3 2 1
5 4 3 2 1
5 4 3 2 1
3 2 1
3 2 1
3 2 1
3 2 1
3 2 1
3 2 1
5 4 3 2 1
5 4 3 2 1
5 *4 3 2 1
3 2 1
3 2 1
11
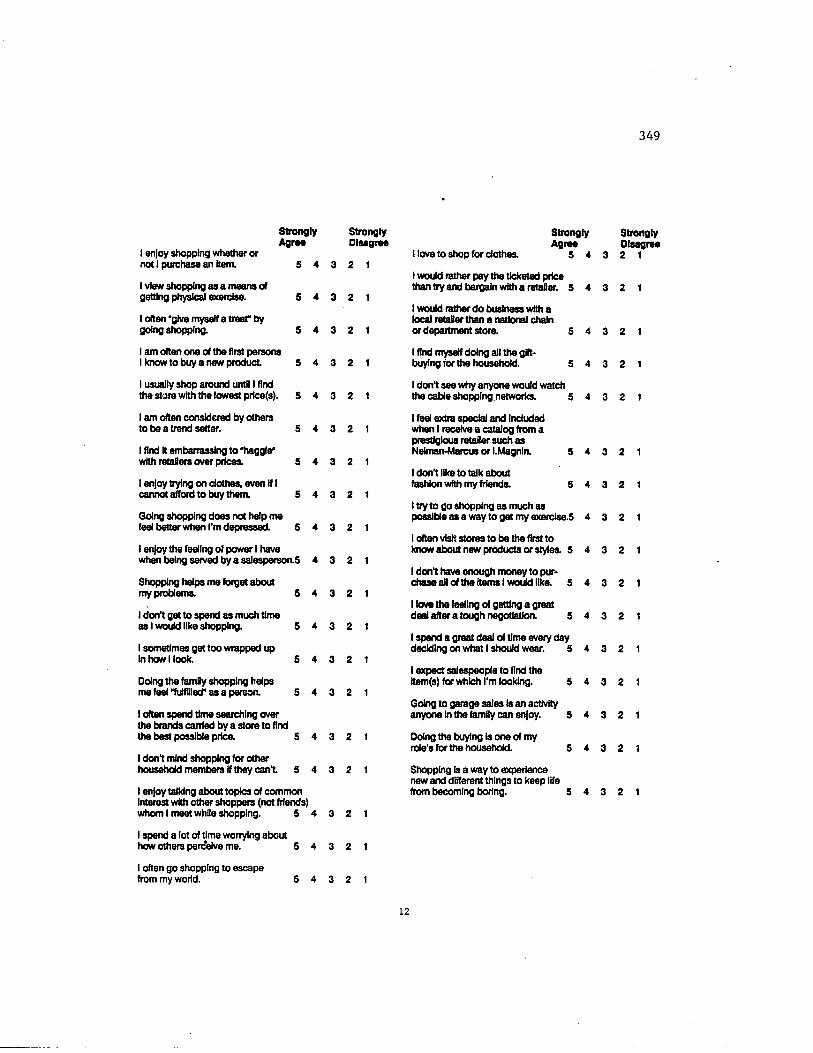
349
I enjoy shopping whether or not I purchase an item.
I view shopping as a means of getting physical exercise.
I often "give myself a treaT by going shopping.
Strongly StronglyAgree Disagree
5 4 3 2 1
5 4 3 2 1
5 4 3 2 1
I am often one of the first persons I know to buy a new product 5 4 3 2 1
I usually shop around until I findthe store with the lowest price(s). 5 4 3 2 1
I am often considered by othersto be a trend setter. 5 4 3 2 1
I And it embarrassing to "haggle*with retaSera over prices. 5 4 3 2 1
I enjoy trying on clothes, even If Icannot afford to buy them. 5 4 3 2 1
Going shopping does not help mefeel better when I'm depressed. 5 4 3 2 1
I enjoy the feeling of power I havewhen being served by a salesperson^ 4 3 2 1
Shopping helps me forget aboutmy problems. 5 4 3 2 1
I don't get to spend as much timeas I would like shopping. 5 4 3 2 1
I sometimes get too wrapped upIn how I look. 5 4 3 2 1
Doing the family shopping helpsme feel "fulfilled" as a person. 5 4 3 2 1
I often spend time searching overthe brands carried by a store to Andthe best possible price. 5 4 3 2 1
I don't mind shopping for otherhousehold members if they can t 5 4 3 2 1
I enjoy talking about topics of commonInterest with other shoppers (not friends)whom I meet while shopping. 5 4 3 2 1
I spend a lot of time worrying abouthow others percblve me. 5 4 3 2 1
I often go shopping to escape from my worid.
I love to shop for clothes.
StronglyAgree
5 4 :
I would rather pay the ticketed price than try and bargain with a retailer. 5 4 !
I would rather do business with a local retaSerthan a national chain or department store. 5 4 ;
I And myself doing all the gift- buying for the household. 5 4 ;
I don't see why anyone would watchthe cable shopping .networks. 5 4 :
I feel extra special and Included when I receive a catalog from a prestigious retailer such as Nelman-Marcus or I.Magnia 5 4 2
I don't like to talk about fashion with my friends. 5 4 !
I try to go shopping as much aspossible as a way to get my exerdse.5 4 2
I often visit stores to be the Arst toknow about new products or styles. 5 4 2
I don't have enough money to purchase ail of the Items I would like. 5 4 2
I love the feeling of getting a greatdeal after a tough negotiation. 5 4 2
I spend a great deal of time every day deciding on what I should wear. 5 4 2
I expect salespeople to And theltem(s) for which I'm looking. 5 4 2
Going to garage sales Is an activity anyone In the famBy can enjoy. 5 4 2
Doing the buying Is one of my role's for the household. 5 4 2
Shopping Is a way to experiencenew and different things to keep lifefrom becoming boring. 5 4 2
5 4 3 2 1
StronglyDisagree2 1
2 1
2 1
2 1
2 1
2 1
2 1
2 1
2 1
2 1
2 1
2 1
2 1
2 1
2 1
2 1
12
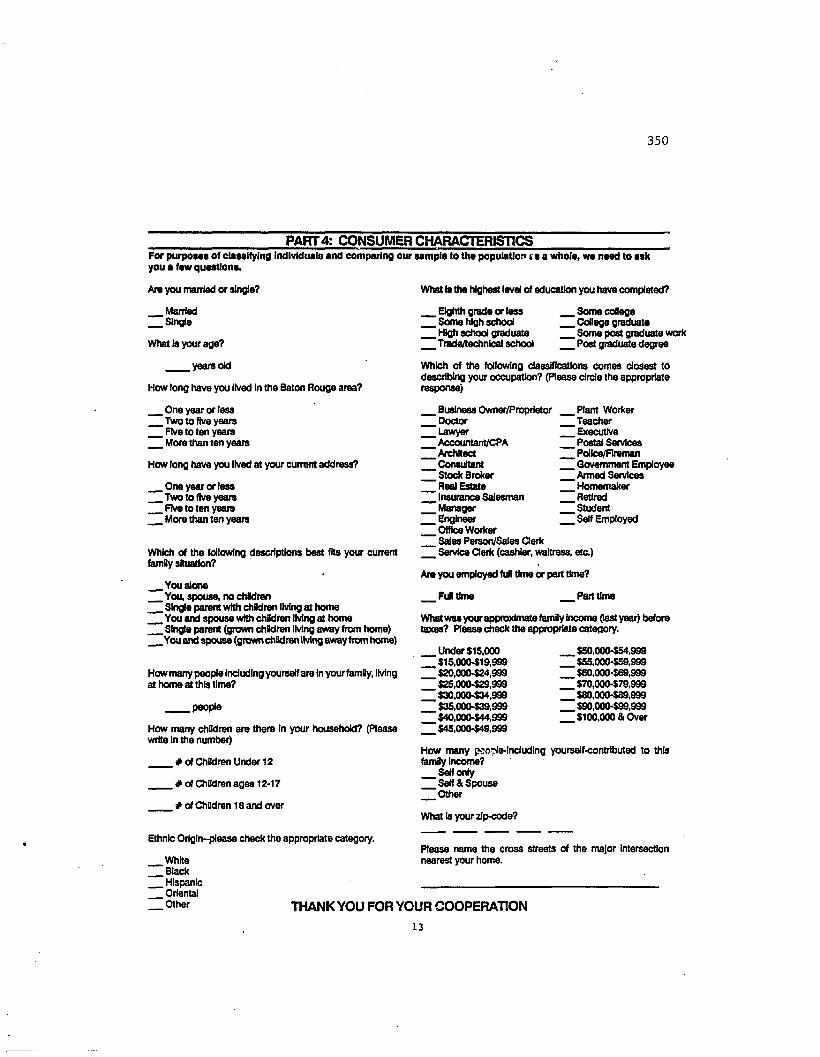
350
PART 4: CONSUMER CHARACTERISTICSFor purposes of classifying Individual!! and comparing our sampla to the population i s a w iiols, wa nssd to ask you a fsw questions.
Are you married or single?
Married Single
What is your age?
years old
How long have you lived In the Baton Rouge area?
One year or less Two to five years Five to ten years More than ten years
How long have you lived at your current address?
One year or less Two to five years Five to ten years More than ten years
Which of the following descriptions best fits your current family situation?
You alone You, spouse, no chldren Single parent with chldren living at home You and spouse with chldren living at home Single parent (grown chldren living away from home) You and spouse (grown chldren living away from home)
How many people Including yourself are In your family, living at home at this time?
people
How many children are there In your household? (Please write In the number)
# of Chldren Under 12
# of Children ages 12-17
* of Children 18 and over
Ethnic Origln-please check the appropriate category.
White Black Hispanic Oriental
Other
What Is the highest level of education you have completed?
Eighth grade or less Some high school High school graduate Trade/technical school
Some college College graduate Some post graduate work Post graduate degree
Which of the following classifications comes closest to describing your occupation? (Please circle the appropriate response)
.BusinessOwner/Proprietor __‘ Doctor "Lawyer‘ Accountant/CPA ‘ Architect [Consultant 'S tock Broker ‘ Real Estate [insurance Salesman [Manager 'Engineer [Office Worker _ Sales Person/Sales Clerk [ Service Clerk (cashier, waitress, etc.)
Plant WorkerTeacherExecutivePostal SendeesPollce/FIremanGovernment EmployeeArmed ServicesHomemakerRetiredStudentSelf Employed
Are you employed full time or part time?
Fufl time Part time
What was your approximate family Income (last year) before taxes? Please check the appropriate category.
Under $15,000 ' $15,000-519,999 '$20,000524,999 ' $25,000-$29,999 ' $30,000-534,999 '$35,000-539,999 ' 540,000-544,999 ' 545,000-549,999
$50,000-554,999 $55,000-559,999 $60,000-569,999 $70,000579,999 $80,000589,999 590,000599,999
$100,000 & Over
How many psrvpie-lndudlng yourself-contributed to this famfy Income? Self only Self&Spouse Other
What Is your zlp-code?
Please name the cross streets of the major Intersection nearest your home.
THANK YOU FOR YOUR COOPERATION13

Appendix B Shopping Motivation Scale Development Results (Stages 2 and 3)
351
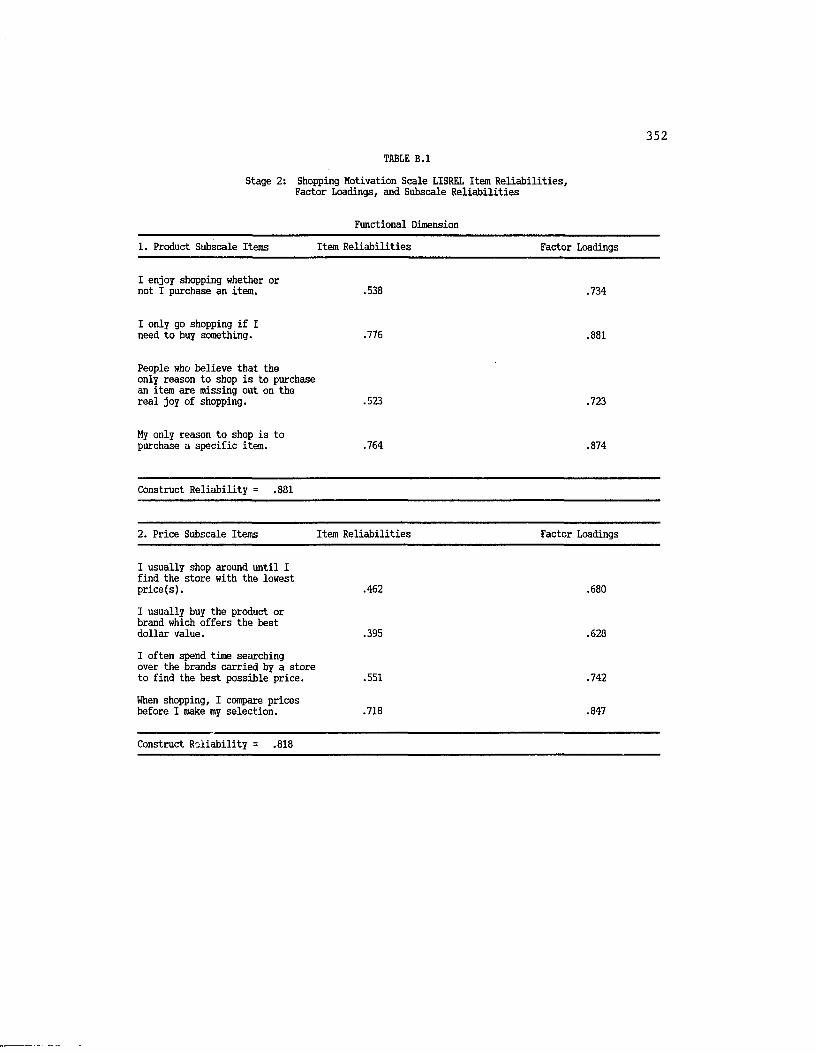
352TABLE B.l
Stage 2: Shopping Motivation Scale LISREL Item Reliabilities, Factor Loadings, and Subscale Reliabilities
Functional Dimension
1. Product Subscale Items Item Reliabilities Factor Loadings
I enjoy shopping whether or not I purchase an item. .538 .734
I only go shopping if I need to buy something. .776 .881
People who believe that the only reason to shop is to purchase an item are missing out on the real joy of shopping. .523 .723
My only reason to shop is to purchase a specific item. .764 .874
Construct Reliability = .881
2. Price Subscale Items Item Reliabilities Factor Loadings
I usually shop around until I find the store with the lowest price(s). .462 .680
I usually buy the product or brand which offers the bestdollar value. .395 .628
I often spend time searching over the brands carried by a storeto find the best possible price. .551 .742
When shopping, I compare pricesbefore I make my selection. .718 .847
Construct Reliability = .818
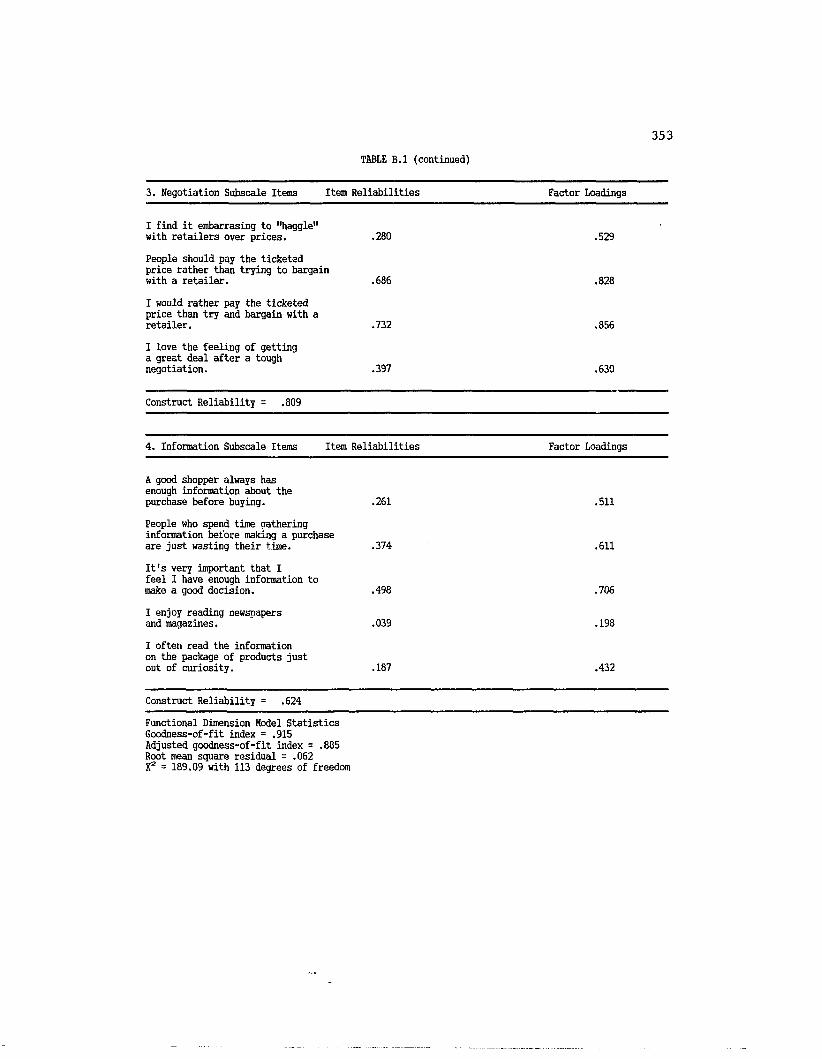
TABLE B.l (continued)
353
3. Negotiation Subscale Items Item Reliabilities Factor Loadings
I find it embarrasing to "haggle" with retailers over prices. .280 .529
People should pay the ticketed price rather than trying to bargain with a retailer. .686 .828
I would rather pay the ticketed price than try and bargain with a retailer. .732 .856
I love the feeling of getting a great deal after a tough negotiation. .397 .630
Construct Reliability = .809
4. Information Subscale Items Item Reliabilities Factor Loadings
A good shopper always has enough information about the purchase before buying. .261 .511
People who spend time gathering information before making a purchase are just wasting their time. .374 .611
It's very important that I feel I have enough information to make a good decision. .498 .706
I enjoy reading newspapers and magazines. .039 .198
I often read the information on the package of products just out of curiosity. .187 .432
Construct Reliability = .624
Functional Dimension Hodel Statistics Goodness-of-fit index = .915 Adjusted goodness-of-fit index = .885 Root mean square residual = .062 X2 = 189.09 with 113 degrees of freedom
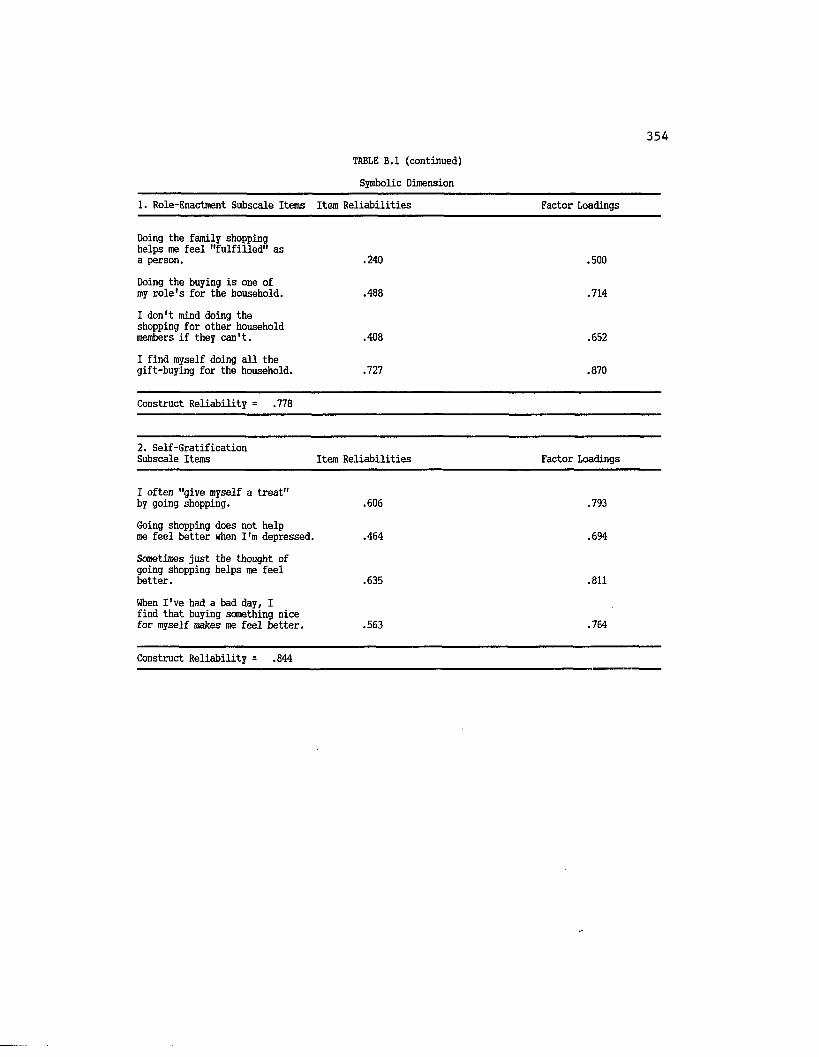
354TABLE B.l (continued)
Symbolic Dimension
1. Role-Enactroent Subscale Items Item Reliabilities Factor Loadings
Doing the family shopping helps me feel "fulfilled" as a person. .240 .500
Doing the buying is one of my role's for the household. .488 .714
I don't mind doing the shopping for other household members if they can't. .408 .652
I find myself doing all the gift-buying for the household. .727 .870
Construct Reliability = .778
2. Self-Gratification Subscale Items Item Reliabilities Factor Loadings
I often "give myself a treat" by going shopping. .606 .793
Going shopping does not help me feel better when I'm depressed. .464 .694
Sometimes just the thought of going shopping helps me feel better. .635 .811
When I've had a bad day, I find that buying something nice for myself makes me feel better. .563 .764
Construct Reliability = .844
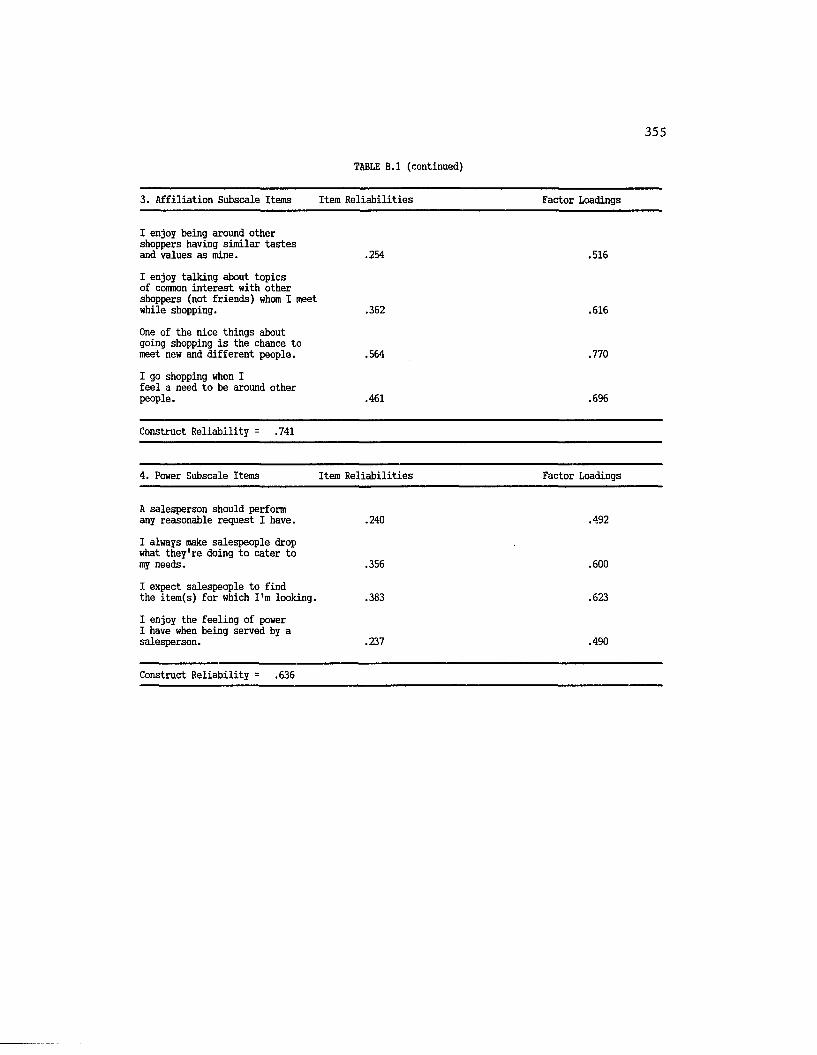
355
TABLE B.l (continued)
3. Affiliation Subscale Items Item Reliabilities Factor Loadings
I enjoy being around other shoppers having similar tastes and values as mine. .254 .516
I enjoy talking about topics of common interest with other shoppers (not friends) whom I meet while shopping. .362 .616
One of the nice things about going shopping is the chance to meet new and different people. .564 .770
I go shopping when Ifeel a need to be around otherpeople. .461 .696
Construct Reliability = .741
4. Power Subscale Items Item Reliabilities Factor Loadings
A salesperson should perform any reasonable request I have. .240 .492
I always make salespeople drop what they're doing to cater to my needs. .356 .600
I expect salespeople to find the item(s) for which I'm looking. .383 .623
I enjoy the feeling of power I have when being served by a salesperson. .237 .490
Construct Reliability = .636
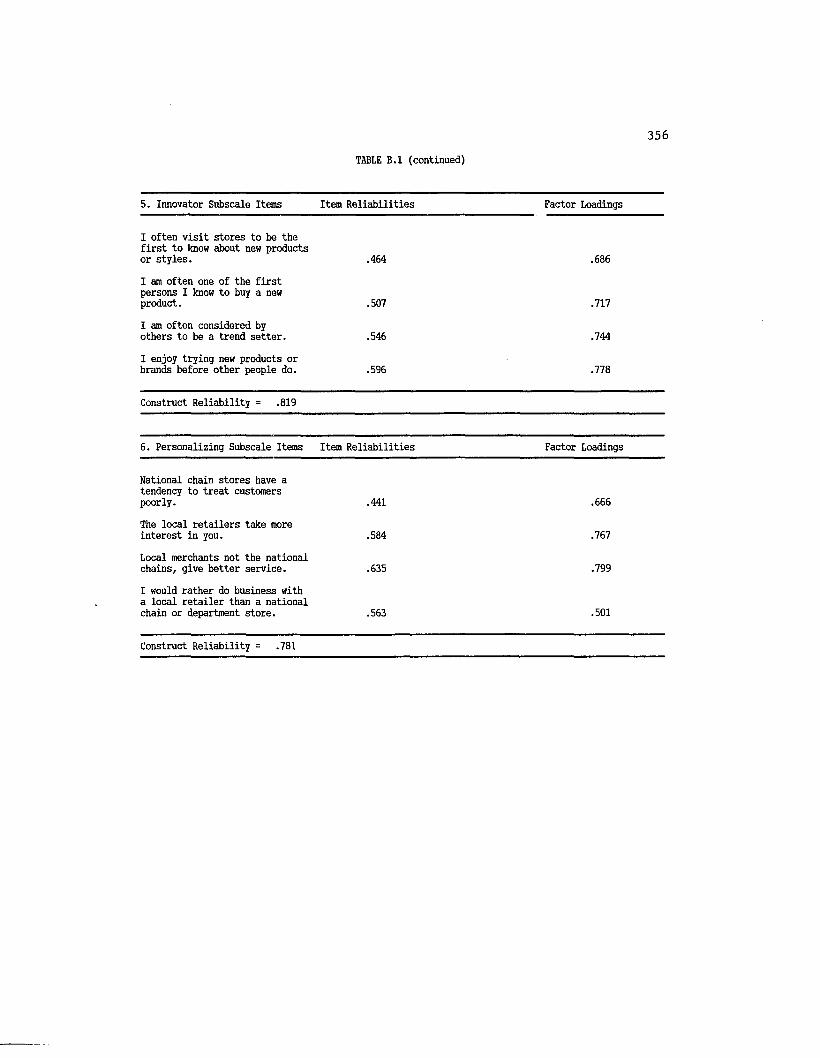
TABLE B.l (continued)
356
5. Innovator Subscale Items Item Reliabilities Factor Loadings
I often visit stores to be the first to know about new products or styles. .464 .686
I am often one of the first persons I know to buy a new product. .507 .717
I am often considered by others to be a trend setter. .546 .744
I enjoy trying new products or brands before other people do. .596 .778
Construct Reliability = .819
6. Personalizing Subscale Items Item Reliabilities Factor Loadings
National chain stores have a tendency to treat customers poorly. .441 .666
The local retailers take more interest in you. .584 .767
Local merchants not the national chains, give better service. .635 .799
I would rather do business with a local retailer than a national chain or department store. .563 .501
Construct Reliability = .781
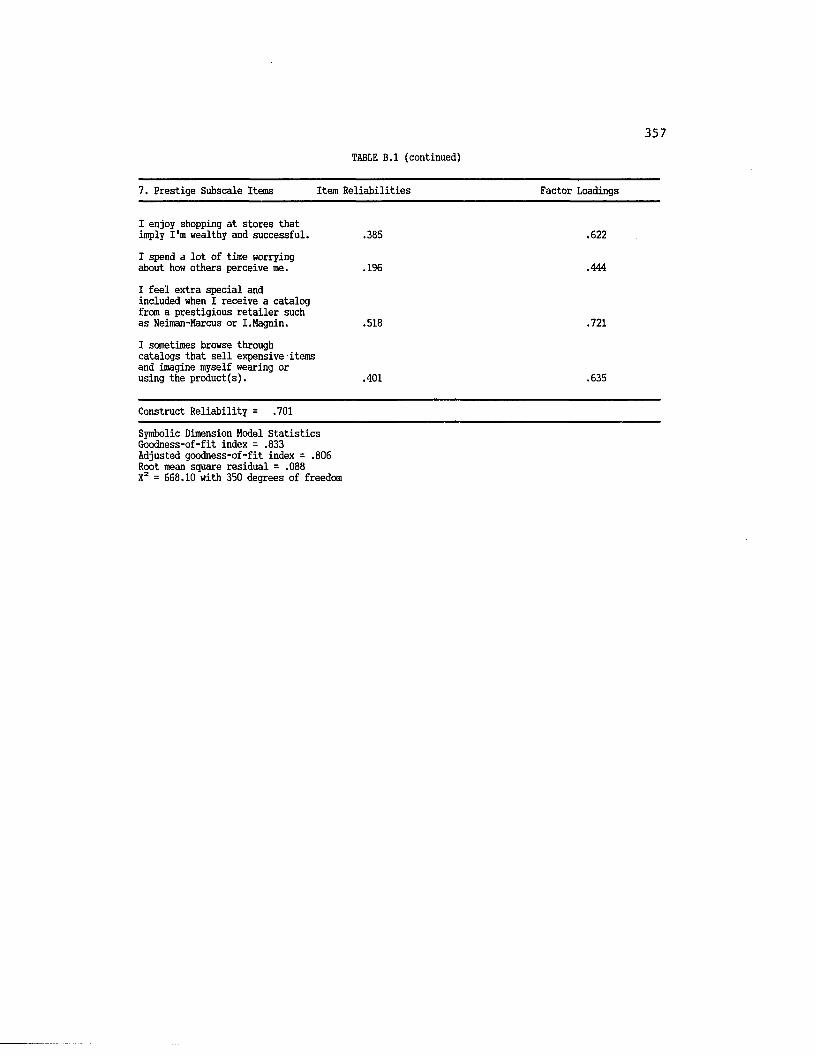
357T&BLE B.l (continued)
7. Prestige Subscale Items Item Reliabilities Factor Loadings
I enjoy shopping at stores that imply I'm wealthy and successful. .385 .622
I spend a lot of time worrying about how others perceive me. .196 .444
I feel extra special and included when I receive a catalog from a prestigious retailer such as Neiman-Marcus or I.Magnin. .518 .721
I sometimes browse through catalogs that sell expensive items and imagine myself wearing or using the product(s). .401 .635
Construct Reliability = .701
Symbolic Dimension Model Statistics Goodness-of-fit index = .833 Adjusted goodness-of-fit index = .806 Root mean square residual = .088 Xz = 668.10 with 350 degrees of freedom

358TABLE B.l (continued)
Experiential Dimension
1. Exercise Subscale Items Item Reliabilities Factor Loadings
The exercise I get from shopping does not help me to stay fit. .169 .414
I try to go shopping as much as possible as a way to get my exercise. .468 .690
Shopping is a goof way for me to get exercise. .744 .869
I view shopping as a means of getting physical exercise. .725 .858
Construct Reliability = .809
2. Diversion Subscale Items Item Reliabilities Factor Loadings
I often go shopping to escape from my world. .701 .837
Shopping is not just an everyday task but something new and different. .411 .641
Shopping helps me forget about my problems. .611 .782
Shopping is a way to experience new and different things to keep life from becoming boring. .695 .834
Construct Reliability = .858

TABLE B.l (continued)359
3. Sensory Stimulation Subscale Items Item Reliabilities Factor Loadings
It's pleasurable visiting a store which has a tasteful and nicely decorated store interior. .397 .631
I love the "feel" of a store which is in tune with my needs and desires. .459 .678
I enjoy looking at interesting or attractive store displays. .555 .746
Sometimes I find myself drawn to a particular store because of its "atmosphere". .474 .689
Construct Reliability = .780
4. Cognitive Stimulation Subscale Items Item Reliabilities Factor Loadings
I find myself thinking about products I would like to purchase or own. .531 .728
I often daydream about the pn ducts I might buy. .694 .833
I sometimes imagine which product(s) I might buy if I had unlimited monetary resources. .544 .737
I enjoy imagining myself wearing or using certain products. .536 .732
Construct Reliability = .844
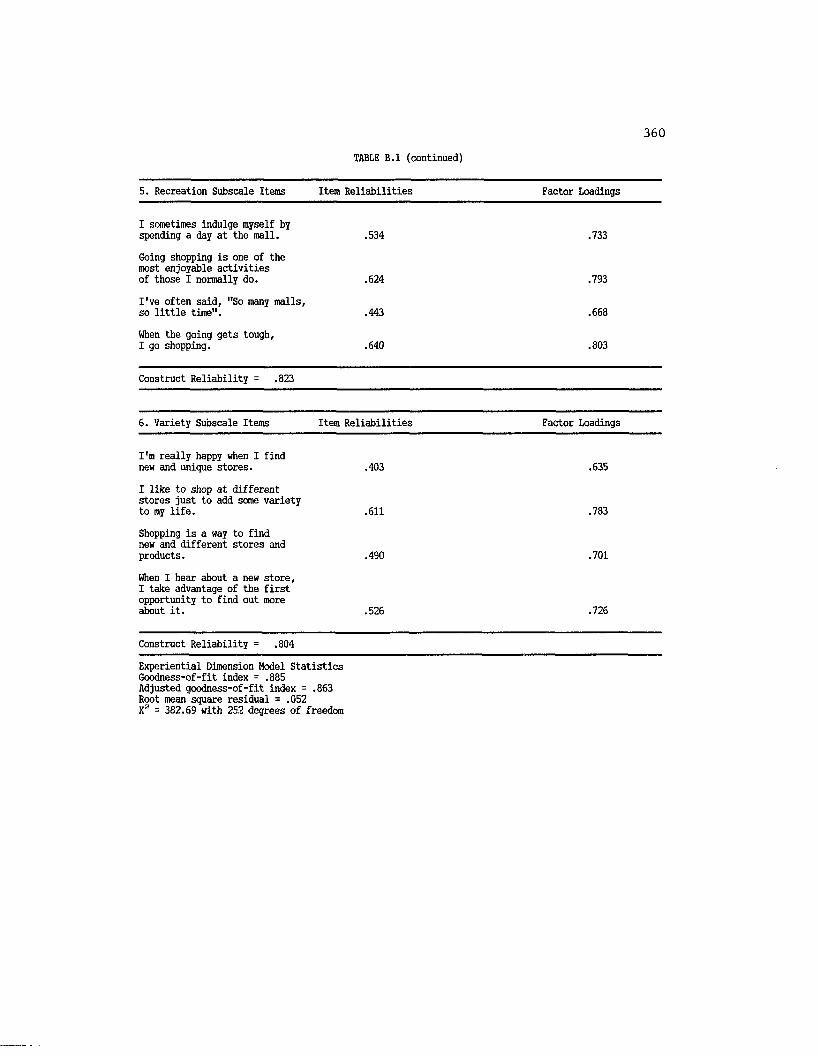
TABLE B.l (continued)
360
5. Recreation Subscale Items Item Reliabilities Factor Loadings
I sometimes indulge myself by spending a day at the mall. .534 .733
Going shopping is one of the most enjoyable activities of those I normally do. .624 .793
I've often said, "So many malls, so little time". .443 .668
When the going gets tough, I go shopping. .640 .803
Construct Reliability = .823
6. Variety Subscale Items Item Reliabilities Factor Loadings
I'm really happy when I find new and unique stores. .403 .635
I like to shop at different stores just to add some variety to my life. .611 .783
Shopping is a way to find new and different stores and products. .490 .701
When I hear about a new store, I take advantage of the first opportunity to find out more about it. .526 .726
Construct Reliability = .804
Experiential Dimension Model Statistics Goodness-of-fit index = .885 Adjusted goodness-of-fit index = .863 Root mean square residual = .052 X2 = 382.69 with 252 degrees of freedom

361TABLE B.2
Stage 3: Shopping Motivation Item Analysis
Functional Dimension
1. Product Subscale Item MeanStandardDeviation
Item-TotalCorrelation
Alpha if Item Deleted
I only go shopping if I need to buy something. 3.11 1.3520 .7097 .7799
My only reason to shop is to purchase a specific item. 3.05 1.2219 .7452 .7659
I enjoy shopping whether or not I purchase an item. 2.94 1.2504 .6875 .7901
People who believe that the only reason to shop is to purchase an item are missing out on the real joy of shopping. 3.12 1.2813 .5562 .8461
Standardized Item Alpha = .8403
2. Price Subscale Item MeanStandardDeviation
Item-TotalCorrelation
Alpha if Item Deleted
I usually shop around until I find the store with the lowest price(s). 3.07 1.1915 .6126 .7255
I often spend time searching over the brands carried by a store to find the best possible price. 3.33 1.2320 .6710 .6906
I usually buy the product or brand which offers the best dollar value. 3.99 .9842 .5215 .7674
When shopping, I compare prices before I make my selection. 3.92 .9942 .5827 .7402
Standardized Item Alpha = .7867
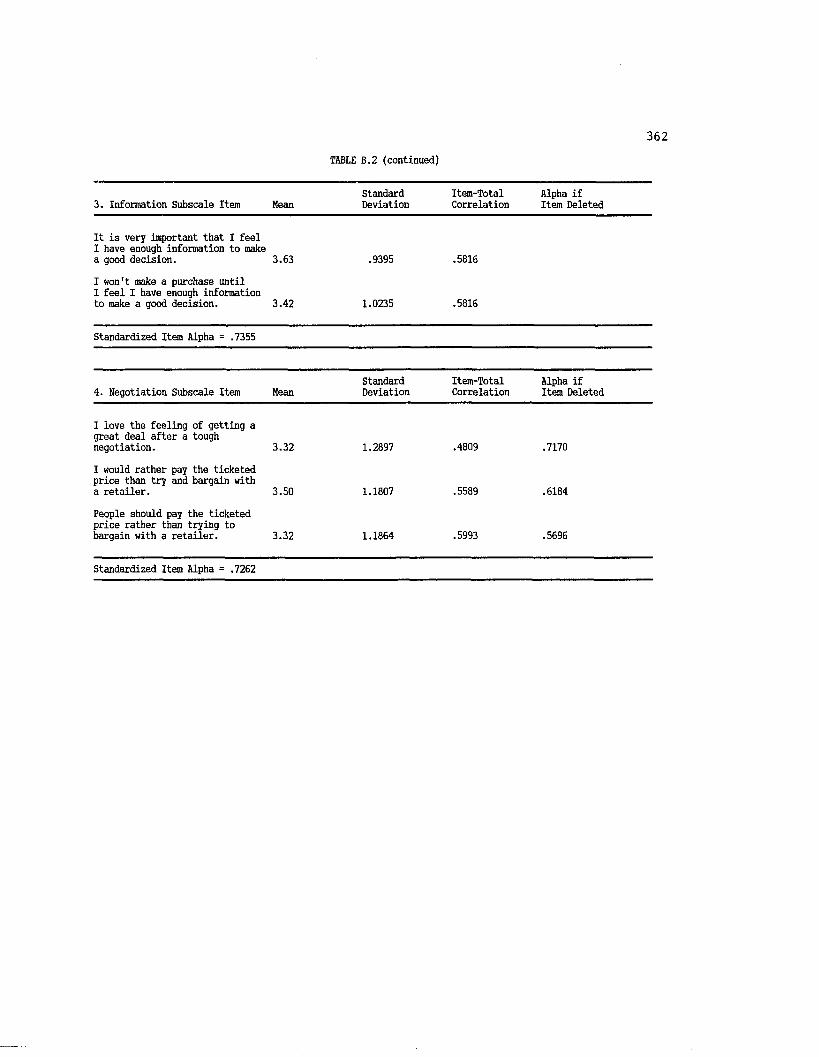
362TABLE B.2 (continued)
3. Information Subscale Item KeanStandardDeviation
Item-TotalCorrelation
Alpha if Item Deleted
It is very important that I feel I have enough information to make a good decision. 3.63 .9395 .5816
I won't make a purchase until I feel I have enough information to make a good decision. 3.42 1.0235 .5816
Standardized Item Alpha = .7355
4. Negotiation Subscale Item MeanStandardDeviation
Item-TotalCorrelation
Alpha if Item Deleted
I love the feeling of getting a great deal after a tough negotiation. 3.32 1.2897 .4809 .7170
I would rather pay the ticketed price than try and bargain with a retailer. 3.50 1.1807 .5589 .6184
People should pay the ticketed price rather than trying to bargain with a retailer. 3.32 1.1864 .5993 .5696
Standardized Item Alpha = .7262
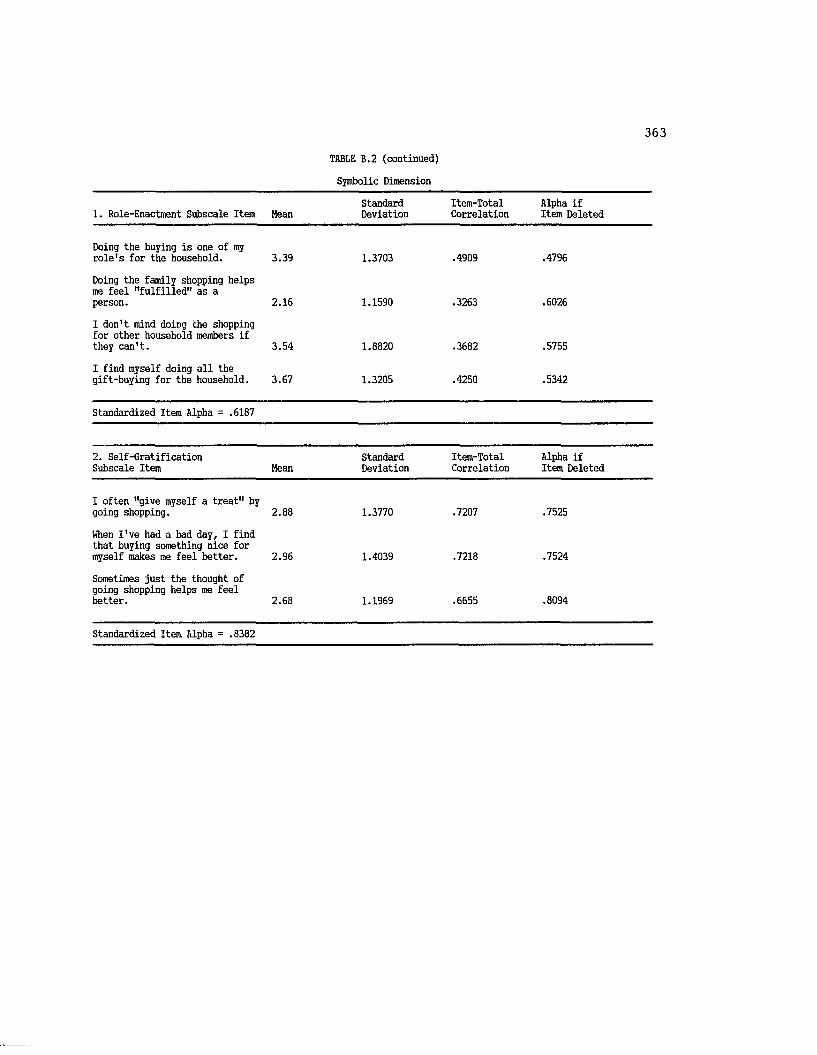
363TABLE B.2 (continued)
Symbolic Dimension
1. Role-Enactment Subscale Item MeanStandardDeviation
Item-TotalCorrelation
Alpha if Item Deleted
Doing the buying is one of my role's for the household. 3.39 1.3703 .4909 .4796
Doing the family shopping helps me feel "fulfilled" as a person. 2.16 1.1590 .3263 .6026
I don't mind doing the shopping for other household members if they can't. 3.54 1.8820 .3682 .5755
I find myself doing all the gift-buying for the household. 3.67 1.3205 .4250 .5342
Standardized Item Alpha = .6187
2. Self-Gratification Subscale Item Mean
StandardDeviation
Item-TotalCorrelation
Alpha if Item Deleted
I often "give myself a treat" by going shopping. 2.88 1.3770 .7207 .7525
When I've had a bad day, I find that buying something nice for myself makes me feel better. 2.96 1.4039 .7218 .7524
Sometimes just the thought of going shopping helps me feel better. 2.68 1.1969 .6655 .8094
Standardized Item Alpha = .8382

364
TABLE B.2 (continued)
3. Affiliation Subscale Item MeanStandardDeviation
Item-TotalCorrelation
Alpha if Item Deleted
I enjoy talking about topics of common interest with other shoppers (not friends) whom I meet while shopping. 2.60 1.2792 .5316 .6809
I enjoy being around other shoppers who have similar tastes and values as mine. 3.13 1.1840 .5126 .6893
One of the nice things about going shopping is the chance to meet new and different people. 2.33 1.0852 .6056 .6397
I go shopping when I feel a need to be around other people. 1.87 1.1079 .4828 .7050
Standardized Item Alpha = .7410
4. Power Subscale Item MeanStandardDeviation
Item-TotalCorrelation
Alpha if Item Deleted
I enjoy the feeling of power I have when being served by a salesperson. 1.67 .9835 .5431 .5311
I always make salespeople drop what they're doing to cater to my needs. 1.64 .9516 .4861 .6048
I often feel superior to the sales people that wait on me. 2.04 1.0918 .4686 .6340
Standardized Item Alpha = .6863

365TABLE B.2 (continued)
5. Innovator Subscale Item MeanStandardDeviation
Item-TotalCorrelation
Alpha if Item Deleted
I am often one of the first persons I know to buy a new product. 2.24 1.555 .7715 .8034
I am often considered by others to be a trend setter. 2.21 1.1579 .7191 .8249
I enjoy trying new products or brands before other people do. 2.81 1.1704 .6337 .8592
I often visit stores to be the first to know about new products or styles. 2.11 1.1706 .7325 .8194
Standardized Item Alpha = .8648
6. Personalizing Subscale Item MeanStandardDeviation
Item-TotalCorrelation
Alpha if Item Deleted
Local merchants not the national chains give better service. 2.92 .9948 .6033 .5359
I would rather do business with a local retailer than a national chain or department store. 2.87 1.1240 .5118 .6450
The local retailers take more interest in you. 2.82 1.0714 .4800 .6801
Standardized Item Alpha = .7141

366TABLE B.2 (continued)
7. Prestige Subscale Item MeanStandardDeviation
Item-TotalCorrelation
Alpha if Item Deleted
I spend a lot of time worrying about how others perceive me. 2.47 1.2584 .5019 .7356
I feel extra special and included when I receive a catalog from a prestigious retailer even if I can't afford to purchase anything.2.58 1.2700 .6282 .6688
I sometimes browse through catalogs that sell expensive items and imagine myself wearing or using the product(s). 3.17 1.4135 .5950 .6869
I enjoy shopping at stores that imply I'm wealthy and successful. 2.26 1.2401 .5217 .7255
Standardized Item Alpha = .7617
Experiential Dimension
1. Exercise Subscale Item MeanStandardDeviation
Item-TotalCorrelation
Alpha if Item Deleted
Shopping is a way for me to get my exercise. 2.16 1.1972 .7817 .8395
I view shopping as a means of getting physical exercise. 1.89 1.0835 .8332 .7864
I try to go shopping as much as possible as a way to get my exercise. 1.73 .9896 .7313 .8785
Standardized Item Alpha = .8875
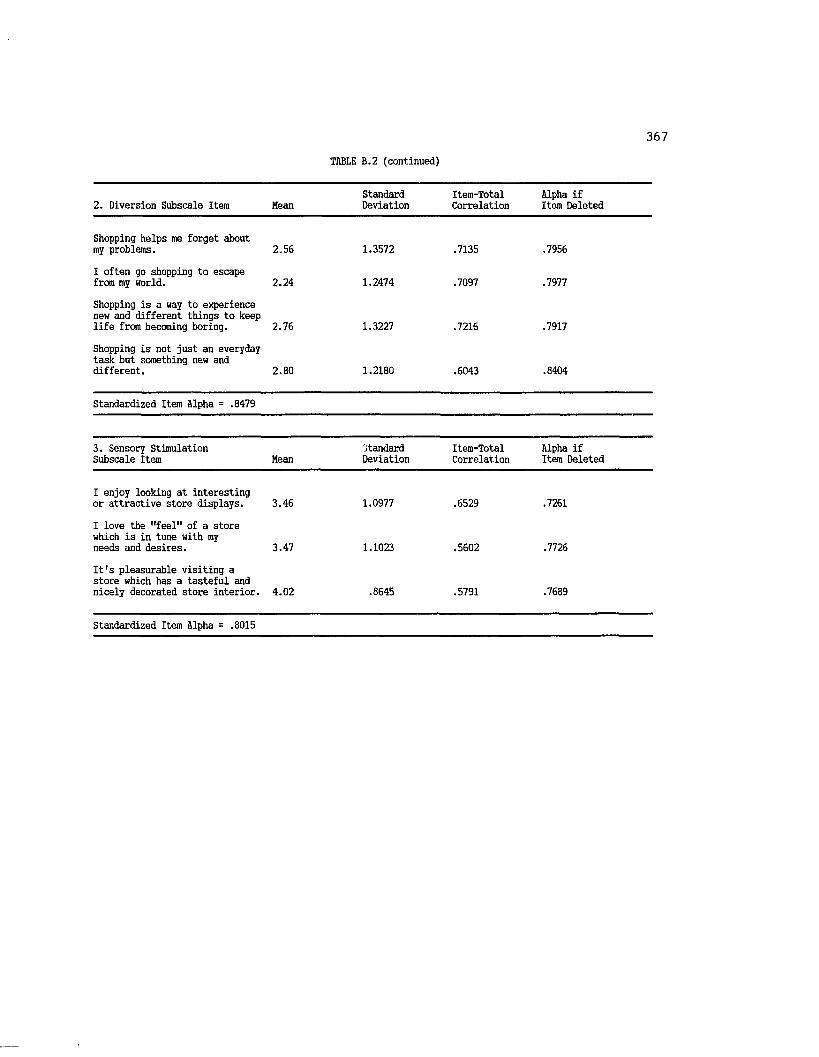
367TABLE B.2 (continued)
2. Diversion Subscale Item MeanStandardDeviation
Item-TotalCorrelation
Alpha if Item Deleted
Shopping helps me forget about my problems. 2.56 1.3572 .7135 .7956
I often go shopping to escape from my world. 2.24 1.2474 .7097 .7977
Shopping is a way to experience new and different things to keep life from becoming boring. 2.76 1.3227 .7216 .7917
Shopping is not just an everyday task but something new and different. 2.80 1.2180 .6043 .8404
Standardized Item Alpha = .8479
3. Sensory Stimulation Subscale Item Mean
jtandardDeviation
Item-TotalCorrelation
Alpha if Item Deleted
I enjoy looking at interesting or attractive store displays. 3.46 1.0977 .6529 .7261
I love the "feel" of a store which is in tune with my needs and desires. 3.47 1.1023 .5602 .7726
It's pleasurable visiting a store which has a tasteful and nicely decorated store interior. 4.02 .8645 .5791 .7689
Standardized Item Alpha = .8015
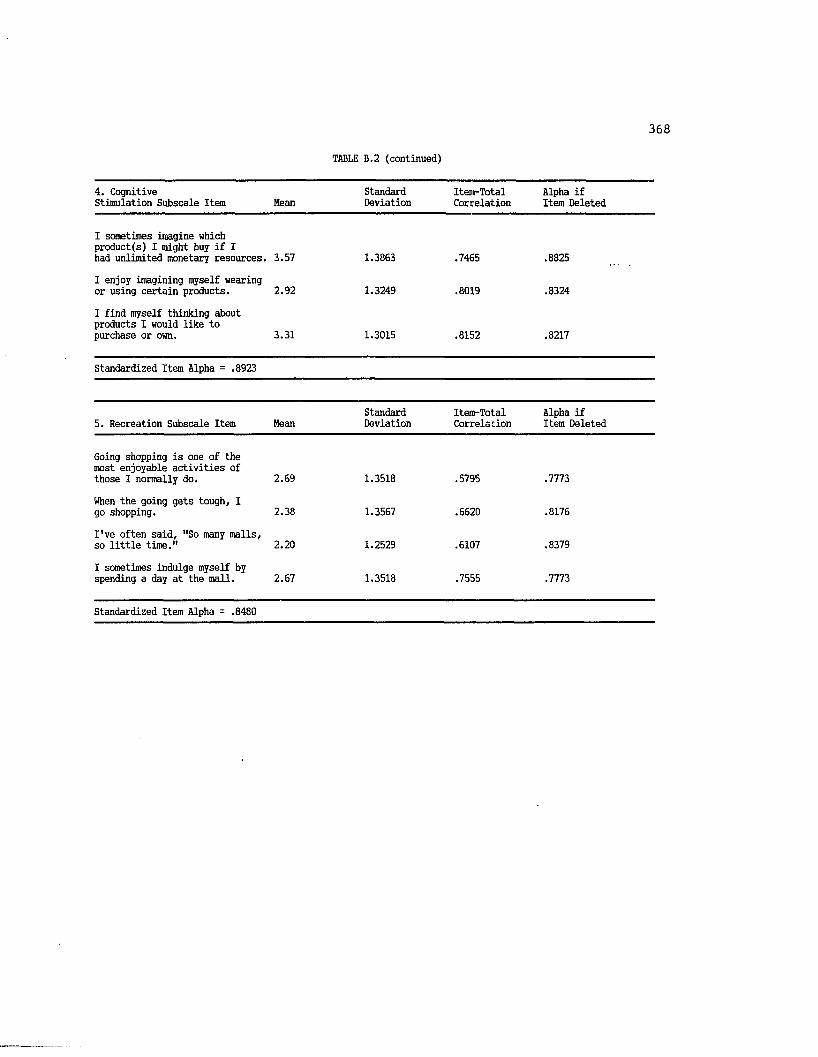
368
TABLE B.2 (continued)
4. CognitiveStimulation Subscale Item Mean
StandardDeviation
Item-TotalCorrelation
Alpha if Item Deleted
I sometimes imagine which product(s) I might buy if I had unlimited monetary resources. 3.57 1.3863 .7465 .8825
I enjoy imagining myself wearing or using certain products. 2.92 1.3249 .8019 .8324
I find myself thinking about products I would like to purchase or own. 3.31 1.3015 .8152 .8217
Standardized Item Alpha = .8923
5. Recreation Subscale Item MeanStandardDeviation
Item-TotalCorrelation
Alpha if Item Deleted
Going shopping is one of the most enjoyable activities of those I normally do. 2.69 1.3518 .5795 .7773
When the going gets tough, I go shopping. 2.38 1.3567 .6620 .8176
I've often said, "So many malls, so little time." 2.20 1.2529 .6107 .8379
I sometimes indulge myself by spending a day at the mall. 2.67 1.3518 .7555 .7773
Standardized Item Alpha = .8480
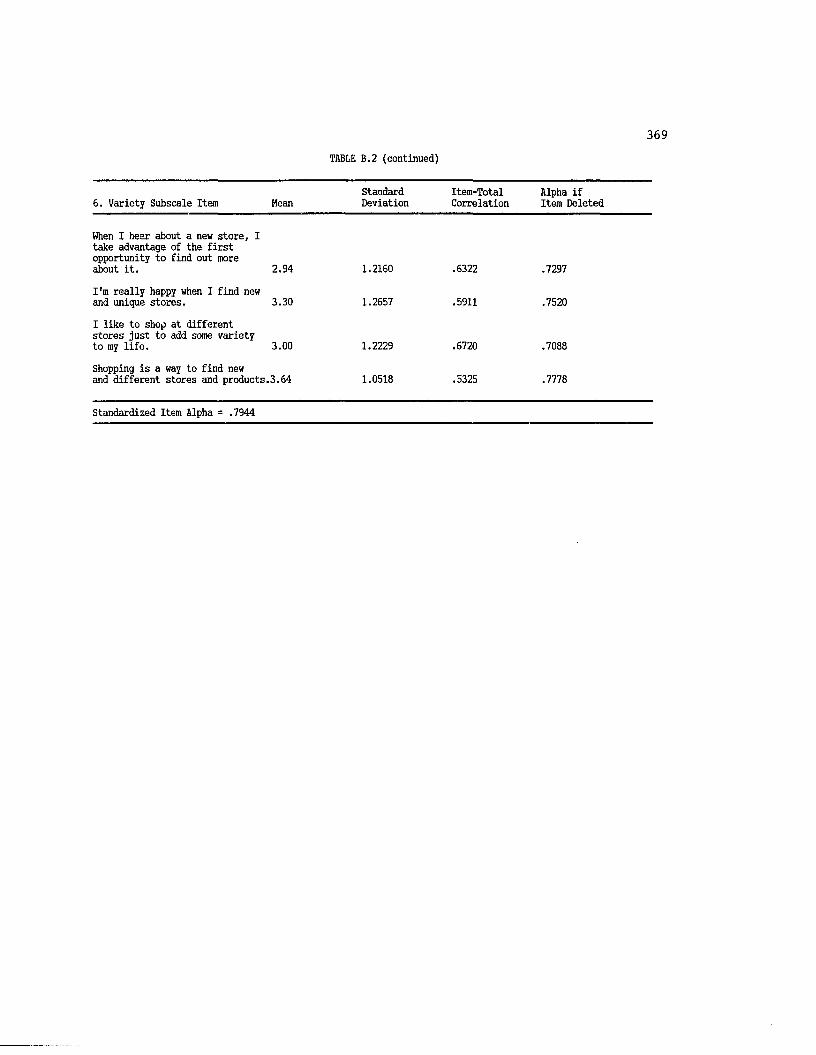
369TABLE B.2 (continued)
6. Variety Subscale Item MeanStandardDeviation
Item-TotalCorrelation
Alpha if Item Deleted
When I hear about a new store, I take advantage of the first opportunity to find out more about it. 2.94 1.2160 .6322 .7297
I'm really happy when I find new and unique stores. 3.30 1.2657 .5911 .7520
I like to shop at different stores just to add some variety to my life. 3.00 1.2229 .6720 .7088
Shopping is a way to find newand different stores and products.3.64 1.0518 .5325 .7778
Standardized Item Alpha = .7944
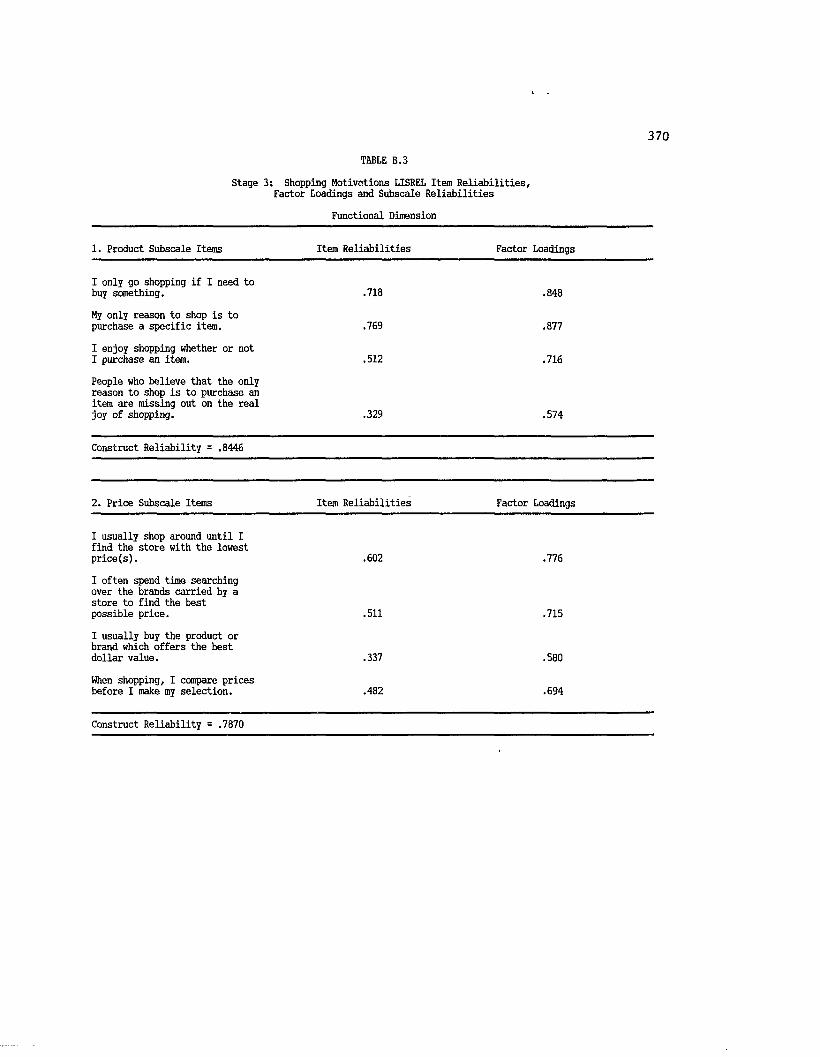
370TRBLE B.3
Stage 3: Shopping Motivations LISREL Item Reliabilities, Factor Loadings and Subscale Reliabilities
Functional Dimension
1. Product Subscale Items Item Reliabilities Factor Loadings
I only go shopping if I need to buy something. .718 .848
My only reason to shop is to purchase a specific item. .769 .877
I enjoy shopping whether or not I purchase an item. .512 .716
People who believe that the only reason to shop is to purchase an item are missing out on the real joy of shopping. .329 .574
Construct Reliability = .8446
2. Price Subscale Items Item Reliabilities Factor Loadings
I usually shop around until I find the store with the lowest price(s). .602 .776
I often spend time searching over the brands carried by a store to find the best possible price. .511 .715
I usually buy the product or brand which offers the best dollar value. .337 .580
When shopping, I compare prices before I make my selection. .482 .694
Construct Reliability = .7870
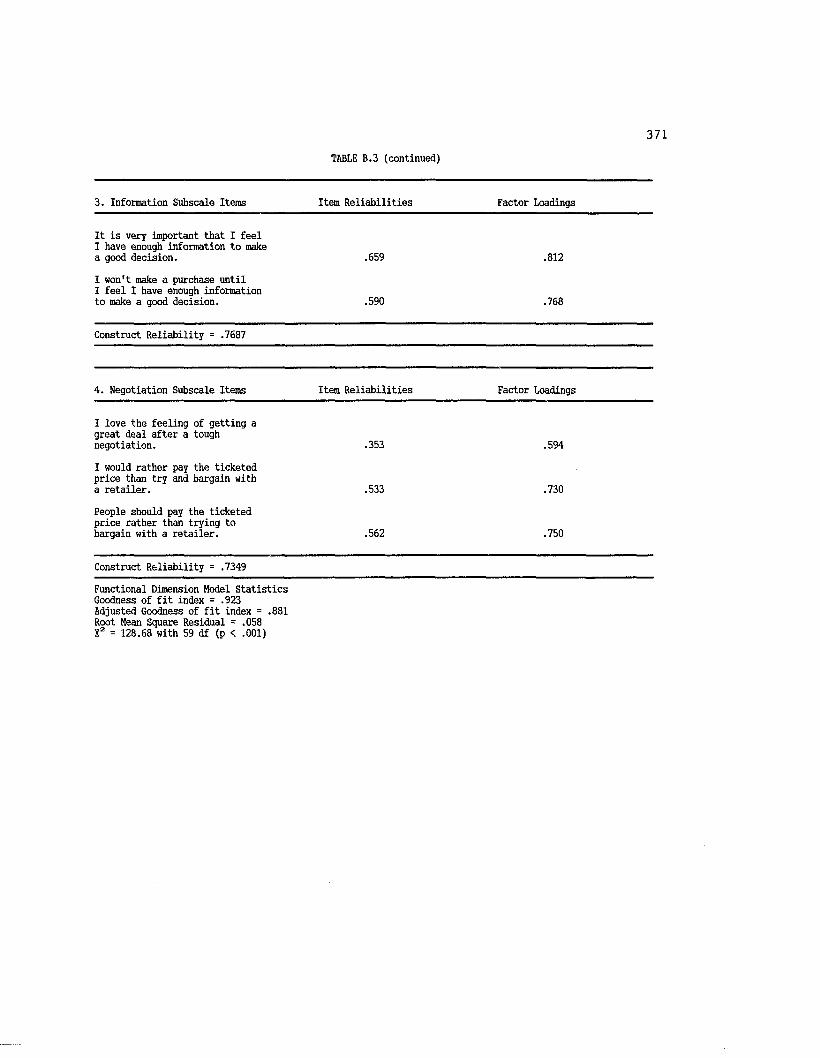
371TABLE B.3 (continued)
3. Information Subscale Items Item Reliabilities Factor Loadings
It is very important that I feel I have enough information to make a good decision. .659 .812
I won't make a purchase until I feel I have enough information to make a good decision. .590 .768
Construct Reliability = .7687
4. Negotiation Subscale Items Item Reliabilities Factor Loadings
I love the feeling of getting a great deal after a tough negotiation. .353 .594
I would rather pay the ticketed price than try and bargain with a retailer. .533 .730
People should pay the ticketed price rather than trying to bargain with a retailer. .562 .750
Construct Reliability = .7349
Functional Dimension Model Statistics Goodness of fit index = .923 Adjusted Goodness of fit index = .881 Root Mean Square Residual = .058 Xz = 128.68 with 59 df (p < .001)
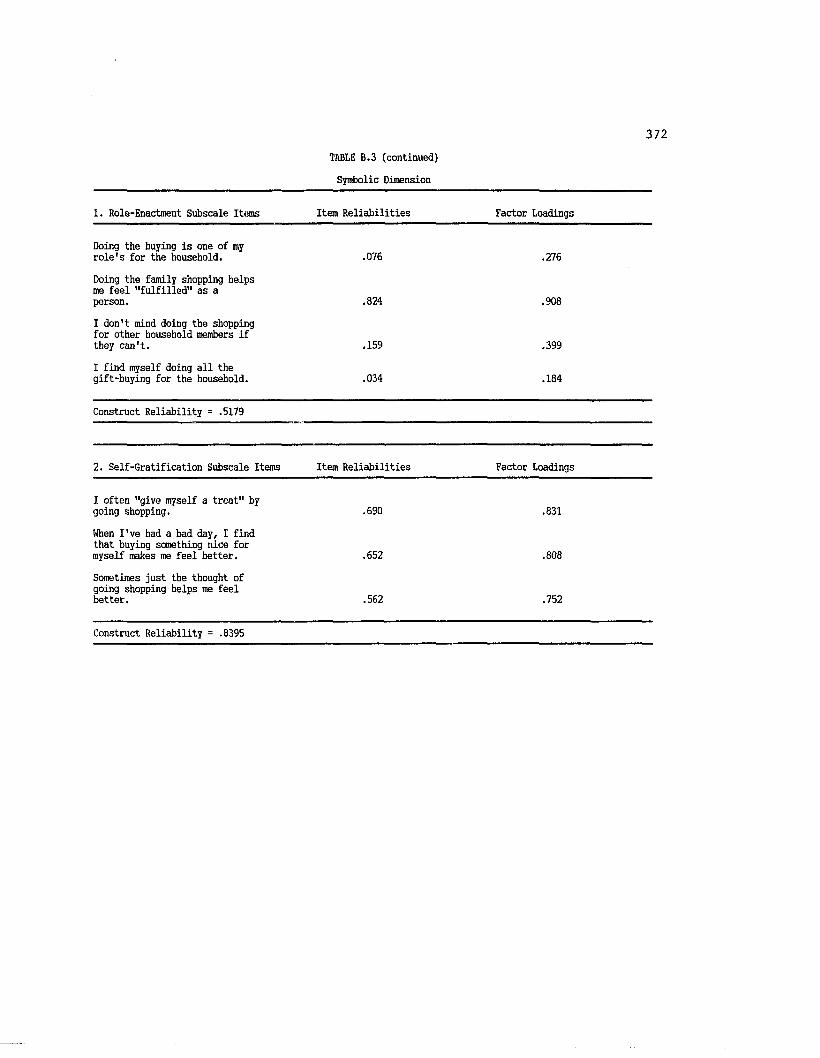
372TABLE B.3 (continued)
Symbolic Dimension
1. Role-Enactment Subscale Items Item Reliabilities Factor Loadings
Doing the buying is one of my role's for the household. .076 .276
Doing the family shopping helps me feel "fulfilled" as a person. .824 .908
I don't mind doing the shopping for other household members if they can't. .159 .399
I find myself doing all the gift-buying for the household. .034 .184
Construct Reliability = .5179
2. Self-Gratification Subscale Items Item Reliabilities Factor Loadings
I often "give myself a treat" bygoing shopping. .690 .831
When I've had a bad day, I find that buying something nice formyself makes me feel better. .652 .808
Sometimes just the thought of going shopping helps me feelbetter. .562 .752
Construct Reliability = .8395

373TABLE B.3 (continued)
3. Affiliation Subscale Items Item Reliabilities Factor Loadings
I enjoy talking about topics of common interest with other shoppers (not friends) whom I meet while shopping. .338 .581
I enjoy being around other shoppers who have similar tastes and values as mine. .455 .675
One of the nice things about going shopping is the chance to meet new and different people. .456 .676
I go shopping when I feel a need to be around other people. .414 .644
Construct Reliability = .7395
4. Power Subscale Items Item Reliabilities Factor Loadings
I enjoy the feeling of power I have when being served by a salesperson. .579 .761
I always make salespeople drop what they're doing to cater to my needs. .400 .632
I often feel superior to the sales people that wait on me. .308 .555
Construct Reliability = .6889

TABLE B.3 (continued)
374
5. Innovator Subscale Items Item Reliabilities Factor Loadings
I am often one of the first persons I know to buy a new product. .724 .851
I am often considered by others to be a trend setter. .577 .759
I enjoy trying new products or brands before other people do. .496 .705
I often visit stores to be the first to know about new products or styles. .680 .824
Construct Reliability = .8661
6. Personalizing Subscale Items Item Reliabilities Factor Loadings
Local merchants not the national chains give better service. .628 .792
I would rather do business with a local retailer than a national chain or department store. .410 .641
The local retailers take more interest in you. .366 .605
Construct Reliability = .7224
J
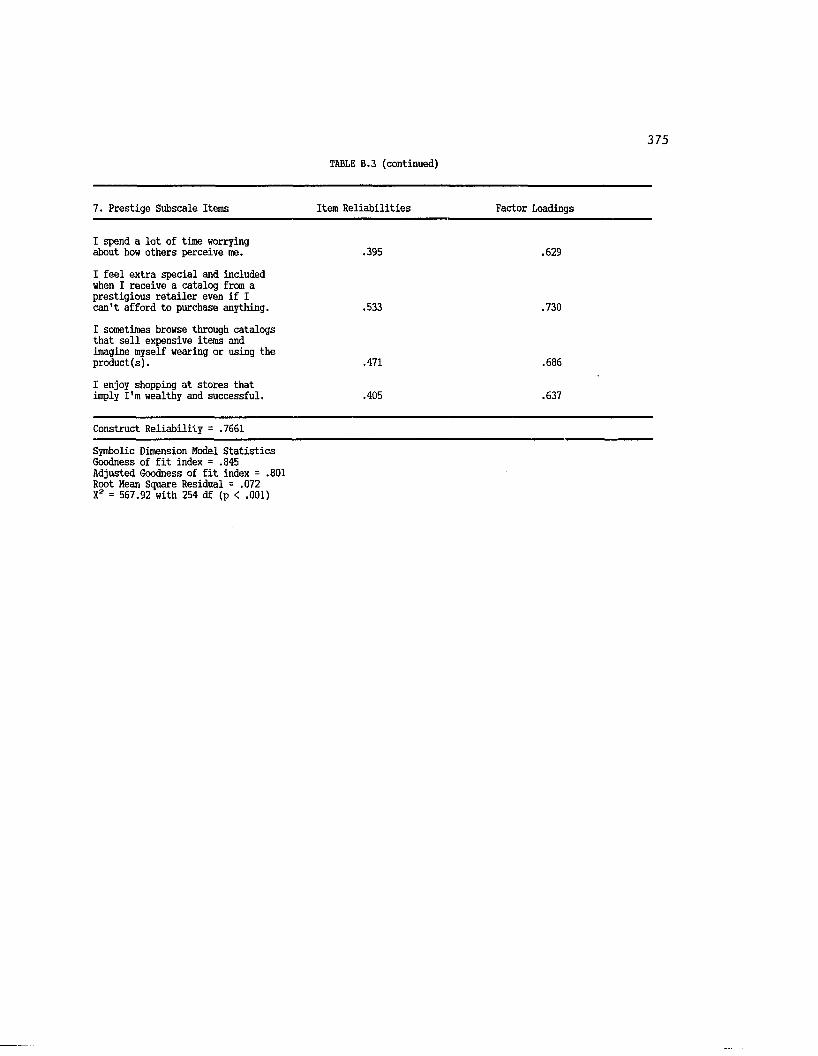
375TABLE B.3 (continued)
7. Prestige Subscale Items Item Reliabilities Factor Loadings
I spend a lot of time worrying about how others perceive me. .395 .629
I feel extra special and included when I receive a catalog from a prestigious retailer even if I can't afford to purchase anything. .533 .730
I sometimes browse through catalogs that sell expensive items and imagine myself wearing or using the product(s). .471 .686
I enjoy shopping at stores that imply I'm wealthy and successful. .405 .637
Construct Reliability = .7661
Symbolic Dimension Model Statistics Goodness of fit index = .845 Adjusted Goodness of fit index = .801 Root Mean Square Residual = .072 X2 = 567.92 with 254 df (p < .001)
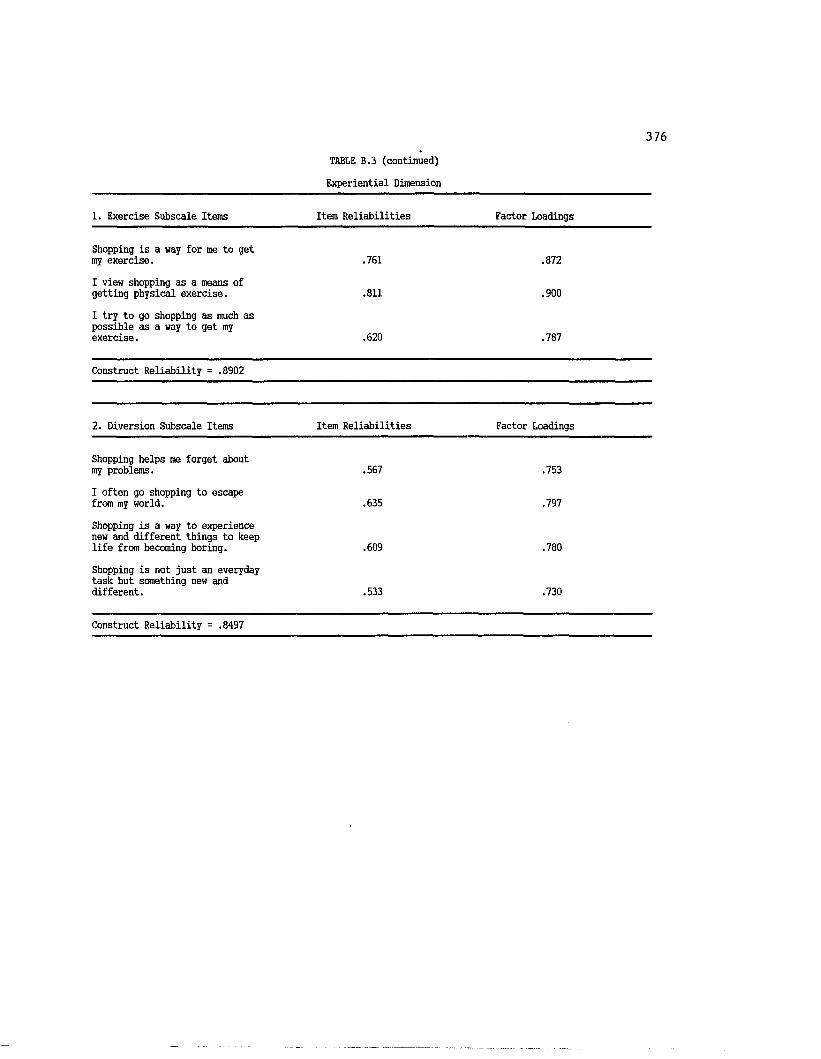
376TABLE B.3 (continued)
Experiential Dimension
1. Exercise Subscale Items Item Reliabilities Factor Loadings
Shopping is a way for me to get my exercise. .761 .872
I view shopping as a means of getting physical exercise. .811 .900
I try to go shopping as much as possible as a way to get my exercise. .620 .787
Construct Reliability = .8902
2. Diversion Subscale Items Item Reliabilities Factor Loadings
Shopping helps me forget about my problems. .567 .753
I often go shopping to escape from my world. .635 .797
Shopping is a way to experience new and different things to keep life from becoming boring. .609 .780
Shopping is not just an everyday task but something new and different. .533 .730
Construct Reliability = .8497
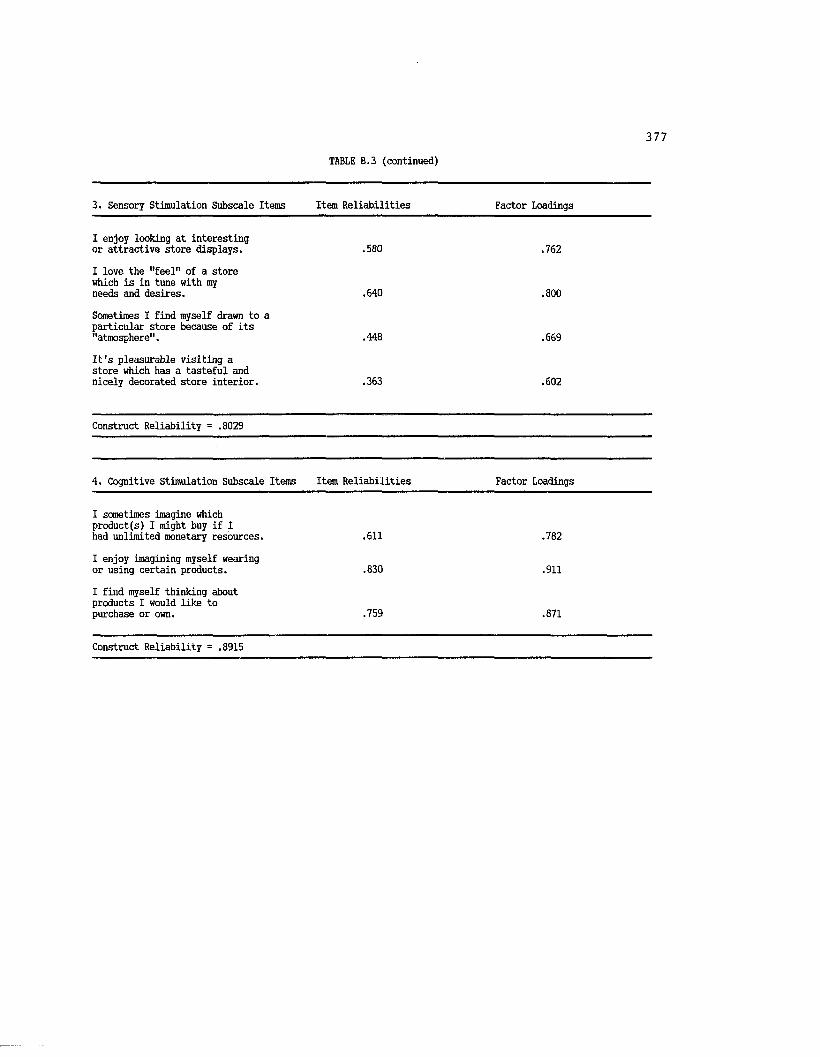
377TABLE B.3 (continued)
3. Sensory Stimulation Subscale Items Item Reliabilities Factor Loadings
I enjoy looking at interesting or attractive store displays. .580 .762
I love the "feel" of a store which is in tune with my needs and desires. .640 .800
Sometimes I find myself drawn to a particular store because of its "atmosphere". .448 .669
It's pleasurable visiting a store which has a tasteful and nicely decorated store interior. .363 .602
Construct Reliability = .8029
4. Cognitive Stimulation Subscale Items Item Reliabilities Factor Loadings
I sometimes imagine which product(s) I might buy if I had unlimited monetary resources. .611 .782
I enjoy imagining myself wearing or using certain products. .830 .911
I find myself thinking about products I would like to purchase or own. .759 .871
Construct Reliability = .8915

378TABLE B.3 (continued)
5. Recreation Subscale Items Item Reliabilities Factor Loadings
Going shopping is one of the most enjoyable activities of those I normally do. .741 .861
When the going gets tough, I go shopping. .535 .731
I've often said, "So many malls, so little time." .463 .680
I sometimes indulge myself by spending a day at the mall. .622 .789
Construct Reliability = .8511
6. Variety Subscale Items Item Reliabilities Factor Loadings
When I hear about a new store, I take advantage of the first opportunity to find out more about it. .538 .733
I'm really happy when I find new and unique stores. .498 .706
I like to shop at different stores just to add some variety to my life. .562 .750
Shopping is a way to find new and different stores and products. .395 .628
Construct Reliability = .7981
Experiential Dimension Model Statistics Goodness of fit index = .859 Adjusted Goodness of fit index = .816 Root Mean Square Residual = .057 Xz = 450.92 with 194 df (p < .001)

VITA
JILL S. ATTAWAY
Office address:Department of Marketing College of Business and Economics University of Kentucky Lexington, KY 40506 (606) 257-3388 or 257-1626
PROFESSIONAL OBJECTIVE:To develop and maintain a research and teaching career at a University committed to research excellence.
RESEARCH INTERESTS:Principal research interest is in the area of consumer decision making, specifically retail patronage behavior. Current emphasis lies in consumers shopping motivations and other determinants of outlet choice.
Other research interests include variety seeking theory applied to catalog use and consumption, choice set decision processes, advertising effectiveness and the use of advertising by non-profit organizations.
TEACHING INTERESTS:Retailing Management, Consumer Behavior, Marketing Research, and Marketing Theory.
EDUCATIONAL BACKGROUND:Doctor of Philosophy in Business Administration, Louisiana State University, August 1989.
Major Area: MarketingMinor Area: Psychology
Master of Science, Louisiana State University, August 1985. Major in Marketing with a concentration in Quantitative Business Analysis.
Bachelor of Business Administration, Texas A&M University, August 1982. Major in Marketing with a concentration in Finance.
Home address:326 Lowry Lane Lexington, KY 40503
379

DOCTORAL EXAMINATION AND DISSERTATION REPORT
Candidate:
Major Field:
Title of Dissertation:
Jill Suzanne Attaway
Business Administration
Influence of an Expanded Framework ofShopping Motivations and Inclusion of Non-Store Retailers on the Choice Set Formation Process
Approved:
Major Professor and Chairman
Dean of the Gradu:
EXAMINING COMMITTEE:
M kUaJ C
Date of Exam ination:
June 19, 1989