MOTIVATIONS ON ONLINE BOOK-SHOPPING OF ...
84
MOTIVATIONS ON ONLINE BOOK-SHOPPING OF UNIVERSITY STUDENTS IN CHINA Weisheng Zhang Project submitted as partial requirement for the conferral of Master of Science in Business Administration, at ISCTE – University Institute of Lisbon, 2014 Supervisor: Prof. Nelson José dos Santos António, Full Professor, ISCTE Business School, Department of Marketing, Operation and General Management September 2014
-
Upload
khangminh22 -
Category
Documents
-
view
2 -
download
0
Transcript of MOTIVATIONS ON ONLINE BOOK-SHOPPING OF ...
MOTIVATIONS ON ONLINE BOOK-SHOPPING OF
UNIVERSITY STUDENTS IN CHINA
Weisheng Zhang
Project submitted as partial requirement for the conferral of
Master of Science in Business Administration, at ISCTE – University Institute of
Lisbon, 2014
Supervisor:
Prof. Nelson José dos Santos António, Full Professor,
ISCTE Business School, Department of Marketing, Operation and General
Management
September 2014
Abstract
E-commerce is developing really fast in China. The existence of local famous online
book stores along with Amazon leads to recession of physical book stores. More and
more people turn to buy books online which makes physical book stores become a
place only for exhibiting hardcopies. Young and highly educated people are the main
group contributes to the growth of internet user scale in the past 5 years in China. The
purpose of this dissertation was to study the motivations drive university students to
buy books online based on utilitarian and hedonic motivation value. A questionnaire
was developed to collect data from China.
Results show that, two utilitarian values and one hedonic value were identified. Ease
to Access and Cost Saving are utilitarian values, the results show that both of them
have significant positive influence on utilitarian motivation of online book shopping.
Ease to Access has much important impact on utilitarian motivation than Cost Saving.
Authority & Enjoyment has significant impact on hedonic motivation of online book
shopping motivation as a hedonic value.
Hedonic motivation has positive influence impact on search intention in the context of
online book shopping, while utilitarian motivation do not affect search intention. Both
utilitarian and hedonic motivation have no impact on purchase intention of online
book shopping. The results show that search intention triggers purchase intention.
Hedonic motivation could generate search intention and indirectly generate purchase
intention, which is the phenomenon called impulsive shopping.
Key words: motivation, utilitarian value, hedonic value, online book shopping
JEL Classification: M3, M31

Resumo
O E-commerce está a desenvolver-se muito rápido na China. A existência de famosas
livrarias online, juntamente com a Amazon leva à recessão de livrarias propriamente
ditas. Há cada vez mais pessoas a comprar livros online, fazendo com que as livrarias
físicas se tornem num lugar apenas para exibir cópias impressas. Jovens e pessoas
altamente qualificadas são o principal grupo que contribui para o crescimento em
escala dos consumidores online nos últimos 5 anos na China. O objetivo desta
dissertação foi estudar as motivações que levam os estudantes universitários a
comprar livros online com base nos valores utilitaristas e hedonistas. Foi elaborado
um questionário para recolher dados a partir da China.
Os resultados mostram que foram identificados dois valores utilitários e um valor
hedonista. A Facilidade de Acesso e Redução de Custos são os valores utilitários, os
resultados confirmam que ambos têm influência positiva significativa sobre a
motivação utilitária para comprar livros online. A Facilidade de Acesso tem um
impacto importante na motivação utilitária, sendo maior do que na Redução de Custos.
Autoridade & Prazer tem um impacto significativo sobre a motivação hedonista na
linha motivação comercial para a compra de um livro.
A motivação hedonista tem um impacto positivo na intenção de busca do contexto de
um livro, enquanto a motivação utilitária não afeta essa intenção. Ambas as
motivações utilitaristas e hedonistas não têm impacto sobre a intenção de compra dos
livros online. Os resultados mostram que a intenção de busca do contexto desencadeia
a intenção de compra. A motivação hedonista poderia gerar a intenção de busca e
indiretamente gerar a intenção de compra, que é o fenómeno designado por compras
impulsivas.
Palavras-chave: motivação, valor utilitarista, valor hedonista, compras de livros
online
Classificação JEL: M3, M31

i
Index
1 Introduction ............................................................................................................... 1
2 Literature Review ..................................................................................................... 3
2.1 Consumer Behavior .............................................................................................. 3
2.1.1 Definition ....................................................................................................... 3
2.1.2 Some Research Models on Consumer Behavior ............................................ 4
2.1.3 Impact Factors of Consumer Behavior .......................................................... 5
2.2 Motivation ............................................................................................................ 6
2.2.1 Definition ....................................................................................................... 7
2.2.2 Some Theories on Motivation ........................................................................ 8
2.2.3 Shopping Motivation ................................................................................... 11
2.2.4 Online Shopping Motivation........................................................................ 13
2.2.5 Search Intention and Purchase Intention ...................................................... 15
2.3 Research Hypothesis .......................................................................................... 16
2.3.1 Utilitarian Value and Motivation ................................................................. 16
2.3.2 Hedonic Value and Motivation .................................................................... 18
2.3.3 Shopping Motivations, Search Intention and Purchase Intention ................ 20
2.3.4 Research Hypothesis Graph ........................................................................ 21
2.4 Summary ............................................................................................................ 22
3 Methodology ............................................................................................................ 23
3.1 Pilot Test ............................................................................................................ 23
3.2 The Questionnaire .............................................................................................. 24
3.3 The Samples ....................................................................................................... 25
3.4 The Tool ............................................................................................................. 25
4 Result ........................................................................................................................ 26
4.1 Demographics .................................................................................................... 26
4.2 Validity .............................................................................................................. 27
ii
4.2.1 Utilitarian Value Scale ................................................................................. 27
4.2.2 Hedonic Value Scale ................................................................................... 29
4.2.3 Utilitarian & Hedonic Motivation Scale ..................................................... 30
4.2.4 Search & Purchase Intention Scale ............................................................. 31
4.3 Reliability ........................................................................................................... 32
4.4 Multiple Linear Regression Analysis................................................................. 32
4.4.1 Correlation among Exogenous Variables ................................................... 32
4.4.2 Multiple Linear Regression Model 1 .......................................................... 33
4.4.3 Multiple Linear Regression Model 2 .......................................................... 37
4.4.4 Multiple Linear Regression Model 3 .......................................................... 38
4.4.5 Multiple Linear Regression Model 4 .......................................................... 43
4.4.6 Model Summary.......................................................................................... 47
5 Conclusion ............................................................................................................... 49
5.1 Discussion and Conclusion ................................................................................ 49
5.2 Limitation ........................................................................................................... 54
5.3 Further Research ................................................................................................ 55
Bibliography ............................................................................................................... 56
Annexes ....................................................................................................................... 63
7.1 Demographics ..................................................................................................... 63
7.2 Multiple Linear Regression Analysis ................................................................. 64
7.3 Questionnaire ..................................................................................................... 71
7.3.1 Questionnaire in English .............................................................................. 71
7.3.2 Questionnaire in Chinese ............................................................................. 74
iii
Index of Tables
Table 1 KMO and Bartlett’s Test of Utilitarian Value Scale ................................................... 28
Table 2 Principal components of Utilitarian Value Scale ........................................................ 28
Table 3 KMO and Bartlett’s Test of Hedonic Value Scale ...................................................... 29
Table 4 Principal components of Hedonic Value Scale ........................................................... 29
Table 5 KMO and Bartlett’s Test of Utilitarian & Hedonic Motivation Scale ........................ 30
Table 6 Principal components of Utilitarian & Hedonic Motivation Scale ............................. 31
Table 7 KMO and Bartlett’s Test of Search & Purchase Intention Scale ................................ 31
Table 8 Principal components of Search & Purchase Intention Scale ..................................... 31
Table 9 Reliability statistics .................................................................................................... 32
Table 10 Correlation among exogenous variables .................................................................. 33
Table 11 Correlation of Model 1 variables .............................................................................. 33
Table 12 Ramsey RESET Test of Model 1 .............................................................................. 34
Table 13 The White Test statistics ........................................................................................... 35
Table 14 Correlation of Model 3 ............................................................................................. 39
Table 15 Ramsey RESET Test of Model 3 .............................................................................. 39
Table 16 The White Test statistics ........................................................................................... 40
Table 17 Heteroskedasticity Test statistics .............................................................................. 41
Table 18 White Heteroskedasticity-Consistent Standard Errors & Covariance ...................... 41
Table 19 Correlation of Model 4 ............................................................................................. 43
Table 20 Ramsey RESET Test of Model 4 .............................................................................. 43
Table 21 The White Test statistics ........................................................................................... 44
Table 22 Heteroskedasticity Test statistics .............................................................................. 45
Table 23 White Heteroskedasticity-Consistent Standard Errors & Covariance ...................... 45
Table 24 Frequency distributions of respondents’ demographics ........................................... 63
Index of Figures
Figure 1 Research model and hypotheses ............................................................................... 22
Figure 2 Result of JB Test of Model 1 .................................................................................... 35
Figure 3 Durbin-Watson region............................................................................................... 36
Figure 4 Result of JB Test of Model 3 .................................................................................... 40
Figure 5 Durbin-Watson region............................................................................................... 41
Figure 6 Result of JB Test of Model 4 .................................................................................... 44
Figure 7 Durbin-Watson region............................................................................................... 45
Figure 8 Relationships supported by empirical study ............................................................. 48
iv
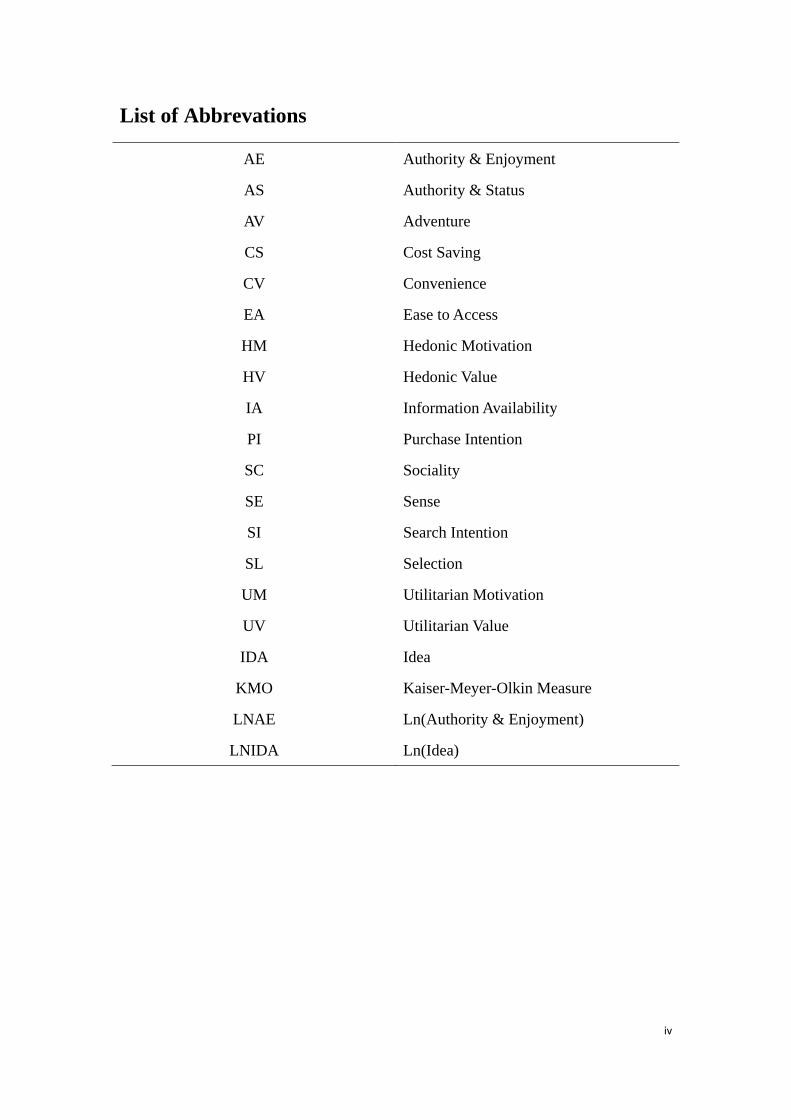
List of Abbrevations
AE Authority & Enjoyment
AS Authority & Status
AV Adventure
CS Cost Saving
CV Convenience
EA Ease to Access
HM Hedonic Motivation
HV Hedonic Value
IA Information Availability
PI Purchase Intention
SC Sociality
SE Sense
SI Search Intention
SL Selection
UM Utilitarian Motivation
UV Utilitarian Value
IDA Idea
KMO Kaiser-Meyer-Olkin Measure
LNAE Ln(Authority & Enjoyment)
LNIDA Ln(Idea)
1
1 Introduction
The Internet and information technology bring huge influence and changes to people’s
life and the ways people do business. The development of information technology
also provides new ways to reach the end market, which has increase the popularity of
online shopping (Lian & Lin, 2007). The number of people who is online increase
676.3 percent over past 4 years, according to Internet World Stats (2013).
According to the survey of How Digital Influences How We Shop around the World
reported by Nielsen (2012), the Internet penetration rates are continuing to increase
steadily, especially in developing countries. This survey also shows that 33% of
respondents have the online purchase intent of hard copy books and physical
subscriptions, which is in the second position.
The research by China IntelliConsulting Corp. (2012) indicates that the market size of
online shopping in China reached 8090 hundred million Yuan in 2011, the number of
online shoppers was 2.12 hundred million, and the percentage of people who bought
books & audio and video products was 20.9%, which was 4th position after clothing,
digital products & electric appliance and furniture.
The rise of online shopping brings interaction between customers and technology.
Internet could provide high interaction so that consumers can communicate with
corporates and other consumers easily. Low cost, convenience, easy communication,
information availability and even higher quality of products and services dramatically
reduce the advantages of conventional shopping (Hoffman & Novak, 1996;
Szymanski & Hise, 2000).
Physical bookstore is a segment that living in a hard time due to strike of online book
store. In U.S., Barnes & Noble became the only national bookstore chain in the U.S.
in 2011. In the next ten years, Barnes & Noble plans close nearly 20 retail stores each
year (Laura, 2013), and it indicates that the profit earned from physical retail stores is
not attractive due to the high rent and human capital cost. According to the source of
Publishers Weekly, there were 11 leading U.S. bookstore chains in Spring 1991
including Borders and Barnes & Noble, however, there were only 6 left in autumn
2
2011. In U.K., there are 140 retailers are having financial problems and regarded as in
“critical level” (Richard, 2012). And the level of “significant” distress had increased
85% which the retailers of books, news and stationery experienced (Begbies Traynor
Group, 2012).
Situation in China is similar. According to a survey held by All-China Federation of
Industry & Commerce, until 2011 nearly half of the physical bookstores closed in the
past 10 years (Xiaokai Liu, 2011). According to CNNIC (2010), the number of people
who is shopping on B2C online stores had reached 99.36 million in China. Books had
become one of the best sell categories in China. Compare to offline physical store,
35.9% of customers prefer shopping books and audio-visual products online.
Besides, according to iResearch (2012) , the characteristic of Chinese online shoppers
in 2011 is young people, 60.8% of online shoppers’ age are between 18 and 30, and
42.5% of them are undergraduate students. According to the 31th Report of the
Situation of Internet Development of China (CNIC, 2013), by the end of December
2012, young and highly educated group becomes the most important group to the
growth of internet user scale in the past 5 years in China and undergraduate students
play main role. The appearance of online book stores has already changed people’s
book shopping patterns, which leads to recession of physical book stores. Young
people, especially undergraduate students participate mainly in online shopping.
Thus, this study is trying to study university students in order to discuss the following
questions:
1. What influences university students to buy books online?
2. What kinds of motivation could have influences on university students’ that drive
them to shop with online book stores?
3
2 Literature Review
2.1 Consumer Behavior
2.1.1 Definition
Consumer behavior is an important topic for marketing since it became a single field
of study during the 1960s. There are plenty of researches about consumer behavior
and the definition of consumer behavior is diverse.
Williams (1982) thinks consumer behavior is a gather of opinions, activities and
influences related to purchasing commodities or services processes held by consumers.
Engel et al. (1986) define consumer behavior as “those acts of individuals directly
involved in obtaining, using, and disposing of economic goods and services, including
the decision processes that precede and determine these acts”. Consumer behavior
according to Solomon et al. (1996) “is the study of the processes involved when
individuals or groups select, purchase, use or dispose of products, services, ideas or
experiences to satisfy needs and desires.” Schiffman and Kanuk (1997) think
consumer behavior study the process of individuals decide to spend their resources on
consumptive things. Kenneth A .Coney (2000) thinks consumer behavior is a study to
understand how individuals, groups and organizations choose, acquire, use and
dispose products, services, experience and thoughts, and the influence to consumers
and society, in order to fulfill their demands.
To summarize, the key words of consumer behavior are “processes and activities”,
“select, purchase, use or dispose of products and services” and “satisfy needs and
desires”. Thus, the definition of consumer behavior could be stated as:
The processes and activities involved when individuals select, purchase, use or
dispose of products and services to satisfy needs and desires.
To the online shopping perspective, the definition of online consumer behavior could
be sated as:
In the context of Internet, the processes and activities involved when individuals select,
4
purchase, use or dispose of products and services to satisfy needs and desires.
2.1.2 Some Research Models on Consumer Behavior
In order to understand consumer behavior better, some research models were
established in order to explain it. Consumer behavior models show the factors that can
influence consumer behavior in a simplified literal way. Nicosia model (Nicosia, 1976)
is mainly about a firm’s relationship with its potential consumers. However, Nicosia
model is lack of explanation and definition of external variables (Lunn, 1974) and it is
criticized due to lack of empirically test (Zaltman, Pinson and Agelman, 1973).
Howad & Sheth model proposed in 1969 (Howard & Sheth, 1967) is a comprehensive
model and probably the most frequently quoted model for consumer behavior, but it
cannot explain all buyer behavior. In addition, EKB model (Engel, Kollat and
Blackwell, 1990) mainly bases on purchasing decision-making process to analyze
consumer behavior. Moreover, there are still a lot of models for studying consumer
behavior, such as Bettman’s information processing model (Bettman, 1979),
Sheth-Newman gross model of consumption values (Sheth et al. 1991) and
Stimulus-Response model of buyer behavior (Middlenton, 1994).
With the fast development of Internet and e-commerce, online consumer behavior has
become a popular research field. Some researchers draw theories from classical
consumer behavior research (Skinner, 1938; Fishbein, 1967; Bettman, 1979; Folkes,
1988), and some other researchers believe online shopping behavior is mostly similar
to offline except seeking convenience (Liang and Lai, 2000; Keen et al., 2000;
Srinivasan et al., 2002). However, several researchers consider online shopper is not
only the people shop online but also the people use computer, which makes online
consumer behavior differing from offline behavior (Ba and Pavlou, 2002; Pavlou and
Fygenson, 2006). Thus, the impact of information system attracts more and more
attention (Gefen et al., 2003; Jarvenpaa et al., 2000; McKnight and Chervany, 2002).
Cheung et al. (2005) find out that most of researchers use the Theory of Reasoned
Action and its family theories (Technology Acceptance Model and the Theory of
5
Planned Behavior) to analyze online consumer behavior. And the
Expectation-Confirmation Theory (ECT) and Innovation Diffusion Theory (IDT) are
also utilized to study online consumer behavior too (Cheung et al., 2005).
2.1.3 Impact Factors of Consumer Behavior
Existing researches about impact factors of consumer behavior mainly try to divide
factors into different categories. Mostly the classification of impact factors include
two categories, inner factors and outer factors, or in other words, personal factors and
environmental factors. Some researchers may develop additional categories beside of
personal and environmental factors, in order to acquire detailed insight of consumer
behavior. J. Stávková et al. (2008) summarized several categories proposed by
different researchers:
Nicosia et al. (2002) identified environmental factors (economy, family, social and
culture) and psychological factors (attitude, demand, personality, motivation).
Blacken (2003) proposed two groups, environmental factors (culture, social class,
opinion leader, family and other reference group) and personal factors (personality,
motivation, knowledge and attitude). Jagdish N. Sheth & Banwari Mittal (2004)
classified impact factors into two groups: environmental factors (economic situation,
topography, climate, ecology characteristics, technology and government policy) and
personality factors (gender, age, personality, social class, colony, culture, race and
genetic characteristics). Brown (2006) classified factors into three groups, personal
(sex, race, age), psychological (motivation, perception, lifestyle, ability &knowledge,
attitude and personality) and social (opinion leaders, references groups, social class,
roles & family influences and culture & sub-culture). Foret & Procházka (2007)
identified product factors (primary usage, quality) and intangible factors (image,
consultancy and post-scale service). Fatimah et al. (2012) identified five groups,
including cultural factors (culture, sub-culture, social class), social factors (groups,
family, role & statues), personal factors (age, life cycle stage, occupation, economic
situation), psychological factors (motivation, perception, learning) and marketing mix
6
(price, product, promotion, placement).
For the factors which may influence online consumer behavior, Cheung et al. (2005)
make a summary about it. After studying existing studies, Cheung et al. (2005)
propose that impact factors of online consumer behavior could be separated into five
major domain areas about factors influencing online consumer behavior. The research
of Cheung et al. (2005) offers a deep insight of the impact factors studied by previous
researchers.
First, are the individual/consumer characteristics, referring to internal individual
factors and behavioral characteristics, including attitude, satisfaction, demographics,
flow, trust, motivation, perceived risk and personal innovativeness. Second, are the
environmental influences, referring to the structural influences, including
market-related issues (uncertainty, competition and concentration). national and
international issues (legal structure, trade restrictions and culture), the key constructs
are exposure and perceived behavioral control subjective norm. Third, are the
product/service characteristics, referring to knowledge about the product, product type,
frequency of purchase, tangibility and product quality. The key constructs are price,
product type and product knowledge. Forth is medium characteristics, referring to
both traditional IS attributes (ease of use, quality, security and reliability) and
Web-specific factors (navigation, interface and network speed). Convenience,
navigation, ease of use, shopping aids, information quality, security and usefulness are
key constructs. The last domain area is merchants and intermediate characteristics,
referring to the key attributes/features of the online stores. Key constructs include
brand, service quality, privacy and security and control.
2.2 Motivation
Motivation is a core concept to consumer behavior and they have close connection to
each other in many ways. Usually people pay for products and services due to
something that motivate them to do so, such as want or needs. Motivation has been
considered as an important factor about studying consumer shopping behavior both
7
online and offline (Nicosia, 2002; Brown, 2006; Fatimal et al., 2012; Christy Cheung
et al., 2005). This study will focus on consumer’s motivation, in order to obtain
deeper insight of consumer behavior, in the context of online book shopping.
2.2.1 Definition
The term motivation appears early in psychology. Usually the term motivation was
adopted by functionalist philosophers and psychologists when studying voluntary
action behaviors (Forgas et al, 2005). The term motivation has a wide range of
meaning in different situation or background. On the Webster’s New Collegiate
Dictionary, a motive is “something (a need or desire) that causes a person to act.”
And motivate means “to provide with a motive”, so the word motivation is “the act or
process of motivating”.
The definition of motivation from Guay et al. (2010) is “the reasons underlying
behavior”. And Broussard and Garrison (2004) define motivation as “the attribute
that moves us to do or not to do something”. In the psychology perspective, according
to Landy and Becker (1987), the motivation is “the internal mental state of a person
which relates to the initiation, direction, persistence, intensity and termination of
behavior”, while the managerial meaning of motivation is “the activity of managers to
induce others to produce results desired by the organization or, perhaps, by the
manager” (Sudhanshu and S.S.Chauhan, 2013). The academic motivation definition
proposed by Gottfried (1990) is “enjoyment of school learning characterized by a
mastery orientation; curiosity; persistence; task- endogen; and the learning of
challenging, difficult, and novel tasks”. In the shopping context, motivation could be
said as the driving force within consumers makes them to shop.
All in all, a particular behavior could be aroused by a set of reasons while this set of
reasons is motivation. Thereby, in this study, the definition of motivation is:
The general set of reasons drive a person to take some action.
Thus shopping motivation could be described as:
The reasons drive a person to shop.
8
Moreover, the motivation drives consumers to shop online could be described as:
The reasons drive a person to shop online (through Internet).
2.2.2 Some Theories on Motivation
Motivation always refers to any sort of general drive or inclination to act (Baumeister
and Bohs, 2007). Usually needs will be the motivation that cause behaviors, and when
those needs have been fulfilled, there will be some type of reward to the person
(Shanks, 2011). In Kotler’s point of view, when a need appears and reach a sufficient
level of intensity, it will become a motive to drive the person to act (Kotler, 2002).
a) Drive Theory
Freud is the originator of psychology. His drive theory could be treated as the paragon
for explaining all facets of intraphisychic and interpersonal phenomena, not only
including the base and primordial urges of unconscious desire, but also advanced
mental and physical activities (Mills, 2004). According to Freud, a person may not
fully understand what motivated him or her to act. The real motivation to a behavior
may hide beneath the conscious, the reason known by the person who act maybe just
is the superficial level of desire.
b) Hierarchy of Needs Theory
Maslow proposed his hierarchy of needs theory back in 1943 which has already
become a famous and widespread use theory. He believed human have their potential
to achieve the highest levels of their capabilities (Maslow, 1970). He identified five
types of human needs and these are activated in a hierarchical manner.
Physiological needs are biological needs of the human being which are the most basic
needs as the starting point for motivation theory. Safety needs are the second level of
human motivation, and emerge when physiological needs are relatively well gratified.
Belongingness and love needs emerge when both the physiological and the safety
needs are satisfied. Next are the needs of esteem. When the needs of esteem are
satisfied, a person will feel self-confident and valuable. Self-actualization is the need
occupied the top of Maslow’s pyramid of human needs. This need refers to the one’s
9
need to be what one wants to be to achieve the ultimate peace with one-self (Maslow,
cited in Shafritz & Ott, 1996).
According to Maslow, the five needs are aroused from the lowest-order need
(physiological needs) to the highest one (self-actualization), which means each needs
emerge after the prior needs are satisfied, although not completely. There are
exceptions to the hierarchy manner of needs. To some people, self-esteem needs or
belongingness & love needs may be the most important needs than others. The
average people will be satisfied 85% of belonging-love needs, 40% of self-esteem
needs and 10% of self-actualization needs. Although the theory is famous, Maslow
never verified it but just presented it as a frame work for future research (Nigro &
Nigro, 1973).
c) Two-factor Theory
Herzberg’s theory is also called two-factor theory that distinguished dissatisfiers
(factors that cause dissatisfaction) from satisfiers (factors that cause satisfaction).
These two types of factor are also named motivators and hygiene factors. Motivators
are the factors which will lead to positive satisfaction arising from intrinsic condition
of the job itself, such as recognition, achievement or personal growth. While, the
hygiene factors will not lead to positive satisfaction. But the absence of them will lead
to dissatisfaction. Mostly hygiene factors are from extrinsic condition, like company
policies, working place, supervisory practice or wages.
Although Herzberg’s theory makes enterprise managers pay more attention to the
working contents and working satisfaction, there still are several drawback about this
theory. The number of sample group is only 203 which is not enough, meanwhile the
main subjects are mainly engineers and accountants, which means they barely worry
about their salary, security and working condition, thus these factors may not be
motivators to them.
In Solomon et al. (2006)’s point of view, Herzberg’s theory gives marketers positive
implication which is marketers should identify and focus on offering satisfiers or
motivators for customers to purchase, and avoid dis-satisfiers that might un-sell their
products.
10
d) Expectancy Theory
Expectancy theory was first developed by Victor Vroom (1964) for work settings. In
this theory, the main idea is that people believe they will obtain better performance
because of their stronger effort, and finally receive the rewards they want. Moreover,
there are four assumptions in the expectance theory (Vroom, 1964).
The first assumption is that people join an organization with their expectations about
their motivations, needs and past experiences. The second assumption is that the
behavior of an individual is caused by conscious choice which means people behave
with their own will under their own expectance calculations. The third assumption is
that people want different things from the organization such as good salary, job
security, advancement and challenges. The forth assumption is that people will
optimize outcomes among alternatives for their own sake.
Based on these four assumptions, there are three key elements of the expectancy
theory. They are; expectance, instrumentality and valence. The expectance is the
possibility valuated by person that their effort will generate a given level of
performance. The instrumentality is the possibility valuated by person that their given
level of performance will lead to various work outcomes. And the valence is how
strong an employee’s preference is for a specific reward. Suggested by Vroom, the
relation among motivation, expectance, instrumentality and valence could be
expressed as below:
Motivation = Expectancy × Instrumentality × Valence (2.1)
The influence from three key elements to motivation is not the simple addition but
multiplication. Thus even they are all low, the result of the multiplier effect, in the
right side of the equation, lead to higher levels of motivation. Meanwhile, the
multiplier assumption also implies if one of the three elements is zero, the level of
motivation is also zero (Fred, 2011).
All in all, Vroom’s expectancy theory does not suggest specific idea about what
motivate people which makes itself different from the theories of Maslow, Herzberg
and other researchers. Expectancy theory makes contribution to the managers during
setting goals. Under the suggestions of expectancy theory, in a managerial point of
11
view, employees could be motivated by altering the person’s effort-to-performance
expectancy, performance-to-reward expectancy, and reward valences (Fred, 2011).
2.2.3 Shopping Motivation
Understanding consumers’ behavior and needs could benefit companies or marketers
Based on the understanding of consumers’ motivation, companies can not only
develop spontaneous desire in consumers’ mind, but also develop it over time by
advertising and other media.
In the research field, the traditional cognition, affect, and behavior (CAB) model is a
favorable model which considers people go shopping because they need to buy certain
products or services. Then Tauber (1972) first explores the motivation of shopping
behavior with a range of psychosocial needs that go beyond the purchasing of
products and services. Tauber (1972) identifies two types of psychological needs:
personal and social. The personal motives include role-playing needs, diversion,
learning about new-trend, sensory stimulation, self-gratification and physical activity.
The social motives include the needs for social experiences, status and authority, peer
group attractions, pleasure in bargaining and communication with others.
Hirschman and Holbrook (1982) extend Tauber (1972)’s idea, they add pleasure,
feeling, aesthetics, emotion, and enjoyment as new motivations. Following Tauber’s
study, Westbrook and Black (1985) suggested seven dimensions of shopping
motivation, while Arnold and Reynolds (2003) focus on motivations about hedonic
and non-product in nature. According to Dawson et al. (1990), shopping motivation
can be more product oriented (acquiring products or services) or experience oriented
(hedonic oriented). A hedonic oriented person focuses on fun, sensory, excitement
(Babin et al., 1994; Arnold and Reynolds, 2003), and also the fulfillment of needs as
gaining ideas, improving personal wellbeing, and socializing with others (Tauber,
1972; Buttle and Coates, 1984).
Consumer buying behavior is expressed when needs activated, but the benefit gained
from product orientation and experience orientation are different: utilitarian benefit

12
and hedonic benefit. Several studies indicate that customers go shopping with
utilitarian motives, also with experiential motives, which means consumers shop to
acquire product and service or they shop to shop (Bloch and Richens, 1983; Hoffman
and Novak, 1996; Schlosser and Kanfer, 1999).
a) Utilitarian Motivation
The definition of Utilitarian motivation is that this kind of motivation is goal oriented,
decision effective mission critical, and rational (Hirshman and Holbrook, 1982; Batra
and Ahtola, 1991; Engel et al., 1993). The utilitarian benefits are objectives,
functional product attributes (Engel et al., 1990). Utilitarian benefits are the necessary
functional and instrumental benefits of the products or services in contrast to luxuries.
Utilitarian shopping relates to achieve the shopping objective in an efficient manner, it
is task-oriented and rational (Hirschman and Holbrook, 1982; Batra and Ahtola, 1991).
All in all, the behavior of a person to shop with utilitarian motivation is task-oriented
and seeking to accomplish a mission, the utilitarian benefits are acquired or not
depends on the mission is completed or the mission is completed efficiently during
the process.
b) Hedonic Motivation
Hedonic motivation includes emotional responses, sensory pleasures, daydreams and
esthetic considerations (Hirschman and Holbrook, 1982). The behavior with hedonic
motivation relates to seek happiness, fantasy, awakening, sensuality and enjoyment.
According to Bloch and Bruce (1984), Sherry (1990) and Babin et al. (1994),
shopping behavior is not only a task or a mission to complete, customers will go to
shop just for enjoy the shopping process to acquire experiential and emotional benefit.
We can say hedonic motives is similar to utilitarian motives as task seeking, however,
the different is the “task” of hedonic motives is about hedonic fulfillment (Babin et al.,
1994).
The research of hedonic motivation extent the understanding of shopping motivation
and now become the most important thing along with utilitarian motivation to the
companies to maintain competitive advantage (Parson, 2002).

13
2.2.4 Online Shopping Motivation
Online shopping behavior is the process of buying products or services through the
Internet (Li & Zhang, 2002). What drive a person to shop are the reasons or needs,
namely shopping motivation (Jansen, 2006), and the motivations drive an individual
to shop online are online shopping motivations.
The success factors of online retailing are the attraction and retention of consumers.
Thus influence factors of accepting or refusing online shopping are critical to
marketers. Chang et al. (2005) propose a categorization of factors with three
categories: a) perceived characteristics of the Internet as a sale channel, b) consumer
characteristics and c) characteristics of the product for summary. Liudmila and Jurgita
(2009) summarize several factors in each categories based on researchers’
investigation.
For the perceived characteristics of the Internet as a sale channel, two factors are
identified, barriers and benefits. Barriers factor includes Internet security/privacy
concerns, low perceived trust, perceived stress and lack of sociality. Benefits factor
includes usefulness, ease of use, convenient, enjoyment/adventure, rewarding,
information availability, selection, price/charge/cost saving, value (sales, bargains,
discount), idea (discover new trends), perception that needs will be met and
control/authority.
The consumer characteristics include demographics (age, gender, education,
household income and family composition), shopping (recreational, economic,
convenience, socialization), experience (Internet use, shopping innovativeness,
previous online purchase, compatibility, self-efficacy and peer influence) and personal
traits (personal innovativeness, innovativeness of checking of new websites,
consumer personality type).
The last is characteristics of the product which includes customized products or
services, usability of storefront, brand and name recognition, product type, handling
merchandise and perceived service quality.
Liudamila and Jurgita (2009) also identify two groups of factors are motivation
14
dimensions (convenience, product variety, purchase surrounding, information depth
and brand) and demotivation dimensions (risk, economic, conditions and ability, time
and socialization and sense) on Lithuanian consumers. In their research, the strong
motives drive people to shop online is convenience dimension and product variety
dimensions while the brand dimension and information depth dimension are the least
specific features of this group. The strong point not to shop online is the perceived
risk dimension. The respondents are much concerned with security of their private
information but they do not consider payment system security is a threat to them.
Lack of sense to the products or services bought online raises the perceived risk of
consumers.
Mary et al. (2000) identify different important factors related to goal directed and
experiential online shopping behavior. For the goal directed buying, the most
important factors include accessibility/convenience, selection, information availability,
control of sociality and commitment to Goal (not experience). For the experiential
buying, the factors include ambiance/atmosphere, positive sociality, positive surprise,
commitment to experience as important as or even more important than goal.
Andrew and Vanitha (2004) propose several motives of shopping include shopping
convenience (include time saving), information seeking, immediate possession, social
interaction, the retail shopping experience and variety seeking. Their research
identifies overall shopping convenience as a motive for shopping online, and so do
social interaction and variety seeking. However, time saving and recreation and
enjoyment are not identified as motives to online shopping.
To et al. (2007) identify several factors that may have influence to utilitarian
motivation or hedonic motivation. In addition, they also study the influence caused by
utilitarian and hedonic motivation to search intention and purchase intention. The
research indicates that consumers of online shopping have both utilitarian and hedonic
motivations. Both types of motivation drive search intention and purchase intention.
Furthermore, Factors including cost saving, convenience, selection and information
availability are important utilitarian values, while adventure/explore and authority &
status are important hedonic values.
15
Ceren (2012) studies the relationship among shopping motives (utilitarian and
hedonic value), concern factors (privacy and security) and search intention and
purchase intention about Turkey consumers. The conclusion of this study is Internet
shoppers purchase for both utilitarian and hedonic values, but when they concern
about personal security, they will not go shopping online. Turkey consumers will be
driven by hedonic value to search but not by utilitarian value. This result do not
support the conclusion proposed by Jamiszewski (1998) and To et al. (2007), both of
their conclusion show that search intention would be influenced by both utilitarian
and hedonic value. Moreover, the study of Ceren (2012) indicates that both utilitarian
and hedonic values have important impact on purchase intention, especially hedonic
value has important impact on both search and purchase intentions. Although
utilitarian value has no impact on search intention, it has stronger impact on purchase
intention than hedonic value.
Demographic of consumer is also an important factor. According to table X, age and
gender are the most popular demographic factors researchers frequently studied
before. Teo (2001) examine education as demographic factor. The previous online
purchase is also an important demographic factor researchers considered (Foucault
and Scheufele, 2002; Vijayasarathy, 2004; Barkhi and Wallace, 2007). To et al. (2007)
and Ceren (2012) record years on the Internet of consumer.
2.2.5 Search Intention and Purchase Intention
There are two types of search intention identified by Janiszewski (1998) including
goal-directed search and exploratory search. The customers with goal-directed
orientation are mainly shopping efficiently with a clear goal and substantial shopping
plan. Thus the search behavior taken by them is for collecting relative information of
the target product. The exploration-oriented customers search for browsing shop to
enjoy the searching process. In the online shopping context, search behavior is much
easier to be took compare to offline shopping because the Internet and technology
increase searching efficiency and decrease the limitation of space, which make the
16
browsing medium more convenient and lead to increasing customers’ search
intention.
Li and Zhang (2002) consider the online shopping intention could be described as the
willingness to purchase in an Internet store. According to Fishbein and Ajzen (1975),
the behavioral intention is a valuable predictor of behavior, while Sheppard et al.’s
(1988) research proves that the average correlation between intentions and behavior is
0.53. Therefore, the stronger the behavioral intentions of online shopping is, the much
possible the consumer to shop online. Meanwhile, in accordance with the research of
Moe (2003), when a goal-oriented customer acquire enough or needed information,
they may generate purchase intention. And one the exploration-oriented customer
suffer emotional stimulation, they may have impulsive purchasing or unplanned
shopping behavior. Thus both goal-oriented and exploration-oriented searching
behavior could have impact on purchase intention.
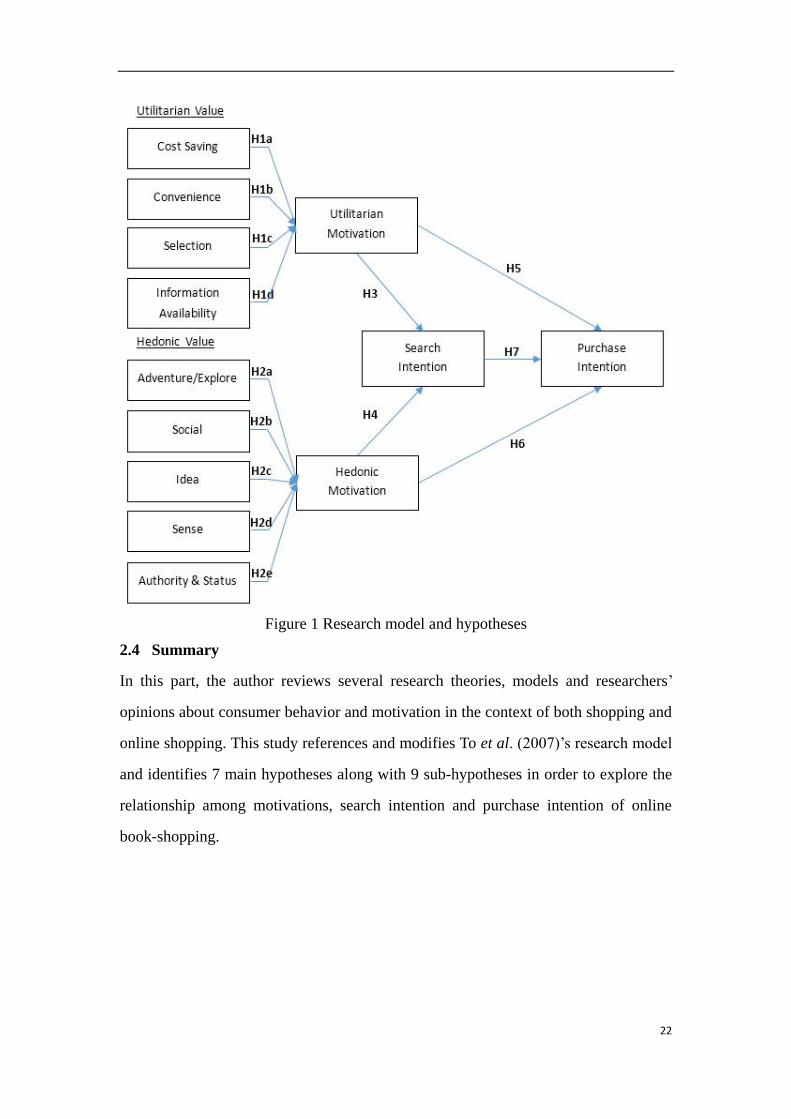
2.3 Research Hypothesis
The purpose of this study is to study what motivation factors may have influence on
online book shopping. The motivation factors are categorized into two groups,
utilitarian motivation and hedonic motivation. Moreover, the other purpose of this
study is to discuss the influence of motivation on search intention and purchase
intention. This study references and modifies To et al. (2007)’s research model and
hypotheses to adapt to study online book-shopping motivation and behavior.
2.3.1 Utilitarian Value and Motivation
Utilitarian motivation is one of two main types of motivation related to online
shopping behavior. Former researchers identified several specific values which may
influence utilitarian motivation. There are six values identified by To et al. (2007), but
two values were removed due to the context of book-shopping. First is lack of
sociality, which means customers may be motivated to shop online due to the lack of
bother from sales people. In the book store of China, staffs will not work and sale as
17
other physical stores, which makes it no sense that lack of sociality drives people to
buy books online. Regarding the other removed value, customized products or service
is not possible because the books are written by writers and the packaging, shipment,
design and transaction method are determined and provided by the online bookstores.
Therefore, there are four values identified in this study referenced from To et al.
(2007).
Cost saving
According to Keeney (1999, cited in To et al., 2007), due to the lower expenditure of
product cost and browsing cost, shopping online is more cost saving than offline. Also,
the saving of rent, store installation, decoration and personnel are other reasons why
shopping online is cost saving (Miller, cited in To et al., 2007). In addition, due to the
reasons stated above, the price will be lower than physical store which becomes
monetary incentives for consumers because they experience cost saving and achieve
higher level of economic control, and as a result, this kind of price promotion exhibit
significant positive correlations with Internet use (Charney and Greenberg, Flanagin
and Metzger, Wolin and korgaonkar, cited in Angeline & Monika, 2010).
Convenience
Shopping online provides no limitation of time, space or weather and 24/7 nonstop
service (Burke, cited in To et al., 2007). Convenience is viewed as the most
compelling motivation in online shopping context because customer can shop online
24/7 easily at home (Swaminthan, Lepkowska-White, & Rao, 1999). Wolfinbarger
and Gilly (2001, cited in To et al., 2007) consider the convenience of online shopping
is from the comfortable and convenient shopping environment provided by using
Internet. According to Liudmila and Jurgita (2009), convenience is the factor has the
most important effect.
Selection
Alba et al. (1997, cited in To et al., 2007) and Wolfinbarger and Gilly (2001) pointed
out that online stores have more products for selection than physical store, and even
the “niche” products also can be found online brings variety advantage to online
shopping compare to offline shopping. Meanwhile, the possibility to make
18
comparison through Internet increases customers’ variety seeking behavior (Rohm
and Swaminathan, 2004). For utilitarian consumers, numerous choices brings more
possibility to find the most appropriate products they want.
Information availability
According to Hoffman and Novak (1996), the Internet makes it possible for
consumers to receive the specific information they need from a wider variety of
information than before. Online shopping also makes it easier to compare, search and
access information than in physical store (Lynch and Ariely, 2000).
All the hypothesis related to utilitarian motivation are stated below.
H1. Utilitarian value has significant positive impact on utilitarian motivation of online
book shopping.
H1a. Cost saving has significant positive impact on utilitarian motivation of online
book shopping.
H1b Convenience has significant positive impact on the utilitarian motivation of
online book shopping.
H1c. Selection has significant positive impact on the utilitarian motivation of online
book shopping.
H1d. Information availability has significant positive impact on the utilitarian
motivation of online book shopping.
2.3.2 Hedonic Value and Motivation
Hedonic motivation is the other type of online shopping motivation. There were five
values identified by To et al. (2007) but Value was removed in this study. Value refers
to the pleasure felt by customer when they negotiate with the sales people during a
bargaining process (Westbrook and Black, 1985). In To et al. (2007)’s point of view,
value will be obtained through the shopping process, which provide increased sensory
involvement and excitement. However, the Chinese customers have consensus that
they certainly will find discount in online book stores and the price are the same in
difference online stores. Therefore, value would not be a motive. Moreover, this study
further adds one variable which is sense of the product. According to Liudmila and
Jurgita (2009), lack of sense to the products or services bought online raises the
19
perceived risk of consumers. In Westbrook and Black (1985)’s point of view,
stimulation is that during shopping process a person may have the motivation to quest
novel and interesting stimuli from the retail environment. Such stimulation might
involve the sensory, emotive, and/or cognitive faculties. Therefore, sense of product
or service could be a valuable value to hedonic motivation. There are five hedonic
values identified in this study.
Adventure/explore
According to Westbrook and Black (1985), the adventure of shopping means that
consumers may feel novel and interesting and experience the joy of exploration
during shopping. Webster et al. (1993, cited in To et al., 2007) propose that people
will have curiosity when interacting with computer which will lead to an action of
adventure as a result.
Social
Tauber (1972) proposes several social motives may influence shopping behavior. Alba
et al. (1997) thinks that desire for social interaction may influence the choice of retail
format such as physical store, catalog or online setting. Arnold and Reynolds (2003)
suggests that many people enjoy spending time to shop with friends or family
members. Wolfinbarger and Gilly (2001) believe consumers can acquire pleasure
when sharing information and shopping experiences with the friends known through
the Internet or in the virtual community.
Idea
This value is that consumers may learn about new trends through go shopping
(Arnold and Reynolds, 2003). Due the wide variety of information from the Internet,
consumers can discover and secure new trends easily which becomes one of the
strongest motivation of online shopping (Parsons, 2002). Consumers can learn the
new books, the bestseller books or the most famous book around the world through
the Internet.
Sense
In the online context, it is difficult to have sense of the product or product-trail
experiences. According to Liudmila and Jurgita (2009), lack of sense to the products
20
or services bought online raises the perceived risk of consumers. Because the most
valuable thing of a book is the content and online retailers cannot post all the content
online for consumers to read, lack of sense will be a challenge to attract recreational
shoppers who may just want to have a glance of a book in the physical book stores.
Authority and status
Parson (2002) considers consumers would have a higher level of control and authority
during shopping online because they can decide the things they see and buy, the time
to receive and then time to make orders. To et al. (2007) think consumers can acquire
the feeling of authority and status by controlling over technology.
All the hypothesis of hedonic motivation are stated below:
H2. Hedonic value has significant positive impact on Hedonic motivation of online
book shopping.
H2a. Adventure/explore has significant positive influence on the hedonic motivation
of online book shopping.
H2b. Sociality has significant positive influence on the hedonic motivation of online
book shopping.
H2c. Idea has significant positive impact on the hedonic motivation of online book
shopping.
H2d. Lack of sense has significant negative impact on the hedonic motivation of
online book shopping.
H2e. Authority and status has significant positive impact on the hedonic motivation of
online book shopping.
2.3.3 Shopping Motivations, Search Intention and Purchase Intention
For the utilitarian oriented consumers, they prefer to search and collect the useful
information during shopping in order to acquire the thing they want to complete the
“mission”; while hedonic oriented consumers need to search online during aimless
browsing for acquiring enjoyment from what they find and the searching process.
Thus, both utilitarian and hedonic motivation would have impact on search intention
21
of online shopping. The eleventh and twelfth hypothesis are:
H3. Utilitarian motivation has significant positive impact on the search intention of
online book shopping.
H4. Hedonic motivation has significant positive impact on the search intention of
online book shopping.
Babin et al. (1994) suggest that hedonic motivation will have stronger influence on
unplanned purchase behavior than utilitarian motivation. Based on Babin et al.
(1994)’s opinion, To et al. (2007) suggest that hedonic motivation will have impact on
purchase intention through search intention indirectly. However, the study of Ceren
Topalovğlu (2012)’s on Turkish consumers indicates that both utilitarian and hedonic
value could influence purchase intention. Thus, the thirteenth and fourteenth
hypothesis are:
H5. Utilitarian motivation has significant positive influence on the purchase intention
of online book shopping.
H6. Hedonic motivation has significant positive impact on the purchase intention of
online book shopping.
Shim et al. (2001)’s research proposes that the search intention of online shoppers has
a positive impact on their purchase intention. Based on this conclusion, the fifteenth
hypothesis is:
H7. The search intention has significant positive impact on purchase intention of
online book shopping.
2.3.4 Research Hypothesis Graph
22
Figure 1 Research model and hypotheses
2.4 Summary
In this part, the author reviews several research theories, models and researchers’
opinions about consumer behavior and motivation in the context of both shopping and
online shopping. This study references and modifies To et al. (2007)’s research model
and identifies 7 main hypotheses along with 9 sub-hypotheses in order to explore the
relationship among motivations, search intention and purchase intention of online
book-shopping.
23
3 Methodology
On the basis of the literature review, the author has established the research model of
this study. In order to analyze the data of the research, seven research hypotheses and
nine sub-hypotheses are set up. The hypotheses are focusing on the relationship
among Utilitarian values, Hedonic values, Utilitarian motivation, Hedonic motivation,
Search intention and Purchase intention. A questionnaire survey is held as a tool to
collect primary data in order to test the hypotheses, because according to Saunders et
al. (2003), for collecting descriptive and explanatory data about opinions, behaviors
and attributes, using a questionnaire is the best way.
3.1 Pilot Test
There are two steps of the pilot test. The first step is to obtain an initial Chinese
translation of the questionnaire by the way of English-Chinese-English process,
because the questionnaire survey would be conduct in China. Meanwhile, because the
items of the questionnaire was all in English and referenced from To et al. (2007)’s
research, Liudmila and Jurgita (2009)’s research and Ruoqiao Ma et al. (2010)’s
research, in order to conduct the survey in China, the questionnaire should be
translated into Chinese. Thus, a pilot test should be implemented.
The whole questionnaire was translated into Chinese from English by the author. And
then, Zongyuan Li who is a master student in ISCTE-IUL, major in Finance, was
invited to revise the Chinese questionnaire into English. Then the author discussed
with Zongyuan Li about the differences between the original questionnaire and the
translation of Zongyuan Li, in order to clarify the misunderstanding about Chinese
wording. After further discussion, an initial Chinese questionnaire was obtained under
the help of Zongyuan Li.
The second step is to release the initial Chinese questionnaire to 10 people from the
target group to answer the questionnaire, they are the students from different
university including one student named Lü Zou who is major in English and
Translation. In this step, the goal is to test the initial Chinese questionnaire under
24
different points of view, to see if there are any other misunderstandings or the diction
which is not clear. For example, about the translation of “in my own universe”, Lü
Zou suggested this item consisted of two parts: the feeling of free and the feeling of
happiness and enjoyment. Thus he suggested to utilize the special way of translation,
to combine literal translation and liberal translation. Moreover, the 10 students
suggested to scramble the items of questionnaire because the respondents may have
tendentiousness when they find several items have similar meanings to the one they
just answer. And they also suggested to divide the whole questionnaire into parts
because they thought if the questionnaire could be divided into parts, the respondents
might not feel there were too many items to answer.
After the pilot test the author amended the questionnaire. First is to amend the diction
of each item to make it much more clear and easy to understand, for example the item
“in my own universe” mentioned above. Second is to divide the whole questionnaire
into three parts, Utilitarian & Hedonic value, Utilitarian & Hedonic motivation, and
Search intention & Purchase intention. Third is to scramble the items of the part
Utilitarian & Hedonic value to avoid the tendentiousness of the respondents. After the
amendments of questionnaire, the formal version was obtained and ready to release.
3.2 The Questionnaire
The questionnaire has four parts, including Demographic data, Utilitarian & Hedonic
value, Utilitarian & Hedonic motivation and Search & Purchase intention.
For the part of Demographic data, it requires the respondents to fill in their basic
information, including Gender, Age, Graduate School, Residence, Education
Background, Online Shopping Experiences, Internet Use History and The Favorite
Book-shopping Website.
For the part of Utilitarian & Hedonic value, several specific factors are identified with
related items. Regarding Utilitarian values, it includes Cost Saving, Convenience,
Selection and Information Availability, and the items for each factor are quoted from
To et al. (2007)’s research. Regarding Hedonic values, it includes Adventure/explore,
25
Social, Idea, Sense and Authority & Status. The items of Sense are quoted from the
researches of Liudmila and Jurgita (2009) and Ruoqiao Ma et al. (2010). The rest of
items are all quoted from To et al. (2007)’s research.
For the part of Utilitarian & Hedonic motivation, the items are quoted from To et al.
(2007)’s research, while To et al. (2007) used the measurement of utilitarian and
hedonic motivations developed by Voss et al. (2003).
For the part of Search & Purchase intention, the items are quoted from To et al.
(2007)’s research.
The part of Utilitarian & Hedonic value and Search & Purchase intention adopted a
seven-scale Likert scale, with 1 representing total disagreement and 7 representing
total agreement. The part of Utilitarian & Hedonic motivation adopted a seven-scale
semantic differential measurement.
3.3 The Samples
Respondents of this study are university students including 3-Years college students,
bachelor students, master students and Ph.D. students, because university students
become the main group for buying books, and also the earliest group to learn and
adopt Internet and E-commerce. The way to collect the data is convenient sampling. A
total of 313 questionnaires were distributed through Internet, 257 were valid. The
valid response rate was 82.1%. The samples with online shopping experience less
than 1 year, and Internet use history less than 1 year were considered as low
persuasion, which means their opinions were not representative enough as light online
shoppers. After deleting the light online shoppers, 238 were valid, the valid response
rate was 76.0%.
3.4 The Tool
In this study, the software SPSS 22.0 and Eviews 6.0 are used to analyze the data
collected by the questionnaire survey.

26
4 Result
4.1 Demographics
The respondents of this study are students who also are Internet users in China that
have Internet shopping experience.
The number of male respondents is 85 (35.7%) while female respondents is 153
(64.3%). People aged between 23 and 24 comprise about 87 (36.6%) of the
respondents; people aged between 25 and 26 comprise about 85 (35.7%); people who
is 22 and younger than 22 comprise 38 (16%) while people who is 27 and over 27
comprise 28 (11.8%) of the respondents. Thus, people who aged between 23 and 26
are the major group of this study.
There are 194 (81.5%) respondents have no oversea education background, which
means their whole education is taken under the education system of China; and there
are 44 (18.5%) respondents have oversea education background.
There are 150 (63%) respondents live in South China while 88 (37%) respondents live
in other parts of China, for example, East China, North China, Central China or
West-north China.
There are 169 (71.0%) respondents who have bachelor degree, while 61 (25.6%)
respondents have master degree; only 2 (0.8%) respondents have Ph.D. degree and 6
(2.5%) has 3-year college degree.
The number of respondents who have 1 to 3 years online shopping experience is 85
(35.7%), and 118 (49.6%) respondents have 4 to 6 years online shopping experience
which is approximately half of the respondents, 30 (12.6%) respondents have 7 to 9
years online shopping experience while only 5 (2.1%) have over 9 years of
experience.
About the Internet use history, the majority is the people who have used Internet over
9 years with the number of 126 (52.9%), the second largest group is the people who
have used Internet between 7 and 9 years with the number of 61 (25.6%), and then 48
(20.2%) respondents have 4 to 6 years Internet use history, and only 3 (1.3%)
respondents have used Internet between 1 to 3 years.
27
This study asked the respondents to apply their most frequent book-shopping website
for answering the questionnaire. It shows that Dangdang.com is the most popular
website in this study with 94 (39.5%) respondents use it as their most frequent
book-shopping website. The following is Amazon.cn with 81 (34.0%) respondents. 38
(16.0%) respondents use Taobao.com as their most frequent website while 22 (9.2%)
respondents use JD.com as their most frequent website. Only 3 (1.3%) respondents do
not use those websites mentioned above as their most frequent website.
4.2 Validity
For the purpose of assessing convergent and discriminant validities, there are three
scales of the questionnaire with total 45 items were subjected to principal components
analysis with varimax rotation. For the scale of Utilitarian & Hedonic value, there are
two sub-scales which are Utilitarian Value and Hedonic value (To et al., 2007). And
the rest of scales are Utilitarian & Hedonic Motivation (Voss et al., cited in To et al.,
2007) and Search & Purchase Intention (To et al., 2007).
4.2.1 Utilitarian Value Scale
There are 13 items used to measure four research variables by using principal
components analysis first. Because item IA2 and SL2 contribute to two different
components based on the value of rotated component matrix under the rotation
method of Varimax and the pattern matrix and structure matrix under the rotation
method of Direct Oblimin, both item IA2 and SL2 should be deleted. After deleting
item IA2 and SL2, there are only two items SL1 and IA1 in component 3, which is
less than 3 items and is not enough to represent a component. Therefore, item SL1
and IA1 are deleted. The final outcome of factor analysis of Utilitarian Value Scale is
shown below.
KMO and Bartlett’s Test
According to Kaiser (1974), the KMO measure of sampling adequacy has to be higher
than 0.60, so that the factor analysis could be proceed. The KMO measure is 0.859
shows a level of favorable, the approximate chi-square is 649.830, degree of freedom
is 36, and the significance level is 0.000 which is <0.01. All the values indicates it is
appropriate to proceed factor analysis.
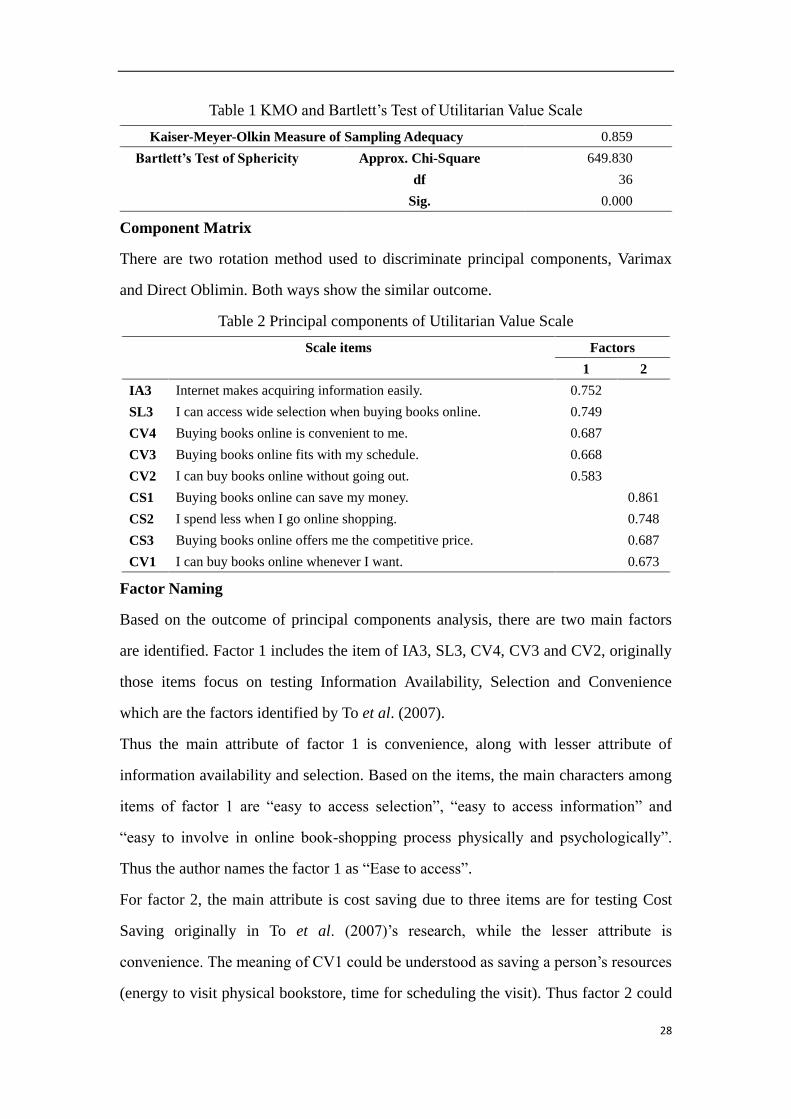
28
Table 1 KMO and Bartlett’s Test of Utilitarian Value Scale Kaiser-Meyer-Olkin Measure of Sampling Adequacy 0.859
Bartlett’s Test of Sphericity Approx. Chi-Square 649.830
df 36
Sig. 0.000
Component Matrix
There are two rotation method used to discriminate principal components, Varimax
and Direct Oblimin. Both ways show the similar outcome.
Table 2 Principal components of Utilitarian Value Scale
Scale items Factors
1 2
IA3 Internet makes acquiring information easily. 0.752
SL3 I can access wide selection when buying books online. 0.749
CV4 Buying books online is convenient to me. 0.687
CV3 Buying books online fits with my schedule. 0.668
CV2 I can buy books online without going out. 0.583
CS1 Buying books online can save my money. 0.861
CS2 I spend less when I go online shopping. 0.748
CS3 Buying books online offers me the competitive price. 0.687
CV1 I can buy books online whenever I want. 0.673
Factor Naming
Based on the outcome of principal components analysis, there are two main factors
are identified. Factor 1 includes the item of IA3, SL3, CV4, CV3 and CV2, originally
those items focus on testing Information Availability, Selection and Convenience
which are the factors identified by To et al. (2007).
Thus the main attribute of factor 1 is convenience, along with lesser attribute of
information availability and selection. Based on the items, the main characters among
items of factor 1 are “easy to access selection”, “easy to access information” and
“easy to involve in online book-shopping process physically and psychologically”.
Thus the author names the factor 1 as “Ease to access”.
For factor 2, the main attribute is cost saving due to three items are for testing Cost
Saving originally in To et al. (2007)’s research, while the lesser attribute is
convenience. The meaning of CV1 could be understood as saving a person’s resources
(energy to visit physical bookstore, time for scheduling the visit). Thus factor 2 could
29
be named as “Cost Saving”.
4.2.2 Hedonic Value Scale
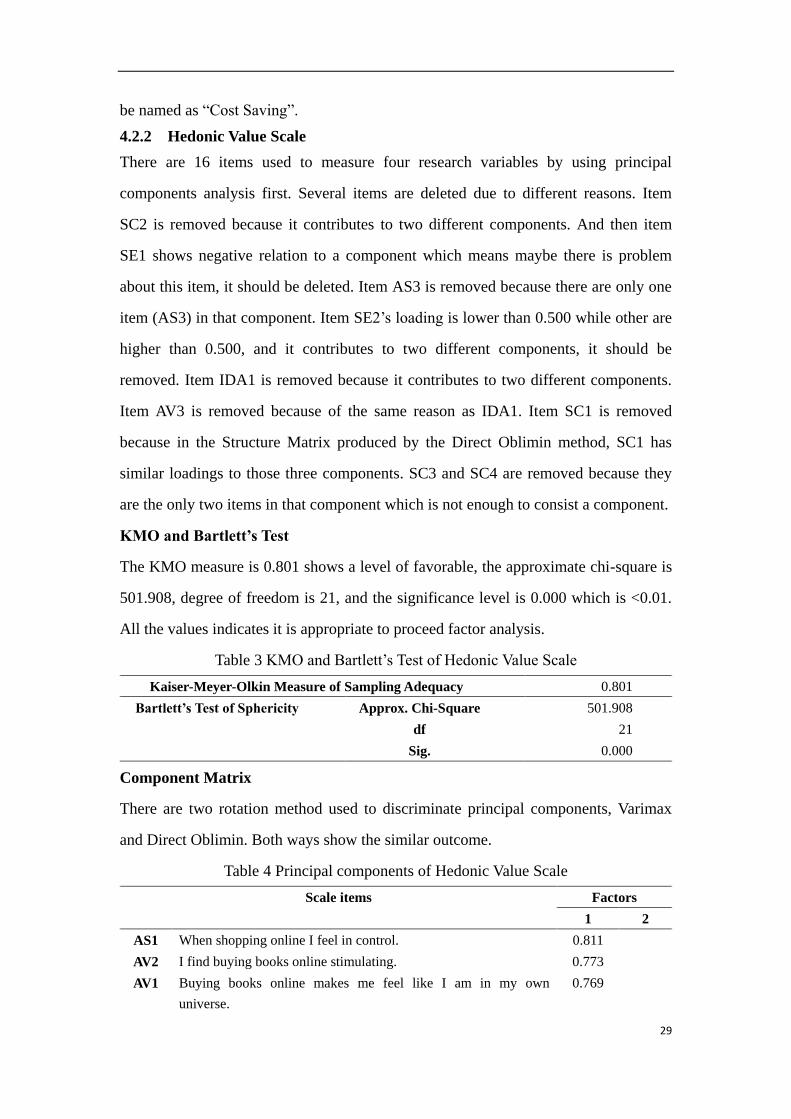
There are 16 items used to measure four research variables by using principal
components analysis first. Several items are deleted due to different reasons. Item
SC2 is removed because it contributes to two different components. And then item
SE1 shows negative relation to a component which means maybe there is problem
about this item, it should be deleted. Item AS3 is removed because there are only one
item (AS3) in that component. Item SE2’s loading is lower than 0.500 while other are
higher than 0.500, and it contributes to two different components, it should be
removed. Item IDA1 is removed because it contributes to two different components.
Item AV3 is removed because of the same reason as IDA1. Item SC1 is removed
because in the Structure Matrix produced by the Direct Oblimin method, SC1 has
similar loadings to those three components. SC3 and SC4 are removed because they
are the only two items in that component which is not enough to consist a component.
KMO and Bartlett’s Test
The KMO measure is 0.801 shows a level of favorable, the approximate chi-square is
501.908, degree of freedom is 21, and the significance level is 0.000 which is <0.01.
All the values indicates it is appropriate to proceed factor analysis.
Table 3 KMO and Bartlett’s Test of Hedonic Value Scale
Kaiser-Meyer-Olkin Measure of Sampling Adequacy 0.801
Bartlett’s Test of Sphericity Approx. Chi-Square 501.908
df 21
Sig. 0.000
Component Matrix
There are two rotation method used to discriminate principal components, Varimax
and Direct Oblimin. Both ways show the similar outcome.
Table 4 Principal components of Hedonic Value Scale
Scale items Factors
1 2
AS1 When shopping online I feel in control. 0.811
AV2 I find buying books online stimulating. 0.773
AV1 Buying books online makes me feel like I am in my own
universe.
0.769
30
AS2 During buying books online, I have control over my online
shopping process.
0.641
IDA2 I can keep up with the new books. 0.853
IDA3 I can see what new books are available. 0.824
SE3 The book assessment provided in online book stores is helpful to
know more about the books.
0.647
Factor Naming
Based on the outcome of principal components analysis, there are two main factors
are identified. Factor 1 includes the item of AS1, AV2, AV1 and AS2, originally those
items focus on testing Adventure/explore and Authority & Status which are the factors
identified by To et al. (2007). Based on the items, the author names the factor 1 as
“Authority & Enjoyment”.
For factor 2, the main attribute is to get the idea of new trend due to two items are for
testing Idea originally in To et al. (2007)’s research, while the lesser attribute is the
sense of books. The meaning of LS3 could be understood as getting the idea of how
books are assessed. Thus factor 2 could be named as “Idea”.
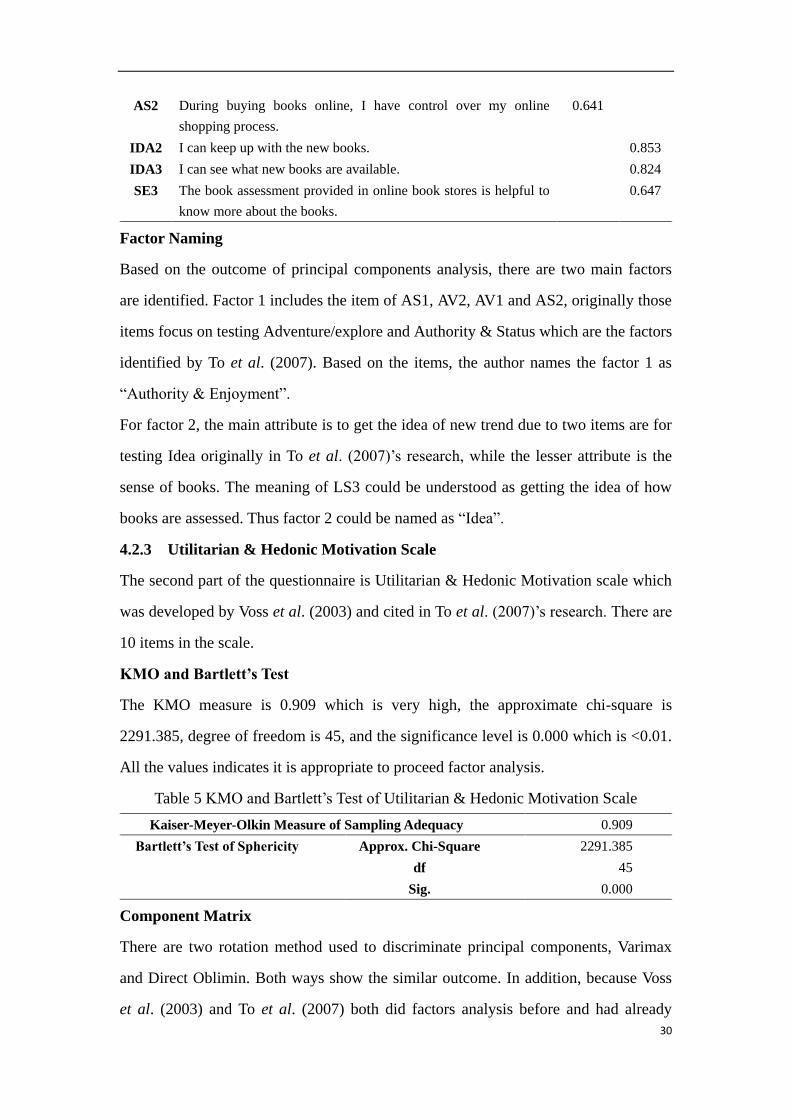
4.2.3 Utilitarian & Hedonic Motivation Scale
The second part of the questionnaire is Utilitarian & Hedonic Motivation scale which
was developed by Voss et al. (2003) and cited in To et al. (2007)’s research. There are
10 items in the scale.
KMO and Bartlett’s Test
The KMO measure is 0.909 which is very high, the approximate chi-square is
2291.385, degree of freedom is 45, and the significance level is 0.000 which is <0.01.
All the values indicates it is appropriate to proceed factor analysis.
Table 5 KMO and Bartlett’s Test of Utilitarian & Hedonic Motivation Scale Kaiser-Meyer-Olkin Measure of Sampling Adequacy 0.909
Bartlett’s Test of Sphericity Approx. Chi-Square 2291.385
df 45
Sig. 0.000
Component Matrix
There are two rotation method used to discriminate principal components, Varimax
and Direct Oblimin. Both ways show the similar outcome. In addition, because Voss
et al. (2003) and To et al. (2007) both did factors analysis before and had already
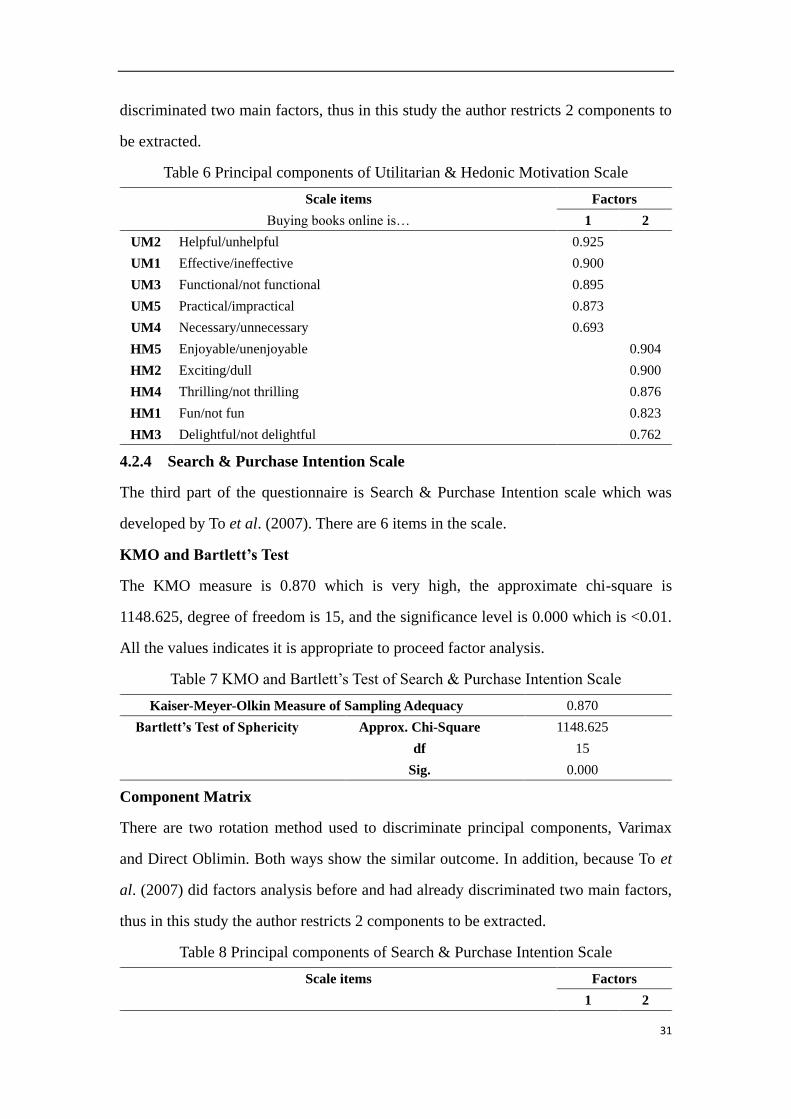
31
discriminated two main factors, thus in this study the author restricts 2 components to
be extracted.
Table 6 Principal components of Utilitarian & Hedonic Motivation Scale
Scale items Factors
Buying books online is… 1 2
UM2 Helpful/unhelpful 0.925
UM1 Effective/ineffective 0.900
UM3 Functional/not functional 0.895
UM5 Practical/impractical 0.873
UM4 Necessary/unnecessary 0.693
HM5 Enjoyable/unenjoyable 0.904
HM2 Exciting/dull 0.900
HM4 Thrilling/not thrilling 0.876
HM1 Fun/not fun 0.823
HM3 Delightful/not delightful 0.762
4.2.4 Search & Purchase Intention Scale
The third part of the questionnaire is Search & Purchase Intention scale which was
developed by To et al. (2007). There are 6 items in the scale.
KMO and Bartlett’s Test
The KMO measure is 0.870 which is very high, the approximate chi-square is
1148.625, degree of freedom is 15, and the significance level is 0.000 which is <0.01.
All the values indicates it is appropriate to proceed factor analysis.
Table 7 KMO and Bartlett’s Test of Search & Purchase Intention Scale
Kaiser-Meyer-Olkin Measure of Sampling Adequacy 0.870
Bartlett’s Test of Sphericity Approx. Chi-Square 1148.625
df 15
Sig. 0.000
Component Matrix
There are two rotation method used to discriminate principal components, Varimax
and Direct Oblimin. Both ways show the similar outcome. In addition, because To et
al. (2007) did factors analysis before and had already discriminated two main factors,
thus in this study the author restricts 2 components to be extracted.
Table 8 Principal components of Search & Purchase Intention Scale
Scale items Factors
1 2
32
PI3 I will continue shopping online in the future. 0.840
PI2 I would like to purchase products or service online. 0.834
PI1 It is a wonderful way to shop online. 0.822
SI2 I would like to search products or services online. 0.859
SI1 It is a wonderful way to search products or service online. 0.803
SI3 I will continue searching products or service online in the future. 0.795
4.3 Reliability
The reliability test is implemented to test the following scales, Utilitarian Value Scale,
Hedonic Value Scale, Utilitarian & Hedonic Motivation Scale and Search & Purchase
Intention Scale. Moreover, reliability test is also implemented to test the reliability of
each value identified by factor analysis, including Ease to Access, Cost Saving,
Authority & Enjoyment and Idea.
Cronbach’s alpha indicator is used to assess the initial reliability of the scales, a
minimum value of 0.7 of Cronbach’s alpha is acceptable (Cronbach, 1970; Nunnally,
1978). In this case, the lowest value of Cronbach’s alpha is 0.724, all Cronbach’s
Alpha of other scales are higher than 0.724. These results indicate that all scales have
acceptable reliability.
Table 9 Reliability statistics
Scales Cronbach’s
Alpha
Cronbach’s Alpha Based
on Standardized Items
N of Items
Utilitarian Value 0.833 0.836 9
Ease to Access 0.770 0.772 5
Cost Saving 0.782 0.782 4
Hedonic Value 0.807 0.808 7
Authority & Enjoyment 0.781 0.780 4
Idea 0.724 0.725 3
Utilitarian & Hedonic
Motivation
0.928 0.928 10
Search & Purchase Intention 0.923 0.927 10
4.4 Multiple Linear Regression Analysis
4.4.1 Correlation among Exogenous Variables
In the overall model, there are four exogenous variables, they are Ease to Access, Cost
Saving, Authority & Enjoyment and Idea. According to the correlation matrix, Ease to
Access has medium correlation with Cost Saving (0.538, p=0.000) and Authority &
Enjoyment (0.461, p=0.000) separately, while Cost Saving has low correlation with

33
Authority & Enjoyment (0.303, p=0.000). Idea has no correlation with Ease to Access
(-0.084, p=0.199), or Cost Saving (-0.104, p=0.111), or Authority Enjoyment (-0.021,
p=0.744).
Table 10 Correlation among exogenous variables
Ease to
Access
Cost Saving Authority &
Enjoyment
Idea
Ease to Access 1
Cost Saving 0.538** 1
Authority & Enjoyment 0.461** 0.303** 1
Idea -0.084 -0.104 -0.021 1
**. Correlation is significant at the 0.01 level (2-tailed).
4.4.2 Multiple Linear Regression Model 1
Model Equation
There are two explanatory variables and one dependent variable included in this
model. The two explanatory variables are Ease to Access (EA) and Cost Saving (CS),
while the dependent variable is Utilitarian Motivation (UM).
UM = c + 𝛽1EA + 𝛽2CS (4.1)
Correlation
Based on the result, we conclude that the correlation between Ease of Access which is
the explanatory variable and Utilitarian Motivation which is the dependent variable is
statistically significant (0.345, p=0.000), in accordance to the 5% significance level.
Moreover, another explanatory variable Cost Saving also has statistically significant
correlation (0.301, p=0.000) to the dependent variable Utilitarian Motivation, in
accordance to the 5% significance level.
Table 11 Correlation of Model 1 variables
Ease of Access Cost Saving Utilitarian
Motivation
Ease of Access 1
Cost Saving 0.538** 1
Utilitarian Motivation 0.345** 0.301** 1
**. Correlation is significant at the 0.01 level (2-tailed).
Stability Test – The RESET Test
The RESET test (Regression specification error test) is a general test to conclude
about the occurrence of three types of specification errors: omission of relevant

34
explanatory variables, incorrect functional form and correlation between variables and
the errors of the model (Ramsey, 1969).
Based on the outcome of RESET test, the F-statistic is 0.847861, the Prob. F (2,233)
is 0.4296 and the Prob. Chi-Square (2) is 0.4219, we can conclude that the
Linear-Linear functional form is the correct one to establish the relationship between
dependent variable (Utilitarian Motivation) and explanatory variables (Ease to Access
and Cost Saving).
Table 12 Ramsey RESET Test of Model 1
F-statistic 0.847861 Prob. F (2,233) 0.4296
Log likelihood ratio 1.725838 Prob. Chi-Square (2) 0.4219
Normality Test – The Jarque - Bera (JB) Test
The normality Jarque-Bera test is based on the estimates for the coefficients of
skewness and kurtosis.
As the probability associated with the J-B test is 0.000000 which is lower than the
significance level of 5%. Thus the residuals distribution of this sample is not normally
distributed. In another word, the normality of the errors is violated. Although the OLS
estimators are still Best Linear Unbiased Estimators, based on the Central Limit
Theorem, the statistical inference is only valid asymptotically (Johnston and Dinardo,
2001). Moreover, based on the Central Limit Theorem, although the normality of the
errors is violated, the F-test and T-test are still workable.
0
5
10
15
20
25
30
35
40
-25 -20 -15 -10 -5 0 5 10
Series: Residuals
Sample 1 238
Observations 238
Mean -1.32e-15
Median 0.611174
Maximum 10.38865
Minimum -26.00189
Std. Dev. 5.668931
Skewness -2.335158
Kurtosis 10.22186
Jarque-Bera 733.5071
Probability 0.000000
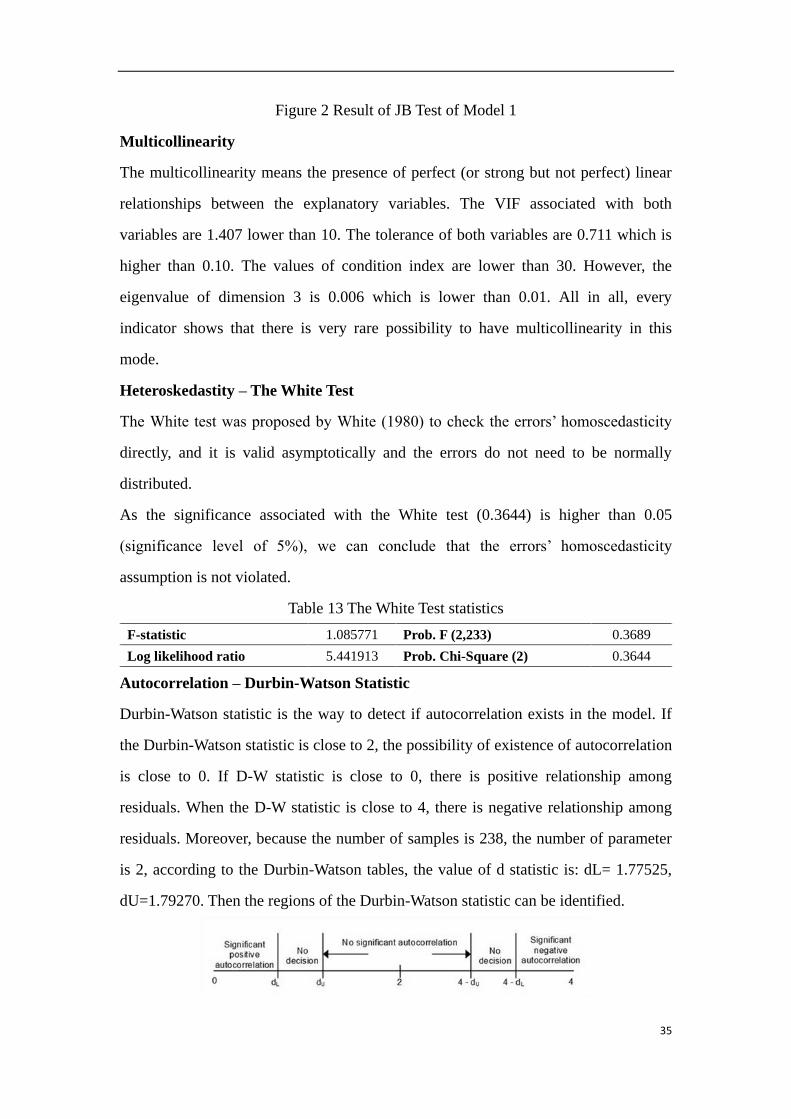
35
Figure 2 Result of JB Test of Model 1
Multicollinearity
The multicollinearity means the presence of perfect (or strong but not perfect) linear
relationships between the explanatory variables. The VIF associated with both
variables are 1.407 lower than 10. The tolerance of both variables are 0.711 which is
higher than 0.10. The values of condition index are lower than 30. However, the
eigenvalue of dimension 3 is 0.006 which is lower than 0.01. All in all, every
indicator shows that there is very rare possibility to have multicollinearity in this
mode.
Heteroskedastity – The White Test
The White test was proposed by White (1980) to check the errors’ homoscedasticity
directly, and it is valid asymptotically and the errors do not need to be normally
distributed.
As the significance associated with the White test (0.3644) is higher than 0.05
(significance level of 5%), we can conclude that the errors’ homoscedasticity
assumption is not violated.
Table 13 The White Test statistics
F-statistic 1.085771 Prob. F (2,233) 0.3689
Log likelihood ratio 5.441913 Prob. Chi-Square (2) 0.3644
Autocorrelation – Durbin-Watson Statistic
Durbin-Watson statistic is the way to detect if autocorrelation exists in the model. If
the Durbin-Watson statistic is close to 2, the possibility of existence of autocorrelation
is close to 0. If D-W statistic is close to 0, there is positive relationship among
residuals. When the D-W statistic is close to 4, there is negative relationship among
residuals. Moreover, because the number of samples is 238, the number of parameter
is 2, according to the Durbin-Watson tables, the value of d statistic is: dL= 1.77525,
dU=1.79270. Then the regions of the Durbin-Watson statistic can be identified.
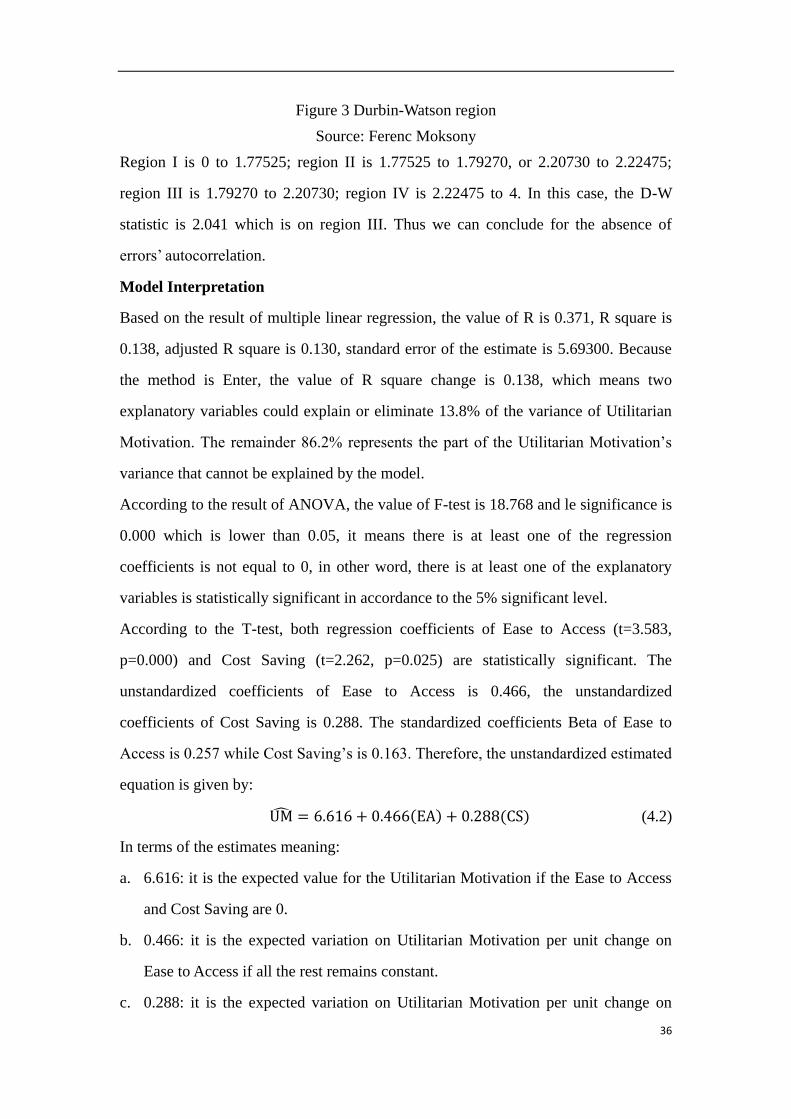
36
Figure 3 Durbin-Watson region
Source: Ferenc Moksony
Region I is 0 to 1.77525; region II is 1.77525 to 1.79270, or 2.20730 to 2.22475;
region III is 1.79270 to 2.20730; region IV is 2.22475 to 4. In this case, the D-W
statistic is 2.041 which is on region III. Thus we can conclude for the absence of
errors’ autocorrelation.
Model Interpretation
Based on the result of multiple linear regression, the value of R is 0.371, R square is
0.138, adjusted R square is 0.130, standard error of the estimate is 5.69300. Because
the method is Enter, the value of R square change is 0.138, which means two
explanatory variables could explain or eliminate 13.8% of the variance of Utilitarian
Motivation. The remainder 86.2% represents the part of the Utilitarian Motivation’s
variance that cannot be explained by the model.
According to the result of ANOVA, the value of F-test is 18.768 and le significance is
0.000 which is lower than 0.05, it means there is at least one of the regression
coefficients is not equal to 0, in other word, there is at least one of the explanatory
variables is statistically significant in accordance to the 5% significant level.
According to the T-test, both regression coefficients of Ease to Access (t=3.583,
p=0.000) and Cost Saving (t=2.262, p=0.025) are statistically significant. The
unstandardized coefficients of Ease to Access is 0.466, the unstandardized
coefficients of Cost Saving is 0.288. The standardized coefficients Beta of Ease to
Access is 0.257 while Cost Saving’s is 0.163. Therefore, the unstandardized estimated
equation is given by:
UM = 6.616 + 0.466(EA) + 0.288(CS) (4.2)
In terms of the estimates meaning:
a. 6.616: it is the expected value for the Utilitarian Motivation if the Ease to Access
and Cost Saving are 0.
b. 0.466: it is the expected variation on Utilitarian Motivation per unit change on
Ease to Access if all the rest remains constant.
c. 0.288: it is the expected variation on Utilitarian Motivation per unit change on
37
Cost Saving if all the rest remains constant.
And the standardized coefficients could be interpret as:
1. 0.257: for the variation of one standard deviation in the Ease to Access, and
assuming everything else constant, it is expected a variation of 0.257 standard
deviations on Utilitarian Motivation.
2. 0.163: it is the expected variation on Utilitarian Motivation per unit change on
Cost Saving.
The beta coefficient of Ease to Access is higher than the one of Cost Saving, it means
Ease to Access is the explanatory variable with higher impact on the dependent
variable Utilitarian Motivation.
4.4.3 Multiple Linear Regression Model 2
Model Equation
In this model, because the RESET test of Linear-Linear functional form was
statistically significant, which indicates that there may be specification errors. Under
the functional form of Linear-Log, the result of RESET test was not significant, which
means the problem of specification error was solved by changing the functional form.
Thus the result below is using the functional form of Linear-Log.
In addition, according to the result of Collinearity Diagnostics, the eigenvalue of
dimension 2 is 0.006<0.01, eigenvalue of dimension 3 is 0.002<0.01, and the
condition index of dimension 3 is 44.093 which is higher than 30. These statistics
indicates that the multicollinearity problem exist. Moreover, the value of variance
proportions of Log (Idea) in dimension 3 is 0.75, therefore, in order to eliminate the
multicollinearity problem, factor Log (Idea) should be deleted.
Therefore, model 2 becomes a simple linear regression model and the model equation
is:
HM = c + 𝛽1AE (4.3)
Model Interpretation
Based on the result of simple regression analysis, the value of R is 0.520, R square is
0.270, adjusted R square is 0.267, the standard error of the estimate is 5.19727. Here
the explanatory variable Authority & Enjoyment could explain or eliminate 27.0% of
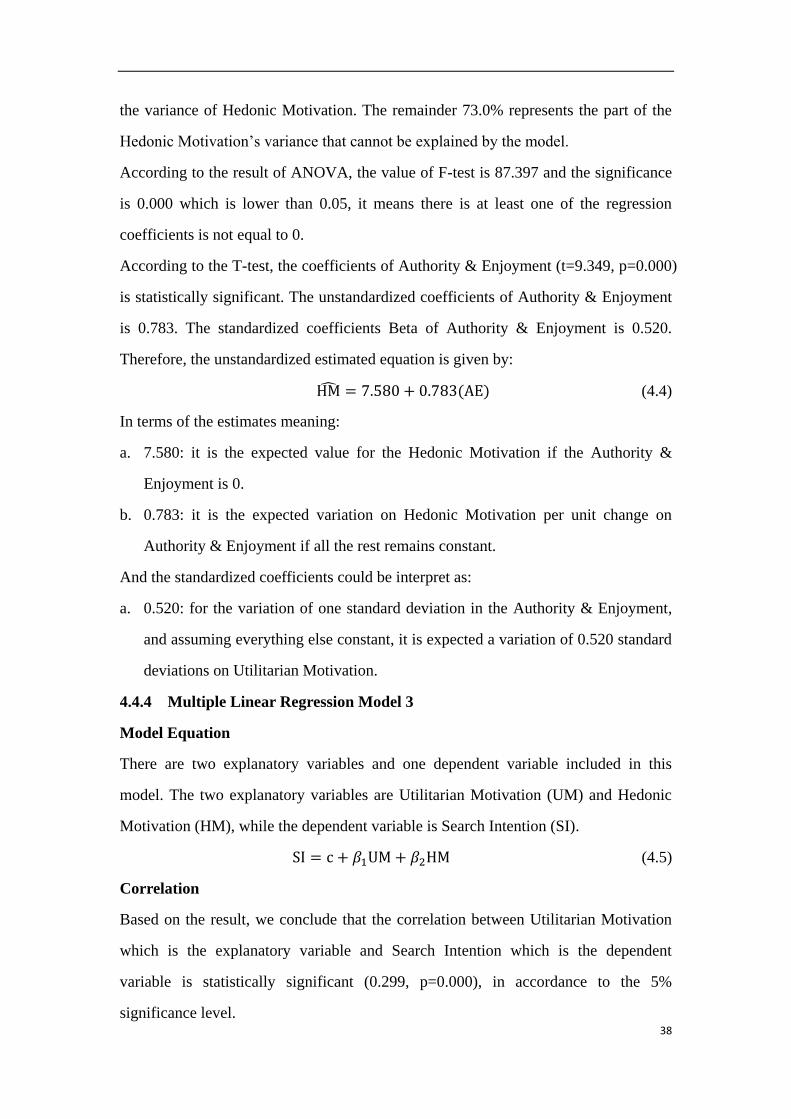
38
the variance of Hedonic Motivation. The remainder 73.0% represents the part of the
Hedonic Motivation’s variance that cannot be explained by the model.
According to the result of ANOVA, the value of F-test is 87.397 and the significance
is 0.000 which is lower than 0.05, it means there is at least one of the regression
coefficients is not equal to 0.
According to the T-test, the coefficients of Authority & Enjoyment (t=9.349, p=0.000)
is statistically significant. The unstandardized coefficients of Authority & Enjoyment
is 0.783. The standardized coefficients Beta of Authority & Enjoyment is 0.520.
Therefore, the unstandardized estimated equation is given by:
HM = 7.580 + 0.783(AE) (4.4)
In terms of the estimates meaning:
a. 7.580: it is the expected value for the Hedonic Motivation if the Authority &
Enjoyment is 0.
b. 0.783: it is the expected variation on Hedonic Motivation per unit change on
Authority & Enjoyment if all the rest remains constant.
And the standardized coefficients could be interpret as:
a. 0.520: for the variation of one standard deviation in the Authority & Enjoyment,
and assuming everything else constant, it is expected a variation of 0.520 standard
deviations on Utilitarian Motivation.
4.4.4 Multiple Linear Regression Model 3
Model Equation
There are two explanatory variables and one dependent variable included in this
model. The two explanatory variables are Utilitarian Motivation (UM) and Hedonic
Motivation (HM), while the dependent variable is Search Intention (SI).
SI = c + 𝛽1UM + 𝛽2HM (4.5)
Correlation
Based on the result, we conclude that the correlation between Utilitarian Motivation
which is the explanatory variable and Search Intention which is the dependent
variable is statistically significant (0.299, p=0.000), in accordance to the 5%
significance level.
39
Moreover, another explanatory variable Hedonic Motivation also has statistically
significant correlation (0.219, p=0.000) to the dependent variable Search Intention, in
accordance to the 5% significance level.
Table 14 Correlation of Model 3
Utilitarian
Motivation
Hedonic
Motivation
Search
Intention
Utilitarian Motivation 1
Hedonic Motivation 0.532** 1
Search Intention 0.299** 0.219** 1
**. Correlation is significant at the 0.01 level (2-tailed).
Stability Test
All the significance of RESET test under four different functional forms are lower
than 0.05, which means the specification errors of model 2 is not incorrect functional
forms. Linear-Linear functional form will be used to proceed the analysis.
Table 15 Ramsey RESET Test of Model 3
Functional Form F-statistic Prob. F Log likelihood ratio Prob. Chi-Square
Linear-Linear 22.31841 0.000 41.71555 0.000
Log-Log 39.15395 0.000 36.82204 0.000
Linear-Log 20.88581 0.000 39.24664 0.000
Log-Linear 22.14011 0.000 41.40967 0.000
Normality Test – The Jarque - Bera (JB) Test
As the probability associated with the J-B test is 0.396561 which is higher than the
significance level of 5%. Thus the residuals distribution of this sample is normally
distributed. The OLS estimators are Best Linear Unbiased Estimators, and the results
of F-test and T-test are trustworthy.
40
Figure 4 Result of JB Test of Model 3
Multicollinearity
The VIF associated with both variables are 1.395 lower than 10. The tolerance of both
variables are 0.717 which is higher than 0.10. The values of condition index are lower
than 30. The eigenvalues are higher than 0.01. All in all, we conclude there is no
multicollinearity problem occurs in this model.
Heteroskedastity – The White Test
Result
As the significance associated with the White test (0.0000) is lower than 0.05
(significance level of 5%), we can conclude that the errors’ homoscedasticity
assumption is violated. In addition, the results of the White test under different
functional forms all shows the existence of heteroskedastity, thus changing functional
forms cannot solve the problem
Table 16 The White Test statistics
F-statistic 6.942827 Prob. F (5,232) 0.0000
Log likelihood ratio 30.97685 Prob. Chi-Square (5) 0.0000
Solution
Weighted Least Squares
In order to solve the problem of heteroskedastity, the weighted least squares method is
chosen. The most important thing is to decide the form of weight. In this study, there
0
4
8
12
16
20
24
28
-6 -4 -2 0 2 4 6
Series: Residuals
Sample 1 238
Observations 238
Mean -7.50e-16
Median 0.143130
Maximum 6.502113
Minimum -6.528537
Std. Dev. 2.306591
Skewness -0.172871
Kurtosis 2.741152
Jarque-Bera 1.849850
Probability 0.396561
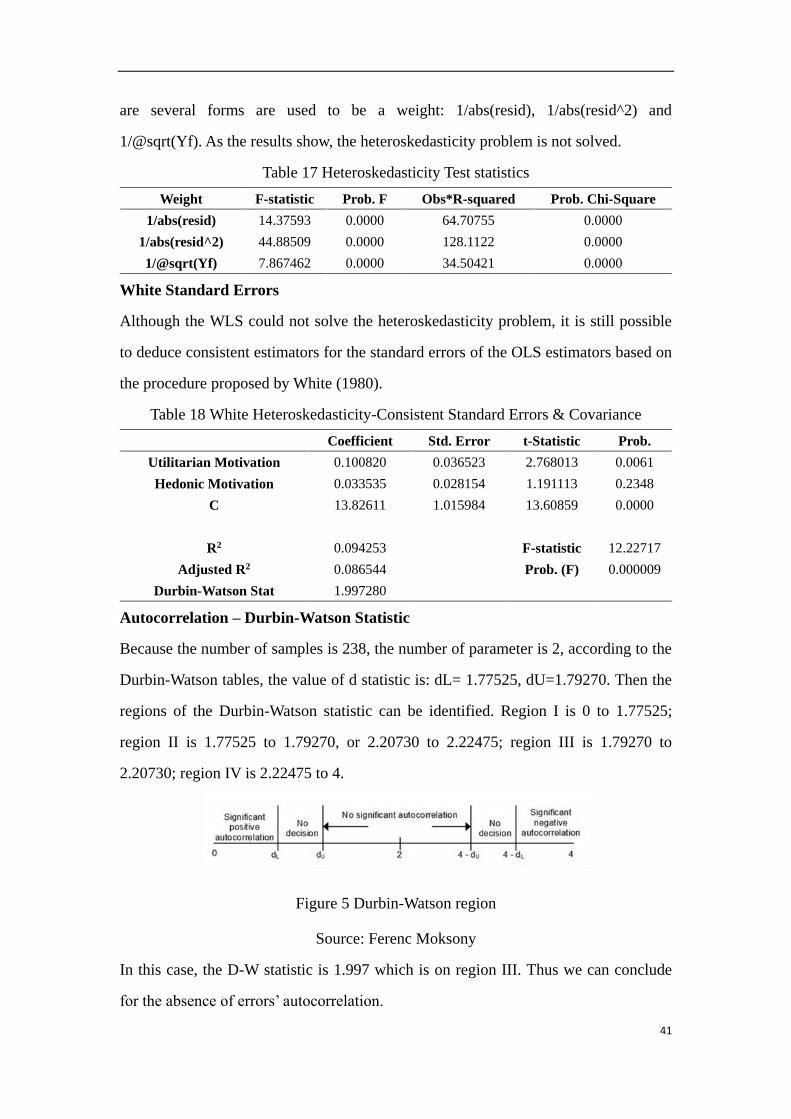
41
are several forms are used to be a weight: 1/abs(resid), 1/abs(resid^2) and
1/@sqrt(Yf). As the results show, the heteroskedasticity problem is not solved.
Table 17 Heteroskedasticity Test statistics
Weight F-statistic Prob. F Obs*R-squared Prob. Chi-Square
1/abs(resid) 14.37593 0.0000 64.70755 0.0000
1/abs(resid^2) 44.88509 0.0000 128.1122 0.0000
1/@sqrt(Yf) 7.867462 0.0000 34.50421 0.0000
White Standard Errors
Although the WLS could not solve the heteroskedasticity problem, it is still possible
to deduce consistent estimators for the standard errors of the OLS estimators based on
the procedure proposed by White (1980).
Table 18 White Heteroskedasticity-Consistent Standard Errors & Covariance
Coefficient Std. Error t-Statistic Prob.
Utilitarian Motivation 0.100820 0.036523 2.768013 0.0061
Hedonic Motivation 0.033535 0.028154 1.191113 0.2348
C 13.82611 1.015984 13.60859 0.0000
R2 0.094253 F-statistic 12.22717
Adjusted R2 0.086544 Prob. (F) 0.000009
Durbin-Watson Stat 1.997280
Autocorrelation – Durbin-Watson Statistic
Because the number of samples is 238, the number of parameter is 2, according to the
Durbin-Watson tables, the value of d statistic is: dL= 1.77525, dU=1.79270. Then the
regions of the Durbin-Watson statistic can be identified. Region I is 0 to 1.77525;
region II is 1.77525 to 1.79270, or 2.20730 to 2.22475; region III is 1.79270 to
2.20730; region IV is 2.22475 to 4.
Figure 5 Durbin-Watson region
Source: Ferenc Moksony
In this case, the D-W statistic is 1.997 which is on region III. Thus we can conclude
for the absence of errors’ autocorrelation.
42
Model Interpretation
Because there is heteroskedastity problem exist in this model, and it could not be
solved by using WLS method, in order to deduce consistent estimators for the
standard errors of the OLS estimators, White Standard Errors is used. The model
interpretation will based on the result of White Heteroskedasticity-Consistent standard
errors & covariance.
In this model, the value of R square is 0.094253, adjusted R square is 0.086544, the
standard error of the estimate is 2.316385, which means two explanatory variables
could explain or eliminate 9.4% of the variance of Search Intention. The remainder
90.6% represents the part of the Search Intention’s variance that cannot be explained
by the model.
The value of F-test is 12.227 and the significance is 0.000 which is lower than 0.05, it
means there is at least one of the regression coefficients is not equal to 0, in other
word, there is at least one of the explanatory variables is statistically significant in
accordance to the 5% significant level.
According to the T-test, the regression coefficient of Utilitarian Motivation
(t=2.768013, p=0.0061) is statistically significant, while the regression coefficient of
Hedonic Motivation (t=1.191113, p=0.2348) is not statistically significant. The
unstandardized coefficients of Utilitarian Motivation is 0.100820. Therefore, the
unstandardized estimated equation is given by:
SI = 13.826 + 0.101(UM) (4.6)
In terms of the estimates meaning:
a. 13.826: it is the expected value for the Search Intention if the Utilitarian
Motivation is 0.
b. 0.101: it is the expected variation on Search Intention per unit change on E
Utilitarian Motivation if all the rest remains constant.
According to the result of SPSS, the standardized coefficients could be interpret as:
a. 0.254: for the variation of one standard deviation in the Hedonic Motivation, and
assuming everything else constant, it is expected a variation of 0.254 standard
deviations on Search Intention.
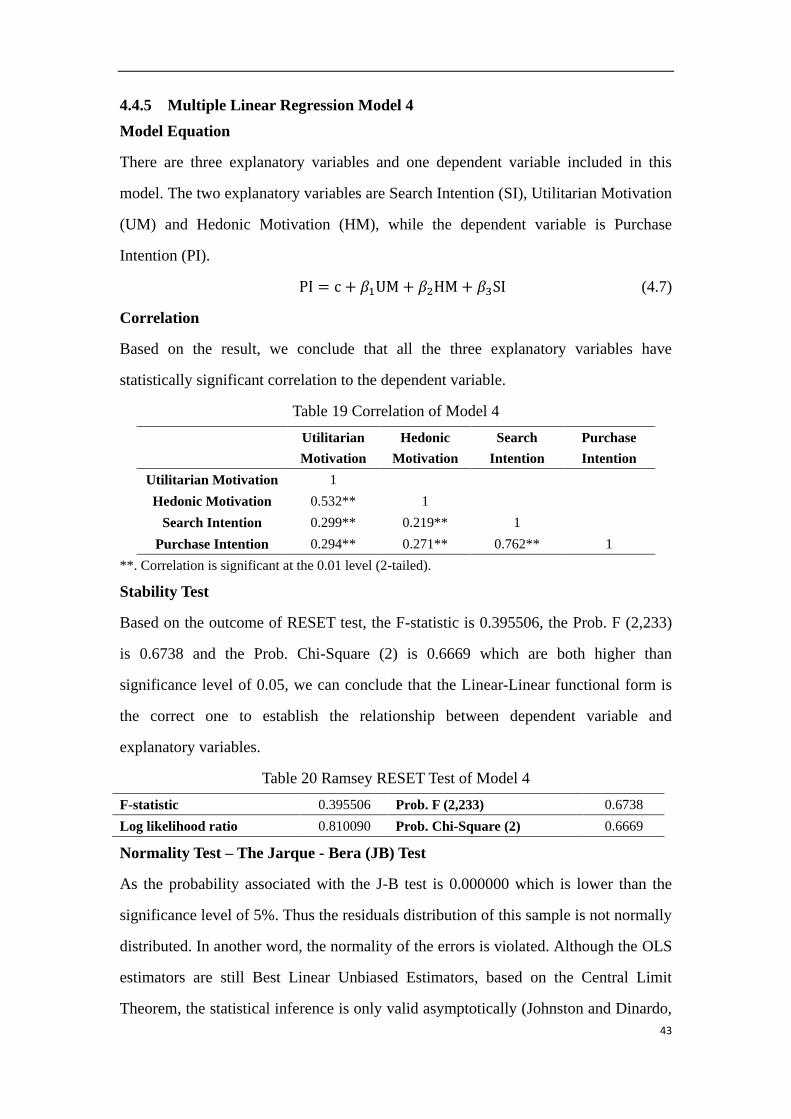
43
4.4.5 Multiple Linear Regression Model 4
Model Equation
There are three explanatory variables and one dependent variable included in this
model. The two explanatory variables are Search Intention (SI), Utilitarian Motivation
(UM) and Hedonic Motivation (HM), while the dependent variable is Purchase
Intention (PI).
PI = c + 𝛽1UM + 𝛽2HM + 𝛽3SI (4.7)
Correlation
Based on the result, we conclude that all the three explanatory variables have
statistically significant correlation to the dependent variable.
Table 19 Correlation of Model 4 Utilitarian
Motivation
Hedonic
Motivation
Search
Intention
Purchase
Intention
Utilitarian Motivation 1
Hedonic Motivation 0.532** 1
Search Intention 0.299** 0.219** 1
Purchase Intention 0.294** 0.271** 0.762** 1
**. Correlation is significant at the 0.01 level (2-tailed).
Stability Test
Based on the outcome of RESET test, the F-statistic is 0.395506, the Prob. F (2,233)
is 0.6738 and the Prob. Chi-Square (2) is 0.6669 which are both higher than
significance level of 0.05, we can conclude that the Linear-Linear functional form is
the correct one to establish the relationship between dependent variable and
explanatory variables.
Table 20 Ramsey RESET Test of Model 4
F-statistic 0.395506 Prob. F (2,233) 0.6738
Log likelihood ratio 0.810090 Prob. Chi-Square (2) 0.6669
Normality Test – The Jarque - Bera (JB) Test
As the probability associated with the J-B test is 0.000000 which is lower than the
significance level of 5%. Thus the residuals distribution of this sample is not normally
distributed. In another word, the normality of the errors is violated. Although the OLS
estimators are still Best Linear Unbiased Estimators, based on the Central Limit
Theorem, the statistical inference is only valid asymptotically (Johnston and Dinardo,
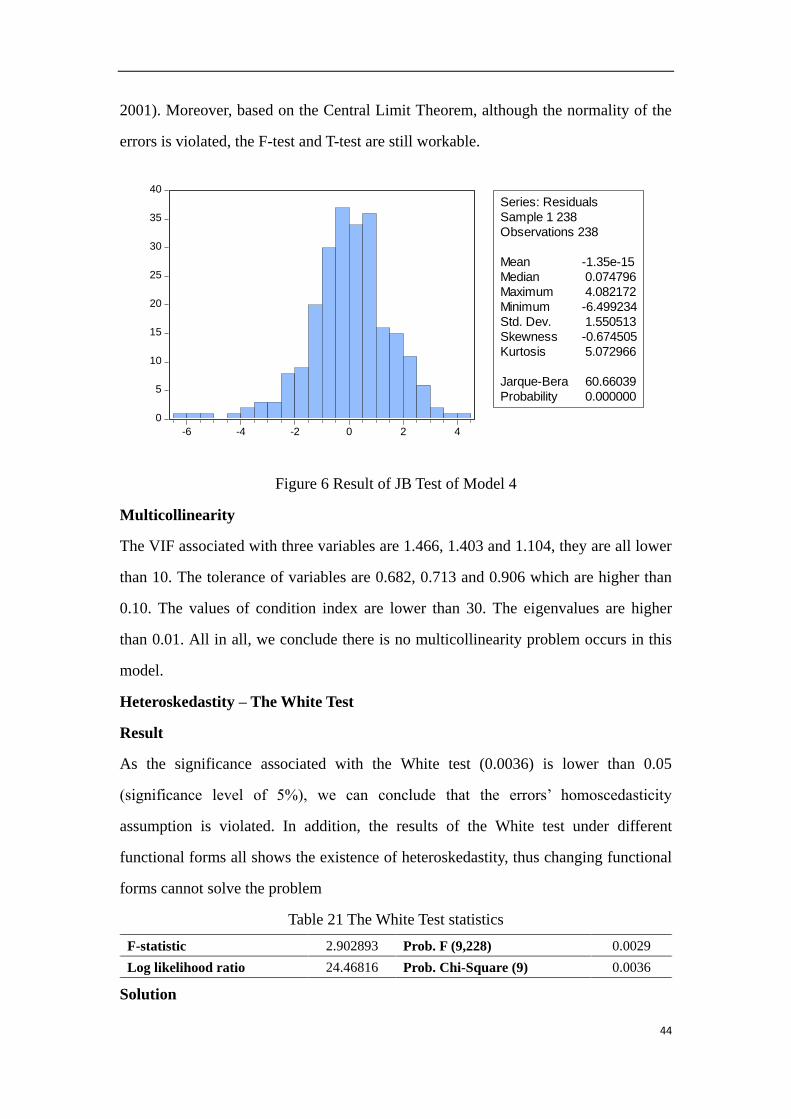
44
2001). Moreover, based on the Central Limit Theorem, although the normality of the
errors is violated, the F-test and T-test are still workable.
Figure 6 Result of JB Test of Model 4
Multicollinearity
The VIF associated with three variables are 1.466, 1.403 and 1.104, they are all lower
than 10. The tolerance of variables are 0.682, 0.713 and 0.906 which are higher than
0.10. The values of condition index are lower than 30. The eigenvalues are higher
than 0.01. All in all, we conclude there is no multicollinearity problem occurs in this
model.
Heteroskedastity – The White Test
Result
As the significance associated with the White test (0.0036) is lower than 0.05
(significance level of 5%), we can conclude that the errors’ homoscedasticity
assumption is violated. In addition, the results of the White test under different
functional forms all shows the existence of heteroskedastity, thus changing functional
forms cannot solve the problem
Table 21 The White Test statistics
F-statistic 2.902893 Prob. F (9,228) 0.0029
Log likelihood ratio 24.46816 Prob. Chi-Square (9) 0.0036
Solution
0
5
10
15
20
25
30
35
40
-6 -4 -2 0 2 4
Series: Residuals
Sample 1 238
Observations 238
Mean -1.35e-15
Median 0.074796
Maximum 4.082172
Minimum -6.499234
Std. Dev. 1.550513
Skewness -0.674505
Kurtosis 5.072966
Jarque-Bera 60.66039
Probability 0.000000
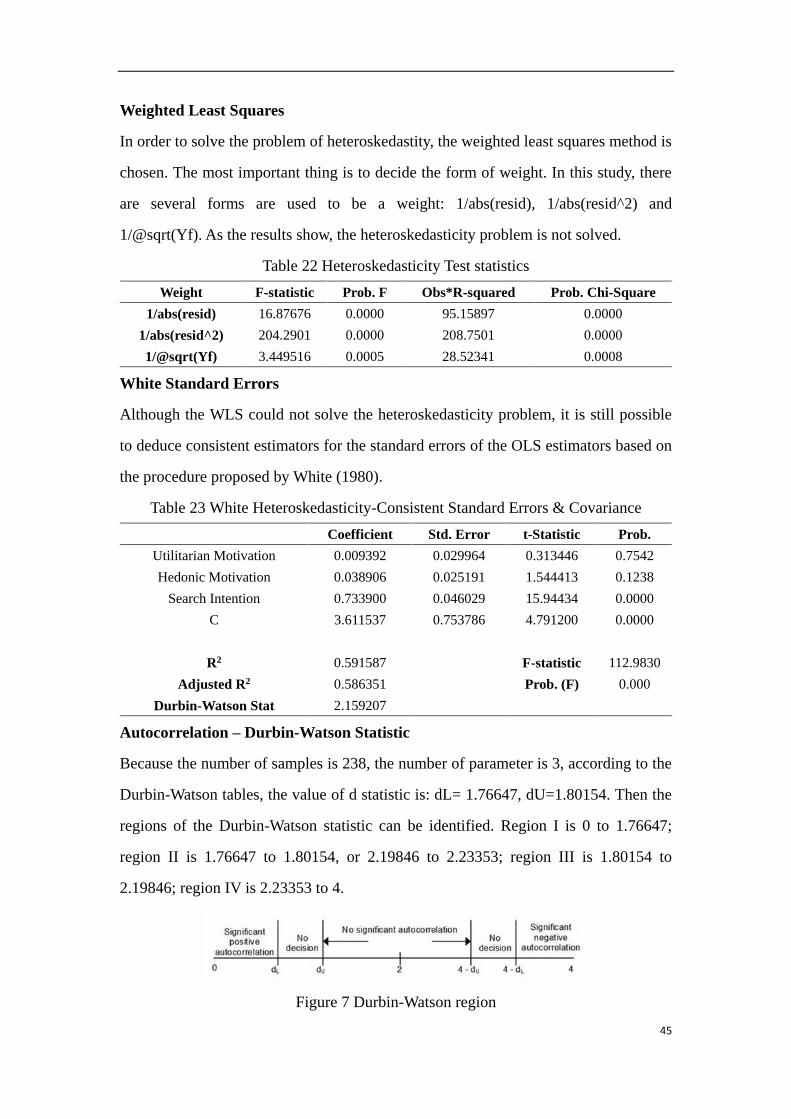
45
Weighted Least Squares
In order to solve the problem of heteroskedastity, the weighted least squares method is
chosen. The most important thing is to decide the form of weight. In this study, there
are several forms are used to be a weight: 1/abs(resid), 1/abs(resid^2) and
1/@sqrt(Yf). As the results show, the heteroskedasticity problem is not solved.
Table 22 Heteroskedasticity Test statistics
Weight F-statistic Prob. F Obs*R-squared Prob. Chi-Square
1/abs(resid) 16.87676 0.0000 95.15897 0.0000
1/abs(resid^2) 204.2901 0.0000 208.7501 0.0000
1/@sqrt(Yf) 3.449516 0.0005 28.52341 0.0008
White Standard Errors
Although the WLS could not solve the heteroskedasticity problem, it is still possible
to deduce consistent estimators for the standard errors of the OLS estimators based on
the procedure proposed by White (1980).
Table 23 White Heteroskedasticity-Consistent Standard Errors & Covariance
Coefficient Std. Error t-Statistic Prob.
Utilitarian Motivation 0.009392 0.029964 0.313446 0.7542
Hedonic Motivation 0.038906 0.025191 1.544413 0.1238
Search Intention 0.733900 0.046029 15.94434 0.0000
C 3.611537 0.753786 4.791200 0.0000
R2 0.591587 F-statistic 112.9830
Adjusted R2 0.586351 Prob. (F) 0.000
Durbin-Watson Stat 2.159207
Autocorrelation – Durbin-Watson Statistic
Because the number of samples is 238, the number of parameter is 3, according to the
Durbin-Watson tables, the value of d statistic is: dL= 1.76647, dU=1.80154. Then the
regions of the Durbin-Watson statistic can be identified. Region I is 0 to 1.76647;
region II is 1.76647 to 1.80154, or 2.19846 to 2.23353; region III is 1.80154 to
2.19846; region IV is 2.23353 to 4.
Figure 7 Durbin-Watson region
46
Source: Ferenc Moksony
In this case, the D-W statistic is 2.159 which is on region III. Thus we can conclude
for the absence of errors’ autocorrelation.
Model Interpretation
Because there is heteroskedastity problem exist in this model, and it could not be
solved by using WLS method, in order to deduce consistent estimators for the
standard errors of the OLS estimators, White Standard Errors is used. The model
interpretation will based on the result of White Heteroskedasticity-Consistent standard
errors & covariance.
In this model, the value of R square is 0.591587, adjusted R square is 0.586351, the
standard error of the estimate is 1.560420, which means two explanatory variables
could explain or eliminate 59.2% of the variance of Search Intention. The remainder
40.8% represents the part of the Search Intention’s variance that cannot be explained
by the model.
The value of F-test is 112.9830 and the significance is 0.000 which is lower than 0.05,
it means there is at least one of the regression coefficients is not equal to 0, in other
word, there is at least one of the explanatory variables is statistically significant in
accordance to the 5% significant level.
According to the T-test, the regression coefficient of Utilitarian Motivation
(t=0.313446, p=0.7542) is not statistically significant, while the regression coefficient
of Hedonic Motivation (t=1.544413, p=0.1238) is not statistically significant too. The
regression coefficient of Search Intention (t=15.94434, p=0.000) is statistically
significant. The unstandardized coefficient of Search Intention is 0.753786. Therefore,
the unstandardized estimated equation is given by:
PI = 3.612 + 0.754(SI) (4.8)
In terms of the estimates meaning:
a. 3.612: it is the expected value for the Purchase Intention if the Search Intention is
0.
b. 0.754: it is the expected variation on Purchase Intention per unit change on Search
Intention if all the rest remains constant.
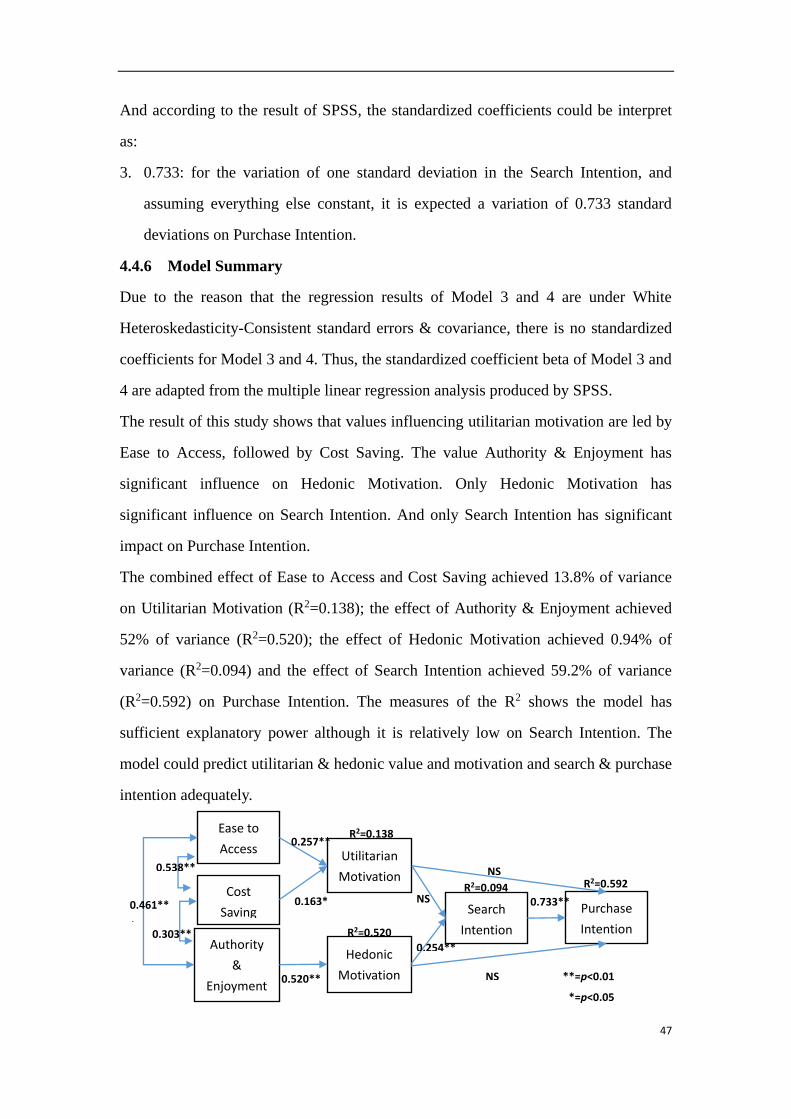
47
And according to the result of SPSS, the standardized coefficients could be interpret
as:
3. 0.733: for the variation of one standard deviation in the Search Intention, and
assuming everything else constant, it is expected a variation of 0.733 standard
deviations on Purchase Intention.
4.4.6 Model Summary
Due to the reason that the regression results of Model 3 and 4 are under White
Heteroskedasticity-Consistent standard errors & covariance, there is no standardized
coefficients for Model 3 and 4. Thus, the standardized coefficient beta of Model 3 and
4 are adapted from the multiple linear regression analysis produced by SPSS.
The result of this study shows that values influencing utilitarian motivation are led by
Ease to Access, followed by Cost Saving. The value Authority & Enjoyment has
significant influence on Hedonic Motivation. Only Hedonic Motivation has
significant influence on Search Intention. And only Search Intention has significant
impact on Purchase Intention.
The combined effect of Ease to Access and Cost Saving achieved 13.8% of variance
on Utilitarian Motivation (R2=0.138); the effect of Authority & Enjoyment achieved
52% of variance (R2=0.520); the effect of Hedonic Motivation achieved 0.94% of
variance (R2=0.094) and the effect of Search Intention achieved 59.2% of variance
(R2=0.592) on Purchase Intention. The measures of the R2 shows the model has
sufficient explanatory power although it is relatively low on Search Intention. The
model could predict utilitarian & hedonic value and motivation and search & purchase
intention adequately.
R2=0.138
R2=0.520
R2=0.094 R2=0.592
**=p<0.01
*=p<0.05
Cost
Saving
Utilitarian
Motivation
Authority
&
Enjoyment
Hedonic
Motivation
Search
Intention
Purchase
Intention
Ease to
Access
0.538**
0.461**
* 0.303**
0.257**
0.163*
0.520**
0.254**
NS
NS
NS 0.733**

48
Figure 8 Relationships supported by empirical study
49
5 Conclusion
5.1 Discussion and Conclusion
There are many researches study shopping motivation on the base of utilitarian and
hedonic motivation proposed by Hirschman and Holbrook (1982). In the online
shopping context, utilitarian and hedonic motivation were applied and analyzed to
search intention and purchase intention To et al. (2007) in Taiwan. Moreover, Suki et
al. (2001) applied motivation and concern factors for online shopping about
Malaysian consumers. Ceren (2012) also studied online shopping with utilitarian and
hedonic motivation, along with other concern factors based on Turkey consumers
which was similar to Suki et al. (2001)’s study.
This study referenced the research hypothesis and questionnaire proposed by To et al.
(2007) in order to explore utilitarian and hedonic motivation factors for online
book-shopping search intention and purchase intention. Unfortunately, many items of
Utilitarian & Hedonic Scale were dropped during exploratory factor analysis for the
reasons of poor or mixed loadings, and new factors named based on the items
remained. Mainly the remained items were related to several factors originally in To
et al. (2007)’s research, they were Cost Saving, Convenience, Selection, Information
Availability, Adventure/explore and Authority and Status. There were four factors
identified through exploratory factor analysis, they are Ease of Access, Cost Saving,
Authority & Enjoyment and Idea. Idea was removed when applying multiple linear
regression analysis due to multicollinearity, therefore only three new factors left in
study model. Because three new factors were composed by items from different
factors identified by To et al. (2007), they might have primary attribute along with
other secondary attributes. Ease of Access’s main attribute is Convenience, along with
Selection and Information Availability. Cost Saving is mainly consisted by items from
Cost Saving, but also by one item of Convenience. For Authority & Enjoyment, it is
consisted half by Authority & Status and another half by Adventure/explore.
Therefore, the sub-hypothesis of Hypothesis 1 and 2 have to be changed. The new
sub-hypothesis are stated below.
50
H1a. Cost saving has a significant positive impact on utilitarian motivation of online
book shopping.
H1b. Ease to Access has a significant positive impact on utilitarian motivation of
online book shopping.
H2a. Authority & Enjoyment has a significant positive impact on hedonic motivation
of online book shopping.
There are two reasons to explain the different outcome of factor analysis comparing to
To et al. (2007)’s research. First is the feature of exploratory factor analysis.
Exploratory factor analysis is a methodology to explore common factors from a
questionnaire based on samples’ data, thus it may extract common factors which are
different from original research because the data is collect from different group of
people, with different background. Therefore, it is possible to extract different
common factors under different samples. The second reason is the questionnaire was
used to study online book shopping motivation which is much specific object to evoke
subjects’ targeted experience they obtained before.
The Hypothesis 1, Hypothesis 2, Hypothesis 1a, 1b and Hypothesis 2a are not rejected
based on the results of this study. Regarding Cost Saving, it has significant positive
influence on utilitarian motivation of online book shopping. This result supports the
conclusion achieved by To et al. (2007) which is that Cost saving have significant
positive impact on utilitarian motivation in the context of online shopping. The
secondary attribute of Cost Saving identified in this study is time saving based on the
expression of the specific item, which relates to Convenience in To et al. (2007)’s
research. In their study, Convenience was a utilitarian value has significant influence
on utilitarian motivation too. However, according to Rohm and Swaminathan (2004),
time savings was not a reason why people shop online because scale items to measure
this construct was removed from the exploratory factor analysis. They though the
reason why time saving dropped was that the notion of time savings was covered by
overall shopping convenience construct. In this study, the attribute of time saving was
subsumed in Cost Saving probably because customers considered time is a cost of
their resources spent for buying books online.

51
For the construct of Ease of Access, the main attribute is convenience and the result
supports To et al. (2007)’s research. Moreover, Rohm and Swaminathan (2004) also
identified convenience as an important factor regarding online shopping. Convenience
also identified as a main dimension in Liudmila and Jurgita (2009)’s research. For
lesser attributes, Information availability and Selection have influence on utilitarian
motivation as a part of Ease of Access. In To et al. (2007)’s research, they identified
Information availability as an influencing value to utilitarian motivation as well as
Selection. Liudmila and Jurgita (2009) identified product variety and information
depth as effective motivational dimensions to online shopping. In addition, variety
seeking was found to be significant motivational factor to online shopping from Rohm
and Swaminathan (2004)’s research.
Regarding values affecting hedonic motivation, values Social and Sense dropped
during exploratory factor analysis because of low or mixed loadings. Items of Social
could not be extracted as a common factor, the reason might be that people does not
concern too much about if their books are damaged because online book stores are
improving to deal with this problem, or some of the people does not care about this
problem, so they may not need to know about this kind of information through
interacting with other buyers online. In addition, it spends time to read a book in order
to achieve overall impression of the content. There are many websites provide
communities which is attractive for readers to share their opinion and book review.
People may prefer to share on a community website instead of online book stores.
One item of Sense contribute to the new factor named Idea. Idea was not a significant
value to hedonic motivation based on the result of multiple linear regression analysis
which was similar to To et al (2007)’s conclusion. However, due to multicollinearity
problem, new factor Idea was removed.
Authority & Enjoyment is the only impact value to hedonic motivation of online book
shopping. There are two main attributes of this construct, authority and adventure. In
To et al. (2007)’s research, Authority & Status and Adventure/explore were two
values had significant influence on hedonic motivation. Several researches also
indicated that control/authority was an influencing factor to online shopping

52
(Vijayasarathy, 2004; Shang et al., 2005). However, in Rohm and Swaminathan
(2004)’s research, the factor of recreation and enjoyment dropped during factor
analysis, in their opinion, the reason might be that people use Internet to shop for
more functional reasons. The reason why Adventure could be an influencing factor to
hedonic motivation might be that the recommendation mechanism provided by online
book stores increases novelty gained by browsing on book stores’ websites. The
options recommended by the recommendation mechanism are selected based on the
statistics of consumers’ searching and purchasing record, therefore those options are
the books that consumers interested in, which increases the possibility for consumers
to discover their favorite books, consequently increases positive sense of adventure.
Meanwhile, the design of websites are easy to use and online book stores try their best
to improve use experience of their websites. So consumers will easily control their
behavior on the website without constraint.
In terms of the impact of motivation to search intention, the outcome of this study is
in accordance with Ceren (2012)’s research, but not accordance with that of
Jamiszewski (1998) and To et al. (2007). Both studies of Jamiszewski (1998) and To
et al. (2007) conclude that customers search through Internet drive by both utilitarian
motivation and hedonic motivation. Ceren (2012)’s research shows that customers
only search for hedonic reasons. This study also shows that hedonic value drives
consumers’ search intention while utilitarian value does not, therefore, Hypothesis 3 is
rejected based on the result of this study, while Hypothesis 4 is not rejected that
hedonic motivation has significant positive impact on search intention of online book
shopping. Chinese consumers enjoy the exploration activity and value much on the
searching process about books instead of what is acquired, specifically they value
authority & enjoyment when searching books online. Moreover, the result of
relationship between shopping motivation and search intention in this study also
differs from mane previous researches about online shopping. Several researches
reveal that utilitarian motivation and hedonic motivation both drive search intention
and it is driven mostly by utilitarian motivation (To et al, 2007; Morganosky and
Cude, 2000; Verhoef and Langerak, 2001; Blake et al., 2005).

53
Meanwhile, the result of this research shows that both utilitarian and hedonic
motivation have no significant influence on purchase intention. Therefore, Hypothesis
5 and Hypothesis 6 are rejected. Although many researches show that utilitarian
motivation has more influence on purchase intention than hedonic motivation
(Morganosky and Cude, 2000; Verhoef and Langerak, 2001; Blake et al., 2005; Ceren,
2012), but the result of this study does not in accordance with previous researches.
The reason probably relates to reading habit of Chinese citizen. According to The
Tenth National Reading Survey held by Press and Publication Academy of China
(2013), comparing to the situation of 2011, Chinese citizen’s (aged from 18 to 70)
reading quantity of paper book was slightly increased, the number of paper book
reading per capita was 4.39 copies while it was 4.35 in 2011. The number of e-book
reading increased from 0.93 per capita in 2011 to 1.42 per capita in 2012, the
percentage increased 65.5% which was extraordinarily impressive. Because in China
it is very easy to achieve e-book through internet, readers may try to avoid buying
books by the way of searching e-books through Internet, especially utilitarian-oriented
readers. As a result, utilitarian or hedonic motivation may not influence purchase
intention directly. In addition, the rapid development of smart phone and tablet lead to
the change of reading habit. According to Haiyan Hu and Ruiqing Jian (2011), there
are several new reading patterns appear currently, such as fragmentation reading,
shallow reading and digital reading. Smart phone and tablet are efficient and popular
tool for digital reading in anytime and anywhere, so as fragmentation reading which
may consequently reduce the purchase intention of buying paper books online. One
more thing is that the major group of respondents is bachelor and master students,
they can access to a large number of books through library of their university or their
city. Borrowing books from library is accord with utilitarian’s feature, and the
exhibition of books in library may also fulfill hedonist’s demand. For these many
reasons, utilitarian and hedonic motivation do not have influence on purchase
intention of online book shopping.
The results show that search intention triggers purchase intention which is in
accordance with the researches of Shim et al. (2001), To et al. (2007) and Ceren

54
(2012). Hypothesis 7 is not rejected. Combine with the relationship among hedonic
value, hedonic motivation and search intention, we can conclude that enjoyment
gained from shopping could generate search intention and indirectly generate
purchase intention. This phenomenon is impulsive shopping which is an unplanned
and hasty shopping behavior. Interesting website design, interactive design and
individualized design which considered and integrated different hedonic values may
cause impulsive online shopping behavior.
To summarize, the results reveal that utilitarian value has significant positive impact
on utilitarian motivation of online book shopping and hedonic value has significant
positive impact on hedonic motivation of online book shopping. More specifically,
Ease to Access and Cost Saving both have significant positive impact on utilitarian
motivation while Authority & Enjoyment has positive influence on hedonic
motivation significantly. Only hedonic motivation influences search intention
significantly which utilitarian motivation does not. Both utilitarian motivation and
hedonic motivation have no impact on purchase intention. Search intention is a trigger
to purchase intention, so that consequently hedonic motivation may indirectly cause
an impulsive purchase intention through influencing search intention.
5.2 Limitation
This study focuses on utilitarian and hedonic motivation of online book shopping.
Many researches usually focus on online shopping, this study chooses a more specific
field to study because physical bookstores are facing an ordeal cause by rapid
development of e-commerce and online bookstores, in order to understand better what
drives consumers to buy books through Internet instead of physical bookstores.
Convenience sampling is used to collect research data instead of random sampling,
therefore the representativeness of the sample is not good, and contingency is strong.
The respondents are mainly students of China and heavy Internet users which might
cause a bias in the sample. In addition, e-book purchasing is not considered in this
study, but this reading mode will become increasingly important in the nearly future
which is worth to study. There are many other concern factors could influence online
book shopping behavior but they were not included in this study.
55
5.3 Further Research
This study explores relationship between motivation factors and online book shopping
intention based on utilitarian and hedonic perspectives. Academics could include
more motivation factors or other concern factors to study online book shopping
behavior. To study motivation under different backgrounds such as gender, education
and age is valuable. Analyzing shopping motivation under different book categories is
worth to study. Future researchers could also study e-book market, to explore key
factors which might influence development of e-books.
56
Bibliography
Alba, J., Lynch J., Weitz B., Janiszewski C., Lutz R., Wood S. 1997. Interactive home
shopping: consumer, retailer, and manufacturer incentives to participate in
electronic marketplaces. Journal of Marketing, 61: 38–53.
Andrew, J. Rohm, Vanitha Swaminathan. 2004. A typology of online shoppers based
on shopping motivations. Journal of Business Research, 57: 748-757.
Angeline, G. Clos and Monika, Kukar-Kinney. 2010. Beyond buying: Motivations
behind consumers’ online shopping cart use. Journal of Business Research, 63:
986-992.
Arnold, M.J., Reynolds, K.E. 2003. Hedonic shopping motivations. Journal of
Retailing, 79 (2): 1–20.
Ba, S. and Pavlou, P. A. 2002. Evidence of the effect of trust in electronic markets:
price premiums and buyer behavior. MIS Quarterly, 23(4): 243-268.
Babin, B.J., Darden, W.R. & Griffin, M. (1994). Work and/or fun: measuring hedonic
and utilitarian shopping value. Journal of Consumer Research, 20: 644-656.
Barkhi, R. & Wallace, L. 2007. The impact of personality type on purchasing
decisions in virtual stores. Information Technology and Management, 8 (4),
313-330.
Batra, R., Ahtola, O.T. 1991. Measuring the hedonic and utilitarian sources of
customer attitudes. Marketing Letters, 12 (2): 159–170.
Baumeıster, R. F. & Vohs, K. D. 2007. Self-Regulation, Ego Depletion, and
Motivation, Social and Personality Psychology Compass 1:
10.1111/j.1751-9004.2007.00001.x. Florida State University, University of
Minnesota.
Blake, B.F., Neuendorf, K.A. and Valdiserri, C.M. 2005. Tailoring new websites to
appeal to those most likely to shop online. Technovation, 25: 1205–1214.
Bloch, P.H., Bruce, G.D., 1984. Product involvement as leisure behavior. In: Kinnear,
T.C. (Ed.), Advances in Consumer Research, vol. 11: 197–202.
Bloch, P. H. and Richens, M. L. 1993. Shopping without Purchase: An Investigation
of Consumer Browsing Behavior. in Advances in Consumer Research, ed. R. P.
Bagozzi and A. M. Tybout, Ann Arbor, MI: Association for Consumer
Research, (10): 389-393.
Buttle, F., & Coates, M. 1984. Shopping motives. Services Industries Journal, 4:
71-81.
Bettman, J.R. (1979). An Information Processing Theory of Consumer Choice
Reading. MA Addison-Wesley, Advances in Marketing Series, 402.

57
Broussard, S. C., & Garrison, M. E. B. 2004. The relationship between classroom
motivation and academic achievement in elementary school-aged children.
Family and Consumer Sciences Research Journal, 33(2): 106–120.
Ceren Topalovğlu. 2012. Consumer motivation and concern factors for online
shopping in Turkey. Asian Academy of Management Journal, 17(2): 1-19.
Chang, M. K., Cheung, W., & Lai, V. S. 2005. Literature derived reference models
for the adoption of online shopping. Information & Management, 42 (4):
543-559.
Cheung, C. M. K., Chan, G. W. W., and Limayem, M. 2005. A critical review of
online consumer behavior: Empirical research. Journal of Electronic Commerce
in Organizations, 3(4): 1-19.
Cronbach, L.J. 1970. Essentials of psychological testing (3rd Ed.). New York: Harper
and Row.
Dawson, D., Bloch, P.H., & Ridgway, N.M. 1990. Shopping motives, emotional
states, and retail outcomes. Journal of Retailing, 66: 408-427.
Engel, J. F., Blackwell, R. D., and Miniard, P. W. 1986. Consumer Behavior (5th ed.),
New York: the Dryden Press.
Engel, J. F., R. D. Blackwell & P. W. Miniard. 1990. Consumer Behavior (6th Ed).
New York: the Dryden Press.
Engel, J.F., Blackwell, R.D., Miniard, P.W. 1993. Consumer Behavior (7th ed).
Chicago: the Dryden Press.
Foucault, B.E., & Scheufele, D.A. 2002. Web vs campus store? Why students buy
textbooks online. Journal of Consumer Marketing, 19 (5): 409-423
Fred C. Lunenburg. 2011. Expectancy Theory of Motivation: Motivating by Altering
Expectations. International Journal of Management, Business, and
Administration. 15(1): 1-6.
Forgas, J. P., Wıllıams, K. D. & Laham, S. M. 2005. Social Motivation: Conscious
and Unconscious Processes. UK: Cambridge University Press.
Gefen, D., Karahanna, E., and Straub, D. W. 2003. Trust and TAM in online shopping:
An integrated model. MIS Quarterly, 27(1): 51-90.
Gottfried, A. E. 1990. Academic intrinsic motivation in young elementary school
children. Journal of Educational Psychology, 82(3): 525–538.
Guay, F., Chanal, J., Ratelle, C. F., Marsh, H. W., Larose, S., & Boivin, M. 2010.
Intrinsic, identified, and controlled types of motivation for school subjects in
young elementary school children. British Journal of Educational Psychology,
80(4): 711–735.
Haiyan Hu, Ruiqing Jian. 2011. New trend of reading challenge reading guide of
58
library. New Century Library, 5: 14-17.
Hirschman, E.C., Holbrook, M.B. 1982. Hedonic consumption: emerging concepts,
methods and propositions. Journal of Marketing, 46 (2): 92–101.
Hoffman, D. L. & T. P. Novak. 1996. Marketing in Hypermedia Computer-Mediated
Environments: Conceptual Foundations. Journal of Marketing, 60(Jul.): 50-68.
Howard J.A and Sheth J.N. 1967. Theory of Buyer Behavior. Proceedings, American
Marketing Association.
Janiszewski, C. (1998). The influence of display characteristics on visual exploratory
search behavior. Journal of Consumer Research, 25(3): 290–301.
Jansen, F. P. J. 2006. German Sunday shoppers in Roermond: Shopping motivations
and choice criteria. Unpublished thesis, Marketing Department, Tilburg
University.
Jarvenpaa, S. L., Tractinsky, N., and Vitale, M. 2000. Consumer trust in an internet
store. Information Technology and Management, 1(1/2): 45-71.
J.R. Bettman. 1979. An information Processing Theory of Consumer Choice.
Reading, Mass.: Addison-Wesley.
J. Stávková, L. Stejskal, Z. Toufarová. 2008. Factors influencing consumer behavior.
Agric. Econ. – Czech, 54(6): 276–284.
Kaiser, H. F. 1974. Little Jiffy, Mark IV. Educational and Psychological
Measurement, 34: 111-117.
Keen, C.; Wetzels, M., de Ruyter, K., and Feinberg, R. 2004. E-tailers versus retailers:
Which factors determine consumer preferences. Journal of Business Research,
57(7): 685-694.
Kenneth A. Coney. 2000. Consumer Behavior: Building Marketing Strategy [M].
MC GVAW-Hill.
Kotler, P. 2002. Marketing Management Millenium Edition (10th ed.). Prentice-Hall,
Inc., New Jersey.
Li, N., & Zhang, P. 2002. Consumer online shopping attitudes and behavior: An
assessment of research. Eight Americas Conference on Information Systems,
508–517.
Lian, J. W., & Lin T. M. 2007. Effects of consumer characteristics on their acceptance
of online shopping: Comparisons among different product types. Computers in
Human Behavior, 24(1): 48–65.
Liang, T., and Lai, H. 2000. Electronic store design and consumer choice: an
empirical study. Proceedings of the 33rd Hawaii International Conference on
System Sciences.
59
Liudmila Bagdoniene, Jurgita Zemblyte. 2009. Online shopping motivation factors
and their effect on Lithuanian consumers. Economics & Management, 14:
367-374.
Lunn, J.A. 1974. Consumer Decision Process Models in Models of Buyer Behaviour
(ed N. Sheth Jagdish). Harper and Row, New York: 34-69.
Lynch JG, Ariely D. 2000. Wine online: search costs affect competition on price,
quality, and distribution. Marketing Science, 19(1):83-103.
Maslow, A. H. 1970. Motivation and personality (2nd ed.). New York: Harper &
Row.
McKnight, D. H., Choudhury, V., and Kacmar, C. 2002. Developing and validating
trust measures for e-commerce: An integrative typology. Information Systems
Research, 13(3): 334-359.
M. Fishbein. 1967. Attitude and Prediction of Behavior, in M. Fishbein, ed. Readings
in Attitude Theory and Measurement, New York: John Wiley, 477-492.
Middelton, V.T.C. 1994. Marketing for Travel and Tourism (2nd ed.)
Butterworth-Heinemann, London.
MILLS, Jon. 2004. Clarifications on Trieb: Freud’s Theory of Motivation Reinstated.
Psychoanalytic Psychology, 21(4): 673-677.
Moe, W.W. 2003. Buying, searching or browsing: differentiating between online
shoppers using in-store navigational clickstream. Journal of Consumer
Psychology, 13 (1): 29-39.
Morganosky, M.A., Cude, B.J. 2000. Consumer response to online grocery shopping.
International Journal of Retail and Distribution Management, 28 (1): 17-26.
Nicosia, F.M. Robert, W. 1976. Consumer Behavior toward Sociology of
Consumption. Journal of Consumer Research.
Nigro, F. A., & Nigro L. G. 1973. Modern public administration. New York: Harper
& Row Publishers, Inc.
Nunnally, J. C. 1978. Psychometric theory. New York: McGraw-Hill.
Parsons, A.G., 2002. Non-functional motives for online shoppers: why we click. The
Journal of Consumer Marketing, 19 (5): 380–392.
Pavlou, P. A., and Fygenson, M. 2006. Understanding and predicting electronic
commerce adoption: An extension of the theory of planned Behavior. MIS
Quarterly, 30(1): 115-143.
Press and Publication Academy of China. The tenth national reading survey.
http://cips.chuban.cc/kybm/cbyjs/cgzs/201304/t20130419_140027.html. 18th
April, 2013.
60
Rohm, A.J. and Swaminathan, V. 2004. A typology of online shoppers based on
shopping motivations. Journal of Business Research, 57(7): 748-58.
Saunders, M., Lewis, P., & Thornhill, A. 2003. Research method for business
students (3rd ed.). New York: Prentice Hall.
Schhiffman J.B and Kanuk Lealie Lazar. 1997. Consumer Behavior (6th ed.).
Prentice Hall.
Schlosser, A. E. and Kanfer, A. 1999. Interactivity in Commercial Web Sites:
Implications for Web Site Effectiveness. Working Paper, Vanderbilt University.
Shafritz, J. M., & Ott, J. S. (Eds.). 1996. Classics of organization theory (4th ed.).
New York: Harcourt Brace College Publishers.
Shang, R.A., Chen, Y.C., & Shen, L. (2005). Extrinsic versus intrinsic motivations for
consumers to shop on-line. Information & Management, 42 (3), 401-413.
Sheppard, B. H., Hartwick, J., and Warshaw, P. 1988. The theory of reasoned action:
A meta-analysis of past research with recommendations for modifications and
future research. Journal of Consumer Research, 15(3): 325-343.
Sherry, J.F., 1990. A sociocultural analysis of mid-western flea market. Journal of
Consumer Research, 17 (2): 13–30.
Sheth, J.N.B.I. and Newman B.L Gross, B.L. 1991. Why We Buy What We Buy a
Theory of Consumer Behavior. Journal of Business Research, 22: 159-170.
Shim, S., Eastlick, M.A., Lotz, S.L., Warrington, P. 2001. An online pre-purchase
intentions model: the role of intention to search. Journal of Retailing, 77 (4):
397–416.
Skinner, B.F. 1938. The Behavior of Organisms: An Experimental Analysis. Oxford,
England: Appleton-Century, 457.
Solomon et al. 1996. Consumer behaviour (3rd ed.). Prentice Hall Englewood Cliffs.
Solomon, M., Bamossy, G., Askegaard, S. & Hogg, M. K. 2006. Consumer Behavior:
A European Perspective (3rd ed.). London: Prentice Hall-Financial Times.
Srinivasan, S. S., Anderson, R., and Ponnavolu, K. 2002. Customer loyalty in
ecommerce: An exploration of its antecedents and consequences. Journal of
Retailing, 78(1): 5-5.
Sudhanshu Bhadoriya, S.S.Chauhan. 2013. Acritical analysis on intrinsic & extrinsic
factors of motivation. International Journal of Management & Business
Studies. 3(3): 20-26.
Suki, N. B. M., Ahmad M. I., & Thyagarajan, V. 2002. Motivation and concern
factors for internet shopping: A Malaysian perspective. The Electronic Journal
for Ecommerce Tools and Applications, 1: 1–18.
61
Swaminathan, V., Lepkowska-White, E., & Rao, B. P. 1999. Browsers or buyers in
cyberspace? An investigation of factors influencing electronic exchange.
Journal of Computer Mediated Communication, 5(2): 1–23.
Szymanski, D.M., & T. R. Hise. 2000. E-Satisfaction: a Initial Examination. Journal
of Retailing, 76(3): 309-322.
Tauber, E.M. 1972. Why do people shop? Journal of Marketing, 36 (4): 46–49.
Teo, T. 2001. Demographic and motivation variables associated with Internet usage
activities. Internet Research: Electronic Networking Applications and Policy,
11 (2): 125–137.
To, P., Liao, C., & Lin, T. 2007. Shopping motivations on Internet: a study based on
utilitarian and hedonic value. Technovation, 27: 774-787.
Verhoef, P.C., Langerak, F., 2001. Possible determinants of consumers’ adoption of
electronic grocery shopping in the Netherlands. Journal of Retaining and
Consumer Services, 8: 275–285.
Vijayasarathy, L.R. 2004. Predicting consumer intentions to use on-line shopping: the
case of an augmented technology acceptance model. Information and
Management, 41 (6): 747–762.
Vroom, V. H. 1964. Work and motivation. San Francisco, CA: Jossey-Bass.
V.S. Folkes. 1988. Recent Attribution Research in Consumer Behavior: A Review
and New Directions. Journal of Consumer Research, 14: 548-565.
Westbrook, R.A., Black, W.C. 1985. A motivation-based shopper typology. Journal
of Retailing, 61 (1): 78–103.
Williams, T.G. 1982. Consumer Behavior Fundamental and Strategies [M]. St. Paul
Minninberg: West Publishing Corporation.
Zaltman,G. Pinson, C.A .And Agelman, R. 1973. Methodology and Consumer
Research. Holt Rinehart and Winston, New York.
Electronic Documents
Begbies Traynor Group. "Zombie” retailers feel the bite this winter as Austerity
Britain takes hold.
http://www.begbies-traynorgroup.com/begbies-traynor/news/12-12-24/zombie%
E2%80%9D_retailers_feel_the_bite_this_winter_as_austerity_britain_takes_hol
d.aspx. 24th December, 2012.
China IntelliConsulting Corp. Online shopping consumers report of China in 2012.
http://www.199it.com/archives/37963.html. May, 2012.
CNIC. The 31th Report of the Situation of Internet Development of China.
http://www.cnic.cn/xw/kydt/201301/t20130117_3751850.html. 16th January, 2013.
62
CNNIC. Report of Chinese Customer Behavior of Vertical Online Shopping in 2010.
http://www.cnnic.cn/hlwfzyj/hlwxzbg/dzswbg/201206/t20120612_27444.htm.
16th June, 2011.
Ferenc Moksony. The problem of autocorrelation. Statistical Methods for Program
Evaluation.
http://www.tankonyvtar.hu/en/tartalom/tamop425/0010_2A_04_Moksony_Feren
c_Statistical_Methods_for_Program_Evaluation/ch07s04.html.
iResearch. 2011-2012 China Online Shoppers’ Behavior Report.
http://report.iresearch.cn/1701.html. 17th May, 2012.
Laura Hazard Owen. Barnes & Noble will close up to a third of its stores over the
next decade.
http://gigaom.com/2013/01/28/barnes-noble-will-close-up-to-a-third-of-its-stores
-over-the-next-decade/. 28th January, 2012.
Nielson. How digital influences how we shop around the world.
http://www.nielsenkorea.com/comm/reports/How%20Digital%20Influences%2
0How%20We%20Shop%20Around%20the%20World.pdf. August, 2012.
Richard Meryn. UK retailers are facing closures.
http://www.industryleadersmagazine.com/uk-retailers-are-facing-closures/. 24th
December, 2012.
Shanks, N. H. 2011. Management and Motivation. Chapter 2: 24. Jones and Bartlett
Publishers.
http://www.jblearning.com/samples/076373473X/3473X_CH02_4759.pdf.
Wolfinbarger, Mary and Gilly, Mary. 2000. Consumer Motivations for Online
Shopping. AMCIS 2000 Proceedings. Paper 112.
http://aisel.aisnet.org/amcis2000/112
World Internet Users and Population Stats. Internet Usage Statistics, the Internet Big
Picture. http://www.internetworldstats.com/stats.htm. December, 2013.
Xiaokai Liu. Facing bankrupt, what should physical bookstore do?.
http://news.hexun.com/2011-12-08/136088362.html. December, 2011.
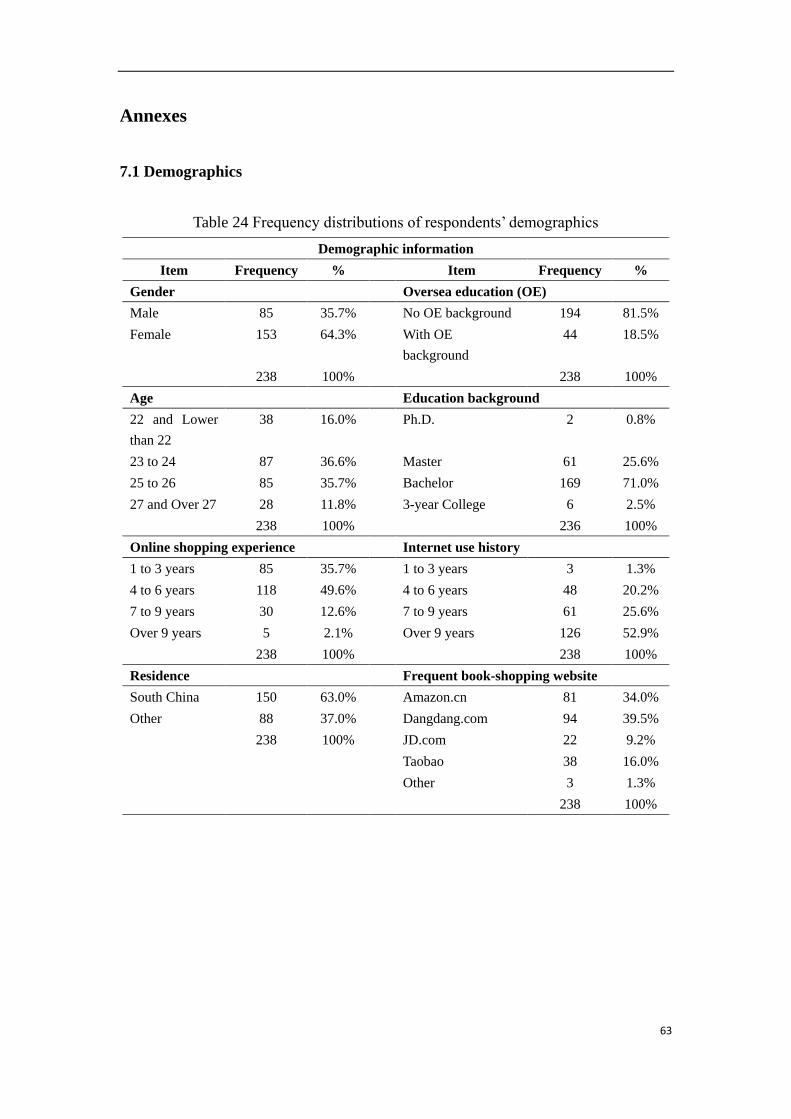
63
Annexes
7.1 Demographics
Table 24 Frequency distributions of respondents’ demographics
Demographic information
Item Frequency % Item Frequency %
Gender Oversea education (OE)
Male 85 35.7% No OE background 194 81.5%
Female 153 64.3% With OE
background
44 18.5%
238 100% 238 100%
Age Education background
22 and Lower
than 22
38 16.0% Ph.D. 2 0.8%
23 to 24 87 36.6% Master 61 25.6%
25 to 26 85 35.7% Bachelor 169 71.0%
27 and Over 27 28 11.8% 3-year College 6 2.5%
238 100% 236 100%
Online shopping experience Internet use history
1 to 3 years 85 35.7% 1 to 3 years 3 1.3%
4 to 6 years 118 49.6% 4 to 6 years 48 20.2%
7 to 9 years 30 12.6% 7 to 9 years 61 25.6%
Over 9 years 5 2.1% Over 9 years 126 52.9%
238 100% 238 100%
Residence Frequent book-shopping website
South China 150 63.0% Amazon.cn 81 34.0%
Other 88 37.0% Dangdang.com 94 39.5%
238 100% JD.com 22 9.2%
Taobao 38 16.0%
Other 3 1.3%
238 100%
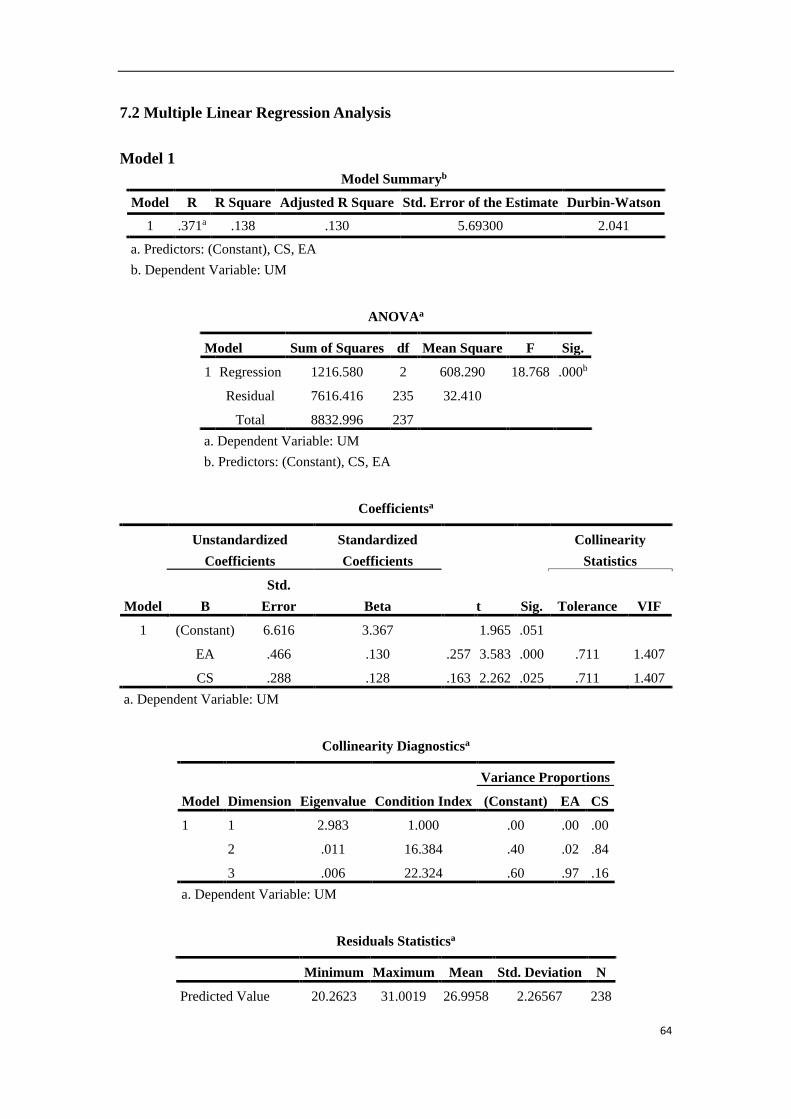
64
7.2 Multiple Linear Regression Analysis
Model 1
Model Summaryb
Model R R Square Adjusted R Square Std. Error of the Estimate Durbin-Watson
1 .371a .138 .130 5.69300 2.041
a. Predictors: (Constant), CS, EA
b. Dependent Variable: UM
ANOVAa
Model Sum of Squares df Mean Square F Sig.
1 Regression 1216.580 2 608.290 18.768 .000b
Residual 7616.416 235 32.410
Total 8832.996 237
a. Dependent Variable: UM
b. Predictors: (Constant), CS, EA
Coefficientsa
Model
Unstandardized
Coefficients
Standardized
Coefficients
t Sig.
Collinearity
Statistics
B
Std.
Error Beta Tolerance VIF
1 (Constant) 6.616 3.367 1.965 .051
EA .466 .130 .257 3.583 .000 .711 1.407
CS .288 .128 .163 2.262 .025 .711 1.407
a. Dependent Variable: UM
Collinearity Diagnosticsa
Model Dimension Eigenvalue Condition Index
Variance Proportions
(Constant) EA CS
1 1 2.983 1.000 .00 .00 .00
2 .011 16.384 .40 .02 .84
3 .006 22.324 .60 .97 .16
a. Dependent Variable: UM
Residuals Statisticsa
Minimum Maximum Mean Std. Deviation N
Predicted Value 20.2623 31.0019 26.9958 2.26567 238
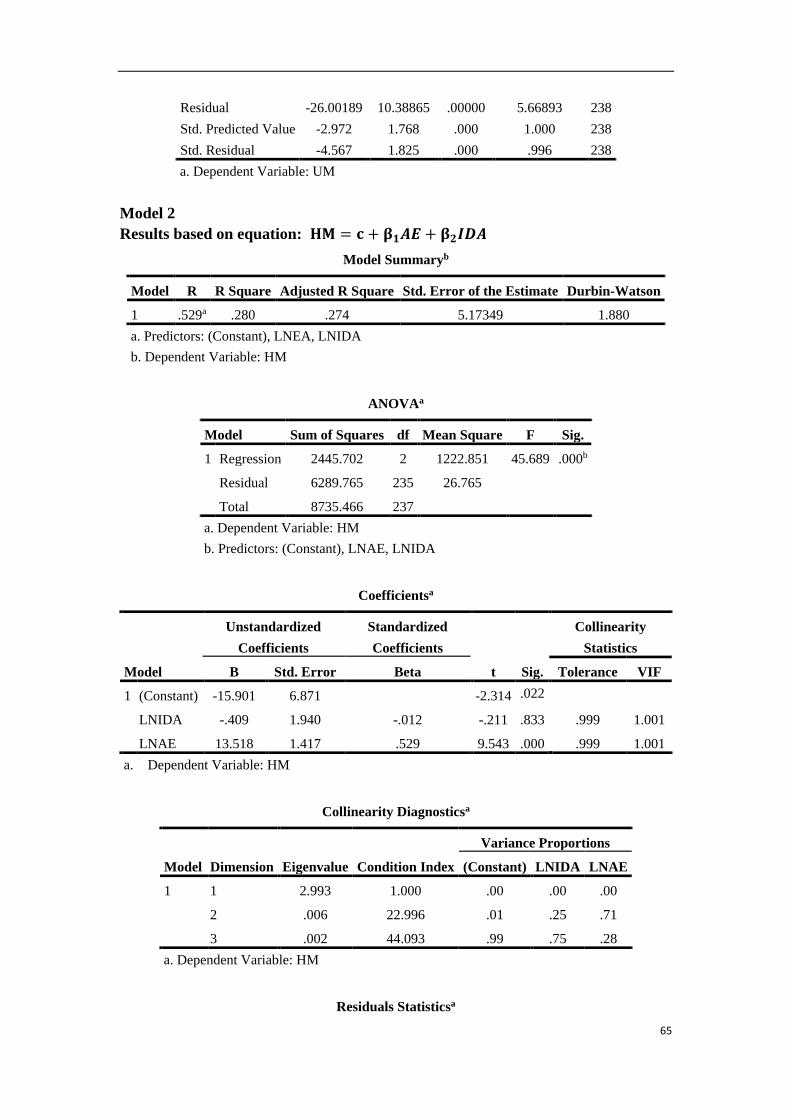
65
Residual -26.00189 10.38865 .00000 5.66893 238
Std. Predicted Value -2.972 1.768 .000 1.000 238
Std. Residual -4.567 1.825 .000 .996 238
a. Dependent Variable: UM
Model 2
Results based on equation: 𝐇𝐌 = 𝐜 + 𝛃𝟏𝑨𝑬 + 𝛃𝟐𝑰𝑫𝑨
Model Summaryb
Model R R Square Adjusted R Square Std. Error of the Estimate Durbin-Watson
1 .529a .280 .274 5.17349 1.880
a. Predictors: (Constant), LNEA, LNIDA
b. Dependent Variable: HM
ANOVAa
Model Sum of Squares df Mean Square F Sig.
1 Regression 2445.702 2 1222.851 45.689 .000b
Residual 6289.765 235 26.765
Total 8735.466 237
a. Dependent Variable: HM
b. Predictors: (Constant), LNAE, LNIDA
Coefficientsa
Model
Unstandardized
Coefficients
Standardized
Coefficients
t Sig.
Collinearity
Statistics
B Std. Error Beta Tolerance VIF
1 (Constant) -15.901 6.871 -2.314 .022
LNIDA -.409 1.940 -.012 -.211 .833 .999 1.001
LNAE 13.518 1.417 .529 9.543 .000 .999 1.001
a. Dependent Variable: HM
Collinearity Diagnosticsa
Model Dimension Eigenvalue Condition Index
Variance Proportions
(Constant) LNIDA LNAE
1 1 2.993 1.000 .00 .00 .00
2 .006 22.996 .01 .25 .71
3 .002 44.093 .99 .75 .28
a. Dependent Variable: HM
Residuals Statisticsa
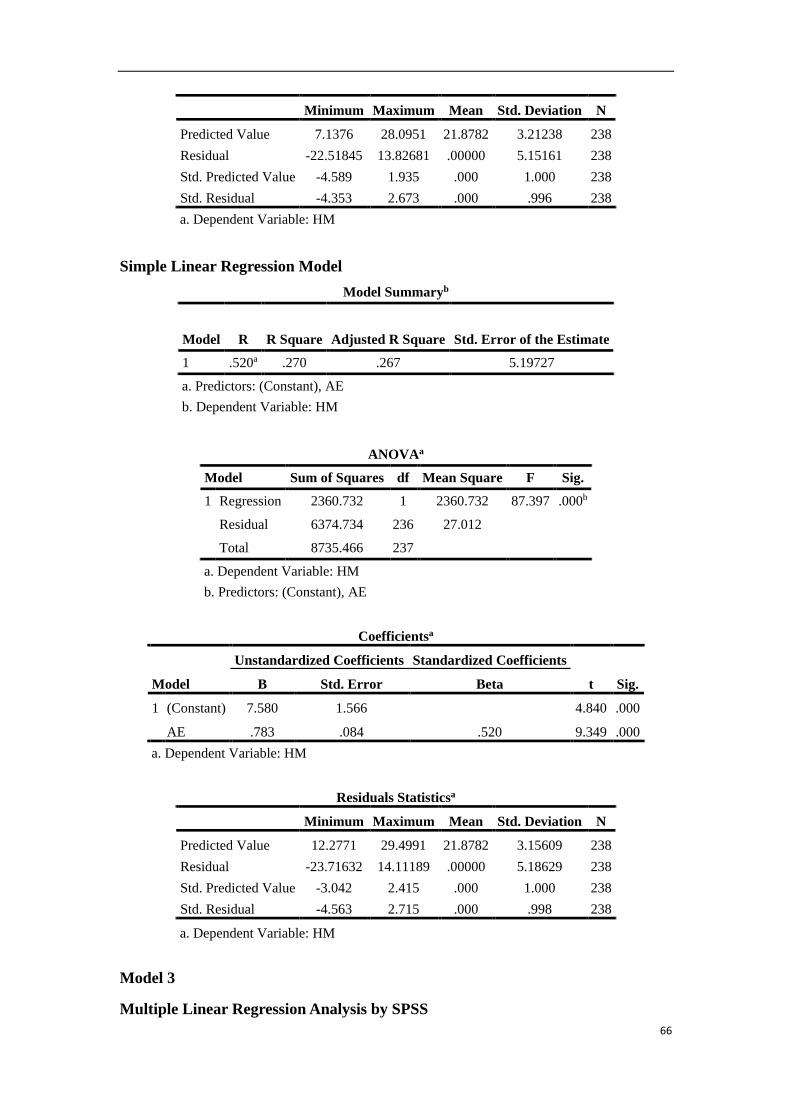
66
Minimum Maximum Mean Std. Deviation N
Predicted Value 7.1376 28.0951 21.8782 3.21238 238
Residual -22.51845 13.82681 .00000 5.15161 238
Std. Predicted Value -4.589 1.935 .000 1.000 238
Std. Residual -4.353 2.673 .000 .996 238
a. Dependent Variable: HM
Simple Linear Regression Model
Model Summaryb
Model R R Square Adjusted R Square Std. Error of the Estimate
1 .520a .270 .267 5.19727
a. Predictors: (Constant), AE
b. Dependent Variable: HM
ANOVAa
Model Sum of Squares df Mean Square F Sig.
1 Regression 2360.732 1 2360.732 87.397 .000b
Residual 6374.734 236 27.012
Total 8735.466 237
a. Dependent Variable: HM
b. Predictors: (Constant), AE
Coefficientsa
Model
Unstandardized Coefficients Standardized Coefficients
t Sig. B Std. Error Beta
1 (Constant) 7.580 1.566 4.840 .000
AE .783 .084 .520 9.349 .000
a. Dependent Variable: HM
Residuals Statisticsa
Minimum Maximum Mean Std. Deviation N
Predicted Value 12.2771 29.4991 21.8782 3.15609 238
Residual -23.71632 14.11189 .00000 5.18629 238
Std. Predicted Value -3.042 2.415 .000 1.000 238
Std. Residual -4.563 2.715 .000 .998 238
a. Dependent Variable: HM
Model 3
Multiple Linear Regression Analysis by SPSS
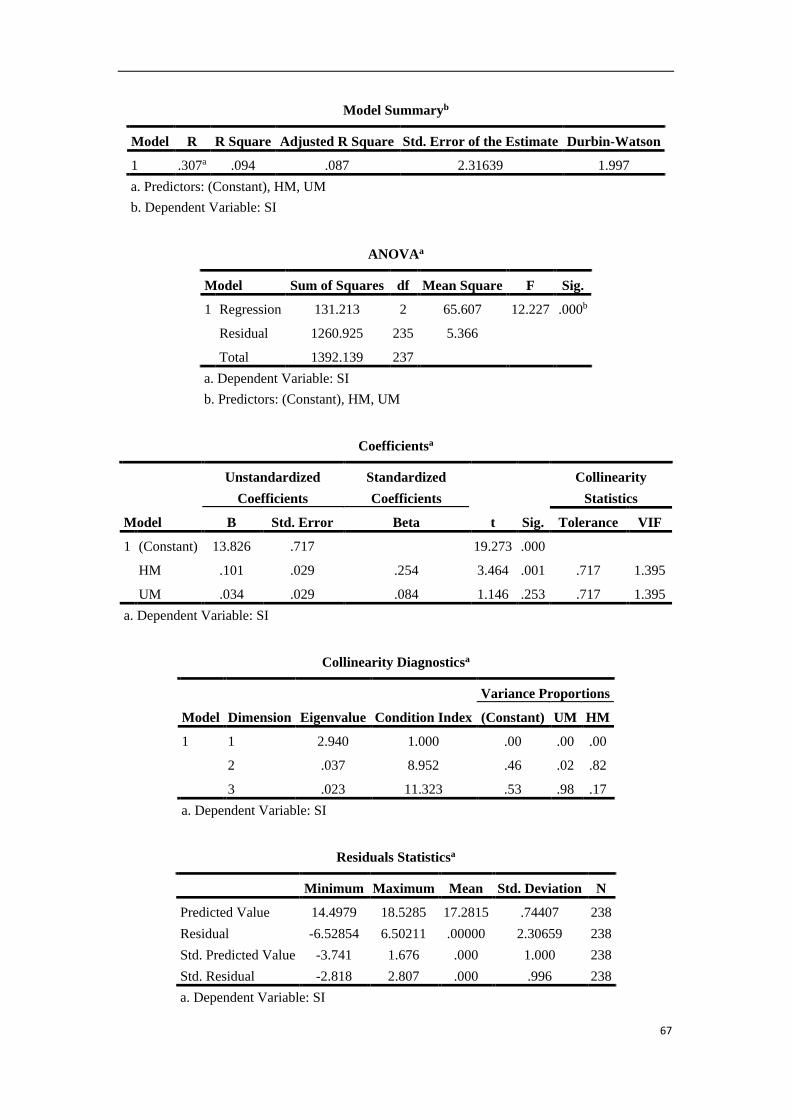
67
Model Summaryb
Model R R Square Adjusted R Square Std. Error of the Estimate Durbin-Watson
1 .307a .094 .087 2.31639 1.997
a. Predictors: (Constant), HM, UM
b. Dependent Variable: SI
ANOVAa
Model Sum of Squares df Mean Square F Sig.
1 Regression 131.213 2 65.607 12.227 .000b
Residual 1260.925 235 5.366
Total 1392.139 237
a. Dependent Variable: SI
b. Predictors: (Constant), HM, UM
Coefficientsa
Model
Unstandardized
Coefficients
Standardized
Coefficients
t Sig.
Collinearity
Statistics
B Std. Error Beta Tolerance VIF
1 (Constant) 13.826 .717 19.273 .000
HM .101 .029 .254 3.464 .001 .717 1.395
UM .034 .029 .084 1.146 .253 .717 1.395
a. Dependent Variable: SI
Collinearity Diagnosticsa
Model Dimension Eigenvalue Condition Index
Variance Proportions
(Constant) UM HM
1 1 2.940 1.000 .00 .00 .00
2 .037 8.952 .46 .02 .82
3 .023 11.323 .53 .98 .17
a. Dependent Variable: SI
Residuals Statisticsa
Minimum Maximum Mean Std. Deviation N
Predicted Value 14.4979 18.5285 17.2815 .74407 238
Residual -6.52854 6.50211 .00000 2.30659 238
Std. Predicted Value -3.741 1.676 .000 1.000 238
Std. Residual -2.818 2.807 .000 .996 238
a. Dependent Variable: SI
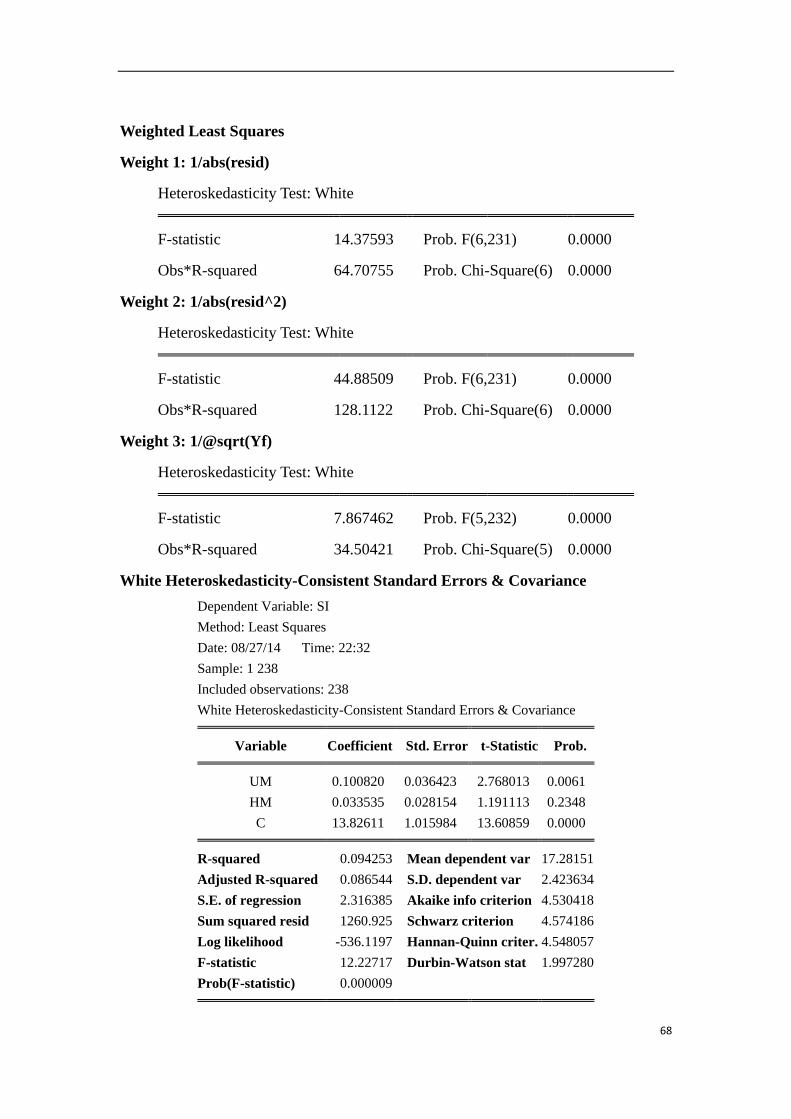
68
Weighted Least Squares
Weight 1: 1/abs(resid)
Heteroskedasticity Test: White
F-statistic 14.37593 Prob. F(6,231) 0.0000
Obs*R-squared 64.70755 Prob. Chi-Square(6) 0.0000
Weight 2: 1/abs(resid^2)
Heteroskedasticity Test: White
F-statistic 44.88509 Prob. F(6,231) 0.0000
Obs*R-squared 128.1122 Prob. Chi-Square(6) 0.0000
Weight 3: 1/@sqrt(Yf)
Heteroskedasticity Test: White
F-statistic 7.867462 Prob. F(5,232) 0.0000
Obs*R-squared 34.50421 Prob. Chi-Square(5) 0.0000
White Heteroskedasticity-Consistent Standard Errors & Covariance
Dependent Variable: SI
Method: Least Squares
Date: 08/27/14 Time: 22:32
Sample: 1 238
Included observations: 238
White Heteroskedasticity-Consistent Standard Errors & Covariance
Variable Coefficient Std. Error t-Statistic Prob.
UM 0.100820 0.036423 2.768013 0.0061
HM 0.033535 0.028154 1.191113 0.2348
C 13.82611 1.015984 13.60859 0.0000
R-squared 0.094253 Mean dependent var 17.28151
Adjusted R-squared 0.086544 S.D. dependent var 2.423634
S.E. of regression 2.316385 Akaike info criterion 4.530418
Sum squared resid 1260.925 Schwarz criterion 4.574186
Log likelihood -536.1197 Hannan-Quinn criter. 4.548057
F-statistic 12.22717 Durbin-Watson stat 1.997280
Prob(F-statistic) 0.000009
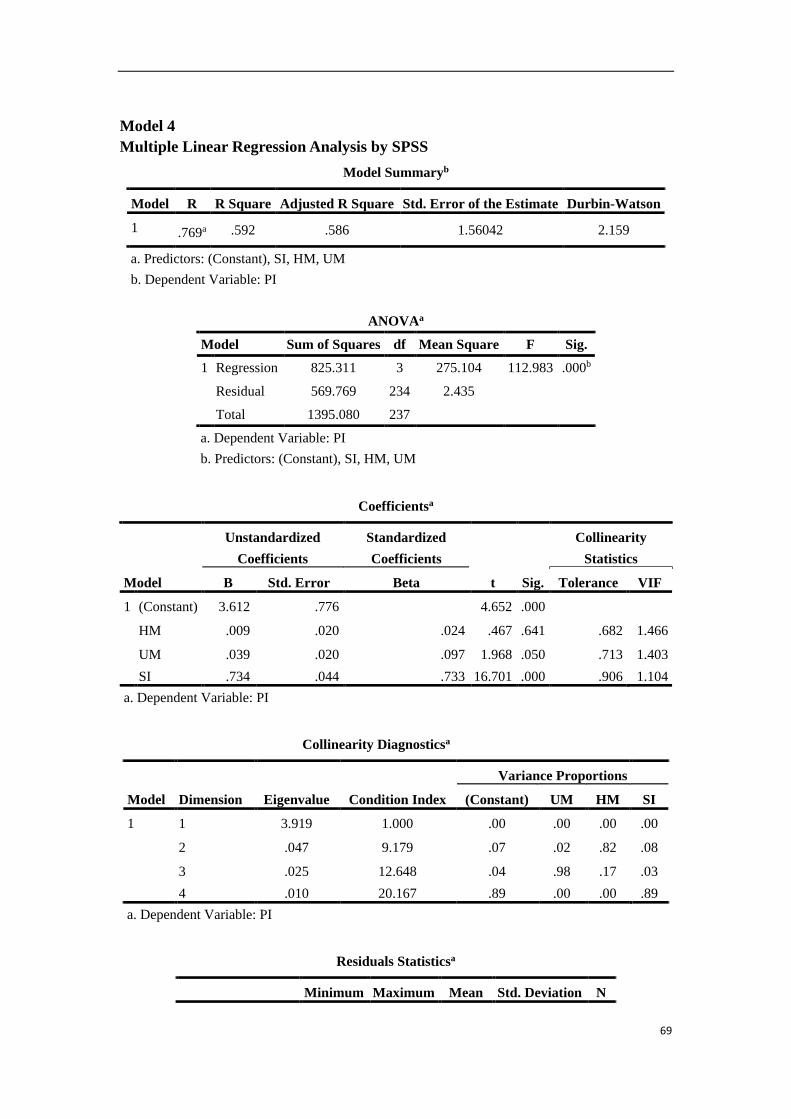
69
Model 4
Multiple Linear Regression Analysis by SPSS
Model Summaryb
Model R R Square Adjusted R Square Std. Error of the Estimate Durbin-Watson
1 .769a .592 .586 1.56042 2.159
a. Predictors: (Constant), SI, HM, UM
b. Dependent Variable: PI
ANOVAa
Model Sum of Squares df Mean Square F Sig.
1 Regression 825.311 3 275.104 112.983 .000b
Residual 569.769 234 2.435
Total 1395.080 237
a. Dependent Variable: PI
b. Predictors: (Constant), SI, HM, UM
Coefficientsa
Model
Unstandardized
Coefficients
Standardized
Coefficients
t Sig.
Collinearity
Statistics
B Std. Error Beta Tolerance VIF
1 (Constant) 3.612 .776 4.652 .000
HM .009 .020 .024 .467 .641 .682 1.466
UM .039 .020 .097 1.968 .050 .713 1.403
SI .734 .044 .733 16.701 .000 .906 1.104
a. Dependent Variable: PI
Collinearity Diagnosticsa
Model Dimension Eigenvalue Condition Index
Variance Proportions
(Constant) UM HM SI
1 1 3.919 1.000 .00 .00 .00 .00
2 .047 9.179 .07 .02 .82 .08
3 .025 12.648 .04 .98 .17 .03
4 .010 20.167 .89 .00 .00 .89
a. Dependent Variable: PI
Residuals Statisticsa
Minimum Maximum Mean Std. Deviation N
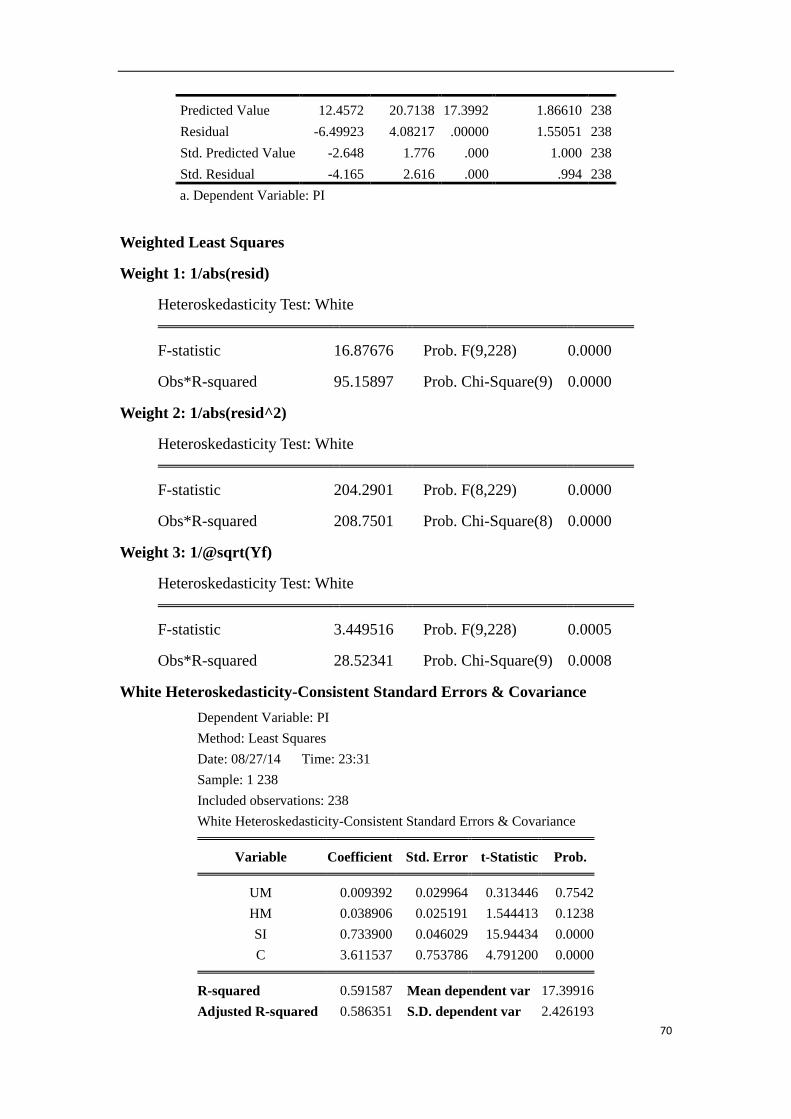
70
Predicted Value 12.4572 20.7138 17.3992 1.86610 238
Residual -6.49923 4.08217 .00000 1.55051 238
Std. Predicted Value -2.648 1.776 .000 1.000 238
Std. Residual -4.165 2.616 .000 .994 238
a. Dependent Variable: PI
Weighted Least Squares
Weight 1: 1/abs(resid)
Heteroskedasticity Test: White
F-statistic 16.87676 Prob. F(9,228) 0.0000
Obs*R-squared 95.15897 Prob. Chi-Square(9) 0.0000
Weight 2: 1/abs(resid^2)
Heteroskedasticity Test: White
F-statistic 204.2901 Prob. F(8,229) 0.0000
Obs*R-squared 208.7501 Prob. Chi-Square(8) 0.0000
Weight 3: 1/@sqrt(Yf)
Heteroskedasticity Test: White
F-statistic 3.449516 Prob. F(9,228) 0.0005
Obs*R-squared 28.52341 Prob. Chi-Square(9) 0.0008
White Heteroskedasticity-Consistent Standard Errors & Covariance
Dependent Variable: PI
Method: Least Squares
Date: 08/27/14 Time: 23:31
Sample: 1 238
Included observations: 238
White Heteroskedasticity-Consistent Standard Errors & Covariance
Variable Coefficient Std. Error t-Statistic Prob.
UM 0.009392 0.029964 0.313446 0.7542
HM 0.038906 0.025191 1.544413 0.1238
SI 0.733900 0.046029 15.94434 0.0000
C 3.611537 0.753786 4.791200 0.0000
R-squared 0.591587 Mean dependent var 17.39916
Adjusted R-squared 0.586351 S.D. dependent var 2.426193
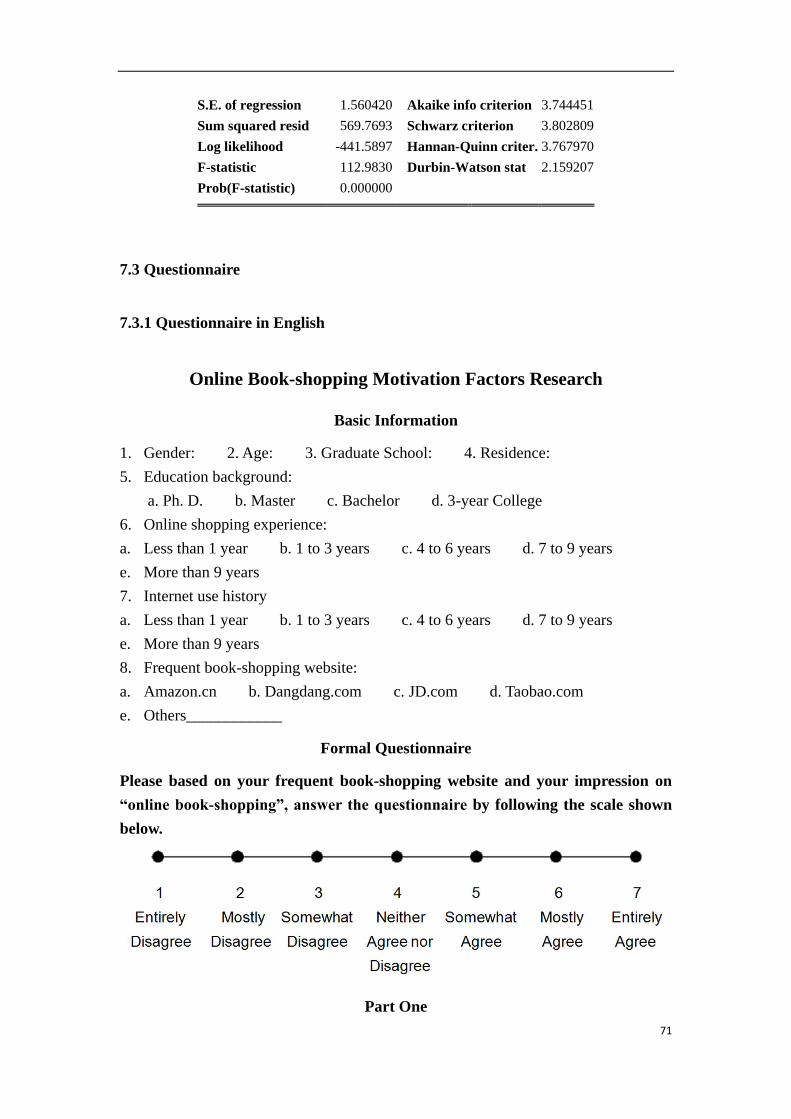
71
S.E. of regression 1.560420 Akaike info criterion 3.744451
Sum squared resid 569.7693 Schwarz criterion 3.802809
Log likelihood -441.5897 Hannan-Quinn criter. 3.767970
F-statistic 112.9830 Durbin-Watson stat 2.159207
Prob(F-statistic) 0.000000
7.3 Questionnaire
7.3.1 Questionnaire in English
Online Book-shopping Motivation Factors Research
Basic Information
1. Gender: 2. Age: 3. Graduate School: 4. Residence:
5. Education background:
a. Ph. D. b. Master c. Bachelor d. 3-year College
6. Online shopping experience:
a. Less than 1 year b. 1 to 3 years c. 4 to 6 years d. 7 to 9 years
e. More than 9 years
7. Internet use history
a. Less than 1 year b. 1 to 3 years c. 4 to 6 years d. 7 to 9 years
e. More than 9 years
8. Frequent book-shopping website:
a. Amazon.cn b. Dangdang.com c. JD.com d. Taobao.com
e. Others____________
Formal Questionnaire
Please based on your frequent book-shopping website and your impression on
“online book-shopping”, answer the questionnaire by following the scale shown
below.
Part One
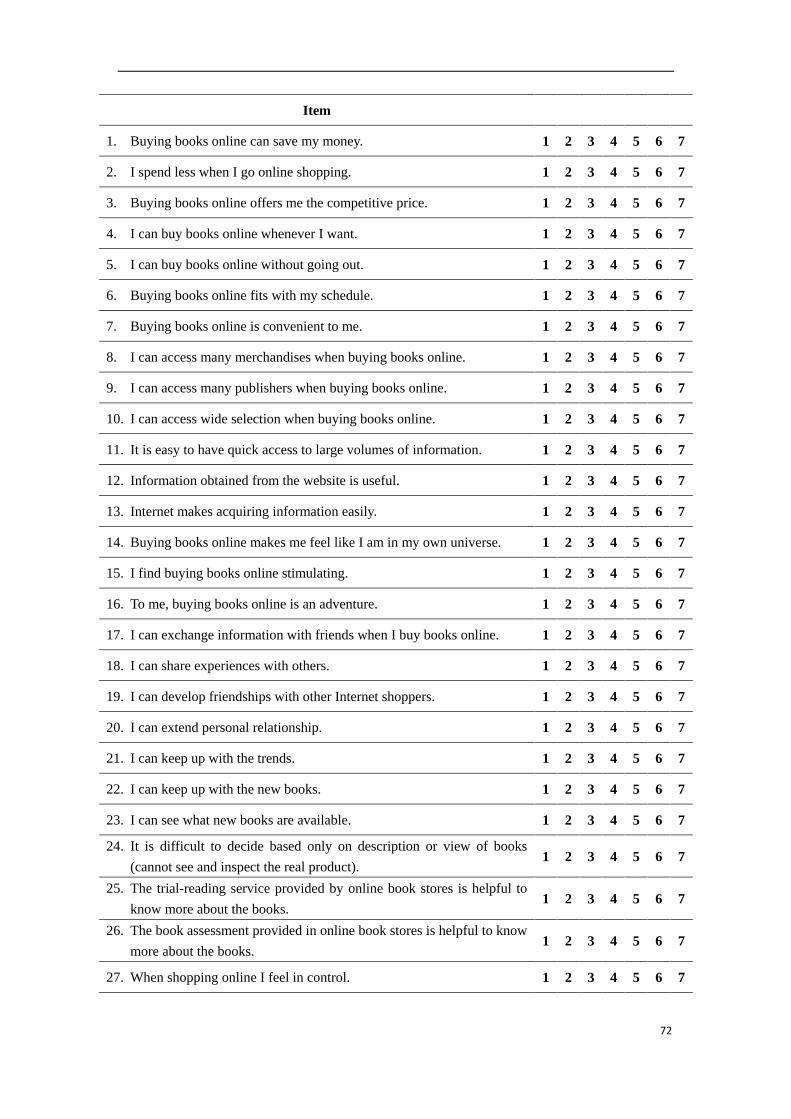
72
Item
1. Buying books online can save my money. 1 2 3 4 5 6 7
2. I spend less when I go online shopping. 1 2 3 4 5 6 7
3. Buying books online offers me the competitive price. 1 2 3 4 5 6 7
4. I can buy books online whenever I want. 1 2 3 4 5 6 7
5. I can buy books online without going out. 1 2 3 4 5 6 7
6. Buying books online fits with my schedule. 1 2 3 4 5 6 7
7. Buying books online is convenient to me. 1 2 3 4 5 6 7
8. I can access many merchandises when buying books online. 1 2 3 4 5 6 7
9. I can access many publishers when buying books online. 1 2 3 4 5 6 7
10. I can access wide selection when buying books online. 1 2 3 4 5 6 7
11. It is easy to have quick access to large volumes of information. 1 2 3 4 5 6 7
12. Information obtained from the website is useful. 1 2 3 4 5 6 7
13. Internet makes acquiring information easily. 1 2 3 4 5 6 7
14. Buying books online makes me feel like I am in my own universe. 1 2 3 4 5 6 7
15. I find buying books online stimulating. 1 2 3 4 5 6 7
16. To me, buying books online is an adventure. 1 2 3 4 5 6 7
17. I can exchange information with friends when I buy books online. 1 2 3 4 5 6 7
18. I can share experiences with others. 1 2 3 4 5 6 7
19. I can develop friendships with other Internet shoppers. 1 2 3 4 5 6 7
20. I can extend personal relationship. 1 2 3 4 5 6 7
21. I can keep up with the trends. 1 2 3 4 5 6 7
22. I can keep up with the new books. 1 2 3 4 5 6 7
23. I can see what new books are available. 1 2 3 4 5 6 7
24. It is difficult to decide based only on description or view of books
(cannot see and inspect the real product). 1 2 3 4 5 6 7
25. The trial-reading service provided by online book stores is helpful to
know more about the books. 1 2 3 4 5 6 7
26. The book assessment provided in online book stores is helpful to know
more about the books. 1 2 3 4 5 6 7
27. When shopping online I feel in control. 1 2 3 4 5 6 7

73
28. During buying books online, I have control over my online shopping
process. 1 2 3 4 5 6 7
29. he Web allows me to control my online shopping trip. 1 2 3 4 5 6 7
Part Two
Ineffective 1 2 3 4 5 6 7 Effective
Unhelpful 1 2 3 4 5 6 7 Helpful
Not functional 1 2 3 4 5 6 7 Functional
Unnecessary 1 2 3 4 5 6 7 Necessary
Impractical 1 2 3 4 5 6 7 Practical
Not fun 1 2 3 4 5 6 7 Fun
Dull 1 2 3 4 5 6 7 Exciting
Not delightful 1 2 3 4 5 6 7 Delightful
Not thrilling 1 2 3 4 5 6 7 Thrilling
Not enjoyable 1 2 3 4 5 6 7 Enjoyable
Part Three
Item
1. It is a wonderful way to search products or service online. 1 2 3 4 5 6 7
2. I would like to search products or services online. 1 2 3 4 5 6 7
3. I will continue searching products or service online in the future. 1 2 3 4 5 6 7
4. It is a wonderful way to shop online. 1 2 3 4 5 6 7
5. I would like to purchase products or service online. 1 2 3 4 5 6 7
6. I will continue shopping online in the future. 1 2 3 4 5 6 7
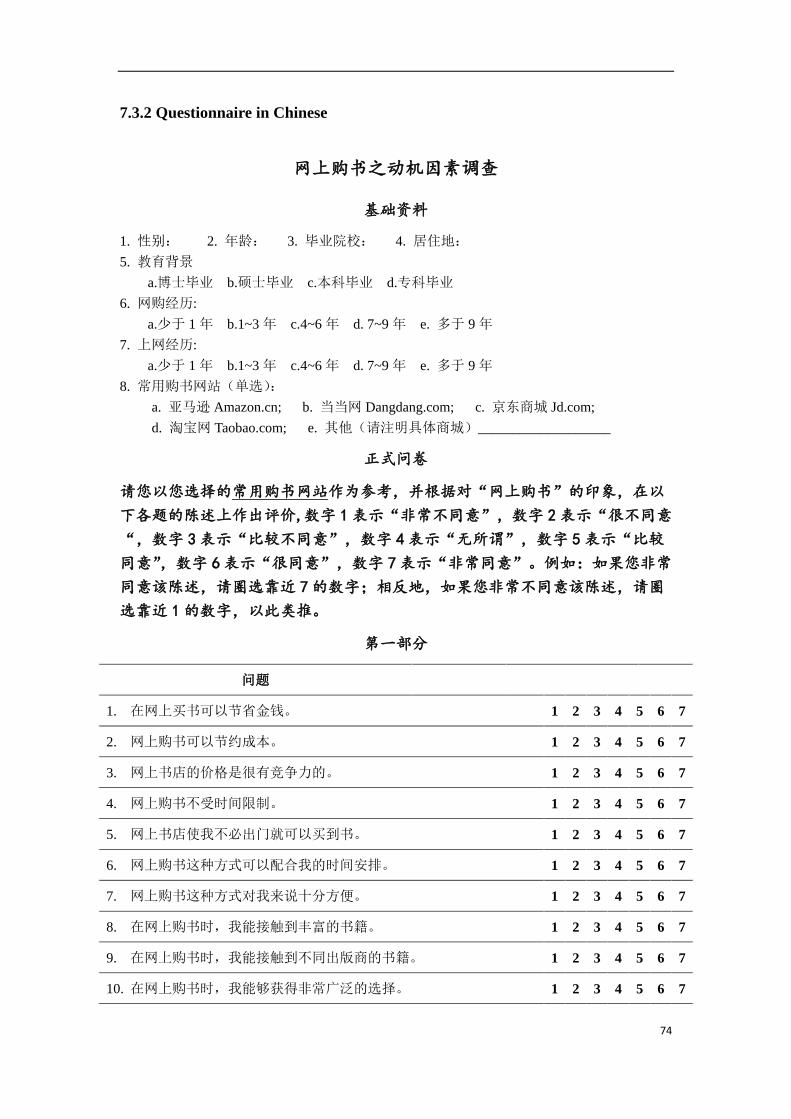
74
7.3.2 Questionnaire in Chinese
网上购书之动机因素调查
基础资料
1. 性别: 2. 年龄: 3. 毕业院校: 4. 居住地:
5. 教育背景
a.博士毕业 b.硕士毕业 c.本科毕业 d.专科毕业
6. 网购经历:
a.少于 1 年 b.1~3 年 c.4~6 年 d. 7~9 年 e. 多于 9 年
7. 上网经历:
a.少于 1 年 b.1~3 年 c.4~6 年 d. 7~9 年 e. 多于 9 年
8. 常用购书网站(单选):
a. 亚马逊 Amazon.cn; b. 当当网 Dangdang.com; c. 京东商城 Jd.com;
d. 淘宝网 Taobao.com; e. 其他(请注明具体商城)___________________
正式问卷
请您以您选择的常用购书网站作为参考,并根据对“网上购书”的印象,在以
下各题的陈述上作出评价,数字 1表示“非常不同意”,数字 2 表示“很不同意
“,数字 3表示“比较不同意”,数字 4 表示“无所谓”,数字 5 表示“比较
同意”,数字 6 表示“很同意”,数字 7 表示“非常同意”。例如:如果您非常
同意该陈述,请圈选靠近 7 的数字;相反地,如果您非常不同意该陈述,请圈
选靠近 1 的数字,以此类推。
第一部分
问题
1. 在网上买书可以节省金钱。 1 2 3 4 5 6 7
2. 网上购书可以节约成本。 1 2 3 4 5 6 7
3. 网上书店的价格是很有竞争力的。 1 2 3 4 5 6 7
4. 网上购书不受时间限制。 1 2 3 4 5 6 7
5. 网上书店使我不必出门就可以买到书。 1 2 3 4 5 6 7
6. 网上购书这种方式可以配合我的时间安排。 1 2 3 4 5 6 7
7. 网上购书这种方式对我来说十分方便。 1 2 3 4 5 6 7
8. 在网上购书时,我能接触到丰富的书籍。 1 2 3 4 5 6 7
9. 在网上购书时,我能接触到不同出版商的书籍。 1 2 3 4 5 6 7
10. 在网上购书时,我能够获得非常广泛的选择。 1 2 3 4 5 6 7
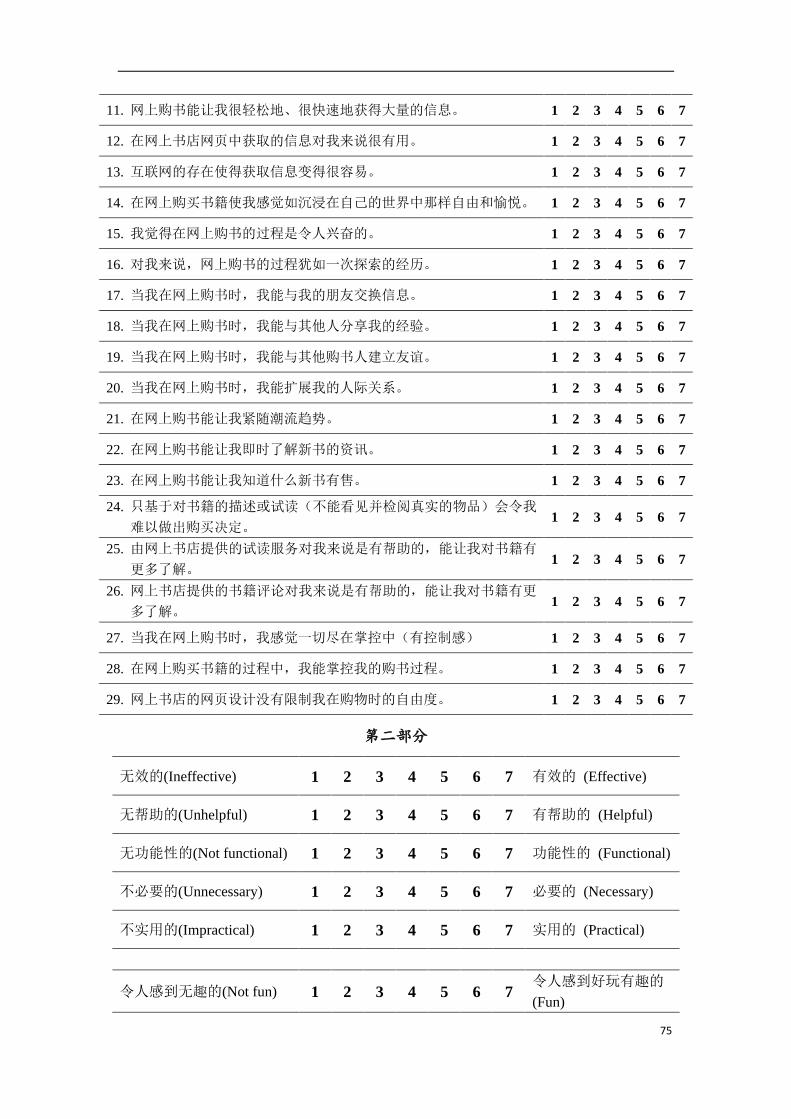
75
11. 网上购书能让我很轻松地、很快速地获得大量的信息。 1 2 3 4 5 6 7
12. 在网上书店网页中获取的信息对我来说很有用。 1 2 3 4 5 6 7
13. 互联网的存在使得获取信息变得很容易。 1 2 3 4 5 6 7
14. 在网上购买书籍使我感觉如沉浸在自己的世界中那样自由和愉悦。 1 2 3 4 5 6 7
15. 我觉得在网上购书的过程是令人兴奋的。 1 2 3 4 5 6 7
16. 对我来说,网上购书的过程犹如一次探索的经历。 1 2 3 4 5 6 7
17. 当我在网上购书时,我能与我的朋友交换信息。 1 2 3 4 5 6 7
18. 当我在网上购书时,我能与其他人分享我的经验。 1 2 3 4 5 6 7
19. 当我在网上购书时,我能与其他购书人建立友谊。 1 2 3 4 5 6 7
20. 当我在网上购书时,我能扩展我的人际关系。 1 2 3 4 5 6 7
21. 在网上购书能让我紧随潮流趋势。 1 2 3 4 5 6 7
22. 在网上购书能让我即时了解新书的资讯。 1 2 3 4 5 6 7
23. 在网上购书能让我知道什么新书有售。 1 2 3 4 5 6 7
24. 只基于对书籍的描述或试读(不能看见并检阅真实的物品)会令我
难以做出购买决定。 1 2 3 4 5 6 7
25. 由网上书店提供的试读服务对我来说是有帮助的,能让我对书籍有
更多了解。 1 2 3 4 5 6 7
26. 网上书店提供的书籍评论对我来说是有帮助的,能让我对书籍有更
多了解。 1 2 3 4 5 6 7
27. 当我在网上购书时,我感觉一切尽在掌控中(有控制感) 1 2 3 4 5 6 7
28. 在网上购买书籍的过程中,我能掌控我的购书过程。 1 2 3 4 5 6 7
29. 网上书店的网页设计没有限制我在购物时的自由度。 1 2 3 4 5 6 7
第二部分
无效的(Ineffective) 1 2 3 4 5 6 7 有效的 (Effective)
无帮助的(Unhelpful) 1 2 3 4 5 6 7 有帮助的 (Helpful)
无功能性的(Not functional) 1 2 3 4 5 6 7 功能性的 (Functional)
不必要的(Unnecessary) 1 2 3 4 5 6 7 必要的 (Necessary)
不实用的(Impractical) 1 2 3 4 5 6 7 实用的 (Practical)
令人感到无趣的(Not fun) 1 2 3 4 5 6 7 令人感到好玩有趣的
(Fun)
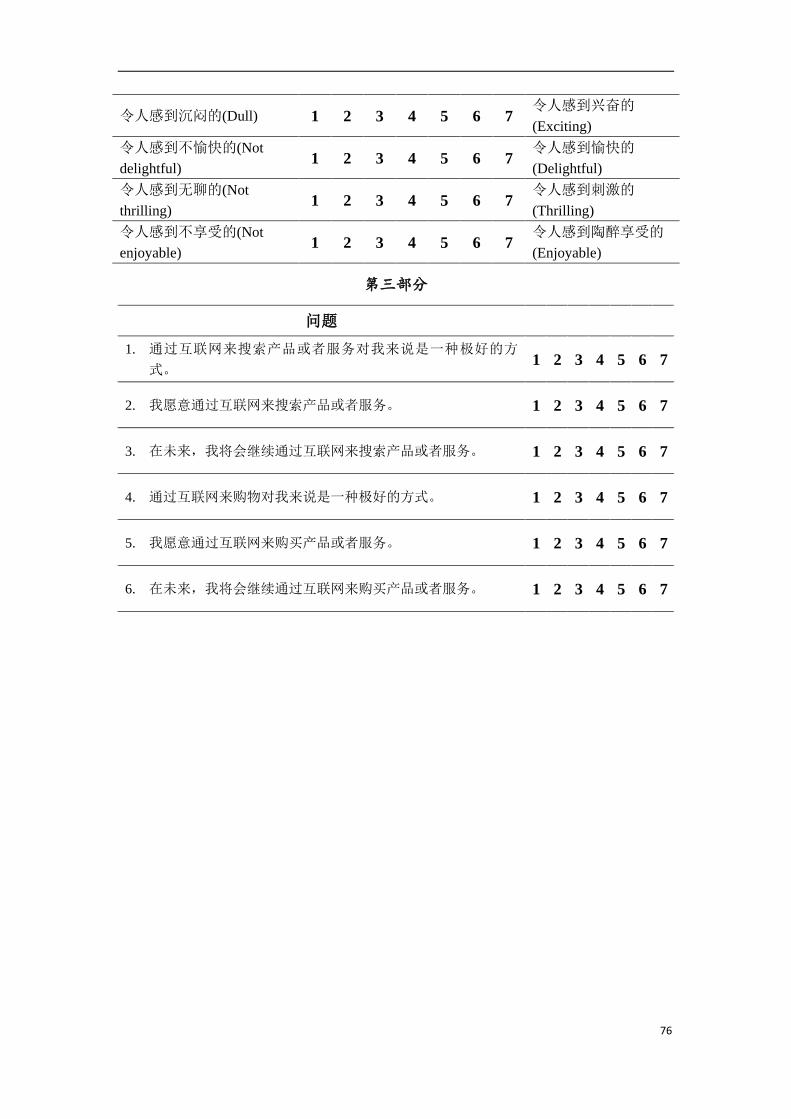
76
令人感到沉闷的(Dull) 1 2 3 4 5 6 7 令人感到兴奋的
(Exciting)
令人感到不愉快的(Not
delightful) 1 2 3 4 5 6 7
令人感到愉快的
(Delightful)
令人感到无聊的(Not
thrilling) 1 2 3 4 5 6 7
令人感到刺激的
(Thrilling)
令人感到不享受的(Not
enjoyable) 1 2 3 4 5 6 7
令人感到陶醉享受的
(Enjoyable)
第三部分
问题
1. 通过互联网来搜索产品或者服务对我来说是一种极好的方
式。 1 2 3 4 5 6 7
2. 我愿意通过互联网来搜索产品或者服务。 1 2 3 4 5 6 7
3. 在未来,我将会继续通过互联网来搜索产品或者服务。 1 2 3 4 5 6 7
4. 通过互联网来购物对我来说是一种极好的方式。 1 2 3 4 5 6 7
5. 我愿意通过互联网来购买产品或者服务。 1 2 3 4 5 6 7
6. 在未来,我将会继续通过互联网来购买产品或者服务。 1 2 3 4 5 6 7