Shopping online and/or in-store? A structural equation model of the relationships between e-shopping...
26
Shopping online and/or in-store? A structural equation model of the relationships between e-shopping and in-store shopping Sendy Farag* Tim Schwanen Martin Dijst * Corresponding author Urban and Regional research centre Utrecht (URU), Faculty of Geographical Sciences Utrecht University, P.O. Box 80.115, 3508 TC Utrecht, The Netherlands Phone: (31) 30 253 2407/1399 Fax: (31) 30 253 2037 E-mail: [email protected] , [email protected] , [email protected] Paper submitted for presentation at the 45th congress of the European Regional Science Association in Amsterdam, 23-27 August 2005 Abstract Searching product information and buying goods online are becoming increasingly popular, which could affect shopping trips. However, little empirical evidence about the relationships between e- shopping and in-store shopping is available. The aim of this study is to investigate how the frequencies of online searching, online buying, and non-daily shopping trips relate to each other, and how they are influenced by several factors like attitudes, behaviour, and land use features. Questionnaire data were collected from 826 respondents residing in four municipalities (one urban, three suburban) in the center of the Netherlands. Structural equation modeling was used to understand the multiple and complex relationships among variables. The results show that searching online positively affects the frequency of shopping trips, which in its turn positively influences buying online. An indirect positive effect of time-pressure on online buying was found and an indirect negative effect of online searching on shopping duration. These findings suggest that e-shopping could be task-oriented (a time-saving strategy) for some, and leisure-oriented for others. Urban residents shop online more often than suburban residents, because they tend to have a faster Internet connection. The more shopping opportunities one can reach within ten minutes by bicyle, the less often one searches online. Keywords: e-shopping, shopping trips, structural equation modeling
Transcript of Shopping online and/or in-store? A structural equation model of the relationships between e-shopping...

Shopping online and/or in-store?
A structural equation model of the relationships between
e-shopping and in-store shopping
Sendy Farag*
Tim Schwanen
Martin Dijst
* Corresponding author
Urban and Regional research centre Utrecht (URU), Faculty of Geographical Sciences
Utrecht University, P.O. Box 80.115, 3508 TC Utrecht, The Netherlands
Phone: (31) 30 253 2407/1399 Fax: (31) 30 253 2037
E-mail: [email protected], [email protected], [email protected]
Paper submitted for presentation at the 45th congress of the European Regional Science Association in
Amsterdam, 23-27 August 2005
Abstract
Searching product information and buying goods online are becoming increasingly popular, which
could affect shopping trips. However, little empirical evidence about the relationships between e-
shopping and in-store shopping is available. The aim of this study is to investigate how the frequencies
of online searching, online buying, and non-daily shopping trips relate to each other, and how they are
influenced by several factors like attitudes, behaviour, and land use features. Questionnaire data were
collected from 826 respondents residing in four municipalities (one urban, three suburban) in the
center of the Netherlands. Structural equation modeling was used to understand the multiple and
complex relationships among variables. The results show that searching online positively affects the
frequency of shopping trips, which in its turn positively influences buying online. An indirect positive
effect of time-pressure on online buying was found and an indirect negative effect of online searching
on shopping duration. These findings suggest that e-shopping could be task-oriented (a time-saving
strategy) for some, and leisure-oriented for others. Urban residents shop online more often than
suburban residents, because they tend to have a faster Internet connection. The more shopping
opportunities one can reach within ten minutes by bicyle, the less often one searches online.
Keywords: e-shopping, shopping trips, structural equation modeling

1
1 Introduction
The Internet has rapidly become an indispensable tool in Western society. Nowadays, many
people use the Internet daily for work or private purposes. Searching for product information
or buying goods online are also becoming increasingly popular activities (TNS Interactive,
2002). The Internet provides easy and quick comparison of many different types of products.
Conceptually, several relationships between e-shopping and in-store shopping can be
distinguished (Mokhtarian, 2004). On the one hand, e-shopping could substitute shopping
trips, while on the other hand it could also generate trips that otherwise would not have been
made. Modification happens when e-shopping alters certain shopping trip characteristics such
as mode or timing, while neutrality is said to occur when e-shopping has no effect on trip
making.
A more hybrid form between e-shopping and in-store shopping is arising. Empirical
research shows that individuals more and more start their shopping process with an
information search on the Internet before they go to the store (Ward and Morganosky, 2002).
Another mixture between e-shopping and in-store shopping could be to search for a product
online, check it in-store, and finally buying it online. Thus, e-shopping could lift the time and
space constraints of the shopping process and enable more flexibility, ultimately, leading to a
fragmentation of the shopping activity in time and space (Couclelis, 2004).
However, little empirical evidence about the relationships between e-shopping and in-
store shopping is available. The few empirical studies that hitherto have been carried out,
either do not distinguish between online shopping and other types of home shopping (e.g.,
buying via catalogue, telephone, or television), or do not separate online buying from online
searching (e.g., Ferrell, 2004; Casas et al., 2001). Also, they are relatively limited because
relevant factors such as Internet behaviour or shopping attitudes are often not taken into
account, and because multivariate analysis techniques are not always applied. Moreover, no
empirical research has yet investigated the effects of online searching on shopping trips. This
is remarkable, since information gathering and evaluation often are important parts of the
shopping process (Mokhtarian, 2004).
The aim of this study is twofold. First, we investigate how the frequencies of online
searching, online buying, and non-daily shopping trips relate to each other, and second, how
these frequencies are influenced by shopping attitudes and behaviour, Internet behaviour,
sociodemographics, land use features, and lifestyle/personality characteristics. To the best of
our knowledge, this has not been done so explicitly before. We have concentrated on non-
2
daily shopping trips, because most products searched for or bought online are non-daily
products, such as books, clothes, and electronic devices (TNS Interactive, 2002).
Because few data are available about the relationship between e-shopping and in-store
shopping, we have collected data using a shopping survey in four municipalities (one urban,
three suburban) in the center of the Netherlands, with different levels of shop availability, as
reflected in the quantity and quality of shops available. Our research population consisted of
Internet users, since having Internet access is a prerequisite for e-shopping. Structural
equation modeling was employed to account for the complexity of the relationships between
e-shopping and in-store shopping. This method of analysis is capable of explaining several
dependent variables simultaneously and enables the relationship between variables to be
decomposed into total, direct, and indirect effects (Jöreskog & Sörbom, 2001).
The following section consists of a literature review together with our hypotheses
concerning the relationships between e-shopping, in-store shopping, and other variables. In
section 3 the research design and methodology are explained. Section 4 contains the results of
our analysis. Finally, a summary of the main findings and a discussion of their implications
are given in section 5.
2 Theoretical framework
As has been mentioned earlier, e-shopping could replace, generate, or modify shopping trips
(Mokhtarian, 2004). Substitution takes places when e-shopping replaces a shopping trip,
generation occurs when e-shopping results in a shopping trip that otherwise would not have
been made, and modification happens when e-shopping changes the mode, timing, or other
characteristics of a shopping trip. These relationships could occur simultaneously, making it
difficult to simply classify them in terms of generation or substitution (Mokhtarian, 2004).
Several empirical studies report mixed findings on the relationships between e-
shopping and in-store shopping. Ferrell (2004, 2005) has analysed activity diaries using
multivariate analysis techniques to investigate the relationship between teleshopping (i.e.,
shopping by Internet, catalogue, or television) and shopping travel. On the person level,
results indicate that teleshoppers make fewer shopping trips and travel shorter distances for
shopping (Ferrell, 2005). Using travel diaries, Casas et al. (2001) show that e-shoppers tend to
make more shopping trips than non-e-shoppers. They defined e-shopping as searching or
buying online. However, no multivariate analysis techniques were used in this study.
Analyzing questionnaire data with OLS regression, Farag et al. (2005b) found that online
buyers tend to make more shopping trips and have a shorter shopping activity duration than

3
non-online buyers. However, they did not take online searching into account, only online
buying.
Other disciplines, including economics and marketing, have also paid attention to the
relationships between e-shopping and in-store shopping. They investigate the information and
purchase decisions of consumers across different shopping channels, also termed ‘multi-
channel shopping’ (e.g., Ward and Morganosky, 2002; BCG, 2001). Information search in
one channel could lead to purchases in another (e.g., online search leading to store purchase).
This is called complementarity. Results of an online questionnaire of nearly 12,000 European
Internet users show that the majority (88%) of Internet users browses the Internet for product
information (BCG, 2001). Three-quarter of the browsers who made a decision online
purchased the product offline (BCG, 2001). Likewise, Ward and Morganosky (2002) found,
using regression analysis, that online searching tends to increase purchases made via in-store
shopping. However, off-line product information gathering tends not to be related to online
purchasing (Ward and Morganosky, 2002; Farag et al., 2005b). Concerning the relationship
between online searching and buying, research has shown that searching online positively
affects buying online (Bellman et al., 1999).
We expect that the frequencies of e-shopping and in-store shopping are related to the
following factors:
• Shopping attitudes: attitudes towards e-shopping and in-store shopping;
• Shopping behaviour: home shopping experience, shopping trip chaining, shopping
duration;
• Internet behaviour: Internet experience in years, frequency of Internet use, Internet
connection type;
• Lifestyle/personality indicators: active lifestyle, adventure-seeking, subjective time-
pressure;
• Land use features: shop accessibility, urbanisation level;
• Sociodemographic characteristics: gender, age, education, income, and so forth.
How these sets of variables empirically relate to shopping is briefly discussed below.
Shopping attitudes: There are several motives for people to shop: acquiring goods,
socializing, learning about new trends, for example (Ng, 2003). Shoppers can be task-oriented
(minimalizing the time spent on shopping) or leisure-oriented (deriving pleasure from the act
of shopping itself) (Ng, 2003). Swinyard and Smith (2003) found that e-shoppers perceive
online shopping to be more entertaining and straightforward than do non-e-shoppers. People

4
who like to see and touch products before buying them make fewer online purchases, while
people who like to save time spent on shopping buy online more frequently (Li et al., 1999).
Persons who associate e-shopping with the risk of time loss because they find in-store
shopping easier and faster are less likely to buy online, just like persons who associate e-
shopping with financial risk because of credit card misuse (Forsythe and Shi, 2003).
Individuals who like to shop in-store tend to make more shopping trips (Farag et al., 2005b).
The relationship between attitudes and behaviour is not straightforward, since attitudes could
affect behaviour, but behaviour could also affect attitudes (e.g., Golob, 2001).
Shopping behaviour: Prior home-shopping experience (shopping via catalogue,
telephone, or television, for example) has a positive effect on online buying (Bellman et al.,
1999; Swinyard and Smith, 2003; Forsythe and Shi, 2003). Ferrell (2004) found that
teleshoppers chain their shopping trips more often than non-teleshoppers, although no such
effect was found in his second study (Ferrell, 2005). He remarks that both teleshopping and
trip chaining could be used as ‘ travel-efficiency tools’ .
Internet behaviour: Internet experience as well as a fast Internet connection have a
positive effect on online buying (Swinyard and Smith, 2003; Farag et al., 2005b).
Lifestyle/personality indicators: Casas et al. (2001) mention that the positive
relationship that they found between online buying and the frequency of shopping trips is
perhaps due to an active 'on-the-go' lifestyle. Similarly, an adventurous inclination could
positively affect in-store shopping. Mokhtarian et al. (2001) show that persons with an
adventurous inclination tend to travel more miles in both short- and long-distance travel for
work/school related purposes and, in the case of short-distance travel, for entertainment.
Other studies have used sociodemographic variables (e.g., the number of small children in a
household) as proxies for time-pressure. 'Time-starved' working female heads of households
tend to teleshop more, but also make more shopping trips and chain their shopping trips more
often (Ferrell, 2005). Perhaps, teleshopping is for them more functional than recreational
(Ferrell, 2005). Bellman et al. (1999) found a positive relationship between total household
working hours and online buying: the more hours people work, the greater is their inclination
to buy online. These authors conclude that time-pressure positively influences the decision to
shop online.
Land use features: Very few studies have addressed the impact of land use and
accessibility characteristics on e-shopping. Farag et al. (2005a) find that people living in
urbanized areas in the Netherlands are more likely to search and buy online than are people in
less urbanized areas. This result is consistent with the innovation diffusion hypothesis which

5
states that the spatial distribution process of new innovations follows a pattern from large to
small settlements (Hägerstrand, 1967). However, a high shop accessibility has also been
shown to have a negative impact on the frequency of online buying (Farag et al., 2005a).
Perhaps, if it does not take much effort to visit stores, e-shopping is less attractive.
With respect to in-store shopping, more trips can be expected to occur in areas with
many activity places (like shops, schools, restaurants) than in areas with few activity places.
This is because someone living in an area with a high level of shop accessibility can travel to
stores more frequently than someone living in an area with poorer accessibility to stores.
Empirical support for a positive relationship between shop accessibility and trip frequency is
available in Meurs and Haaijer (2001), Srinivasan and Bhat (2004), and Van and Senior
(2000). Ferrell (2005) also showed that persons living near retail opportunities make more
shopping trips and chain their shopping trips more often. He also found that people with high
retail accessible homes tend to spend more time shopping both inside and outside the home.
This could mean that what individuals see in-store induces them to shop online or vice versa.
Sociodemographic characteristics: Empirical studies have indicated that men, the
higher educated, and higher-income groups are more likely to buy online than are women, the
less well educated, and lower-income groups (Swinyard and Smith, 2003; Forsythe and Shi,
2003; Li et al., 1999).
Few empirical studies have investigated the frequency of non-daily shopping trips.
Studies focusing on overall shopping trip generation suggest that females, persons on a high
income, older persons, and households with children tend to engage more often in shopping
than males, persons on a low income, younger persons, and households without children
(Srinivasan & Bhat, 2004; Srinivasan & Bhat, 2005; Yun & O’Kelly, 1997). Households with
one car or more tend to make fewer grocery shopping trips than households without a car,
possibly, because they can transport more groceries at a time (Van & Senior, 2000; Srinivasan
& Bhat, 2005).
Concluding, we put forward some hypotheses about the relationships among online
searching, online buying, and shopping trips. Based on previous empirical research, we expect
that searching online positively affects buying online, and that online buying is positively
related to in-store shopping (Bellman et al., 1999; Casas et al., 2001; Farag et al., 2005b).
Products can be quickly compared via the Internet. Therefore, we expect that if persons are
specifically looking for certain products, searching online could save time, because fewer in-
store comparisons of the product would be needed. Hence, online searching could replace
shopping trips that are primarily done out of task-oriented motives. This does not apply for

6
leisure-oriented shopping trips or for impulse purchases. However, for task-oriented shoppers,
gathering and evaluating information at home via Internet could lead to more efficient store
visits. Especially time-pressured persons could shop more often online for this reason.
Concerning the effect of land use features on e-shopping, we assume that urban residents shop
more often online than suburban residents due to the diffusion of innovations as described
earlier. Consistent with empirical findings, a negative relationship between shop accessibility
and e-shopping is expected, but a positive relationship between shop accessibility and
shopping trips (Farag et al., 2005a; Ferrell, 2005).
3 Research design and methodology
3.1 Data employed
To gain more insight into the relationships between e-shopping and in-store shopping, a
shopping questionnaire and a two-day travel diary were designed. We asked respondents to
fill out the travel diary on a Friday and Saturday, since most in-store shopping takes places on
these days (Ministry of Transport, Public Works, and Water Management, 2004). The
shopping questionnaire consisted of questions about daily and non-daily in-store shopping
habits, Internet use, e-shopping habits, attitudes towards e-shopping and in-store shopping,
and sociodemographics. This paper only draws on information obtained in the shopping
questionnaire. Data were collected in November and December 2003. Non-Internet users were
excluded from the study, because the aim was to investigate how e-shopping (which requires
Internet use) relates to in-store shopping. Two-thirds of the Dutch households has an Internet
connection at home (Statistics Netherlands, 2005).
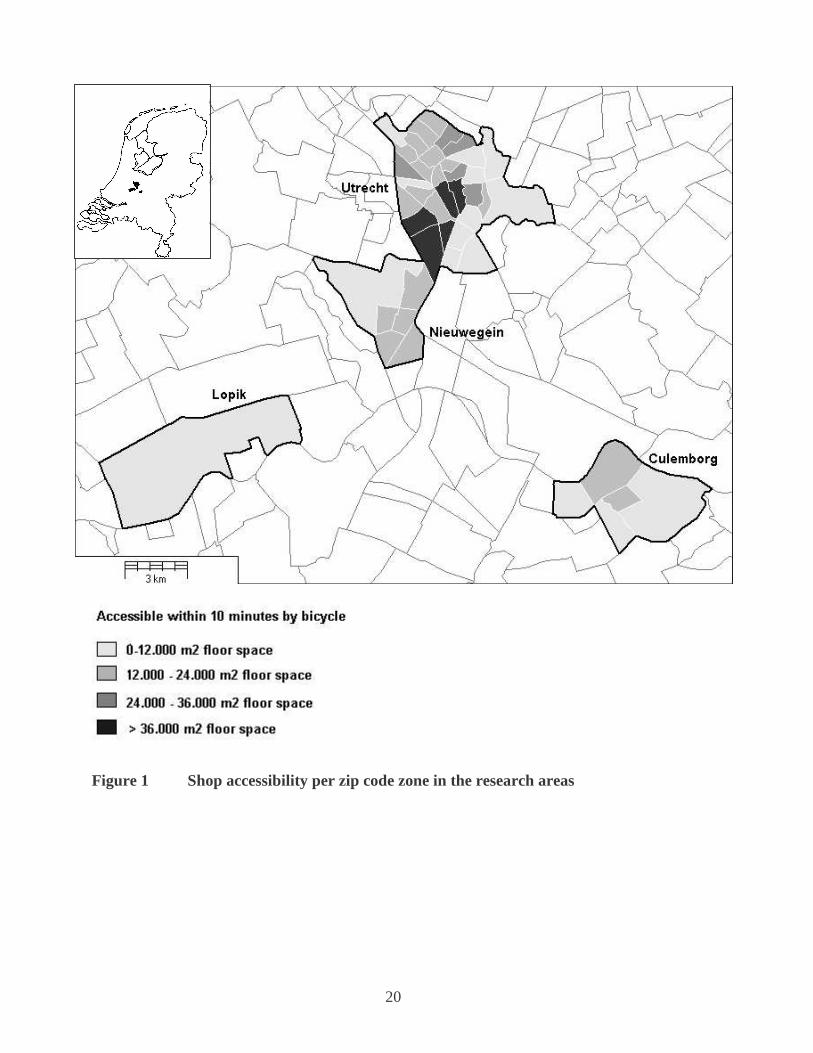
The research area consists of four municipalities located in the center of the
Netherlands that were selected on the basis of their urbanization and shop-availability levels
(Figure 1). Shop availability was measured as the total amount of floor space in square meters
for non-daily goods in a municipality (Locatus, 2003). We selected Utrecht (population 270
243), since it is the core settlement in a strongly urbanized area and its inhabitants have a high
level of shop availability (333 880m2 total floor space, 1417m2 floor space per 1000
inhabitants). Three suburban municipalities in the immediate surroundings of Utrecht
differing in shop availability and distance to Utrecht were also selected. Nieuwegein
(population 61 806) has a relatively low level of shop availability (48 408m2 total floor space,
779m2 floor space per 1000 inhabitants), but is near to Utrecht (7 kilometers). Culemborg
(population 26 613) has a high level of shop availability (61 965m2 total floor space, 2365m2

7
floor space per 1000 inhabitants), but is relatively far from Utrecht (17 kilometers). Finally,
Lopik (population 13 869) has a low level of shop availability (3667m2 total floor space,
481m2 floor space per 1000 inhabitants) and is relatively far from Utrecht (18 kilometers). It
should be remembered that the Netherlands has a rather traditional retail structure, with
almost no large-scale hypermarkets or shopping malls. Uncontrolled retail growth at the
fringes of urban areas has been prevented by a restrictive national retail planning policy for
decades, although this policy has recently been abandoned (Evers, 2002). Nonetheless,
approximately half of all shops in the Netherlands are located in the central areas (CBDs) of
towns and cities (Locatus, 2003). Of all shopping trips in the Netherlands nearly half (48%)
are made on foot or by bicycle; these forms of travel account for 15% of all kilometers
traveled for the purpose of visiting shops (Ministry of Transport, Public Works, and Water
Management, 2004).
The data collection took place in two stages. For the first stage, 8000 households were
drawn randomly using the municipalities’ population administration (4000 in Utrecht and
4000 in the suburban municipalities) and were sent a selection questionnaire asking whether
they wanted to participate in the main questionnaire and how: online or via paper-and-pencil.
Nearly a quarter (24%) of the households returned the selection questionnaire; of these, 80%
were willing to participate in the main questionnaire (1566 respondents). Of the respondents
willing to participate, 77% were Internet users and therefore belonged to our research
population (1210 respondents). An Internet user was defined as someone using the Internet
for work or private reasons. Nearly half (46%) of the 1210 respondents preferred to
participate in the online questionnaire. In the second stage, the 1210 respondents received a
shopping questionnaire and a two-day travel diary. Paper-and-pencil respondents received a
written copy of the questionnaire and travel diary by mail, while online respondents received
an invitation by e-mail that enabled them to log on to the websites containing the
questionnaire and travel diary. In total 826 people filled out both a shopping questionnaire
and a travel diary, which is a response rate of 68%. Of these respondents, 44% participated
online.
One-third of the sample searches less than once a month or never for product
information online, while 37% does so at least once a week. The majority (58%) of the
respondents have bought a product online at some time. Only 14% of the respondents have
neither searched nor bought online. A quarter of the respondents search online, but they do
not buy online. Thus, most respondents (60%) search as well as buy online. A comparison of
our data with a nationwide sample of Internet users and e-shoppers shows that our sample has

8
about the same marginal distribution for sociodemographic factors (see for details Farag et al.,
2005c).
3.2 Method of analysis
Because of the complexity of the relationships between e-shopping and in-store shopping, we
chose SEM as method of analysis. The reason is that in SEM a variable can be dependent
(i.e., an outcome variable) and independent (i.e., an explanatory variable) at the same time.
Moreover, SEM distinguishes between direct, indirect, and total effects (Jöreskog & Sörbom,
2001). A total effect consists of a direct and indirect effect.
A SEM analysis consists of two parts: a measurement model and a structural model. In
the measurement model, latent variables are explained by their indicators (observed
variables). In the structural model, relationships between the latent variables can be modeled.
The structural model captures regression effects of exogenous (independent) variables upon
endogenous (dependent) variables, and the regression effects of endogenous variables upon
each other.
Covariance analysis is used to estimate the coefficients in a SEM model. A model
covariance matrix is fitted on a sample covariance matrix, while iteratively minimizing the
differences between the predicted and observed values. There are several goodness of fit
measures that can be used to assess the outcome of a SEM analysis. Often used measures are
(Golob, 2003): the root mean square error of approximation (RMSEA), which is based on chi-
square values and measures the discrepancy between observed and predicted values per
degree of freedom (a good model has a RMSEA value of less than 0.05); the comparative fit
index (CFI), which compares the proposed model to a baseline model with no restrictions (a
good model should exhibit a value greater than 0.90); the consistent Akaike information
criterion (CAIC), which compares the model fit with the degree of parsimony of the model
(the smaller the value is, the better); and goodness-of-fit measures, which compare the sample
and model-implied variance-covariance matrices, such as the standardized root mean square
residual (SRMR) (a value less than 0.05 is considered a good fit) and the adjusted goodness of
fit index (AGFI) (the greater the value is, the better). Another goodness of fit measure is the
Satorra-Bentler chi-square, which takes non-normality into account by using an asymptotic
covariance matrix (Jöreskog, 2001).
First, we checked our data for outliers and multicollinearity. Maximum likelihood
estimation was used as the method of estimation. In addition to a covariance matrix, an
asymptotic covariance matrix was calculated as input for the analysis. In this way standard
9
errors and chi-squares were corrected for non-normality (Jöreskog, 2001). We estimated a
non-recursive structural equation model with latent variables using LISREL software version
8.54 (Jöreskog and Sörbom, 2001). A measurement model for some of the variables was
developed (Internet experience, attitudes towards e-shopping and in-store shopping, and
adventurousness). In the structural model, parameters of the relationships between the
endogenous and exogenous variables, and among the endogenous variables were estimated.
The measurement model and the structural model were estimated simultaneously.
3.3 Operationalization of variables
The frequency distribution and operationalization of the variables included in the structural
equation model analysis are shown in Table 1. See for a fuller description of the sample Farag
et al. (2005c). Several shop accessibility measures were developed using Flowmap version 7
(Zwan et al., 2003). These measures combined the total floor space in square meters for non-
daily shopping goods per four-digit zip code zone (destination) with the respondent’s zip code
zone (origin) and a roadmap of the Netherlands (street-network-based travel distances).
Regular proximity counts were used which measure the summarized floor space for non-daily
goods in square meters a respondent can reach either by foot or by bicylcle from the place of
residence within five or ten minutes, respectively.
4 Structural equation modeling results
Indices of overall model fit show that the model performs reasonably well (Table 3).
Although the Satorra-Bentler scaled chi-square is significant at 572.046 (df=505, p=0.021),
other indices are good. The RMSEA (Root Mean Square Error of Approximation) is 0.013,
and the CFI (Comparative Fit Index) is 0.878.
4.1 Measurement model
Table 2 shows the standardized parameter estimates and t-values of the observed indicators
that were used for constructing the latent variables. In order to get a scale that can be
interpreted for a latent variable, we have fixed one of its belonging observed indicators on one
(Hox and Bechger, 1998). Judging by the t-values, all observed indicators for the latent
variables perform well. Persons who have a positive in-store shopping attitude like to take
their time in shopping (Table 2). Individuals who do not find it important to see and feel a
product before buying it, and who find e-shopping as easy to do as visiting a store, score
highly on having a positive e-shopping attitude.
10
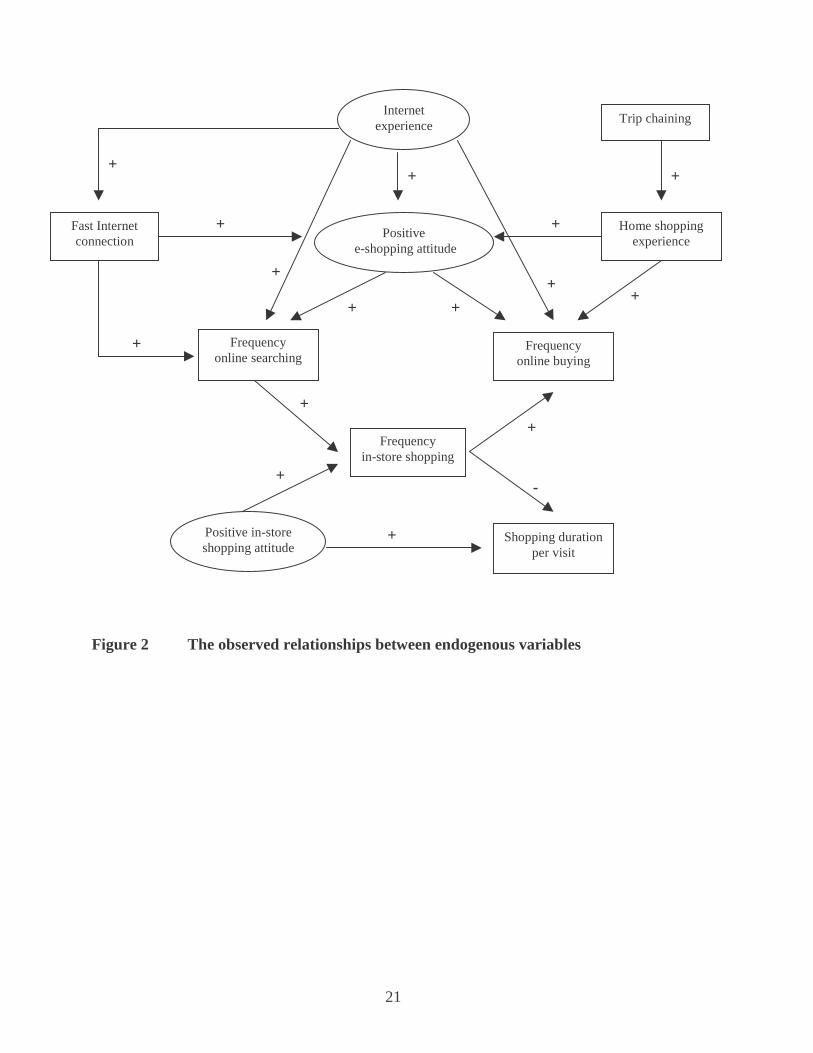
4.2 Structural model
4.2.1 Relationships among the endogenous variables
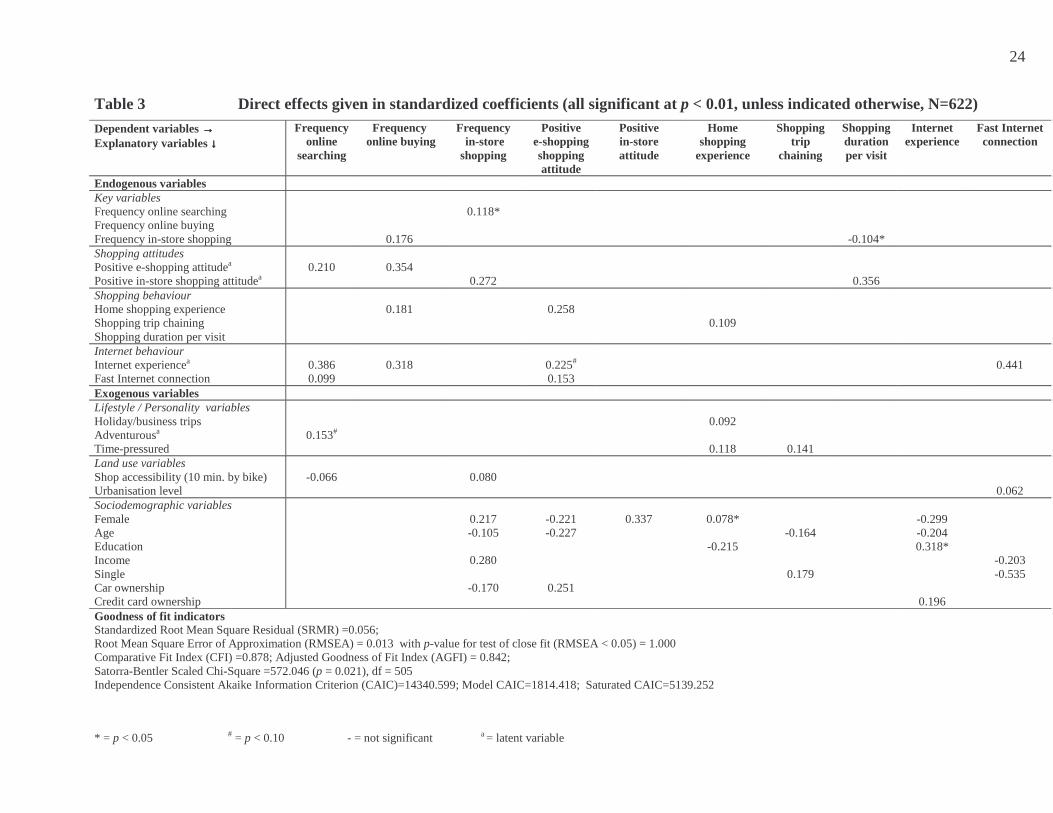
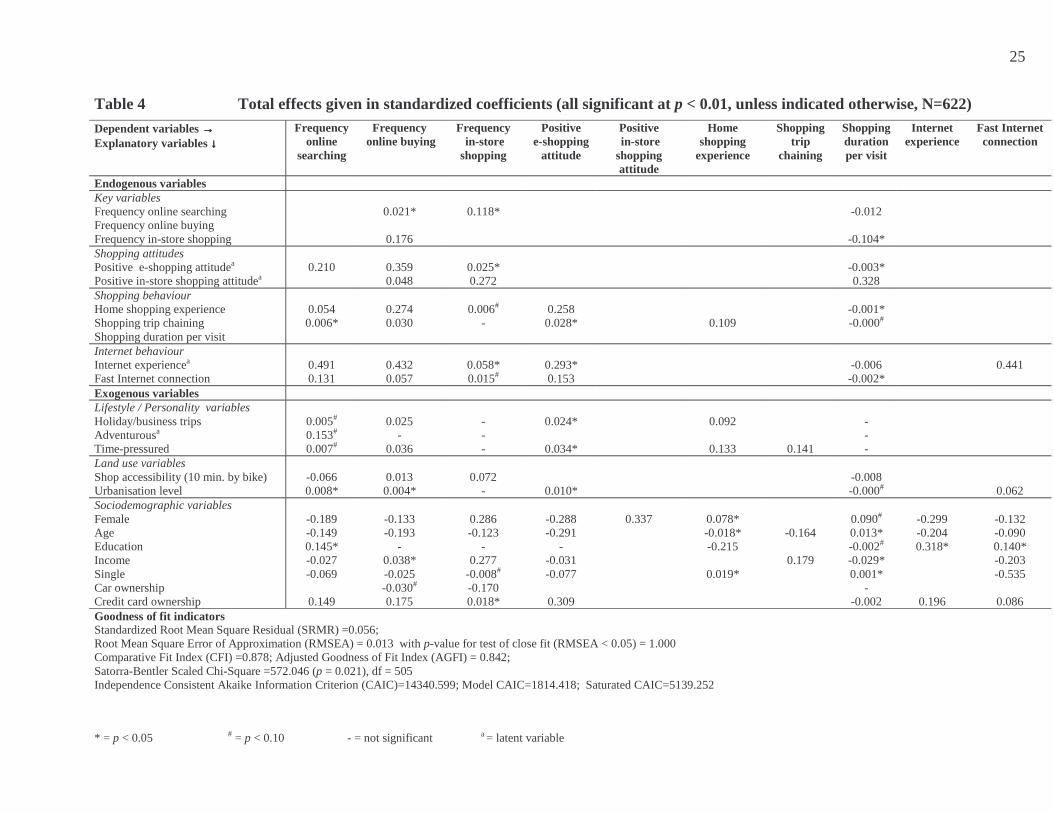
Table 3 and Table 4 present the outcomes of our model in direct and total effects. In these
tables standardized coefficients are given, which facilitates the comparison of the magnitude
of the effects. All the coefficients presented are significant at p < 0.01, unless indicated
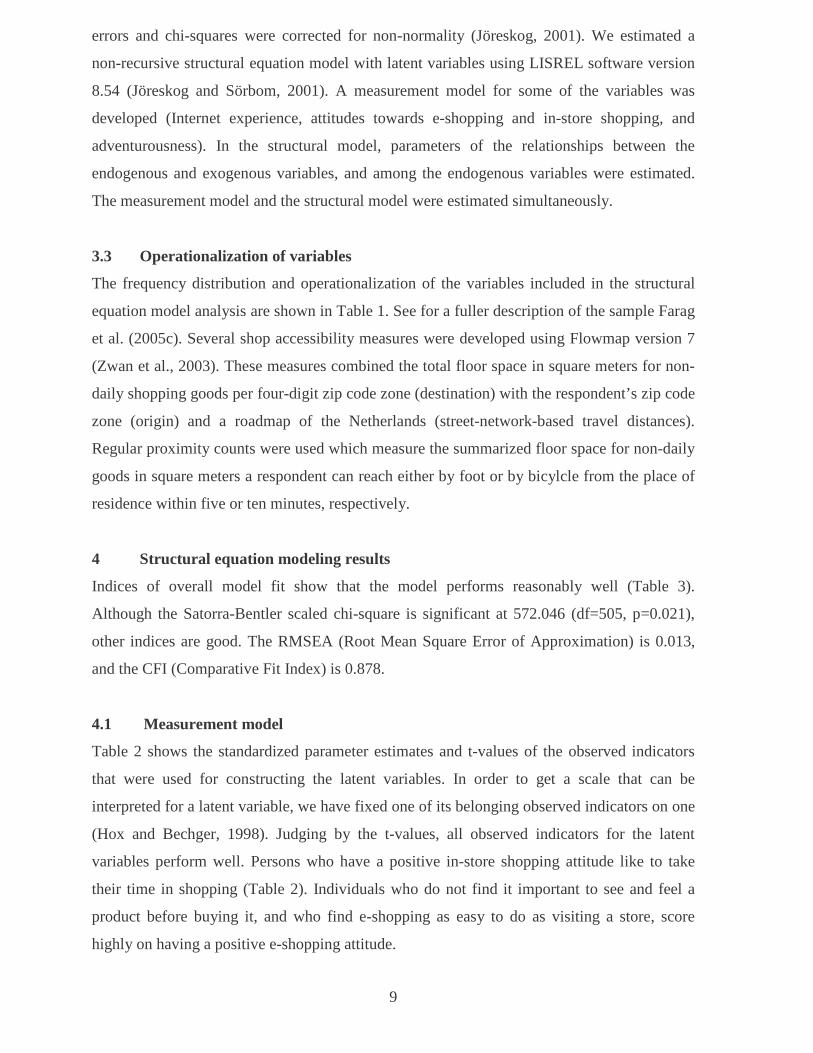
otherwise. Figure 2 visualizes the relationships between the endogenous variables in the
model.
Table 3 shows that online searching affects the frequency of shopping trips positively.
Frequent online searchers tend to make more shopping trips than infrequent online searchers.
This finding was not expected, as we assumed that online searching facilitates reaching a
purchase decision, which would result in fewer shopping trips. Perhaps people use the
Internet to help them decide which products to choose, but then still shop in-store to have a
look at the product before buying it either online or in-store. This result is consistent with the
findings of Casas et al. (2001), who found that e-shoppers tend to make more shopping trips
than non-e-shoppers. It also seems to be consistent with the finding of Ward and Morganosky
(2002) that online searching tends to increase in-store purchases. This remains speculative,
however, since we do not have information about the act conducted in-store (searching or
buying).
Additionally, a positive direct effect of the frequency of shopping trips on online
buying was found. Persons who often shop in-store, also often buy online. The results suggest
that, probably, these persons buy at least as often in-store as online rather than using in-store
shopping as a means to orient themselves on products they ultimately purchase online (Ward
and Morganosky, 2002; Farag et al., 2005b). It seems that individuals who like to shop will do
so in various ways, using different shopping modes. No direct effect of online searching on
online buying was found, although there is an indirect effect via in-store shopping: persons
who often make shopping trips (like frequent online searchers), also often buy online.
Generally speaking, the results for the frequencies of e-shopping and in-store shopping
suggest relationships of complementarity (i.e., parts of the shopping process are conducted via
different channels) or generation, rather than substitution.
As expected, persons with a positive e-shopping attitude search and buy online more
often, and these with a positive in-store shopping attitude shop in-store more often. A positive
in-store shopping attitude also affects online buying positively, via the frequency of shopping
trips (Figure 2). Likewise, a positive e-shopping attitude affects the frequency of shopping
trips via online searching, although this total effect is weaker than the effect of a positive in-

11
store shopping attitude on online buying (Table 4). These results indicate that individuals who
like to shop use different channels to do so. During the model building process, we also
specified paths leading from behaviour to attitudes, but they were considerably weaker than
the paths in which attitudes affect behaviour. Therefore, we chose to let attitudes influence
behaviour instead of the opposite in the final model.
Frequent home shoppers (buying via catalogue, telephone, etc.) often buy online,
while a positive total effect of trip chaining has been found on e-shopping. This is because
persons who frequently chain their shopping trips are more likely to have home shopping
experience (Figure 2). This effect may reflect time-saving strategies: both the chaining of
shopping trips and home shopping may function as ways of making more time available for
activities other than shopping. Home shopping experience positively affects a positive e-
shopping attitude, which in turn results in more e-shopping. These findings suggest that
persons who are experienced in 'buying at a distance' have less trouble with doing so than
those who are less familiar with this concept.
Experienced Internet users search and buy online more often than do inexperienced
Internet users, while persons with a fast Internet connection frequently search online (Table
3). Additionally, a fast Internet connection has a total positive effect on online buying via a
positive e-shopping attitude: because persons with a fast Internet connection tend to think
positively about e-shopping, they buy more frequently online (Figure 2). Internet experience
not only affects e-shopping, but also in-store shopping via online searching: because
experienced Internet users search online often, they make more shopping trips (Figure 2).
Similarly, paths can be seen in Figure 2 leading from Internet connection and home shopping
experience to the frequency of shopping trips, meaning that persons with a fast Internet
connection and experienced home shoppers make more shopping trips.
Outlined earlier, online searching does not lead to fewer shopping trips, indicating that
in-store comparisons of products are still being made. Indirectly, however, online searching
negatively affects shopping duration (Figure 2). Frequent online searchers tend to have a
shorter shopping duration. This means that, ultimately, e-shopping leads to more efficient
store visits, not via making fewer visits, but through shorter visits. Shopping duration is also
adversely influenced by the frequency of shopping trips: the more shopping trips persons
make, the shorter their shopping duration tends to be. This finding is consistent with earlier
empirical research (Farag et al., 2005b). Further, experienced Internet users, experienced
home shoppers, persons with a fast Internet connection, and persons with a positive e-
shopping attitude, also have a shorter shopping duration because they search online more

12
and/or make more shopping trips (Figure 2). Not surprisingly, there is a direct positive
influence of in-store shopping attitude on shopping duration (Table 3).
4.2.2 Relationships between the endogenous and exogenous variables
With respect to the lifestyle/personality indicators, the following results were obtained.
Persons with an active lifestyle (measured by the number of holidays or business trips they
have made in the past year) have a lot of home shopping experience (Table 3). This indirectly
leads to a positive effect on e-shopping, confirming (although indirectly) Casas et al.'s (2001)
notion that e-shoppers tend to be 'active on-the-go' persons. No effect of an active lifestyle on
the frequency of shopping trips was found. Persons who consider themselves adventurous
search more often online (Table 3). Time-pressure affects online buying indirectly via home
shopping experience: because time-pressured individuals often shop from home, they buy
online frequently (see Figure 2). Time-pressured persons also chain their shopping trips more
often. It has been shown earlier that trip chaining positively affects home shopping
experience. No effect of time-pressure on online searching was found. A more objective time-
pressure variable (the number of hours paid work per week) has also been tested, but did not
have any significant effects on any of the endogenous variables and was hence excluded from
the final model specification.
Shop accessibility (the total amount of floor space in m2 for non-daily goods within a
ten-minute travel time by bicycle from home) has a negative effect on online searching: the
more shopping opportunities one can reach within ten minutes by bicycle, the less often one
searches online (Table 3). This finding might suggest that the utility of searching online
increases when there are little or no shopping opportunities available in the vicinity of the
home. Similar findings were obtained for the amount of floor space that can be reached within
five minutes by bicycle and within ten minutes on foot. Furthermore, the more shopping
opportunities one can reach within ten minutes by bicycle, the more often one makes
shopping trips, which is consistent with findings in the literature (Section 2). Because the
frequency of shopping trips is positively related to online buying, a total positive effect of
shop accessibility on online buying occurs: the more shopping opportunities one can access
within ten minutes by bicycle, the more often one buys online. Having shops nearby could
encourage people to explore a product in-store, but ultimately buy it online, because this may
be cheaper. This finding seems to support the notion that e-shopping and in-store shopping
tend to complement or generate each other.

13
Persons living in more urbanised areas are more likely to have a fast Internet
connection than persons living in less urbanised areas. This finding is consistent with the
innovation diffusion hypothesis, which states that the spatial distribution process of new
innovations follows a pattern from large to small settlements (Hägerstrand, 1967). Thus,
because urban residents have a faster Internet connection, they search and buy online more
often. No significant effect of urbanisation level on the frequency of shopping trips was
found.
There are no direct effects of sociodemographic variables on e-shopping, but only
total effects (Table 4). Females and older individuals have less Internet experience and a more
negative e-shopping attitude than males and younger individuals, which makes that females
and older persons shop less often online. Higher educated persons have more Internet
experience than lower educated persons, which explains the total positive effect of education
on e-shopping. Contrary to our expectations, individuals with a higher income search less
often online. This total effect is the result of persons with a higher income having a relatively
slow Internet connection. Perhaps price differences between fast and slow Internet
connections have become so small that many lower-income households can afford to have a
fast Internet connection. As expected, individuals with a higher income buy more often online
than individuals with a lower income, because the former make more shopping trips (Table
4). It seems that persons with a high income like to spend their money on shopping, whether
online, or in-store. Singles shop online less often compared to other household types, because
they have a fast Internet connection less often. Research from Statistics Netherlands (2005)
has shown that households with children most often have a fast Internet connection at home.
Finally, credit card owners have more Internet experience and a more positive e-shopping
attitude than persons who do not own a credit card, which explains the positive total effect of
credit card ownership on e-shopping.
Unlike for e-shopping, sociodemographic variables have direct impacts on in-store
shopping. The positive effect of income on the frequency of shopping trips has already been
mentioned and is consistent with earlier findings (Section 2). Other results in line with earlier
studies are that females make more shopping trips than males, and that persons who do not
own a car shop in-store more often than persons who own one or more cars. We also find that
younger persons make more non-daily shopping trips than older persons. No significant
effects of education and household type on in-store shopping could be detected.
Summarizing, frequent online searchers are also frequent in-store shoppers. Persons
who frequently shop in-store, also frequently buy online. So far, the relationships between e-
14
shopping and in-store shopping hint at complementarity. However, frequent online searchers
tend to have a shorter shopping duration and time-pressured individuals tend to buy more
often online. These findings suggest substitution. Probably, for some persons e-shopping
might replace shopping trips, while for others it is just another way of shopping,
complementary to their in-store shopping. Urban residents search and buy more often online,
because they have a faster Internet connection. Individuals with a high level of shop
accessibility search less often online, while persons with many shopping opportunities make
more shopping trips. Persons who frequently search or buy online tend to be male, young,
highly educated, frequent Internet users, have a fast Internet connection, and a positive
attitude towards e-shopping. Frequent in-store shoppers tend to be female, young, have a high
income, no car, and a positive attitude towards in-store shopping.
5 Conclusion
The study reported in this paper has sought to provide more insights into the relationships
among the frequencies of online searching, online buying, and non-daily shopping trips, while
taking account of other factors known to affect shopping behavior in a structural equation
modeling analysis. The findings show that persons who frequently search online make more
non-daily shopping trips, and that frequent in-store shoppers are frequent online buyers. It
thus appears that in terms of shopping trip frequencies, e-shopping and in-store shopping tend
to complement or generate each other. Yet, with respect to shopping duration we found that
frequent online searchers tend to have a shorter shopping duration per visit, because they
make more shopping trips. Moreover, results indicate that persons who feel time-pressured
frequently chain their shopping trips and have much home shopping experience (e.g.,
shopping via catalogue or telephone). Because home shopping experience positively affects
online buying, we observe an indirect effect of time-pressure on online buying.
Our results thus indicate that substitution and generation could occur simultaneously
(see also Mokhtarian, 2004). They suggest that it is important to look beyond the traditional
‘substitution or generation’ issue and to recognize the more complex relationships between e-
shopping and in-store shopping. It seems that the decision how to shop (online, in-store, or
both ) not only depends on the type of product and its price, but also on the shopping motives
of persons (task-oriented or leisure-oriented). In order to gain additional insights into the
complex relationships between e-shopping and in-store shopping, data are required that
distinguish among acts making up the total shopping activity, such as information gathering,
evaluation, selection, and purchase. We have distinguished between online searching and

15
online buying, but not for shopping trips. Future studies should address this limitation and
differentiate between the several acts of which shopping exists.
Concerning the effect of other factors, we found that Internet experience and a positive
e-shopping attitude positively affect online searching and buying. These factors themselves
can be explained by several sociodemographic attributes. As expected, men and younger
persons tend to have more Internet experience and a more positive attitude towards e-
shopping, while higher educated persons tend to have more Internet experience. The results
also show that, urbanisation level indirectly affects e-shopping positively via Internet
connection type. Because they tend to have a faster Internet connection, urban residents
search and buy online more often. However, all else being equal, shop accessibility has a
negative effect on online searching: the more shopping opportunities one can reach within ten
minutes by bicylce, the less often one searches online. This might suggest that if shopping
trips can be made from the home with little effort, experiencing a product in-store is preferred
to e-shopping. However, the more shopping opportunities one can reach, the more shopping
trips one makes, which is positively related to online buying. It seems that having shops
nearby induces people to make more shopping trips, perhaps to explore a product in-store, but
ultimately buying it online, because this is cheaper, for example.
These findings reinforce our earlier suggestion that future studies should try to gain
additional insights into hybrid shopping activities in which different parts of the shopping
cycle are conducted via different channels. Cross-validation of the study results is required to
find out whether the conclusions also hold in other space-time contexts, or whether they are
specific to the data employed here. Finally, future research should try to get more insight into
persons’ motives to shop online. Our findings seem to indicate that e-shopping could be done
out of task-oriented (e.g., time-saving) reasons, but also out of leisure-oriented reasons.
Depending on the motives to shop online and in which part of the shopping cycle e-shopping
occurs, shopping trips might ultimately be substituted, modified, or generated.
Acknowledgements
The authors wish to thank Dr Anne Boomsma, University of Groningen, and Dr Jan Faber,
Utrecht University, the Netherlands, for their helpful suggestions concerning the analysis. Dr
Tom de Jong is gratefully acknowledged for his help in making the map of shop accessibility.

16
References
1. Bellman, S., G.L. Lohse & E.J. Johnson. Predictors of Online Buying Behaviour.
Communications of the ACM, (Association for Computing Machinery), Vol. 42, 1999,
pp. 32-38.
2. Boston Consulting Group, 2001, The multi-channel consumer. The need to integrate
online and offline channels in Europe. S. Rasch & A. Lintner.
3. Casas, J., J. Zmud & S. Bricka. Impact of Shopping Via Internet on Travel for
Shopping Purposes. Paper presented at 80th Annual Meeting of the Transportation
Research Board, Washington, D.C, 2001.
4. Couclelis, H. Pizza over the Internet: e-commerce, the fragmentation of activity and
the tyranny of the region. Entrepreneurship & Regional Developnment, Vol. 16, 2004,
pp. 41-54.
5. Evers, D., 2002, The rise (and fall?) of national retail planning. TESG, 93, pp. 107-
113.
6. Farag, S., J. Weltevreden, T. van Rietbergen, & M. Dijst. E-shopping in the
Netherlands: Does Geography Matter? 2005a, Forthcoming Environment and
Planning B
7. Farag, S., K.J. Krizek & M. Dijst. E-shopping and its Relationship with In-store
Shopping: Empirical Evidence from the Netherlands and the US. 2005b, Forthcoming
Transport Reviews
8. Farag, S., T. Schwanen, & M. Dijst. Online searching and buying and their
relationship with shopping trips empirically investigated. 2005c, Forthcoming
Transportation Research Record
9. Ferrell, C. E. Home-Based Teleshoppers and Shopping Travel: Do Teleshoppers
Travel Less? Paper presented at 83th Annual Meeting of the Transportation Research
Board, Washington, D.C, 2004.
10. Ferrell, C. E. Home-Based Teleshopping and Shopping Travel: Where do we find the
time? Paper presented at 84th Annual Meeting of the Transportation Research Board,
Washington, D.C, 2005.
11. Forsythe, S,. & B. Shi. Consumer Patronage and Risk Perceptions in Internet
Shopping. Journal of Business Research, Vol. 56, 2003, pp. 867-875.
12. Golob, T.F. Joint models of attitudes and behavior in evaluation of the San Diego I-15
congestion pricing project. Transportation Research A, Vol. 35, 2001, pp. 495-514.

17
13. Golob, T.F. Structural equation modeling for travel behaviour research.
Transportation Research B, Vol. 37, 2003, pp. 1-25.
14. Hägerstrand, T., 1967, Innovation Diffusion as a Spatial Process. Chicago: University
of Chicago Press.
15. Hox, J.J., & T.M. Bechger. An Introduction to Structural Equation Modeling. Family
Science Review, Vol. 11, 1998, 354-373.
16. Jöreskog, K. G. Analysis of Ordinal Variables 2: Cross-sectional Data. October 2001.
http://www.ssicentral.com/lisrel/ord2.pdf Accessed July 14, 2004.
17. Jöreskog, K. G. & D. Sörbom. LISREL 8: User’s Reference Guide. SSI: Scientific
Software International, Lincolnwood, USA, 2001.
18. Li, H., C. Kuo, & M. G. Russell. The Impact of Perceived Channel Utilities, Shopping
Orientations, and Demographics on the Consumer's Online Buying Behavior. Journal
of Computer Mediated Communication, Vol. 5, 1999,
http://www.ascusc.org/jcmc/vol5/issue2/hairong.html Accessed July 6, 2004.
19. Locatus. Retail Guide 2003 (in Dutch). Locatus, Woerden, 2003.
20. Meurs, H. & R. Haaijer. Spatial Structure and Mobility. Transportation Research D,
Vol. 6, 2001, pp. 429-446.
21. Ministry of Transport, Public Works, and Water Management. Passenger Transport in
the Netherlands. Key Figures 2004. AVV Transport Research Centre, 2004.
22. Mohtarian, P.L., I. Salomon, & L.S. Redmond. Understanding the Demand for Travel:
It's Not Purely 'Derived'. Innovation, Vol. 14, 2001, pp.355-380.
23. Mokhtarian, P. A Conceptual Analysis of the Transportation Impacts of B2C E-
Commerce. Transportation, Vol. 31, 2004, pp. 257-284.
24. Ng, C. F. Satisfying shoppers’ psychological needs: from public market to cyber-mall.
Journal of Environmental Psychology, Vol. 23, 2003, pp. 439-455.
25. Srinivasan, S. & C. R. Bhat, Modeling the generation and allocation of shopping
activities in a household. Paper presented at 83th Annual Meeting of the
Transportation Research Board, Washington, D.C, 2004.
26. Srinivasan, S. & C. R. Bhat, Modeling household interactions in daily in-home and
out-of-home maintenance activity participation. Paper presented at 84th Annual
Meeting of the Transportation Research Board, Washington, D.C, 2005.
27. Statistics Netherlands. The Digital Economy 2003 (in Dutch). Statistics Netherlands,
Voorburg, 2003.

18
28. Statistics Netherlands (2005) Webmagazine Snelle opmars breedband internet
http://www.cbs.nl/nl/publicaties/artikelen/algemeen/webmagazine/artikelen/2005/164
4k.htm Accessed 14.02.2005
29. Swinyard, W.R. & S.M. Smith. Why People (Don’ t) Shop Online: A Lifestyle Study
of the Internet Consumer. Psychology & Marketing, Vol. 20, 2003, pp. 567-597.
30. TNS Interactive, Global eCommerce Report 2002. Taylor Nelson Sofres Interactive,
2002. http://www.tnsofres.com/ger2002/ Accessed July 5, 2004.
31. Van, U.P., & M. Senior, 2000. The contribution of mixed land uses to sustainable
travel in cities. In: Williams, K., E. Burton, M. Jenks (Eds.), Achieving sustainable
urban form. E and FN Spon, London/New York, pp. 139-148.
32. Ward, M. R., & M. Morganosky. Consumer Acquisition of Product Information and
Subsequent Purchase Channel Decisions. In: Baye, M.R. (ed.) Advances in Applied
Microeconomics: The Economics of the Internet and E-commerce. Vol. 11, 2002,
Amsterdam: Elsevier Science.
33. Yun, D.S. & M. E. O’Kelly. Modeling the day-of-the-week shopping activity and
travel patterns. Socio-Economic Planning Sciences, Vol.31, 1997, pp. 307-319.
34. Zwan, J. van der & R. van der Wel & J. Ritsema van Eck & T. de Jong & H. Floor,
2003, Manual Flowmap 7. Utrecht: Faculty of Geosciences.

19
List of Figures and Tables
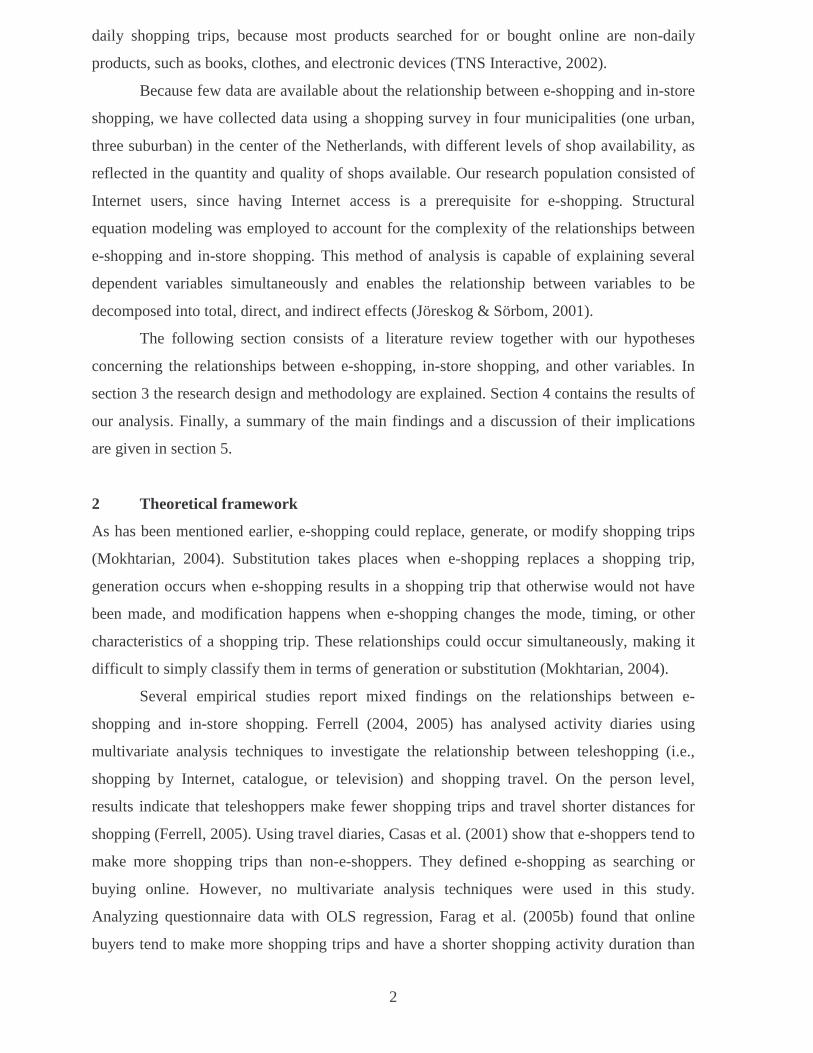
Figure 1 Shop accessibility per zip code zone in the research areas
Figure 2 The observed relationships between endogenous variables
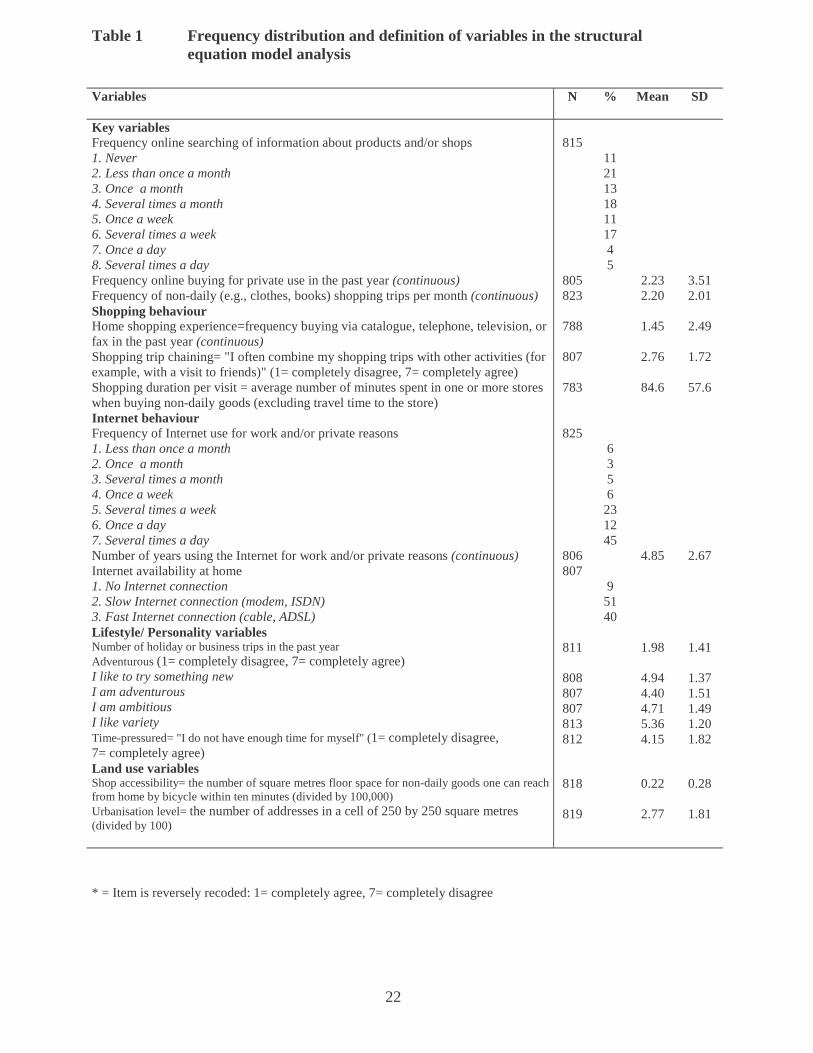
Table 1 Frequency distribution and definition of variables in the structural equation
model analysis
Table 2 Standardized parameter estimates of the observed indicators for the latent
variables (N=622)
Table 3 Direct effects given in standardized coefficients (all significant at p < 0.01,
unless indicated otherwise, N=622)
Table 4 Total effects given in standardized coefficients (all significant at p < 0.01,
unless indicated otherwise, N=622)
20
Figure 1 Shop accessibility per zip code zone in the research areas
21
Figure 2 The observed relationships between endogenous variables
Frequency online searching
Frequency in-store shopping
Positive in-store shopping attitude
Shopping duration per visit
Frequency online buying
Positive e-shopping attitude
Home shopping experience
Fast Internet connection
Trip chaining Internet
experience
+
-
+
+
+
+ +
+
+
+
+
+ +
+ +
+
22
Table 1 Frequency distribution and definition of variables in the structural equation model analysis
* = Item is reversely recoded: 1= completely agree, 7= completely disagree
Variables
N % Mean SD
Key variables Frequency online searching of information about products and/or shops 1. Never 2. Less than once a month 3. Once a month 4. Several times a month 5. Once a week 6. Several times a week 7. Once a day 8. Several times a day Frequency online buying for private use in the past year (continuous) Frequency of non-daily (e.g., clothes, books) shopping trips per month (continuous)
815
805 823
11 21 13 18 11 17 4 5
2.23 2.20
3.51 2.01
Shopping behaviour Home shopping experience=frequency buying via catalogue, telephone, television, or fax in the past year (continuous) Shopping trip chaining= "I often combine my shopping trips with other activities (for example, with a visit to friends)" (1= completely disagree, 7= completely agree) Shopping duration per visit = average number of minutes spent in one or more stores when buying non-daily goods (excluding travel time to the store)
788
807
783
1.45
2.76
84.6
2.49
1.72
57.6
Internet behaviour Frequency of Internet use for work and/or private reasons 1. Less than once a month 2. Once a month 3. Several times a month 4. Once a week 5. Several times a week 6. Once a day 7. Several times a day Number of years using the Internet for work and/or private reasons (continuous) Internet availability at home 1. No Internet connection 2. Slow Internet connection (modem, ISDN) 3. Fast Internet connection (cable, ADSL)
825
806 807
6 3 5 6 23 12 45 9 51 40
4.85
2.67
Lifestyle/ Personality variables Number of holiday or business trips in the past year Adventurous (1= completely disagree, 7= completely agree) I like to try something new I am adventurous I am ambitious I like variety Time-pressured= "I do not have enough time for myself" (1= completely disagree, 7= completely agree)
811
808 807 807 813 812
1.98
4.94 4.40 4.71 5.36 4.15
1.41
1.37 1.51 1.49 1.20 1.82
Land use variables Shop accessibility= the number of square metres floor space for non-daily goods one can reach from home by bicycle within ten minutes (divided by 100,000) Urbanisation level= the number of addresses in a cell of 250 by 250 square metres (divided by 100)
818
819
0.22
2.77
0.28
1.81

23
Table 2 Standardized parameter estimates of the observed indicators for the latent variables (N=622)
a = Item fixed on 1.00 * = Reversed items were recoded before being included in the analysis
Latent variables
Parameter estimate t-value
Positive in-store shopping attitude I like to shop I prefer to shop as quickly as possible* I often make unplanned purchases
0.850 a 0.687 0.396
6.431 4.572
Positive e-shopping attitude Online shopping is less fun than visiting a store* Online shopping is more complex than visiting a store* Online shopping is cheaper than visiting a store The supply of products on the Internet is inferior to that in the stores* It is convenient that you can shop online without having to leave home It is annoying to have to wait for a product to be delivered if you buy it online* Paying with a credit card online is to be trusted I find it important to be able to see and feel a product before I buy it* None of my friends shop online*
0.656 a 0.610 0.336 0.331 0.323 0.461 0.441 0.844 0.400
8.259 4.052 3.689 3.649 6.899 6.143 10.837 3.993
Internet experience Frequency of Internet use Number of years using the Internet
0.913 a
0.515
6.942 Adventurous I like to try something new I am adventurous I am ambitious I like variety
0.698 a
0.658 0.522 0.688
9.419 6.842 16.992
* = p < 0.05 # = p < 0.10 - = not significant a = latent variable
24
Table 3 Direct effects given in standardized coefficients (all significant at p < 0.01, unless indicated otherwise, N=622)
Goodness of fit indicators Standardized Root Mean Square Residual (SRMR) =0.056; Root Mean Square Error of Approximation (RMSEA) = 0.013 with p-value for test of close fit (RMSEA < 0.05) = 1.000 Comparative Fit Index (CFI) =0.878; Adjusted Goodness of Fit Index (AGFI) = 0.842; Satorra-Bentler Scaled Chi-Square =572.046 (p = 0.021), df = 505 Independence Consistent Akaike Information Criterion (CAIC)=14340.599; Model CAIC=1814.418; Saturated CAIC=5139.252
Dependent variables →→→→ Explanatory variables ↓↓↓↓
Frequency online
searching
Frequency online buying
Frequency in-store shopping
Positive e-shopping shopping attitude
Positive in-store attitude
Home shopping
experience
Shopping trip
chaining
Shopping duration per visit
Internet experience
Fast Internet connection
Endogenous variables Key variables Frequency online searching Frequency online buying Frequency in-store shopping
0.176
0.118*
-0.104*
Shopping attitudes Positive e-shopping attitudea Positive in-store shopping attitudea
0.210
0.354
0.272
0.356
Shopping behaviour Home shopping experience Shopping trip chaining Shopping duration per visit
0.181
0.258
0.109
Internet behaviour Internet experiencea Fast Internet connection
0.386 0.099
0.318
0.225#
0.153
0.441
Exogenous variables Lifestyle / Personality variables Holiday/business trips Adventurousa Time-pressured
0.153#
0.092
0.118
0.141
Land use variables Shop accessibility (10 min. by bike) Urbanisation level
-0.066
0.080
0.062 Sociodemographic variables Female Age Education Income Single Car ownership Credit card ownership
0.217 -0.105
0.280
-0.170
-0.221 -0.227
0.251
0.337
0.078*
-0.215
-0.164
0.179
-0.299 -0.204 0.318*
0.196
-0.203 -0.535
* = p < 0.05 # = p < 0.10 - = not significant a = latent variable
25
Table 4 Total effects given in standardized coefficients (all significant at p < 0.01, unless indicated otherwise, N=622)
Goodness of fit indicators Standardized Root Mean Square Residual (SRMR) =0.056; Root Mean Square Error of Approximation (RMSEA) = 0.013 with p-value for test of close fit (RMSEA < 0.05) = 1.000 Comparative Fit Index (CFI) =0.878; Adjusted Goodness of Fit Index (AGFI) = 0.842; Satorra-Bentler Scaled Chi-Square =572.046 (p = 0.021), df = 505 Independence Consistent Akaike Information Criterion (CAIC)=14340.599; Model CAIC=1814.418; Saturated CAIC=5139.252
Dependent variables →→→→ Explanatory variables ↓↓↓↓
Frequency online
searching
Frequency online buying
Frequency in-store shopping
Positive e-shopping
attitude
Positive in-store shopping attitude
Home shopping
experience
Shopping trip
chaining
Shopping duration per visit
Internet experience
Fast Internet connection
Endogenous variables Key variables Frequency online searching Frequency online buying Frequency in-store shopping
0.021*
0.176
0.118*
-0.012
-0.104*
Shopping attitudes Positive e-shopping attitudea Positive in-store shopping attitudea
0.210
0.359 0.048
0.025* 0.272
-0.003* 0.328
Shopping behaviour Home shopping experience Shopping trip chaining Shopping duration per visit
0.054 0.006*
0.274 0.030
0.006#
-
0.258 0.028*
0.109
-0.001* -0.000#
Internet behaviour Internet experiencea Fast Internet connection
0.491 0.131
0.432 0.057
0.058* 0.015#
0.293* 0.153
-0.006 -0.002*
0.441
Exogenous variables Lifestyle / Personality variables Holiday/business trips Adventurousa Time-pressured
0.005#
0.153#
0.007#
0.025
- 0.036
- - -
0.024*
0.034*
0.092
0.133
0.141
- - -
Land use variables Shop accessibility (10 min. by bike) Urbanisation level
-0.066 0.008*
0.013 0.004*
0.072
-
0.010*
-0.008 -0.000#
0.062 Sociodemographic variables Female Age Education Income Single Car ownership Credit card ownership
-0.189 -0.149 0.145* -0.027 -0.069
0.149
-0.133 -0.193
- 0.038* -0.025 -0.030#
0.175
0.286 -0.123
- 0.277
-0.008#
-0.170 0.018*
-0.288 -0.291
- -0.031 -0.077
0.309
0.337
0.078* -0.018* -0.215
0.019*
-0.164
0.179
0.090#
0.013* -0.002#
-0.029* 0.001*
- -0.002
-0.299 -0.204 0.318*
0.196
-0.132 -0.090 0.140* -0.203 -0.535
0.086