Big Boxes versus Traditional Shopping Centers: Looking At Households' Shopping Trip Patterns
30
173 International Articles Editor Graeme Newell University of Western Sydney School of Construction, Property and Planning Locked Bag 1797 Penrith South NSW 1797 Australia [email protected]. This section publishes research articles on subjects outside of the United States. All real estate topics are sought. The editor and associate editors are particularly interested in papers on emerging markets and they recognize that database and other research limitations may exist in such markets. Manuscripts on developed markets are encouraged as well. All submissions should be limited to fifteen double-spaced pages. Associate Editors Alastair Adair (2006–2009) University of Ulster Jaime Alvayay (2006–2007) California State University–Sacramento K. W. Chau (2006) University of Hong Kong Francois DesRosiers (2006–2007) Laval University Daniel Gat (2006–2009) Technion Institute of Technology–Israel Liow Kim Hiang (2006–2007) National University of Singapore Colin Lizieri (2006–2008) University of Reading Stanley McGreal (2006) University of Ulster Joseph Ooi (2006–2009) National University of Singapore Mauricio Rodriguez (2006–2007) Texan Christian University Stephen E. Roulac (2006–2008) Roulac Global Places & University of Ulster Karl-Werner Schulte (2006) European Business School Arthur L. Schwartz, Jr. (2006–2009) University of South Florida-Emeritus M. Atef Sharkawy (2006) Texas A&M University James R. Webb (2006–2008) Cleveland State University Patrick J. Wilson (2006–2008) University of Technology, Sydney Elaine Worzala (2006) University of San Diego
-
Upload
independent -
Category
Documents
-
view
2 -
download
0
Transcript of Big Boxes versus Traditional Shopping Centers: Looking At Households' Shopping Trip Patterns

173
International ArticlesEditor
Graeme NewellUniversity of Western Sydney
School of Construction, Property and PlanningLocked Bag 1797
Penrith South NSW 1797Australia
This section publishes research articles on subjects outside of the United States. Allreal estate topics are sought. The editor and associate editors are particularly interestedin papers on emerging markets and they recognize that database and other researchlimitations may exist in such markets. Manuscripts on developed markets areencouraged as well. All submissions should be limited to fifteen double-spaced pages.
Associate Editors
Alastair Adair (2006–2009)University of Ulster
Jaime Alvayay (2006–2007)California State University–Sacramento
K. W. Chau (2006)University of Hong Kong
Francois DesRosiers(2006–2007)Laval University
Daniel Gat (2006–2009)Technion Institute of Technology–Israel
Liow Kim Hiang (2006–2007)National University of Singapore
Colin Lizieri (2006–2008)University of Reading
Stanley McGreal (2006)University of Ulster
Joseph Ooi(2006–2009)National University of Singapore
Mauricio Rodriguez (2006–2007)Texan Christian University
Stephen E. Roulac(2006–2008)Roulac Global Places & University ofUlster
Karl-Werner Schulte (2006)European Business School
Arthur L. Schwartz, Jr. (2006–2009)University of South Florida-Emeritus
M. Atef Sharkawy (2006)Texas A&M University
James R. Webb(2006–2008)Cleveland State University
Patrick J. Wilson (2006–2008)University of Technology, Sydney
Elaine Worzala (2006)University of San Diego


175
Big Boxes versus Traditional ShoppingCenters: Looking At Households’ ShoppingTrip PatternsGjin Biba,* Francois Des Rosiers,** Marius Theriault*** and PaulVilleneuve****
AbstractIn this paper, the competition between, on the one hand, regional and super-regionalshopping centers and, on the other hand, ‘‘category killers’’ and ‘‘big boxes’’ isanalyzed using discrete choice modeling (logistic regression). An extensive Origin-Destination phone survey in the Quebec Metropolitan Area in 2001 provides detailedinformation on both households’ socioeconomic and demographic profiles and dailytrip patterns, making it is possible to identify and model customers’ shoppingdestination choices. The findings suggest that several trip and household attributesimpact customers’ choice for either big boxes or traditional shopping centers: trippurpose, transportation mode and car ownership, day of the week, departure time andplace as well as trip length and, finally, respondent’s gender, age and type ofhousehold.
This paper looks at the competition between traditional shopping centers and newlyemerging shopping facilities which, since the early 1990s, have spread all over NorthAmerica. Commonly referred to as ‘‘big boxes’’ and ‘‘category killers’’ (Grantz andMintz, 1998), often grouped into ‘‘power centers,’’1 the latter are threatening the longestablished equilibrium prevailing in the retail sector in much the same way asdowntown commercial streets were outmatched by suburban regional and super-regional shopping centers in the late 1950s, early 1960s. Behind this phenomenon liesthe changing structure of consumers’ professional, household and mobility profileswhich, in turn, affects their shopping patterns.
The originality of this study rests on the availability of a transportation-orientedmethodology currently used for planning purposes in Canadian metropolitan areas,the Origin-Destination (O-D) survey. In contrast with typical marketing surveys thatemphasize consumption patterns, O-D surveys focus on daily trip patterns and provideunique and detailed information on trip purpose, mode and timing, as well as onindividual and household characteristics. Moreover, the sample size used for O-Dsurveys, which ranges from 5% to 10% of regional populations, makes it possible tobreakdown shopping trip patterns to an extent that ordinary surveys cannot match.
*Laval University, Quebec City, Canada, G1K 7P4 or [email protected].**Laval University, Quebec City, Canada, G1K 7P4 or [email protected].***Laval University, Quebec City, Canada, G1K 7P4 or [email protected].**** Laval University, Quebec City, Canada, G1K 7P4 or [email protected].

176 Journal of Real Estate Literature
VOLUME 14, NUMBER 2, 2006
Context and Problematics of the StudySince the middle of twentieth century, the retail trade sector has experienced a growingdegree of concentration resulting in fewer and larger stores. The design of retailstructure in urban areas has changed significantly, expanding from individual storeslocated on traditional commercial streets to very large and car-oriented shoppingcenters and, later on, isolated mega-stores, or big boxes. According to authors, severalinternal and external factors affecting retail facilities may be brought forward aspossible explanations for this concentration. Many of the changes have been linkedto metropolitan growth patterns, changes in urban transportation systems includingthe rising dominance of the automobile, as well as evolving retail marketingtechniques (Beyard and O’Mara, 1999). Similarly, changing shopping behaviorchoices of households would affect the shaping of the retail sector. These areexpressed through household mobility, as well as through their purchasing power andpreferences for retail trade forms that offer a large diversity of products and services(Baker, 2000; and Gobillon, Selod and Zenou, 2003).
The expansion of shopping centers and, more recently of big box outlets and powercenters in North American and West European urban areas is a major feature of theretail trade sector development. After the first shopping malls appeared in the 1950s,enclosed, regional and super-regional malls experienced their largest growth duringthe 1970s and 1980s. Their success stemmed from putting together a large numberof diversified stores. By addressing the strong competition in the retail trade sector,such a marketing strategy, referred to as retail mix, significantly reduced the risk ofmall operators while also leading to a growing homogeneity among shopping centers.This, in turn, resulted in an increasingly monotonous shopping experience forconsumers who sought after larger and more varied selections of merchandise. Theconvenience of single-stop shopping in climate-controlled malls was thusprogressively offset by the drawbacks of finding a convenient parking place, of longhikes between stores in ever-expanding buildings and of the often too limited selectionof merchandise in the stores (Carliner, 2002).
Consequently, by the early 1990s, big boxes had become a serious challenge totraditional shopping centers. By the end of the decade, big box outlets accounted forroughly 70% of the new retail footage built in Canada. In 1999, for example, thelatter reaped six out of the eight million square feet of new retail space planned forconstruction (Thorne, 1999), with major metropolitan areas like Toronto, Montreal,Edmonton, Vancouver, Calgary and Quebec City displaying the highest outletconcentration (Simmons and Kamikihara, 2001). According to a recent study byGeocom (2003), big boxes and power centers in the Montreal metropolitan area haveexperienced a 428% growth in their square footage between 1990 and 2003 and nowaccount for 22% of the retail customer traffic, as opposed to 29% for traditionalshopping centers. Retail sectors where their influence is particularly prominent includefood stores, home renovation outlets, department stores, as well as furniture andelectric appliance establishments.
The potential effects these new players exert on the urban scene are numerous andextend well beyond the sole retail sector (Arnold and Luthra, 2000; and Barber and

Big Boxes versus Traditional Shopping Centers: Looking At Households’ Shopping Trip Patterns 177
Tietje, 2004). Indeed, they address overall planning issues; whereas the trend towardsever larger and land-consuming outlets results in providing consumers with a greatervariety of stores in order to meet household needs and constraints. While easing theirsearch for leisure and other personal non-work activities, it also induces the out-migration of people from central, well-serviced areas to more isolated locations thatare less easily accessible by mass transit while raising the demand for roadinfrastructures.
This paper investigates the competition between regional and super-regional shoppingcenters and big boxes and power centers using the extensive O-D mobility surveyperformed on the Quebec Metropolitan Area (QMA) and integrated into a regionalGIS that links each trip origin with its destination. Combining information onshopping trip patterns by type of retail establishment with socio-economic anddemographic attributes of individuals and households makes it possible to betterunderstand the issues at stake in the retail sector. It also helps to foresee howcompetition between major shopping centers and big boxes will evolve in the light ofdaily travel behavior.
The next section consists of a literature review on shopping behavior in the light ofeconomic, marketing and transportation research. This review is followed by adiscussion of the database, research hypotheses and the analytical approach. Next,regression results are reported and analyzed. The paper concludes with a summary offindings and a discussion on issues requiring further research.
Literature Review
The expansion of large scale retail outlets and complexes has received much attentionin the literature from a variety of research perspectives involving economic, marketing,transportation and real estate issues. While macro-economic studies investigate therelationship between economic globalization of the retail sector and the emergence oflarge retail formats (Burt, 1991; Guy, 1999; Wrigley, 2000; and Burt, Dawson andSpraks, 2003), the micro-economic and marketing literatures mainly focus onconsumer behavior, with a special emphasis on the consumer’s utility function, as wellas on tenant mix (Yuo, Crosby, Lizieri and McCann, 2004), brand choice attributes(brand name, packaging, etc.) and their impacts on firm strategies (Nakanishi andCooper, 1974; Fotheringham, 1988; Fader and Hardie, 1996; Arnold and Luthra, 2000;Jones and Doucet, 2000; and Severin, Jordan and Finn, 2001).
By and large then, marketing and urban economics studies look at consumer behaviorin the context of various shopping alternatives and competing destinations (Thill andTimmermans, 1992; Swait and Adamowicz, 2001; and Swait and Erdem, 2002).Transportation-oriented research, in contrast, investigates individual behavior inrelation to travel mode choice (Timmermans, van der Hagen and Borgers, 1992;Limanond and Niemeier, 2004; and Wang, Li and Timmermans, 2004), trip chaining,trip duration, departure time decision, etc. (Bhat, 1998; Bhat, Srinivasan andAxhausen, 2005). It aims less at understanding competition among retail formats than

178 Journal of Real Estate Literature
VOLUME 14, NUMBER 2, 2006
at solving travel demand and transportation policy issues. In line with the firstapproach, this literature review focuses on retail activity and store choice modeling.
Spatial Interaction Modeling
Spatial considerations are granted a significant place in consumer behavior research.Referring to industry research in the United States, Bell, Ho and Tang (1998) remindus that location explains up to 70% of households’ choice for a grocery store. Spatialinteraction models have been the first analytical tools to address the store choice issue.With Reilly’s (1929) pioneering work, Newton’s ‘‘gravitational’’ concept is applied toretail analysis and the spatial attraction of outlets is measured as a function of theirsize and distance to customers. With Christaller’s (1933) central place theory in thebackground, spatial interaction models based on the distance minimizing principlewere used for decades for retail competition analysis and transportation planningpurposes. As consumer mobility rose and transportation systems gained in complexity,these rather simplistic tools needed to be upgraded. A substantial improvement tospatial interaction models is made by Huff (1964) who introduces the utility conceptas formulated by Luce (1959),2 thereby turning deterministic models of store choiceinto quasi-probabilistic ones. Thereafter, and throughout the following two decades,the idea of a utility function is widely discussed in the literature dealing with consumerbehavior models (Downs, 1970; Prosperi and Schuler, 1976; and Timmermans, 1982and 1988).
The effect of spatial structure on consumer behavior and competition among stores(Mejia and Benjamin, 2002; Des Rosiers, Theriault and Menetrier, 2005; andTheriault, Des Rosiers and Joerin, 2005), the distance between shoppers’ home andretail facilities (Borgers and Timmermans, 1987; Arentze, Borgers and Timmermans,1993; and Gonzalez-Benito, 2002), the location of work opportunities, as well as thegeographical and socio-economic attributes of residential areas (Gober, McHugh andLeclerc, 1993; and Des Rosiers et al., 2005) all constitute issues that receive aparticular attention in the literature. The number and nature of nearby stores is alsoconsidered as an important factor in the choice for a retail outlet (Solgaard andHansen, 2003). Finally, May (1981) and Gripsrud and Horverak (1986) argue thatconsumers tend to base their patronage decisions on the shopping complex rather thanon individual stores.
Discrete Choice Modeling
Since the end of the 1970s, a new paradigm on retail store choice has emerged thatlinks random utility theory with discrete choice models (Louvier and Gaeth, 2000).This approach makes it possible to combine individual-level perceptual variables, suchas product selection, merchandise quality, price levels and so forth (Lindquist, 1974;Schuler, 1979; and Arnold, Tae and Tigert, 1983) with individual shoppers’ attributesand/or more objective measures like floor space, as well as store and product mix(Gensch and Recker, 1979; and Weisbrod, Parcells and Kern, 1984). Discrete choicemodels are applied using the maximum likelihood method (Ben-Akiva and Lerman,1985) and estimate the probability of any given event to occur considering a series

Big Boxes versus Traditional Shopping Centers: Looking At Households’ Shopping Trip Patterns 179
of individual or household attributes or some exogenous variables (Timmermans,1982; and Thill and Timmermans, 1992). Discrete choice modeling requires that thedependent variable be expressed as a categorical variable.
Despite criticisms regarding mainly the IIA (i.e., independent, identical alternatives)hypothesis, which states that shopping alternatives are both independent and equallyweighted, the discrete choice model remains highly popular, especially in retailing,transportation, house choice, etc., studies. This popularity stems from its highpredictive performance and flexibility in comparing stated and revealed preferences(Swait and Louviere, 1993; Adamowicz, Louviere and Williams, 1994; and Louviere,Hensher and Swait, 1999).
The identification of the relevant attributes affecting the choice of shoppingdestinations is among the main topics found in much of the discrete choice modelsof consumer behavior (Eppli and Benjamin, 1993). Depending on their objectives,studies that analyze shopping patterns use different kinds of data and sets of variables.While some authors focus on store or shopping center attributes (Gautschi, 1981;Ghosh, 1984; Guy, 1987; and Borgers and Timmermans, 1987), others opt forconsumers’ perceptions and try to assess how it may affect their decisions (Nevin andHouston, 1980; Recker and Schuler, 1981; Louviere and Gaeth, 1987; and Dudey,1990). Another set of studies—mostly cross-sectional ones—explains shoppingpatterns by looking at socio-economic and demographic profiles. Several lay emphasison households’ retail outlet choices (Kau and Ehrenberg, 1984; Wrigley and Dunn,1984a,b; and Uncles and Ehrenberg, 1988), with some resorting to store-level data inorder to study the effectiveness of marketing mix on store sales and substitutionbetween outlets (Mulhern and Leone, 1990; Hoch, Kim, Montgomery and Rossi,1995; and Leon and Philippe, 2000).
The literature review first shows that there is a substantial body of literature dealingwith consumer behavior and retail outlet choice and that a great diversity of attributesappears to be relevant for explaining shopping patterns. It also suggests, though, thatthe socio-economic, demographic and geographical dimensions of shopping patternsand choices still leave room for further investigation. The issue has obvious real estateimplications in that competition among retail outlets directly affects sales, and hencetheir profitability and value.
While numerous studies have focused on the spatial competition between retailestablishments, none has ever taken advantage of O-D surveys as a tool forinvestigating the issue. Yet, the O-D survey, especially if it is GIS-operated, providesnumerous advantages: (1) as it rests upon an extensive survey, the ensuing results aremost representative of a large spectrum of mobility profiles; (2) it providesunprecedented detail about shopping trip mode, purpose and timing; (3) sinceemployment and leisure destinations, as well as multi-purpose trips are reported, itallows for trip-chaining habits to be investigated; (4) household attributes being knownfor trips that originate from home, useful insights can be gained from linking suchattributes with shopping trip behavior; and (5) the O-D methodology may be appliedto many metropolitan areas in Canada and elsewhere.

180 Journal of Real Estate Literature
VOLUME 14, NUMBER 2, 2006
In this paper, the logit, binomial model, derived from the discrete choice modelingmethodology and widely resorted to by authors (Tabachnick and Fidell, 1996; andMenard, 2001), is used to look at how mobility and household attributes impactconsumers’ propensity to opt for a given type of retail format. The structure andspecification of the logit model are explained further below.
Database
Selecting Retail Outlets
With a population of roughly 683,000 inhabitants (2001 Canadian Census), theQuebec Metropolitan Area (QMA) covers 3,154 square kilometers and is namelycharacterized by an extensive road network, which greatly facilitates motorizedmovements and prevents any congestion problem. By 2000, the average householdincome stood at $50,230 Canadian ($58,630 for Canada as a whole) while per capitaincome stood at $27,939 Canadian ($29,769 for Canada as a whole). As for the retailstructure, some 7,721 retail stores could be found in the QMA (ZipCom, 2000), withmore than half of these consisting of small individual outlets scattered along the maincommercial arteries and all over residential areas. Remaining stores are either locatedwithin 83 neighborhoods, community, regional and super-regional shopping centersor consist of big boxes and power centers.3
The retail database used here is confined to all regional and super-regional shoppingcenters4 and big boxes located in the QMA. As suggested by their name, the latterare characterized by their large size, which often have 50,000 or more square feet ofretail space, compared with the 1,500 – 5,000 square feet of a typical specialty shopin a shopping center (Urban Land Institute, 2000). While big boxes may be specialized(Mass Merchandisers) or not (Combination Stores), they generally offer a wide varietyof low-price goods, as well as an easy access to the store coupled with extensive car-park facilities directly in front of the establishment. By 2000, the QMA had threeregional and three super-regional shopping centers, all six establishments accountingfor roughly 6.9 million square feet (1,001 retail stores) and drawing 18% of customertrips.5 For the same year, the number of big boxes—defined as retail outlets with afloor area of 5,000 square meters and over—stood at 34 (2.6 million square feet) andattracted 8.3% of all customer trips. Most establishments belong to chain stores thatcan be found throughout American and Canadian metropolitans areas such as Wal-Mart, Home Depot, Costco, Bureau en Gros, Canadian Tire, Sobey’s, etc.
O-D Survey Data
As for data on trip patterns, they are based on a major O-D phone survey carried outjointly by the Ministry of Transport of Quebec (MTQ) and Quebec City’s publictransport authority (RTC) between mid-September and mid-December 2001 fortransportation planning purposes. The survey covers around 8% of the local populationand accounts for 174,243 daily trips made to reach activity places during a typicalweek day (from Monday to Friday). Overall, 68,121 persons living in 27,839households were interviewed.6 Some 6,426 relevant shopping trips are used to

Big Boxes versus Traditional Shopping Centers: Looking At Households’ Shopping Trip Patterns 181
Exhibit 1
Retail Customer Traffic in the Quebec Metropolitan Area: Monday to Friday
Regional & Super-Regional Centers
18%Small Individual
Stores37%
Neighborhood Centers
9%
Community Centers
12%
Commercial Streets
16%
Big Boxes & Power Centers
8%
Source: Quebec Metropolitan Area Origin-Destination Survey, 2001.
determine the spatial market for each type of retail facility and to analyze customers’shopping choices. Among these, 2,031 shopping trips, made by 1,860 individualsliving in 1,444 households, had big boxes and power centers as their destination while4,395 shopping trips (4,151 individuals, 3,234 households) ended up at regional andsuper-regional shopping centers. Trip distribution for all types of retail facilities inthe QMA is displayed in Exhibit 1.
Locating Households and Trip Origins and Destinations
All spatial information is handled using a regional GIS (MapInfo software), assuggested by Thrall (1998). Every household has its home located on a 1�20,000 mapcombining street address, assessment role (location of specific buildings) andgeocoding with either addresses on the street network or 6-digit postal codes. Eachperson belongs to a specific household and is characterized by age, gender, occupation(worker, student, retired, unemployed, etc.) and ownership of a car driver license. Amulti-step programming approach was used to assign a family status for each memberof every household. Households were ultimately classified according to the followingcategories: lone person, childless couple, two-parent family, lone-parent family orother households. Socio-economic data—namely household income and educationlevel—derived from the 2001 census and seized at the neighborhood (disseminationarea) level are also integrated in the GIS. Census values are then assigned to surveyedhomes after information has been reshuffled according to a finer, hexagonal gridcomposed of 6,150 cells.
182 Journal of Real Estate Literature
VOLUME 14, NUMBER 2, 2006
The origin and destination points of each trip reported by respondents are located inspace using several geocoding methods that yield accurate spatial references at eitherthe building or city block level. Each trip is described by several attributes includingits purpose, transportation mode and departure time. No information on trip durationthough is provided via the O-D survey. Instead, it is estimated using an ad hoccomputational procedure linking the origin and destination points of each trip to thenearest street corner, selected among 20,262 local street corners throughout the QMA.This highly complex operation is designed via a GIS-operated topological streetnetwork made of 29,035 road segments linked through a total of 20,906 nodes (localstreet corners and highway connectors). Implemented within TransCAD GIS usingthe GISDK language (Theriault, Vandersmissen, Lee-Gosselin and Leroux, 1999). Theresulting network is designed so as to find the best route and compute, for eachreported trip, total length (kilometers) and duration (minutes).
Finally, firms operating in all classes of activities and services were identified andlocated using the ZipCom directory as well as the Quebec Land ManagementDirectory (1997), in combination with a variety of other data sources, among whichis the Quebec City assessment roll. Again, several months were necessary to developa reliable geocoding program.
Overall descriptive statistics for selected variables are displayed in Exhibit 2 whiledetailed absolute and relative frequencies for each type of retail outlet are reported inExhibit 3. It can be seen from Exhibit 2 that the clientele of big boxes is slightlyyounger (49 years old) than shopping centers’ (50 years old) while also benefitingfrom a better average household income ($56,400 vs. $54,400), although personalincome is lower. Both car trip distance (7.4 km) and duration (7.1 minutes) to bigboxes fall below those experienced for shopping centers (7.9 km vs. 7.4 minutes,respectively). As for Exhibit 3 statistics, they may be summarized as follows: quiteclearly, grocery-oriented trips are a dominant feature of big boxes’ business (37% ofcustomers), whereas traditional shopping centers feed on product diversity (84%).While both retail formats prove to be heavily car-dependent, this is particularly thecase with big boxes whose clientele is composed of car owners in a proportion of97%. Big boxes primarily attract men (48%) in their working life (76%) belongingto middle-income (42%) family households with workers (31%); their clienteleconsists of a high proportion of blue-collar workers (33%).
Research Hypothesis and Analytical Approach
Research Hypothesis
In this study, shopping trip patterns are examined so as to highlight the role thatvarious factors exert on consumers’ choices regarding both shopping location and typeof retail establishment. Thus, focus is put on access to retail facilities rather than onhouseholds’ purchase behavior as such.
As part of households’ daily trip practices (Bell and Lattin, 1998), shopping tripsdepend on the relationship between home, workplace and retail outlet location.

Big
Boxes
versusT
raditionalShopping
Centers:
Looking
At
Households’
ShoppingT
ripPatterns
183
Exhibit 2
Overall Descriptive Statistics by Type of Retail Outlet (continuous variables)
Variable
Big Boxes & Power Centers
Min. Max. Mean Std. Dev.
Regional & Super-Regional Shopping Centers
Min. Max. Mean Std. Dev.
Age of respondent (yr.) 5 85 48.8 16.0 5 95 50.1 18.1
Household income ($) 0 239.20 56.43 21.53 0 239.20 54.42 22.10
Income per person ($) 0 119.60 25.26 15.52 0 133.38 26.54 16.71
Car trip length (km) 0 59.01 7.24 6.7 0 57.63 7.91 6.8
Car trip duration (min) 0 42.10 7.1 5.3 0 45.00 7.41 5.3

184Journal
ofR
ealE
stateL
iterature
VO
LU
ME
14,N
UM
BE
R2,
2006
Exhibit 3
Frequencies by Categorical Variable and Type of Retail Outlet
Variables
Big Boxes
Frequency Percent
Shopping Centers
Frequency Percent
Total
Big Boxes%
Shopp. Centers%
Trip PurposeGrocery 752 37.0 213 4.8 77.9 22.1Restaurant 32 1.6 269 6.1 10.6 89.4Leisure 99 4.9 231 5.3 30.0 70.0Others 1,148 56.5 3,682 83.8 23.8 76.2
Transportation ModeCar 1,963 96.7 3,894 88.6 33.5 66.5Bus 14 0.7 328 7.5 4.1 95.9Foot 46 2.3 141 3.2 24.6 75.4Other 8 0.4 32 0.7 20.0 80.0
Household Car OwnershipWithout car or without driver 45 2.2 348 7.9 36.0 64.0Less than one car per driver 791 38.9 1,659 37.7 11.5 88.5One car per driver 1,146 56.4 2,301 52.4 33.2 66.8More than one car per driver 49 2.4 87 2.0 32.3 67.7
Day of WeekMonday, Tuesday and Wednesday 996 49.0 1,914 43.5 34.2 65.8Thursday and Friday 1,035 51.0 2,481 56.5 29.4 70.6
Time of Departure8 AM–6 PM 1,554 76.5 3,598 81.9 30.2 69.86 PM–12 PM 477 23.5 797 18.1 37.4 62.6
Departure PlaceResidence 1,250 61.5 3,075 70.0 28.9 71.1Work /School 138 6.8 435 9.9 24.1 75.9Other 643 31.7 885 20.1 42.1 57.9

Big
Boxes
versusT
raditionalShopping
Centers:
Looking
At
Households’
ShoppingT
ripPatterns
185
Exhibit 3 (continued)
Frequencies by Categorical Variable and Type of Retail Outlet
Variables
Big Boxes
Frequency Percent
Shopping Centers
Frequency Percent
Total
Big Boxes%
Shopp. Centers%
Car Trip Duration (min.)0 to 2.4 288 14.2 622 14.2 31.6 68.42.5 to 4.9 483 23.8 1,093 24.9 30.6 69.45 to 14.9 1,115 54.9 2,362 53.7 32.1 67.915 to 29.9 129 6.4 290 6.6 30.8 69.2� of 30 16 0.8 28 0.6 36.4 63.6
Car Trip Length (km)0.00–4.99 884 43.5 1,800 41.0 32.9 67.15–9.99 721 35.5 1,326 30.2 35.2 64.810–14.99 229 11.3 724 16.5 24.0 76.015–19.99 103 5.1 335 7.6 23.5 76.5� 20 94 4.6 210 4.8 30.9 69.1
Respondent’s GenderMan 978 48.2 1,672 38.0 36.9 63.1Woman 1,053 51.8 2,723 62.0 27.9 72.1
Respondent’s Age24 or less 150 7.4 495 11.3 23.3 76.725 to 64 1,540 75.8 2,830 64.4 35.2 64.865 and over 341 16.8 1,070 24.3 24.2 75.8
ProfessionBlue-Collar Worker 670 33.0 1,212 27.6 35.6 64.4Professional 264 13.0 486 11.1 35.2 64.8Student 130 6.4 418 9.5 23.7 76.3Pensioners 687 33.8 1,717 39.1 28.6 71.4Other 280 13.8 562 12.8 33.3 66.7

186Journal
ofR
ealE
stateL
iterature
VO
LU
ME
14,N
UM
BE
R2,
2006
Exhibit 3 (continued)
Frequencies by Categorical Variable and Type of Retail Outlet
Variables
Big Boxes
Frequency Percent
Shopping Centers
Frequency Percent
Total
Big Boxes%
Shopp. Centers%
Type of Household2 adults or more with workers 632 31.1 1,103 25.1 36.4 63.62 adults or more without workers 1,128 55.5 2,450 55.7 31.5 68.5Lone person or single-parent family without work 132 6.5 499 11.4 20.9 79.1Lone person or single-parent family with work 139 6.8 343 7.8 28.8 71.2
Household Income (Nbhd level Census data)Less than 40,000 $ /year 408 20.1 1,143 26.0 26.3 73.740,000 to 59,999 $ /year 856 42.1 1,700 38.7 33.5 66.560,000 to 79,999 $ /year 543 26.7 1,146 26.1 32.1 67.9More than 80,000 $ /year 224 11.0 406 9.2 35.6 64.4
Education Level (Nbhd level Census data)High school or less 225 11.1 443 10.1 33.7 66.3Collegial 1,460 71.9 3,055 69.5 32.3 67.7University 346 17.0 897 20.4 27.8 72.2
Big Boxes versus Traditional Shopping Centers: Looking At Households’ Shopping Trip Patterns 187
Understanding consumers’ preferences for a given shopping destination requires thatindividual and household socioeconomic profiles as well as outlet format be analyzed.In addition though, the geo-spatial environment of the retail area should also beaccounted for. In that respect, two types of relationships may exist between thesethree sets of factors. On the one hand, customers’ satisfaction results from theinteraction between retail outlet attributes and customer profiles may be partiallyexpressed through the outlet attendance rate. On the other hand, accessibility toshopping facilities is dependent on spatial determinants (Des Rosiers and Theriault,1996; Villeneuve et al., 2000; Vandersmissen, Villeneuve and Theriault, 2003;Theriault and Des Rosiers, 2003; Vandersmissen, Theriault and Villeneuve, 2004; andDes Rosiers et al., 2005).
In line with the literature, it can be stated that both residential areas and workplacesgrounds the competition between, on the one hand, big boxes and power centers and,on the other hand, regional and super-regional shopping centers. However, thiscompetition may be suspected to apply only to some specific market segments, jointlydefined by product range, mobility behavior and constraints and consumers’ individualand household attributes. Consequently, four research hypotheses are developed basedon trip purpose, transportation mode, trip attributes and customer profiles:
1. Trip Purpose: Considering the nature and marketing strategies of bigboxes, it can be assumed that these tend to attract consumers interestedin specific lines of products (hardware and renovation materials, furnitureand electronics, home furnishing) or in low-price, essential commodities(groceries, clothing). Since the O-D survey used here may only identifyfour trip purposes, namely grocery, restaurant, leisure and other products,the first hypothesis (H1) may be expressed as follows:
Hypothesis 1 (H1): The propensity to shop at big boxes is particularlystrong where trip purpose is grocery-oriented.
2. Transportation Mode: While car accessibility is central to both bigboxes and major shopping centers, the latter are also well served bypublic transport, which is not the case with the former. From thatstatement of fact, the second hypothesis (H2) may be derived as follows:
Hypothesis 2 (H2): Big box attendance is essentially car-oriented andconfined to car owning households.
3. Trip Attributes: Big boxes are usually open on weekdays until 9PMwhereas the vast majority of stores located in regional and super-regionalshopping centers close at 5PM from Monday to Wednesday. Therefore,it is not surprising, as shown in Exhibit 3, that the former exhibit a higherproportion of evening trips. More interesting though is the fact that bigboxes attract a higher share of trips originating from places other thanhome, workplace or school. This suggests that their attendance heavilydepends on trip-chaining activities, which has important implicationswith respect to the actual nature of the competition that prevails betweenbig boxes and traditional shopping centers. Hence the third hypothesis(H3):
188 Journal of Real Estate Literature
VOLUME 14, NUMBER 2, 2006
Hypothesis 3 (H3): Big boxes heavily feed on activities that generatetrip-chaining behavior (i.e., trips originating from places other than home,workplace or school).
4. Customer Profile: While household income and education level ofindividuals are derived from the Canadian census and therefore apply towhole residential neighborhoods, other attributes characterize either theO-D survey respondent (gender, age and profession) or its household(household composition). Considering the type of goods usually suppliedin big boxes and based on Exhibit 3 statistics, the fourth, and final,hypothesis (H4) may be expressed as follows:
Hypothesis 4 (H4): Male workers in their active life and belonging tomiddle-income family households of two or more persons are more proneto shop at big boxes than at traditional shopping centers.
These four research hypothesis are to be tested simultaneously using binomial logisticregression, as developed below.
Designing Location Polygons
As shown in Exhibit 4, each shopping center is located using polygons. In order toaccount for shopping trips resulting from agglomeration economies, polygons includea buffer zone that varies between 50 and 150 meters around the shopping centerbuilding. This buffer zone is designed so as to include smaller nearby stores, whichbenefit from customer traffic derived from the presence of the shopping center. As forpolygons pertaining to big boxes, they only include the parking area of each outlet.
Modeling Trip Patterns Using Binomial Logistic Regression
Considering that consumer store choice is a utility-maximizing decision process andthat the dependent variable is a categorical, dichotomous one, the binomial logisticregression method is the most appropriate here, as suggested by the literature.
The logistic regression method—or logit model—is designed to estimate theprobability of occurrence of a given event considering the values of a set ofquantitative and/or qualitative descriptive variables xj (Menard, 2001). The parametersof the logistic equation are estimated by maximizing log-likelihood functions (�2LL)7
whereby all possible combinations of the �0 . . . , �n parameters are computed todetermine which one maximizes the likelihood for the event to occur (Liao, 1994;and Menard, 2001).
The log odds for a given event are given by:
Pr(Response�x) Pr (Response�x) � x , . . . , X � x )1 k klog � log� � � �1 � Pr(Response�x) 1 � Pr(Response�x) � x , . . . , X � x )1 k k
k
� � � � x . (1)�0 j jj�1

Big
Boxes
versusT
raditionalShopping
Centers:
Looking
At
Households’
ShoppingT
ripPatterns
189Exhibit 4
Shopping Centers and Big Box Outlet Locations
Source: ZipCom Directory (2000) for the QMA.
190 Journal of Real Estate Literature
VOLUME 14, NUMBER 2, 2006
As for its probability of occurrence, it is expressed as:
kexp(� � � � x ) 10 j�1 j jPr(Response�x) � � . (2)k k1 � exp(� � � � x ) 1 � exp[� (� � � � x )]0 j�1 j j 0 j�1 j j
Finally, the probability assigned to the non occurrence of an event is derived from alogistic function with coefficients that have the same magnitude as in Equation (2),although with opposite signs:
1Pr(No Response�x) � . (3)k1 � exp[� (� � � � x )]0 j�1 j j
Both the probability and the log odds are a direct function of the �jxj. Thus, for �j �0, Pr(Response�x) will increase with xj, and vice versa.
The results obtained with a binomial logistic regression model may be interpreted asfollows (Liao, 1994; and Long, 1997):
� The goodness-of-fit of the model is given by the �2LL—or loglikelihood—value and by the Hosmer-Lemshow (H & L) test: the largerthe reduction in the �2LL value between the initial and final steps ofthe model and the weaker the H & L test,8 the better the fit. The Cox& Snell R2 as well as Nagelkerke R2 are also used as indications of themodel’s goodness-of-fit (explanatory power).9
� As for the overall predictive accuracy of the model (the equivalent ofthe SEE in standard OLS regression), it is given by the percentage ofcorrect predictions: the higher the percentage of correct predictions, thebetter the overall predictive accuracy of the model.
� The statistical significance of any independent variable is measuredthrough the Wald (W) statistic (the equivalent of the t value in standardOLS regression), which follows a chi-square distribution.
� The partial contribution of each independent variable to the explanationof the dependent variable is given by the odds ratio, expressed asExp(B).10 When applied to the different categories of a single variable,the odds ratio reflects the deviation with respect to the base, or reference,category: where above (below) the unity, an odds ratio indicates that theconditional probability of an event to occur increases (decreases) relativeto the reference category.
� Resorting to the logistic regression does not allow for VIFs (varianceinflation factors) to be computed or for any stepwise procedure to beused. The multicollinearity issue is dealt with through an iterativeapproach whereby closely related variables are alternately inserted into,and deleted from, the equation depending on their statistical significanceand overall impact on the stability of regression coefficients.

Big Boxes versus Traditional Shopping Centers: Looking At Households’ Shopping Trip Patterns 191
� Finally, it should be stressed that, in contrast with OLS requirements,neither the normality nor the homoscedasticity of model residuals is apre-requisite to applying logistic regression.
Explaining Customers’ Choices for Retail Outlets
In the logit model that follows, the dependent variable is defined as the probabilityfor customers to shop at big boxes as opposed to regional and super-regional shoppingcenters. Two sets of explanatory factors are used:
1. Spatiotemporal attributes of shopping trips from origin (home,workplace, etc.) to final destination (retail outlet): In this study, theshopping trip purpose, transportation mode and rate of motorization(number of cars per driver), departure time, day of the week, place ofdeparture, as well as trip length (km.) or duration (min.) have beenconsidered as potential determinants of shopping patterns and groupedinto four categories of variables: trip purpose, transportation mode, tripattributes and customer profile.
2. Socioeconomic and demographic profiles of individuals and households:These include respondent’s age, gender and professional occupation,education level, household type, number of adults as well as thehousehold average income for 2000.
The basic exponential function to be used in this paper can be written as:
(���*X ��*X ��*X ��*X ) (���*X ��*X ��*X ��*X )1 1 2 2 3 3 4 4 1 1 2 2 3 3 4 4� � e /1 � e , (4)
where � is the constant term, �1 to �4 are the coefficients of the predictor variablesand X1 to X4 are the vectors of independent variables pertaining to trip purpose (X1),transportation mode (X2), trip attributes (X3) and customer profile (X4). Since thelogistic regression is the logit transformation of �, Equation 4 may be expressed as:
Y � Logit [� (X )] � ln [� (X ) /1 � � (X )]i i i
� � � � *X � � *X � � *X � � *X . (5)1 1 2 2 3 3 4 2
Logistic Regression Main FindingsOverall Model Performances
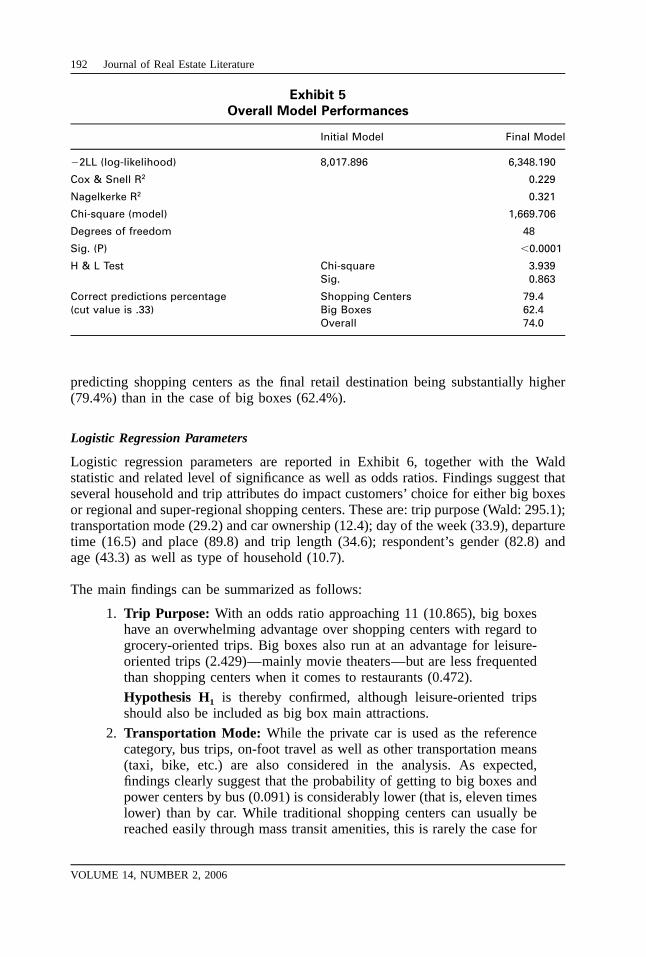
Overall model performances are reported in Exhibit 5. Considering that neither theprice nor the size of the ‘‘bundle of goods’’ is used as an explanatory variable in themodel, explaining between 23% and 32% of the variations in the dependent variableis most satisfactory.11 Moreover, the logit model displays a high statistical significancetogether with a marked decrease in the �2LL value in the process. The H & L testperforms well, indicating high goodness-of-fit throughout the probability range.Finally, correct predictions amount, overall, to 74% of cases, with the probability of
192 Journal of Real Estate Literature
VOLUME 14, NUMBER 2, 2006
Exhibit 5
Overall Model Performances
Initial Model Final Model
�2LL (log-likelihood) 8,017.896 6,348.190
Cox & Snell R2 0.229
Nagelkerke R2 0.321
Chi-square (model) 1,669.706
Degrees of freedom 48
Sig. (P) �0.0001
H & L Test Chi-square 3.939Sig. 0.863
Correct predictions percentage Shopping Centers 79.4(cut value is .33) Big Boxes 62.4
Overall 74.0
predicting shopping centers as the final retail destination being substantially higher(79.4%) than in the case of big boxes (62.4%).
Logistic Regression Parameters
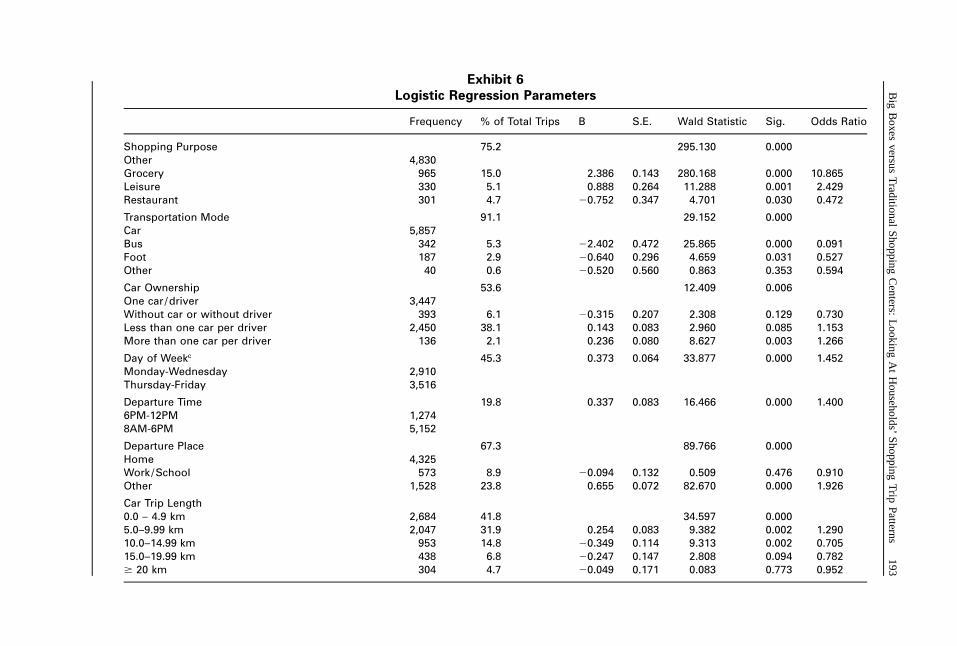
Logistic regression parameters are reported in Exhibit 6, together with the Waldstatistic and related level of significance as well as odds ratios. Findings suggest thatseveral household and trip attributes do impact customers’ choice for either big boxesor regional and super-regional shopping centers. These are: trip purpose (Wald: 295.1);transportation mode (29.2) and car ownership (12.4); day of the week (33.9), departuretime (16.5) and place (89.8) and trip length (34.6); respondent’s gender (82.8) andage (43.3) as well as type of household (10.7).
The main findings can be summarized as follows:
1. Trip Purpose: With an odds ratio approaching 11 (10.865), big boxeshave an overwhelming advantage over shopping centers with regard togrocery-oriented trips. Big boxes also run at an advantage for leisure-oriented trips (2.429)—mainly movie theaters—but are less frequentedthan shopping centers when it comes to restaurants (0.472).
Hypothesis H1 is thereby confirmed, although leisure-oriented tripsshould also be included as big box main attractions.
2. Transportation Mode: While the private car is used as the referencecategory, bus trips, on-foot travel as well as other transportation means(taxi, bike, etc.) are also considered in the analysis. As expected,findings clearly suggest that the probability of getting to big boxes andpower centers by bus (0.091) is considerably lower (that is, eleven timeslower) than by car. While traditional shopping centers can usually bereached easily through mass transit amenities, this is rarely the case for
Big
Boxes
versusT
raditionalShopping
Centers:
Looking
At
Households’
ShoppingT
ripPatterns
193Exhibit 6
Logistic Regression Parameters
Frequency % of Total Trips B S.E. Wald Statistic Sig. Odds Ratio
Shopping Purpose 75.2 295.130 0.000Other 4,830Grocery 965 15.0 2.386 0.143 280.168 0.000 10.865Leisure 330 5.1 0.888 0.264 11.288 0.001 2.429Restaurant 301 4.7 �0.752 0.347 4.701 0.030 0.472
Transportation Mode 91.1 29.152 0.000Car 5,857Bus 342 5.3 �2.402 0.472 25.865 0.000 0.091Foot 187 2.9 �0.640 0.296 4.659 0.031 0.527Other 40 0.6 �0.520 0.560 0.863 0.353 0.594
Car Ownership 53.6 12.409 0.006One car /driver 3,447Without car or without driver 393 6.1 �0.315 0.207 2.308 0.129 0.730Less than one car per driver 2,450 38.1 0.143 0.083 2.960 0.085 1.153More than one car per driver 136 2.1 0.236 0.080 8.627 0.003 1.266
Day of Weekc 45.3 0.373 0.064 33.877 0.000 1.452Monday-Wednesday 2,910Thursday-Friday 3,516
Departure Time 19.8 0.337 0.083 16.466 0.000 1.4006PM-12PM 1,2748AM-6PM 5,152
Departure Place 67.3 89.766 0.000Home 4,325Work /School 573 8.9 �0.094 0.132 0.509 0.476 0.910Other 1,528 23.8 0.655 0.072 82.670 0.000 1.926
Car Trip Length0.0 – 4.9 km 2,684 41.8 34.597 0.0005.0–9.99 km 2,047 31.9 0.254 0.083 9.382 0.002 1.29010.0–14.99 km 953 14.8 �0.349 0.114 9.313 0.002 0.70515.0–19.99 km 438 6.8 �0.247 0.147 2.808 0.094 0.782� 20 km 304 4.7 �0.049 0.171 0.083 0.773 0.952

194Journal
ofR
ealE
stateL
iterature
VO
LU
ME
14,N
UM
BE
R2,
2006
Exhibit 6 (continued)
Logistic Regression Parameters
Frequency % of Total Trips B S.E. Wald Statistic Sig. Odds Ratio
Gender 41.2 0.653 0.072 82.814 0.000 1.922Man 2,650Woman 3,776
Age 68.0 43.274 0.00025–64 years 4,370� 65 years 1,411 22.0 �0.510 0.089 32.880 0.000 0.600� 24 years 645 10.0 �0.413 0.118 12.352 0.000 0.661
Household Type2 adults or more with workers 1,735 27.0 10.718 0.0132 adults or more without workers 3,578 55.7 �0.219 0.078 7.871 0.005 0.804Lone-person or single-parent family with worker 482 7.5 �0.229 0.136 2.848 0.091 0.795Lone-person or single-parent family without workers 631 9.8 �0.376 0.144 6.780 0.009 0.687Constant �1.572 0.110 203.827 0.000 0.208
Note: Table is probabilities to shop at big boxes and power centers as opposed to regional and super-regional shopping centers.
Big Boxes versus Traditional Shopping Centers: Looking At Households’ Shopping Trip Patterns 195
newly erected big boxes that are mostly located ‘‘in the fields,’’ at somedistance from densely developed areas.
3. Car Ownership: As a corollary, the propensity to shop at big boxesincreases in households with more than one car per driver (1.266).Considering these outlets are relatively isolated from existingneighborhoods, the availability of a car, rather than its mere presence,is conditional to opting for such establishments.
Hypothesis H2 is thereby confirmed.
4. Day of the Week: Findings suggest that customers are more prone toend up in big boxes if they go shopping during the first half of theweek (Monday to Wednesday: 1.452) rather than on Thursdays andFridays, where shopping centers run at an advantage.
5. Departure Time: Big boxes are also more popular among eveningshoppers (1.400), that is between 6PM and 9PM. This comes as acorollary to the previous statement since the vast majority of retailestablishments in the Quebec Metropolitan Area are open until 9PM onThursdays and Fridays only.
6. Departure Place: Most interestingly, shopping at big boxes is almosttwice as popular among customers originating from places otherthan home (1.926) while departing from the workplace or learninginstitutions (0.910) tends to favor traditional shopping centers. Thissuggests that big boxes and power centers may feed on ‘‘trip chaining’’induced by nearby shopping centers, a conclusion that brings aboutimportant consequences with respect to location and marketingstrategies on both sides.
Hypothesis H3 is thereby confirmed.
7. Car Trip Length: Car trip distances standing between five and tenkilometers from the place of origin maximize the probability offrequenting big boxes and power centers (1.290). Both shorter andlonger trips tend to favor shopping centers. Such findings suggest thatthe dominant market area for big boxes and power centers is containedwithin a five to ten kilometer radius while that of shopping centers mayextend well beyond 20 kilometers.
8. Respondent’s Gender: While nearly 60% of all retail trips are madeby women, the odds for shoppers at big boxes to be males are almosttwo to one (odds ratio: 1.922). The relative dominance of this type ofretail outlet in the home renovation products sector may be broughtforward as part of the explanation.
9. Respondent’s Age:Active people, i.e., those aged 25–64, are moreprone than others to shop at big boxes, which may reflect the familystatus and needs of customers with children who favor low-price retailestablishments. Younger people (0.600) and the elderly (0.660), incontrast, clearly favor traditional shopping centers where entertainmentactivities can be found.
196 Journal of Real Estate Literature
VOLUME 14, NUMBER 2, 2006
10. Type of Household: Active family households, it seems, form moreoften than not the customer base for big box and power center outlets.Retirees (0.804) and even more so lone-person households or single-parent families, active (0.795) or not (0.687), typically prefer shoppingcenters, which provide not only a more diversified array of goods andservices, but also more social interaction opportunities.Hypothesis H4 is partly confirmed: if findings clearly suggest that maleworkers in their active life who are part of a family household show astrong propensity to shop at big boxes, nothing can be said about otherhousehold attributes, namely professional status of respondent as wellas level of education and average household income in residentialdissemination area. These were tested but did not emerge as significantdeterminants of shopping behavior.
Therefore, no conclusion may be drawn from this study as to how socio-economicfactors affect shopping trip patterns.
ConclusionIn this paper, the competition between, on the one hand, regional and super-regionalshopping centers and, on the other hand, big boxes and power centers is analyzedusing discrete choice modeling (logistic regression). Thanks to an extensive Origin-Destination phone survey carried out in the Quebec Metropolitan Area in 2001 thatprovides detailed information on respondents’ daily trip patterns and household profile,it is possible to identify and model customers’ shopping choices with respect to theretail format they favor. Four hypotheses are tested pertaining to shopping trippurpose, transportation mode, trip attributes and customer profile. The findings suggestthat several trip and household attributes impact customers’ choice for either big boxesor traditional shopping centers: transportation mode and car ownership; day of theweek, departure time and place and trip length; respondent’s gender and age as wellas type of household.
Overall, big boxes and power centers typically attract male workers between 25 and64 years of age who are part of a family household with more than one car. Theyalso hold an overwhelming advantage over traditional shopping centers with respectto grocery and leisure-oriented car trips, particularly where these are made in the firstpart of the week (Monday to Wednesday), during evening hours. Quite interestingly,shopping at big boxes is more popular among customers originating from places otherthan home, the workplace or learning institutions. This suggests that big boxes andpower centers may feed on ‘‘trip chaining’’ induced by nearby shopping centers, aconclusion that brings about important consequences with respect to location andmarketing strategies on both sides. Finally, the dominant market area for big boxesand power centers seems to be confined within a five to ten kilometer radius fromdeparture place while that of regional and super-regional malls may extend wellbeyond 20 kilometers.
Findings emerging from this study provide most useful insights into the understandingof customers’ retail format choice process. They tend to confirm that the competition

Big Boxes versus Traditional Shopping Centers: Looking At Households’ Shopping Trip Patterns 197
between big boxes and traditional shopping centers operates in a selective way, withspecific types of goods and specific clienteles being targeted. In that respect, theinteraction of household profiles with trip purpose, mode and attributes helps sortingout conditional probabilities to opt for a given type of retail establishment, whichcorroborates the usefulness and originality of the approach used here. This being said,there are substantial limits to the current O-D survey methodology. Considering thatthe vast majority of shops and services in the Quebec Metropolitan Area have longbeen opened seven days a week and that weekend retail and leisure trips now accountfor a high proportion of all non-work and non-school oriented trips, the inability ofO-D surveys to account for weekend trips remains a major drawback which ought tobe remedied. The issue, however, is under study and could soon be settled.
If, as it seems, big boxes capture a significant share of regional and super-regionalshopping centers’ sales in specific segments of the retail market, the latter willeventually experience a downturn in their profitability, hence in their market value.Strategic moves are therefore needed on the part of shopping centers’ owners andmanagers if such a consequence is to be avoided. Retail mix optimization throughfocusing on top-of-the-range, fashion-driven, goods and services is one of the possibleresponses to counter competition from big boxes and power centers. Extendingopening hours is another one: as the recent try in that direction by Quebec’s shoppingcenter operators showed though, this solution may be challenged by tenants whoseturnover cannot support hiring additional staff on weekday evenings where they runat a loss. Whatever the solution put forward to fight back, it will probably involverevisiting the relationships between shopping center landlord/managers and thetenants.
A second issue raised by this study concerns the location strategy of big boxes withrespect to existing regional and super-regional shopping centers. As suggested by thefindings, big boxes benefit from multi-purpose trips, particularly from trips originatingfrom other retail outlets. In other words, big boxes and shopping centers, while incompetition, could also be assumed to be complementary while both formats takeadvantage of agglomeration economies generated through nearby retail complexes.Whether these giant competitors should get closer or keep each other at a distanceneeds further investigation.
Endnotes
1. In this paper, ‘‘big boxes’’ also account for ‘‘power centers,’’ which consist of groupingsof big boxes on a single location.
2. Under the ‘‘strict utility’’ theory developed by Luce (1959), it is assumed that individualshave a fixed preference structure, which is deterministic in nature and engenders a constantdecisional rule. This theory can be considered as intermediate between a purelydeterministic, gravitational approach and a probabilistic one.
3. In 2000, 54 neighborhood, 23 community, 3 regional and 3 super-regional shopping centerswere numbered in the QMA, occupying roughly 28.8 million square feet of land with 2,485shops.

198 Journal of Real Estate Literature
VOLUME 14, NUMBER 2, 2006
4. Both the Urban Land Institute (2000) and the International Council of Shopping Centers(2004) provide an operational definition of regional and super-regional shopping centers:(1) Regional shopping centers provide a great variety of general merchandises, apparel,furniture and home furnishings, as well as a range of services and recreational facilities.They are built around one or two full-line department stores of generally not less than50,000 square feet each. Their typical size is about 500,000 square feet of gross leasablearea; in practice, it may range from 250,000 to more than 900,000 square feet. (2) Whileoffering an even greater selection of goods and services, super-regional centers are builtaround three or more full-line department stores of generally not less than 75,000 squarefeet each. The typical size of a super-regional center is about 1,000,000 square feet of grossleasable area but may range from about 500,000 to more than 1,500,000 square feet.
5. These centers are: Place Laurier, Galeries de la Capitale, Place Fleur de Lys, Place Ste-Foy, Place de la Cite and Galeries Chagnon, with the latter located on the south shore ofthe Saint Lawrence River.
6. For a detailed description of both the O-D survey methodology and the geocodingprocedures used to locate households as well as trip origins and destinations, see DesRosiers and Theriault (2003).
7. The reason why the log-likelihood is multiplied by a factor of �2 is that is so doing, ithas approximately a �2 distribution (Menard, 2001).
8. The Hosmer-Lemshow test is a deciles-of-risk statistic, which evaluates goodness of fit bycreating ordered groups of subjects and then comparing the number actually in each groupwith the number assigned to each group by the logistic regression model (Tabachnick andFidell, 1996:598). Since it tests the statistical significance of the between-group differences,the weaker the test the better the fit of the model estimates.
9. According to Menard (2001), another measure of the goodness-of-fit may be obtained bydividing the model’s chi-square by the initial �2LL value.
10. Exp(B) (or odds ratio) is defined as the exponent to which e must be raised to obtain the
slope. Odds can be converted into probabilities as follows: Y � .Odds
1 � Odds
11. Menard’s (2001) pseudo R2, as computed according to Endnote 9, stands at 0.259.
References
Adamowicz, W., J. Louviere and M. Williams, Combining Revealed and Stated PreferenceMethods for Valuing Environmental Amenities, Journal of Environmental Economics andManagement, 1994, 26:3, 271–92.Arentze, T., A. Borgers and H. Timmermans, A Model of Multi-Purpose Trip Behavior, RegionalScience, 1993, 72:3, 239–56.Arnold, S. J., H. O. Tae and D. J. Tigert, Determinant Attributes in Retail Patronage: Seasonal,Temporal, Regional and International Comparisons, Journal of Marketing Research, 1983, 20,149–57.Arnold, S. J. and M. L. Luthra, Market Entry Effects of Large Format Retailers: A StakeholderAnalysis, International Journal of Retail and Distribution Management B, 2000, 28:4/5, 139–54.Baker, G. R., Towards a Dynamic Aggregate Shopping Model and its Applications to RetailTrading Hour and Market Area Analysis, Regional Science, 2000, 79, 413–34.

Big Boxes versus Traditional Shopping Centers: Looking At Households’ Shopping Trip Patterns 199
Barber, C. S. and B. C. Tietje, A Distribution Service Approach for Developing EffectiveCompetitive Strategies Against ‘‘Big Box’’ Retailers, Journal of Retailing and ConsumerServices, 2004, 11, 95–107.Bell, D. R., T.-H. Ho and C. S. Tang, Determining Where to Shop: Fixed and Variable Costsof Shopping, Journal of Marketing Research, 1998, 35:3, 352–69.Bell, D. R. and J. M. Lattin, Shopping Behaviour and Consumer. Preference for Store PriceFormat: Why ‘‘Large Basket’’ Shoppers Prefer EDLP?, Marketing Science, 1998, 17:1, 66–88.Ben-Akiva, M. and S. R. Lerman, Discrete Choice Analysis, Cambridge, MA: MIT Press, 1985.Beyard, M. D. and W. P. O’Mara, Shopping Center Development Handbook, Third edition,Washington, D.C.: Urban Land Institute, 1999.Bhat C. R., Analysis of Travel Mode and Departure Time Choice for Urban Shopping Trips,Transportation Research Part B, 1998, 32:6, 361–71.Bhat, C. R., S. Srinivasan and K. W. Axhausen, An Analysis of Multiple Interepisode DurationsUsing A Unifying Multivariate Hazard Model, Transportation Research Part B, 2005, 39:9,797–823.Borgers, A. W. J. and H. J. P. Timmermans, Model Specification. Substitution and SpatialStructure Effects: A Simulation Experiment, Regional Science and Urban Economics, 1987, 17,29–47.Burt, S., Trends in the Internationalisation of Grocery Retailing: The European Experience,International Review of Retail, Distribution and Consumer Research, 1991, 1:4, 487–515.Burt, S., J. Dawson and L. Spraks, Failure in International Retailing: Research Propositions,International Review of Retail, Distribution and Consumer Research, 2003, 13:4, 355–73.Carliner, S., Big Boxes and Shoppertainment: More Lessons for Web Design from Mall andRetail Design. http: / /www.boxesandarrows.com. (September 23, 2002).Christaller, W. Central Place in Southern Germany, Trans, C. W. Baskin, (1966) EnglewoodCliffs, N.J.: Prentice-Hall, Inc., 1933.Des Rosiers, F. and M. Theriault, Rental Amenities and the Stability of Hedonic Prices: AComparative Analysis of Five Market Segments, Journal of Real Estate Research, 1996, 12:1,17–36.——., Origin-Destination Surveys and Retail Market Analysis, Geospatial Solutions, November,2003, 46–51.Des Rosiers, F., M. Theriault and L. Menetrier, Spatial versus Non-Spatial Determinants ofShopping Center Rents: Modeling Location and Neighborhood-Related Factors, Journal of RealEstate Research, 2005, 27:3, 293–319.Downs, R. M., The Cognitive Structure of a Shopping Center, Environment and Behavior, 1970,2, 13–39.Dudey, M., Competition by Choice: The Effect of Consumer Search on Firm LocationDecisions, The American Economic Review, 1990, 80:5, 1092–1104.Eppli, M. J. and J. D. Benjamin, The Evolution of Shopping Center Research: A Review andAnalysis, Journal of Real Estate Research, 1993, 9:1, 5–32.Fader P. S. and G. S. Hardie, Modeling Consumer Choice Among SKUs, Journal of MarketingResearch, 1996, 33:4, 442–52.Fotheringham, A. S., Consumer Store Choice and Choice Set Definition, Marketing Science,1988, 7:3, 299–310.Gautschi, D. A., Specification of Patronage Models for Retail Center Choice, Journal ofMarketing Research, 1981, 18, 162–74.Gensch, D. H. and W. W. Recker, The Multinational, Multiattribute Logit Choice Model,Journal of Marketing Research, 1979, 16:1, 124–33.Geocom, Survey on the Expansion of Big Boxes and Power Centers in the MontrealMetropolitan Area, August 2003.

200 Journal of Real Estate Literature
VOLUME 14, NUMBER 2, 2006
Ghosh, A., Parameter Nonstationarity in Retail Choice Models, Journal of Business Research,1984, 12, 425–36.Gober, P. K. E. McHugh and D. Leclerc, Job-Rich but Housing-Poor: The Dilemma of a WesternAmenity Town, The Professional Geographer, 1993, 45, 12–20.Gobillon, L., H. Selod and Y. Zenou, Spatial Mismatch: From the Hypothesis to the Theories,Working Paper # 693, IZA :Bonn, Germany, 2003.Gonzalez-Benito, O., Overcoming Data Limitations for Store Choice Modelling. ExploitingRetail Chain Choice Data by Means of Aggregate Logit Models, Journal of Retailing andConsumer Services, 2002, 9, 259–68.Grantz, R. B. and N. Mintz, Cities Back from the Edge, New York: Preservation Press, 1998.Gripsrud, G. and O. Horverak, Determinants of Retail Patronage: A ‘‘Natural’’ Experiment,International Journal of Research in Marketing, 1986, 3:4, 263–72.Guy, C. M., Recent Advances in Spatial Interaction Modelling: An Application to theForecasting of Shopping Travel, Environment and Planning A, 1987, 19, 173–86.Guy, C. M., Internationalisation of Large-Format Retailers and Leisure Providers in WesternEurope: Current Constraints and Opportunities, 23rd Applied Geography Conference, Charlotte,NC, 1999.Hoch, S. J., B. D. Kim, A. L. Montgomery and P. E. Rossi, Determinants of Store-Level PriceElasticities, Journal of Marketing Research, 1995, 32, 12–29.Huff, D. L., Defining and Estimating a Trading Area, Journal of Marketing, 1964, 28:3, 34–8.International Council of Shopping Centers, Shopping Centers Definition, 2004, In: http: / /www.icsc.org/Jones, K. and M. Doucet, Big-Box Retailing and the Urban Retail Structure: The Case of theToronto Area, Journal of Retailing and Consumer Services, 2000, 7, 233–47.Kau, A. K. and A. S. C. Ehrenberg, Patterns of Store Choice, Journal of Marketing Research,1984, 21, 399–409.Leon, P.-Y. and J. Philippe, Comportements des Consommateurs Dans l’espace Metropolitain:Arbitrages Entre Center-ville etPperipherie Commerciale. Communication in EuropeanMarketing Conference at Universita Ca’Foscari Venezia (Italy), 2000.Liao, T. F., Interpreting Probability Models: Logit, Probit, and Other Generalized Linear Models,Sage University Papers, Series on Quantitative Applications in the Social Sciences 07-101,Thousand Oaks, CA: Sage, 1994.Lindquist, J. D., Meaning of Image, Journal of Retailing, 1974, 50:4, 29–38.Long, J. S., Regression Models for Categorical and Limited Dependent Variables, Sage:Advanced Quantitative Techniques in the Social Sciences, 96, 1997.Louviere, J. J. and G. J. Gaeth, Decomposing the Determinants of Retail Facility Choice Usingthe Method of Hierarchical Information Integration: A Supermarket Illustration, Journal ofRetailing, 1987, 63, 25–48.Louviere, J., D. Hensher and J. Swait, Conjoint Preference Elicitation Methods in the BroaderContext of Random Utility Theory Preference Elicitation Methods. In Gustafsson, Herrmannand Huber (Eds.), Conjoint Measurement: Methods and Applications, Berlin: Springer, 279–318, 1999.Luce, R., Individual Choice Behaviour, New York: Wiley, 1959.Limanond, T., and D. A. Niemeier, Effect of Land Use on Decisions of Shopping TourGeneration: A Case Study of Three Traditional Neighbourhoods, Transportation, 2004, 31:2,153–81.May, E. G., Product Positioning and Segmentation Strategy: Adaptable to Retail Stores?, InStampfl and Hirschman (Eds.), Theory in Retailing: Traditional and Nontraditional Sources,American Marketing Association, Chicago, 144–53, 1981.
Big Boxes versus Traditional Shopping Centers: Looking At Households’ Shopping Trip Patterns 201
Mejia, L. C. and J. D. Benjamin, What Do We Know About the Determinants of ShoppingCenter Sales? Spatial vs. Non-Spatial Factors, Journal of Real Estate Literature, 2002, 10:1,3–26.Menard, S., Applied Logistic Regression. Second Edition. Series: Quantitative Applications inthe Social Sciences. Thousand Oaks, CA Sage University Papers, 106, 2001.Mulhern, F. J. and R. Leone, Retail Promotional Advertising Do the Number of Deal Items andSize of Deal Discounts Affect Store Performance?, Journal of Business Research, 1990, 21,179–94.Nakanishi, M. and L. G. Cooper, Parameter Estimation for a Multiplicative CompetitiveInteraction Model-Least Squares Approach, Journal of Marketing Research, 1974, 11, 303–11.Nevin, J. R. and M. J. Houston, Image as a Component of Attractiveness to Intra-UrbanShopping Areas, Journal of Retailing, 1980, 56, 77–93.Prosperi, D. C. and H. J. Schuler, An Alternative Method to Identify Rules of Spatial Choice,Geographical Perspectives, 1976, 38, 33–8.Recker, W., and H. Schuler, Destination Choice and Processing Spatial Information: SomeEmpirical Tests with Alternative Constructs, Economic Geography, 1981, 57, 373–83.Reilly, W., Methods for the Study of Retail Relationships, University of Texas Bulletin #2944,1929.Schuler, H. J., A Disaggregate Store-Choice Model of Spatial Decision Making, ProfessionalGeographer, 1979, 31, 146–56.Severin, V., J. L. Jordan and A. Finn, The Stability of Retail Shopping Choice Over Time andAcross Countries, Journal of Retailing, 2001, 77, 185–202.Simmons, J. and S. Kamikihara, Commercial Activity in Canada: 2000. Centre for the Studyof Commercial Activity, Ryerson Polytechnic University: Toronto, 2001.Solgaard, H. S. and T. Hansen, A Hierarchical Bayes Model of Choice Between SupermarketFormats, Journal of Retailing and Consumer Services, 2003, 10, 169–80.Swait, J. and W. Adamowic, Choice Environment, Market Complexity, and Consumer Behavior:A Theoretical and Empirical Approach for Incorporating Decision Complexity into Models ofConsumer Choice, Organizational Behavior and Human Decision Processes, 2001, 86:2, 141–67.Swait, J. and T. Erdem, The Effects of Temporal Consistency of Sales Promotions andAvailability on Consumer Choice Behavior, Journal of Marketing Research, 2002, 39:3, 304–20.Swait, J. and J. Louviere, The Role of the Scale Parameter in the Estimation and Use ofMultinomial Logit Models, Journal Marketing Research, 1993, 30, 305–14.Tabachnick, B. G. and L. Fidell, Using Multivariate Statistics, Third Edition, New York: HarperCollin College Publication, 1996.Theriault, M. and F. Des Rosiers, Modelling Perceived Accessibility to Urban Amenities UsingFuzzy Logic, Transportation GIS and Origin-Destination Surveys, Communication at the 10th
European Real Estate Society Conference, Helsinki, Finland, June, 2003.Theriault M., F. Des Rosiers and F. Joerin, Modelling Accessibility to Urban Services UsingFuzzy Logic: A Comparative Analysis of Two Methods, Journal of Property Investment andFinance, 2005, 23:1, 22–54.Theriault, M., M. H. Vandersmissen, M. Lee-Gosselin and D. Leroux, Modelling CommuterTrip Length and Duration within GIS: Application to an O-D Survey, Journal for GeographicInformation and Decision Analysis, 1999, 3:1, 41–55.Thill, J-C. and H. J. P. Timmermans, Analyse des Decisions Spatiales et du Processus de Choixdes Consommateurs: Theorie, Methodes et Exemples d’Applications, L’Espace Geographique,1992, 2, 143–66.Thorne, S., Powering up Canadian Centers: Consumers Turn Big-Box Outlets into an Engineof Growth, Shopping Centers Today, 1999, June 1.
202 Journal of Real Estate Literature
VOLUME 14, NUMBER 2, 2006
Thrall, G. I., Common Geographic Errors of Real Estate Analysts, Journal of Real EstateLiterature, 1998, 6:1, 45–54.Timmermans, H., X. van der Hagen X. and A. Borgers, Transportation Systems, RetailEnvironments and Pedestrian Trip Chaining Behaviour: Modelling Issues and Applications,Transportation Research Part B, 1992, 26:1, 45–59.Timmermans, H. J. P., Consumer Choice of Shopping Centre: An Information IntegrationApproach, Regional Studies, 1982, 16, 171–82.——., Multipurpose Trips and Individual Choice Behaviour: An Analysis Using ExperimentalDesign Data, In Golledge and Timmermans (Eds.), Behavioural Modelling in Geography andPlanning. London: Croom Helm, 1988.Uncles, M. D. and A. S. C. Ehrenberg, Patterns of Store Choice: New Evidence from the USA,In Wrigley (Eds.), Store Choice, Store Location and Market Analysis, London: Routledge, 272–99, 1988.Urban Land Institute, Developing Retail Entertainment Destination, Second Edition, UrbanLand Institute: Washington D.C., 2000.Vandersmissen, M. H., M. Theriault and P. Villeneuve, What About Effective Access to Carsin Motorized Households?, The Canadian Geographer/Le Geographe Canadien, 2004, 48:4,488–504.Vandersmissen, M. H., P. Y. Villeneuve and M. Theriault, Analyzing Changes in Urban Formand Commuting Times, The Professional Geographer, 2003, 55:4, 446–63.Villeneuve, P., M. H. Vandersmissen and M. Theriault, Comparing Self-reported and ComputedTrip-length. Communication presented at Canadian Regional Association Meeting, Toronto,2000.Wang, D., J. Li and H. Timmermans, Measuring Bifurcation Point in Choice Behavior:Principles and Illustration, Environment and Planning A, 2004, 36, 1125–38.Weisbrod, G. E., R. J. Parcells and C. Kern, A Disaggregate Model for Predicting ShoppingArea Market Attraction, Journal of Retailing, 1984, 60, 65–83.Wrigley, N. and R. Dunn, Stochastic Panel-Data Models of Urban Shopping Behaviour: 1.‘‘Purchasing at Individual Stores in a Single City,’’ Environment and Planning A, 1984a, 16,629–650.——., Stochastic Panel-Data Models of Urban Shopping Behaviour: 2. Multistore PurchasingPatterns and the Dirichlet Model, Environment and Planning A, 1984b, 16, 759–78.Wrigley, N., The Globalization of Retail Capital: Themes for Economic Geography, In Clark,Gertler and Feldman (Eds.), Handbook of Economic Geography, Oxford: Oxford UniversityPress, 292–313, 2000.Yuo, T. S-T., N. Crosby, C. Lizieri and P. McCann, Tenant Mix Variety in Regional ShoppingCentres: Some UK Empirical Analyses, Working Papers in Real Estate & Planning 2/04,University of Reading Business School, 2004.ZipCom, Quebec Metropolitan Area Business Directory. CRAD: Laval University, Quebec,2000.
This research was funded by the Canadian SSHRC (Social Sciences and HumanitiesResearch Council) under both Team and Major Collaborative Research Initiative grantsprograms. The authors are grateful to Quebec City’s Assessment division for giving accessto assessment role as well as to Quebec Province’s Ministry of Transport and Reseau deTransport de la Capitale (RTC) for giving access to O-D surveys.