Social barriers to meaningful engagement in biology field trip group work

Universidade do Minho
FIELD TRIP GUIDEBOOK
3rd International Meeting of Fire Effects on SoilProperties
Editors:António Bento Gonçalves, António Vieira
Authors:António Bento Gonçalves, António Vieira,Flora Ferreira Leite, Luciano Lourenço,Hermínio Botelho, Paulo Fernandes,Xavier Úbeda, Artémio Cerdà

28
4. Forest Fires in the Portuguese northwest
António Bento Gonçalves ([email protected]), António Vieira
([email protected]) and Flora Ferreira Leite ([email protected])
Centro de Estudos em Geografia e Ordenamento do Território (CEGOT), Núcleo de Investigação em Geografia
e Planeamento (NIGP), Departamento de Geografia, Minho University, Campus de Azurém, 4800-058
Guimarães (Portugal)
Centro de Estudos em Geografia e Ordenamento do Território (CEGOT), Núcleo de Investigação em Geografia
e Planeamento (NIGP), Departamento de Geografia (Ph.D. Student), Minho University, Campus de Azurém,
4800-058 Guimarães (Portugal)
The number of occurrences of forest fires and the scorched areas in the Portuguese
northwest is remarkably high. In the period from 1990 to 2009 there were a total of 206423
occurrences, representing 43,7% of the total occurrences on the national level. However, in
relation to the area scorched by forest fires the same period registered a total of 387395
hectares, which represented only 16,01% of the total area scorched in the whole of the
Portuguese territory for the period under consideration (Table I and Figure 1).
TABLE I – Historical record of the number of forest fires occurrences and scorched areas
(hectares) in the Portuguese northwest in the period of 1990 – 2009
Year Number of fires Scorched forest area
(ha)
Scorched
Shrubland área
(ha)
Total
Scorched area
(ha)
1990 5049 11219 5062 16281
1991 5867 2434 4461 6895
1992 6476 1753 4047 5800
1993 9179 4689 9013 13702
1994 6207 1329 3623 4952
1995 14657 12307 18263 30570
1996 13489 7380 14394 21774
1997 10394 5087 6530 11617
1998 16136 16482 19851 36333
1999 9492 3871 4069 7940
2000 12667 10245 11162 21407
2001 11947 6671 8405 15076
2002 12228 9191 12225 21416
2003 13465 7462 6204 13666
2004 9760 5601 10773 16374
2005 15688 43663 31869 75532
2006 9025 13940 20705 34645
2007 7772 2882 6605 9487
2008 4394 1009 1946 2955
2009 12531 8245 29218 37463
Total 206423 175460
228425 403885
Source: AFN, 2010

29
Source: AFN, 2010
Figure 1 – Evolution of the annual number of forest fire occurrences and total scorched area
in the Portuguese Northwest in the period of 1990 – 2009
Just as was case in the national context, the years of 1998 and 2005 registered the
highest number of occurrences in the northwest region, with 16136 and 15688 respectively.
The reduction of occurrences in the years between 2005 and 2008 (presenting the lowest
value in the 19 year period under analysis) are worth signalling. This tendency was inverted in
2009. Nevertheless, we can confirm a tendency, though slightly attenuated (R2=5,8%) for the
rise in the number of occurrences (Figure 2).
Source: AFN, 2010
Figure 2 – Evolution of the annual number of forest fire occurrences and tendency line for the
Portuguese northwest for the period of 1990 - 2009
Regarding the area scorched in the northwest region, the years 1998, 2005, 2006, and
2009 registered higher values and it is interesting to note that while 2003 had the highest

30
value at the national level, in regional terms it presented a rather diminished area. For the
northwest 2005 witnessed the largest area scorched. 2008 stands out as the lowest value for
this time series (Figure 3).
Source: AFN, 2010
Figure 3 – Evolution of the total scorched area (ha) in the Portuguese northwest for the period
1990-2008
The area of the settlements scorched annually is marked by annual variations which
vary from a minimum of 1009 ha (in the year 2008) to a maximum of 43663 ha (in 2005). The
year 2005 is an exception since it recorded unusually high values for the region (Figure 4).
Source: AFN, 2010
Figure 4 – Evolution of the scorched areas of settlements (ha) and tendency line for the
Portuguese northwest for the period 1990-2009
By analyzing the tendency line we can observe the existence of a positive correlation
between the scorched settlement areas and the temporal evolution. More precisely, we can
verify a tendency for augmentation of the scorched areas in the long run. However, the square

31
of the correlation coefficient (R2) indicates that only 4,86% of that growth can be correlated
with the temporal evolution (Figure 4).
The area of shrubland scorched anally varies considerably. The lowest value was 1946
ha in 2008, which contrasted to the 31869 ha of 2005. Since 1993, only fiver years lowered
under 500 ha (1991, 1992, 1994, 1999, and 2008). 2005 registered the highest value in the
series with 31869 ha, while 2008 revealed the lowest value with 1946 ha. There is also a
tendency for the area of shrubland scorched to augment over time. The correlation between
the temporal evolution and the referred to scorched areas (R2) is 17,09% (Figure 5).
Source: AFN, 2010
Figure 5 – Evolution of the scorched area of shrublands (ha) and tendency line in the
Portuguese northwest for the period 1990-2009
In summary, an annual variability of the scorched areas (settlements and shrublands) is
verified. Equally, the forest fires also display an annual variability. Nevertheless, there is a
tendency in the long run for a rise in the scorched areas and number of occurrences.
The value of the scorched areas and the number of occurrences of a particular year do
not seem to influence the value of the following year (APIF/ISA, 2005). This estocastic
behaviour can be explained in part by the variability of the meteorologic conditions of the
summer season.
The geographic distribution of the forest fires in the Portuguese northwest is não even.
The number of occurrences is higher in the more urban municipalities. There is a positive
correlation between the number of occurrences and the number of inhabitants (APIF/ISA,
2005).
The distribution of the scorched areas in the northwest is also charactized by a accentuated
difference between the coastal and central municipalities and the more interior municipalities.
This distinction is evident when we analyze the maps of the scorched areas of the region for
the period between 1990 and 20096 (Figure 6). Here we can verify that the more interior,
mountainous municipalities, with their demographic debilities and the predominance of forest
areas over the other land uses (Figure 1, 2.Mountain wild spaces in Portuguese northwest),
present more extensive scorched areas, contrary to the distribution pattern of the forest fire
occurrences.
6 Information provided in shapefile format for Arcview by AFN.
32
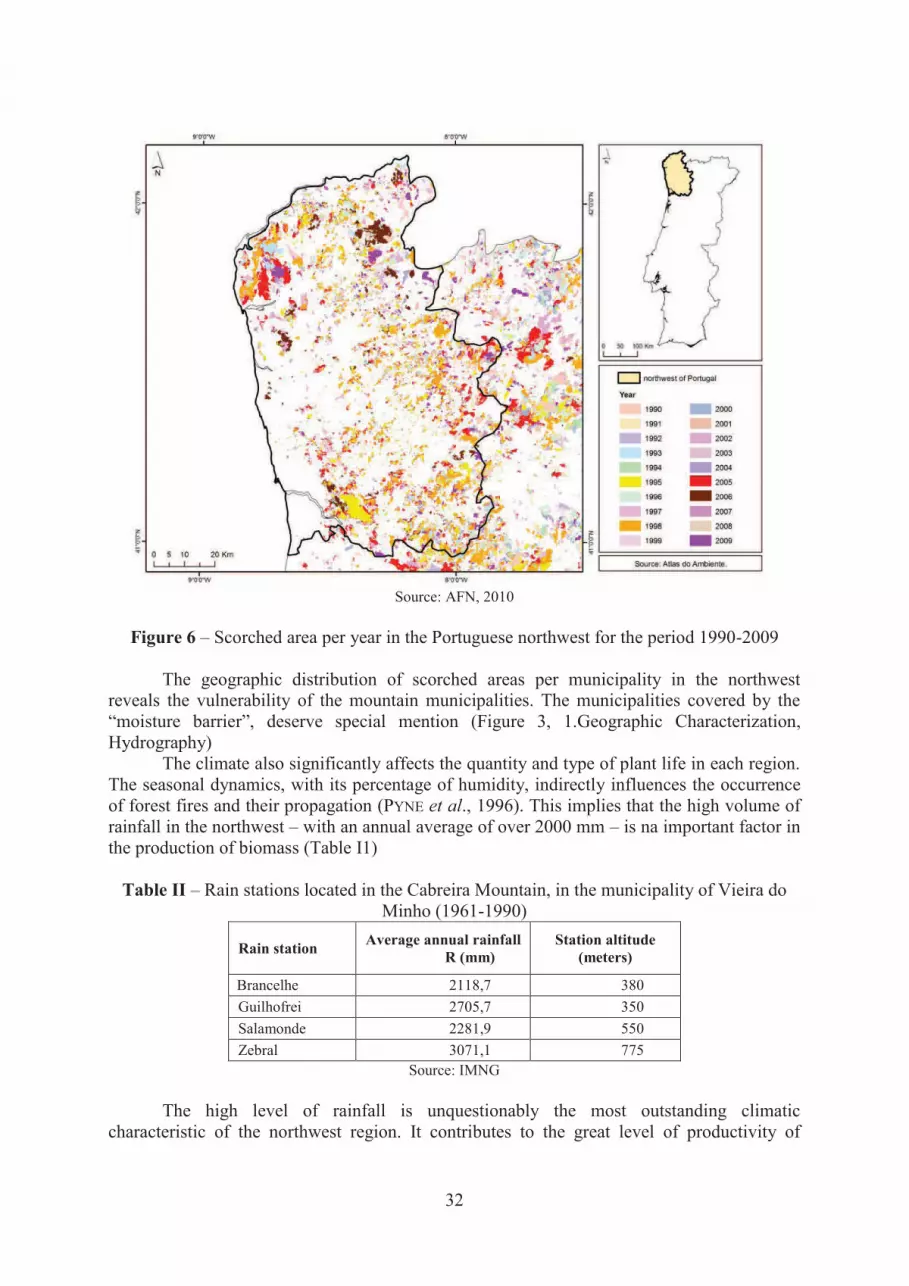
Source: AFN, 2010
Figure 6 – Scorched area per year in the Portuguese northwest for the period 1990-2009
The geographic distribution of scorched areas per municipality in the northwest
reveals the vulnerability of the mountain municipalities. The municipalities covered by the
“moisture barrier”, deserve special mention (Figure 3, 1.Geographic Characterization,
Hydrography)
The climate also significantly affects the quantity and type of plant life in each region.
The seasonal dynamics, with its percentage of humidity, indirectly influences the occurrence
of forest fires and their propagation (PYNE et al., 1996). This implies that the high volume of
rainfall in the northwest – with an annual average of over 2000 mm – is na important factor in
the production of biomass (Table I1)
Table II – Rain stations located in the Cabreira Mountain, in the municipality of Vieira do
Minho (1961-1990)
Rain station Average annual rainfall
R (mm)
Station altitude
(meters)
Brancelhe 2118,7 380
Guilhofrei 2705,7 350
Salamonde 2281,9 550
Zebral 3071,1 775
Source: IMNG
The high level of rainfall is unquestionably the most outstanding climatic
characteristic of the northwest region. It contributes to the great level of productivity of

33
biomass of the region and, consequently, making the municipalities with the larger forest
areas (generally the more mountainous) more vulnerable to the progression of fires.
The demographic situation of the northwest has an incontestable direct influence in the
“forest protection” in that the aging population in the rural areas and the concentration in the
main urban centres contribute to significant spatial imbalances. This implies an abandonment
of the agricultural areas and forests in the interior areas with the consequent lack of
management of these spaces and the growth of the combustible load (PNDFCI, 2005). Due to
this reality and to a climate the auspicious to the production of biomass, the shrub layer
spilled over into the agricultural fields transforming them in shrublands which then are
dominated by forest spaces that are more vulnerable to the occurrence of forest fires
(LOURENÇO, 2006).
As a result, the high production of biomass, the abandonment of the rural space, and,
in particular, the mountain areas with their inherent problems and physical and social
disadvantages (BENTO GONÇALVES 2006), generate conditions which are favorable to the
rapid propagation/progression of forest fires. More precisely, the mountain areas are subject
to a plethora of conflicts that result from a series of opposing interests – e.g., land use,
coexistence between the rural life and urban visitors, cattle grazing and property rights,
hunting, etc. – which make fighting fires more difficult and contribute to the extension of the
scorched areas (BENTO GONÇALVES et al., 2009).
The reincidence of fires in the same places is, in part, also due to the aspects above.
The maps on the spatial distribution of the reincidence of scorched areas in the
Portuguese northwest for the period 1990-2008 confirms the high vulnerability of some of
these spaces to forest fires (Figure 7).
Figure 7 – Reincidence of scorched areas in the Portuguese northwest in the period 1990-
2008

34
We can verify that this region presents areas with a level of maximum incidences
equal to that registered for the national level (8).
Of the total area of the northwest (785565,7 ha), 222648,5 ha, representing 28,3% of
the region, have been scorched at least once. Of those spaces (222648,5 ha), 15,4%,
corresponding to 121452,1 he were scorched only once. 8,2% of the total scorched area in the
northwest were scorched only twice and 3,1% were scorched at least three times. The areas
scorched more than three times are very few. Records show that areas scorched residual
values for areas scorched four (1,1%), five (0,45), six (0,08%), seven (0,01%), and even eight
times (0,002%) (TABLE III e IV)
TABLE III - Scorched Area (ha) and percentage of scorched area in relation to the total area
of the Portuguese Northwest in the period 1990-2008
Scorched
Area
(ha)
Scorched Area
/Total Area
(%)
Total Area Scorched 222648,5
28,3
Non-scorched Area 562917,2 71,7
Total Area 785565,7 100
TABLE IV – Scorched Area (ha) and percentage of scorched area in relation to the total area
of the Portuguese northwest in accordance with the number of times scorches in the period
1990 – 2008
Scorched Area
(N. of Times)
Scorched Area
(ha)
Scorched Area
/ Total Area
(%)
Scorched Area/
Total Scorched Area
(%)
Only Once 121452,1 15,4 54,5
Only Twice 64540,4 8,2 29,0
Only Three Times 24302,2 3,1 11,0
Only Four Times 8832,1 1,1 4,0
Only Five Times 2758,4 0,4 1,2
Only Six Times 659,8 0,08 0,3
Only Seven Times 85,4 0,01 0,04
Only Eight Times 18,1 0,002 0,008
Total 222648,5 28,3 100
While comparing the distribution of the area of the Portuguese northwest with the area
of Portugal, in terms of the degree of forest fire incidences, we can verify that the total area of
scorched land is higher in the northwest (28,3%/19,6%). The same hold true for the area
effected by a fist incidence – i.e., 15,4% in the northwest and 14,4% in Portugal. It is after the
first incidence that we can verify greater differences. In fact, the northwest registers, in
percentage, a higher number value of scorched areas for the higher degrees of incidence. It is
noteworthy to highlight the fact that the percentage of areas scorched eight times registers a
value of 0,002%, in the northwest in comparison to the national value of 0,0002% (Figures 8
and 9).

35
Figure 8 – Distribution of the area of the
Portuguese northwest (%) by degree of
forest fire incidences in the period 1990-
2008
Figure 9 - Distribution of the area of the
Portuguese mainland (%) by degree of
forest fire incidences in the period 1990-
2008
References
Agência para a Prevenção de Incêndios Florestais (APIF) e Instituto Superior de Agronomia
(ISA) (2005) - Plano Nacional de Defesa da Floresta contra Incêndios, Estudo técnico I,
Diagnóstico, Visão e Objectivos Estratégicos, Lisboa.
Bento-Gonçalves, A.; Vieira, A.; Martins, C.; Ferreira-Leite, F.; Costa, F. (2009) – “A criação
de Garranos na serra da Cabreira (Vieira do Minho) e o uso do fogo”. GEO-Working
Papers, nº. 2009/1, Guimarães, p. 96.
Lourenço, L. (2006b) – “Paisagens de socalcos e riscos naturais em vales do rio Alva”. VI
Colectâneas Cindínicas, NICIF/ Faculdade de Letras da Universidade de Coimbra, 188 p.
Pyne, S.; Andrews, P.; Laven, R. (1996) – Introduction to Wildland Fire, Jonhn Wiley &
Sons, New York.
WEB
Autoridade Florestal Nacional - http://www.afn.min-agricultura.pt/portal/dudf
Copyright © 2022 FDOKUMEN