
Cost-effective management of a eutrophicated sea in the presence of uncertain technological...
32
WORKING PAPER 01/2014 Cost-effective management of a eutrophicated sea in the presence of uncertain technological development and climate change Gren, Ing-Marie Lindqvist, Martin Economics Sveriges lantbruksuniversitet, Institutionen för ekonomi Working Paper Series 2014:01 Swedish University of Agricultural Sciences, Department of Economics Uppsala 2014 ISSN 1401-4068 ISRN SLU-EKON-WPS-1401-SE Corresponding author: [email protected] _____________________________________________________________________________________________
Transcript of Cost-effective management of a eutrophicated sea in the presence of uncertain technological...
WORKING PAPER 01/2014
Cost-effective management of a eutrophicated sea in the
presence of uncertain technological development and climate
change
Gren, Ing-Marie Lindqvist, Martin Economics
Sveriges lantbruksuniversitet, Institutionen för ekonomi Working Paper Series 2014:01 Swedish University of Agricultural Sciences, Department of Economics Uppsala 2014
ISSN 1401-4068 ISRN SLU-EKON-WPS-1401-SE Corresponding author: [email protected] _____________________________________________________________________________________________

2
Cost-effective management of a eutrophicated sea in the presence of uncertain technological development and climate change
Abstract We analyse effects of uncertain climate change and technological development on cost-
effective abatement of nitrogen and phosphorus for a eutrophied sea. A dynamic model is
developed which accounts for differences in the sea’s adjustment to the loads of the two
nutrients, uncertainty in climate change effects with probabilistic constraints on nutrient pool
targets, and uncertain technological development in a mean-variance framework. The analytical
results show that introduction of uncertainty increases abatement costs but that the effect on
marginal abatement cost differ for the two types of uncertainty. Marginal abatement cost is
increased by technological uncertainty but decreased by the reduction in the risk discount of
climate change uncertainties. It is also shown that abatement along the optimal time path is
delayed by the introduction of technological uncertainty, but made earlier when considering
climate change uncertainty. An application to the eutrophied Baltic Sea indicates that climate
change and technological development can reduce total abatement cost by 1/3, but also increase
it considerably when uncertainty is included.
Key words; cost-effectiveness, nutrients, climate change, technological development,
uncertainty, Baltic Sea
JEL: D99; O13; Q52; Q53; Q54
Department of Economics Institutionen för ekonomi Swedish University of Agricultural Sciences (SLU) Sveriges lantbruksuniversitet P.O. Box 7013, SE-750 07 Uppsala, Sweden Box 7013, 750 07 Uppsala Ph. +46 18 6710 00, Fax+ 46 18 67 35 02 Tel. 018-67 10 00, fax 018 67 35 02 www.slu.se www.slu.se www.slu.se/economics www.slu.se/ekonomi
1. Introduction
Eutrophication of coastal marine waters is globally considered to be a serious environmental problem
(e.g. Gilbert et al., 2007; Heisler et al. 2008). It is caused by unbalanced and excessive loads and pools of
nutrients, which create damages from eutrophication, such as increased frequency of harmful algal
blooms, sea bottom areas without biological life, cyanobacteria, and decreases in water transparency and
populations of commercial fish species. These environmental damages were realized in mid 1970s and
manifested by the implementation of different types of abatement measures directed mainly towards
households’ and the industry’s discharges into the seas (see Elofsson et al. 2003 and Rabotyagov et al.
2014 for reviews). However, in spite of these measures and development of new abatement technologies
such as construction of nutrient traps in drainage basins, damages have aggravated because of excessive
nutrient loads mainly from agriculture. Further degradation is expected from climate change effects on
nutrient pools and on biological activities which may require more stringent and expensive eutrophication
policies. On the other hand, further technological development can make nutrient abatement less
expensive. However, impacts of both climate change and technological development are uncertain, and
the perceived abatement cost then depends also on society’s attitudes towards these risks. The purpose of
this study is to calculate cost effective management of a eutrophied sea under conditions of uncertain
climate change effects and technological development. The study is applied to the Baltic Sea, which is
regarded as the most damaged sea in the world (e.g. Elmgren and Larsson, 2001; Conley et al., 2009).
Climate change is likely to have direct effect on a sea and indirectly through alterations in
nutrient loads from the drainage basins (e.g. Kabel et al., 2012). Direct effects occur through
increases in pH in seawater, biological activities, and nutrient pools. Nutrient pools, in turn, are
determined by several processes, denitrification, nitrogen fixation, and nutrient sedimentation
and burial, which are affected by nutrient loads from the catchment. Changes in precipitation and
temperature affect runoff of nutrients from the catchment to the sea, but also the nutrient
retention in the catchment, which may counteract the effects of nutrient runoff alteration. These
changes in nutrient loads and the sea’s responses may need revisions of nutrient load targets,
4

which can be made more or less stringent. The net effect on abatement costs of climate change
then depends on these two climate change forces, i.e. on nutrient pools and targets, which can
either counteract or reinforce each other.
In this study we consider climate change effects on both nutrient pools and target, and a safety-first
decision framework is applied when including uncertainty in these effects. Targets are formulated as
maximum future nutrient pools which are to be obtained at minimum cost and with a minimum
probability. This, so-called chance-constraint programming, has an old tradition in economics and has
been applied to, among others, food supply and water quality management (e.g. Shortle 1990; Kataria et
al., 2010). There is also a large literature on the economics of technological development (see e.g. Carraro
et al., 2010 for a review). We use the learning by doing approach, where costs decline over time as firms
gain experience in using a technology. Learning by doing is most often described as a function of the
production process where repetition of the process leads to efficiency gains, but can also occur through
abatement activities, since cutting back on emissions usually means that new, cleaner technologies are
adopted (Rosendahl, 2004). Uncertainty in technological development is treated in a mean-variance
framework where the objective function includes mean and variance in total abatement costs.
Our study is mostly related to the empirical literature on economics of eutrophication. Starting in
mid1990s there is by now a relatively large body of literature on cost effective or efficient nutrient load
reductions to eutrophied sea. To the best of our knowledge, only two studies evaluate effects of climate
change, Gren (2010) and Lindqvist et al. (2012), and one considers implications of technological
development (Lindqvist and Gren, 2013). Most studies calculate cost effective or efficient allocation of
abatement among the riparian countries in a deterministic setting (Gren et al., 1997, 2013; Elofsson, K.,
2006, 2007; Ollikainen and Hokatukla 2001, Laukanen and Huhtala 2008; Laukanen et al. 2009; Ahlvik
and Pavlova, 2013). The focus is often on optimal nutrient management in one drainage basin including
only agriculture (Hart and Brady, 2002, Hart 2003) or this sector together with sewage treatment
(Elofsson, 2006; Helinet al., 2008; Laukkanen and Huhtala, 2008; Laukkanen et al., 2009). However,
none of the studies applied on eutrophication in a sea consider uncertain climate change effects and
5

technological development. On the other hand, this combination of uncertainties has been applied to
energy policy in a dynamic context (Held et al, 2009; Schmidt et al., 2011) who use a similar approach as
in this study by assigning probabilistic constraints on emission targets. In our view, this paper extends the
literature on dynamic management of eutrophied seas and lakes by adding uncertain climate change
effects and technological development.
The study is organised as follows. First, the model is presented, which is followed by an analysis of the
properties of cost effective solutions. The model is applied to the Baltic Sea in Section 4, and the paper
ends with a concluding section.
2. A simple dynamic model for dynamic cost effectiveness
The numerical dynamic model builds on Gren et al. (2013), but adds climate change and endogenous
technical change under conditions of uncertainty. Total load of a nutrient to a sea, EtL with E=N,P
where N is nitrogen and P is phosphorus, is the sum of discharges from all countries i=1,..,n is written as
business-as-usual (BAU) loads, EitI , , minus abatement, Ei
tA , , according to
Ei
tiEt LL ,∑= (1)
where Eit
Eit
Eit AIL ,,, −= .
The response mechanisms and time required for the sea’s adjustments to the loads described by eq. (1)
differ between nutrients. Phosphorus is cycling in the sea due to biotic activity, but is also sequestered in
the sediment pool in normal oxygen conditions. Under conditions of oxygen deficit, part of this
sequestered phosphorus can be released into the water body and returned into the cycle. In addition to
similar biotic cycling, nitrogen is denitrified into harmless nitrogen gas and, thus, removed from the
cycling, but can also be supplied to the Baltic Sea by the nitrogen-fixing cyanobacteria, under appropriate
conditions. These adjustment mechanisms may result in a non-linear system with associated difficulties of
6

identifying optimal abatement paths (e.g. Mäler et al. 2003). Furthermore, the responses of nitrogen and
phosphorus cycles are connected. For example, reductions in phosphorus pools may decrease the nitrogen
fixation by cyanobacteria (e.g. Savchuk and Wulff 2009). However, these connections are poorly
understood in quantitative terms, and we therefore assign simple linear relations between stock of nutrient
E in period t+1, EtS 1+ , and prior period t and nutrient load, which is written as:
Et
Et
EEt LSS +−=+ )1(1 α (2)
EE SS =0
Following Gren et al. (2013) targets are set on maximum nutrient pools in a certain period, ETK , which are
expected to bring about desired improvements in water transparency, algal blooms, and populations of
commercial fish. in turn. Climate change is then assumed to affect both nutrient stocks in each period of
time, EtS , and the target, E
TK . We assign simple representations of these effects by assuming
multiplicative impact of climate change on EtS , 0>Eφ , and on E
TK , 0>Eγ . When 1=Eφ and
1=Eγ there is no climate change impact. For parameter values below(above) unity climate change
implies a decline(increase) in nutrient pools and a reduction(increase) in the acceptable nutrient pools in
the target year. The net effect is then either a reduction or an increase in total abatement cost for achieving
the target.
Both climate change parameters are assumed to be normally distributed with an average of E,φµ and
variance E,φσ for Eφ , and E,γµ and E,γσ for Eγ . When decision makers hold relatively strong
aversion against deviations from a target or threshold safety-first decision rules can be particularly useful.
The safety first criteria can, in turn, be formulated in different ways, which in general give rise to
different outcomes (e.g. Pyle and Turnovsky, 1970). This paper makes use of the safety –first criterion
originally suggested by Tesler (1955) which allows for the adoption of relatively easy and accepted
decision rules, minimization of costs under emission constraints, where the emission constraint is
7

formulated in probabilistic terms. It is then required that the predetermined nutrient pool targets, ETK ,
must be achieved with a minimum level of a chosen probability )1 ,0(∈Eβ , which is written as
ET
EET
E KS γφ ≤ , and EET
EET
E KSprob βγφ ≥≤ )( (3)
Similar probabilistic target formulations have been made in several studies in environmental economics;
water quality management (Shortle, 1990; Byström et al. 2000; Elofsson, 2003; Kataria et al. 2010),
biodiversity protection (Gren et al., 2013), and climate change (Held et al., 2009; Gren et al. 2012). We
follow this literature and apply chance-constrained programming for translating the restriction in (3) into
a deterministic framework, which allows for relatively easy numerical solutions (e.g. Taha, 2007). The
probability restriction in equation (3) can then be written as
EE
ET
EET
E
E
ET
EET
EET
ET KSKSKSprob β
σµµ
σµµ λφλφ
≥
−−≤
−−−2/1
,,
2/1
,,
)()(0
)()(
(3’)
where ),(2)( ,2,2 EEET
ET
EET
EET
ET
EET
EE CovKSKSKSVar γφσσγφσ γφ −+=−= . The term
2/1,,
,,
)()(
EE
ET
EET
EET
ET KSKS
γφ
λφ
σσµµ
+−−−
shows the number of standard errors, Eψ , that ET
ET KS − deviates
from the mean values. By the choice of Eβ , there is a level of acceptable deviation, E,βψ , and the
expression within brackets in (3’) then holds only if
ET
EEEET
E KS ,2/1,, γβφ µσψµ ≤+ (4)
Expression (4) shows the effects on costsof climate change impacts through the nutrient pool constraints.
The minimum cost can be reduced under climate change impacts, which occurs when 10 , << Eφµ and
1, >Eγµ , i.e. when the nutrient pools are reduced and the targets are revised upwards. On the other hand,
the existence of uncertainty in one or both of the climate impacts results in increased cost when E,βψ >0.
8
Following Bramoulle and Ohlsson (2005) endogenous technical change is described by accumulation of
knowledge through abatement and an initial knowledge stock, iH 0 . It is assumed that knowledge is
created by the sum of abatement of both nutrients, which is often the case for several technologies
involving land use changes, such as cultivation of catch crops or construction of wetlands. The
accumulated knowledge in period t, itH , is then written as
Eit
t
Eii
t AHH ,00 ∑∑ =
+=τ
(5)
Abatement cost in each period of time is assumed to exhibit economy of scope where the cost of
simultaneous abatement of both nutrients, NitA , and Pi
tA , , for achieving specific nutrient targets is lower
than separate abatement, i.e. )()(),( ,,,, Pit
iNit
iPit
Nit
i ACACAAC +< (e.g. Panzar and Willig 1981;
Baumol et al. 1988). Further, the cost depends on the accumulated knowledge described by equation (5).
The cost function is thus written as
ii
tPi
tNi
tii
t HAACC ,,, ))(,( θ−= (6)
where ),( ,, iii N θθ σµθ = is the learning elasticity in absolute terms, which shows the percentage
decrease in costs from one percentage increase in abatement accumulation.
3. Properties of cost-effective solutions
The decision problem is now specified as choosing the allocation of abatement among countries and time
periods that minimises total control cost for achieving the targets defined by equation (4), which is written
as
( )iCiittEit
CMin σηρ +∑∑∑ (7)
s.t. (1)-(6)
9
where tρ is the discount factor, ,i
tC is expected cost, and iη is a measurement of risk aversion. The
variance in costs is found from a second order Taylor expansion, which gives
θθ σσ 22,, )ln(),()( ttEi
tEi
tii
tC HHAACCVar
i −− −== .
The first-order conditions for a cost effective solution are obtained by solving for ETS in equation (2),
formulating the Lagrangian, and differentiating with respect to EitA , , which deliver
∂∂
+∂∂
=
∂∂
+∂∂
− 2/1
,,
,
,
,,
)21
Eit
EE
Eit
ET
EETEi
t
Ci
Eit
it
t AAS
AAC
i
σψ
µλσηρ β
φ
(8)
where
( )∑ +−−−−
−∂
∂=
∂∂ T
tiEiEiii
tEit
Eit
Eit
i
Eit
it HAACH
AAAC
AC ),1(,,,
,
,,
, ),(),( θ
τττθ θ , (9)
( ))1(ln)()ln(),(
21 2,,),1(2
,,
,,
, −+−∂
∂=
∂∂ −+−−
−
∑ it
EiEiiT
ti
tititEi
t
Eit
Eit
i
Eit
C
HAACHHHA
AACA
i
ττθθ
θ θσ
σ , (10)
1,, )1( +−−−=
∂∂ ∑ τφ αµ TET
tE
Eit
ET
AS
, (11)
11
, )1()),(2( +−−−+−=
∂∂ ∑ τφ αγφσσ TET
tEEE
TETEi
t
E
CovKSA
E
, (12)
ETλ are Lagrange multipliers for the restrictions on nutrient concentrations, and –E denotes the other
nutrient. The first-order condition in (8) states simply that a cost-effective solution occurs where the
marginal cost of achieving the nutrient pool target is equal to ETλ for all countries. The terms at each side
of (8) include marginal impacts on uncertainty; on future development of costs from accumulated
abatement at the left-hand side and on the pool target at the right-hand side. The condition thus shows that
10
a marginal abatement increases mean and variability in abatement but contributes with a reduction in
mean and variance in nutrient pools.
The first term at the left-hand side of (9) is the marginal abatement cost without consideration of effects
on technological development, which is positive. The second term is negative and shows the decline in
future costs due to technological development from a marginal abatement in time t. However, the
marginal effect on variance in costs is clearly positive, which can be seen from equation (10). The signs
of marginal effects on the mean and variance in nutrient pools in equations (11) and (12) are also
unambiguously negative, but the magnitude depends on the climate impact parameter E,φµ ; the lower the
parameter the smaller is the impact.
With respect to the derivation of optimal development of abatement over time, the full-fledged condition
in (8) does not lend itself to an easy interpretation, and we therefore investigate the optimal paths under
different simplifications. In the most simple case, without technological development and uncertainty, the
optimal development of abatement over time is guided by
)1(1
,,1
1EEi
t
it
Eit
it
AC
AC
αρ −=
∂∂
∂∂
+
+ (13)
According to (13), abatement is delayed because of the discount factor and of the self-cleaning capacity.
The discount rate reduces future costs of abatement, and the self-cleaning capacity allows for the use of
‘free’ nutrient pool decrease. The inclusion of technological development, but not uncertainty, changes
the condition to
( ) ( ))1(
1),1(,,1
),1(,1,
1E
T
tiii
tEit
iT
tiii
tEit
i
HCHACHCH
AC
αρθθ θ
τθθ
τθ
−=
−
∂∂
−
∂∂ ∑∑ +−−
++−−
++
(14)
Let us for the moment assume that the derivative of θ−tH with respect to Ei
tA , is zero. The first term in
the numerator and denominator at the left-hand side of (14) is then positive, and for a given marginal
abatement cost, a larger cost decrease is obtained from technological development in period t+1 since
11

i
ti
t HH ,,1
θθ −−+ < for Ei
tEA ,
1+∑ >0. This, in turn, reinforces the delay in abatement caused by the discount
rate and self-cleaning capacity shown at the right-hand side of (14). On the other hand, abatement is made
earlier when including the second term in the numerator and denominator since Ei
ti
tEi
ti
t AHAH ,1
,1
,, // +−+
− ∂∂>∂∂ θθ because of the longer time period that the marginal abatement acts on
cost decreases from technological development. Depending on the relative magnitude of these two forces,
optimal abatement is either delayed or made earlier compared with the optimal abatement path without
technological development.
Adding uncertainty in nutrient pools in time T does not affect the optimal path since the effect on
)( ETSVar makes no difference as shown at the right hand side of (13). Both Ei
tET AS ,/ ∂∂ and
Eit
ET ASVar ,/)( ∂∂ are driven by the same time developments, see equations (11) and (12). However,
since the target stringency increases by the risk discount in nutrient pool variability (eq. 4), there is a need
for more abatement than under deterministic conditions when 0, >Eβψ . This, in turn, implies larger
abatement in the starting period under uncertainty. Uncertainty in target setting has the same impact; it
will not affect the optimal rate of abatement during time but only the starting levels.
The introduction of uncertainty in the learning elasticity will affect the optimal rate of abatement during
time. The expression for optimal development path then becomes quite involved. In order to develop
some analytical result we therefor make the same assumption as above that EitE
it
it AHH ,
11 ++ ∑=− , and
then differentiate Eit
it ACVar ,/)( ∂∂ with respect to t in (12) which gives
+
∂∂
−−=
∂
∂ −−+
+− ∑ )1(2)ln1(2/)(
,),1(2
1),1(
, dtdH
AC
dtdH
HHCHdtA
CVard
it
Eit
iiti
ti
tit
T
ti
tEit
it θθσ θθθ (15)
1ln0 ><dt
dHHfor
iti
tθ
12

Thus, the effect of uncertainty in the development in learning rate is likely to delay abatement over time
compared with the deterministic case. Relatively early abatement creates more abatement over a longer
period of time during which costly uncertainty can act.
The main conclusions from this theoretical analysis are thus that the introduction of climate change
increase or decrease total abatement cost depending on the impact on nutrient pool, and technological
development reduces overall costs. The optimal timing of abatement is either delayed or made earlier
depending on climate change impact, and on the relation between cost reductions of technological
development from implemented and future abatement. The effects of introducing uncertainty are
unambiguous; total costs are increased and abatement made earlier because of climate change uncertainty
and delayed due to technological development uncertainty. Uncertainty in nutrient pools and targets
increase costs through the need of more abatement in order to reach a minimum probability of achieving
average targets. An uncertain learning elasticity increases the variation in future costs and thereby total
cost for risk-averse agents.
4. Application to the Baltic Sea
The Baltic Sea is the largest brackish water sea, but also the sea with the largest areas of dead sea bottoms
caused by eutrophication (Conley et al., 2009). This is not a new finding; signs of damages from
eutrophication were detected already in the 1960s, and an international administrative body Helcom was
established in 1974 in order to monitor status of the sea and coordinate mitigation actions. Since then,
three international governmental agreements on nutrient load reductions have been signed (Helcom 1988;
2007; 2013). All agreements are supposed to be based on desired improvements in the functioning of the
sea, such as less frequency of toxic algal blooms, larger populations of commercial fish, and water
transparency, but only one of them presents required reductions in the nutrient pools (Helcom, 2007),
which are reported in Gren et al. (2013). We therefore apply out model to this agreement. The latest
agreement from 2013 contains only modest changes in nutrient load reductions, and the calculations will
therefore be valid also for this agreement.
13

4.1 Data retrieval
The study makes use of data on abatement costs from Gren et al. (2008) and on nutrient transports in the
sea from Gren et al. (2013). The Gren et al. (2008) study includes data on nutrient loads from different
sources (atmospheric deposition, agriculture, industry, and households) in each country, and on
abatement costs for different measures reducing loads from these sources. More precisely, the abatement
measures are: increased nutrient cleaning capacity at sewage treatment plants, catalysts in cars and ships,
flue gas cleaning in stationary combustion sources, and reductions in the agricultural deposition of
fertilisers and manure, change in spreading time of manure from autumn to spring, cultivation of so
called catch crops, energy forests, ley grass, and creation of wetlands. A change of spreading time from
autumn to spring implies less leaching since, in spring, there is a growing crop which utilises the
nutrients. Catch crops refer to certain grass crops, which are drilled at the same time as the ordinary
spring crop but the growth, and thereby the use of remaining nutrients in the soil, is concentrated to the
period subsequent to the ordinary crop harvest.
A pseudo-data approach is used for obtaining parameter values on quadratic abatement cost functions,
where data on abatement costs and nutrient reductions are obtained by Monte Carlo simulations with cost
effective solutions of 500 random combinations of nitrogen and phosphorus reductions for each of the
riparian countries. The cost-effective solutions are calculated by use of the programming model described
by Gren et al. (2008). The ordinary least square estimator is then applied for the estimation of coefficients
in a quadratic cost function for nitrogen and phosphorus for each country, see Appendix. This approach
for deriving cost functions in each time period assumes that cost effective reductions of nitrogen and
phosphorus are implemented in each country.
There are no data on risk aversion in abatement costs for the riparian countries, which are needed for
calculating cost of uncertainty in technological development. It is, however, generally agreed that the
constant relative risk aversion (CRRA) for market risks ranges between 1 and 10, although it can be lower
and higher (eg. Azar, 2010). We assume an average CRRA of 5 and calculate a constant absolute risk
aversion (CARA) for each country, which is evaluated at the mean GDP/capita.
14

Table 1: BAU loads of nitrogen and phosphorus loads, abatement cost functions, and risk premium in riparian countries. Country Nitrogen,
kton1 Phos Phorus, kton1
Parameter values2 in the cost function
Pit
iNt
iPit
iNit
ii AAcAbAaC ,2,2, −+= ai bi ci
CARA3
Sweden 74 1.6 3.57 1576.63 20.89 0.019 * 10-3
Poland 318 22.0 0.35 94.01 3.18 0.091 * 10-3 Finland 49 1.7 5.65 2089.23 16.68 0.020 * 10-3 Denmark 44 1.1 0.29 1945.18 58.83 0.016 * 10-3 Germany 46 0.5 4.95 11836.62 149.80 0.023 * 10-3 Estonia 56 1.6 1.27 1394.43 31.44 0.068 * 10-3 Latvia 44 3.0 3.61 1021.82 45.30 0.093 * 10-3 Lithuania 93 3.5 0.78 511.14 13.15 0.094 * 10-3 Russia 83 4.0 2.90 340.17 17.36 0.116 * 10-3 Total 824 38.9 1 Gren et al. (2008) Table 1; 2Appendix, Table A2; 3Constant absolute risk aversion calculated from an assumed relative risk aversion of 5 and evaluated at the mean GDP in 2008.
There is a relatively large body of literature estimating learning elasticities which is applied on
manufacturing and energy technologies (e.g. McDonald and Schrattenholzer, 2001, Rasmussen, 2004;
Jamasb, 2007). However, there is no study considering all the different abatement technologies included
in Gren et al. (2008), which constitute a mix of mature, emerging and new technologies with different
learning elasticities. Jamasb (2007) carried out estimates of a combination of different technologies for
electricity provision, with a range of 0.03 to 0.21. We use an average of 0.12 in this study, and by
assumption of a normal distribution, the standard deviation for a confidence interval of 0.95 is 0.045. The
coefficient of variation is then 0.38.
Data on nutrient pools and carry over rates are obtained from simulations with an oceanographic model
(Savchuk and Wulff 2007, 2009) for consistent estimates of nutrient pools and self-cleaning capacities,
which are reported in Gren et al. (2013). The carry-over rates vary for different marine basins of the
Baltic Sea. We calculated a weighted average for the entire Baltic Sea from the basin specific carry-over
rates and nutrient pools reported in Gren et al. (2013), where the pools constitute weights. In a similar
15

vein, targets as measured in average nutrient pools reductions are calculated as the weighted average of
reductions in Gren et al. (2013).
Quantification of impacts on nutrient pools from climate changes is not readily available. Instead, there is
a relatively large body of literature on the estimation of impacts on nutrient discharges from single
drainage basins in the catchment (see compilation of studies in Lindqvist et al., 2013). The general
approach is to use a regional Baltic Sea model, the so-called Rosby Centre Atmosphere Ocean Model
(RCAO), for simulating impacts of different climate change scenarios obtained from two global
circulation models, at the Hadley Centre, United Kingdom and Max Planck Institute for Metrology in
Germany which are used for setting the boundary conditions which drive the regional RCAO-model.
Each global model applies two different CO2 emission scenarios, high and low emissions, obtained from
the Intergovernmental Panel on Climate Change (IPCC). This results in four different climate change
scenarios with a high or a low future CO2 level and with boundary conditions from one of two different
global general circulation models. The results show different impacts on nutrient loads in different parts
of the Baltic Sea. The loads of nutrients are expected to decrease for the largest marine basin, Baltic
Proper, between 15% and 61% for nitrogen and between 14% and 49% for phosphorus (Lindqvist et al.,
2013 Table 2). On the other hand, loads are expected to increase between 8% and 31% for all other
marine basin. Ranges in impacts on total Baltic Sea are calculated by weighting the impacts calculated for
each marine basin with its nutrient pools.
With respect to climate change impacts on the targets, there exist no studies on their quantification.
Changes in temperature are likely to affect the anoxic sea bottom areas, and the CO2 uptake by oceans
cause acidification which impacts biological activities (e.g. Kabel et al., 2012). It is therefore quite likely
that, for given nutrient pools, the damages can be higher and thus counteract the calculated climate
change effects on reduction in nutrient pools. However, since there exists no number on expected changes
on settled targets, we simply assume that Eγµ is the same for both nutrient targets and amounts to 0.9 and
that the coefficient of variation is 0.1.
16

Table 2: Nutrient pools, carry over rates, targets, and uncertainty quantification in pools and targets
Pools,
kton 1 Carry over rate, (1-αE) 2
Target, % reduction3
Average climate impact on pools, E,φµ 4
CV in E,φµ 5
Average target effect,
E,γµ
CV in Eγ
Nitrogen 2567 0.76 8.62 0.89 0.13 0.9 0.1 Phosphorus 558 0.94 41.50 0.84 0.14 1Bioavailable nutrients in Gren et al., (2013), Table 1 with shares of total N of 0.844 and total P of 0.943; 2 Weighted average from nutrient pools and self-cleaning rates in in Gren et al. 2013 Table 1, 3 Weighted average from nutrient pools and target reductions in Gren et al., 2013 Table 1 4 Weighted average from nutrient pools in Gren et al., 2013 Table 1 and climate change effects in Lindkqvist et al., (2013) Table 2; 5CV, coefficient of variation calculated from the data obtained under 4
Finally, there is a need for defining the target time when the improvements are to be achieved, and the
discount rate. The target times are determined by implementation of abatement measures and response
time of the sea basins. Helcom BSAP suggests 2021 to be the deadline for implementation of nutrient
load reductions. However, the suggestion contains no discussion on when the targets are supposed to be
achieved. We therefore follow Gren et al. (2013) and apply a time period of 60 years. We choose a
relatively low discount rate of 1.5.
4.2 Results
Minimum costs are calculated for the impacts of learning and the two climate change impacts, separately
and in combination, with and without uncertainty. The GAMS Conopt2 solver is used for the numerical
solutions (Rosenthal et al., 2008).
4.2.1 No uncertainty
The total cost for achieving the targets in the reference case, without any impacts, amounts to 307 billion
SEK. This corresponds to an average annual cost of approximately 5.2 billion SEK, which is considerably
17
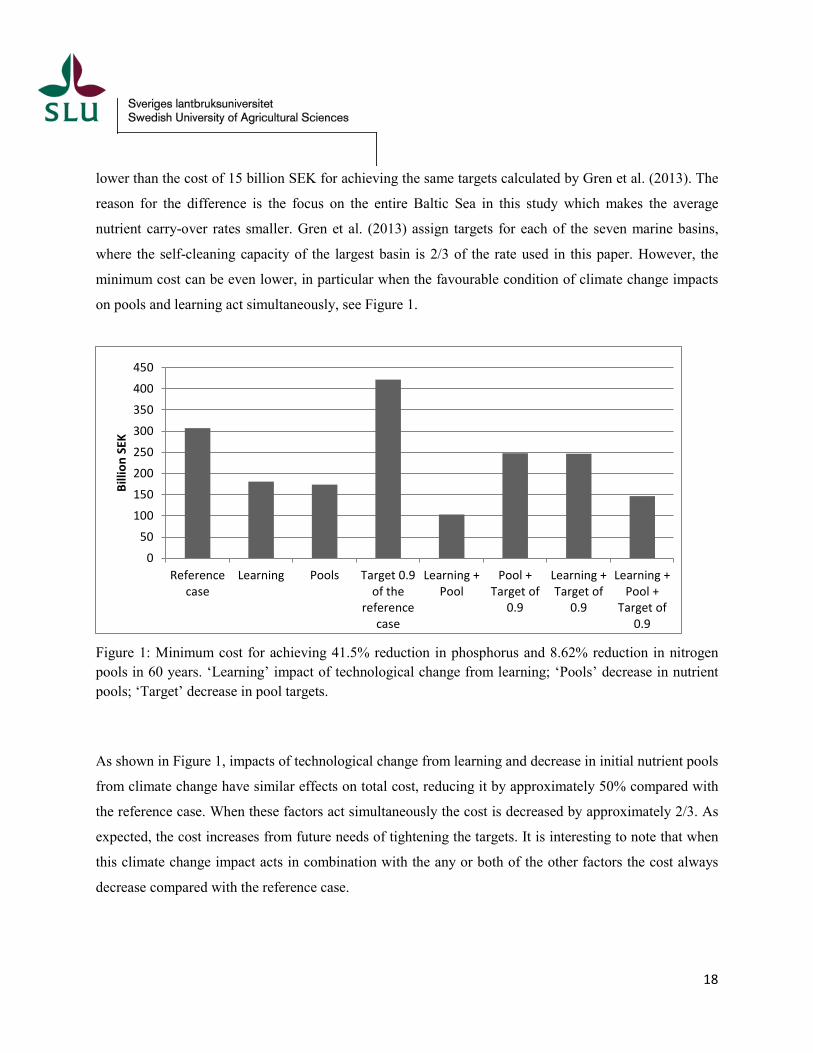
lower than the cost of 15 billion SEK for achieving the same targets calculated by Gren et al. (2013). The
reason for the difference is the focus on the entire Baltic Sea in this study which makes the average
nutrient carry-over rates smaller. Gren et al. (2013) assign targets for each of the seven marine basins,
where the self-cleaning capacity of the largest basin is 2/3 of the rate used in this paper. However, the
minimum cost can be even lower, in particular when the favourable condition of climate change impacts
on pools and learning act simultaneously, see Figure 1.
Figure 1: Minimum cost for achieving 41.5% reduction in phosphorus and 8.62% reduction in nitrogen pools in 60 years. ‘Learning’ impact of technological change from learning; ‘Pools’ decrease in nutrient pools; ‘Target’ decrease in pool targets.
As shown in Figure 1, impacts of technological change from learning and decrease in initial nutrient pools
from climate change have similar effects on total cost, reducing it by approximately 50% compared with
the reference case. When these factors act simultaneously the cost is decreased by approximately 2/3. As
expected, the cost increases from future needs of tightening the targets. It is interesting to note that when
this climate change impact acts in combination with the any or both of the other factors the cost always
decrease compared with the reference case.
0
50
100
150
200
250
300
350
400
450
Referencecase
Learning Pools Target 0.9of the
referencecase
Learning +Pool
Pool +Target of
0.9
Learning +Target of
0.9
Learning +Pool +
Target of0.9
Billi
on S
EK
18

With respect to timing of abatement costs, all scenarios show three phases; i) an initial period of about 30
years with low annual costs, ii) increasing cost for a period of 15 to 25 years, and iii) a plateau followed
by a decline. The first part is explained by the cost savings made from delaying abatement due to the
discount rate and the self-cleaning capacities as shown by equation (13) in Section 3. The second phase
arises from the combination of stationary maximum cleaning of phosphorus in order to reach the target in
period 60 and the abatement of nitrogen, which has a much faster turnover rate. In the third phase,
abatement of both nutrients is at the maximum level, and the costs are declining because of the discount
rate. The main difference in optimal paths between the scenarios is the timing of these three phases.
Figure 2: Optimal paths of annual discounted abatement costs under four different scenarios of
technological development and climate change impacts. (See Figure 1 for description of legends)
The main difference in optimal time paths occurs between the highest cost, ‘Target’ and the lowest cost
‘Learning’. Due to the higher target stringency, the cost outlays occur earlier because of the need to
obtain, in particular, the phosphorus target. The main implication of technological development from
learning can be seen by comparing ‘’Learning’ and ‘Pools’. Although the total costs are in the same order
of magnitude for these scenarios, the patterns during time differ where the outlays occur about 10 years
earlier for the ‘Learning’ scenario because of the subsequent gains made from cost decreases as shown by
equation (14) in Section 3.
0
5
10
15
20
25
0 10 20 30 40 50 60
Billi
on S
EK
Reference
Learning
Pools
Target
19

Recall from the data retrieval Section 4.1 that Poland accounts for the largest loads of both nutrients. This,
in combination of the large reduction requirement of phosphorus, implies that the abatement costs are
highest for Poland in all scenarios, see Figure 3.
Figure 3: Total cost of abatement per country, under different technological development and climate change scenarios. (SWE Sweden; DEN Denmark; FIN Finland; POL Poland; EST Estonia; LAT Latvia; LIT Lithuania; GER Germany; RUS Russia)
The impacts of different scenarios on total abatement costs are similar for all countries, and follows that
on total costs displayed in Figure 1. For Poland, the most costly scenario (Target) is approximately 5
times more expensive than the least costly scenario (Learning + Pools). Poland bears a least 50% of total
cost in all scenarios.
4.2.2 Uncertainty
When calculating costs of the different scenarios under uncertainty we need to decide about the
reliability levels for achievement of the targets, which we set at β =0.9 for both nutrient targets.
As expected, costs under all scenarios increase when uncertainty is included, see Figure 5.
0
50
100
150
200
250
SWE DEN FIN POL EST LAT LIT GER RUS
Billi
on S
EK
Reference case Learning
Pools Target 0.9 of the reference case
Learning + Pool Pool + Target of 0.9
Learning + Target of 0.9 Learning + Pool + Target of 0.9
20
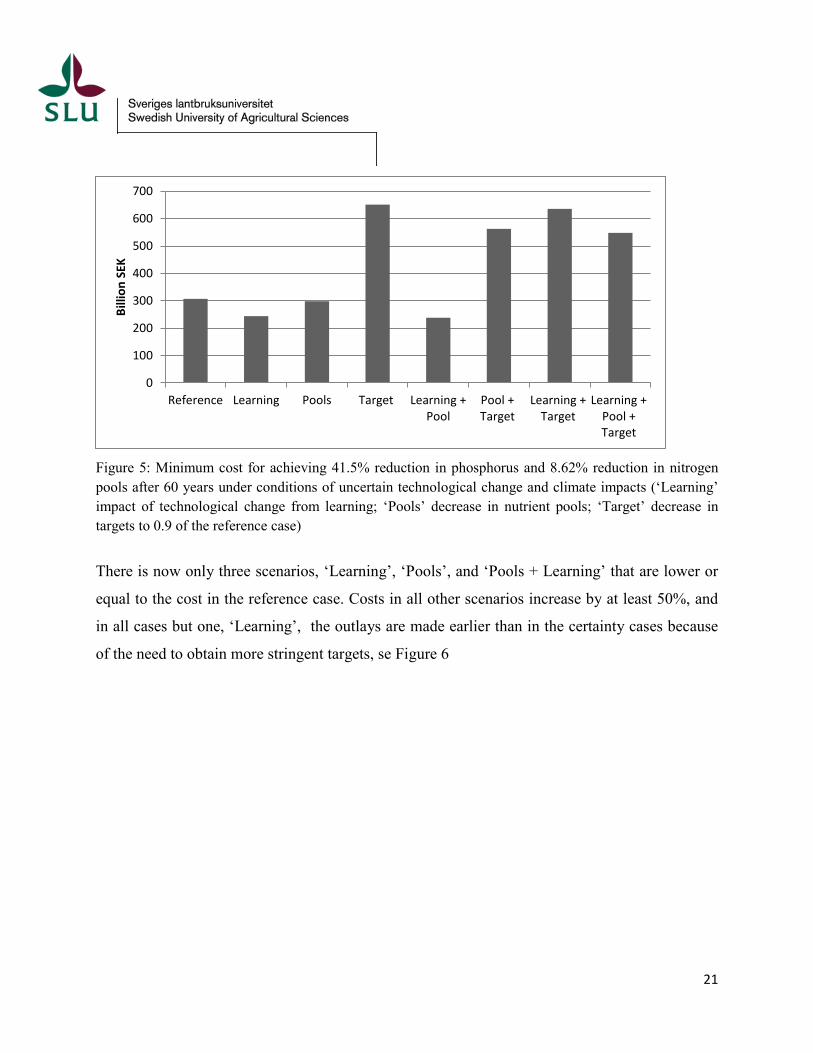
Figure 5: Minimum cost for achieving 41.5% reduction in phosphorus and 8.62% reduction in nitrogen pools after 60 years under conditions of uncertain technological change and climate impacts (‘Learning’ impact of technological change from learning; ‘Pools’ decrease in nutrient pools; ‘Target’ decrease in targets to 0.9 of the reference case)
There is now only three scenarios, ‘Learning’, ‘Pools’, and ‘Pools + Learning’ that are lower or
equal to the cost in the reference case. Costs in all other scenarios increase by at least 50%, and
in all cases but one, ‘Learning’, the outlays are made earlier than in the certainty cases because
of the need to obtain more stringent targets, se Figure 6
0
100
200
300
400
500
600
700
Reference Learning Pools Target Learning +Pool
Pool +Target
Learning +Target
Learning +Pool +Target
Billi
on S
EK
21
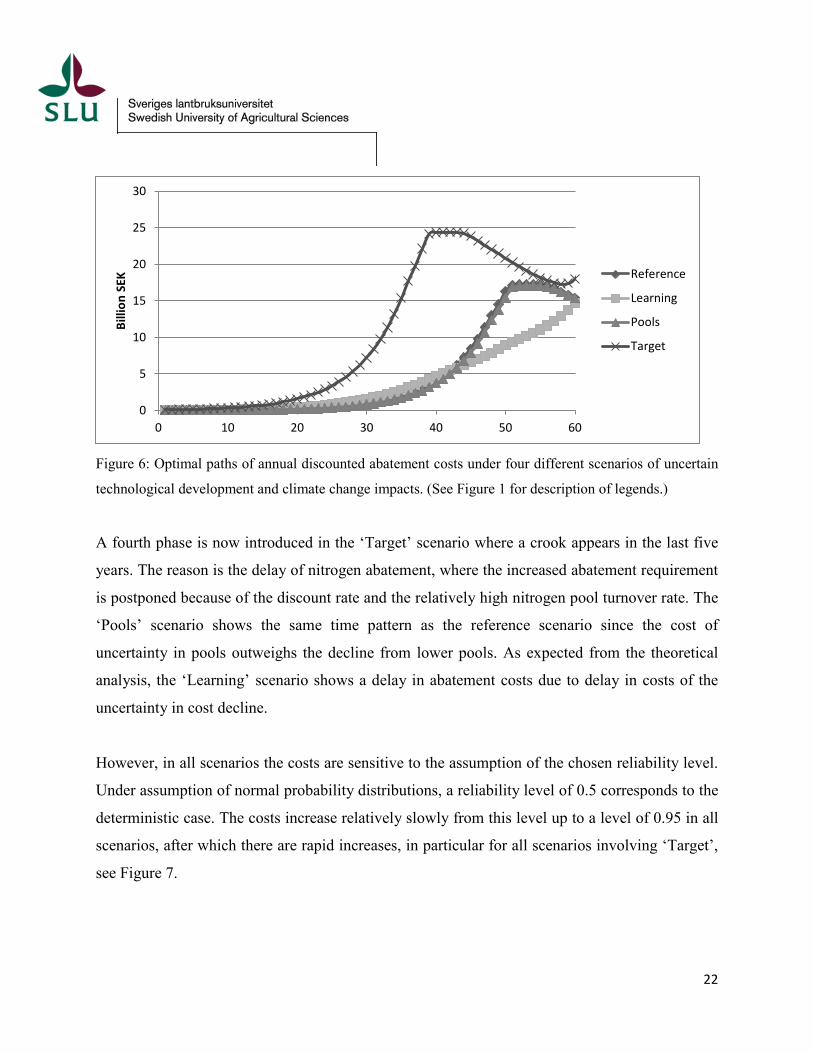
Figure 6: Optimal paths of annual discounted abatement costs under four different scenarios of uncertain
technological development and climate change impacts. (See Figure 1 for description of legends.)
A fourth phase is now introduced in the ‘Target’ scenario where a crook appears in the last five
years. The reason is the delay of nitrogen abatement, where the increased abatement requirement
is postponed because of the discount rate and the relatively high nitrogen pool turnover rate. The
‘Pools’ scenario shows the same time pattern as the reference scenario since the cost of
uncertainty in pools outweighs the decline from lower pools. As expected from the theoretical
analysis, the ‘Learning’ scenario shows a delay in abatement costs due to delay in costs of the
uncertainty in cost decline.
However, in all scenarios the costs are sensitive to the assumption of the chosen reliability level.
Under assumption of normal probability distributions, a reliability level of 0.5 corresponds to the
deterministic case. The costs increase relatively slowly from this level up to a level of 0.95 in all
scenarios, after which there are rapid increases, in particular for all scenarios involving ‘Target’,
see Figure 7.
0
5
10
15
20
25
30
0 10 20 30 40 50 60
Billi
on S
EK Reference
Learning
Pools
Target
22

Figure 7: Total discounted abatement costs under different scenarios of uncertain technological change and climate impacts for different probability levels of achieving the nutrient targets in 60 years.
The main difference in abatement costs between the scenarios appears at high reliability levels
where targets including both ‘Pools’ and ‘Targets’ now become most expensive. The reasons are
the risk discount of both uncertainties and that the cost of uncertainty in the decline in nutrient
pools is higher than the reduction in costs from the reduction in nutrient pools.
5. Conclusions
Climate change is likely to result in several and uncertain impacts on a eutrophied sea, and this
study investigated the implications for cost-effective solutions of two of them; effects on nutrient
pools and target setting. Depending on the direction of impacts, total abatement cost for reaching
certain future nutrient pool targets can either increase or decrease. Unlike this ambiguous result,
the introduction of technological development from learning by doing results in a cost decrease.
Another unambiguous result is the increase in abatement cost from considering uncertainty,
irrespective of its origins in nutrient pools, target setting or technological development.
However, the combined impact on total abatement cost of all impacts depend can be either a
0
500
1000
1500
2000
2500
0,5 0,6 0,7 0,8 0,9 1
Billi
on S
EK
Probability of achieving targets
Pools
Target
Learnig + Pool
Learning + Target
Target + Pool
Learning + Pool +Target
23

decrease or an increase depending on the magnitude of the effects, and on risk aversion against
non-attainment of targets and variability in costs.
The model was applied to the most recent intergovernmental agreement for combatting
eutrophication in the Baltic Sea, which requires an average of 41.5% reduction in the phosphorus
and 8.62% in the nitrogen pool. The minimum cost for achieving these targets in 60 years
amounts to approximately 310 billion SEK in the reference case without any technological
development or climate change. However, the cost can either decrease by 2/3 or increase 2.5
times depending on assumptions on the combination of impacts. The most favourable condition
occurs for the combination of technological development and climate impact on nutrient pools.
The latter are expected to decrease by approximately 15% due to climate change. However, if
climate change instead requires a target reduction increase by 10%, the cost can increase
considerably. The range in minimum cost becomes even larger when considering uncertainty,
between 248 and 2011 billion SEK, because of the risk discount and variability in climate change
effects and technological development.
Undoubtedly, our results show that the existence of uncertainty, and the aversion against it,
increase abatement costs for all type of combinations of technological development and climate
change. However, the results also show that climate change may facilitate implementation of
nutrient abatement strategies because of the expected reduction in nutrient pools. In this case, the
cost may be below current abatement costs even under conditions of uncertainty and no technical
development. These results point to the importance of analysing and quantifying different
climate change impacts and in particular their combined effect on environmental problems,
since, in isolation they may under- or overestimate minimum cost solutions to pre-specified
targets.
.
24
Appendix: Estimation of nutrient abatement cost functions
Data on costs, nitrogen and phosphorus abatement are abatement from calculations of cost
effective solutions to 500 random combinations of nitrogen abatement between 1 and max 60%
BAU nitrogen loads, and of phosphorus combinations between 1 and 80% a of BAU phosphorus
loads. The restrictions are determined by the capacity constraint imposed in Gren et al. (2008).
The reason for the differences in maximum percent abatement of BAU loads is that relatively
much of the nitrogen emission sources are located upstream in drainage basins with low impact
nitrogen loads to the sea, and that part of nitrogen loads come from airborne emission sources
located outside the catchment of the Baltic Sea. For some countries, the maximum reductions
are not attainable, and the number of observations are then below 500, see Table A1 for
descriptive statistics.
The data are used to estimate the regression equation
iPiiNiPiiNiii AAcAbAaC ε+++= ,2,2, )()( (A1)
where NiA , and PiA , are abatement of nitrogen and phosphorus, respectively, and iε is the error
term. Ordinary least square estimator is used, and the results are presented in Table A2.
25

Table A1: Summary statistics, costs in million SEK and abatement of nitrogen and phosphorus in kton Variable Observations Mean, Standard
deviation Mean Max
TCPoland 500 11183 8558 61 39231 TCSweden 500 3243 2395 50 10096 TCDenmark 500 2412 2088 59 9973 TCFinland 500 2895 1892 25 8652 TCEstonia 470 830 571 7 2850 TCLatvia 451 1702 1235 9 5228 TCLithuania 455 1446 1145 3 6810 TCGermany 500 1443 1291 22 5916 TCRussia 500 2735 2930 15 18782 AN, Poland 500 98 58 3.83 206 AN, Sweden 500 23 14 0.89 47 AN, Denmark 500 14 8.06 0.53 29 AN, Finland 500 15 8.98 0.59 32 AN, Estonia 470 17 10 0.66 36 AN, Latvia 451 14 8.07 0.53 29 AN, Lithuania 455 29 17 1.12 60 AN, Germany 500 14 8.43 0.56 30 AN, Russia 500 26 15 1.00 54 AP,Poland 500 8.91 5.09 0.24 18 AP,Sweden 500 0.65 0.37 0.02 1.28 AP,Denmark 500 0.45 0.26 0.01 0.88 AP,Finland 500 0.69 0.39 0.02 1.36 AP,Estonia 470 0.65 0.37 0.02 1.28 AP,Latvia 451 1.18 0.67 0.03 2.32 AP,Lithuania 455 1.42 0.81 0.04 2.80 AP,Germany 500 0.20 0.12 0.01 0.40 AP,Russia 500 1.62 0.93 0.04 3.20
26

Table A2: Results from OLS estimation of joint abatement cost functions for the Baltic Sea riparian countries. Country Nitrogen
ai p-value Phosphorus2: b i p-value
Joint N and P: ci p-value
Adj. R2
Sweden 3.577 0.000 1576.631 0.000 20.894 0.000 0.99 Poland 0.347 0.000 94.010 0.000 3.179 0.000 0.99 Finland 5.648 0.000 2089.229 0.000 16.680 0.000 0.99 Denmark 0.293 0.000 1945.179 0.000 58.831 0.000 0.98 Germany 4.946 0.000 11836.620 0.000 149.799 0.000 0.96 Estonia 1.274 0.000 1394.426 0.000 31.437 0.000 0.99 Latvia 3.610 0.000 1021.817 0.000 45.296 0.000 0.99 Lithuania 0.776 0.000 511.138 0.000 13.150 0.000 0.95 Russia 2.904 0.000 340.171 0.000 17.361 0.000 0.86
References
Ahlvik, L. Pavlova, Y., 2013. A strategic analysis of eutrophication abatement in the Baltic Sea. Environmental and Resource Economics 56:353-378. Azar, S.A. 2010. Bounds to the coefficient of relative risk aversion. Banking and Finance Letters 2: 391-398. Baumol JW, Oates W E.. 1988. The theory of environmental policy. Cambridge University Press, UK. Birge, J., and Louveaux, F., 1997. Introduction to stochastic programming. Springer, New York, USA. Bramoullé, Y. and Olson, L.J. 2005. Allocation of pollution abatement under learning by doing. Journal of Public Economics 89: 1935-1960. Byström, O., Andersson, H., Gren, I-M., 2000. Economic criteria for restoration of wetlands under uncertainty. Ecological Economics 35: 35-45. Carraro, C., De Cian, E., Nicita, L., Massetti, E., Verdoloni, E., 2010. Environmental policy and technical change: A survey. International Review of Environmental and Resource Economics. 4:163-219.
27
Charnes, A., Cooper, W.W., 1964. Deterministic equivalents for optimizing and satisfying under chance constraints. Operations Research 11: 18-39. Conley D J, Björck S, Bonsdorff E, Carstensen J, Destouni G, Gustafsson B, Hietanen S. Kortekaas M, Kuosa H, Meier M, Müller-Karulis B, Nordberg K, Norkko A, Nürnberg G, Pitkänen H, Rabalais N, Rosenberg R, Savchuk O, Slomp C, Voss M. Wulff F, Zillén L. 2009. Hypoxia-related processes in the Baltic Sea, Environmental Science and Technology 43: 3412-.3420. Elmgren R., Larsson U.,2001. Eutrophication in the Baltic Sea area. Integrated coastal management issues. In: B. von Bodungen and R.K. Turner (Eds.). Science and integrated coastal management. Dahlem University Press, Berlin; pp15-35. Elofsson, K., Folmer, H., Gren, IM. 2003Management of eutrophicated coastal zones – A synposis of the literature. Ecological Economics 47:1-13.
Elofsson K. 2006. Cost effective control of interdependent water pollutants. Environmental Management 37: 54-68.
Elofsson K. 2007. Cost uncertainty and unilateral abatement. Environmental and Resources Economics 36: 143-162. Elofsson, K., 2003. Cost effective reductions of stochastic agricultural nitrogen loads to the Baltic Sea. Ecological Economics 47: 13-31. Gilbert P M . 2007. Eutrophication and harmful algal blooms: A complex global issue. International Journal of Oceans and Oceanography 2: 157-169. Gren, I-M, Elofsson K, Jannke P. 1997. Cost effective nutrient reductions to the Baltic Sea. Environmental and Resource Economics 10: 341-362. Gren I-M, Lindqvist M, Jonzon Y. 2008. Calculation of costs for nutrient reductions to the Baltic Sea – technical report. Working paper no. 2008-1. Department of Economics, SLU, Uppsala Gren I-M, Savchuck O, Jansson T. 2013. Dynamic and spatial cost effective mitigation of Baltic Sea eutrophication. Marine Resource Economics 28:263-284. Gren I-M. 2010. Climate change and the Water Framework Directive: Cost effectiveness and policy design for water management in the Swedish Mälar region. Climatic Change 100: 463-484. Hart R. 2003. Dynamic pollution control. Ecological Economics 47: 79-93.
28

Hart R, Brady M. 2002. Nitrogen in the Baltic Sea – Policy implication of stock effects. Journal of Environmental Management 6: 91-103. Heisler J, Glibert P M, Burkholder J M,. Anderson D M, Cochlan W, Dennison W C, Dortch Q, Goble C J,. Heil C A, Humphries E, Lewitus A, Magnien R, Marshall H G, Sellner K, Stockwell D A, Stoecker D K, Suddleson M. 2008. Eutrophication and harmful algal blooms: A scientific consensus. Harmful Algae 8: 3–13. Helcom 2007, 2013 HELCOM Baltic Sea Action Plan. Helsinki Commission, Helsinki, Finland. http://www.helcom.fi/baltic-sea-action-plan/nutrient-reduction-scheme/ (accessed 07.01.14). Held, H., Kriegler, E., Lessman, K., Edenhofer O., 2009. Efficient climate policies under technology and climate uncertainty. Energy Economics 31: S50-S61. Helin, J. Laukkanen, M., Koikkalainen, K., 2008. Abatement costs for agricultural nitrogen and phosphorus loads: a case study of crop farming in south-western Finland. Agricultural and Food Science 15: 351-374. Jamasb, T. 2007. Technical change theory and learning curves: patterns of progress in electricity generation technologies. The Energy Journal 28: 51- 72. Kabel, K., Moros, M., Prosche, P., Neumann T., Adolphi, F., Andersen, T.J., Siefel, M., Leipe, T., Jansen, E., Damste, J., 2012. Impact of cimate change on the Baltic Sea ecosystem over the past 1000 years. Nature Climate Change 2: 871-874. Kataria, M., Elofsson, K., Hassler, B. 2010. Distributional assumptions in chance constrained programming models of stochastic water pollution. Environmental Modeling and Assessment 15: 273-281. Laukkanen M, Huhtala A. 2008. Optimal management of a eutrophied coastal ecosystem: balancing agricultural and municipal abatement measures. Environmental and Resource Economics 39: 139-159. Laukkanen M, Ekholm P, Huhtala A, Pitkänen H, Kiirikki M, Rantanen P, Inkata A, 2009. Integrating ecological and economic modelling of eutrophication: Toward optimal solutions for a coastal area suffering from sediment release of phosphorus. Ambio 38: 225-235. Lindqvist, M., Gren, I-M., Elofsson, K. 2013. A study of climate change and cost effective mitigation of eutrophication in the Baltic Sea. In Singh, B.R. (ed.) ‘Climate change – Realities, impacts over ice cap, sea level and risk’. ISBN 978-953-51-0934-1. In Tech, Prague, pp.459-480.
29

Lindqvist, M., Gren, I-M. 2013. Cost-effective nutrient abatement for the Baltic Sea under learning-by- doing induced technical change. Working paper 01/2103, Department of Economics, Swedish University of Agricultural Sciences, Uppsala, Sweden. MacDonald, A. Schrattenholzer, L. 2001. Learning rates for energy technologies. Energy Policy 29: 255-261. Mäler, K-G., Xepapadeas, A., de Zeeuw, A., 2003. The economics of shallow lakes. Environmental and Resource Economics 26: 603-624.. Ollikainen M, Honkatukla J. 2001. Towards efficient pollution control in the Baltic Sea: An anatomy of current failure with suggestions for change. Ambio 4: 779-93. Panzar J, Willig R . 1981. Economies of scope. American Economic Review 71: 268-274 Pyle, D., and Turnovsky, S. 1970. Safety-first and expected utility maximization in a mean- standard deviation portfolio analysis. Review of Economics and Statistics 52:75-81 Rabotyagov, S., Kling, C., Gassman, P., Rabalais, N., Turner, R., 2014. The economics of dead zone: causes, impacts, policy challenges, and a model of the Gulf of Mexico hypoxic zones. Review of Environmental Economics and Policy, online doi:10.1093/reep/ret024. Rasmussen, T.N. 2001. CO2 abatement policy with learning-by-doing in renewable energy. Resource and Energy Economics 23: 297-325. Rosendahl, K.E. 2004. Cost-effective environmental policy: implications of induced technical change. Journal of Environmental Economics and Management 48, 1099-1121. Rosenthal R. 2008. Gams – a user’s guide. GAMS Development Corporation, Washington, DC, USA Savchuk O P, Wulff F. 2007. Modeling the Baltic Sea eutrophication in a decision support system. Ambio 36: 141 – 148. Savchuk OP, Wulff F. 2009. Long-term modelling of large-scale nutrient cycles in the entire Baltic Sea. Hydrobiologia 629: 209-224. Schmidt, M., Lorenz, A., Held, H., Kriegler, 2011. Climate targets under uncertainty: challenges and remedies. Climatic Change 104: 783-791.
30
Shortle, J., 1990. The allocative efficiency implications of water pollution abatement cost comparisons. Water Resources Research 26: 793-797. Taha, H. 2007. Operations Research. An introduction. Eighth edition. McMillan Publishing Co pp. 713-716. Tesler, L.G. 1955-56. Safety first and hedging. Review of Economic Studies 23:1-16.
31
Department of Economics Institutionen för ekonomi Swedish University of Agricultural Sciences (SLU) Sveriges lantbruksuniversitet P.O. Box 7013, SE-750 07 Uppsala, Sweden Box 7013, 750 07 Uppsala Ph. +46 18 6710 00, Fax+ 46 18 67 35 02 Tel. 018-67 10 00, fax 018 67 35 02 www.slu.se www.slu.se www.slu.se/economics www.slu.se/ekonomi
32