Preparing for an Uncertain ClimateÑVol. II
389
Preparing for an Uncertain Climate—Vol. II October 1993 OTA-O-568 NTIS order #PB94-134657 GPO stock #052-003-01357-6
-
Upload
khangminh22 -
Category
Documents
-
view
1 -
download
0
Transcript of Preparing for an Uncertain ClimateÑVol. II
Preparing for an Uncertain Climate—Vol. II
October 1993
OTA-O-568NTIS order #PB94-134657
GPO stock #052-003-01357-6
Recommended Citation:U.S. Congress, Office of Technology Assessment, Preparing for an UncertainClimate--Volume II, OTA-O-568 (Washington, DC: U.S. Government PrintingOffice, October 1993).
Foreword
P reparing for an Uncertain Climate is OTA’s second report on climate change. In1991, we published Changing by Degrees: Steps to Reduce Greenhouse Gases,which focused on ways to reduce the buildup of greenhouse gases in theatmosphere. Slowing the rate of growth in these emissions continues to be very
important, but most analyses conclude that despite international efforts, the Earth is likelyto warm several degrees over the next century.
Climate change poses many potential problems for human and natural systems, andthe long-term effects of climate change on these systems are becoming increasinglyimportant in public policy, For example, international agreements were recently signed onboth climate change and biodiversity. Recognizing the potential problems, Congress askedOTA to examine how the Nation can best prepare for an uncertain future climate. Thisassessment tackles the difficult tasks of assessing how natural and human systems may beaffected by climate change and of evaluating the tools at our disposal to ease adaptation toa warmer climate. Volume 1 addresses coastal areas, water resources, and agriculture;volume 2 includes wetlands, preserved lands, and forests.
OTA identifies more than 100 options in the full report that could help ease thetransition to an uncertain climate. We categorized a subset of these options as ‘‘first steps. ’Options that fall into this group are near-term concerns because they will take a long timeto complete, address ‘‘front-line” or urgent issues that need attention first in order to makebetter decisions later, can be approached through efforts already under way, are beneficialfor reasons other than helping to prepare for climate change, or represent near-term ‘targetsof opportunity.‘‘
The United States has put in place an ambitious Global Change Research Program to‘‘observe, understand, and ultimately predict global and regional climate change. ” Thiseffort, which has so far been based overwhelmingly in the physical sciences, is not gearedto help make natural resource planning and management decisions, to identify ecosystem-level responses to climate change, or to readily provide policy guidance on mitigation oradaptation. While scientists continue to reduce uncertainty, policy makers will continue toreauthorize environmental legislation, manage natural resources, and develop energypolicy. Having mechanisms for integrating research and evaluating reasonable policyroutes while we are completing the science would be a valuable addition to the Federaleffort. This assessment could help guide these needed improvements.
Preparing for an Uncertain Climate was requested by three congressionalcommittees: the Senate Committees on Environment and Public Works and on Commerce,Science, and Transportation, and the House Committee on Science, Space, and Technology.OTA appreciates the support this effort received from hundreds of contributors. Workshopparticipants, reviewers, contractors, and informal advisors gave us invaluable support as weattempted to sift through the voluminous material on this subject. OTA, however, remainssolely responsible for the contents of this report.
Roger C. Herdman, Director
Advisory PanelHelen M. Ingram, ChairmanDirectorUdall Studies in Public PolicyUniversity of Arizona
Richard M. AdamsProfessor of Resource EconomicsDepartment of Agricultural and
Resource EconomicsOregon State University
Vera AlexanderDean, School of Fisheries
and Ocean SciencesUniversity of Alaska
Michael J. BeanSenior AttorneyEnvironmental Defense Fund
Margaret Adela DavidsonExecutive DirectorSouth Carolina Sea Grant
Consortium
J. Clarence DaviesDirectorCenter for Risk ManagementResources for the Future
Baruch FischhoffProfessor of Engineering
and Public PolicyCarnegie Mellon University
Michael H. GlantzProgram DirectorEnvironmental Impacts GroupNational Center for Atmospheric
Research
George HobergAssistant ProfessorPolitical Science DepartmentUniversity of British Columbia
Henry D. JacobyDirector, Joint Program on the
Science and Policyof Global Change
Sloan School of ManagementMassachusetts Institute of
Technology
Waiter JarckCorporate Director
Forest ResourcesGeorgia-Pacific Corporation
David N. KennedyDirector, California State
Department of Water Resources
Jon KuslerExecutive DirectorAssociation of State Wetlands
Managers
Douglas MacLeanAssociate ProfessorPhilosophy DepartmentUniversity of Maryland
Jerry MahlmanDirector, Geophysical Fluid
Dynamics Laboratory/NOAAPrinceton University
Barbara MillerSenior Civil EngineerTennessee Valley Authority
Steve PeckDirector, Environmental Sciences
DepartmentElectric Power Research Institute
Herman ShugartChairmanDepartment of Environmental
SciencesUniversity of Virginia
Phil SissonDirector, Commodities and
Economic Analysis DivisionQuaker Oats
Don WilhiteDirectorInternational Drought
Information CenterUniversity of Nebraska
Gary YoheProfessorDepartment of EconomicsWesleyan University
NOTE: OTA appreciates and is grateful for the valuable assistance and thoughtful critiques provided by the advisory panel members.The panel does not, however, necessarily approve, disapprove, or endorse this-report. OTA assumes full responsibility for the reportand the accuracy of its contents.
iv
Project StaffClyde BehneyAssistant Director, OTAHealth and Environmental
Sciences Division
ROSINA BIERBAUMProject Director
Sherry ShowellAnalyst
Michael BowesSenior Analyst
Nadine CutlerResearch Analyst
John AndelinAssistant Director,
to Aug. 31, 1993Elise HollandResearch Analyst
William WestermeyerSenior Analyst
Robert NiblockProgram ManagerOceans and Environment
Jacqueline CourteauAnalyst
CONTRACTORS
ADMINISTRATIVE STAFF Timothy BeatleyUniversity of Virginia
Julie PhillipsIndexer
Kathleen BellOffice Administrator
Stanley ChangnonIllinois State Water Survey
Frank Potterconsultant
Kimberly HolmlundAdministrative Secretary
William ClineInstitute of International EconomicsCharles CooperSan Diego University
Carleton RayUniversity of VirginiaTheodore SchadConsultantSharon Knarvik
SecretaryWilliam EasterlingUniversity of Nebraska-Lincoln
Daniel SheerWater Resources Management, Inc.
CONTRIBUTORS
Bob Friedman
Beth Robinson
Mark Zinniker
Jae EdmondsPacific Northwest LaboratoryEnvironmental Defense Fund
David GillilanUniversity of Arizona
Joel SmithRCG/Hagler, Bailley, Inc.William SmithYale UniversityNick SundtconsultantRichard WahlUniversity of Colorado
Patrick Hal pinUniversity of Virginia
Robert LilieholmUtah State University
EDITOR
Cynthia AllenEditorial Services
Scott WarrenConnecticut CollegeDaniel WillardIndiana University
Janice LongstrethPacific Northwest Laboratory
Geraldine McCormick-RayUniversity of VirginiaMary McKenneyconsultantWalt OechelSan Diego State University v
workshopWORKSHOP ON WETLANDS
Tom BancroftNational Audubon SocietyAnn BartuskaU.S. Forest ServiceMichael BeanEnvironmental Defense FundElizabeth BokmanU.S. Department of the Interior
Dieter BuschU.S. Fish and Wildlife Service
Douglas CanningWashington Department of EcologyJames ChambersNational Oceanic and Atmospheric
Administration
Kevin ErwinKevin L. Erwin Consulting
Ecologist, Inc.
Lee FooteU.S. Fish and Wildlife ServiceTaber HandAssociation of State Wetlands
ManagersSuzette KimballUniversity of VirginiaJames KundellThe University of Georgia
Jon KuslerAssociation of State Wetlands
ManagersBruce MoultonTexas Water CommissionWalter OechelSan Diego State University
ParticipantsRichard ParkIndiana University
Karen PoianlCornell UniversityMichael SauerNorth Dakota Department of HealthCharles SegelquistU.S. Fish and Wildlife ServiceJohn SimpsonMassachusetts Department of
Environmental Protection
James TitusU.S. Environmental Protection AgencyJohn ToliverU.S. Forest Service
Richard TomczykMassachusetts Department of
Environmental Protection
Virginia Van Sickle-BurkettU.S. Fish and Wildlife Service
Don VorosU.S. Fish and Wildlife ServiceScott WarrenConnecticut College
Dennis WhighamSmithsonian Environmental
Research Center
Daniel WillardIndiana University
Tom WinterU.S. Geological Survey
Irene WisheuUniversity of OttawaDonald WitherillMaine Department of Environmental
Protection
WORKSHOP ON FORESTS
Robert BaileyUniversity of GeorgiaRichard BirdseyNortheastern Forest Experiment StationBruce BongartenUniversity of GeorgiaJ.E. de SteigeurU.S. Forest Service
Phil DoughertySoutheastern Forest Experiment Station
Lauren FinsUniversity of IdahoMichael FosbergU.S. Forest ServiceKathleen GeyerU.S. Forest Service
Robin GrahamOak Ridge National Laboratory
Robert HaackMichigan State University
Edward HansenU.S. Forest ServiceRoy HeddenClemson University
Arnold HoldenU.S. Forest Service
David Le BlancBall State University
F. Thomas LedigU.S. Forest ServiceRobert LilieholmUtah State University
vi
Rex McCulloughWeyerhaeuser Company
Stephen NodvinUniversity of Tennessee
David ParsonsNational Park Service
Phillip RigganU.S. Forest Service
Clark RowconsultantCon SchallauAmerican Forest Council
Hank Shugart, ChairUniversity of Virginia
William SmithYale University
Alan SolomonU.S. Environmental Protection Agency
Jack WinjumU.S. Environmental Protection Agency
John ZerbeForest Products Laboratory
Robert ZiemerU.S. Forest Service
WORKSHOP ONWESTERN LANDS
Cecil ArmstrongU.S. Forest Service
Will BlackburnU.S. Department of Agriculture
Terence BoyleColorado State University
Michael CassityUniversity of Wyoming
Stan ColoffBureau of Land Management
Charles CooperSan Diego State University
Doug FOX
U.S. Forest ServiceHelen Ingram, ChairUniversity of Arizona
Linda JoyceU.S. Forest Service
John KelmelisU.S. Geological Survey
Gil LuskGlacier National Park
Mitch McClaranUniversity of Arizona
Gary McVickerBureau of Land ManagementRon MoodyU.S. Department of Agriculture
David MouatDesert Research Institute
Walter OechelSan Diego State University
Pat ReecePanhandle Research and Extension
Center
Patrick ReedUniversity of Georgia
Tim SeastedtUniversity of Colorado
Richard StroupPolitical Economy Research Center
Eleonora TrotterUniversity of New Mexico
Sara VickermanDefenders of Wildlife
Mary WallaceUniversity of Arizona
WORKSHOP ON CLIMATETREATIES AND MODELS
Dan BodanskyUniversity of Washington
Tony BrentonHarvard University
Herman CesarTilburg University
Joel DarmstadterResources for the FutureHadi DowlatabadiCarnegie Mellon UniversityJae EdmondsPacific Northwest Laboratory
Howard GruenspechtU.S. Department of EnergyJames HammittRand Corp.William HoganHarvard University
Ted ParsonHarvard University
Steve RaynerPacifilc Northwest Laboratory
John ReillyMassachusetts Institute
of TechnologyJoel ScheragaU.S. Environmental Protection Agency
Dennis TirpakU.S. Environmental Protection Agency
David VictorHarvardI University
John MyantStanford University
Don WilhiteUniversity of Nebraska
vii
WORKSHOP ONAGRICULTURE
Richard AdamsOregon State UniversityRobert ChenConsortium for the International Earth
Science Information Network
Ralph ChiteThe Library of congress
John ClarkBattelle Institute
Roy DarwinU.S. Department of AgricultureWilliam EasterlingUniversity of Nebraska
Dean EthridgeU.S. Department of Agriculture
Gary EvansU.S. Department of AgricultureSteven HollingerUniversity of IllinoisMarvin JensenColorado State UniversityC. Allan JonesTexas A&M University
Jan LewandrowsklU.S. Department of AgricultureRobert LoomlsUniversity of CaliforniaRobert MendelssohnYale University
Calvin QuaisetUniversity of CaliforniaWayne RasmussenU.S. Department of AgricultureSteve RawlinsUs. Department of AgricultureJohn ReillyMassachusetts Institute of Technology
Norman Rosenberg, ChairBattelle Institute
Cynthia RosenzweigColumbia UniversityVernon RuttanUniversity of Minnesota
Paul UngerU.S. Department of Agriculture
John van EsUniversity of Illinois
WORKSHOP ON ECOLOGYAND REMOTE SENSING
Jim BunceU.S. Department of AgricultureLeonard DavidSpace Data Resources and Information
Ruth DefrlesUniversity of Maryland
Irv ForsethUniversity of Maryland
Robert HudsonUniversity of MarylandDavid InouyeUniversity of Maryland
Tony JanetosNational Aeronautics and
Space Adm inistrationMichael KearnneyUniversity of Maryland
Penelope KolnesUniversity of MarylandBill LawrenceUniversity of Maryland
Eileen McLellanUniversity of MarylandAlan MillerUniversity of Maryland
Raymond MillerUniversity of Maryland
Rob NichollsUniversity of Maryland
Karen PrestegaardUniversity of MarylandSteve PrinceUniversity of Maryland
Alan RobockUniversity of Maryland
John TownshendUniversity of Maryland
Richard WeismillerUniversity of Maryland
Robert WorrestConsortium for the International E
Science Information Network
WORKSHOP ON EOS ANDUSGCRP: ARE WE ASKINGAND ANSWERING THERIGHT QUESTIONS?
Dan AlbrittonNational Oceanic Atmospheric
Administration
James AndersonHarvard University
Francis BrethertonUniversity of WisconsinRonald BrunnerUniversity of Colorado
William ClarkHarvard University
Robert CorellNational Science Foundation
viii
Jeff DozierUniversity of California
John EddyConsortium for the International Earth
Science Information Network
Diane EvansJet Propulsion Laboratory
James HansenNational Aeronautics and Space
Administration
Tony JanetosNational Aeronautics and Space
Administration
Jerry MahlmanPrinceton University
Ari PatrinosU.S. Department of Energy
Robert WatsonNational Aeronautics and Space
Administration
WORKSHOP ONWATER RESOURCES
Tony BagwellTexas Water Development Board
Stanley ChangnonIllinois State Water Survey
Hanna CortnerUniversity of Arizona
Stephen Estes-SmargiassiMassachusetts Water Resources
Authority
Myron FieringHarvard University
Kenneth FrederickResources for the Future
Jerome GilbertWater Transfer Associates
Michael Glantz, ChairNational Center for Atmospheric
Research
Helen IngramUniversity of Arizona
William KelloggNational Center for Atmospheric
Research
Steve MacaulayCalifornia Department of Water
Resources
Barbara MillerTennessee Valley Authority
Peter RhoadsSouth Florida Water Management
District
John SchefterU.S. Geological Survey
Neil SchildU.S. Department of the Interior
Rusty SchusterBureau of Reclamation
Joel SmithU.S. Environmental Protection Agency
Eugene StakhivUs. Army corps of Engineers
Dan TarlockChicago-Kent College of Law
Richard WahlUniversity of Colorado
Don WilhiteUniversity of Nebraska
Dennis LettenmaierUniversity of Washington
lx
1 Synthesis, Summary andPolicy Options 1The OTA Assessment 3The Problem of Climate Change 7Choosing Adaptation Strategies 15Overarching Policy Themes 19Near-Term Congressional Action 35Summaries and First Steps for Each
Resource Chapter 39Chapter 1 References 57
2 A Primer on Climate Change andNatural Resources 65How Do We Know Climate Is Changing? 66What Causes Climate Change? 71What Changes in Climate Are Predicted? 71How Will Climate Change Affect Natural
Resources? 79Which Natural Resources Are Most Vulnerable
to Climate Change? 99Chapter 2 References 101
3 Global Change Research in theFederal Government 109The U.S. Global Change Research program 112Priorities and Balance in USGCRP 119Adaptation Research in the Federal
Government 132Evaluation Mechanisms 139Policy Options: Augmenting the Federal
Research Effort on Global Change 144Chapter 3 References 151
contents
r 1
1
I xi
4
5
6
Wetlands 153Overview 154U.S. Wetlands Today 160Survival of Wetlands Under Climate Change 172Policy Context 185Policy options 195First Steps 211Chapter 4 References 213
Preserves: Federally Protected NaturalAreas 219Overview 220Federally Protected Natural Areas Today 224The Problem of Climate Change: A Shifting
Climate Over a Static Map 254Policy Options 279First Steps 289Chapter 5 References 291
Forests 299Overview 300The Forest Resource 301Forests and Climate Change 320Responding to climate Change 330Policy options 336First Steps 349Chapter 6 References 351
APPENDIXESA: List of Tables and Figures 357B: Acknowledgments 363
xii I
Synthesis,Summary
andPolicy
Options 1idespread public attention to the question of whetheror not climate is changing intensified during the hotsummers of the late 1980s. Since then, during thetime the Office of Technology Assessment (OTA)
was conducting this assessment, the Nation has experiencedmajor drought in the western and southeastern United States,powerful hurricanes in Florida and Hawaii, a destructive forestfire in Northern California, and substantial flooding in theMidwest. Although none of these events can be clearly linked toclimate change, they represent the types of extreme events thatmay occur with greater frequency if climate warms.
Most scientists believe that the Earth’s climate is likely towarm by several degrees during the next few decades. Althoughour understanding of climate change has progressed a great dealin the past few years, major knowledge gaps remain, andempirical evidence of human-induced climate change is notunequivocal. Many factors important to understanding climate,such as the role of clouds, ocean circulation, and solar cycles andthe interactions between living organisms and the environment,cannot yet be reliably incorporated into general circulationmodels (GCMS), science-based computer models used to predictpotential changes in average global surface temperature. Somekey information that could guide policy response is likely toremain unknown for another decade or two (69). We cannotpredict rates or magnitudes of changes in local or regionaltemperature and precipitation patterns. Predicting changes in thevariability of climate and weather patterns, particularly on smallspatial scales, is also beyond current scientific capabilities.Existing ecological, social, and economic models are similarlylimited and cannot adequately predict the responses to climate 1
2 I Preparing for an Uncertain Climate-Volume 2
changes by natural systems (e.g., forests andwetlands) or managed systems (e.g., water re-source systems and agriculture). Therefore, mostpolicy decisions made in the near future abouthow to respond to the specter of climate changewill be made in light of great uncertainty aboutthe nature and magnitude of potential effects.
Although climate change has certainly becomea public and scientific concern, what to do aboutit is not clear. Issues now being heatedly debatedare the technical feasibility and economic impli-cations of reducing or offsetting emissions ofgreenhouse gases. Several studies concluded thatcutting U.S. emissions of carbon dioxide (CO2),the most important anthropogenic greenhousegas, below current levels is plausible. OTA’s1991 report, Changing by Degrees: Steps toReduce Greenhouse Gases, concluded that byadopting a package of low-cost measures, theUnited States could significantly slow the growthof its CO2 emissions over the next 25 years-butcould not easily decrease them to below currentlevels (172). With aggressive-but potentiallyexpensive--initiatives, OTA found that the UnitedStates might be able to decrease its CO2 emissionsto 35 percent below today’s levels by 2015. Evenin this case, U.S. emissions of C02 are expectedto rise again after 2015 unless there are successfulprograms for developing alternatives to fossil-energy supplies (such as solar and nuclear power)-programs that would lead to substantial increasesin market penetration of one or more of theseenergy alternatives by 2015.
Since the 1992 United Nations Conference onEnvironment and Development (UNCED) inBrazil, many countries have signed the ClimateConvention, seeking to freeze greenhouse gasemissions at 1990 levels in the near future. OnEarth Day 1993, President Clinton announcedthat the United States would participate in thiseffort. The Climate Convention represents alandmark agreement and recognition that global
environmental problems must be addressed on aglobal scale.
Nonetheless, the bulk of scientific evidenceindicates that simply freezing greenhouse gasemissions at 1990 levels will not stop globalwarming. Stabilizing emissions is different fromstabilizing atmospheric concentrations. Constantannual emissions will still increase the totalconcentration of greenhouse gases and, thus, theheat-trapping capacity of the atmosphere. TheIntergovernmental Panel on Climate Change(IPCC), an international group representing morethan 50 countries, concluded that to stabilize theconcentrations of greenhouse gases in the atmos-phere at today’s levels would require up to an 80percent reduction in world CO2 emission levelsimmediately, along with significant reductionsin other greenhouse gases. Even if such reduc-tions could be achieved, the world would warmabout 1 to 4 OF (1 to 2 ‘C) because of long-livedgreenhouse gases emitted over the last century.Given the virtual certainty that energy use (andassociated C02 emissions) in developing coun-tries will rise as they pursue economic growth,and given the intense debate in the United Statesand other industrialized countries about the feasi-bility of achieving even a freeze in emissions, itseems certain that global atmospheric concentra-tions of greenhouse gases will continue to rise.Thus, unless the predictive GCMS are seri-ously flawed, average global temperatures areexpected to increase several degrees over thenext century, even under the most optimisticemissions scenarios (see box 2-B).1
If climate change is inevitable, then so isadaptation to climate change. Society and naturemay have to cope with rising sea levels, morefrequent drought and periods of temperatureextremes, changes in water supplies, disruption ofecosystems, and changes in many other climate-sensitive natural resources (see ch. 2). The termadaptation, as used here, means any adjustment to
1 All chapters, boxes, figures, and tables cited here can be found in volumes 1 and 2 of this report. Volume 1 addresses coastal areas, waterresources, and agriculture; volume 2 includes wetlands, preserved lands, and forests.
Chapter l-Synthesis, Summary, and Policy Options I 3
altered conditions; it can be a biological, techni-cal, institutional, regulatory, behavioral, or eco-nomic response. It encompasses passive adjust-ments (e.g., biologically driven changes in plantcommunities or gradual changes in human behav-ior and tastes), deliberate reactive responses(management responses after climate changeeffects are observed), and anticipatory actions,(plannin g, engineering, or regulatory responsestaken in preparation for climate change). Through-out this report, we examine the ability of natural-resource-based systems, both unmanaged andmanaged, to adapt to climate change and considermeans by which adaptation can be enhanced bymodifying management, advancing research andtechnology, disseminating information, and tak-ing legislative actions.
Given the current inability to predict accuratelywhere, when, and how much change will occur,decisionmakers must plan for natural and man-aged systems in light of considerable uncertainty.It is understandable, under these circumstances,that postponing responses until more is knownabout climate change is very appealing. Nonethe-less, uncertainty does not mean that the Nationcannot position itself better to cope with the broadrange of impacts possible under climate change orprotect itself against potentially costly futureoutcomes. In fact, delay in responding mayleave the Nation poorly prepared to deal withthe changes that do occur and may increase thepossibility of impacts that are irreversible orotherwise very costly. Many options that willincrease the Nation’s ability to cope with theuncertainties of climate change will also help indealing with existing threats to natural resourcesystems, such as those related to climate extremes(e.g., droughts, floods, and fire) and the fragmen-tation of natural habitat.
The following sections of this chapter discussthe OTA assessment, general problems posed byclimate change, criteria for choosing strategicresponses, near-term opportunities for Congres-sional action, and summaries and frost steps forthe six resource systems studied in detail.
THE OTA ASSESSMENTThree Committees of Congress asked OTA to
help them think about coping with potentialclimate change. OTA was asked: How can theUnited States set prudent policy, given that we donot know for certain what the climate will be?This assessment attempts to answer three keyquestions:
What is at risk over what time frames?Which natural ecological systems and man-aged natural resource systems are at riskfrom climate change? How do the lead timesneeded for human interventions in thesesystems vary?
How can we best plan for an uncertainclimate? When and how should decision-makers consider the uncertain effects of achanging climate as they plan the futuremanagement of natural and managed sys-tems in the United States? What criteriashould be used?
Will we have answers when we needthem? Does the current U.S. Global ChangeResearch Program (USGCRP) reflect theshort- and long-term needs of decision-makers? Will it provide information aboutrates of climate change, the potential for‘‘surprise’ effects on different systems,potential strategies for making systems moreresilient in the face of uncertain climatechange, and adapting to the changes that mayoccur?
Society depends on natural and managed sys-tems for both basic needs and amenities. Theseinclude, for example, food, shelter, clothing,
. .drinking, energy, and recreation. Manysocial and economic problems arise when theavailability and diversity of goods and servicesdecline. Such disruptions can range fromd tosevere, and they include unemployment, famine,migration of workers, and political instability.Climate change heightens the uncertainty aboutfuture availability of desired goods and services.
4 I Preparing for an Uncertain Climate-Volume 2
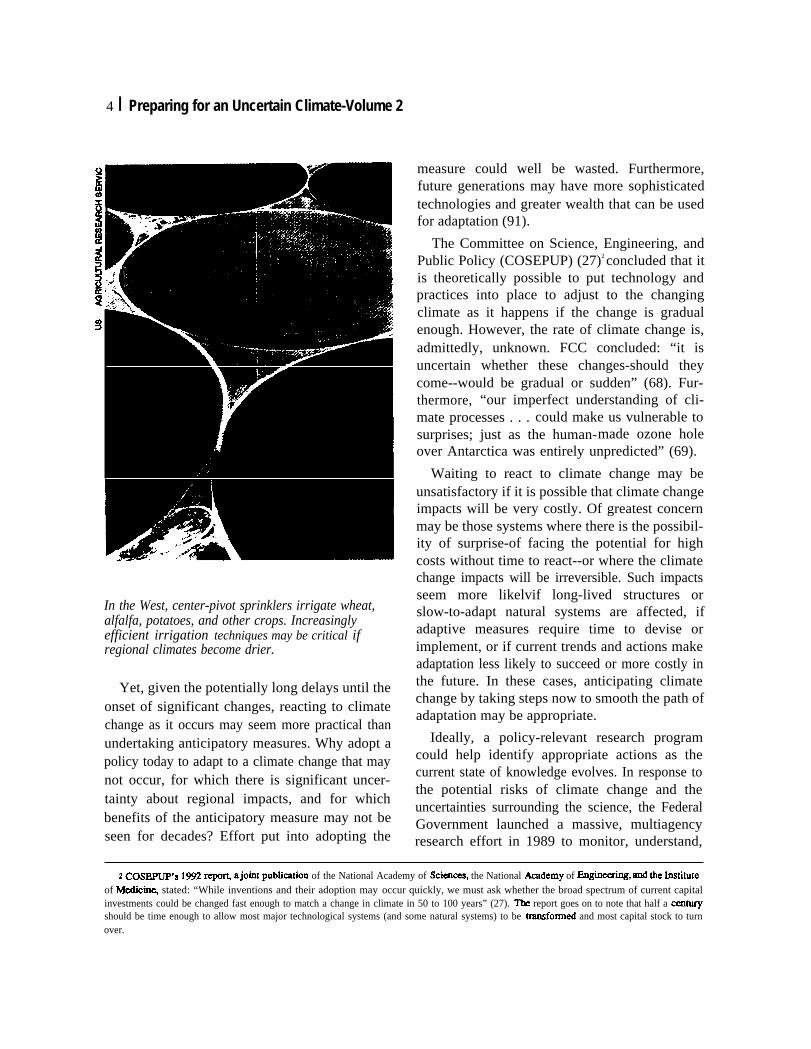
In the West, center-pivot sprinklers irrigate wheat,alfalfa, potatoes, and other crops. Increasinglyefficient irrigation techniques may be critical ifregional climates become drier.
Yet, given the potentially long delays until theonset of significant changes, reacting to climatechange as it occurs may seem more practical thanundertaking anticipatory measures. Why adopt apolicy today to adapt to a climate change that maynot occur, for which there is significant uncer-tainty about regional impacts, and for whichbenefits of the anticipatory measure may not beseen for decades? Effort put into adopting the
measure could well be wasted. Furthermore,future generations may have more sophisticatedtechnologies and greater wealth that can be usedfor adaptation (91).
The Committee on Science, Engineering, andPublic Policy (COSEPUP) (27)2 concluded that itis theoretically possible to put technology andpractices into place to adjust to the changingclimate as it happens if the change is gradualenough. However, the rate of climate change is,admittedly, unknown. FCC concluded: “it isuncertain whether these changes-should theycome--would be gradual or sudden” (68). Fur-thermore, “our imperfect understanding of cli-mate processes . . . could make us vulnerable tosurprises; just as the human-made ozone holeover Antarctica was entirely unpredicted” (69).
Waiting to react to climate change may beunsatisfactory if it is possible that climate changeimpacts will be very costly. Of greatest concernmay be those systems where there is the possibil-ity of surprise-of facing the potential for highcosts without time to react--or where the climatechange impacts will be irreversible. Such impactsseem more likelvif long-lived structures orslow-to-adapt natural systems are affected, ifadaptive measures require time to devise orimplement, or if current trends and actions makeadaptation less likely to succeed or more costly inthe future. In these cases, anticipating climatechange by taking steps now to smooth the path ofadaptation may be appropriate.
Ideally, a policy-relevant research programcould help identify appropriate actions as thecurrent state of knowledge evolves. In response tothe potential risks of climate change and theuncertainties surrounding the science, the FederalGovernment launched a massive, multiagencyresearch effort in 1989 to monitor, understand,
2 cosm’s Im r~~ ajo~ publi~tion of the National Academy of Scies.m?s, the National ACdemy of h@mXr@, and the hE@UtCof Medicrne, stated: “While inventions and their adoption may occur quickly, we must ask whether the broad spectrum of current capitalinvestments could be changed fast enough to match a change in climate in 50 to 100 years” (27). The report goes on to note that half a cesmu-yshould be time enough to allow most major technological systems (and some natural systems) to be tmnsformed and most capital stock to turnover.
Chapter l-Synthesis, Summary, and Policy Options I 5
and, ultimately, predict global changes and todetermine the mechanisms influencing thesechanges (25, 26). Chapter 3 examines theUSGCRP and suggests ways to effectively broa-den the program to both incorporate naturalresource concerns and assessment activities.
Other studies have examined systems at riskfrom climate change in various ways (see boxesI-A, l-B, and 2-F and refs. 27, 67, and 188). Tocomplement these analyses, OTA focused itsexamination of adaptation potential on areaswhere:
■ Costs of climate change may be very high.For example, flood and wind damages frommore-intense storms could lead to death andextensive property damage.
■ Impacts of climate change may be irre-versible. For example, species extinction andloss of valuable ecosystems—in wetlands,forests, and wilderness areas-may be per-manent.
■ The validity of long-term decisions madetoday will be affected by climate change.For example, trees planted with a life expec-tancy of many decades may not survive tomaturity if climate conditions change, Agri-cultural and coastal development in climate-sensitive areas may add to the likelihood offuture losses to natural disasters.
■ Preparing for catastrophic events is al-ready warranted. Reacting to climatechange may mean reacting to climate ex-tremes-such as floods, droughts, storms,and frees. Coordinated contingency planningcan help avert high costs and reduce risk ofloss.
■ There is a significant Federal role in theresearch, planning, or management ofthese systems.
On the basis of these criteria, OTA selected sixsystems for further analysis:
1. coastal areas,
2. water resources,3. agriculture,
4. wetlands,5. preserves (federally protected natural areas),
and6. forests.
The first three systems are managed natural-re-source-based systems with a high degree ofgovernment involvement and a complex systemof incentives and subsidies in place; these aregrouped together in volume 1 of the report. Theother three systems include less-managed naturalsystems and are presented together in volume 2.Both volumes contain this summary chapter, aprimer on climate change, and a chapter on theFederal research effort. Box 1-A highlights ouroverall methodological approach.
Each of the six systems OTA examined isstressed to some degree today, and that mayinfluence how well it can respond to any changein the future. For example, because populations incoastal areas are growing, the exposure to costlynatural disasters is increasing. Water scarcity andwater-quality concerns are already common inmany parts of the United States. Current agricul-tural support programs often distort and constrainchoices about crop and farm management. Wet-land loss continues-albeit at a much slower ratethan 20 years ago--despite a stated national goalof “no net loss’ (see vol. 2, ch. 4). Preservednatural areas serve aesthetic, recreational, andbiodiversity functions, but may not be adequate insize or distribution to maintain wildlife and plantspecies in the face of growing habitat loss andfragmentation. U.S. forest managers are finding itincreasingly difficult to meet the sometimescompeting demands for recreation, environmentalservices, and commercial wood products.
Water is an integral element of all of theresource systems discussed in this report. Itsabundance, location, and seasonal distribution areclosely linked to climate, and this link has hadmuch to do with where cities have flourished,how agriculture has developed, and what floraand fauna inhabit a region. Water quality andquantity will remain key to the economy. Future
6 Preparing for an Uncertain Climate-Volume 2
Box l-A–The OTA Study in Context
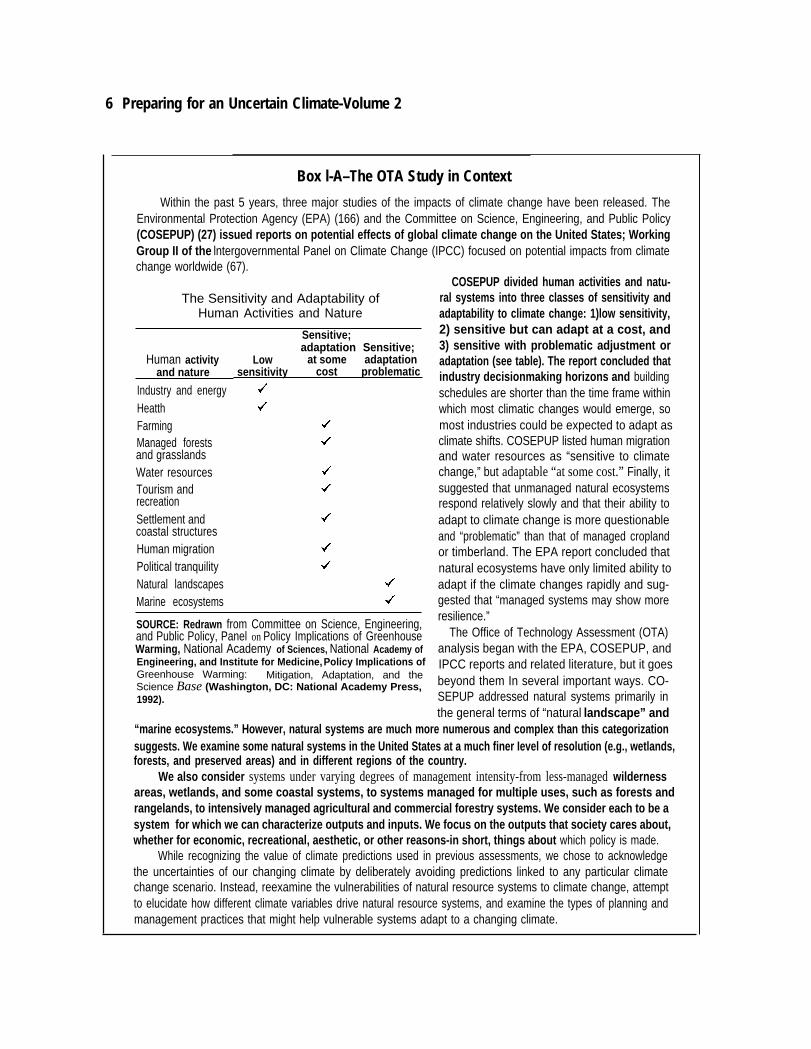
Within the past 5 years, three major studies of the impacts of climate change have been released. TheEnvironmental Protection Agency (EPA) (166) and the Committee on Science, Engineering, and Public Policy(COSEPUP) (27) issued reports on potential effects of global climate change on the United States; WorkingGroup II of the lntergovernmental Panel on Climate Change (IPCC) focused on potential impacts from climatechange worldwide (67).
The Sensitivity and Adaptability ofHuman Activities and Nature
Human activityand nature
Industry and energyHeatthFarmingManaged forestsand grasslandsWater resourcesTourism andrecreationSettlement andcoastal structuresHuman migrationPolitical tranquilityNatural landscapesMarine ecosystems
Sensitive;adaptation Sensitive;
Low at some adaptationsensitivity cost problematic
SOURCE: Redrawn from Committee on Science, Engineering,and Public Policy, Panel on Policy Implications of GreenhouseWarming, National Academy of Sciences, National Academy ofEngineering, and Institute for Medicine, Policy Implications ofGreenhouse Warming: Mitigation, Adaptation, and theScience Base (Washington, DC: National Academy Press,1992).
COSEPUP divided human activities and natu-ral systems into three classes of sensitivity andadaptability to climate change: 1)low sensitivity,2) sensitive but can adapt at a cost, and3) sensitive with problematic adjustment oradaptation (see table). The report concluded thatindustry decisionmaking horizons and buildingschedules are shorter than the time frame withinwhich most climatic changes would emerge, somost industries could be expected to adapt asclimate shifts. COSEPUP listed human migrationand water resources as “sensitive to climatechange,” but adaptable “at some cost.” Finally, itsuggested that unmanaged natural ecosystemsrespond relatively slowly and that their ability toadapt to climate change is more questionableand “problematic” than that of managed croplandor timberland. The EPA report concluded thatnatural ecosystems have only limited ability toadapt if the climate changes rapidly and sug-gested that “managed systems may show moreresilience.”
The Office of Technology Assessment (OTA)analysis began with the EPA, COSEPUP, andIPCC reports and related literature, but it goesbeyond them In several important ways. CO-SEPUP addressed natural systems primarily inthe general terms of “natural landscape” and
“marine ecosystems.” However, natural systems are much more numerous and complex than this categorizationsuggests. We examine some natural systems in the United States at a much finer Ievel of resolution (e.g., wetlands,forests, and preserved areas) and in different regions of the country.
We also consider systems under varying degrees of management intensity-from less-managed wildernessareas, wetlands, and some coastal systems, to systems managed for multiple uses, such as forests andrangelands, to intensively managed agricultural and commercial forestry systems. We consider each to be asystem for which we can characterize outputs and inputs. We focus on the outputs that society cares about,whether for economic, recreational, aesthetic, or other reasons-in short, things about which policy is made.
While recognizing the value of climate predictions used in previous assessments, we chose to acknowledgethe uncertainties of our changing climate by deliberately avoiding predictions linked to any particular climatechange scenario. Instead, reexamine the vulnerabilities of natural resource systems to climate change, attemptto elucidate how different climate variables drive natural resource systems, and examine the types of planning andmanagement practices that might help vulnerable systems adapt to a changing climate.
Chapter l-Synthesis, Summary, and Policy Options 7
Timing is key to our analyses. In addition to the sensitivity of systems to climate change, the lead time neededfor human interventions in these systems also varies, as does the time frame for systems to respond. Continuationof the structure, function, and services of many systems in an uncertain future depends on decisions being madetoday. In this report, we highlight how today’s decisions about long-lived systems (e.g., forests and water resourceprojects) may determine how those systems respond to tomorrow’s unknown climate.
Finally, and perhaps most importantly for Congress, our assessment examines the institutions and legislativeframework that surround natural and built systems in the United States today. Whether or not a system can adaptto a changing climate may depend on how adaptable the institutions themselves are. Many systems transcendagency, geographic, or legislative boundaries; such fragmentation can impede adaptation. OTA identifies theserigidities and offers new legislative, coordination, planning, and management options to facilitate adaptation.
water availability is essential for continued serv-ices and functions from coasts, water resources,agriculture, preserves, wetlands, and forests. Com-petition for water, whether for irrigation, recrea-tion, wildlife, or urban use, is likely to heighten insome regions of the country. Throughout thereport, we highlight this and other intersectingissues in cross-cutting boxes, indicated by a bar oficons representing the six systems studied (seetable l-l).
THE PROBLEM OF CLIMATE CHANGEClimate change alters the baseline against
which future actions are gauged. Our lifestyles,water supplies, and food supplies and other thingssociety values from natural resources rely on adependable, consistent, and sustainable supply.Our institutions and infrastructure presume thatthe past is a reasonable surrogate for the future.When designing reservoirs, for example, historicrainfall patterns are assumed to provide a goodindication of the range of future patterns. Afarmer plants knowing that at times, weatherconditions will cause a crop to fail, but with theexpectation-based on past climate-that thecrop will succeed, in most years.
Climate change poses two potential problemsfor existing management strategies for resources:
1) increased unpredictability resulting from chang-ing climate averages, and 2) increased risk ofsurprises or large-scale losses. These, togetherwith the ‘‘background’ of increasing population,greater future demand, and growing competitionfor the use of scarce resources, make the need toimprove the Nation’s ability to deal with anuncertain climate all the more urgent.
Stresses on resources are most acute and visi-ble during extreme events such as floods anddroughts. Our response to such events has oftenproven to be expensive and unsatisfactory. Dam-ages from the Mississippi River flooding in 1993are expected to range from $5 billion to $10billion, with Federal disaster payments of about$3 billion. Almost $4 billion in Federal paymentswent to farmers suffering crop losses during the1988 drought. Hurricane Hugo cost the FederalGovernment about $1.6 billion. HurricaneAndrew topped $2 billion in Federal disasterpayments, and many complained about the Govern-ment’s response.3 Policies that improve the Na-tion’s ability to prepare for and cope moreeffectively with climate hazards (e.g., floods,frees, and droughts) would be valuable now andwould help prepare the Nation for a less certainfuture.
3 Hurricane Andrew’s estimated cost to property insurers as of February 1993 is at least $15.5 billion (136). Additional losses involveduninsured property, public utility equipment (e.g., power lines), crop damage, property insured under the National Flood Insurance and theSmall Business Adminis tration programs, lost tax revenue, and the costs of emergency services.
8 I Preparing for an Uncertain Climate-Volume 2
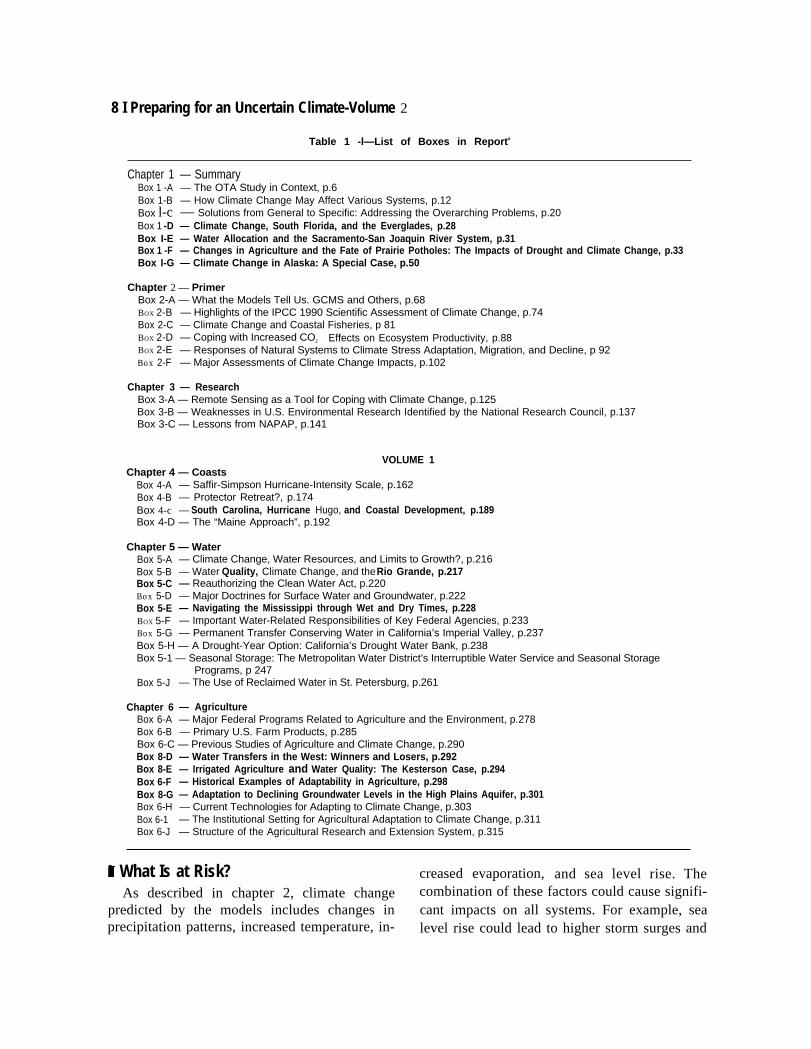
Table 1 -l—List of Boxes in Reporta
Chapter 1 — SummaryBox 1 -A — The OTA Study in Context, p.6Box 1-B — How Climate Change May Affect Various Systems, p.12Box l-c — Solutions from General to Specific: Addressing the Overarching Problems, p.20Box 1 -D — Climate Change, South Florida, and the Everglades, p.28Box I-E — Water Allocation and the Sacramento-San Joaquin River System, p.31Box 1 -F — Changes in Agriculture and the Fate of Prairie Potholes: The Impacts of Drought and Climate Change, p.33Box I-G — Climate Change in Alaska: A Special Case, p.50
Chapter 2 — PrimerBox 2-A — What the Models Tell Us. GCMS and Others, p.68BOX 2-B — Highlights of the IPCC 1990 Scientific Assessment of Climate Change, p.74Box 2-C — Climate Change and Coastal Fisheries, p 81BOX 2-D — Coping with Increased CO2 Effects on Ecosystem Productivity, p.88BOX 2-E — Responses of Natural Systems to Climate Stress Adaptation, Migration, and Decline, p 92Box 2-F — Major Assessments of Climate Change Impacts, p.102
Chapter 3 — ResearchBox 3-A — Remote Sensing as a Tool for Coping with Climate Change, p.125Box 3-B — Weaknesses in U.S. Environmental Research Identified by the National Research Council, p.137Box 3-C — Lessons from NAPAP, p.141
VOLUME 1Chapter 4 — Coasts
Box 4-A — Saffir-Simpson Hurricane-Intensity Scale, p.162Box 4-B — Protector Retreat?, p.174Box 4-c — South Carolina, Hurricane Hugo, and Coastal Development, p.189Box 4-D — The “Maine Approach”, p.192
Chapter 5 — WaterBox 5-A — Climate Change, Water Resources, and Limits to Growth?, p.216Box 5-B — Water Quality, Climate Change, and the Rio Grande, p.217Box 5-C — Reauthorizing the Clean Water Act, p.220Box 5-D — Major Doctrines for Surface Water and Groundwater, p.222Box 5-E — Navigating the Mississippi through Wet and Dry Times, p.228BOX 5-F — Important Water-Related Responsibilities of Key Federal Agencies, p.233Box 5-G — Permanent Transfer Conserving Water in California’s Imperial Valley, p.237Box 5-H — A Drought-Year Option: California’s Drought Water Bank, p.238Box 5-1 — Seasonal Storage: The Metropolitan Water District’s Interruptible Water Service and Seasonal Storage
Programs, p 247Box 5-J — The Use of Reclaimed Water in St. Petersburg, p.261
Chapter 6 — AgricultureBox 6-A — Major Federal Programs Related to Agriculture and the Environment, p.278Box 6-B — Primary U.S. Farm Products, p.285Box 6-C — Previous Studies of Agriculture and Climate Change, p.290Box 8-D — Water Transfers in the West: Winners and Losers, p.292Box 8-E — Irrigated Agriculture and Water Quality: The Kesterson Case, p.294Box 6-F — Historical Examples of Adaptability in Agriculture, p.298Box 8-G — Adaptation to Declining Groundwater Levels in the High Plains Aquifer, p.301Box 6-H — Current Technologies for Adapting to Climate Change, p.303Box 6-1 — The Institutional Setting for Agricultural Adaptation to Climate Change, p.311Box 6-J — Structure of the Agricultural Research and Extension System, p.315
9 What Is at Risk? creased evaporation, and sea level rise. TheAs described in chapter 2, climate change combination of these factors could cause signifi-
predicted by the models includes changes in cant impacts on all systems. For example, seaprecipitation patterns, increased temperature, in- level rise could lead to higher storm surges and
Chapter l-Synthesis, Summary, and Policy Options I 9
VOLUME 2Chapter 4 — Wetlands
Box 4-A —Box 4-B —Box 4-C —BOX 4-D —Box 4-E —Box 4-F —Box 4-G —Box 4-H —Box 4-I —
Chapter 5 —BOX 5-A —BOX 5-B —Box 5-C —BOX 5-D —BOX 5-E —Box 5-F —60X 5-G —BOX 5-H —Box 5-1 —BOX 5-J —BOX 5-K —BOX 5-L —BOX 5-M —
Chapter 6 —Box 6-A —Box 6-B —BOX 6-C —Box 6-D —Box 6-E —Box 6-F —Box 6-G —Box 6-H —
Wetland Restoration and Mitigation. Maintaining Wetland Functions and Values, p.154How Wet Is A Wetland? The Debate Over Which Wetlands to Regulate, p 157Wetland Types and Distribution, p 160Why Care About Wetlands?, p.162Is a Wetland a Place or a Process?, p 166Louisiana and Sea Level Rise: A Preview of What’s to Come?, p.173How Will Climate Change Affect Wetlands?, p 175Will Climate Change Increase Conflicts Over Riparian Wetlands in the Arid West?, p.178The Wetlands Policy Space, p 189
Preserves: Federally Protected Natural AreasClimate Change and Management Philosophies for Natural Area Management, p 221The Strategic Dilemma for Protecting Natural Areas Under Climate Change, p.223Federally Protected Natural Areas The Legislative Framework, p.228Implicatlons for Endangered Species Conservation Under a Changing Climate, p 235Landscape Fragmentation Islands of Nature in a Sea of Human Activity, p.241Some Innovative Management Models Toward Ecosystem Management in Natural Areas, p.244Competition for Water: The Case of the Stillwater National Wildlife Management Area, p.252Water and Natural Areas Under Climate Change, p.255The Yellowstone Fires of 1988 Harbinger of Climate Change and Fire Management Conflicts, p 262Possible Funding Sources for Conservation Programs, p 265The Sustainable Biosphere Initiative Articulating an Ecological Research Agenda for Global Change, p 269Buliding Blocks for Integrated Information Systems, p 270Restoration Ecology Giving Nature a Helping Hand Under Climate Change, p 276
ForestsMajor Forest Types of the United States, p 306Forests and Carbon Sequestration, p 310Major Federal Laws Related to Forest Management, p 312Southern Bottomland Hardwoods” Converting Wetland Forests to Agriculture, p.316The Blue Mountains: Forest Decline and Climate Change, p.318Current Weather-Related Stresses on Selected Forests, p 324Private Property and Fire Risk, p 329Public Grazing Lands Management Dilemmas, p.334
a Shading indicates boxes that discuss interactions across resource systems
increased erosion of coasts (see vol. 1, ch. 4).Shifts in precipitation patterns could cause morefloods, droughts, water-supply disruptions, hy-dropower reductions, and groundwater overdrafts,especially in the arid West (see vol. 1, ch. 5). Theideal range for agricultural crops might movenorth as temperatures increase, and drought lossescould become more frequent (see vol. 1, ch. 6).Forests could experience more-frequent fire anddiebacks driven by drought, insects, and disease(see vol. 2, ch. 6). It could become difficult toretain unique assemblages of plants and animalsin preserves as the climate to which they areadapted effectively shifts northward or to higherelevations (see vol. 2, ch. 5). With sea level rise,
loss of coastal wetlands may be accelerated, andregional drying could eliminate some prairiepotholes (see vol. 2, ch. 4).
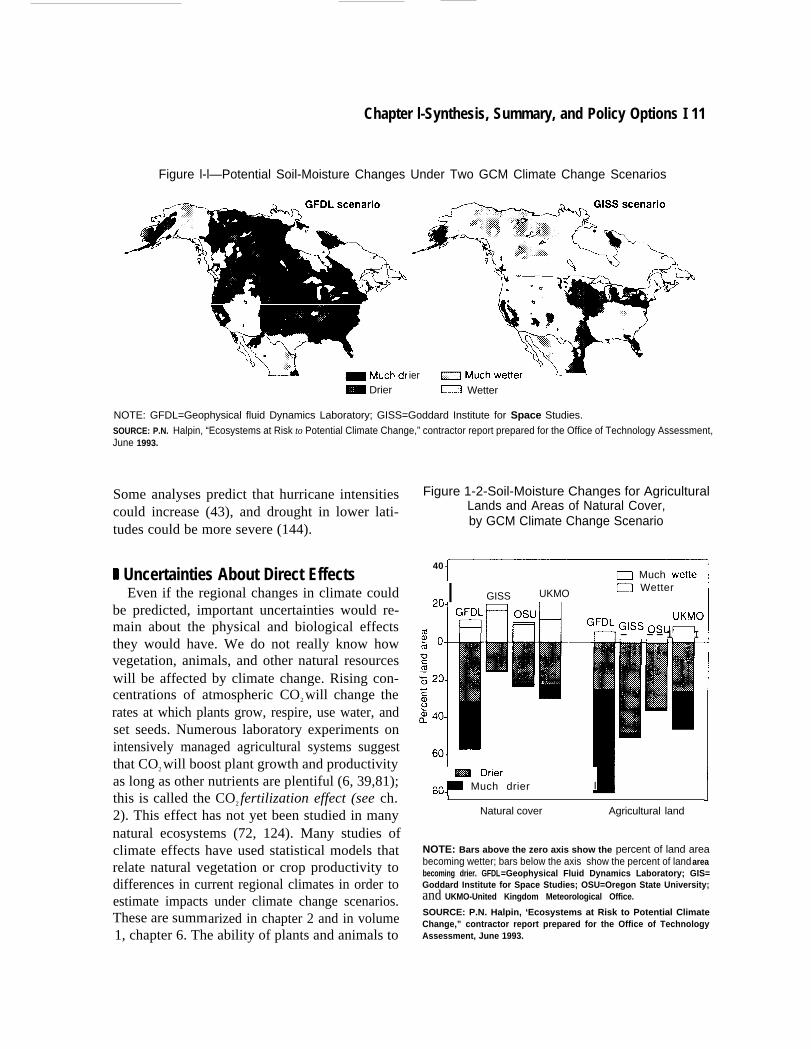
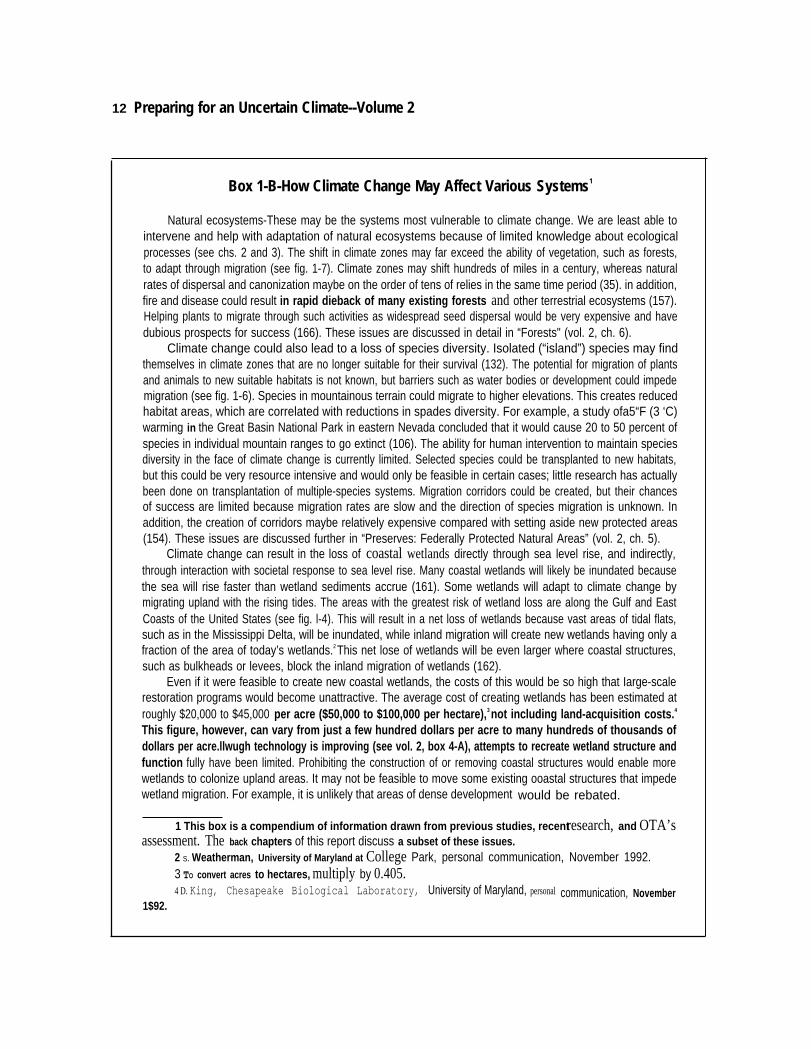
The loss of soil moisture that might result fromhigher evaporation rates at warmer temperaturesis likely to present the greatest threat to naturalsystems. Figure 1-1 shows areas of the UnitedStates that may undergo significant changes insoil moisture based on climate changes projectedby two GCMS. The Goddard Institute for SpaceStudies (GISS) scenario suggests that large areasface moderate drying. The Geophysical FluidDynamics Laboratory (GFDL) scenario showsmore severe drying across much of the eastern andcentral United States. Figure 1-2 illustrates the
10 I Preparing for an Uncertain Climate-Volume
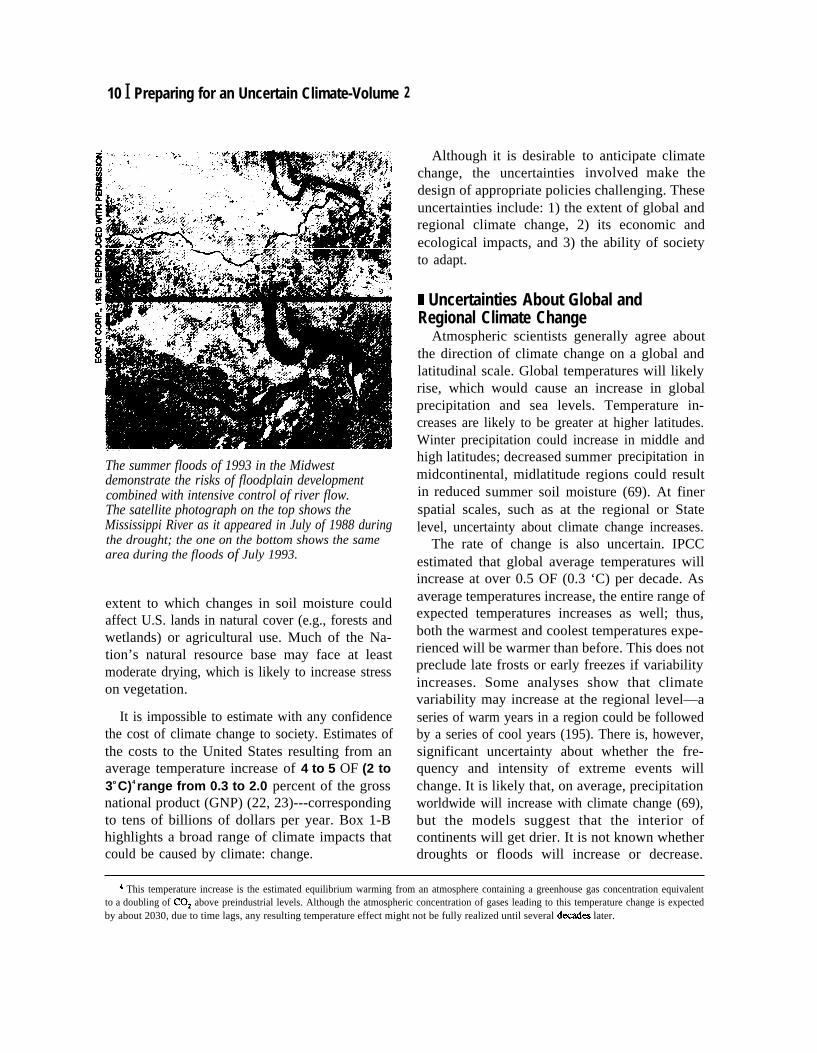
The summer floods of 1993 in the Midwestdemonstrate the risks of floodplain developmentcombined with intensive control of river flow.The satellite photograph on the top shows theMississippi River as it appeared in July of 1988 duringthe drought; the one on the bottom shows the samearea during the floods of July 1993.
extent to which changes in soil moisture couldaffect U.S. lands in natural cover (e.g., forests andwetlands) or agricultural use. Much of the Na-tion’s natural resource base may face at leastmoderate drying, which is likely to increase stresson vegetation.
It is impossible to estimate with any confidencethe cost of climate change to society. Estimates ofthe costs to the United States resulting from anaverage temperature increase of 4 to 5 OF (2 to3o C)4 range from 0.3 to 2.0 percent of the grossnational product (GNP) (22, 23)---correspondingto tens of billions of dollars per year. Box 1-Bhighlights a broad range of climate impacts thatcould be caused by climate: change.
2
Although it is desirablechange, the uncertainties
to anticipate climateinvolved make the
design of appropriate policies challenging. Theseuncertainties include: 1) the extent of global andregional climate change, 2) its economic andecological impacts, and 3) the ability of societyto adapt.
I Uncertainties About Global andRegional Climate Change
Atmospheric scientists generally agree aboutthe direction of climate change on a global andlatitudinal scale. Global temperatures will likelyrise, which would cause an increase in globalprecipitation and sea levels. Temperature in-creases are likely to be greater at higher latitudes.Winter precipitation could increase in middle andhigh latitudes; decreased summer precipitation inmidcontinental, midlatitude regions could resultin reduced summer soil moisture (69). At finerspatial scales, such as at the regional or Statelevel, uncertainty about climate change increases.
The rate of change is also uncertain. IPCCestimated that global average temperatures willincrease at over 0.5 OF (0.3 ‘C) per decade. Asaverage temperatures increase, the entire range ofexpected temperatures increases as well; thus,both the warmest and coolest temperatures expe-rienced will be warmer than before. This does notpreclude late frosts or early freezes if variabilityincreases. Some analyses show that climatevariability may increase at the regional level—aseries of warm years in a region could be followedby a series of cool years (195). There is, however,significant uncertainty about whether the fre-quency and intensity of extreme events willchange. It is likely that, on average, precipitationworldwide will increase with climate change (69),but the models suggest that the interior ofcontinents will get drier. It is not known whetherdroughts or floods will increase or decrease.
4 This temperature increase is the estimated equilibrium warming from an atmosphere containing a greenhouse gas concentration equivalentto a doubling of COZ above preindustrial levels. Although the atmospheric concentration of gases leading to this temperature change is expectedby about 2030, due to time lags, any resulting temperature effect might not be fully realized until several deeades later.
Chapter l-Synthesis, Summary, and Policy Options I 11
Figure l-l—Potential Soil-Moisture Changes Under Two GCM Climate Change Scenarios
/
ier~ Drier C13 Wetter
NOTE: GFDL=Geophysical fluid Dynamics Laboratory; GISS=Goddard Institute for Space Studies.
SOURCE: P.N. Halpin, “Ecosystems at Risk to Potential Climate Change,” contractor report prepared for the Office of Technology Assessment,June 1993.
Some analyses predict that hurricane intensitiescould increase (43), and drought in lower lati-tudes could be more severe (144).
Figure 1-2-Soil-Moisture Changes for AgriculturalLands and Areas of Natural Cover,by GCM Climate Change Scenario
B Uncertainties About Direct EffectsEven if the regional changes in climate could
be predicted, important uncertainties would re-main about the physical and biological effectsthey would have. We do not really know howvegetation, animals, and other natural resourceswill be affected by climate change. Rising con-centrations of atmospheric CO2 will change therates at which plants grow, respire, use water, andset seeds. Numerous laboratory experiments onintensively managed agricultural systems suggestthat CO2 will boost plant growth and productivityas long as other nutrients are plentiful (6, 39,81);this is called the CO2 fertilization effect (see ch.2). This effect has not yet been studied in manynatural ecosystems (72, 124). Many studies ofclimate effects have used statistical models thatrelate natural vegetation or crop productivity todifferences in current regional climates in order toestimate impacts under climate change scenarios.These are summarized in chapter 2 and in volume1, chapter 6. The ability of plants and animals to
40i D Much wettel
I GISS UKMOnn0 Wetter
: o+-
= Drier~fi _ Much drier IOu+
- — 1— I
I
Natural cover Agricultural land
NOTE: Bars above the zero axis show the percent of land areabecoming wetter; bars below the axis show the percent of land areabecoming drier. GFDL=Geophysical Fluid Dynamics Laboratory; GIS=Goddard Institute for Space Studies; OSU=Oregon State University;and UKMO-United Kingdom Meteorological Office.
SOURCE: P.N. Halpin, ‘Ecosystems at Risk to Potential ClimateChange,” contractor report prepared for the Office of TechnologyAssessment, June 1993.
12 Preparing for an Uncertain Climate--Volume 2
Box 1-B-How Climate Change May Affect Various Systems1
Natural ecosystems-These may be the systems most vulnerable to climate change. We are least able tointervene and help with adaptation of natural ecosystems because of limited knowledge about ecologicalprocesses (see chs. 2 and 3). The shift in climate zones may far exceed the ability of vegetation, such as forests,to adapt through migration (see fig. 1-7). Climate zones may shift hundreds of miles in a century, whereas naturalrates of dispersal and canonization maybe on the order of tens of relies in the same time period (35). in addition,fire and disease could result in rapid dieback of many existing forests and other terrestrial ecosystems (157).Helping plants to migrate through such activities as widespread seed dispersal would be very expensive and havedubious prospects for success (166). These issues are discussed in detail in “Forests" (vol. 2, ch. 6).
Climate change could also lead to a loss of species diversity. Isolated (“island”) species may findthemselves in climate zones that are no longer suitable for their survival (132). The potential for migration of plantsand animals to new suitable habitats is not known, but barriers such as water bodies or development could impedemigration (see fig. 1-6). Species in mountainous terrain could migrate to higher elevations. This creates reducedhabitat areas, which are correlated with reductions in spades diversity. For example, a study ofa5“F (3 ‘C)warming in the Great Basin National Park in eastern Nevada concluded that it would cause 20 to 50 percent ofspecies in individual mountain ranges to go extinct (106). The ability for human intervention to maintain speciesdiversity in the face of climate change is currently limited. Selected species could be transplanted to new habitats,but this could be very resource intensive and would only be feasible in certain cases; little research has actuallybeen done on transplantation of multiple-species systems. Migration corridors could be created, but their chancesof success are limited because migration rates are slow and the direction of species migration is unknown. Inaddition, the creation of corridors maybe relatively expensive compared with setting aside new protected areas(154). These issues are discussed further in “Preserves: Federally Protected Natural Areas” (vol. 2, ch. 5).
Climate change can result in the loss of coastal wetlands directly through sea level rise, and indirectly,through interaction with societal response to sea level rise. Many coastal wetlands will likely be inundated becausethe sea will rise faster than wetland sediments accrue (161). Some wetlands will adapt to climate change bymigrating upland with the rising tides. The areas with the greatest risk of wetland loss are along the Gulf and EastCoasts of the United States (see fig. l-4). This will result in a net loss of wetlands because vast areas of tidal flats,such as in the Mississippi Delta, will be inundated, while inland migration will create new wetlands having only afraction of the area of today’s wetlands.2 This net lose of wetlands will be even larger where coastal structures,such as bulkheads or levees, block the inland migration of wetlands (162).
Even if it were feasible to create new coastal wetlands, the costs of this would be so high that Iarge-scalerestoration programs would become unattractive. The average cost of creating wetlands has been estimated atroughly $20,000 to $45,000 per acre ($50,000 to $100,000 per hectare),3 not including land-acquisition costs.4
This figure, however, can vary from just a few hundred dollars per acre to many hundreds of thousands ofdollars per acre.llwugh technology is improving (see vol. 2, box 4-A), attempts to recreate wetland structure andfunction fully have been limited. Prohibiting the construction of or removing coastal structures would enable morewetlands to colonize upland areas. It may not be feasible to move some existing ooastal structures that impedewetland migration. For example, it is unlikely that areas of dense development would be rebated.
1 This box is a compendium of information drawn from previous studies, recent research, and OTA’sassessment. The back chapters of this report discuss a subset of these issues.
2 S. Weatherman, University of Maryland at College Park, personal communication, November 1992.3 TO convert acres to hectares, multiply by 0.405.4 D. King, Chesapeake Biological Laboratory, University of Maryland, personal communication, November
1$92.
Chapter 1--Synthesis, Summary, and Policy Options 13
Prairie pothole and riparian wetlands in regions that get drier maybe at greater risk than those in regions thatget wetter. For example, in the North Central States, increases in temperatures and evaporation rates could causemany prairie potholes to shrink or disappear, leading to further declines in already diminished continental waterfowlpopulations (9). Tundra may shrink as increased temperatures allow the permafrost to thaw and drain (see boxl-G). In addition, wetlands of any type that are already degraded by pollution, water diversions, or fragmentationmay also be particularly vulnerable (196, 199). The status and vulnerability of coastal, riparian, depressional, andtundra wetlands are discussed in “Wetlands” (vol. 2, oh. 4).
Fisheries-The potential effects of climate change on aquatic ecosystems have been studied very Iittle todate, and could vary significantly. In some cases, marine fish may be able to migrate to new, more suitable habitats,depending on several factors, if food sources are available (80). Some freshwater fish in open waters, such asthe Great Lakes, could benefit from a larger thermal niche (96). Fish in small lakes and streams, however, maysuffer from increases in temperature that adversely affect survival, reproduction, or their ability to migrate to coderlocations (101). Changes in water quality will also affect the survival of aquatic organisms. Climate change mayalter circulation patterns in many lakes, reducing dissolved-oxygen concentrations. Higher temperatures will alsoact to reduce dissolved-oxygen concentrations (71 ). Sea level rise will increase saltwater intrusion of estuaries,potentially benefiting marine fish at the expense of freshwater species (60). However, changes in estuaries couldhave broad impacts on the U.S. fishery. By far, the greatest portion of commercial catches, with the exception ofthose from Alaskan fisheries, are composed of estuarine-dependent species (139). Ongoing alterations of criticalhabitat (such as those caused by geographic fragmentation and pollution) may be exacerbated by climate change.Box2-C (ch. 2) discusses, by region, the condition and value of fisheries today, current problems, and the potentialimpacts of climate change.
Agriculture-This system is very sensitive to climate, but climate change impacts maybe offset by intensemanagement over short time frames. High temperatures and drought could reduce crop yields, although this effectcould be counteracted by higher atmospheric concentrations of carbon dioxide and longer growing seasons inhigher latitudes (129). The potential for agricuitural adaptation, particularly at the farm level, is very high (30).Changes in management practices (e.g., changing planting dates or using irrigation or crop-switching) can reduceor eliminate many of the potentially negative impacts of climate change. Shifts in climate zones would result inchanges in relative productivity y levels, with some areas increasing output, and other areas reducing output dueto increased competition (l). See “Agriculture” (vol. 1, ch. 6) for further discussion.
Coastal resources-Cities, roads, airports, and other coastal resources are vulnerable to flooding from sealevel rise and hurricanes. The population near the coast is growing faster than populations in any other region ofthe country, and the construction of buildings and infrastructure to serve this growing population is proceedingrapidly. As a result protection against and recovery from hazards peculiar to the coastal zone, such as hurricanesand sea level rise, are becoming ever more costly (11). The combination of popularity and risk in coastal areashas important near-term consequences for the Safety of coastal residents, protection of property, maintenance oflocal economies, and preservation of remaining natural areas. These points are discussed further in “Coasts” (vol.1, ch. 4).
Water resources-These resources are vulnerable to several climate change impacts. Changes inprecipitation and higher levels of evapotranspiration can combine to affect surface-water and groundwatersupplies, flood and drought frequency, and hydropower production. Arid basins could experience the largestrelative change in water flow from climate change (67). Numerous studies have been conducted on the relativevulnerability of the major U.S. river basins to flood and drought, supply disruptions, hydropower reductions,groundwater overdrafts, and extreme events (46,49,66, 166). They conclude that the water resource regions mostvulnerable to some or all of these events are the Great Basin, California Missouri, Arkansas, Texas Gulf l RioGrande, and Lower Colorado (see fig. 1-5). See “water” (vol. 1, ch. 5) for more information; Appendix 5.1 listsState-by-State problems,
(Continued on next page)
14 Preparing for an Uncertain Climate-Volume 2
Box 1-B--How Climate Change May Affect Various Systems--(Continued)
Human health--Climate change could affect human health, but there is a great deal of uncertainty aboutwhether mortality and morbidity would actually increase and about the potential for adaptive measures (such asthe use of air conditioning) to offset any negative impacts. Several studies have concludedthat the potential rangeof infectious diseases could shift with climate change, but the exact nature of these shifts is uncertain (94). Evenif the range of dbase-carrying vectors, such as mosqitoes, changes, enhanced pest-control measures couldnullify the increased threat of disease. Effects of climate change in other countries could displace somepopulations. If “environmental refugees” lead to an increase in immigration, there is the potential for increasedimportation of communicable diseases into the United States (164). Other studies have shown that climate changecould lead to increased cases of heat-stress mortality (74). Uncertainties about changes in human physiologicaland behavioral response make it difficult to draw conclusions about the risks of climate change to humanhealth.
Energy--Higher temperatures will no doubt increase energy demand for cooling and decrease energydemand for heating. This would result in an increase in the demand for electricity (primarily for air conditioning)and for electric-generating capacity (93). This new demand would not be completely offset by reductions in theuse of oil and gas for heating (96). The largest capital costs would be associated with increased power plantconstruction, which could cost as much as $170 to $920 billion, about 12 percent inure than the increasescapacity-needed to population and
ineconomic growth through the middle of the next century (93). As with sea
level rise, adapting to increased energy demand could involve significant costs.Transportation--Some forms of transportation could be positively or negatively affected by climate change.
inland shipping maybe the most sensitive to climate change. On the one hand, warmer winters wouid likely resultin less ice cover and a longer shipping season. For example, ice cover on the Great Lakes could be reduced by5 to 13 weeks (4), lowering shipping and related costs (78). On the other hand, lower river flow and lake levelscould increase shipping costs by reducing shipping tonnage capacity or blocking shipping (143). Some roads nearthe coast may have to be moved or protected from sea level rise. in many instances, adaptation is highly probablein transportation at some cost to the economy (see vol. 1, box 5-~ “Navigating the Mississippi through Wet andDry Times”).
adapt to changes in climate, either throughphysiological adjustment or through migration, is Ability to Adaptuncertain. Historically, trees can disperse andmigrate about 60 miles (100 kilometers)5 percentury, but the projected rates of temperaturechange would require migration rates 5 to 10times faster for forests to remain in suitablehabitats (35, 36). The success with which naturalvegetation can migrate will depend on seeddispersal, physical barriers to migration (e.g.,mountains and developed land), competitionbetween species, and the availability of fertilesoils in areas of suitable climate.
Finally, how society will respond to whateverclimate change occurs and the resulting impactsare uncertain. Coping with climate change cantake the form of technical, institutional, regula-tory, behavioral, and economic adjustments.Future technologies and levels of income areunknown, although they will most likely improveand increase and will aid in adaptation (5). Willpopulation growth or environmental consensuslimit or expand adaptation options? Will people
5 To convert miles to kilometers, multiply by 1.609,
Chapter 1--Synthesis, Summary, and Policy Options 15
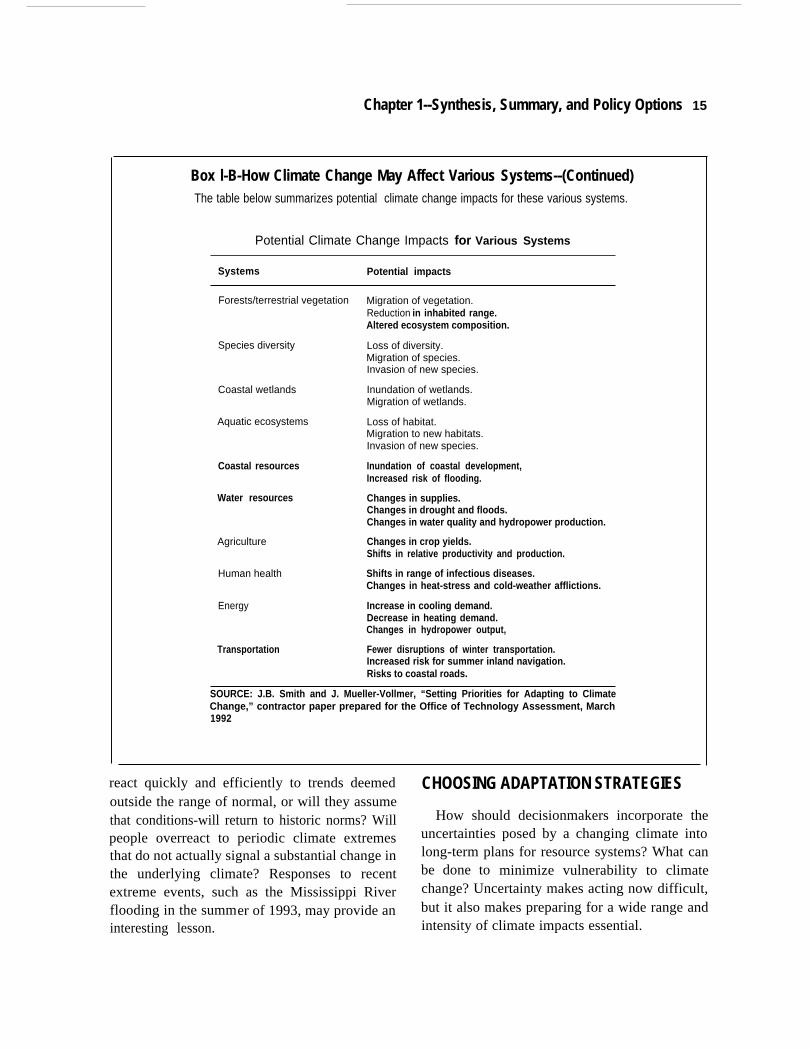
Box l-B-How Climate Change May Affect Various Systems--(Continued)The table below summarizes potential climate change impacts for these various systems.
Potential Climate Change Impacts for Various Systems
Systems Potential impacts
Forests/terrestrial vegetation Migration of vegetation.Reduction in inhabited range.Altered ecosystem composition.
Species diversity Loss of diversity.Migration of species.Invasion of new species.
Coastal wetlands Inundation of wetlands.Migration of wetlands.
Aquatic ecosystems Loss of habitat.Migration to new habitats.Invasion of new species.
Coastal resources
Water resources
Agriculture
Human health
Energy
Inundation of coastal development,Increased risk of flooding.
Changes in supplies.Changes in drought and floods.Changes in water quality and hydropower production.
Changes in crop yields.Shifts in relative productivity and production.
Shifts in range of infectious diseases.Changes in heat-stress and cold-weather afflictions.
Increase in cooling demand.Decrease in heating demand.Changes in hydropower output,
Transportation Fewer disruptions of winter transportation.Increased risk for summer inland navigation.Risks to coastal roads.
SOURCE: J.B. Smith and J. Mueller-Vollmer, “Setting Priorities for Adapting to ClimateChange,” contractor paper prepared for the Office of Technology Assessment, March1992
react quickly and efficiently to trends deemed CHOOSING ADAPTATION STRATEGIESoutside the range of normal, or will they assumethat conditions-will return to historic norms? Will How should decisionmakers incorporate the
people overreact to periodic climate extremes uncertainties posed by a changing climate into
that do not actually signal a substantial change in long-term plans for resource systems? What can
the underlying climate? Responses to recent be done to minimize vulnerability to climate
extreme events, such as the Mississippi River change? Uncertainty makes acting now difficult,
flooding in the summer of 1993, may provide an but it also makes preparing for a wide range and
interesting lesson. intensity of climate impacts essential.
16 I Preparing
g
for an Uncertain Climate-Volume 2
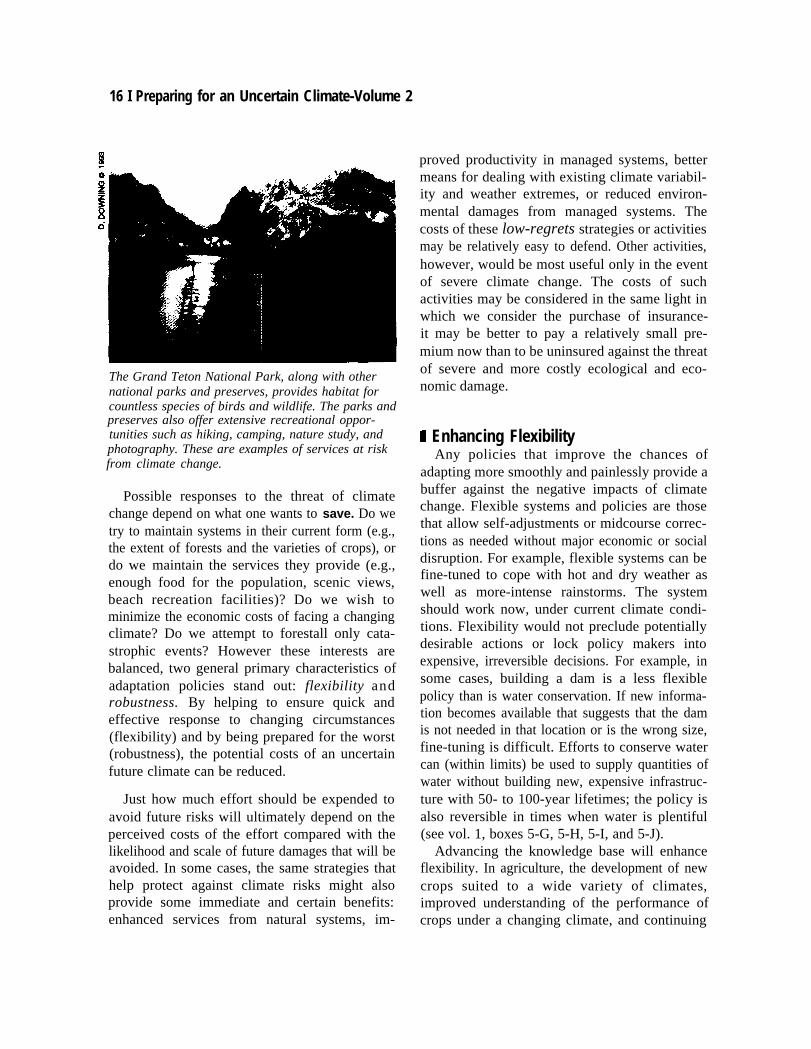
The Grand Teton National Park, along with othernational parks and preserves, provides habitat forcountless species of birds and wildlife. The parks andpreserves also offer extensive recreational oppor-tunities such as hiking, camping, nature study, andphotography. These are examples of services at riskfrom climate change.
Possible responses to the threat of climatechange depend on what one wants to save. Do wetry to maintain systems in their current form (e.g.,the extent of forests and the varieties of crops), ordo we maintain the services they provide (e.g.,enough food for the population, scenic views,beach recreation facilities)? Do we wish tominimize the economic costs of facing a changingclimate? Do we attempt to forestall only cata-strophic events? However these interests arebalanced, two general primary characteristics ofadaptation policies stand out: flexibility androbustness. By helping to ensure quick andeffective response to changing circumstances(flexibility) and by being prepared for the worst(robustness), the potential costs of an uncertainfuture climate can be reduced.
Just how much effort should be expended toavoid future risks will ultimately depend on theperceived costs of the effort compared with thelikelihood and scale of future damages that will beavoided. In some cases, the same strategies thathelp protect against climate risks might alsoprovide some immediate and certain benefits:enhanced services from natural systems, im-
proved productivity in managed systems, bettermeans for dealing with existing climate variabil-ity and weather extremes, or reduced environ-mental damages from managed systems. Thecosts of these low-regrets strategies or activitiesmay be relatively easy to defend. Other activities,however, would be most useful only in the eventof severe climate change. The costs of suchactivities may be considered in the same light inwhich we consider the purchase of insurance-it may be better to pay a relatively small pre-mium now than to be uninsured against the threatof severe and more costly ecological and eco-nomic damage.
I Enhancing FlexibilityAny policies that improve the chances of
adapting more smoothly and painlessly provide abuffer against the negative impacts of climatechange. Flexible systems and policies are thosethat allow self-adjustments or midcourse correc-tions as needed without major economic or socialdisruption. For example, flexible systems can befine-tuned to cope with hot and dry weather aswell as more-intense rainstorms. The systemshould work now, under current climate condi-tions. Flexibility would not preclude potentiallydesirable actions or lock policy makers intoexpensive, irreversible decisions. For example, insome cases, building a dam is a less flexiblepolicy than is water conservation. If new informa-tion becomes available that suggests that the damis not needed in that location or is the wrong size,fine-tuning is difficult. Efforts to conserve watercan (within limits) be used to supply quantities ofwater without building new, expensive infrastruc-ture with 50- to 100-year lifetimes; the policy isalso reversible in times when water is plentiful(see vol. 1, boxes 5-G, 5-H, 5-I, and 5-J).
Advancing the knowledge base will enhanceflexibility. In agriculture, the development of newcrops suited to a wide variety of climates,improved understanding of the performance ofcrops under a changing climate, and continuing
Chapter l-Synthesis, Summary, and Policy Options I 17
education and extension programs to providebetter-informed decisionmaking by farmers willall help smooth the path of adaptation (see vol. 1,ch. 6). In general, research that clarifies howsystems respond to climate change will helpidentify and expand the range of possible adap-tive actions and will speed their successfulimplementation.
Removing legislative or administrative con-straints that now limit our ability to change wouldalso promote flexibility. For example, the compli-cated programs of price supports in agriculturenow penalize farmers who choose to changeplanting or management practices significantly.Given the importance of agriculture in the UnitedStates, large economic costs could be associatedwith even brief delays in agricultural adjustmentto a changing climate. Other subsidies, such asthose for irrigation and those implicit in thesupport for infrastructure in coastal zones, add toour inflexibility by encouraging the developmentof built systems in areas that maybe increasinglyat risk to natural disasters. Resolving conflictsover the use of natural resources, through thecreation of organizational structures or marketincentives, should also help with our ability toimplement change.
ti Enhancing RobustnessPolicies can also minimize the risk of adverse
effects from climate change by making systemsless sensitive to climate. Robust systems are thosethat can tolerate a wide range of climate condi-tions and are, therefore, less vulnerable to climatechange extremes. Actions that increase robust-ness in a system are those that help protect againstthe threat of large-scale losses or climate sur-prises. The robustness of a system can be in-creased in several ways. One is to take actions thatmake the system itself inherently more tolerant ofa variety of climate conditions. For example,developing and planting crops that perform rea-sonably well under a wide range of climates maybe wise no matter how the climate changes.
Adding capacity to dams or other structures canmake them more ‘‘robust, that is, able toaccommodate greater variability in precipitation.Another way to increase robustness is to put avariety of mechanisms in place to protect againstpossible losses, hoping that some mechanismswill succeed even if others fail. For example, amix of management strategies for forests andnatural areas could be used to protect againstclimate change.
Improving the robustness of a system will oftenrequire an insurance strategy-something mustbe initiated now in order to avoid extremely highcosts under a much warmer climate. The idea isthat paying a small amount now will reduce therisks of a major loss in the future. For example,establishing gene banks or learning how toundertake ecosystem restoration may be an “in-vestment” that would reduce the risks of cata-strophic forest or ecosystem loss in the future.
Efforts that enhance the general health, produc-tivity, or quality of a system can also enhancerobustness by making the system more resilient,or able to tolerate some climate-related stresses.Actions promoting robustness include improvingthe quality and protection of wetlands, minimiz-ing existing threats to natural areas, and establish-ing new preserves (see vol. 2, chs. 4 and 5).Plannin g and management measures that averttrends that make adaptation more difficult in thefuture are also robust strategies.
It is not immediately obvious that naturalsystems, such as forests or wetlands, are lessrobust (more vulnerable) in the short term than aremanaged systems such as agriculture and water-supply systems. Natural systems do have someinherent buffering to protect themselves againstexisting climate variability. However, what mayput natural systems at greater risk than systemsthat are actively managed is continued stress fromclimate change over a long time period. Once anatural system declines, it may take many years torecover. Of particular concern is the possibilitythat losses to natural systems may be irreversi-ble, such as the loss of species. In managed
18 I Preparing for an Uncertain Climate-Volume 2
systems, it is much more likely that there wouldbe intervention to reduce the losses because theeconomic value at stake is often very high.
B Applying the CriteriaFederal agencies are currently making many
decisions about the management of natural re-sources that could be significantly affected byclimate change. What the Federal Governmentdecides now about the management of watersupplies, forests, wetlands, fish, wildlife, andother issues could limit or foreclose the ability ofthese resources and their managers to adapt to thefuture effects of climate change, or could helpmake us better prepared to deal with an uncertainclimate future.
Given the broad criteria of flexibility androbustness, we identified a large class of policyoptions that could remove inefficiencies, addressexisting problems, and help insure against theuncertainties posed by climate change to resourcesystems. Many studies term such options noregrets or low regrets because they make sense topursue now, even assuming no climate change.The question that arises is: Why are actions thatare supposed to be prudent, anyway, even withoutthe added impetus of climate change, beingpursued in such a limited way (5)? Actions thatappear reasonable for protecting resources cannotbe considered in a vacuum. In reality, there arebarriers of many sorts-in information, institu-tions, and process--even 10 options that appear tobe low regrets. OTA’s policy analysis focused onthese barriers and tried to identify ways toovercome them.
Another large class of policy options calls forus to be prepared for the worst. Whether theseoptions will still be seen as no-regrets onceclimate does change may depend on the rapidityand magnitude of that climate change, and thefuture response of decisionmakers. If, in the faceof signficant climate change, the no-regretsoptions prove inadequate, there could indeed beregrets that substantially more aggressive meas-
ures were not taken earlier. OTA has also lookedat some of the more aggressive measures thatwould be appropriate if the likelihood of climatechange is considered high.
The policy options presented in this report toenhance the flexibility and robustness of thevarious resource systems represent a gradationfrom ‘‘learn more about the natural resourcesystem” to “improve the technology or know-how required for adaptation” to “relax theinstitutional constraints that tend to inhibit theability or incentive to respond. ” This gradationdepends on whether the ability to respond toclimate change is limited by information, byavailable technologies, or by the institutions thatgovern the system.
Coastal systems and water resources (dis-cussed in vol. 1, chs. 4 and 5, respectively) facemany institutional factors that may limit adapta-tion. Theoretically, there is enough water tosupply needs throughout the United States, evenunder climate change. We know how to movewater from one place to another and havetechnologies to save water or even to make freshwater from salt water. However, the complexsystem of water rights, lack of incentives toconserve water, and limits on the transferabilityof water result in daunting institutional con-straints and inflexibility. In coastal systems, theinfrastructure of roads and bridges and subsidizedflood insurance encourage a degree of develop-ment in high-risk zones that maybe economicallyunwise even under current climate conditions andsea levels.
In agriculture, market incentives and annualplanting cycles make the system quite responsive,or flexible, to change. As long as there arecontinued efforts in research, technology, andinnovation that expand the base on which adapta-tion can proceed, coping with climate changeshould be relatively easy for agriculture--barringcatastrophic changes (vol. 1, ch. 6). Yet, whetheradaptation is optimal may depend greatly on ourability to remove certain institutional incentivesthat may encourage uneconomic farming of areas
Chapter l-Synthesis, Summary, and Policy Options I 19
where climatic risks are high. In this regard, farmsubsidies and disaster-assistance programs needreview and, likely, adjustment.
For less-managed systems, our ability to facili-tate natural adaptation is limited by inadequateinformation or understanding of natural processesand by the narrow range of available and suitabletechnologies for adaptation. In wetlands (vol. 2,ch. 4), sea level rise and changes in the timing andamount of precipitation will exacerbate ongoinghabitat loss. Efforts to reduce current loss willmake the system more robust and improvechances for adaptation to climate change. Actionsto minimize the possibility of irreversible damageshould receive high priority. For forests andnatural preserves (vol. 2, chs. 5 and 6), climatechange may make the continued existence ofunique assemblages of plants and animals ques-tionable. Natural areas have become the reposi-tory of biodiversity in the United States. Yet littleis known about maintainingg, changing, restoring,or transplanting natural ecosystems. There is nosystematic effort to document what is currentlypreserved and how that can be augmented orprotected under climate change, Enhancing theseareas through strategic acquisitions of land orland easements and through innovative coordina-tion of management with adjacent landownersoffers great promise as an approach for maximiz-ing protection of biodiversity. Filling in gaps inour knowledge through research would allow usto better manage and protect these areas and toreduce the risk of decline under climate change.
OVERARCHING POLICY THEMES
As we developed and evaluated policy options,using the criteria described above, for the sixdifferent resource sectors examined in this report,many sector-specific policy options appeared tocoalesce into several broad themes, or problems.Four particular themes were found to be shared byseveral or all of the sectors:
■ geographic and institutional fragmentation,W inadequate communication of climate risk,
H the need for contingency planning, and■ an ongoing Federal research effort-the
U.S. Global Change Research Program--that will not fill many key research andinformation gaps.
Each chapter addresses these themes within thecontext of the appropriate resource sector, but thecommon threads are highlighted here. Below, wedescribe the overarching themes more fully andillustrate some possible directions Congress couldtake to begin addressing these broader policychallenges. Box 1-C examines some specificoptions from the resource chapters, and relatesthem to these common themes.
H FragmentationA key problem in natural resource management
is that the most sensible management units froma resource perspective—watersheds or eco-systems—rarely correspond to the boundarieswithin which resources are actually managed.Furthermore, resources are usually owned andmanaged for multiple purposes. Many differentgovernment agencies and private owners mayhave some responsibility for the management ofa given resource, with differing incentives moti-vating its management and use. As a result,resources may be fragmented geographically andjurisdictionally.
One aspect of fragmentation is the geographi-cal division of landscapes and ecosystems thatresults from uncoordinated development and theencroachment of human activity. Such activityhas left few ecosystems intact in the lower 48States (the Greater Yellowstone Ecosystem isoften cited as the most important remainingexample). In most parts of the country, remainingnatural areas have become ‘‘islands’ of habitat,surrounded by developed or altered landscapesand vulnerable to a variety of human stresses (seevol. 2, box 5-E). This fragmentation of formerlarge ecosystems has led to greater stress on thenatural resources within the remaining fragments.Many natural areas, including the federally pro-
20 Preparing for an Uncertain Climate-Volume 2
Box 1-C--Solutions from General to Specific: Addressing the Overarching Problems
During the course of developing policy options for coping with climate change, OTA heard repeatedly frommany experts that climate change alone is not necessarily the most worrisome threat to natural resources. Rather,climate change is likely to exacerbate various trends and problems that already plague natural resourcemanagement. Current management policies and practices for coasts, water resources, agriculture, wetlands,natural areas, and forests are perceived in many quarters as being inadequate in ways that not only hindermanagement today, but could impose greater constraints under a changing climate. Four particular problems werefound to be common to several or all of the sectors: 1) Institutional and geographical fragmentation;2) inadequate communication of information that would improve response to climatic risks; 3) lack ofcontingency planning and, other measures to prepare for extreme events or weather surprises; and4) information gaps in various key scientific and policy areas.
Addressing these overarching problems will pose numerous challenges for Congress and Federal agendas.All four problems have been recognized to varying degrees in the past, but progress toward solving them has beenslow. Attempting to solve any of them could require far-reaching policy changes, but small piecemeal actions couldbe undertaken for individual resource sectors by many different government agencies or by congressionalappropriations, legislation, and oversight committees. Big, bold policy changes could accomplish the job moreuniformly or effectively, but reaching agreement on solutions and then garnering sufficient support to implementthem could prove impossible. Incremental changes do not require such widespread support and may accomplishspecific goals, but such policies can also detract from needed larger changes by leaving the impression that nofurther action is necessary.
In the resource and research chapters of this report (vols. 1 and 2, ohs. 3 through 6), we suggest numerouspolicy options that address parts of the four overarching problems in waysthat are specific to each resource sector.In many cases these resource-specific options could be formulated in broader terms to attempt across-the-boardsolutions to the overarching problems identified above. Furthermore, many of the sector-specific options areinterconnected, and could be more effective if enacted in a coordinated way. In some cases, any of severaldifferent resource-specific policy options could form a first step toward solving an overarching problem. A few ofthese options are described below.
Fragmentation
Options to help reduce Institutional fragmentation include:■ Promoting the reestablishment and strengthening of Federal-State river basin commissions to improve
coordination among agencies. (Vol. 1, option 5-11 -’’Wade”)”)■ promoting integrated resource management at the watershed level. (Vol. 2, option 4-22--’’Wetland.”)● Creating a Federal coordinating council for ecosystem management. (Vol. 2, option 5-12-’’ Preserves.”)■ Amending the Science Policy Act of 1976 (P.L. 94-262) to strengthen the ability of the Office of Science and
Technology Policy (OSTP) and the Federal Coordinating Council on Science, Engineering, and Technology(FCCSET) to coordinate research and ecosystem management across agencies. (Vols. 1 and 2, option3-1—’’Research.”)
Although these options seem varied, all four address, in some way, the problem of institutional fragmentation andthe need for greater coordination and integrated management. If enacted individually, these policies could focuson specific problems in the management of water resources, wetlands, and preserves. However, any of the fourcould also serve as part of a larger effort to coordinate the management of all three retirees. Reinstated riverbasin commissions could form a local base for watershed management that could be broadened to includeattention to wetlands and other natural areas within the watershed. Similarly, a Federal coordinating council forecosystem management could use watershed units as one level of coordination and examine the interac-
Chapter 1--Synthesis, Summary, and Policy Options 21
tion of water resources with other natural resources in that unit. The problem in trying to expand any of theseindividual options to cover the overarching concerns would be in how best to assign authority and enforcementcapabilities for any coordinating agency without interfering with the jurisdiction of the agencies to be coordinated.
Options to help reduce geographic fragmentation include:Identifying and assigning priorities to the wetlands that are most important to protect and restore. (Vol. 2, option4-19--’’Wetlands.”)Directing agencies to modify their criteria for land acquisition to include underrepresented ecosystems andlong-term survivability. (Vol. 2, option 5-9--’’Preserves.”)Using current conservation incentive programs administered by the Secretaries of Agriculture and Interior toenhance the Federal effort to protect natural areas. (Vol. 2, option 5-10-’’ Preserve”)”)Protecting highly valued forest sites. (Vol. 2, option 6-4--’’Forests.”)Providing incentives to reduce fragmentation of private forestland. (Vol. 2, option 6-5--’’Forests.”)
Several of the policy options for wetlands, preserves, and forests either explicitly address the problem ofgeographic fragmentation or could be used to do so. The options listed above would promote priority setting forland acquisition or restoration of valuable natural areas, including wetlands, forests, and other types of preserves.Reducing landscape fragmentation could be viewed as a high-priority goal. Furthermore, existing conservationincentive programs of various types could be required to focus on the lands most valuable for preventing orameliorating fragmentation.
Communication of climate risk
Options to communicate risk through modifying subsidies include:Raising premium rates for the National Flood Insurance Program (NFIP) policyholders who receive subsidizedflood insurance. (Vol. 1, option 4-1-’’Coasts.”)Reducing the Federal share of public disaster assistance. (Vol. 1, option 4-7–-"Coasts.”)Reforming pricing in Federal water projects. (Vol. 1, option 5-5--’’Water.”)Defining disasters formally, with assistance provided only for unusual losses. (Vol. 1, option 6-3--’’Agriculture.”)improving participation in the crop-insurance program. (Vol. 1, option 6-5-’’Agricuitur”)”)Eliminating incentives to destroy wetlands. (Vol. 2, option 4-8--’’Wetlands.”)Reducing Federal subsidies, such as Coastal Zone Management funds and flood insurance, in areas that havenot established setback or “planned retreat” policies. (Vol. 2, option 4-16--’ ’Wetlands.”)
One of the major ways the Federal Government affects the responsiveness to climate risk is in the distribution ofpublic money for disaster assistance and insurance subsidies. Subsidized and regulated prices distort theperception of changing risks and could slow the response to growing water scarcity and to increases in thefrequency of droughts, floods, and storms. The options listed above suggest that policies to reduce or eliminatesuch subsidies could be beneficial in encouraging greater precautions and faster responses to changing climaterisk in nearly every individual resource sector-as well as in reducing Federal spending in an era of constrainedbudgets. If enacted together, these options could go a long way toward addressing the overarching problem ofmisperception of risk.
Options to communicate risk through tax signals include:■ Eliminating or reducing tax benefits for coastal development (such as the casualty-loss deduction). (Vol. 1,
option 4-16—’’Coasts.”)■ Reforming tax provisions to promote conservation investments. (Vol. 1, option 5-4--’’Water.”)■ Using current conservation incentive programs administered by the Secretaries of Agriculture and interior to
enhance the Federal effort to protect natural areas. (Vol. 2, option 5-9--’’ Preserves.”)
(Continued on next page)
22 Preparing for an Uncertain Climate-Volume 2
Box 1-C--Solutions from General to Specific:Addressing the Overarching Problems--(Continued)
The U.S. Tax Code can provide both incentives and disincentives for financial risks. Tax incentives can be usedto encourage behavior that might reduce risks to humans and the environment, including investments in waterconservation and in protecting natural areas. Tax disincentives could be used to help prevent unproductivebehavior, such as coastal development in high-risk zones or where development leads to the destruction ofwetlands or creates barriers against their movement inland as the sea level rises.
Other options to communicate risk include:■ Improving the research and extension process (develop a database on successful practices; expand farmer
involvement; provide support for on-farm experimentation). (Vol. 1, option 6-11 -’’Agriculture.”)■ Incorporating climate change scenarios into forest plans and assessments, (Vol. 2, option 6-11--"Forests.”)■ Eliminating the even-flow-harvest requirement of the National Forest Management Act (P.L. 94-588), which
falsely implies that future timber supplies will be stable). (Vol. 2, option 6-12--"Forests.”)■ Incorporating sea level rise into National Flood Insurance Program mapping. (Vol. 2, option 4-5--"Coasts.")
The Government is the source of considerable information that can serve to improve private sector response toa changing climate. Outreach and extension services will be valuable in communicating changes in theeffectiveness of farm management techniques and crop choices, speeding the process of adaptation. Inventories,monitoring, climate data, and resource--status assessments will indicate trends in natural resource conditions andsignal changes in the future supply of products and service from natural resource systems. Better understandingof these trends will help businesses and individuals to anticipate and adjust more effectively to changing futureconditions. Inappropriate signals about climate risk that create an unrealistic expectation of stable conditions mayencourage unwise financial investments in resource-dependent communitiesthat are at risk of decline. The pubicgenerally is not well-informed about the risks associated with living in coastal areas, and this lack of awarenesshas led and will continue to lead to large public and private expenditures. Educating people now about the riskof a rising sea level could greatly reduce future damages.
Contingency planning
Options to formalize contingency planning include:■ Creating an interagency drought task force to develop a national drought policy and plan. (Vol. 1, option
5-16--’’Water.")■ Creating a national flood-assessment board, (Vol. 1, option 5-17--’’Water.”)■ Establishing criteria for intervention in order to protect or restore forest health through a forest health bill. (Vol.
2, option 6-7--"Forests.n)Droughts, forest fires, floods, and hurricanes have all become the focus of public attention in recent years afterevents such as the nationwide drought in 1988, the 5-year California drought of 1988-1992, the Mississippi floodsin the summer of 1993, and Hurricanes Hugo and Andrew in 1988 and 1992. in many cases, contingency plansset up to deal with such disasters were either inadequate or nonexistent. Policy options for water resources andforests suggest different types of contingency planning that may help address future disasters as the climatechanges. Because the presence of forests and wetlands moderates how water moves through the landscape, bothshould be considered in flood planning and development.
Options that add a measure of “insurance” against catastrophic events include:■ Increasing support for the development of new commercial crops. (Vol. 1, option 6-14--"Agriculture.”)■ Conducting research on natural resources to prepare for climate change (restoration ecology, preservation of
biodiversity, effective preserve design). (Vol. 2, option 5-2--’’Preserves.”)■ Directing agencies to modify their criteria for land acquisition to include underrepresented ecosystems and
brig-term survivability. (Vol. 2, option 5-9--’’ Preserves.”)
Chapter 1--Synthesis, Summary, and Policy Options 23
● Enhancing forest seed banks and genetics research programs. (Vol. 2, option 6-1--”Forests.”)
Preparing for extreme future climate conditions through the development of technologies or institutions will assistin recovery and can help reduce the threat of future damage. The development of crops well-suited to harsherfuture climate may provide some insurance against a steep decline in our agricultural sector. Contingencypreparations for forests and preserves must consider the potential need for active restoration or protection if naturalprocesses become excessively disturbed. Seed banks may provide the material to rebuild a forest in the eventof severe decline and loss of spades or populations from their natural range.
Information gaps
Options to help decrease these gaps include:■ Supporting long-term research and monitoring on the impacts of climate change on wetlands. (Vol. 2, option
4-24--’’Wetlands.”)■ Increasing funding f or ecological research in the U.S. Global Change Research Program (USGCRP). (Vol. 2,
option 5-1—’’Preserves.”)● Supporting coordinated research in federally protected natural areas. (Vol. 2, option 5-4--’’Preserves.”)■ Creating a national program for inventorying and monitoring. (Vol. 2, option 5-5-’’Preserves.”)■ Using the Experimental Forests for research on adaptation to climate change. (Vol. 2, option 6-2—’’Forests.”)● Using existing monitoring and inventorying efforts to identify causes and effects of forest decline. (Vol. 2,option
6-6--’’Forests.") ■ Creating an Integrated Assessment program within or outside USGCRP positioned above the agency level.
(Vols. 1 and 2, option 3-8--’’ Research.”)● Creating an adaptation and mitigation research program either within USGCRP or separate but parallel to it.
(Vols. 1 and 2, option 3-5--’’Research.”)
Many policy options suggest particular research questions or promote the use of specific existing programs toaddress some of the information gaps regarding climate change. Coordinating these different research effortsand ensuring that each considers some of the related concerns of others might yield synergistic results. Forexample, while the Experimental Forests should be useful sites for examining how forests may adapt to climatechange, research could be focused more broadly to consider issues that affect natural areas (including questionsof how to maintain biodiversity and how to restore damaged ecosystems) and forested wetlands.
While these research programs in individual areas are forming useful building blocks toward solving theoverarching problem of lack of knowledge, a broader program of coordinated research across-the-board could alsobe attempted. Some of the research listed could be coordinated under the Ecological Systems and Processespriority group in the USGCRP. However, the USGCRP goals and purview need to be broadened to includeecosystem research, adaptation and mitigation research, and an iterative integrated assessment in order to bemore useful to policy-making.
tected natural areas, may not be large enough to sheds, for example, for dozens of Federal, State,withstand future stresses such as climate change.Managing smaller areas as individual parcels inan uncoordinated manner and without largerneeds in mind has become part of the problem.
A second aspect of fragmentation is the ineffi-ciency that results from a lack of coordination inmanagement across government agencies. It isnot uncommon in even relatively small water-
and local agencies to share jurisdiction overwaterand other natural resources. For instance, theDelaware River Basin is divided among fourStates (fig. 1-3). Responsibility for water re-sources alone in this basin is divided among atleast 10 agencies in each of the four States andamong more than 20 Federal agencies. In mostbasins, responsibility for groundwater manage-
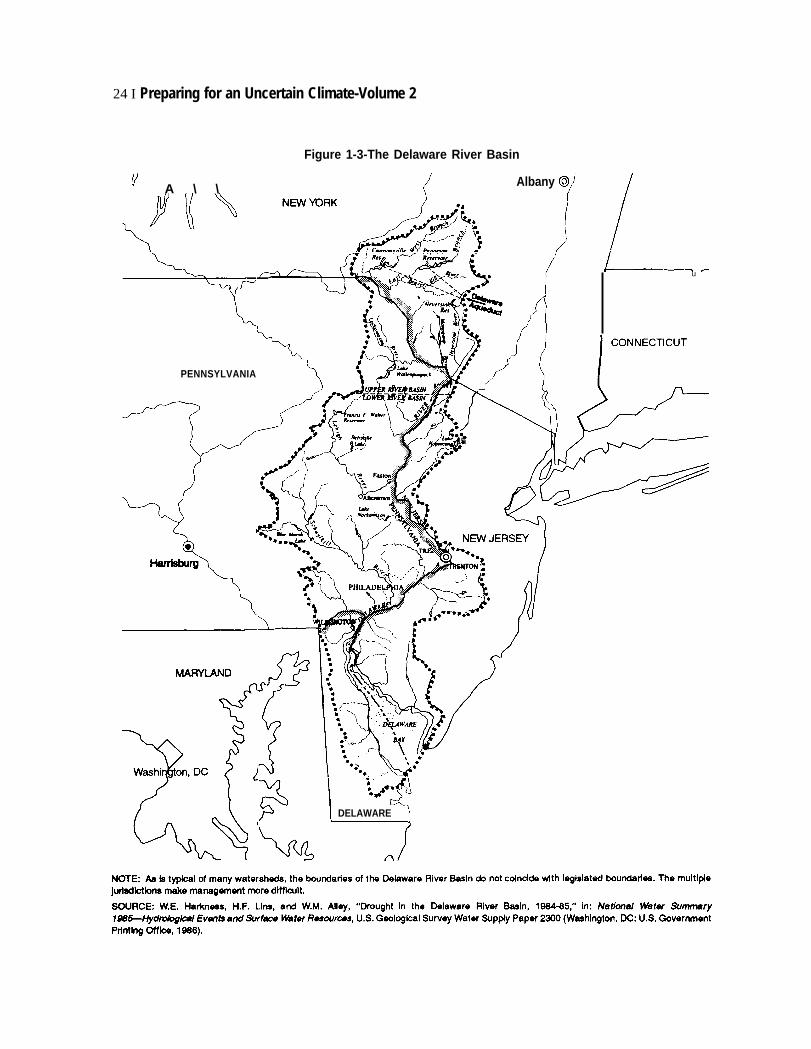
24 I Preparing for an Uncertain Climate-Volume 2
Figure 1-3-The Delaware River Basin
v A \ \ ( Albany 0/
u
PENNSYLVANIA
){Xz!!$+5Wp-
1% .-
\ 9
MARYIAND
&P
Washi on, DC
Zi
\ DELAWARE)
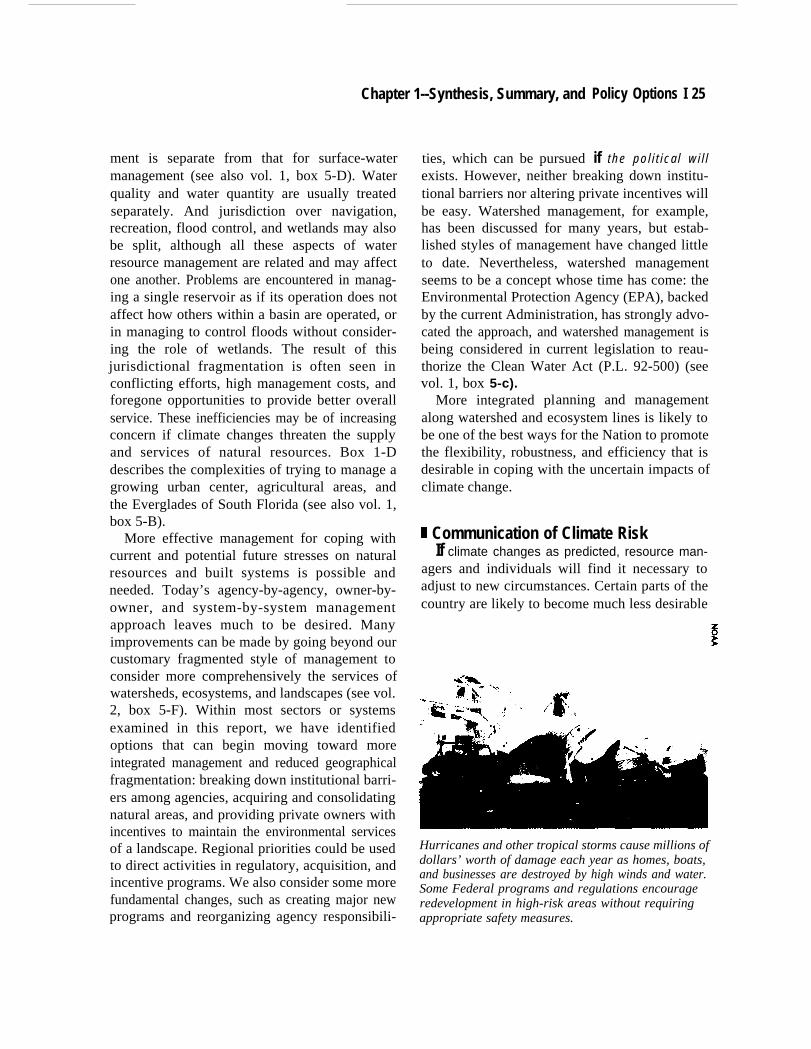
Chapter 1--Synthesis, Summary, and
ment is separate from that for surface-watermanagement (see also vol. 1, box 5-D). Waterquality and water quantity are usually treatedseparately. And jurisdiction over navigation,recreation, flood control, and wetlands may alsobe split, although all these aspects of waterresource management are related and may affectone another. Problems are encountered in manag-ing a single reservoir as if its operation does notaffect how others within a basin are operated, orin managing to control floods without consider-ing the role of wetlands. The result of thisjurisdictional fragmentation is often seen inconflicting efforts, high management costs, andforegone opportunities to provide better overallservice. These inefficiencies may be of increasingconcern if climate changes threaten the supplyand services of natural resources. Box 1-Ddescribes the complexities of trying to manage agrowing urban center, agricultural areas, andthe Everglades of South Florida (see also vol. 1,box 5-B).
More effective management for coping withcurrent and potential future stresses on naturalresources and built systems is possible andneeded. Today’s agency-by-agency, owner-by-owner, and system-by-system managementapproach leaves much to be desired. Manyimprovements can be made by going beyond ourcustomary fragmented style of management toconsider more comprehensively the services ofwatersheds, ecosystems, and landscapes (see vol.2, box 5-F). Within most sectors or systemsexamined in this report, we have identifiedoptions that can begin moving toward moreintegrated management and reduced geographicalfragmentation: breaking down institutional barri-ers among agencies, acquiring and consolidatingnatural areas, and providing private owners withincentives to maintain the environmental servicesof a landscape. Regional priorities could be usedto direct activities in regulatory, acquisition, andincentive programs. We also consider some morefundamental changes, such as creating major newprograms and reorganizing agency responsibili-
ties, which can be pursued
Policy Options I 25
if the political willexists. However, neither breaking down institu-tional barriers nor altering private incentives willbe easy. Watershed management, for example,has been discussed for many years, but estab-lished styles of management have changed littleto date. Nevertheless, watershed managementseems to be a concept whose time has come: theEnvironmental Protection Agency (EPA), backedby the current Administration, has strongly advo-cated the approach, and watershed management isbeing considered in current legislation to reau-thorize the Clean Water Act (P.L. 92-500) (seevol. 1, box 5-c).
More integrated planning and managementalong watershed and ecosystem lines is likely tobe one of the best ways for the Nation to promotethe flexibility, robustness, and efficiency that isdesirable in coping with the uncertain impacts ofclimate change.
I Communication of Climate RiskIf climate changes as predicted, resource man-
agers and individuals will find it necessary toadjust to new circumstances. Certain parts of thecountry are likely to become much less desirable
Hurricanes and other tropical storms cause millions ofdollars’ worth of damage each year as homes, boats,and businesses are destroyed by high winds and water.Some Federal programs and regulations encourageredevelopment in high-risk areas without requiringappropriate safety measures.
26 I Preparing for an Uncertain Climate-Volume 2
places to live and work. Even where climatechanges are less harsh., current managementpractices and lifestyles may not continue to beappropriate. The speed with which resourcemanagers and individuals can recognize andrespond effectively to new climate conditionswill largely determine the economic and socialcosts of climate change. Adaptation to change islikely to be delayed by the inherent difficulties inrecognizing climate change against the back-ground of normal climate variability. Respon-siveness to changing climate risks may be furtherimpeded by existing Federal programs designedto protect individuals from the financial risks ofclimatic extremes. It maybe enhanced by provid-ing information about the nature of climatechange risks, the changing resource situation, andthe likely success of particular adjustments inresource-management techniques. Effective com-munication of the nature of climate-related riskscan be promoted through formal educationalefforts or through appropriate incentives.
The Government could better communicateclimate risk by reducing the various publicsubsidies for developments in areas of high risk.The public has come to depend heavily ongovernment disaster assistance and subsidizedinsurance programs, which helps reduce exposureto the financial risks from climate extremes. Suchprograms have been valuable in allowing theproductive use of resources in areas of highlyvariable climate. Problems may arise, however, ifthe financial buffer provided by these Federalprograms unintentionally encourages people tomove into environments where they may beexposed to greater risk in the future, or reducesincentives to take adequate precautions againstclimate risk. Because development decisions arenot easily reversible, and the consequences ofdecisions taken now are, in some cases, likely tobe with us for many decades, it seems prudent tobegin reexamining policies that may encouragedevelopment in climate-sensitive areas. Privatecitizens should recognize the true costs of extend-ing farms into economically marginal areas,
building structures in areas of high forest-fire risk,or locating buildings in coastal erosion zones.
We assessed two systems in which a reexamin-ation of current risk protection policies may beespecially important in the face of climatechange: coastal areas and agriculture (see vol. 1,chs. 4 and 6). Flooding and erosion are ofparticular concern in coastal areas, and thesehazards could increase in a warmer climate. Wediscuss options in the coastal and agriculturechapters that could help owners respond moreeffectively to climate change and that woulddecrease potential future exposure to climate risk.For example, the National Flood Insurance Pro-gram has been only partially successful in reduc-ing the need for taxpayer-funded disaster assist-ance and in encouraging local mitigation efforts.In agriculture, Federal Crop Insurance, variousdisaster-assistance programs, and irrigation sub-sidies all tend to distort the manner in whichfarmers respond to climate risks. (See box 1-Eonwater allocation in the Sacramento-San JoaquinRiver System and box 1-F on agriculture in theprairie-pothole region.) Improvements can andshould be made in these program to ensure that inthe future, individuals, communities, and theFederal Government are not exposed to exces-sive costs.
Equally important may be quickly communi-cating the detection of any change in key climatevariables and other information that will assist inthe responses to changing climates. Farmers andforesters, for example, may be reluctant to alterpractices until they are convinced climate hasactually changed. The potential role of the Exten-sion Services in tracking the changing success offarming and forestry practices and spreading thisinformation to managers may prove important inreducing the costs of adaptation.
9 Contingency PlanningThe goal of contingency planning is to mini-
mize losses from natural disasters or accidents bypreparing in advance to take appropriate actions.
Chapter 1--Synthesis, Summary, and Policy Options I 27
Contingency planning is important where thethreat of significant losses is high in the absenceof preparation and prompt response-as is thecase with floods, forest fires, droughts, andhurricanes (see vol. 1, chs. 4 and 5 and box 4-C;vol. 2, box 5-I). Climate change could affect theintensity or number of extreme climate events,making preparedness perhaps even more impor-tant than it is now. However, adequate contin-gency plans do not exist for all parts of the countrythat are vulnerable to extreme events. For exam-ple, only 23 States have drought-managementplans (197). The States that do have them,however, have generally adapted better todroughts than those without plans (197). Weidentified options that could help mitigate dam-ages, including the ecological harm caused bynatural disasters. Improvements in contingencyplanning would be helpful both to minimizenear-term damages and to prepare for potentiallygreater damages caused by climate change.
States have a key role in plannin g for mostextreme events and must continue to do so. Statesshould be encouraged to develop contingencyplans or to refine them with climate change inmind. The Federal Government also has a role inplanning for natural disasters, with many agen-cies involved in some way in this activity (seecartoon on page 34). However, the FederalGovernment could do better at defining therespective roles of the agencies that have respon-sibilities for extreme events. It could also promotestronger coordination among Federal agenciesand among the various levels of government inestablishing requirements for assistance and inproviding such assistance in a more timely,consistent, and equitable manner.
Contingency planning is also important whenemergency measures are likely to be controver-sial; it allows potential responses to be consideredin advance when there can be rational debate.
Such controversies are very likely to be associ-ated with any efforts to restore the health ofnatural ecosystems that have been severelyharmed by climate-related stresses. This is well-illustrated by difficulties now faced in respondingto “massively destructive forest health prob-lems” in the Blue Mountain forests of EasternOregon (176; see vol. 2, ch. 6 and box 6-E).Although there is general agreement that majorchanges in management are needed in thoseforests, the response has been slow, and agree-ment about how to proceed has been hard toachieve. Procedures for responding to ecosystemhealth emergencies should be established.
9 Research and Information GapsThe individual resource chapters outline the
important research gaps that need to be addressedfor coasts, water resources, agriculture, wetlands,preserves, and forests. Overall, we found thatvarious strategies for coping with climate changecan be identified for managed natural-resource-based systems (including the coastal zone, waterresources, and agriculture--see vol. 1, chs. 4-6).Some of these strategies may require continuedsupport for research on new technologies ormanagement practices that will enhance thepotential for adaptation. For natural systems,however (e.g., wetlands, unmanaged forests, andnature preserves-see vol. 2, chs. 4-6), theinformational gaps in our understanding of thesesystems are so large that realistic responsestrategies are difficult or impossible to identifynow (see also vol. 2, box 5-K).
Although an estimated $900 million is spentannually on what can be considered research in‘‘environmental life sciences’ (54) or ‘‘environ-mental biology,”6 there is currently very littleresearch directed specifically at protecting naturalareas under climate change and helping landmanagers modify management strategies to re-
6 J. ~5z, ~wutive swm~, su~mfittw on ~wirorlmenti Biology, Committee on Life Scienees md Hw.W Fede~ coordiKMtins
Council for Scienee, Engineering, and ‘IWmology, personal communication, Sept. 14, 1993. Only 11 percent of these expenditures overlapswith the Federal Global Change Research Program budget.
28 Preparing for an Uncertain Climate-Volume 2
Box 1-D--Climate Change, South Florida, and the Everglades
Lying dose to sea level and in the preferred path of a sizable percentage of Atlantic hurricanes, South Floridais potentiality one of the most vulnerable areas of the United States to climate change. it is also one of the moatdistinctive. South Florida’s famed Everglades, a vast subtropical wetland of which about one-seventh is preservedin Everglades National Park, is seen by many as one of the crown jewels of the U.S. National Park System. Miami,Palm Beach, and other coastal communities in South Florida makeup one of the most popular seaside vacationdestinations in the world. Despite hurricane and flood hazards,these cities have experienced phenomenal growthin recent years. In addition, varieties of crops can be grown in the warm, subtropical climate that grow nowhereelse in the United States. And Miami has become a gateway between North and South America, transformingSouth Florida into an important international crossroads.
Despite, or perhaps because of, its distinctiveness and popularity, South Florida is under stress and, like afew other heavily developed parts of the United States, beginning to bump up against limits to growth. The criticalfactor is water. Although the region receives an annual average of 80 inches (152 centimeters) of rain, annualevaporation can sometimes exceed this amount and rainfall variability from year to year is quite high, resultingin periodic droughts and floods. In the past century, moreover, South Florida has been transformed from a virtualwilderness into a complex, interconnected system of developed and undeveloped land. The main elements of thissystem-the growing urban sector, agricultural areas, and the Everglades and other remaining naturalareas--must all compete for the limited supply of water, and the competition is increasing with every new resident.
Much of the growth of South Florida has occurred since 1870. Then, fewer than 100 people lived in what arenow Dade, Broward, and Palm Beach Counties. Now, about 5.2 million people occupy the same area The vastunaltered Everglades, which originally extended from Lake Okeechobee to Florida Bay, were seen by early settlersas hostile to human welfare and completely without value. Encouraged by a grant from the U.S. Congress, theState of Florida began draining these “useless’’ wetlands for agriculture, and by the earty 20th century, the naturalcharacter of the Everglades had begun to change. Farmers planted sugar cane and a variety of vegetables in thedrained area south of Lake Okeechobee now known as the Everglades Agricultural Area (EAA).
The initial drainage system worked well enough during normal years but was stressed during occasionalabnormal events and failed completely during a major hurricane in 1928. At that time, 2,000 people died in theEAA when the protective dike around Lake Okeechobee burst. This incident prompted the Initiation of a massivepublic works project, as attention shifted from drainage of wetlands to flood control. Eventually, an 85-mile(137-kilometer)1 earthen dike was built around Lake Okeechobee, and the meandering 98-mile Kissimmee River,which fed the lake from the north, was transformed into a canal 48 miles long and 33 feet (10 meters) deep.Flooding problems diminished, but the former broad, riverlike system north of Everglades National Park has beengreatly altered into a series of canals and pools. The former sheet-like flow of water to the park, necessary to itshealth, has been blocked. Today, the area has more than 1,395 miles of canals and levees and 143 water-controlstructures.
Projects to expand the supply of water to growing urban centers proceededin tandem with flood-controlprojects. To accommodate demands for agricultural and urban expansion, diking and draining of wetlandscontinued, and as the expansion progressed, more water was diverted for these purposes. Today, additional wateris diverted for sewage dilution, pest control, and frost protection. Some water is used to recharge aquifers thatsupply cities east of the Everglades and the populated areas of the Florida Keys. Large quantities of water thatcould be recycled or used to recharge urban aquifers are dumped into the Atlantic Ocean (see vol. 1, oh. 5, andvol. 2, oh. 4, for complete discussions of water and wetland issues).
A major effect of this decades-long restructuring of the natural hydrological system has been to drasticallyreduce the supply of water from the Kissimmee River watershed that reaches the much-diminished-in-size
1 To convert miles to kilometers, multiply by 1.609.
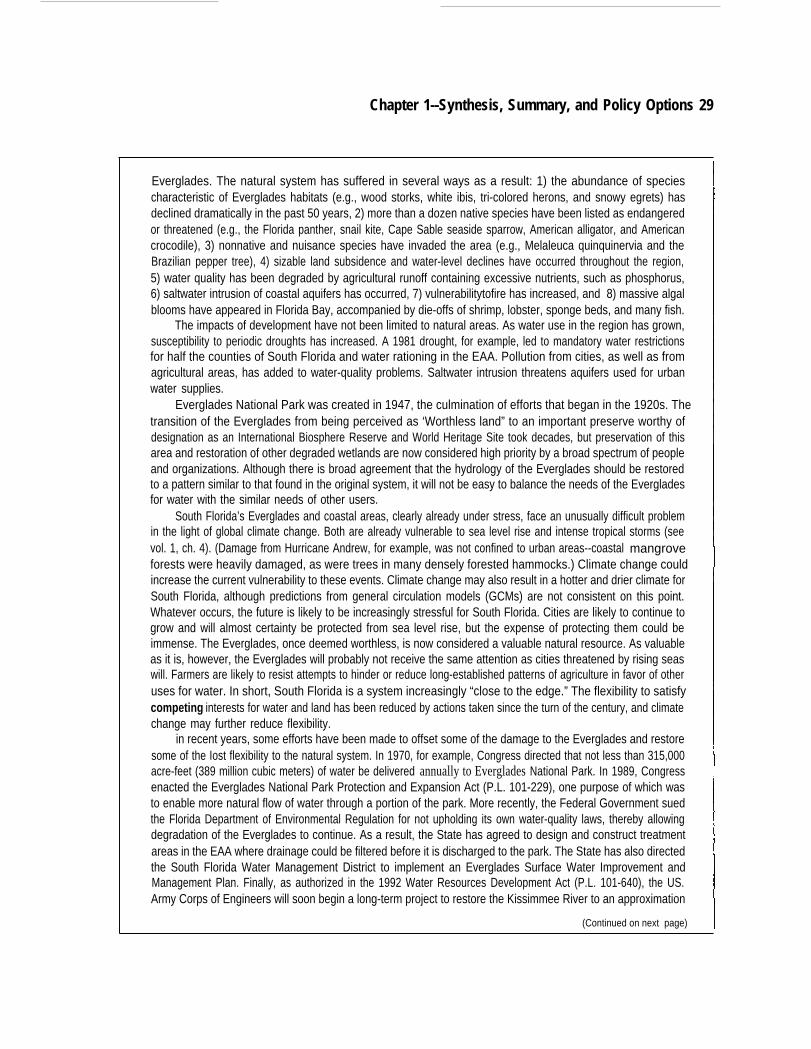
Chapter 1--Synthesis, Summary, and Policy Options 29
Everglades. The natural system has suffered in several ways as a result: 1) the abundance of speciescharacteristic of Everglades habitats (e.g., wood storks, white ibis, tri-colored herons, and snowy egrets) hasdeclined dramatically in the past 50 years, 2) more than a dozen native species have been listed as endangeredor threatened (e.g., the Florida panther, snail kite, Cape Sable seaside sparrow, American alligator, and Americancrocodile), 3) nonnative and nuisance species have invaded the area (e.g., Melaleuca quinquinervia and theBrazilian pepper tree), 4) sizable land subsidence and water-level declines have occurred throughout the region,5) water quality has been degraded by agricultural runoff containing excessive nutrients, such as phosphorus,6) saltwater intrusion of coastal aquifers has occurred, 7) vulnerabilitytofire has increased, and 8) massive algalblooms have appeared in Florida Bay, accompanied by die-offs of shrimp, lobster, sponge beds, and many fish.
The impacts of development have not been limited to natural areas. As water use in the region has grown,susceptibility to periodic droughts has increased. A 1981 drought, for example, led to mandatory water restrictionsfor half the counties of South Florida and water rationing in the EAA. Pollution from cities, as well as fromagricultural areas, has added to water-quality problems. Saltwater intrusion threatens aquifers used for urbanwater supplies.
Everglades National Park was created in 1947, the culmination of efforts that began in the 1920s. Thetransition of the Everglades from being perceived as ‘Worthless land” to an important preserve worthy ofdesignation as an International Biosphere Reserve and World Heritage Site took decades, but preservation of thisarea and restoration of other degraded wetlands are now considered high priority by a broad spectrum of peopleand organizations. Although there is broad agreement that the hydrology of the Everglades should be restoredto a pattern similar to that found in the original system, it will not be easy to balance the needs of the Evergladesfor water with the similar needs of other users.
South Florida’s Everglades and coastal areas, clearly already under stress, face an unusually difficult problemin the light of global climate change. Both are already vulnerable to sea level rise and intense tropical storms (seevol. 1, ch. 4). (Damage from Hurricane Andrew, for example, was not confined to urban areas--coastal mangroveforests were heavily damaged, as were trees in many densely forested hammocks.) Climate change couldincrease the current vulnerability to these events. Climate change may also result in a hotter and drier climate forSouth Florida, although predictions from general circulation models (GCMs) are not consistent on this point.Whatever occurs, the future is likely to be increasingly stressful for South Florida. Cities are likely to continue togrow and will almost certainty be protected from sea level rise, but the expense of protecting them could beimmense. The Everglades, once deemed worthless, is now considered a valuable natural resource. As valuableas it is, however, the Everglades will probably not receive the same attention as cities threatened by rising seaswill. Farmers are likely to resist attempts to hinder or reduce long-established patterns of agriculture in favor of otheruses for water. In short, South Florida is a system increasingly “close to the edge.” The flexibility to satisfycompeting interests for water and land has been reduced by actions taken since the turn of the century, and climatechange may further reduce flexibility.
in recent years, some efforts have been made to offset some of the damage to the Everglades and restoresome of the Iost flexibility to the natural system. In 1970, for example, Congress directed that not less than 315,000acre-feet (389 million cubic meters) of water be delivered annually to Everglades National Park. In 1989, Congressenacted the Everglades National Park Protection and Expansion Act (P.L. 101-229), one purpose of which wasto enable more natural flow of water through a portion of the park. More recently, the Federal Government suedthe Florida Department of Environmental Regulation for not upholding its own water-quality laws, thereby allowingdegradation of the Everglades to continue. As a result, the State has agreed to design and construct treatmentareas in the EAA where drainage could be filtered before it is discharged to the park. The State has also directedthe South Florida Water Management District to implement an Everglades Surface Water Improvement andManagement Plan. Finally, as authorized in the 1992 Water Resources Development Act (P.L. 101-640), the US.Army Corps of Engineers will soon begin a long-term project to restore the Kissimmee River to an approximation
(Continued on next page)
30 Preparing for an Uncertain Climate--Volume 2
Box 1-D--Climate Change, South Florida, and the Everglades--(Continued)
of its original meandering route, thereby increasing wetlands north of Lake Okeechobee, helping to improve waterquality in the lake, and increasing the water-storage capacity of the entire Everglades system.
Although important steps are being taken to restore the Everglades, some major obstacles are stymieing themore comprehensive ecosystem plating that will be required to address the full range of South Florida’s currentand climate-change-related problems. One of the most vexing, and one encountered many times In OTA’s study,is the lack of coordination among the responsible State and Federal agencies. Part of the problem is a result ofa lackof shared values among agencies and among the constituencies they represent. Furthermore, each agencyhas a different mandate, and agencies’ jurisdictional boundaries seldom coincide with boundaries of naturalsystems. One might expect that the preservation mandate of the U.S. Fish and Wildlife Service and the FloridaDepartment of Environmental Regulation would often dash with the fIood-control mandate of the Corps ofEngineers and with the interests of EAA farmers, and such has been the case in South Florida. However, lack ofcoordination has extended even to agencies with similar mandates; a prominent example has been the difficultyof reconciling the National Park Service’s ecosystem-wide approach to restoring the Everglades with the Fish andWildlife Service's mandate under the Endangered Species Act (P.L. 100-707) to focus on protection of individualspecies.
Recently, Interior Secretary Bruce Babbitt expressed a strong interest in Everglades National Park and hasmade dear his intention to get the National Park Service and the Fish and Wildlife Service to work more closelytogether to develop a common policy. Babbitt has also announced plans to form a Federal taskforce in an attemptto overcome some of the coordination problems.
The broader challenge for the region is to manage this complex system in an integrated fashion to maximizethe health of all its diverse elements. This is no small challenge because it may be very difficult to sustain agriculturewithout environmental costs, for example, or for urban areas to continue to grow indefinitely without somerestraints. The effort to sort through these problems must take place with some understanding of what climatechange may mean.
SOURCES: S. Light, L. Gunderson, and C. Holling, “The Everglades: Evolution of Management in a Turbulent Ecosystem," University ofFlorida, Arthur C. Marshall Laboratory, unpublished manuscript, 1993; National AudubonEverglades and Endangered Species(New York: National Audubon
Society, Report of the Advisory Panel on the Society, 1992);J. de Golia, Everglades: The Story Behind the Scenery
(Las Vegas, NV: KC Publications, Inc., 1978); K. Kemezis, "BabbittToTest Ecosystem Policy in the Everglades,"Environment Week, Feb.25, 1993.
spend to climate change. In 1992, only $8 million or the ecological information that would bewas spent on research focused on adaptation to helpful in providing policy guidance and adapta-climate change.7
tion options for natural systems. Overall,
The U.S. Global Change Research Program USGCRP is more focused on understanding the
(USGCRP) is a $1.4 billion research program. causes for and rates of climate change8 than onHowever, as currently designed, it will not examining the ecological and human impacts ofprovide either the practical technologies that change (see ch. 3 for a more complete explanationmight make us more prepared for climate change of USGCRP). The agencies primarily responsible
7 The Working Group on Mitigation and Adaptation Research Strategies (disbanded in 1992) of the Committee on Earth and EnvironmentalSciences of FCCSET identified Federal research that focuses on or contributes to adaptation to global change (24).
8 USGCRP is designed to produce a predictive understanding of the Earth system and focuses on three interrelated streams of activity:documenting global change (observations), enhancing understanding of key processes (process research), and predicting global and regionalenvironmental change (integrated modeling and prediction). For FY 1994, a fourth activity stream, assessment, was added.
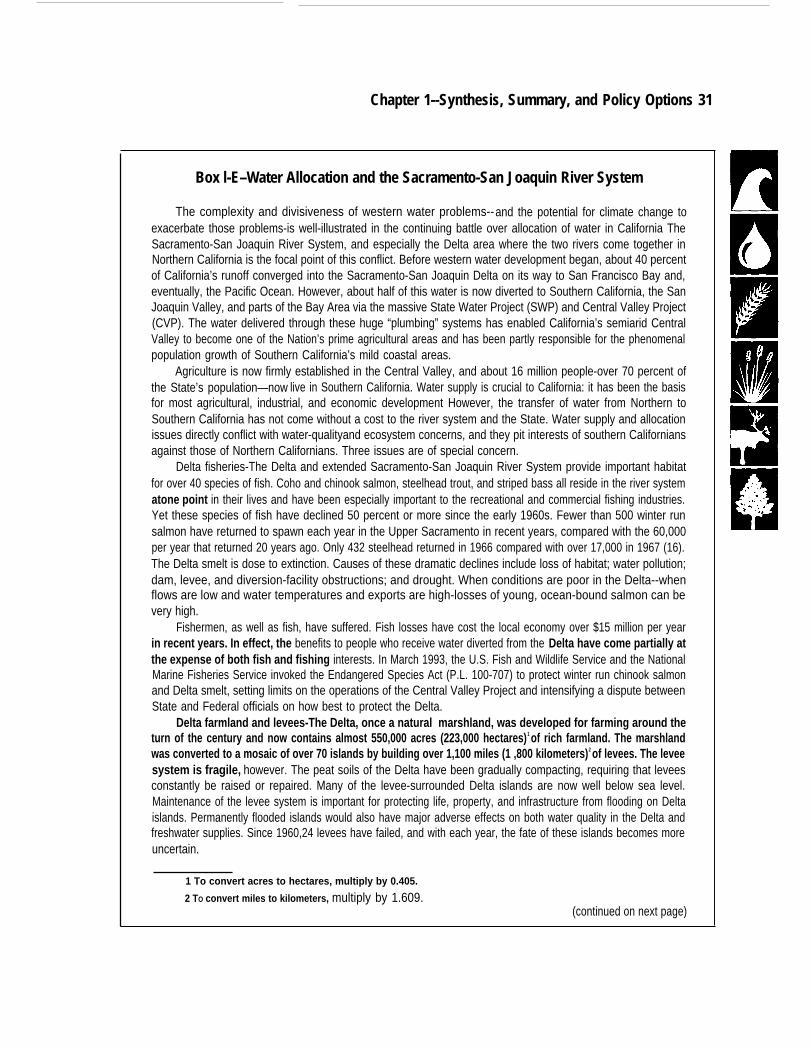
Chapter 1--Synthesis, Summary, and Policy Options 31
Box l-E–Water Allocation and the Sacramento-San Joaquin River System
The complexity and divisiveness of western water problems--and the potential for climate change toexacerbate those problems-is well-illustrated in the continuing battle over allocation of water in California TheSacramento-San Joaquin River System, and especially the Delta area where the two rivers come together inNorthern California is the focal point of this conflict. Before western water development began, about 40 percentof California’s runoff converged into the Sacramento-San Joaquin Delta on its way to San Francisco Bay and,eventually, the Pacific Ocean. However, about half of this water is now diverted to Southern California, the SanJoaquin Valley, and parts of the Bay Area via the massive State Water Project (SWP) and Central Valley Project(CVP). The water delivered through these huge “plumbing” systems has enabled California’s semiarid CentralValley to become one of the Nation’s prime agricultural areas and has been partly responsible for the phenomenalpopulation growth of Southern California’s mild coastal areas.
Agriculture is now firmly established in the Central Valley, and about 16 million people-over 70 percent ofthe State’s population—now live in Southern California. Water supply is crucial to California: it has been the basisfor most agricultural, industrial, and economic development However, the transfer of water from Northern toSouthern California has not come without a cost to the river system and the State. Water supply and allocationissues directly conflict with water-qualityand ecosystem concerns, and they pit interests of southern Californiansagainst those of Northern Californians. Three issues are of special concern.
Delta fisheries-The Delta and extended Sacramento-San Joaquin River System provide important habitatfor over 40 species of fish. Coho and chinook salmon, steelhead trout, and striped bass all reside in the river systematone point in their lives and have been especially important to the recreational and commercial fishing industries.Yet these species of fish have declined 50 percent or more since the early 1960s. Fewer than 500 winter runsalmon have returned to spawn each year in the Upper Sacramento in recent years, compared with the 60,000per year that returned 20 years ago. Only 432 steelhead returned in 1966 compared with over 17,000 in 1967 (16).The Delta smelt is dose to extinction. Causes of these dramatic declines include loss of habitat; water pollution;dam, levee, and diversion-facility obstructions; and drought. When conditions are poor in the Delta--whenflows are low and water temperatures and exports are high-losses of young, ocean-bound salmon can bevery high.
Fishermen, as well as fish, have suffered. Fish losses have cost the local economy over $15 million per yearin recent years. In effect, the benefits to people who receive water diverted from the Delta have come partially atthe expense of both fish and fishing interests. In March 1993, the U.S. Fish and Wildlife Service and the NationalMarine Fisheries Service invoked the Endangered Species Act (P.L. 100-707) to protect winter run chinook salmonand Delta smelt, setting limits on the operations of the Central Valley Project and intensifying a dispute betweenState and Federal officials on how best to protect the Delta.
Delta farmland and levees-The Delta, once a natural marshland, was developed for farming around theturn of the century and now contains almost 550,000 acres (223,000 hectares)1 of rich farmland. The marshlandwas converted to a mosaic of over 70 islands by building over 1,100 miles (1 ,800 kilometers)2 of levees. The leveesystem is fragile, however. The peat soils of the Delta have been gradually compacting, requiring that leveesconstantly be raised or repaired. Many of the levee-surrounded Delta islands are now well below sea level.Maintenance of the levee system is important for protecting life, property, and infrastructure from flooding on Deltaislands. Permanently flooded islands would also have major adverse effects on both water quality in the Delta andfreshwater supplies. Since 1960,24 levees have failed, and with each year, the fate of these islands becomes moreuncertain.
1 To convert acres to hectares, multiply by 0.405.
2 TO convert miles to kilometers, multiply by 1.609.(continued on next page)
32 Preparing for an Uncertain Climate-Volume 2
Box 1-E--Water Allocation and the Sacramento-San Joaquin River System--(Continued)
Water quality--Water quality in the Delta is of concern because of possible salinity intrusion into the westernDelta from San Francisco Bay, wastewater discharges that contain chemical pollutants, and the inflow ofagricultural drainage water that may contain pesticide residues and other toxic agents (18). Maintaining waterquality and ecological health in the Delta(by, among other things, ensuring that an adequate amount of fresh waterreaches the Delta) is legally required by the State but may conflict with water transfers and Iocal consumptive uses.This is especially true during drought, when there may not be enough water to fulfill all demands. Drought posesanother problem as well: during low-flow periods, water temperature in system rivers increases, and this hascontributed significantly to the decline of odd-water anadromous fish species in recent years.
In sum, Californians are making heavy demands on the Sacramento-San Joaquin River System. Theyrecognize that the means of transferring water from the Delta must be improved to maintain water quality and toenable more efficient transfer of supplies to the southern part of the State, but the issue has proved to be one ofthe most controversial water problems in the West. In 1982, for example, California voters defeated a referendumto build the so-died Peripheral Canal around the Delta to improve the system’s efficiency. Northern Californiansoverwhelmingly rejected the proposal, for fear that the Delta’s environmentwould not be adequately protected andbecause they perceived that populous Southern California was attempting yet another “water grab.” A/thoughthere was more support in Southern California, many in that part of the State feared the project's high cost.
Studies of the potential impact of climate change in California suggest--but have by no means proven--thatthe regional effects of climate change could be reduced mountain snowpack, a shift in runoff patterns (i.e., in timing,amount, or duration of precipitation), and large decreases in summer soil moisture. Specifically, a possible resultof warming temperatures is that more winter precipitation will fall as rain and a reduced mountain snowpack willstart melting earlier in the spring. As a result, reservoirs would fill faster. Because a portion of reservoir space mustbe reserved for flood-control purposes, the additional water would have to be spilled. A/though California’s totalwater budget might remain the same, less would be available during the summer, when water demand is highestThe reduced snowpack in effect represents the loss of one or more storage reservoirs. Maintaining adequatefreshwater flow to San Francisco Bay would be more difficult in summer and could increasingly conflict with waterneeded for consumptive purposes. Summer temperatures would also likely increase in the Sacramento and otherrivers and represent a threat to fish.
A further complication could be sea level rise. The intergovernmental Panel on Climate Change predicts atotal sea level rise of 28 inches (65 centimeters)3 by 2100. Such a rise would inundate the entire Delta area andhave devastating effects on Delta islands and water quality. A sea level rise of more than 2 feet would transformthe current 100-year high-tide peak at Antioch, a western Delta location, into a 1 in 10 event--making such rareoccurrences more common. Levees would be even more expensive, or even impossible, to maintain. Becausethe Delta islands are developed for farming and valued for helping preserve water quality, the initial response toincremental sea level rise is likely be to try to preserve the islands. In the long run, a phased retreat from the Deltamay have to be considered (142). Choosing between preservation at any price and abandonment would not beeasy.
If the above impacts occur (Or worse, if California’s water budget actuallydecreases), maintaining California’swater supplies for consumptive purposes and maintaining the health of the Delta will be a great challenge. Thiswould be especially true during droughts, which, if more common than-and as extreme as--the currentdrought In California, could have devastating impacts. A suite of demand-and-supply management andsupply-augmentation responses to the State’s water problems is being considered. No one response will besufficient Conservation and water marketing could significantly ease California’s water problems, but building newreservoirs and even some desalination plants and other responses may be needed as well.
3 To convert inches to centimeters, multiply by 2.540.
SOURCE: Office of Technology Assessment, 1993.
Chapter 1--Synthesis, Summary, and Policy Options 33
Box l-F-Changes in Agriculture and the Fate of Prairie Potholes:The Impacts of Drought and Climate Change
The prairies comprise millions of acres over a vast geographical area that includes parts of Canada, and theStates of Montana, North Dakota, South Dakota, Minnesota, and lowa.The region is characterized by a glaciated,depressed topography with poorly defined drainage that results innumerous small lakes and wetlands known asprairie potholes.1 Millions of potholes dot the landscape, providing an impermanent water source for the region’sagricultural operations and diverse wildlife, including migratory waterfowl. Since the early 1960s, a general shiftin the structure of the agricultural economy has occurred in the prairie region, involving a move towardmore-intensive farming practices (60). The drainage of prairie potholes has been accelerated in order to bring moreland into production and to increase yields on existing cropland. However, drought conditions in recent years haveevoked concerns about the sustainability of the regional agriculture and wildlife and have raised questions aboutimpacts that may result from climate change.
The drying effects of climate change are certain to affect the prairie-pothole region by altering aquaticconditions. Agricultural operations and wildlife rely on prairie potholes for water. An increase in temperature, whichwould influence aridity in continental interior areas, would reduce available volumes, thereby putting both farmingand waterfowl at risk in addition to changes in the availability of surface water, water storage in the soil is likelyto decrease (134). Temperature changes may also mean an extended growing season, which could alter thenesting and feeding habits of wildlife. in total, climate change will affect the region by increasing existing stresson the prairie-pothole ecosystems and agriculture.
Agriculture operations in the prairie region have long provided the bulk of the Nation’s wheat supply. Wheatis well-suited to the region’s dryland agriculture, with the majority of precipitation failing during the growing seasonand with relatively cool temperatures keeping evapotranspiration rates down. Farming in the region has becomemore and more intensive as agriculture has become increasingly mechanized. These developments have had aconsiderable effect on the fate of prairie potholes, which have decreased from 20 million to 7 million acres (8 to3 million hectares)2 leaving only 35 percent of the original pothole acreage intact (179). A poor farm economy inthe 1980s coupled with mechanization caused prairie farmers to push every possible acre into production. NorthDakota’s potholes were being drained at an estimated rate of 20,000 acres per year to support conversion toagriculture (179). And drainage rates became similarly high in other prairie States, as farmers recognized thepotential value of new farmland.
NOW, although 20 percent of all remaining prairie potholes are protected, 3 prairie potholes are among the mostthreatened ecosystems in the United States. They provide prime nesting grounds and habitat for a multitude ofwaterfowl and other wildlife. Since the 1970s, populations of three common duck species (the mallard, the pintail,and the blue-winged teal) have declined dramatically. Populations of some other species of duck less dependenton potholes in agricultural regions have increased. The mallard, pintail, and blue-winged teal nest in thedrought-prone zone of intensive agriculture (1 19). These migratory waterfowl have lost not only extensive areasof breeding habitat, but also adjacent vegetated areas once used for food and cover. Here,the detrimental effectsof the loss of wetlands cleared for agricultural use are dramatic; wildlife populations have likely been cut in half(60).
1 Prarie-pothole wetlands are relatively shallow, water-holding depressions that vary in size, waterpermanence, and water chemistry.They are located in the glaciated Portion of the North American Great Plains andare the single most important breeding area for waterfowl on this continent (63). They also support a variety of otherwildlife.
2 TO convert acres to hectares, multiply by 0.405.3 Protection includes, but is not limited to: ownership by Federal or State governments,short- and long-term
government easements, and ownership by private conservation groups.
(Continued on next page)
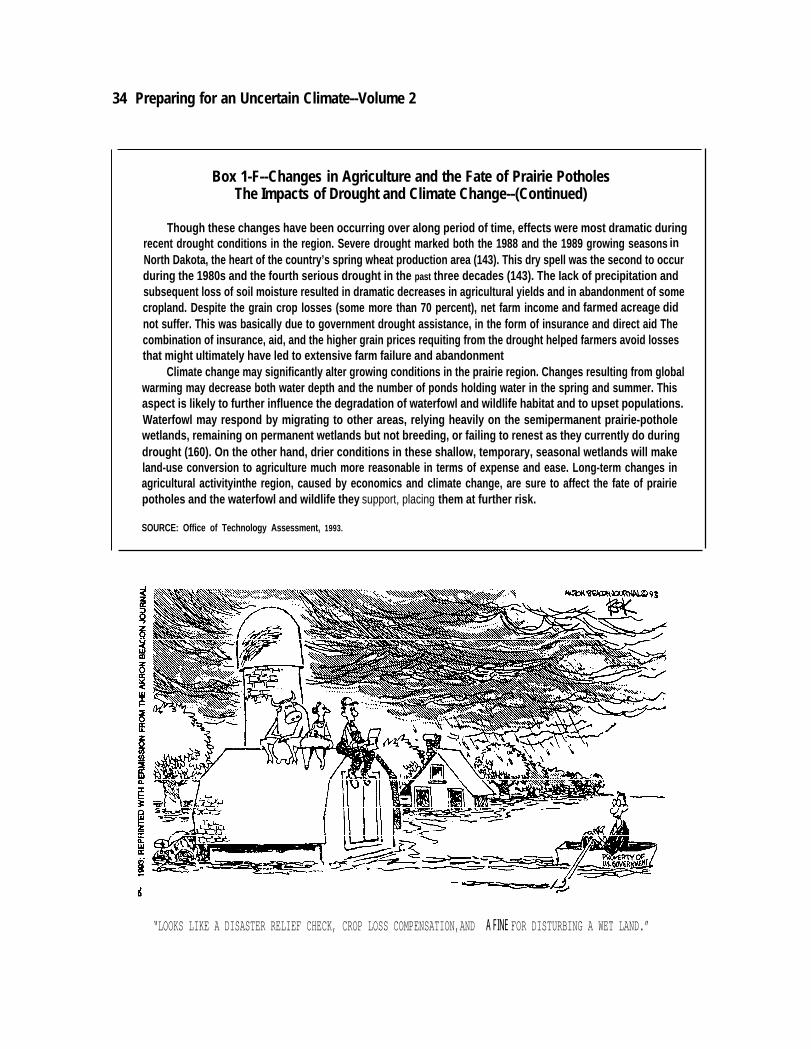
34 Preparing for an Uncertain Climate--Volume 2
Box 1-F--Changes in Agriculture and the Fate of Prairie PotholesThe Impacts of Drought and Climate Change--(Continued)
Though these changes have been occurring over along period of time, effects were most dramatic duringrecent drought conditions in the region. Severe drought marked both the 1988 and the 1989 growing seasons inNorth Dakota, the heart of the country’s spring wheat production area (143). This dry spell was the second to occurduring the 1980s and the fourth serious drought in the past three decades (143). The Iack of precipitation andsubsequent loss of soil moisture resulted in dramatic decreases in agricultural yields and in abandonment of somecropland. Despite the grain crop losses (some more than 70 percent), net farm income and farmed acreage didnot suffer. This was basically due to government drought assistance, in the form of insurance and direct aid Thecombination of insurance, aid, and the higher grain prices requiting from the drought helped farmers avoid lossesthat might ultimately have led to extensive farm failure and abandonment
Climate change may significantly alter growing conditions in the prairie region. Changes resulting from globalwarming may decrease both water depth and the number of ponds holding water in the spring and summer. Thisaspect is likely to further influence the degradation of waterfowl and wildlife habitat and to upset populations.Waterfowl may respond by migrating to other areas, relying heavily on the semipermanent prairie-potholewetlands, remaining on permanent wetlands but not breeding, or failing to renest as they currently do duringdrought (160). On the other hand, drier conditions in these shallow, temporary, seasonal wetlands will makeland-use conversion to agriculture much more reasonable in terms of expense and ease. Long-term changes inagricultural activityinthe region, caused by economics and climate change, are sure to affect the fate of prairiepotholes and the waterfowl and wildlife they support, placing them at further risk.
SOURCE: Office of Technology Assessment, 1993.
“LOOKS LIKE A DISASTER RELIEF CHECK, CROP LOSS COMPENSATION,AND A FINE FOR DISTURBING A WET LAND.”
Chapter l-Synthesis, Summary, and Policy Options I 35
for research and management of public lands (theDepartment of the Interior (DOI), the U.S. De-partment of Agriculture, the National ScienceFoundation and EPA) combined receive less than30 percent of the total funding for EcologicalSystems and Dynamics (less than 5 percent of thetotal USGCRP budget). Given that such researchon ecological and human impacts may take yearsor decades to produce results, the slow processmay cost us the ability to respond to globalchange in areas that are especially at risk toirreversible damage. In addition to understandingclimate impacts and effects, it is important toknow how to minimize socioeconomic impacts.Ultimately, to be useful in plannin g for anuncertain climate, USGCRP must include ecosys-tem research that can feed into management,socioeconomic analysis, and adaptation research.An assessment process that incorporates all thesecategories and permits inputs from stakeholdersand policy makers is necessary to make USGCRPtruly policy relevant. This is a much broaderdefinition of “assessment” than USGCRP canaccommodate given its current research programand structure.
NEAR-TERM CONGRESSIONAL ACTIONIn the resource chapters (vol. 1, chs. 4-6, and
vol. 2, chs. 4-6) of this report, a series of ‘‘fnststeps’ is outlined to illustrate ways to beginincorporating climate change considerations intostatutes, policies, and programs relating to vari-ous natural resources-coasts, water, agriculture,wetlands, preserved lands, and forests. The froststeps for the resource chapters are summarizedbriefly in the last section of this chapter. Severalof the first steps focus on actions that offerimportant and immediate benefits, even withoutclimate change as an additional factor justifyingthem. Several targets of opportunity in the near-term congressional agenda, in the announced andpotential initiatives of the new Administration,and in the programs of the various agencies can becapitalized upon now.
Likewise, the USGRP offers annual opportuni-ties for changes. Chapter 3 discusses severaldirections the program could take; many of theseoptions are included below as possible near-termcongressional actions. The process of policydevelopment in government is not so orderly thatone can lay out and follow a detailed plan oflogical first steps, followed by logical secondsteps, and so on. Regular congressional reauthori-zation cycles for major natural resource pro-grams, the annual budget cycle, election cycles,the fragmentation of responsibilities among con-gressional committees, and still other policy-making realities provide the context in whichdecisions about climate change will be made.Seen in this light, the choice of first steps issignificantly influenced by an assessment ofwhere the opportunities lie.
I Annual AppropriationsEven if Congress did nothing else, each year it
would enact legislation appropriating money forcarrying out governmental programs. Thus, animmediate and recurrent annual opportunity toaddress many of the issues considered in thisreport is through the appropriation process. Mostsimply and directly, to narrow the breadth ofuncertainties that exist today, Congress can en-sure adequate levels of funding for existingclimate-change-related research programs.Through the appropriation process, Congress canalso encourage natural resource managementagencies to carry out their monitoring and re-search programs in ways that meet their intendedobjectives while simultaneously producing datathat could be useful to their own or otheragencies’ climate change research efforts.
The annual appropriation process is also themeans by which Congress makes major long-terminvestments-for example, in land acquired forNational Parks and wildlife refuges and in damsand other water resource projects. Until now,climate change considerations have not been afactor in deciding whether any of these invest-
36 I Preparing for an Uncertain Climate--Volume 2
ments were prudent. One could justify inclusionof such considerations now because climatechange has the potential to lessen the value ofsuch investments. Thus, Congress could re-quire that the land-acquisition, water-resource-development, and other similar proposalsbrought before it be accompanied by explicitevaluations of how climate change may affectthe long-term viability of the investment. Alter-natively, in the case of lands proposed to beacquired for conservation purposes, Congresscould direct that the criteria by which agenciesrank their acquisition priorities include someconsideration of potential climate change impactson those lands or their resources. Building up theNation’s reserve of protected land would helpstem some climate change impacts by reducingfragmentation and, possibly, reducing otherthreats to natural area resources. Increased pro-tection and reduced fragmentation of these areascould help build more resiliency into somenatural systems (see vol. 2, chs. 4 and 5).
Congress has increasingly linked policy direc-tion to agency funding during the appropriationprocess. Congress could include requirementsin its various appropriation bills that each ofthe agencies managing natural resources po-tentially affected by climate change provideCongress with its own evaluation of the agen-cies’ preparedness to cope with a range ofclimate futures. The appropriation process mayalso be especially well-suited to encouragingagencies that implement climate-sensitive pro-grams (e.g., agricultural disaster assistance, cropsubsidies, and flood insurance) to develop long-term budget projections for those programs basedon several future climate scenarios. In this way, abudget-conscious Congress can better informitself early on about the potential costs of climatechange for those programs.
# Reauthorization CycleIn addition to the annual appropriation cycle,
congressional action is heavily influenced by the
reauthorization cycles of major Federal programs.Congressional attention is not focused on allissues at once. Rather, at any given time, itsattention is disproportionately focused, throughits committees, on the major Federal programs forwhich current authorization is about to expire.The process of extending that authorization pro-vides an opportunity to evaluate the workings ofa program closely and to provide legislative direc-tion for that program for a period of many years.Thus, at least with respect to changes in existingFederal natural resource programs, the best op-portunities to implement the first steps recom-mended here are in the context of laws andprograms that are about to be reauthorized.
Among these, the Clean Water Act is a high-priority target of opportunity (see vol. 1, box 5-C).Comprehensive revisions of that law have beenproposed, and the act’s wetland provisions areundergoing particular scrutiny. The reauthori-zation of the Clean Water Act provides a keyopportunity to address one of the more importantneeds identified in this report-the need toachieve more effective integration of resource-management efforts across political jurisdictions.Comprehensive watershed planning (see vol. 1,ch. 5), which integrates wetland protection andrestoration goals (see vol. 2, box 4-A), water-use-efficiency goals, strategies for controlling point-source and non-point-source pollution, and bothwater-quantity and water-quality concerns gener-ally, could create the institutional capability andflexibility to anticipate and plan for climatechange. Such planning could be especially valu-able for finding creative ways to resolve currentconflicts in which landowner and developmentinterests chafe at restrictions on use of wetlands,while environmental interests decry the continuedloss of wetlands (see vol. 2, ch. 4 and box 4-B).
Another major target of opportunity is theupcoming reauthorization of farm programs in the1995 Farm Bill. The next reauthorization cyclecould provide a forum for considering how toenhance farmers’ flexibility and effectiveness inresponding to a changing climate and how climate
Chapter l-Synthesis, Summary, and Policy Options I 37
change may affect Federal expenditures on disas-ter assistance and farm commodity programs (seevol. 1, ch. 6).
I New Targets of OpportunityIn addition to the reauthorization of existing
laws, Congress regularly considers altogethernew legislation creating programs for existing ornew agencies of Government. A program of po-tentially great significance on the horizon isInterior Secretary Babbitt’s proposal to create aNational Biological Survey (see vol. 2, box 5-L).Legislation to establish the Survey has beenintroduced in both the House and Senate, and aNational Research Council committee has beenasked to offer advice on the formation and role ofthe Survey. The nature, mandate, resources, andoverall purposes of the National Biological Sur-vey, however, are still very much in the process ofdevelopment. The bills introduced in Congressthus far to establish the Survey give only a verygeneral description of its functions. Thus, thereexists an opportunity to shape the content anddirection of this new institution in ways thatwould be useful to the management of naturalresource systems in a changing climate.
The rationale frequently offered by SecretaryBabbitt for creating a National Biological Surveyis its potential, by cataloging the biologicalresources of the Nation and monitoring theirstatus and trends, to avert future ‘‘train wrecks, ’that is, the disruptive and wrenching conflictsbetween conservation and development goals. A‘‘train wreck’ of another sort could take the formof severe adverse impacts on our natural resourcesfrom climate change for which we were unpre-pared. A National Biological Survey could helpdetect, evaluate, and prepare for that climatechange. Thus, an important opportunity exists tostructure the mission and capabilities of theSurvey so that it can contribute to the earlydetection of indicators of climate change, a betterunderstanding of the ability of organisms andnatural communities to respond to climate changes,
and the design and management of a system ofpreserves best able to achieve the purposes forwhich they were established. Careful congres-sional attention now to these details in the designof a National Biological Survey could yield majorreturns in the future (see vol. 2, ch. 5).
~ Existing Statutory LanguageOf the many Federal statutes pertaining to the
management of the natural resource systemsdiscussed in this report, only one-the CoastalZone Management Act (CZMA; P.L. 92-583 )--explicitly addresses climate change and its poten-tial consequences. The 1990 amendments to thatlaw required that possible sea level rise resultingfrom climate change be anticipated and addressedin State coastal zone management plans (see vol.1, ch. 4). Congress could extend this legislativeprecedent to other statutory arenas; here, weattempt to identify which statutes may be mostappropriate for this.
None of the statutes governing the variousnatural resource systems discussed throughoutthe full report precludes the agencies responsiblefor their management from fully consideringclimate change. Existing grants of authority aresufficiently general and open-ended to allow anagency, on its own initiative, to examine theimplications of climate change for the naturalresources under its jurisdiction and to tailor itsmanagement of those resources accordingly.The question, therefore, is whether Congresswishes to supplement the existing legislativeframework with explicit directives pertaining toclimate change.
Several categories of legislation may be espe-cially appropriate for considering possible climate-change-related amendments. First among theseare statutes, such as CZMA, that require long-range planning for the management of naturalresources. For example, the Rangeland andRenewable Resources Planning Act of 1974(RPA; P.L. 93-378) requires the preparation of aforest “resource planning assesment’ that looks
38 I Preparing for an Uncertain Climate-Volume 2
50 years into the future. Similarly, the CleanWater Act requires preparation of area-widewaste treatment plans that look two decades intothe future, a planning horizon also found in thePacific Northwest Electric Power Planning andConservation Act (P.L. %-501). In general, thelonger the time frame over which management isto be planned, the greater the likelihood thatclimate change may affect the resources beingmanaged. Thus, mechanisms to ensure that cli-mate change is taken into account when long-range plans are being developed and to ensure thatplans can be revised as new information about thedirection and magnitude of climate change be-comes available are clearly desirable.
A second statutory area, where it is especiallyimportant to ensure that potential climate changeis considered is long-term public or privateinvestments affecting natural resources. Examp-les include public land acquisition for parks,wildlife refuges, and the like (see vol. 2, box 5-C).Historically, such public land acquisitions havebeen viewed as permanent investments, with theintention of keeping the areas acquired in publicownership in perpetuity. The expectation implici-tly accompanying these investments has beenthat the areas acquired would, with appropriatemanagement, continue to provide the environ-mental and recreational benefits for which theywere acquired indefinitely into the future. Cli-mate change introduces a new uncertainty aboutthe validity of this expectation. At the very least,it suggests the need for a more careful examina-tion of whether particular acquisitions are, in fact,likely to continue to provide the environmentalbenefits that they provide today.
Somewhat similar are public or private in-vestments in dams and other water-resource-development projects. Public projects are gov-erned by the Water Resources Planning Act (P.L.89-80) and private ones are licensed pursuant tothe Federal Power Act (P.L. 102-486). Theimplicit assumption underlying both has alwaysbeen that hydrological models based on pastclimate will accurately predict future conditions
as well. The possibility of climate change castsdoubt on the continuing validity of that assump-tion and may warrant statutory revisions explic-itly requiring water resource planning agenciesand Federal regulators to factor climate changeinto their decisionmaking.
A third statutory arena relevant here includesthose laws that require an evacuation of theexpected environmental impacts of plannedactions. Foremost among these laws is the Na-tional Environmental Policy Act (NEPA; P.L.91-190); similar, though less far-reaching, lawsinclude the Fish and Wildlife Coordination Act(P.L. 85-624) and the Endangered Species Act(P.L. 100-707). Under these and similar laws,expectations of the environmental impacts ofplanned actions may vary, depending on whethera constant or changing climate is anticipated.Legislative direction could provide useful guid-ance to agencies with respect to their duties toconsider climate change possibilities in implem-enting their responsibilities (see, for example,vol. 2, box 5-D).
A fourth set of laws that warrant discussionconsists of those that authorize research pro-grams. The Clean Water Act and the Rangelandand Renewable Resources Planning Act areexamples. As this report makes abundantly clear,there are many uncertainties about climatechange, including its magnitude, its direction, andits impact on natural resource systems. Naturalresource management will require research aimedat resolving many of today’s uncertainties. Re-flecting that need in the legislative description ofthe various research missions may serve tounderscore the importance of this area of inquiry.Each resource chapter highlights important re-search options to consider.
Finally, the Science Policy Act of 1976 (P.L.94-282), which established the Office of Scienceand Technology Policy (OSTP) and the FederalCoordinating Council on Science, Engineering,and Technology (FCCSET), could be amended tostrengthen the ability of these offices to coordi-
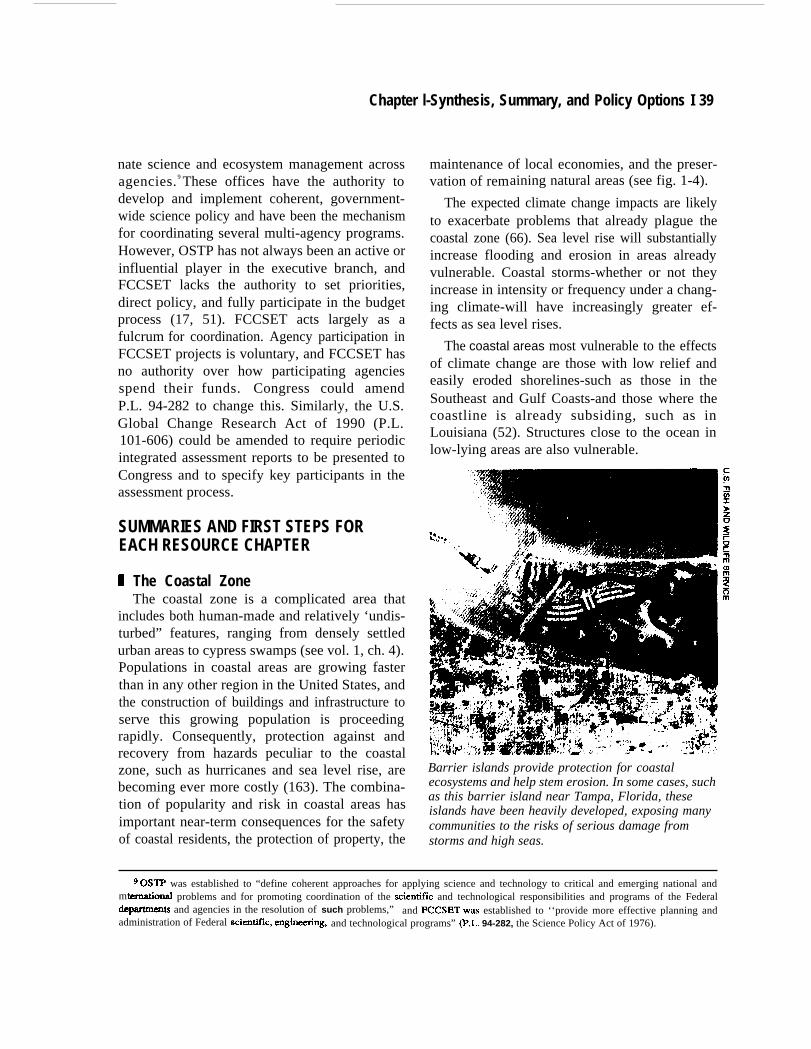
Chapter l-Synthesis, Summary, and Policy Options I 39
nate science and ecosystem management acrossagencies. 9 These offices have the authority todevelop and implement coherent, government-wide science policy and have been the mechanismfor coordinating several multi-agency programs.However, OSTP has not always been an active orinfluential player in the executive branch, andFCCSET lacks the authority to set priorities,direct policy, and fully participate in the budgetprocess (17, 51). FCCSET acts largely as afulcrum for coordination. Agency participation inFCCSET projects is voluntary, and FCCSET hasno authority over how participating agenciesspend their funds. Congress could amendP.L. 94-282 to change this. Similarly, the U.S.Global Change Research Act of 1990 (P.L.101-606) could be amended to require periodicintegrated assessment reports to be presented toCongress and to specify key participants in theassessment process.
SUMMARIES AND FIRST STEPS FOREACH RESOURCE CHAPTER
B The Coastal ZoneThe coastal zone is a complicated area that
includes both human-made and relatively ‘undis-turbed” features, ranging from densely settledurban areas to cypress swamps (see vol. 1, ch. 4).Populations in coastal areas are growing fasterthan in any other region in the United States, andthe construction of buildings and infrastructure toserve this growing population is proceedingrapidly. Consequently, protection against andrecovery from hazards peculiar to the coastalzone, such as hurricanes and sea level rise, arebecoming ever more costly (163). The combina-tion of popularity and risk in coastal areas hasimportant near-term consequences for the safetyof coastal residents, the protection of property, the
maintenance of local economies, and the preser-vation of remaining natural areas (see fig. 1-4).
The expected climate change impacts are likelyto exacerbate problems that already plague thecoastal zone (66). Sea level rise will substantiallyincrease flooding and erosion in areas alreadyvulnerable. Coastal storms-whether or not theyincrease in intensity or frequency under a chang-ing climate-will have increasingly greater ef-fects as sea level rises.
The coastal areas most vulnerable to the effectsof climate change are those with low relief andeasily eroded shorelines-such as those in theSoutheast and Gulf Coasts-and those where thecoastline is already subsiding, such as inLouisiana (52). Structures close to the ocean inlow-lying areas are also vulnerable.
Barrier islands provide protection for coastalecosystems and help stem erosion. In some cases, suchas this barrier island near Tampa, Florida, theseislands have been heavily developed, exposing manycommunities to the risks of serious damage fromstorms and high seas.
9 OSTP was established to “define coherent approaches for applying science and technology to critical and emerging national andmternational problems and for promoting coordination of the scientiilc and technological responsibilities and programs of the Federaldepartmats and agencies in the resolution of such problems,” and FCCSET wm established to ‘‘provide more effective planning andadministration of Federal scientiilc, enginmring, and technological programs” (P.L. 94-282, the Science Policy Act of 1976).
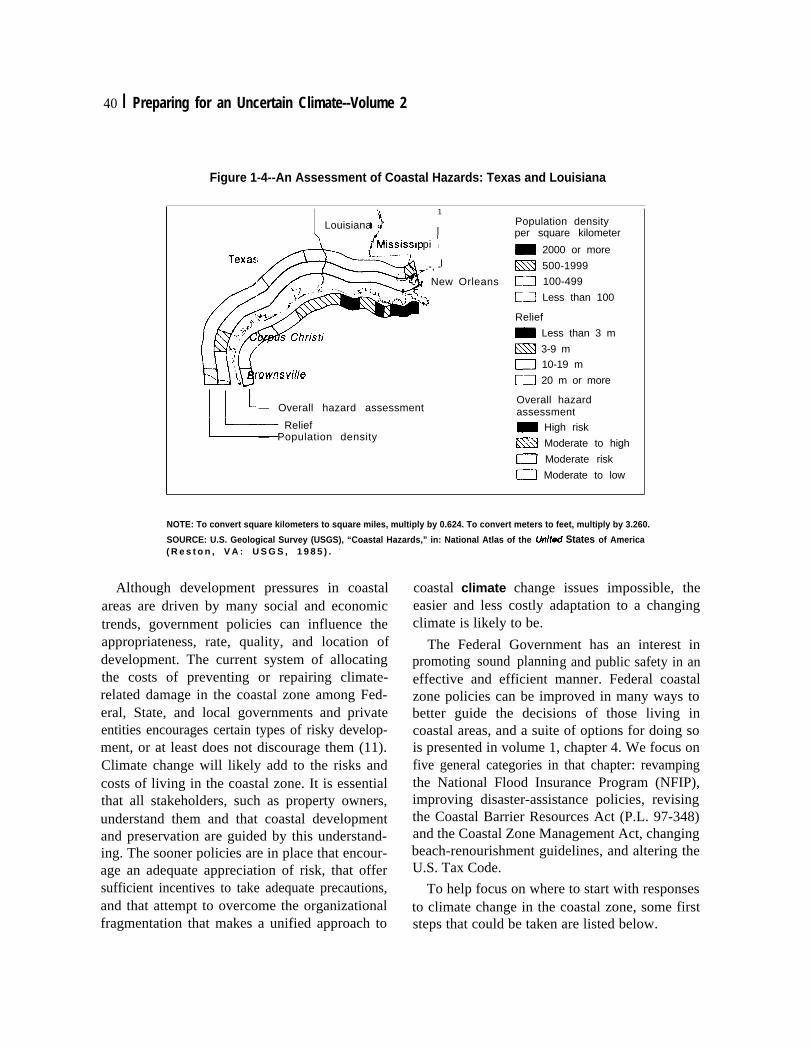
40 I Preparing for an Uncertain Climate--Volume 2
Figure 1-4--An Assessment of Coastal Hazards: Texas and Louisiana
<
)1
Louisiana IMississippi “1
TexasL--------
I7.-, -.
f’
New-. . s’ ~ fu
,f~
. +~+~
j
\ \ownsvi/lee
1-— Overall hazard assessment
l_5– Relief— Population density
Orleans
Population densityper square kilometer
m 2000 or more
m 500-1999
I--J 100-499
D Less than 100
Relief
_ Less than 3 m
N 3-9 m
n 10-19 m
m 20 m or more
Overall hazardassessment
m High risk
~ Moderate to high
m Moderate risk
O Moderate to low
NOTE: To convert square kilometers to square miles, multiply by 0.624. To convert meters to feet, multiply by 3.260.
SOURCE: U.S. Geological Survey (USGS), “Coastal Hazards,” in: National Atlas of the United States of America( R e s t o n , V A : U S G S , 1 9 8 5 ) . -
Although development pressures in coastalareas are driven by many social and economictrends, government policies can influence theappropriateness, rate, quality, and location ofdevelopment. The current system of allocatingthe costs of preventing or repairing climate-related damage in the coastal zone among Fed-eral, State, and local governments and privateentities encourages certain types of risky develop-ment, or at least does not discourage them (11).Climate change will likely add to the risks andcosts of living in the coastal zone. It is essentialthat all stakeholders, such as property owners,understand them and that coastal developmentand preservation are guided by this understand-ing. The sooner policies are in place that encour-age an adequate appreciation of risk, that offersufficient incentives to take adequate precautions,and that attempt to overcome the organizationalfragmentation that makes a unified approach to
coastal climate change issues impossible, theeasier and less costly adaptation to a changingclimate is likely to be.
The Federal Government has an interest inpromoting sound planning and public safety in aneffective and efficient manner. Federal coastalzone policies can be improved in many ways tobetter guide the decisions of those living incoastal areas, and a suite of options for doing sois presented in volume 1, chapter 4. We focus onfive general categories in that chapter: revampingthe National Flood Insurance Program (NFIP),improving disaster-assistance policies, revisingthe Coastal Barrier Resources Act (P.L. 97-348)and the Coastal Zone Management Act, changingbeach-renourishment guidelines, and altering theU.S. Tax Code.
To help focus on where to start with responsesto climate change in the coastal zone, some firststeps that could be taken are listed below.
Chapter l-Synthesis, Summary, and Policy Options I 41
■ Revamp the National Flood InsuranceProgram. The National Flood Insurance Pro-gram could be revised to provide strongerincentives to reduce the potential costsassociated with high-risk development incoastal areas. Congress has been consideringrevising the NFIP for several years, and billsto do this have been introduced in both theHouse and Senate. H.R. 62, the “NationalFlood Insurance Compliance, Mitigation,and Erosion Management Act of 1993,”contains provisions that partially addresssome of the NFIP improvements that maybedesirable. Most pressing is the need toadequately address erosion along the coast.Erosion losses will increase with rising sealevels. The Federal Emergency ManagementAgency does not now have the authority tomap erosion risks or to reflect such risks ininsurance premiums, and as a consequence,information and incentives to avoid develop-ment in eroding areas are inadequate. Also,it seems especially desirable to increaseinsurance premiums after multiple claims aremade on properties in high-risk areas subjectto repeated flooding.
■ Improve disaster assistance. Several billshave also been introduced in the 103dCongress to revise disaster-assistance poli-cies and regulations. More stringent disas-ter mitigation by States and localitiescould be required, which could hold downfuture costs to the Federal Government.This could be accomplished by more stronglytying disaster assistance to adoption ofmitigation measures. H.R. 935, the “Earth-quake, Volcanic Eruption, and HurricaneHazards Insurance Act of 1993, ” for exam-ple, would establish minimum criteria forreducing losses, recommends such measuresas fiscal incentives to reduce losses, providesfor low-interest loans or grants to retrofitfacilities vulnerable to hurricanes, and pro-vides guidelines for establishing actuarialpremium rates for disaster insurance. S. 995,
the “Federal Disaster Preparedness and Re-sponse Act of 1993, ’ would establish, amongother things, a grant program and accompa-nying performance standards to help Statesprepare for, respond to, and recover frommajor disasters.
■ Strengthen coastal zone management.The Coastal Zone Management Act willbe up for reauthorization in 1995, andthis provides an opportunity to requirestronger State controls on risky develop-ment. Such controls could include, forexample, an erosion-setback program(already adopted by several States), re-restrictions on construction of immovablebuildings, a relocation-assistance program,restrictions on rebuilding damaged or de-stroyed structures in high-risk locations, andadoption of minimum coastal-constructionstandards. All of these controls would addsome degree of protection against sea levelrise and flood or storm damage. Anotherpossibility for reducing risks of living on thecoasts would be to encourage States to adoptcoastal-hazards-management programs.These could be overseen jointly by theNational Oceanic and Atmospheric Ad-ministration and the Federal EmergencyManagement Agency.
■ Promote public education. The public gen-erally is not well-informed about the risksassociated with living in coastal areas, andthis lack of awareness has led and willcontinue to lead to large public and privateexpenditures. H.R. 935 provides one possi-bility for expanding public education. Theact authorizes education programs andprovides funds to States to implementthem through a self-sustaining mitigationfund. The private sector, particularly theprivate insurance industry, could also play animportant role in increasing awareness ofcoastal hazards.
■ Require increased State and local contri-butions to beach-nourishment operations.
42 I Preparing for an Uncertain Climate-Volume 2
Most benefits of the U.S. Army Corps ofEngineer’s beach nourishment and shoreline-protection projects are realized at the local orregional level, yet these projects are oftenheavily subsidized. In most instances, theFederal share is 65 percent. Greater Stateand local contributions could be required,both for initial construction and for main-tenance, and Federal funding could bemade conditional on adoption of strongermitigation measures. These adjustmentswould tend to increase the interest of localgovernments in acting to limit communityexposure to coastal hazards.
I Water ResourcesMany factors are straining the Nation’s water
resources and leading to increased competitionamong a wide variety of different uses and usersof water (see vol. 1, ch. 5). Human demands forwater are increasingly in conflict with the needsof natural ecosystems, and this has led to signifi-cant water-quality and water-quantity problems(see vol. 1, box 5-B). In addition, water infrastruc-ture in many urban areas is aging.
Although it is unclear exactly how climatechange will affect water resources, climatechange has emerged as another important factorto consider in water resource planning. Changesin water availability as a result of climatechange could further affect already overbur-dened systems, and changes could occur in thefrequency, duration, and intensity of floodsand droughts (105). The areas that are mostvulnerable to climate change are, not surprisingly,places that are already experiencing stressedwater resources (see fig. 1-5), such as many partsof the Southwest and South Florida; the centralpart of the country, which most models predictwill become hotter and drier; and areas wherecompetition for water is expected to increase.
The country faces a huge challenge in adaptingits water resource systems to the many current andpotential stresses. The numerous impediments to
this adaptation include the fact that traditionalengineering solutions for developing additionalwater supplies-such as dam construction-havebecome prohibitively expensive and politicallyless acceptable because the best sites have alreadybeen developed. Federal agencies’ responsibili-ties for water often overlap or conflict, andcoordination among different levels of gover-nment on water issues is often inadequate (166)(see vol. 1, box 5-F). Many institutional arrange-ments for the management and allocation of waterresources are rigid and inefficient, making themill-equipped to cope well with water scarcity. Andthere are very few incentives to conserve water.
Water resource planning is a complex political,economic, sociological, scientific, and technolog-ical endeavor, so adaptation to change will not bestraightforward. In encouraging adaptation tochanges in water resources caused by climatechange, the Federal Government, in cooperationwith State and local agencies, should focus onencouraging five types of activity: improvingdemand management (e.g., through pricing re-form and conservation); improving supply man-agement (e.g., through improving coordination,jointly managing ground- and surface-water sup-plies, and improving the management of reser-voirs and reservoir systems); facilitating watermarketing and related types of water transfers;improving planning for floods and droughts; andpromoting the use of new analytical tools thatenable more efficient operations.
The following first steps toward improvingwater resources planning and management—selected from a longer suite of options presentedin volume 1, chapter 5—are intended to bothrelieve existing stresses and make sense forclimate change.
■ Improve extreme-events management.Despite all efforts to date, both floods anddroughts continue to cause significant lossesto human and natural systems (143, 200).Greater coordination of the many agen-cies with flood- or drought-related re-
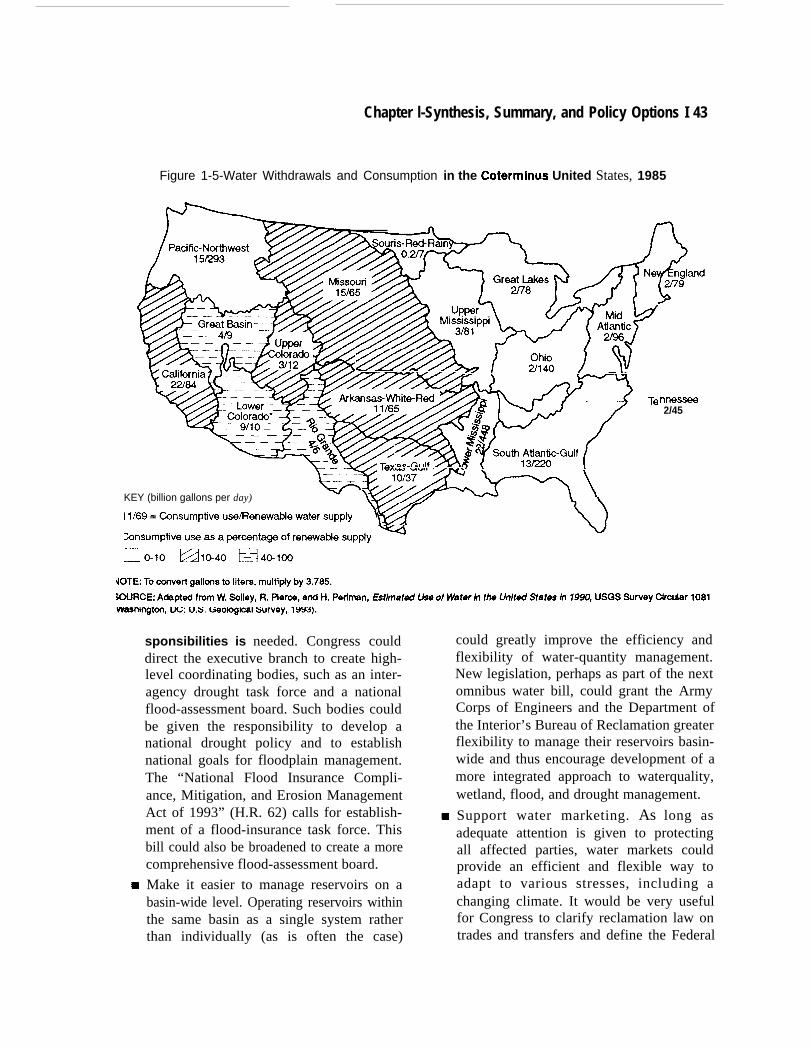
Chapter l-Synthesis, Summary, and Policy Options I 43
Figure 1-5-Water Withdrawals and Consumption in the Coterminus United States, 1985
Innessee2/45
KEY (billion gallons per day) “\y//zz’w v
sponsibilities is needed. Congress coulddirect the executive branch to create high-level coordinating bodies, such as an inter-agency drought task force and a nationalflood-assessment board. Such bodies couldbe given the responsibility to develop anational drought policy and to establishnational goals for floodplain management.The “National Flood Insurance Compli-ance, Mitigation, and Erosion ManagementAct of 1993” (H.R. 62) calls for establish-ment of a flood-insurance task force. Thisbill could also be broadened to create a morecomprehensive flood-assessment board.
Make it easier to manage reservoirs on abasin-wide level. Operating reservoirs withinthe same basin as a single system ratherthan individually (as is often the case)
could greatly improve the efficiency andflexibility of water-quantity management.New legislation, perhaps as part of the nextomnibus water bill, could grant the ArmyCorps of Engineers and the Department ofthe Interior’s Bureau of Reclamation greaterflexibility to manage their reservoirs basin-wide and thus encourage development of amore integrated approach to waterquality,wetland, flood, and drought management.
Support water marketing. As long asadequate attention is given to protectingall affected parties, water markets couldprovide an efficient and flexible way toadapt to various stresses, including achanging climate. It would be very usefulfor Congress to clarify reclamation law ontrades and transfers and define the Federal
44 I Preparing for an Uncertain Climate--Volume 2
Government’s interest in facilitating thecreation of markets (193). Congress couldurge the Department of the Interior toprovide stronger leadership to assist withwater transfers, and water marketing couldbe thoroughly evaluated as part of theWestern Water Policy Review, authorized inlate 1992.
■ Promote the use of new analytical tools.Further development, dissemination, anduse of new modeling and forecasting toolscould greatly enhance water resourcemanagement. Some current analytical ef-forts have not been adequately funded, andthe most advanced tools now available arenot yet being used by many States or waterutilities. Small investments in promotingdissemination and use of these tools todaycould save substantial sums later. Section 22of the Water Resources Development Act of1974 (P.L. 93-251) authorizes funding fortraining and technical assistance to Statesand could be used to promote the adoption ofthe new tools. Congress could also considerproviding funds to develop or refine toolsthat incorporate climate uncertainty intotraditional hydrologic analyses.
■ Promote demand management. The up-coming reauthorization of the Clean WaterAct is one potential target of opportunityfor improving water-use efficiency (seevol. 1, box 5-C). Congress could considermaking conservation projects eligible for theState revolving-fund loans created under theact to fund wastewater treatment plants. TheFederal Government could set an exampleby adopting efficient water-use practices inits own facilities. The Energy Policy Act of1992 (P.L. 102-486) requires that Federalfacilities adopt conservation practices to theextent practicable, but it concentrates pri-marily on energy conservation. A technical-adjustment bill to the Energy Policy Actcould be considered in the 103d Congressand would provide a way to clarify and
underline congressional intent toward waterconservation in Federal facilities.
■ Expand the scope of the Western WaterPolicy Review. With the enactment of Title30 of the Reclamation Projects Authoriza-tion and Adjustment Act of 1992 (P.L.102-575), Congress authorized the Presidentto oversee a major water-policy study. Title30 directs the President to undertake acomprehensive review of Federal activitiesthat affect the allocation and use of waterresources in the 19 western States and toreport findings to appropriate congressionalcommittees by the end of October 1995(190). Climate change is not mentioned asa factor motivating the Western WaterPolicy Review, but the study could pro-vide an opportunity to assess more fullyhow climate change may affect waterresources and to evaluate policy optionsthat might help with adaptation to awarmer climate. Congress could expandthe scope of the Review beyond the West, orit could authorize a similar follow-on studyof eastern water issues. The Review couldalso provide an opportunity to explicitlyconsider land-use practices and water re-source issues jointly. The relationship be-tween the two is close, and there appear to besignificant opportunities to improve bothwater-quantity and waterquality managem-ent by improving land-use practices.
# AgricultureAgriculture in the United States is an inten-
sively managed, market-based natural resource.Throughout the world, agriculture has adaptedcontinuously to the risks associated with normalclimate variability, just as it has adapted tochanges in economic conditions. The Americanagricultural sector will undoubtedly make furtheradaptations in response to climate changes, withmarket forces rewarding and encouraging therapid spread of successful adaptation (30, 41,
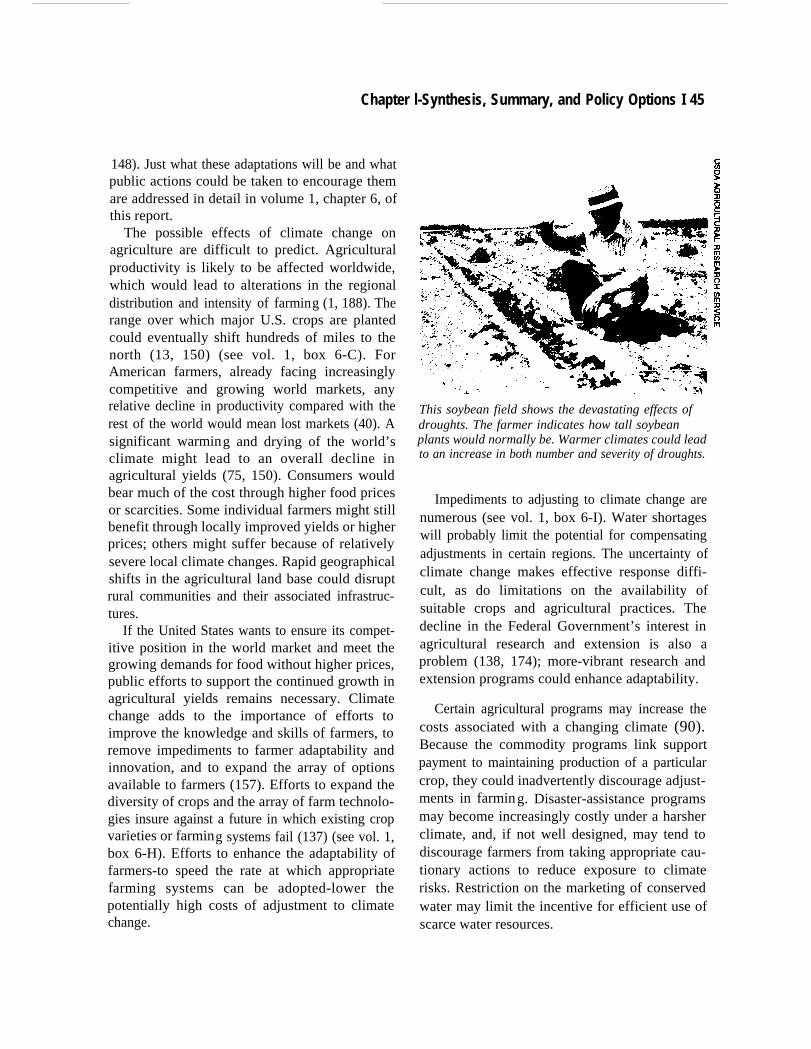
Chapter l-Synthesis, Summary, and Policy Options I 45
148). Just what these adaptations will be and whatpublic actions could be taken to encourage themare addressed in detail in volume 1, chapter 6, ofthis report.
The possible effects of climate change onagriculture are difficult to predict. Agriculturalproductivity is likely to be affected worldwide,which would lead to alterations in the regionaldistribution and intensity of farming (1, 188). Therange over which major U.S. crops are plantedcould eventually shift hundreds of miles to thenorth (13, 150) (see vol. 1, box 6-C). ForAmerican farmers, already facing increasinglycompetitive and growing world markets, anyrelative decline in productivity compared with therest of the world would mean lost markets (40). Asignificant warming and drying of the world’sclimate might lead to an overall decline inagricultural yields (75, 150). Consumers wouldbear much of the cost through higher food pricesor scarcities. Some individual farmers might stillbenefit through locally improved yields or higherprices; others might suffer because of relativelysevere local climate changes. Rapid geographicalshifts in the agricultural land base could disruptrural communities and their associated infrastruc-tures.
If the United States wants to ensure its compet-itive position in the world market and meet thegrowing demands for food without higher prices,public efforts to support the continued growth inagricultural yields remains necessary. Climatechange adds to the importance of efforts toimprove the knowledge and skills of farmers, toremove impediments to farmer adaptability andinnovation, and to expand the array of optionsavailable to farmers (157). Efforts to expand thediversity of crops and the array of farm technolo-gies insure against a future in which existing cropvarieties or farming systems fail (137) (see vol. 1,box 6-H). Efforts to enhance the adaptability offarmers-to speed the rate at which appropriatefarming systems can be adopted-lower thepotentially high costs of adjustment to climatechange.
This soybean field shows the devastating effects ofdroughts. The farmer indicates how tall soybeanplants would normally be. Warmer climates could leadto an increase in both number and severity of droughts.
Impediments to adjusting to climate change arenumerous (see vol. 1, box 6-I). Water shortageswill probably limit the potential for compensatingadjustments in certain regions. The uncertainty ofclimate change makes effective response diffi-cult, as do limitations on the availability ofsuitable crops and agricultural practices. Thedecline in the Federal Government’s interest inagricultural research and extension is also aproblem (138, 174); more-vibrant research andextension programs could enhance adaptability.
Certain agricultural programs may increase thecosts associated with a changing climate (90).Because the commodity programs link supportpayment to maintaining production of a particularcrop, they could inadvertently discourage adjust-ments in farming. Disaster-assistance programsmay become increasingly costly under a harsherclimate, and, if not well designed, may tend todiscourage farmers from taking appropriate cau-tionary actions to reduce exposure to climaterisks. Restriction on the marketing of conservedwater may limit the incentive for efficient use ofscarce water resources.
46 I Preparing for an Uncertain Climate-Volume 2
The most pressing tasks concerning agricul-ture and climate change that the FederalGovernment should undertake are: improv-ing technology and information transfer tofarmers in order to speed adaptation andinnovation in farm practice; removing theimpediments to adaptation created unneces-sarily by features of commodity support anddisaster-assistance programs; and supportingresearch and technology that will ensure thatthe agricultural sector can deal successfullywith the various challenges of the next century.
The Government could organize its approacharound the following first steps, which shouldincrease the ability of the farm sector to adjustsuccessfully to a changing climate.
■ Revise the commodity support programs.Congress addresses farm issues every 5years in omnibus farm bills, with the nextone likely to be debated for passage in 1995.The annual budget-reconciliation processand agricultural appropriations bills offerintermediate opportunities for revisions incommodity support programs. Commoditysupport payments are linked to the continuedproduction of a single crop. If a farmersignificantly changes crops, support pay-ments will be reduced. This link discouragesthe responsiveness of farmers to changingmarket and climate conditions. The cumula-tive economic costs of even temporarydelays in adjusting to climate change mightprove to be large. Congress should considerbreaking the link between farm support andthe production of a single crop. A furtherincrease in flex acreage (an amount of landthat can be shifted to new crops with littlepenalty) or other more substantial revisionsin the commodity support programs thatwould allow greater flexibility in cropchoice (42) could be considered in the 1995reauthorization of the Farm Bill. Thesechanges would increase the ability of farm-ers to adapt to climate change.
Encourage research and development incomputerized farm-management systems.The competitiveness of the farm sector willincreasingly depend on advances that imp-rove the efficiency of U.S. farmers-ratherthan on further increases in intensity of inputuse. Computerized farm-management sys-tems include land-based or remote sensors,robotics and controls, image analysis,geographical information systems, andtelecommunications linkages packaged intodecision-support systems or embodied inintelligent farm equipment. Such systemswill be increasingly important to the farmer’sability to increase yields, control costs, andrespond to environmental concerns. TheU.S. Department of Agriculture’s Agricul-tural Research Service already providesleadership in this area and has proposed an‘‘Integrated Farm Management Systems Re-search’ program that would provide for thedevelopment and broader use of technolo-gies that have the potential to greatly en-hance the efficiency of farming and toincrease the flexibility with which farmerscan respond to climate conditions.Use the 1995 Farm Bill to modify disaster-assistance programs. Since the late 1970s,Congress has been considering how to beststructure the crop-insurance and disaster-payment programs (20, 21). After a flurry ofproposals and studies before the passage ofthe 1990 Farm Bill, the programs were leftessentially unchanged. Major revisions arelikely to be considered in the 1995 Farm Bill.The best option for revising these programsremain unclear. For the purpose of preparingfor climate change, any program thatprovides a greater incentive for farmersor local communities to reduce theirexposure to risk should lessen the poten-tial for large-scale future losses and en-courage adaptation to changing climaterisks. Features of a restructured systemmight include: defining disasters formallv.–––––-—a 7
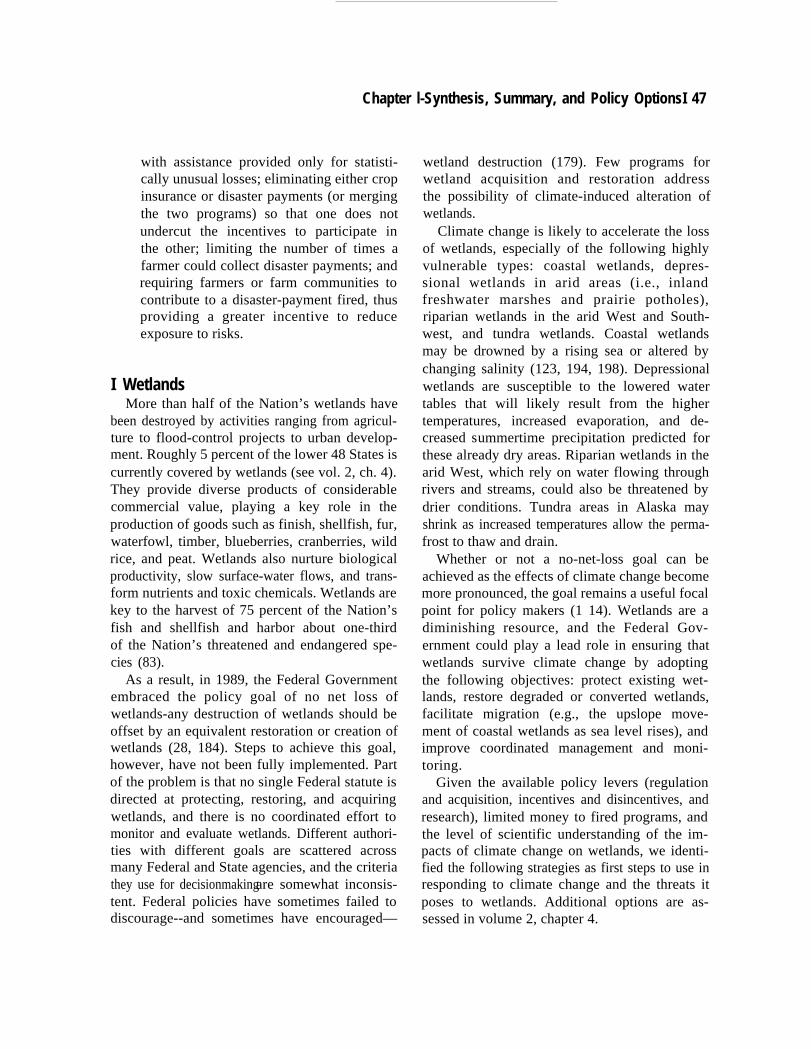
Chapter l-Synthesis, Summary, and Policy OptionsI 47
with assistance provided only for statisti-cally unusual losses; eliminating either cropinsurance or disaster payments (or mergingthe two programs) so that one does notundercut the incentives to participate inthe other; limiting the number of times afarmer could collect disaster payments; andrequiring farmers or farm communities tocontribute to a disaster-payment fired, thusproviding a greater incentive to reduceexposure to risks.
I WetlandsMore than half of the Nation’s wetlands have
been destroyed by activities ranging from agricul-ture to flood-control projects to urban develop-ment. Roughly 5 percent of the lower 48 States iscurrently covered by wetlands (see vol. 2, ch. 4).They provide diverse products of considerablecommercial value, playing a key role in theproduction of goods such as finish, shellfish, fur,waterfowl, timber, blueberries, cranberries, wildrice, and peat. Wetlands also nurture biologicalproductivity, slow surface-water flows, and trans-form nutrients and toxic chemicals. Wetlands arekey to the harvest of 75 percent of the Nation’sfish and shellfish and harbor about one-thirdof the Nation’s threatened and endangered spe-cies (83).
As a result, in 1989, the Federal Governmentembraced the policy goal of no net loss ofwetlands-any destruction of wetlands should beoffset by an equivalent restoration or creation ofwetlands (28, 184). Steps to achieve this goal,however, have not been fully implemented. Partof the problem is that no single Federal statute isdirected at protecting, restoring, and acquiringwetlands, and there is no coordinated effort tomonitor and evaluate wetlands. Different authori-ties with different goals are scattered acrossmany Federal and State agencies, and the criteriathey use for decisionmaking are somewhat inconsis-tent. Federal policies have sometimes failed todiscourage--and sometimes have encouraged—
wetland destruction (179). Few programs forwetland acquisition and restoration addressthe possibility of climate-induced alteration ofwetlands.
Climate change is likely to accelerate the lossof wetlands, especially of the following highlyvulnerable types: coastal wetlands, depres-sional wetlands in arid areas (i.e., inlandfreshwater marshes and prairie potholes),riparian wetlands in the arid West and South-west, and tundra wetlands. Coastal wetlandsmay be drowned by a rising sea or altered bychanging salinity (123, 194, 198). Depressionalwetlands are susceptible to the lowered watertables that will likely result from the highertemperatures, increased evaporation, and de-creased summertime precipitation predicted forthese already dry areas. Riparian wetlands in thearid West, which rely on water flowing throughrivers and streams, could also be threatened bydrier conditions. Tundra areas in Alaska mayshrink as increased temperatures allow the perma-frost to thaw and drain.
Whether or not a no-net-loss goal can beachieved as the effects of climate change becomemore pronounced, the goal remains a useful focalpoint for policy makers (1 14). Wetlands are adiminishing resource, and the Federal Gov-ernment could play a lead role in ensuring thatwetlands survive climate change by adoptingthe following objectives: protect existing wet-lands, restore degraded or converted wetlands,facilitate migration (e.g., the upslope move-ment of coastal wetlands as sea level rises), andimprove coordinated management and moni-toring.
Given the available policy levers (regulationand acquisition, incentives and disincentives, andresearch), limited money to fired programs, andthe level of scientific understanding of the im-pacts of climate change on wetlands, we identi-fied the following strategies as first steps to use inresponding to climate change and the threats itposes to wetlands. Additional options are as-sessed in volume 2, chapter 4.
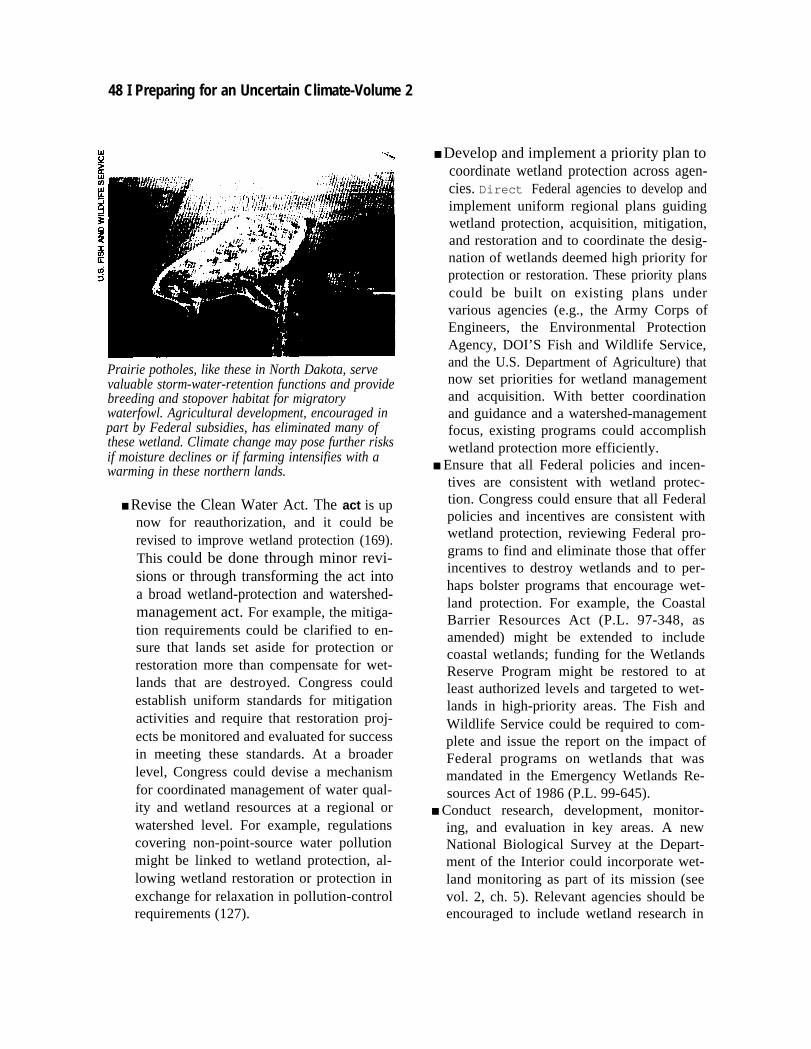
48 I Preparing for an Uncertain Climate-Volume 2
w%4
Prairie potholes, like these in North Dakota, servevaluable storm-water-retention functions and providebreeding and stopover habitat for migratorywaterfowl. Agricultural development, encouraged inpart by Federal subsidies, has eliminated many ofthese wetland. Climate change may pose further risksif moisture declines or if farming intensifies with awarming in these northern lands.
■ Revise the Clean Water Act. The act is upnow for reauthorization, and it could berevised to improve wetland protection (169).This could be done through minor revi-sions or through transforming the act intoa broad wetland-protection and watershed-management act. For example, the mitiga-tion requirements could be clarified to en-sure that lands set aside for protection orrestoration more than compensate for wet-lands that are destroyed. Congress couldestablish uniform standards for mitigationactivities and require that restoration proj-ects be monitored and evaluated for successin meeting these standards. At a broaderlevel, Congress could devise a mechanismfor coordinated management of water qual-ity and wetland resources at a regional orwatershed level. For example, regulationscovering non-point-source water pollutionmight be linked to wetland protection, al-lowing wetland restoration or protection inexchange for relaxation in pollution-controlrequirements (127).
■ Develop and implement a priority plan tocoordinate wetland protection across agen-cies. Direct Federal agencies to develop andimplement uniform regional plans guidingwetland protection, acquisition, mitigation,and restoration and to coordinate the desig-nation of wetlands deemed high priority forprotection or restoration. These priority planscould be built on existing plans undervarious agencies (e.g., the Army Corps ofEngineers, the Environmental ProtectionAgency, DOI’S Fish and Wildlife Service,and the U.S. Department of Agriculture) thatnow set priorities for wetland managementand acquisition. With better coordinationand guidance and a watershed-managementfocus, existing programs could accomplishwetland protection more efficiently.
■ Ensure that all Federal policies and incen-tives are consistent with wetland protec-tion. Congress could ensure that all Federalpolicies and incentives are consistent withwetland protection, reviewing Federal pro-grams to find and eliminate those that offerincentives to destroy wetlands and to per-haps bolster programs that encourage wet-land protection. For example, the CoastalBarrier Resources Act (P.L. 97-348, asamended) might be extended to includecoastal wetlands; funding for the WetlandsReserve Program might be restored to atleast authorized levels and targeted to wet-lands in high-priority areas. The Fish andWildlife Service could be required to com-plete and issue the report on the impact ofFederal programs on wetlands that wasmandated in the Emergency Wetlands Re-sources Act of 1986 (P.L. 99-645).
■ Conduct research, development, monitor-ing, and evaluation in key areas. A newNational Biological Survey at the Depart-ment of the Interior could incorporate wet-land monitoring as part of its mission (seevol. 2, ch. 5). Relevant agencies should beencouraged to include wetland research in
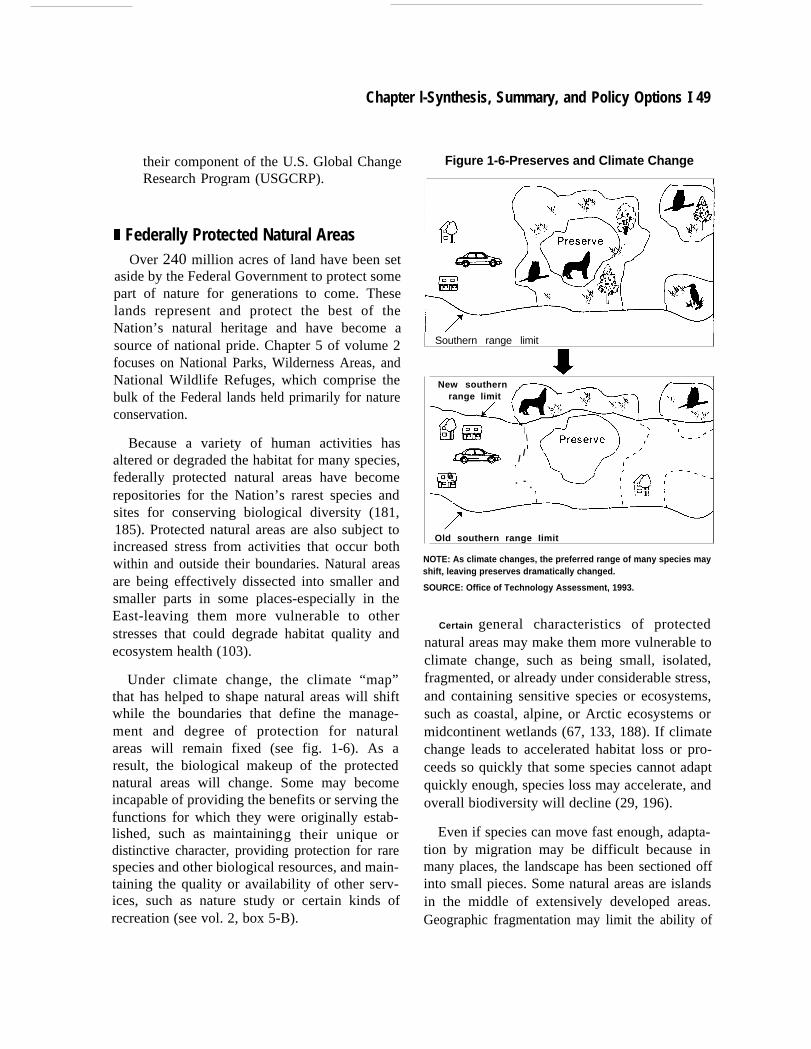
Chapter l-Synthesis, Summary, and Policy Options I 49
their component of the U.S. Global ChangeResearch Program (USGCRP).
I Federally Protected Natural AreasOver 240 million acres of land have been set
aside by the Federal Government to protect somepart of nature for generations to come. Theselands represent and protect the best of theNation’s natural heritage and have become asource of national pride. Chapter 5 of volume 2focuses on National Parks, Wilderness Areas, andNational Wildlife Refuges, which comprise thebulk of the Federal lands held primarily for natureconservation.
Because a variety of human activities hasaltered or degraded the habitat for many species,federally protected natural areas have becomerepositories for the Nation’s rarest species andsites for conserving biological diversity (181,185). Protected natural areas are also subject toincreased stress from activities that occur bothwithin and outside their boundaries. Natural areasare being effectively dissected into smaller andsmaller parts in some places-especially in theEast-leaving them more vulnerable to otherstresses that could degrade habitat quality andecosystem health (103).
Under climate change, the climate “map”that has helped to shape natural areas will shiftwhile the boundaries that define the manage-ment and degree of protection for naturalareas will remain fixed (see fig. 1-6). As aresult, the biological makeup of the protectednatural areas will change. Some may becomeincapable of providing the benefits or serving thefunctions for which they were originally estab-lished, such as maintainingg their unique ordistinctive character, providing protection for rarespecies and other biological resources, and main-taining the quality or availability of other serv-ices, such as nature study or certain kinds ofrecreation (see vol. 2, box 5-B).
Figure 1-6-Preserves and Climate Change
Southern range limit
?New southern
range limit
Q@\
❑ \
&
I/
/1
a❑ 0 . - .
t
Old southern range Iimit
NOTE: As climate changes, the preferred range of many species mayshift, leaving preserves dramatically changed.
SOURCE: Office of Technology Assessment, 1993.
Certain general characteristics of protectednatural areas may make them more vulnerable toclimate change, such as being small, isolated,fragmented, or already under considerable stress,and containing sensitive species or ecosystems,such as coastal, alpine, or Arctic ecosystems ormidcontinent wetlands (67, 133, 188). If climatechange leads to accelerated habitat loss or pro-ceeds so quickly that some species cannot adaptquickly enough, species loss may accelerate, andoverall biodiversity will decline (29, 196).
Even if species can move fast enough, adapta-tion by migration may be difficult because inmany places, the landscape has been sectioned offinto small pieces. Some natural areas are islandsin the middle of extensively developed areas.Geographic fragmentation may limit the ability of
50 Preparing for an Uncertain Climate-Volume 2
Box l-G-Climate Change in Alaska: A Special Case
Nowhere in the United States does there remain such a vast expanse of land so undisturbed by human activityas in Alaska. Because of its distinctive character, pristine conditions, and abundant natural resources, Alaska hasbecome a national treasure. Nearly 66 percent of Alaska’s land base is protected in wilderness areas, NationalWildlife Refuges, National Forests, or public lands administered by the Bureau of Land Management (BLM). Alaskacontains some 170 million acres (69 million hectares)1 of wetlands (over 60 percent of the Nation’s total) and 330million acres of boreal forest. Alaskan plants and animals withstand some of the harshest environmental conditionsin the world and many are unique to polar climates. Although human activities are to some extent adverselyaffecting this remote environment, it remains the most wild place in the United States and is rightly referred teasour “last frontier.”
The unique characteristics of Alaska-the natural resources, the wildlife, and the pristine, harshenvironment-affect nearly every aspect of life, including the culture and industry of those who Iive here. Forexample, traditions of the indigenous communities are deeply rooted In the distinctive wildlife and vegetation ofAlaska. Many indigenous communities, such as the Inupiat Eskimos of Alaska’s North Slope, still rely on wildlifeand natural vegetation for subsistence. The bowhead whale is central to their culture. The whales are a major foodsource and the hunts are a community tradition. Caribou and fish are other staples for Inupiats. AthapaskanIndians, who reside mostly in the boreal forest of interior Alaska, rely heavily on the plant Iife there for food, housingmaterials, and heating fuels (120). Fish such as salmon and whitefish are primary elements of Athapaskansubsistence, and caribou and moose are important sources of food and clothing (120).
Alaska’s economy is also deeply rooted in its abundant natural resources, with oil and gas, fishing, andtourism providing the base for the economy. Nearly 85 percent of the State’s revenue comes from oil and gasexploration or development. Two of the largest oil fields in North America (Prudhoe Bay and Kuparuk fields) arelocated near Alaska’s North Slope and provide the economic base for much of that region. Alaskan waters arealso sites of sores of the world’s most productive fisheries. The Bering Sea has the biggest fishery in the UntiedStates; it is among the biggest in the world. In 1990, Alaska’s fish harvest(mostly salmon, king crab, halibut, shrimp,and scallops) surpassed any other State’s, with more than 5.4 billion pounds (2.4 billion kilograms)2 of seafoodharvested-half of all seafood harvested in the Nation. The seafood industry is also Alaska’s largest private-sectoremployer, employing 23 percent of the State’s work force. In addition, Alaska’s vast expanse of rugged land andabundant wildlife have made tourism a growing and important industry there. Visitors to Alaska spent almost$1 billion in 1989, the third largest source of income in the State. With 13,500 workers in tourist-related industries,tourism is second only to fisheries as a source of employment
Because climate changes resulting from rising atmospheric carbon dioxide (C02) are expected to beespecially pronounced in Alaska and other high-latitude regions, Alaska may provide an "early warning” of initialclimate effects. In very general terms, Alaska can expect to see increased average temperatures, increasedprecipitation, and melting of sea ice. The rate and ultimate severity of the climate changes is at present unknown(67). In addition, Iittle is known about the sensitivities of wiidlife, vegetation, ecosystems, indigenous cultures,orthe economy to any potential climate changes.
Warmer temperatures in polar regions are expected to lead to some melting of sea ice. A recent study ofclimate change effects on the Canadian Beaufort Sea determined that, based on a doubling of atmospheric CO2,the open-water season could increase from an average of 2 months to 5 months, the extent of open water couldincrease from about 100 miles (160 kilometers)4 to 300-500 miles, and maximum ice thickness could decrease
1 TO convert acres to hectares, multiply by 0.405.2 TO convert pounds to kilograms, multiply by 0.454.3 P. Carison, Alaska Division of Tourism, personal communication, September 1993.
4 To convert miles to kilometers, multiply by 1.609.

Chapter 1--Synthesis, Summary, and Policy Options 51
by 50-75 percent (102). Shoreline erosion could increase significantly with a longer open-water season. Overallbiological productivity is also expected to increase in parts of the Bering Sea with an increase in temperature andchange in ice cover. Because of the drying effects of warmer temperatures, there could be an increase in thefrequency and extent of fires. Over the past three decades, fires in Alaska have increased due to warmer and drierconditions. More fires under climate change could expand the extent of early successional vegetation favored bymoose, beavers, Arctic hares, sharptailed grouse, and other wildlife species. However, fire may adversely affectthe lichen supply in spruce forests-an important food for caribou in winter.
The most profound consequence of warming in Alaska and other polar regions maybe the exacerbation ofglobal climate change through the release of carbon from the permafrost of the AIaskan tundra and boreal forests.Worldwide, tundra and boreal forests contain nearly a third of the world’s soil carbon. Thawing of the permafrostand the resulting decomposition of organic material, could release huge quantities of methane (CH4) and CO2 intothe atmosphere and contribute to accelerated warming (67).5 Climate warming may also be exacerbated bymelting of the vast expanse of ice and snow that now reflects away considerable incoming heat Little can be doneto stem the thaw and resulting secondary climate impacts, except to slow warming by reducing human-madegreenhouse gas emissions.
Potential Losers
Indigenous cultures-Alaska’s indigenous, subsistence communities could be at risk under climate change.Thawing of the permafrost is likely to affect supported structures such as pipelines and bridges, and roads maybe threatened if thawing weakens the soil. Many indigenous peoples use the permafrost for food-storage cellars,so warming may threaten their ability to preserve food during summer months. Hunting the bowhead whale, anancient and sacred tradition for many indigenous communities on the North Slope, is linked to the extent of seaice. Melting of the sea ice will likely change the whale’s migration and affect access to the whales by indigenoushunters.
Plants and animals--Nearly half of the world’s peatlands (tundra) are in North America, with nearly a thirdof these in Alaska. Even a 2oF (1 oC) warming could lead to forests replacing alpine tundra on many mountainsand islands (122). Some tundra species unable to adapt to climate change might decline. Caribou populationsdepend on lichens for food. The distribution of lichens is sensitive to the amount and extent of snow cover, whichwill change under a warming climate. Furthermore, because caribou calving is linked to vegetation produced duringearly snow melt, changes in the timing of the melt could disrupt calving.
Some 25 species of marine mammals regularly use Alaskan waters. The marine mammals most likely to beadversely affected by climate change are pinnipeds (seals and walruses) that winter primarily in the Bering Sea,have regular contact with ice, and are closely associated with the continental shelf or shelf edge. These includespotted and ribbon seals, which may suffer from increased competition with other species and reduced habitat,and Pacific walruses and bearded seals, which are ice-associated bottom feeders and are therefore tied to theseasonally ice-covered continental shelves. Both the beluga and bowhead whales are associated with sea ice,but they may not be significantly affected by melting because they do not depend on ice cover to protect andnurture their newborn.
Perhaps the biggest unknown impact of climate change is how it will affect fish populations and the fishingindustry. Variations in stock size and species abundance appear to be correlated with periodic variability of oceantemperature, but are not completely understood. For example, huge fluctuations in groundfish stocks occur now. 6
Many scientists believe that overfishing will remain the primary concern for Alaskan fisheries (122). However,
5 Recent measurements indicate that the tundra of the North Slope of Alaska has in fact changed from a‘(sink” to a “source” of C02 with the warming trend seen In Alaska over the past few decades (125).
6 V. Alexander, Dean, School of Fisheries and Ocean Science, University of Alaska at Fairbanks, personalcommunication, May 27, 1993.
(Continued on next page)

52 Preparing for an Uncertain Climate--Volume 2
Box 1-G--Climate Change in Alaska: A Special Case--(Continued)
considering the importance of fishing to the Alaskan economy, the potential for loss under climate change isSignificant
Potential Winners
Oil and gas industry-Reduction of the sea ice could allow the use of less expensive offshore structuresand would reduce the costs of marine transportation. Some speculate that the opening up of the NorthwestPassage would offer a shortcut for shipping from Europe to the Pacific Rim but Alaskan ports probably would notparticipate significantly in this traffic.
Plants and animals--In general, plant life is likely to benefit from an increase in temperature, though thecomposition of forests and other vegetated areas will likely change. Some boreal forest species, such as whitespruce and birch, are likely to expand northward. Others, such as red and yellow cedar, may be less able to migratebecause of the rugged terrain, low genetic variability, and slow dispersing ability. Some migration is alreadyhappening-white spruce ranges have been expanding over the past 40 years. Expansion of white spruce intoboreal forests may eventually be important for timber harvests.
Most wildlife species, including polar bears, moose,musk-oxen, mountain sheep, most marine mammals, andmany birds (e.g., grouse, raptors, owls, and migratory birds), will likely benefit from increased temperatures andincreased productivity in vegetation. These benefits might be stemmed by losses of tundra wetlands, increasesin disease spread, or changes in species assemblages that would result in changed predation patterns. Most birdswill likely benefit from having more forage, more insects, and a longer season during which to rear their young.Omnivores such as bears should respond favorable to a changing climate because of the longer availability ofgreen vegetation in the spring. Other forbearers and carnivores should increase in response to larger preypopulations unless they are controlled by hunting, trapping, or other human activities.
Tourism--Higher temperatures are likely to benefit the tourism industry, although vigorous advertising bythe State has almost certainly had more impact on the industry in recent years than has its climate. increasedwildlife populations will probably attract more hunters, hikers, and campers. However, increased tourism could alsomean more impacts on the environment that is so important to indigenous, subsistence communities.
species to find new habitat-they may have no factors that make natural areas valuable: charac-place to go (34).
Natural areas in the West are currently muchlarger and much less fragmented than they are inthe East. However, the institutions that managethese lands are designed to manage only their ownparcels-in isolation-and are not encouraged toconsider the often more extensive natural ecologi-cal system. This compartmental approach tomanagement, or institutional fragmentation, mayprevent effective solutions to problems that tran-scend individual management parcels, such asthose posed by climate change (64, 92).
The main challenge for policy is to maintainthe high value of the system of natural areas whilerealizing that climate change may affect the very
ter, species protection, and environmental serv-ices. The ideal response to this challenge might besome combination of three general managementapproaches: 1) maintain species where they aretoday, 2) help species migrate through moreintensive management, and 3) acquire lands thatwill be valuable under a changed climate. How-ever, the lack of adequate knowledge and infor-mation precludes the full implementation ofeither approach now.
It is difficult to predict how climate change willaffect natural areas and how they will respond.his lack of knowledge limits the ability to helpnatural areas adapt. We do not know whichspecies are most sensitive to climate change,
Chapter l-Synthesis, Summary, and Policy Options I 53
which could be saved, or how to recreate habitatsor entire ecosystems elsewhere. The limitedsuccess with restoring populations of endangeredspecies illustrates how little is known aboutrestoring species and their natural habitat. Inaddition, we do not know what lands will be mostvaluable as preserves under climate change. Wedo not even know all of the species and kinds ofecosystems currently under formal protection inpreserves today.
The most useful approaches that the FederalGovernment could take to facilitate adapta-tions to climate change in natural areas fallinto two categories: information gathering(including research, inventory, and monitor-ing options) (115, 171), and managing naturalareas now to minimize the impediments toadaptation and to increase their resiliency. Thesecond category includes taking direct Federalaction to influence the management of naturalareas, establishing incentives to private landown-ers to encourage conservation under uncertainty,and promoting larger-scale management throughmore partnerships among agencies, communities,and governments. A variety of options thataddress these needs are assessed in volume 2,chapter 5.
Because money to implement every policyoption and the scientific understanding of howclimate change will affect natural areas arelimited, we have identified some strategies thatrepresent inexpensive or useful frost steps forfacilitating adaptation to climate change in natu-ral areas. These options meet at least one ofseveral criteria: they will take a long time tocomplete; they address “front-line,” or urgent,issues that need attention before informed policydecisions can be made; they can be approachedthrough mechanisms that are already in place orthrough efforts already under way; and/or theyhave benefits in addition to those that helpprepare for climate change. In some cases, anear-term legislative action will provide a targetof opportunity to pursue these options.
■ Use the National Biological Survey (NBS)to assess ecological inventory and moni-toring needs. Future strategies to protectnatural areas and their resources will requirea national picture of current biological re-sources and the extent of the protectionof--or the threat to-these resources. Anational inventory and monitoring programwould be particularly beneficial in support-ing efforts to protect endangered species andbiodiversity. DOI’s proposed new NationalBiological Survey presents an opportunity toimplement some of these activities (131,132, 188). Congress could ask NBS toinitiate a nationwide inventory and monitor-ing program, synthesize ecological and bio-logical information for managers and plan-ners, establish a mechanism for facilitatingregional-level research and management,and develop a priority plan for expandingprotection of natural areas.
■ Support basic research on key gaps in ourunderstanding of ecosystems. This re-search would include work on species sensi-tivity to climate change, restoration andtranslocation ecology, the design and effec-tiveness of migratory corridors or protectivebuffer zones, the development of ecologicalmodels, and the effect of elevated CO2
concentrations on plants and animals. Basicresearch in these areas is needed now todetermine how species might respond toclimate change and how best to provide fortheir protection in the future.
■ Conduct a review of ecological researchwithin USGCRP and across Federal agen-cies. Such a review would evaluate howmuch ecosystem research relevant to cli-mate change and other long-term ecologicalproblems (e.g., loss of biodiversity) is beingdone, and would identify important gaps. Areview of all research on ‘natural resources’has not yet been conducted across theFederal agencies. Existing analyses suggestthat a great deal of money is spent on
54 I Preparing for an Uncertain Climate--Volume 2
research relevant to the environment, buthow much is useful to understanding long-term ecological problems is not known.Further, there is currently no mechanism forconsolidating results from disparate researchefforts into ‘‘general patterns and principlesthat advance the science and are useful forenvironmental decisionmaking. Withoutsuch synthesis studies, it will be impossiblefor ecology to become the predictive sciencerequired by current and future environ-mental problems’ (97). An effort to charac-terize and synthesize ongoing research couldhelp bridge the gap between basic researchand natural resource planning. Such a re-view could be conducted by the Office ofScience and Technology Policy, the Na-tional Academy of Sciences, or an independ-ent commission.
■ Provide funding for the Fish and WildlifeConservation Act of 1980 (P.L. 96-366).This law establishes a Federal cost-shareprogram for “nongame” species conserva-tion. It has already been enacted, but hasnever been funded. Many States have pre-pared initial plans that could qualify forFederal matching funds, making it a targetof opportunity to promote natural areaconservation at the State level. With someamendments to promote multispecies, or‘‘ecosystem, protection at the State leveland adequate funding, the Fish and WildlifeConservation Act could be used to encour-age natural area protection and conservationon State and private lands.
H Use acquisition strategies to enhance pro-tection. Federal land-management agenciesshould be directed to consider whether allfuture land acquisitions and exchanges:1) augment underrepresented ecosystems inthe Federal natural area holdings, 2) bufferor connect other preserved land parcels, and3) provide habitat or services likely to persistover the long term despite anticipated stresses.Setting aside a given amount of land within
the modem fragmented landscape does notalone ensure that the ecological features forwhich it is valued will be preserved. To bestconserve species, natural areas should in-clude an array of ecosystems and transitionzones between them to allow for the manycomplex interactions that rely on linksbetween different parts of the landscape. Byasking agencies to incorporate such con-cerns into future acquisitions, Congress couldminimize future geographic fragmentationand use limited monies to maximize therange of protected ecosystems.
1 ForestsForests cover roughly one-third of the U.S.
land area, shaping much of the natural environ-ment and providing the basis for a substantialforest-products industry. These forests are enor-mously variable, ranging from the sparse scrub ofthe arid interior West to the lush forests of thecoastal Pacific Northwest and the South. TheNation’s forests provide essential fish and wild-life habitat, livestock forage, watershed protec-tion, attractive vistas, and an array of recreationalopportunities. Timber is one of the Nation’s mostimportant agricultural crops.
Climate change may pose a significantthreat to forests, particularly forests that arenot actively managed for timber production.Within a century, climate change might shift theideal range for some North American forestspecies more than 300 miles to the north (see fig.1-7). Such a shift would almost certainly exceedthe ability of natural forests to migrate (35, 36,146). Forests stranded outside their ideal climaticrange could suffer from declining growth andincreased mortality from climate-related stressessuch as insects, disease, and fires (2, 58, 100,157). Some forests may collapse, and species andunique populations may be lost from isolatedranges if climate change is too rapid.
The most vulnerable forest resources are thosein regions subject to increased moisture stress, as
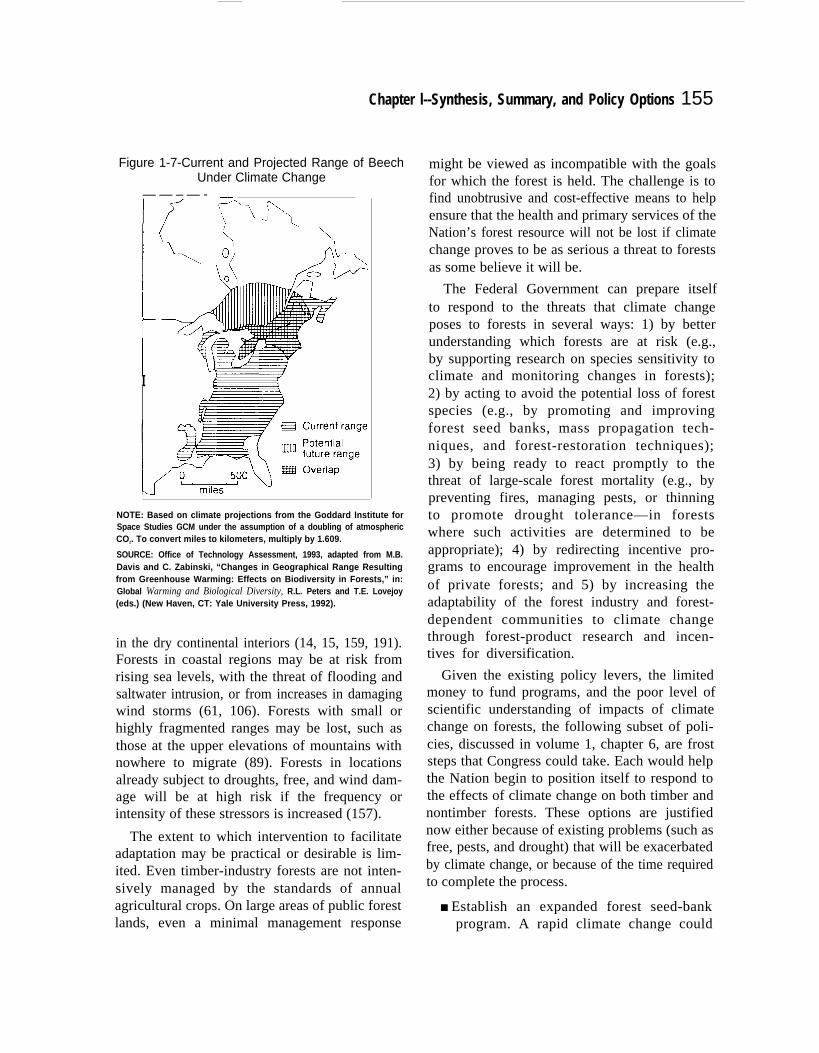
Chapter l--Synthesis, Summary, and Policy Options 155
Figure 1-7-Current and Projected Range of BeechUnder Climate Change
— — – — - ———
I [ f’
~+Nl “0”’””’NOTE: Based on climate projections from the Goddard Institute forSpace Studies GCM under the assumption of a doubling of atmosphericCO2. To convert miles to kilometers, multiply by 1.609.
SOURCE: Office of Technology Assessment, 1993, adapted from M.B.Davis and C. Zabinski, “Changes in Geographical Range Resultingfrom Greenhouse Warming: Effects on Biodiversity in Forests,” in:Global Warming and Biological Diversity, R.L. Peters and T.E. Lovejoy(eds.) (New Haven, CT: Yale University Press, 1992).
in the dry continental interiors (14, 15, 159, 191).Forests in coastal regions may be at risk fromrising sea levels, with the threat of flooding andsaltwater intrusion, or from increases in damagingwind storms (61, 106). Forests with small orhighly fragmented ranges may be lost, such asthose at the upper elevations of mountains withnowhere to migrate (89). Forests in locationsalready subject to droughts, free, and wind dam-age will be at high risk if the frequency orintensity of these stressors is increased (157).
The extent to which intervention to facilitateadaptation may be practical or desirable is lim-ited. Even timber-industry forests are not inten-sively managed by the standards of annualagricultural crops. On large areas of public forestlands, even a minimal management response
might be viewed as incompatible with the goalsfor which the forest is held. The challenge is tofind unobtrusive and cost-effective means to helpensure that the health and primary services of theNation’s forest resource will not be lost if climatechange proves to be as serious a threat to forestsas some believe it will be.
The Federal Government can prepare itselfto respond to the threats that climate changeposes to forests in several ways: 1) by betterunderstanding which forests are at risk (e.g.,by supporting research on species sensitivity toclimate and monitoring changes in forests);2) by acting to avoid the potential loss of forestspecies (e.g., by promoting and improvingforest seed banks, mass propagation tech-niques, and forest-restoration techniques);3) by being ready to react promptly to thethreat of large-scale forest mortality (e.g., bypreventing fires, managing pests, or thinningto promote drought tolerance—in forestswhere such activities are determined to beappropriate); 4) by redirecting incentive pro-grams to encourage improvement in the healthof private forests; and 5) by increasing theadaptability of the forest industry and forest-dependent communities to climate changethrough forest-product research and incen-tives for diversification.
Given the existing policy levers, the limitedmoney to fund programs, and the poor level ofscientific understanding of impacts of climatechange on forests, the following subset of poli-cies, discussed in volume 1, chapter 6, are froststeps that Congress could take. Each would helpthe Nation begin to position itself to respond tothe effects of climate change on both timber andnontimber forests. These options are justifiednow either because of existing problems (such asfree, pests, and drought) that will be exacerbatedby climate change, or because of the time requiredto complete the process.
■ Establish an expanded forest seed-bankprogram. A rapid climate change could
56 I Preparing for an Uncertain Climate--Volume 2
threaten the genetic diversity of U.S. forests.A national effort in the conservation offorest seeds would provide an opportunity torespond to the potential for loss of geneticdiversity in the forest resource under climatechange. An appropriate goal for such aprogram would be to maintain sufficientseed variety, or other genetic material, sothat much of the original diversity of theNation’s forests could eventually be restored(86, 87). (Current forest seed-collectionactivities are uncoordinated and focused ononly a small number of species (113).) Toaccomplish this goal, Congress could au-thorize and fired a National Forest GeneticResources Program within the Forest Serv-ice, providing funds for the construction andoperation of seed-storage facilities, for theestablishment of associated plantations to beused for continuing, seed production, and fora forest genetics research program thatwould address climate tolerance of trees andmeans for large-scale propagation. Such aprogram could be partially supportedthrough fees for private access to the seedcollection.
■ Develop strategic plans for responding tomajor forest declines. Increased risk offries and insect damage may result under awarmer climate. The relative value of pre-vention activities to reduce risk is likely tobe increased. The need for aggressive inter-vention to protect forest resources may alsobe increased. Because of the need for promptaction and because of the contentiousnessthat often accompanies forest management,policy rules for pest-control activities andsilvicultural management to reduce foresthealth risks are best established before theyare needed. Congress could enact a forest-health bill that would establish criteria thatwould allow prompt action to protect againstthreats of catastrophic mortality or restoreforests after large-scale mortality and de-cline. Such a bill might allow for the
declaration of temporary forest-health emer-gencies, under which accelerated actions toprotect or restore forest health would beauthorized-as long as these actions wereconsistent with established standards forprotection of all forest values. A policy-review group made up of academics, repre-sentatives of interest groups, and Federalforestry personnel could develop criteria forundertaking actions to stem forest decline.
■ Prepare for a forest-management responseto climate change. A changing climate mayeventually require innovations in forest-management and planting practices. Experi-mental efforts will be important in establish-ing a scientific basis for any necessarychanges to future management practices thatmight later be applied to public multiple-useforests. Congress could support a program ofresearch on the Forest Service’s Experimen-tal Forests, or other research facilities, toaddress adaptation to climate change. TheExperimental Forests are already designat-ed as outdoor laboratories for evaluatingforestry practices. The research could bedirected toward finding practical andenvironmentally appropriate techniques formanaging the public forests that will helpbuffer them or help them adapt to a chang-ing climate.
■ Improve incentives for private manage-ment of forest lands. The Federal Gover-nment controls only about one-quarter of theNation’s forestland. In the East especially,where Federal holdings are limited, efforts tosupport the protection of private forestlandmay take on increased importance. TheFederal Government may use incentives,disincentives, and cooperative approaches topromote the health and productivity of thisforestland. Existing subsidy programs underthe Cooperative Forestry Assistance Act of1978 (P.L. 95-313), as amended by the 1990Farm Bill, provide cost-sharing assistance toowners of small, private forests. Traditional
Chapter l-Synthesis, Summary, and Policy Options I 57
forest-support programs (e.g., the For-estry Incentives Program) target funds onthe basis of potential gains in timbersupply. These programs could be modi-fied so that funds could be targeted toareas at high risk of insect and firedamage and to ecologically valuable fores-tland, which would encourage activitiesthat maintain the health of the privateforestland and discourage the furtherfragmentation of forestland. Expandingthe role of the Forest Stewardship and ForestLegacy Programs might help to accomplishthese goals. The funding priorities of theForest Stewardship Program could be clari-fied, thus ensuring that most funds aretargeted to the areas identified above.
CHAPTER 1 REFERENCES
1.
2,
3.
4.
5.
6.
7.
8.
9.
Adarns, R. M., et al., “Global Climate Change and USAgriculture,” Nature, vol. 345, 1990, pp. 219-24.Anderson, R.L., “Effects of Global Climate Change on TreeSurvival and Forest Pests in the Sou@” paper presented at theSociety of American Foresters Convention in WashingtorL DC,July 30, 1990.Armentano, T. V., R.A, Park and L.C. Cloonan, “Impacts onCoastal Wetlands Throughout the United States,” in: Green-house Effect, Sea Level Rise, and Coastal Wetlands, EPA23005-86-013, J, Titus (cd.) (WashingtorL DC: U.S. Environ-mental Protection Agency, Oftlce of Policy, Planning andEva.huNiou Jtdy 1988).Assel, R.A., ‘‘Implications of COZ Global Warming on GreatLakes Ice Cover,” Climatic Change, vol. 18, 1991, pp. 377-95,Ausube~ J.H., “A Second Imok at the Impacts of ClimateChange,” American Scientist, vol. 79, 1991, pp. 210-21.Bazz.az, F. A., and E.D. Fajer, “Plant Life in a CO#ichWorld,” Scientific American, vol. 266, No. 1, January 1992, pp.68-74.Beaq M.J., “Federal Laws and Politics Pertaining to theMaintenance of Biological Diversity on Federal and PrivateLands, ” contractor report prepared for the Oft3ce of lkdmologyAssessment’s report Technologies to Maintain BiologicalDiversity, Oct. 1, 1985.BeaQ MJ., “Waterfowl and Climate Change: A Glimpse intothe Twenty-First Century,” On”on Nature Quarterly, spring1989, pp. 22-27.Beaq M. J., “Non-Indigenous Species in the United States: TheRole of the United States Department of the Interior inNon-Indigenous Species Issues, ” contractor paper prepared forthe OffIce of lkchnology Assessment, November 1991.
10,
11,
12.
13.
14.
15.
16.17.
18.
19.
20.
21.
22.
23.
24.
25.
26.
Beatley, T., ‘Hurricane Hugo and Shoreline Retreat: Evaluatingthe EffeetivcsEss of the south Carolina Beachfront Managernent AcL’ final report to the National Science FoundationSeptember 1992.Beatley, T., “Risk Allocation Policy in the Coastal Zone: TheCurrent Framework and Future Directions, ” contractor paperprepared for the Office of Tkdmology Assessmen~ February1993.Bernabo, C.J., Science and Policy Associates, Inc., testimony athearings before the House Committee on Science, Space, and‘lkchnOlogy, May 19, 1993.Biasing, TJ., and A. Solomoq Response of the North AmericanCorn Belt to Climatic Warming, Publication 2134, Environ-mental Sciences Division (Oak Ridge, TN: Oak Ridge NationalLaboratory, 1982).BotlcirL DB,, R.A. Nisbes and T.E. Reynales, “Effects ofClimate Change on Forests of the Great Lake States,” im ThePotential Effects of Global Climate Change on the Uru”tedStates, AppendixD: Forests, J.B. Smith and D.A. Tirpak (eds.)(WashingtO% DC: U.S. Environmental Protection Agency,Office of Policy, Planning and EvaluatiorL 1989).Bowes, M.D., and R.A. Sedjo, “Impacts and Responses toClimate Change in Forests of the MINK Regioq” CZimaticChange, vol. 24, June 1993, pp. 63-82.Bricksoq B., “The River, ” Western Water, July/August 1990.Browq G.E., Jr., Chairmq Committee on Science, Space, andlkchnology, U.S. House of Representatives, “Report of thel%sk Force on the Health of Research, “Chamnan’s Repofi ”Serial L, Committee I%.@ 1992.California Department of Water Resources, California Water:boking to the Future, Bulletin 160-87, November 1987.Carnegie Commission on Science, ‘lkehnology and Govern-ment, Environmental Research and Development: Strengthen-ing the Fe&ral Infrastructure (W%sh.kgtonj DC: CarnegieCommis sion on Science, lkchnology and Govunmen4 Decemb-er 1992).Chite, R,M., Library of Congress, Congressional ResearchService, “Federal Crop Insurance: Current Issues and Optionsfor Reforrq” 92-318 ENRj March 1992,Chite, R. M., Library of Congress, Congressional ResearchService, “Agricultural Disaster ASSiStiUIW, ” ~91099, July1992.Cline, W.R., The Economics of Glo&al Warming (WaahingtoqDC: Institute for International Economics, 1992).Cline, W.R., “The Impact of Global Warming on the UnitedStates: A Survey of Recent Literature,” contractor paperprepared for the Oft3ce of lkchnology lkwessmem~ March 1993.Committee on Earth and Environmental Sciences (CEES),Mitigation and Adaptation Research Strategies Working Group,Directoq of Federal Research Activities Related to Mitigationof or Adaptation to GlobaI Change (Washington, DC: CEES,1992).Committee on Earth and Environmental Sciences (CEES), OurChanging Planet: The FY 1993 U.S. Global Change ResearchProgram (Wasl@to~ DC: CEES, 1992).Committee on Earth and Environmental Sciences (CEES), OurChanging Planet: The FY 1994 U.S. Global Change ResearchProgram (WAingtoq DC: CEES, 1993),
58 I Preparing for an Uncertain Ciimate--Volume 2
27.
28,
29.
30.
31.
32.
33.
34.
35.
36.
37.
38.
39.
40.
41.
42.
43.
Committee on Science, Engineering, and Public Policy, Panelon Policy Implications of Greenhouse Warming, NationalAcademy of Sciences, National Academy of J@@cdng, andInst i tute of Medicine, Policy Implications of GreenhouseWarnu”ng: h4itigation,Adaptation, a n d t h e S c i e n c e B a s e (Wash-
- DC: National Academy Resa, 1992).Conservat ion FoundatiorL Protecting America’s Wetlands: AnAm”on Agenda, the fti report of the National Wetlands PolicyForum (Washington DC: Conserv ation Foundation 1988).
-* c~.s “Smaitivities of Western U.S. Ecosystems toClimate change” contmctor report prepared for the Office of‘Ikchnology Assessment August 1992.Council for Agricultural Science and lkchnology, PreparingUS. Agricuhurefor Global Climate Change, ‘l&k Force ReportNo. 119 (Ames, IOWW CourCiI for Agricultural Science and‘lMlrlology, 1992).Crumpacker, D., ‘‘Status and Trends of Natural Ecosystems inthe U.S.,” contractor report prepared for the ~lce of ‘I&imol-ogy Assessment’s report Technologies to Mcu”ntain BiologicalDiversity, Septernlxr 1985.D@ T . E . , Wetlan& Losses i n t h e U n i t e d S t a t e s , 1 7 8 0 s t o1980s, report to Congress (Washington DC: U.S. Departmentof the Interior, Fish and Wildlife Service, 1990).Dal& T.E., and C.E. Johnao& Status and Trends of Wetlands int h e Conternu’nous Um”ted S t a t e s , M i d - 1 9 7 0 ’ s to M i d - 1 9 8 0 ’ s(WaahingtorL DC: U.S. Department of Interior, U.S. Fish andWildlife Service, 1991).Davis, G.D., “Natural Diversity for the Future Generations: TheRole of Wilderness,” in: Proceedt”ngs of the Natural Diversityi n F o r e s t E c o s y s t e m s W o r k s h o p , J.L. Cooley and J.H. Cooley(eds.) (Athens, GA: University of Georgi& 1984).Davis, M.B., “Lags in Vegetation Response to GreenhouseWarming,” Climatic Change, vol. 15, 1989, pp. 75-82.Davis M.B., and C. Zabinski, “Cbanges in Geographical Rangefrom Greenhouse Warming: Effects on Biodiversity in For-ests, “ in: Global Warming artd Biological Diversity, R. Petersand T. Lovejoy (eds.) (New Havem CT: Yale University Press,1992).de Gel@ J. , E v e r g l a d e s : The Story Behind the Scene~ (LasVegas, NV: KC Publications, Inc., 1978),Dowlatabad4 H., and M.G. Morgan, “Integrated Assessment ofClimate Change,” Science, vol. 259, Mar. 26, 1993, pp. 1813,1932.Drake, B. G., “Effect of Elevated COZ on Chesapeake BayW e t l a n d s , ” Responses of Vegetat ion to Carbon Diom”de, vol.51, April-November 1990.DuncQ NLR., “U.S. @’iC’UltUl’C: Hard Realities and NewO p p o r t u n i t i e s , ” Econon”c Review: Federal Reserve Bank ofKansas City, February 1989, pp. 3-20.
~~-, W.E., “AdaPt@ United StateS &@xl~ t.climate Changq” contractor report prepared for the Office ofTkclmology Asseasmen4 January 1993.EIL C.W., Library of Congress, Congressional Research Serv-ice, “Normal Crop Acreage,’ 89-467 ~ August 1989.Emanuel, K.A., ‘‘The Dependence of Hurricane Intensity onClimate,” Nature, vol. 326, 1987, pp. 483-85.
44.
45.
46.
47.
48.
49.
50.
51.
52.
53.
54.
55.
56.
57.
58.
59.
Environmmtal and Energy Study Institu@ 1993 Briejhg Booko n E n v i r o n m e n t a l a n d E n e r g y L e g i s l a t i o n (lVas@toq DC:EQvironmcmtal a n d E n e r g y s t u d y Institutq 1 9 9 3 ) .Federal EmergesIcyWna&ment Agelxy, “Projected Impact ofRelative Sea Ixwel Rise on the National Flood InmramcProgranq” October 1991.Frederick K., ‘Wvenfiew,” k Scarce W a t e r andhwitutionalChange, K. Frederick (ed.)(W@ingtoQ DC: Resources forthe FMurG 1986)._ D., “Innovative Approaches to Water RamurceManagement,” contractor report prepared for the Of3ce of‘IIXlmology Assessment, September 1992.G i a n t . q H.M. (cd.), S o c i e t a l R e s p o n s e s t o R e g i o n a l ClimeC h a n g e : F o r e c a s t i n g b y A n a l o g y ( B o u l d e r , C O : WestviewPreas, 1988),GleicL P., “Vulnerability of Water Systems,” im ClimateC h a n g e andU.S. Water Resources (NewY~ NY: J o h n W~& sons, 1990).Godddk, D., D. Brewer, and T Beat@, catastrophicC o a s t a l S t o r m s : HasardMitigah”on a n d D e v e l o p m e n t M a n a g e -ment (DurhanL NC: Duke University PrwM, 1989).Gore, A., “From Red ‘lhpe to Results: Creating a Governrmmtthat Works Better and Costs Less,” report of the NationalPerformance Review, Sept. 7, 1993.Gornitz, V., ‘E White, and R. Cushmq “Vuhmbility of theU.S. to Future Sea Level Rise,” in: Proceedings of the 7thS y m p o s i u m o n C o a s t a l a n d O c e a n M a n a g e m e n t (Long B-CA: American Society of Civil “Engwers 1991).Grahaq ILL., M.G. ‘hner, and V.H. D;q “HOW Incmas@C02 and Climate Change Meet Forests,” Bioscience, vol. 40,No. 8, Septemba 1990, pp. 575-87.Gramp, K.M., A.H. ‘Ric& and S.D, Nelsoq Federal Fundi”ngfor Environmental R&D: A Special Report, R&D Budget andPolicy Projecg The American Association for the Advancunmtof science, M publication number 92-48S (Waahin@QDC: AAAs, 1992).Halpiq PN., “Ecosystems at Risk to PMentird ClimateChange,” contractor report prepared for the Office of ‘Rclmol-ogy Assessment, June 1993,Harkness, W.E., H1. Lina, and W.M. Alley, “Drought in theDelaware River Basiq 1984-85,” im National Wtier Summary198S-Hy&ological E v e n t s andh.rface W a t e r R e s o u r c e s , U . S .Geologictd Survey Water Supply Paper 2300 (Waah@tcq DC:U.S. Government Printing Office, 1986).Harper, S.C., L.L. F- and E.W. Rank@ The Northern ForestLand Study ofNew England and New York (IWlar@ VT: U.S.Department of Agricukurq Forest Service, and Governors’ l%skForce on Northern Forest Lands, April 199Q 2rKl priding,February 1992).Hexideq R.L., “Global Climate Change: Implication forSilvicuku.re and Pest Management,” “u P r o c e e d i n g s , F~B i e n n i a l S o u t h e r n Sihdcuhural R e s e a r c h C o n f e r e n c e , Germal‘Rchnic-al Report No. SO-74 (New Orleans, LA: USDA F%restService, Southern Forest hpcriment StatiorL 1989).Herrik C.N., and D. Jarnieso~ “l%e Social Construction ofAcidRaim Some Implications for Science/Policy Aasesmen “4paper to be presented at the 18th annual meeting of the Societyfor the Social Studies of Science, Nov. 19-21, 1993.
Chapter l-Synthesis, Summary, and Policy Options I 59
60. Hey, D., “Prairie Potholes,” in: Restoran”on of AquaticEcosystems: Science, Technology, and Public Policy, NationalResearch Council (Washington DC: National Academy Press,1992), pp. 505-509.
61. Hodges, D.G., etal., “Regional Forest Migrations and PotentialEconomic Effects,” Environmental Ton”cology and Chemistry,vol. 11, 1992, pp. 1129-136.
62. Holdridge, L.R., L#e Zone Ecology (San Jose, Costa Rica:Tropiml Science Center, 1%7).
63. Hubbar& D.E., “Glaciated Prairie Wetland Functions andMdues: A Synthesis of the Literature,” U.S. Fish and Wildlijle
Service Biological Report, vol. 88, No. 43, 1988.64. Hudsoq W.E., Landscape b”n.kages andBiodiversity (Washing-
ton DC: Defenders of Wildlife and Island Press, 1992).65. Institute of Ecology, Experimental Ecological Reserves: A
Proposed Nationa[ Network, report prepared for the National
Seiencx Foundation (Washington DC: U.S. Government Print-
ing Office, June 1977).66. Intergovernmental Panel on Climate Change, Response Strate-
gies Working Group, Coastal Zone Management Subgroup,
Global Climate Change and the Rising Challenge of the Sea(The Hague: Ministry of Transport 1992).
67. Intergovernmental Panel on Climate Change (WCC), WorldMeteorological Organiza tion+ and United Nations EnvironmentProgram, Climate Change: The IPCC Impacts Assessment,report prepared for IPCC by Working Group IL W. McG.
‘lkgartj G. Sheldo& and D. Griffith (eds.) (Canberra, Australia:Australian Govemrnent Publishing Service, 1990).
68. Intergovernmental Panel on Climate Change (IPCC), WorldMeteorological Organiza tioq and United Nations EnvironmentProgram, Climate Change: The IPCC Response Strategies,report prepared for IPCC by Working Group III, 1990.
69. Intergovemrnental Panel on Climate Change (WCC), WorldMeteorological Organiza tioq and United Nations EnvironmentProgram+ Climate Change: The IPCC Scientific Assessment,report prepared for WCC by Working Group I, J. Houghtoq G.Jenkins, and J. Ephraums (eds.) (Cambridge, England: Cam-bridge University Press, 1990).
70. Intergovernmental Panel on Climate change (TPCC), WorldMeteorological Organizatiom and United Nations EnvironmentProgrq Climate Change 1992: The Supplementary Report tothe ZPCC Scientific Assessment, report prepared for IPCC byWorking Group I, J. Houghton, B. Callander, and S. Wrney(eds.) (Cambridge, England: Cambridge University Press,1992).
71. Jacoby, H.D., “Water Quality,” in: Climate Change and U.S.
Water Resources, P.E. Waggoner (cd.) (New Yorlq NT: JohnWiley & Sons, 1990).
72. Jamis, P.G., “Atmospheric Carbon Dioxide and Forests,”Plu”losophical Transactions of the Royal Society of London, vol.B 3W, 1989, pp. 369-92.
73. Jones, E., and W. Stolzenberg, “Building in Coastal BarrierResource Systems” (Washington, DC: National Wildlife Feder-ation 1990).
74. Kalkste~ L. S., ‘‘Impacts of Global Warming on HumanHealth: Heat Stress Related Mortality,” in: Global Climate
Change: Implications, Challenges and A4itigation Measures, S.Majurndar et al. (e&.) (Philadelphia Pennsylvania Academy ofScierms, 1992).
75. Kane, S., J, Reilly, and J. ‘Ibbey, “An Empirical Study of theEconomic Effects of Climate Change on World Agriculture,”Climatic Change, vol. 21, No. 1, 1992, pp. 17-36.
76. Kareiv& P.M., Biotic Interactions and Global Change, J.Kingsolver and R. Huey (eds.) (Sunderland, MA: SimmerAssociates, Inc., 1993).
77. Karl, T.R., ‘‘Missing Pieces of the Puzzle,’ Research &Exploration, vol. 9, No. 2, Spring 1993, pp. 23449.
78. Keith, V.F., C. DeAvila, and R.M. Willis., “Effect of ClimateChange on Shipping within I.Ace Superior and Lake Erie,” in:The Potential Effects of Global Climate Change on the United
States, EPA-23 @05-89-050, J. Smith and D. Tirpak (eds.)
(Washington DC: U.S. Environmental Protection Agency,1989).
79. Kemezis, K., “Babbitt to ‘l&t Ecosystem Policy in theEverglades, “ Environment Week, Feb. 25, 1993.
80. Kennedy, V. S., ‘‘Anticipated Effects of Climate Change onEstuarine and Coastal Fisheries, ” Fisheries, vol. 15, No. 6,1990, pp. 16-25.
81. Kimball, B.A., N.J. Rosenberg, and L.H. Alleq Jr. (eds.),Impact of Carbon Dioxide, Trace Gases and Climate Change
on GZobal Agriculture, Special Publication No. 53 (MadisoqWI: American Society of Agronomy, 1990).
82. War@ P., and M. Hershmaq “Response of Coastal ZoneManagement Programs to Sea Level Rise in the United States,’Coastal Management, vol. 18, 1990.
83. Kusler, J.A., Our Nationul Wetlands Heritage: A ProtectionGuidebook (Washington DC: Environmental Law Institute,1983).
84. Kusler, J.A., and M.E. Kenh@ Wetland Creation andRestora-tion: The Status of the Science (Washington DC: Island press,1990).
85. Leatherrnaq S., “Impact of Accelerated Sea bvel Rise onBeaches and Coastal Wetlands, “ in: Global Climate ChangeLinkages, James C. White (cd.) (titerd~ l%e Netherlands:Elsevier Science Publishing, 1989).
86. Ledig, F.’E, A Strategy to Manage Forest Genetic Resources inthe United States (Berkeley, CA: U.S. Department of Agricul-ture, Forest Service, Institute of Forest Genetics, PacificSouthwest Research Statioq 1992).
87. IAig, F.T., and J.H. Kitzmiller, “Genetic Strategies forReforestation in the Face of Global Climate Change,” ForestEcology and Management, 1991.
88. Lettenmaier, D,, T Gaq and D. Dawdy, “Interpretation ofHydrologic Effects of climate Change in the Sacramento-SanJoaquin River Basirq Californ@” h The Potential Eflects of
Global Climate Change on the Uru”ted States, AppendLx A:Water Resources, J. Smith and D. Tirpak (eds.) (Waahin@oqDC: U.S. Environmental Protection Agency, 1989).
60 I Preparing for an Uncertain Climate--Volume 2
89. Leverenz, J.W., and DJ. Lev, “Ef%cts of Carbon Dioxide-Induced Climate Changes on the Natural Rauges of Six MajorCommercisJ Tree Species in the Western United States,” in:The Greenhouse Efect, Climate Change, and U.S. Forests, W.Shads andj. Hoffman (eds. ) (Washington DC: The Consema-tion Foundation 1987), pp. 123-155.
90. Lewandrows& J., and R. 13razee, “Government Farm Pro-p ~d C-te -c: A First J.mok’ in: EconomicIssues in Global Climate Change: Agriculture, Forestry, andNatural Resources, J. Reilly and M. Anderson (eds.) (Boulder,CO: Westview Press, 1992), pp. 132-147.
91. Light S., L. Ounderson, and C. Helling, “The Everglades:Evolution of Management in a lbrbulent Ecosystem,’ ArthurC. Miimhall Laboratory, University of Flon@ Gainesville,unpublished manuscript 1993.
92. Lillieholm, RJ., Presewes at Risk: An Investigation ofResource Management Strategies, Implications, and Opportu -tu”ties, contractor report prepared for the Office of lkchnologyAmessment January 1993.
93. Linder, K.P., and M.R. Inglis, “The Potential Effects ofClimate Change on Regional or National Demands forElectricity,” in: The Potewial Effects of Global ClimateChange on the United Statt*s, Appendix H: Ir@astructure, J.Smith and D. Tirpak (eda.) (Washington DC: U.S. Environ-mental Protection Agency, ]989),
94. Longstre@ J., and J. Wisemam “The Potential Impacts ofClimate Change on Patterns of Infectious Disease in the UnitedStates,’ ti The PotentialEflects of Global Climate Change onthe Utu”tedStates, Appendix G: Heulth, J. Smith and D. Tirpak(eds.) (WashingtoqDC: U.S. EnvironmentalProtectionA gency,1989).
95. Lovejoy, T.E., “Diverse Considerations, ” Biodiverw”ty, E.O.Wilson (cd.) (Washington DC: National Academy Press,1988).
%. Imveland, J.E, and G.Z. Brown,Impacts of Climate Change onthe Energy Performance o}’ Buz”ldings in the United States,contmctor report prepared for the Office of ‘IkchnologyAssesrnen4 December 1990.
97; Lubchenco, J., et al., “The Sustainable Biosphere Initiative:An Ecological Research Agen@” Ecology, vol. 72, No. 2,1991, pp. 371412.
98. MagnusorL JJ., H.A. Regxer, and BJ. Shuter, “PotentialResponses of Great Lakes Fishes and Their Habitat to GlobalClimate Warming,” in: The Potential Efiects of GlobalClimate Change on the United States, Appendix E: AquaticResources, J. Smith and D. Tirpak (eds.) (Washington DC:U.S. Environmental Protection Agency, 1989).
99, MaMmarL J.D., “Assessing Global Climate Change: WhenWill We Have Better Evidence?” in: Climate Change andEnergy PoZicy, IJJS Alamos National Laboratory IA-UR-92-502, L. Rosen and R. GlasseI (eds.) (New York NY: AmericanInstitute of Physics, 1992), pp. 17-31.
100. Mattson, W.J., and RA. HaacL ‘‘The Role of Drought inoutbreaks of Plant-Eating Insects,” Bioscience, vol. 37, No.2, Februaq 1987, pp. 110-16.
101. Matthews, WJ,, and E.G. Zimmerrnaq “Potential Effects ofGlobal Warming on Native F’ishes of the Southern Great Plainsand the Southwest,” Fisheries, vol. 15, No. 6, 1990, pp. 26-32.
102. McGill.ivary, D,G., T Agnew, G.R. PilMngtonet al., “Irnpactaof Climate Change on the Beaufort Sea-Ice Regime: Implica-tions for the Arctic Petroleum Imh@,” Canadian ClimateCentre Report 92-6 (DownsView, Ontario: Atmospheric Envi-ronment Service, 1992).
103. McNeely, J. A., “Climate Change and Biological Diversity:Policy Implications,” in: Landscape-Ecological Impact ofClimatic Change, M. Boer and R. de Groot (ala.) (AmsterdanL~ Netherlands: 10S Press, 1990), pp. 406-429.
104. McNeely, J.A., ‘‘The Future of the National Parks,” Environ-ment, vol. 32, No. 1, 1990, pp. 16-20 and 37-41.
105. Mcarns, L., “Implications of Global Warming for ClimateWuiability and the Occurrence of Extreme Climate Eventa,”in: Drought Assessment, Management, and Planning: Theoryand Case Studies, D. Wilhite (cd.) (Bostoq MA: KluwexAC$MkdC Publishers, 1993).
106. Miller, W.F., P.M. DOU@CSty, and G.L. Switzer, “Effect ofRising Cmbon Dioxide and Potential Climate Change onImblolly Pine Distribution Grow@ Suwival and Productiv-ity,” in: The Greenhouse Effect, Climate Change and Us.Forests, W.E. Shands and J.S. Hofhan (eda.) (Wash@toqDC: The Consemation Foundation 1987).
107. Moreau D1-L, “It Will Be a Long Wait for Proof,” paperpresented at the Southeast Climate Symposium Chan@ngClimate and Water Resources, Charleston SC, Oct. 27-29,1992.
108. Murphy, D.D., and S.B. Weiss, “Effects of Climate Change onBiological Diversity in Western North Americ.tu SpeciesLosses and Mechanisms “ in: Global Warnu”ng and BwlogicalDiversity, R.L. Peters id T E. Lovejoy (eds.) (New HaverLCT: Yale University I%ss, 1992), pp. 355-368.
109. National Audubon Society, Report of the Adn”sory Panel onthe Everglades and Endangered Species (New Y* NY:National Audubon Society, 1992).
110. National Committee on Property Insurance, Amen”ca’s Varu”sh-ing Coastlines, October 1988.
111, National Research Cod Toward an Understand@ ofGlobal Change (Washington DC: National Academy Pnx,1988).
112, NationalResearchCounci~ Managing CoastalErosion (Waah-ingtom DC: National Academy Press, 1990).
113. National Research Councu Managing Global Genetic Re-sources: Forest Trees (Waahingto& DC: National AcademyPress, 1991).
114. National Research Council, Restoration of Aquatic Ecosys-tems: Science, Technology, and Public Policy (Washin@o~DC: National Academy Rew, 1992).
115. National Research CounciL Science and the Nationaf Parks(WSShingtorq DC: National Academy Ress, 1992).
116. National Research Council, Water Tram-firs in the West:Eflciency, Equity, and the Environment (Waahingto& DC:National Academy Press, 1992).
117. National Research CouncL Research to Protect, Restore, andManage the Environment (WaahingtoU DC: National /kxul-emy Press, 1993).
118. National Research’ Council, Setting Pnoritiesfor Land Con-servation (WashingtorL DC: National Academy Press, 1993).
.
Chapter 1--Synthesis, Summary, and Policy Options I 61
119. Nelsoq J.W., “The Duck Depression of the 1980’+AnAgenda for Recove~,’ a Ducks Unlimited Discussion Paper,Ducks Unlimited, Inc., Long Grove, IL, 1989.
120. NelsoqRK., “AthapaskanSubsistenceA daptationsinAlas@”in: Alaska Native Cultures in History, U. Kotani and M,Workman (eds.) (OsalQ Japan: National Museum of Ethnol-Ogy, 1980).
121. Oechel, W.c., “Effects of Anticipated Changes in GlobalClimate and Atmospheric COZ on Western Ecosystems:Chaparral and Asociated Forest Ecosystems,” contractorreport prepared for the Offlce of lkchnology Assessment, July1992.
122. Oechel, W.C., “Sensitivities of Alaskan Biological and SocialSystems to Climate Change: A Scenario,” contractor repofiprepared for the Offke of ‘IWnology Assessment May 1993.
123. Oechel, W.C., and W.D. Billings, “Effects of Global Changeon the Carbon Balance of Arctic Plants and fiosystems, ’ in:Arctic Ecosystems in a Changing Climate: An Ecophysiologi-cal Perspective, F.S. Chapin Ill, R.L. Jefferies, J.F, Reynolds,G.R. Shaver, and J. Svobo& (eds.) (San Diego, CA: AcademicPK2SS, 1992), pp. 139-68.
124. Oechel, W. C., and B.R. Strain, “Native Species Responses toIncreased Carbon Dioxide Concentration” in: Direct Eflecrsofkreasing Carbon Diom”de on Vegetation, DOE/ER41238,B. Strain and J. Cure (txls.) (Washington.L DC: U.S. Departmentof Energy, December 1985).
125. oeche~ W.C., et aI., “Recent Changes of Arctic TkmdraEcosystems from a Net Carbon Dioxide Sink to a Source, ”Nature, vol. 361, 1993, pp. 52023.
126. Oversight Review Board of the National Acid PrecipitationAssessment Program (NAPAP), The Experience and~gacy ofNAPAP: Report to the Joint Chairs Council of the InteragencyTask Force on Acid Deposition (Washington, DC: NAPAP,April 1991).
127. ParlG R.A., et al., “The Effects of Sea Level Rise on U.S.Coastal Wetlands,’ in: The PotenhaiE#ects of Global ClimateChange in the U.S., Appendix B: Sea Level Rise, J. Smith andD. Tirpak (eds.) (WashingtorL DC: U.S. EnvironmentalProtection Agency, 1989).
128. Parker, B.B., National Oceanic and Atmospheric A&rums‘ “ tra-tion (NOAA), Ocean and Lake Levels Division+ Offke ofOcean and Earth Sciences, National Ocean Sexvice, NOAA,“The Use of Long Historical Sea ~vel Records in the Studyof climate and Global Change, ’ paper presented at Marine‘Ikdmology Society ’92, Washington, DC, Oct. 19-21, 1992.
129. Parry, M.L., and P.N. Duinker, “Agriculture and Foreshy, ”in: Climate Change: The IPCC Impacts Assessment, W. McG.‘lkgrixl G. Sheldoni and D. GriMths (eds.), WMO/UNEPIntergovernmental Panel on Climate Change (canbem& Aus-tralia: Australian Government Publishing Service, 1990).
130. Peine, J., J. Burde, and W, Harmm“q “Threats to the NationalWilderness Preservation Systerq” in: Wilderness Benchmark1988: Proceedings of the National Wilderness Colloquium,General ‘Ikchnical Report SE-51 (Asheville, NC: U.S. Depart-ment of Agriculture, Forest Service, Southeastern ForestExperiment Statioq 1989), pp. 133-141.
131. Peters, R.L., ‘The Effeet of Global Climatic change onNatural Communitiq” im Biodiversity, E.O. Wilson (cd.)(WaahingtOrL DC: National Academy Ress, 1988), pp. 450-464,
132. Peters, R.L., and J.Il. Darling, “The Greenhouse Effect andNature Reserves,” Bioscience, vol. 35, 1985, p. 707.
133. Peters, RL., and T.E. Imvejoy (eds.), GlobaZ Warming andBiological Diversity (New Haveu CT: Yale University Press,1992).
134, Poiani, K. A., and W.C, Johnsoq “Global Warming and PrairieWetlands: Potential Consequences for Waterfowl Habi@”Bioscience, vol. 41, No. 9, October 1991, pp. 61 1-18;
135. President’s Commis sion on Americans Outdoors, AmericansOut&ors: The Legacy, The Challenge (Washingtm DC:Island prCSS, 1987).
136. Property Claim Services, A Division of American InauraneeServices Group, Inc., ‘ ‘Hurricane AndrCW’S Estimated cost toProperty Insurers Revised to $15.5 Billion by Pqerty ClaimServices,” Fetnuary 1993 (press release).
137. RawsorL J.M., Library of Congress, Congressional ResearchS-ice, “New Crops and New Farm Products: A Briefing,”88-771 ~ December 1988.
138. Rawsou J.M., Library of Congress, Congressional ResearchSewice, “Agricultural Research and Extensiorr Current Is-sues,” 93-83 ~ January 1993.
139, my, G.C., M.G. McCormick-Ray, and F.M. Potter, “GlobalClimate Change and the Coastal Zone: Evaluation of Impactson Marine Fisheries and Biodiversity of the U.S.,” contractorreport prepared for the Office of ‘Ibdmology Assessment,February 1993,
140. Ray, G.C., et al., ‘‘Effects of Global Warming on theBiodiversity of Coastal-Marine“ Zones,” iru Global Wimnz”ngand Biological Diversity, RL. Peters and T.E. Lovejoy (eds.)(New Haveq CT: Yale University Press, 1992), pp. 91-104.
141. Reisner, M., Cadillac Desert: The American West and ItsDisappearing Water (New York NY: Viking Pengu@ k.,1986).
142. Riebsame, W., and J. Jacobs, “Climate Change and WaterResources in the S aerament&San Joaquin Region of Califor-nia’ ‘ working papex 64, Natural Hazards Reseamh andApplications Information Center, University of Colorado,December 1988.
143. Riebsame, W., S. ChangnorL and T. KarL Drought and NaturalResources Management in the Um”ted States: Impacts andImplications of the 1987-89 Drought (Boulder, CO: WeswiewPress, 1991).
144. Rind, D., R Goldberg, J. I-Iansq C. Rosenzweig, and R.Ruedy, “PotesMiaJ Evapotranspi.ration and the Likelihood ofFuture Drought,” Journal of Geophysical Research, vol. 95,No. 7, 1~, pp. 9983-10004.
145, Ritchie, J.T, B.D. Baer, and T.Y. Chou, “Effect of G1oIMIClimate Change on Agriculture in the Great bkea RegioL”in: The Potential Eflects of Global Climate Change on theUnited States, Appendix C, Volume 1: Agriculture, J. Smithand D. Tirpak (eds.) (Waahin@oK DC: U.S. EnvironmentalProtection Agency, 1989), pp. 1-1 to 1-30.
146. Roberts, L. “HowFast Can Trees Migrate?” Science, Feb. 10,1989.
62 I Preparing for an Uncertain Climate-Volume 2
147, Rocky Mountain- Inatituttz Water Eficiency: A Resource forUtility Managers, Commauu”ty Planners, and Other Decim”on-makers, m cooperation with the U.S. Environmental protection
* OfliCC of Water (Sno wroaas, co: Rocky MountainInstitute, 1991).
1*. R~ NJ.) “Adaptatiim of Agriculture to Climate
-,” Ckhalz-c Change, vol. 21, No. 4,1992, pp. 38545.149. Rosenzweig, C., “Potential Effects of Climate Change on
-M production in the Great Plains: A Sixn~tionStudy,” tie The Potential Effects of Global Climate Change onthe Um”tedSmtes, Appendix C, Volume I: Agriculture, J. Smithand D. Tirpak (eds.) @%lh@tOw DC: U.S. EIIVhOlllll=tdProtection Ageney, 1989), pp. 3-1 to 3-43.
150. Rosenzwe”q, C., ~ M. P~Y, Climate Change and WorldFood Supply (OxforL En@nd: University of Oxford in
m).151. RuttaQ V.W., “W. Parry: Climate Change and World Agricul-
ture,” Environment, vol. 33, 1991, pp. 25-29 (book review),152. Scow MJ., B. Csuti, and S. Caieco, “GapAnalysis: Assessing
Protection Needs,” in: L.atdrcape Linkages and Biodz”versity(Wash@@a DC: Island press, 1991), pp. 15-26.
153. Sheer, D., “Rmervoir and Water Resources Systems in theFace of Global Climate Change,” contractor report preparedfor the Office of ‘Rchnology Assessmen4 December 1992.
1 5 4 . Simberloff, D . , J.A. FaK, J. C o x , a n d D.W. M e -“Movement Corridors: Conservation Bargains or Poor Invest-ments?” Conservation Biology, vol. 6, No. 4, 1992, pp.493-504.
155, SmitlL JB,, “Amending Natural Resourw Statutes to Antici-pate Climate Change,’ con&actor report prepared for theOffice of lkchnology Assessrnen4 March 1993.
1S6. Smi@ JB., and J. Mueller-Vollrner, “Setting Priorities forAdapting to Climate Change,’ contractor report prepared forthe Office of lkchnology Assessment, Febnuq 1993.
157. Smi@ W.H., “United States Freest Response and Vulnerabil-ity to Climate Change,” contractor report prepared for theGfflce of ‘lkchnology Assessment May 1992.
158. Solley, W., R Pieree, and H. Pt:rl.rnaq Estimated Use of Waterin the Utu”ted States in 1990, United States Geological Survey(USGS) Survey Cimular 1081 (TWhi@om DC: USGS,1993).
159. Solomo% A.M., “Transient Response of Forests to C02-Indueed Climate Change: Simulation Modeling Experimentsin Eastern North Ameriq” Oecologia, vol. 68, 1986, pp.567-79.
160. swanacm GA., and H.F. Duebbert, “Wetland Habitats ofWaterfowl in the Prairie Pothole Regionj” i.w NorthernPrairie Wetlands, A. vander Wdk (cd.) (Ames, IA: Iowa StateUniversity Press, 1989), pp. 22.8-67.
161. Titus, J.G. (cd.), Greenhouse Eflect, Sea Level Rise, andCoastal W&landr, EPA 23(M5-86-013 (wfiSh.@tO~ DC:Us. Environmenttal Protection Agency, OffIce of Policy,Planning and hduatioq July 1988).
162. Titus, J.G. “Greenho use Effect and Coastal Wetland Policy:How Americans Could Abandon an Area the Size of Massa-chusetts at Minimum Cost,’ EnvironmentaZManagement, vol.15, No. 1, 1991, pp. 39-58.
163. Titus, J.G., and M. Greene. “An Overview of the NationwideImpacts of Sea Level Rise, “ i.ru The Po{entialEflects of Global
Climate Change on the United S@zr, Appendix B: Sea LevelRise, J, Smith and D. Tirpak (eds.) (Washington DC: U.S.Environmental Rotection Ageney, 1989).
164. ‘Ibrner, M., D. Swezy, and J. Longstrethj “Potential Impactsof Global Climate Change in the U. S.: Importation.VExacerbation of Human Infectious Diseases,” mntrwmr
report prepared for the Of&-e of ‘lbchnology Assessmen$December 1992.
165. United Nations, United Nations Convenn”on on ClimateChange, Article 2 and Article 4, Sec. 2(b), 1992.
166. U.S. Advisory Commission on Intergovemmmtal Relations(ACIR), Coordinating WaterResourcesin theFe&ralSystem:The Groundwater~urjace Water Connection (WasMngto~
DC: ACII& October 1991).167. U.S. by corps of “Engmeem, Institute for Water Reaourees,
4’IWR Review Report for U.S. Congress, Office of ‘Rchnol-ogy Assessmen6 in Referenee to Draft Report on Systems atRisk from Climate Change,” IWR Policy Study 93-PS-1, July1993.
168. U.S. Congress, General Accounting Office (GAO), Natio?ud
Wildlife Rej@?s: Continuing Problems with IncompatibleUses Call for Bold Action, GAOIRCED-89-1% (wt@ixI@JQDC: U.S. GAO, September 1989).
‘169. U.S. Congress, General Accounting Oftice (GAO), WetZands
Overview: Federal and State Po(icies, Legislan”on, and Pro-grams, GAO/RCED-92-79FS (W@ingtoU DC: U.S. GAO,November 1991).
170. U.S. Congress, Offke of TMmology Aisessme@ WedandkTheir Use andRegulation, OTA-O-206 (Washington DC: U.S.Government Printing Oflice, March 1984).
171. U.S. Congress, Office of ‘lkchnology Assessmen4 Technolo-gies to Maintain Biological Diversity, OTA-F-30 (Washing-ton DC: U.S. Government Printing Office, March 1987).
172. U.S. Congress, Offlce of ‘Ikchnology Assessment, Changingby Degrees: Steps to Reduce Greenhouse Gases, O’IA-0482
(T%shingtoa DC: U.S. Government Print@ Off&, February1991).
173. U.S. Congress, Off& of ‘IHmology Assesamen4 En&gyEflciency in the Federal Government: Government by Good
Example? OTA-E42 (WashingtoxL DC: U.S. GovernmentPrinting office, May 1991).
174. U.S. Congress, Offlce of ‘Rzhnology Assessment A NewTechnological Era for American Agriculture, OTA-F474
(WashingtorL DC: U.S. Government Printing Oftice, August1992).
175. U.S. Congress, Office of lkehnology Awessmeq HarmfidNon-Indigenous Species in the United S@es (Wash@to~DC: Government Printing Gffke, in press).
176. U.S. Department of Agriculture, Forest Service, Blue Moun-
tains Forest Health Report: New Perspective in Forest Health(Portland, OR: U.S. Forest Service, Pacific Northwest RegioqApril 1991).
Chapter 1-Synthesis, Summary, and Policy Options 163
177. U.S. Department of Energy, Argonne National Laboratory,Environmental Assessment and Information Sciences Divi-sioq RdmOlogy and Environmental Policy Sectiom E..eczs ofScientific Uncertainties on the Accuracy of Global ClimateChange Predictions: A Survey of Recent Literature, DOEinternal repom M.E. Femau and D.W. South (eds.) (Agonne,IL: U.S. Department of Energy, October 1991).
178. U.S. Department of Energy, Office of Energy ResearcL Officeof Basic Energy Sciences, Carbon Dioxide Research DivisioqDirect Effects of Increasing Carbon Dioxide on Vegetation,DOWER-(X238, B. Strain and J. Cure (eds.) (Washington DC:U.S. Department of Enqy, December 1985).
179. U.S. Department of the Interior, The hnpact of FederalPrograms, Volume 1: The Lower Mississippi Alluvial Plan andthe Prain”e Pothole Region, a report to Congress by theSecretary of the Interior, October 1988.
180. U.S. Department of the Interior, Bureau of Land ManagementFish and Wildlife 2000: Spea”al Status Fishes Habitat Man-agement, BLM/SC/PT - 91/005+6844 (WashingtoXL DC: U.S.Government Printing 0ff3ce, May 1991).
181. U.S. Department of the Interior, Bureau of Land ManagementFish and Wildlife 2000: Annual Report ofAccomplishmentsFY1991 (WashingtorL DC: U.S. Government Printing Office,1991).
182. U.S. Department of the Interior, Fish and Wildlife ServicemanOverview of Major WetlandFunctions and Values, FWS/OBS-84/18, contractor paper prepared by J. Sather and R, Smith(Washington DC: U.S. Fish and Wildlife Semice, September1984).
183. U.S. Department of the Interior, Fish and Wildlife Semice,Endangered and Threatened Species Recove?y Program (Wash-ington, DC: U.S. Government Printing Office. December1990).
184. U.S. Department of the Interior, Fish and Wildlife Semice,Wetlands: Meeting the Presi&nt’s Cha11eng+1990 WetlandsAction Plan (T%.shingtou DC: U.S. Fish and Wildlife Service,1990).
185, U.S. Department of the Interior, Fish and Wildlife Service,R@ges 200374 Plan for the Future of the National WildlifeRefige System, Issue 2, March 1991.
186. U.S. Department of the Interior, Fish and Wildlife Service, andU.S. Department of Commtice, Bureau of the Census, 1991National Survey of Fishing, Hunting, and Wildlife-AssociatedRecreation (Washington, DC: U.S. Government PrintingOffke, 1993).
187, U.S. Department of the Interior, National Park Service, TheNationul Parks: Shaping the System (Waahingtow DC: Na-tional Park Service, 1991).
188. U.S. Environmental Protection Agency, The Potential Effectsof Global Climate Change on the Um”ted States, EPA-23@05-89-050, J. Smith and D. Tirpak (eds.) (Washington, DC: U.S.Environmental Protection Agency, December 1989).
189. U.S. Geological Survey, “Coastal Hazards,” in: NationalAtlas of the United States of America (Restoq VA: U.S.Geological Sumey, 1985) (map).
190. U.S. House of Representatives, Reclamation Projects Authori-zation and Adjustment Act of 1992-Conference Repo*Report 1(32-1016 (Title ~: Central Wiley ProjectImprovement A@ Title IOCX: Western Water Policy Review),Oct. 5, 1992.
191. Urbaq D.L., and H.H. Shugartj ‘ Forest Response to ClimaticChange: A Simulation Study for Southeastern Forests,” irxThe Potential Efects of Global Climate Change on the UnitedStates, Appendix D: Forests, J. Smith and D. Tirpak (eds.)(W#dngtoq DC: U.S. Environmental Protection Agency,1989).
192. Mm Sickle-BurketL V., et al., National Wetlands ResearchCenter, U.S. Fish and Wildlife Service, tables describingcoastal wetland vulnerabilities to climate change, prepared forU.S. Office of ‘Rdmology Assessment, May 1992.
193. Wr@ R., “The Management of Water Resources in theWestern U.S. and Potential Climate Change,” contractorreport prepared for the Of&e of ‘Rdmology Assessmen4October 1992.
194, Warreq R.S., Coastal Wetland Vuherabilities to ClimateChange, contractor paper prepared for the Oftlce of ‘Ik&nol-ogy Assessmen4 July 1992.
195. Washington W., “Reliabilityofthe Models: ‘fheirhfatchwithObsenations, “ in: Climate Change and Energy Policy, L.Rosen and R Glasses (eds.) (New York: American Institute ofPhysics, 1992).
1%. Webb, T., “Past Changes in Vegetation and Climate: I_xxsonsfor the Future, ” im Global Warnu”ng and Biological Diversity,R. Peters and T. Lovejoy (eds.) (New HaverL CT: YaleUniversity Press, 1992), pp. 59-75.
197. Wilhite, D,, “Drought Management and Climate Change,”contractor report prepared for the Ofllce of ‘RdnologyAssessmen4 December 1992.
198. Willan$ D.E., et al., “Wetland Vulnerabilities to ClimateChange,” contractor paper prepared for the Offke of lbchnol-ogy Assessment, August 1992.
199. WillarL D.E., and L.D. Kosmond, A Watershed-EcosystemApproach to L.iandand Water Use Planning and Management,contractor report prepared for the Offlce of ‘IWmologyASSCSSUHC Aug. 28, 1992.
200. Wingerd, D., and M. Tseng, “Flood and Drought Functions ofthe U.S. Army Corps of Engineers,” in: National Watersummq 1988-8-ydrologic Events and Floods andDroughts, U.S. Geological Survey Water-Supply Paper 2375(Washington DC: U.S. Government Printing 0i3ice, 1991).
201. World Resoumes Institute (WRI), The World ConservationUnion (lUCN), and United Nations Environment Programme(UNEP), Global Biodiversity Strategy: Policy-Makers’ Guide(Baltimore, MD: WRI Publications, 1992).
202. Wright G.R., Wildlife Research and Management in theNational Parks (Chicago, IL: University of Illinois Press,1992),

T
A Primer onClimate Change
and NaturalResources 2
his chapter summarizes the current state of knowledgeabout climate change and describes the interaction ofclimate variables with natural systems. Backgroundinformation key to understanding the impacts described
in each of the resource chapters (coasts, water, agriculture,wetlands, preserves, and forests) is included here. This chapterillustrates the range of effects climate change could cause acrosssystems and at different spatial and temporal scales.
Human activities have increased the rate at which greenhousegases-carbon dioxide (CO2), methane (CH4), nitrous oxide(N20), and chlorofluorocarbons (CFCs)-are building up in theatmosphere. This increase is likely to lead to changes in climatethat could have significant effects on natural systems. Thefirst-order effects of a buildup of greenhouse gases-increasingaverage temperature, rising sea level, and changes in precipita-tion and evapotranspiration--can be estimated with someconfidence at the global scale. Global average temperature mayincrease about 2 OF (1 ‘C) by 2030 and sea level is predicted torise by about 8 inches (20 centimeters) l in the same period;precipitation and evapotranspiration globally will also increase.
As scientists consider smaller spatial scales, their certaintyabout these effects decreases. Some midcontinent regions arelikely to become warmer and drier rather than warmer and wetter,for example, but not enough is known yet about climate changeon a regional scale to be confident about the direction andmagnitude of changes. A decade or more of research will beneeded before such precision is available. Second- and third-order effects, such as changes in individual plants and animals orwhole ecosystems, are ultimately the impacts that humans care
1 To convert inches to centimeters (cm), multiply by 2.540.
I 65
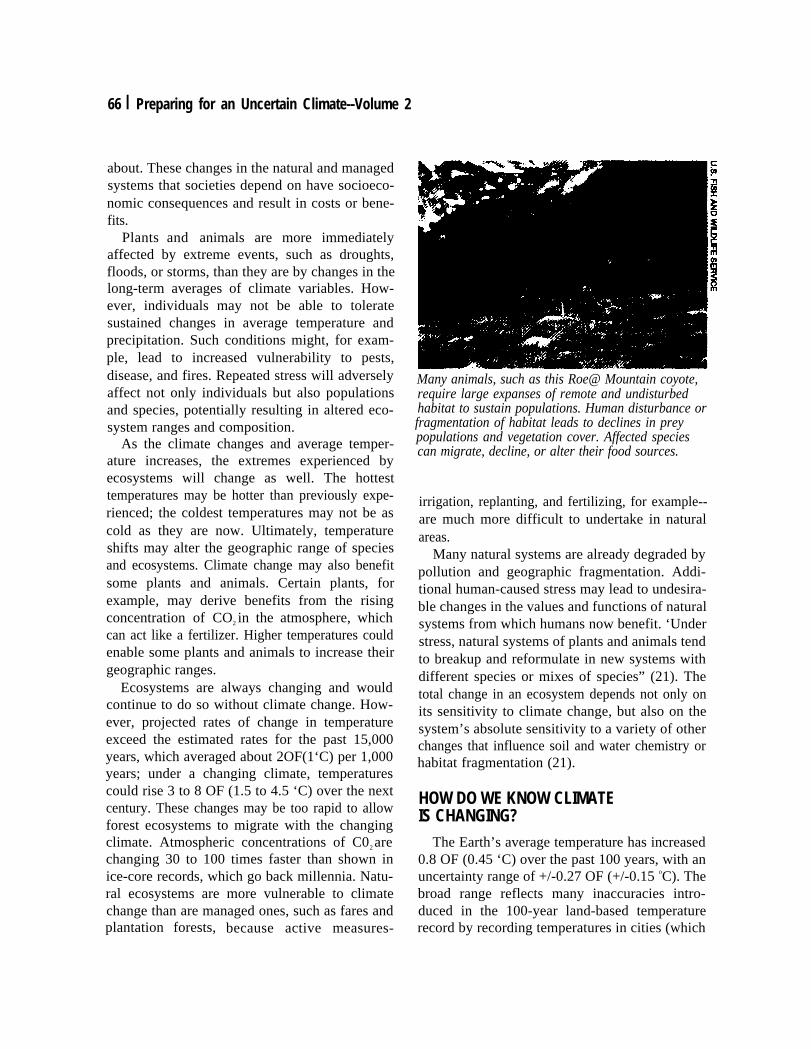
66 I Preparing for an Uncertain Climate--Volume 2
about. These changes in the natural and managedsystems that societies depend on have socioeco-nomic consequences and result in costs or bene-fits.
Plants and animals are more immediatelyaffected by extreme events, such as droughts,floods, or storms, than they are by changes in thelong-term averages of climate variables. How-ever, individuals may not be able to toleratesustained changes in average temperature andprecipitation. Such conditions might, for exam-ple, lead to increased vulnerability to pests,disease, and fires. Repeated stress will adverselyaffect not only individuals but also populationsand species, potentially resulting in altered eco-system ranges and composition.
As the climate changes and average temper-ature increases, the extremes experienced byecosystems will change as well. The hottesttemperatures may be hotter than previously expe-rienced; the coldest temperatures may not be ascold as they are now. Ultimately, temperatureshifts may alter the geographic range of speciesand ecosystems. Climate change may also benefitsome plants and animals. Certain plants, forexample, may derive benefits from the risingconcentration of CO2 in the atmosphere, whichcan act like a fertilizer. Higher temperatures couldenable some plants and animals to increase theirgeographic ranges.
Ecosystems are always changing and wouldcontinue to do so without climate change. How-ever, projected rates of change in temperatureexceed the estimated rates for the past 15,000years, which averaged about 2OF(1‘C) per 1,000years; under a changing climate, temperaturescould rise 3 to 8 OF (1.5 to 4.5 ‘C) over the nextcentury. These changes may be too rapid to allowforest ecosystems to migrate with the changingclimate. Atmospheric concentrations of C02 arechanging 30 to 100 times faster than shown inice-core records, which go back millennia. Natu-ral ecosystems are more vulnerable to climatechange than are managed ones, such as fares andplantation forests, because active measures-
Many animals, such as this Roe@ Mountain coyote,require large expanses of remote and undisturbedhabitat to sustain populations. Human disturbance orfragmentation of habitat leads to declines in preypopulations and vegetation cover. Affected speciescan migrate, decline, or alter their food sources.
irrigation, replanting, and fertilizing, for example--are much more difficult to undertake in naturalareas.
Many natural systems are already degraded bypollution and geographic fragmentation. Addi-tional human-caused stress may lead to undesira-ble changes in the values and functions of naturalsystems from which humans now benefit. ‘Understress, natural systems of plants and animals tendto breakup and reformulate in new systems withdifferent species or mixes of species” (21). Thetotal change in an ecosystem depends not only onits sensitivity to climate change, but also on thesystem’s absolute sensitivity to a variety of otherchanges that influence soil and water chemistry orhabitat fragmentation (21).
HOW DO WE KNOW CLIMATEIS CHANGING?
The Earth’s average temperature has increased0.8 OF (0.45 ‘C) over the past 100 years, with anuncertainty range of +/-0.27 OF (+/-0.15 oC). Thebroad range reflects many inaccuracies intro-duced in the 100-year land-based temperaturerecord by recording temperatures in cities (which
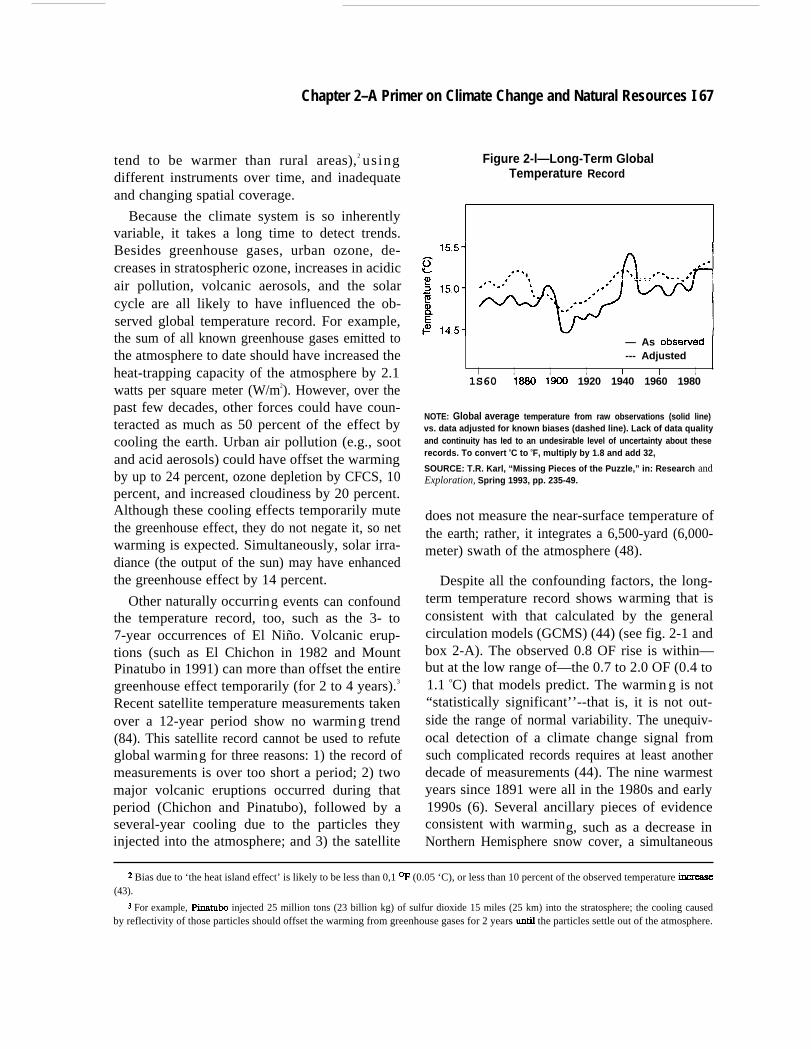
Chapter 2–A Primer on Climate Change and Natural Resources I 67
tend to be warmer than rural areas),2 usingdifferent instruments over time, and inadequateand changing spatial coverage.
Because the climate system is so inherentlyvariable, it takes a long time to detect trends.Besides greenhouse gases, urban ozone, de-creases in stratospheric ozone, increases in acidicair pollution, volcanic aerosols, and the solarcycle are all likely to have influenced the ob-served global temperature record. For example,the sum of all known greenhouse gases emitted tothe atmosphere to date should have increased theheat-trapping capacity of the atmosphere by 2.1watts per square meter (W/m2). However, over thepast few decades, other forces could have coun-teracted as much as 50 percent of the effect bycooling the earth. Urban air pollution (e.g., sootand acid aerosols) could have offset the warmingby up to 24 percent, ozone depletion by CFCS, 10percent, and increased cloudiness by 20 percent.Although these cooling effects temporarily mutethe greenhouse effect, they do not negate it, so netwarming is expected. Simultaneously, solar irra-diance (the output of the sun) may have enhancedthe greenhouse effect by 14 percent.
Other naturally occurring events can confoundthe temperature record, too, such as the 3- to7-year occurrences of El Niño. Volcanic erup-tions (such as El Chichon in 1982 and MountPinatubo in 1991) can more than offset the entiregreenhouse effect temporarily (for 2 to 4 years).3
Recent satellite temperature measurements takenover a 12-year period show no warming trend(84). This satellite record cannot be used to refuteglobal warming for three reasons: 1) the record ofmeasurements is over too short a period; 2) twomajor volcanic eruptions occurred during thatperiod (Chichon and Pinatubo), followed by aseveral-year cooling due to the particles theyinjected into the atmosphere; and 3) the satellite
Figure 2-l—Long-Term GlobalTemperature Record
,.-.●
,“-’-*” ‘*B
— As obsewed--- Adjusted
I I I I 1 1 I1S60 1880 1900 1920 1940 1960 1980
NOTE: Global average temperature from raw observations (solid line)vs. data adjusted for known biases (dashed line). Lack of data qualityand continuity has Ied to an undesirable level of uncertainty about theserecords. To convert oC to oF, multiply by 1.8 and add 32,
SOURCE: T.R. Karl, “Missing Pieces of the Puzzle,” in: Research andExploration, Spring 1993, pp. 235-49.
does not measure the near-surface temperature ofthe earth; rather, it integrates a 6,500-yard (6,000-meter) swath of the atmosphere (48).
Despite all the confounding factors, the long-term temperature record shows warming that isconsistent with that calculated by the generalcirculation models (GCMS) (44) (see fig. 2-1 andbox 2-A). The observed 0.8 OF rise is within—but at the low range of—the 0.7 to 2.0 OF (0.4 to1.1 oC) that models predict. The warmin g is not“statistically significant’’--that is, it is not out-side the range of normal variability. The unequiv-ocal detection of a climate change signal fromsuch complicated records requires at least anotherdecade of measurements (44). The nine warmestyears since 1891 were all in the 1980s and early1990s (6). Several ancillary pieces of evidenceconsistent with warming, such as a decrease inNorthern Hemisphere snow cover, a simultaneous
z Bias due to ‘the heat island effect’ is likely to be less than 0,1 OF (0.05 ‘C), or less than 10 percent of the observed temperature incxease(43).
s For example, Pinakubo injected 25 million tons (23 billion kg) of sulfur dioxide 15 miles (25 km) into the stratosphere; the cooling causedby reflectivity of those particles should offset the warming from greenhouse gases for 2 years undl the particles settle out of the atmosphere.
68 Preparing for an Uncertain Climate-Volume 2
Box 2-A–What the Models Tell Us: GCMs and Others
To describe how the climate system operates and to predict how changes in the composition of theatmosphere will affect climate, scientists have developed models known as general circulation models (GCMs).GCMs are composed of mathematical equations that describe the physical climate processes and interrelation-ships, including seasonal changes in sunlight, global air currents, evaporation and condensation of water vapor,and absorption of heat by the oceans. The models incorporate basic physical principles (such as the conservationof energy and mass) and empirical evidence from observations of how the climate system seems to operate (suchas statistical equations describing the humidity and temperature at which clouds generally form). The four majorGCMs have generated somewhat different predictions about how climate might change largely because they usedifferent empirical evidence and starting assumptions and incorporate different sets of climate variables. Evenmodels that agree on global averages may predict different regional distributions becausethey have different waysof accounting for small-scale climate processes.
The differences in climate change predictions from the various major climate models have drawnconsiderable attention. So, too, has the fact that observedchanges in global average temperature have been lowerthan initial estimates. Many models have predicted that based on the increases of human-generated greenhousegas emissions (particularly carbon dioxide (CO2) emitted during fossil fuel combustion) over the past century,global temperatures should already have increased by 0.5 to 2.0°F(0.3 to 1.0oC). Measurements of warming todate suggest that global average surface-air temperatures have increased approximately 0.5 to 1.0 oF (0.3 to0.6 oC)-on the low end of the predicted range (45).1
That global warming appears to be proceeding more slowly than predicted maybe due to difficulties indistinguishing short-term climate patterns from long-term trends, as well as to the complex and incompletelycharacterized interactions of oceans, clouds, and air pollution with weather and climate (44,92). Natural variationsin weather(e.g.,rainfall and temperature) occur over years or decades, which may mask longer-term (century andmillennium) climate patterns for many years (83). in addition, oceans have an enormous capacity to absorb heat,which may delay atmospheric warming for some time (81, 88). Clouds also play an important but uncertain rolein moderating planetary climate. Depending on their composition and location, clouds may either cool the planetby reflecting incoming solar radiation or warm it by contributing to the greenhouse effect,so it is not clear whether,in the aggregate, they contribute to orsomewhat offset global warming (1,88). Finally, global warming maybeoffset somewhat in the Northern Hemisphere because sores human-generated pollution (particularly sulfuraerosols) may actually exert a cooling effect: when converted to sulfate particles in the atmosphere, they reflectincoming solar radiation (44, 88).
Generalities and uncertainties
GCMs paint the following general picture of global climate change. Average global air temperatures willincrease. With increased temperatures will come an increase in average global precipitation because warmer aircauses faster evaporation, speeding up the rate at which water vapor becomes available for cloud formation andprecipitation. Increased temperatures will cause the water in oceans to expand (water expands as it warms above39 oF (4 oC)), and as ocean volume increases, sea levels will rise. Sea level rise may be moderated if increased
1 Global-average temperature statistics are compiled from historical temperature measurements fromweather stations around the world. Accurate Interpretation of historical temperature data is complicated andcontroversial because changes In measurement techniques and locations over the past century make the datadifficult to compare. Data analysis is further complicated by the urban “heat Island effect’’--local warming In areaswith many buildlngs and paved surfaces that tend trap heat-which has raised temperatures at some monitoringstations, reflecting changes In local climate apart from any potential global changes. The estimated temperaturechange reported here was a consensus figure developed by the lntergovernmental Panel on ClimateChange (lPCC)that attempts to account for both the changes in measurement and the confounding effects of data from urban areas.
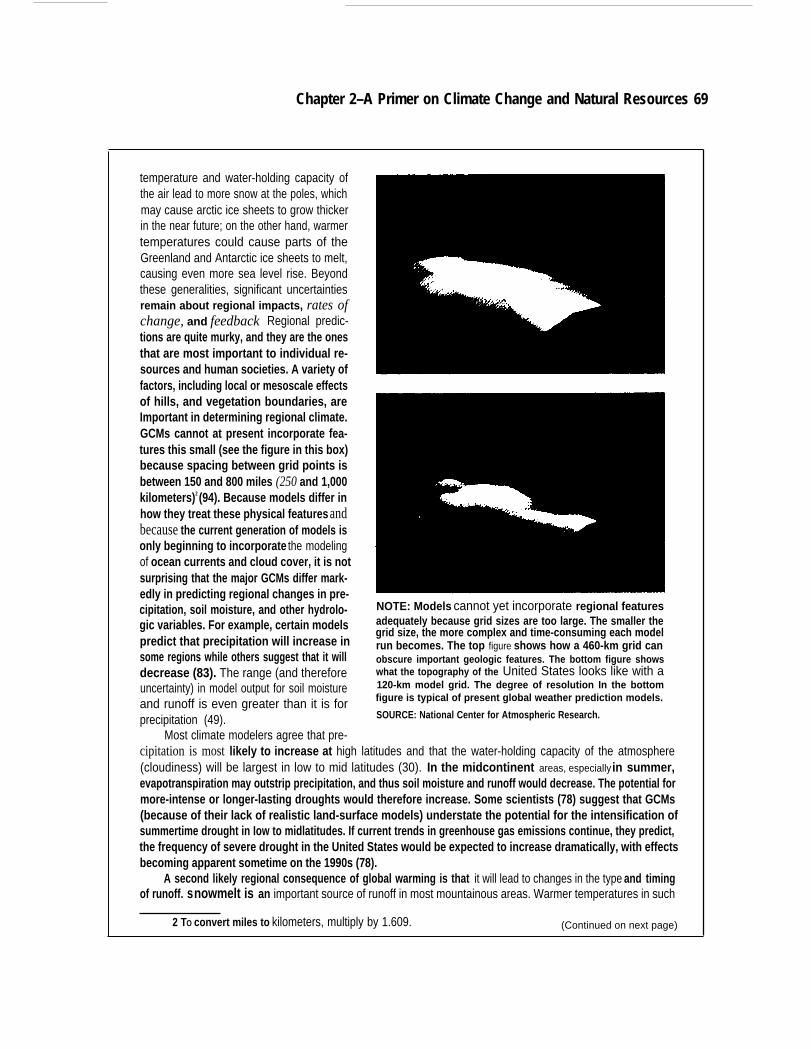
Chapter 2–A Primer on Climate Change and Natural Resources 69
temperature and water-holding capacity ofthe air lead to more snow at the poles, whichmay cause arctic ice sheets to grow thickerin the near future; on the other hand, warmertemperatures could cause parts of theGreenland and Antarctic ice sheets to melt,causing even more sea level rise. Beyondthese generalities, significant uncertaintiesremain about regional impacts, rates ofchange, and feedback Regional predic-tions are quite murky, and they are the onesthat are most important to individual re-sources and human societies. A variety offactors, including local or mesoscale effectsof hills, and vegetation boundaries, areImportant in determining regional climate.GCMs cannot at present incorporate fea-tures this small (see the figure in this box)because spacing between grid points isbetween 150 and 800 miles (250 and 1,000kilometers)2 (94). Because models differ inhow they treat these physical features andbecause the current generation of models isonly beginning to incorporate the modelingof ocean currents and cloud cover, it is notsurprising that the major GCMs differ mark-edly in predicting regional changes in pre-cipitation, soil moisture, and other hydrolo-gic variables. For example, certain modelspredict that precipitation will increase insome regions while others suggest that it willdecrease (83). The range (and thereforeuncertainty) in model output for soil moistureand runoff is even greater than it is forprecipitation (49).
Most climate modelers agree that pre-
NOTE: Models cannot yet incorporate regional featuresadequately because grid sizes are too large. The smaller thegrid size, the more complex and time-consuming each modelrun becomes. The top figure shows how a 460-km grid canobscure important geologic features. The bottom figure showswhat the topography of the United States looks like with a120-km model grid. The degree of resolution In the bottomfigure is typical of present global weather prediction models.
SOURCE: National Center for Atmospheric Research.
cipitation is most likely to increase at high latitudes and that the water-holding capacity of the atmosphere(cloudiness) will be largest in low to mid latitudes (30). In the midcontinent areas, especially in summer,evapotranspiration may outstrip precipitation, and thus soil moisture and runoff would decrease. The potential formore-intense or longer-lasting droughts would therefore increase. Some scientists (78) suggest that GCMs(because of their lack of realistic land-surface models) understate the potential for the intensification ofsummertime drought in Iow to midlatitudes. If current trends in greenhouse gas emissions continue, they predict,the frequency of severe drought in the United States would be expected to increase dramatically, with effectsbecoming apparent sometime on the 1990s (78).
A second likely regional consequence of global warming is that it will lead to changes in the type and timingof runoff. snowmelt is an important source of runoff in most mountainous areas. Warmer temperatures in such
2 TO convert miles to kilometers, multiply by 1.609. (Continued on next page)
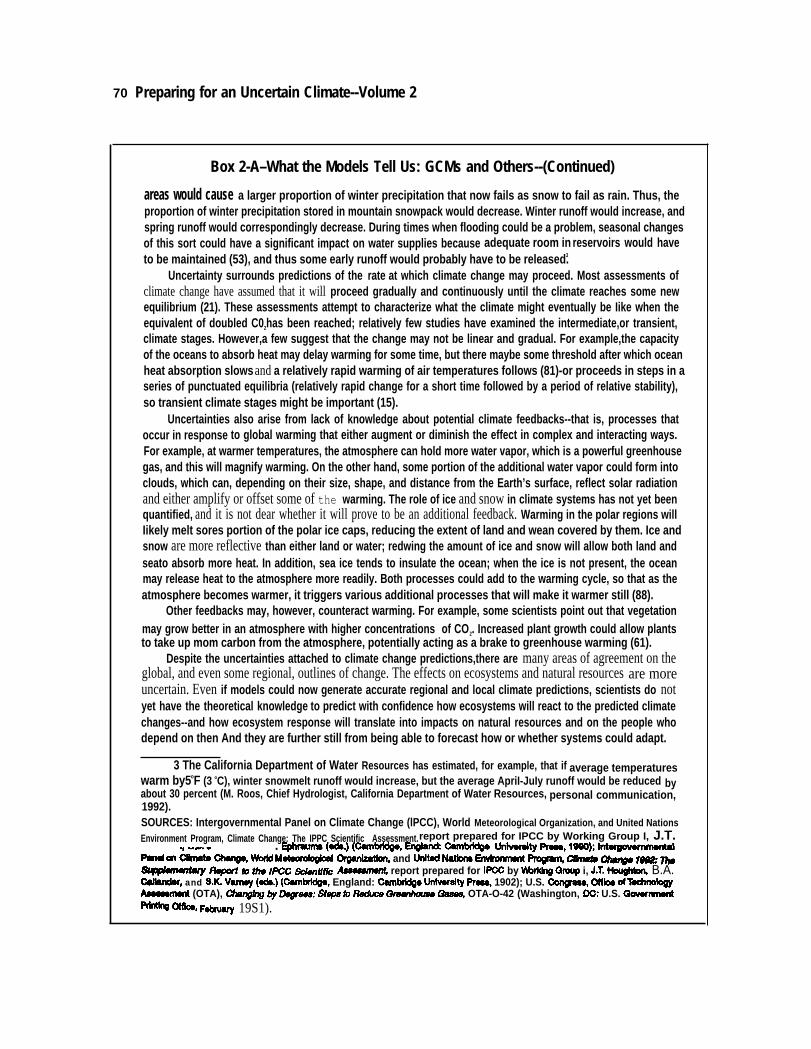
70 Preparing for an Uncertain Climate--Volume 2
Box 2-A–What the Models Tell Us: GCMs and Others--(Continued)
areas would cause a larger proportion of winter precipitation that now fails as snow to fail as rain. Thus, theproportion of winter precipitation stored in mountain snowpack would decrease. Winter runoff would increase, andspring runoff would correspondingly decrease. During times when flooding could be a problem, seasonal changesof this sort could have a significant impact on water supplies because adequate room in reservoirs would haveto be maintained (53), and thus some early runoff would probably have to be released.3
Uncertainty surrounds predictions of the rate at which climate change may proceed. Most assessments ofclimate change have assumed that it will proceed gradually and continuously until the climate reaches some newequilibrium (21). These assessments attempt to characterize what the climate might eventually be Iike when theequivalent of doubled C02has been reached; relatively few studies have examined the intermediate,or transient,climate stages. However,a few suggest that the change may not be linear and gradual. For example,the capacityof the oceans to absorb heat may delay warming for some time, but there maybe some threshold after which oceanheat absorption slows and a relatively rapid warming of air temperatures follows (81)-or proceeds in steps in aseries of punctuated equilibria (relatively rapid change for a short time followed by a period of relative stability),so transient climate stages might be important (15).
Uncertainties also arise from lack of knowledge about potential climate feedbacks--that is, processes thatoccur in response to global warming that either augment or diminish the effect in complex and interacting ways.For example, at warmer temperatures, the atmosphere can hold more water vapor, which is a powerful greenhousegas, and this will magnify warming. On the other hand, some portion of the additional water vapor could form intoclouds, which can, depending on their size, shape, and distance from the Earth’s surface, reflect solar radiationand either amplify or offset some of the warming. The role of ice and snow in climate systems has not yet beenquantified, and it is not dear whether it will prove to be an additional feedback. Warming in the polar regions willIikely melt sores portion of the polar ice caps, reducing the extent of land and wean covered by them. Ice andsnow are more reflective than either land or water; redwing the amount of ice and snow will allow both land andseato absorb more heat. In addition, sea ice tends to insulate the ocean; when the ice is not present, the oceanmay release heat to the atmosphere more readily. Both processes could add to the warming cycle, so that as theatmosphere becomes warmer, it triggers various additional processes that will make it warmer still (88).
Other feedbacks may, however, counteract warming. For example, some scientists point out that vegetationmay grow better in an atmosphere with higher concentrations of CO2. Increased plant growth could allow plantsto take up mom carbon from the atmosphere, potentially acting as a brake to greenhouse warming (61).
Despite the uncertainties attached to climate change predictions,there are many areas of agreement on theglobal, and even some regional, outlines of change. The effects on ecosystems and natural resources are moreuncertain. Even if models could now generate accurate regional and local climate predictions, scientists do notyet have the theoretical knowledge to predict with confidence how ecosystems will react to the predicted climatechanges--and how ecosystem response will translate into impacts on natural resources and on the people whodepend on then And they are further still from being able to forecast how or whether systems could adapt.
3 The California Department of Water Resources has estimated, for example, that if average temperatureswarm by5oF (3 oC), winter snowmelt runoff would increase, but the average ApriI-JuIy runoff would be reduced byabout 30 percent (M. Roos, Chief Hydrologist, California Department of Water Resources, personal communication,1992).SOURCES: Intergovernmental Panel on Climate Change (lPCC), World Meteorological Organization, and United NationsEnvironment Program, Climate Change: The IPPC Scientific Assessment,report prepared for IPCC by Working Group I, J.T.
. EpmlImO (d.) (Cambltdge, l%f$and: camlXklgO UnlvOmlty h, Wso); ltlt~PaIMIm && Q, WukiMduudo$d Or$anizatlm, and United Nation9 Emimmmt~wv R@@ fo ttm IPCC scktifio
f’wm% - C%8?r@o f-” mA8mmm@ report prepared for IPCO by Wrklng Qmup i, J.T. ~ B.A.
0dland8r, and M. Vamey (ads.) (Cam-, England: Carnbddge Unlvordty Praq 1902); U.S. Congmoq Offiao d%chmbgyAwamont (OTA), Changhg byfbgre: Steps b RsckKw c3mdwuse Qamw, OTA-O-42 (Washington, DC: U.S. Qovmund_ ~, F*v 19S1).
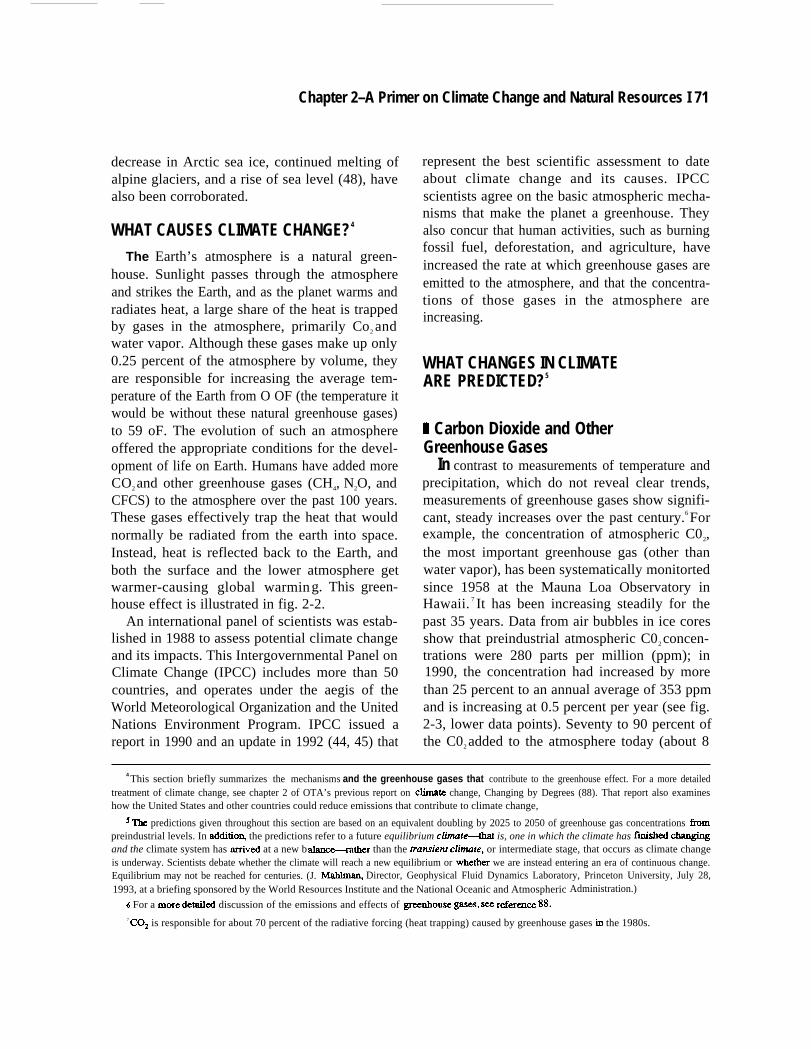
Chapter 2–A Primer on Climate Change and Natural Resources I 71
decrease in Arctic sea ice, continued melting ofalpine glaciers, and a rise of sea level (48), havealso been corroborated.
WHAT CAUSES CLIMATE CHANGE?4
The Earth’s atmosphere is a natural green-house. Sunlight passes through the atmosphereand strikes the Earth, and as the planet warms andradiates heat, a large share of the heat is trappedby gases in the atmosphere, primarily Co2 andwater vapor. Although these gases make up only0.25 percent of the atmosphere by volume, theyare responsible for increasing the average tem-perature of the Earth from O OF (the temperature itwould be without these natural greenhouse gases)to 59 oF. The evolution of such an atmosphereoffered the appropriate conditions for the devel-opment of life on Earth. Humans have added moreCO2 and other greenhouse gases (CH4, N2O, andCFCS) to the atmosphere over the past 100 years.These gases effectively trap the heat that wouldnormally be radiated from the earth into space.Instead, heat is reflected back to the Earth, andboth the surface and the lower atmosphere getwarmer-causing global warming. This green-house effect is illustrated in fig. 2-2.
An international panel of scientists was estab-lished in 1988 to assess potential climate changeand its impacts. This Intergovernmental Panel onClimate Change (IPCC) includes more than 50countries, and operates under the aegis of theWorld Meteorological Organization and the UnitedNations Environment Program. IPCC issued areport in 1990 and an update in 1992 (44, 45) that
represent the best scientific assessment to dateabout climate change and its causes. IPCCscientists agree on the basic atmospheric mecha-nisms that make the planet a greenhouse. Theyalso concur that human activities, such as burningfossil fuel, deforestation, and agriculture, haveincreased the rate at which greenhouse gases areemitted to the atmosphere, and that the concentra-tions of those gases in the atmosphere areincreasing.
WHAT CHANGES IN CLIMATEARE PREDICTED?5
M Carbon Dioxide and OtherGreenhouse Gases
In contrast to measurements of temperature andprecipitation, which do not reveal clear trends,measurements of greenhouse gases show signifi-cant, steady increases over the past century.6 Forexample, the concentration of atmospheric C02,the most important greenhouse gas (other thanwater vapor), has been systematically monitortedsince 1958 at the Mauna Loa Observatory inHawaii. 7 It has been increasing steadily for thepast 35 years. Data from air bubbles in ice coresshow that preindustrial atmospheric C02 concen-trations were 280 parts per million (ppm); in1990, the concentration had increased by morethan 25 percent to an annual average of 353 ppmand is increasing at 0.5 percent per year (see fig.2-3, lower data points). Seventy to 90 percent ofthe C02 added to the atmosphere today (about 8
4 This section briefly summarizes the mechanisms and the greenhouse gases that contribute to the greenhouse effect. For a more detailedtreatment of climate change, see chapter 2 of OTA’s previous report on clixnate change, Changing by Degrees (88). That report also examineshow the United States and other countries could reduce emissions that contribute to climate change,
s ‘l’he predictions given throughout this section are based on an equivalent doubling by 2025 to 2050 of greenhouse gas concentrations fkompreindustrial levels. In additioq the predictions refer to a future equilibrium climuk-that is, one in which the climate has Mshed chaqingand the climate system has arrivtxi at a new bahce-rather than the rrun.sient climute, or intermediate stage, that occurs as climate changeis underway. Scientists debate whether the climate will reach a new equilibrium or whdher we are instead entering an era of continuous change.Equilibrium may not be reached for centuries. (J. Mahhnaq Director, Geophysical Fluid Dynamics Laboratory, Princeton University, July 28,1993, at a briefing sponsored by the World Resources Institute and the National Oceanic and Atmospheric Administration.)
s For a mm de~~ discussion of the emissions and effects of gKxXhOuSe -s, ~ r~~m 88.7 COZ is responsible for about 70 percent of the radiative forcing (heat trapping) caused by greenhouse gases h the 1980s.
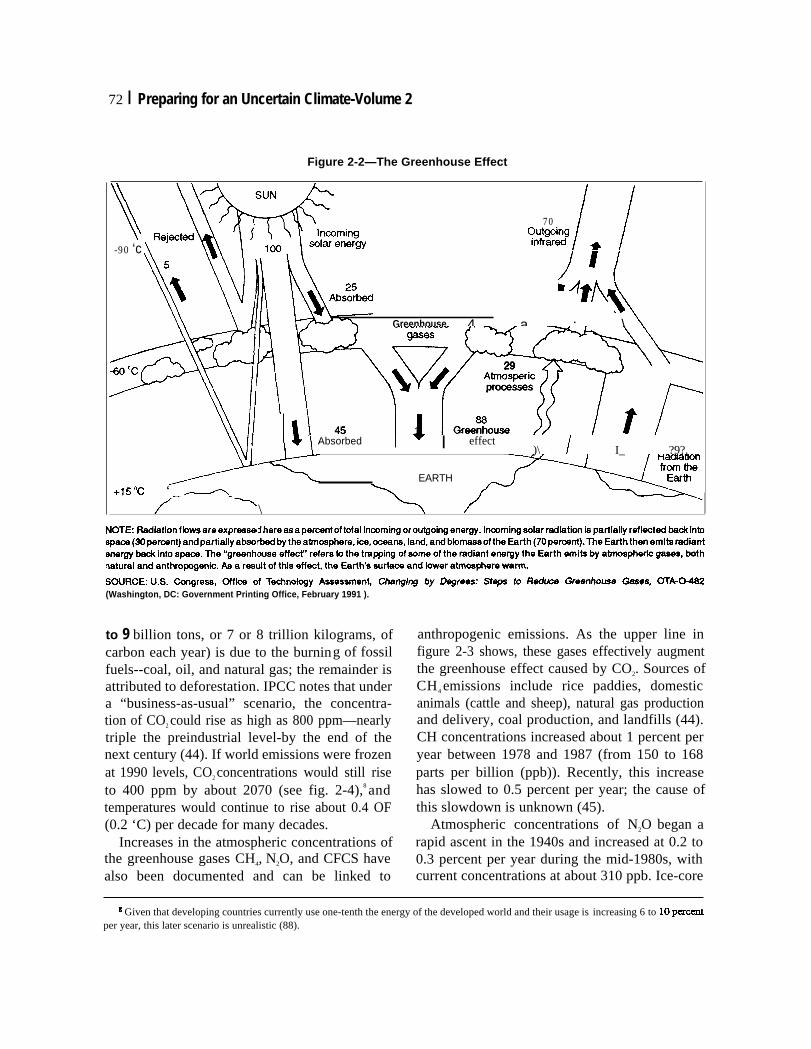
72 I Preparing for an Uncertain Climate-Volume 2
Figure 2-2—The Greenhouse Effect
\70
C#ttimg
-90 ‘c Ii
4 a ; \\
Greenhousen~gases “k\v/ 29Atrnospencprocesses
1Sa
Greenhouse d’J4! 45Absorbed w I effect
)\ / I_ ?9?.
EARTH+15°c ‘
\
(Washington, DC: Government Printing Office, February 1991 ).
to 9 billion tons, or 7 or 8 trillion kilograms, ofcarbon each year) is due to the burning of fossilfuels--coal, oil, and natural gas; the remainder isattributed to deforestation. IPCC notes that undera “business-as-usual” scenario, the concentra-tion of CO2 could rise as high as 800 ppm—nearlytriple the preindustrial level-by the end of thenext century (44). If world emissions were frozenat 1990 levels, CO2 concentrations would still riseto 400 ppm by about 2070 (see fig. 2-4),8 andtemperatures would continue to rise about 0.4 OF(0.2 ‘C) per decade for many decades.
Increases in the atmospheric concentrations ofthe greenhouse gases CH4, N2O, and CFCS havealso been documented and can be linked to
anthropogenic emissions. As the upper line infigure 2-3 shows, these gases effectively augmentthe greenhouse effect caused by CO2. Sources ofCH4 emissions include rice paddies, domesticanimals (cattle and sheep), natural gas productionand delivery, coal production, and landfills (44).CH concentrations increased about 1 percent peryear between 1978 and 1987 (from 150 to 168parts per billion (ppb)). Recently, this increasehas slowed to 0.5 percent per year; the cause ofthis slowdown is unknown (45).
Atmospheric concentrations of N2O began arapid ascent in the 1940s and increased at 0.2 to0.3 percent per year during the mid-1980s, withcurrent concentrations at about 310 ppb. Ice-core
g Given that developing countries currently use one-tenth the energy of the developed world and their usage is increasing 6 to loperecntper year, this later scenario is unrealistic (88).
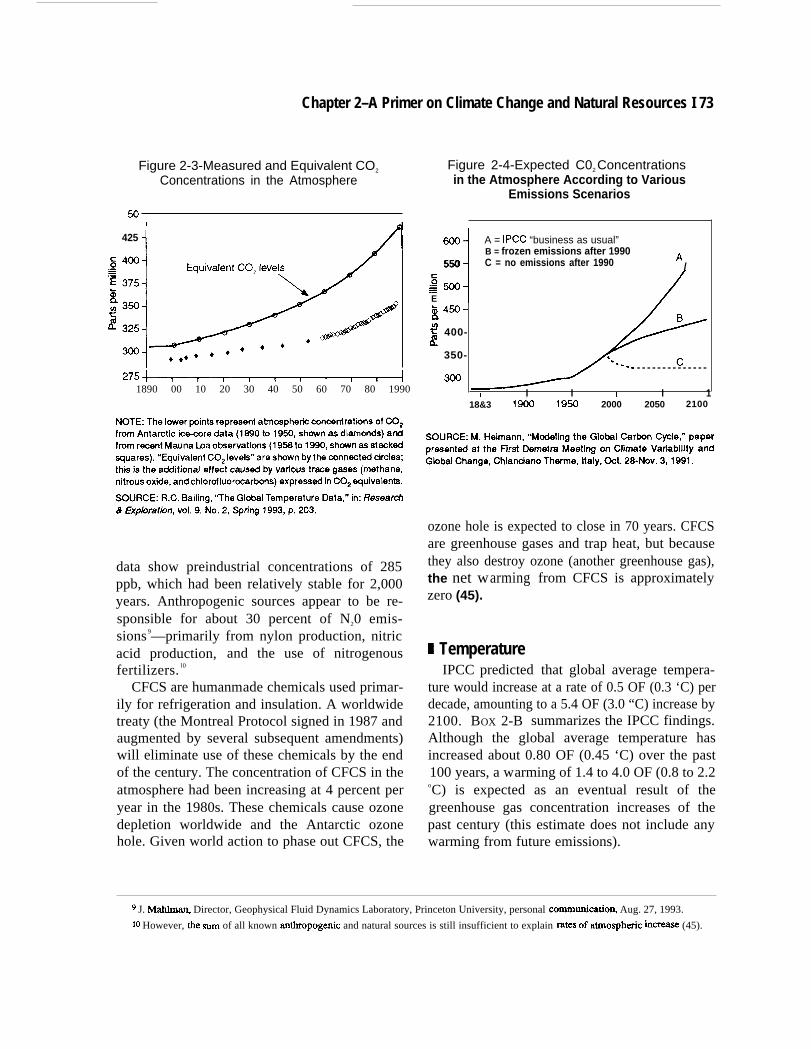
Chapter 2–A Primer on Climate Change and Natural Resources I 73
Figure 2-3-Measured and Equivalent CO2
Concentrations in the AtmosphereFigure 2-4-Expected C02 Concentrationsin the Atmosphere According to Various
Emissions Scenarios
425i
I d
/1
275~1890 00 10 20 30 40 50 60 70 80 1990
data show preindustrial concentrations of 285ppb, which had been relatively stable for 2,000years. Anthropogenic sources appear to be re-sponsible for about 30 percent of N20 emis-sions 9—primarily from nylon production, nitricacid production, and the use of nitrogenousfertilizers. l0
CFCS are humanmade chemicals used primar-ily for refrigeration and insulation. A worldwidetreaty (the Montreal Protocol signed in 1987 andaugmented by several subsequent amendments)will eliminate use of these chemicals by the endof the century. The concentration of CFCS in theatmosphere had been increasing at 4 percent peryear in the 1980s. These chemicals cause ozonedepletion worldwide and the Antarctic ozonehole. Given world action to phase out CFCS, the
‘1 A = IPCC “business as usual”B = frozen emissions after 1990
550 C = no emissions after 1990 A/
$500E ig 450-
: 400-a
350-- - - - - - - - - - - - - -
1 I I I I 118&3 Iti 1960 2000 2050 2100
ozone hole is expected to close in 70 years. CFCSare greenhouse gases and trap heat, but becausethey also destroy ozone (another greenhouse gas),the net warmingzero (45).
I TemperatureIPCC predicted
from CFCS is approximately
that global average tempera-ture would increase at a rate of 0.5 OF (0.3 ‘C) perdecade, amounting to a 5.4 OF (3.0 “C) increase by2100. BOX 2-B summarizes the IPCC findings.Although the global average temperature hasincreased about 0.80 OF (0.45 ‘C) over the past100 years, a warming of 1.4 to 4.0 OF (0.8 to 2.2
oC) is expected as an eventual result of thegreenhouse gas concentration increases of thepast century (this estimate does not include anywarming from future emissions).
g J. Mahlmaq Director, Geophysical Fluid Dynamics Laboratory, Princeton University, personal cornmunicatio~ Aug. 27, 1993.
10 However, tie sum of all known anthropogenic and natural sources is still insufficient to explain rates of atmosphtic k~w (45).
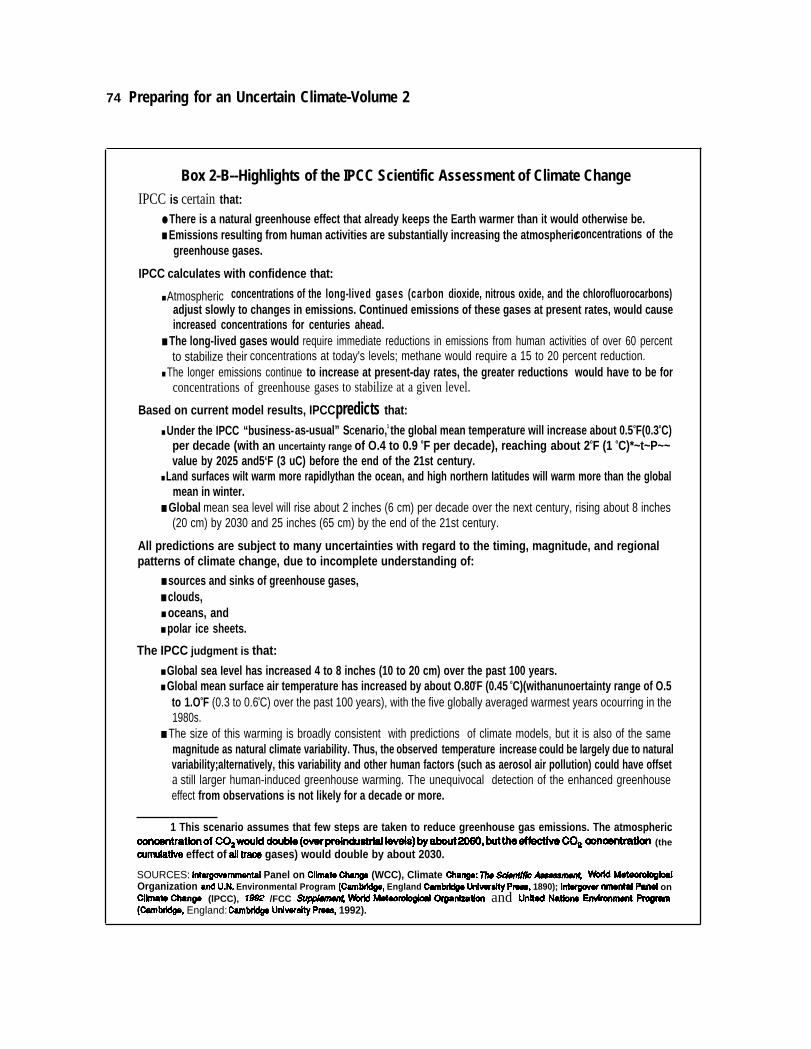
74 Preparing for an Uncertain Climate-Volume 2
Box 2-B--Highlights of the IPCC Scientific Assessment of Climate ChangeIPCC is certain that:
● There is a natural greenhouse effect that already keeps the Earth warmer than it would otherwise be.■ Emissions resulting from human activities are substantially increasing the atmosphericconcentrations of the
greenhouse gases.
IPCC calculates with confidence that:
■ Atmospheric concentrations of the long-lived gases (carbon dioxide, nitrous oxide, and the chlorofluorocarbons)adjust slowly to changes in emissions. Continued emissions of these gases at present rates, would causeincreased concentrations for centuries ahead.
■ The long-lived gases would require immediate reductions in emissions from human activities of over 60 percentto stabilize their concentrations at today's levels; methane would require a 15 to 20 percent reduction.
■ The longer emissions continue to increase at present-day rates, the greater reductions would have to be forconcentrations of greenhouse gases to stabilize at a given level.
Based on current model results, IPCC predicts that:
as-usual” SCenario,1 the global mean temperature will increase about 0.5oF(0.3oC)■ Under the IPCC “business-per decade (with an uncertainty range of O.4 to 0.9 oF per decade), reaching about 2oF (1 oC)*~t~P~~value by 2025 and5‘F (3 uC) before the end of the 21st century.
■ Land surfaces wilt warm more rapidlythan the ocean, and high northern Iatitudes will warm more than the globalmean in winter.
■ Global mean sea level will rise about 2 inches (6 cm) per decade over the next century, rising about 8 inches(20 cm) by 2030 and 25 inches (65 cm) by the end of the 21st century.
All predictions are subject to many uncertainties with regard to the timing, magnitude, and regionalpatterns of climate change, due to incomplete understanding of:
■ sources and sinks of greenhouse gases,■ clouds,■ oceans, and■ polar ice sheets.
The IPCC judgment is that:
■ Global sea Ievel has increased 4 to 8 inches (10 to 20 cm) over the past 100 years.■ Global mean surface air temperature has increased by about O.80oF (0.45 oC)(withanunoertainty range of O.5
to 1.OoF (0.3 to 0.6oC) over the past 100 years), with the five globally averaged warmest years ocourring in the1980s.
■ The size of this warming is broadly consistent with predictions of climate models, but it is also of the samemagnitude as natural climate variability. Thus, the observed temperature increase could be largely due to naturalvariability;alternatively, this variability and other human factors (such as aerosol air pollution) could have offseta still larger human-induced greenhouse warming. The unequivocal detection of the enhanced greenhouseeffect from observations is not likely for a decade or more.
1 This scenario assumes that few steps are taken to reduce greenhouse gas emissions. The atmosphericoonoentrationof COawouid doubie(ovwrpreindustdai leve18)byabout2060, buttheeffeotlve (x)a OOIlwltratbn (theoumuiative effect of aii trace gases) would double by about 2030.
SOURCES: Intargcwemmental Panel on Cllmate Ohanga (WCC), Climate Cha~: 7he SC#WMC Ausssm@ Wudd MoteOroIOgiealOrganization and U.N. Environmental Program (Cambddga, England Camtxktgo Unkrdty Prea6, 1890); Inter@vu nmental Pad onClknata Changa (lPCC), f9# /FCC Su@wn@ H Mdaordogicd Orgadzatlon and lbhd NatkMs Env&onmont Progfam(CambMgO, England: Cam- Univwsityf%ess, 1992).
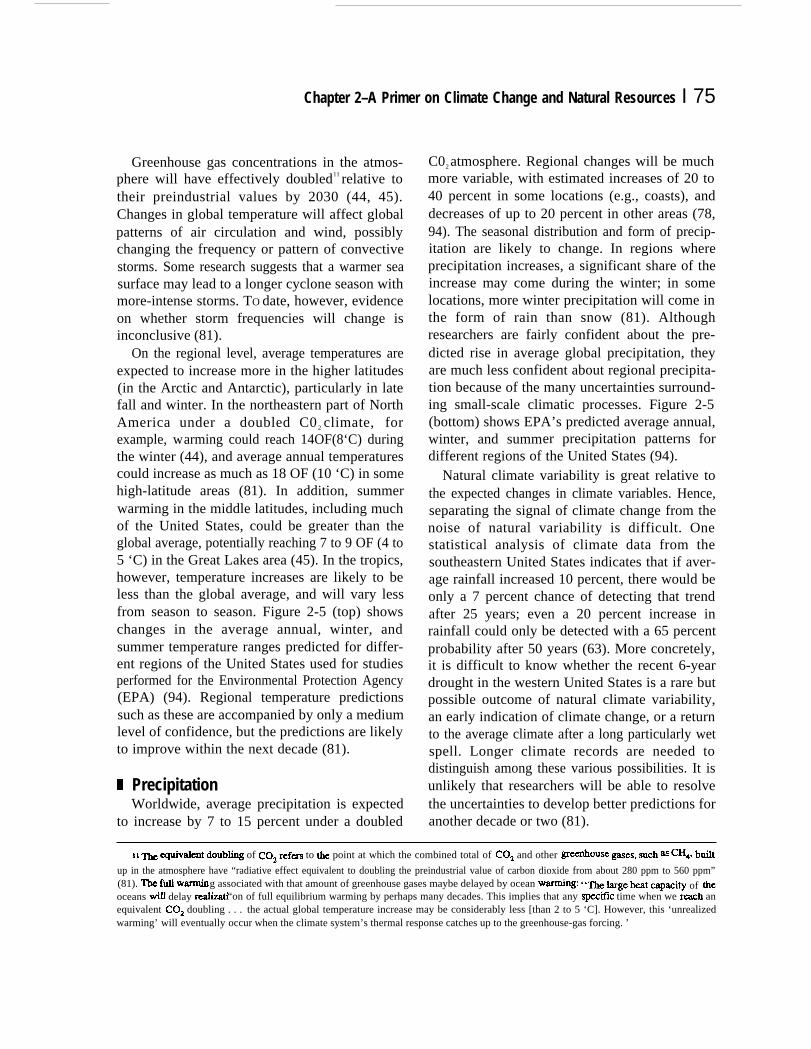
Chapter 2–A Primer on Climate Change and Natural Resources I 75
Greenhouse gas concentrations in the atmos-phere will have effectively doubled11 relative totheir preindustrial values by 2030 (44, 45).Changes in global temperature will affect globalpatterns of air circulation and wind, possiblychanging the frequency or pattern of convectivestorms. Some research suggests that a warmer seasurface may lead to a longer cyclone season withmore-intense storms. TO date, however, evidenceon whether storm frequencies will change isinconclusive (81).
On the regional level, average temperatures areexpected to increase more in the higher latitudes(in the Arctic and Antarctic), particularly in latefall and winter. In the northeastern part of NorthAmerica under a doubled C0 2 climate, forexample, warming could reach 14OF(8‘C) duringthe winter (44), and average annual temperaturescould increase as much as 18 OF (10 ‘C) in somehigh-latitude areas (81). In addition, summerwarming in the middle latitudes, including muchof the United States, could be greater than theglobal average, potentially reaching 7 to 9 OF (4 to5 ‘C) in the Great Lakes area (45). In the tropics,however, temperature increases are likely to beless than the global average, and will vary lessfrom season to season. Figure 2-5 (top) showschanges in the average annual, winter, andsummer temperature ranges predicted for differ-ent regions of the United States used for studiesperformed for the Environmental Protection Agency(EPA) (94). Regional temperature predictionssuch as these are accompanied by only a mediumlevel of confidence, but the predictions are likelyto improve within the next decade (81).
I PrecipitationWorldwide, average precipitation is expected
to increase by 7 to 15 percent under a doubled
C02 atmosphere. Regional changes will be muchmore variable, with estimated increases of 20 to40 percent in some locations (e.g., coasts), anddecreases of up to 20 percent in other areas (78,94). The seasonal distribution and form of precip-itation are likely to change. In regions whereprecipitation increases, a significant share of theincrease may come during the winter; in somelocations, more winter precipitation will come inthe form of rain than snow (81). Althoughresearchers are fairly confident about the pre-dicted rise in average global precipitation, theyare much less confident about regional precipita-tion because of the many uncertainties surround-ing small-scale climatic processes. Figure 2-5(bottom) shows EPA’s predicted average annual,winter, and summer precipitation patterns fordifferent regions of the United States (94).
Natural climate variability is great relative tothe expected changes in climate variables. Hence,separating the signal of climate change from thenoise of natural variability is difficult. Onestatistical analysis of climate data from thesoutheastern United States indicates that if aver-age rainfall increased 10 percent, there would beonly a 7 percent chance of detecting that trendafter 25 years; even a 20 percent increase inrainfall could only be detected with a 65 percentprobability after 50 years (63). More concretely,it is difficult to know whether the recent 6-yeardrought in the western United States is a rare butpossible outcome of natural climate variability,an early indication of climate change, or a returnto the average climate after a long particularly wetspell. Longer climate records are needed todistinguish among these various possibilities. It isunlikely that researchers will be able to resolvethe uncertainties to develop better predictions foranother decade or two (81).
11 ~ ~~v~e~ doub~ of COZ mf~ to the point at which the combined total of C02 and other greenhouse g~es) such as ~4) b~t
up in the atmosphere have “radiative effect equivalent to doubling the preindustrial value of carbon dioxide from about 280 ppm to 560 ppm”(81). The full WUmiXlg associated with that amount of greenhouse gases maybe delayed by oceanq: “me ~ge ~t Capaciw of theoceans will delay ~“on of full equilibrium warming by perhaps many decades. This implies that any spec~lc time when we reach anequivalent COZ doubling . . . the actual global temperature increase may be considerably less [than 2 to 5 ‘C]. However, this ‘unrealizedwarming’ will eventually occur when the climate system’s thermal response catches up to the greenhouse-gas forcing. ’
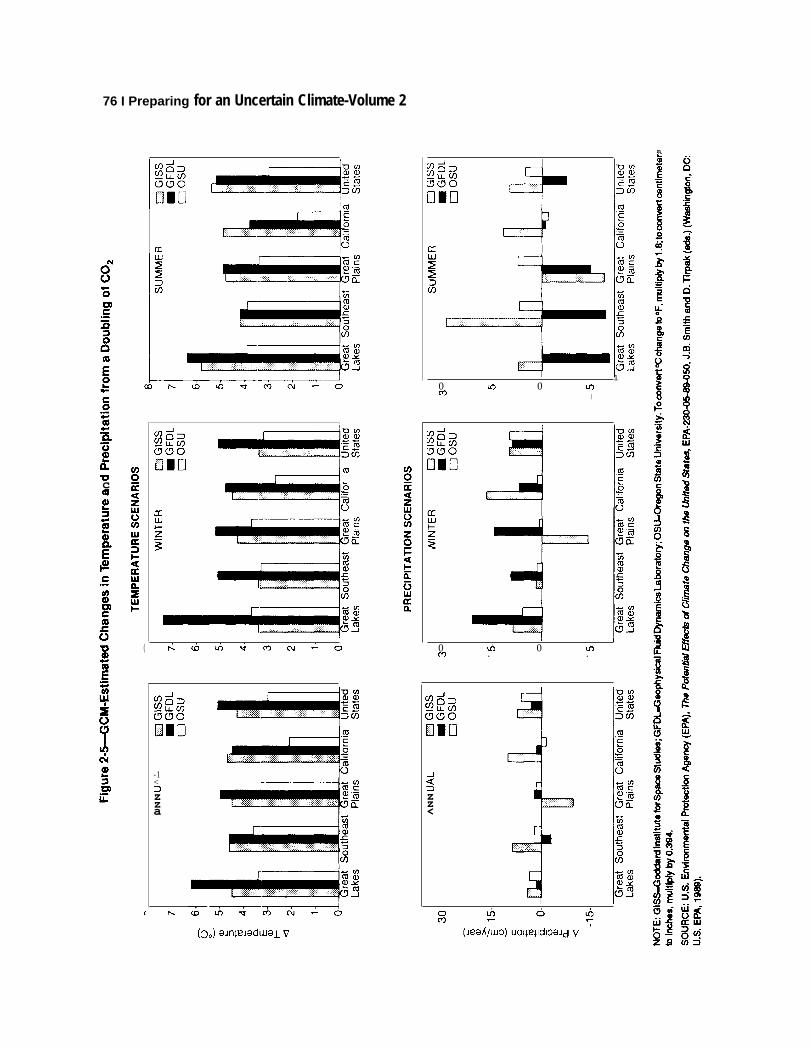
76 I Preparing for an Uncertain Climate-Volume 2
m
==$u u I
1,0 m 0co
mI
ucm
c.-
I, I0 mm
0 m. .(
Elan
-1<3zza
<3zz<
r%
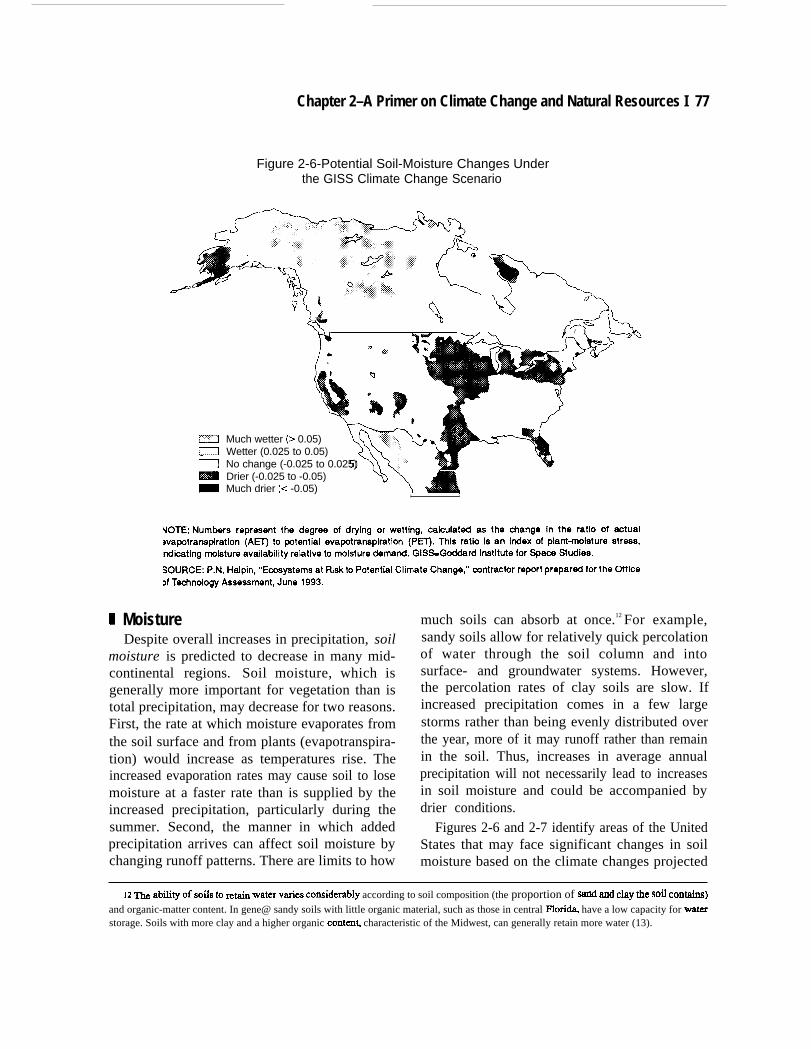
Chapter 2–A Primer on Climate Change and Natural Resources I 77
Figure 2-6-Potential Soil-Moisture Changes Underthe GISS Climate Change Scenario
\-l 1 / ) [
\-
—Much wetter (> 0.05)Wetter (0.025 to 0.05)No change (-0.025 to 0.025) 4Drier (-0.025 to -0.05) .&!/Much drier (< -0.05) ‘i
) \
B MoistureDespite overall increases in precipitation, soil
moisture is predicted to decrease in many mid-continental regions. Soil moisture, which isgenerally more important for vegetation than istotal precipitation, may decrease for two reasons.First, the rate at which moisture evaporates fromthe soil surface and from plants (evapotranspira-tion) would increase as temperatures rise. Theincreased evaporation rates may cause soil to losemoisture at a faster rate than is supplied by theincreased precipitation, particularly during thesummer. Second, the manner in which addedprecipitation arrives can affect soil moisture bychanging runoff patterns. There are limits to how
much soils can absorb at once.12 For example,sandy soils allow for relatively quick percolationof water through the soil column and intosurface- and groundwater systems. However,the percolation rates of clay soils are slow. Ifincreased precipitation comes in a few largestorms rather than being evenly distributed overthe year, more of it may runoff rather than remainin the soil. Thus, increases in average annualprecipitation will not necessarily lead to increasesin soil moisture and could be accompanied bydrier conditions.
Figures 2-6 and 2-7 identify areas of the UnitedStates that may face significant changes in soilmoisture based on the climate changes projected
12 ~ a~~ of SOiIS to rer.ain wat~ vties Comi(,terably according to soil composition (the proportion of Wld md Chiy the SOfl COnblh)and organic-matter content. In gene@ sandy soils with little organic material, such as those in central Florih have a low capacity for waterstorage. Soils with more clay and a higher organic content characteristic of the Midwest, can generally retain more water (13).
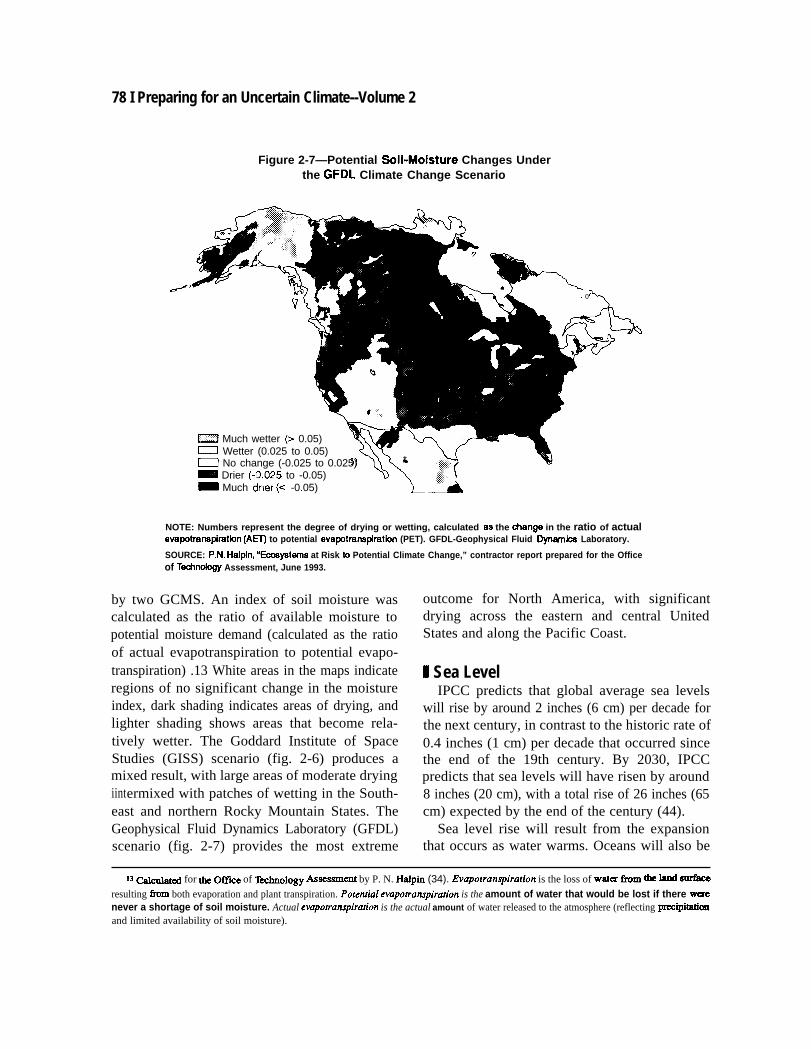
78 I Preparing for an Uncertain Climate--Volume 2
Figure 2-7—Potential Soil-Mokture Changes Underthe GFDL Climate Change Scenario
y~
—CZ.2 Much wetter (> 0.05)0 Wetter (0.025 to 0.05)
u
U No change (-0.025 to 0.025) *
_ Drier (-[3.025 to -0.05)_ Much drier (< -0.05)
o
NOTE: Numbers represent the degree of drying or wetting, calculated aa the change in the ratio of actualevapotranspkatbn (AE~ to potential evapotranspiration (PET). GFDL-Geophysical Fluid Dynamles Laboratory.
SOURCE: P.N. Halpin, ‘Eeosysterns at Risk to Potential Climate Change,” contractor report prepared for the Officeof Tdnolegy Assessment, June 1993.
by two GCMS. An index of soil moisture wascalculated as the ratio of available moisture topotential moisture demand (calculated as the ratioof actual evapotranspiration to potential evapo-transpiration) .13 White areas in the maps indicateregions of no significant change in the moistureindex, dark shading indicates areas of drying, andlighter shading shows areas that become rela-tively wetter. The Goddard Institute of SpaceStudies (GISS) scenario (fig. 2-6) produces amixed result, with large areas of moderate drying
ermixed with patches of wetting in the South-iinteast and northern Rocky Mountain States. TheGeophysical Fluid Dynamics Laboratory (GFDL)scenario (fig. 2-7) provides the most extreme
outcome for North America, with significantdrying across the eastern and central UnitedStates and along the Pacific Coast.
M Sea LevelIPCC predicts that global average sea levels
will rise by around 2 inches (6 cm) per decade forthe next century, in contrast to the historic rate of0.4 inches (1 cm) per decade that occurred sincethe end of the 19th century. By 2030, IPCCpredicts that sea levels will have risen by around8 inches (20 cm), with a total rise of 26 inches (65cm) expected by the end of the century (44).
Sea level rise will result from the expansionthat occurs as water warms. Oceans will also be
13 ~~~~ for ~ OffiCC of mchnolo~ ~ses~ent by P. N. Halpin (34). Evapotranspiration is the loss of water fXOm * H _
resulting h both evaporation and plant transpiration. PotentiuZ evapotranspiration is the amount of water that would be lost if there werenever a shortage of soil moisture. Actual evapotranspiration is the actual amount of water released to the atmosphere (reflecting peeipitationand limited availability of soil moisture).
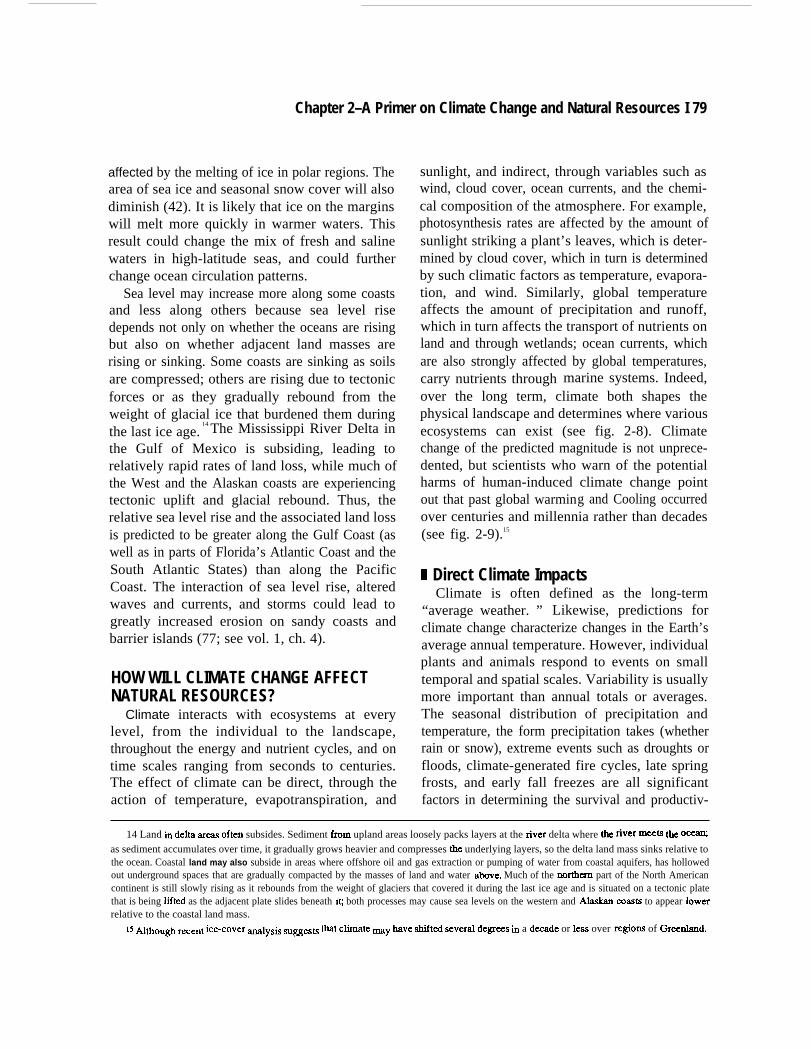
Chapter 2–A Primer on Climate Change and Natural Resources I 79
affected by the melting of ice in polar regions. Thearea of sea ice and seasonal snow cover will alsodiminish (42). It is likely that ice on the marginswill melt more quickly in warmer waters. Thisresult could change the mix of fresh and salinewaters in high-latitude seas, and could furtherchange ocean circulation patterns.
Sea level may increase more along some coastsand less along others because sea level risedepends not only on whether the oceans are risingbut also on whether adjacent land masses arerising or sinking. Some coasts are sinking as soilsare compressed; others are rising due to tectonicforces or as they gradually rebound from theweight of glacial ice that burdened them duringthe last ice age.
14 The Mississippi River Delta in
the Gulf of Mexico is subsiding, leading torelatively rapid rates of land loss, while much ofthe West and the Alaskan coasts are experiencingtectonic uplift and glacial rebound. Thus, therelative sea level rise and the associated land lossis predicted to be greater along the Gulf Coast (aswell as in parts of Florida’s Atlantic Coast and theSouth Atlantic States) than along the PacificCoast. The interaction of sea level rise, alteredwaves and currents, and storms could lead togreatly increased erosion on sandy coasts andbarrier islands (77; see vol. 1, ch. 4).
HOW WILL CLIMATE CHANGE AFFECTNATURAL RESOURCES?
Climate interacts with ecosystems at everylevel, from the individual to the landscape,throughout the energy and nutrient cycles, and ontime scales ranging from seconds to centuries.The effect of climate can be direct, through theaction of temperature, evapotranspiration, and
sunlight, and indirect, through variables such aswind, cloud cover, ocean currents, and the chemi-cal composition of the atmosphere. For example,photosynthesis rates are affected by the amount ofsunlight striking a plant’s leaves, which is deter-mined by cloud cover, which in turn is determinedby such climatic factors as temperature, evapora-tion, and wind. Similarly, global temperatureaffects the amount of precipitation and runoff,which in turn affects the transport of nutrients onland and through wetlands; ocean currents, whichare also strongly affected by global temperatures,carry nutrients through marine systems. Indeed,over the long term, climate both shapes thephysical landscape and determines where variousecosystems can exist (see fig. 2-8). Climatechange of the predicted magnitude is not unprece-dented, but scientists who warn of the potentialharms of human-induced climate change pointout that past global warming and Cooling occurredover centuries and millennia rather than decades(see fig. 2-9).15
# Direct Climate ImpactsClimate is often defined as the long-term
“average weather. ” Likewise, predictions forclimate change characterize changes in the Earth’saverage annual temperature. However, individualplants and animals respond to events on smalltemporal and spatial scales. Variability is usuallymore important than annual totals or averages.The seasonal distribution of precipitation andtemperature, the form precipitation takes (whetherrain or snow), extreme events such as droughts orfloods, climate-generated fire cycles, late springfrosts, and early fall freezes are all significantfactors in determining the survival and productiv-
14 Land in del~ U- ofh subsides. Sediment horn upland areas loosely packs layers at the river delta where tie fiv= HW tie o-as sediment accumulates over time, it gradually grows heavier and compresses the underlying layers, so the delta land mass sinks relative tothe ocean. Coastal land may also subside in areas where offshore oil and gas extraction or pumping of water from coastal aquifers, has hollowedout underground spaces that are gradually compacted by the masses of land and water alwve. Much of the northexn part of the North Americancontinent is still slowly rising as it rebounds from the weight of glaciers that covered it during the last ice age and is situated on a tectonic platethat is being lifted as the adjacent plate slides beneath it both processes may cause sea levels on the western and Alaslmn c4Msts to appear lowerrelative to the coastal land mass.
IS ~~ou~ r=ent icecover ~ys~ ~w=~ tit c~te my ~ve ~t~ sever~ de~ms ti a d-de or less over NgiODS of G~tid.
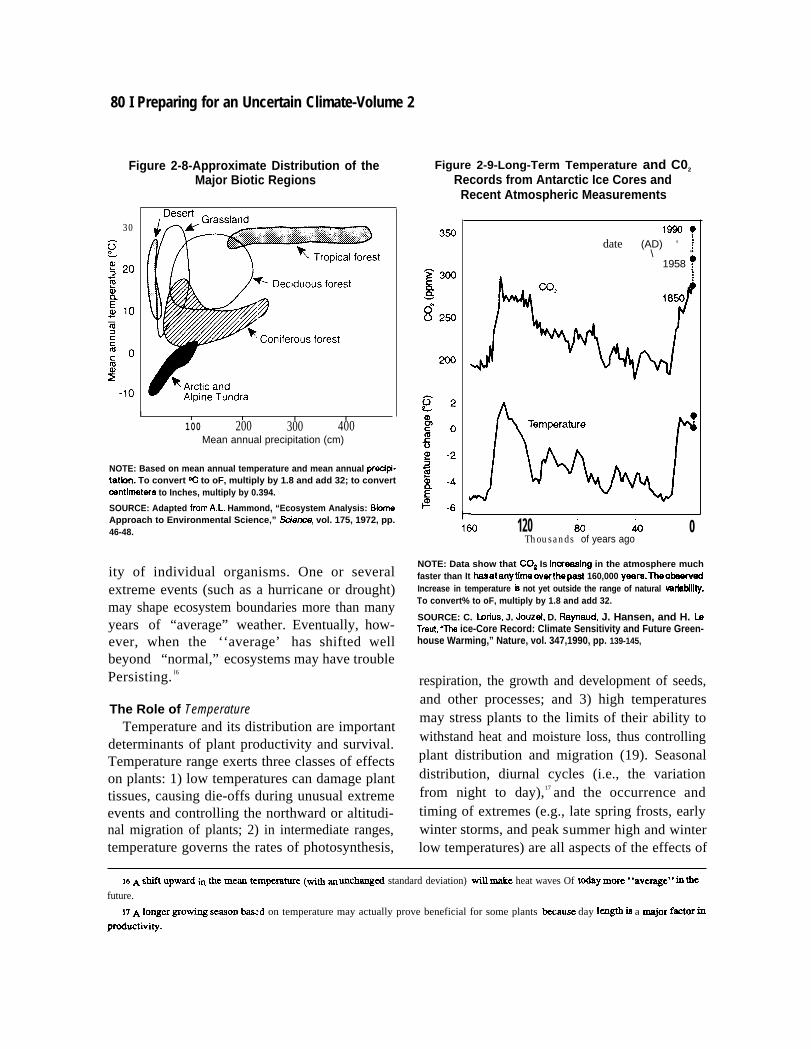
80 I Preparing for an Uncertain Climate-Volume 2
Figure 2-8-Approximate Distribution of the
30
Major Biotic Regions
I [ I I I
100 200 300 400Mean annual precipitation (cm)
NOTE: Based on mean annual temperature and mean annual predpi-tatbn. To convert % to oF, multiply by 1.8 and add 32; to converteentlrneters to Inches, multiply by 0.394.
SOURCE: Adapted fmm A.L. Hammond, “Ecosystem Analysis: BiomeApproach to Environmental Science,” ScJencw, vol. 175, 1972, pp.46-48.
ity of individual organisms. One or severalextreme events (such as a hurricane or drought)may shape ecosystem boundaries more than manyyears of “average” weather. Eventually, how-ever, when the ‘‘average’ has shifted wellbeyond “normal,” ecosystems may have troublePersisting. l6
The Role of TemperatureTemperature and its distribution are important
determinants of plant productivity and survival.Temperature range exerts three classes of effectson plants: 1) low temperatures can damage planttissues, causing die-offs during unusual extremeevents and controlling the northward or altitudi-nal migration of plants; 2) in intermediate ranges,temperature governs the rates of photosynthesis,
Figure 2-9-Long-Term Temperature and C02
Records from Antarctic Ice Cores andRecent Atmospheric Measurements
1990 ydate (AD) ‘ j
\ “1958 :
t-160 120 & i 0
Thousands of years ago
NOTE: Data show that COZ Is Inereaeing in the atmosphere muchfaster than It haaatanytlme overthepast 160,000 years.llwsobservedIncrease in temperature la not yet outside the range of natural varkMty.To convert% to oF, multiply by 1.8 and add 32.
SOURCE: C. Lorius, J. Jouzel, D. Raynaud, J. Hansen, and H. kTreut, ‘The ice-Core Record: Climate Sensitivity and Future Green-house Warming,” Nature, vol. 347,1990, pp. 139-145,
respiration, the growth and development of seeds,and other processes; and 3) high temperaturesmay stress plants to the limits of their ability towithstand heat and moisture loss, thus controllingplant distribution and migration (19). Seasonaldistribution, diurnal cycles (i.e., the variationfrom night to day),17 and the occurrence andtiming of extremes (e.g., late spring frosts, earlywinter storms, and peak summer high and winterlow temperatures) are all aspects of the effects of
16A s~t upw~d ~ be rne~ tcm~~me (with an unchan&d standard deviation) will UMke heat waves Of tOdSy mOm ‘av-~” h dlC
future.
17A loWer gro~ se~on bas<d on temperature may actually prove beneficial for some plants beeause day hmgth is a mSjOr fSCtOI inpmduetivity.
Chapter 2–A Primer on Climate Change and Natural Resources 81
Box 2-C-Climate Change and Coastal Fisheries
BackgroundThe U.S. commercial, recreational, and sport fishing industries, worth an estimated $14 billion in 1986 (73),
rely on the health of nearshore and coastal areas (such as tidal marshes, coral reefs, seagrass beds, mangroveforests, estuaries, and banks). Two-thirds of the world’s fish catch, and many other marine species, depend oncoastal wetlands and estuaries for their survival (42). By far the greatest portion of U.S. commercial fisheriescatches, with the exception of those from Alaskan fisheries, are composed of estuarine-dependent species.Ongoing alterations of critical habitat (such as geographic fragmentation and pollution) may be exacerbated byclimate change.
Much is yet to be learned about the marine environment and the long-term effects that humans have on it.Understanding the breadth of environmental stresses that affect fish and coastal systems will be essential toforecasting how climate change may affect these valuable areas. During the 1970s and 1980s, populations ofmany commercially important estuarine-dependent fish plummeted. Human activities in the coastal zone arethought to have been responsible for many of the dramatic declines in fish populations. Overfishing has beenimplicated as a primary cause of the declines of some fish stocks, with some 42 percent of species in Americanwaters considered to be overfished (52). The Atlantic cod fishery of the Grand Banks area has all but collapsed,triggering industry-related layoffs (primarily in Canada) of more than 30,000 people (75). Migratory species suchas salmon, shad, herring, and striped bass have decreased due to a combination of habitat degradation andoverfishing. The Chesapeake Bay’s oyster harvest has declined 96 percent from the levels of 100 years ago dueto disease, over-exploitation, predators, and habitat degradation (18). Nearly half of the Chesapeake’s wetlandsand seagrass meadows, which serve as primary nursery habitat for many migratory species, have been destroyed.Such destruction will adversely affect future fish populations.
The fishing industry from Southern California to Alaska is experiencing similar troubles as a result ofoverfishing, the damming of spawning rivers, water-quality degradation from logging, and other anthropogenic
(Continued on next page)
temperature on plants. Length of the growing and indirect influences on animals. Higher-than-season is also very important, particularly foragricultural crops. Seed production generallyrequires a certain number of days with a tempera-ture above freezing, often expressed in terms ofdegree-days. At northern latitudes, the growingseason may not be long enough for some speciesto set seeds. Longer growing seasons in a warmerclimate could boost productivity of trees andother plants, especially those that could tolerateerratic spring and fall weather (e.g., early or latefrosts). Seeds of many tree species, includingconifers, need to be chilled for particular periodsbefore they will germinate (17, 21), so a shortenedcool season could be detrimental to such species.
In addition to the numerous effects of tempera-ture on vegetation, temperature exerts other direct
usual temperatures can adversely affect the repro-ductive success of many birds, mammals, andinsects (26). Increased water temperature limitsthe availability of oxygen in the water and, in turn,reduces the amount of oxygen available to fishand other aquatic organisms (87). For many fishspecies, ambient water temperature is critical forsurvival (see box 2-C). In addition, temperatureincreases can actually reduce the number ofspecies in a given ecological community (87),though total biomass may increase.
Warmer temperatures could allow some in-sects, including various agricultural pests, tosurvive winters farther north than they now do.For example, the potato leafhopper, which is apest on soybeans and other crops, now overwin-
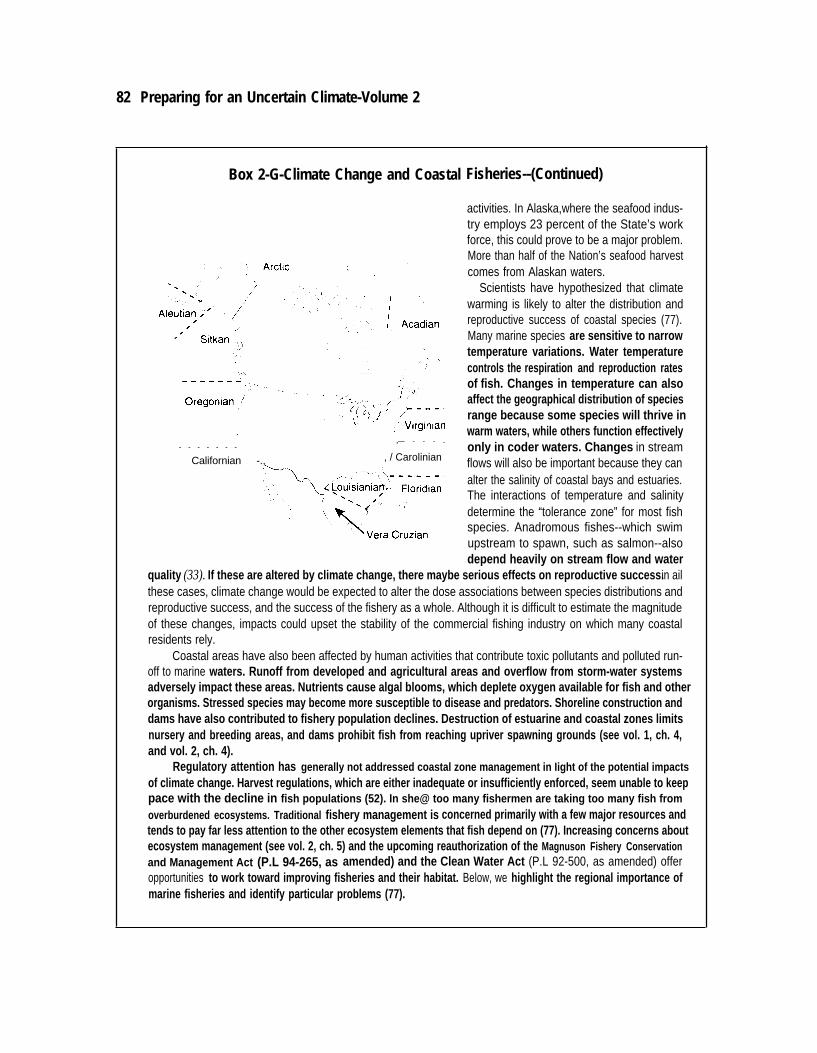
82 Preparing for an Uncertain Climate-Volume 2
Box 2-G-Climate Change and Coastal
,— - - - .- - - - - - -
Californian -., , / Carolinian
Fisheries--(Continued)
activities. In Alaska,where the seafood indus-try employs 23 percent of the State’s workforce, this could prove to be a major problem.More than half of the Nation’s seafood harvestcomes from Alaskan waters.
Scientists have hypothesized that climatewarming is likely to alter the distribution andreproductive success of coastal species (77).Many marine species are sensitive to narrowtemperature variations. Water temperaturecontrols the respiration and reproduction ratesof fish. Changes in temperature can alsoaffect the geographical distribution of speciesrange because some species will thrive inwarm waters, while others function effectivelyonly in coder waters. Changes in streamflows will also be important because they canalter the salinity of coastal bays and estuaries.The interactions of temperature and salinitydetermine the “tolerance zone” for most fishspecies. Anadromous fishes--which swimupstream to spawn, such as salmon--alsodepend heavily on stream flow and water
quality (33). If these are altered by climate change, there maybe serious effects on reproductive success. in ailthese cases, climate change would be expected to alter the dose associations between species distributions andreproductive success, and the success of the fishery as a whole. Although it is difficult to estimate the magnitudeof these changes, impacts could upset the stability of the commercial fishing industry on which many coastalresidents rely.
Coastal areas have also been affected by human activities that contribute toxic pollutants and polluted run-off to marine waters. Runoff from developed and agricultural areas and overflow from storm-water systemsadversely impact these areas. Nutrients cause algal blooms, which deplete oxygen available for fish and otherorganisms. Stressed species may become more susceptible to disease and predators. Shoreline construction anddams have also contributed to fishery population declines. Destruction of estuarine and coastal zones limitsnursery and breeding areas, and dams prohibit fish from reaching upriver spawning grounds (see vol. 1, ch. 4,and vol. 2, ch. 4).
Regulatory attention has generally not addressed coastal zone management in Iight of the potential impactsof climate change. Harvest regulations, which are either inadequate or insufficiently enforced, seem unable to keeppace with the decline in fish populations (52). In she@ too many fishermen are taking too many fish fromoverburdened ecosystems. Traditional fishery management is concerned primarily with a few major resources andtends to pay far less attention to the other ecosystem elements that fish depend on (77). Increasing concerns aboutecosystem management (see vol. 2, ch. 5) and the upcoming reauthorization of the Magnuson Fishery Conservationand Management Act (P.L 94-265, as amended) and the Clean Water Act (P.L 92-500, as amended) offeropportunities to work toward improving fisheries and their habitat. Below, we highlight the regional importance ofmarine fisheries and identify particular problems (77).
Chapter 2–A Primer on Climate Change and Natural Resources 83
Regional Characteristics of the U.S. Coastal Marine Fisheries
Acadian-Boreal (Newfoundland and southern Greenland to Cape Cod, MA)
■ Cultural: Indigenous coastal people-New England dam diggers.■ Fishing:
■
—7 percent of the Nation’s commercial fisheries--estimated value, $250 million in 1990--multispecies trawl fishery
--32 percent of species estuarine-dependent-important species include hard dam, soft dam, American lobster, sea scallops, northern shrimp, Atlantic cod,
butterfish, cusk, flounder, haddock, red and white hake (sliver hake)–Atlantic cod most commercially important fish in 1989 (valued at $45 million)
Common problems:-only remaining self-supporting U.S. salmon runs are in Maine-lobsters are overharvested-northern shrimp are at maximum harvest and subject to environmental variability, especially when waters
are warmer
Virginian-Mid Atlantic (Cape Cod, MA, to Cape Hatteras, NC)
■ Cultural:Indigenous coastal people--Chesapeake Bay watermen.■ Fishing:
--estimated value, $500 million in 1990—11 percent of the Nation’s commercial fisheries-most important species are blue crab and surf and ocean quahog-Chesapeake Bay fish: 87 percent are estuarine-dependent
Common problems:-region ‘is the most urbanized and densely populated in the United States--disease, overharvesting, predation, and pollution are rampant--responsible for reductions in harvestable
shellfish, forcing many watermen out of business--second to the Gulf of Mexico in the number of point sources of pollution--striped bass began a precipitous decline in 1973
Carolinian-south Atlantic (Cape Hatteras, NC, to Cape Canaveral, FL)
■ Fishing:-3 percent of the Nation’s commercial fisheries-estimated valued, $169 million in 1990-94 percent of species estuarine-dependent-over half of this harvest from estuarine-dependent species-most important species include Atlantic menhaden, blue crabs, and penaeid shrimp
■ Common problems:-application of pesticides and fertilizers to extensive commercially harvested forested wetlandsdegradation of shellfish habitat due to agricultural runoff and septic system overflow
Floridian-West Indian (Cape Canaveral to Key West, FL, and West Indies)
● Fishing:-values for individual species are not observed-important species include the Queen conch, spiny lobster, Nassau grouper, and more than 100 reef fishes
(Continued on next page)
84 Preparing for an Uncertain Climate--Volume 2
Box 2-C--Climate Change and Coastal Fisheries--(Continued)
■ Common problems:--growing human populations, greater demands, and technological improvements in catch-virtually all assessed reef-fish stocks are overharvested--major tropical storms, including hurricanes, generally affect the area
Louisiana-Gulf of Mexico (Northern Gulf of Mexico from Central West Florida to South Texas)● Fishing:
—17 percent of the Nation’s commercial fishery (with Vera Cruzian)--estimated value, $648 million in 1989--leading seafood producer among regions
■ Common problems:--subject to devastating floods, tornadoes, hurricanes and tropical storms, erosion, land subsidence, saltwater
encroachment, and sedimentation--second-fastest-growing population rate of all regions-more point sources of pollution than any other region-application of pesticides to agricultural lands is the highest among all regions
Vera Cruzian-West Indian (South Texas to Yucatan Peninsula)
■ Fishing:--fourth leading U.S. port in fisheries value-major commercial species are similar to those of the Gulf region
■ Common problems:-hurricanes and intense thunderstorms
California-subtropical Eastern Pacific (Southern California(LosAngeles basin) southward to Mexico andCentral America)
■ Fishing:-major commercial species include Pacific sardine, northern anchovies, and Jack mackerel
■ Common problems:-most wetlands already lost; restoration doubtful-low-lying coastal areas subject to sea level rise
Oregonian-Temperate Eastern Pacific (California north of Los Angeles to British Columbia)
■ Fishing:-estimated value, $337 million in 1989-ens-fifth of catch estuarine-dependent species, especially Pacific salmon (Chinook, coho, sockeye, pink and
chum)--commercial landings of salmon valued at $140 million-other important species include northern anchovies, Pacific sardine, Jack mackerel, and groundfish
(flatfishes, rockfish, including Pacific whiting, sable fish, Dover sole, widow reddish, and others)
■ Common problems:--confiicts among fishermen, the Fisheries Council, various States, Canada and foreign fisheries regarding
the allocation of resources-worsening freshwater (spawning) habitat has been the main cause of the salmon decline, and wild coho
stocks of the lower Columbia River were recently declared extinct
Sitkan-North Pacific (British Columbia to base of Alaska Peninsula)
■ Fishing:--56 percent of the Nation’s commercial landings of fish (with other Alaskan fisheries)
Chapter 2–A Primer on Climate Change and Natural Resources 85
--estimated value, $1.5 billion in 1990-5.4 billion pounds (2.5 billion kg) landed In 1990 (with other Alaskan fisheries)—76 percent of species estuarine-dependent--most important species include Pacific salmon, Pacific herring, Pacific halibut, Gulf groundfish (Pacific
cod, stablefish), king crab, and tanner crabs
■ Common problems:-some rookeries threatened by fishery operations-Exxon Valdez oil spill severely contaminated coastal areas
Arctic-Boraal/Arctic (Southeast Bering Sea to Chukchl and Beaufort Seas and Canadian archipelago)
Cultural:Coastal indigenous people--Eskimo, Aleute
fishing:-most important species include Pacific salmon, Alaska pollock, Pacific herring—Pacific salmon fisheries rank as the State’s largest nongovernmental employer-provides an integral part of Alaska’s native culture and heritage
Common problems:-acme stocks (chinook and echo) may be harmed by foreign high-seas catches, and some salmon may be
regionally overfished-destruction of spawning and rearing habitat-human population in this area is expected to increase by 380 percent between 1960 and 2010
Aleutian-North Pacific (Alaska Peninsula base to Aleutian and Pribilof Islands and Including southwestBering Sea)
■ Fishing:-estimated value of groundfish, $352 million in 1990-dominant groundfish groups are walleye pollock, flatfishes (Yellow sole, rocksole, other), Pacific cod, Atka
mackerel, and shrimp—Alaska king crab value, $88 million in 1990
■ Common problems:--The U.S. fishery for shrimp in Alaska is at a low level, and potential yields are not well-understood (91)
Insular-lndo Pacific (Tropical Indian and Pacific Oceans; not shown in figure)
■ Cultural: Coastal indigenous people--Papuan, Micronesia, and Hawaiian
■ Fishing:—7 percent of the Nation’s commercial flsheries taken in the Pacific United States and Hawaii-major species include invertebrates species (spiny and slipper lobsters; gold, bamboo and pinkcorals), bottom fish (snappers, jacks, groupers, Pacific armorhead), tropical tunas (yellowfin andskipjack), and albacore
■ Common problems:-coastal pollution-destructive fishery technologies (explosives, poison, etc.)--overfishing by foreign fleets--ambiguous application of Federal environmental laws
SOURCES: M.R. Chambers, ‘U.S. Coastal Habitat Degradation and Fishery Declines, " in: Transactions of the North American Wildlife andnatural Resources Conference (Washington, DC: The Wildlife Management Institute, In press); U.S. Department of Commerce, NationalOceanic and Atmospheric Administration (NOAA) National Marine Fisheries Service (NMFS), Our Living Oceans, The First Annual reporton the Status of the U.S. Living Marine Resources, NOAA Technical Memo, NMFS-F/SPO-1, 1991; C.G. Ray, G. McCormick-Ray, and F.M.Potter, Global Climate Change and the Coastal Zone: Evaluation of lmpacts on Marine Fisheries and Biodiversityof the U.S., contractorreport prepared for the Office of Technology Assessment, 1993.
86 I Preparing for an Uncertain Climate-Volume 2
infiltration, runoff, and evaporation)--directlyaffects plant growth through its role in photosyn-thesis. Although average annual precipitation isoften used to characterize climate zones, theseasonal distribution is more significant than theannual total. Adequate moisture during the grow-ing season is critical. Seeds need moisture togerminate, and young plants-both annuals andperennials--are often quite sensitive to drought.Vegetation may respond by defoliating, whichreduces water and nutrient demand, helpingplants survive dry periods. Precipitation duringthe growing season controls wood growth as wellas the size and maturation time of seeds (21, 42).Decreases in soil moisture can slow growth,interfere with reproduction, and cause plants todie early. Increases in soil moisture are less likelyto cause harm unless the soil in normally dry areasbecomes saturated with water for extended peri-ods. Standing water can drown the roots of plantsnot adapted to wetlands by interfering withnormal respiration; extended saturation of rootsmay kill the entire plant.
Direct effects of moisture on many land ani-mals may often be less important than the indirecteffects-that is, moisture affects plant growth,which then affects the availability of food andhabitat (86). However, moisture does play acritical, direct role in the natural history ofinvertebrate species (e.g., snails) and is essentialto the survival and reproduction of amphibians(105). Fish and other aquatic organisms thatinhabit rivers and streams can be threatened byeither too little water during drought periods ortoo much runoff flowing into streams. Duringperiods of high precipitation, water may becometurbid, interfering with the health and functioningof the aquatic ecosystem. Moisture is also impor-tant to many microorganisms and fungi, includingmany that contribute to human disease or areconsidered forest or agricultural pests (describedin more detail below and in vol. 1, ch. 6, and vol.
(the result of a combination of precipitation, 2, ch. 6).
Chapter 2–A Primer on Climate Change and Natural Resources I 87
SunlightThe amount of available sunlight, or solar
irradiance, that strikes vegetation is an importantvariable in photosynthesis and productivity. Indi-vidual plants or species that make up the canopy,those near the edges, or those growing in clear-ings receive more light, whereas those in theunderstory are better adapted to lower light levels.Solar irradiance varies regularly from season toseason and from latitude to latitude. Cloud coveralso affects the quality and quantity of solarirradiance and its distribution over time, allowingless sunlight to reach the surface on cloudy days.If climate change is accompanied by increasedcloudiness, as some models predict, overall plantproductivity could decline. Water stress and hightemperatures may also affect plant response;however, plant response to changes in solarirradiance is complex and difficult to predict (19).
In addition to the total amount of solar irradi-ance, the number of hours of sunlight per day (daylength, or photoperiod) plays a role in plantfunctions such as flowering and the setting offruit, and influences the rising of sap indeciduoustrees, such as sugar maple, in spring. Light qualitymay also affect productivity. For example, cottondepends on very regular day lengths, which onlyoccur in southern latitudes. Plant species thatmight migrate northward as the climate warmsmay not be able to reproduce as effectivelybecause day length is longer at northern latitudesduring the summer and drastically reduced duringthe winter (41). On the other hand, adaptation toa shorter photoperiod may limit northward move-ment.
Increased C02
Rising concentrations of atmospheric CO2 mayaffect the rates at which plants grow, respire, usewater, and set seeds. This is known as the CO2
fertilization effect (see box 2-D). Numerouslaboratory experiments and intensively managedagricultural systems that have been studied sug-gest that CO2 has the potential to boost plantgrowth and productivity by speeding the rate of
photosynthesis, relieving nutrient stress (by im-proving efficiency of nutrient uptake and use),increasing water-use efficiency, decreasing respi-ration (which is a major source of water loss),slowing the rate at which leaves die, and speedingthe development of seeds (27, 42,66,68,69, 93).
Theoretically, the fertilization effect couldcompensate for the water stress faced by plants inareas that become warmer and drier due to climatechange, and might actually increase the totalglobal biomass (41). On the other hand, variousstudies have suggested that in some settings, theremay be limits to and even detrimental effects fromincreased CO2. For example, changes in theamount of carbon in plant leaves affect nutritionalquality (65), which could mean that foraginganimals would have to eat more leaves to gain thesame amount of nutrition. Increased CO2 mayalso cause starch to accumulate in plant leaves tosuch high concentrations that it could actuallyharm the plant by interfering with photosynthesis(50), though there is no field data to support this.
Numerous complex factors interact to deter-mine the extent to which fertilization actuallyoccurs in natural ecosystems, and many uncer-tainties about the overall impacts remain. Plantresponses to CO2 vary according to species andstage of development, as well as to water andnutrient availability (42). Some plant speciesalready use CO2 efficiently and will not receivemuch of a boost, whereas other species are nowlimited by their inefficient use of CO2 and couldprofit from higher atmospheric concentrations.
Plants may experience the greatest productivityboosts from increased CO2 when other nutrientsare plentiful (7). Thus, for example, field studieshave demonstrated that higher CO2 concentra-tions boost productivity in Chesapeake Bay saltmarshes, where water entering the bay is rich innutrients (2, 27, 28, 107), but CO2 fertilizationdoes not appear to be significant or permanent innutrient-limited tundra and other arctic ecosys-tems (32, 68). Few other ecosystem types have yetbeen tested in the field. Intensively managedagricultural systems, in which nutrient deficien-
88 I Preparing for an Uncertain Climate-Volume 2
Box 24)-Coping with Increased CO2: Effects on Ecosystem Productivity
Climate,particularly the combination of temperature and moisture, largely determines where plants grow (14),and vegetation, in turn, is key to the distribution of animal species. Generally, climate belts vary within the UnitedStates from humid and damp in the Southeast and Northeast to moderately dry in the central regions, to arid inmuch of the West, except for a humid belt along the Pacific Coast from northern California to Washington.Temperature and precipitation maps of the United States reveal bands across the Nation from north to south fortemperature, and east to west for precipitation. Vegetation growth, in type and lushness, varies with temperatureand altitude, but in all cases, solar irradiance is critical to the productivity of living things.
The sun provides the energy that fuels ecosystems; this energy is transformed through the processes ofphotosynthesis and photorespiration. During photosynthesis, plants use water and the energy from sunlight toconvert carbon dioxide (CO2) and other nutrients into organic matter and oxygen. This process is dependent onthe concentration of CO2 in the air (i.e., ambient CO2), and, therefore, changes in normal CO2 levels may affectphotosynthesis and, likewise, plant growth. External environmental factors, such as temperature and theavailability of nutrients, may modify photosynthesis as well. The output of organic matter by an ecosystem ischaracterized as its biological, or primary, productivity. Linked to primary productivity is nutrient cycling--theabsorption by plants of vital nutrients (e.g., carbon, nitrogen, and phosphorous) and their subsequent conversioninto usable forms.1 The combination of energy and nutrient cycling in vegetative systems determines the natureof the assemblage of plants and animals in a given area Certain types of plants, growing in certain conditions,have higher primary productivities than others, Ecosystems that are highly productive often support both largenumbers of other organisms and many diverse species-that is, they are characterized by high secondaryproductivityand high biodiversity.2 Productivity is also key to carrying capacity --the number of organisms that aparticular area can support. Carrying capacity can vary from year to year based on many factors, including climate,
1 Carbon is derived from CO2through photorespiration; nitrogen and phosphorous are taken up from the soiland converted to usable forms during the same process.
2 Although definitions vary, biodiversity generally refers to the "variety and variability among living organismsand the ecological complexes in which they occur" (89).
cies can be remedied by adding fertilizers, may be fires, which play an important and visible role inmore likely to receive a productivity boost fromadditional C0 2 than are natural ecosystems.Many complex interactions determine to whatextent, if any, the C02 fertilization effect docu-mented in laboratory studies will occur in naturalecosystems. The responses will likely vary somuch from ecosystem to ecosystem and locationto location that there cannot be a simple answer tothe question of whether it will present a netbenefit or a net harm.
■ Indirect Climate ImpactsThrough Stressors
Climate will also have numerous secondaryimpacts. Increases in herbivores, disease, and
mediating the near-term effects of climate changeon communities and ecosystems, could result. Forexample, although few trees in a forest may dieoutright due to heat or drought, it is likely thatmany trees will sicken and become more suscepti-ble to insects and disease. At the same time, treesin decline will provide more fuel for frees (83).The extent to which an area is stressed byanthropogenic activities, such as land clearingand pollution, will also influence the effects ofclimate change.
Insects and DiseaseClimate may affect the proliferation of insects
and disease in numerous ways. Higher tempera-
Chapter 2–A Primer on Climate Change and Natural Resources 89
and refers to the individual species or mix of species in a particular ecosystem. Overall, however, ecosystem healthand productivity is dependent on the availability of sunlight, water, nutrients, and C02.
Considerable experimental evidence has shown that an increase in the atmospheric concentration of C02
has the potential to increase plant growth and ecosystem productivity (28). This expected effect of increased plantproductivity in the presence of elevated C02 concentrations is known as the “CO2 fertilization effect,” and it isexpected to be particularly pronounced in the presence of plentiful supplies of light, water, and nutrients. Over thelong run, this effect may help alleviate the rate of global warming by drawing excess C02 from the atmosphere(8), although researchers are uncertain about the extent to which this will occur (vol. 2, see box 6-B).
Plants vary in their response to C02 in part because of differing photosynthetic mechanisms-- most speciesfollow the C3 pathway and some, the C4 pathway. C3 species (e.g., wheat, rice, soybeans, and all woody plants)are not yet fully saturated with C02 and may greatly increase their productivity, whereas C4 species (e.g., corn,sorghum, sugar cane, and tropical grasses) are almost saturated with CO2 and their productivity may not be muchaffected. Added productivity of C4 species from doubled C02 may be in the O to 20 percent range, and in the 20to 60 percent range for C3 species. The differential effects of C02could alter the dynamics of competition amongspecies, with C3 plants potentially prospering at the expense of C4 species. In agriculture, this competition amongplants may prove important. Because 14 of the world’s most troublesome weed species are C, plants that occuramidst C3 crops, enhanced CO2 concentrations may make such weeds less competitive (73). However, many ofthe major weeds of corn (a C4 crop) in the United States are C3 plants; climate change may favor the growth ofthese weeds. Similarly, natural grassland ecosystems where C4 grasses now dominate may be invaded by weedyplants. Competitive success, however, does not depend solely on response to CO2. Competition among speciesin natural ecosystems will continue to depend on the ability of species to tolerate soil, light, temperature, andmoisture conditions. Because of the complex effects of competition among species, it is by no means clear howthe overall productivity of natural ecosystems will increase under elevated CO2 (8).
SOURCES: B.G. Drake, "The Impact of Rising C02on Ecosystem Production,” Water, Air, and Soil Pollution, vol. 64,1992, pp. 25-44; P.M.Kareiva, J.G. Kingsolver, and R.B. Huey (ads.), Biotic Interactions and Global Change (Sunderland, MA: Sinauer Associates, Inc., 1993).
tures could accelerate the growth rate of insects. Once stressed by heat or drought, vegetationIf the number of warm days per year increases, thenumber of insect generations per year mayincrease. Also, the range of many insects isdetermined by cold winter temperatures. Asdescribed in the section above on temperatureimpacts, milder winters could allow insects suchas leafhoppers (agricultural pests) to spread northof their present range. Hot, dry conditions encour-age the growth of numerous fungi in forests (suchas Armillaria mellea, a fungus that causes rootdisease), which can cause widespread damage inmany types of forests. Warm, humid conditions,which favor soil and leaf-litter organisms as wellas decomposition, may encourage the growth ofother fungi and insect pests, such as aphids, whichcan also be quite damaging,
may become more susceptible to pests (58).Changes in CO2 concentration may affect thecomposition of leaves, potentially making themless nutritious, so insects might have to consumemore to obtain the same amount of nutrients (8).Thus, damage from insects and disease mightincrease, and in some cases, the effects of climatechange may become noticeable over the shortterm. Over the long term, damage from insectsand disease may cause less-adaptable species todecline, potentially opening the way for exoticspecies to migrate into communities (21, 83).
Extreme EventsPeriodic but unpredictable events such as
extended drought, storms, and fire are among theprimary natural factors that shape ecosystems.
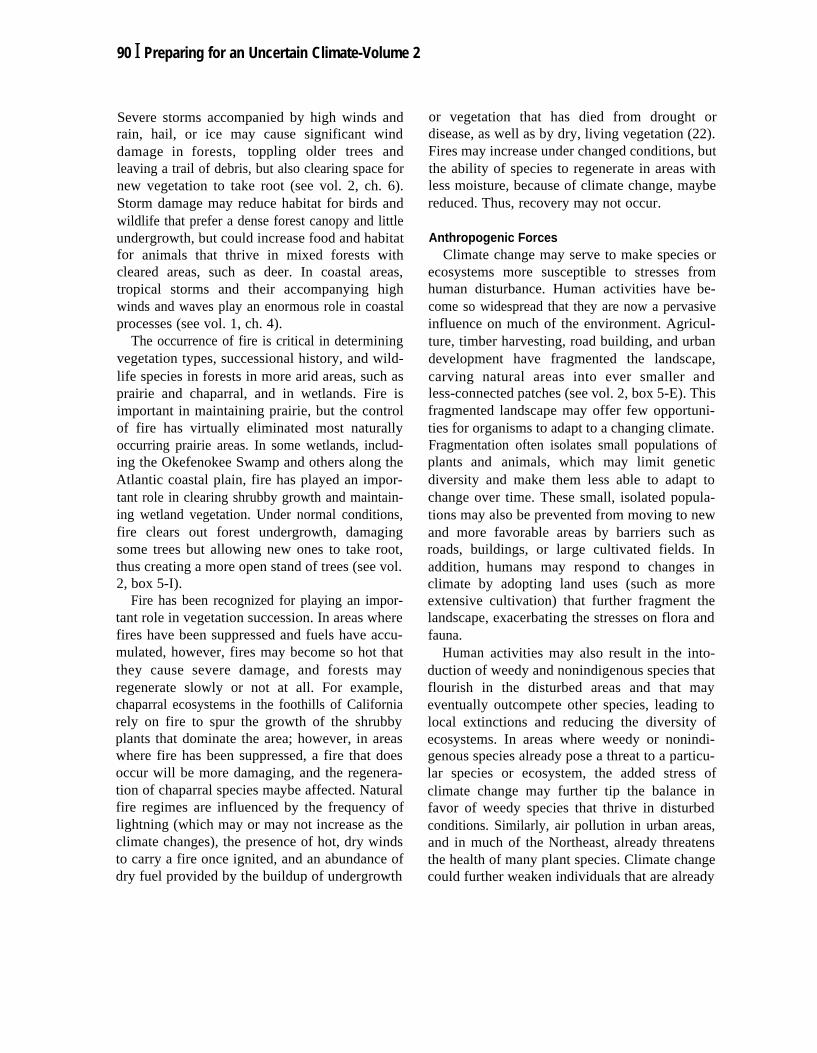
90 I Preparing for an Uncertain Climate-Volume 2
Severe storms accompanied by high winds andrain, hail, or ice may cause significant winddamage in forests, toppling older trees andleaving a trail of debris, but also clearing space fornew vegetation to take root (see vol. 2, ch. 6).Storm damage may reduce habitat for birds andwildlife that prefer a dense forest canopy and littleundergrowth, but could increase food and habitatfor animals that thrive in mixed forests withcleared areas, such as deer. In coastal areas,tropical storms and their accompanying highwinds and waves play an enormous role in coastalprocesses (see vol. 1, ch. 4).
The occurrence of fire is critical in determiningvegetation types, successional history, and wild-life species in forests in more arid areas, such asprairie and chaparral, and in wetlands. Fire isimportant in maintaining prairie, but the controlof fire has virtually eliminated most naturallyoccurring prairie areas. In some wetlands, includ-ing the Okefenokee Swamp and others along theAtlantic coastal plain, fire has played an impor-tant role in clearing shrubby growth and maintain-ing wetland vegetation. Under normal conditions,fire clears out forest undergrowth, damagingsome trees but allowing new ones to take root,thus creating a more open stand of trees (see vol.2, box 5-I).
Fire has been recognized for playing an impor-tant role in vegetation succession. In areas wherefires have been suppressed and fuels have accu-mulated, however, fires may become so hot thatthey cause severe damage, and forests mayregenerate slowly or not at all. For example,chaparral ecosystems in the foothills of Californiarely on fire to spur the growth of the shrubbyplants that dominate the area; however, in areaswhere fire has been suppressed, a fire that doesoccur will be more damaging, and the regenera-tion of chaparral species maybe affected. Naturalfire regimes are influenced by the frequency oflightning (which may or may not increase as theclimate changes), the presence of hot, dry windsto carry a fire once ignited, and an abundance ofdry fuel provided by the buildup of undergrowth
or vegetation that has died from drought ordisease, as well as by dry, living vegetation (22).Fires may increase under changed conditions, butthe ability of species to regenerate in areas withless moisture, because of climate change, maybereduced. Thus, recovery may not occur.
Anthropogenic ForcesClimate change may serve to make species or
ecosystems more susceptible to stresses fromhuman disturbance. Human activities have be-come so widespread that they are now a pervasiveinfluence on much of the environment. Agricul-ture, timber harvesting, road building, and urbandevelopment have fragmented the landscape,carving natural areas into ever smaller andless-connected patches (see vol. 2, box 5-E). Thisfragmented landscape may offer few opportuni-ties for organisms to adapt to a changing climate.Fragmentation often isolates small populations ofplants and animals, which may limit geneticdiversity and make them less able to adapt tochange over time. These small, isolated popula-tions may also be prevented from moving to newand more favorable areas by barriers such asroads, buildings, or large cultivated fields. Inaddition, humans may respond to changes inclimate by adopting land uses (such as moreextensive cultivation) that further fragment thelandscape, exacerbating the stresses on flora andfauna.
Human activities may also result in the into-duction of weedy and nonindigenous species thatflourish in the disturbed areas and that mayeventually outcompete other species, leading tolocal extinctions and reducing the diversity ofecosystems. In areas where weedy or nonindi-genous species already pose a threat to a particu-lar species or ecosystem, the added stress ofclimate change may further tip the balance infavor of weedy species that thrive in disturbedconditions. Similarly, air pollution in urban areas,and in much of the Northeast, already threatensthe health of many plant species. Climate changecould further weaken individuals that are already
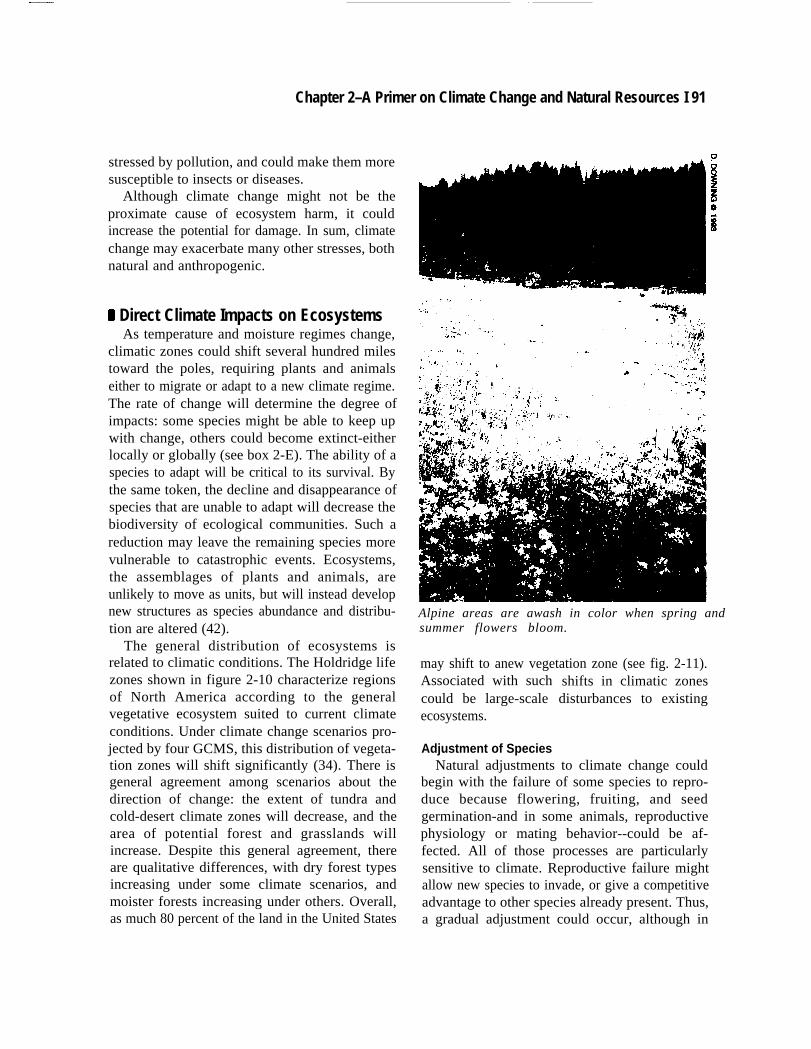
.
Chapter 2–A Primer on Climate Change and Natural Resources I 91
stressed by pollution, and could make them moresusceptible to insects or diseases.
Although climate change might not be theproximate cause of ecosystem harm, it couldincrease the potential for damage. In sum, climatechange may exacerbate many other stresses, bothnatural and anthropogenic.
9 Direct Climate Impacts on EcosystemsAs temperature and moisture regimes change,
climatic zones could shift several hundred milestoward the poles, requiring plants and animalseither to migrate or adapt to a new climate regime.The rate of change will determine the degree ofimpacts: some species might be able to keep upwith change, others could become extinct-eitherlocally or globally (see box 2-E). The ability of aspecies to adapt will be critical to its survival. Bythe same token, the decline and disappearance ofspecies that are unable to adapt will decrease thebiodiversity of ecological communities. Such areduction may leave the remaining species morevulnerable to catastrophic events. Ecosystems,the assemblages of plants and animals, areunlikely to move as units, but will instead developnew structures as species abundance and distribu-tion are altered (42).
The general distribution of ecosystems isrelated to climatic conditions. The Holdridge lifezones shown in figure 2-10 characterize regionsof North America according to the generalvegetative ecosystem suited to current climateconditions. Under climate change scenarios pro-jected by four GCMS, this distribution of vegeta-tion zones will shift significantly (34). There isgeneral agreement among scenarios about thedirection of change: the extent of tundra andcold-desert climate zones will decrease, and thearea of potential forest and grasslands willincrease. Despite this general agreement, thereare qualitative differences, with dry forest typesincreasing under some climate scenarios, andmoister forests increasing under others. Overall,as much 80 percent of the land in the United States
.‘=$wtw+
*. , ,’ ,$J’ . . . !. ~,.
Alpine areas are awash in color when spring andsummer flowers bloom.
may shift to anew vegetation zone (see fig. 2-11).Associated with suchcould be large-scaleecosystems.
Adjustment of Species
shifts in climatic zonesdisturbances to existing
Natural adjustments to climate change couldbegin with the failure of some species to repro-duce because flowering, fruiting, and seedgermination-and in some animals, reproductivephysiology or mating behavior--could be af-fected. All of those processes are particularlysensitive to climate. Reproductive failure mightallow new species to invade, or give a competitiveadvantage to other species already present. Thus,a gradual adjustment could occur, although in
92 Preparing for an Uncertain Climate-Volume 2
Box 2-E--Responses of Natural Systems to Climate Stress:Adaptation, Migration, and Decline
Resonses of individuals and communities to climate stress fall into three basic categories: adaptation,migration, and decline and die-back The extent to which individuals and communities respond may depend onthe rate and magnitude of climate change.
Adaptation
It is difficult to predict which species, populations, communities, ecosystems, and landscapes will prove mostable to cope with climate change because of the many variables and uncertainties that exist. However, biologicaldiversity affords populations the ability to adapt to changes in the environment by serving as a natural protectionagainst shocks and stress."The rule that there is security in diversity is an axiom of ecology as well as finance....Biological diversity is a natural protection against surprises and shocks, climatic and otherwise. Among diversespecies will be some adapted to prosper in a new landscape in new circumstances” (21).
in species with diverse gene pods, the chances will be greater that some individuals will possess acombination of genes that is useful in new environments, such as genes that determine drought resistance andtolerance to extreme temperatures or salinity. These individuals will be the most likely to survive and pass alongadaptive characteristics to their offspring. At the community level, diversity may also increase the chances forsurvival. For example, a forest stand composed of a single species or of trees that are all the same age may beless able to withstand climate change than a forest composed of several species within a range of ages.Biodiversityis generallyconsidered an important trait at the ecosystem level, too, because it increases the chancesthat the overall structure and function of an ecosystem will persist or adapt to changing conditions, even if somespecies that were formerlypart of the ecosystem no longer remain (21).
Some species may prosper under climate change conditions, others may be able to adapt relativiely quickly,and still others may prove unable to adapt at all and may face extinction. As a result, ecosystems may changeas differed plant species become dominant and different animal species become associated with altered habitats(21). Species in varied landscapes maybeable to find microclimates within their current ranges that are suitable,and some species may even thrive and expand their ranges. Species already adapted to disturbed environments(e.g.,weedy species) may be particularly resilien to changes in climate. On the other hand, species with extremelyspecific and/or narrow habitats maybe more at risk to changes in climate. In addition, species on the fringe ofhabitats, in transitional zones, may also experience greater stress from the impacts of climate change becausethese species may not be well-established. On the whole, sores species may be restricted bya variety of biologicaland physical imitations, but others will be able to adapt to the conditions brought on by climate change.
Certain wildlife species may be able to alter their diet in favor of other, exotic but newly available plant species.White-tailed deer, mule deer, moose, elk, and other species benefit from human activities that disturb ecosystemsand alter habitat (22). If, for example, climate change contributes to the conversion of a dense, forested habitatto a more open area, species such as these would likely benefit. Similarly, some birds, such as robins, starlings,and @is, may adapt easily to alterations in habitat caused by climate change (22). These species tend to feedon a variety of different organisms and are territorial and aggressive in nature. They are very good at vying forresources with less competitive and smaller birds.
Migration
Some communities and ecosystems might have to migrate to survive the environmental conditions that couldresult from climate change. Most species of vegetation and wildlife have the ability to migrate to some extent.However, adverse conditions, such as landscapefragmentation, may limit this ability (see vol. 2,ch.5). in addition,the ability of a species to migrate depends not only on environmental conditions but on dispersal rate. Animalscan generally disperse much more quickly than plants (22). However, because wildlife independent on vegetation
Chapter 2–A Primer on Climate Change and Natural Resources 93
for survival, many species are forced to migrate only as fast as vegetation does (94). Therefore, the health andsurvival of many species will be dependent on the response of vegetation to climate change.
Dispersal rates for vegetation are considerably slower than the projected rate of climate change, and,therefore, some species will not be able to migrate as fast as their corresponding climatic regimes. For example,most North American tree species can migrate at 12 to 25 miles (20 to 40 kilometers) per century, but climateregimes are expected to migrate at much faster rates, in some cases by at least an order of magnitude (106). Inparticular parts of the United States, climatic regimes may shift hundreds of miles by as early as the middle to theend of the next century (43, 74). Because some species will be unable to keep up with the pace of climate change,their range may be reduced, or they may become extinct.
Coastal and estuarine wetland vegetation will Iikely attempt to migrate inland as the sea level rises. Theirsuccess in migrating will depend on the steepness of the coast and obstructions to migration that might exist, suchas rocky areas and human-built structures. Wetlands fringing the playa lakes of the Southwest may retreat alongwith the water levels if increased evaporation, in a hotter and drier climate, causes water levels to drop. Alpinetundra will likely migrate toward higher altitudes as lower areas become warmer and drier.
In all of these cases, wildlife and other organisms that are dependent on these ecosystems for survival mayattempt to migrate as well. The least Bell’s vireo, an endangered species completely dependent on riparianvegetation for survival, may lose a great deal of habitat if inland drying occurs (22). The jack-pine forest in northernMichigan, which provides critical habitat for the endangered Kirtland’s warbler, could die off and be replaced bya sugar maple forest in as few as 30 years under climate change conditions (1 1).
In each case, the ability to migrate will be limited by adjacent land-use patterns and the availability of areasto which organisms can migrate. “Barriers,” such as roads, cities, and agriculture, degrade habitat quality and limitthe ability of vegetation and wildlife to move or spread. Roads may pose a formidable physical barrier to animalmigration, and even plants may have difficulty “moving” across roads if their seeds are too heavy to be dispersedeasily and overlarge distances by wind. Vast expanses of suburban developments now occupy sites that formerlycould have offered either suitable destinations or pathways for migration of plants and animals from one Iocaleto another. Many animals will not cross seemingly small obstructions, such as railroad clearings or roads, to getto nearby suitable habitat (22). Agricultural land and other highly managed areas prevent species from naturallyestablishing themselves. In general, the ability of plants and animals to migrate in response to climate change islargely affected by anthropocentric influences and factors. Nevertheless, many species will be sufficientlyresourceful to migrate successfully, and some may even thrive and expand their ranges.
Decline and die-back
If climate change is rapid or severe, some species, ecosystems, and landscapes may not be able to adapt.Changes in climate may cause severe loss of function or value in certain species, ecosystems, and landscapes,or may result in the disappearance of certain species or entire ecosystems. Just as human land-use patterns maylimit migration, they may also ultimately Iimit the chances for some species or ecosystems to survive. Some speciesare well-suited to a very narrow set of environmental conditions, but lack characteristics that would allow them tomove or adapt easily to new environments. When human activities reduce or eliminate their normal habitats, thesespecies are likely to show signs of stress leading to decline or die-back.
in forest systems, decline and die-back occur when a large proportion of a tree population exhibits visiblesymptoms of stress, unusual and consistent growth decreases, or death over a large area Such distinguishingcharacteristics can be irregular in distribution, and discontinuous but recurrent in time. In all cases, however,decline and die-back are the result of complex interactions of multiple stress factors (83). Some common abioticfactors include drought and low- and high-temperature stress. Biotic agents include defoliating insects,root-infecting fungi, and borers and bark beetles. Typically, declines are initiated by an abiotic stress, with mortalityultimately caused by a biotic stress agent.
(Cotinued on next page)
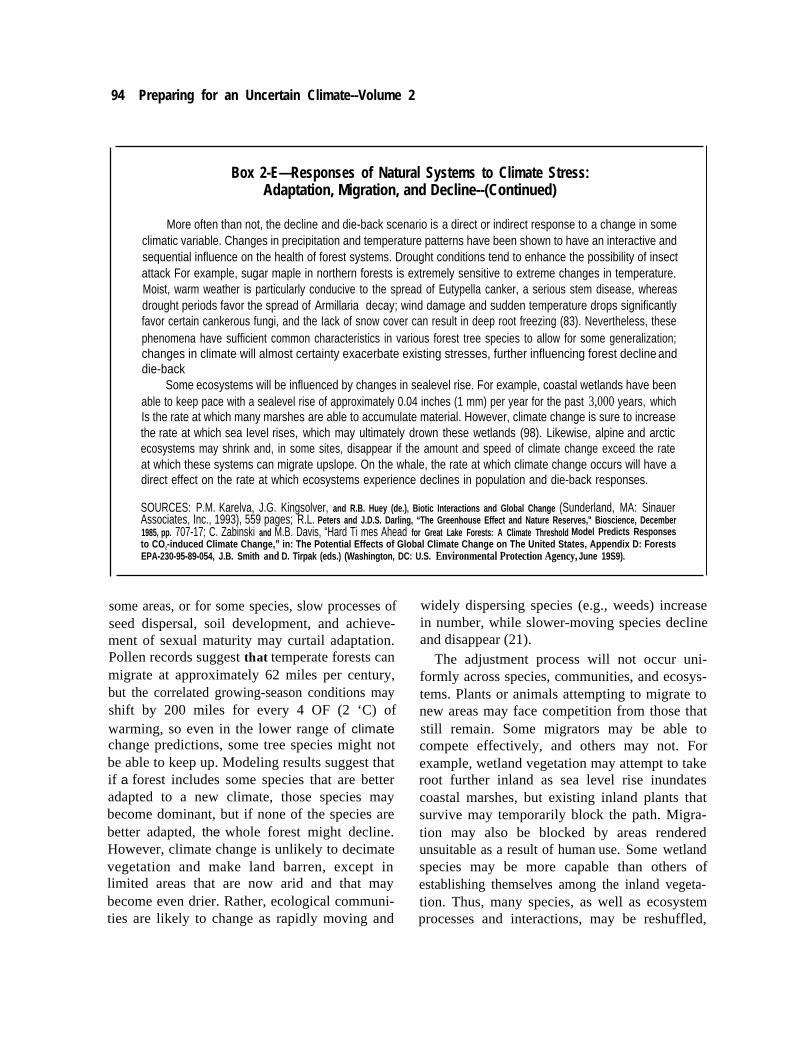
94 Preparing for an Uncertain Climate--Volume 2
Box 2-E—Responses of Natural Systems to Climate Stress:Adaptation, Migration, and Decline--(Continued)
More often than not, the decline and die-back scenario is a direct or indirect response to a change in someclimatic variable. Changes in precipitation and temperature patterns have been shown to have an interactive andsequential influence on the health of forest systems. Drought conditions tend to enhance the possibility of insectattack For example, sugar maple in northern forests is extremely sensitive to extreme changes in temperature.Moist, warm weather is particularly conducive to the spread of Eutypella canker, a serious stem disease, whereasdrought periods favor the spread of Armillaria decay; wind damage and sudden temperature drops significantlyfavor certain cankerous fungi, and the Iack of snow cover can result in deep root freezing (83). Nevertheless, thesephenomena have sufficient common characteristics in various forest tree species to allow for some generalization;changes in climate will almost certainty exacerbate existing stresses, further influencing forest decline anddie-back
Some ecosystems will be influenced by changes in sealevel rise. For example, coastal wetlands have beenable to keep pace with a sealevel rise of approximately 0.04 inches (1 mm) per year for the past 3,000 years, whichIs the rate at which many marshes are able to accumulate material. However, climate change is sure to increasethe rate at which sea Ievel rises, which may ultimately drown these wetlands (98). Likewise, alpine and arcticecosystems may shrink and, in some sites, disappear if the amount and speed of climate change exceed the rateat which these systems can migrate upslope. On the whale, the rate at which climate change occurs will have adirect effect on the rate at which ecosystems experience declines in population and die-back responses.
SOURCES: P.M. Karelva, J.G. Kingsolver, and R.B. Huey (de.), Biotic Interactions and Global Change (Sunderland, MA: SinauerAssociates, Inc., 1993), 559 pages; R.L. Peters and J.D.S. Darling, “The Greenhouse Effect and Nature Reserves," Bioscience, December1985, pp. 707-17; C. Zabinski and M.B. Davis, “Hard Ti mes Ahead for Great Lake Forests: A Climate Threshold Model Predicts Responsesto CO2-induced Climate Change,” in: The Potential Effects of Global Climate Change on The United States, Appendix D: ForestsEPA-230-95-89-054, J.B. Smith and D. Tirpak (eds.) (Washington, DC: U.S. Environmental Protection Agency, June 19S9).
some areas, or for some species, slow processes of widely dispersing species (e.g., weeds) increaseseed dispersal, soil development, and achieve-ment of sexual maturity may curtail adaptation.Pollen records suggest that temperate forests canmigrate at approximately 62 miles per century,but the correlated growing-season conditions mayshift by 200 miles for every 4 OF (2 ‘C) ofwarming, so even in the lower range of climatechange predictions, some tree species might notbe able to keep up. Modeling results suggest thatif a forest includes some species that are betteradapted to a new climate, those species maybecome dominant, but if none of the species arebetter adapted, the whole forest might decline.However, climate change is unlikely to decimatevegetation and make land barren, except inlimited areas that are now arid and that maybecome even drier. Rather, ecological communi-ties are likely to change as rapidly moving and
in number, while slower-moving species declineand disappear (21).
The adjustment process will not occur uni-formly across species, communities, and ecosys-tems. Plants or animals attempting to migrate tonew areas may face competition from those thatstill remain. Some migrators may be able tocompete effectively, and others may not. Forexample, wetland vegetation may attempt to takeroot further inland as sea level rise inundatescoastal marshes, but existing inland plants thatsurvive may temporarily block the path. Migra-tion may also be blocked by areas renderedunsuitable as a result of human use. Some wetlandspecies may be more capable than others ofestablishing themselves among the inland vegeta-tion. Thus, many species, as well as ecosystemprocesses and interactions, may be reshuffled,
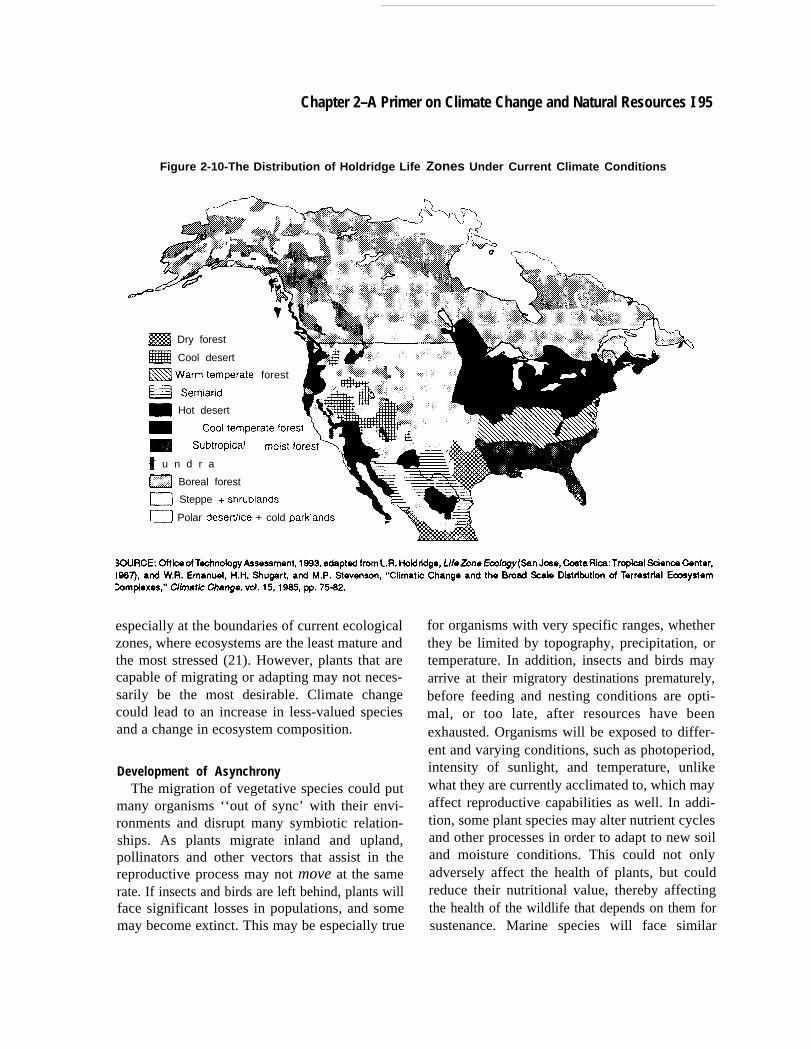
Chapter 2–A Primer on Climate Change and Natural Resources I 95
Figure 2-10-The Distribution of Holdridge Life Zones Under Current Climate Conditions
e-’
= Dry forest Y~ Cool desert
~ Warrnternperate forest
~ Semiarid
- Hot desert [
Y
_ Coolternperateforest -
_ Subtropmlrn olstforest ~
T u n d r a
m Boreal forest Y
m Steppe +shrublands T
fl Polar deserthce + cold Darklands\-%
especially at the boundaries of current ecologicalzones, where ecosystems are the least mature andthe most stressed (21). However, plants that arecapable of migrating or adapting may not neces-sarily be the most desirable. Climate changecould lead to an increase in less-valued speciesand a change in ecosystem composition.
Development of AsynchronyThe migration of vegetative species could put
many organisms ‘‘out of sync’ with their envi-ronments and disrupt many symbiotic relation-ships. As plants migrate inland and upland,pollinators and other vectors that assist in thereproductive process may not move at the samerate. If insects and birds are left behind, plants willface significant losses in populations, and somemay become extinct. This may be especially true
for organisms with very specific ranges, whetherthey be limited by topography, precipitation, ortemperature. In addition, insects and birds mayarrive at their migratory destinations prematurely,before feeding and nesting conditions are opti-mal, or too late, after resources have beenexhausted. Organisms will be exposed to differ-ent and varying conditions, such as photoperiod,intensity of sunlight, and temperature, unlikewhat they are currently acclimated to, which mayaffect reproductive capabilities as well. In addi-tion, some plant species may alter nutrient cyclesand other processes in order to adapt to new soiland moisture conditions. This could not onlyadversely affect the health of plants, but couldreduce their nutritional value, thereby affectingthe health of the wildlife that depends on them forsustenance. Marine species will face similar
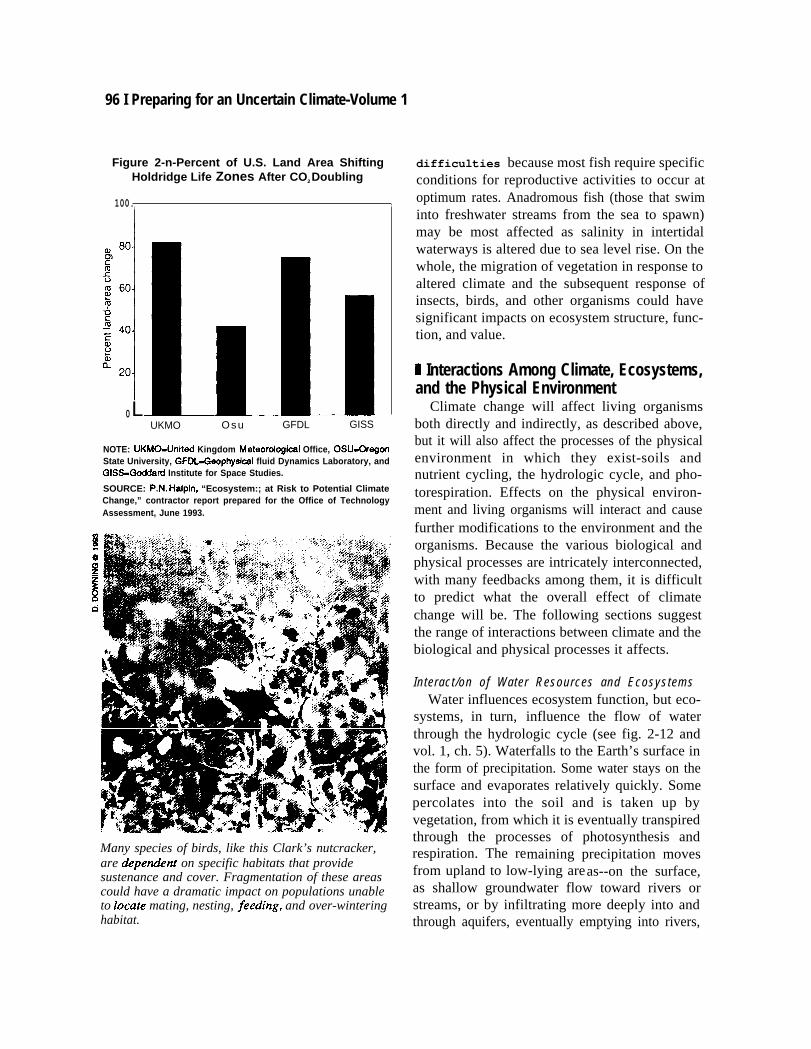
96 I Preparing for an Uncertain Climate-Volume 1
Figure 2-n-Percent of U.S. Land Area ShiftingHoldridge Life Zones After CO2 Doubling
100. t
0LUKMO Osu GFDL GISS
NOTE: UKMO=United Kingdom Meteomiogioal Office, OSU-OregonState University, GFDL-Geophysical fluid Dynamics Laboratory, andGISS-Goddad Institute for Space Studies.
SOURCE: P.N. Halpin, “Ecosystem:; at Risk to Potential ClimateChange,” contractor report prepared for the Office of TechnologyAssessment, June 1993.
Many species of birds, like this Clark’s nutcracker,are &pendent on specific habitats that providesustenance and cover. Fragmentation of these areascould have a dramatic impact on populations unableto locate mating, nesting, feedhg, and over-winteringhabitat.
difficulties because most fish require specificconditions for reproductive activities to occur atoptimum rates. Anadromous fish (those that swiminto freshwater streams from the sea to spawn)may be most affected as salinity in intertidalwaterways is altered due to sea level rise. On thewhole, the migration of vegetation in response toaltered climate and the subsequent response ofinsects, birds, and other organisms could havesignificant impacts on ecosystem structure, func-tion, and value.
U Interactions Among Climate, Ecosystems,and the Physical Environment
Climate change will affect living organismsboth directly and indirectly, as described above,but it will also affect the processes of the physicalenvironment in which they exist-soils andnutrient cycling, the hydrologic cycle, and pho-torespiration. Effects on the physical environ-ment and living organisms will interact and causefurther modifications to the environment and theorganisms. Because the various biological andphysical processes are intricately interconnected,with many feedbacks among them, it is difficultto predict what the overall effect of climatechange will be. The following sections suggestthe range of interactions between climate and thebiological and physical processes it affects.
Interact/on of Water Resources and EcosystemsWater influences ecosystem function, but eco-
systems, in turn, influence the flow of waterthrough the hydrologic cycle (see fig. 2-12 andvol. 1, ch. 5). Waterfalls to the Earth’s surface inthe form of precipitation. Some water stays on thesurface and evaporates relatively quickly. Somepercolates into the soil and is taken up byvegetation, from which it is eventually transpiredthrough the processes of photosynthesis andrespiration. The remaining precipitation movesfrom upland to low-lying areas--on the surface,as shallow groundwater flow toward rivers orstreams, or by infiltrating more deeply into andthrough aquifers, eventually emptying into rivers,
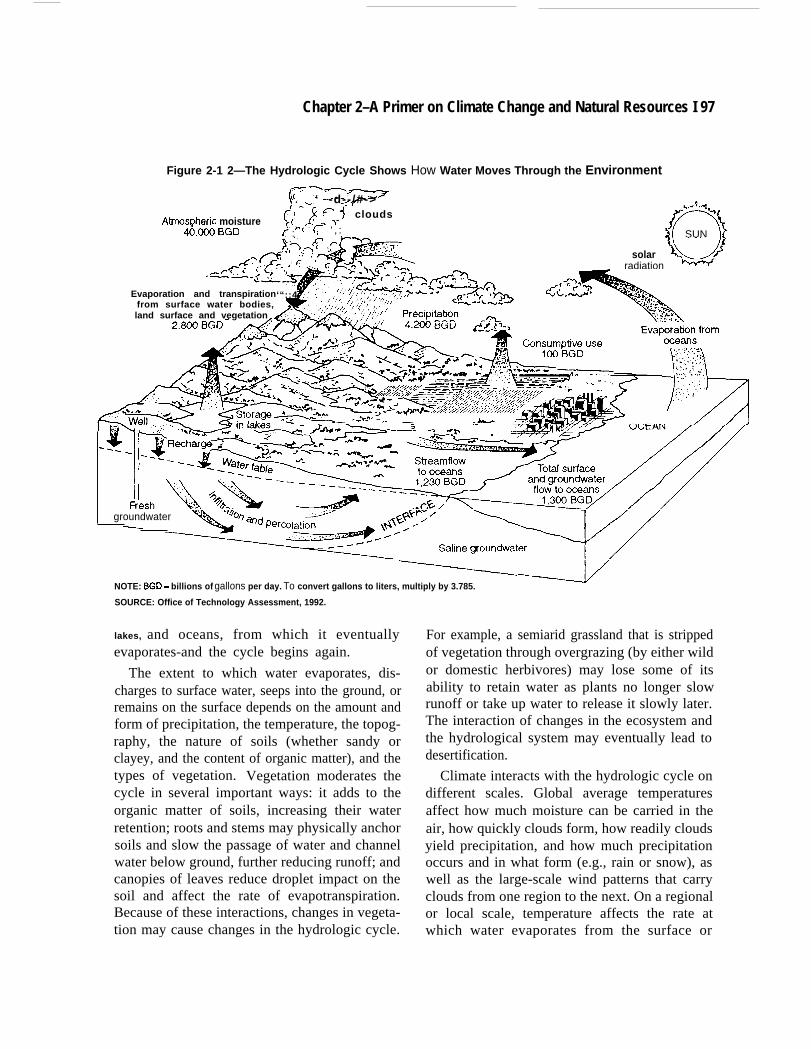
Chapter 2–A Primer on Climate Change and Natural Resources I 97
Figure 2-1 2—The Hydrologic Cycle Shows
r’-~i; ~ ‘ -d--/#->
AtrnosDheric moisture~: -} ~r,.f clouds
How Water Moves Through the Environment
4&D0 BGD ‘“ *(: - r ‘ , :r : S( SUN )?
solar i~)radiation
‘“~-Evaporation and transpiration‘“::4
from surface water bodies,land surface and vegetation ~-~ ‘/$
i~
‘ .,.. .’,.;,.,,, , :. . . ‘, ,“- . .,..- . . .“. ,
.,~. . .
-groundwater
NOTE: BGD - billions of gallons per day. To convert gallons to liters, multiply by 3.785.
SOURCE: Office of Technology Assessment, 1992.
lakes, and oceans, from which it eventuallyevaporates-and the cycle begins again.
The extent to which water evaporates, dis-charges to surface water, seeps into the ground, orremains on the surface depends on the amount andform of precipitation, the temperature, the topog-raphy, the nature of soils (whether sandy orclayey, and the content of organic matter), and thetypes of vegetation. Vegetation moderates thecycle in several important ways: it adds to theorganic matter of soils, increasing their waterretention; roots and stems may physically anchorsoils and slow the passage of water and channelwater below ground, further reducing runoff; andcanopies of leaves reduce droplet impact on thesoil and affect the rate of evapotranspiration.Because of these interactions, changes in vegeta-tion may cause changes in the hydrologic cycle.
For example, a semiarid grassland that is strippedof vegetation through overgrazing (by either wildor domestic herbivores) may lose some of itsability to retain water as plants no longer slowrunoff or take up water to release it slowly later.The interaction of changes in the ecosystem andthe hydrological system may eventually lead todesertification.
Climate interacts with the hydrologic cycle ondifferent scales. Global average temperaturesaffect how much moisture can be carried in theair, how quickly clouds form, how readily cloudsyield precipitation, and how much precipitationoccurs and in what form (e.g., rain or snow), aswell as the large-scale wind patterns that carryclouds from one region to the next. On a regionalor local scale, temperature affects the rate atwhich water evaporates from the surface or
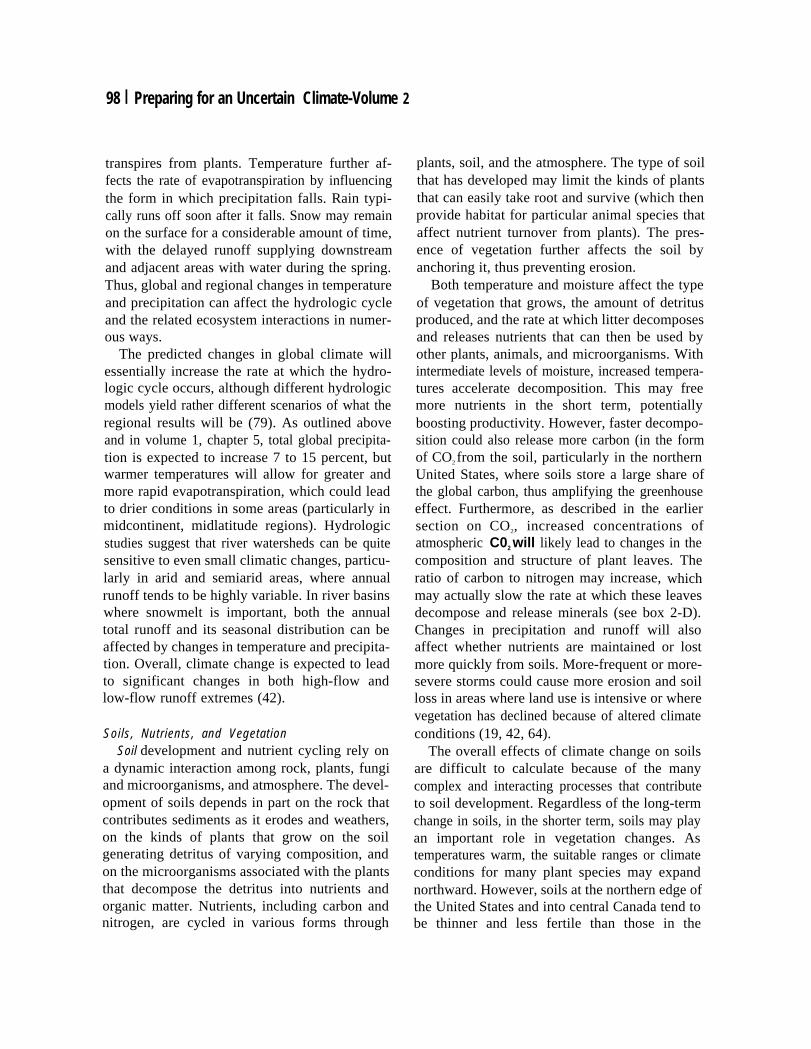
98 I Preparing for an Uncertain Climate-Volume 2
transpires from plants. Temperature further af-fects the rate of evapotranspiration by influencingthe form in which precipitation falls. Rain typi-cally runs off soon after it falls. Snow may remainon the surface for a considerable amount of time,with the delayed runoff supplying downstreamand adjacent areas with water during the spring.Thus, global and regional changes in temperatureand precipitation can affect the hydrologic cycleand the related ecosystem interactions in numer-ous ways.
The predicted changes in global climate willessentially increase the rate at which the hydro-logic cycle occurs, although different hydrologicmodels yield rather different scenarios of what theregional results will be (79). As outlined aboveand in volume 1, chapter 5, total global precipita-tion is expected to increase 7 to 15 percent, butwarmer temperatures will allow for greater andmore rapid evapotranspiration, which could leadto drier conditions in some areas (particularly inmidcontinent, midlatitude regions). Hydrologicstudies suggest that river watersheds can be quitesensitive to even small climatic changes, particu-larly in arid and semiarid areas, where annualrunoff tends to be highly variable. In river basinswhere snowmelt is important, both the annualtotal runoff and its seasonal distribution can beaffected by changes in temperature and precipita-tion. Overall, climate change is expected to leadto significant changes in both high-flow andlow-flow runoff extremes (42).
Soils, Nutrients, and VegetationSoil development and nutrient cycling rely on
a dynamic interaction among rock, plants, fungiand microorganisms, and atmosphere. The devel-opment of soils depends in part on the rock thatcontributes sediments as it erodes and weathers,on the kinds of plants that grow on the soilgenerating detritus of varying composition, andon the microorganisms associated with the plantsthat decompose the detritus into nutrients andorganic matter. Nutrients, including carbon andnitrogen, are cycled in various forms through
plants, soil, and the atmosphere. The type of soilthat has developed may limit the kinds of plantsthat can easily take root and survive (which thenprovide habitat for particular animal species thataffect nutrient turnover from plants). The pres-ence of vegetation further affects the soil byanchoring it, thus preventing erosion.
Both temperature and moisture affect the typeof vegetation that grows, the amount of detritusproduced, and the rate at which litter decomposesand releases nutrients that can then be used byother plants, animals, and microorganisms. Withintermediate levels of moisture, increased tempera-tures accelerate decomposition. This may freemore nutrients in the short term, potentiallyboosting productivity. However, faster decompo-sition could also release more carbon (in the formof CO2 from the soil, particularly in the northernUnited States, where soils store a large share ofthe global carbon, thus amplifying the greenhouseeffect. Furthermore, as described in the earliersection on CO2, increased concentrations ofatmospheric C02 will likely lead to changes in thecomposition and structure of plant leaves. Theratio of carbon to nitrogen may increase, whichmay actually slow the rate at which these leavesdecompose and release minerals (see box 2-D).Changes in precipitation and runoff will alsoaffect whether nutrients are maintained or lostmore quickly from soils. More-frequent or more-severe storms could cause more erosion and soilloss in areas where land use is intensive or wherevegetation has declined because of altered climateconditions (19, 42, 64).
The overall effects of climate change on soilsare difficult to calculate because of the manycomplex and interacting processes that contributeto soil development. Regardless of the long-termchange in soils, in the shorter term, soils may playan important role in vegetation changes. Astemperatures warm, the suitable ranges or climateconditions for many plant species may expandnorthward. However, soils at the northern edge ofthe United States and into central Canada tend tobe thinner and less fertile than those in the
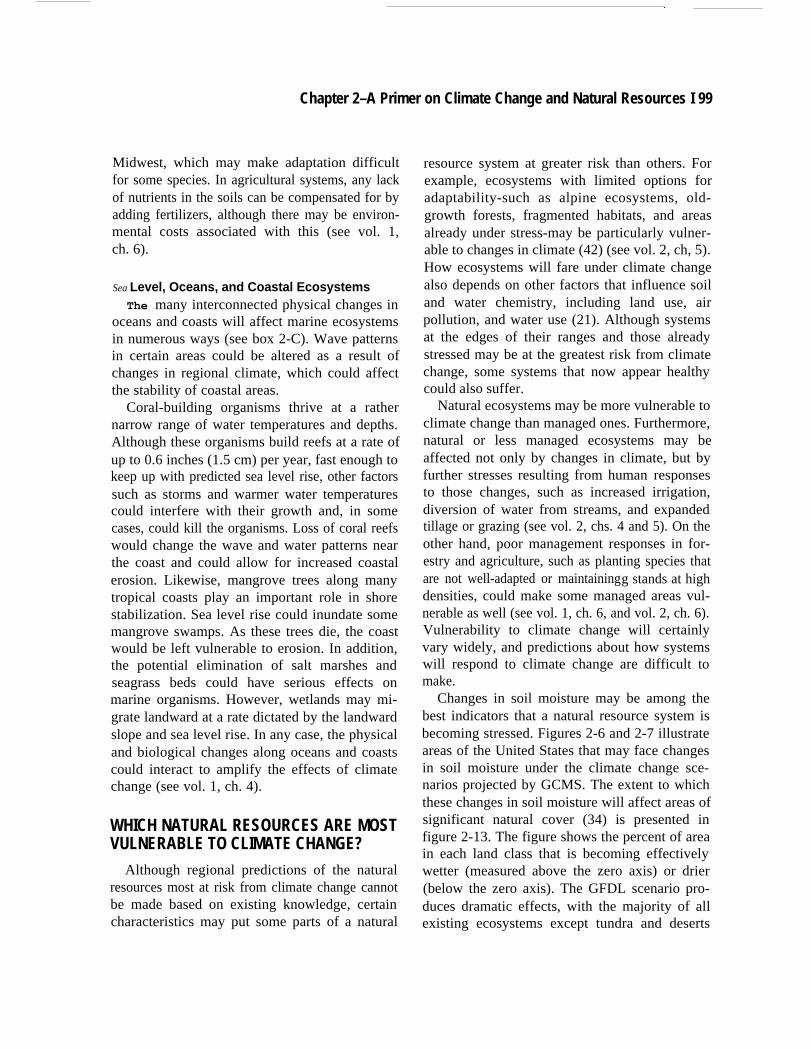
—.
Chapter 2–A Primer on Climate Change and Natural Resources I 99
Midwest, which may make adaptation difficultfor some species. In agricultural systems, any lackof nutrients in the soils can be compensated for byadding fertilizers, although there may be environ-mental costs associated with this (see vol. 1,ch. 6).
Sea Level, Oceans, and Coastal EcosystemsThe many interconnected physical changes in
oceans and coasts will affect marine ecosystemsin numerous ways (see box 2-C). Wave patternsin certain areas could be altered as a result ofchanges in regional climate, which could affectthe stability of coastal areas.
Coral-building organisms thrive at a rathernarrow range of water temperatures and depths.Although these organisms build reefs at a rate ofup to 0.6 inches (1.5 cm) per year, fast enough tokeep up with predicted sea level rise, other factorssuch as storms and warmer water temperaturescould interfere with their growth and, in somecases, could kill the organisms. Loss of coral reefswould change the wave and water patterns nearthe coast and could allow for increased coastalerosion. Likewise, mangrove trees along manytropical coasts play an important role in shorestabilization. Sea level rise could inundate somemangrove swamps. As these trees die, the coastwould be left vulnerable to erosion. In addition,the potential elimination of salt marshes andseagrass beds could have serious effects onmarine organisms. However, wetlands may mi-grate landward at a rate dictated by the landwardslope and sea level rise. In any case, the physicaland biological changes along oceans and coastscould interact to amplify the effects of climatechange (see vol. 1, ch. 4).
WHICH NATURAL RESOURCES ARE MOSTVULNERABLE TO CLIMATE CHANGE?
Although regional predictions of the naturalresources most at risk from climate change cannotbe made based on existing knowledge, certaincharacteristics may put some parts of a natural
resource system at greater risk than others. Forexample, ecosystems with limited options foradaptability-such as alpine ecosystems, old-growth forests, fragmented habitats, and areasalready under stress-may be particularly vulner-able to changes in climate (42) (see vol. 2, ch, 5).How ecosystems will fare under climate changealso depends on other factors that influence soiland water chemistry, including land use, airpollution, and water use (21). Although systemsat the edges of their ranges and those alreadystressed may be at the greatest risk from climatechange, some systems that now appear healthycould also suffer.
Natural ecosystems may be more vulnerable toclimate change than managed ones. Furthermore,natural or less managed ecosystems may beaffected not only by changes in climate, but byfurther stresses resulting from human responsesto those changes, such as increased irrigation,diversion of water from streams, and expandedtillage or grazing (see vol. 2, chs. 4 and 5). On theother hand, poor management responses in for-estry and agriculture, such as planting species thatare not well-adapted or maintainingg stands at highdensities, could make some managed areas vul-nerable as well (see vol. 1, ch. 6, and vol. 2, ch. 6).Vulnerability to climate change will certainlyvary widely, and predictions about how systemswill respond to climate change are difficult tomake.
Changes in soil moisture may be among thebest indicators that a natural resource system isbecoming stressed. Figures 2-6 and 2-7 illustrateareas of the United States that may face changesin soil moisture under the climate change sce-narios projected by GCMS. The extent to whichthese changes in soil moisture will affect areas ofsignificant natural cover (34) is presented infigure 2-13. The figure shows the percent of areain each land class that is becoming effectivelywetter (measured above the zero axis) or drier(below the zero axis). The GFDL scenario pro-duces dramatic effects, with the majority of allexisting ecosystems except tundra and deserts
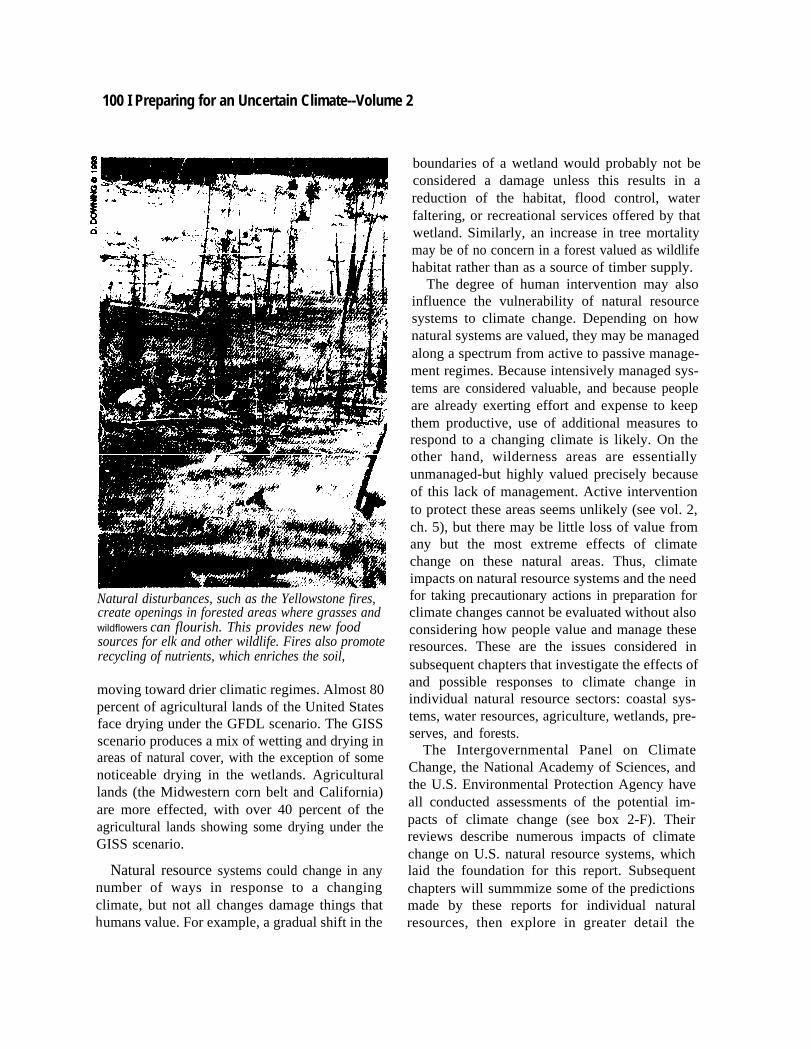
100 I Preparing for an Uncertain Climate--Volume 2
Natural disturbances, such as the Yellowstone fires,create openings in forested areas where grasses andwildflowers can flourish. This provides new foodsources for elk and other wildlife. Fires also promoterecycling of nutrients, which enriches the soil,
moving toward drier climatic regimes. Almost 80percent of agricultural lands of the United Statesface drying under the GFDL scenario. The GISSscenario produces a mix of wetting and drying inareas of natural cover, with the exception of somenoticeable drying in the wetlands. Agriculturallands (the Midwestern corn belt and California)are more effected, with over 40 percent of theagricultural lands showing some drying under theGISS scenario.
Natural resource systems could change in anynumber of ways in response to a changingclimate, but not all changes damage things thathumans value. For example, a gradual shift in the
boundaries of a wetland would probably not beconsidered a damage unless this results in areduction of the habitat, flood control, waterfaltering, or recreational services offered by thatwetland. Similarly, an increase in tree mortalitymay be of no concern in a forest valued as wildlifehabitat rather than as a source of timber supply.
The degree of human intervention may alsoinfluence the vulnerability of natural resourcesystems to climate change. Depending on hownatural systems are valued, they may be managedalong a spectrum from active to passive manage-ment regimes. Because intensively managed sys-tems are considered valuable, and because peopleare already exerting effort and expense to keepthem productive, use of additional measures torespond to a changing climate is likely. On theother hand, wilderness areas are essentiallyunmanaged-but highly valued precisely becauseof this lack of management. Active interventionto protect these areas seems unlikely (see vol. 2,ch. 5), but there may be little loss of value fromany but the most extreme effects of climatechange on these natural areas. Thus, climateimpacts on natural resource systems and the needfor taking precautionary actions in preparation forclimate changes cannot be evaluated without alsoconsidering how people value and manage theseresources. These are the issues considered insubsequent chapters that investigate the effects ofand possible responses to climate change inindividual natural resource sectors: coastal sys-tems, water resources, agriculture, wetlands, pre-serves, and forests.
The Intergovernmental Panel on ClimateChange, the National Academy of Sciences, andthe U.S. Environmental Protection Agency haveall conducted assessments of the potential im-pacts of climate change (see box 2-F). Theirreviews describe numerous impacts of climatechange on U.S. natural resource systems, whichlaid the foundation for this report. Subsequentchapters will summmize some of the predictionsmade by these reports for individual naturalresources, then explore in greater detail the
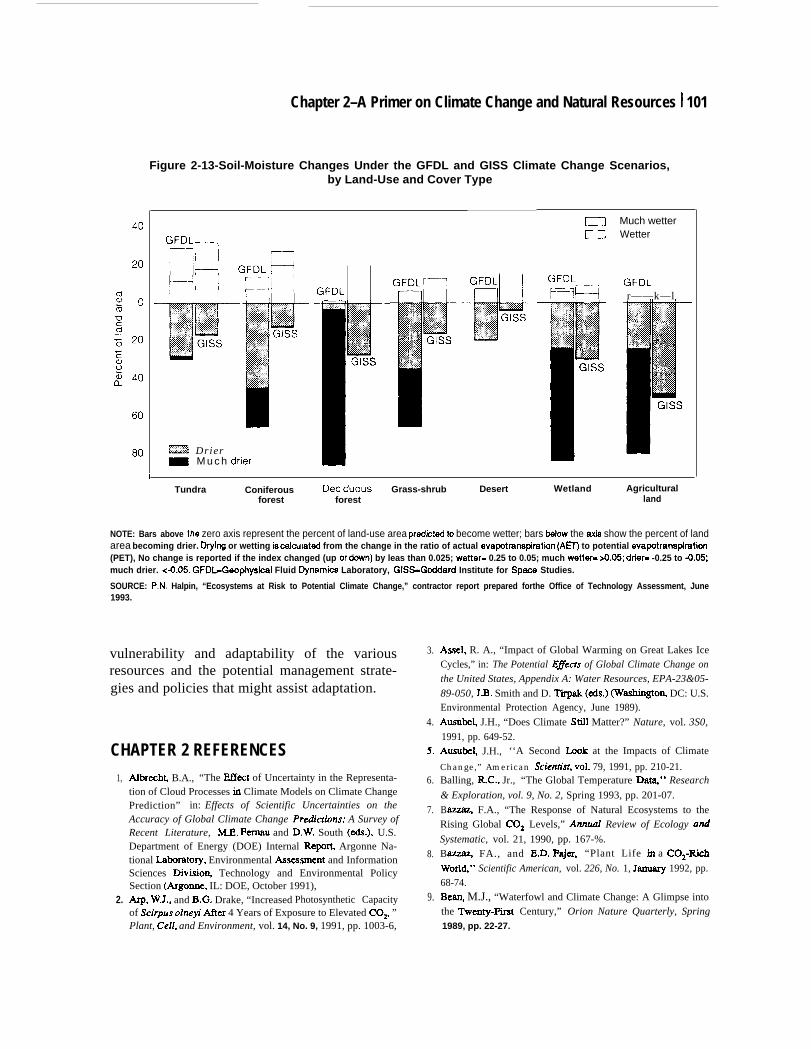
Chapter 2–A Primer on Climate Change and Natural Resources I 101
Figure 2-13-Soil-Moisture Changes Under the GFDL and GISS Climate Change Scenarios,by Land-Use and Cover Type
GFDL—
EZ23 Drier_ M u c h
—GFDL
l==!H
drier
GFDLGFDLr-lrl
Much wetterWetter
GFDL
mmGFDLr——k—l
[Tundra Coniferous Dec[duous Grass-shrub Desert Wetland Agricultural
forest forest land
NOTE: Bars above the zero axis represent the percent of land-use area predkted to become wetter; bars below the mds show the percent of landarea becoming drier. Dryfng or wetting iscalcuiated from the change in the ratio of actual evapotranspiration (AET) to potential evapotranspiration(PET), No change is reported if the index changed (up ordovm) by leas than 0.025; wetter- 0.25 to 0.05; much wetter- M1.05; dderm -0.25 to 4,05;much drier. .4.05. GFDL-Geophysical Fluid Dynamiea Laboratory, GiSS.Goddard Institute for Spaoe Studies.
SOURCE: P.N. Halpin, “Ecosystems at Risk to Potential Climate Change,” contractor report prepared forthe Office of Technology Assessment, June1993.
vulnerability and adaptability of the variousresources and the potential management strate-gies and policies that might assist adaptation.
CHAPTER 2 REFERENCES1,
2.
AllmchL B.A., “The E!%ct of Uncertainty in the Representa-tion of Cloud Processes in Climate Models on Climate ChangePrediction” in: Effects of Scientific Uncertainties on theAccuracy of Global Climate Change Predicn”ons: A Survey ofRecent Literature, M.E, Fernau and D.W. South (eds.), U.S.Department of Energy (DOE) Internal Repq Argonne Na-tional Laborsto~, Environmental Awiwment and InformationSciences Divisio~ Technology and Environmental PolicySection (&gonne, IL: DOE, October 1991),ArP, WJ., and B.G. Drake, “Increased Photosynthetic Capacityof Scirpus oln.+ Afker 4 Years of Exposure to Elevated COz, ”Plant, Cell, and Environment, vol. 14, No. 9, 1991, pp. 1003-6,
3.
4.
5,
6.
7.
8.
9.
Assel, R. A., “Impact of Global Warming on Great Lakes IceCycles,” in: The Potential Eflects of Global Climate Change onthe United States, Appendix A: Water Resources, EPA-23&05-
89-050, J.B. Smith and D. Tirpak (CdS.) (wSShill@O~ DC: U.S.Environmental Protection Agency, June 1989).Ausube~ J.H., “Does Climate Still Matter?” Nature, vol. 3S0,
1991, pp. 649-52.Ausube~ J.H., ‘‘A Second Ixwk at the Impacts of Climate
Change,” American Scientist, vol. 79, 1991, pp. 210-21.Balling, R.C,, Jr., “The Global Temperature Da@” Research
& Exploration, vol. 9, No. 2, Spring 1993, pp. 201-07.Bazzaz, F.A., “The Response of Natural Ecosystems to theRising Global C02 Levels,” AnnuaI Review of Ecology ad
Systematic, vol. 21, 1990, pp. 167-%.Bazzaz, FA., and E.D. Fajer, “Plant Life in a CO#ich
Worl&” Scientific American, vol. 226, No. 1, Januaq 1992, pp.68-74.B- M.J., “Waterfowl and Climate Change: A Glimpse intothe ‘Rventy-First Century,” Orion Nature Quarterly, Spring1989, pp. 22-27.
102 Preparing for an Uncertain Climate--Volume 2
Box 2-F--Major Assessments of Climate Change Impacts
Three major assessments by national and international organizations have addressed the potential impactsof climate change: the U.S. Environmental Protection Agency's (EPA’s) 1989 report, The Potential Effects ofClimate Change (94), the three-volume climate change series issued by the Intergovernmental PaneI on ClimateChange in 1990 (42, 43,44, and the 1992 supplement (45)), and a 1991 report by the National Academy ofSciences, Policy Implications of Greenhouse Warming (22), and its 1992 supplement These reports focus ondifferent aspects of climate change. Taken together, they lay the foundations for OTA’s assessment of theadaptability and vulnerabilityof systems to climate change, and their findings are cited throughout this chapter!
The EPA Report-In 1987, Congress requested that EPA study “the potential health and environmentaleffects of climate change including, but not... Iimited to, the potential impacts on agriculture, forests, wetlands,human health, rivers, lakes, estuaries, as well as societal impacts.’’ To respond, EPA conducted a massive 2-yeareffort, hiring more than a hundred contractors to model potential effects on each system, and contracting outseveral regional case studies to integrate how all impacts might interact in different regions. The results weresynthesized in a 400-page report accompanied by 11 appendixes of contractor papers.
EPA used regional predictions of temperature and precipitation generated by four major general circulationmodels (GCMs) to examine the sensitivities of managed and unmanaged systems and to evaluate regional effects.The climate predictions were distributed to contractors, who then incorporated the results into their own modelsfor crop growth, forest productivity, farm-level decisionmaking, etc., to predict the potential effects on particularsystems and in particular regions.
EPA found that unmanaged systems such as coastal wetlands, parks, and forests “may be unable to adaptquickly to rapid warming.” Effects could include a reduced range for many tree species, changes in forestcomposition, a decline in cold-water fish and shellfish (although some warm-water species could benefit), anincrease in species extinction, Ioss of coastal wetlands, and an increase in salinization of estuaries. Such impactscould begin in 30 to 80 years. Climate changes may heighten the effects of other stresses (such as pollution,increased radiation accompanying stratospheric ozone depletion, pests and pathogens, and fire). For example,climate-induced stress may make large regions of forests more susceptible to other stresses, such as fire, pests,disease outbreaks, wind damage, and air pollution. Changes in forest species and productivity could lead tosecondary effects such as increased soil runoff and erosion, reduced aquifer recharge, reduced biodiversity, andchanges in wildlife habitat and recreational opportunities. Species extinctions could increase (and biologicaldiversity could decline), especially in areas where roads, agriculture, and urban development block or restrictmigration pathways or habitat, and in areas that harbor heat-or drought-sensitive species. Some forested landcould become grassland. As communities and ecosystems are displaced by climate change, it may be necessaryto expand scientific knowledge on the practice of ecosystem restoration, so that Communities can be rebuilt indegraded sites or relocated to new areas where they have not existed in the past (94) (see also vol. 2, boxes 4-Aand 5-M).
Overall, EPA found that managed systems such as water resources and agriculture are more capable thannatural systems of withstanding climate change. However, problems may still arise as humans attempt to adaptto the changes to these systems brought about by climate change. Agricultural yields might be reduced, butproductivity could shift northward so that overall production could probably meet domestic needs, with somepossible reductions in exports. Farmers might have to change their practices, such as beginning or increasingirrigation, which might increase conflicts over water use. If climate change leads to reduced stream flows, waterquality may suffer because less water will be available for diluting or flushing pollutants and dissipating heat;these
1 All three reports were based on the assumption that there would be no major changes in climate variability.
Chapter 2–A Primer on Climate Change and Natural Resources 103
changes could affect fish and wildlife populations. The effects on agriculture might vary considerably over regions,with declines, for example, in crop acreage in the Great Plains potentially offset by increased acreage in the GreatLakes States.
Quality of life may not suffer much in areas where, for example, forests shift from one species to another, andwhere the shifts are gradual; however, in areas where forests die out altogether (such as may occur in some partsof California), people would face severe environmental and land-use effects. Recreation relies on relatively healthyforests;rapid changes that caused stressed or declining forests would Iikely reduce recreational opportunities anddemand.
The IPCC Report--The intergovernmental Panel on Climate Change (IPCC) is an international group ofhundreds of scientists from more than 50 countries established in 1988 by the World Meteorological Organizationand the United Nations Environment Program. The IPCC setup three working groups: Working Group i to assessthe scientific basis for how human activities affect the climate; Working Group ii to study the potential impacts ofclimate change worldwide; and Working Group III to formulate possible policy responses. The results werepublished in the three-volume Climate Change report in 1990 (The IPCC Scientific Assessment, The IPCC ImpactsAssessment, and The IPCC Response Strategies). The working groups continue to meet, and issue occasionalupdates to the 1990 reports.
The scientific assessment predicted that under a "business-as-usual” scenario (characterized by continuedreliance on coal-intensive energy sources and only modest efficiency increases), the global average temperaturewould increase at a rate of 0.5‘F (0.3%) per decade, with a Iikely increase of 2 oF (1 oC) over current Ievels by2025 and 5.4 oF (3 oC) before the end of the next century. The impact assessment used this business-as-usualprediction for increasing temperature (with accompanying estimates that equivalent atmospheric C02
concentrations 2 would double by 2025 to 2050 and sea level would rise about 1 foot (0.3 meter) by 2030) to predictpotential impacts on systems including natural terrestrial ecosystems, agriculture, and forestry.
IPCC suggested that climate change could shift climatic zones several hundred miles toward the poles overthe next 50 years, requiring natural terrestrial ecosystems to either migrate or adapt to a new climate regime. Therate of change will determine the degree of impacts: some species might be able to keep up with change, but somecould become extinct, thus reducing global biodiversity. Ecosystems are unlikely to move as units, but will developnew structures as species abundance and distribution are altered. Most at risk are systems with limited optionsfor adaptability (montane, alpine, and polar areas, island and coastal communities, remnant vegetation, heritagesites or reserves, and areas already under stress). Sealevel rise and ocean warming will affect fisheries, potentiallyreducing habitat for several commercially important species. Coastal wetlands maybe inundated by rising seasand forced to migrate inward, though in many areas, this may not be possible. inland wetland areas may comeunder increased pressure for agricultural use. As for managed systems, forests may become more susceptibleto parasites, and losses from fires will increase. It is unclear whether global agricultural productivity would increaseor decrease overall, but many regions are Iikely to experience shifts or losses in production (for example, a declinein cereal and horticultural production in the southern United States), which will alter trade patterns. Impacts willdiffer considerably from region to region, as will the socioeconomic effects. Water availability will Iikely increasein some areas and decrease in others, but regional details are not yet known. There may also be a change indrought risk, which could seriously affect agriculture at both the regional and global levels.
The NAS Report-The National Academy of Sciences (NAS) convened three different scientific panels toconduct preliminary analyses of climate change effects, mitigation strategies, and adaptation strategies. Eachpanel drafted a report that described their analyses and conclusions. A fourth “synthesis” panel drew on the workof the other three panels to formulate a policy report, which was published in April 1991.
2 The cumulative warming effect of all greenhouse gases is equivalent to a doubled C02 concentration.
(Continued on next page)
104 Preparing for an Uncertain Climate--Volume 2
Box 2-F-Major Assessments of Climate Change Impacts--(Continued)
The NAS panels assumed greenhouse warming in the range of 2 to 9°F (1 to 5oC), but did not give a specifictime frame of reference. Based on this scenario, NAS classified natural resource systems and human activitiesinto one of three categories: low sensitivity to climate change within the given range; sensitive but adaptable ata cost; and sensitive with questionable ability to adjust or adapt. NAS concluded that built systems generally fitinto the first or second categories, and managed crop or timber lands fit into the second.
Water resources are quite sensitive to climate because runoff is the “small difference between the largerquantities of precipitation and evaporation," and runoff “fluctuates relatively more” than either precipitation orevaporation. Changes in runoff will have adverse impacts only when water supply no longer matches waterdemand for use and consumption. In the United States, water supply and demand are now closely matched in theGreat Basin, Missouri, and California water regions, so these areas maybe particularly vulnerable to decreasesin precipitation (and conversely, they would reap large benefits should precipitation increase). Activities such asirrigation are also vulnerable to decreased precipitation because irrigation is most common in areas whereprecipitation is already light and evaporation is high. Unless climate changes quickly relative to demographicchanges that affect water demand, however, the NAS report concludes, “the overall impact of climate change isunlikely to be substantially more serious than that of the vagaries of the current climate” (21).
In contrast, NAS suggested that unmanaged ecosystems--the “natural landscape” and marine ecosystems--respond relatively slowly to climate change and that their ability to adapt is questionable and “problematic.”
SOURCE: Office of Technologyy Assessment, 1993.
10. Blumberg, A.F,, and D.M. Di Toro, “The Effects of Climate 18. Chambers, J.R., “U.S. Coastal Habitat Degradation and FisheryWarming on Lake Erie Water Quality,” in: The Potential Effectsof Global Climate Change on the United States, Appendix A:Water Resources, EPA-230-05-89-050, J.B. Smith and D.Tirpak (eds.) (Washington, DC: U.S. Environmental ProtectionAgency, June 1989).
11. Botkin, D. B., and R.A. Nisbet, “Projecting the Effects ofClimate Change on Biological Diversity in Forests,” in: GlobalWarming and Biological Diversity, R.L. Peters and T.E.Lovejoy (eds.) (New Haven, CT: Yale University Press, 1992).
12. Botkin, D.B., R.A. Nisbet, and T.E. Reynales, “Effects ofClimate Change of Forests of the Great Lakes States,” in: ThePotential Effects of Global Climate Change on the UnitedStates, Appendix D: Forests, EPA-230-95-89-054, J.B. Smithand D. Tirpak (eds.) (Washington, DC: U.S. EnvironmentalProtection Agency, June 1989).
13. Brady, N.C., The Nature and Properties of Soils, 9th Ed. (NewYork NY: MacMillan Publishing 1984), 750 pp.
14. Brewer, R., The Science of Ecology (Philadelphia: SaundersCollege publishing, 1988).
15. Broecker, W. S., “Unpleasant Surprises in the Greenhouse?”Nature, vol. 328, 1987, pp. 123-26.
16. Browne, M.W., “Report Says Carbon Dioxide Rise May HurtPlants,” New York Times, Sept. 18, 1992, p. A14.
17. Burns, R. M., and B.H. Honkala, “Silvics of North AmericanConifers,” vol. l, Agriculture Handbook 654 (Washington DC:U.S. Department of Agriculture, Forest Service, 1990).
Declines,’ in: Transactions of the North American Wildlife andNatural Resources Conference (Washington, DC: The Wildlife
Management Institute, in press).19. Clark, J. S., C.D. Reid, and G. Derda, Sensitivity of Major North
American Terrestrial Biomes to Global Change, draft reportprepared for the Electric Power Research Institute, 1992,
20. Clark, W.C., “Scale Relationships in the Interactions ofClimate, Ecosystems, and Societies,” in: Forecasting in theSocial and Natural Sciences, K.C. Land and S.H. Schneider(eds.) (Boston, MA: D. Reidel Publishing Co., 1987), pp.337-78.
21. Committee on Science, Engineering, and Public Policy, Panel
on Policy Implications of Greenhouse Warming, NationalAcademy of Sciences, National Academy of Engineering,Institute of Medicine, Policy Implications of GreenhouseWarming: Mitigation, Adaptation, and the Science Base (Wash-ington DC: National Academy Press, 1992).
22. Cooper, C.F., “Sensitivities of Western U.S. Ecosystems toClimate Change, ” contractor report prepared for the Office ofTechnology Assessment, August 1992.
23. COX, G.W., “Review of Draft Report on Vulnerabilities ofWestern U.S. Ecosystems to Climate Change: Biodiversity andWildlife Issues,” draft contractor paper prepared for Office ofTechnology Assessment July 1992.
Chapter 2–A Primer on Climate Change and Natural Resources I 105
24. Croley, TE., 11, and H.C. HartmaM, “Effecta of Climate
Changes on the Laurentian Great Lakes Xzvek,” iru ThePotential Efiects of Global Climate Change on The Um”tedStates, Appendix A: Water Resources, EPA-230-05-89-050, J.B.Smith and D. Tirpak (eds.) (WashingtorL DC: U.S. Environ-mental Protection Agency, June 1989).
25. Davis, O.K., “Ancient Analogs for Greenhouse Warming ofCentral (lilifo~’ in: The Pofentia/ E’ects of Global ClimateChange on the UnitedStates,Appeti”xD :Forests, EPA-23@95-
89-054, J.B. Smith and D. Tirpak (dS.) (wdlill@O~ DC: U.S.Environmemal Protection Agency, June 1989).
26. Dawso~ W.R., “physiological Responses of ‘Ammals to Higherlkmperatures, “ im Global Warnu”ng and Biological Diversity,RL. Peters and TE. Imvejoy (eds.) (lJew Haveq ff: YaleUniversity Press, 1992).
27. Drake, B. G., “Effect of Elevated C02 on Chesapeake BayWetlands,” Responses of Vegetation to Carbon Dioxide, in:Ecoytem and Whole Plant Responses, U.S. Department ofEnergy (DOE), Oftlce of Energy Researc4 Carbon DioxideResearch Division (Washingto% DC: DOE, April-November1988).
28. Drake, B.G., Research Scientist, Smithsonian EnvironmentalResearch Center, testimony before the Senate Committee onCommeree, Science, and Transportation Hearing on GlobalChange Research: Global Warmin g and the Biosphere, Apr. 9,1992.
29. Emanuel, W.R., H.H. Shug@ and M.P. Stevensoq “ClimaticChange and the Broad-Scale Distribution of ‘Rxreshial Ecosys-tem Complexes,” Climate Change, vol. 7, 1985, pp. 2943.
30. Frederick K., and P. Gleilq “Water Resourcxs and ClimateChange,” in: Greenhouse Warm”ng: Abatement and Adapta-
tion, N. Rosenberg, W, Easterling, P. Crossq and J, Darm-stadter (eds.) (Washington DC: Resources for the Future,1988).
31. Giant.z Ml-L, ‘‘The Use of Analogies in Forecasting Ecologicaland Societat Responses to Global Warming,’ Enw”romnmt, vol.33, December 1991, pp. 11-15,27-33,
32. Grulke, N.E., G.H. Riechers, W.C. Oechel, U. Hje@ and C.Jaeger, “Carbon Balance in lhssock ‘Ibndra Under Ambientand Elevated Atmospheric COz, ” Oecologia, VOL 83, 1990, pp.485494.
33. Hains, D.K., and C.F. Hains, “Iznpacts of Global Warming onRunoff in the Upper Chtahooehee River Bas@’ in: ThePotential E#ects of Global Climate Change on the UnitedStates, Appendix A: Water Resources, EPA-23@05-89-050, J.B.Smith and D. Tirpak (da.) (Washington DC: U.S. Environ-mental Protection Agency, June 1989).
34. HalpiQ P.N., “Ecosystems at Risk to Potential ClimateChange,” contractor report prepared for the 0f6ce of ‘lkchnol-ogy, June 1993.
35. Hammonx A.L., “Ecosystem Analysis: Biome Approach toEnvironmental Science,” Science, vol. 175, 1972, pp. 46-48.
36. HanseQ AJ., TA. Spies, F.J. Swansoq and J.L. Ohmanq“Conserving Biodiversity in Managed Forests, ” Bioscience,vol. 41, 1991, pp. 382-92.
37. Hansenj J., W. ROSSOW, and 1. Fung, “bz)g-~rm Monitoringof Global Climate Forcings and Feedbacks,’ in: NASA GoddardIm”tuse for Space Stuh”es Conference Publication, New York1992.
38. Heimanq M., “Modeling the Global Carbon Cycle,” paperpresented at the First Deme@a Meeting on Climate Friabilityand Global Change, Chianciano Theme, Italy, Oct. 28-Nov. 3,1991.
39. Holdridge, L.R., L#e Zone Ecology (San Jose, Costa Rica:Tropical Science Center, 1%7).
40. Hopkins, A.D., Bioclimatics: A Science of Life and ClimateRe2ations, U.S. Department of Agriculture (USDA) Miscellane-ous Publication 280 (Waahingtoq DC: USDA+ 1938).
41. Mao, S.B., “The Aerial Fertilization Effect of COZ and ItsImplications for Global Carbon Cycling and Max.un‘ um Green-house Warming,” Bulletin of the Amen”can Meteorotogica[Socie~, vol. 72, No. 7, July 1991, pp. %2-65.
42. Intergovernmental Panel on Climate Change (TPCC), WorldMeteorological Organiza tiom and United Nations EnvironmentPrograrq Climate Change: The IPCC Impacts Assessment,report prepared for IPCC by Working Group II, WJ, McG.~gart, G.W. Sheldou a n d D.C. Grif.fM (eds.) (Can-Australia: Australian Government publishing Service, 1990).
43. Intergovernmental Panel on Climate Change (WCC), WorldMeteorological organization and United Nations EnvironmentPrograrq Climate Change: The IPCC Response Strategies,report prepared for IPCC by Working Group III, 1990.
44, Intergovernmental Panel on Ctimate Change (IPCC), WorldMeteorological Organiza tiom and United Nations EnvironmentProgram, Climate Change: The fPCC Scientific Assessment,report prepared for IPCC by Working Group I, J.T HoughtoqGJ. Jenkins, and JJ. Ephraums (eds.) (Cambridge, England:Cambridge University Press, 1990).
45. Intergovernmental Pmel on Climate Change, World Meteoological Organizatl“o% and United Nations Environment Pro-v Climate Change 1992: The Supplementary Report to theIPCC Scientific Assessment, report prepared for IPCC byWorking Group I, J.T. Houghtou B.A. Callander, and S.K.Wrney (eds.) (Cambridge, England: Cambridge UniversityPress, 1992).
46. hrae~ Y.A., and S.M. Semenov, “Ecological Standards Setting:Methodology and Practical Issues: Problems of EcologicalMonitoring and Ecosystems Modeling,” I.xm@p@ Gtiome-teoizdat, vol. 13 (in press).
47. Kareiv% P.M., J.G. Kingsolver, and R.B. Huey (eds.), BioticInteractions and Global Change (Sunderlaz@ MA: SimmerAssociates, Inc., 1993),
48. Karl, TR., “Missing Pieces of the Puzzle,” Research &Exploration, vol. 9, No. 2, Spring 1993, pp. 234-49.
49. Kellogg, W., and Z. Zhow, “Sensitivity of Soil Moisture toDoubling of Carbon Dioxide in Climate Model ExperimentsPart I: North Ame~” Journal of Climate, VOL 1, No. 4, April1988.
50. Kdmer, D., and J.A. Arnone, “Responses to Elevated CarbonDioxide in Artificial ‘fkopicd Ecosystems, ” Science, vol. 257,Sept. 18, 1992, pp. 1672-75.
51. Krutillq J, V., “Conservation Reconsider@” American Eco-nomic Review, vol. 57, No. 4, September 1%7, pp. 777-86.
106 I Preparing for an Uncertain Climate--Volume 2
52.
53.
54.
55.
56.
57.
58.
59.
60.
61.
62.
63.
64.
65.
66.
LavvrczL B., “NET LOSS,” National WildI~e, vol. 30, October/November, 1992, W, 47-50,52.Letteimlal“er, D.P., ‘IIY. C@ and D.R. Dawdy, “Interpretationof Hydrologic Effects of Climate Change in the Sacmnxmt*sariJoaquin R.iVCX Basiq Calihr@” iw The Potential E&ects ofGlobal Climate Change on the United States, Appendix A:Water Resources, EPA-230-05-894150, J.B. Smith and D.Tirpak (eds.) (WashingtoXL DC: U.S. Environmental ProtectionAgency, June 1989).Lindzeq R. S., ‘Some Coolness Concernin gfflobal warming,”BuUetin of the American h4eteoro10gical Society, VOL 71,1990,pp. 288-290.Imrius, C., J. Jouz(?L D. l?qmau~ J. Hanseq and H. b Treu$“The IceCore Record: Climate Sensitivity and Future Green-house Warming,” Nature, vol. 347, 1990, pp. 139-145.hhhlmaqJ.D.,‘‘AM%@ Global Climate Change: When WiIlWe Have Better Evidence?” irx Climate Change and EnergyPolicy, L. Rosen and R. Glasser (eds.), Los Alatnos NationalLaboratory, LA-UR-92-502 (New Yo* NY: American Insti-tute of Physics, 1992), pp. 17-31.Manabe, S., and R.T Wetherald “Reduction in Summer SoilWetness Induced by an Increme in Atmospheric CarbonDioxide,” Science, vol. 232, 1986, pp. 62678.MattsorL W.J., and R.A. I-I& “The Role of Drought inOutbreaks of Plant-Eating Insects,” Bioscience, vol. 37, No, 2,February 1987, pp. 110-18.McCormiclq M.J., “Potential Climate Changes to the LakeMichigan Thermal Structure,’” in: The Potential Effects ofGlobal Climate Change on the United States, Appendix A:Water Resources, EPA-23@05-894150, J.B. Smith and D.Tirpak (eds.) (Washington, DC: U.S. Environmental ProtectionAgerwy, June 1989).Michaela, P.M., ‘The Greenhouse Conflagration Clinton/Goreand Global Warning,’ ‘ lecture [u The Cato Institute, Washing-ton DC, Dec. 14, 1992.Michads, P.M., Sound and Fury: The Science and Politics ofGZobaZ Wm”ng (Wash@toQ DC: The Cato Institute, 1992).Miller, BA., and W.G, Brock “Potential Impacts of ClimateChange on the ‘Iimnessee Wiley Authority Reservoir Sys~”h The Potential Eflects of Giobal Climate Change on theUnited States, Appendix A: Water Resources, EPA-230-05-89-050, J.B. Smith and D. Tirpak (edS.) (Washin@oq DC: U.S.Environmental Protection Agency, June 1989).Moreaq D.H., “It Will Be a Lmg Wait for Proof,” paperpresented at the Southeast Clnnate Symposium: Chan@ngClimate and Water Resources, Charleston SC, Oct. 27-29,1992.National Science Foundation “Soil-Warming Experimeds inGlobal Change Research” report of a workshop held in WoodsHole, MA, Sept. 27-28, 1991.Norby, R.J., E.G. O’Neil, and R.J. Luxmo Orq “Effects ofAtmospheric C02 Enrichment on the Growth and MineralNutrition of Quercus alba Seedlings in Nutrient Poor Soil,”Pkant physiology, VO1. 82, 1986, pp. 83-89,Oecllel, W.c., “Effects of Anticipated Changes in GlobalClimate and Atmospheric C02 on Western Ecosystems: Chapar-ral and Associated Forest Ecosystems,” draft contractor paperkx Office of lkchnology Assessrnentj July 1992.
67.
68.
69.
70.
71.
72.
73.
74.
75.
76.
77.
78.
79.
80.
4
111
1
oecl14 W.c., ‘TtetpnSes of Alaskan Biological ad SocialSystems to C!bate q: A scenario,” contmctor paper
m for Office of lbclmology Amwune@ Jan. 11, 1993.OecheI, W.C., and W.D. Billings, “Effect8 of Global Change onthe CarbonBalance of Arctic Plants and~~’’~~cticEcosystems in a Changing Climate: An EcophysiologicalPerspeti”ve, F.S. Chapin ~ RL. Jeff@es, J. SVObod& JRReynolds, and G.R Shaver (eds.) (San Diego, CA: Acadanicpress, 1992), pp. 139-68+
Geci@ W,C., and B.R. Straiq “Native Species Reqonses toWreased Carbon Dioxide Concentration” im DirectE&ts ofIncreasing Carbon Dioxide on Vegetation, DOWER-(X238, B.Rstrain awl J.D. cure (eds.) (washiqtoq DC: Us. Deparmmof Energy, Dccem&r 1985).Ovx J.’E, and PJ. Bartle@ “Assessing b Reqmnsc ofvegetation to Future climate change: Ecological Re8pomleSUrfhceS ad Paleoecological Model WIMatioQ” kc ThePotent&d E#kcts of Global Climate Change on the UnitedStates, Appenalx D: Forests, EEA-23095-89-054, JB. Smithand D. Tirpak (eds.) (w&lShkl@Oq DC: U.S. Envimnmcn.talProtection Agency, June 1989).Pa&w, BB., National Oceanic and Atmosphcxic AdmhMm—tion (NOM), Ocean and Lake Levels DivisioQ office of oceanand Earth Scieacq National Ocean Servi% NO* “The Useof Long Historical Sea Izvel Records in the Study of Climateand Global Change,” paper presented at Mnrine TkdmologySociety ’92, Washington DC, Oct. 19-21, 1992.Perry, D.A., “Landsqe Pattern and Fomt Pests,” NorthwestEnvironmentalJournal, VOL 4, No. 213, 1988.Perry, M., “The Potential Effect of climate change onAgriculture and Land Use,” Advances in Ecological Research,vol. 22, 1992, pp. 63-91.Peters, RL., and J.D.S. Darling, “The -ouse Effect andNature Reserves,” Bioscience, December 1985, pp. 707-17.P@ D.E., “Data Leave Little Doubt l%at Fish Are in Peril ,“The New York Times, Aug. 3, 1993, p. C4.Ray, G.C., B.P. Haydm A.J. Bu&er, Jr., and M.G. McCmnick-Ray t “Effects of Global Warming on the Biodivemity ofCoastal-Marine Zones,” b Global Warming and BiologicalDiversi(y, R.L Peters and TX. Lovejoy (da.) (New Haveq CT:Yale University Press, 1992), pp. 91-104.Ray, G.C., M.G. MSormick-Ray, and F.M. Potter, GlobalClimate Change and the Coastal tine: Evaluation of Impactsm Marine Fisheries and Bwdiversity of the U.S., cmtnwkm
m p- for the Office o f llXhnology kmsamen~Pebruary 1993.W@ D., R Goldberg, J. Hanseq C, Rcznzwig, and R Rudy,“Potential Evapotranspiration and the I&lihwd of FutureDrq@” Journal of Geophysical Research, vol. 95, No. D7,rune 20, 1990, p. 10,001.Rin+ D., C,~ and R Goldbergj “Modelling theIIydrological Cycle in Assessments of climate -“Vature, vol. 358, 1992, pp. 119-122.$chneider, S., P. GM+ and L. Meams, “prospects for Climato3umge,” h Climate Change and U.S. Water Resources, P.Waggoner (cd.) (New York John Wiley and Sons, 1990), pp.!1-73.
Chapter 2–A Primer on Climate Change and Natural Resources I 107
81. Schneider, S.H., L, Mearns, and P.H. Gleick+ “Climate-ChangeScenarios for Impact Assessment” in: G106uI Warming andBiological Diversity, R.L. Peters and T.E. Lovejoy (eds.) (NewHaveq CT: Yale University Press, 1992), pp. 38-55.
82. Sheer, DY., and D. _ “Methods for Evaluating thePotential Impacts of Global Climate Change: Case Studies of theState of California and AtlanQ Gee@%” in: The PotentialEfects of Global Climate Change on the United States,Appendix A: Water Resources, EPA-23CL05-89-050, J.B. Smithand D. Tirpak (eds.) (WashingtorL DC: U.S. EnvironmentalRotection Agency, June 1989).
83. Smit4 W. H., “United States Forest Response and Vulnerabilityto Climate Change, ” contractor report prepared for the OffIceof ‘Ikchnology Assessment May 1992.
84. Spencer, RW., and J.R Christy, “Precise Monitoring of Global‘Rxnperature Trends from Satellites,” Science, vol. 247, 1990,pp. 1558-62.
85. Titus, J.G., cd., Greenhouse Effect, Sea LevelRise, and CoastalWetlands, EPA-230-05-86013 (Washington DC: U.S. Envi-ronmental protection Agency, July 1988).
86. ‘lbpping, J. C., Jr., and J.P. Bond The Potential Impact ofClimate Change on Fisheries and Wiidlife in North America,report of the Climate Institute to the U.S. EnvironmentalProtection Agency, May 1988.
87. Tracy, C.R., “Ecological Responses of Animals to Climate,”in: Global Warming and Biological Diversity, R.L. Peters andT.E. Lovejoy (eds.) (New Haven, CT: Yale University Press,1992).
88. U.S. Congress, CMce of lkchnology Assessment (OTA),Changing by Degrees: Steps to Reduce Greenhouse Gases,OTA-0482 (W%shingtou DC: U.S. Government printingOffice, February 1991).
89. U.S. Congress, GffIce of Ikchnology Assessment (OTA),Forest Sem’ce Planning: Accommodating Uses, ProducingOutputs, and Sustaining Eco~stems, OTA-F-505 (Washingto%DC: U.S. Governme nt Printing Offke, February 1992).
90. U.S. Congress, Gff3ce of ‘JkcImology Assessment (OTA),Harrr@ Non-Indigenous Species in the United States (Wash-
@tom DC: Government printing Oftlce, 1993).91. U.S. Department of Commeme, Nationat Oceanic and Atmos-
pheric Administration (NOM), National Marine FisheriesSemice (NMFS), Our Living Oceans: The First Annual Reporton the Status of the U.S. Living Marine Resources, NOA4Technical Memo, NMFS-FISPO-1, 1991.
92. U.S. Department of Energy (DOE), Argome National Labora-tory, Environmental Assessment and Information SciencesDivisiou Tdmology and Environmental Policy Sectioq Ef-fects of Scientific Uncertainties on the Accuracy of GlobalClimate Change Predictions: A Survey of Recent Literature,U.S. DOE internal report, M.E. Fernau and D.W. Soutb (eds.)(Argonne, IL: DOE, October 1991).
93. U.S. Department of Energy (DOE), Office of Energy Researc&Office of Basic Energy Sciences, @bon Dioxide ResearchDivisiow Direct Effects of Increasing Carbon Dioxide onVegetation, DOE/ER-0238, B.R, Strain and J.D. Cure (eds.)(?Abh@ton+ DC: U.S. DOE, December 1985).
94. U.S. Environmental protection Agency (EPA), The PotentialEffects of Global Climate Change on the Uru”ted States,EPA-23&05 -89-050,J.Jj.” Smith andD, Tirpak(eds.) (washing-
ton DC: U.S. EPA December 1989).
95. U.S. Environmental Protection Agency @PA), The PotentialEffects of Global Climate Change on the United Stites,Appendix A: Water Resources, EPA-23 CMM-89-050, J.B.Smith and D. Tirpak (MIs.) (T%shingtow DC: U.S. EPA June1989).
%. U.S. Environmental Protection Agency (EPA), The PotentialEffects of Global Climate Change on the United States,
Appendix D: Forests, EPA-230-95-89-054, J.B. Smith and D.Tirpak (eds.) (Washington, DC: U.S. EPA, June 1989).
97. Urba D.L., and H.H. ShugarL “Forest Response to ClimaticChange: A Simulation Study for Southeastern Forests,” in:The Potential Eflects ~ Global Ciimate Change On The
United States, Appendix D: Forests, EPA-23 G95-89-054, JJ3.Smith and D. Tirpak (eds.) (Washington DC: U.S. Environ-mental Protection Agency, June 1989).
98. Warre% S.R., Coastal Wetland Vulnerabilities to ClimateChange, contractor report prepared for Gt31ce of ‘lkchnologyAssessment July 30, 1992.
99. WarriclL R.A., R. Giffor& and M.L. Parry, “COz, ClimaticChange and Agriculture, ‘‘ in: The Greenhouse E#ect, Climatic
Change and Ecosystems, B. Bolin et al. (eds.), SCOPE 29(New York, NY: John Wiley and Sons, 1986).
100. Webb, T., III, “Past Cbanges in Vegetation and Climate:
hssons for the Future, “ in: Global Warming and Biological
Diversity, R.L. Peters and T.E. Lovejoy (eds.) (New HaveqCT: Yale University press, 1992), pp. 59-75.
101. WillarL D. E., and L.D. Kosmond, A Water.rhed-Ecosystem
Approach to Land and Water Use Planning and Management,
contractor report prepared for the Oftlce of TechnologyAssessment Aug. 28, 1992.
102. Willard, D.E., et al., Wetland Vulnerabilities to ClimateChange, contractor report prepared for the 0fi3ce of lkchnol-ogy Assessment, Aug. 18, 1992.
103. WilIiams, P,B., ‘‘The Impacts of CIimate Change on theSalinity of San Francisco Bay,” in: The Potential E’ec:s of
Global Climate Change on the United States, Appendix A:
Wafer Resources, EPA-230-05-89-050, JB. Smith and D.
Tirpak (eds.) (Washington DC: U.S. Envimrunentid Protec-
tion Agency, June 1989).104. Woodrnaq J.N., and C.S. Furiness, “Potential Effects of
Climate Change on U.S. Forests: Case Studies of Californiaand the Southeasl’ in: The Potential Effects of Global Climate
Change on the United States, Appendix D: Forests, EPA-23(L95-89-054, J.B. Smith and D. Tirpak (eds.) (%hShiKi$j’tO~ DC:
U.S. Environmental Rotection Agency, June 1989).105. Wyman+ R.L., ‘‘Multiple Threats to Wildlife: Climate Change,
Acid Precipitation and Habitat Fragmentation” in: Global
Climate Change and Lfe on Earth, RL. Wyman led.) (NewYork, NY: Routledge, Chapman, & Hall, 1991), pp. 134-55.

108 I Preparing for an Uncertain Climate--Volume 2
106. 2Minaki, C., and M-B. Davis, “Hind Times Ahead for @eat 107. Ziskaj L.H,, B.G. Drake, and S. Chamberlain+ “Lon&’I&rm~For@s: A tie Threshold Model hdiCtS Responses Photosynthetic Response in Single haves of a ~ and Cd Srdtto CO+duccd Climate Change,’ m: The Potential Effects of Marsh Species Grown at Elevated Atmospheric COZ in Situ,’G1oW Climate Oumge on the United States, Appendix D: Oecologia, vol. 83, 1990, pp. 469-72.Forests, EPA-230-95-89-0S4, J.Il. Smith and D. Tiqxtk (e&.)(Washington DC: U.S. Environmc@zd Protection Agency,b 1989).
Global ChangeResearch
in theFederal
Government
n October 13, 1992, the United States ratified the UnitedNations Framework Convention on Climate Change.The convention was one of the key accomplishments ofthe United Nations Conference on Environment and
3
Development (UNCED) held in Rio de Janeiro in 1992. Itsdeclared goal is ‘‘stabilization of greenhouse gas concentrationsat a level that would prevent dangerous anthropogenic interfer-ence with the climate system, ’ and it calls for parties to return“individually or jointly to their 1990 levels of these anthropo-genic emissions of carbon dioxide and other greenhouse gasesnot controlled by the Montreal Protocol” (46). Most of the 166countries that signed the convention have pledged to do so by2000 (on April 21, 1993, President Clinton made a commitmentto reduce U.S. greenhouse gas emissions to 1990 levels by thatyear). The convention also requires all participating countries toprepare action plans detailing their strategy to mitigate climatechange. The Biodiversity Convention, signed by most develop-ing and industrialized countries at UNCED, calls for thedevelopment of strategies for global biodiversity conservation,and Agenda 21, the comprehensive action agenda to promotesustainable development adopted at UNCED, also calls forpolicies to minimize environmental degradation.
All these concerns about climate change, biodiversity, andsustainable development reflect a policy agenda that is inextrica-bly linked to scientific research. “The relationships betweenscientific and technological advancement and government sup-port are complex, and the stakes in these decisions are high, notjust for scientists and engineers, but for society as a whole.Consequently, a better understanding of the process of articulat-ing goals, both within and outside science, is vital” (3).
I 109
110 I Preparing for an Uncertain Climate--Volume 2
The Federal Government launched a multi-agency research effort in 1989 in response to theuncertainties and potential risks of climatechange. Its purpose is to observe, understand, andpredict global change (9) When the U.S. GlobalChange Research Program (USGCRP) was cre-ated as a Presidential Initiative in 1989, it did nothave an explicit plan to link research to policy.Before codifying the program, Congress directedit to provide information useful to policy makers;however, Congress did not identify or mandateany mechanism to ensure this. When the programwas first implemented, key questions of thescientists and policy makers were: Are humanssignificantly changing the climate, and can cli-mate change be predicted? The program wasintended to replace a crisis-driven, one-problem-at-a-time approach to environmental problemswith a more systemic, proactive approach thatrecognizes that different environmental problemsare linked by the very nature of the Earth system.1
Although the program is scientifically well--grounded, it has become overwhelmingly a physi-cal science program focused on basic Earthsystem processes that largely ignores the behav-ioral, economic, and ecological aspects of envi-ronmental problems. For example, understandingthe role clouds play in climate change and the roleof the ocean-kind-atmosphere interface is now itshighest priority.
Understanding the size and scope of USGCRPcan be difficult, and the coordination challengesof such a large interagency program are formida-ble. Agency personnel committed to the programhave made a commendable effort to ensure thatthe program functions smoothly. However,USGCRP is not a managed entity with onebudget, nor does it have an authoritative bodymaking decisions on projects. It is, rather, a
loosely coordinated collection of several pro-grams and budgets. Even this level of coordina-tion is undermined at the legislative level, wherethe program, collected into a compilation ofbudgets by the Federal Coordinating Council forScience, Engineering, and Technology(FCCSET), is splintered into several parts andnever considered as a whole during the authoriza-tion, appropriation, and oversight processes.
The primary questions of policy makers havechanged since 1989 in the wake of the worldclimate treaty and the publication of several keyreports: the Intergovernmental Panel on ClimateChange (IPCC) reports, the Environmental Pro-tection Agency (EPA) reports on the potentialeffects of climate change and policy options, andthe Committee on Science, Engineering andPublic Policy (COSEPUP) report.2 It is nowgenerally accepted that unequivocal detection ofthe greenhouse effect requires another decade ofmeasurements, and that rates of climate changeand regional details about climate changes willnot be available for at least that long (see ch. 2).Thus, questions being asked today have movedbeyond the basic science issues of “observing,understanding and predicting’ climate change toa second set of concerns: What can be done tomitigate or adapt to climate change? What are theclimate effects of most concern? How can wemanage natural and human systems wisely givenan uncertain climate? Consequently, USGCRP’Smission statement and priorities are now toonarrow to address questions such as how tominimum negative impacts of climate change.
The congressional committees requesting thisstudy recognized that decisionmaking must con-tinue in the face of uncertainty. They expressedthe following concerns to the Office of Technol-ogy Assessment (OTA):
1 ‘Ile Earth system is the sum of all interactions among living organisms and their biotic and abiotic environments.2 IPCC’S Scientific Assessment (28), Impacts Assessment (26), Response Strategies (27), and Supplementary Report to the IPCC Scienh~c
Assessment (29); EPA’s Policy Optiomfor Stabilin”ng Global Climate (52) and The Potential Eflects of Global Climate Change on the Utu”tedStates (51); and COSIIPLJP’S Panel on Policy Implications of Greenhouse Warming, National Academy of Sciences, National Academy ofEngineering, and Institute of Medicine, Policy Implications of Greenhouse Warming: Mitigation, A&aptation, and the Science Base (10).
■
■
✘
Chapter 3-Global Change Research in the Federal Government I 111
“We think it is prudent to begin--today—investigating how our research and develop-ment programs should incorporate concernsabout climatic uncertainty. ”3
‘‘Do current U.S. R&D Programs focus onthe right questions to provide informationabout effects on different systems, potentialstrategies for making systems more resilientin the face of climate change and adapting tosuch changes that may occur?’
“What information can more research pro-vide over various time frames to guidedecisions about reducing greenhouse gasemissions, ameliorating effects of globalclimate change, and building resiliency intosystems?’
Conducting research to answer some of thesequestions has been a low priority. Although theresults of the program, as currently structured,will provide valuable information for predictingclimate change, they will not necessarily contrib-ute to the information needed by public andprivate decisionmakers to respond to globalchange. Three areas are particularly lacking:ecosystem-scale research, adaptation research(ecological, human, and economic), and inte-grated assessments (evaluation of all focusedand contributing research results and their impli-cation for public policy). Research can begin nowon topics more closely related to policy decisionsdespite incomplete answers from the physicalsciences. More research is needed on the impactsof climate change on natural and managed eco-systems and the resulting implications for landand water resource management, on how peopleadapt, and on why people resist change. Keyprojects for a USGCRP committed to policy-relevant research should also include gatheringinformation about the relative importance ofpopulation size and expectations of quality-of-life
improvements, the demand for goods and services(including clean water, agriculture and forestryproducts, and access to natural areas), and eco-nomic and institutional barrriers to the dissemina-tion and adoption of technological innovation.Some of the research in these areas will takedecades and, if started now, may leave us muchbetter prepared to respond to global change in thefuture.
Implicit in the current structure of USGCRP isthat the initiation of a comprehensive adaptationresearch program must wait until predictions ofclimate change are reliable. However, there areseveral important reasons not to wait to initiateadaptation research. First, according to IPCCestimates, few reliable predictions of climatechange on a regional scale will be available beforethe next 15 to 20 years. Although such regionalinformation might help focus research on man-aged and natural systems in areas expected toexperience the most change, research on ecosys-tems is a multidecade task (see vol. 2, chs. 4-6)and should begin now. Second, even though theeffects of climate change on a regional levelcannot currently be modeled accurately, generaleffects can be predicted, such as sea level rise.Adaptation research that addresses sea level riseand other effects of climate change need not waitfor reliable predictions. Third, much adaptationresearch makes sense regardless of climatechange. For example, restoration of wetlandsaddresses adaptation to climate change, but it alsoaddresses the current depletion of wetlands due toother causes. Adaptation research can use histori-cal records of societal, economic, and environ-mental impacts of environmental change com-bined with reasonable hypothetical scenarios forfuture environmental change (31).
Because policy makers and scientists havedifferent educational and professiona1 backgrounds,scientific research findings need to be translated
3 HOUSC cotintX OXI SCICIKC, sptMX, @ khROIO~, k~r to o~ Sept. 27* 1~1.4 Senate Cornrnittee on Environment and Public Works, letter to 0~ Oct. 4, 1991,
s Senate C ommittec on Commerce, Science, and Tnmsportatioq letter to Ow Oct. 8, 1991,
112 I Preparing for an Uncertain Climate--Volume 2
into terms relevant to policy making and deci-sionmaking. Regardless of the “completeness”of climate research, policy makers are makingdecisions now that affect global change andwhether the Nation will mitigate and/or adapt toit. They also decide where to allocate scarceresources for research.
A recent National Research Council report,Research to Protect, Restore, and Manage theEnvironment (37), stated: “No matter how goodthe science, environmental problems cannot besolved without integrating the science with envi-ronmental policy. To accomplish that, integrativestudy is needed to bridge the multidisciplinarygaps and deal with the conflicting goals held byvaried constituencies. Research is necessary butnot sufficient to solve problems. ’ One way toimprove the relevance of research results forpolicy makers is through the use of integratedassessments. Integrated assessments are a mecha-nism for synthesizing all the research relevant toan identified problem and for presenting researchresults in policy-relevant language. Such assess-ments, if conducted by multidisciplinary teams ona regular basis, could help bring together andevaluate research results produced by USGCRP,which is now composed largely of isolatedprograms and projects.
Although assessments were not included in theoriginal USGCRP program, they are included ina rudimentary form in the FY 1994 budget (8).However, there has been no fundamental changein the mission of USGCRP, which remainspredominately focused on understanding climatechange. As a result, different people draw differ-ent conclusions about what changes in researchfocus to expect from USGCRP. In addition, thequality of assessments is determined solely by theinformation fed into them and the backgrounds ofthose constructing the assessment framework. Ifecological, economic, and sociological researchcontinues to be neglected, the planned assess-ments will not be useful to policy makers (24).John Gibbons, assistant to the President forscience and technology, testified recently that
USGCRP needs to expand the scope of itsresearch to include the impacts of climate changeon natural and human environments and strate-gies for mitigating and adapting to climatechange. He also recognized the need to improvethe integration of research with policy making(20).
This chapter will examine the broad issuessurrounding the Federal research effort to under-stand climate change-particularly within thecontext of the natural and managed systemsdiscussed in chapters 4 through 6 of volumes 1and 2. The options presented here, if imple-mented, could help commit the Federal Govern-ment to addressing areas of imbalance inUSGCRP, the need for adaptation research, andthe issues surrounding a national research pro-gram with an explicit science-policy interface.These program changes could benefit policymakers and decisionmakers by ensuring thatUSGCRP and other federally funded globalchange research supply the integrated informa-tion they need to make choices in the face ofuncertainty about global change and its impacts.
THE U.S. GLOBAL CHANGERESEARCH PROGRAM
I Inception and StructureRecognition that human activity could signifi-
cantly alter the global environment grew duringthe 1970s and 1980s. Concerns focused particu-larly on the threat of climate change fromincreased emissions of greenhouse gases and thedepletion of the ozone layer by chlorofluorocar-bons (CFCS). In response to the potential risks ofclimate change and the uncertainties surroundingthe science, the Federal Government launched amassive, multiagency research effort in 1989 “toobserve, understand, and, ultimately, predict globalchanges and to determine the mechanisms influ-encing these changes” (9). In 1989, USGCRPwas developed by the Committee on EarthSciences (now the Committee on Earth and
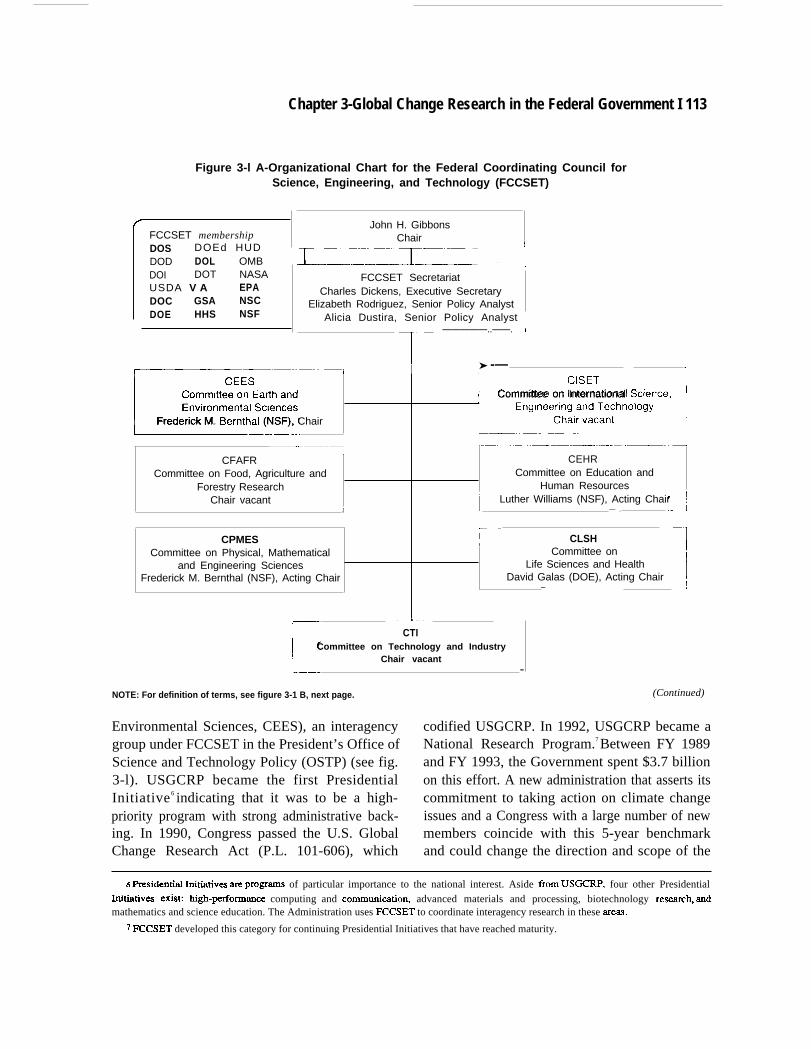
Chapter 3-Global Change Research in the Federal Government I 113
Figure 3-l A-Organizational Chart for the Federal Coordinating Council forScience, Engineering, and Technology (FCCSET)
(FCCSET membershipDOS DOEd HUDDOD DOL OMBDOI DOT NASAUSDA V A EPADOC GSA NSCDOE HHS NSF
~“—”
John H. GibbonsChair
r—r’— -----::
FCCSET SecretariatCharles Dickens, Executive Secretary
Elizabeth Rodriguez, Senior Policy AnalystAlicia Dustira, Senior Policy Analyst I
T
—————..——. —A
—~ I ➤ -— 1
E’!!!: :_E::iii&z.]Committee on International Sctence,
Frederick M. Bernthal (NSF), Chair
—~——
CFAFR CEHRCommittee on Food, Agriculture and Committee on Education and
Forestry Research Human ResourcesChair vacant
\ JLuther Williams (NSF), Acting Chair
J — .
CPMES r CLSHCommittee on Physical, Mathematical Committee on T
and Engineering Sciences Life Sciences and HealthFrederick M. Bernthal (NSF), Acting Chair David Galas (DOE), Acting Chair
— 1
r —L
CTICommittee on Technology and Industry
Chair vacant—
NOTE: For definition of terms, see figure 3-1 B, next page.
Environmental Sciences, CEES), an interagencygroup under FCCSET in the President’s Office ofScience and Technology Policy (OSTP) (see fig.3-l). USGCRP became the first PresidentialInitiative 6 indicating that it was to be a high-priority program with strong administrative back-ing. In 1990, Congress passed the U.S. GlobalChange Research Act (P.L. 101-606), which
(Continued)
codified USGCRP. In 1992, USGCRP became aNational Research Program.7 Between FY 1989and FY 1993, the Government spent $3.7 billionon this effort. A new administration that asserts itscommitment to taking action on climate changeissues and a Congress with a large number of newmembers coincide with this 5-year benchmarkand could change the direction and scope of the
6 ~sidenti~ tititivm ~e PmgXWIIS of particular importance to the national interest. Aside horn USGCRP, four other Presidentialklititltk% exist: high-perfo rrnarw computing and communication+ advanced materials and processing, biotechnology research andmathematics and science education. The Administration uses FCCSET to coordinate interagency research in these areas.
T FCCS13T developed this category for continuing Presidential Initiatives that have reached maturity.
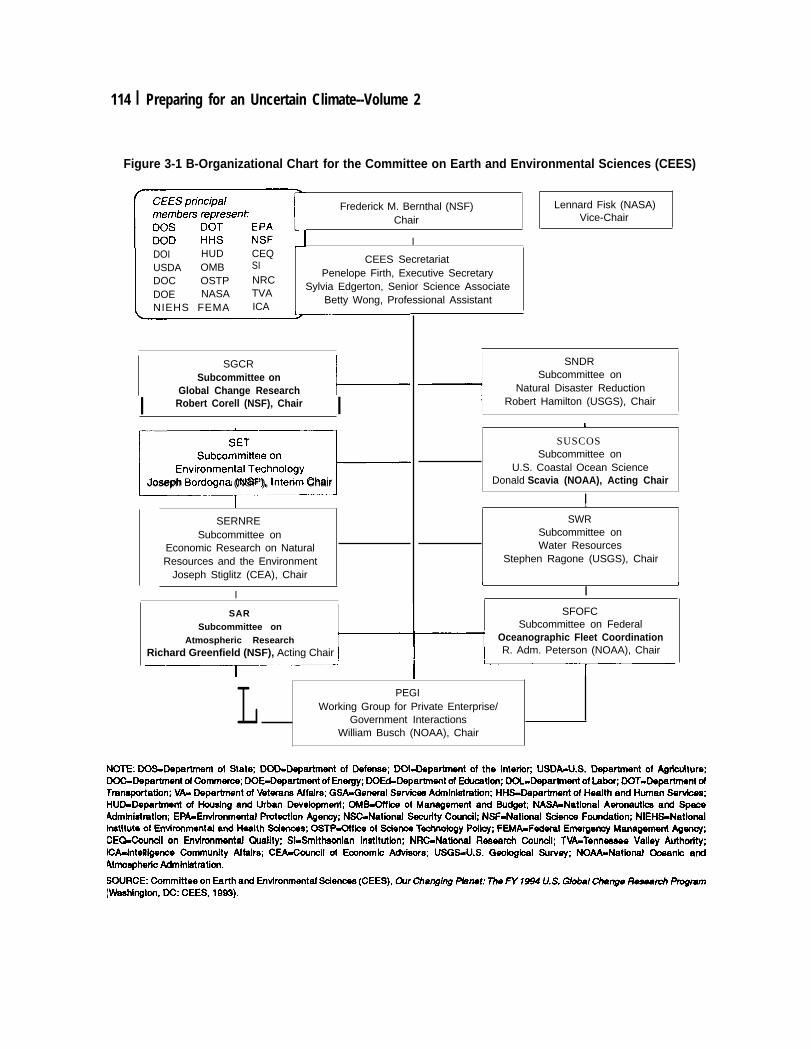
114 I Preparing for an Uncertain Climate--Volume 2
Figure 3-1 B-Organizational Chart for the Committee on Earth and Environmental Sciences (CEES)
F-l
Frederick M. Bernthal (NSF) Lennard Fisk (NASA)
Chair Vice-Chair
IDOI HUD CEQUSDA OMB SI CEES Secretariat
DOC OSTP NRCPenelope Firth, Executive Secretary
DOE NASA TVASylvia Edgerton, Senior Science Associate
NIEHS FEMA ICABetty Wong, Professional Assistant
SGCRSubcommittee on
Global Change Research L
I Robert Corell (NSF), Chair I
l-TEl_._J-Joseph Bordogna (NSF”), Intenm Chair
1
SERNRESubcommittee on
Economic Research on NaturalResources and the Environment
Joseph Stiglitz (CEA), Chair
I
+
SNDRSubcommittee on
Natural Disaster ReductionRobert Hamilton (USGS), Chair
I
SUSCOSSubcommittee on
U.S. Coastal Ocean ScienceDonald Scavia (NOAA), Acting Chair
I1SWR
Subcommittee onWater Resources
Stephen Ragone (USGS), Chair
t 1I
SFOFCSubcommittee on Federal
SARSubcommittee on
Atmospheric Research
+17Oceanographic Fleet Coordination
Richard Greenfield (NSF), Acting Chair R. Adm. Peterson (NOAA), Chair
L1
PEGIWorking Group for Private Enterprise/
Government InteractionsWilliam Busch (NOAA), Chair
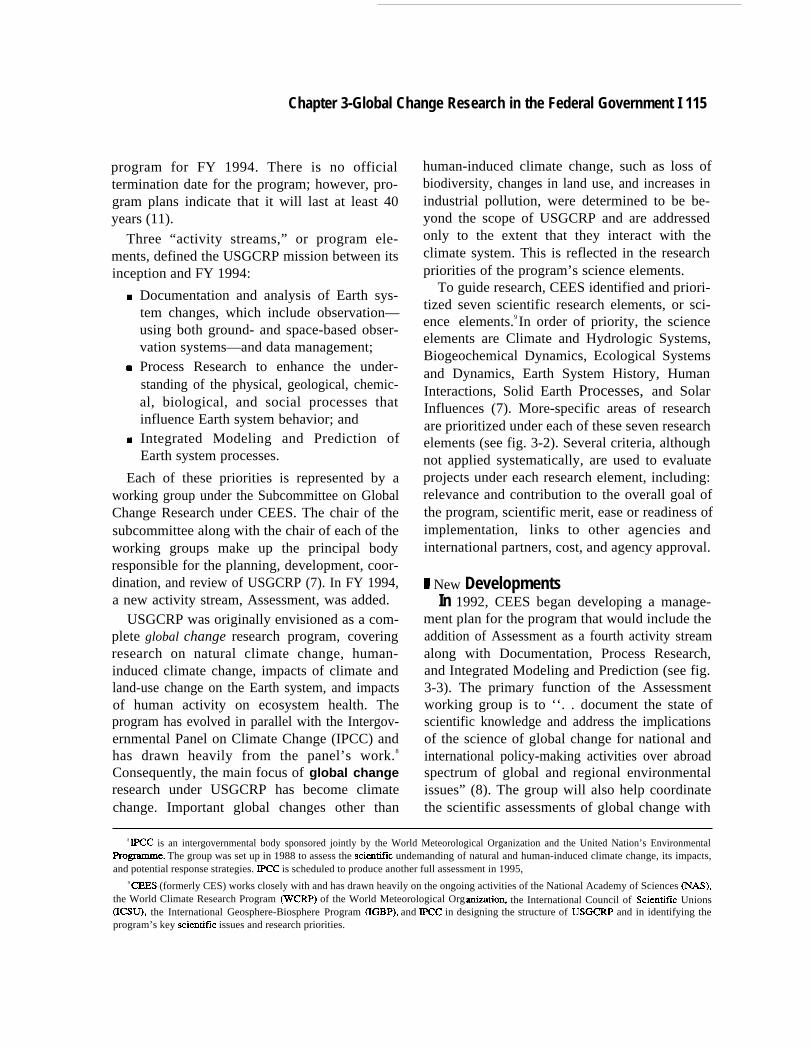
Chapter 3-Global Change Research in the Federal Government I 115
program for FY 1994. There is no officialtermination date for the program; however, pro-gram plans indicate that it will last at least 40years (11).
Three “activity streams,” or program ele-ments, defined the USGCRP mission between itsinception and FY 1994:
Documentation and analysis of Earth sys-tem changes, which include observation—using both ground- and space-based obser-vation systems—and data management;Process Research to enhance the under-standing of the physical, geological, chemic-al, biological, and social processes thatinfluence Earth system behavior; andIntegrated Modeling and Prediction ofEarth system processes.
Each of these priorities is represented by aworking group under the Subcommittee on GlobalChange Research under CEES. The chair of thesubcommittee along with the chair of each of theworking groups make up the principal bodyresponsible for the planning, development, coor-dination, and review of USGCRP (7). In FY 1994,a new activity stream, Assessment, was added.
USGCRP was originally envisioned as a com-plete global change research program, coveringresearch on natural climate change, human-induced climate change, impacts of climate andland-use change on the Earth system, and impactsof human activity on ecosystem health. Theprogram has evolved in parallel with the Intergov-ernmental Panel on Climate Change (IPCC) andhas drawn heavily from the panel’s work.8
Consequently, the main focus of global changeresearch under USGCRP has become climatechange. Important global changes other than
human-induced climate change, such as loss ofbiodiversity, changes in land use, and increases inindustrial pollution, were determined to be be-yond the scope of USGCRP and are addressedonly to the extent that they interact with theclimate system. This is reflected in the researchpriorities of the program’s science elements.
To guide research, CEES identified and priori-tized seven scientific research elements, or sci-ence elements.9 In order of priority, the scienceelements are Climate and Hydrologic Systems,Biogeochemical Dynamics, Ecological Systemsand Dynamics, Earth System History, HumanInteractions, Solid Earth Processes, and SolarInfluences (7). More-specific areas of researchare prioritized under each of these seven researchelements (see fig. 3-2). Several criteria, althoughnot applied systematically, are used to evaluateprojects under each research element, including:relevance and contribution to the overall goal ofthe program, scientific merit, ease or readiness ofimplementation, links to other agencies andinternational partners, cost, and agency approval.
~ New DevelopmentsIn 1992, CEES began developing a manage-
ment plan for the program that would include theaddition of Assessment as a fourth activity streamalong with Documentation, Process Research,and Integrated Modeling and Prediction (see fig.3-3). The primary function of the Assessmentworking group is to ‘‘. . document the state ofscientific knowledge and address the implicationsof the science of global change for national andinternational policy-making activities over abroadspectrum of global and regional environmentalissues” (8). The group will also help coordinatethe scientific assessments of global change with
8 IPCC is an intergovernmental body sponsored jointly by the World Meteorological Organization and the United Nation’s EnvironmentalProgramme. The group was set up in 1988 to assess the scientitlc undemanding of natural and human-induced climate change, its impacts,and potential response strategies. IPCC is scheduled to produce another full assessment in 1995,
9 CEES (formerly CES) works closely with and has drawn heavily on the ongoing activities of the National Academy of Sciences (NAS),the World Climate Research Program (WCRP) of the World Meteorological Organizatio~ the International Council of ScientMc Unions(ICSU), the International Geosphere-Biosphere Program (IGBP), and IPCC in designing the structure of USGCRP and in identifying theprogram’s key scientitlc issues and research priorities.
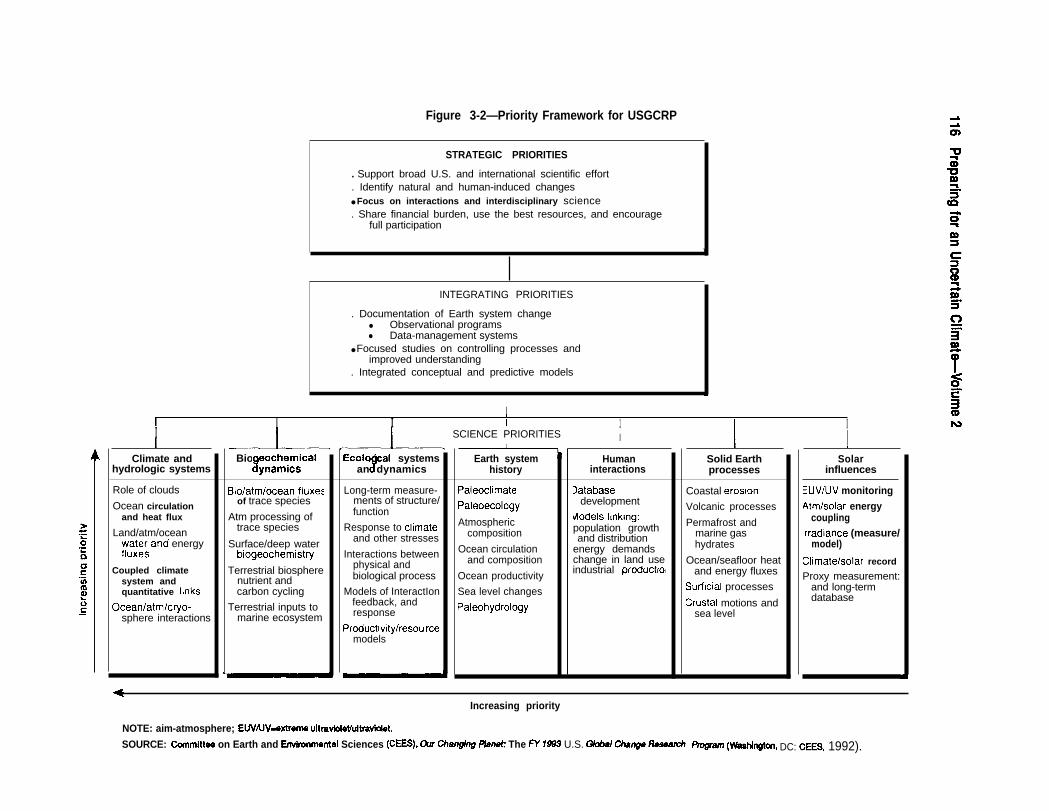
Figure 3-2—Priority Framework for USGCRP
STRATEGIC PRIORITIES
. Support broad U.S. and international scientific effort
. Identify natural and human-induced changes● Focus on interactions and interdisciplinary science. Share financial burden, use the best resources, and encourage
full participation
\
INTEGRATING PRIORITIES
. Documentation of Earth system change● Observational programs● Data-management systems
● Focused studies on controlling processes andimproved understanding
. Integrated conceptual and predictive models
\
I1I I I I 1 1 III
Climate andhydrologic systems
Role of clouds
Ocean circulationand heat flux
Land/atm/ocean~ua:&and energy
Coupled climatesystem andquantitative Ilnks
Ocean/atm/cryo-sphere interactions
Bio eochemicai%ynamics
Bio/aMocean fiuxe:of trace species
Atm processing oftrace species
Surface/deep waterbiogeochemistry
Terrestrial biospherenutrient andcarbon cycling
Terrestrial inputs tomarine ecosystem
Ecolo ical systemsJan dynamics
Long-term measure-ments of structure/function
Response to climateand other stresses
Interactions betweenphysical andbiological process
Models of InteractIonfeedback, andresponse
Productwity/resou rcemodels
SCIENCE PRIORITIES I1
Earth systemhistory
Paleoclimate
Paleoecology
Atmosphericcomposition
Ocean circulationand composition
Ocean productivity
Sea level changes
Paleohydrology
Humaninteractions
latabasedevelopment
dodels Imking:population growthand distribution
energy demandschange in land useindustrial producttol
ISolid Earthprocesses
Coastal erosion
Volcanic processes
Permafrost andmarine gashydrates
Ocean/seafloor heatand energy fluxes
Surflcial processes
Crustal motions andsea level
I1Solar
influences
EUV/UV monitoringAtm/solar energy
couplingIrradiance (measure/
model)
chfEI@k3kM record
Proxy measurement:and long-termdatabase
IQ
Increasing priority
NOTE: aim-atmosphere; EUVAJV-axtrema ultravbiethdtraviolet
SOURCE: Cunmlttea on Earth and Erwhonrnantal Sciences (CEES), or ChW@ng I%met: The FY 1993 U.S. Global Change Rosean51- mmxon, DC: CEES, 1992).
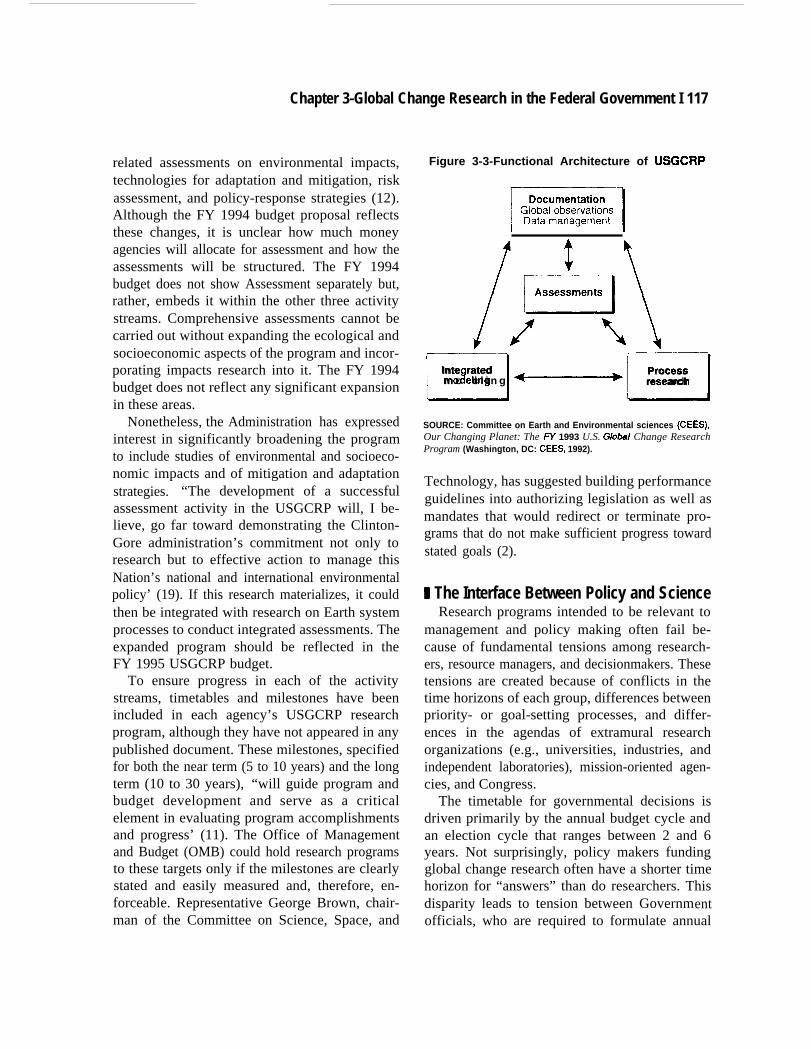
Chapter 3-Global Change Research in the Federal Government I 117
related assessments on environmental impacts,technologies for adaptation and mitigation, riskassessment, and policy-response strategies (12).Although the FY 1994 budget proposal reflectsthese changes, it is unclear how much moneyagencies will allocate for assessment and how theassessments will be structured. The FY 1994budget does not show Assessment separately but,rather, embeds it within the other three activitystreams. Comprehensive assessments cannot becarried out without expanding the ecological andsocioeconomic aspects of the program and incor-porating impacts research into it. The FY 1994budget does not reflect any significant expansionin these areas.
Nonetheless, the Administration has expressedinterest in significantly broadening the programto include studies of environmental and socioeco-nomic impacts and of mitigation and adaptationstrategies. “The development of a successfulassessment activity in the USGCRP will, I be-lieve, go far toward demonstrating the Clinton-Gore administration’s commitment not only toresearch but to effective action to manage thisNation’s national and international environmentalpolicy’ (19). If this research materializes, it couldthen be integrated with research on Earth systemprocesses to conduct integrated assessments. Theexpanded program should be reflected in theFY 1995 USGCRP budget.
To ensure progress in each of the activitystreams, timetables and milestones have beenincluded in each agency’s USGCRP researchprogram, although they have not appeared in anypublished document. These milestones, specifiedfor both the near term (5 to 10 years) and the longterm (10 to 30 years), “will guide program andbudget development and serve as a criticalelement in evaluating program accomplishmentsand progress’ (11). The Office of Managementand Budget (OMB) could hold research programsto these targets only if the milestones are clearlystated and easily measured and, therefore, en-forceable. Representative George Brown, chair-man of the Committee on Science, Space, and
Figure 3-3-Functional Architecture of USGCRP
m
/
$EEzl
17f$~ ~+
El—Inte rated
%
m
Processm o c l i n g ~ research
SOURCE: Committee on Earth and Environmental sciences (CEES),Our Changing Planet: The W 1993 U.S. Globai Change ResearchProgram (Washington, DC: CEES, 1992).
Technology, has suggested building performanceguidelines into authorizing legislation as well asmandates that would redirect or terminate pro-grams that do not make sufficient progress towardstated goals (2).
1 The Interface Between Policy and ScienceResearch programs intended to be relevant to
management and policy making often fail be-cause of fundamental tensions among research-ers, resource managers, and decisionmakers. Thesetensions are created because of conflicts in thetime horizons of each group, differences betweenpriority- or goal-setting processes, and differ-ences in the agendas of extramural researchorganizations (e.g., universities, industries, andindependent laboratories), mission-oriented agen-cies, and Congress.
The timetable for governmental decisions isdriven primarily by the annual budget cycle andan election cycle that ranges between 2 and 6years. Not surprisingly, policy makers fundingglobal change research often have a shorter timehorizon for “answers” than do researchers. Thisdisparity leads to tension between Governmentofficials, who are required to formulate annual
118 I Preparing for an Uncertain Climate--Volume 2
budgets and make immediate decisions, and thescientific community, whose long-term researchis dependent on continuous and reliable funding.When the questions of policy makers are notanswered in one or even a few years, it maybecome more difficult to sell a program asrelevant to policy needs. Mission-oriented agen-cies are repeatedly deflected by the ‘crisis-of-the-month’ syndrome, which siphons resources awayfrom long-term programs (37). The result may beannual budget fluctuations and/or rapidly shiftingpriorities-both of which are detrimental to thedevelopment of a sound scientific program. Abalance between continuity in priorities andfunding and flexibility in project direction isessential (3).
Tension arises between extramural researchorganizations and the Federal Government be-cause of different research agendas. Universitiesand independent laboratories judge their scien-tists to a large extent on their ability to raise fundsfor research. Adherence to management- andpolicy-relevant goals is not seen as importantunless it leads to more Federal funding.
Many scientists believe that the science mustbe “complete” before policy conclusions can bemade safely. Policy makers, on the other hand,cannot afford the luxury of complete information.Decisions about reauthorizing environmental leg-islation and natural resource planning and mana-gement will continue to be made based on thebest available information. “[I]f policy is to beeffectual, then we must make policy while wecontinue to investigate the physical and societaleffects of global warming. But this means thatpolicy will also enter the feedback loop, influenc-ing societal responses and physical effects’ (30).Science need not proceed in a sequential fashion.Research on the climate system need not be“complete” before research on the ecologicaleffects of climate change is undertaken nor doesresearch on the ecological effects of climatechange need to be ‘‘complete’ before research onthe societal impacts of and potential responses toclimate change is initiated (45). If USGCRP is to
address policy-relevant questions, a parallel ap-proach to climate effects and response research isnecessary.
In a narrow sense, USGCRP is policy-relevantif the most important policy concern is to gain abetter understanding of Earth system processes inorder to predict climate change. However, themajor international assessments conducted byIPCC demonstrate that the key questions policymakers need to address move far beyond thenarrow definition of ‘‘observe, document, andpredict” global change, into the realm of issuesrelated to adaptation and mitigation. As a result offocusing research funds on climate prediction,USGCRP is not addressing other key scienceissues or broad policy questions for the near term.For example, what plants and “ animals are sensi-tive to climate changes? How might biota andvegetation respond to changes in climate? Whatare the implications for forestry, agriculture, andnatural areas? What mitigation strategies wouldslow climate change the most? How much wouldthey cost? To whom? How might society respondto changes in climate and global ecosystems?What technologies should be developed? Howwill the effects of climate change interact withother global environmental changes? How impor-tant is climate change in the scheme of long-termenvironmental threats? How can natural resourcesbe managed to minimize economic and ecologicalloss? These issues were largely excluded fromUSGCRP to keep it primarily driven by the earthsciences. Even if accurate regional climate pre-dictions could be given today, land managers,planners, decisionmakers, and policy makerswould not have all the information they need toguide their response (33). As originally envi-sioned in 1990, these issues were to be addressedunder the CEES Working Group on Mitigationand Adaptation Research Strategies (MARS),which was abolished in 1992.
If USGCRP begins to address this broader setof questions, it will be moving closer to policy-relevant research. Some fear that a programdriven by policy concerns will undermine or
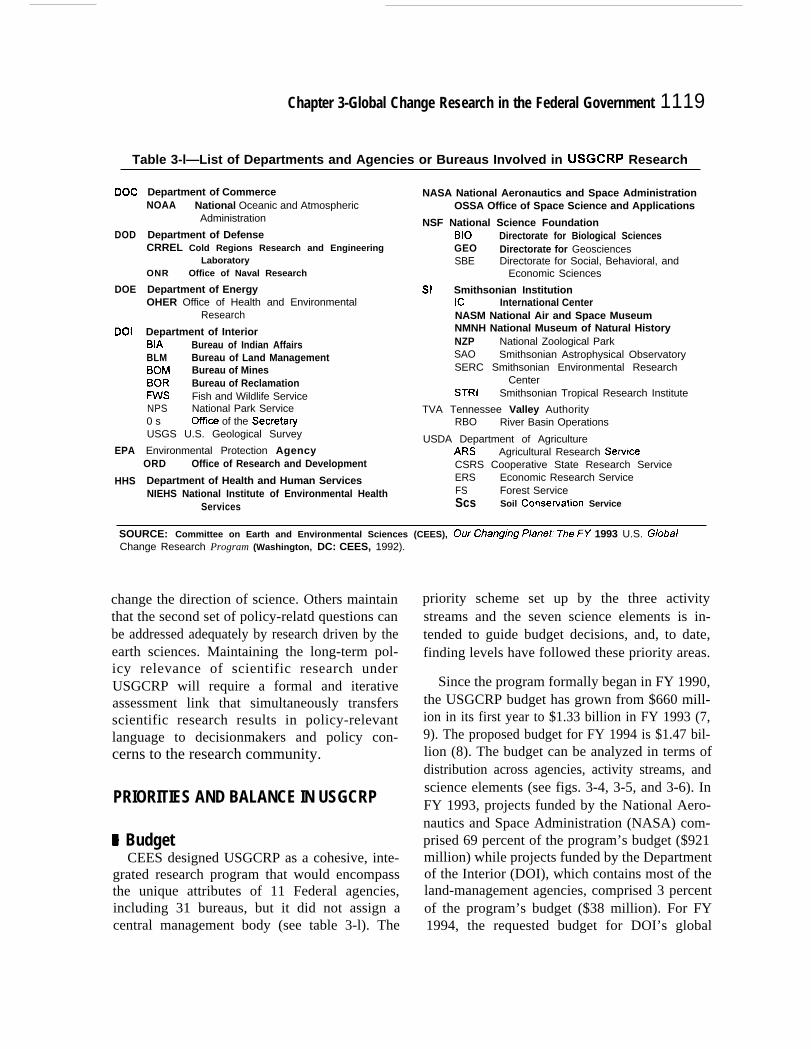
Chapter 3-Global Change Research in the Federal Government 1119
Table 3-l—List of Departments and Agencies or Bureaus Involved in USGCRP Research
DOC
DOD
DOE
DOI
EPA
HHS
Department of CommerceNOAA National Oceanic and Atmospheric
Administration
Department of DefenseCRREL Cold Regions Research and Engineering
LaboratoryONR Office of Naval Research
Department of EnergyOHER Office of Health and Environmental
Research
Department of InteriorBIA Bureau of Indian AffairsBLM Bureau of Land ManagementBOM Bureau of MinesBOR Bureau of ReclamationFws Fish and Wildlife ServiceNPS National Park Service0 s Offiw of the Secreta~USGS U.S. Geological Survey
Environmental Protection AgencyORD Office of Research and Development
Department of Health and Human ServicesNIEHS National Institute of Environmental Health
Services
NASA National Aeronautics and Space AdministrationOSSA Office of Space Science and Applications
NSF National Science FoundationBIO Directorate for Biological SciencesGEO Directorate for GeosciencesSBE Directorate for Social, Behavioral, and
Economic Sciences
SI Smithsonian InstitutionIc International CenterNASM National Air and Space MuseumNMNH National Museum of Natural HistoryNZP National Zoological ParkSAO Smithsonian Astrophysical ObservatorySERC Smithsonian Environmental Research
CenterSTRI Smithsonian Tropical Research Institute
TVA Tennessee Valley AuthorityRBO River Basin Operations
USDA Department of AgricultureARS Agricultural Research SewiceCSRS Cooperative State Research ServiceERS Economic Research ServiceFS Forest ServiceScs Soil Consewation Service
SOURCE: Committee on Earth and Environmental Sciences (CEES), Our Changjng Pknet: The H’ 1993 U.S. G/obdChange Research Program (Washington, DC: CEES, 1992).
change the direction of science. Others maintainthat the second set of policy-relatd questions canbe addressed adequately by research driven by theearth sciences. Maintaining the long-term pol-icy relevance of scientific research underUSGCRP will require a formal and iterativeassessment link that simultaneously transfersscientific research results in policy-relevantlanguage to decisionmakers and policy con-cerns to the research community.
PRIORITIES AND BALANCE IN USGCRP
I BudgetCEES designed USGCRP as a cohesive, inte-
grated research program that would encompassthe unique attributes of 11 Federal agencies,including 31 bureaus, but it did not assign acentral management body (see table 3-l). The
priority scheme set up by the three activitystreams and the seven science elements is in-tended to guide budget decisions, and, to date,finding levels have followed these priority areas.
Since the program formally began in FY 1990,the USGCRP budget has grown from $660 mill-ion in its first year to $1.33 billion in FY 1993 (7,9). The proposed budget for FY 1994 is $1.47 bil-lion (8). The budget can be analyzed in terms ofdistribution across agencies, activity streams, andscience elements (see figs. 3-4, 3-5, and 3-6). InFY 1993, projects funded by the National Aero-nautics and Space Administration (NASA) com-prised 69 percent of the program’s budget ($921million) while projects funded by the Departmentof the Interior (DOI), which contains most of theland-management agencies, comprised 3 percentof the program’s budget ($38 million). For FY1994, the requested budget for DOI’s global
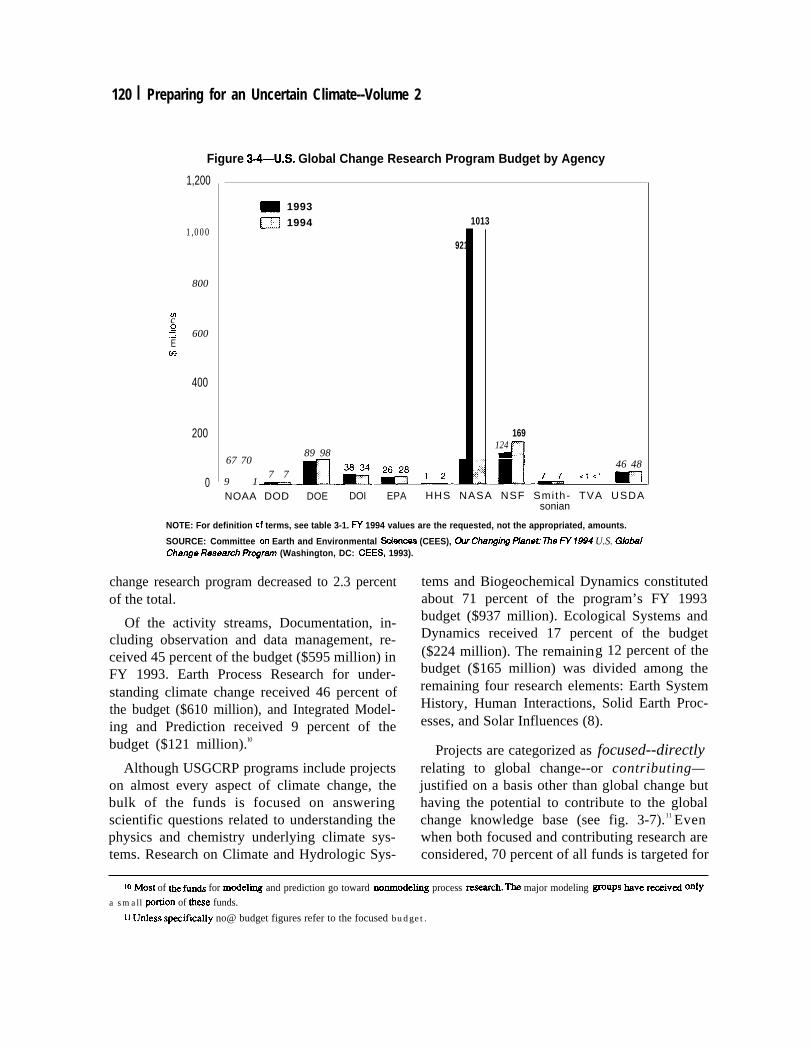
120 I Preparing for an Uncertain Climate--Volume 2
1,200
1,000
800
(ncQ 600=.—Ew
400
200
0
Figure 3-4-U.S. Global Change Research Program Budget by Agency
m 1993
n 1994 1013
921
169124
67 7089 98
9 1
46 487 7 <1 <1
NOAA DOD DOE DOI EPA HHS NASA NSF Smi th- TVA USDAsonian
NOTE: For definition of terms, see table 3-1. FY 1994 values are the requested, not the appropriated, amounts.
SOURCE: Committee on Earth and Environmental Sclenees (CEES), ~ Char@g Planet: 7?Ie FY 1994 U.S. GkidChaoge Reseamh Progmm (Washington, DC: CEES, 1993).
change research program decreased to 2.3 percentof the total.
Of the activity streams, Documentation, in-cluding observation and data management, re-ceived 45 percent of the budget ($595 million) inFY 1993. Earth Process Research for under-standing climate change received 46 percent ofthe budget ($610 million), and Integrated Model-ing and Prediction received 9 percent of thebudget ($121 million).l0
Although USGCRP programs include projectson almost every aspect of climate change, thebulk of the funds is focused on answeringscientific questions related to understanding thephysics and chemistry underlying climate sys-tems. Research on Climate and Hydrologic Sys-
tems and Biogeochemical Dynamics constitutedabout 71 percent of the program’s FY 1993budget ($937 million). Ecological Systems andDynamics received 17 percent of the budget($224 million). The remaining 12 percent of thebudget ($165 million) was divided among theremaining four research elements: Earth SystemHistory, Human Interactions, Solid Earth Proc-esses, and Solar Influences (8).
Projects are categorized as focused--directlyrelating to global change--or contributing—justified on a basis other than global change buthaving the potential to contribute to the globalchange knowledge base (see fig. 3-7).11 Evenwhen both focused and contributing research areconsidered, 70 percent of all funds is targeted for
10 Most of fie funds for model~ and prediction go toward nonmodeling process researeh. The major modeling groups hve RJ3E@ed ody
a small potion of these funds.
11 Udess ~~lca~y no@ budget figures refer to the focused budget.
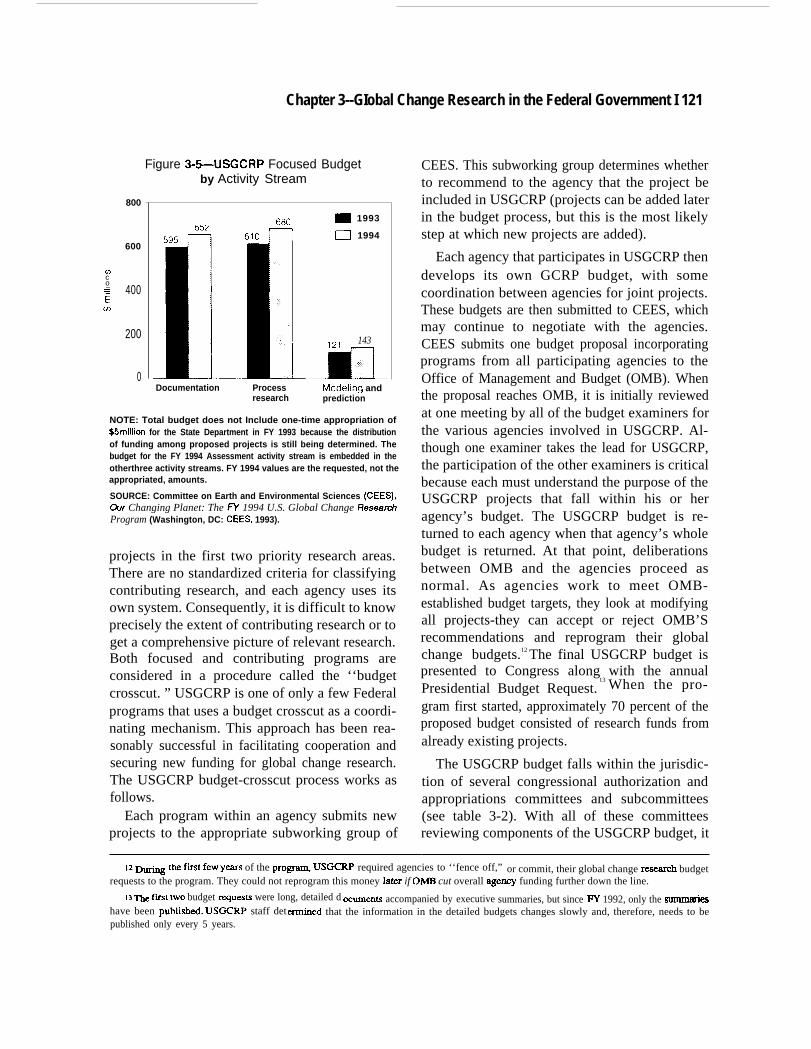
Chapter 3--GIobal Change Research in the Federal Government I 121
800
600
mco= 400Fm
200
0
Figure 3-&USGCRP Focused Budgetby Activity Stream
680 m 1993
n 1994
. n. 143mDocumentation Process Modellng and
research prediction
NOTE: Total budget does not Include one-time appropriation of$5million for the State Department in FY 1993 because the distributionof funding among proposed projects is still being determined. Thebudget for the FY 1994 Assessment activity stream is embedded in theotherthree activity streams. FY 1994 values are the requested, not theappropriated, amounts.
SOURCE: Committee on Earth and Environmental Sciences (CEES),&r Changing Planet: The W 1994 U.S. Global Change ReseardProgram (Washington, DC: CEES, 1993).
projects in the first two priority research areas.There are no standardized criteria for classifyingcontributing research, and each agency uses itsown system. Consequently, it is difficult to knowprecisely the extent of contributing research or toget a comprehensive picture of relevant research.Both focused and contributing programs areconsidered in a procedure called the ‘‘budgetcrosscut. ” USGCRP is one of only a few Federalprograms that uses a budget crosscut as a coordi-nating mechanism. This approach has been rea-sonably successful in facilitating cooperation andsecuring new funding for global change research.The USGCRP budget-crosscut process works asfollows.
Each program within an agency submits newprojects to the appropriate subworking group of
CEES. This subworking group determines whetherto recommend to the agency that the project beincluded in USGCRP (projects can be added laterin the budget process, but this is the most likelystep at which new projects are added).
Each agency that participates in USGCRP thendevelops its own GCRP budget, with somecoordination between agencies for joint projects.These budgets are then submitted to CEES, whichmay continue to negotiate with the agencies.CEES submits one budget proposal incorporatingprograms from all participating agencies to theOffice of Management and Budget (OMB). Whenthe proposal reaches OMB, it is initially reviewedat one meeting by all of the budget examiners forthe various agencies involved in USGCRP. Al-though one examiner takes the lead for USGCRP,the participation of the other examiners is criticalbecause each must understand the purpose of theUSGCRP projects that fall within his or heragency’s budget. The USGCRP budget is re-turned to each agency when that agency’s wholebudget is returned. At that point, deliberationsbetween OMB and the agencies proceed asnormal. As agencies work to meet OMB-established budget targets, they look at modifyingall projects-they can accept or reject OMB’Srecommendations and reprogram their globalchange budgets.12 The final USGCRP budget ispresented to Congress along with the annualPresidential Budget Request.
13 When the pro-
gram first started, approximately 70 percent of theproposed budget consisted of research funds fromalready existing projects.
The USGCRP budget falls within the jurisdic-tion of several congressional authorization andappropriations committees and subcommittees(see table 3-2). With all of these committeesreviewing components of the USGCRP budget, it
12- @ f~t few years of the progr~ USGCRP required agencies to ‘‘fence off,” or commit, their global change researeh budgetrequests to the program. They could not reprogram this money later if OMB cut overall ageney funding further down the line.
13 m fiit two budget qests were long, detailed d ocuments accompanied by executive summaries, but since FY 1992, only the sum.mmieshave been pubLished. USGCRP staff deterrnined that the information in the detailed budgets changes slowly and, therefore, needs to bepublished only every 5 years.
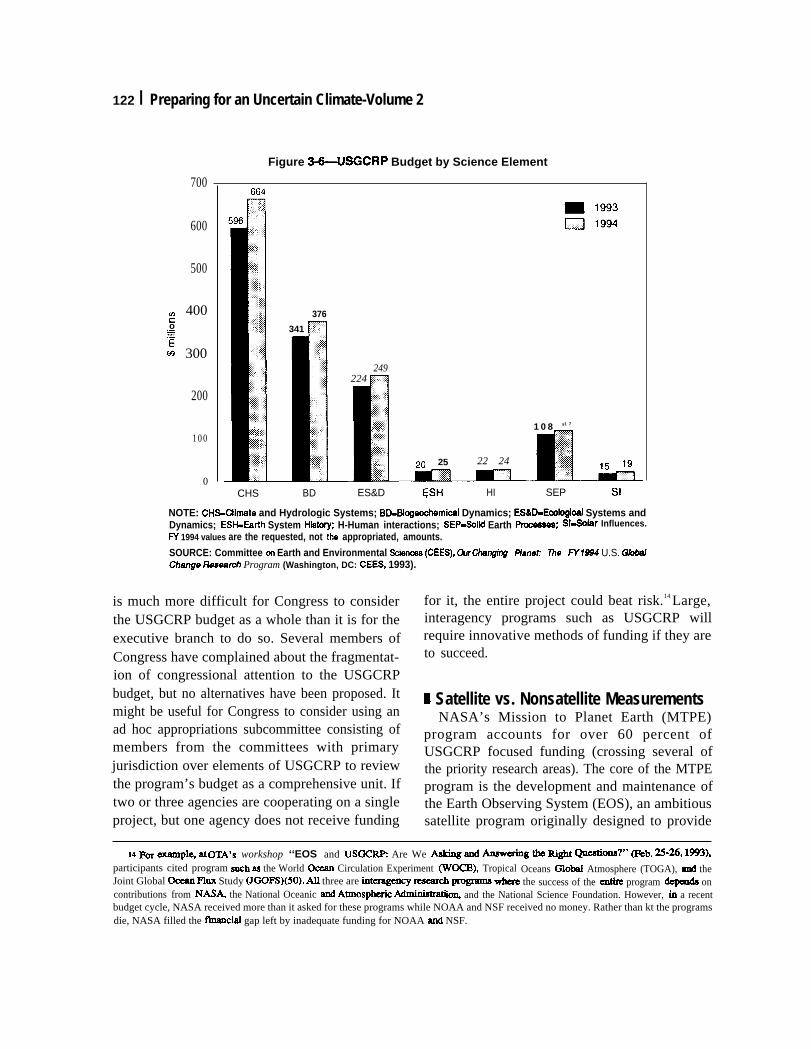
122 I Preparing for an Uncertain Climate-Volume 2
700
600
500
(/J 400co==
: 300
200
100
0
Figure 3-6-USGCRP Budget by Science Element
376
341 l-’-”-l
249224 m
Ii,:., . .:,:,’
20 25 22 24
1 0 8 ’1 7
II__
,,, .:...
k2__CHS BD ES&D ~SH HI SEP SI
NOTE: CHS-Clirnate and Hydrologic Systems; BD-Biogeoohemloal Dynamics; ES&D-Eeobgloal Systems andDynamics; ESH-Earth System Hiat6ry; H-Human interactions; SEP-Solid Earth Pmceeees; S1-Solar Influences.FY 1994 values are the requested, not the appropriated, amounts.
SOURCE: Committee on Earth and Environmental Sciencea (CEES), LWWangh?g Rand: 7he /+’7994 U.S. Q&ba/Change Reseamh Program (Washington, DC: CEES, 1993).
is much more difficult for Congress to considerthe USGCRP budget as a whole than it is for theexecutive branch to do so. Several members ofCongress have complained about the fragmentat-ion of congressional attention to the USGCRPbudget, but no alternatives have been proposed. Itmight be useful for Congress to consider using anad hoc appropriations subcommittee consisting ofmembers from the committees with primaryjurisdiction over elements of USGCRP to reviewthe program’s budget as a comprehensive unit. Iftwo or three agencies are cooperating on a singleproject, but one agency does not receive funding
for it, the entire project could beat risk.14 Large,interagency programs such as USGCRP willrequire innovative methods of funding if they areto succeed.
9 Satellite vs. Nonsatellite MeasurementsNASA’s Mission to Planet Earth (MTPE)
program accounts for over 60 percent ofUSGCRP focused funding (crossing several ofthe priority research areas). The core of the MTPEprogram is the development and maintenance ofthe Earth Observing System (EOS), an ambitioussatellite program originally designed to provide
M MI ~mpk, at OTA’S workshop ‘‘EOS and USGCIU? Are We Ask@ and AIISWCX@ * R@ -~?” @b. 2$26 IW).participants cited program soch as the World ocean Circulation Experiment (WOCE), Tropical Oceans Globtd Atmosphere (TOGA), aml theJoint Global ocean~ux Study (JGOFS)(50). All three are intcnqyncy m$earch pqrams wke the success of the dire program depeda oncontributions from NASA the National Oceanic and Atmospbmic Admin&@ “q and the National Science Foundation. However, in a recentbudget cycle, NASA received more than it asked for these programs while NOAA and NSF received no money. Rather than kt the programsdie, NASA filled the f~cial gap left by inadequate funding for NOAA and NSF.
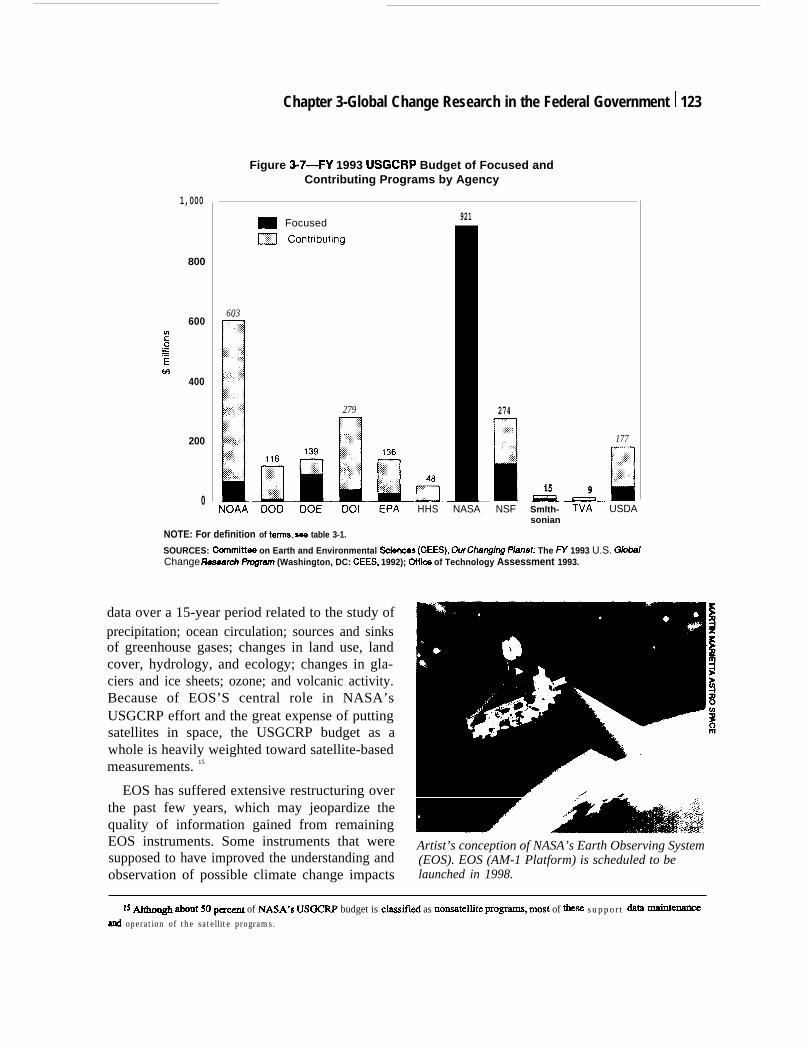
1,000
800
600w&~=E*
400
200
0
Chapter 3-Global Change Research in the Federal Government [ 123
Figure 3-7-FY 1993 USGCRP Budget of Focused andContributing Programs by Agency
_ Focused
m Contributing
603
279
-fl-HHS
921
274
LNASA NSF Smlth-
177
_----Ll15 9
TVA USDAsonian
NOTE: For definition of term, saa table 3-1.
SOURCES: Committes on Earth and Environmental Sclances (CEES), OurChm@g Planet: The W 1993 U.S. GlobalChange Reseati Pmgnzn (Washington, DC: CEES, 1992); Offica of Technology Assessment 1993.
data over a 15-year period related to the study ofprecipitation; ocean circulation; sources and sinksof greenhouse gases; changes in land use, landcover, hydrology, and ecology; changes in gla-ciers and ice sheets; ozone; and volcanic activity.Because of EOS’S central role in NASA’sUSGCRP effort and the great expense of puttingsatellites in space, the USGCRP budget as awhole is heavily weighted toward satellite-basedmeasurements. 15
EOS has suffered extensive restructuring overthe past few years, which may jeopardize thequality of information gained from remainingEOS instruments. Some instruments that weresupposed to have improved the understanding andobservation of possible climate change impacts
Artist’s conception of NASA’s Earth Observing System(EOS). EOS (AM-1 Platform) is scheduled to belaunched in 1998.
15 Alrhou@ about 50 pcrcxmt of NASA’S USGCR.P budget is classifkd as nonsatellite progmms, mOst of tise support bh ti~
ad operation of the satellite programs.
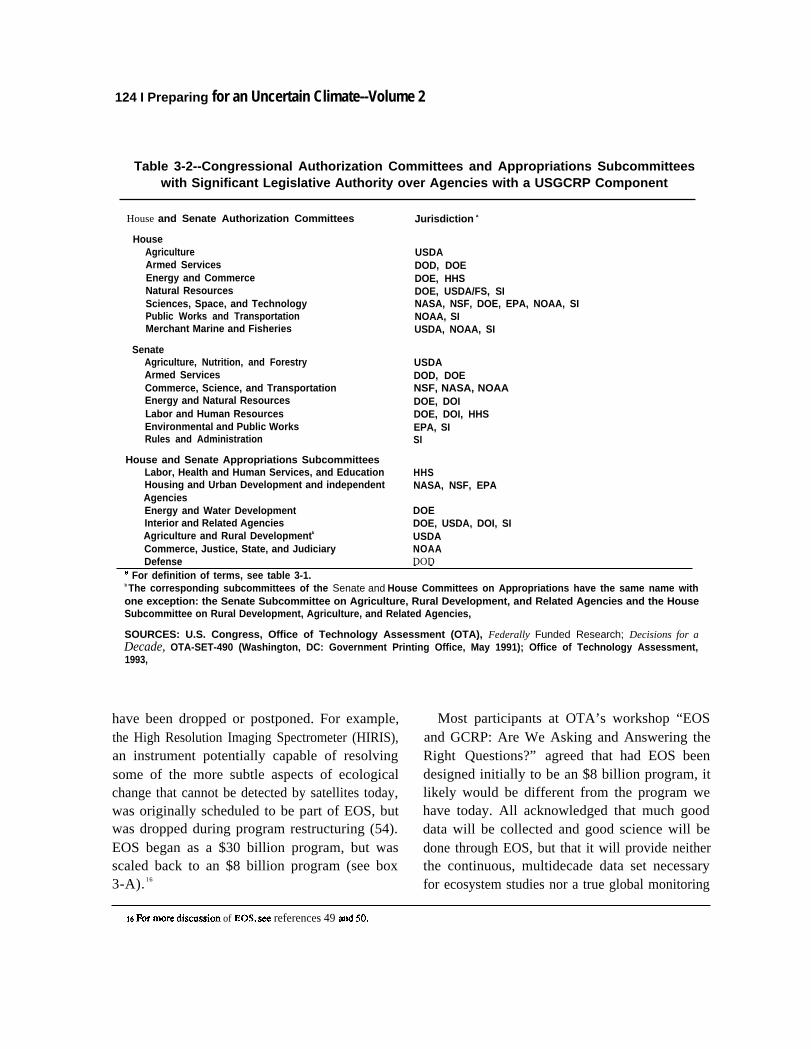
124 I Preparing for an Uncertain Climate--Volume 2
Table 3-2--Congressional Authorization Committees and Appropriations Subcommitteeswith Significant Legislative Authority over Agencies with a USGCRP Component
House and Senate Authorization Committees
HouseAgricultureArmed ServicesEnergy and CommerceNatural ResourcesSciences, Space, and TechnologyPublic Works and TransportationMerchant Marine and Fisheries
SenateAgriculture, Nutrition, and ForestryArmed ServicesCommerce, Science, and TransportationEnergy and Natural ResourcesLabor and Human ResourcesEnvironmental and Public WorksRules and Administration
House and Senate Appropriations SubcommitteesLabor, Health and Human Services, and EducationHousing and Urban Development and independentAgenciesEnergy and Water DevelopmentInterior and Related AgenciesAgriculture and Rural Developmentb
Commerce, Justice, State, and JudiciaryDefense
Jurisdiction a
USDADOD, DOEDOE, HHSDOE, USDA/FS, SINASA, NSF, DOE, EPA, NOAA, SINOAA, SIUSDA, NOAA, SI
USDADOD, DOENSF, NASA, NOAADOE, DOIDOE, DOI, HHSEPA, SISI
HHSNASA, NSF, EPA
DOEDOE, USDA, DOI, SIUSDANOAADOD— —
a For definition of terms, see table 3-1.b The corresponding subcommittees of the Senate and House Committees on Appropriations have the same name withone exception: the Senate Subcommittee on Agriculture, Rural Development, and Related Agencies and the HouseSubcommittee on Rural Development, Agriculture, and Related Agencies,
SOURCES: U.S. Congress, Office of Technology Assessment (OTA), Federally Funded Research; Decisions for aDecade, OTA-SET-490 (Washington, DC: Government Printing Office, May 1991); Office of Technology Assessment,1993,
have been dropped or postponed. For example,the High Resolution Imaging Spectrometer (HIRIS),an instrument potentially capable of resolvingsome of the more subtle aspects of ecologicalchange that cannot be detected by satellites today,was originally scheduled to be part of EOS, butwas dropped during program restructuring (54).EOS began as a $30 billion program, but wasscaled back to an $8 billion program (see box3-A). 16
Most participants at OTA’s workshop “EOSand GCRP: Are We Asking and Answering theRight Questions?” agreed that had EOS beendesigned initially to be an $8 billion program, itlikely would be different from the program wehave today. All acknowledged that much gooddata will be collected and good science will bedone through EOS, but that it will provide neitherthe continuous, multidecade data set necessaryfor ecosystem studies nor a true global monitoring
16 For more dismssion of EOS, see references 49 md 50.
Chapter 3--Global Change Research in the Federal Government] 125
Box 3-A-Remote Sensing as a Tool for Coping with Climate Change
Remote sensing is the observation of the Earth from a distance. The ability to view and monitor large areasof the Earth has become valuable in understanding regional and global-scale phenomena such as weathersystems, deforestation rates, and, most recently, climate change. Remote sensing can help reduce theuncertainties associated with climate change in two ways: 1) by improving climate predictions through betterunderstanding of atmospheric and climate processes and 2) by improving scientists’ ability to detect and predictthe effects of climate change on the biosphere. Both uses of remote sensing would be important for coping withclimate change. However, most biosphere-related climate research to date has focused on the former, whereasrelatively little has focused on the latter. This box examines the uses and limitations of remote-sensingtechnologies for observing, detecting, and understanding changes in the biosphere resulting from climate change,land-use change, or other factors.
Development of remote-sensing technology
Airborne sensors-The oldest form of remote sensing-invented about 100 years ago--consists ofphotographs taken from balloons. The development of the airplane made aerial photography the primary way tomonitor and study the Earth’s surface from a distance. Scientists also discovered t hat images created from otherparts of the electromagnetic spectrum (i.e., the infra red region) could provide additional information about surfacecharacteristics, such as mineral composition, soil moisture, and crop condition.
The U.S. Forest Service has been using aerial photography since the 1930s to measure the area of forests,monitor forest health, and plan timber harvests. Aerial photography is also an important tool in the U.S. Fish andWildlife Service’s National Wetland Inventory Program The technique is best suited for observing relatively smallareas and for studies requiring a high level of spatial detail. Riparian wetlands and wetlands less than 5 acres(2 hectares)1 in area, for example, cannot be accurately characterized by satellite-based observations (18).Therefore, aerial photography is an essential tool for comprehensive wetland monitoring.
However, using aerial photography to get consistent coverage overlarge areas for regional analysis is verydifficult and costly. The aerial photography technology used frequently by the National Aeronautics and SpaceAdministration (NASA) for ecological studies can cost about $10,000 per flight. Difficulties also lie in determiningexactly where the plane is in space so that the area being photographed can be precisely identified. Also, takingphotographs at different times from exactly the same vantage point is difficult. Although aerial photography maybe preferable for ecological applications requiring high levels of detail (e.g., wetland inventory and forestmonitoring), it is not practical for routine, regular measurements or for studies of large-scale ecologicalphenomena.
Remote sensing from satellites--By the late 1960s, advances in technology made transmitting electronicimages to Earth from satellite-based instruments practical. Polar-orbiting satellites (orbits pass over both the Northand South Poles) allow imaging of the entire globe. These Earth observation satellites are equipped with varioussensors that detect natural radiance (electromagnetic waves emitted by surface features) and reflectance (thosereflected from Earth’s surface).2 The intensity and wavelength of the signal detected become a type of signaturefor certain surface features. By combining these signals, various vegetation types and other characteristics canbe identified.
1 TO convert acres to hectares, multiply by 0.405.
2 Sunlight is absorbed by Earth’s atmosphere, scattered and reflected off Earth’s surface, or absorbed by itssurface. Surface features that absorb some waves can re-emit electromagnetic signals-often at longerwavelengths. In general, reflected (or scattered) signals give information about the structure of the surface features,and radiated signals give information about Its chemical composition.
(Continued on next page)
126 Preparing for an Uncertain Climate--Volume 2
Box 3-A-Remote Sensing as a Tool for Coping with Climate Change--(Continued)
Satellites include several instruments that monitor Earth with ’’passive sensors’’ designed to detect a narrowrange, or window, of various parts of the electromagnetic spectrum. These windows are called spectral bands. Bydetecting different parts of the spectrum, a variety of signatures is obtained. Being able to detect narrower bandsimproves the ability to categorize detected signatures by wavelength. More narrow bands over a wider range ofthe spectrum enables detection of more signatures, which improves the ability to discern closely spaced objectsand identify surface features. Identification of a wetland, for example, generally requires analysis of three or moreinfrared spectral bands (18): one discriminates amounts of vegetation, water, and soil moisture; another helpsdetermine water quality; and another helps to classify different vegetation types. However, detailed geographicand spectral resolution is more expensive, requires higherdata-collection rates, and limits spatial coverage (49).Passive optical sensors detect only surface features. They cannot be used for Earth observation through clouds,accurate measurement of soil moisture through dense vegetation cover, or detection of submerged vegetation.Radar instruments have “active” sensors that provide their own illumination via microwave pulses and thenmeasure the reflected energy. Unlike optical sensors, radar data can be acquired through clouds and at night.Radar signals are especially sensitive to water and may improve the way soil and vegetation moisture aremeasured (53, 54). In addition, radar can probe to greater depths and may provide better information about surfaceroughness, canopy height, and, perhaps, vegetation beneath a dense canopy than can optical sensors (53,54).
Several countries besides the United States, including France, Japan, India and Russia, have launchedsatellites for environmental studies and Earth observation. Discussed below are satellites whose data are mostwidely used by US. scientists for detecting change in the biosphere and for large-scale ecosystem studies.
Advanced Very High Resolution Radiometer (AVHRR)--This scanning radiometer, aboard NOAA’s PolarOrbiting Environmental Satellite (POES), uses five detectors to create surface images in five spectral bands (49).AVHRR data allow multispectral analysis of vegetation, clouds, lakes, coasts, snow, and ice and have been usedto monitor crop conditions, classifyglobal vegetation, and demonstrate the scale of deforestation in the tropics (44).AVHRR provides daily coverage of the Earth, allowing frequent monitoring of a large region and the creation ofvirtually cloud-free images at a fraction of the cost and computing time required for aerial photography or othersatellite technologies (43).3 Although AVHRR data have much lower spatial resolution than do data from aerialphotography--about 0.7 miles (1.1 kilometers)4 per pixel, or data point--O.6-mile to 16-mile resolutions areadequate for “assessing many global or regional trends in land cover, vegetation damage, deforestation, and otherenvironmental conditions” (44).
Landsat--ln 1972, NASA launched the first of a series of Landsat satellites for civilian Earth observation andmonitoring. Now, a 20-year continuous data set has been acquired for some selected areas (primarily in the UnitedStates and the former Soviet Union), making Landsat data the primary source of data for detecting long-termecological trends. This long-term record is just now beginning to provide valuable information about trends andchanges In wetland area, vegetation types, forest growth, deforestation rates, and urban expansion.
Consistency in measurement is very important for maintaining accurate and useful long-term records.Landsat missions have been designed so that data from different missions can be compared while allowingmoderate advances In technology. Sustaining Landsat missions and maintaining a continuous data set over 20years has not been easy. Over this time, operation of Landsat has changed from public to private and back to public
3 The EROS Data Center makes global data sets that are almost aloud-free by imaging over approximately10 days.
4 TO connvert miles to kilometers, multiply by 1.609.
Chapter 3-Global Change Research in the Federal Government 127
hands.5 These changes have threatened to limit the availability of data to users, have increased the costs of datato users, and have limited the number of scenes imaged. Landsats 4 and 5 have already surpassed their expectedlife spans by several years. The recently launched Landsat 6 (October 1993) never reached orbit, and thelong-term Landsat record is now threatened.
The main advantage of Landsat and similar satellites is that they can distinguish surface features with higherspatial and spectral resolution and broader spectral coverage than do AVHRR data.6 Landsat data have been usedto identify and monitor crops, classify forest stands with finer classification scales, and assess damages fromnatural disasters. However, Landsat provides less frequent coverage of an area (every 16 days) and requires morecomputing time and power than do AVHRR data sets. For these reasons, AVHRR is more widely used thanLandsat for global data analyses. Landsat data sets are also significantly more expensive than are AVHRR datasets. According to one scientist, “The 10-times greater expense and 1,000-times-greater data volume [of ThematicMapper of Landsat (TM) data as opposed to AVHRR data preclude] use of multiple annual [Landsat] data setsfor global studies” (43). (The cost of each 120-by 110-mile scene is about $5,000 (18)).
New technologies7—instruments considered for Landsat 7 will improve surface resolution and allow thecreation of topographic images (by having the ability to point to the side), thereby increasing Landsat’s revisitfrequencies from once every 16 days to once every 3 days (49). Until recently, a High Resolution ImagingSpectrometer (HIRIS) was under consideration for development as part of NASA’s Earth Observing System (EOS)program. In principle, HIRIS data could be used to detect specific species of trees or other ground cover, trackpollutants in water, and identify natural vegetation that is under stress. A Synthetic Aperture Radar (SAR) proposedfor EOS--but recently canceled--would have been capable of multiangle, multifrequency, and multipolarizartionmeasurements (49). SAR could have measured soil moisture under vegetated land, determined the verticalstructure of vegetation canopies, and measured canopy moisture (53). However, both HIRIS and SAR weredropped from consideration because of high costs and launch requirements (54).
Uses of remote sensing under climate change8
Many questions about climate change impacts and how to respond to them remain unanswered. Forexample, which plant and animal communities are likely to change first? How will they change? How fast willchanges occur? Which species are already declining? Why? Where? Which are flourishing? Satellite data arealready being used to answer many questions related to large-scale ecological change, but limitations in bothsatellite technology and in ecological understanding prevent some of the most compelling questions about globalecological change from being addressed with satellite data. The table in this box (next page) lists some potentialuses of remote-sensing data.
Remote sensing for scientific study-Although an Earth observation satellite has never been launchedspecifically for ecological studies (41), current operating satellites can help reveal some important aspects of
5 Landsat 4 and 5 are operated and maintained by the Earth Observation Satellite Company (EOSAT, aprivate company. Landsat 6 will be launched by the U.S. Government but operated by EOSAT (16). The LandRemote Sensing Policy Act of 1992 (P.L. 102-555) transfers all control of future Landsat missions (starting withLandsat 7) to the Department of Defense and NASA (49).
6 Landsat4 and 5 carry the Thematic Mapper (TM) sensor, providing 100-foot (30-m) ground resolution in sixspectral bands (one thermal infared band has a 390-foot (120-m) resolution). Landsat 6 is scheduled for launch onSeptember 5,1993, and will carry an Enhanced Thematic Mapper Imaging Instrument (ETM). ETM will improve theTM by adding a 5-foot resolution panchromatic sensor, making it possible to collect data streams with sharperresolutions and increase vegetation discrimination.
7 See The Future of Remote Sensing from Space: Civilian Satellite Systems andApplications (49) for a morecomplete discussion of the future of remote-sensing technologies.
8 Much of this section was developed from a workshop, “Ecology and Remote Sensing,” held September 18,1992, at the University of Maryland at College Park.
(Continued on next page)
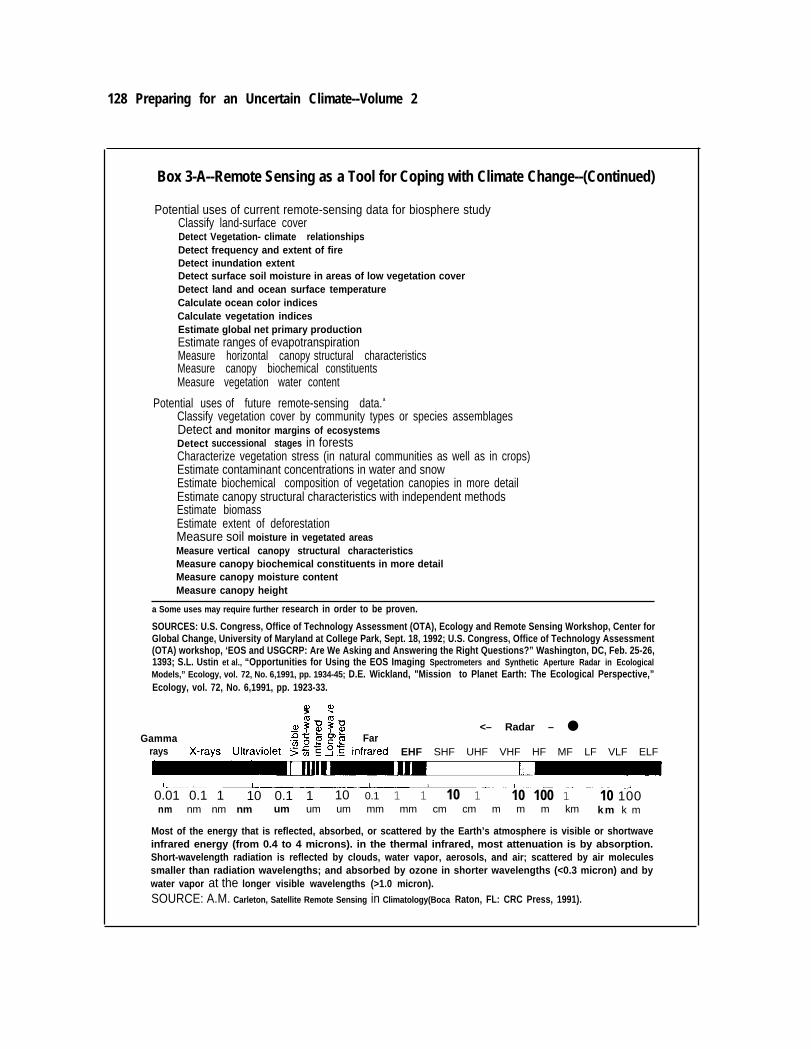
128 Preparing for an Uncertain Climate--Volume 2
Box 3-A--Remote Sensing as a Tool for Coping with Climate Change--(Continued)
Potential uses of current remote-sensing data for biosphere studyClassify land-surface coverDetect Vegetation- climate relationshipsDetect frequency and extent of fireDetect inundation extentDetect surface soil moisture in areas of low vegetation coverDetect land and ocean surface temperatureCalculate ocean color indicesCalculate vegetation indicesEstimate global net primary productionEstimate ranges of evapotranspirationMeasure horizontal canopy structural characteristicsMeasure canopy biochemical constituentsMeasure vegetation water content
Potential uses of future remote-sensing data.a
Classify vegetation cover by community types or species assemblagesDetect and monitor margins of ecosystemsDetect successional stages in forestsCharacterize vegetation stress (in natural communities as well as in crops)Estimate contaminant concentrations in water and snowEstimate biochemical composition of vegetation canopies in more detailEstimate canopy structural characteristics with independent methodsEstimate biomassEstimate extent of deforestationMeasure soil moisture in vegetated areasMeasure vertical canopy structural characteristicsMeasure canopy biochemical constituents in more detailMeasure canopy moisture contentMeasure canopy height
a Some uses may require further research in order to be proven.
SOURCES: U.S. Congress, Office of Technology Assessment (OTA), Ecology and Remote Sensing Workshop, Center forGlobal Change, University of Maryland at College Park, Sept. 18, 1992; U.S. Congress, Office of Technology Assessment(OTA) workshop, ‘EOS and USGCRP: Are We Asking and Answering the Right Questions?” Washington, DC, Feb. 25-26,1393; S.L. Ustin et al., “Opportunities for Using the EOS Imaging Spectrometers and Synthetic Aperture Radar in EcologicalModels,” Ecology, vol. 72, No. 6,1991, pp. 1934-45; D.E. Wickland, "Mission to Planet Earth: The Ecological Perspective,”Ecology, vol. 72, No. 6,1991, pp. 1923-33.
><– Radar – ●
Gamma Farrays EHF SHF UHF VHF HF MF LF VLF ELF
1
0.01 0.1 1 10 0.1 1 10 0.1 1 1 10 1 10 100 1 10 100nm nm nm nm um um um mm mm cm cm m m m km k m k m
Most of the energy that is reflected, absorbed, or scattered by the Earth’s atmosphere is visible or shortwaveinfrared energy (from 0.4 to 4 microns). in the thermal infrared, most attenuation is by absorption.Short-wavelength radiation is reflected by clouds, water vapor, aerosols, and air; scattered by air moleculessmaller than radiation wavelengths; and absorbed by ozone in shorter wavelengths (<0.3 micron) and bywater vapor at the longer visible wavelengths (>1.0 micron).SOURCE: A.M. Carleton, Satellite Remote Sensing in Climatology(Boca Raton, FL: CRC Press, 1991).
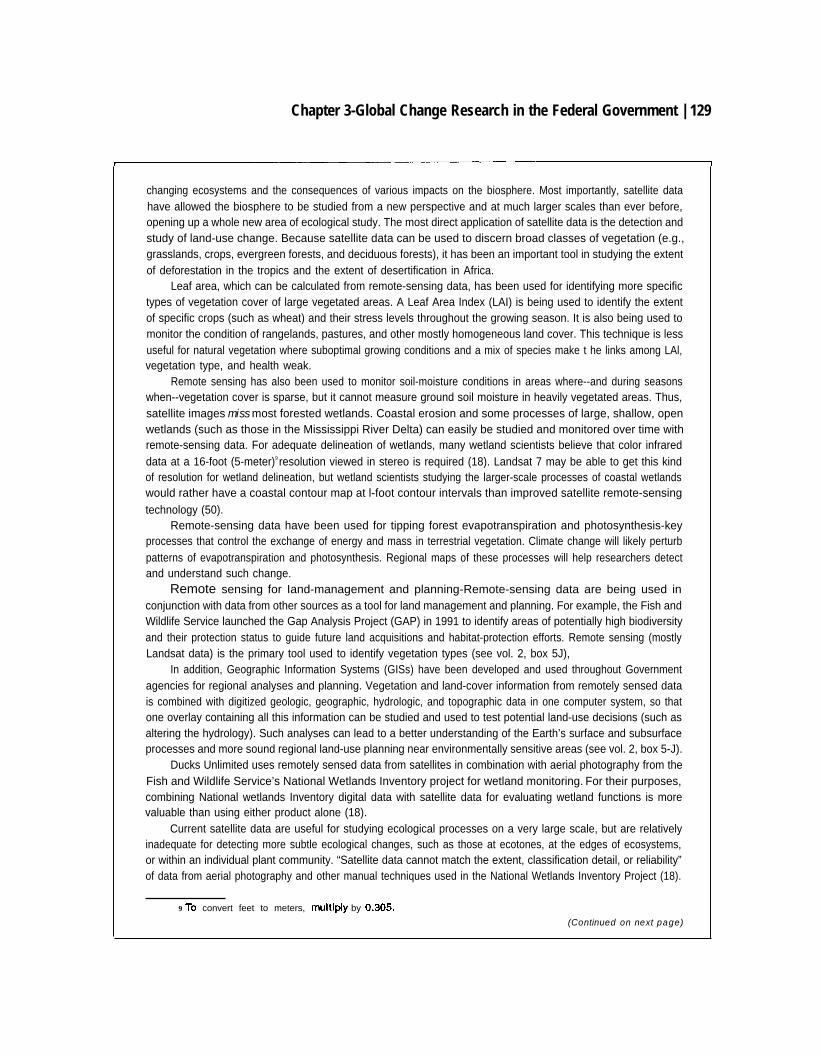
Chapter 3-Global Change Research in the Federal Government | 129
changing ecosystems and the consequences of various impacts on the biosphere. Most importantly, satellite datahave allowed the biosphere to be studied from a new perspective and at much larger scales than ever before,opening up a whole new area of ecological study. The most direct application of satellite data is the detection andstudy of land-use change. Because satellite data can be used to discern broad classes of vegetation (e.g.,grasslands, crops, evergreen forests, and deciduous forests), it has been an important tool in studying the extentof deforestation in the tropics and the extent of desertification in Africa.
Leaf area, which can be calculated from remote-sensing data, has been used for identifying more specifictypes of vegetation cover of large vegetated areas. A Leaf Area Index (LAI) is being used to identify the extentof specific crops (such as wheat) and their stress levels throughout the growing season. It is also being used tomonitor the condition of rangelands, pastures, and other mostly homogeneous land cover. This technique is lessuseful for natural vegetation where suboptimal growing conditions and a mix of species make t he links among LAl,vegetation type, and health weak.
Remote sensing has also been used to monitor soil-moisture conditions in areas where--and during seasonswhen--vegetation cover is sparse, but it cannot measure ground soil moisture in heavily vegetated areas. Thus,satellite images miss most forested wetlands. Coastal erosion and some processes of large, shallow, openwetlands (such as those in the Mississippi River Delta) can easily be studied and monitored over time withremote-sensing data. For adequate delineation of wetlands, many wetland scientists believe that color infrareddata at a 16-foot (5-meter)9 resolution viewed in stereo is required (18). Landsat 7 may be able to get this kindof resolution for wetland delineation, but wetland scientists studying the larger-scale processes of coastal wetlandswould rather have a coastal contour map at l-foot contour intervals than improved satellite remote-sensingtechnology (50).
Remote-sensing data have been used for tipping forest evapotranspiration and photosynthesis-keyprocesses that control the exchange of energy and mass in terrestrial vegetation. Climate change will likely perturbpatterns of evapotranspiration and photosynthesis. Regional maps of these processes will help researchers detectand understand such change.
Remote sensing for Iand-management and planning-Remote-sensing data are being used inconjunction with data from other sources as a tool for land management and planning. For example, the Fish andWildlife Service launched the Gap Analysis Project (GAP) in 1991 to identify areas of potentially high biodiversityand their protection status to guide future land acquisitions and habitat-protection efforts. Remote sensing (mostlyLandsat data) is the primary tool used to identify vegetation types (see vol. 2, box 5J),
In addition, Geographic Information Systems (GISs) have been developed and used throughout Governmentagencies for regional analyses and planning. Vegetation and land-cover information from remotely sensed datais combined with digitized geologic, geographic, hydrologic, and topographic data in one computer system, so thatone overlay containing all this information can be studied and used to test potential land-use decisions (such asaltering the hydrology). Such analyses can lead to a better understanding of the Earth’s surface and subsurfaceprocesses and more sound regional land-use planning near environmentally sensitive areas (see vol. 2, box 5-J).
Ducks Unlimited uses remotely sensed data from satellites in combination with aerial photography from theFish and Wildlife Service’s National Wetlands Inventory project for wetland monitoring. For their purposes,combining National wetlands Inventory digital data with satellite data for evaluating wetland functions is morevaluable than using either product alone (18).
Current satellite data are useful for studying ecological processes on a very large scale, but are relativelyinadequate for detecting more subtle ecological changes, such as those at ecotones, at the edges of ecosystems,or within an individual plant community. “Satellite data cannot match the extent, classification detail, or reliability”of data from aerial photography and other manual techniques used in the National Wetlands Inventory Project (18).
9 TO convert feet to meters, rmdtiply by 0.305.
(Continued on next page)
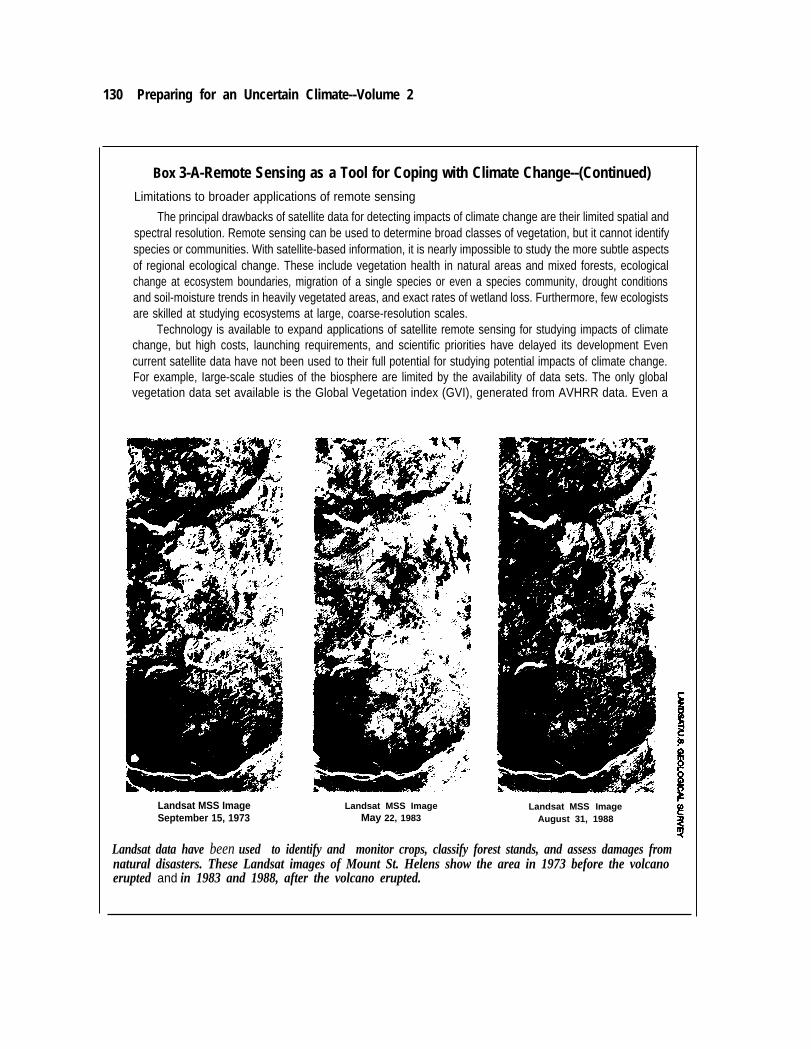
130 Preparing for an Uncertain Climate--Volume 2
Box 3-A-Remote Sensing as a Tool for Coping with Climate Change--(Continued)Limitations to broader applications of remote sensing
The principal drawbacks of satellite data for detecting impacts of climate change are their limited spatial andspectral resolution. Remote sensing can be used to determine broad classes of vegetation, but it cannot identifyspecies or communities. With satellite-based information, it is nearly impossible to study the more subtle aspectsof regional ecological change. These include vegetation health in natural areas and mixed forests, ecologicalchange at ecosystem boundaries, migration of a single species or even a species community, drought conditionsand soil-moisture trends in heavily vegetated areas, and exact rates of wetland loss. Furthermore, few ecologistsare skilled at studying ecosystems at large, coarse-resolution scales.
Technology is available to expand applications of satellite remote sensing for studying impacts of climatechange, but high costs, launching requirements, and scientific priorities have delayed its development Evencurrent satellite data have not been used to their full potential for studying potential impacts of climate change.For example, Iarge-scale studies of the biosphere are limited by the availability of data sets. The only globalvegetation data set available is the Global Vegetation index (GVI), generated from AVHRR data. Even a
Landsat MSS ImageSeptember 15, 1973
Landsat MSS ImageMay 22, 1983
Landsat MSS ImageAugust 31, 1988
Landsat data have been used to identify and monitor crops, classify forest stands, and assess damages fromnatural disasters. These Landsat images of Mount St. Helens show the area in 1973 before the volcanoerupted and in 1983 and 1988, after the volcano erupted.
Chapter 3-Global Change Research in the Federal Government 131
consistent, calibrated, single-source map of U.S. land cover and land use does not exist. More detailed coverageof large areas on the global or continental scale is limited by high costs and data volume. In fact, many universityresearchers have started to study AVHRR data despite its limited resolution and spectral information because ofthe high costs of Landsat data.
Another factor that limits wider use of remotely sensed data stems from differences among scientificdisciplines. Many ecologists, for example, are not trained to use satellite data (41), and those who useremote-sensing technologies are typically not mainstream ecologists. There has never been a remote-sensinginstrument designed specifically for ecological studies (41). Furthermore, few remote-sensing scientists havebackgrounds in ecology or biology (41). Ecologists must essentially take what they can get from remote-sensingdata that may not be optimal for their field. Opportunities for interdisciplinary studies at universities and therelatively recent surge of interest in ecosystem research (spurred by climate change, deforestation, and globalpollution) may help to bridge the gap.
SOURCE: Office of Technology Assessment 1993.
network. Both these shortcomings are importantto consider in future discussions about the sciencebase of USGCRP. Many correlative measure-ments made with airborne platforms or ground-based instruments (that would verify and calibratethe satellite measurements and provide continu-ous coverage when satellites are not operating)were originally planned to be part of USGCRPbut were not funded. Costs for such efforts couldbe a small percentage of the USGCRP budget—inthe tens of millions of dollars each year.17
The Landsat satellite monitoring program is ofsignificant ecological interest because it is theprimary source of data for detecting long-termecological trends (18).18 Landsat satellites con-tain instruments that analyze multispectral data toobtain images of the Earth (see box 3-A). Newtechnologies have allowed resolution to improvefrom about 100 feet (30 meters)19 to a few feet.Landsat data allow changes to be detected invegetation type and cover, hydrologic patterns,extent of wetlands, land use, and soil moisture. Itis the only satellite monitoring program that has
a 20-year data set, despite several changes inownership and new technology over the years thatnearly resulted in its termination. The data are justnow becoming relevant for ecological studies ofchanges in vegetation cover due to natural proc-esses. Multidecade data sets are vital to globalchange research; however, consistency is ex-tremely difficult because the average life of asatellite is only 5 years. A central element of anextended set of missions must be ensuring thecompatibility of future satellite data with currentdata while accommodating new technologies. Inaddition, subsequent satellites must survive fiscalfluctuations.
■ Balance Among NASA andOther USGCRP Agencies
The question of balance between satellite andnonsatellite measurements is directly connectedto the question of balance among participatingUSGCRP agencies. Currently, NASA, the Na-tional Oceanic and Atmospheric Administration(NOAA), and the Department of Energy (DOE)
17 OTA'S workshop "EOS and USGCRP: Are we Asking and Answering the Right Questions?’ Washington, DC, Feb. 25-26, 1993.
18 Landsat receives approximately 25 percent of its budget from NASA and 75 percent from DOD. It is a part of NASA’s Mission to Planet
Earth, but it is separate from EOS.
19 To convert feet to meters, multiply by 0.305.
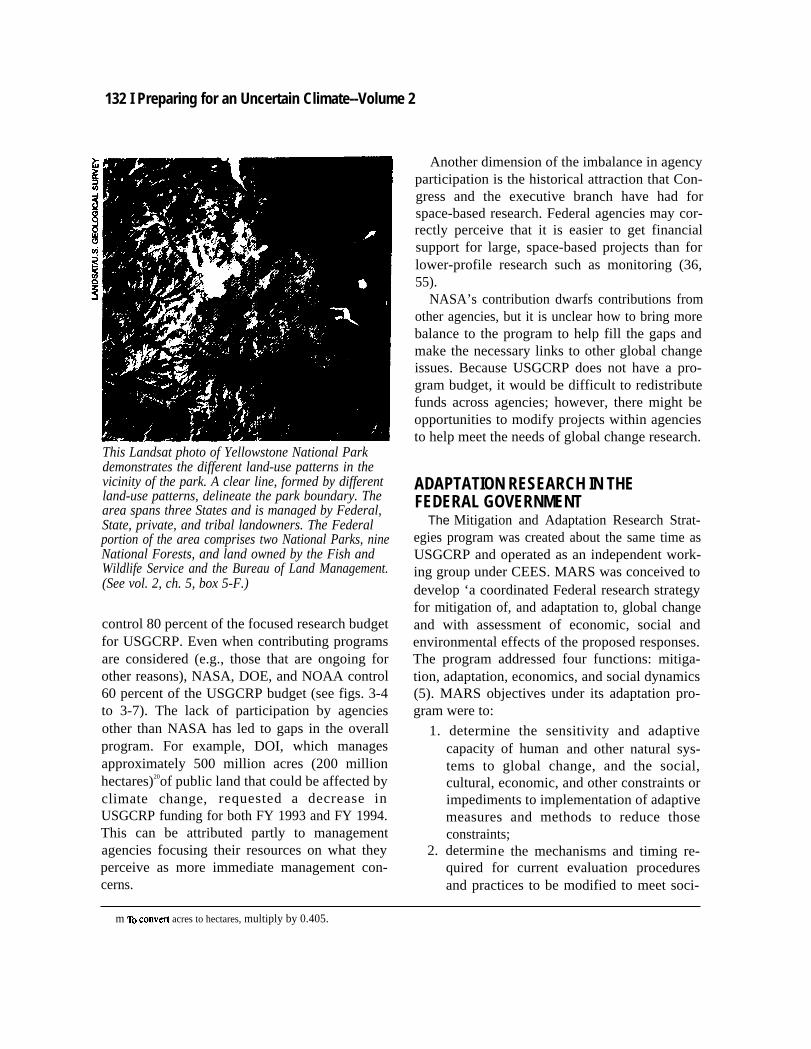
132 I Preparing for an Uncertain Climate--Volume 2
This Landsat photo of Yellowstone National Parkdemonstrates the different land-use patterns in thevicinity of the park. A clear line, formed by differentland-use patterns, delineate the park boundary. Thearea spans three States and is managed by Federal,State, private, and tribal landowners. The Federalportion of the area comprises two National Parks, nineNational Forests, and land owned by the Fish andWildlife Service and the Bureau of Land Management.(See vol. 2, ch. 5, box 5-F.)
control 80 percent of the focused research budgetfor USGCRP. Even when contributing programsare considered (e.g., those that are ongoing forother reasons), NASA, DOE, and NOAA control60 percent of the USGCRP budget (see figs. 3-4to 3-7). The lack of participation by agenciesother than NASA has led to gaps in the overallprogram. For example, DOI, which managesapproximately 500 million acres (200 millionhectares)20of public land that could be affected byclimate change, requested a decrease inUSGCRP funding for both FY 1993 and FY 1994.This can be attributed partly to managementagencies focusing their resources on what theyperceive as more immediate management con-cerns.
Another dimension of the imbalance in agencyparticipation is the historical attraction that Con-gress and the executive branch have had forspace-based research. Federal agencies may cor-rectly perceive that it is easier to get financialsupport for large, space-based projects than forlower-profile research such as monitoring (36,55).
NASA’s contribution dwarfs contributions fromother agencies, but it is unclear how to bring morebalance to the program to help fill the gaps andmake the necessary links to other global changeissues. Because USGCRP does not have a pro-gram budget, it would be difficult to redistributefunds across agencies; however, there might beopportunities to modify projects within agenciesto help meet the needs of global change research.
ADAPTATION RESEARCH IN THEFEDERAL GOVERNMENT
The Mitigation and Adaptation Research Strat-egies program was created about the same time asUSGCRP and operated as an independent work-ing group under CEES. MARS was conceived todevelop ‘a coordinated Federal research strategyfor mitigation of, and adaptation to, global changeand with assessment of economic, social andenvironmental effects of the proposed responses.The program addressed four functions: mitiga-tion, adaptation, economics, and social dynamics(5). MARS objectives under its adaptation pro-gram were to:
1. determine the sensitivity and adaptivecapacity of human and other natural sys-tems to global change, and the social,cultural, economic, and other constraints orimpediments to implementation of adaptivemeasures and methods to reduce thoseconstraints;
2. determine the mechanisms and timing re-quired for current evaluation proceduresand practices to be modified to meet soci-
m ~ ~nv~ acres to hectares, multiply by 0.405.
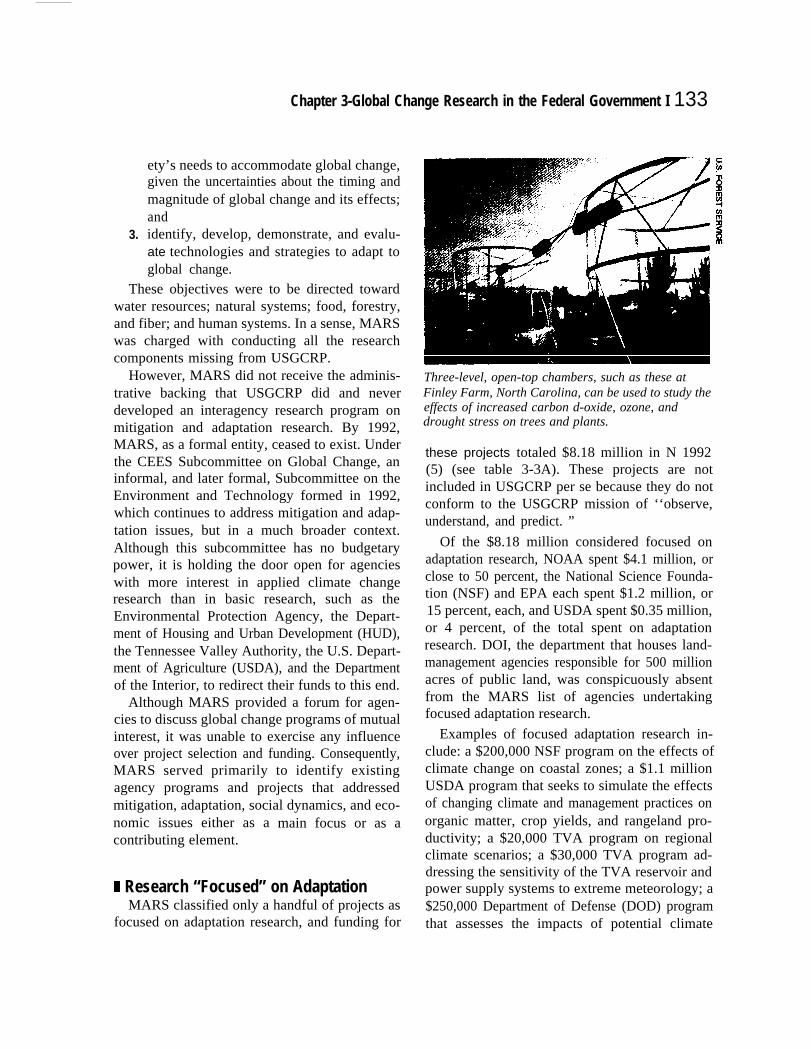
Chapter 3-Global Change Research in the Federal Government I 133
3.
ety’s needs to accommodate global change,given the uncertainties about the timing andmagnitude of global change and its effects;andidentify, develop, demonstrate, and evalu-ate technologies and strategies to adapt toglobal change.
These objectives were to be directed towardwater resources; natural systems; food, forestry,and fiber; and human systems. In a sense, MARSwas charged with conducting all the researchcomponents missing from USGCRP.
However, MARS did not receive the adminis-trative backing that USGCRP did and neverdeveloped an interagency research program onmitigation and adaptation research. By 1992,MARS, as a formal entity, ceased to exist. Underthe CEES Subcommittee on Global Change, aninformal, and later formal, Subcommittee on theEnvironment and Technology formed in 1992,which continues to address mitigation and adap-tation issues, but in a much broader context.Although this subcommittee has no budgetarypower, it is holding the door open for agencieswith more interest in applied climate changeresearch than in basic research, such as theEnvironmental Protection Agency, the Depart-ment of Housing and Urban Development (HUD),the Tennessee Valley Authority, the U.S. Depart-ment of Agriculture (USDA), and the Departmentof the Interior, to redirect their funds to this end.
Although MARS provided a forum for agen-cies to discuss global change programs of mutualinterest, it was unable to exercise any influenceover project selection and funding. Consequently,MARS served primarily to identify existingagency programs and projects that addressedmitigation, adaptation, social dynamics, and eco-nomic issues either as a main focus or as acontributing element.
i Research “Focused” on AdaptationMARS classified only a handful of projects as
focused on adaptation research, and funding for
Three-level, open-top chambers, such as these atFinley Farm, North Carolina, can be used to study theeffects of increased carbon d-oxide, ozone, anddrought stress on trees and plants.
these projects totaled $8.18 million in N 1992(5) (see table 3-3A). These projects are notincluded in USGCRP per se because they do notconform to the USGCRP mission of ‘‘observe,understand, and predict. ”
Of the $8.18 million considered focused onadaptation research, NOAA spent $4.1 million, orclose to 50 percent, the National Science Founda-tion (NSF) and EPA each spent $1.2 million, or15 percent, each, and USDA spent $0.35 million,or 4 percent, of the total spent on adaptationresearch. DOI, the department that houses land-management agencies responsible for 500 millionacres of public land, was conspicuously absentfrom the MARS list of agencies undertakingfocused adaptation research.
Examples of focused adaptation research in-clude: a $200,000 NSF program on the effects ofclimate change on coastal zones; a $1.1 millionUSDA program that seeks to simulate the effectsof changing climate and management practices onorganic matter, crop yields, and rangeland pro-ductivity; a $20,000 TVA program on regionalclimate scenarios; a $30,000 TVA program ad-dressing the sensitivity of the TVA reservoir andpower supply systems to extreme meteorology; a$250,000 Department of Defense (DOD) programthat assesses the impacts of potential climate
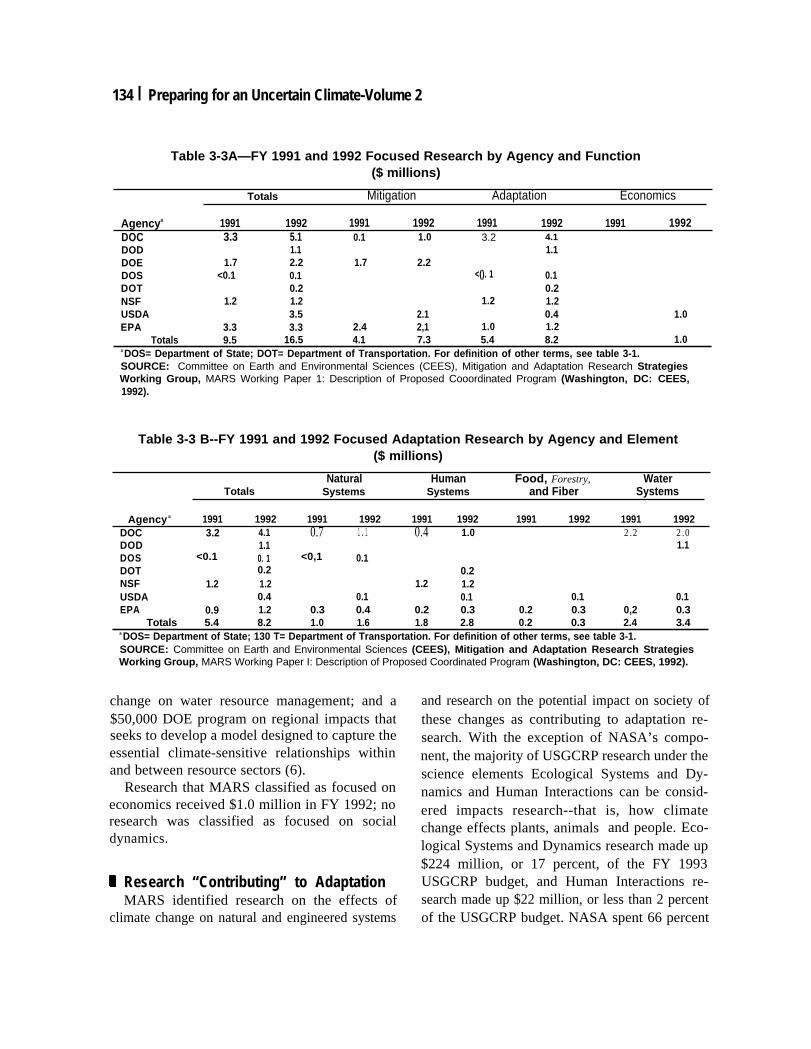
134 I Preparing for an Uncertain Climate-Volume 2
Table 3-3A—FY 1991 and 1992 Focused Research by Agency and Function($ millions)
Totals Mitigation Adaptation Economics
Agencya 1991 1992 1991 1992 1991 1992 1991 1992DOC 3.3 5.1 0.1 1.0 3.2 4.1DOD 1.1 1.1DOE 1.7 2.2 1.7 2.2DOS <0.1 0.1 <(). 1 0.1DOT 0.2 0.2NSF 1.2 1.2 1.2 1.2USDA 3.5 2.1 0.4 1.0EPA 3.3 3.3 2.4 2,1 1.0 1.2
Totals 9.5 16.5 4.1 7.3 5.4 8.2 1.0a DOS= Department of State; DOT= Department of Transportation. For definition of other terms, see table 3-1.SOURCE: Committee on Earth and Environmental Sciences (CEES), Mitigation and Adaptation Research StrategiesWorking Group, MARS Working Paper 1: Description of Proposed Cooordinated Program (Washington, DC: CEES,1992).
Table 3-3 B--FY 1991 and 1992 Focused Adaptation Research by Agency and Element($ millions)
Natural Human Food, Forestry, WaterTotals Systems Systems and Fiber Systems
Agency a 1991 1992 1991 1992 1991 1992 1991 1992 1991 1992DOC 3.2 4.1 0.7 1.1 0.4 1.0 2.2 2.0DOD 1.1 1.1DOS <0.1 0. 1 <0,1 0.1DOT 0.2 0.2NSF 1.2 1.2 1.2 1.2USDA 0.4 0.1 0.1 0.1 0.1EPA 0.9 1.2 0.3 0.4 0.2 0.3 0.2 0.3 0,2 0.3
Totals 5.4 8.2 1.0 1.6 1.8 2.8 0.2 0.3 2.4 3.4a DOS= Department of State; 130 T= Department of Transportation. For definition of other terms, see table 3-1.SOURCE: Committee on Earth and Environmental Sciences (CEES), Mitigation and Adaptation Research StrategiesWorking Group, MARS Working Paper I: Description of Proposed Coordinated Program (Washington, DC: CEES, 1992).
change on water resource management; and a$50,000 DOE program on regional impacts thatseeks to develop a model designed to capture theessential climate-sensitive relationships withinand between resource sectors (6).
Research that MARS classified as focused oneconomics received $1.0 million in FY 1992; noresearch was classified as focused on socialdynamics.
I Research “Contributing” to AdaptationMARS identified research on the effects of
climate change on natural and engineered systems
and research on the potential impact on society ofthese changes as contributing to adaptation re-search. With the exception of NASA’s compo-nent, the majority of USGCRP research under thescience elements Ecological Systems and Dy-namics and Human Interactions can be consid-ered impacts research--that is, how climatechange effects plants, animals and people. Eco-logical Systems and Dynamics research made up$224 million, or 17 percent, of the FY 1993USGCRP budget, and Human Interactions re-search made up $22 million, or less than 2 percentof the USGCRP budget. NASA spent 66 percent
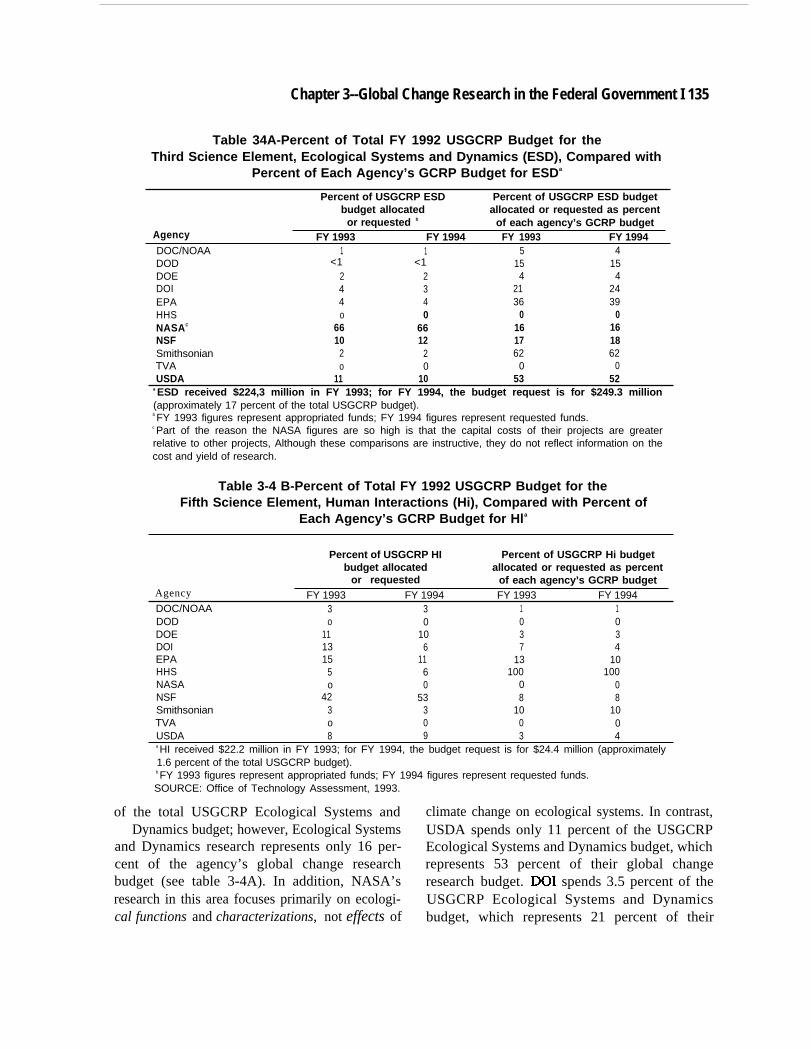
Chapter 3--Global Change Research in the Federal Government I 135
Table 34A-Percent of Total FY 1992 USGCRP Budget for theThird Science Element, Ecological Systems and Dynamics (ESD), Compared with
Percent of Each Agency’s GCRP Budget for ESDa
Percent of USGCRP ESD Percent of USGCRP ESD budgetbudget allocated allocated or requested as percent
or requested b of each agency’s GCRP budgetAgency FY 1993 FY 1994 FY 1993 FY 1994DOC/NOAA 1 1 5 4DOD <1 <1 15 15DOE 2 2 4 4DOI 4 3 21 24EPA 4 4 36 39HHS o 0 0 0NASAC 66 66 16 16NSF 10 12 17 18Smithsonian 2 2 62 62TVA o 0 0 0USDA 11 10 53 52
a ESD received $224,3 million in FY 1993; for FY 1994, the budget request is for $249.3 million(approximately 17 percent of the total USGCRP budget).b FY 1993 figures represent appropriated funds; FY 1994 figures represent requested funds.c Part of the reason the NASA figures are so high is that the capital costs of their projects are greaterrelative to other projects, Although these comparisons are instructive, they do not reflect information on thecost and yield of research.
Table 3-4 B-Percent of Total FY 1992 USGCRP Budget for theFifth Science Element, Human Interactions (Hi), Compared with Percent of
Each Agency’s GCRP Budget for Hla
Percent of USGCRP HI Percent of USGCRP Hi budgetbudget allocated allocated or requested as percent
or requested of each agency’s GCRP budgetAgency FY 1993 FY 1994 FY 1993 FY 1994DOC/NOAA 3 3 1 1DOD o 0 0 0DOE 11 10 3 3DOI 13 6 7 4EPA 15 11 13 10HHS 5 6 100 100NASA o 0 0 0NSF 42 53 8 8Smithsonian 3 3 10 10TVA o 0 0 0USDA 8 9 3 4a HI received $22.2 million in FY 1993; for FY 1994, the budget request is for $24.4 million (approximately1.6 percent of the total USGCRP budget).b FY 1993 figures represent appropriated funds; FY 1994 figures represent requested funds.SOURCE: Office of Technology Assessment, 1993.
of the total USGCRP Ecological Systems and climate change on ecological systems. In contrast,Dynamics budget; however, Ecological Systems USDA spends only 11 percent of the USGCRP
and Dynamics research represents only 16 per- Ecological Systems and Dynamics budget, whichcent of the agency’s global change research represents 53 percent of their global changebudget (see table 3-4A). In addition, NASA’s research budget. DOI spends 3.5 percent of theresearch in this area focuses primarily on ecologi- USGCRP Ecological Systems and Dynamicscal functions and characterizations, not effects of budget, which represents 21 percent of their
136 I Preparing for an Uncertain Climate-Volume 2
global change research budget (see table 3-4A).The agencies that one would expect to conduct thebulk of research on ecological systems and theeffects of climate change on ecosystems—EPAand the land-management agencies of DOI andUSDA—play only a minor role. The reasons arevaried and complex, but include the higher capitalcosts of NASA projects and the reluctance ofsome agencies to actively support and participatein the program. Consequently, these agencies’contributions to USGCRP comprise projects thatare in place for reasons other than climate changeresearch, such as characterizing ground- andsurface-water flows, maintaining weather data,and monitoring ecosystem change.
Definitions of what encompasses EcologicalSystems and Dynamics research become veryimportant in the face of such disparate budgetallocations among agencies. If the definition isnot consistent across agencies, or if it is too broad,large gaps could potentially exist. For example, itis unclear how much large ecosystem research isbeing conducted—such as research on the use ofcorridors for the migration of plants and animalsin response to global change or techniques forecosystem transplantation. Are we clarifyingrates at which various species in an ecosystem canmigrate? Do we understand how to maintainecosystems in place? Will pest ranges increase?Will fire hazards increase’? Are our crop and treevarieties genetically diverse enough to cope withthe range of potential changes? What agencies areaddressing these questions, and is research ade-quate to find the answers to these questions? Whatquestions under this research category doesNASA attempt to answer compared with whatquestions USDA attempts to answer? NASA’scontribution to the understanding of ecologicalsystems comes largely from space-based meas-urements and observations, whereas the land-management agencies’ contribution comes morefrom field research. Box 3-B highlights weak-nesses in environmental research identified by theNational Research Council (NRC).
Of the $22 million spent on Human Interac-tions, NSF spends 42 percent, which represents7.5 percent of their global change researchbudget. Except for the Department of Health andHuman Services (HI-IS), which spends $5.41million, or 100 percent, of its USGCRP budget onHuman Interactions, the percent of agencyUSGCRP budgets allocated to Human Interac-tions ranges from 0 to 10 percent (see tables 3-3Band 3-4B). Although it is difficult to obtainreliable numbers, because social science researchhas many labels, it is doubtful that any Federalagency devotes as much as 1 percent of its totalresearch budget to environmental social science(37).
Specific projects classified as contributing toadaptation include: a $4.7 million program atDOI’s National Park Service (NPS) to improvethe scientific basis of adaptive management of thetypes of ecosystem responses likely to be associ-ated with climate and other global environmentalchanges; a $1.3 million program at DOI’s Bureauof Reclamation (BOR) to study the changes inhydrologic processes under scenarios of globalclimate change and to determine the potentialimpacts on snowpack, snowmelt, and runoff inthe 17 Western States; a $1.5 million program atDOI’s U.S. Geological Survey (USGS) to evalu-ate the sensitivity of water resources to climatevariability and change across the United States;and a $150,000 DOE program to evaluate theexisting social science knowledge base concer-ning energy and the analysis of the role ofinstitutions in making decisions affecting climatechange (6).
Very little of the effects research describedabove could also be considered research on theimpacts of global change on human systems.USGCRP’S new Economics Initiative does con-sider the impact of climate change on the econ-omy, and several agencies support research in thisarea, including NSF, NOAA, and USDA (in itsEconomics Research Service). However, the eco-
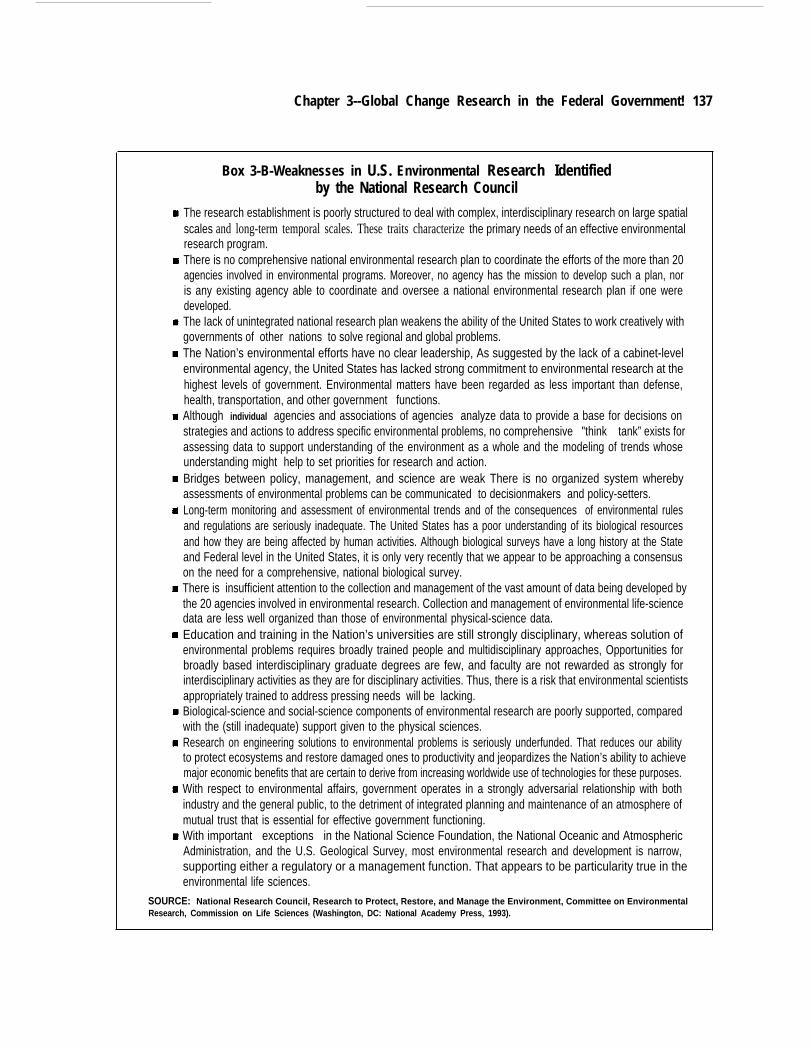
Chapter 3--Global Change Research in the Federal Government! 137
Box 3-B-Weaknesses in U.S. Environmental Research Identifiedby the National Research Council
The research establishment is poorly structured to deal with complex, interdisciplinary research on large spatialscales and long-term temporal scales. These traits characterize the primary needs of an effective environmentalresearch program.There is no comprehensive national environmental research plan to coordinate the efforts of the more than 20agencies involved in environmental programs. Moreover, no agency has the mission to develop such a plan, noris any existing agency able to coordinate and oversee a national environmental research plan if one weredeveloped.The Iack of unintegrated national research plan weakens the ability of the United States to work creatively withgovernments of other nations to solve regional and global problems.The Nation’s environmental efforts have no clear leadership, As suggested by the lack of a cabinet-levelenvironmental agency, the United States has lacked strong commitment to environmental research at thehighest levels of government. Environmental matters have been regarded as less important than defense,health, transportation, and other government functions.Although individual agencies and associations of agencies analyze data to provide a base for decisions onstrategies and actions to address specific environmental problems, no comprehensive "think tank” exists forassessing data to support understanding of the environment as a whole and the modeling of trends whoseunderstanding might help to set priorities for research and action.Bridges between policy, management, and science are weak There is no organized system wherebyassessments of environmental problems can be communicated to decisionmakers and policy-setters.Long-term monitoring and assessment of environmental trends and of the consequences of environmental rulesand regulations are seriously inadequate. The United States has a poor understanding of its biological resourcesand how they are being affected by human activities. Although biological surveys have a long history at the Stateand Federal level in the United States, it is only very recently that we appear to be approaching a consensuson the need for a comprehensive, national biological survey.There is insufficient attention to the collection and management of the vast amount of data being developed bythe 20 agencies involved in environmental research. Collection and management of environmental life-sciencedata are less well organized than those of environmental physical-science data.Education and training in the Nation’s universities are still strongly disciplinary, whereas solution ofenvironmental problems requires broadly trained people and multidisciplinary approaches, Opportunities forbroadly based interdisciplinary graduate degrees are few, and faculty are not rewarded as strongly forinterdisciplinary activities as they are for disciplinary activities. Thus, there is a risk that environmental scientistsappropriately trained to address pressing needs will be lacking.Biological-science and social-science components of environmental research are poorly supported, comparedwith the (still inadequate) support given to the physical sciences.Research on engineering solutions to environmental problems is seriously underfunded. That reduces our abilityto protect ecosystems and restore damaged ones to productivity and jeopardizes the Nation’s ability to achievemajor economic benefits that are certain to derive from increasing worldwide use of technologies for these purposes.With respect to environmental affairs, government operates in a strongly adversarial relationship with bothindustry and the general public, to the detriment of integrated planning and maintenance of an atmosphere ofmutual trust that is essential for effective government functioning.With important exceptions in the National Science Foundation, the National Oceanic and AtmosphericAdministration, and the U.S. Geological Survey, most environmental research and development is narrow,supporting either a regulatory or a management function. That appears to be particularity true in theenvironmental life sciences.
SOURCE: National Research Council, Research to Protect, Restore, and Manage the Environment, Committee on EnvironmentalResearch, Commission on Life Sciences (Washington, DC: National Academy Press, 1993).
138 I Preparing for an Uncertain Climate--Volume 2
nomics component of USGCRP is not well-integrated with the rest of the program.21
CEES is aware of the absence of research on theimpacts of climate change and has slightlyexpanded Earth Process Research, the secondintegrating priority, to include research to deter-mine the impacts associated with predicted globalchanges (12). However, explicit recognition ofthe need for research on impacts of climatechange is not yet reflected in the programstructure.
S A New Adaptation ProgramFor reasons discussed above, it is necessary to
pursue research on impacts of global change andpotential response and adaptation strategies with-out waiting for USGCRP to complete climateresearch. The issues addressed by MARS con-tinue to be discussed because MARS sought toanswer near-term policy questions and questionsthat naturally accompany climate change re-search: If the climate is changing, how willforests, agriculture, and natural areas be affectedand what should we do? MARS may not have hadthe administrative, congressional, and programsupport it needed to pursue its mission a few yearsago, but now MAIM-related questions are beingasked with more persistence, and it might be timeto consider reinstating another MARS-type pro-gram.22The following discussion addresses how
such a program might be structured. We suggestsome possible ways to incorporate adaptation intoUSGCRP below and in option 3-5.
A framework for developing research prioritiesfor an adaptation research program (ARP) shouldbe developed through a combination of an intera-gency committee and an external advisory panel.The interagency committee should consist of
members from several scientific disciplines andthe policy- and decisionmaking communities.Committee and advisory panel members shouldbe committed to the goal of creating a management-and policy-relevant research program.
The committee and advisory panel could ad-dress the following questions:
1.
2.
3.
What areas of science are important topursue in order to support adaptation re-search? What existing federally supportedresearch, which is not currently classified asglobal change research, could be augmentedto support an adaptation-focused researchprogram?
What areas of research would most effec-tively reduce the physical, biological, social-behavioral, and economic uncertainties facedby decisionmakers in choosing among pol-icy options affecting global change?23
How can ARP be organized so that it isuseful to public and private decisionmakers?
Answers to these questions require cooperationand coordination in the ecological and socialsciences communities, coordination among theland-management agencies, and a clear delinea-tion of the role of adaptation research in agencypolicy and management. As concluded by theCommittee on Human Dimensions of GlobalChange, there is “an almost complete mismatchbetween the roster of Federal agencies thatsupport research on global change and the rosterof agencies with strong capabilities in socialscience” (35). There is a similar mismatchbetween the roster of Federal agencies withenvironmental responsibilities and the roster ofagencies with strong capabilities in social science(37).
21 OTA’S wor~hop “EOS @ US-: AN We A&@ and AnSWU@ thc Right QllCSdOIIS?’ W-XL ~, Feb. X-26, 1993.
21 OWSS wor~hop ‘‘EOS md Us(3CRP: &e We Asking and Answering the Right Questions?’ W-Q X, Feb. 2S-26, 1993.
22 ~n~s ~fi~y SS~OTA m addreM adaptation issues however, if Congress ChOOSCS to tit@tC ~ *P@onPro~ it m
also decide whether related mitigation wsues should readdressed along withan adaptationpro~ as a separate prograq orwithin USGCRP.
23 ~ qu@on VV~ &VclO@ in the National Acid Precipitation &SSIMnt ~~’s @NM’@ 19M ~~ - for ~
Group I (39). Unfortunately, that task group was disbanded the next year.
—.
Chapter 3-Global Change Research in the Federal Government I 139
The Ecological Society of America’s Sustain-able Biosphere Initiative (SBI) has made a start infostering cooperation among the ecological andsocial sciences. SBI has clearly laid out scientificpriorities in the ecological sciences. Coordinationamong the land-management agencies is alsobeginning with groups such as the TerrestrialResearch Interest Group, an ad hoc coordinatingcommittee of Federal agencies and other organi-zations conducting terrestrial research (see box5-J). An adaptation program could continue toencourage such efforts.
Budget Mechanisms for ARP
Because the scope of any ARP would reachacross agencies, a new agency or executive body,or a new office in an existing agency, could becreated to house it or, as with USGCRP, a budgetcrosscut could be used. Because several agencieshave significant expertise and infrastructure topursue research on adaptation to global changeand because of budget constraints, Congressmight find it difficult to create a separate body forARP. If an existing agency housed ARP, it couldundermine the ARP mission by creating tensionamong agencies about interagency authority.Because budget crosscuts have worked well in thepast, at least until the point when they aresubmitted to Congress, the use of a budgetcrosscut for ARP might be desirable.
FCCSET currently coordinates the budgetcrosscut of USGCRP and could coordinate thebudget crosscut for ARP. However, becauseFCCSET supports science, engineering, and tech-nology initiatives but does not initiate management-and policy-relevant deliberations within theseprograms, it may not be the best organization forARP budget coordination. If an office within theWhite House coordinated ARP’s budget, theprogram could more easily maintain its emphasison policy-relevant research; however, it might bemore subject to political pressure.
ARP Within USGCRPIf Congress does not wish to create anew ARP,
but chooses instead to augment the existingUSGCRP three points should be considered.First, the priorities of USGCRP would need to bechanged. In addition to observation, understandi-ng, and prediction, “planning’ for climatechange and other global changes, including adap-tation, would have to be incorporated into theUSGCRP goals. The seven scientific elements inthe priority structure of USGCRP might need tobe rewritten, with the help of advisory panels,agency personnel, and, perhaps, the NationalResearch Council. More funds would need to beallocated to the research topics under the presentEcological Systems and Dynamics and HumanDimensions elements. Adaptation would have tobe incorporated into the existing elements, or anew adaptation element would have to be added.
Second, as would be the case with a separateprogram for adaptation, the land-managementagencies must be encouraged to unify theirresearch programs that address ecological andhuman-system response to and management ofglobal change. Congress must commit moreresources to the Ecological Systems and Dynam-ics and Human Interactions research areas, espe-cially within the land-management agencies.Finally, projects currently supported underUSGCRP would need to be reviewed for theirusefulness to adaptation research. For example,the Earth Observing System (EOS) currentlyconcentrates on climate monitoring and ecologi-cal monitoring, primarily for the sake of deter-mining land-atmosphere interfaces for globalclimate models. Could EOS be modified toprovide information on processes that are impor-tant for adaptation?
EVALUATION MECHANISMSTo date, there has been no formal evaluation of
the overall scope, goals, and priorities ofUSGCRP and of whether its activities collect-ively are addressing the needs of policy makers.
140 Preparing for an Uncertain Climate-Volume 2
Several evaluation mechanisms could be used toaddress the dichotomy between science andpolicy in USGCRP, including internal and exter-nal reviews, integrated assessments, and coordi-nated congressional oversight. Appropriate com-munication links among scientific disciplines,Federal agencies, State agencies, policy makers,decisionmakers, and all levels of USGCRP arevital for its success.
■ ReviewsMost formal reviews of USGCRP elements
have centered on the instruments and methodsused in research about specific scientific prioritiesor have focused on individual projects within theprogram. For example, teams reviewing the EOSprogram have addressed specific instruments thatEOS should use, and the National Academy ofSciences (NAS) has carried out reviews andmidcourse evaluations of specific agency pro-grams and projects.
Reviews should be used as a mechanism formaintaining flexibility in the program and toredirect its activities, if necessary. Reviewsshould: be timely and efficient; include peoplewho do not have an immediate stake in USGCRP,but do have significant knowledge about itscurrent structure, content, and history; be con-ducted periodically to reflect the nature of thequestions being asked; and identify programs thatcan be eliminated as well as recommend newones. Perhaps most importantly, reviews that callfor a redirection in the overall program shouldconsider that research on global change issuesrequires a financial and institutional commitmentthat transcends political and budgetary cycles.Reviews should not be used to respond to thepolitical crisis of the day or as a mechanism toundermine effective programs with long timehorizons.
■ Integrated AssessmentsReviews generally look at individual parts of a
program or the program as a whole and determinehow they are functioning; they do not try tointegrate the program’s different research results.Integrated assessments are a mechanism forsynthesizing all the research relevant to anidentified problem and for presenting researchresults in a policy context to decisionmakers (13,42).24 Just as important, integrated assessmentshelp guide research and identify key assumptions,uncertainties, gaps, and areas of agreement. TheFederal Government tried to incorporate an as-sessment process into the National Acid Precipi-tation Assessment Program (NAPAP) in the1980s with only limited success (see box 3-C). Achallenge for the global change research commu-nity will be to devise assessments that minimizedisruption of ongoing programs but still allow forredirection of program elements in light of newdiscoveries, advances in technology, and chang-ing long-term needs of policy makers.
Scientific information is critical, but not suffi-cient, in determining how the United Statesshould respond to the risks of global change. IfUSGCRP is to be driven by social relevance aswell as by scientific curiosity, its research priori-ties should include sociocultural factors as well asphysical factors (23). Integrated assessmentscould help determine the importance of theproblems presented by global change relative toother policy problems, outline alternative policiesto respond to global change, and explain the prosand cons of various responses and implementa-tion strategies.
For example, preliminary results of an inte-grated assessment computer model to prioritizepolicy-relevant research, by Carnegie MellonUniversity, suggest that: economic and ecologicalimpacts are unambiguously the most important
24 Integrated assessment (also known as comprehensive and end-to-end Assessment) is an evolving concept. An integrated assessment ofglobal change would generally include at least the following activities: assessments of the physical science component of a project; assessmentsof the potential impacts of change on the environment, human health, and the economy; assessments of the effectiveness and economic impactof possible societal responses to change; and assessments of the political feasibility of possible responses (31).
Chapter 3-Global Change Research in the Federal Government 141
Box 3-C--Lessons from NAPAP
In 1980, Congress passed the Acid Precipitation Act (Title Vll of the Energy Security Act, P.L. 98-294) andthereby established an interagency task force to plan and oversee a 10-year National Acid PrecipitationAssessment Plan (NAPAP). The National Oceanic and Atmospheric Administration, the U.S. Department ofAgriculture, and the Environmental Protection Agency jointly chaired the task force, which included representativesfrom the Department of the Interior, the Department of Health and Human Services, the Department of Commerce,the Department of Energy, the Department of State, the National Aeronautics and Space Administration, theCouncil on Environmental Quality, the National Science Foundation, and the Tennessee Valley Authority alongwith representatives of the Argonne, Brookhaven, Oak Ridge, and Pacific Northwest National Laboratories andfour Presidential appointees. The purpose of NAPAP was to increase our understanding of the causes and effectsof add precipitation through research, monitoring, and assessment activities that emphasized the timelydevelopment of science for use in decisionmaking (39).
NAPAP (with an annual budget that ranged from about $17 million at the beginning of the program to justover $300 million at its end) was one of the most ambitious interagency programs ever focused on a particularproblem (47). It was designed to be a major research effort that provided policy-relevant information in a timelymanner. It succeeded in its research efforts, but it did not provide policy-relevant information in a timely manner.Because the nature of problems facing the country is increasingly interdisciplinary and global in scope, it isreasonable to assume that the government will mandate more programs that try to bridge the gap between scienceand public policy. To reap the greatest benefits from these programs, it will be necessary to incorporate the lessonsof NAPAP into program structure. This box focuses on the Task Group on Assessments and Policy Analysis andthe overall lessons learned from such a large, interagency program.
When founded, NAPAP consisted of 10 task groups, each with a single agency serving as the coordinationcontact: Natural Sources of Acid Precipitation, Human Sources of Acid Precipitation, Atmospheric Processes,Deposition Monitoring, Aquatic Effects, Terrestrial Effects, Effects on Materials and Cultural Resources, ControlTechnologies, Assessments and Policy Analysis, and International Activities. In 1985, the assessments and policyanalysis task group was disbanded--a decision that undermined the value of the program for decisionmakers.
Congress established NAPAP in large part to determine whether acid rain was a problem. However, in thecontext of research NAPAP did not approach acid rain as a unified issue. Rather, it examined the subject atmultidisciplinary and subdisciplinary levels with Iittle emphasis on synthesizing findings, As stated in one critique(24):
The program reported findings in excruciating disciplinary detail, an approach which was not especiallyhelpful to non-specialist decision makers. The disciplinary pluralism of NAPAP also allowed policyadvocates to pick and choose among NAPAP’s reported findings, emphasizing facts or uncertaintiessupporting a particular position and reemphasizing others. NAPAP lacked an extra-disciplinaryperspective that would have allowed it to characterize acid rain as a problem, non-problem, or
‘ something in between,
Assessment and policy analysis research develops and uses quantitative methods to organize andcommunicate scientific and other information in ways that allow comparison of policy choices. These methodsinclude decision analysis, benefit-cost analysis, risk analysis, and technology assessments. The NAPAP TaskGroup on Assessments and Policy Analysis attempted to begin early in the program to develop integratedassessment methodologies and to perform multiple assessments throughout the program to ensure policyrelevance. A 1985 report was to include an assessment of the current damages attributed to acid deposition, anuncertainty analysis of key scientific areas, and the implications of uncertainty for policy choices. The task groupalso tried to develop a framework for the methodology for subsequent integrated assessments in 1987 and 1989(25),
(Continued on next page]
142 Preparing for an Uncertain Climate--Volume 2
Box W-lessons from NAPAP--(Continued)
However, in 1985, NAPAP’s management changed and, consequently, the focus of the program changed.The assessments task group was disbanded, and responsibility for assessments was transferred to NAPAP’sdirector of research. It was uncertain whether NAPAP would produce even one assessment: NAPAP ceasedfunding integrated assessment modeling because the Interagency Scientific Committee decided to spend theirlimited funding on other research. The new director repeatedly delayed the 1985 assessment, but it was finallyreleased-with much controversy--in 1987. The 1987 and 1989 integrated assessments were never produced.Finally, during the Iast few years of the program, NAPAP produce its second integrated assessment; however, the1990 publication of the report came too late to be of maximum use to policy makers in formulating the amendmentsto the Clean Air Act (47).
Because NAPAP failed to carry out the full range of assessmentis t originally planned, key components forthe 1990 integrated assessment were either not pursued or were underfunded, and the assessment wasincomplete (39). For example, although NAPAP was initially supposed to evaluate the economic effects of adddeposition on crops, forests, fisheries, and recreational and aesthetic resources and to determine the implicationsof alternative policies, funds were significantly reduced for research in these areas (47).
The Oversight Review Board (ORB) of NAPAP, in its 1981 report to the Joint Chairs council of the InteragencyTask Force on Acidic Deposition, strongly emphasized that an assessment function be given primacy throughout
recommendation on lessons learned about the interface between sciencean interagency program (39). ORB’s keyand policy was to give assessment priority over research (24) because “science and research findings per se havelittle to offer directly to the public policy process, [and] their usefulness depends on assessment, defined as theinterpretation of findings relevant to decisions” (39). ORB also outlined eight other suggestions that any programwith such a close interface between science and policy should follow:
1. Match institutional remedies to problems.2. Obtain and maintain political commitment.3. Take steps to ensure continuity.4. Configure organization and authority to match responsibility.5. Give assessment primacy.6. Provide for independent external programmatic oversight.7. Understand the role of science and how to use it.8. Take special care with communication.9. Prepare early for ending the program.
The insights gained from the experiences of NAPAP were not considered when designing the U.S. GlobalChange Research Program (USGCRP)-a much larger program on both a temporal and spatial scale thanNAPAP. Some argue that USGCRP is following the same path as NAPAP--good research will come fromUSGCRP, but the results will not be used to inform policy, and decisions concerning global change will be madewith little more knowledge than is available today (42). The logical questions to ask are: Why didn’t Congress usethe experiences of NAPAP in formulating Iegislation for USGCRP, and how should incorporation of lessons fromNAPAP be integrated into USGCRP and future Interagency programs?
SOURCE: Office of Technology Assessment, 1993.
sources of uncertainty and that reducing the according to the policy objectives chosen and theuncertainty is more important than resolving the time horizon; although they must not be ignored,differences among climate models; the priority uncertainties about climate variables appear, inplaced on research in different fields will vary many cases, to be less important than certain
Chapter 3-Global Change Research in the Federal Government I 143
social, economic, and ecological factors; andmodels that measure all impacts in monetaryterms are unlikely to be able to explore many ofthe most important aspects of the climate prob-lem (15).
Regardless of the scope of an integratedassessment, its primary functions should be: toidentify key questions to be answered, to surveythe state of current scientific judgments aboutwhat we know and do not know about globalchange and its impacts, to identify and prioritizewhat the key uncertainties are in relation to policyneeds, to list key assumptions and judgments, toidentify where new research is needed to aid thepolicy process most effectively, including re-search on key uncertainties in understanding theclimate system and fostering mitigation andadaptation research, and to establish the require-ments for peer and public review (24, 42).
Assessments need not be conducted sequen-tially (e.g., results of earth science research oreconomic research need not be complete beforean assessment can begin), but should begin at thebeginning of a program and continue throughoutthe life of the program (l). The ideal assessmentwould pay particular attention to bridging gapsand maintaining essential links among variousresearch projects and disciplines and woulddetermine the value of new information.
The Massachusetts Institute of Technology,Carnegie Mellon University, the Electric PowerResearch Institute, and Battelle Pacific NorthwestLaboratory have programs for developing com-puter models for integrated assessments. Forexample, the Battelle Pacific Northwest Labora-tory is developing an Integrated Climate ChangeAssessment Model (ICCAM)25 that will incorpo-rate information from models on human activi-ties, atmospheric composition, climate and sealevel, and terrestrial ecosystems (17). ICCAM isintended to be an integrated collection of these
models in a reduced, or simplified, form, with thegoal of giving practical answers to practicalquestions. The models are limited by the com-plexity and uncertainty of each system, and somefear that the results from these integrated assess-ments could be difficult to understand. However,these models can at least help to structure thought,direct inquiries, identify which uncertainties areimportant and which are not, and suggest coursesof action (40).
Assessments could be performed by independ-ent, nongovernment committees, Federal intera-gency task forces consisting of agency personnelwho are participating in the program, a mix of thetwo groups, or by the National Academy ofSciences (42). Nongovemment committees wouldoffer the fresh perspective of independent evalu-ators who are less weighed down by politicalagendas; however, they might have little controlover the agencies they are trying to influence.Interagency committees would have the advan-tage of using Government researchers who arewell-informed about the program and who couldnot easily ignore assessment findings.
To date, integrated assessments have receivedlittle admini strative support and almost no fund-ing from any ongoing program. Some agencypersonnel have expressed interest in integratedassessments, but few have committed any re-sources to it (EPA and DOE have funded someassessment research). The little funding thatintegrated assessments have received has comelargely from NSF and the Electric Power Re-search Institute. A small percentage of the totalUSGCRP budget—perhaps 1 to 5 percent--couldbe set aside for integrated assessment (15, 50).The Carnegie Commission also recommends thata larger percentage of environmental research anddevelopment dollars go toward assessment andpolicy research (4).
~ Bafielle PKifIC Nort.hwmt Iabomtov is working in conjunction with the University Corporation for Atmospheric Rese=b tie EICC~CPower Researeh Institute, the U.S. Department of Energy, and the Environmental Protection Ageney.
144 I Preparing for an Uncertain Climate--Volume 2
■ Congressional OversightCongress has held several hearings on global
climate change that have focused predominantlyon what we know, what we do not know, theaccuracy of current data, reconciling the existenceof conflicting data, the implication of climatechange for natural resources and the economy,and the potential costs of actions designed tomitigate climate change. However, these hearingshave not successfully addressed USGCRP as aprogram. Some hearings have focused on thecurrent research of program participants, which isa first step in determining the necessity of theresearch, but few have focused on whetherUSGCRP research was supplying informationneeded to develop policy responses to globalchange. The direction of the program and itsemphasis on the frost two science elements havenot been altered.
In addition, the different committees withjurisdiction over USGCRP have not been equallyactive in their oversight activities. As a result,certain portions of the program are regularlyreviewed while others are never reviewed.
New approaches to traditional authorizationand appropriation procedures for large intera-gency programs such as the USGCRP need to beconsidered. The current authorization and appro-priation process guarantees that USGCRP will beexamined by Congress only in pieces (38). Anannual, ad hoc appropriation subcommittee mightbe created to specifically address the USGCRPbudget as a whole. This committee should consistof members from appropriation subcommitteeswith jurisdiction over elements of USGCRP (seetable 3-2).
For congressional oversight to be effective ininfluencing USGCRP, a long-term systematicapproach to communication and oversight mustbe developed. Congressional feedback, expecta-tions, and prospective actions must be communi-cated quickly to the program. Oversight should beextended to include regular meetings amongpolicy makers who have jurisdiction over
USGCRP and USGCRP participants; an interdis-ciplinary, multiagency group working withUSGCRP; and outside reviewers. Results fromthese meetings should be freely and widelydisseminated. Oversight hearings should be coor-dinated with all committees who have jurisdictionover USGCRP (see table 3-l).
POLICY OPTIONS: AUGMENTINGTHE FEDERAL RESEARCH EFFORTON GLOBAL CHANGE
To policy makers, climate change does notbecome a problem the moment that the change inthe Earth’s mean average temperature becomesstatistically significant. For them, it becomes aproblem when a community feels the pinch of anunwanted event-drought or flood or decline oftimberland, for example. Knowing how best toameliorate or cope with any costs that climatechange might induce is important to policymakers. Knowing how mitigation efforts to re-duce greenhouse gases will affect our ability toadapt is important. Knowing what information isknowable and unknowable over various timescales is important to policy makers. This kind ofinformation does not automatically emerge froma basic research program. To be useful to thegoverning bodies of the world, the science factsgained by USGCRP must somehow be translatedinto potential costs or benefits incurred by climatechange and must guide strategies to prepare for orreact to change. Currently, there is no formalmechanism in USGCRP for making the linkbetween policy and science.
Given the complicated and long-term nature ofclimate change, the research needed to understandit, and the shorter-term needs of policy makers,a research program for global change shouldideally:
■ identify the key science and policy questionsfor the near term and the long term;
■ orchestrate a research program that involvesthe physical, biological, and social scientists;
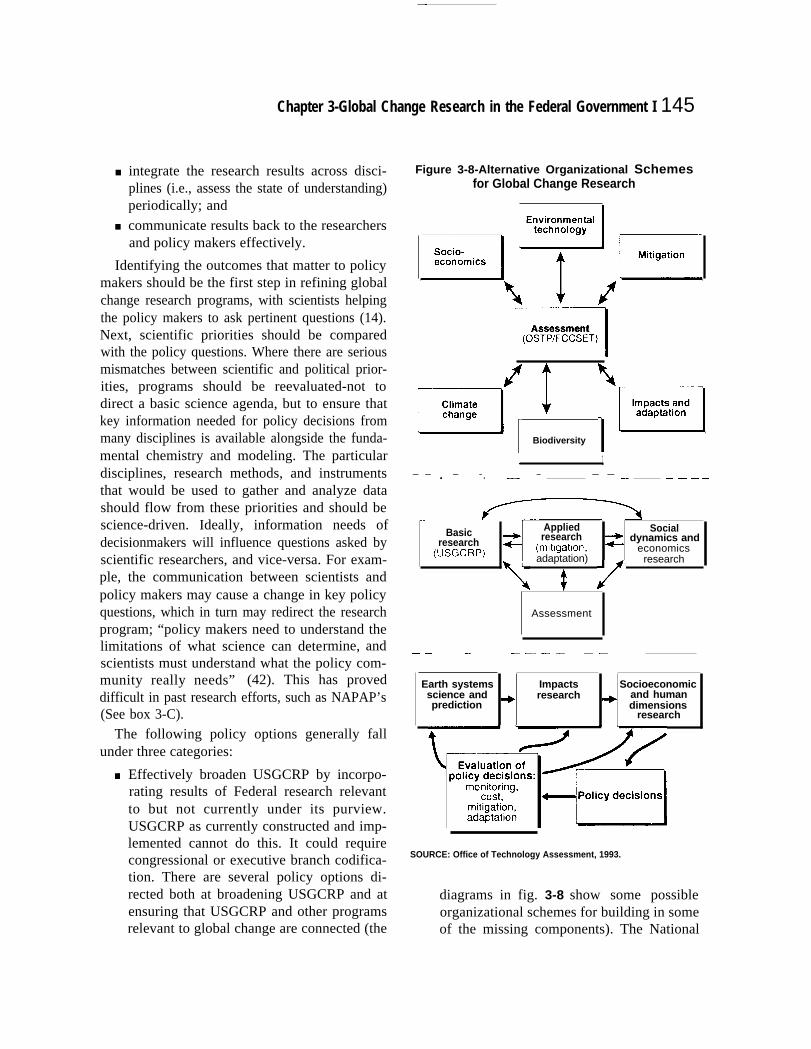
—
Chapter 3-Global Change Research in the Federal Government I 145
■
■
integrate the research results across disci-plines (i.e., assess the state of understanding)periodically; and
communicate results back to the researchersand policy makers effectively.
Identifying the outcomes that matter to policymakers should be the first step in refining globalchange research programs, with scientists helpingthe policy makers to ask pertinent questions (14).Next, scientific priorities should be comparedwith the policy questions. Where there are seriousmismatches between scientific and political prior-ities, programs should be reevaluated-not todirect a basic science agenda, but to ensure thatkey information needed for policy decisions frommany disciplines is available alongside the funda-mental chemistry and modeling. The particulardisciplines, research methods, and instrumentsthat would be used to gather and analyze datashould flow from these priorities and should bescience-driven. Ideally, information needs ofdecisionmakers will influence questions asked byscientific researchers, and vice-versa. For exam-ple, the communication between scientists andpolicy makers may cause a change in key policyquestions, which in turn may redirect the researchprogram; “policy makers need to understand thelimitations of what science can determine, andscientists must understand what the policy com-munity really needs” (42). This has proveddifficult in past research efforts, such as NAPAP’s(See box 3-C).
The following policy options generally fallunder three categories:
9 Effectively broaden USGCRP by incorpo-rating results of Federal research relevantto but not currently under its purview.USGCRP as currently constructed and imp-lemented cannot do this. It could requirecongressional or executive branch codifica-tion. There are several policy options di-rected both at broadening USGCRP and atensuring that USGCRP and other programsrelevant to global change are connected (the
Figure 3-8-Alternative Organizational Schemes—for Global Change Research
=(y/F
nAssessment(OSTP/FCCSET)
pJ-( [ ;F,Biodiversity
1 1— — . — —. —— — — — —— .———
Basic Applied Socialresearch research + dynamics and
(USGCRP) (mltlgatlon, economics
\
adaptation)
/‘
research
Assessment
. — — — —- — — — — —
Earth systems Impacts Socioeconomicscience and + research and humanprediction dimensions
research
~~Fy~<fi
SOURCE: Office of Technology Assessment, 1993.
diagrams in fig. 3-8 show some possibleorganizational schemes for building in someof the missing components). The National
146 I Preparing for an Uncertain Climate--Volume 2
9
9
Research Council has recommended thecreation of a National Environmental Coun-cil in the Executive Office of the President(37), and the National Commission on theEnvironment (NCE) recommended the de-velopment of a National Environmental Strat-egy (34); either or both of these couldcomplement the options described below.Increase funding or redirect funding toareas where research is inadequate. Amodest redirection of 1 to 5 percent ofcurrent funding ($15 to $70 million) couldbegin filling in the large gaps between thecurrent climate change program and a policy-relevant global change program (15, 50).Because the bulk of this OTA report focuseson natural-resource-based systems and theNation’s potential to adapt to climatechange, we discuss coordinating existingecosystem research and initiating new effortsthat are critical to planning for and/or manag-ing natural resources under climate change.However, building strong socioeconomiccomponents of USGCRP is equally import-ant.Make the program more relevant to policymaking by incorporating an assessmentfunction. Assessment and regular reevalua-tion of USGCRP could be instrumental inidentifying the current information base onclimate change, gaps in knowledge, andshort- and long-term policy questions.
I Effectively Broaden USGCRPAs currently structured, USGCRP is a collec-
tion of programs from several agencies with nocentral management. Although research shouldremain decentralized, coordination should becentralized and top-down. The Subcommittee onGlobal Change Research under the Committee onEarth and Environmental Sciences is currentlyresponsible for coordinating activities under theFederal Coordinating Council for Science, Engi-neering, and Technology. FCCSET acts largely as
a fulcrum for coordination, but agency participa-tion in FCCSET projects is voluntary, andFCCSET has no authority over how participatingagencies spend their funds. A previous OTAreport (48) looked broadly at the health of U.S.research and development and concluded:
In the Executive Branch, Congress should insist,at a minimum, on iterative planning that resultsin: a) making tradeoffs among research goals; andb) applying (after scientific merit and programrelevance) other criteria to research decisionmak-ing that reflects plarnning for the future. . . OSTP[Office of Science and Technology Policy] couldinitiate broader priority-setting.
Option 3-1: Amend the Science Policy Act of1976 (PL. 94-282), which established the Officeof Science and Technology Policy and the Fed-eral Coordinating Council on Science, Engineer-ing, and Technology, to strengthen the ability ofthese offices to coordinate science and ecosystemmanagement across agencies. OSTP was estab-lished to “define coherent approaches for apply-ing science and technology to critical and emerg-ing national and international problems and forpromoting coordination of the scientific andtechnological responsibilities and programs ofthe Federal departments and agencies in theresolution of such problems, ’ and FCCSET wasestablished to “provide more effective planningand administration of Federal scientific, engi-neering, and technological programs” (P.L. 94-282). These offices have the authority to developand implement coherent, Government-wide sci-ence policy and have been the mechanism forcoordinating several multiagency programs. How-ever, OSTP has not always been an active orinfluential player in the executive branch, andFCCSET lacks the authority to set priorities,direct policy, and fully participate in the budgetprocess (2, 21). The directions for environmentalresearch must be set—and responsibilities amongvarious Federal agencies must be coordinated-atthe executive level because environmental re-search is of the highest national importance.
—
Chapter 3-Global Change Research in the Federal Government I 147
About 20 Federal agencies have major responsi-bilities related to the environment. In all instances(except for EPA), concern for the environment isnot the primary role of the agency conducting theenvironmental research (37). For example, DOEsupports much environmental research, but thedepartment’s primary responsibility is energy,not the environment.
OSTP could be given budgetary authority,perhaps in conjunction with the Office of Man-agement and Budget, to guide agency programsthat contribute to science and technology. Thiscould mean reinstating “fencing,” or requiringagencies to commit funds to USGCRP projects(see footnote 12). These funds could not then beredirected to meet OMB targets for other areaswithin each agency.
A further step would be to create a NationalScience and Technology Council to replaceFCCSET as proposed by Vice President Gore inhis National Performance Review (21). Underthis plan, agencies would clear their budgets withthe science council as well as with OMB.
Option 3-2: Establish a committee withinFCCSET to standardize the criteria for classify-ing focused and contribut ing research toUSGCRP and to classify all government researchaccordingly. Much research that could qualify as‘‘contributing’ to USGCRP may be ongoingunder another title (such as ‘‘EnvironmentalBiology;’ see option 3-6 below). Likewise, more“focused work” might occur in the agencies ifthe USGCRP scope is broadened. A defined set ofcriteria for classifying research would be of greatvalue in identifying Federal research that is trulypertinent to the global change problem and inidentifying critical gaps in research.
Option 3-3: Reassess program priorities. Re-assess the order of priority given to the sevenscience elements. Although the current structureis producing good science, research results willn o t b e s u f f i c i e n t t o p r o v i d e t h e i n f o r m a t i o n
n e c e s s a r y t o a n s w e r p o l i c y q u e s t i o n s c o n c e r n i n g
t h e i m p a c t s o f c l i m a t e c h a n g e o n t h e N a t i o n ’ s
r e s o u r c e s . T o a n s w e r t h e s e q u e s t i o n s , m o r e e m -
phasis needs to be directed toward the scienceelements that address the ecological, socio eco-nomic, adaptation, mitigation, and human aspectsof global change. Some of this can be done easilywithin the current construct of USGCRP; somemay require additional programs outside theUSGCRP research structure.
Option 3-4: Make research on the humandimensions of global change a primary element ofthe program. A human-dimensions program wouldlook at the interface between human actions andthe natural environment. Humans alter the envi-ronment through population growth, economicgrowth, technological change, political and eco-nomic institutions, and attitudes and beliefs.Human response to a changing environment willdepend on individual perceptions, markets, so-ciocultural systems, organized responses at asubnational level, national policies, internationalcooperation, and global social change (35). Theseelements of a human-environment interface willdirectly influence adaptation responses to climatechange.
Option 3-5: Create an adaptation and mitiga-tion research program (ARP) either withinUSGCRP or separate but parallel to it. This
program should either have the authority toinfluence project selection throughout USGCRPor feed into a formal assessment process thatinfluences program direction. Congress mustdecide whether an ARP should function as aprogram separate from, but parallel, to USGCRPor whether ARP should operate within USGCRP.If ARP is created as a separate program, it shouldhave formal ties to USGCRP. If USGCRP sub-sumes adaptation, the USGCRP mission wouldhave to change to make adaptation equal inimportance to the other three activity streams.
The mission of such a program must explicitlystate its management and policy orientation.ARP’s mission might be:
. . . to pursue research that will support public and
private decisionmaking on issues related to global
change if climate change occurs. At a minimum,
148 I Preparing for an Uncertain Climate--Volume 2
research will include studies of the public andprivate management of natural and managedsystems and of how to develop strategies to adaptto the effects of climate change. Annually, theprogram will assess the state-of-the-science, de-velop Government policy and management op-tions for responding to the potential for globalchange (including programs that supply informa-tion to private decisionmakers), and incorporatethese findings into new research directions. Theassessment, policy options, and new directionsfor research will be reported to Congress in anannual report presented along with the President’sBudget Request,
The program must include a formal mechanismfor bridging the gap between science and policy;specifically, integrated assessments need to be atthe center of any ARP structure. Congress shouldconsider mandating this in any enabling legisla-tion in order to ensure that assessments are giventop priority.
Congress should consider several “rules ofthumb” in structuring the program:
w
■
■
Management agencies should act as the leadagencies.
Goals for research must have problem-oriented task descriptions and milestonesthat are specific and easily measurable.
Congress should consider retaining the “powerof advice and consent in the appointmentsof the director and assistant directors of theprogram.
Other mechanisms for ensuring policy relevancecould include requiring the program to makeperiodic reports to Congress, and giving Congressoversight and investigation authority.
If Congress chose to augment USGCRP, itmust recognize that the program has little abilityat present to target its programs to help public andprivate decisionmaking. Given the structure ofUSGCRP, management- and policy-relevant re-search would be hard to initiate because theprocess of setting priorities in USGCRP isdominated by key agency personnel in conjunc-tion with members of the national and interna-tional scientific
1 IncorporateResearch andInto USGCRP
community.
More EcosystemNatural Resource Planning
Although an estimated $900 to $943 million isspent on what can be considered research inenvironmental life sciences (22) or environmentalbiology, 26 there is currently very little ecologicalresearch directed specifically at protecting naturalareas under climate change and helping landmanagers modify management strategies to re-spond to climate change.27 Of the $943 millionthat FCCSET estimates is spent on environmentalbiology, only 11 percent was also reported asUSGCRP program money.
28 A former working
group under FCCSET found that in 1992, only$8 million was spent on research focused onadaptation. 29 This number represents less than0.8 percent of the USGCRP budget and less than0.9 percent of the amount spent on environmentalbiology research. A review of ecological experi-ments from 1980 to 1987 found that 50 percent ofall studies were done on very small scales--onplots less than 3 feet in diameter; only 7 percentlasted longer than 5 years. Large-scale andlong-term experiments are essential to respond to
26 J, GOSZ, fi~tive s~re~, subcommittee on Environmental Biology, Committee on Life sciences and Hed.h+ Feda COOrk@!
Council for Science, Engineering, and ‘llxhnology, personal communication, Sept. 14, 1993.27 ~csET d~fines ~nviromtlfa~ b~~~~gy w ~1 WM of biology d- titi tie smdy of organisms and their in@~tions ~th their biotic
and abiotic environment (J. GOSL personal communication, Sept. 14, 1993). Grarnp et. al. (22) defiie environmental life sciences as processesand interactions of living resources such as environmental biology, including ecology, forestry, biology, and marine biology.
28 GOSZ, op. cit., footnote M.
29 The wo~ @oup on M@;abon and ~p~tion Strategies (disbanded in 1992) of the Committee on Ikuth ~d fivh~entd ScieQcC3
of FCCSET identifkd Federal research that focuses on or contributes to adaptation to global change (6).
Chapter 3--Global Change Research in the Federal Government I 149
the challenges of global research (37). Yet,research on large-scale ecosystem management,structure, and function is necessary to protectnatural areas in the future, and it is not clear thatit is occurring under the auspices of ‘ ● environ-mental biology’ or USGCRP.
USGCRP as currently designed will not pro-vide either the practical technologies that mightallow us to be more prepared for climate changeor the ecological information that would behelpful in providing policy guidance and adapta-tion options for natural systems.
Option 3-6: Conduct a review of ecologicalresearch within USGCRP and across Federalagencies, evaluate how much long-term ecosystem-level research relevant to climate change, bio-diversity, and other long-term problems is underway; and identify important gaps in ecologicalresearch. A review of all research on ‘‘naturalresources’ has not yet been conducted across t heFederal agencies. Existing analyses suggest agreat deal of money is spent on research relevantto the environment, but how much is useful tounderstanding long-term ecological problems (suchas biodiversity and climate change) is not known.There is currently no mechanism for consolidat-ing results from disparate research efforts into‘‘general patterns and principles that advance thescience and are useful. for environmental deci-sionmaking. Without such synthesis studies, itwill be impossible for ecology to become thepredictive science required by current and futureenvironmental problems’ (32).
In volume 2, chapter 5, of this report, wehighlight key gaps in our understanding ofecosystems, such as: past climate changes andcorresponding species responses, restoration andtranslocation ecology, the effectiveness of corri-dors and buffer zones, the development of eco-logical models, and the effect of elevated CO2 onassemblages of plants and animals.
Basic research in these areas is needed now todetermine how species might respond to climatechange and how best to provide for their protec-tion in the future. Agencies could attempt to
redirect existing funds within USGCRP or pro-cure new funds for addressing these basic eco-logical research needs under the Ecological Sys-tems and Dynamics research area. Alternatively,NSF, whose mission is to support basic scientificresearch, could take the lead in supporting theseresearch areas outside the auspices of USGCRP.The new National Biological Survey (see ch. 1and vol. 2, ch. 5) could also be an appropriatevehicle to use in addressing some of the researchthat directly relates to land-management issues.
An effort to characterize and synthesize ongo-ing research could help bridge the gap betweenbasic research and natural resource planning.Such a review could be conducted by OSTP,NAS, or an independent commission.
Option 3-7: Make research on monitoring andmanaging natural resources a key component ofa broadened global change research program.One of the most prudent approaches to naturalarea conservation under climate change is morecoordinated management on the ecosystem orregional scale. This approach would also helpaddress threats to biodiversity and maximizepossibilities for species survival under climatechange. The land-management agencies shouldreceive increased funding--or existing fundsshould be redirected-for research that woulddirectly address concerns of managing naturalresources under climate change. In particular, asthe National Research Council recommends (37),“environmental research should advance thesocial goals of protecting the environment forpresent and future generations, restoring dam-aged environments so that they are productiveonce more, and managing our natural, economic,cultural, and human resources in ways thatencourage the sustainable use of the environ-m e n t .
Inventory and monitoring programs are usuallythe last to get funds and the first to be cut in abudget crisis (36, 55); existing institutions arepoorly designed to support and strengthen them(37). Many monitoring programs that have beenestablished in protected natural areas have been
150 I Preparing for an Uncertain Climate--Volume 2
discontinued because of personnel changes, pol-icy alterations, or budget cuts (55).30 Baselineinformation is needed on the status and trends ofvegetation cover, plant distributions, animal dis-tributions, soils, and water resources to detect andmonitor climate-induced changes. All Federalagencies conduct some type of inventory as amatter of policy, but these efforts vary widely incompleteness and quality, are not consistentlyimplemented and funded, and are not coordinatedat the national or even agency level.
A concerted effort to connect, in a timelymanner, the information contained in inventoriesto the resource-management and land-use-planning process is vital. If these connections arenot adequately addressed, the gap between re-search and management could increase, whichwould be detrimental to DOI’s new NationalBiological Survey.
I Incorporate Assessment and OversightOption 3-8: Amend the U.S. Global Change
Research Act of 1990 (P.L. 101-606) to requireperiodic integrated assessment reports to bepresented to Congress and specify key partici-pants in the assessment process. If such aprogram is incorporated into USGCRP, it shouldbe positioned above the agency level. However,because all of the elements necessary for anintegrated assessment are not found in USGCRP,an assessment program would have to incorporateinformation from outside the program and includeresearch that is not formally contained withinUSGCRP but that contributes to it. An assessmentprogram should fund external and internal assess-ment efforts. Because integrated assessments thatuse computer models to knit together all aspectspertinent to global change are not well-developed, they should be used only as a guide tosteer program elements. To ensure policy rele-vance, an assessment program must be given the
authority to influence program priorities andproject selection. Assessment teams must beinterdisciplinary. Documenting the state of scien-tific knowledge is listed as the primary functionof the newly created Assessment Working Group;however, the results of such a survey are highlydependent on the questions being asked-what isregarded as unknown or uncertain depends onwhat one wants to know and the perspective andbackground of the person or team carrying out theassessment (24). To ensure commitment andaccountability to the assessment process, thedirector of an assessment program could beappointed with the advice and consent of Con-gress.
Option 3-9: Create innovative congressionalinvolvement in USGCRP. USGCRP does notfunction as an individual agency, and Congresscannot expect to interact with the program in thesame manner it does with agencies. Congressneeds to create a forum where USGCRP can beaddressed as a whole before being broken downinto individual components that fit neatly intoauthorization and appropriation jurisdictions. Forexample, the Environmental and Energy StudyInstitute could conduct an annual seminar for itscongressional members on the USGCRP budget,or Congress could establish an ad hoc appropria-tion committee consisting of members from eachcommittee and appropriations subcommittee withjurisdiction over USGCRP to consider the pro-gram’s budget as a whole.
Congress should conduct oversight of theprogram as a whole. Because USGCRP is aninteragency program, it cannot be evaluatedeffectively by Congress on an agency-by-agencybasis or through the activities of individualcommittees working independently. Committeeswith jurisdiction over USGCRP should coordi-nate oversight of the program.
-W For e~ple, iII n 1993, tie Bureau of Land Management (BLM) eliminated 6 of its 16 acid rain stations to rekWe about $~,ooo fOrother BLM activities. Several of the six stations had been in operation for 10 years and had bra maintaining data seta to monitor the healthof forests and the effects of acid rain. Continuation of this long-term reeord was lost as a result of these cuts.
Chapter 3-Global Change Research in the Federal Government I 151
CHAPTER 3 REFERENCES
1,
2.
3.
4.
5.
6.
7.
8.
9.
10,
11.
12.
13.
14.
Bernabo, C.J., Science and Policy Associates, Inc., testimony athearings before the House Committee on Science, Space, and-lkchnology, May 19, 1993.Brow G.E. J r . , “Chamnaq Committee on Science, Space, and‘IMmology, U.S. House of Representatives, “Report of theI&k Force on the Health of Research, “Chamnan’s Repo%”Serial L, Committee Pr@ 1992.Carnegie Commission on Science, lkchnology and Govern-ment, Enabling the Future: Liti”ng Science and Technology toSocietal Goals (Washington DC: Carnegie Commission onScience, Technology and Government, September 1992).Carnegie Commission on Science, ‘lkchnology and Govern-ment, Environmental Research and Development: Strengthen-ing the Federal Infrastructure (Washington, DC: CarnegieCommission on Science, lkchnology and Governmen4 Decem-ber 1992).Committee on Earth and Environmental Sciences (CEES),Mitigation and Adaptation Research Strategies Working Group,hL4RS Working Paper I: Description of Proposed Coor&”natedProgram (TVashingtoq DC: CEES, 1991).Committee on Earth and Environmental Sciences (CEES),Mitigation and Adaptation Research Strategies Working Group,Directory of Federal Research Activities Related to Mitigationof or Adaptation to Global Change (WashingtorL DC: CEES,1992).Committee on Earth and Environmental Sciences (CEIX), OurChanging Planet: The FY 1993 U.S. Global Change ResearchProgram (Washington DC: CEES, 1992).Committee on Earth and Environmental Sciences (CEES), OurChanging Planet: The FY 1994 U.S. Global Change ResearchProgram (Washington DC: CEES, 1993).Committee on Ewth Sciences (cES), Our Changing Planet: TheFY J990 Research Plan (Washington DC: CES, July 1989).Committee on Science, Engineering, and Public Policy, Panelon Policy Implications of Greenhouse Warming, NationalAcademy of Sciences, National Academy of Enginm@, andInstitute of Medicine, Policy Implications of GreenhouseWm”ng: Mitigation, A&ptation, and the Science Base (Wash-
@@% DC: National Academy Press, 1992).Corell, RW., Geosciences, National Science Foundation testi-mony at hearings before the House Subcommittee on theEnvironment Committee on Science, Space, and ‘Rchnology,May 5, 1992.CoreL R.W., Committee on Earth md Environmental Sciences,Subcommittee on Global Change Research and Geosciences,National Science FoundatiorL testimony before the HouseSubcommittee on Space, Committee on Science, Space, andTechnology, Mar. 30, 1993.Dowlatabti H., and M.G. Morgaq ‘‘A Model Framework forIntegrated Studies of the Climate Problerq” Energy Policy,March 1993, pp. 209-221,Dowlatabadi, H., and M.G. Morgan, ‘‘Integrated Assessment ofClimate Change,” Science, vol. 259, Mm. 26, 1993, pp. 1813,1932.
15.
16.
17.
18.
19.
20.
21.
22.
23.
24.
25.
26.
27,
28.
Dowlatabadi, H., and M.G. Mor~ Department of Engineeringand Public Policy, Carnegie Mellon University, testimony at
hearings before the House Committee on Science, Space, and‘IkchnOlogy, May 19, 1993.
Earth Observation Satellite Company @OSAT), La&&t Tech-nical Notes, EOSAZ September 1992.Edmonds, J.A., H.M Pitcher, F.N.J. Rosenberg, and TM.L.Wigley, “Design for an Integrated Global EnvironmesmdChange Model,” report prepared for the Electric PowexResearch Institute and the U.S. Department of Energy, July 13,1993 (draft).Federal Geographic Data Committee, Wetlands Subcommittee,Application of Satellite Data for Mapping and Mom”ton-ng
Wetlands, fact-finding draft report, April 1992.Gibbons, J.H., Assistant to the President for Science andlkchnology, memorandum to Frederick M. Berntl@ ActingDirector, National Science FoundatiorL July 8, 1993.Gibbons, J.H., Assistant to the Pnxident for Science and‘Ikchnology, testimony at hearings before the Senate Committeeon Energy and Natuml Resources, Mar. 30, 1993.Gore, A., “From Red Thpe to Results: Creating a Governmentthat Works Better and Costs Less, ” report of the NationalPerformance Review, Sept. 7, 1993.Gramp, K.M, A.H. lkich and S.D. Nelsou Federal Funal”ngfor Environmental R&D: A Special Report, R&D Budget andPolicy project ‘he Amerkn Association for the Advancement
of Science, AAAS publication number 9248S, 1992 (Waahing-tom DC: AAAs).Herrick, C.N., “Science and Climate Policy: A Historykwom” Issues in Science and Technology, vol. 8, No. 2,winter 1991-92, pp. 56-57.Herrick, C.N., and D. Jamiesoq “’IIE Social Construction ofAcid Rain: Some Implications for Science/Policy Assessrnen4°paper to be presented at the 18th annual meeting of the Societyfor the Social Studies of Science, Nov. 19-21, 1993,Interagency Task Force on Acid precipitatio~ Annual Repoti1982 to the President and Congress (Washington DC: NationalAcid Precipitation Assessment pro= 1982).Intergovernmental Panel on Climate Change (IPCC), WorldMeteorological C@anizatioq and United Nations EnvironmentPrograq Climate Change: The IPCC Impacts Assessment,
report prepared for IPCC by Working Group u W. McG.Tkg@ G. Sheldou and D. Griffith (eds.) (CQ AustralixAustralian G’OV ernment publishing Service, 1990),Intergov ernmenta.1 Panel on Climate Change (IPCC), WorldMeteorological organizatio~ and United Nations Environmentpro- Climate Change: The IPCC Response Strategies,report prepared for LPCC by Working Group Ill, 1990.Intergovernmental Panel on Climate Change (WCC), WorldMeteorological Organizatioq and United Nations Environmentpro- Climate Change: The IPCC Scientific Assessment,repofi prepared for WCC by Working Group I, J. Houghtou G.Jenkins, and J. Ephraums (eds.) (Cambridge, England: Cam-bridge University Press, 1990).
152 I Preparing for an Uncertain Climate--Volume 2
29. Intergovernmental Panel on Climate Change, World Meteoro-logical Organizatl“oq and United Nations Environment Pro-
W Climte Change 1992: rhe Supplementary Report to thIPCC Scientific Assessment, report prepared for IPCC byWorking Group ~ J, Houghton, B, Callandex, and S. Wrney(eds.) (Cambridge, England Cambridge University Press,1992).
30. JamiesorL D., “Managing the Future: Public Policy, ScientificUncertainty, and Global Warming, ’ in: Upstream/Downstream: Issues in Environmental Ethics, D. Scherer (cd.)
_elp@ PA: ~ple un~v~sity -s, 1~).31. Lancaster, J., “Global Warming Integrated Assessment and
Interdisciplinary Research’ proceedings of a Batelle workshopon Regional Impacts of Climate Change, Oct. 18-21, 1993,RichlanL WA (RicW, WA: Batelle Pacific NorthwestLaboratory, in press).
32. Lubchenco, J., et al., “The SuWainableBiosphere Initiative: AnEcological Research Agen@ ‘ Ecology, vol. 72, No. 2, 1991,pp. 371-412.
33. Mahlmaq J.D., “Understanding Climate Change,” in: JointClimate Project to Address Decision Makers’ Uncertainties:Report of Findi”ngs (Washington.L DC: Science and PolicyAssociates, Inc., 1992).
34. National Comrnis sion on the I?nvironment, Choosr”ng a Sustain-able Future, report of the National Commission on theEnvironment convened by the World Wildlife Fund (Washing-ton, DC: Island Press).
35. National Research Council, Global Environmental Change:Understanding the Human Dimensions (WashingtorL DC:National Academy Press, 1992).
36. National Research Council, Science and the National Parks(Washington DC: National Academy press, 1992).
37. National Research Cmmc& Research to Protect, Restore, andManage the Environment (Wah@to@ DC: National AcademyPress, 1992).
38. National Research Council, Sca”ence, Technology, and theFederal Government: National Goals for a New Era (Washing-to~ DC: National ACtl(kllly Press, 1993).
39. Oversight Review Board of the National Acid PrecipitationAssessment Program (NAPAF’), The E.xpen”ence and Legacy ofNAP~: Report to the Joint Chaz”rs Council of the InteragencyTak Force on Acid Deposition (WaahingtOU DC: NAPAP,April 19!31).
40. Parsons, T., “UseiMness of Climate Models in DevelopingClimate Treaties,” contractor report prepared for the Of6ce of‘lkchnology Assessmen4 Sept 20, 1993.
41. Roughgardeq J., S.W. Rum@, and P.A. MatsorL “WhatDoesRemote Sensing Do for Ecolo~y?’’Ecoiogy, vol. 726, 1991, pp.1918-22.
42. Rubi.q E.S., L.B. Lave, and M.G. Morgaq “Keeping ClimateResearch Relevant,’ Issues in Science and Technology, vol. 8,No. 2, Winter 1991-1992, W. 47-55.
43. Runnin g, S.W., “EWmating Tkxreatrial Primary Productivityby Combi.ning Remote Sensing and Ecosystem Simulation” irxRemote Sensa”ng of Biosphere Functiona”ng, R.J. Hobbs and H.A.Mooney (eds.) (New YorlG NY: Springer-Vcrlag New YorkInc., 1990), pp. 65-86.
44. Sayn-WittgczWeiq L., “Land Cover Mapping for Mission toPlanet Earth,” IEEE Technology and Socn”ety Magazine, Spring1992, pp. 1622.
45. Science and Policy Associates, Inc., Joint Climate Project toAddress Decision Makers’ Uncertainties: Report of Findings
(w-oq DC: Scics.we and pOtiCy i%WCilltCS, kc., 1992).46. United Nations, United Nations Convention on Climate
Change, Article 2 and Article 4, Sec. 2(b), 1S92.47. U.S. Congress, General Accounting Office (GAO), Acid Rain:
Delays and Management Changes in the Federal ResearchProgram, GAO/RCED-87-89 (Washington DC: GAO, April1987).
48. U.S. Congress, Office of ‘fkchnology Assessment, FederallyFunded Research: Decisions for a Decade, OTA-SET+O(Washingtor4 DC: U.S. Government Printing Office, May1991),
49. U.S. Congress, Offke of lkchnology Assessmen4 The Futureof Remote Sensingfiom Space: Civilian Satellite Systems andApplications, OTA-ISC-558 (Washington DC: Governmentprinting ~lce, July 1993).
50. U.S. Congress, Office of lbchnology Assessment “EOS andUSGCRP: Are We Asking and Answering the Right Ques-tions?” background paper prepared by OTA (in press).
51. U. S. Environmental ProtectionAgency, The PotentialEflects qfGlobal Climate Change on the United States, EPA-23M5-89-050, J. Smith and D. Tirpak (eds.) (Washin@oq DC: U.S.13nvironmrmtal Protection Agency, December 1989).
52. U.S. Environmental protection Agency, Policy Options forStabilizing Global Climate, Report to Congress, EPA 21P-2003.1, D. Lashof and D. TirPak (dS.) (Washh@oq DC: U.S.Environmental Protection Agency, GfIlce of Policy, Planningand Evaluation December 1S90).
53. UstiQ S.L., et al., “Opportunities for Using the EOS ImagingSpectrometers and Synthetic Aperture Radar in EcoIogicidModels,” Ecology, vol. 72, No. 6, 1S91, pp. 1934-45.
54. Wickland, D.E., “Mission to Planet Earth: The EcologicalPerspective,” Ecology, vol. 72, No. 6, 1991, pp. 1923-33.
55. Wright, G.R,, Hiildlife Research and Management in theNational Parkx (Chicago, IL: University of Illinois Press, 1992).
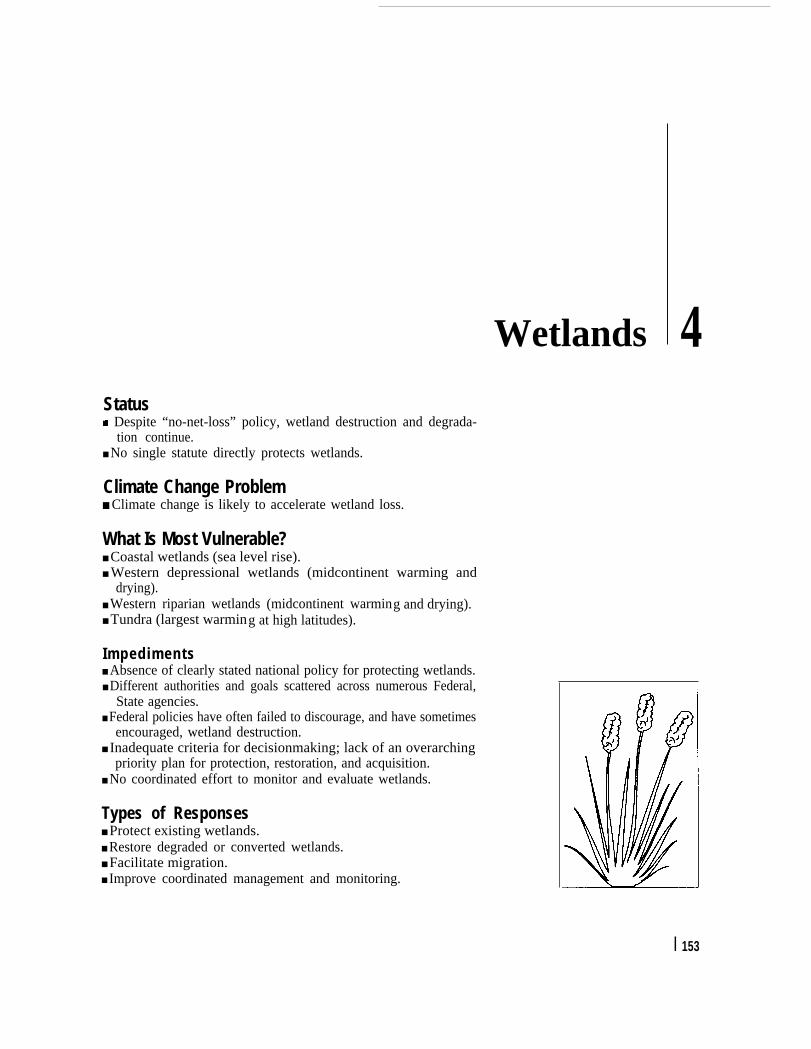
Wetlands 4Statusg Despite “no-net-loss” policy, wetland destruction and degrada-
tion continue.■ No single statute directly protects wetlands.
Climate Change Problem■ Climate change is likely to accelerate wetland loss.
What Is Most Vulnerable?■ Coastal wetlands (sea level rise).■ Western depressional wetlands (midcontinent warming and
drying).■ Western riparian wetlands (midcontinent warming and drying).■ Tundra (largest warming at high latitudes).
Impediments■ Absence of clearly stated national policy for protecting wetlands.■ Different authorities and goals scattered across numerous Federal,
State agencies.■ Federal policies have often failed to discourage, and have sometimes
encouraged, wetland destruction.■ Inadequate criteria for decisionmaking; lack of an overarching
priority plan for protection, restoration, and acquisition.■ No coordinated effort to monitor and evaluate wetlands.
Types of Responses■ Protect existing wetlands.■ Restore degraded or converted wetlands.■ Facilitate migration.■ Improve coordinated management and monitoring.
I 153
154 I Preparing for an Uncertain Climate--Voiume 2
OVERVIEWWetlands are extremely complex and sensitive
ecological systems that cover roughly 5 percent ofthe lower 48 States, but even today, the value ofthese systems is not always understood or appre-ciated.
Concern about steadily increasing losses ofwetlands led the Federal Government to embrace
a policy goal of no net loss of wetlands in 1989.The policy specifies that destruction of wetlandsshould be offset by an equivalent restoration orcreation of wetlands (see box 4-A). Efforts tomove toward that goal have led to major contro-versies over how to define wetlands, the criteriaand procedures necessary for mitigation, and theextent of Government involvement in regulating
Box 4-A–Wetland Mitigation and Restoration: Maintaining Wetland Functions and Values
During the 1950s to1970s,458,000 acres (183,200 hectares) 1 of wetlands were being lost each year, mainlyto agriculture and urban and suburban development. That pace has been slowed to 100,000 to 200,000 acres peryear, primarily due to Iegislative efforts. Wetlands serve many functions that are difficult to quantify in eoonomicterms; they are critical for storm-water retention, water quality control, and provision of wildlife habitat. Developingmethods of restoring lost or degraded wetlands would help to alleviate problems resulting from their destruction,help achieve the Nation’s goal of no net Ioss of wetlands in the short term, and increase the quantity and qualityof wetlands in the long term.
Wetland mitigation is simplyalleviating any or all detrimental effectsthat may arise from harming a wetland.Mitigation includes enhancement, creation, and restoration; it may be done to formally complywith Section 404of the Clean Water Act or for other reasons. Mitigation may involve the in-kind restoration or creation ofwetlands-in another location--or the enhancement of services and functions of the wetland being harmed inplace.Enhancement involves increasing one or more functions or values of an existing wetland (e.g., flood control,water quality improvement, and habitat provision). Creation refers to the complete conversion of an upland areainto a wetland; it is the most difficult of the three and, so far, the least successful.
Wetland restoration involves the reestablishment of aquatic functions and related physical, chemical, and
biological characteristics that were Iost from a wetland. There are basically three categories of restorationtechniques: 1) reestablishing and/or managing wetland hydrology, 2) eliminating or controlling wetlandcontaminants, and 3) reestablishing and/or managing the native plants. Sound plannig, project management andbroad-based scientific knowledge regarding wetland processes are all critical elements in achieving a successfulrestoration. Wetland restoration is not easy because wetlands are complex ecosystems that Involve interactionsbetween a multitude of species, and many of these relationships are not fully understood.
Wetland restoration is also a controversial practice for several reasons. The success of restoration techniquesis not dear, mostly because there has been little investment in monitoring and evaluation (13). In addition, themeasurement of success is elusive and complex. Success varies according to the value and function the projectaims to restore. These functions range from providing wildlife habitat to flood control to water filtration. Determiningsuccess on the basis of these functions requires long-term evaluation as systems evolve and mature; somewetland system will respond more quickly and more positively to restoration than others. There are fewdocumented, definitively successful cases; however, coastal marsh-restoration projects are generally moresuccessful than restoration of inland freshwater marsh systems, mostly because coastal hydrology is betterunderstood and, thus, more easily restored (13). Projects that have occurred outside the regulatory process havebeen more successful.2 Factors such as unclear project goals, lack of monitoring, and an inadequateunderstanding of the wetland ecosystem have contributed to restoration failures,
1To convert acres to hectares, multiply by 0.405.2 K.L. Erwin, Consulting Ecologist, Inc., personal communication, July 1993.
Chapter 4–Wetlands 155
Several Federal agencies are attempting to incorporate wetland-mitigation activities into their land-management plans. For the most part, these aim to retard wetland loss while doing little in the way of actualrestoration (7). These efforts are heralded by the Army Corps of Engineers (the Corps), the EnvironmentalProtection Agency (EPA), the Fish and Wildlife Service (FWS), and the National Marine Fisheries service (NMFS).The Corps is mainly concerned with replacing or providing substitutes for wetlands that have been reduced orsubject to the adverse effects of water-resource development projects (7). EPA follows the Corps’ criteria forevaluating discharges that have an adverse impact on surface- and groundwater systems, but has yet to issueany specific guidance on mitigation (7). FWS has developed a comprehensive mitigation policy that focuses onhabitat value, and mandates that the degree of mitigation requested correspond to the value and scarcity of thehabitat at risk. More importantly, the policy recommends that altering highly valued wetlands be avoided. NMFShas taken a proactive approach by participating in the early planning stages of wetland-restoration projects. In thisway, the agency can offer guidance on identifying alternatives to wetland destruction, decreasing conflictanticipating problems, and minimizing potentially adverse effects on living marine resources and habitat.
In response to vast wetland losses, a mitigation banking program was developed as a mechanism forcompensating unavoidable habitat losses associated with development activities (e.g., construction of roads andbuildings) and administered primarily under the Clean Water Act (CWA; P.L. 92-500). The program includes theparticipation of agencies, nonprofit organizations, and private entities and involves off-site creation, restoration,and/or enhancement of wetlands. It is carried out by the private sector through the Section 404 permitting processand other similar State and local wetland regulations. The National Environmental Policy Act (NEPA; P.L. 91-1907)and the wetlands Executive Order (1 1990) encourage the exploration of alternatives to actions that would destroywetlands. Mitigation, as an alternative, must address impacts and cannot be used simply to offset the acreage ofwetland losses. Successful mitigation includes “replacing the loss of aquatic resource values by creating,restoring, and enhancing similar functions and values” (33 CFR, App. A, 334, July 1, 1992). This does notnecessarily imply a one-to-one ratio of destroyed to mitigated acreage. Problems with enforcement,implementation, and monitoring of wetland mitigation have raised questions about the success of mitigationprograms.
Restoration goals are bound to vary from region to region. For example, in urban areas, flood control andwater filtering are highly valued functions of wetlands. Restoration of these functions does not require a fullyvegetated wetland that supports fish and wildlife; the most important part of restoring these functions maybe simplyto dear obstacles from the site and plant enough vegetation to anchor the soil. In other sites, including those inareas important for wildlife but where considerable habitat has been destroyed, a more complete restorationproject to rehabilitate a broader range of functions maybe preferred. In some cases, technologies can be usedto establish an artificial wetland for tertiary wastewater treatment. This application requires greater manipulationof the land and the installation of piping systems to regulate flow across the manually planted areas. Artificialwetlands are being successfully used to treat agricultural and urban wastewater in smaller communities acrossthe country. As this technology is expanded, it may be more widely used as a low-cost, low-maintenancealternative to traditional wastewater treatment applications.
Using restoration as a way to offset loss of healthy wetland systems by creating new wetlands in anotherlocation often results in a trade to Iower function and value. In some cases, though, a trade may make good sense.For example, allowing development on a small, isolated wetland in a highly urbanized area in exchange forprotecting a larger tract that is in a migratory bird flyway could be beneficial in the long term. Several suchprojects are under way on the California and Oregon coasts, where migratory waterfowl habitat has been lost atrates that surpass those in the rest of the country.
In the San Francisco Bay area, for example, hundreds of acres of tidal marshland were restored after havingbeen diked off and converted for cattle grazing, mostly during the 1930s. The original salt marsh was dominated
(Continued on next page)
156 Preparing for an Uncertain CIimate--Volume 2
Box 4-A-Wetland Restoration and Mitigation:Maintaining Wetland Functions and Values--(Continued)
by pickerel weed, which moved into "seasonal wetlands” toward upland areas, which are inundated byprecipitation during the fall and winter months but dry out in the spring and summer. The restoration was a jointproject between a private entity and the State.The private group was interested in developing the upland areasand, in exchange, created a restoration design that aimed to reestablish the original water-flow patterns in thedegraded marsh, which allow vegetation to prosper; the design assumed that vegetation would colonizethe area gradually, so an extensive planting program would not be needed. Sand and silt were excavated to createbasins within the marsh, surrounded by a shelf that would support vegetation, and the dike was breached, allowingthe bay waters to flow inland and reclaim the dormant marshland. Natural sedimentation processes could thenoccur, helping to resters the proper substrate conditions that would eventually support new tidal-marsh vegetation.The restoration is continuing naturally and, with monitoring, the wetland will probablybefunctional in a few years.In other cases, plants might have to be manually reestablished, and in inland or riparian-wetland situations,restoring the hydrology would be much more difficult. In all cases, however, it is important to perform a completeenvironmental assessment of the site before any fieldwork begins.
Wetlands are extremely complex systems that include a multitude of species of microbes, plants, birds, andother wildlife. Their interactions are highly developed; it has taken hundreds or thousands of years for thesesystems to achieve their level of ecological and functional diversity. Restoring destroyed wetlands or improvingdamaged ones requires not only a clear understanding of this dynamic and complex ecosystem, but also awell-ordered plan that attempts to account for difficulties that may arise during the restoration. A comprehensivemonitoring program is necessary to track the restoration of a wetland’s functions. Additional research is neededto improve restoration technology to help prevent the continued loss of the Nation’s wetlands and to begin to regainsome of what has already been lost.
SOURCES: K.L. Erwin, An Evaluation of Wetland Mitigation in the South Florida Water Management District (1990), Volume 1, reportprepared for the South FloridaWater Management District, July 1991; K.L. Erwin, Consulting Ecologist, Inc., personal communication,July1993,Interagancy Committee on Wetlands Restoration and Creation, A National Program for Wetlands Restoration and Creation, reportto the Policy Coordinating Group Interagency Task Force on Wetlands, August 1992;J.AKusler and M.E. Kentula, Wetland Creation andRestoration: The Status of the Science (Washington, DC: Island Press, 1990); L. Roberts, “Wetland Trading is a Loser's Game, SayEcologists," Science, vol. 260, June 25, 1993, pp. 1890-92; D. Salveson, Wetlands:(Washington, DC: The Urban Land Institute, 1990).
Mitigating and Regulating Development Impacts
the use of private land where most wetlands exist(see box 4-B). As the debate continues on how toachieve the no-net-loss goal, the possibility ofclimate change, which may make halting the lossof wetlands even more difficult, looms on thehorizon.
Four types of wetlands appear to be particularlyvulnerable to climate change: coastal wetlands,depressional wetlands in arid or semiarid regions,riparian wetlands in the arid West and Southwest,and tundra wetlands. Coastal wetlands may bedrowned by rising sea or altered by changingsalinity. Arise of about 1.5 feet (about 0.5 meter)1
could inundate more than 30 percent of coastalwetlands. Depressional wetlands maybe affectedby lowered water levels-the likely result ofhigher temperatures, increased evaporation, anddecreased precipitation in already dry areas. Drierconditions in the West also may threaten riparianwetlands that rely on water from rivers andstreams. Tundra areas may shrink as increasedtemperatures allow the permafrost to thaw anddrain.
Climate change may cause loss of wetlands,even as the need for wetlands becomes greaterunder climate change. For example, healthy
1 To convert feet to meters, multiply by 0.305.
Chapter 4–Wetlands 157
Box 4-B-How Wet Is a Wetland?: The Debate Over Which Wetlands to Regulate
The regulatory system has tied itself into knots attempting to meet the policy goal of "no net Ioss’’ of wetlands.The simple-sounding goal is made complicated by the lack of an accepted definition for "wetland.” Other issueshave also yet to be reconciled, such as: How wet must a wetland be--and how often must it be wet? How canboundaries be drawn around it to distinguish a wetland that is covered by Federal regulatory programs (ajurisdictional wetland)from an adjacent area that is not? TheAdministration’s efforts to clarify these issues set offa firestorm of controversy surrounding not only fundamental issues in wetland science, but also the relationshipsamong science, politics, and policy.
In August 1991, a new policy program to meet the no-net-loss goal was announced. As part of that programthe Environmental Protection Agency (EPA), the Army Corps of Engineers (the Corps), the Soil ConservationService (SCS), and the Fish and Midlife Service (FWS) published in the Federal Register proposed newdelineation manual, which was to be used for decisions about wetlands across all agencies. The manual statedthat to be considered a wetland, an area must be flooded for 15 consecutive days, or saturated to the surfacefor21 consecutive days, sometime during the growing season. This definition would exclude from regulation wetlandsthat are only sporadically inundated (e.g., in floodplains and prairie areas) and that may be dry for the greater partof the year. The manual imposed a high burden of proof, requiring that certain vegetation types, soils, andhydrology (water flow) be documented according to detailed rules of evidence.
The proposed manual set off an immediate uproar. Critics in the scientific and environmental communitiesclaimed that there was no defensible scientific rationale for stating that wetlands must be flooded or saturated forso many days in a row, that the proposal would exclude up to half of the areas now regulated as wetlands, andthat the manual--which was supposed to streamline the regulatory process--was actually more difficult,time-consuming, and expensive to use than the manual then in use. Supporters of the proposal, including farmers’and developers’ organizations, favored the exclusion of “drier” wetlands, contending that the wetter ones weremore important to protect. They argued that existing regulations were inconsistent, placed too great a burden onprivate landowners, and interfered in property rights, producing numerous horror stories of permits gone awryandcausing untoward delays. By January 1992, EPA received more than 60,000 comments on the proposed manual.To date, no further revisions have been issued. in the interim, Congress requested a National Academy ofSciences study of wetlands delineation, and the agencies have fallen back on one or another version of manualsused in the past to determine what a wetland is.
Although particularly heated in 1991 and 1992, the debate over what to regulate and how to recognize it datesback to 1972, when the Clean Water Act (P.L. 92-500) was passed. The act promoted protection of the Nation’swater quality and established a permit program to regulate the dredging and filling of U.S. waters. The permitprocess was to be overseen by the Corps in its capacity for managing navigable waters. Four other Federalagencies-EPA, FWS, the National Marine Fisheries Service (NMFS), and SCS--alongwith State agencies werealso allowed to review and comment on permit applications, but of the four, only EPA could veto a permit. Whenthe Corps published regulations to implement the act it interpreted the mandate narrowly as including onlytraditionally navigable waters. Environmental groups sued, and a court order forced the Corps to issue newregulations in 1977 that covered a broad range of headwaters and wetlands. After considering 22 differentdefinitions of wetlands, the Corps settled on the definition, also adopted by EPA, that is still used today in itsregulatory decisions: “areas that are inundated or saturated by surface or ground water at a frequency and durationsufficient to support, and that under normal circumstances do support, a prevalence of vegetation adapted for lifein saturated conditions” (33 CFR328.6(6), 1991). Somewhat different definitions are used by other-s, suchas FWS or the U.S. Department of Agriculture (USDA), whose purview includes wetlands.
Broad application of the CWA sometimes resulted in actions that private landowners protested were unfairtakings of their property (see vol. 1, ch. 4). Each agency issued its own set of field guidelines on how to determine
(Continued on next page)
158 I Preparing for an Uncertain Climate--Volume 2
Box 4-B-How Wet Isa Wetland?:The Debate Over Which Wetlands to Regulate--(Continued)
what constitutes a jurisdictional wetland. Regulation varied considerablyfrom one jurisdiction to the next becauseseparate regional offices of the decentralized Corps of Engineers interpreted or applied regulations differently, andsome States were more active in overseeing wetland programs than others. Furthermore, changes by the Reaganadministration intended to curtail the regulatory program by revising the Corps’ procedures were opposed by manyIn EPA and FWS, leading to numerous conflicts over policy. By 1987, these differences made dear the need fora more coordinated national policy. Former EPA Administrator Lee Thomas requested that The ConservationFoundation, a private environmental organization, convene the Wetlands Forum in 1987 to try to resolve someof these issues. In 1983, this forum offered the idea for an interim goal of “no net loss” of wetlands with a long-term goal of a net gain in the quality and quantity of the Nation’s wetlands.
A year later, the agencies were spurred to joint action. The Corps and EPA signed a memorandum ofagreement detailing how they would meet the no-net-loss policy goal and encouraging more rigorousimplementation of the Section 404 permit program. in addition, the Corps, EPA, FWS, and SCS adopted anlnteragency delineation manual to be used by the four agencies in making regulatory andprogram decisions (33).The manual was developed by a panel of wetland scientists and set mandatory technical criteria and suggestedfield indicators. Although the interagency manual changed little in the Section 404 policy, it did result in a morecoordinated and uniform application of the 404 program nationwide. Because it was not an official policy document,the manual was adopted without public notification and comment, which rankled those regulated.Th ey complainedthat the manual was too technical and difficult for people who had to delineate wetlands-in some jurisdictions,the landowners themselves. The groundswell of dissatisfaction was effectively consolidated by a series of publichearings convened across the country by the President’s Council on Competitiveness. Protests gradually grewmore vocal and more organized, and eventually led to the Administration decision to issue the revised manual thatbecame the center of so much controversy in 1991.
Although the 1989 manual was accused by some of being too technical, it had at least won the support ofthe scientific community. The 1991 revision did not enjoysuch scientific support. During the revision, the chief ERAscientist onthe panel resigned, protesting that modifications demanded by the White House and some membersof Congress were politically motivated rather than scientifically sound. Federal agencies such as the Office ofManagement and Budget and the Council on Competitiveness assumed major rolesinthe revision, further fuelingsuspicions by scientists and environmentalists and leading to a huge number of comments protesting the revisedmanual.
The regulatory question, “How wet is a wetland?” has still not been resolved. A revised manual is unlikelyto be issued soon. In the meantime, EPA and the Corps have reverted to using the Corps’ 1987 guidelines. Theoutcry over the manual has encouraged many States to become more active in their oversightof the Section 404program, and some are preparing to assume primary responsibility for implementing the Federal programs, asmany have done for air-pollution-control regulations. But whatever the resolution on the regulatory side, the debatehas demonstrated the difficulty of reaching consensus on natural resource protection. The boundaries of a wetlandwill appear to be boated indifferent places depending on when in the moisture cycle it is examined: a wetlandmay not always be wet. Moreover, protecting only the obviously wet areas may fail to protect the ecosystem asa whole (2). Protection based on larger areas---watersheds or ecoregions bounded by their topography,hydrological systems, and biological characteristics---will be more Iikely to maintain the function of wetlands andother important ecosystems.
SOURCES: J.A. Kusler, “Wetlands Delineation: An Issue of Sciences or Politics’?’ Environment vol. 34, March 1992, pp. 7-11, 29-37; J,Alper, “War Over the Wetlands: Ecologists v. the White House,"Science, vol. 257, August 1992, pp. 1043-44; J.P. Cohn, ‘How Wet Musta Wetland Be?” Government Executive, vol. 24, March 1992, pp. 20-25; C. Copeland, Federal Wetlands Manual Revisions:SummaryofInteragency Team Reports (Washington, DC: Congressional Research Service, Library of Congress, Feb. 25, 1992); U.S. EnvironmentalProtection Agency, Office of Wetlands, Oceans, and Watersheds, “Proposed Revision to the FederaI Manual for Delineating Wetlands,"Federal Register, vol. 56, Aug. 14,1991, pp. 404446-80.
. . .
Chapter 4–Wetlands I 159
wetlands can help control coastal erosion andflooding that may result from accelerated sealevel rise (see vol. 1, ch. 4). Wetlands will helpabsorb and slow water runoff in urban areas thatmay result from more frequent and intensestorms. In areas that become drier, concentrationsof pollutants may be higher in runoff and surfacewater (see vol. 1, ch. 5). Wetlands will help falterout these pollutants and improve water quality.They may also become even more important ashabitats for fish, waterfowl, invertebrates, andother wildlife under various warming scenarios.
Wetlands are not protected by any singleFederal law or regulation, but by an amalgam ofprograms at all levels of government, many ofwhich might be called on to cope with the impactsof climate change on wetlands. Federal programsover the past 50 years have focused on protectingexisting wetlands through acquisition and, start-ing two decades ago, regulation. More recently, asthe loss of wetlands has continued, interest hasalso turned toward restoring degraded anddrained wetlands and creating new ones.
Section 404 of the Clean Water Act (CWA;P.L. 92-500) has played a limited but contentiousrole in the protection of wetlands. As one part ofthe broad CWA program to maintain the chemi-cal, physical, and biological integrity of theNation’s waters, Section 404 regulates the dis-charge of dredged or fill material into waters ofthe United States, including wetlands. However,Section 404 effectively covers activities responsi-ble for just one-fifth of the area of wetlands thatdisappears each year (112). Attempts to tightendirect Federal regulation of other wetlands havebeen constrained by the perception that strongrestrictions on privately owned wetlands could,under appropriate circumstances, constitute ataking, which requires compensation (see vol. 1,ch. 5). With nearly three-quarters of all remainingwetlands in private hands, an appropriate structuri-ng of Federal incentives for activities on privatelands is an essential complement to existingstrategies for regulating wetlands (25). Incentiveprograms include direct payments, removal of
various Federal subsidies, and tradable rightsprovisions such as mitigation banking (discussedbelow).
State and local regulations, including zoningand land-use controls, and efforts by privateconservation organizations are essential to anoverall strategy for protecting wetlands, both nowand as the climate changes. However, becausethis report focuses on Federal programs, discus-sion of State and local activities is limited toconsidering how Federal programs might encour-age or coordinate-or at least refrain from hinder-ing-efforts at other levels.
A program designed to protect and regulatewetlands on almost any scale will be mosteffective if it incorporates an integrated approachto evaluating and managing wetlands within thecontext of the watersheds and hydrological sys-tems in which they are located. Decisions on howto balance loss of wetlands against the need fordevelopment and other activities can best be madewhen decisionmakers have a clear understandingof the particular functions and values of a wetlandwithin a given watershed-whether for wildlifehabitat, flood control, water quality, or recreation,for example-and of how important that site iscompared with other natural areas in the samevicinity that offer similar or complementaryfunctions and values. An integrated approach toprotecting wetlands will likely become even moreimportant under a changing climate because thevalue of functions such as flood control andmaintenance of water quality may increase inmany areas due to changes in storms and hydro-logical regimes (see also vol. 1, chs. 4 and 5).
Whether wetlands change, migrate, or declinein response to climate change will depend largelyon how humans decide to protect and restorewetlands now and in the future. Because loss ofwetlands has already been extensive and degrada-tion continues, many coastal wetlands and someinland wetlands are unlikely to be able to adapt toclimate change--and a net loss of U.S. wetlandswill occur. The existing Clean Water Act seeks torestore and maintain the physical, chemical, and
160 Preparing for an Uncertain Climate---Volume 2
biological integrity of the Nation’s waters. Toachieve the act’s goals, existing wetlands shouldbe protected from destruction or degradation tothe maximum extent practicable; formerly de-stroyed or degraded wetlands could be restored aspart of watershed-based plans. Current and futureprotection policies must be tailored to anticipatethe effects of climate change and to maximize theadaptability of the wetland systems that existnow.
This chapter summarizes the current locationand status of wetlands in the United States,outlines the fictions and products they provide,and describes the legislative framework underwhich they are regulated and managed. The waysin which wetlands might be affected by climatechange and whether they will be able to adapt toit are also addressed. Finally, the chapter suggests
various policy responses that could help maintaina full range of functioning wetlands.
U.S. WETLANDS TODAY
■ What Are Wetlands?Wetlands are dynamic systems, characterized
as much by constant processes of change as byany truly constant features (see box 4-C). Wet-lands are often difficult to recognize or defineprecisely because the boundary between wet anddry in the continuum from open water and landsthat are always wet (aquatic ecosystems) toupland areas (terrestrial ecosystems) that areoften dry is rarely discrete. In general, however,most scientists agree that wetlands can be definedby the composition of the vegetation, the soilcharacteristics, and the presence of water at or
Box 4-C-Wetland Types and Distribution
Wetlands are usually categorized according to their characteristic vegetation, their location(coastal or inland),and the salinity of the water they contain (ranging from fresh to brackish to salt water). Ecologists have developeda comprehensive technical classification of U.S. wetlands (22); these areas are described in the broadestcategories in general vernacular terms below.
Coastal salt marshes grow along relatively calm, low-lying coasts of the Gulf of Mexico, the Atlantic, and soresparts of the Pacific (with the greatest expanses occurring on coasts in the Southeast), and are alternately inundatedand drained by the rise and fall of the tides. The relatively small number of plant species that can tolerate theextremes in temperature and the continuous changes in water level and salinity consist primarily of Spartinagrasses.
Mangrove swamps along the Atlantic and Gulf coasts in Florida (southwestern Florida harbors the largestexpanses) and in a few patches in Louisiana and Texas contain any of several species of salt-tolerant trees andtake the place of salt marshes in areas that are mostly free from frost
Tidal freshwater marshes occur in the upper reaches of tidal zones in estuaries along the Atlantic, Gulf, andPacific coasts, but are most common in the mid-Atlantic region, Texas, and Florida Vegetation includes bothgrasses and broadleaf species and maybe extremely diverse and productive in the upper reaches of the marsh.
Freshwater nontidal wetlands comprise 95 percent of the Nation’s vegetated wetlands. They may occur atany latitude but are not common at very high altitudes. Water depths of these wetlands usually range from 6 inchesto 3 feet (from 0.15 to 0.90 meters)1 and vegetation is generally characterized by soft-stemmed plants, grasses,sedges, and rushes. These include common plants such as waterlilies, cattails, reeds, arrowheads, and pickerelweed. Most of these wetlands serve vital storm-water and water-quality-control functions.
Inland depressional marshes may be either freshwater or saline. The freshwater marshes are most commonlyfound in depressions in the Great Plains States (prairie potholes), in Florida, and in California (vernal pools) and
1 To convert inches to meters, multiply by 0.025; to convert feet to meters, multiply by 0.305.
Chapter 4–Wetlands 161
have water depths ranging from several inches to 3 feet. Vegetation consists of soft-stemmed plants--grasses,sedges, and rushes, such as waterlilies, cattails, reeds, and wildrice-that emerge above the water surface. Thesaline marshes occur primarily along shallow lake basins and other depressions in the arid western United States,and include playas and rain-basin wetlands. These marshes are generally saturated with water and maybe 2 or3 feet deep during the growing season. Plant life includes hard-stemmed or alkali bulrushes, widgeon grass, andsago. Many of these wetlands are semipermanent or seasonal, and some are found only occasionaIIyduring wet years.
Peatlands, including bogs and fens, are found throughout the Upper Midwest and in the Northeast, as wellas in North Carolina and Honda, in shallow lake basins and flat uplands and along slow-moving streams. The soil,which is often composed of peat and maybe covered by moss, is generally saturated with water and may supportboth woody and herbaceous plants. Typical vegetation in northern bogs includes cranberries, leather-leaf,Labrador tea, and cotton grass, whereas southeastern bogs (known as pocosins) harbor pitcher plants, pond pine,Cyrilla, Persea, Gordonia, sweet bay, and Virginia chain fern. Bogs are typically valued for their production ofrenewable resources such as blueberries and cranberries, and can also be used as a source of peat andsphagnum moss for use in agriculture and horticulture. In some areas, the water-purifying properties of bogs arealso important. Bogs are home to various insectivorous plants, which are valued for their scientific interest and asexotic house plants. Several varieties of these plants, including hooded and golden pitcher plants, are threatenedor endangered species.
Tundra is a wet grassland found in cold climates, either at high altitudes on mountains (alpine tundra) or atnorthern latitudes (arctic tundra). Up to 25 percent of the State of Alaska is covered by arctic tundra and alpinetundra cart be found in the Rocky Mountains in the West and in the White Mountains in New England. Tundragenerally has a deep Iayer of water-saturated soil that is permanently frozen (pemafrost), covered by a thick, oftenwater-saturated mat of living and decaying vegetation including lichens, sphagnum mosses, grasses, sedges, anddwarf woody plants.
Shrub swamps are found along slow-moving streams and floodplains throughout the Southeast and UpperMidwest. The soil, which is often saturated during the growing season and may flood up to 6 inches deep, supportsvegetation such as alder, willows, and dogwood.
Wooded swamps may be found alongside sluggish streams, in floodplains or shallow lake basins, and onflat uplands in the Southeast and Upper Midwest. The Soil is generally water-saturated during most of the growingseason, and may be covered by up to 2 feet of water during periods of heavy rain or flooding. Typical northernvegetation includes tree species such as tamarack, white cedar, balsam, red maple, and black ash, oftenaccompanied by a thick covering of moss, whereas further to the west, willows, red alder, and western hemlockare more common. In the South, vegetation may feature water and overcup oak, tupelo gum, swamp black gum,and cypress.
Bottomlands and other riparian habitats are found in low-lying floodplain areas adjacent to rivers throughoutthe eastern and southern United States as well as the arid West. These areas are not always recognized aswetlands because they are not necessarily water-saturated throughout the full growing season and they may onlyhave standing water after an occasional flood. In the South, the lowest areas are characterized by hardwood treessuch as bald cypress, tupelo gum, and water elm Higher areas that are less-frequently flooded support red maple,sweet gum, and various types of oak. The most infrequently flooded sites contain shagbark hickory, swampchestnut oak, and post oak. In the West, riparian habitats are widely scattered along the permanent and intermittentrivers and streams that course through the arid and semiarid terrain; common trees include willows, alders,cotton woods, salt cedar, and mesquite.SOURCES: R. Brewer, The Science of Ecology(Philadelphia: Saunders College Publishing, 1988); U.S. Department of the Interior (DOI),Fish and Wildlife Service (FWS), An Overview of Major Wetland Functions and Values, FWS/OBS-84/18 , contractor paper prepared by J.H.Sather and R.D. Smith (Washington, DC: U.S. DOI, FWS, September 1984); US. Congress, Office of Technology Assessment, Wetlands:Their Use and Regulation, OTA-0-206 (Washington, DC: U.S. Government Printing Office March 1984); R.S. Warren, "Coastal WetlandVulnerabilities to Climate Change,” contractor report prepared for the Office of Technology Assessment, July 1992.
162 Preparing for an Uncertain Climate---Volume 2
near the soil surface for some part of the year. Wetlands are lands where saturation with water isThese elements are set forth in the definition of the dominant factor determining the nature of soilwetlands used by the U.S. Fish and Wildlife development and the types of plant and animalService (FWS) as the basis for the National communities living in the soil and on its surface.Wetlands Inventory (22) (several similar but The single feature that most wetlands share is soil
distinct definitions are used by other agencies for or substrate that is at least periodically saturated
regulatory purposes (see box 4-D)): with or covered by water . . . Wetlands are lands
Box 4-D--Why Care About Wetlands?
Wetlands are a resource of tremendous yet sometimes unrecognized, economic importance. The jobs ofcommercial fishers rely on wetlands---75 percent of the commercially landed fish and shellfish are dependent onwetlands (14). Sport fishing and waterfowl hunting, both of which depend on wetlands, generate several billiondollars of economic activity annually, offering significant stimulation to local economies. Commercial trappersmake their living from wetlands, with over a third of the furs harvest in the United States coming from mammalsthat live and grow in wetlands. Millions of dollars in flood damage and pollution control may be averted by thepresence of healthy wetlands. Wetlands provide crucial habitat for many endangered species. They also providean environment highly valued for its aesthetic and recreational enjoyment
The degree to which and the frequency with which a wetland performs these various functions depend largelyon where it is located. For example, although all wetlands perform some water filtration, this function is valued morewhere runoff waters are polluted than in pristine areas. Similarly, although nearly all wetlands provide wildlifehabitat, the significance of that habitat varies. Some Wetlands provide major societal benefits only occasionally,such as the floodplains and t emporary ponds that may store or slow runoff during heavy rains or flooding, but maynot even appear to be wetlands during dry years. Furthermore, value is in the eye of the beholder. A resident ofa flood-prone area may value nearby wetlands because they attenuate floods and may eliminate the need toconstruct walls or ditches to control floods, whereas a mare distant resident may value the same wetland morefor its aesthetic and recreational values.
The loss of these functional values usually comes at an expense to the surrounding area Removing ordegrading a wetland that serves an important flood-control function will require investment in additionalstorm-water controls or replacement of property and resources damaged by floods. Degradation of a wetland thatserves a prims water-filtration function will require additional investment in wastewater treatment facilities in thelong term. By the same token,loss of valuable wetland wildlife habitat will result in a decrease in species. Thoughit is difficult to quantify these values, their loss certainly results in reverberating effects on surrounding communitiesand the landscape.
Economic values of wetlands are difficult to calculate and vary widely among different types of wetlands andthe particular functions and products they provide. An array of approaches has been used to assess the values.Some studies have examined one or several services that wetlands provide to society, such as removingpollutants, providing flood control, or slowing coastal erosion, then have calculated the dollar value necessary toconstruct and operate sewage treatment plants or flood-control barriers that would perform equivalent services;the value of a wetland is assumed to be equal to the cost of replacing these services. Such studies have arrivedat replacement values ranging from hundreds to hundreds of thousands of dollars per acre (70, 71, 89, 116).However, market values of wetlands rarely reflect the full replacement values indicated in such studies.Furthermore, despite numerous attempts, many values defy quantification. The value of habitat provided bywetlands for endangered species, for example, cannot easily be translated into dollar figures, but can only behinted at through often-criticized surrogate pricing methods, such as surveys of the public’s willingness to pay.Wetlands clearly make huge indirect contributions to the national economy through their roles in supporting the
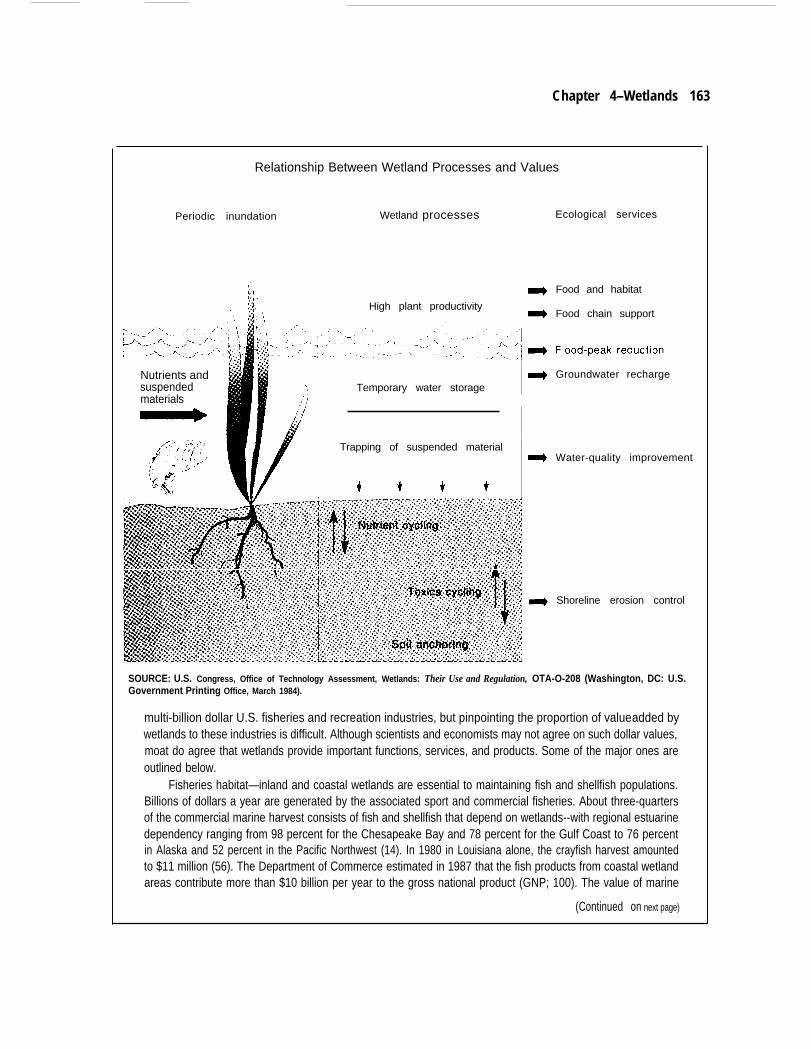
Chapter 4–Wetlands 163
Relationship Between Wetland Processes and Values
Periodic inundation Wetland processes
High plant productivity
Ecological services
Food and habitat
Food chain support
Nutrients andsuspendedmaterials
Temporary water storage
Trapping of suspended material I
Groundwater recharge
Water-quality improvement
Shoreline erosion control
SOURCE: U.S. Congress, Office of Technology Assessment, Wetlands: Their Use and Regulation, OTA-O-208 (Washington, DC: U.S.Government Printing Office, March 1984).
multi-billion dollar U.S. fisheries and recreation industries, but pinpointing the proportion of value added bywetlands to these industries is difficult. Although scientists and economists may not agree on such dollar values,moat do agree that wetlands provide important functions, services, and products. Some of the major ones areoutlined below.
Fisheries habitat—inland and coastal wetlands are essential to maintaining fish and shellfish populations.Billions of dollars a year are generated by the associated sport and commercial fisheries. About three-quartersof the commercial marine harvest consists of fish and shellfish that depend on wetlands--with regional estuarinedependency ranging from 98 percent for the Chesapeake Bay and 78 percent for the Gulf Coast to 76 percentin Alaska and 52 percent in the Pacific Northwest (14). In 1980 in Louisiana alone, the crayfish harvest amountedto $11 million (56). The Department of Commerce estimated in 1987 that the fish products from coastal wetlandareas contribute more than $10 billion per year to the gross national product (GNP; 100). The value of marine
(Continued on next page)
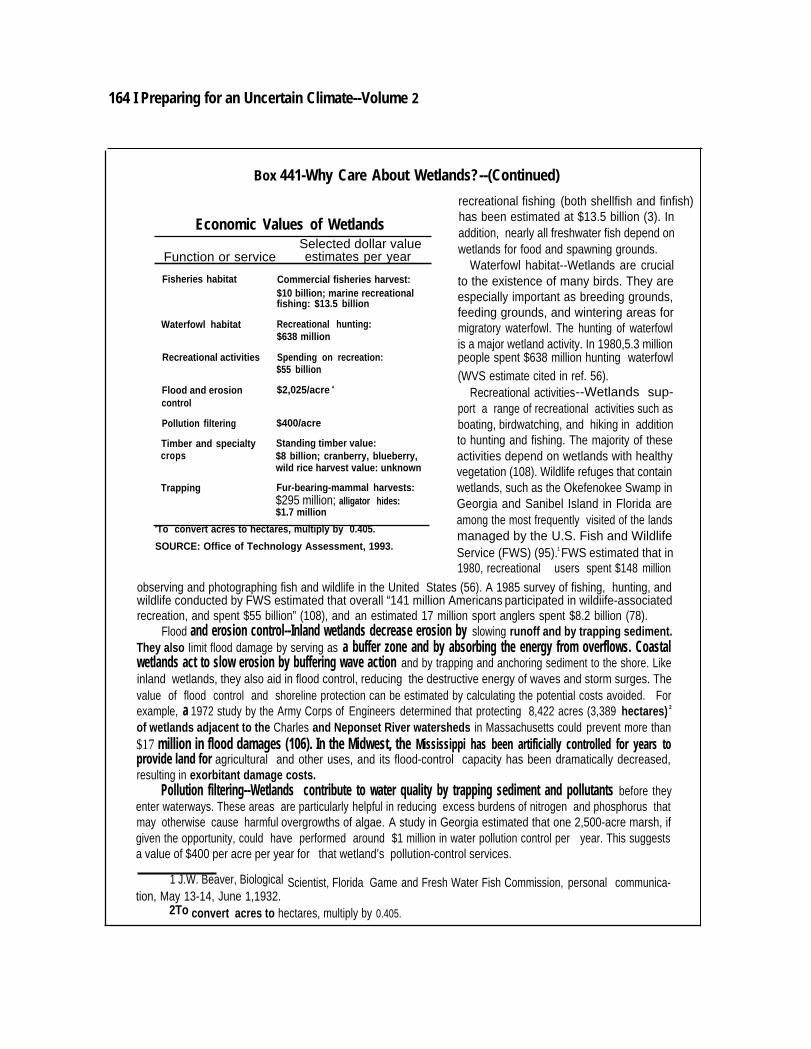
164 I Preparing for an Uncertain Climate--Volume 2
Box 441-Why Care About Wetlands?--(Continued)
Economic Values of WetlandsSelected dollar value
Function or service estimates per year
Fisheries habitat
Waterfowl habitat
Recreational activities
Flood and erosioncontrol
Pollution filtering
Timber and specialtycrops
Trapping
Commercial fisheries harvest:$10 billion; marine recreationalfishing: $13.5 billion
Recreational hunting:$638 million
Spending on recreation:$55 billion
$2,025/acre a
$400/acre
Standing timber value:$8 billion; cranberry, blueberry,wild rice harvest value: unknown
Fur-bearing-mammal harvests:$295 million; alligator hides:$1.7 million
aTo convert acres to hectares, multiply by 0.405.
SOURCE: Office of Technology Assessment, 1993.
recreational fishing (both shellfish and finfish)has been estimated at $13.5 billion (3). Inaddition, nearly all freshwater fish depend onwetlands for food and spawning grounds.
Waterfowl habitat--Wetlands are crucialto the existence of many birds. They areespecially important as breeding grounds,feeding grounds, and wintering areas formigratory waterfowl. The hunting of waterfowlis a major wetland activity. In 1980,5.3 millionpeople spent $638 million hunting waterfowl(WVS estimate cited in ref. 56).
Recreational activities--Wetlands sup-port a range of recreational activities such asboating, birdwatching, and hiking in additionto hunting and fishing. The majority of theseactivities depend on wetlands with healthyvegetation (108). Wildlife refuges that containwetlands, such as the Okefenokee Swamp inGeorgia and Sanibel Island in Florida areamong the most frequently visited of the landsmanaged by the U.S. Fish and WildlifeService (FWS) (95).1 FWS estimated that in1980, recreational users spent $148 million
observing and photographing fish and wildlife in the United States (56). A 1985 survey of fishing, hunting, andwildlife conducted by FWS estimated that overall “141 million Americans participated in wildiife-associatedrecreation, and spent $55 billion” (108), and an estimated 17 million sport anglers spent $8.2 billion (78).
Flood and erosion control--Inland wetlands decrease erosion by slowing runoff and by trapping sediment.They also Iimit flood damage by serving as a buffer zone and by absorbing the energy from overflows. Coastalwetlands act to slow erosion by buffering wave action and by trapping and anchoring sediment to the shore. Likeinland wetlands, they also aid in flood control, reducing the destructive energy of waves and storm surges. Thevalue of flood control and shoreline protection can be estimated by calculating the potential costs avoided. Forexample, a 1972 study by the Army Corps of Engineers determined that protecting 8,422 acres (3,389 hectares) 2
of wetlands adjacent to the Charles and Neponset River watersheds in Massachusetts could prevent more than$17 million in flood damages (106). In the Midwest, the Mississippi has been artificially controlled for years toprovide land for agricultural and other uses, and its flood-control capacity has been dramatically decreased,resulting in exorbitant damage costs.
Pollution filtering--Wetlands contribute to water quality by trapping sediment and pollutants before theyenter waterways. These areas are particularly helpful in reducing excess burdens of nitrogen and phosphorus thatmay otherwise cause harmful overgrowths of algae. A study in Georgia estimated that one 2,500-acre marsh, ifgiven the opportunity, could have performed around $1 million in water pollution control per year. This suggestsa value of $400 per acre per year for that wetland’s pollution-control services.
1 J.W. Beaver, Biological Scientist, Florida Game and Fresh Water Fish Commission, personal communica-tion, May 13-14, June 1,1932.
2To convert acres to hectares, multiply by 0.405.
Chapter 4–Wetlands 165
Timber and specialty crops--Bottomland wetland forests of the southeastern United States have astanding value of some $8 billion. Hardwood timber harvests from bottomland forests can be accomplished withminimal harm to wetlands. Other wetland areas in the South support rice farming and aquaculture. Wetlands inthe Northeast and North Central States provide cranberries and blueberries, and some North Central wetlands alsogrow wild rice. Grasses in wetlands also serve as livestock feed in many areas of the country, particularly alongrivers and streams in the arid West.
Trapping--Both the coastal and inland wetlands provide valuable habitat for fur bearers and reptiles.Fur-bearing mammals that live in wetlands include beavers, muskrats, raccoons, minks, and otters; FWSestimated the harvest of these mammals from wetlands to be $295 million in 1980 (nearly one-third of the industry’stotal). The sale of alligator hides that year generated an additional $1.7 million (56).
Endangered species habitat-More than one-third of the United States’s threatened and endangeredspecies use wetlands as their primary habitat (69), and numerous others rely on wetlands during some part of theirlife cycles. Wetlands are necessary for the survival of such species as the American crocodile, the whooping crane,the wood stork, the bald eagle, the manatee, the insectivorous hooded pitcher plant, and many others.
Carbon sink--Because of their high productivity, many wetland systems are very effective at storing, orsequestering, carbon. Soils in tundra (and other northern ecosystems) may store up to one-third of the global podof carbon now stored in soils (which could, if released to the atmosphere, speed up climate change) (72). Coastalwetlands, such as salt marshes, also store significant amounts of carbon (27).
Other cultural and aesthetic values---Wetlands hold many sites of historical and archaeological value andoffer opportunities for education and scientific study. The combination of land and water gives wetlands a uniqueaesthetic appeal (120).
SOURCES: U.S. Congress, Office of Technology Assessment (OTA), Wetlands: Their Use and Regulation, OTA-0-206 (Washington, DC:U.S. Government Printing Office, March 1984); U.S. Department of Commerce, Letter of Comment, dated Nov. 27, 1987, on the Sept. 1,1987, Draft Wetlands Priority Plan; U.S. Department of Commerce, National Oceanic and Atmospheric Administration (NOAA), NationalMarine Fisheries Service (NMFS), Fisheries of the United States, 1990, Current Fishery Statistics No. 9000 (Silver Spring, MD: FisheriesStatistics Division, NMFS, NOAA May 1991).
transitional between terrestrial and aquatic sys- inland or coastal, fresh or saline. However classi-tems where the water table is usually at or near thesurface or the land is covered by shallow water. . .[W]etlands must have one or more of the follow-ing three attributes: 1) at least periodically, theland supports predominantly hydrophytes [plantsthat can grow in water-saturated soil]; 2) thesubstrate is predominantly undrained hydric soil[soil that displays properties associated withhaving been saturated with water]; and 3) thesubstrate is nonsoil and is saturated with water orcovered by shallow water at some time during thegrowing season of each year,How to apply this definition, or some variation
fied, wetlands cannot be considered in isolationfrom the landscapes and the larger context of thehydrological systems in which they exist, such asthe estuarine and inland landscapes shown infigure 4-1 (68, 120; see also ch. 2). Becausewetlands are intricately connected to the quantityand quality of water flowing through a watershed,they are susceptible to any climate-induced changesin temperature and precipitation that affect theamount, speed, or temperature of water in thesystem. Their close link to hydrological cyclesalso means that they both affect and are affected
of it, has generated considerable controversy, by human activities in surrounding areas. Forparticularly in attempts to define the boundaries example, wetlands that occur in sites where anof wetlands subject to Federal regulation (see box aquifer discharges water at the surface may be4-E). affected if the aquifer is depleted or reduced by
Wetlands can be classified according to many decreased precipitation, runoff, and increaseddifferent characteristics, such as whether they are evaporation, or by human activities such as
166 Preparing for an Uncertain Climate-Volume 2
Box 4-E-Is a Wetland a Place or a Process?
Part of the difficulty of regulating and protecting wetlands is that they are, by nature, dynamic systems.Wetlands may follow a progression from being fully or partially saturated, through a period d uring which vegetativematerial gradually accumulates, to being saturated less frequently, allowing for different species to move in. Manyare only seasonally or periodically wet. Or the opposite may occur---a wetland may gradually or suddenly becomesaturated as a result of changes in water flow or levels in a lake, river, or estuary and eventually convert to openwater. A recent report by the National Academy of Science (68) states:
Along the edges of rivers, newly deposited sediments will be readily invaded by opportunistic plantsand animals. Initial colonists are unlikely to be the same species as those of the floodplain forest thateventually develops. Along the edges of continents, mud fiats are formed by alluvial outwash and aregradually colonized by salt marsh grasses and succulents, which in turn trap sediments that raise thetopography and attract additional plant and animal species. Along the edge of an acidic lake, sphagnummoss and herbaceous plants develop a mat that eventually supports bog shrubs and bog forest trees.in all these habitats, the nutrient content of the soil and the biomass of plants and animals increasethrough time, along with increases in species diversity and ecosystem complexity.
Yet U.S. policyhas tended to treat wetlands,like many other natural lands, as if they were static systems thatwill stay in the same place indefinitely if only further development is prevented. The Government has designatedNational Parks, National Wildlife Refuges, National Estuarine Research Reserves, and National MarineSanctuaries as places where wetlands will be protected, but these areas are often surrounded by intensive landuse and development, which may limit the ability of wetlands to continue their processes of growth and evolution(see vol. 1, ch. 4). in many parts of the Nation today, the natural processes of wetland evolution can no longertake place: “Before the widespread impact of man, new wetlands would have regularly opened up---due to thechanging flow of a river for example--replacing those lost by succession or changes in drainage patterns.... Inour modern, human-dominated world, however, where rivers and coastlines are constantly being molded to suitour whims, the natural recruitment of new wetlands is lost, depriving wildlife of a vital habitat . . .“ (41).
Where does climate change fit into the picture? By speeding up the rate at which the elements of theenvironment change---the temperature, precipitation, and water-flow patterns, for example--climate change willrequire that the processes of evolution and the migration of species that inhabit wetlands take place more rapidlyto keep up. In areas where there remains room to grow, where human activities have not yet blocked the pathsfor a natural progression of wetlands, the wetlands maybe able to adapt in time. But regardless of the initial causesof loss or degradation, in places where human activities have raised impenetrable barriers, the natural processesof wetlands may simply be squeezed out.
SOURCES: E. Goldsmith, N. Hildyard, P. McCully, and P, Bunyard, Imperiled Planet:Restoring Our Endangered Ecosystems (Cambridge,W-The MIT Press, 1990); National Research Council (NRC), Committee on Restoration of Aquatic Ecosystems --Science, Technology,and Public Policy, Water Science and Technology Board, Commission on Geosciences, Environment and Resources, Restoration ofAquatic Ecosystems: Science, Technology, and Public Policy(Washington, DC: National Academy Press, 1992).
pumping water for irrigation and municipal use. ■ Why Are Wetlands Important?Likewise, destruction of a wetland may cause Wetlands provide diverse products of consider-downstream changes in flooding or water quality able commercial value, playing a key role in theand degrade the quality of habitat for fish and production of goods such as finfish, shellflsh, fur,wildlife. Attempts to manage, protect, or restore waterfowl, timber, blueberries, cranberries, wildwetlands must take into account the numerous rice, and peat (see box 4-D). Wetlands alsoand intricate interactions among different parts of nurture biological productivity, slow surface-the landscape and must recognize that wetlands water flows, transform nutrients and toxic chemi-make up just one part. cals, and provide habitat that often harbors high
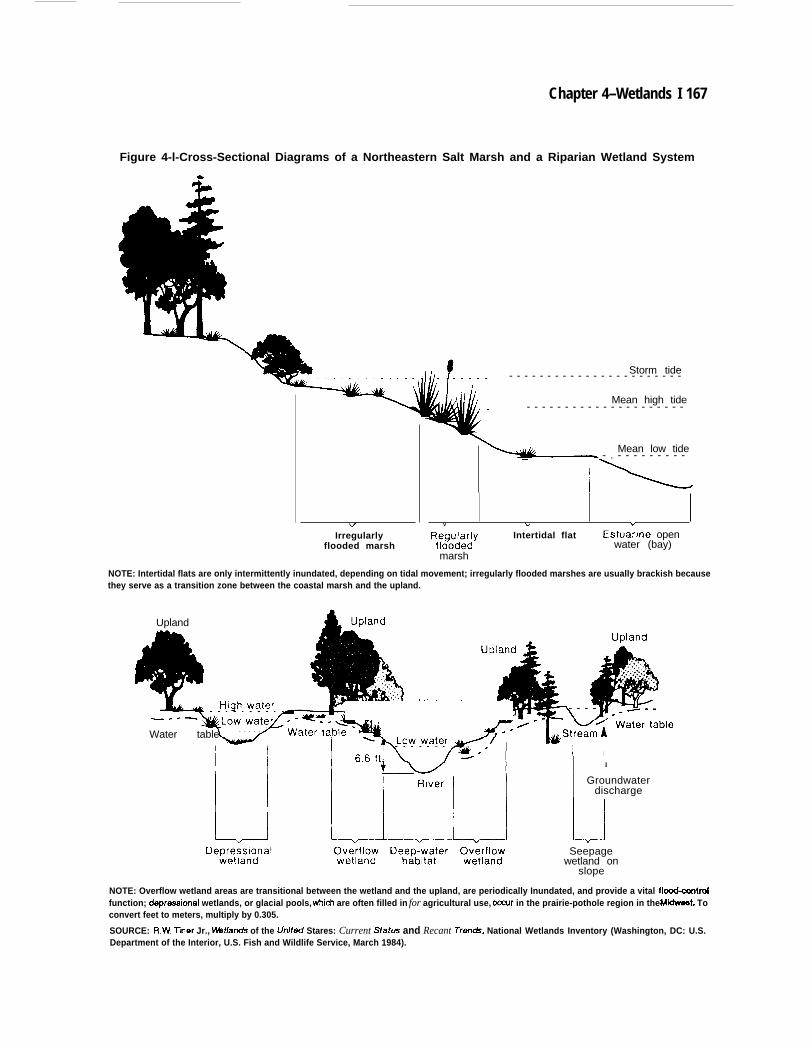
Chapter 4–Wetlands I 167
Figure 4-l-Cross-Sectional Diagrams of a Northeastern Salt Marsh and a Riparian Wetland System
&
vIrregularly
flooded marsh
Storm tide- - - - - - - - - - - - - - - - - - - - - - -
Mean high tide- - - - - - - - - - - - - - - - - - - - -
Mean low tide- . - - - - - - - - -
v v -/
Rf~~;$J;y Intertidal flat Estuarine openwater (bay)
marsh
NOTE: Intertidal flats are only intermittently inundated, depending on tidal movement; irregularly flooded marshes are usually brackish becausethey serve as a transition zone between the coastal marsh and the upland.
Upland d I Inland
@
— .-—Water table - - - - - ‘- Iill&sq ‘ater’ab’e
I
Groundwaterdischarge
Seepagewetland on
slope
NOTE: Overflow wetland areas are transitional between the wetland and the upland, are periodically Inundated, and provide a vital flood-contrdfunction; deprmsional wetlands, or glacial pools, wbich are often filled in for agricultural use, oocur in the prairie-pothole region in the Midweet. Toconvert feet to meters, multiply by 0.305.
SOURCE: R.W. Tlner Jr., kWtlands of the United Stares: Current Status and Recant Trerr&, National Wetlands Inventory (Washington, DC: U.S.Department of the Interior, U.S. Fish and Wildlife Service, March 1984).
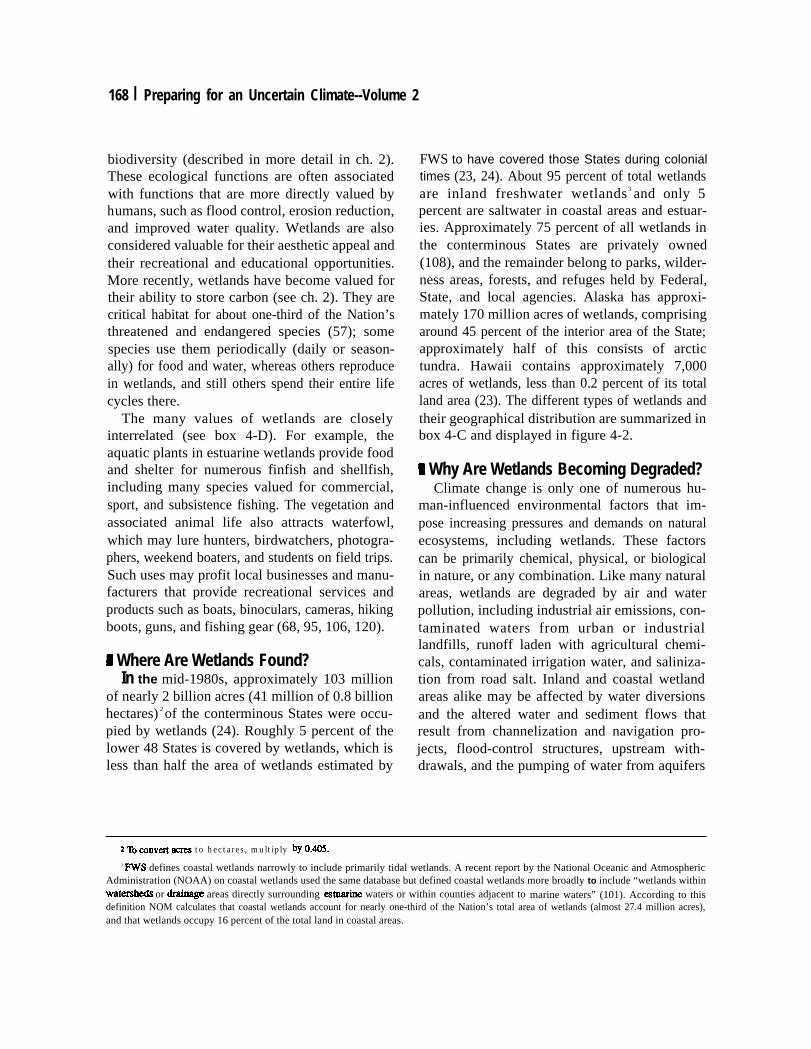
168 I Preparing for an Uncertain Climate--Volume 2
biodiversity (described in more detail in ch. 2).These ecological functions are often associatedwith functions that are more directly valued byhumans, such as flood control, erosion reduction,and improved water quality. Wetlands are alsoconsidered valuable for their aesthetic appeal andtheir recreational and educational opportunities.More recently, wetlands have become valued fortheir ability to store carbon (see ch. 2). They arecritical habitat for about one-third of the Nation’sthreatened and endangered species (57); somespecies use them periodically (daily or season-ally) for food and water, whereas others reproducein wetlands, and still others spend their entire lifecycles there.
The many values of wetlands are closelyinterrelated (see box 4-D). For example, theaquatic plants in estuarine wetlands provide foodand shelter for numerous finfish and shellfish,including many species valued for commercial,sport, and subsistence fishing. The vegetation andassociated animal life also attracts waterfowl,which may lure hunters, birdwatchers, photogra-phers, weekend boaters, and students on field trips.Such uses may profit local businesses and manu-facturers that provide recreational services andproducts such as boats, binoculars, cameras, hikingboots, guns, and fishing gear (68, 95, 106, 120).
9 Where Are Wetlands Found?In the mid-1980s, approximately 103 million
of nearly 2 billion acres (41 million of 0.8 billionhectares) 2 of the conterminous States were occu-pied by wetlands (24). Roughly 5 percent of thelower 48 States is covered by wetlands, which isless than half the area of wetlands estimated by
FWS to have covered those States during colonialtimes (23, 24). About 95 percent of total wetlandsare inland freshwater wetlands 3 and only 5percent are saltwater in coastal areas and estuar-ies. Approximately 75 percent of all wetlands inthe conterminous States are privately owned(108), and the remainder belong to parks, wilder-ness areas, forests, and refuges held by Federal,State, and local agencies. Alaska has approxi-mately 170 million acres of wetlands, comprisingaround 45 percent of the interior area of the State;approximately half of this consists of arctictundra. Hawaii contains approximately 7,000acres of wetlands, less than 0.2 percent of its totalland area (23). The different types of wetlands andtheir geographical distribution are summarized inbox 4-C and displayed in figure 4-2.
9 Why Are Wetlands Becoming Degraded?Climate change is only one of numerous hu-
man-influenced environmental factors that im-pose increasing pressures and demands on naturalecosystems, including wetlands. These factorscan be primarily chemical, physical, or biologicalin nature, or any combination. Like many naturalareas, wetlands are degraded by air and waterpollution, including industrial air emissions, con-taminated waters from urban or industriallandfills, runoff laden with agricultural chemi-cals, contaminated irrigation water, and saliniza-tion from road salt. Inland and coastal wetlandareas alike may be affected by water diversionsand the altered water and sediment flows thatresult from channelization and navigation pro-jects, flood-control structures, upstream with-drawals, and the pumping of water from aquifers
2 ~ COIIW31 WITS to hectares, multiply by O.m.
3 FWS defines coastal wetlands narrowly to include primarily tidal wetlands. A recent report by the National Oceanic and AtmosphericAdministration (NOAA) on coastal wetlands used the same database but defined coastal wetlands more broadly to include “wetlands withinwaterskis or dndnage areas directly surrounding estuarine waters or within counties adjacent to marine waters” (101). According to thisdefinition NOM calculates that coastal wetlands account for nearly one-third of the Nation’s total area of wetlands (almost 27.4 million acres),and that wetlands occupy 16 percent of the total land in coastal areas.
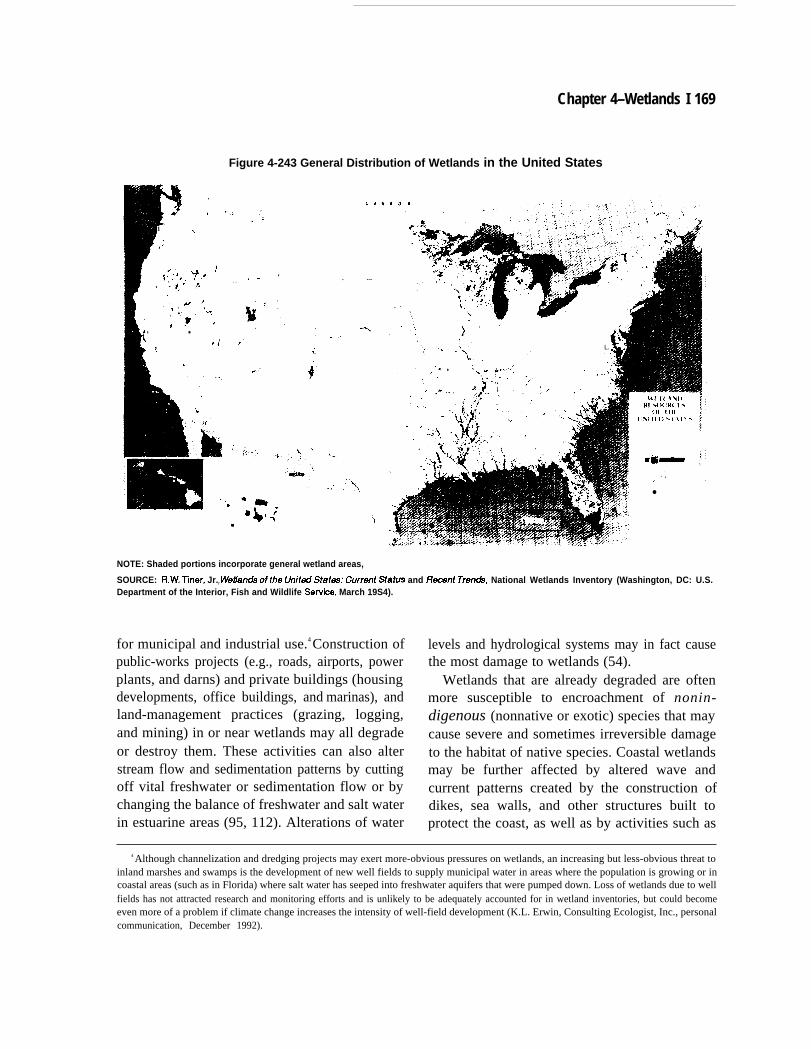
Chapter 4–Wetlands I 169
Figure 4-243 General Distribution of Wetlands in the United States
c
1 ; \
r’(“i- ‘ . .,.. .
. .
F. .
4[: L.
.<.
.,’●
“,-r.‘*’ -t’
NOTE: Shaded portions incorporate general wetland areas,
SOURCE: R.W. Tiner, Jr.r WeZ/andsoft/re /J-vledStakas; Current Status and Reuwt Trends, National Wetlands Inventory (Washington, DC: U.S.Department of the Interior, Fish and Wildlife Servke, March 19S4).
for municipal and industrial use.4 Construction ofpublic-works projects (e.g., roads, airports, powerplants, and darns) and private buildings (housingdevelopments, office buildings, and marinas), andland-management practices (grazing, logging,and mining) in or near wetlands may all degradeor destroy them. These activities can also alterstream flow and sedimentation patterns by cuttingoff vital freshwater or sedimentation flow or bychanging the balance of freshwater and salt waterin estuarine areas (95, 112). Alterations of water
levels and hydrological systems may in fact causethe most damage to wetlands (54).
Wetlands that are already degraded are oftenmore susceptible to encroachment of nonin-digenous (nonnative or exotic) species that maycause severe and sometimes irreversible damageto the habitat of native species. Coastal wetlandsmay be further affected by altered wave andcurrent patterns created by the construction ofdikes, sea walls, and other structures built toprotect the coast, as well as by activities such as
4 Although channelization and dredging projects may exert more-obvious pressures on wetlands, an increasing but less-obvious threat toinland marshes and swamps is the development of new well fields to supply municipal water in areas where the population is growing or incoastal areas (such as in Florida) where salt water has seeped into freshwater aquifers that were pumped down. Loss of wetlands due to wellfields has not attracted research and monitoring efforts and is unlikely to be adequately accounted for in wetland inventories, but could becomeeven more of a problem if climate change increases the intensity of well-field development (K.L. Erwin, Consulting Ecologist, Inc., personalcommunication, December 1992).
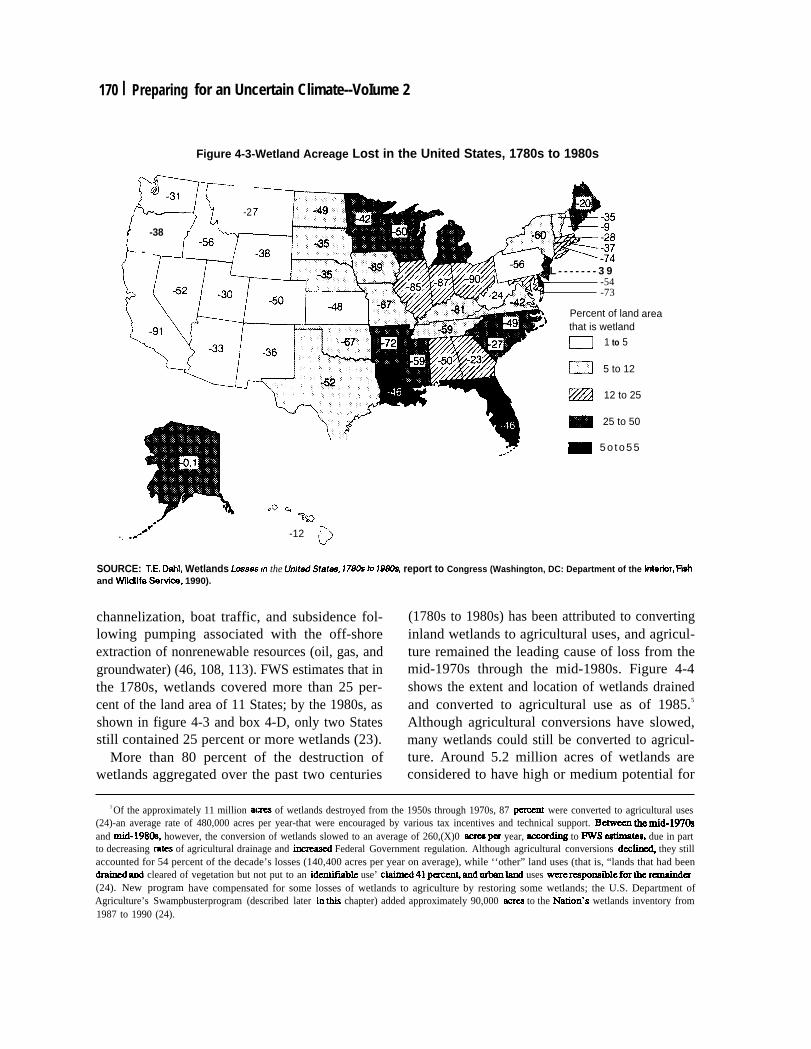
170 I Preparing
-,
for an Uncertain Climate--VoIume 2
Figure 4-3-Wetland Acreage Lost in the United States, 1780s to 1980s
-38
-
-2
-12D
L - - - - - - - 3 9-54-73
ir) Percent of land,* that is wetland
1 to 5
5 to 12
12 to 25
25 to 50
- 5 o t o 5 5
area
SOURCE: T.E. Dahl, Wetlands Lossesm the Unkd%tes, 1780s to 1980s, report to Congress (Washington, DC: Department of the Interbr, FMand Wklllfe Servics, 1990).
channelization, boat traffic, and subsidence fol-lowing pumping associated with the off-shoreextraction of nonrenewable resources (oil, gas, andgroundwater) (46, 108, 113). FWS estimates that inthe 1780s, wetlands covered more than 25 per-cent of the land area of 11 States; by the 1980s, asshown in figure 4-3 and box 4-D, only two Statesstill contained 25 percent or more wetlands (23).
More than 80 percent of the destruction ofwetlands aggregated over the past two centuries
(1780s to 1980s) has been attributed to convertinginland wetlands to agricultural uses, and agricul-ture remained the leading cause of loss from themid-1970s through the mid-1980s. Figure 4-4shows the extent and location of wetlands drainedand converted to agricultural use as of 1985.5
Although agricultural conversions have slowed,many wetlands could still be converted to agricul-ture. Around 5.2 million acres of wetlands areconsidered to have high or medium potential for
5 Of the approximately 11 million acxes of wetlands destroyed from the 1950s through 1970s, 87 pement were converted to agricultural uses(24)-an average rate of 480,000 acres per year-that were encouraged by various tax incentives and technical support. BetwecQ themid-1970sand mid-1980s, however, the conversion of wetlands slowed to an average of 260,(X)0 acres pa year, aecding to FWS estimate% due in partto decreasing mtes of agricultural drainage and incmasd Federal Government regulation. Although agricultural conversions declir@ they stillaccounted for 54 percent of the decade’s losses (140,400 acres per year on average), while ‘‘other” land uses (that is, “lands that had beendraimxiand cleared of vegetation but not put to an identi.fhble use’ clairned41 pcrcen4 andurbanland uses wererqcmsibleforthe runaind~(24). New program have compensated for some losses of wetlands to agriculture by restoring some wetlands; the U.S. Department ofAgriculture’s Swampbusterprogram (described later inthia chapter) added approximately 90,000 acrcx to the Nation’s wetlands inventory from1987 to 1990 (24).
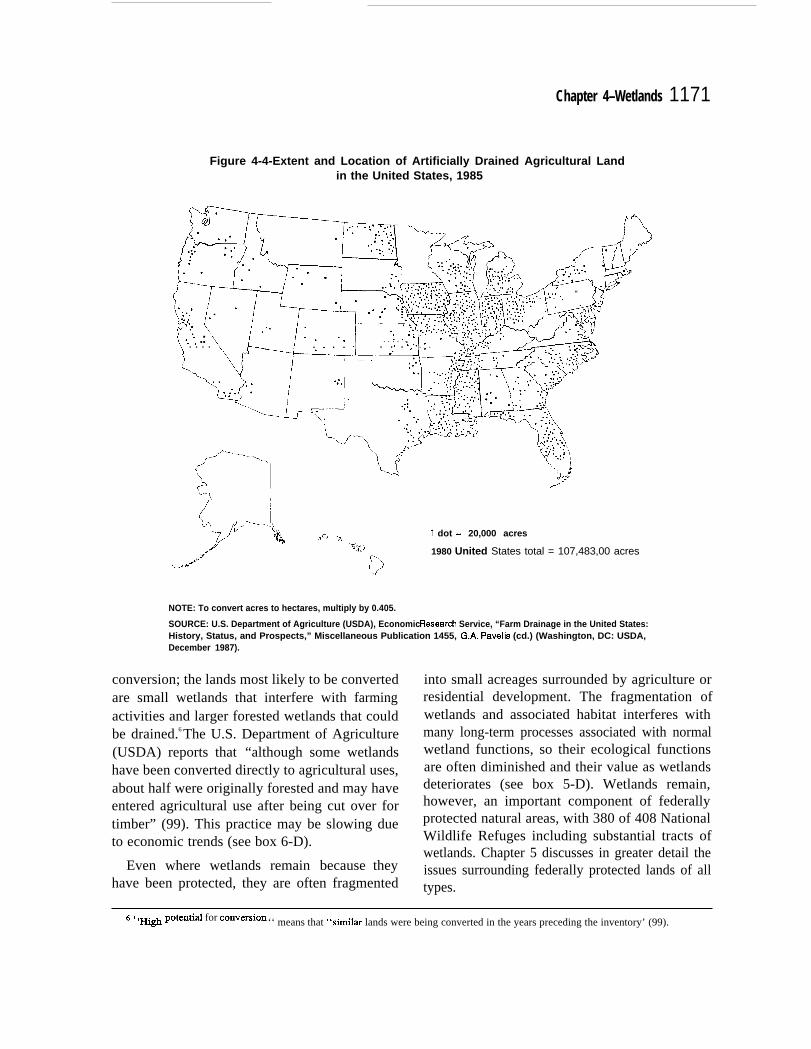
Chapter 4–Wetlands 1171
Figure 4-4-Extent and Location of Artificially Drained Agricultural Landin the United States, 1985
(,.. ““, .: \ “1. ...’. . . . . .. ~ z::; ‘X_. . . . . . . . . . . . ,“. . ; .
.~ :~.”>~
9
C?2.“ . . ,.. . . . . .t. ;%.. .., .
A“ [::..d
--.. , . . . . .,.=-”t .. .0 “. . . . . . }P. ..
“/
h--.
L—
I
\-L
r1 dot = 20,000 acres
1980 United States total = 107,483,00 acres
NOTE: To convert acres to hectares, multiply by 0.405.
SOURCE: U.S. Department of Agriculture (USDA), Economic Researeh Service, “Farm Drainage in the United States:History, Status, and Prospects,” Miscellaneous Publication 1455, G.A. Pavelis (cd.) (Washington, DC: USDA,December 1987).
conversion; the lands most likely to be converted into small acreages surrounded by agriculture orare small wetlands that interfere with farming residential development. The fragmentation ofactivities and larger forested wetlands that could wetlands and associated habitat interferes withbe drained.6 The U.S. Department of Agriculture(USDA) reports that “although some wetlandshave been converted directly to agricultural uses,about half were originally forested and may haveentered agricultural use after being cut over fortimber” (99). This practice may be slowing dueto economic trends (see box 6-D).
Even where wetlands remain because theyhave been protected, they are often fragmented
many long-term processes associated with normalwetland functions, so their ecological functionsare often diminished and their value as wetlandsdeteriorates (see box 5-D). Wetlands remain,however, an important component of federallyprotected natural areas, with 380 of 408 NationalWildlife Refuges including substantial tracts ofwetlands. Chapter 5 discusses in greater detail theissues surrounding federally protected lands of alltypes.
6. CHi@ p~ten~ for conv~sion ‘‘ means that “simihu lands were being converted in the years preceding the inventory’ (99).
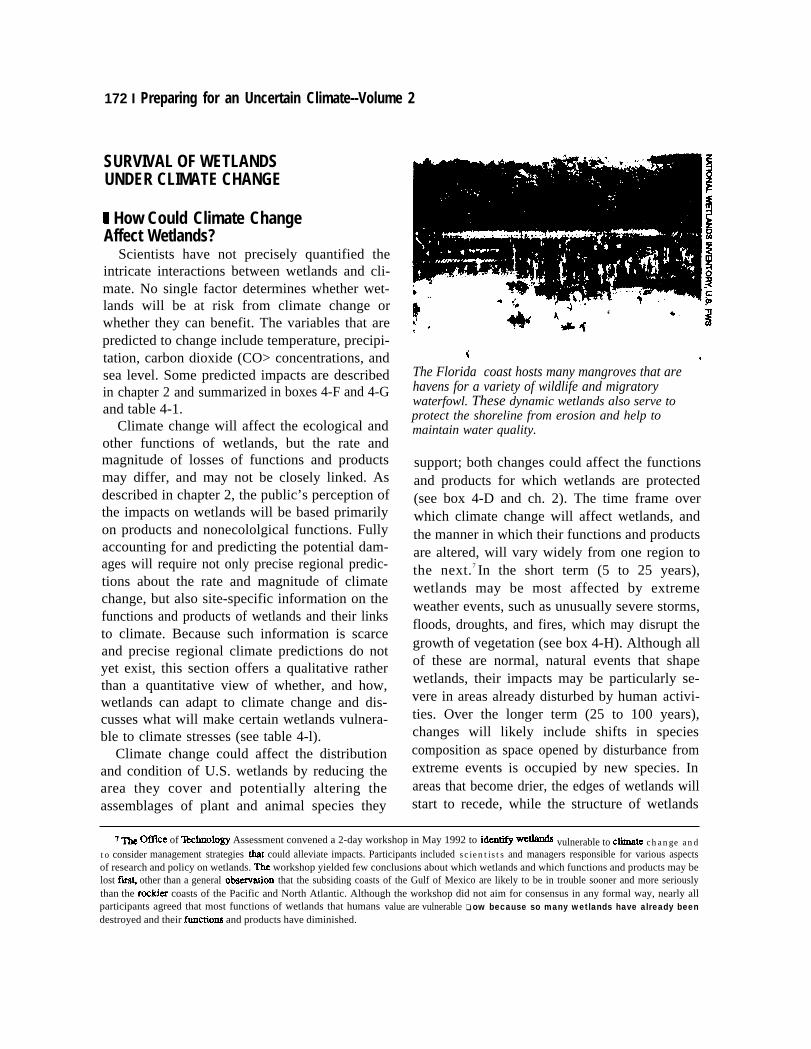
172 I Preparing for an Uncertain Climate--Volume 2
SURVIVAL OF WETLANDSUNDER CLIMATE CHANGE
H How Could Climate ChangeAffect Wetlands?
Scientists have not precisely quantified theintricate interactions between wetlands and cli-mate. No single factor determines whether wet-lands will be at risk from climate change orwhether they can benefit. The variables that arepredicted to change include temperature, precipi-tation, carbon dioxide (CO> concentrations, andsea level. Some predicted impacts are describedin chapter 2 and summarized in boxes 4-F and 4-Gand table 4-1.
Climate change will affect the ecological andother functions of wetlands, but the rate andmagnitude of losses of functions and productsmay differ, and may not be closely linked. Asdescribed in chapter 2, the public’s perception ofthe impacts on wetlands will be based primarilyon products and nonecololgical functions. Fullyaccounting for and predicting the potential dam-ages will require not only precise regional predic-tions about the rate and magnitude of climatechange, but also site-specific information on thefunctions and products of wetlands and their linksto climate. Because such information is scarceand precise regional climate predictions do notyet exist, this section offers a qualitative ratherthan a quantitative view of whether, and how,wetlands can adapt to climate change and dis-cusses what will make certain wetlands vulnera-ble to climate stresses (see table 4-l).
Climate change could affect the distributionand condition of U.S. wetlands by reducing thearea they cover and potentially altering theassemblages of plant and animal species they
.
*(“ ‘*4
. .( v
The Florida coast hosts many mangroves that arehavens for a variety of wildlife and migratorywaterfowl. These dynamic wetlands also serve toprotect the shoreline from erosion and help tomaintain water quality.
support; both changes could affect the functionsand products for which wetlands are protected(see box 4-D and ch. 2). The time frame overwhich climate change will affect wetlands, andthe manner in which their functions and productsare altered, will vary widely from one region tothe next.7 In the short term (5 to 25 years),wetlands may be most affected by extremeweather events, such as unusually severe storms,floods, droughts, and fires, which may disrupt thegrowth of vegetation (see box 4-H). Although allof these are normal, natural events that shapewetlands, their impacts may be particularly se-vere in areas already disturbed by human activi-ties. Over the longer term (25 to 100 years),changes will likely include shifts in speciescomposition as space opened by disturbance fromextreme events is occupied by new species. Inareas that become drier, the edges of wetlands willstart to recede, while the structure of wetlands
7 ~ Office of ‘ltchnology Assessment convened a 2-day workshop in May 1992 to idenw ~ti vulnerable to ClimfitC change andto consider management strategies t.hnt could alleviate impacts. Participants included scientists and managers responsible for various aspectsof research and policy on wetlands. TIM workshop yielded few conclusions about which wetlands and which functions and products may belost firsg other than a general obsemation that the subsiding coasts of the Gulf of Mexico are likely to be in trouble sooner and more seriouslythan the rockicz coasts of the Pacific and North Atlantic. Although the workshop did not aim for consensus in any formal way, nearly allparticipants agreed that most functions of wetlands that humans value are vulnerable ❑ ow because so many wetlands have already beendestroyed and their fictions and products have diminished.
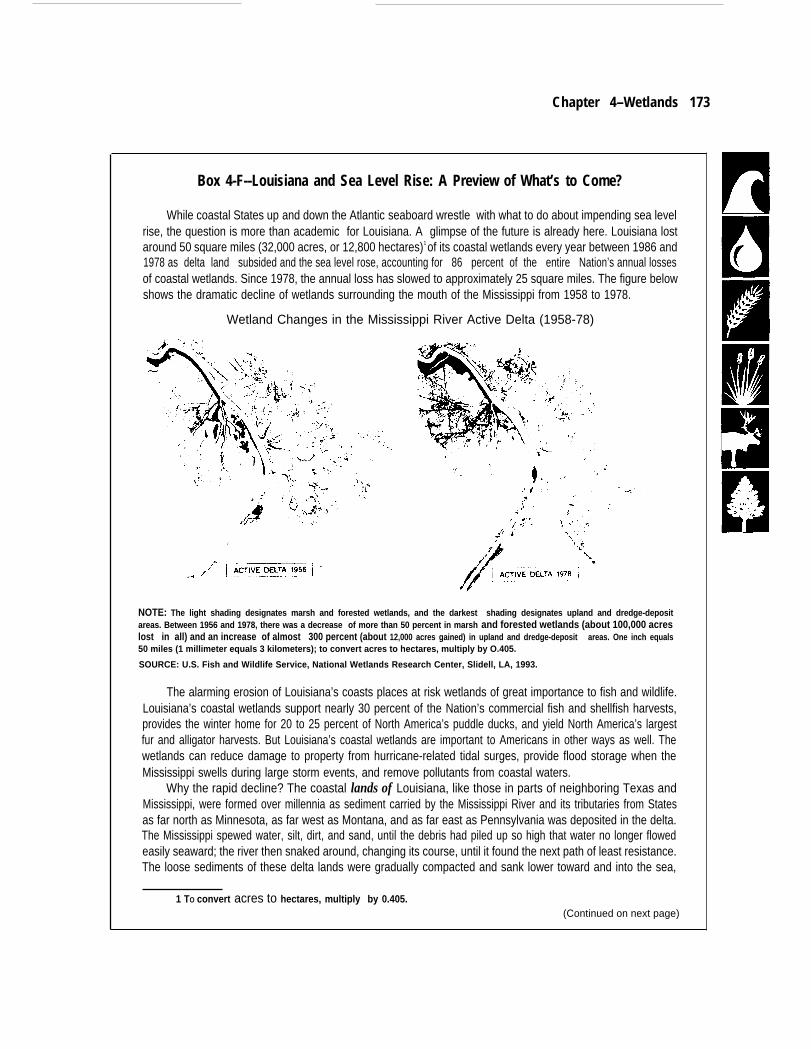
Chapter 4–Wetlands 173
Box 4-F--Louisiana and Sea Level Rise: A Preview of What’s to Come?
While coastal States up and down the Atlantic seaboard wrestle with what to do about impending sea levelrise, the question is more than academic for Louisiana. A glimpse of the future is already here. Louisiana lostaround 50 square miles (32,000 acres, or 12,800 hectares)1 of its coastal wetlands every year between 1986 and1978 as delta land subsided and the sea level rose, accounting for 86 percent of the entire Nation’s annual lossesof coastal wetlands. Since 1978, the annual loss has slowed to approximately 25 square miles. The figure belowshows the dramatic decline of wetlands surrounding the mouth of the Mississippi from 1958 to 1978.
Wetland Changes in the Mississippi River Active Delta (1958-78)
NOTE: The light shading designates marsh and forested wetlands, and the darkest shading designates upland and dredge-depositareas. Between 1956 and 1978, there was a decrease of more than 50 percent in marsh and forested wetlands (about 100,000 acreslost in all) and an increase of almost 300 percent (about 12,000 acres gained) in upland and dredge-deposit areas. One inch equals50 miles (1 millimeter equals 3 kilometers); to convert acres to hectares, multiply by O.405.
SOURCE: U.S. Fish and Wildlife Service, National Wetlands Research Center, Slidell, LA, 1993.
The alarming erosion of Louisiana’s coasts places at risk wetlands of great importance to fish and wildlife.Louisiana’s coastal wetlands support nearly 30 percent of the Nation’s commercial fish and shellfish harvests,provides the winter home for 20 to 25 percent of North America’s puddle ducks, and yield North America’s largestfur and alligator harvests. But Louisiana’s coastal wetlands are important to Americans in other ways as well. Thewetlands can reduce damage to property from hurricane-related tidal surges, provide flood storage when theMississippi swells during large storm events, and remove pollutants from coastal waters.
Why the rapid decline? The coastal lands of Louisiana, like those in parts of neighboring Texas andMississippi, were formed over millennia as sediment carried by the Mississippi River and its tributaries from Statesas far north as Minnesota, as far west as Montana, and as far east as Pennsylvania was deposited in the delta.The Mississippi spewed water, silt, dirt, and sand, until the debris had piled up so high that water no longer flowedeasily seaward; the river then snaked around, changing its course, until it found the next path of least resistance.The loose sediments of these delta lands were gradually compacted and sank lower toward and into the sea,
1 TO convert acres to hectares, multiply by 0.405.(Continued on next page)
174 I Preparing for an Uncertain CIimate---Volume 2
Box 4-F-Louisiana and Sea level Rise: A Preview of What’s to Come?--(Continued)
eroding easily in the face of waves and storms, until wetland vegetation took root. Vegetation anchored the soiland built up organic material and trapped sediment and land started to accumulate again in coastal marshes. Thisdynamic process of deposition and growth continued until around a century ago, when human actions to controlfloods and improve navigation on the Mississippi began to drastically alter the hydrological patterns and interferewith the patterns of coastal and wetland growth. The consequences of human attempts to control alluvialprocesses are often dramatic, as was seen when the Mississippi scaled its artificial barriers and inundatedhundreds of thousands of acres in its floodplain in July 1993--reclaiming, at least temporarily, many formerwetlands.
The primary cause of Louisiana’s wetland losses has been the construction of Federal and nonfederalflood-control levees along the Mississippi River that have virtually eliminated the inflow of fresh water and sedimentinto the delta marshes. Engineering projects designed to maintain navigation on the Mississippi River confine waterflow to deep, straight channels, forcing the sediment-laden water to bypass the wetlands and deposit its silt intodeeper Gulf of Mexico waters. Humanmade channels, built through the wetlands for navigation and for easyaccess to off-shore oil rigs, increase the encroachment of salt water into interior wetlands, killing the salt-intolerantvegetation and accelerating the loss of organic matter and the conversion of wetlands to open water. Wave actionfrom boats traveling along the channels accelerates the erosion of the shorelines.
The more rapid sealevel rise predicted with climate change, combined with continuing subsidence, will furtherincrease the rate and extent of wetland loss. Commercial fishers may actually see an initial increase in theirharvests and profits. Shrimp production may increase rapidly during the early stages of wetland decline asopen-water habitat increases, as marshes fragment, and as organic matter is released quickly by decayingvegetation, providing food sources for aquatic organisms. However, the initial boost of productivity will likely befollowed by a long and potentially rapid decline. if sea level changes rapidly, some commercial fisheries may belost entirely (see box 2-C).
What can be done to slow the loss? Many scientists who study wetlands view engineering activities withsuspicion because they have been the cause of past damage. However, further engineering maybe necessaryto reverse the damage that has already been done. The Army Corps of Engineers has already experimented withvarious techniques for offsetting the losses, and it should continue to evaluate their effectiveness to determinewhether they should be implemented more widely. The techniques include: 1) implementing projects to divert freshwater to maintain the proper salinity, and to divert sediment to inhibit subsidence and to help create new wetlandsin shallow open water; 2) backfilling and plugging certain dredged canals to prevent saltwater intrusion;3) establishing salt-tolerant vegetation in areas where the natural vegetation is threatened by salt water;4) effectively using maintenance dredge materials to restore proper marsh elevations for wetland vegetation;5) improving management of water levels and salinities by using levees and water-control structures to preserveand enhance existing wetlands and to restore degraded wetlands; 6) restoring wetlands drained for grazingpurposes; and 7) reducing the widespread use of forced drainage of wetland areas, thereby reducing sedimentcompaction and subsidence. Although levees and water-control structures are useful for controlling water leveland salinity, they prevent or restrict the mobility of aquatic organisms, and interfere with hydrology andsedimentation patterns-the very reason why Louisiana marshes, and some others, are so degraded today, andalso why the Mississippi River appears to have reclaimed its floodplain.
SOURCES: Louisiana Wetlands Protection Panel (LWPP), Saving Louisiana’s Coastal Wetlands: The Need for a Long-Term Plan of Action,EPA-230-02-87-026, report of a panel convened by U.S. Environmental Protection Agency (EPA) and Louisiana Geological Survey atGrand Terre Island, LA, Sept. 17-19,1985 (Washington, DC: U.S. EPA, April 1987); J. McPhee, The Control of Nature (New York: Farrar,Straus, Giroux, 1989); U.S. Department of the Interior (001), Fish and Wildlife Service (FWS), Wetlands: Meeting the President'sChallenge---1990 Wetlands Action Plan (Washington, DC: U.S. DOI, U.S. FWS, 1990); V. Van Sickle-Burkett et al., National WetlandsResearch Center, U.S. Fish and Wildlife Service, tables describing coastal wetland vulnerabilities to climate change, prepared for U.S.Office of Technology Assessment, May 1992.
Chapter 4–Wetlands 175
Box 4-G-How Could Climate Change Affect Wetlands?
Temperature---Increased air temperatures may speed evaporation of surface water from wetlands (and fromrunoff and water bodies that supply wetlands) and could increase the rate at which wetland plants lose waterthrough evaporation and transpiration if the warmer temperatures are not accompanied by increased rainfall.Drying is most likely to occur at the edges of wetlands and could reduce the size or extent of inland wetlands.Warmer temperatures will increase the rates at which plants decompose, affecting the amount of organic materialburied on the marsh floor. Warming could also increase the frequency and severity of drought and fires in seasonalwetlands, which could Iead to major changes in and loss of vegetation and habitat. Warming in tundra areas couldthaw the upper layer of the permafrost, making it more susceptible to drying, and could lead to significantreductions in the areas of both arctic and alpine tundra (120). Changes in the diurnal and seasonal distributionof temperature (such as warmer nights during winter and earlier spring thaws) will affect whether and, if so, howwetlands benefit from warmer temperatures. For example, mangroves may expand northward, replacingbrackish marshes on the northern coast of Florida and throughout the Gulf of Mexico wherever frosts and freezesbecome less frequent. Warmer temperatures in large bodies of water could boost productivity in the associatedwetlands but would affect the mix of species that could thrive,
Precipitation and soil moisture--Hydrology is an Important factor in determining levels of productivity,decomposition, and nutrient cycling in wetlands. Whether precipitation increases or decreases, ail of thesefunctions will be affected. Shifts in hydrological effects may develop in a stepwise manner, with new climatepatterns first affecting current vegetation (through shifts in soil moisture), then plant cover, and finally thepermeability of soils. Alterations of plant cover and soil permeability may then act in a feedback loop to furthermodify the hydrological cycle.
Increases in precipitation may cause shifts in vegetation but are not likely to cause as much disturbance towetlands as are drier conditions. In fact, increased precipitation along the Atlantic coastal plain, which is predictedby some models (64), could benefit Atlantic coast wetlands by transporting increased sediment from upstream tocoastal areas, and by maintaining high freshwater flows to help offset saltwater intrusion-both of which may helplessen the potential destruction of coastal wetlands by sea level rise.
Reduced precipitation is more likely to be harmful than is increased precipitation, especially in semiarid orwater-limited regions, leading to reduced riparian areas and desertification on semiarid flatlands. A driercontinental interior, predicted by many climate models (49, 64; see also ch. 2), will mean less water and sedimentsmoving down the Mississippi River and even greater problems for the coastal swamps and marshes of theMississippi River Delta. It will also likely exacerbate problems associated with saltwater intrusion up the ColumbiaRiver and rivers associated with estuaries such as Puget Sound, San Francisco Bay, and the Tijuana River.Throughout estuarine and coastal systems, lower precipitation will exacerbate ail the impacts and problemsassociated with sea Ievel rise.
Increased carbon dioxide (CO2)--Concentrations of atmospheric C02 are expected to reach twice thepre-industrial concentration (around 275 ppm) by the middle of the next century (49). The effects of this changeon the productivity and composition of natural plant communities, including those in wetlands, are difficult topredict. The fertilizing effect of elevated CO2 concentrations has been shown to boost productivity in ChesapeakeBay salt marshes (5, 26,27, 130), but the effect does not appear to occur for sustained periods in arctic tundra(44, 72), and other types of wetlands have yet to be tested for the effect. Some of the best long-term,open-environment experiments on the effects of increased C02 have been done on tidal wetlands. These studiesdo not provide definitive answers but suggest that elevated C02 concentrations tend to favor C3 species overplants using the C4 pathway for photosynthesis (see ch. 2 for a discussion of C3 and C4 plants). Most coastalwetland grasses are C4 plants, whereas most sedges, rushes, forbs, and the weedy grass Phragmites australisare C3 plants, as are all mangrove species. With rising CO2, therefore, the C3 species, which now tend to be
(Continued on next page)
176 Preparing for an Uncertain Climate--Volume 2
Box H-How Could Climate Change Affect Wetlands?--(Continued)
relatively less abundant, especially in more saline areas, may tend to become more important members of the plantcommunity of the salt marsh--but the magnitude of this change and its effects on salt marsh functions areimpossible to predict.
Accelerating sea level rise--Sea level has been rising at a gradual rate of 4 inches (10 centimeters)1 percentury for the past 3,000 years. At this rate, intertidal low marshes were able to accrete sedimentsts and producepeat at a rate that allowed the vertical marsh growth to keep up with or exceed the sea level rise. Behind theintertidal zone, marsh surface elevations rose above mean high tide, creating anew "high-marsh" niche floodedonly by spring tides, where marsh vegetation could grow. As sea level rises, high-marsh vegetation moveslandward, over the gradually submerging uplands. For a particular marsh to survive in the face of rising sea levelrequires-at a minimum--room for Iandward expansion as well as sufficient sediments to support a rate of surfaceaccretion that on average, tracks the sea level rise. The extent of sea level rise expected to occur with thermalexpansion of the oceans due to global warming--5 to 11 inches by 2050---may exceed the ability of tidal wetlandsto accrete sediments and produce roots fast enough to keep up with the rising sea level. Vegetation may changeand productivity may decrease; in some areas, wetlands maybe converted to open water.
In addition to the possibility that a rising sea may inundate coastal wetlands, it may also increase the distancethat salt water intrudes into estuaries, rivers, and even coastal aquifers. Saltwater intrusion may be magnified ifprecipitation within a watershed decreases at the same time that sea level increases, or if upstream waterwithdrawals for human use reduce water flows. Saltwater intrusion could affect brackish and fresh tidal wetlandsand freshwater coastal swamps, either converting thereto salt marsh or damaging vegetation enough that thoseareas are converted to open water.
1 TO convert inches to centimeters, multiply by 2.540.SOURCE: Office of Technology Assessment, 1993.
along the lowest-lying coasts may begin to likely to benefit. Wetland expansion might bechange (i.e., become larger or disappear) as theyare inundated.
While some wetlands may lose species andarea because of either increased drying or inunda-tion associated with climate change, others couldprosper or expand. For example, the fertilizingeffect of elevated CO2 concentrations (describedin ch. 2) boosts productivity in Chesapeake Baysalt marshes (5, 26, 27, 130). However, thefertilization effect does not appear to extend totundra (44, 72). The extent of the fertilizationeffect in other wetland types has yet to be tested.In many cases, land use in adjacent areas will bea determiningg factor in whether any benefits canbe realized. Wetlands buffered by undevelopednatural areas may have room to move and grow,whereas wetlands in areas where land is frag-mented among many competing uses will be less
accompanied by changes in vegetation, whichcould alter the products of, and the functionscurrently performed by, a given wetland.
Even where climate change benefits wetlands,however, expansion of wetlands in one regionwill not necessarily compensate for reductions indistant or dissimilar wetlands because the func-tions and values differ so widely. For example, inpart of the Southeast, rainfall is predicted toincrease enough to compensate for higher evapo-ration rates as the temperature warms, so parts ofthe region may become wetter. Riparian areas andbottomland hardwood wetlands could expandunder these conditions. At the same time, vastareas of arctic tundra may be at risk as warmingin the upper latitudes allows the permafrostunderlying the wetlands to melt and drain (de-scribed in more detail below). Gains in southeast-
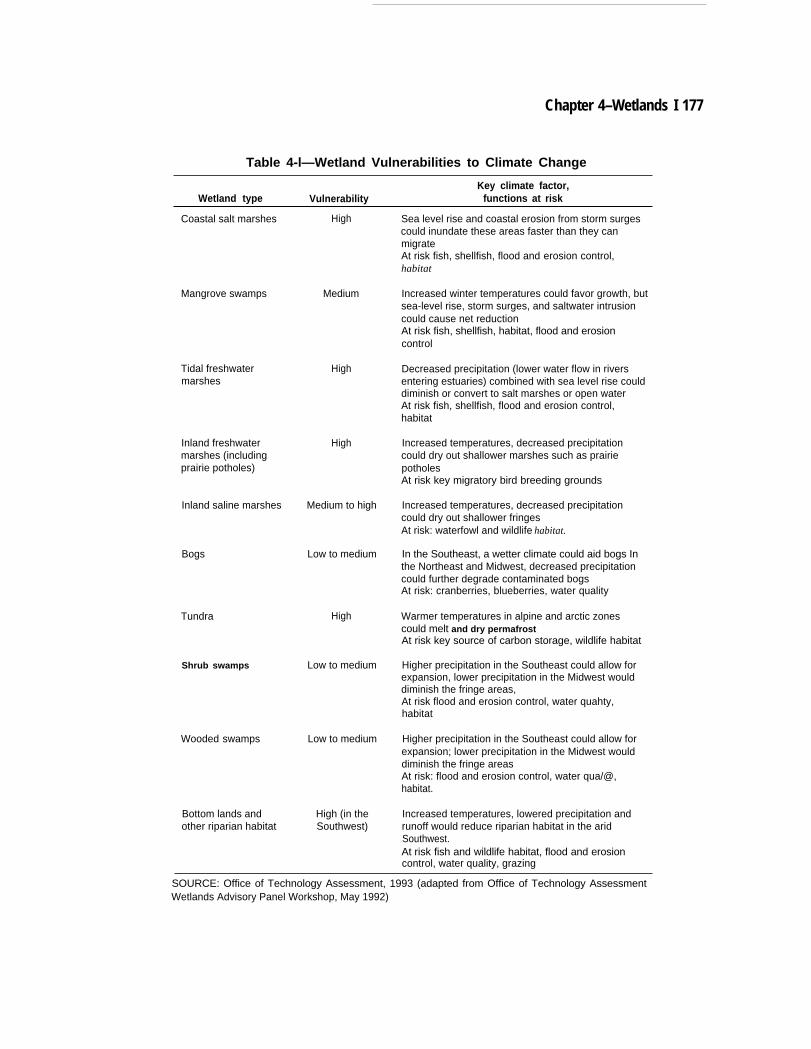
Chapter 4–Wetlands I 177
Table 4-l—Wetland Vulnerabilities to Climate Change
Key climate factor,Wetland type Vulnerability functions at risk
Coastal salt marshes
Mangrove swamps
Tidal freshwatermarshes
Inland freshwatermarshes (includingprairie potholes)
Inland saline marshes
Bogs
Tundra
Shrub swamps
Wooded swamps
Bottom lands andother riparian habitat
High
Medium
High
High
Medium to high
Low to medium
High
Low to medium
Low to medium
High (in theSouthwest)
Sea level rise and coastal erosion from storm surgescould inundate these areas faster than they canmigrateAt risk fish, shellfish, flood and erosion control,habitat
Increased winter temperatures could favor growth, butsea-level rise, storm surges, and saltwater intrusioncould cause net reductionAt risk fish, shellfish, habitat, flood and erosioncontrol
Decreased precipitation (lower water flow in riversentering estuaries) combined with sea level rise coulddiminish or convert to salt marshes or open waterAt risk fish, shellfish, flood and erosion control,habitat
Increased temperatures, decreased precipitationcould dry out shallower marshes such as prairiepotholesAt risk key migratory bird breeding grounds
Increased temperatures, decreased precipitationcould dry out shallower fringesAt risk: waterfowl and wildlife habitat.
In the Southeast, a wetter climate could aid bogs Inthe Northeast and Midwest, decreased precipitationcould further degrade contaminated bogsAt risk: cranberries, blueberries, water quality
Warmer temperatures in alpine and arctic zonescould melt and dry permafrostAt risk key source of carbon storage, wildlife habitat
Higher precipitation in the Southeast could allow forexpansion, lower precipitation in the Midwest woulddiminish the fringe areas,At risk flood and erosion control, water quahty,habitat
Higher precipitation in the Southeast could allow forexpansion; lower precipitation in the Midwest woulddiminish the fringe areasAt risk: flood and erosion control, water qua/@,habitat.
Increased temperatures, lowered precipitation andrunoff would reduce riparian habitat in the aridSouthwest.At risk fish and wildlife habitat, flood and erosioncontrol, water quality, grazing
SOURCE: Office of Technology Assessment, 1993 (adapted from Office of Technology AssessmentWetlands Advisory Panel Workshop, May 1992)
178 Preparing for an Uncertain Climate--Volume 2
Box4-H--Will Climate Change Increase Conflicts Over Riparian WetIands in the Arid West?
Like cases in the desert, riparian wetlands in the arid West offer lush vegetation and cool shade, presentinga respite from the hot sun and dry climate that attracts humans as well as wildlife. Riparian areas occupy just1 percent of the arid lands in the West, but provide food and habitat for three-quarters of the wildlife species inthose areas, including half of ail bird and vertebrate spades in the region (40, 103, 104). Rafting, fishing, andcanoeing on western rivers and streams make an enormous contribution to local economies in the West. Theriver-outfitting industry in Colorado alone generates $70 million annually (77). Riverside and streambed wetlandsare valued by ranchers as a haven for cattle, which seek out the cool shade of cottonwood and willow and thehigh-quality forage. After heavy rains, riparian vegetation filters sediment from runoff water, helping to build andmaintain stream banks, protecting against erosion, and offering a buffer against floods. Riparian wetlands evenplay an important role in how a watershed functions: the vegetation shields water and soil from the sun, slowingevaporation (19).
Yet despite their many functions, riparian wetlands are under constant threat, even In the existing climate.As wet areas in a landscape where water is scarce, they are often overused. The Environmental Protection Agency(EPA) estimates that overgrazing has been the most geographically extensive cause of riparian wetlanddegradation and loss (15). Overgrazing, either by too many animals or for too long a period of time, prevents newplants from taking root and holding down the soil. As a result, stream banks erode, channels become shallow andladen with sediments, water quality and quantity decrease, and, eventually, the stream may flow only intermittentlyor not at all. Riparian wetlands may also be destroyed by the destructive Iand-clearing practices associated withmining and logging. Removing vegetation often leads to erosion that washes sediment into rivers and streams,filling wetlands and allowing them to dry up.
Even more threatening to riparian areas has been the diversion of water from rivers and streams forcompeting uses, either by direct pumping or by projects designed to channel the water. Water rights are hotlycontested in many parts of the West, with water from many rivers already allocated in greater amounts thannormally flow, and the need for water to remain instream (i.e., in the river rather than pumped out or directed) forfish, wildlife, and wetlands is not always recognized. Farmers channel or pump from streams to fields foragricultural use, while cities siphon off water for drinking and other purposes. These water diversions leave lesswater for riparian areas downstream, and because riparian vegetation depends more on flowing water than onprecipitation, Iess water in the stream bed translates to Iess or even totally lost vegetation (28, 38). All told, morethan 80 percent of riparian wetlands have been destroyed by human activity, with an associated loss of habitatand decline of wildlife populations (40, 51, 117).
Climate change could impose greater water stress on already-degraded wetlands, both from lowerprecipitation and from ever-increasing competition with human activities. Climate models predict that conditionswill be hotter and drier in the already-arid West (49). A warmer climate may bring rain rather than snow in the winter,allowing precipitation to run off immediately rather than to remain in snowpacks that melt in spring as the growingseason begins. The earlier runoff could mean that drier conditions would start earlier in the year, making summerand fall water shortage and quality problems worse in many parts of the West (84). As water becomes more scarce,the competition and potential conflicts over water use could increase. Drought-stricken farmers and expandingcities alike may demand more water development projects to makeup for lower precipitation, and ranchers maybe more inclined to encourage grazing in riparian areas (or demand grazing rights on publicly owned properties)as surrounding rangelands decline. Riparian wetlands, along with the fish and wildlife that inhabit them, may welllose out among the competing demands and decreasing water flows.
Although most riparian wetlands are protected from the physical disturbances of dredge and fill activities(Section 404 of the Clean Water Act (P.L. 92-500)), they receive little legal protection against the upstream waterdiversions that might ultimately cause their destruction. Some fish and wildlife agencies and other conservation
Chapter 4–Wetlands 179
groups have recently begun to purchase water rights for instream flows to protect riparian wetlands and wildlife,including fish. In the West, however, water is allocated according to the prior appropriation doctrine, which givespriority to those who first diverted water from a river and put it to use--"first in time, first in right.” (See vol. 1, ch.5.) In most cases, the water rights purchased for natural areas are “junior” to those owned by farmers and cities,so in a water crisis, water for natural areas would be among the first to be lost. The Wild and Scenic Rivers Act(P.L. 90-542) protects instream flows for certain designated rivers, but water rights for National Parks andwilderness areas have yet to be claimed by the Federal Government. Even these protections, which are alreadycontroversial, may become more so as water becomes more since.
SOURCES: E. Chancy, W. Elmore, and W.S, Platts, L/vestal Grazing on Western Riparian Areas, report prepared for the U. S.Environmental Protection Agency (Eagle, ID: Northwest Resources Information Center, Inc., 1990); U.S. Department of the Interior, Bureauof land Management, Riparian-Wetland Initiative for the 1900's, BLM/WO/Gl-91/001-4340 (Washington, DC: Bureau of LandManagement, September 1991); U.S. General Accounting Office, Range/and Management: Forest Service Not Performing NeededMonitoring of Grazing Allotments, GAO/RCED-91-148 (Washington, DC: General Accounting Office, May 1991).
ern wetlands could not compensate for the loss ofhabitat and carbon storage provided by arctictundra wetlands. Likewise, expansion of inlandwetlands within a coastal watershed as sea levelrises may be important to the estuary, but thosewetlands would not perform the same nurseryfunctions for fish and shellfish as do the wetlandsright at the coast. Regardless of the benefits, then,climate change may still pose a threat to manyfunctions and products of wetlands.
Although climate change may affect wetlandsdirectly, many scientists and policy makers con-sider the activities currently degrading and de-stroying wetlands-agriculture, development, pol-lution, and changing water and sediment flows—to be the biggest threats to wetlands and theireconomically important functions in the future.Climate change would add to the stresses posedby these activities: a decrease in runoff in theNortheast could worsen water quality; competi-tion with urban and industrial water uses wouldprobably reduce the water available for wetlands;and increased pressure for water diversions mightfurther alter water and sediment flows to wetlands(84). Thus, in many areas, the direct effects ofclimate change may not overtake existing sourcesof degradation and loss as the dominant threat towetlands in the near term, but will likely exacer-bate current trends of loss and degradation.
Because the United States has already lostmore than half of the wetlands it contained 200years ago (over 100 million acres), the potentialfor climate change to spur further losses anddegradation could pose a significant threat tovalued functions of wetlands (103). If lossescontinue at current rates, FWS estimates, theNation may lose another 4 percent (approxi-mately 4 million acres) of remaining wetlands inthe conterminous States by the year 2000--andthis estimate does not account for any additionallosses in area or function due to climate change(108). Losses of inland wetlands will likelycontinue to make up the bulk of total losses ofwetlands because that is where most U.S. wet-lands lie, but coastal wetlands may suffer largerproportional losses in a changing climate becauseof the threat posed by a rising sea level.
B Can Wetland SpeciesAdapt to Climate Change?
No single factor determines whether the vari-ous plant and animal species that make up awetland can adapt to climate change or whether aparticular wetland system will lose some or all ofits functions and products. In any given site,wetland species may respond in three interrelatedways as the environment changes around them:they may change, migrate, or decline. Whichresponse prevails will depend on where a wetland
180 I Preparing for an Uncertain Climate--Volume 2
lies in the landscape, its size, its hydrology, thehealth of its vegetation, and other physical,biological, and anthropogenic factors that haveshaped it over time, combined with the rates atwhich regional patterns of temperature, precipita-tion, and evaporation change.
ChangeDepending on the rate and magnitude of
climate change, wetlands and the species thatinhabit them may adapt to new climate condi-tions. New plants may become dominant, anddifferent animal species may be associated withthem (66). In a given wetland, a moderate changein precipitation may induce a gradual change inplant species composition but cause little harm towildlife habitat, recreational use, or floodplainprotection. A greater change might convert ayear-round wetland into a, seasonal one, affectingvegetation and impairing wildlife habitat andrecreational value, but perhaps allowing contin-ued floodplain protection.
MigrationWetland vegetative species may migrate to
surrounding, similar areas if such areas exist andif migration pathways are not blocked by topo-graphical or anthropogenic barriers. For example,coastal and estuarine wetland vegetation willbegin to take root further inland as the sea levelrises. Whether the vegetation becomes estab-lished successfully will depend on the rate atwhich water levels rise, the steepness of the coast,and the presence of barriers, such as rocky areasand human-built structures. Wetlands fringing theplaya lakes of the Southwest may retreat orbecome degraded along the water line if increasedevaporation in a hotter and drier climate causeswater levels to drop, and farmers may then till upto or through the fringe. In many areas, adjacenthuman activity severely limits the ability ofwetlands to move or flourish.
The likelihood of successful migration willdiffer for coastal and inland wetlands. In coastalareas, vegetation attempting to take root upslopeof the rising sea may face competition from plantsalready in place that have well-established rootsystems and that may not give way easily. Ininland areas where drying and drought occur,plants attempting to move downslope to followdeclining water levels in rivers or depressions willnot likely face the same kind of competition; thesubmerged plants that might have competed willlikely die when the water recedes. In both coastaland inland areas where channels have been dug,however, migration will be difficult or impossiblebecause the sharp slope at the channel’s edge maypresent an insurmountable barrier.
Even where room to grow is available, there arelimits to migration. As noted in chapter 2, it isunlikely that entire assemblages of plants andanimals can simply pick up and move together inlockstep. Some species will migrate quickly,others slowly, others not at all. Patterns ofcompetition and predation may be significantlyaltered, affecting which species will survivemigration. Long-term studies of degraded ordamaged wetlands suggest that change may takeplace slowly, one species at a time, and that not allspecies recover.8 Random events, such as weatherand chance dispersal of seeds, affect the probabil-ities of migration and survival, Any migrationmay be accompanied by a loss of biodiversityalong with the loss of some of the wetland’sfunctions and products.
DecllneWetlands in some sites may disappear entirely
or become so severely degraded that they lose thefunctions and products by which they are nowcharacterized. If climate change is rapid orsevere, some wetland species may not be able toadapt. Coastal wetlands not degraded by humanactivities have kept pace with a sea level rise of
s B. Bedford, Direetor, Association of Ecosystem Research Centers, and Professor of Ecology, Cornell University, personal ecxnmunieatio~Nov. 4.1991.
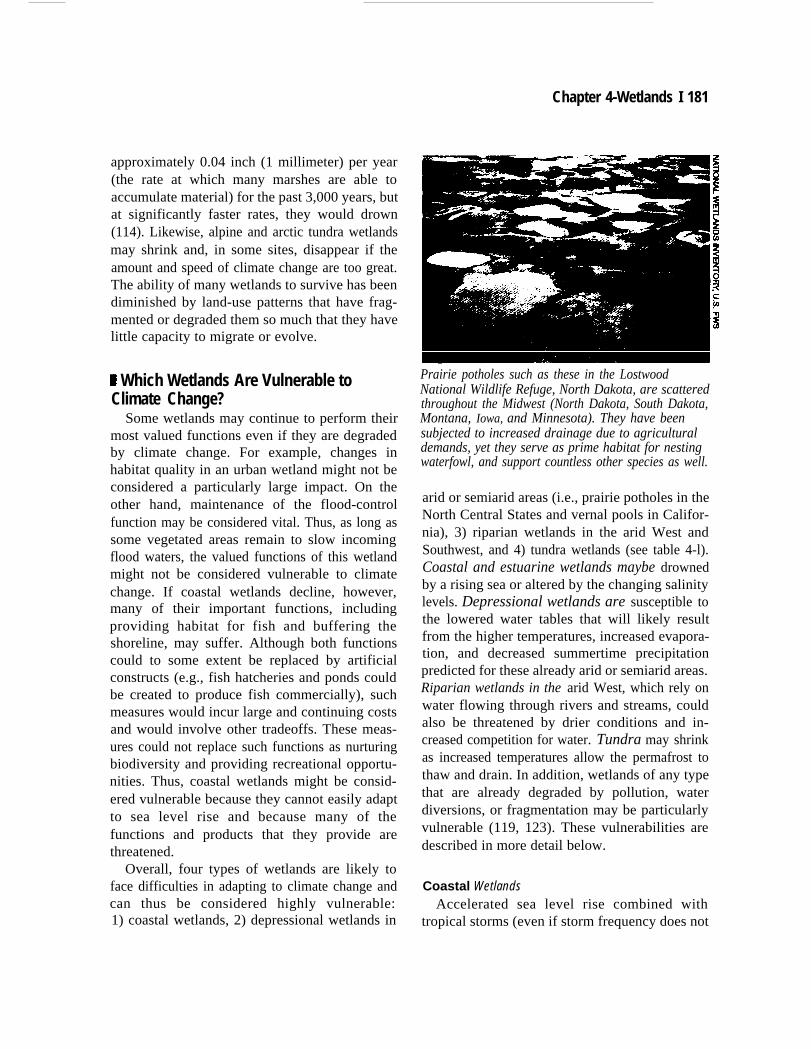
Chapter 4-Wetlands I 181
approximately 0.04 inch (1 millimeter) per year(the rate at which many marshes are able toaccumulate material) for the past 3,000 years, butat significantly faster rates, they would drown(114). Likewise, alpine and arctic tundra wetlandsmay shrink and, in some sites, disappear if theamount and speed of climate change are too great.The ability of many wetlands to survive has beendiminished by land-use patterns that have frag-mented or degraded them so much that they havelittle capacity to migrate or evolve.
E Which Wetlands Are Vulnerable toClimate Change?
Some wetlands may continue to perform theirmost valued functions even if they are degradedby climate change. For example, changes inhabitat quality in an urban wetland might not beconsidered a particularly large impact. On theother hand, maintenance of the flood-controlfunction may be considered vital. Thus, as long assome vegetated areas remain to slow incomingflood waters, the valued functions of this wetlandmight not be considered vulnerable to climatechange. If coastal wetlands decline, however,many of their important functions, includingproviding habitat for fish and buffering theshoreline, may suffer. Although both functionscould to some extent be replaced by artificialconstructs (e.g., fish hatcheries and ponds couldbe created to produce fish commercially), suchmeasures would incur large and continuing costsand would involve other tradeoffs. These meas-ures could not replace such functions as nurturingbiodiversity and providing recreational opportu-nities. Thus, coastal wetlands might be consid-ered vulnerable because they cannot easily adaptto sea level rise and because many of thefunctions and products that they provide arethreatened.
Overall, four types of wetlands are likely toface difficulties in adapting to climate change andcan thus be considered highly vulnerable:1) coastal wetlands, 2) depressional wetlands in
Prairie potholes such as these in the LostwoodNational Wildlife Refuge, North Dakota, are scatteredthroughout the Midwest (North Dakota, South Dakota,Montana, Iowa, and Minnesota). They have beensubjected to increased drainage due to agriculturaldemands, yet they serve as prime habitat for nestingwaterfowl, and support countless other species as well.
arid or semiarid areas (i.e., prairie potholes in theNorth Central States and vernal pools in Califor-nia), 3) riparian wetlands in the arid West andSouthwest, and 4) tundra wetlands (see table 4-l).Coastal and estuarine wetlands maybe drownedby a rising sea or altered by the changing salinitylevels. Depressional wetlands are susceptible tothe lowered water tables that will likely resultfrom the higher temperatures, increased evapora-tion, and decreased summertime precipitationpredicted for these already arid or semiarid areas.Riparian wetlands in the arid West, which rely onwater flowing through rivers and streams, couldalso be threatened by drier conditions and in-creased competition for water. Tundra may shrinkas increased temperatures allow the permafrost tothaw and drain. In addition, wetlands of any typethat are already degraded by pollution, waterdiversions, or fragmentation may be particularlyvulnerable (119, 123). These vulnerabilities aredescribed in more detail below.
Coastal WetlandsAccelerated sea level rise combined with
tropical storms (even if storm frequency does not
182 I Preparing for an Uncertain Climate-Volume 2
increase) will exacerbate “the current losses ofcoastal wetlands. Wetlands along the low-lyingcoasts of the Southeast, from North Carolina inthe Atlantic to Texas in the Gulf of Mexico, arealready subsiding due to compaction (i.e., com-pression of estuarine or deltaic sediments by newlayers of sedimentary deposits). These areas maybe either flooded or washed away as prevailingwater levels rise (see ch. 2). Lands in theMississippi River Delta are expected to suffer thehighest rates of coastal erosion and loss ofwetlands (see vol. 1, ch. 4). Indeed, erosion ofcoastal wetlands is already proceeding rapidly inLouisiana, and increasing rates of loss are ex-pected with accelerated sea level rise (see box4-F). Approximately half of the 5.5 million acresof coastal wetlands that remain in the UnitedStates are found along the Gulf of Mexico (16),making the potential for loss great.
Accelerated sea level rise will also be accom-panied by saltwater intrusion-that is, salt watermoving inland into estuaries and rivers-whichmay further alter or destroy coastal wetlands thatdepend on fresh water or a balance of fresh andsalt water (see vol. 1, chs. 4 and 5, for furtherdiscussion). This effect may be especially damag-ing to tidal freshwater wetlands that lie near theupper reaches of tides in many coastal rivers. Thehigher and rockier coasts bordering the NorthAtlantic and Pacific Oceans are less likely toexperience losses of wetlands, in part becausethese rocky coasts harbor fewer to begin with.However, some important estuarine systems inthese areas, including Puget Sound, San Fran-cisco Bay, and Tijuana Estuary, may be highlyvulnerable because of local subsidence, erosion,and water diversions that have dramaticallyaltered water and sediment flows. Each of theseareas has already lost many wetlands to waterdiversion and competing land uses. Further lossesmight irreparably harm the already-diminishedfunctions and products (83, 126).9
The key to whether coastal wetlands will beable to adapt to climate change is migration--theability to move inland to keep pace with the risingsea (114) (see vol. 1, ch. 4). Although topography,geology, and the coast-shaping processes thataccompany storms are important limiting factorsto migration, human responses to sea level risewill perhaps be even more important. Societalmeasures taken to protect the coasts will helpdetermine the pattern and rate of loss; suchmeasures could range from no additional protec-tion (which is unlikely in developed areas) toefforts to protect not only major coastal develop-ments but more rural areas as well. Wetlandsalong highly developed coasts, including much ofthe Atlantic coast from Maryland to Massachu-setts, may become quite vulnerable to climatechange because control structures such as seawalls and bulkheads already form barriers tomigration. As the sea level rises, the public maydesire to take even more aggressive measures,such as constructing dikes, to protect human lifeand property values in densely settled areas. Evenalong undeveloped coasts, the land just above sealevel into which wetlands could migrate isgenerally smaller than the area of wetlands at riskfrom climate change (91). Thus, coastal wetlandsmay simply be squeezed out between the risingsea and the flood-control structures that arealready in place or that may be constructed toprotect coastal properties.
Several functions and products are at risk ifcoastal wetlands are diminished and altered byclimate change. In ecological terms, Atlantic tidalmarshes are remarkably homogeneous in speciescomposition from Florida to Maine, so it mayappear that some losses will not pose a significantthreat to overall fictions and products. How-ever, regional populations of many species havedeveloped adaptive characteristics that may notbe common in the species as a whole, so declinesin any region still reduce the genetic diversity
9 D. J. Canning, Shorelan& and Coastal Zone Management Pro- Washington State Department Of kology, pod ComrnunicatioqNov. 11, 1992.
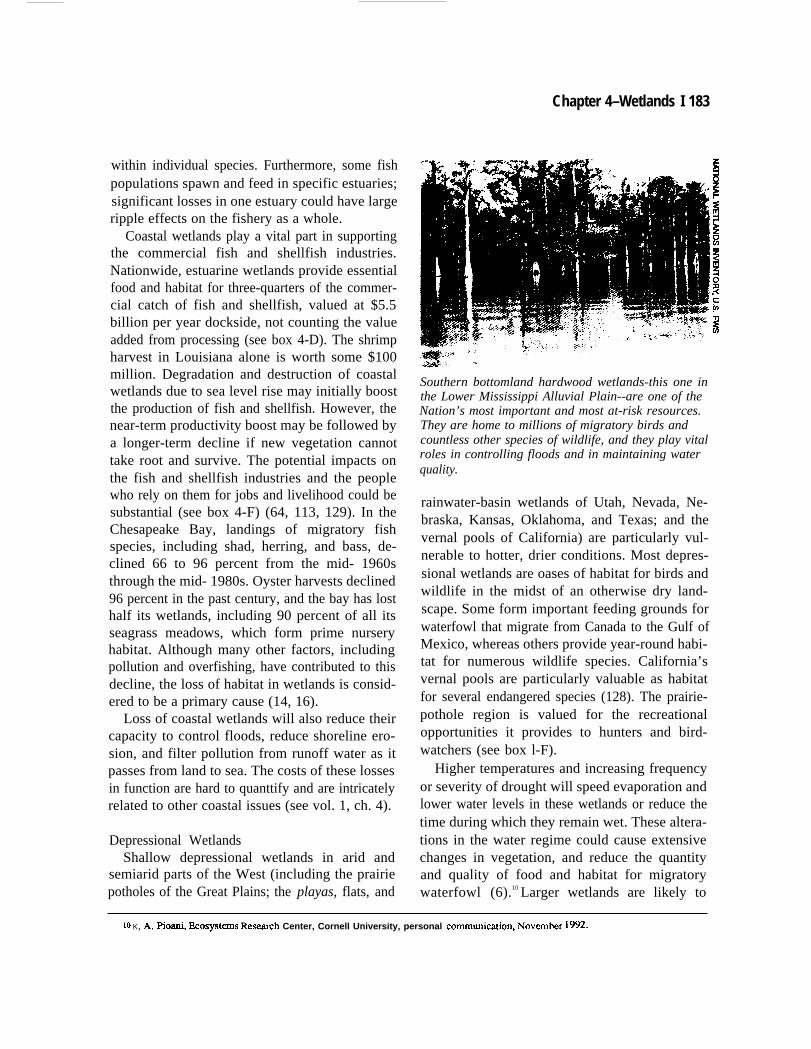
Chapter 4–Wetlands I 183
within individual species. Furthermore, some fishpopulations spawn and feed in specific estuaries;significant losses in one estuary could have largeripple effects on the fishery as a whole.
Coastal wetlands play a vital part in supportingthe commercial fish and shellfish industries.Nationwide, estuarine wetlands provide essentialfood and habitat for three-quarters of the commer-cial catch of fish and shellfish, valued at $5.5billion per year dockside, not counting the valueadded from processing (see box 4-D). The shrimpharvest in Louisiana alone is worth some $100million. Degradation and destruction of coastalwetlands due to sea level rise may initially boostthe production of fish and shellfish. However, thenear-term productivity boost may be followed bya longer-term decline if new vegetation cannottake root and survive. The potential impacts onthe fish and shellfish industries and the peoplewho rely on them for jobs and livelihood could besubstantial (see box 4-F) (64, 113, 129). In theChesapeake Bay, landings of migratory fishspecies, including shad, herring, and bass, de-clined 66 to 96 percent from the mid- 1960sthrough the mid- 1980s. Oyster harvests declined96 percent in the past century, and the bay has losthalf its wetlands, including 90 percent of all itsseagrass meadows, which form prime nurseryhabitat. Although many other factors, includingpollution and overfishing, have contributed to thisdecline, the loss of habitat in wetlands is consid-ered to be a primary cause (14, 16).
Loss of coastal wetlands will also reduce theircapacity to control floods, reduce shoreline ero-sion, and filter pollution from runoff water as itpasses from land to sea. The costs of these lossesin function are hard to quanttify and are intricatelyrelated to other coastal issues (see vol. 1, ch. 4).
Depressional WetlandsShallow depressional wetlands in arid and
semiarid parts of the West (including the prairiepotholes of the Great Plains; the playas, flats, and
Southern bottomland hardwood wetlands-this one inthe Lower Mississippi Alluvial Plain--are one of theNation’s most important and most at-risk resources.They are home to millions of migratory birds andcountless other species of wildlife, and they play vitalroles in controlling floods and in maintaining waterquality.
rainwater-basin wetlands of Utah, Nevada, Ne-braska, Kansas, Oklahoma, and Texas; and thevernal pools of California) are particularly vul-nerable to hotter, drier conditions. Most depres-sional wetlands are oases of habitat for birds andwildlife in the midst of an otherwise dry land-scape. Some form important feeding grounds forwaterfowl that migrate from Canada to the Gulf ofMexico, whereas others provide year-round habi-tat for numerous wildlife species. California’svernal pools are particularly valuable as habitatfor several endangered species (128). The prairie-pothole region is valued for the recreationalopportunities it provides to hunters and bird-watchers (see box l-F).
Higher temperatures and increasing frequencyor severity of drought will speed evaporation andlower water levels in these wetlands or reduce thetime during which they remain wet. These altera-tions in the water regime could cause extensivechanges in vegetation, and reduce the quantityand quality of food and habitat for migratorywaterfowl (6).10 Larger wetlands are likely to
10 K, A. pioti, Ikosystms Resmh Center, Cornell University, personal COIXIfIWiCatiOn, Novak IW.
184 I Preparing for an Uncertain Climate--Volume 2
better withstand the effects of drying and main-tain the range of diverse habitat conditions thatwill continue to support a wide range of species.Smaller ones will change the most under warmerand drier conditions; as they become shallower,they will become choked with cattails and othercover plants that will leave less open water forwaterfowl breeding. In addition, some smallerwetlands may convert from year-round to sea-sonal wetlands, which would significantly changetheir use as habitat. Spring precipitation maybeone of the most important factors in determiningthe degree to which smaller and semipermanentdepressional wetlands are affected by drierconditions. 11
Protection of prairie potholes was the impetusfor the passage of the Migratory Bird Hunting andConservation Stamp Act in 1937 (P.L. 94-215),which levied fees on hunters to support thepurchase of some pothole areas; these purchasessignaled the start of a national system of wildliferefuges (see ch. 5). Numerous laws and landacquisitions since then have sought to protect thewildlife and recreational values of the prairie-pothole region. However, competition for landand water resources may further increase underclimate change, particularly if climate changeleads to expansion of agriculture in the region (seevol. 1, ch. 6).
The ability of western depressional wetlands tosustain waterfowl and other species that rely onthem during climate change will depend in largepart on the Nation’s success in protecting themagainst other threats and restoring areas that havealready been damaged. The key to maintainingdepressional wetlands throughout the arid Westwill be to conserve water to help maintain watertables at their present levels, to find supplementalsupplies where possible, and to restore degradedor drained wetlands where possible. Other possi-ble conservation strategies include maintaining
existing wetlands, increasing protection of deeperareas that may provide better habitat and are morelikely to persist in dry years, and coordinating pro-tection of wetlands within regions so that if someare lost others in the general vicinity may remain.
Western Riparlan WetlandsRiparian areas in the arid West are also highly
vulnerable to the hotter and drier conditionspredicted for much of the interior West. Predictedincreases in temperatures and evaporation rates inthis region, combined with reduced rainfall dur-ing the growing season, could greatly reduce therunoff entering streams and rivers. Some small orseasonal streams and their associated wetlandscould disappear altogether.
Riparian wetlands in the West are highlyvalued for the habitat they provide to waterfowl,fish, and wildlife. Those habitats now compriseless than 1 percent of the western landscape, yetthey support a vast recreational industry includ-ing hunting, fishing, and boating. Riparian wet-lands are often the only forested areas in westernflatlands, and they are critical for breeding,hunting, and cover for many mammal and birdspecies that inhabit these areas. They offer lushgrazing grounds for deer and other wildlife andrange-fed cattle. USDA estimates that over 80percent of riparian habitat has been lost due tograzing and diverting water for irrigation andmunicipal uses (98). Climate change and increas-ing competition for scarce water resources couldaccelerate the loss of riparian habitat and couldlead to diminished wildlife and fish populations,degraded rangeland, and reduced recreationalvalues. 12 The potential for conflicts among differe-nt uses of riparian land and water is discussed inmore detail in box 4-H.
Like coastal wetlands, riparian wetlands havesome capacity to adapt to a changing climate bymigrating along river edges up- and downstream
11 ~id.
12 C. Sege@@ U.S. Fish and Wildlife Service, National Ecology Research Center, Ripatian ~d Wetland ~ology ~oJ~4 peno~communicator July 15, 1992.
as well as up- and down-slope to follow the water.However, in those areas subject to hotter anddrier conditions, rivers are likely to shrink, somigration will likely involve retreat rather thanexpansion.
TundraAlpine and arctic tundra peat lands with
water-saturated soils are highly vulnerable toclimate change. Warmer temperatures will allowthe permafrost layer, on which tundra relies forsustaining moisture, to thaw and drain.13 As theupper layers of permafrost dry, the tundra vegeta-tion and soils will start to decompose, releasingstored carbon into the air and potentially addingto the feedbacks that spur global warming (see ch.2). Permafrost melting and decomposition oftundra soils may also cause the surface to subside,which could affect the stability of roads andpipelines built on tundra. Where arctic tundra issituated near the coast, these processes may alsolead to increased loss of coastal land as frozenpeat melts and slumps into the sea.
Because tundra serves important and diversefunctions, its economic value is difficult to judge(see box 4-D). Along with the other northernsoils, the tundra sequesters approximately one-fifth of the world’s total soil carbon (44, 72, 80).Arctic tundra provides critical habitat and breed-ing grounds for migratory waterfowl, includingcertain geese, swans, and ducks, some of whichmigrate to the Arctic from as far away as theSouthern Hemisphere. Organic matter from tun-dra peat is an important food source for fresh-and saltwater fisheries. In Alaska, arctic tundraprovides habitat for the caribou, wolves, foxes,and waterfowl that contribute to the subsistenceof the indigenous human population (see ch. 1,box l-G).
Chapter 4–Wetlands I 185
Alpine and arctic tundra both have limitedcapacity to adapt to climate change. As tempera-tures warm, alpine tundra is likely to shrink aslower-altitude and lower-latitude edges dry. Spe-cies now found in alpine and arctic tundra areunlikely to adapt easily in dry areas where thepermafrost has been the primary means of main-taining moisture. As soon is it becomes warmer,it will become drier, and the tundra vegetationwill decline. Although large areas of relativelypristine arctic wetlands remain protected by theirisolation from many of the activities that haveharmed wetlands in the rest of the Nation, thisdoes not make them less vulnerable to the risksand impacts of climate change. Few policies otherthan successful efforts to slow greenhouse warm-ing are likely to stem the loss.
POLICY CONTEXT
9 The Challenge for PolicySince 1989, the Federal Government has em-
braced the policy goal of no net loss of wetlands,but steps to achieve it have not been fullyimplemented. The impetus for a no-net-losspolicy arose from the widespread perception thathistorical losses of wetlands due to humanactivities have reduced the ability of remainingwetlands to provide the numerous functions andproducts for which they are valued, and that fur-ther losses would threaten the integrity of wetlandsand the larger ecological systems in which theyare found. A policy aimed at achieving net gains,promoted initially in 1987 by the National Wet-lands Policy Forum (NWPF), received furtherendorsement in 1992 from the National ResearchCouncil (NRC), the policy-research branch of theNational Academy of Sciences (NAS), which
13 h ~~ sy5tem, Petirost ac~ as an impermeable layer between water on the soil surface (the active zone, where vegetation growsduring brief Summer thaws) and the soil layers below. When the permafrost melts, the barrier is broke% and water from the surface can thenseep into the lower layers, causing the active zone to drain and dry. Drying will likely be most severe in “cold desert’ areas of tundr% whereprecipitation is scarce but moisture has accumulated in the active zone over thousands of years because it was prevented from draining. Notall tundra has accumulated enough moisture to support wetlands, but in areas that do have pmt wetlands, those with a relatively thin permafrostlayer may be most vulnerable [o climate change.
186 I Preparing for an Uncertain Climate--Volume
recommended that 10 million acres of wetlandsbe restored by 2010 (68).
The no-net-loss policy does not prohibit someloss of wetlands to development or other uses ifthat loss cannot be avoided. What it does seek toensure is that the overall quantity and quality ofwetlands will remain stable. Efforts to restore andcreate wetlands must be undertaken on some sitesto compensate for degradation and losses else-where (88).
Climate change may make it more difficult tohalt the loss of wetlands and safeguard themultitude of functions and products they provide.This is particularly true in areas where wetlandsare surrounded by development, limiting theareas into which wetland plants and animals canmigrate. Changes in climate could cause far--reaching alterations in the complex ecologicaland hydrological systems that make up wetlands.For example, in the North Central States, in-creased temperatures and evaporation rates couldcause many prairie-pothole wetlands to shrink ordisappear, leading to further declines in already-diminished continental waterfowl populations(6). In the arid West, drier conditions combinedwith increased competition for water for humanconsumption and agricultural use could diminishthe riparian and depressional wetlands (thosealong rivers and in low-lying areas) that nowserve as habitat for diverse flora and fauna (84).Increased evaporation could also diminish waterflow through streams and rivers in the Northeastand reduce water levels in the Great Lakes,leading to diminished water quality and eutrophi-cation that could degrade wetlands. Rainfall mayincrease enough in the Southeast to offset theincreased evaporation rates that accompany in-creased temperatures, potentially expanding thesites where wetland vegetation could grow, butgains may be limited by existing land uses anddevelopment. In coastal areas, a 20-inch (0.5-meter)14 rise in sea level could inundate 35percent of coastal wetlands nationwide by 2100
2
(84, 73, 74, 91). These and other changes maypose an enormous challenge for Federal effortsaimed at preventing further loss of wetlands.
Yet the same changes in climate will makemaintenance of wetlands all the more important.Along coasts where climate change will likelylead to accelerated sea level rise, healthy wetlandscan help control coastal erosion and flooding (seevol. 1, ch. 4). In urban areas, large amounts ofwater-impermeable paved and built surfaces havelead to an increase in runoff during storms, whichcould become more frequent in some areas asclimate changes. Wetlands may help absorb andslow this runoff and prevent flooding. Wetlandsfilter water and improve water quality, which maybecome increasingly important in areas whereclimate change leads to drier conditions and thusto higher concentrations of pollutants in runoffand surface water (see vol. 1, ch. 5). Habitatprovided by wetlands harbors diverse species offish, waterfowl, invertebrates, and other wildlife;climate change may pose further threats to somespecies by eliminating habitat in some areas,making the remaining wetlands even more vital toefforts to protect endangered species (see ch. 5).
1 Wetland ManagementWhatever is done to address the problems
associated with wetland protection, restoration,and migration, those efforts will be more effectiveif the Nation addresses the problems caused byfragmentation-both of the landscape (see ch. 5)and of Federal agencies that oversee wetlands.Management decisions affecting wetlands aremade by many different agencies, authorized bypiecemeal legislation, often with conflicting goalsor criteria for decisionmaking. All of the manyscientists and managers consulted by the Office ofTechnology Assessment (OTA) emphasized theneed for more integrated, coordinated manage-ment, planning, and decisionmaking for wet-
14 ~ conv~ iDCkS to meters, multiply by 0.02S.
Chapter 4–Wetlands I 187
lands. Three aspects of coordination demandattention now:
clarifying the goals for which wetlands aremanaged and amending or eliminating Fed-eral programs that conflict with those goals;developing and applying a method for iden-tifying which wetlands should receive thehighest priority for preservation and restora-tion within particular watersheds; andusing approaches that would coordinate man-agement across resources and across water-sheds or ecosystems (see ch. 1).
Integrated management should include inten-sive and broad-based monitoring to assess therates at which features of wetlands are beingaffected by climate change, to evaluate theeffectiveness of efforts to protect and restorewetlands, and to gauge the impacts of thedegradation and loss of wetlands on the functionsand products they provide. Monitoring is essen-tial for identifying where limited funds should bedirected.
Wetlands cannot be managed effectively inisolation. Many of the functions and products thatmake wetlands important-wildlife and fisherieshabitat, flood control, biodiversity, and so on—depend on the integrity of a broad system ofwetlands and water resources. Further, as de-scribed above, wetlands within watersheds areoften linked by surface- or groundwater flows, sodisturbance to one may affect others. For exam-ple, water diversions upstream of a wetland candegrade or destroy the wetland’s vegetation andhabitat quality by altering water and sedimentflows, and overuse of groundwater for municipalor agricultural purposes may disturb wetlandsthroughout a given aquifer.
By considering wetlands along with the rangeof pressures on other resources, planners andmanagers can make better decisions about themost ‘‘valuable’ areas to be protected and
restored in a given region. With the threat ofclimate change and the possibility that the charac-teristics of wetlands may change, a coordinatedstrategy for maintaining the functions and prod-ucts of wetlands becomes all the more important.
The options presented in this chapter are basedon maintaining the national commitment to pro-tect the existing net quantity and quality ofwetlands and, where wetlands have severelydiminished or been degraded, to restore them. Tomaintain that commitment in the face of climatechange, policy makers should focus on these fourobjectives, discussed in the following section:
1.
2.
3.
4.
Protect remaining wetlands. Mitigate therate of loss by strengthening the protectionand maintenance of existing wetlands, toincrease the chances that wetlands willremain in locations from where they canmigrate or adapt.Restore what has been lost. Encouragerestoration of wetlands to compensate forpast and expected future losses.Facilitate adaptive migration. Prepare forand assist in the migration of wetland spe-cies, which may be needed under a changingclimate and accelerated sea level rise.Improve coordinated management andmonitoring.
15 Address the problems Of legal
and institutional fragmentation. The ab-sence of clearly stated authority for protect-ing wetlands, inadequate criteria for deci-sionmaking and lack of a coordinated effortto monitor and evaluate the quantity andquality of wetlands and the water systemsthat support them must be evaluated.
9 The Existing Regulatory FrameworkGoverning Wetlands16
Regulation of wetlands has increased over thepast two decades with the growing recognition of
15 COO*M management of wetlands cannot easily be accomplished without also considering management of water supplies (see vol.1, C1l. 5).
16 ~ don ~w~ &vfly on ~~n~ pub~h~ fi refer-s 95, ]@ 112 ~ on a ~nw paper p~pared for OTA (120).
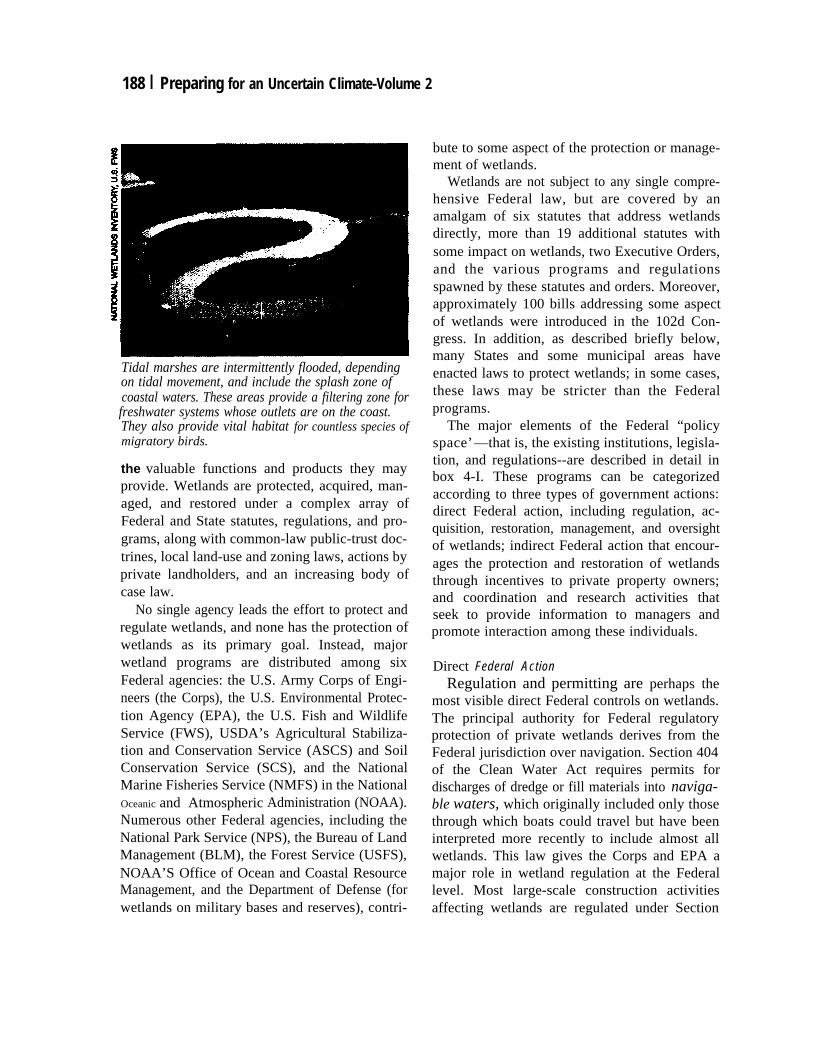
188 I Preparing for an Uncertain Climate-Volume 2
Tidal marshes are intermittently flooded, dependingon tidal movement, and include the splash zone ofcoastal waters. These areas provide a filtering zone forfreshwater systems whose outlets are on the coast.They also provide vital habitat for countless species ofmigratory birds.
the valuable functions and products they mayprovide. Wetlands are protected, acquired, man-aged, and restored under a complex array ofFederal and State statutes, regulations, and pro-grams, along with common-law public-trust doc-trines, local land-use and zoning laws, actions byprivate landholders, and an increasing body ofcase law.
No single agency leads the effort to protect andregulate wetlands, and none has the protection ofwetlands as its primary goal. Instead, majorwetland programs are distributed among sixFederal agencies: the U.S. Army Corps of Engi-neers (the Corps), the U.S. Environmental Protec-tion Agency (EPA), the U.S. Fish and WildlifeService (FWS), USDA’s Agricultural Stabiliza-tion and Conservation Service (ASCS) and SoilConservation Service (SCS), and the NationalMarine Fisheries Service (NMFS) in the NationalOceanic and Atmospheric Administration (NOAA).Numerous other Federal agencies, including theNational Park Service (NPS), the Bureau of LandManagement (BLM), the Forest Service (USFS),NOAA’S Office of Ocean and Coastal ResourceManagement, and the Department of Defense (forwetlands on military bases and reserves), contri-
bute to some aspect of the protection or manage-ment of wetlands.
Wetlands are not subject to any single compre-hensive Federal law, but are covered by anamalgam of six statutes that address wetlandsdirectly, more than 19 additional statutes withsome impact on wetlands, two Executive Orders,and the various programs and regulationsspawned by these statutes and orders. Moreover,approximately 100 bills addressing some aspectof wetlands were introduced in the 102d Con-gress. In addition, as described briefly below,many States and some municipal areas haveenacted laws to protect wetlands; in some cases,these laws may be stricter than the Federalprograms.
The major elements of the Federal “policyspace’—that is, the existing institutions, legisla-tion, and regulations--are described in detail inbox 4-I. These programs can be categorizedaccording to three types of government actions:direct Federal action, including regulation, ac-quisition, restoration, management, and oversightof wetlands; indirect Federal action that encour-ages the protection and restoration of wetlandsthrough incentives to private property owners;and coordination and research activities thatseek to provide information to managers andpromote interaction among these individuals.
Direct Federal ActionRegulation and permitting are perhaps the
most visible direct Federal controls on wetlands.The principal authority for Federal regulatoryprotection of private wetlands derives from theFederal jurisdiction over navigation. Section 404of the Clean Water Act requires permits fordischarges of dredge or fill materials into naviga-ble waters, which originally included only thosethrough which boats could travel but have beeninterpreted more recently to include almost allwetlands. This law gives the Corps and EPA amajor role in wetland regulation at the Federallevel. Most large-scale construction activitiesaffecting wetlands are regulated under Section
Chapter 4–Wetlands 189
Box 44—The Wetlands Policy Space
Regulatory activities and permitting programs--The Army C orps of Engineers, through Section 10 of theRivers and Harbors Act of 1899, was given regulation and oversight authority of a permit program covering anydredge and fill activities affecting navigable waters in the United States. “Navigable waters” has been broadlydefined by the Corps to include coastal and freshwater wetlands,1 and starting in 1968, the Corps expanded thepermit criteria beyond the original assessment of impacts on navigation to include assessments of impacts on fishand wildlife, conservation, pollution, aesthetics, ecology, flood-damage protection, recreation, water supply andquality, and others.
Although the Rivers and Harbors Act set forth the original regulatory authority, Section404 of the FederalWater Pollution Control Act (P.L. 92-500) of 1972, as amended by the Clean WaterAct of1977 (P.L. 92-217), hasbecome the principal Federal program that regulates activities in wetlands. Section 404 requires that anylandowner proposing to undertake activities that would result in the discharge of dredged material into U.S. waters,including wetlands, must first apply for and obtain a permit from the Corps. The application is reviewed inconsultation with Fish and Wildlife Service (FWS), the Environmental Protection Agency (ERA), the NationalMarine Fisheries Service (NMFS), and the State where the activity is to take place. Permit applications areevaluated according to the extent of public and private need for the proposed project, whether alternative locationsor less environmentally damaging methods could be used to achieve the stated project goals and result in lessenvironmental impact, and the significance of the environmental impact the project may have.
Despite the Corps' broad interpretation of the extent of waters covered by permit requirements, the purviewof the Section 404 program is limited in several ways. Numerous activities are exempted from Section 404jurisdiction, including normal farming, forestry, ranching activities that do not convert natural wetlands to anewuse (e.g., cropland), maintenance of flood-control structures, construction of bridges and dams, and maintenanceof farm ponds, irrigation systems, and drainage ditches. Other activities fall under “general permits," whichauthorize activities expected to have minor impacts without the need for individual permits, as long as specifiedprocedures for minimizing impacts are followed. On the basis of these limitations, the General Accounting Office(GAO) estimates that Section 404 "regulates only about 20 percent of the activities that destroy wetIands”(112).
Although States have the opportunity to assume primary responsibility for administering parts of the Section404 program, only Michigan has done so. Many States are using their authorities under Section 401 to modify ordeny Section 404 permits as a way to further protect wetlands under the Clean Water Act
Land acquisition--Federai legislation to acquire wetlands dates back to the Migratory Bird Hunting andConservation Stamp Act (P.L. 94-215), passed in 1934. The act requires that waterfowl hunters purchase “duckstamps”; proceeds from stamp sales are placed into the Migratory Bird Conservation Fund to be used to acquirehabitat for migratory birds. Since the inception of the program, more than $240 million worth of stamps have been
1 ln1975,theCorps issued regulations defining "navigable waters’’to include the following:"coastal waters,wetlands, mudflats, swamps, and similar areas; freshwater lakes, rivers, and streams that are used, were used inthepast, or are susceptible to use to transport interstate commerce, including all tributaries to these waters; Interstatewaters; certain specified intrastate waters, the pollution of which would affect interstate commerce; and freshwaterwetlands, including marshes, shallows, swamps and similar areas that are contiguous or adjacent to the abovedescribed lakes, rivers and streams, and that are periodically inundated and normally characterized by theprevalence of vegetation that requires saturated soil conditions for growth and reproduction” (34).
I
190 Preparing for an Uncertain Climate-Volume 2
Box 44-The Wetlands Policy Space--(Continued)
sold and 2.5 million acres (about 1 million hectares)2of habitat purchased Although some habitat purchases havebeen upland nesting areas, most acquisitions have targeted wetlands, particularly those in the prairie-potholeregion of the North Central United States. In addition to purchasing land, the program seeks to preserve additionalwetlands by acquiring perpetual easements under which landowners exchange their rights to drain, fill, burn, orlevel wetlands for a one-time or annual payment. Although most easement programs have targeted agriculturalland, the Migratory Bird Hunting and Conservation Stamp Act authorizes the use of easements more generally.By the end of FY 1989, the program had spent approximately $49 million to obtain easements on 1.2 million acresof wetlands in the prairie-pothole region.
A more recent land-acquisition statute is the North American Wetlands Conservation Act of 1989 (P.L.101-233), which established a cooperative effort between the United States, and Mexico aimed atconserving or restoring 6 million acres of wetlands in the prairie-pothole region to help revitalize waterfowlpopulations. This act authorized appropriations of up to $15 million for purchase of, and easements on, wetlandsthat will accomplish the goal. Although a substantial portion of the money is to be spent on projects in Canada andMexico, some 25 to 50 percent of the total may be spent in the United States. Some funds are to be raised by excisetaxes on ammunition, sporting arms, and archery equipment, as well as by fines for violations of the Migratory BirdHunting and Conservation Stamp Act.
Various other programs support acquisition of wetlands.The Land and Water Conservation Fund Act of 1965(LAWCON; P.L. 88-578) initiated a fund, bankrolled by fees from offshore drilling, to be used for the purchase ofnatural areas, including wetlands. Amendments in 1986added explicit authorization for LAWCON funds to be usedto purchase wetlands, and further stipulated that States be required to consider wetlands in their StateComprehensive Outdoor Recreation Plans, which they must complete to qualify for grants from the LAWCON pool.FWS has used land acquisitions under this program to add to the National Wildlife Refuge System and to acquirecrucial habitat areas for protecting endangered species. Critics charge that in recent years, LAWCONfunds havebeen underutilized and have not adequately met the mandate to acquire natural areas.
The Emergency Wetlands Resources Act of 1986 (P.L. 99-845) called for the development of a NationalWetlands Priority Conservation Plan to direct the Federal Government's various wetland-protection efforts towardthe most valuable areas. The plan was developed by FWS and issued In 1989. The act also authorized funds toacquire wetlands consistent with the plan, and provided various revenue mechanisms to support wetland-protection and -acquisition activities.
Several Federal programs support wetland preservation through easements. The Water Bank Act (P.L.91-559), passed in 1970, established a fund to help preserve, maintain, and restore wetlands. Administered bythe U.S. Department of Agriculture’s (USDA’s) Soil Conservation Service (SCS), water-bank funds are used*negotiate easements from farms who agree not to drain, fill, burn, level, or otherwise destroy wetlands oradjacent upland areas. Farmers receive annual payments ranging from $5 to $55 per acreforthe duration of the10-year agreement (subject to review after the fourth year), after which the contracts maybe renewed. The WaterBank (Program has concentrated on acquiring easements in the prairie-pothoie region, where it had nearly 550,000acres enrolled as of July 1991, at an annual cost of $8 million. The Conservation Reserve and Wetlands ReservePrograms described in the next section, also negotiate easements for the protection of wetlands.
2To convert acres to hectares, multlply by 0.4053 These figures are from reference 95. According to reference 112, the program had spent $102 million to
acqulre fee-simple title to 584,000 acres of wetlands in the prairie-pothole region under the Small WetlandsAcquisition Program by the end of FY 1989.
Chapter 4–Wetlands I 191
Restoration—Perhaps because more than half of the Nation’s wetlands have already been converted toother uses, particularly agricultural, recent policy initiatives have expanded the wetland-protection mandatebeyond the early framework of preservation and regulation to include restoration. Several programs attemptrestoration of agricultural land. Under the Conservation Reserve Program (CRP), authorized by the Food andSecurity Act of 1985 (P.L. 99-198), USDA can enter into contracts to pay farmers to remove highly erodible orenvironmentally valuable lands from production for 10 to 15 years in exchange for annual payments. A provisionmaking farmed wetlands eligible for the conservation reserve was added in 1989. As of July 1991, nearly 34.5million acres of farmland were enrolled in the CRP. USDA’s Soil Conservation Service (SCS) estimates thatapproximately 410,000 acres were wetlands, for which rental payments were around $20.1 million annually. Thewetlands Reserve Program (WRP), established by the Food, Agriculture, Conservation, and Trade Act of 1990(P.L. 101-824), was established with the goal of restoring up to 1 million acres of wetlands that had been convertedto agriculture. USDA’s Agricultural Stabilization and Conservation Service (ASCS) makes annual payments foreasement under which the farmer agrees to restore the wetlands. In addition, ASCS will provide up to 75 percentof the cost of restoring once-farmed wetlands placed under permanent easement and 50 percent of the cost ofrestoration for wetlands under 30-year easements.
The mitigation provisions of Section 404 of the Clean Water Act require that applicants for Section 404 permitsoffset unavoidable wetland impacts through the restoration or creation of wetlands. One party (often a governmentagency) restores or creates wetlands, t hus establishing marketable credits t hat are held in a bank. The bank canthen arrange the sale of credits to Section 404 permit applicants to offset damage to wetlands that may be causedby the permitted activit y, often at a ratio greater than one-to-one. Achieving no net loss of wetlands requires greaterthan 100 percent replacement to compensate for areas where restoration does not succeed and for the time lagbetween restoration activities and the return of some measure of function. The permit applicant must purchaseenough credit to offset potential wetland losses More t he permitted project begins and wetlands are destroyed.Under current policies, mitigation banking can be used only where loss of wetlands cannot be avoided and wherethere is no suitable site for restoration on the same property. If key areas for wetland migration are identifiedthrough the National Wetlands Priority Plan (described below), a wetland banking program could attempt to targetthose areas and allow mitigation credits for coastal development.
Other programs that support the restoration of wetlands are the Federal Aid in Wildlife Restoration Act of 1937(P.L. 99-398), commonly known as the Pittman-Robertson Act and the Federal Aid in Fish Restoration Act of 1950(P.L. 100-448), the Dingel l-Johnson Act. Through the Pittman-Robertson Act, FWS provides grants to States tocover up to 75 percent of the costs of acquiring, restoring, and maintaining wildlife areas, including wetlands. Theact is funded by Federal excise tax on firearm and ammunition sales. The Dingell-Johnson Act uses Federal excisetaxes on bait and fishing equipment to fund State projects up to 75 percent for “comprehensive fish and wildliferesource plans,” including maintenance and restoration of wetland areas that provide needed habitat.
Coordinated planning and management--Because responsibility y for wetlands is divided among numerouslaws, programs, and agencies, several policies have been put in place to coordinate planning and management.Some of these cover wetlands specifically, and others address wetlands within the larger context of naturalresources such as water resources, coastal areas, and wildlife and endangered species habitat.
At least four laws and one Executive Order explicitly call for coordination among wetlands-planning and-management agencies. The Emergency Wetlands Resources Act of 1988 (P.L. 99-845) seeks to increasecooperation among the numerous agencies at the Federal, State, local, and private levels that protect, manage,and conserve wetlands. The act calls for FWS to develop a National wetlands Priority Conservation Plan, whichwould help decision makers at all levels of government identify the most valuable wetlands for protection. The act
(Continued on next page)
192 I Preparing for an Uncertain Climate-Volume 2
Box 44–The Wetlands Policy Space-(Continued)
also requires that State Comprehensive Outdoor Recreation Plans address wetlands, that FWS complete itswetland inventory mapping by 1988 (24), and t hat FWS conduct a study of how Federal programs affect wetlands.The Water Resources Development Act of 1990 (P.L. 101-640) embodies the call for no net loss of the Nation’sremaining wetlands as part of the Army Corps of Engineers water-resources-development program. The actmandated that the Corps develop, in consultation with EPA, FWS, and other interested agencies, an action planfor achieving the no-net-loss goal for wetlands. The Coastal Wetlands Planning, Protection, and Restoration Act(P.L. 101 -646) established a planning process for protecting and restoring Louisiana coastal wetlands, and hasbeen used to support various restoration projects. Executive Order 11990, Protection of Wetlands, was issued in1977 to direct all Federal agencies to take action in carrying out their individual activities to minimize destruction,loss, and degradation of wetlands and to preserve and enhance wetlands and wetland functions and products.
Other programs that call for coordinated planning and management of wetlands as part of a larger set ofnatural resource issues include the Coastal Zone Management Act (P.L. 92-583), described in more detail underincentives (below and in vol. 1, ch. 4), the Fish and Wildlife Coordination Act (P.L. 89-72), the Endangered SpeciesAct (P.L. 93-205), the National Environmental Policy Act (P.L. 91-190), and Executive Order 11988 (Flood PlainManagement). The Fish and Wildlife Coordination Act requires that wildlife management be considered equal toother purposes in the construction of water-development projects, and authorizes FWS and NMFS to evaluate thepotential impacts on fish and wildlife of Federal construction activities and projects being evaluated for Section 404permits. The National Environmental Policy Act calls for a review of the environmental impacts of all proposedFederal projects, such as road construction and dam building, some of which pose significant threats to wetlands.The Endangered Species Act sets forth a procedure for listing threatened and endangered species and fordesignating the areas they need as habitat. Federal agencies are prohibited from undertaking or subsidizing anyprojects that will destroy habitat of the listed species. Because one-third of all listed endangered species dependon wetlands, this prohibition prevents some development in wetlands. Executive Order 11988 requires that allFederal agencies avoid supporting development in floodplain areas, either directly or indirectly; because manywetlands lie in floodplains, this directive could help protect wetlands.
Incentives and disincentives-Approximately 87 percent of the loss of wetlands in the past decade isattributed to agricultural conversions (108). Various Federal programs-including tax incentives, low-interestFarmers Home Administration (FmHA) loans, technical assistance, and commodity and price-supportprogram--during the 1950s through the 1970s either directly or indirectly encouraged conversion of wetlands toagricultural uses. Thus, it is not surprising that many of the incentive and disincentive programs now seeking toprotect and restore wetlands target agricultural lands. Furthermore, incentive and disincentive programs are inmany cases the Federal Government’s only chance to encourage conservation of the 74 percent of the Nation’sremaining wetlands that are privately owned. The CRP and t he WRP, described above, offer direct payments tofarmers as an incentive to set aside and restore former wetlands.
The Swampbuster program, initiated by the Food Security Act of 1985 (P.L. 99-198) and expanded by theFood, Agriculture, Conservation, and Trade Act of 1990 (P.L. 101-508), hinges on disincentives. As originallywritten, the Swampbuster program prohibited subsidies only if wetlands were converted (e.g., drained, filled,plowed, and burned)-after December 23, 1986-directly for the purposes of growing commodity crops (cropsubsidies are explained in detail in vol. 1, ch. 6). This approach left a large loophole: farmers did not have tocultivate wetlands directly in a subsidized crop in order to boost their commodity acreage; rather, they could plantthe wetland in an unsubsidized crop, such as forage, to free up other land to increase acreage for subsidizedcommodities. The 1990 amendments strengthened the program by calling for denial of crop subsidies ifconversions of wetlands were used to boost acreage in commodity crops, even if the wetlands were not directlycultivated (1 12). Farmers caught in violation of Swampbuster regulations lose eligibility for all Federal farm
Chapter 4–Wetlands |193
benefits, including commodity programs, crop insurance, and disaster payments, for that year and all subsequentyears. As of August 1991, ASCS had withheld approximately $3.7 million in benefits because of Swampbusterviolations (112).
Although agriculture has been a major focus of incentive and disincentive programs, legislation has soughtto reduce or eliminate incentives for conversion of wetlands in other areas as well. The Coastal Barrier ResourcesAct (COBRA; P.L. 100-707) prohibits Federal expenditures or financial assistance (in the form of loans, grants,guarantees, insurance, payments, rebates, subsidies, and so on) to be used for development of coastal barrierislands. The act aims to reduce harm to human life, property, and natural resources, and because many coastalbarriers are accompanied by wetlands, the withdrawal of Federal incentives to development may result in theprotection of coastal wetlands. First established in 1982, the program was considerably expanded by 1990amendments; the approach it espouses-withholding Federal subsidies-is now widely considered to be a goodway to achieve environmental protection at low cost.
The Coastal Zone Management (CZM) Act of 1972 (P.L. 92-583, as amended) was designed to protect,restore, and develop coastal-zone resources and to encourage States to address ecological and aesthetic values,along with economic considerations, in managing their coastal areas. The CZM Act set forth a program in whichStates develop CZM plans according to certain guidelines imposed by the Federal Government. Because therequirements for CZM plans explicitly mandate the protection of ecological values of coastal resources (whichinclude wetlands), and requirements for the plans already cover issues such as beach protection and shorelineerosion, the CZM program offers an appropriate mechanism through which the Federal Government couldencourage the adoption of setbacks, which could allow wetlands room to migrate inland as sea level rises. (Fora more detailed discussion, see vol. 1, ch. 4.)
An indirect incentive for wetland conversion that is being reined in is the National Flood Plain InsuranceProgram (NFIP). Established in 1968 by the National Flood Insurance Act (P.L. 90-448), the intent of the programwas to encourage sound development policies in flood-prone areas. The act sought to accomplish this by requiringthat communities develop and implement plans to regulate construction in flood plains in exchange for eligibilityfor Federal disaster-relief funds. Although the intent was to minimize floodplain development (and many wetlandsoccur in coastal and inland floodplains), the effect was sometimes to encourage development by providingsubsidized insurance. The Federal Emergency Management Agency (FEMA), which administers the program, hascalled for stricter regulations of development in t he most flood-prone areas. (See vol. 1, ch. 4, for more informationabout flood insurance and other emergency-assistance programs.)
Research, inventory, and monitoring-Research on and monitoring of wetlands is conducted by severaldifferent Federal agencies under various programs, as well as by researchers in land-grant and sea-grantinstitutions, private institutions, and conservation organizations. Over the past two decades, long-term researchand monitoring of wetlands has been conducted through programs such as FWS's National Wetlands Inventoryand National wetlands Research Center; the National Science Foundation’s long-Term Ecological Research(LTER) and Land Margin Ecological Research (LMER) programs; EPA’s office of Research and Development andWetlands Research Program; the National Oceanic and Atmospheric Administration’s National EstuarineResearch Reserve System, National Estuary Inventory, Estuarine Habitat Program, and sea level monitoring; theCorps’ Waterways Experiment Station, Wetlands Research Program, and Dredged Materials Program; USDA’sNational Resource Inventory (conducted by SCS); various water- and weather-monitoring programs carried outby the U.S. Geological Survey and the National Weather Service; and others. New efforts include FWS’s GapAnalysis Project (GAP) and EPA’s Environmental Monitoring and Assessment Program (EMAP), which aredescribed in chapter 5.
SOURCES: U.S. Congress, Office of Technology Assessment, Wetian& Their Use andl?egulation, OTA-O-20S (Washington, DC: U.S.Government Printing Office, March 19S4); D.E. Willard et al., “Wetland Vulnerabilities to Climate Change,” contractor paper prepared forthe Offioe of Technology Assessment, August 1992; U.S. General Accounting Office (GAO), W4#ands OWtiw: Federal end StatePoh’c%s, Legk/at/on, and Programs, GAO/RCEM2-79W (Washington, DC: U.S. GAO, November 1991).
194 I Preparing for an Uncertain Climate--Volume 2
404; many normal, ongoing agriculture andforestry practices are specifically exempted. Theprogram does not cover draining of wetlandsunless the activity involves a discharge, nor doesit explicitly cover isolated wetlands (i.e., nonnav-igable ones) unless there is a connection tointerstate commerce (e.g., use by migratory wa-terfowl). overall, the program protects coastal,and particularly tidal, wetlands relatively well,but the exemptions exclude from coverage activi-ties responsible for approximately 80 percent ofthe destruction of wetlands (1 12).
Federal acquisition of wetlands deemed par-ticularly valuable for wildlife is done throughoutright purchase or through the establishment ofeasements, as authorized by legislation includingthe Migratory Bird Hunting and ConservationStamp Act (also referred to as the Duck StampAct), the Emergency Wetlands Resources Act of1986 (P.L. 99-645), and other laws related to theNational Wildlife Refuge System. The NationalWildlife Refuges now contain some 30 millionacres of wetlands. Smaller acquisitions have beenmade through the National Estuarine ResearchReserve System (NERRS), which now holds425,000 acres of estuarine wetlands and adjacentwaters and uplands, and the Marine SanctuariesProgram, which contains some wetlands alongwith open waters in eight sanctuaries. Additionalwetlands have been acquired as part of areaspurchased for parks or designated as wild andscenic rivers or wilderness areas (see ch. 5).
Restoration and management of wetlands arecarried out through diverse programs. The CoastalWetlands Planning, Protection, and RestorationAct (P.L. 101-646), passed in 1990, established arestoration cost-sharing program open to coastalStates, with a particular--but not exclusive-emphasis on restoring coastal wetlands inLouisiana. NOW’S Damage Assessment andRestoration Program conducts habitat restorationand research in coastal wetlands that have beenseverely contaminated. The Conservation Re-serve and Wetlands Reserve Programs, estab-lished by Title XII of the Food Security Act of
1985 (P.L. 99-198) and the Food, Agriculture,Conservation and Trade Act of 1990 (P.L. 101-624) both allow USDA to enter into contractswith farmers to set aside and pay up to 50 to 75percent of the cost of restoration. Ongoingprograms conducted by the Army Corps ofEngineers, which is responsible for constructingand maintaining dams, flood-control structures,and navigable rivers and harbors, have given theagency a role in affecting wetlands throughengineering techniques such as sedimentationcontrol and use of dredged materials to create orrestore wetlands.
Indirect Federal ActionVarious incentive programs encourage wetland
protection and restoration, and some disincen-tives have been established to discourage activi-ties that degrade or destroy wetlands. The WaterBank Act (P.L. 91-559) provides payments tofarmers as an incentive to refrain from drainingwetlands important to migratory waterfowl. The“Swampbuster” provision of the Food SecurityAct of 1985 withdraws Federal benefits (i.e., cropsubsidies and disaster insurance) from farmerswho drain wetlands. The Coastal Barrier Re-sources Act (COBRA; P.L. 100-707) denies suchbenefits as flood insurance and infrastructuresupport to development projects that would altercoastal barrier islands to the point where theywould be unable to provide certain fictions,such as erosion control. The Tax Reform Act of1986 (P.L. 99-514) disallowed deductions forfarm expenses incurred in draining wetlands (e.g.,by constructing drainage ditches).
Coordination and ResearchAt least four laws and one Executive Order
explicitly call for coordination among agenciesresponsible for wetland planning and manage-ment, and at least seven agencies plus numerousprivate and conservation organizations conductresearch on and limited surveys of wetlands. The“Coordinated Planning and Management” and“Research, Inventory, and Monitoring” sections
in box 4-I describe these programs. Despite theseand other programs, however, no coordinatedlong-term Federal effort tracks the overall qualityof wetlands nationwide.
State, Local, and Private ProgramsIn addition to the many Federal programs,
States, municipalities, and private conservationorganizations also share responsibilities for pro-tecting wetlands. States and municipalities play amajor role in regulation through their implemen-tation of land-use controls and plannin g. Loca1land-use efforts, such as storm-water manage-ment and setbacks (see vol. 1, ch. 4) fromwetlands and adjacent areas, can be effective inmaintaining wetlands and their functions. ManyStates have also adopted various measures thataddress coastal, inland, or all wetlands withintheir boundaries, either specifically or in thecontext of water-quality control and broadermandates to protect natural areas (see table 4-2).
State and local parks and refuges are key topreserving the natural values of wetlands (seech. 5). Private conservation groups such as TheNature Conservancy, the Audubon Society, andDucks Unlimited, in addition to numerous re-gional and local land trusts, join the effort toprotect and maintain wetlands.
Because many different organizations at alllevels of government, along with private agen-cies, conduct programs that affect wetlands, anyFederal efforts to respond to the impacts ofclimate change on wetlands must recognize andinteract with the full range of programs. In manycases, State and local agencies have the ability toform partnerships with Federal agencies to ac-complish things that Federal agencies by them-selves cannot.
POLICY OPTIONSOTA has identified many actions that the
Federal Government could take to help protectexisting wetlands, restore degraded areas, facili-tate migration, and promote coordinated manage-
Chapter 4-Wetlands I 195
ment and monitoring. These actions, summarizedin table 4-3, run the gamut from incrementalchanges in existing programs to major policyrevisions or additions. Many of the strategies areinterconnected, comprising different approachesfor accomplishing the same goal. To cope mosteffectively with the potential impacts of climatechange on wetlands, the best approach would beto undertake the strategies together. A specific setof options, based on measures that are particularlyfeasible or urgent and on opportunities that mayarise in upcoming legislative reauthorizations,should be pursued. Those options are suggested inthe final section of this chapter, “First Steps.”
9 Protect Existing WetlandsMinimizing the current rate of loss should be
the first priority of any comprehensive plan tohelp wetlands adapt to climate change. As notedabove, the Nation has already lost more than halfits wetlands. Maintaining what is left is a neces-sary first step to ensure that some wetlands willpersist regardless of the rate and severity ofclimate change. An active protection strategy willyield benefits even if climate change proceedsmore slowly or less severely than predicted. Thegoal of protecting existing wetlands has receivedwidespread and bipartisan support and, despitethe difficulties in achieving it thus far, that goalshould remain. Climate change only makes pro-tection efforts more urgent.
Direct Federal ActionOption 4-1: Implement and oversee the no-net-
10SS policy. The no-net-loss policy has not yetbeen incorporated into the legal and regulatoryframework in inexplicit and accountable way. In1991, the Administration issued a plan for pro-tecting wetlands that would include strengtheningacquisition programs, revising the wetland-delineation manual, and improving regulation ofwetlands under Section 404 of the Clean WaterAct (25, 112). Although a few of the specificprovisions of the plan were implemented, many ofthe more significant changes were not, due in
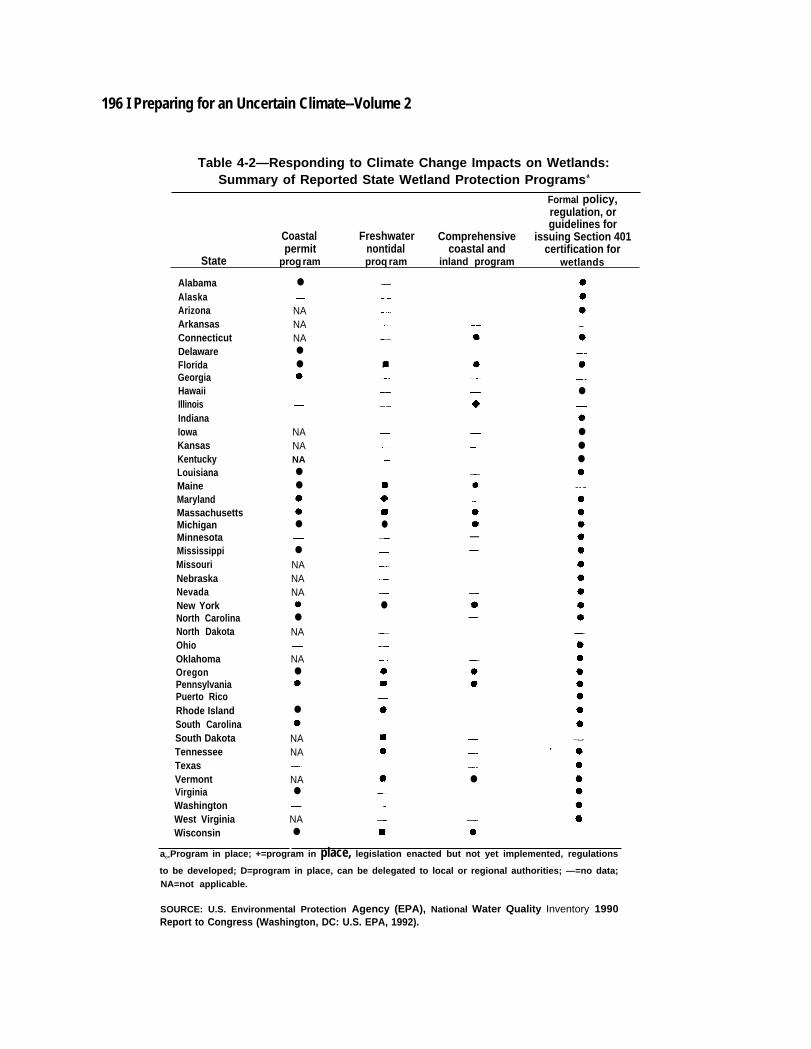
196 I Preparing for an Uncertain Climate--Volume 2
Table 4-2—Responding to Climate Change Impacts on Wetlands:Summary of Reported State Wetland Protection Programsa
Formal policy,regulation, orguidelines for
Coastal Freshwater Comprehensive issuing Section 401permit nontidal coastal and certification for
State program proq ram inland program wetlands
AlabamaAlaskaArizonaArkansasConnecticutDelawareFloridaGeorgiaHawaiiIllinoisIndianaIowaKansasKentuckyLouisianaMaineMarylandMassachusettsMichiganMinnesotaMississippiMissouriNebraskaNevadaNew YorkNorth CarolinaNorth DakotaOhioOklahomaOregonPennsylvaniaPuerto RicoRhode IslandSouth CarolinaSouth DakotaTennesseeTexasVermontVirginiaWashingtonWest VirginiaWisconsin
● ——NANANA●
●
9
——— —
*—*
—
—
— —●— — —
+———
— — —8●
●
●
☛
NANANA●
●
*8●
————
—*8
+8●
—*48——
—●
NANANAo●
NA
—————●
�
—9—
——NA●
9
——*m
—●
9
NANA
88
——
—NA●
— —●
�
�
——NA●
—
ao=Program in place; +=program in place, legislation enacted but not yet implemented, regulations
to be developed; D=program in place, can be delegated to local or regional authorities; —=no data;NA=not applicable.
SOURCE: U.S. Environmental Protection Agency (EPA), National Water Quality Inventory 1990Report to Congress (Washington, DC: U.S. EPA, 1992).
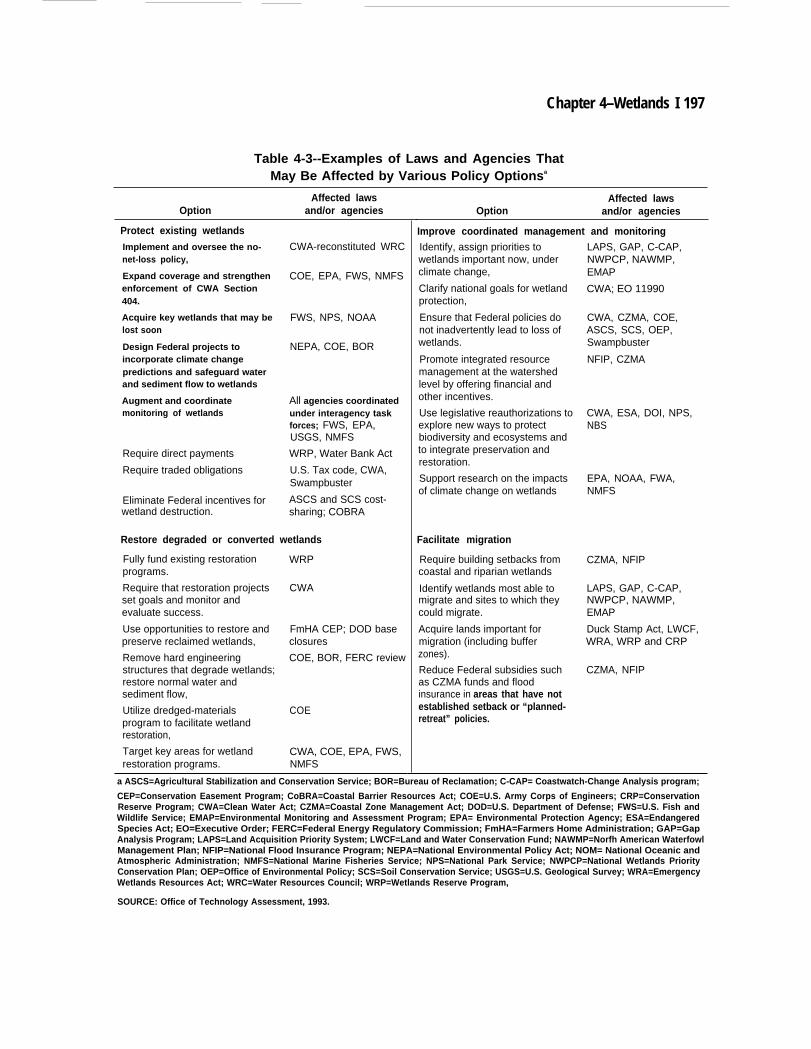
Chapter 4–Wetlands I 197
Table 4-3--Examples of Laws and Agencies ThatMay Be Affected by Various Policy Optionsa
Affected lawsOption and/or agencies
Protect existing wetlands
Implement and oversee the no-net-loss policy,
Expand coverage and strengthenenforcement of CWA Section404.
Acquire key wetlands that may belost soon
Design Federal projects toincorporate climate changepredictions and safeguard waterand sediment flow to wetlands
Augment and coordinatemonitoring of wetlands
Require direct payments
Require traded obligations
Eliminate Federal incentives forwetland destruction.
CWA-reconstituted WRC
COE, EPA, FWS, NMFS
FWS, NPS, NOAA
NEPA, COE, BOR
All agencies coordinatedunder interagency taskforces; FWS, EPA,USGS, NMFS
WRP, Water Bank Act
U.S. Tax code, CWA,Swampbuster
ASCS and SCS cost-sharing; COBRA
Restore degraded or converted wetlands
Fully fund existing restoration WRPprograms.
Require that restoration projects CWAset goals and monitor andevaluate success.
Use opportunities to restore and FmHA CEP; DOD basepreserve reclaimed wetlands, closures
Remove hard engineering COE, BOR, FERC reviewstructures that degrade wetlands;restore normal water andsediment flow,
Utilize dredged-materials COEprogram to facilitate wetlandrestoration,
Target key areas for wetland CWA, COE, EPA, FWS,restoration programs. NMFS
Affected lawsOption and/or agencies
Improve coordinated management and monitoringIdentify, assign priorities towetlands important now, underclimate change,
Clarify national goals for wetlandprotection,
Ensure that Federal policies donot inadvertently lead to loss ofwetlands.
Promote integrated resourcemanagement at the watershedlevel by offering financial andother incentives.
Use legislative reauthorizations toexplore new ways to protectbiodiversity and ecosystems andto integrate preservation andrestoration.
Support research on the impactsof climate change on wetlands
Facilitate migration
Require building setbacks fromcoastal and riparian wetlands
Identify wetlands most able tomigrate and sites to which theycould migrate.
Acquire lands important formigration (including bufferzones).
Reduce Federal subsidies suchas CZMA funds and floodinsurance in areas that have notestablished setback or “planned-retreat” policies.
LAPS, GAP, C-CAP,NWPCP, NAWMP,EMAP
CWA; EO 11990
CWA, CZMA, COE,ASCS, SCS, OEP,Swampbuster
NFIP, CZMA
CWA, ESA, DOI, NPS,NBS
EPA, NOAA, FWA,NMFS
CZMA, NFIP
LAPS, GAP, C-CAP,NWPCP, NAWMP,EMAP
Duck Stamp Act, LWCF,WRA, WRP and CRP
CZMA, NFIP
a ASCS=Agricultural Stabilization and Conservation Service; BOR=Bureau of Reclamation; C-CAP= Coastwatch-Change Analysis program;
CEP=Conservation Easement Program; CoBRA=Coastal Barrier Resources Act; COE=U.S. Army Corps of Engineers; CRP=ConservationReserve Program; CWA=Clean Water Act; CZMA=Coastal Zone Management Act; DOD=U.S. Department of Defense; FWS=U.S. Fish andWildlife Service; EMAP=Environmental Monitoring and Assessment Program; EPA= Environmental Protection Agency; ESA=EndangeredSpecies Act; EO=Executive Order; FERC=Federal Energy Regulatory Commission; FmHA=Farmers Home Administration; GAP=GapAnalysis Program; LAPS=Land Acquisition Priority System; LWCF=Land and Water Conservation Fund; NAWMP=Norfh American WaterfowlManagement Plan; NFIP=National Flood Insurance Program; NEPA=National Environmental Policy Act; NOM= National Oceanic andAtmospheric Administration; NMFS=National Marine Fisheries Service; NPS=National Park Service; NWPCP=National Wetlands PriorityConservation Plan; OEP=Office of Environmental Policy; SCS=Soil Conservation Service; USGS=U.S. Geological Survey; WRA=EmergencyWetlands Resources Act; WRC=Water Resources Council; WRP=Wetlands Reserve Program,
SOURCE: Office of Technology Assessment, 1993.
198 I Preparing for an Uncertain Climate-Volume 2
large part to the controversy that surrounded theproposals. Two previous Executive Orders ad-dressing activities that could destroy wetlands arealso still in effect (No. 11990, Protection ofWetlands, and No. 11988, Floodplain Manage-ment); although many agencies have promulgatedrules and regulations in accordance with thesedirectives, no oversight mechanism exists.
Implementation and oversight of the no-net-10SS policy could be achieved in several ways.The Water Resources Council (WRC), whichoperated from 1967 until 1982 to recommendcoordinated water policies and oversee the inte-grated plarnning efforts of river basin commis-sions, could be funded again with oversight ofwetlands as a key function.17 (See vol. 1, ch. 5, formore discussion of the WRC.)
Alternatively, an interagency committee ortask force, composed of representatives from eachagency whose activities affect wetlands, could beappointed and directed to) oversee wetland policyand to maintain an inventory of the quantity andquality of wetlands. The leadership of the taskforce could rotate among the members, or the taskforce could be placed under the coordination andoversight of the new White House Office ofEnvironmental Policy (OEP), which could play arole similar to that of the Council on Environ-mental Quality in the past. Both types of bodieswould be primarily advisory. A third alternativewould be to appoint a single lead agency tooversee the implementation, but such a designa-tion may cause contention among the severalagencies that could legitimately claim a leadingrole. This coordinated effort could oversee wet-land research and data gathering as well.
No matter which institution is selected toimplement and oversee the no-net-loss policy, nosingle regulatory program can by itself accom-plish the goal. That will require coordinated effortby many agencies under many programs, includ-ing programs that affect wetlands only indirectly.
Furthermore, active Federal oversight of theno-net-loss policy will not eliminate problemsthat stem from unclear goals for wetland protec-tion (discussed in more detail below), but it couldhelp to minimize them.
Option 4-2: Expand coverage and strengthenenforcement of CWA Section 404. The no-net-losspolicy is also constrained by the fact that theClean Water Act Section 404 permitting program(described in box 4-I and ch. 5) covers activitiesresponsible for approximately 20 percent of thedestruction of wetlands (112). Permits cover onlyactivities that involve discharges of dredged orfill material, but not activities such as waterdiversions, draining, channeling, and clearingthat may also destroy wetlands but that do notinvolve a discharge. These constraints allow forincremental losses that appear small, but have alarge cumulative effect (1 15). Even where per-mits do offer the Federal Government a powerfullever with which to control impacts on wetlands,goals for protecting wetlands are not clearlystated in Section 404. Thus, expanding thecoverage of Section 404 to include more activitiesand small wetlands could greatly increase protec-tion of existing wetlands (88).
Even where Section 404 could cover a givenarea and activity, program implementation isdecentralized and has not been uniform acrossregions. Other limitations are the large number ofpermit applications that must be reviewed eachyear (approximately 15,000 individual permits)and the limited resources with which to conductthe review and to monitor compliance. TheSection 404 permit program could be enhancedby increasing finding and by requiring thatindividual permit decisions be selectively re-viewed by an oversight body, as recommendedabove, for consistency and adherence to the goalsof wetland protection,
Option 4-3: Target acquisition programs towetland types that may be lost soon. Several
17 COWXj.1, au~ori~ by the Water Resources Planning Act of 1965 (PL. 89-80), W= never OffkMy d imantled, but the funding wasdiscontinued. Reconstituting the Council would require appropriations rather than new legislation.
Chapter 4-Wetlands I 199
programs seek to preserve wetlands by eitheracquiring the land outright or acquiring perpetualeasements under which landowners exchangetheir rights to drain, fill, bum, or level wetlandsfor a one-time or annual payment (see box 4-I).These acquisition programs are, however, con-strained by limited funds. For example, FWS hasabout $150 million per year to spend on allacquisitions (not just on wetlands), and funds arelimited in other programs as well.
Federal acquisition programs are not likely tobe expanded given the currently tight restrictionson all new Federal expenditures. Thus, it isessential that ongoing acquisitions made withexisting funds focus on important areas currentlyin danger of being lost. Developing a list of high-priority wetlands within an integrated-resource-management framework (described below) willhelp direct funds to areas and wetland types thatare either insufficiently protected now or thatcould be especially vulnerable to climate change.
Option 4-4: Design Federal projects to incor-porate climate change predictions and to safe-guard water and sediment flow to wetlands. Theenvironmental impact statements (EISS) requiredunder the National Environmental Policy Act(NEPA; P.L. 91-190) are intended to ensure thatthe potential environmental impacts of projectsthat the Federal Government oversees are care-fully considered and disclosed to the public.However, wetlands have continued to be de-graded in many areas despite the EIS process, inpart because wetlands are easily affected byalterations in water and sediment flow in adjacentareas-even if the wetland itself is not dredged orfilled. Since 1989, the Army Corps of Engineershas had a policy of evaluating current andpotentially accelerated rates of sea level rise aspart of its planning process (94). NEPA, or itsimplementing regulations, could be amended torequire that all future Federal projects considerthe effects of the proposed action on the water and
sedimentation regimes that supply wetlands, bothnow and under climate change.
Option 4-5: Augment and coordinate moni-toring of wetlands. Although numerous researchand monitoring programs cover some aspect ofwetlands, no single program comprehensivelyaddresses the quantity and quality of wetlandstoday. The National Wetlands Inventory (NWI)conducted by FWS has been invaluable in recentefforts to understand patterns of wetland loss.However, its statistical sampling methods canonly reveal gross changes in the amount ofwetlands. NWI cannot supply information on thestatus or quality of the wetlands not sampled. Theongoing National Water Quality Assessmentconducted by the U.S. Geological Survey (USGS)measures water-quality patterns nationwide butdoes not relate water quality to loss or degradationof wetlands. EPA’s Environmental Monitoringand Assessment Program (EMAP) was initiatedin 1987 to assess and report on the status andtrends of ecological conditions in U.S. naturalresource systems. EMAP includes a wetlandprogram that aims to evaluate and monitor thequantity and quality of wetlands on a regionalscale. The program is still in the pilot stage, but itcould provide a sound basis for coordination if aconsensus can be reached on data-collectionprotocols and dissemination. The Department ofthe Interior’s (DOI’S) Gap-Analysis Program(GAP), described in a later section, also offerspotential for coordinated monitoring. Finally, theNational Biological Survey (NBS), a programrecently initiated by DOI, may prove invaluableto coordinated monitoring and management amongagencies (see ch. 5). The goals of NBS are tocombine biological research activities within DOIinto an independent, non-advocacy biologicalscience arm.18
The Federal Government could strengthen theprotection of wetlands by reducing the overlap ofthese and other existing research and monitoringefforts. Coordinated monitoring could help iden-
IS E. T Roe, m~tor, Coowrative Research Unit Center, U.S. Fish and Wildlife Service, personal cO~~~OU -h 1993.
200 I Preparing for an Uncertain Climate-Volume 2
tify areas that should be protected now, and couldprovide a baseline against which to gauge thefuture impacts of climate change. Increasedfunding for programs such as EMAP, GAP, andNBS, along with other monitoring and inventoryefforts, would aid in coordinating these effortsamong the agencies (see ch. 5).
Indirect Federal ActIonThe Federal Government could attempt to
make it difficult to destroy wetlands and profit-able to preserve them. Numerous programs overthe years have offered direct or indirect subsidiesor incentives to private landowners for construc-tion in wetlands and flooddplains. Among theseare the U.S. Tax Code, which for decades allowedtax write-offs for the construction of drainageand irrigation systems (often resulting in theconversion of wetlands to agricultural uses);various crop-support and commodity programs(see vol. 1, ch. 6); and federally supported disasterand flood insurance, which may have the unin-tended effect of promoting development in flood-prone areas. (Disaster and flood insurance arediscussed in more detail in vol. 1, chs. 4 and 5.)To minimize the loss of wetlands, subsidies andtax incentives for protecting wetlands should becreated or expanded while subsidies and incen-tives for converting wetlands should be reducedor eliminated.
Option 4-6: Pay to protect wetlands on privateproperty. This kind of program pays landownersto refrain from destroying wetlands. Under pro-grams such as the Water Bank Act and the DuckStamp Program (under the Migratory Bird andConservation Stamp Act), Congress has givenagencies authority to pay farmers who agree not todrain, plow, burn, or otherwise harm wetlands ontheir property. Funding for such programs could beincreased or at least maintained at the authorizedlevels.
Option 4-7: Allow trading of regulatory or taxobligations for wetland protection. A reduction inexisting regulatory or tax obligations can betraded for wetland protection. For example, theFederal Government could create tax incentivesfor granting conservation easements on wetlands,or for outright donations of wetlands to conserva-tion agencies. The Tax Reform Act of 1986decreased the deductions possible for charitablegiving, which includes the granting of conserva-tion easements to Federal or State agencies.Introducing the tax incentives for wetland preser-vation could assist protection efforts. The OpenSpace Preservation Act of 1991 (H.R. 2149),introduced during the 102d Congress, sought toaccomplish this goal.19
Some form of traded obligations might also beused as part of watershed-based efforts to achievepollution control. The acquisition and restorationof wetlands near water bodies could be used asone element in a comprehensive water-qualityprogram. Such wetlands could serve as water-filtering buffers to help control non-point-sourcepollution from agricultural lands and urban areas.Many communities have had to support expen-sive tertiary treatment processes at their sewagetreatment plants in order to meet the stricterwater-quality standards under the Clean WaterAct, even though non-point-source pollution consti-tutes a significant part of the problem. Despiteinvestments of $260 billion (1990 dollars) in theconstruction of sewage treatment plants duringthe 1970s and early 1980s, the non-point-source-pollution problems in many water bodies, suchas the Chesapeake Bay, have still not beenresolved (68).
Municipalities and States that are able toacquire, restore, and maintain sufficient amountsof wetlands to attain measurable improvements inwater quality might be permitted to delay or scaledown installation of additional sewage-treatmentcapabilities within the same watershed. Effluent
19 H, R, 2149 pmpo~ to ‘exclud~~ from the gross estate the value of land subjeet to a qualified Conservation cxisement if C@ain conditions
are satisfki and to defer some of the scheduled reduction in estate tax rates. ’
Chapter 4–Wetlands I 201
from sewage treatment plants or storm-waterdrainage should not be discharged directly intoexisting wetlands, although some municipalitieshave constructed wetlands specifically for thatpurpose. Alternatively, some portion of the Fed-eral grants to States for constructing treatmentplants could be used for purchasing wetlandslocated in areas within the watershed (see vol. 1,ch. 5, options 5.1 and 5.2). Any program designedto use wetlands to help control non-point-sourcepollution would have to carefully avoid degradingexisting wetlands.
Option 4-8: Eliminate incentives to destroywetlands. The Swampbuster program (see box4-I) is a prime example of reducing Federalbenefits-in this case, crop subsidies and disasterpayments— in order to protect wetlands.Swampbuster could be expanded to cover anyactivities adjacent to wetlands, such as ditchingand diverting water for irrigation purposes, thatresult in destruction of wetlands.
For wetlands on federally owned land, includ-ing a significant share of the riparian wetlands inthe West, the Federal Government could use feescharged for grazing permits to create an incentivefor lessees to protect riparian areas from overuseby cattle. Offering a fee reduction or rebate tolessees who implement certain measures forrestoring riparian wetlands might be an alterna-tive way to protect wetlands on Federal land.
A far-reaching proposal that has receivedconsiderable attention since it was proposed byDOI in 1983 is to “CoBRAcize wetlands,” thatis, to adopt an approach for all wetlands similar tothat used in the Coastal Barrier Resources Act,which eliminates Federal subsidies that indirectlysupport destruction of coastal barrier islands (seebox 4-I and vol. 1, ch. 4). COBRA denies floodinsurance, new Department of Veterans Affairs
and Farmers Home Administration (FmHA) loans,Urban Development Action Grants, CommunityDevelopment Block Grants, road-building mo-nies, and other Federal support to developmentprojects that would alter the natural functions ofcoastal barrier islands. The program increasesenvironmental protection while saving the Gov-ernment money, provides an alternative to landacquisition as a means of protection, does notinterfere with any State or local programs, andavoids the issue of property takings (50).
9 Restore Degraded or Converted WetlandsRecent reports documenting the extent to
which wetlands have been destroyed over the pasttwo centuries have stimulated the developmentand use of methods to restore them (see box 4-A).Restoration of wetlands has already been donewith varying degrees of success, and the goal ofrestoring them to compensate for historic losseshas been promoted by both the National WetlandsPolicy Forum (NWPF) and the National ResearchCouncil (NRC). NRC recommended that theNation undertake a program to restore 10 millionacres of degraded wetlands by the year 2010 (68).
Within the Federal Government, restoration ispracticed in two distinct contexts. On publiclands, wetlands may be restored, created, orenhanced as part of the overall managementstrategy of wildlife refuges and other naturalareas, or as a way to aid in flood control andmaintenance of water quality.
20 In the regulatorysetting, restoration may be performed for thepurpose of mitigation-that is, the Gov ernmentmay require developers to restore or createwetlands in exchange for receiving a CWASection 404 permit if damage to wetlands cannotbe avoided. There are still many questions con-cerning the success rates of these practices.
m~ currently used by wetland scientists, restoration means “rehnned horn a disturbed or totally altered condition a previously existingnatural or altered condition by some action of ~“ whereas enhancement means ‘‘the increase in one or more values of all or a portion ofan existing wetland by man’s activities, often with the accompanying decline in other wetland values. ’ For exarnpl% effo~ to enhance thevalue of a wetland as habitat for migratory waterfowl may include pumping water into the wetlands or controlling water levels; although thismay make the area more att.mctive for ducks, it may athct other functions such as flood control or biodiversity. Creation is ‘‘the conversionof a persistent non-wetland area into a wetland through some activity of man” (RR. Ixxvis, in ref. 59).
202 I Preparing for an Uncertain Climate-Volume 2
Little comprehensive monitoring has beenperformed to document the success of restorationefforts in either context (37, 59). The evaluationsthat have been done suggest that restoration hasbeen most successful in coastal and estuarinewetlands. It has been somewhat less so in riparianareas, forested or shrub-dominated freshwaterwetlands, and other areas where the hydrology isnot well-understood. Restoration is problematicfor isolated prairie potholes, which are typicallyfed by groundwater. Flood-control and waterfowl-production functions are the most readily re-stored; rejuvenating fisheries and other biologicalfunctions, as well as pollution filtering andaesthetics, is typically more difficult (59). Resto-ration projects may fail because people do notunderstand well enough how these systems work,the construction supervision is improper, thelocation of the project is innapropriate, or man-agement plans for the area once it has beenrestored are lacking.
It is probably impossible to fully recreate orrestore a wetland, or any other natural system.Any attempts at restoration in exchange forunavoidable alterations to wetlands must ensurethat the uncertainty about the success of theproject is taken into consideration. Nonetheless,within the broader context of managing andconserving wetlands under changing climateconditions, restoration is likely to become anincreasingly important part of the effort.21 Acoordinated management policy would seek topreserve and restore a range of wetlands fromcoastal to inland areas within a watershed.
Various programs enacted over the past decadehave sought to restore wetlands to make up forpast degradation and 10SS.22 The Wetlands Re-
serve Program (WRP), established in 1990, aimsto set aside and restore up to 1 million acres ofwetlands that had been converted to agriculture(see box 4-I). The Coastal Wetlands P1anning,Protection, and Restoration Act set forth a pro-gram and authorized funds for protecting andrestoring coastal wetlands, particularly inLouisiana. The act also provided funds forrestoration projects on approximately 6 millionacres of wetlands important for migratory water-fowl—with an emphasis on the prairie-potholeregion-as called for in the Fish and WildlifeService’s North American Waterfowl Manage-ment Plan. Mitigation-banking efforts under Sec-tion 404 can incorporate restoration of wetlands,referred to here as wetland banking. This ap-proach to wetland conservation allows wetlandsto be destroyed-when destruction is unavoid-able-in exchange for restoring comparable wet-lands elsewhere. Federal funds slated for improv-ing grazing lands or other resources could betargeted for wetland restoration and enhance-ment. 23 Alternatively, because receipts fromgrazing fees are dwarfed by revenues from timberand recreation on Federal land, perhaps more ofthese monies could be channeled to protectionand enhancement of the riparian wetlands in aridregions.
Option 4-9: Fully fund existing restorationprograms. Farmers selected to participate in theWRP must develop restoration plans for lands tobe set aside as part of the wetland reserve. TheFederal Government pays up to $50,000 per yearto landowners for property easements and shares50 percent of the restoration costs on landscovered by 30-year easements. For lands underpermanent easement, the Federal Government
21 ~o~ to cr~~ we~ds may a~ be necessary, although generally restoration is preferable bcXaUSC it is more SuCCCSSfd ~d l-s Cosdy
(37, 59).
~ No@ however, that restoration goals may vary within and among regions. For example, in urban areas, flood Control ~ wat~ -are highly valued functions of wetlands. Restoration of these functions does not require aftdlyvegetated wetland that suppata f~ and wildlife;the most important part of restoring these functions maybe simply to clear obstacles horn the site and plant enough vegetation to anchor thesoil. In other sites, including those in areas important for wildlife but in which considerable habitat has been destroyed, a more completerestoration project to rehabilitate a broader range of fimctions, including wildlife habita~ may be preferred.
~ ~enfly, 5(.) pment of Bureau of Land Management and Fo~t Sefice _- fee receipts am targeted for improving rangelanda underthe Federal Land Policy and Management Act of 1976 (PL. 94-579).
Chapter 4–Wetlands I 203
reimburses 75 percent of the costs. The WRP goalto set aside and restore up to 1 million acres ofwetlands over a period of 5 years has beenhampered by funding cutbacks. The WRP pro-gram received $46 million in funding during itsfist year (1991), but in 1992, Congress elimi-nated all funding for the WRP for FY 1993 (55).In the 1995 Federal budget, funding has beenrestored to $65 million, with a goal of enrollingsome 75,000 acres in the program during the year.Additional wetland-reserve easements may bepurchased with emergency funds authorized forMississippi flood relief.
Other restoration efforts include the ArmyCorps of Engineers’ Wetlands Research andDredged Materials Programs, which use dredgedmaterial for wetland-restoration projects;NOAA’s Habitat Restoration Program, a programdirected specifically at coastal wetlands; and theinteragency Coastal America program based inWashington, DC, which operates at the national,regional, and local levels to coordinate restorationand mitigation projects. If these programs were toaddress wetlands that lie somewhat above thepresent sea level, they might be able to provide abuffer against the loss of coastal wetlands toaccelerated sea level rise.
Option 4-10: Increase Government oversightof restoration and mitigation; require that pro-jects set goals to monitor and evaluate success.Typical goals in restoring wetlands include themaintenance of enough vegetation to aid floodcontrol or water retention and the restoration ofsome habitat for fish and wildlife. Fully restoringall natural functions of a wetland has proved verydifficult to do, and each case presents differentchallenges. However, among the goals that canreasonably be expected for all projects are sus-tainability and adaptability: the restored wetlandshould be able to survive the range of currentconditions and adapt to at least small changes inclimate. Clear goals and a comprehensive under-standing of wetland processes will increase theprobability of the success of restoration efforts.
The Federal Government could enhance resto-ration efforts by increasing oversight of andguidance to the States and local agencies thatultimately manage the process. Different strate-gies are needed for efforts on public land (restora-tion) and private land (mitigation). For restorationprojects on public land, an interagency committeecould be convened to administer the program. Formitigation projects on private lands, CWA regu-lations could include explicit directions callingfor goals to be clearly identified at the outset ofany project, as well as for long-term monitoringto be conducted to ensure that the goals areachieved. In addition, there would have to bemechanisms for collecting, storing, and analyzingdata and for evaluating the success of the projectover time.
The Federal Government can also set standardsfor contractors who perform restoration and cantrain the regulators who oversee the projects. Oneapproach for managing the restoration of wet-lands under Section 404 mitigation requirementsis to have private parties pay into a restorationfund and let the Government contract out thework to approved technicians. The private partiesbenefit because they have an interest in theproject’s success, and the approach would alsofacilitate Government oversight because contrac-tors who did not perform to standards could bebarred from participating in future projects.24
Option 4-11: Use opportunities to restore andpreserve reclaimed wetlands. The 1987 Agricul-tural Credit Act (P.L. 100-233) established theFarmers Home Administration ConservationEasement Program (FmHACEP), which author-izes USDA to grant or transfer easements for thepreservation of lands that have reverted to theFmHA through farm foreclosures or voluntaryconveyance. The program is not aimed at wet-lands, but it could be used to assist restoration ofwetlands that have been converted to agriculture.Not all repossessed lands merit easements be-cause agricultural use often transforms wetlandspast the point of return by draining, channeling,
~ K. L. - Comuhkg ECOIOgiS~ kc., personal communication November 1992.
204 I Preparing for an Uncertain Climate--Volume 2
and filling, but full use of the program couldbolster restoration efforts.
Another potential opportunity for reclaimingand restoring wetlands is provided by military-base closures. Decisions on the disposition ofland in closed military installations could includeconsideration of whether wetlands exist or couldbe restored, particularly in sites containing func-tions, species, or habitat that are not well-represented in existing preserves, or in areaswhere the flood- and erosion-control functionswould be highly valued.
Option 4-12: Remove hard engineering struc-tures that degrade wetlands, where feasible, andattempt to restore normal water and sedimentflow. A vital first step in restoring many degradedwetlands is to restore normal water and sedimentflows in river and hydrological systems that havebeen altered. Construction of water-supply and-control structures has in the past often led tounforeseen damage to wetlands both upstreamand downstream. This became vividly apparentwith the Mississippi River flooding in the sum-mer of 1993. The system of levees along the banksof the Mississippi has isolated it from thewetlands that once absorbed and slowed foodwaters. The levees have made the river deeper andswifter, with the consequence that when a breachoccurs-as happened repeatedly during the recentflooding-the resulting flood is much moredestructive than it would otherwise have been.
In some areas, there may be opportunities toremove structures not vital to the protection ofdeveloped areas. Both the Corps and the Bureauof Reclamation could review whether existingstructures associated with the degradation ofwetlands are still necessary and appropriate.Given the extensive damage due to the floodingof the Mississippi, Congress might considerremoving some of the levees, allowing certainundeveloped areas to seine as floodwater-
detention areas, and restoring wetlands withinthese areas. These flood-detention areas mightalso be targeted for conservation-reserve andwetland-reserve expenditures (see option 4-13and the “first steps” at the end of the chapter).
The Corps, for example, has already begun tomodify the structures that forced Florida’s mean-dering Kissimmee River into a straight channel,which led to destruction of wetlands and wildlifehabitat. Alleviation of impacts from water-diversion projects should receive high prioritybecause restoring natural water regimes in awetland plays an essential role in restoring thefunctions. Efforts to conserve the coastal wet-lands of Louisiana, described in box 4-F, illustratesome approaches to restoring water and sedimentflow. For example, the Mississippi River GulfOutlet is a navigation channel that could beconsidered for modification because it is nolonger used, but its presence allows salt water toflow into and harm freshwater wetlands (1 13).
Option 4-13: Use the Dredged MaterialsProgram to facilitate wetland restoration. Duringthe past decade, the by Corps of Engineers hasdredged an average of 334 million cubic yards(255 million cubic meters)25 of material annually,from rivers, harbors, and estuaries, to maintainnavigable waterways and for other purposes.Some of this material could be used to replacesediments in subsiding coastal wetland areas or inareas that may be inundated if sea level rises. Oneestimate suggests that 103 square miles (270square kilometers)26 could be covered to a thick-ness of 3 feet each year with uncontaminateddredged material.27 However, the use of dredgedmaterial to restore wetlands is controversialbecause some of this materialism contaminated andcould be harmful to wetland vegetation andwildlife. The Corps has been directed to disposeof dredged material in the least costly manner,which is usually at sea. However, if the States
2S ~ ~nv~ cubic yards to cubic meters, multiply by 0.765.26 ~ ~onva - miles to squm kilometers, m~tiply by 2S5~”
27 L. Wmos, pofi~ WMI Special studi~ Divisio~ Institute for WatcrResourva, U.S. Army Corps of ~ , personal CommunicationJuly 19, 1993.
Chapter 4–Wetlands I 205
wish to put the dredged material to some use, theFederal Government will contribute half of theincreased costs of disposal if States pay the otherhalf. If the Federal Government wishes to pro-mote the use of uncontaminated dredged materialfor wetland restoration and enhancement, it maywant to increase the subsidy it currently gives tothe States.
Indirect Federal ActionOption 4-14: Target key sites for a wetland-
restoration program. Wetland restoration hasbeen attempted inside and outside the regulatoryprocess. More of an effort must be made in thepreliminary stages of projects to develop soundconstruction and implementation plans. Equallyimportant are the development and application ofmonitoring and evaluation plans.
Small-scale successes in restoration projectscould be used as models for larger-scale efforts,and an expanded regional restoration programcould be created to target high-priority areaswithin watersheds for restoration. It could incor-porate planning and management for restorationon public lands, as well as restoration for Section404 permits. This way, a full array of wetlandscould be maintained and restored, which wouldoffer the broadest range of adaptive possibilities.A broader strategy for restoring wetlands, termedwetland banking, could be keyed to the watershedlevel to create a market for wetland restoration incases where destruction of wetlands cannot beavoided. Wetland banks allow for the marketingof credits for wetland restoration and creation aspart of the CWA Section 404 program (see box4-A). A watershed-level wetland bank may bebetter able to protect functions and products ofwetlands than could numerous individual on-sitemitigation efforts.
So far, wetland banks, have been used verylittle, and most of them have been setup by Statetransportation departments rather than by privateindustry. 28 Still, they offer greater potential for
Federal or regional government oversight than dosite-by-site mitigation efforts. As noted earlier,individual mitigation projects are difficult toenforce effectively, and the goals of mitigationprojects have often not been stated clearly enoughto determine whether the project succeeded (31).
Current Section 404 practice requires that awetland be restored to the extent practicable, asdetermined by the Army Corps of Engineers andEPA. However, specific criteria that can be usedto measure the success of a project designed torestore wetland functions is often lacking. Fur-thermore, under standard permit requirements,individual mitigation efforts are to be undertaken‘‘on site’ and ‘in kind’ wherever possible--thatis, wetlands are to be restored on or near theoriginal site, with the attempt to duplicate thecharacteristics of the original wetland. However,if these objectives are not applied carefully withinthe context of the overall watershed, they caninadvertently lead to the development of numer-ous small, isolated, and fragmented restorationprojects (such as a pond surrounded by shopping-mall parking lots or tucked between the buildingsof an office complex). Larger, better-connectedprojects are preferable and more likely to succeed.Regional wetland-restoration projects might bestpreserve habitat values. Some resource managershave suggested, for example, that restoring wet-lands adjacent to the Everglades would be a betterstrategy than on-site mitigation for wetland lossesin the urban corridor of coastal South Floridabecause it would reestablish historic water flowsand effectively recreate a larger, contiguouswetland.
Failure to recognize that various wetlands andtheir functions are not interchangeable has led tothe downfall of some mitigation projects. Aregional wetland-restoration strategy could avoidsome of the problems of case-by-case mitigationby encouraging mitigation projects on the water-shed level-on the basis of an evaluation of theoverall distribution and functions of wetlands
2$ M. J. Beaq Senior Attorney, Environmental Defense FuI@ personal cOII-ImUDicatiOU &t. 16, 1992.
206 I Preparing for an Uncertain Climate-Volume 2
within the watershed-and by targeting mitiga-tion to areas that need it the most. By allowingdevelopers to pay into a bank, rather thancontracting mitigation projects individually, awetland-banking system could allow greaterGovernment oversight and more rigorous stand-ards for restoration. Finally, by combining theplanning and management of Section 404 mitiga-tion with the restoration projects that take placeon Federal lands, the Government could achievegreater integration of its wetland-protection and-restoration goals.
Standards for mitigation banking have beenproposed as guidelines in some regions by theCorps and EPA but have not been uniformlyimposed.29 Additional Federal guidance couldlink mitigation to a watershed-based priority planthat seeks to maintain an array of wetlands.Participation in regional wetland-restorationschemes should not take the place of avoidingimpacts to wetlands. Where destruction of aparticular wetland cannot be avoided, however,regional restoration projects could offer addi-tional leverage for implementing wetland-restoration goals on a watershed basis. Theregional restoration schemes could require thatmore wetland areas be restored or created thandestroyed.
I Facilitate MigrationThe biggest issue facing coastal wetlands is
whether they will have room to migrate as the sealevel rises.30 Because so many coastal wetlandareas already have a limited potential to grow, theremaining areas for coastal wetland migrationcould be identified and protected, either throughdirect acquisition or through a program of ease-ments. Vegetation in riparian wetlands may alsoneed to migrate toward new sites along rivers andstreams. Regional predictions of climate changeeffects will probably not be available for a decade
or so, which will make identification of landsneeded for wetland migration difficult. However,if planners and managers do not initiate effortsnow to identify where wetlands will be lost firstand where wetlands might be able to relocate, theNation may be ill-prepared to take advantage ofthe advances in global climate modeling toprotect its natural resources. (See ch. 2 for adiscussion of climate models.) While this infor-mation is being developed, sensible land-usepolicies-particularly in coastal areas--can beimplemented to allow wetlands to persist as wellas to reduce property loss and Federal paymentssuch as disaster relief and subsidized floodinsurance (see also vol. 1, ch. 4).
Many measures that could assist migration ofwetlands will involve State and municipal land-use laws and plarnning efforts. Although theparticipation of States and municipalities is vital,the following sections focus on Federal actions,including those that might provide incentives forappropriate programs at the State and local levels.
Direct Federal ActionOption 4-15: Require building setbacks from
coastal and riparian wetlands. A national policyrequiring buildings to be set back a given distancefrom the coast according to actual or estimatedsea level rise-as practiced by the State of Maineand described in more detail in volume 1, chapter4-would not only allow room for wetlands tomigrate, but could have the additional benefit ofprotecting or minimizing the loss of coastalbuildings.
Option 4-16: Identify the wetlands that aremost able to migrate and sites to which they couldmigrate. Identification of key areas for wetlandmigration in both coastal and riparian areas couldbe done through modifications of the variouspriority-setting mechanisms described below under“Improve Coordinated Management, Monitor-
29 Ibid.
Jo Of course, even wi~ sufilcient land, the vegetation of wetlands xnay change from one tYIM tO IUIOther, Or WmC of tie *dOnS my ~dimini shed, but without sufficient land for migratiom loss of wetlands is guaranteed.
Chapter 4-Wetlands I 207
ing, and Research. ” To date, none of theseprograms has included climate change considera-tions, although existing statutes would providesufficient authority to do so. However, a congres-sional directive, perhaps with appropriations at-tached for the purchase of land for wetlandmigration, might ensure that agencies considerthe need for land for migration.
Although accurate predictions of how climatechange will affect wetlands and where they mightmigrate must await further research (outlinedbelow), rough guesses of vital migration areas canbe made now. EPA has already conducted severalstudies that combine various estimates of sealevel rise with data on coastal topography andexisting development to predict where coastalwetlands will be inundated (4, 52, 53, 73, 75).Periodic reassessments should be made as newinformation is obtained.
Option 4-17: Acquire lands important formigration (including buffer zones). In the absenceof precise information on where wetland speciesmight migrate, priority should be given to acquir-ing and protecting buffer zones around existingwetlands. This would be a logical first step inwetland protection. Buffers can help guard thepresent functions of wetlands, including floodcontrol and the provision of wildlife habitat, andcan also allow room for wetlands to grow in anydirection in the event of climate change. Esti-mates of how far a buffer should extend from thewetland boundary vary, with a suggested range of100 to 500 feet, depending on the area and thefunctions. Existing acquisition programs couldbe directed to incorporate suitable buffers withevery purchase of wetlands or, at a minimum,with the purchase of wetlands most at risk fromclimate change.
A potential stumbling block is that acquisitionprograms focus on areas that are valuable now,rather than on those that could become valuablein the future. Although some areas important forfuture migration also have a high present value,such as the remaining coastal uplands in Florida,this may not be true of all sites. Setting priorities
that balance a known present value with anuncertain future value would be quite difficult butcould be accomplished through effective water-shed-management plans, as discussed below andin volume 1, chapter 5.
Indirect Federal ActionOption 4-18: Reduce Federal subsidies, such
as Coastal Zone Management (CZM)funds andflood insurance, in areas that have not estab-lished setback or “planned-retreat’y policies.The State of Maine recently adopted, as part of itscoastal-dune regulations, a rule known as plannedretreat, which ‘‘allows use of coastal property forconstructing a building, provided the building isremoved at some future time when the shoreline(high water line) has advanced to the buildinglocation” (86). Such planned-retreat policies aregenerally aimed at protecting coastal structuresfrom costly damage, but these policies may alsoprovide significant benefits for coastal wetlands.The Federal Government may best rely on Stateand local setbacks because land-use-control meas-ures (such as zoning) generally lie within thepurview of States or local areas. States’ abilitiesto require or induce private-property owners toallow coastal wetlands to migrate with a risingsea, rather than to construct bulkheads, walls, andother structural protections, will hinge on thebalance of private-property rights with the public-trust doctrine (which is rooted in case law andvaries from State to State). However, the planned-retreat rule could be added to the Federal CZMprogram requirements, which explicitly mandatethe protection of ecological values of coastalresources (including wetlands) and already coverissues such as beach protection and shorelineerosion. Of course, CZM cannot require States totake action, but it can offer a financial incentive.
Another way for the Federal Government topromote buffer zones is to eliminate funding foractivities that encourage development in areasadjacent to wetlands or in floodplains (e.g., byusing the COBRA approach as described in option4-8). One potential weakness of the COBRA
208 I Preparing for an Uncertain Climate--Volume 2
approach is that it addresses new construction andland uses. Existing activities, no matter howheavily subsidized by Federal programs in thepast, are not covered by the act.
The Community Rating System (CRS) is arecent Federal Emergency Management Agency(FEMA) initiative that provides an incentive forcommunities to implement activities that exceedthe minimum requirements of the National FloodInsurance Program (NFIP) (see vol. 1, ch. 4).Program participants can receive discounts inflood insurance premiums of up to 45 percent bypromoting activities that protect floodplains andreduce flood losses. These activities includerelocating structures at risk, removing debris fromwaterways, and preserving open space.
The CRS could be expanded to include therestoration of floodplains, which occupy a largepart of the U.S. landscape and include many of theNation’s most productive wetlands and mostfertile soil. Their functions include storing andconveying water, moderating floods, retardingerosion and sedimentation, maintaining waterquality, recharging groundwater, and providingwildlife habitat. Under expansion of the program,credits could be given for actions that help torestore these functions.
9 Improve Coordinated Management,Monitoring, and Research
All three strategies presented above-protectexisting wetlands, restore: degraded ones, andfacilitate migration-will be more effective andefficient if applied within a regulatory andmanagement framework that clearly identifiespriorities and goals and that is coordinated acrossrelevant programs and institutions to achievethose goals. This theme of coordination, which isimportant not just for wetlands but for all naturalresources, is discussed in chapter 1; recommenda-tions specific to wetlands, which can involvegradations from direct to indirect action, aredescribed below.
Direct or Indirect Federal ActionOption 4-19: Identify and assign priorities to
the wetlands that are most important to protectand restore. Identifying and ranking the wetlandsthat are the most important to protect now and inthe future would help efforts to protect and restorewetlands. A listing of priorities that includesclimate change considerations could be used todirect regulation, acquisition, and incentive pro-grams throughout all levels of government. To bemost effective, lists should be compiled for eachmajor watershed and should be developed inconsultation with all relevant stakeholders.
None of the Federal priority-setting mecha-nisms now used to direct wetland acquisition andrestoration-the Land Acquisition Priority Sys-tem (LAPS), the National Wetlands PriorityConservation Plan (NWPCP), the North Americ-an Waterfowl Management Plan (NAWMP), theGap-Analysis Program (GAP) and the Coastwatch-Change Analysis Program (C-CAP--explicitlyaddress the potential effects of climate changeand its implications for setting priorities.
LAPS is a decisionmaking process used byFWS to set priorities for all of its land acquisi-tions, including wetlands. NWPCP, required bythe Emergency Wetlands Resources Act of 1986,was developed by FWS to set criteria for identify-ing important wetlands to be acquired by Federaland State Governments. NAWMP, developed byFWS under the authority of the North AmericanWetlands Conservation Act of 1989, sets priori-ties for wetland conservation and restoration inthe prairie-pothole region.
GAP is a land-use-analysis program at FWSthat seeks to identify priorities for protectingendangered species. It addresses this and othergoals by examining patterns of land use andownership and comparing them with specieshabitat, vegetation, and other ecological featuresof the land (see ch. 5).
Run by the NOAA Estuarine Habitat Program,C-CAP provides information on the location,health, and loss rates of coastal habitats. To helpset priorities for restoration, C-CAP has devel-
Chapter 4–Wetlands 209
oped a standard protocol for rapid assessment ofchanges in habitat quality in coastal wetlands andthe adjacent uplands.
These programs could be tied together andexpanded for use in all Federal, State, and localefforts, including those involving regulatory,incentive, disincentive, acquisition, and restora-tion activities. In addition, they could be used tohelp identify indicators of climate change andmethods of addressing these changes. Prioritiescould be reviewed periodically as new and moreregion-specific information on potential climateimpacts is developed.
A potential problem with any general priorityor ranking scheme for wetlands is that it assumesthat the functions and products of different typesare understood well enough to be compared andranked accurately. Such schemes can easily fallprey to problems of focus and scale. For example,in coastal areas, FWS might need to evaluatewhether top priority should be given to acquiringareas most at risk from sea level rise or tomaintaining an interconnected network of lands.For inland wetlands, including riparian and depres-sional systems, it will also be important toidentify water sources linked to the health ofwetlands and to acquire water as well as landrights, where necessary.
Option 4-20: Clarify national goals for wet-land protection. Climate change makes the needfor clearly stated policy goals pressing. However,the Federal no-net-loss policy for wetlands is notclearly expressed in the regulatory framework,nor has it been completely embodied in Federalactions that provide incentives or disincentives toprivate activities that affect wetlands. Laws andprograms should balance the need to preserveexisting wetlands in the places where they arenow with where they may or may not be in thefuture due to climate change.
One way to clarify wetland-protection goals isto use the opportunity offered by the upcomingreauthorization of the Clean Water Act to make itswetland-protection mandate explicit. Section 404could be expanded, new sections could be added,
or the focus of the entire statute could be changedfrom water quality to sustainable water use withwatersheds. Another possibility would be toformulate a single new piece of legislation thatwould address wetlands specifically-a Federalomnibus wetland act. Some States have adoptedsuch legislation. For example, Florida’s Hen-derson Wetland Act of 1984 provides equalprotection for all the State’s waters and expandsthe State’s jurisdiction over protection.
Option 4-21: Ensure that Federal policies donot inadvertently lead to loss of wetlands. ManyFederal programs affect wetlands by encouragingdifferent patterns of land use and development.The Emergency Wetlands Resources Act of 1986called for the Department of the Interior (DOI) toconduct and publish a comprehensive review ofthe impacts of Federal programs on wetlands. Onepart of that review has been completed andreleased (102), but the second volume has yet tobe published. Volume I discusses the lowerMississippi alluvial plain and prairie potholes.Volume II was to include: the Everglades, coastalLouisiana, Galveston Bay, Puerto Rico, Califor-nia’s Central Valley, western riparian areas, andAlaska. DOI should be urged to complete andissue Volume II promptly. Once the review isavailable, Congress may wish to consider amend-ing programs that conflict with protection.
Option 4-22: Promote integrated resourcemanagement at the watershed level. Greatercoordination and integration of programs andinstitutions would allow more-efficient manage-ment of wetlands. The Federal Governmentshould explore ways to institute watershed-basedmanagement programs that would consider wet-lands along with other natural resources. There iscurrently a great deal of interest in watershedmanagement, and S. 1114, the Water PollutionPrevention and Control Act of 1993, contains amajor section promoting it. Watershed manage-ment essentially recognizes that the many uses ofwater are tied together and that problems and theirsolutions are most effectively considered on asystem-wide basis.
210 I Preparing for an Uncertain Climate--Volume 2
Managing wetlands within a watershed contextwould require an improved understanding of thetypes and amount of wetlands needed within anygiven watershed to support ecological functionsand to maintain the entire system in a healthystate. This approach would require inventories ofland, water, and wetlands so that models can bedeveloped for estimating how changes in someparts of the system (whether caused by climate orby human activity) would affect functions else-where.
Many efforts already exist that could form partof an integrated management program, and nu-merous studies have recommended the need forsuch an approach (see ch. 1 and vol. 1, ch. 5).Programs with some form of integrated planninghave been attempted in States including Califor-nia, Florida, Georgia, Oregon, and Massachu-setts. These programs should be reviewed so thatany Federal action would complement-and avoidinadvertent interference with-successful pro-grams at the State level.
Option 4-23: Use legislative reauthorizationsto integrate preservation and restoration. TheClean Water Act and, to a lesser extent, theEndangered Species Act (P.L. 93-205) are vitalelements of national wetland policies. Both are upfor reauthorization. The controversy surroundingthe Clean Water Act stems partially from the lackof consensus about what the wetland mandateshould be. Also, the effectiveness of the species-by-species approach used in the EndangeredSpecies Act has been questioned by critics as wellas by some who fully support its goals. Reauthor-ization offers an opportunity to explore new waysto protect and restore biodiversity and ecosys-tems, both in wetlands and elsewhere.
Under the Clean Water Act, pilot projects inwatershed management could be initiated insmall watersheds where wetlands are either threat-ened or already degraded. Wetland-restorationprojects could be systematically monitored andevaluated to explore whether restoration tech-niques can rejuvenate a full range of wetlandfunctions and support the original diversity of
flora and fauna in addition to accomplishing morecase-specific goals, such as providing habitat forwaterfowl.
Option 4-24: Support long-term research andmonitoring on the impacts of climate change onwetlands. Efforts to identify which lands will bemost valuable as the climate changes-and, inparticular, estimating where migration of wet-lands might occur-face a daunting lack ofdetailed regional climate predictions and a poortheoretical understanding of how climate andother hydrological and ecological changes willaffect wetlands. Key areas of investigation thatare needed include:
establishing a baseline of wetland conditionsnationwide and a long-term monitoring net-work to document rates and types of change;assessing how wetlands have already beenaltered in areas where the water regime haschanged in ways similar to those predictedfor climate change;determining g water needs for healthy wet-lands and the hydrological connections be-tween wetlands and groundwater;evaluating salt movement through estuaries,coastal aquifers, and inland surface- andgroundwater systems;researching the adaptability of key wetlandspecies (both plants and animals);assessing how extreme events such as stormsand droughts affect the functioning of wet-lands; anddeveloping and evaluating restoration andcreation technologies.
Some of these topics are already the focus ofresearch efforts at the Fish and Wildlife Service’sNational Wetlands Research Center and the ArmyCorps of Engineer’s Wetlands Research Programat the Corp’s Waterways Experiment Station inVicksburg, Mississippi. EPA’s EnvironmentalMonitoring and Assessment Program has alsoproposed monitoring some pertinent indicators ofthe condition of wetlands. The NBS (see ch. 5)
Chapter 4–Wetlands I 211
could also incorporate wetland assessment into itsbroader mandate.
FIRST STEPS
This chapter has described how the currentpolicies for protecting wetlands in the UnitedStates fall short of meeting the stated no-net-losspolicy goal. Because climate change will exacer-bate existing stresses on wetlands as sea levelrises in coastal areas and as some interiorwetlands dry out, the problems encountered undercurrent wetland-protection policies will becomemore acute. Thus, policies designed to facilitateadaptation of wetlands in the future must, at aminimum, seek to accomplish four goals:
1. establish a clear national policy for wetlandprotection,
2. integrate protection across agencies andacross other natural resources,
3. establish and implement a priority plan foracquisition and protection, and
4. enhance protection of especially vulnerablewetlands.
The Federal Government cannot use all policytools to address these problems with equalassurance of success. Because 74 percent of allwetlands are on privately owned lands, thepotential for direct Federal intervention is limi-ted. Given the available policy levers (regulation,acquisition, incentives, and research), the limitedfunds for programs, and the level of scientificunderstanding of the impacts of climate changeon wetlands, OTA has identified the followingstrategies as potential “frost steps” to respond toclimate change and the threats it poses to wet-lands. This list comprises policies that should beinitiated based on concerns about climatechange now.
■ Revise the Clean Water Act. The CleanWater Act (CWA), which is up for reauthori-zation, could be revised in various ways toimprove the protection of wetlands. Theabsence of a clear and explicit mandate
hampers wetland protection. Regulatory ac-tivity under Section 404, for example, islimited because of ambiguity about its appli-cability to wetlands that are periodicallyinundated or saturated-rather than wet allyear. Furthermore, because existing statu-tory language emphasizes only the protec-tion of surface-water quality, drainage activ-ity that may destroy wetlands is not regulatedunless it results in the discharge of materialsinto protected waters. Congress could revisethe statutory language of CWA to spell out aclear goal of protecting wetlands and toextend regulation to all activities that destroywetlands. A bill introduced during the 103dCongress, S. 1304, proposes revisions alongthese lines.
Another potential target for revision is theprovision for mitigation banking. If properlymanaged, regionally coordinated mitigationprojects could offer both greater regulatoryflexibility and more-effective restoration withinwatersheds. CWA could be modified toestablish uniform standards for mitigationactivity and to require that activities becomprehensively monitored and evaluatedfor success. Success should be determinedby the restoration of the destroyed wetland’sunique function and value as well as at leastequivalent lost-wetland area.
The act could also be expanded to promotecomprehensive watershed management. Re-gional watershed management could be fos-tered by revising CWA to set up coordinat-ing mechanisms and incentives. Wetlandprotection and restoration could be linked toregulations covering non-point-source pollu-tion to create a more integrated approach toachieving mandatory water-quality levels.The bills now under consideration include awatershed-management component, but thekey will be to ensure that wetlands areincorporated into this broader water-qualityframework.
212 I Preparing for an Uncertain Climate--Volume 2
■ Develop and implement priority plans tocoordinate wetland protection across agen-cies. Federal agencies including the Fish andWildlife Service (FWS), the EnvironmentalProtection Agency (EPA), the Army Corpsof Engineers (Corps), and the U.S. Depart-ment of Agriculture (USDA) have developeddifferent methods for making decisions aboutwetland protection. Methods for monitoring,delineating, and assigning priority for acqui-sition or restoration vary according to theparticular goals and responsibilities of eachagency. These differences have led to enormousactual and perceived disparities in the pro-tection of wetlands.,
The various Federal agencies (e.g., theCorps, EPA, FWS, and USDA) should coor-dinate the designation of wetlands that aredeemed to be high priority for protection,restoration, or acquisition. Development ofregional priority plans and oversight of theirimplementation could be supervised by amultiagency task force composed of repre-sentatives from all Federal agencies thathave responsibilities for wetlands. Alterna-tively, the White I-louse Office of Environ-mental Policy (OEP) could provide coordi-nation and oversight. Once in place, Federalagencies could be directed to use this uni-form priority plan in making decisions onCWA Section 404 permitting, land acquisi-tion, easements, and restoration (throughSwampbuster, Wetlands Reserve, and otherprograms). Such a plan should be updatedperiodically to reflect changing circumstances,including the anticipated effects of climatechange.
■ Ensure that Federal policies and incen-tives are consistent with wetland protec-tion. Although Executive Order 11990, is-sued in 1977, directs Federal agencies toconsider how their policies will affect wet-lands, there are still many opportunities torevise existing Federal programs to enhancewetland protection.
Congress should urge the Fish and Wild-life Service to complete its review of theimpact of Federal programs on wetlands thatwas mandated by the 1986 Emergency Wet-lands Resources Act. Prompt completion ofthe report could assist further efforts toidentify programs that could be modified toreduce their impacts on wetlands.
Even without the review, some programsappear to be prime candidates for modifica-tion. For example, Congress could amend theCoastal Barrier Resources Act to expand itscoverage to include a broad range of coastalwetlands. Extending the act would not onlyhelp protect wetlands, but would also reduceFederal expenditures and, by slowing devel-opment in high-hazard coastal areas, couldcut down on damage to human lives andproperty during coastal storms. Congresscould also act to increase incentives toprivate landowners to set aside and restorewetlands. For example, Congress could main-tain full funding for the Wetlands ReserveProgram in future appropriations. Tax bene-fits for landowners who grant conservationeasements on or make outright donations ofwetlands to Federal, State, or local conserva-tion organizations could be increased, ascalled for in H.R. 2149 (102d Congress).
Increased coordination across Federal pro-grams could also promote wetland protec-tion. Wetlands could be included among theissues considered in the Western WaterPolicy Review enacted by the 102d Congress(see vol. 1, ch. 5), perhaps considering waysto link conservation of riparian wetlands tomeasures promoting water-use efficiency.Agencies should be urged to take full advan-tage of the Farmers Home Administration (FmHA) Conservation Easement Program toreview lands under FmHA loan defaults andto acquire title or easements to high-prioritywetlands. Similarly, lands on decommis-sioned military bases should be reviewed for
Chapter 4-Wetlands |213
their value for acquisition or restoration asprotected wetlands.Conduct research, development, and eval-uation in key areas. Research and monitor-ing should be part of any long-term effort toprotect and restore wetlands, now and as theclimate changes. Congress could encourageagencies to incorporate research on wetlandsinto their U.S. Global Change ResearchProgam efforts (see ch. 3). Congress couldalso direct the Department of the Interior toinclude an assessment of wetlands and peri-odic monitoring for the effects of climatechange in the proposed National BiologicalSurvey (see ch. 5).
CHAPTER 4 REFERENCESI. AlbrechC VS., and D. Isaacs, “Wetlands Jurisdiction and
Judicial Review,” Natural Resources and Environment, vol. 7,summer 1992, pp. 29-31, 65-67.
2. Alper, J., “War Over the Wetlands: Ecologists v. the WhiteHouse,” Science, vol. 257, Atigust 1992, pp. 1043-44.
3.
4.
5.
6.
7.
tierican Fisheries Society, letter to the Senate Committee onCommerce, Science, and Transportation March 1, 1990, ascited in J.P. Wise, Federal Conservation and Management ofMarine Fisheries in the United States (WashingtorL DC: Centerfor Marine Conservation 1991), p. 1.Arrnentano, TV., RA. ParlL and L.C. CkxmarL “Impacts onCoastal Wetlands Throughout the Unittxl States,” in: Green-house Effect, Sea Level Rise, and Coastal Wetlands, EPA230-05-86-013, J.C. Titua (cd.) (WashirIgton+ DC: U.S. Envi-ronmental Protection Agency, Office of Policy, Planning andEviduatio@ hdy 1988).Arp, WJ., and B.G. Drake, “IncreasedPhotosynthetic Capacityof SciWus olneyi After 4 Years of Exposure to Elevated Co2, ”Plant, Ceil, and Environment, vol. 14, 1991, pp. 1003-6.Beaq MJ., “Waterfowl and Climate Change: A Glimpse intothe ‘Nventy-First Century,” Orion Nature Quurterly, spring1989, pp. 22-27.Bi@arn, G., E.H. Clark II, L.V. Haygoo& and M, IxMie (eds.),Issues in Wetlands Protection: Background Papers Preparedfor the National Wetlands Policy Forum, report prepardforl%eConservation Fouudatior.L WashingtorL DC, 1990.
8. Boo@ W., “Storm I&t Gash in Everglades’ HearL” TheWashington Post, Sept. 6, 1992, pp. 1, 14.
9. Brewer, R., The Science of Ecology (Phi.ladelphirx SaundersCollege Publishing, 1988).
10. Canning, DJ., Sea&velRisein Wmhington State: State-of-the-Knowledge, Impacts, and Potential Policy Issues, Version 2.1(Olympia, WA: Washington State Department of Ecology,Shorelands and Coastal Zone Management Prograuz 1992).
WETLANDS-FIRST STEPS■ Revise the Clean Water Act
-Make the wetland protection mandate specific in Section 404 or elsewhere.-Ensure that more land is set aside for protection or restoration than is destroyed.-Establish uniform standards for mitigation activities.
■ Develop and implement priority plans to coordinate wetland protection across agencies-Build on existing plans under various agencies (i.e., the U.S. Army Corps of Engineers, the Fish and
Wildlife Service, the Environmental Protection Agency, and the U.S. Department of Agriculture).—Direct agencies to use the priority plan in issuing permits (under Section 404 of the Clean Water Act)
and acquiring land and easements (through the Swampbuster and wetlands Reserve Program andother programs).
-Coordinate planning and management for wetlands at the watershed level.
■ Ensure that ail Federal policies and incentives are consistent with wetland protection—Extend the Coastal Barrier Resources Act to include coastal wetlands.—Require the Fish and Wildlife service to issue Volue 2 of The Impact of Federal Programs a report
mandated in the 1986 Emergency wetlands Resources Act.-Restore the wetlands Reserve Program at least to authorized levels; target wetlands in high-priority
areas.—Restore tax incentives to private landowners who grant conservation easements.
214 I Preparing for an Uncertain Climate--Volume 2
11. Castelle, A.J., C. Conolly, M. 13mersetal., WetlandB#ers: AnAnnotatedBibliography, report prepared for the Shorelands andCoastal Zone Management Prograrm Washington State Depart-ment of Ecology, Olymp@ WA Fctnuary 1992.
12. Castelle, A. J., C. Conolly, M Emers et aL, Wetland B@’ers:Use and Effectiveness, report prepared for the Shorelands andCoastal Zme Management ProgrwQ Washington State Depart-ment of Ecology, Olymp@ WA February 1992.
1 3 . Caatelle, A.J., S. Luchessa, C . Conolly et aL, WedandsMitigation Bartk”ng, report prepared for the Shorehmds andCoastal Zone Managemtmt PrognmL Washington State Depart-ment of Ecology, Olymp@ WA February 1992.
14. Chambers, J.R., National Marine Fisheries Service, Nationaloceanic and Atmospheric Admi.nistratioxL ‘U.S. Coastal Habi-tat Degradation and Fishery Deelines,” paper presented at the57th North American Wildlife and Natural Resources Confer-ence, Charlotte, NC, March 27-April 1, 1992. (To be publishedin Transactions of the North American Wildlife and NaturalResources Conference by the Wildlife Management Institute,Washingtorq DC.)
15. Chancy, E., W. Ehnore, and W,S. Platts, Livestock Grazing onWestern Riparian Areas, report prepared produced for the U. S.Environmental Protection Agency (Eagle, ID: Northwest Re-sources Information Center, Inc., 1990).
16. Coastal Ocean Policy Roundtable, The 1992 Coastal StatusReport:A Pilot Study of the U.S. Coastal Zone and Its Resources(NewarlL DE: Coastal Ocean Policy Roundtable, 1992).
17. Cohq J.P., ‘‘How Wet Must a Wetland Be?’ GovernmentExecutive, vol. 24, Mardi 1992, pp. 2CL25.
18. Congressional Research Service, Library of Congress, Oceanand Coastal Resources: A Btiejlng Book (Washington DC:Congressional Research Service, Library of Congress, Sept. 1,1992).
19, Cooper, C., Sensitivities of Western U.S. Ecosystems to ClimateChange, contractor report prepared for the Office of ‘lMmologyAssessment, 1992.
20. Copedand, C,, Fe&ral Wetlands Manual Revisions: Summaryof Interagency Team Reports (Washington DC: CongressionalI&sear& Service, Library of Congress, Feb. 25, 1992).
21. Council on Environmental Quality and Interagency AdvisoryCommittee on Environmental Trends, Environmental Trenak
(W-OIL DC: U.S. Government Printing 0t31ce, 1989).22. Cowar@ L.M., V. Carter, I?.C. GoleL and E.T. LaRoe,
Classljlcation of Wetlands and Deepwater Habitats of theUnitedStates, FWS/OBS-79/31 (WtA@tOq DC: U.S. DeP~-ment of the Interior, U.S. Fish and Wildlife Service, 1979).
23. Du TX., Wetlands Losses in the United States, 1780s to1980s, report to Congress (Washington DC: U.S. Departmentof the Interior, Fish and Wildlife Service, 1990).
24. Dt@ T&., and C.Il. JohnsorL Status and Trends of Wetlands inthe Contenninous United States, Mid-1970’s to Mid-1980’s
(w_oQ DC: U.S. Department of Interior, U.S. Fish andWildlife Service, 1991).
2S. Delar@ M.R., “No Net Loss of Wetlands: A ComprehensiveApproack’ Natural Resourctw and Environment, VOL 7,summer 1992, pp. 3-5.
26, Drake, B.G., “Effect of Elevated COZ on Chesapeake BayWetlands,” Responses of Vegetation to Carbon Dioxide, VOL51, April-November 1990.
27. Drake, B.G., Research Scientist Smithsonian EnvironmentalResearch Center, testimony at the Hcxuing on Global ChangeReaeamh: Global Warming and the Biosphere, before the SemiteCommittee on Commeree, Science, and ‘Mrqmtm“OIL April 9,1992.
28. Drew, L., “Wmngling for Change on the Range,” NationalWildl#e, February-March 1992, pp. 46,4849.
29. Edgertow L.T., The Rising Tide: Global Warnu”ng and WorldSea Levels (WashingtorL DC: Island Press, 1991).
30. Ellison+ J. C., “Climate Change and Sea-hnwl Rise Impacts on
_ve msyst~,” k Impacts of Climate Change onEcosystems and Species, R. Leemrms et aL (eds.) (Cambridge,England: Cambridge University Press, in press).
31. ErwirL K.L., An Evaluation of Wetland Mitigation in the SouthFlori& Water Management Dism”ct (1990), Volume 1, reportprepared for South Florida Water Management Distri@ July1991.
32. Federal Emergency Management Agency, Federal InteragencyFloodplain Managermmt ‘Ihsk Force, Floodplm”n Managementin the Um”ted States: An Assessment Report, Volume 2 ,1992-623-787/60303, prepared by L.R. Johnston Associates(waahingtoq DC: Us. GOvernme nt Printing Office, 1992).
33. Federal I.nterageney Committee for Wetland Delineation Fed-eral Manual for I&nn~ing and Delineating Jurisdim”onalWetlandi, cooperative technieal publicatio~ U.S. Army Corpsof Engineers, U.S. Environmental Protection Agency, U.S. Fishand Wildlife Service, and U.S. Department of Agriculture, SoilConservation Serviee (WashingtoIL DC: U.S. GovernmentPrinting ~lC%, 1989).
34. Federal Register, ‘‘Permits for ktivities in Navigable Watersor Ocean Waters,” Federal Register, vol. 40, No. 144, July 25,1975, pp. 3131943.
35. Fiel& D.W., A.J. Reyer, P.V. Genovese, and B.D. Shearer,Coastal Wetlands of the United States: An Accounting of aValuable National Resource, a special National Oceanic andAtmospheric A&mm“ “stration (NOAA) 20th anniversary report
(%hsh@toq DC: Department of Commerce, NOM February1991).
36. Flather, CH., and T.W. Hoeks~ An Analysis of the Wildlifeand Fish Situation in the United States: 1989-2040, General‘fkdMliCd Report RM-178 (wtlSh@tO~ DC: U.S. Departmentof Agriculture, September 1989).
37. Foster, C,W., and P.P. Rogera, “Rebuilding the Nation’sWetlands Heritage: A Challenge for the 1990s,” reporl of theHarvard Wetlands Policy Projeq Center for Science andInternational Affairs Discussion Paper 91-5, Revised (Cam-bridge, MA: Harvard University, John F. Kennedy School ofGovernment October 1991).
38. Gendler, lW, ‘‘lbwtud a Better Use of Coastal Resouxees:Coordinated State and Federal Plannin g Under the Coastal ZoneManagement Act,” Georgetown Law Journal, vol. 65, April1977, p. 1059.
Chapter 4–Wetlands I 215
39. Georgia Department of Community Affairs, “Minimum Stan-dards and procedures for Local Comprehensive Planning [toimplement Georgia Laws 1989],” Act 634 as amended by theBoard of Community Affairs (Atlan@ GA: Georgia Departmentof community Affairs, April 1992), pp. 1317-91.
40. Gillis, A. M., ‘‘Should Cows Chew Cheatgrass on Com-monlands?” Bioscience, vol. 41, No. 10, November 1991, pp.668-75.
4 1 . Goldsmit4 E., N, Hildyar4 P. Mccully, and P, Bunyar&Imperiled Planet: Restoring Our Endangered Ecosystems(Cambridge, MA: The MIT Press, 1990).
42. Goldstein, J., “Introduction” in: A National Policy of “NoNetLoss” of Wetlands: What do Agricultural Econonu”sts Have toConm”bufe?, AGES 9149, R.E. Heimlich (cd.) (WashingtonDC: U.S. Department of Agriculture, Economic ResearchService, Resource and ‘Ikdmology Division, 1991), pp. 1-3.
43. Gosselink, J.G., E.P. Odum, and RX, Pope, “The Wlue of theTidal kfarsk” Report No. LNJ-SG-74-03 (Baton Rouge, LkCenter for Wetland Resourecs, Louisiana State Univcssity,1974).
44. GruIke, N.E., G.H. Riechers, W.C. Oechel, U. Hjehm and C.Jaeger, “Carbon Balance in TUssoek ‘Ihmlra Under Ambientand Elevated Atmospheric COz, ” Oecologia, vol. 83, 1990, pp.485-94.
45. Heimlic& R.E. (cd.), A National Policy of “No Net Loss” ofWetlands: What Do Agricultural Econonu”sts Have to Conm”b-ute?, AGES 9149 (Washington DC: U.S. Ikp_~t ofAgriculture, Eamomic Research Semice, Resources and ‘Rzh-nology Divisio~ 1991).
46. liil~ C.L., B.J. Ryaq BA. McGregor, and M. RUS4 OurChanging Landscape: Indiana Dunes National Lakeshore, U.S.Geological Sumey CirculaT 1085, in: “Public Issues in EarthScience” series (Washington DC: Government Printing Olllce,1991).
47, Interagency Committee on Wetlands Restoration and CreatiouA National Program for Wetlands Restoration and Creation,report to the Policy Coordinating Group Interagency ‘lhsk Forceon Wetlands, August 1992.
48. I.ntergovernm ental Panel on Climate Change (WCC), WorldMeteorological Organiza tioq and United Nations EnvironmentPrograq Climate Change: The IPCC Impacts Assessment,report prepared for IPCC by Working Group II, WJ. McG.lkgart, G.W. Sheldoq and D.C. Griffi th (eds.) (CantiAustralia: Australian GOVfXXUIIC nt Publishing Service, 1990).
49. Intergovernmental Panel on Climate Change (lPCC), WorldMeteorological Orga.nizatioa and United Nations ~vironrnentpro- Climate Change: The IPCC Scientific Assessment,
report prep~ for KC by VV’Orking Group I, J.’K HoughtonjGJ. Jenkins, and JJ. Ephraums (eds.) (Cambridge, England:Cambridge University Press, 1990).
50. Jones, E., “The Coastal Barrier Resources Act: A CommonCents Approach to protection” Environmental Luw, vol. 21,1991, pp. 1015-80.
51. Joyce, L.A., An Analysis of the Range Forage Situation in theUnited States: J989-2040, a technical document supporting the1989 USDA Forest Service RPA Assessment General lkchni-eal Report RM-180 (Washington+ DC: U.S. Department ofAgriculture, Forest ServiIX, 1989).
52. ~ T.W., BJ. B- and M.L. Williams, “Charleston CaseStudy, “ in: Greenhouse Efect, Sea Level Rise, and CoastalWethnds, EPA 23&05-86-013, J.G. Titus (ML) (Washin@oqDC: U.S. Environmental Protection Agency, Office of policy,Planning and Evdu.atioIL July 1988), pp. 37-59.
53. ~ T.W., W.C. Eiser, BJ. Ba@ and M.L. Williams, “NewJersey Case Study, ” irx Greenhouse Effect, Sea LevelRise, andCoastal Wetlands, EPA 230-0586013, J.G. Titus (cd.) (Wash-@tow DC: U.S. Environmental Protection Agency, Oftlce ofpolicy, Planning and EvahuXiOm July 1988), pp. 61-86.
54. Keddy, PA., ‘‘WaterUvel Fluctuations and Wetland Consenw-tiorq” irx Wetlana3 of the Great Lakes: Protection andRestoration Policies; Status of the Science, Pmeed@s of anInternational Syrnposi~ J, Kusler and R. Smardon (eds.),Niagara Falls, NY, hhy 16-18, 1990, pp. 799-91.
55. Kenworthy, T, “How Wetlands Funda Dried Up,” TheWasha”ngton Post, Get. 7, 1992, p. A3.
56. Kundell JJ3., and S.W, Woolf, Georgia Wetlands: Trend andPolicy Options (Athens, GA: Carl Vinson Institute of Govern-ment University of Georg@ 1986).
57, Kusla, J.A., Our National Wetlands Heritage: A ProtectionGuidebook (Washin@oU DC: Environmatal Law Institute,1983).
58. Kuskr, J.A., “Wetlands Delineatioru An Issue of Scienee orPolitics?” Environment, vol. 34, March 1992, pp. 7-11,29-37.
59. Kusler, JA., and M.E. Kent@ Wet/and Creation andRestora-tion: The Status of the Science (Washingto~ DC: Island Press,1990)!
60. La.moq J.S. (cd.), Mo&ls for Assessment of FreshwaterWet/an&, publication No. 32 (AmhessL MA: University ofMassachusetts, Watcx Resources Research Center, 1976).
61. Liebe_ L.R., and P.T Hundemannj ‘‘Regulatory Standardsfor permits under Section 404,” Natural Resources andEnvironment, vol. 7, summer 1992, pp. 12-14, 56-58.
62. Louisiana Wetlands Protection Panel (LWPP), SavingLouisiana’s Coastal Wetlands: The Needfor a Long-Term Planof ti”on, EPA-23CW2-87-026, report of a panel convened bythe U.S. Environmental Protection Agency @PA) and theIJX1.isiana Geological Sumey at Grand Thrre Islax@ L& Sept.17-19, 1985 @hShiX@Oq DC: U.S. EPA April 1987).
63. McPhee, J., The Control of Nature (New Yodc Farrar, Stmus,Giroux, 1989).
64. Minello, TJ., and R.J. Zimmermam “The Role of EstumineHabitats in Regulating Growth and Swvival of Juvenile PenaeidShrimp,” h Frontiers of Shrimp Research, P. DeLoach, WJ.Dougherty, and MA. Davidson (eds.) (Amaterdarq The Nether-lands: Elsevier Seiencx Publishers, 1991), pp.1-16.
65. Nationalkademyof Scienee, Committee on Science, R@neer-ing, and Public Policy, Panel on Policy Implications ofGreenhouse Warming, Policy Implications of GreenhouseWhrnu”ng: Report of the Adaptation Panel, prepublicationmanuscript (Washington, DC: National Academy Press, 1991).
66. National Academy of Science, committee on Science, En@neer-
ing, ~ public PolicY, Poiiq I m p l i c a t i o n s o f ~WeWarming-Synthesis pane~ Policy Implications of GreenhouseWarnu”ng (WashingtorL DC: National Academy Press, 1991).

216 I Preparing for an Uncertain Climate--Volume
67.
68.
69.
70.
71.
72.
73.
74.
75.
76.
77.
78.
79.
80.
National Oceanic and Atmospheric Adnums‘ ‘ tration (NOAA),Coastal Wetlands of the United States: An Accounting of aValuable National Resources, a special NOAA 20th anniversaryreport (TWshi@ou DC: Department of Commerce, NO-February 1991).National Research Council (NRC), Committee on Restomtionof Aquatic Ecosystesns—— Science, lkcimology, and PublicPolicy, Water Science and Technology Board Commis sion onGeosciences, Environment and Resources, Restoration ofAquatic Ecosystems: Sa”ence, Technology, and Public Policy(Washington DC: National Academy Press, 1992).Niering, WA., “Endangere& Threatened and Rare WetlandPlants and Animals of the Continental United States, ” in: TheEcology and Management of Wetlands, Volume 1, Ecology ofWetland, D.D. Hook et al. (ed.s,) (Portlan& Ok Timber Press,1988).Odum, E.P., “The Mdue clf Wetlands: A Hierarchical Ap-proach,” in: Wetlands Functions and Values: The State of OurUnderstanding, Proceedings of the National Symposium onWetlanak, P. Greesom J.R.. CM and J.E. Clark (MIs.)(Minneapolis, MN: American Waters Resources Association1979).Odum, E.P., “Wetlands and Their %lues,” Journal of Soil andWater Conservation, vol. 38, 1983, p, 5.Oechel, W.C., and W.D. Billings, “Effectsof Global Change onthe Carbon Balance of Arctic Plants and Ecosystems,’ in: ArcticEcosystems in a Changing Climate: An EcophysiologicalPerspective, F.S, Chapin III, R.L. Jefferies, J1. Reynolds,G.R. Shaver, and J. Svoboda (eds.) (San Diego, CA: AcademicPress, 1992), pp. 139-68.P@ R.A., et al., “The Effects of Sca Level Rise on U.S.Coastal Wetlands,” in: The Potential Effects of Global ClimateChange in the U.S.: Appendix B-Sea Level Rise, J. Smith andD, Tirpak (eds.) (Washington, DC: U.S. Environmental Protec-tion Agency, 1989), pp. 1-1 to 1-55.Pa.& R.A., et al., The Effects of Sea Level Rise on U.S. CoastldWetlana3 and Lowlands, contractor report prepared for U.S.Environmental Protection Agency, Cooperative AgreementCR814578-01, September 1989.park R.A., J.K. Lee, and DJ. Canning, Potential Eflects of SeaLevel Rise on Washington State Wetlands, report prepared forWashington State Department of Ecology, Shorelands andCoastal Zone Management Program, OlympiiL WA, 1992.Poiani, KA., and W.C. Johnson, “Global Warming and PrairieWetlands: Potential Consequences for Waterfowl Habi@”Bioscience, vol. 41, No. 9, October 1991, pp. 611-18.President’s Commis sion on the American Outdoors, Amen.ca’sOutdoors: The Legacy, the Challenge (Wr@ingtoQ DC: IslandPress, 1987).Presser, N. S., G.G. Rdonski, i~d D.B. Rock.kmd, “A Review ofState Agencies’ Capabilities to Manage Marine RecreationalFisheries,” paper presented at the 118th Annual Meeting of theAmerican Fisheries Society, Toronto, Cana@ 1988 (Washing-ton, DC: Sport Fishing Institute, 1988).Roberts, L., “Wetlands Trading Is a Imer’s Game, SayEcologists,” Science, vol. 260, June 25, 1993, pp. [email protected], E. F., “Climate Change: High-Latitude Regions,” Cli-matic Change, vol. 15, 1989, pp. 223-53.
2
81.
82.
83.
84.
85.
86.
87.
88.
89.
90.
91.
92.
93.
94.
95.
%.
Salveso% D., Wetkwtds: Mitigating and Regulating Develop-ment Impacts (Wash.ingtoW DC: Urban Land Institutq 1990).Sandersq J.W., “Section 404: Federal Interference with Stateand Local Land Use?” Natural Resources and Ennronment,vol. 7, summer 1992, pp. 6, 8-9, 53-54.Sldpxnaq H., and D. Canning, “Vertical Land Movements inCoastal Washingtoru Implications for Coastal Erosion and SeaLevel Rise,” a Pper pmsmted at the 12th I.nt~tioxMIConference of the Coastal Society, San Antonio, TX, October1990.Smiti J.B., and D. Tirpak (eds.) The Potential Effects of GlobaZClimate Change on the United States, EPA-23W5-89-050(WUh@tOLL DC: U.S. Environmental protection Agency,December 1989),Sokolove, RD., and P.D. Huang, “Privatization of WetlandMitigation Banking,” Natural Resources andEnvironment, vol.7, summer 1992, pp. 36-38,6869.State of Maine, Department of Environmental ProtectiorL“Natural Resources Rotection Act: Coastal Sand Dune Rules,(hpter 355,” mViSCd JarL 4, 1988.Taylor, W.E., and D. Magee, “Should All Wetlands Be Subjectto the Same Regulation?” Natural Resources andEnw.ronment,vol. 7, summer 1992, pp. 32-35, 67-68.The Conservation Foundation Protecting America’s Wetlands:An Action Agenda, The Final Report of the National WetlandsPolicy Forum (Washington DC: The Conserv ation Foundation.L1988).Thorhang, A., and B, Miller, “Stemming the Loss of CoastalWetland Habitats: Jamaica as a Model for the TropicalDeveloping Countries?” Environmental Conservation, vol. 13,1986, p, 72.Tiner, R.W., Jr., Wetlat@ of the Um.ted States: Current Statwand Recent Trends, National Wetlands Invento~ (Waahin@orLDC: U.S. Department of the Interior, Fish and Wildlife Service,March 1984).Titus, J.G. (cd.), Greenhouse Eflect, Sea LevelRise, and CoastalWetlands, EPA 230-05-86-013 (WashingtoIL DC: U.S. Envirommental Protection Agency, Oftlce of Policy, Planning andEvlduatioq Jdy 1988).Titus, J,G., ‘Shategies for Adapting to the Greenhouse Etl~’APA Journal, ~CI 1990, pp. 311-23.
Titus, J.G., “Greenhouse Effect and Coastal Wetland Policy:How Americans Could Abandon an Area the Size of Massachu-setts at Minimum Cost” Environmental Management, vol. 15,No. 1, 1991, pp. 39-58.U.S. Army Corps of Engineers, Institute for Water Resources(IW’R), “IWR Review Report for U.S. Congress, Offke of‘Rchnology ksessmenc in Refexence to Draft Report onSystems at Risk from Climate Change,” IWR Policy Study93-PS-1, July 1993.U.S. Congress, Ofilce of lkchnology Assessment, Wetfanak:Their Use and Regulation, OTA-O-206 (WashingtoxL DC: U.S.Government Printing Office, March 1984).U.S. Department of Agriculture (USDA), Economic ResearchService, Farm Drainage in the United States: History, Status,and Prospects, Miscellaneous Publication 1455, G.A. Pavelis(cd.) (WashingtorL DC: USDA December 1987).
Chapter 4-Wetlands I 217
9’7. us. ~“t of @ ~ - @sDA)~ Fo=t s~ce~ A“Analysis of the Range Forage Situation in the United States:1989-2040, General ‘Ikchnical Report RM-180, a technicaldocument Suppmthlg the 1989 USDA Forest Service RPAAsessrnent, by L.A. Joyce (Washin@oq DC: USDA, 1989).
98. U.S. Depwtment of Agriculture (USDA), Forest Sewice, AnAnalysis of the Wildlife and Fish Situation in the Um”ted States:1989-20#0, General lkchnical Report RIM-178, a technicaldocument supporting the 1989 USDA Forest Service RPAAssesamen4 by C.H. Flather and T.W. Hoekstra (WasMngtoLDC: USDA 1989).
99. U.S. Department of Agriculture (USDA), Soil ConservationService, The Second RCA Appraisal: Soil, Water, and RelatedResources on Nonfederal Land in the United Stated nalysisof Conditions and Trendr, Misccllaruous publication 1482
(W-OW DC: USDA, June 1989, slightly revised blay1990).
1(M. U.S. Department of Commerce, Letter of Commen4 datedNov. 27, 1987, on the Sept. 1, 1987, Dmft National WetlandsPriority Ptan.
101. U.S. Department of Commerce, National Oceanic and Atmos-pheric Admml“ “stration (NOW), National Marine FisheriesSewice (NMFS), Fisheries of the United States, 1990, CurrentFishery Stm”stics No. 9000 (Silver Spring, MD: FisheriesStatistics Diviaioq NMFS, NOW May 1991).
102. U.S. Department of the Interior (DOI), The Impact of Fe&raZPrograms, Volume 1: The Lower h4ississippi Alluvial Plainand the Prairie Pothole Region, a report to Congress by the
Secretary of the Interior, October 1988.103. U. S. Department of the Interior (D(X), Bureau of Land
Management Fish and Wildl~e 2000: Annual Report ofAccomplishments FY 1991 (WashingtorL DC: GovernmentPrinting Office, 1991).
104. U.S. Department of the Interior (DOI), Bureau of Landkfanagemen~ Fish and Wildlife 2000: Special Status FishesHabitat Management, BLM/SC/PT-91~5+6844 (Washing-ton DC: Government Printing ~ce, May 1991).
105. U.S. Department of the Interior 0201), Bureau of LandManagement Riparian-Wetkmd Initiative for the 1990’s,BLM/WO/GI-91/001 +4340 @bShhl@O~ DC: B u r e a u o fLand lvfanagemen~ September 1991).
106. U.S. Department of the Interior (DOI), Fish and WildlifeService (FWS), An Overview of Major WetlandFunctions andValues, FWS/OBS-84/18, contractor paper prepared by J.H.Sather and R.D. Smith (wNhillgtOu DC: U.S. DOI, FWS,September 1984).
107. U.S. Department of the Interior (DOI), Fish and WildlifeService (FWS), National Wetlands Priority Conservation Plan@hShiKl@O~ DC: U.S. DOI, FWS, Apti 1989).
108. U.S. Department of the Interior (XXX), Fish and WildlifeService (FWS), Wetlands: Meeting the President’s Challeng*1990 Wetlands Action Plan (Washington, DC: U.S. DOI,Fws, 1990).
109. U.S. Environmental Protection Agency (EPA), Nationa/ WaterQuality Inventory 1990 Report to Congress (WashingtoIL DC:Us. EPA 1992).
110. Us. Generalkmunting Office (GAO), RangeIand Manage-ment: BLMEfforts to Prevent Unauthorized Livestock Gram-ngNeed Strengthening, GAO/RCED-91-17 (WS.SMI@OU ~:GAO, Decemba 1990).
111. U.S. General Accounting Office (GAO), Rangeland Manage-tnent: Forest Service Not Perfornu”ng Needed Monitoring ofGrazing AUotntents, GAO/RCED-91-148 (Washington DC:GAO, my 1991).
112. Us. General Accounting O!Twe (GAO), WetZands Ovem”ew:Fe&ral and State Policies, Legislation, and Programs,GAO/RCED-92-79Fs (l%shingtom DC: U.S. GAO, NovCf”-b e r 1 9 9 1 ) .
1 1 3 . Mm Sickle-Burkem V . , e t a l . , N a t i o n a l W e t l a n d s R e s e a r c hCenter, U.S. Fish and Wildlife %-vice, tables describingcoastal wetland vulnexabilities to climate change, pxqxu-ed forU.S. Offkz of lkchnology Assessmen4 May 1992.
114. Warrenj R, S., Coastal W2tland Vulnerabilities to ClimateChange, contractor paper prepared for the Office of lkchnol-ogy Assessment, July 1992.
115. Water Quality 2000, A National Water Agenda for the 21stCentury: Final Report (Alexan@ VA: Water EnvironmentFoundatio~ater Quality 2000, November IW).
116. WhigbanL D.F., and M.M. Brinson, ‘‘Wetland Value Im-pacts,” in: Wetlands and Shallow Continental Water Boch”es,Vohme 1, B.C. Patten et al. (c&) (The Hague, The Nether-hdS: SPB ACSdCI”iC PubIiahing, 1990), pp. W1-21.
117. WilkinsoL C.F., The Eagle Bird: Mapping a New West (NewYork Pantheon Books, 1992).
118. Willard, D.E., and L.D. Kosmon4 ‘‘A Watershed-EcosystemApproach to bind and Water Use Planning and Management”draft contractor paper prepared for the OfYicc of ‘RzhnoIogyASSeSSf”CXltj August 1992.
119. Willar&D.E., C.P. Wolfe, and A.G.B. Primack ‘‘l’he Peculiarbut Widespread Problem of Alte@ Degrad~ or DistiWetlands,” paper presented at an Association of State WetlandManagers meeting, Oakland, @ 1991.
120. WillarA D.E., et al., “Wetland Vulnerabilities to ClimateChange,” contractor paper prepared for the Offlce of lkchnol-ogy Assessment, August 1992.
121. Winter, T.C., “A Physiographic and Climatic Framework forHydrological Studies of Wetlands,’ in: Aquatic Ecosystems inSenu”-Arid Regions: Implications for Resource Management,National Hydrology Research Institute Symposium Series #7,R.D. Robards a n d M L . Bothwell (eds.) (Saskatoom Sas-katchewan Cana@ Environment Canada, 1992), pp. 12748.
122. Wise, J.P., Federal Conservation and Management of MarineFisheries in the Um”ted States (Washingto& DC: Center forMarine Conscrvatioq 1991).
123. WisheW I.C., et al., “Effects of Eutrophication on WetlandVegetatio~” im Wetlands of the Great Lakes: Protection andRestoration Policies; Status of the Science, Proceedings of anInternational Symposiuq J.L. Kusler and R. Swardon (eds.),Niagara Falls, NY, h&y 16-18, 1990, pp. 112-21.
124. Wood, LD., “Federal Wetland Regulation is Essential,”Natural Resources and Environment, vol. 7, summer 1992, pp.7, 1011,54-56.
218 I Preparing for an Uncertain Climate--Volume 2
125. Zallm M., ‘The Mitigation Agrccmcnt-A Major Develop-ment in Wetland Rcguladom” Natud Resources and Envi-ronment, vol. 7, summer 19W, pp. 19-21, 60-62.
126. Zedler, JB., “m ChaUenge of Protecting EndangeredSpecies Habitat Along tho Southern California coast CoastalMunagemenr, vol. 19, 1991, pp. 35-53.
127, Zcdler, J1l., “Coastal Wetlands: Multiple Management Protxlcma in Southern Californ@” paper prcstntcd at the MultipleUsa of the Coastal ZOm in a Chan@g World Symposi~sponaod by the National Academy of Science, Commissionon~ Environment and Resources, woods Hole,m June 1992.
128. Zedkr, PH., “The Ecology of Southcm California VernalPools: A Community Profile,” Biological Reporter, VOL 85(7.11), 1987.
129. Zimm~ RJ., ‘IV. MillCllO, E.P. _ and J.M. Nance,“Effbcta of Accelerated Sea-Level Rise on Coastal Secondaryproducti~” im Coastal Wetlandk: Coastal Zone ’91 Cor@er-ence, H.S. Bolton and O.T. Magoon (da.), proceedings ofumferczm held by the American Society of Civil E@neera(ASCE), ~ B- CA JUly 1991.
130. Zi~ LH., B.G. Drake, and S. chambcr~ “Imng-WrmPhotoayntbctic Response in Single Leaves of a ~ and C, SaltMarsh Spccica Grown at Blcvatod Atmospheric COZ in situ,”Oecologia, VOL 83, 1990, pp. 469-72.
Preserves:FederallyProtected
NaturalAreas 5
Status■ Represent and protect the best of the Nation’s natural heritage.■ Repository for the Nation’s rarest species and for conserving
biodiversity.■ Threatened by human activity.
The Climate Change Problem■ A shifting climate ‘‘map’ over protected areas with fixed
boundaries.
What Is Most Vulnerable?■ Areas that are small, isolated, fragmented, under other stress.■ Areas containing climate-sensitive species or ecosystems.■ Some biodiversity loss likely.
Impediments■ Many levels of institutional and landscape fragmentation.■ Lack of knowledge.
Types of Responses■ Ideal responses (if we had the information): 1) maintain species
and/or ecosystems “in place”; 2) help them move.n Realistic responses (given gaps in our knowledge): 1) acquire
needed information (basic research, inventorying, monitoring);2) manage the areas to minimize impediments to adaptation andto increase resiliency of natural areas (through direct Federalaction, indirect Federal action, partnerships).
I
2 1 9
220 I Preparing for an Uncertain Climate--Volume 2
OVERVIEWSetting aside large areas of land to protect their
natural qualities and processes has become acentral strategy in preserving the American heri-tage. As long ago as the early 1800s, prominentAmerican writers and artists envisioned the pres-ervation of parts of the wild, undeveloped frontierand voiced their concern about the destructiveeffects of western expansion. The establishmentof Yellowstone National Park in 1872 marked thebeginning of putting these ideals into practice(157). Since then, the Federal Government hasestablished several systems of reserved lands(e.g., the National Parks, the National WildernessPreservation System, and National Wildlife Ref-uges) and special management agencies (e.g., theNational Park Service and the Fish and WildlifeService) to administer and protect valued re-sources (see box 5-A).1 Federally protected natu-ral areas have become a repository for theNation’s rarest species and for conserving biolog-ical diversity. Over 240 million acres (97 millionhectares) 2 are now held by the Federal Gover-nment specifically to ensure the protection ofwildlife, aesthetic beauty, or other natural attrib-utes for the enjoyment of future generations.Nearly $3 billion is spent annually to manage,maintain, restore, and protect these lands. Climatechange may threaten this substantial nationalinvestment in protecting natural areas.
Projected rates of climate change are fasterthan any that have occurred on a global scale overthe past 10,000 years-since the last ice age (57).Climate regimes could shift dramatically.3 Whetherplants and animals accustomed to a particularclimate regime will be able to adjust to climatechange is uncertain (see ch. 2). The opportunitiesfor species to respond by migrating or adaptingmay be limited; species in small, isolated, frag-
mented areas may be particularly at risk. Theclimate “map” that has helped shape the distinc-tive vegetation and wildlife of many reserves willshift, while the boundaries of the protected areasremain freed. Some reserves may be ‘‘left be-hind,” incapable of providing the benefits orserving the functions for which they were origi-nally established, such as providing protection forrare species or supporting wildlife-related recrea-tion (see fig. 5-l). It may become too costly orimpossible to protect certain species. To protectother plant and animal species, land-managementagencies might find it necessary to undertakeincreasingly aggressive approaches to manage-ment (see box 5-B).
To compound the problems, many natural areashave already become threatened by forces withinand outside their boundaries. Population growthhas led to development pressures, growing visitoruse, and increased geographic fragmentation ofnatural areas. Institutional fragmentation, withthe management structure governing Federallands dispersed across several agencies and hav-ing no unifying goal, has in some cases alsocompromised preservation efforts. Boundaries ofprotected areas are somewhat artificially fixed,with many surrounded by actively managed ordeveloped lands. With growing fragmentation, itwill be increasingly difficult for natural areas toadapt to the stresses of climate change.
Given the vast amount of uncertainty surround-ing climate change and natural area responses, themost sensible ways to prepare for climate changein federally protected natural areas today are to:1) improve information gathering, and 2) enhanceprotection of federally protected areas and theirresources.
1 The National Wilderness Preservation System is administered by four Federal agencies: the U.S. Department of Agriculture’s ForestServiee and the Department of the Interior’s Bureau of I-and Management National Park Service, and Fish and Wildlife Semice.
z ~ ~nve~ acres to hectares, :multiply by 0.45.3 A warming of 5.4 “F (3 “C) over the next century would shift climatic regimes perhaps 200 to 300 miles (300 to 500 kilometers) northward
or 1,600 feet (5(X) meters) in elevation (58, 96, 172).
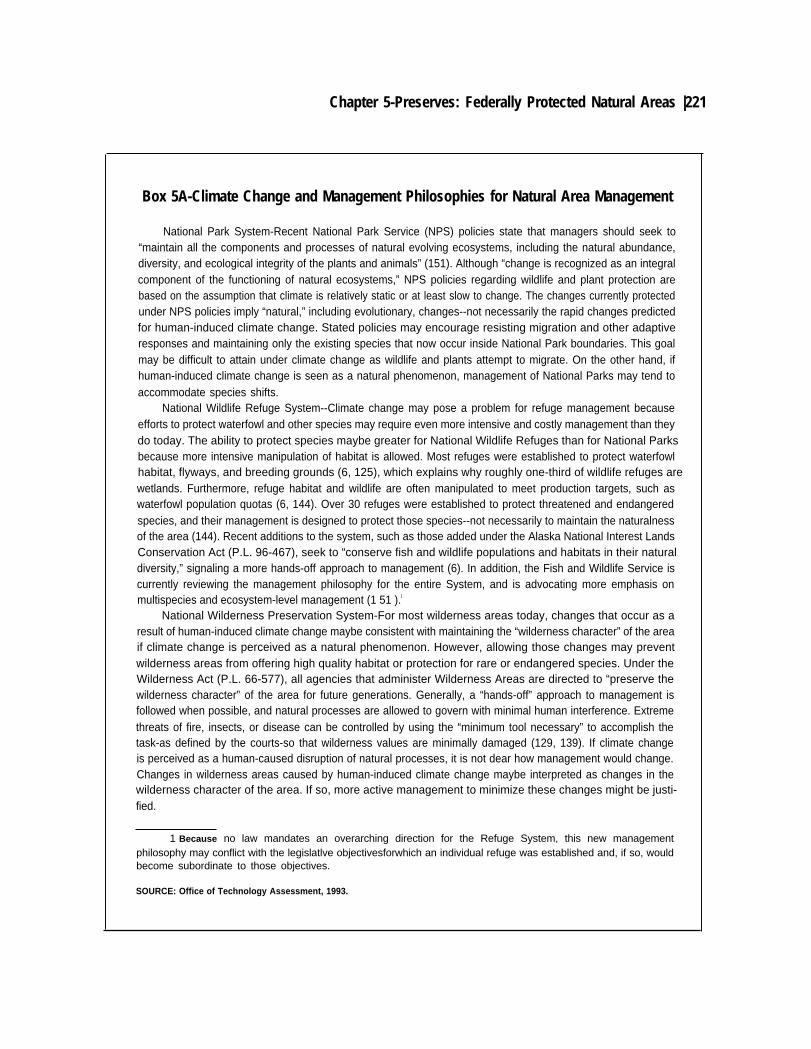
Chapter 5-Preserves: Federally Protected Natural Areas |221
Box 5A-Climate Change and Management Philosophies for Natural Area Management
National Park System-Recent National Park Service (NPS) policies state that managers should seek to“maintain all the components and processes of natural evolving ecosystems, including the natural abundance,diversity, and ecological integrity of the plants and animals” (151). Although “change is recognized as an integralcomponent of the functioning of natural ecosystems,” NPS policies regarding wildlife and plant protection arebased on the assumption that climate is relatively static or at least slow to change. The changes currently protectedunder NPS policies imply “natural,” including evolutionary, changes--not necessarily the rapid changes predictedfor human-induced climate change. Stated policies may encourage resisting migration and other adaptiveresponses and maintaining only the existing species that now occur inside National Park boundaries. This goalmay be difficult to attain under climate change as wildlife and plants attempt to migrate. On the other hand, ifhuman-induced climate change is seen as a natural phenomenon, management of National Parks may tend toaccommodate species shifts.
National Wildlife Refuge System--Climate change may pose a problem for refuge management becauseefforts to protect waterfowl and other species may require even more intensive and costly management than theydo today. The ability to protect species maybe greater for National Wildlife Refuges than for National Parksbecause more intensive manipulation of habitat is allowed. Most refuges were established to protect waterfowlhabitat, flyways, and breeding grounds (6, 125), which explains why roughly one-third of wildlife refuges arewetlands. Furthermore, refuge habitat and wildlife are often manipulated to meet production targets, such aswaterfowl population quotas (6, 144). Over 30 refuges were established to protect threatened and endangeredspecies, and their management is designed to protect those species--not necessarily to maintain the naturalnessof the area (144). Recent additions to the system, such as those added under the Alaska National Interest LandsConservation Act (P.L. 96-467), seek to “conserve fish and wildlife populations and habitats in their naturaldiversity,” signaling a more hands-off approach to management (6). In addition, the Fish and Wildlife Service iscurrently reviewing the management philosophy for the entire System, and is advocating more emphasis onmultispecies and ecosystem-level management (1 51 ).l
National Wilderness Preservation System-For most wilderness areas today, changes that occur as aresult of human-induced climate change maybe consistent with maintaining the “wilderness character” of the areaif climate change is perceived as a natural phenomenon. However, allowing those changes may preventwilderness areas from offering high quality habitat or protection for rare or endangered species. Under theWilderness Act (P.L. 66-577), all agencies that administer Wilderness Areas are directed to “preserve thewilderness character” of the area for future generations. Generally, a “hands-off” approach to management isfollowed when possible, and natural processes are allowed to govern with minimal human interference. Extremethreats of fire, insects, or disease can be controlled by using the “minimum tool necessary” to accomplish thetask-as defined by the courts-so that wilderness values are minimally damaged (129, 139). If climate changeis perceived as a human-caused disruption of natural processes, it is not dear how management would change.Changes in wilderness areas caused by human-induced climate change maybe interpreted as changes in thewilderness character of the area. If so, more active management to minimize these changes might be justi-fied.
1 Because no law mandates an overarching direction for the Refuge System, this new managementphilosophy may conflict with the legislatlve objectivesforwhich an individual refuge was established and, if so, wouldbecome subordinate to those objectives.
SOURCE: Office of Technology Assessment, 1993.
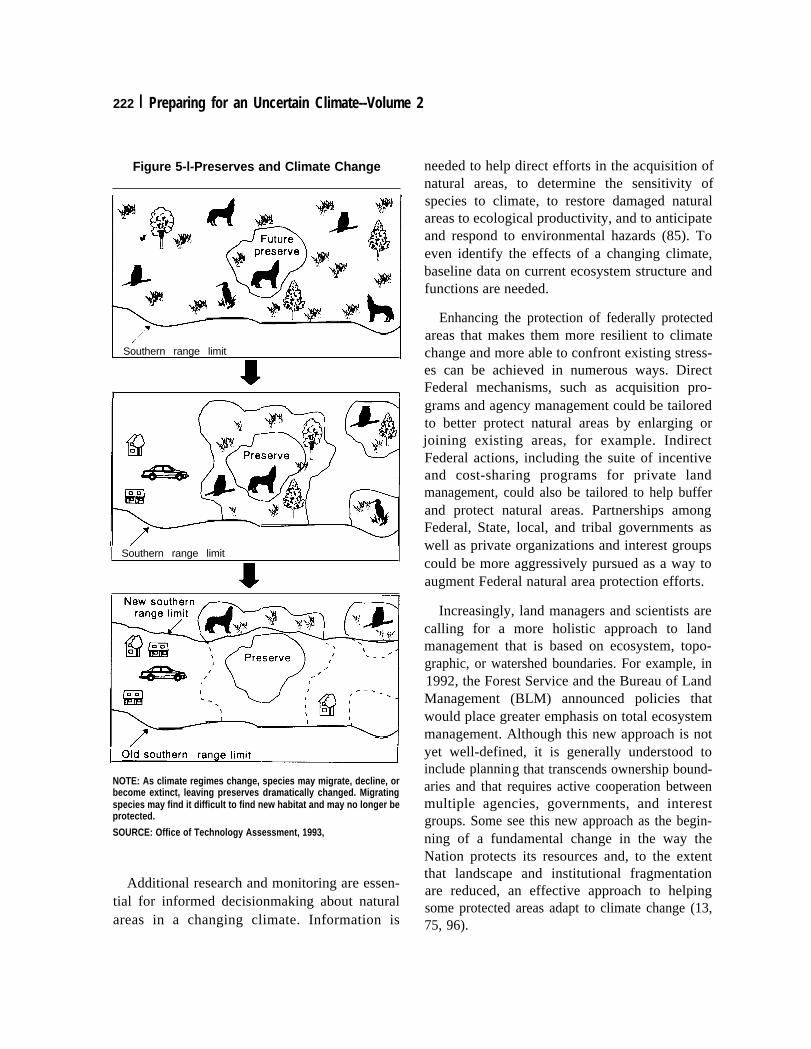
222 I Preparing for an Uncertain Climate--Volume 2
Figure 5-l-Preserves and Climate Change
I Southern range limit I
*I f
I Southern range limit
$
I “dsouthernr ange’’mit ~NOTE: As climate regimes change, species may migrate, decline, orbecome extinct, leaving preserves dramatically changed. Migratingspecies may find it difficult to find new habitat and may no longer beprotected.
SOURCE: Office of Technology Assessment, 1993,
Additional research and monitoring are essen-tial for informed decisionmaking about naturalareas in a changing climate. Information is
needed to help direct efforts in the acquisition ofnatural areas, to determine the sensitivity ofspecies to climate, to restore damaged naturalareas to ecological productivity, and to anticipateand respond to environmental hazards (85). Toeven identify the effects of a changing climate,baseline data on current ecosystem structure andfunctions are needed.
Enhancing the protection of federally protectedareas that makes them more resilient to climatechange and more able to confront existing stress-es can be achieved in numerous ways. DirectFederal mechanisms, such as acquisition pro-grams and agency management could be tailoredto better protect natural areas by enlarging orjoining existing areas, for example. IndirectFederal actions, including the suite of incentiveand cost-sharing programs for private landmanagement, could also be tailored to help bufferand protect natural areas. Partnerships amongFederal, State, local, and tribal governments aswell as private organizations and interest groupscould be more aggressively pursued as a way toaugment Federal natural area protection efforts.
Increasingly, land managers and scientists arecalling for a more holistic approach to landmanagement that is based on ecosystem, topo-graphic, or watershed boundaries. For example, in1992, the Forest Service and the Bureau of LandManagement (BLM) announced policies thatwould place greater emphasis on total ecosystemmanagement. Although this new approach is notyet well-defined, it is generally understood toinclude planning that transcends ownership bound-aries and that requires active cooperation betweenmultiple agencies, governments, and interestgroups. Some see this new approach as the begin-ning of a fundamental change in the way theNation protects its resources and, to the extentthat landscape and institutional fragmentationare reduced, an effective approach to helpingsome protected areas adapt to climate change (13,75, 96).
Chapter 5-Preserves: Federally Protected Natural Areas | 223
Box 5-B-The Strategic Dilemma for Protecting Natural Areas Under Climate Change
To minimize Ioss of the investment in natural areas and their resources, Federal agendas may ultimately needto change their management approach to one that runs counter to currently prevailing approaches. Becauseclimate change may tend to change the composition of animals and vegetation in natural areas, managementpolicies that seek to protect the status quo at any cost as well as those that allow unlimited change will be calledinto question. The “moving map” imposed by climate change will make each type of management scheme moredifficult to implement- Current philosophies are based on a relatively constant mean climate. Climate change willshift this mean climate with year-to-year weather variations. Climate change will shift this mean. Subsequentchanges in natural resources and processes might not be easily addressed under management strategies thatare based on the assumption of a relatively static climate.
Areas valued for their ecological processes may require more manipulation and intensive management tosave valued resources. Agencies may have to develop contingency plans to facilitate change in managementdirection when necessary. Three very general approaches to natural area protection are possible under climatechange: 1) maintain existing species composition, 2) maintain some species in place and allow change for others,and 3) allow climate change impacts to occur.
Strategy 1: Maximize efforts to preserve current species composition-No management schemegoverning Federal protected natural areas fully embraces this philosophy, although management of the NationalPark System in the 1960s advocated this approach. NPS policies were influenced by the 1963 Leopold Report,which suggested that the overriding goal for National Park management should be to preserve “pre-settlement”pristine conditions (88, 172). Hence, management policies favored protection of species historically living in thepark and directed active restoration of areas damnaged by’’post-settlement” activities. Although emphasis is stillon maintaining the historical mix of species in National Parks, most recent National Park Service (NPS) policiesalso seek to protect evolutionary change and shifting natural processes. The overall goal is to maintain a healthyecosystem.
Maintaining the status quo may be important for protecting rare species and communities and for maintainingbiodiversity now. However, climate changes of the rate and magnitude predicted by scientists could causechanges in vegetation and species mixes that would make maintaining historical communities increasingly difficultand costly. Such preservation efforts may run counter to natural processes that are pushing for ecosystem change.Because of new developments in the scientific understanding of ecological communities, this strategy is currentlybeing questioned even without considerations of climate change (88, 104).
To implement this strategy under climate change, more hands-on, intensive management will be required tostave off nonnative or opportunistic species invasions, fight unnatural pests and disease, and possibly preventfires. Given the Nation’s experience with protecting endangered species, the costs of preserving entire ecosystemsby similar “brute force” will likely become prohibitive. Thresholds might have to be set to determine when toterminate preservation efforts for some areas. To best manage resources under this strategy, research effortsshould focus on understanding how communities interact with-each other, respond to stress, and adapt to change.
Strategy 2: Preserve some species in place and allow change for others--Although this is not an officialmanagement strategy for any Federal land-management agency today, it is by default the primary method ofmanagement in National Wildlife Refuges. A National Midlife Refuge is generally managed to preserve a specificcommunity or species so management may allow change in other resources as long as the primary refugeobjective is not adversely affected. In addition, areas that contain endangered species are required by theEndangered Species Act {P.L 93-205) to provide protection for these species despite other managementobjectives. Still, the costs of protection for even a single species can be extremely high (see box 5-Don theexpenditures of endangered species recovery programs).
To implement this strategy in the future, research will be needed to identify what species should or can beprotected in an evolving habitat and which species could migrate. For migrating species, corridor theory and design
(Continued on next page)
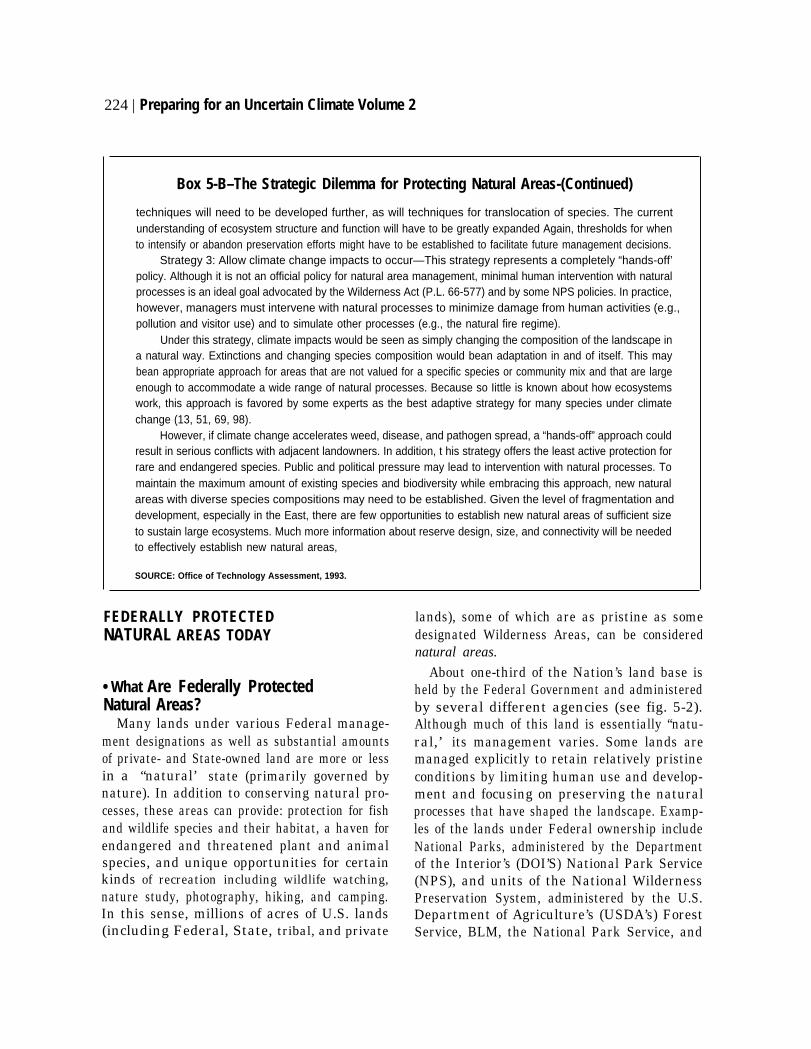
224 | Preparing for an Uncertain Climate Volume 2
Box 5-B–The Strategic Dilemma for Protecting Natural Areas-(Continued)
techniques will need to be developed further, as will techniques for translocation of species. The currentunderstanding of ecosystem structure and function will have to be greatly expanded Again, thresholds for whento intensify or abandon preservation efforts might have to be established to facilitate future management decisions.
Strategy 3: Allow climate change impacts to occur—This strategy represents a completely “hands-off’policy. Although it is not an official policy for natural area management, minimal human intervention with naturalprocesses is an ideal goal advocated by the Wilderness Act (P.L. 66-577) and by some NPS policies. In practice,however, managers must intervene with natural processes to minimize damage from human activities (e.g.,pollution and visitor use) and to simulate other processes (e.g., the natural fire regime).
Under this strategy, climate impacts would be seen as simply changing the composition of the landscape ina natural way. Extinctions and changing species composition would bean adaptation in and of itself. This maybean appropriate approach for areas that are not valued for a specific species or community mix and that are largeenough to accommodate a wide range of natural processes. Because so Iittle is known about how ecosystemswork, this approach is favored by some experts as the best adaptive strategy for many species under climatechange (13, 51, 69, 98).
However, if climate change accelerates weed, disease, and pathogen spread, a “hands-off” approach couldresult in serious conflicts with adjacent landowners. In addition, t his strategy offers the least active protection forrare and endangered species. Public and political pressure may lead to intervention with natural processes. Tomaintain the maximum amount of existing species and biodiversity while embracing this approach, new naturalareas with diverse species compositions may need to be established. Given the level of fragmentation anddevelopment, especially in the East, there are few opportunities to establish new natural areas of sufficient sizeto sustain large ecosystems. Much more information about reserve design, size, and connectivity will be neededto effectively establish new natural areas,
SOURCE: Office of Technology Assessment, 1993.
FEDERALLY PROTECTED lands), some of which are as pristine as someNATURAL AREAS TODAY
• What Are Federally ProtectedNatural Areas?
Many lands under various Federal manage-ment designations as well as substantial amountsof private- and State-owned land are more or lessin a ‘‘natural’ state (primarily governed bynature). In addition to conserving natural pro-cesses, these areas can provide: protection for fishand wildlife species and their habitat, a haven forendangered and threatened plant and animalspecies, and unique opportunities for certainkinds of recreation including wildlife watching,nature study, photography, hiking, and camping.In this sense, millions of acres of U.S. lands(including Federal, State, tribal, and private
designated Wilderness Areas, can be considerednatural areas.
About one-third of the Nation’s land base isheld by the Federal Government and administeredby several different agencies (see fig. 5-2).Although much of this land is essentially “natu-ral,’ its management varies. Some lands aremanaged explicitly to retain relatively pristineconditions by limiting human use and develop-ment and focusing on preserving the naturalprocesses that have shaped the landscape. Examp-les of the lands under Federal ownership includeNational Parks, administered by the Departmentof the Interior’s (DOI’S) National Park Service(NPS), and units of the National WildernessPreservation System, administered by the U.S.Department of Agriculture’s (USDA’s) ForestService, BLM, the National Park Service, and
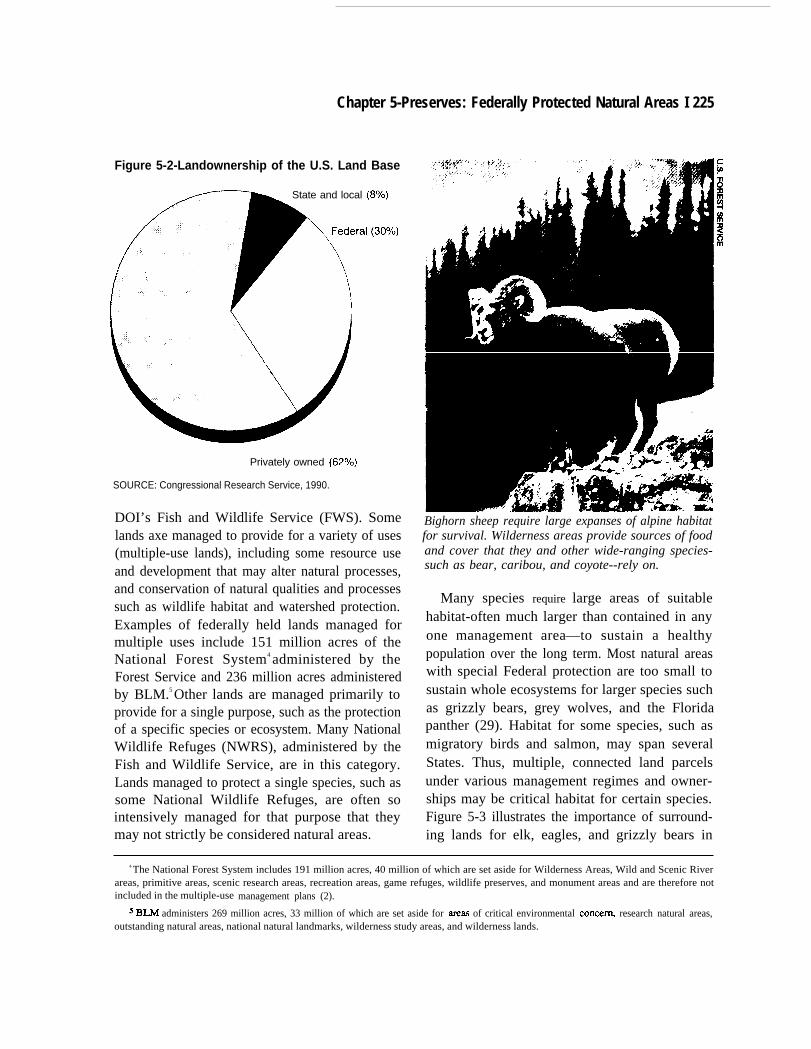
Chapter 5-Preserves: Federally Protected Natural Areas I 225
Figure 5-2-Landownership of the U.S. Land Base
State and local (8’Yo)
Privately owned (62Yo)
SOURCE: Congressional Research Service, 1990.
DOI’s Fish and Wildlife Service (FWS). Somelands axe managed to provide for a variety of uses(multiple-use lands), including some resource useand development that may alter natural processes,and conservation of natural qualities and processessuch as wildlife habitat and watershed protection.Examples of federally held lands managed formultiple uses include 151 million acres of theNational Forest System4 administered by theForest Service and 236 million acres administeredby BLM.5 Other lands are managed primarily toprovide for a single purpose, such as the protectionof a specific species or ecosystem. Many NationalWildlife Refuges (NWRS), administered by theFish and Wildlife Service, are in this category.Lands managed to protect a single species, such assome National Wildlife Refuges, are often sointensively managed for that purpose that theymay not strictly be considered natural areas.
Bighorn sheep require large expanses of alpine habitatfor survival. Wilderness areas provide sources of foodand cover that they and other wide-ranging species-such as bear, caribou, and coyote--rely on.
Many species require large areas of suitablehabitat-often much larger than contained in any
—to sustain a healthyone management areapopulation over the long term. Most natural areaswith special Federal protection are too small tosustain whole ecosystems for larger species suchas grizzly bears, grey wolves, and the Floridapanther (29). Habitat for some species, such asmigratory birds and salmon, may span severalStates. Thus, multiple, connected land parcelsunder various management regimes and owner-ships may be critical habitat for certain species.Figure 5-3 illustrates the importance of surround-ing lands for elk, eagles, and grizzly bears in
4 The National Forest System includes 191 million acres, 40 million of which are set aside for Wilderness Areas, Wild and Scenic Riverareas, primitive areas, scenic research areas, recreation areas, game refuges, wildlife preserves, and monument areas and are therefore notincluded in the multiple-use management plans (2).
S B~ administers 269 million acres, 33 million of which are set aside for areas of critical environmental concerq research natural areas,outstanding natural areas, national natural landmarks, wilderness study areas, and wilderness lands.
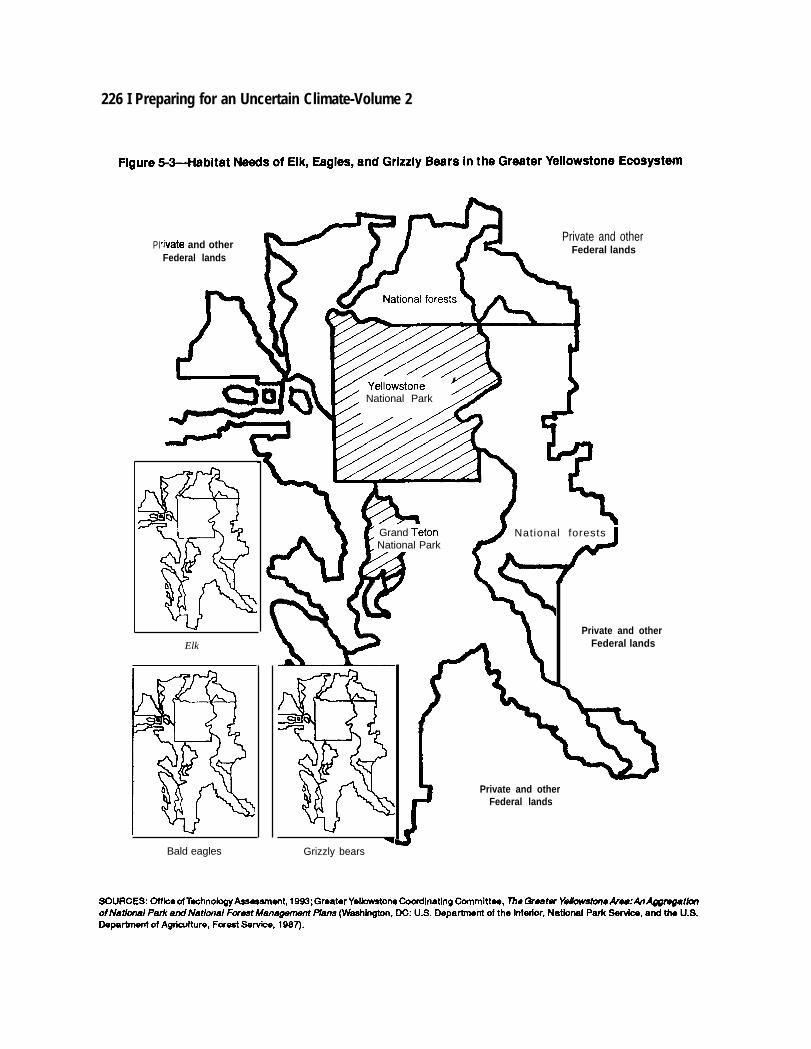
226 I Preparing for an Uncertain Climate-Volume 2
PIPrivate and other
rwate and other Federal landsFederal lands
Elk
Bald eagles
9~ YellowStone ‘z, National Park
ifGrand Teton > National forests ~
k National Park 1
-Grizzly bears
Private and otherFederal lands
1’ Private and otherFederal lands
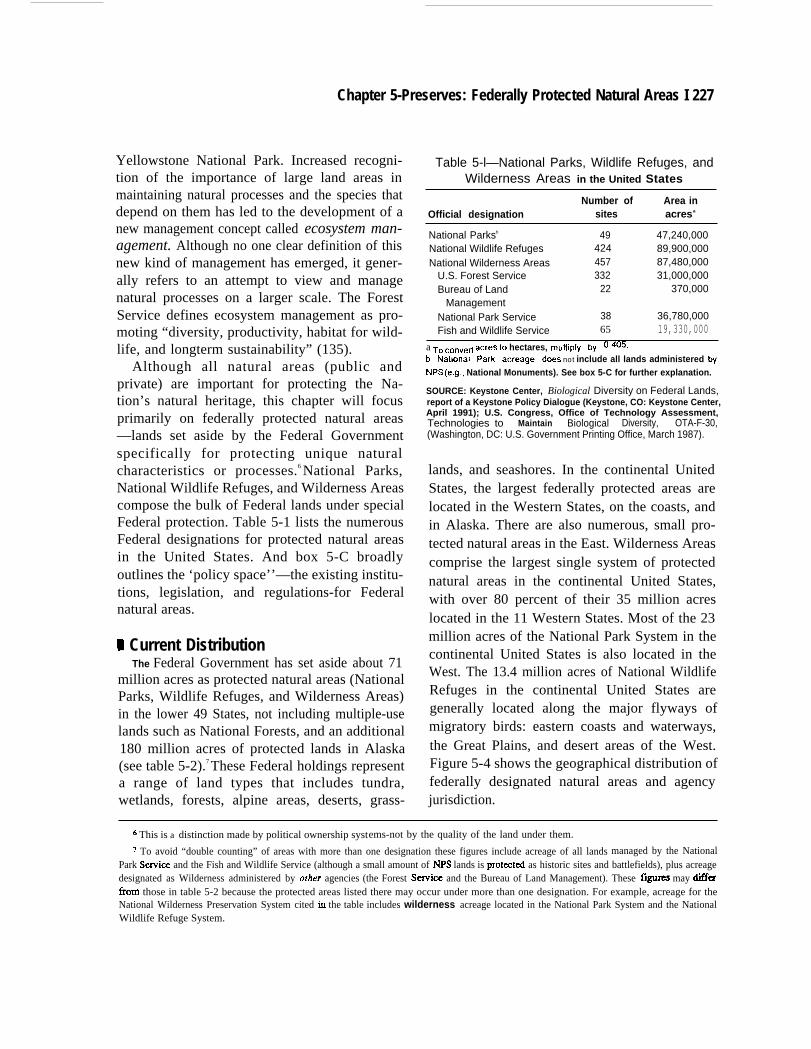
Chapter 5-Preserves: Federally Protected Natural Areas I 227
Yellowstone National Park. Increased recogni-tion of the importance of large land areas inmaintaining natural processes and the species thatdepend on them has led to the development of anew management concept called ecosystem man-agement. Although no one clear definition of thisnew kind of management has emerged, it gener-ally refers to an attempt to view and managenatural processes on a larger scale. The ForestService defines ecosystem management as pro-moting “diversity, productivity, habitat for wild-life, and longterm sustainability” (135).
Although all natural areas (public andprivate) are important for protecting the Na-tion’s natural heritage, this chapter will focusprimarily on federally protected natural areas—lands set aside by the Federal Governmentspecifically for protecting unique naturalcharacteristics or processes.6 National Parks,National Wildlife Refuges, and Wilderness Areascompose the bulk of Federal lands under specialFederal protection. Table 5-1 lists the numerousFederal designations for protected natural areasin the United States. And box 5-C broadlyoutlines the ‘policy space’’—the existing institu-tions, legislation, and regulations-for Federalnatural areas.
9 Current DistributionThe Federal Government has set aside about 71
million acres as protected natural areas (NationalParks, Wildlife Refuges, and Wilderness Areas)in the lower 49 States, not including multiple-uselands such as National Forests, and an additional180 million acres of protected lands in Alaska(see table 5-2).7 These Federal holdings representa range of land types that includes tundra,wetlands, forests, alpine areas, deserts, grass-
Table 5-l—National Parks, Wildlife Refuges, andWilderness Areas in the United States
Number of Area inOfficial designation sites acresa
National Parksb 49 47,240,000National Wildlife Refuges 424 89,900,000National Wilderness Areas 457 87,480,000
U.S. Forest Service 332 31,000,000Bureau of Land 22 370,000
ManagementNational Park Service 38 36,780,000Fish and Wildlife Service 65 19,330,000
a T. ~.nve~ acres to hectares, multiply by 0405b National park acreage does not include all lands administered byNPS (e.g., National Monuments). See box 5-C for further explanation.
SOURCE: Keystone Center, Biological Diversity on Federal Lands,report of a Keystone Policy Dialogue (Keystone, CO: Keystone Center,April 1991); U.S. Congress, Office of Technology Assessment,Technologies to Maintain Biological Diversity, OTA-F-30,(Washington, DC: U.S. Government Printing Office, March 1987).
lands, and seashores. In the continental UnitedStates, the largest federally protected areas arelocated in the Western States, on the coasts, andin Alaska. There are also numerous, small pro-tected natural areas in the East. Wilderness Areascomprise the largest single system of protectednatural areas in the continental United States,with over 80 percent of their 35 million acreslocated in the 11 Western States. Most of the 23million acres of the National Park System in thecontinental United States is also located in theWest. The 13.4 million acres of National WildlifeRefuges in the continental United States aregenerally located along the major flyways ofmigratory birds: eastern coasts and waterways,the Great Plains, and desert areas of the West.Figure 5-4 shows the geographical distribution offederally designated natural areas and agencyjurisdiction.
s This is a distinction made by political ownership systems-not by the quality of the land under them.
y To avoid “double counting” of areas with more than one designation these figures include acreage of all lands managed by the NationalPark Serviee and the Fish and Wildlife Service (although a small amount of NPS lands is proteeted as historic sites and battlefields), plus acreagedesignated as Wilderness administered by other agencies (the Forest Serviee and the Bureau of Land Management). These f- may differtiom those in table 5-2 because the protected areas listed there may occur under more than one designation. For example, acreage for theNational Wilderness Preservation System cited in the table includes wilderness acreage located in the National Park System and the NationalWildlife Refuge System.
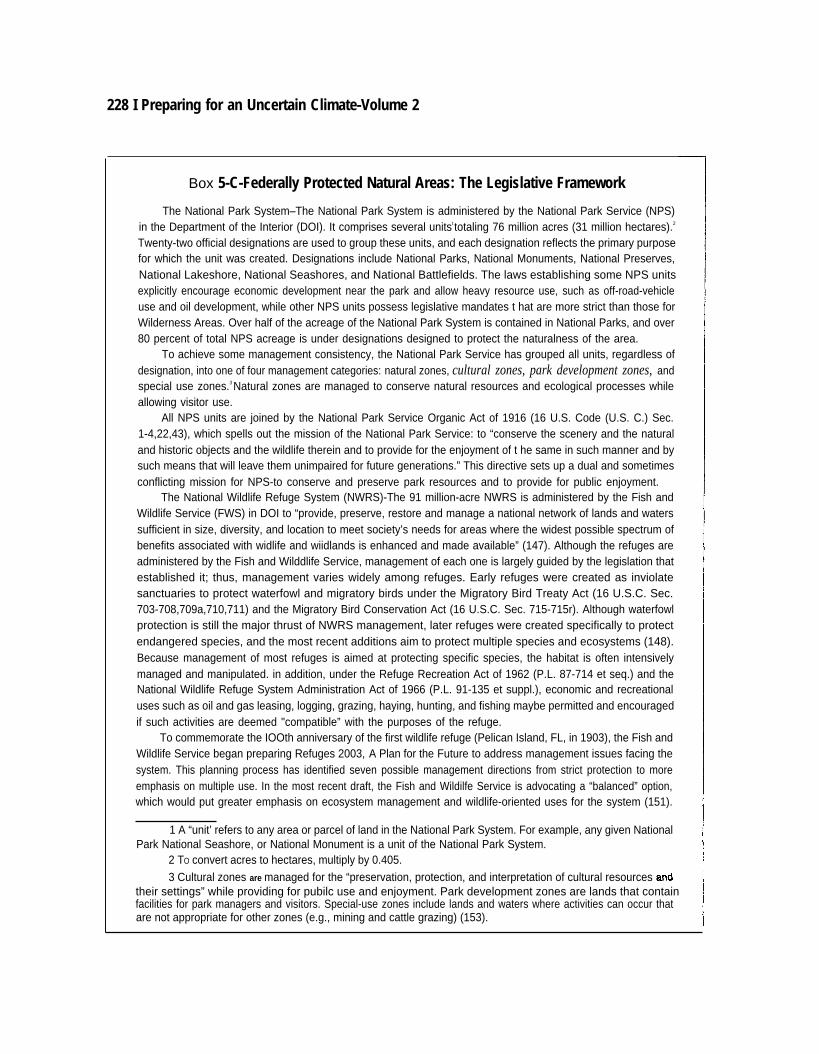
228 I Preparing for an Uncertain Climate-Volume 2
Box 5-C-Federally Protected Natural Areas: The Legislative Framework
The National Park System–The National Park System is administered by the National Park Service (NPS)in the Department of the Interior (DOI). It comprises several unitst totaling 76 million acres (31 million hectares).2
Twenty-two official designations are used to group these units, and each designation reflects the primary purposefor which the unit was created. Designations include National Parks, National Monuments, National Preserves,National Lakeshore, National Seashores, and National Battlefields. The laws establishing some NPS unitsexplicitly encourage economic development near the park and allow heavy resource use, such as off-road-vehicleuse and oil development, while other NPS units possess legislative mandates t hat are more strict than those forWilderness Areas. Over half of the acreage of the National Park System is contained in National Parks, and over80 percent of total NPS acreage is under designations designed to protect the naturalness of the area.
To achieve some management consistency, the National Park Service has grouped all units, regardless ofdesignation, into one of four management categories: natural zones, cultural zones, park development zones, andspecial use zones.3 Natural zones are managed to conserve natural resources and ecological processes whileallowing visitor use.
All NPS units are joined by the National Park Service Organic Act of 1916 (16 U.S. Code (U.S. C.) Sec.1-4,22,43), which spells out the mission of the National Park Service: to “conserve the scenery and the naturaland historic objects and the wildlife therein and to provide for the enjoyment of t he same in such manner and bysuch means that will leave them unimpaired for future generations.” This directive sets up a dual and sometimesconflicting mission for NPS-to conserve and preserve park resources and to provide for public enjoyment.
The National Wildlife Refuge System (NWRS)-The 91 million-acre NWRS is administered by the Fish andWildlife Service (FWS) in DOI to “provide, preserve, restore and manage a national network of lands and waterssufficient in size, diversity, and location to meet society’s needs for areas where the widest possible spectrum ofbenefits associated with widlife and wiidlands is enhanced and made available” (147). Although the refuges areadministered by the Fish and Wilddlife Service, management of each one is largely guided by the legislation thatestablished it; thus, management varies widely among refuges. Early refuges were created as inviolatesanctuaries to protect waterfowl and migratory birds under the Migratory Bird Treaty Act (16 U.S.C. Sec.703-708,709a,710,711) and the Migratory Bird Conservation Act (16 U.S.C. Sec. 715-715r). Although waterfowlprotection is still the major thrust of NWRS management, later refuges were created specifically to protectendangered species, and the most recent additions aim to protect multiple species and ecosystems (148).Because management of most refuges is aimed at protecting specific species, the habitat is often intensivelymanaged and manipulated. in addition, under the Refuge Recreation Act of 1962 (P.L. 87-714 et seq.) and theNational Wildlife Refuge System Administration Act of 1966 (P.L. 91-135 et suppl.), economic and recreationaluses such as oil and gas leasing, logging, grazing, haying, hunting, and fishing maybe permitted and encouragedif such activities are deemed "compatible” with the purposes of the refuge.
To commemorate the IOOth anniversary of the first wildlife refuge (Pelican Island, FL, in 1903), the Fish andWildlife Service began preparing Refuges 2003, A Plan for the Future to address management issues facing thesystem. This planning process has identified seven possible management directions from strict protection to moreemphasis on multiple use. In the most recent draft, the Fish and Wildilfe Service is advocating a “balanced” option,which would put greater emphasis on ecosystem management and wildlife-oriented uses for the system (151).
1 A “unit’ refers to any area or parcel of land in the National Park System. For example, any given NationalPark National Seashore, or National Monument is a unit of the National Park System.
2 TO convert acres to hectares, multiply by 0.405.
3 Cultural zones are managed for the “preservation, protection, and interpretation of cultural resources andtheir settings” while providing for pubilc use and enjoyment. Park development zones are lands that containfacilities for park managers and visitors. Special-use zones include lands and waters where activities can occur thatare not appropriate for other zones (e.g., mining and cattle grazing) (153).
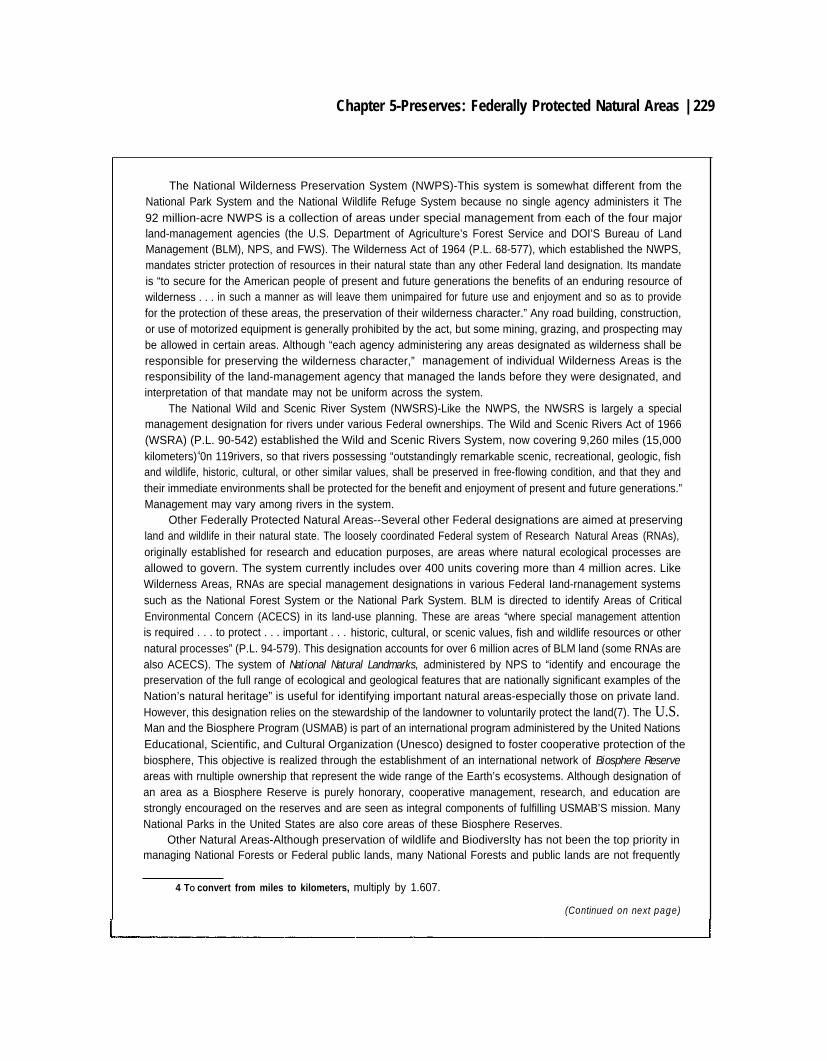
Chapter 5-Preserves: Federally Protected Natural Areas | 229
The National Wilderness Preservation System (NWPS)-This system is somewhat different from theNational Park System and the National Wildlife Refuge System because no single agency administers it The92 million-acre NWPS is a collection of areas under special management from each of the four majorland-management agencies (the U.S. Department of Agriculture’s Forest Service and DOI’S Bureau of LandManagement (BLM), NPS, and FWS). The Wilderness Act of 1964 (P.L. 68-577), which established the NWPS,mandates stricter protection of resources in their natural state than any other Federal land designation. Its mandateis “to secure for the American people of present and future generations the benefits of an enduring resource ofwilderness . . . in such a manner as will leave them unimpaired for future use and enjoyment and so as to providefor the protection of these areas, the preservation of their wilderness character.” Any road building, construction,or use of motorized equipment is generally prohibited by the act, but some mining, grazing, and prospecting maybe allowed in certain areas. Although “each agency administering any areas designated as wilderness shall beresponsible for preserving the wilderness character,” management of individual Wilderness Areas is theresponsibility of the land-management agency that managed the lands before they were designated, andinterpretation of that mandate may not be uniform across the system.
The National Wild and Scenic River System (NWSRS)-Like the NWPS, the NWSRS is largely a specialmanagement designation for rivers under various Federal ownerships. The Wild and Scenic Rivers Act of 1966(WSRA) (P.L. 90-542) established the Wild and Scenic Rivers System, now covering 9,260 miles (15,000kilometers)40n 119rivers, so that rivers possessing “outstandingly remarkable scenic, recreational, geologic, fishand wildlife, historic, cultural, or other similar values, shall be preserved in free-flowing condition, and that they andtheir immediate environments shall be protected for the benefit and enjoyment of present and future generations.”Management may vary among rivers in the system.
Other Federally Protected Natural Areas--Several other Federal designations are aimed at preservingland and wildlife in their natural state. The loosely coordinated Federal system of Research Natural Areas (RNAs),originally established for research and education purposes, are areas where natural ecological processes areallowed to govern. The system currently includes over 400 units covering more than 4 million acres. LikeWilderness Areas, RNAs are special management designations in various Federal Iand-rnanagement systemssuch as the National Forest System or the National Park System. BLM is directed to identify Areas of CriticalEnvironmental Concern (ACECS) in its land-use planning. These are areas “where special management attentionis required . . . to protect . . . important . . . historic, cultural, or scenic values, fish and wildlife resources or othernatural processes” (P.L. 94-579). This designation accounts for over 6 million acres of BLM land (some RNAs arealso ACECS). The system of National Natural Landmarks, administered by NPS to “identify and encourage thepreservation of the full range of ecological and geological features that are nationally significant examples of theNation’s natural heritage” is useful for identifying important natural areas-especially those on private land.However, this designation relies on the stewardship of the landowner to voluntarily protect the land(7). The U.S.Man and the Biosphere Program (USMAB) is part of an international program administered by the United NationsEducational, Scientific, and Cultural Organization (Unesco) designed to foster cooperative protection of thebiosphere, This objective is realized through the establishment of an international network of Biosphere Reserveareas with rnultiple ownership that represent the wide range of the Earth’s ecosystems. Although designation ofan area as a Biosphere Reserve is purely honorary, cooperative management, research, and education arestrongly encouraged on the reserves and are seen as integral components of fulfilling USMAB’S mission. ManyNational Parks in the United States are also core areas of these Biosphere Reserves.
Other Natural Areas-Although preservation of wildlife and Biodiverslty has not been the top priority inmanaging National Forests or Federal public lands, many National Forests and public lands are not frequently
4 TO convert from miles to kilometers, multiply by 1.607.
(Continued on next page)
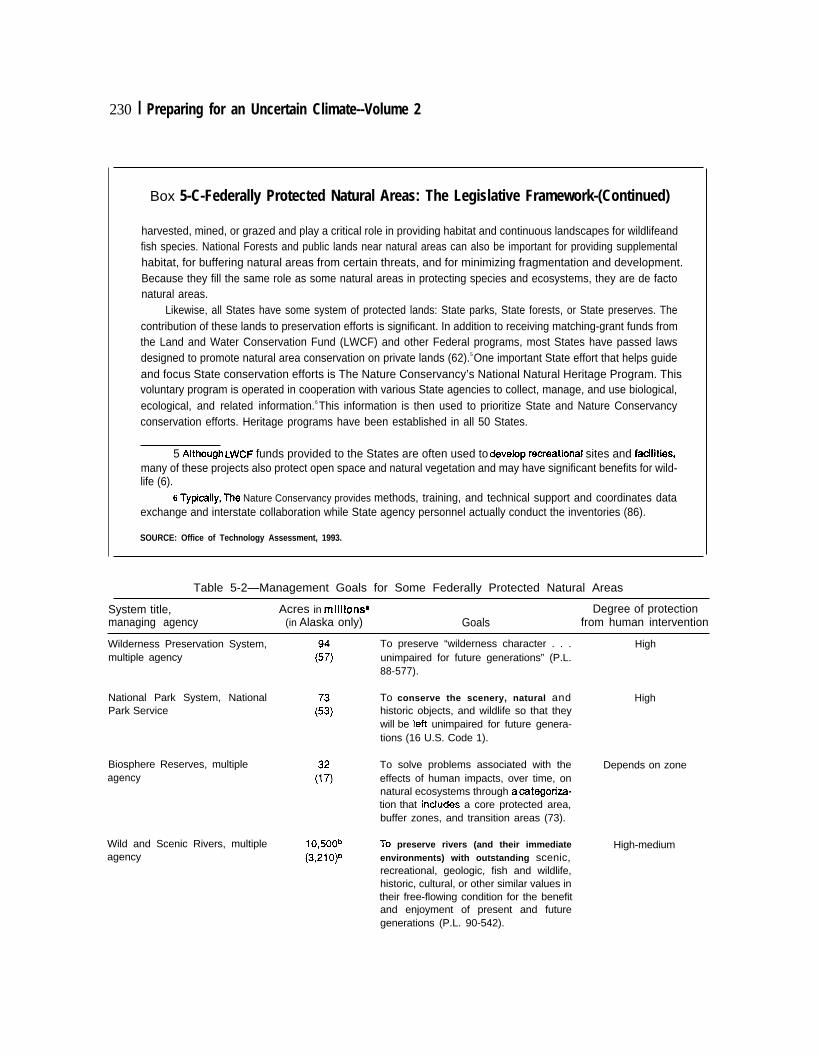
230 I Preparing for an Uncertain Climate--Volume 2
Box 5-C-Federally Protected Natural Areas: The Legislative Framework-(Continued)
harvested, mined, or grazed and play a critical role in providing habitat and continuous landscapes for wildlifeandfish species. National Forests and public lands near natural areas can also be important for providing supplementalhabitat, for buffering natural areas from certain threats, and for minimizing fragmentation and development.Because they fill the same role as some natural areas in protecting species and ecosystems, they are de factonatural areas.
Likewise, all States have some system of protected lands: State parks, State forests, or State preserves. Thecontribution of these lands to preservation efforts is significant. In addition to receiving matching-grant funds fromthe Land and Water Conservation Fund (LWCF) and other Federal programs, most States have passed lawsdesigned to promote natural area conservation on private lands (62).5 One important State effort that helps guideand focus State conservation efforts is The Nature Conservancy’s National Natural Heritage Program. Thisvoluntary program is operated in cooperation with various State agencies to collect, manage, and use biological,ecological, and related information.6 This information is then used to prioritize State and Nature Conservancyconservation efforts. Heritage programs have been established in all 50 States.
5 Although LWCF funds provided to the States are often used to devehp reffeational sites and fadities,many of these projects also protect open space and natural vegetation and may have significant benefits for wild-life (6).
6 Typi~ly, The Nature Conservancy provides methods, training, and technical support and coordinates dataexchange and interstate collaboration while State agency personnel actually conduct the inventories (86).
SOURCE: Office of Technology Assessment, 1993.
Table 5-2—Management Goals for Some Federally Protected Natural Areas
System title, Acres in millions~ Degree of protectionmanaging agency (in Alaska only) Goals from human intervention
Wilderness Preservation System,multiple agency
National Park System, NationalPark Service
Biosphere Reserves, multipleagency
Wild and Scenic Rivers, multipleagency
(%)
lo,500b(3,210)b
To preserve “wilderness character . . .unimpaired for future generations” (P.L.88-577).
To conserve the scenery, natural andhistoric objects, and wildlife so that theywill be Iefl unimpaired for future genera-tions (16 U.S. Code 1).
To solve problems associated with theeffects of human impacts, over time, onnatural ecosystems through acategoriza-tion that inctudes a core protected area,buffer zones, and transition areas (73).
To preserve rivers (and their immediateenvironments) with outstanding scenic,recreational, geologic, fish and wildlife,historic, cultural, or other similar values intheir free-flowing condition for the benefitand enjoyment of present and futuregenerations (P.L. 90-542).
High
High
Depends on zone
High-medium
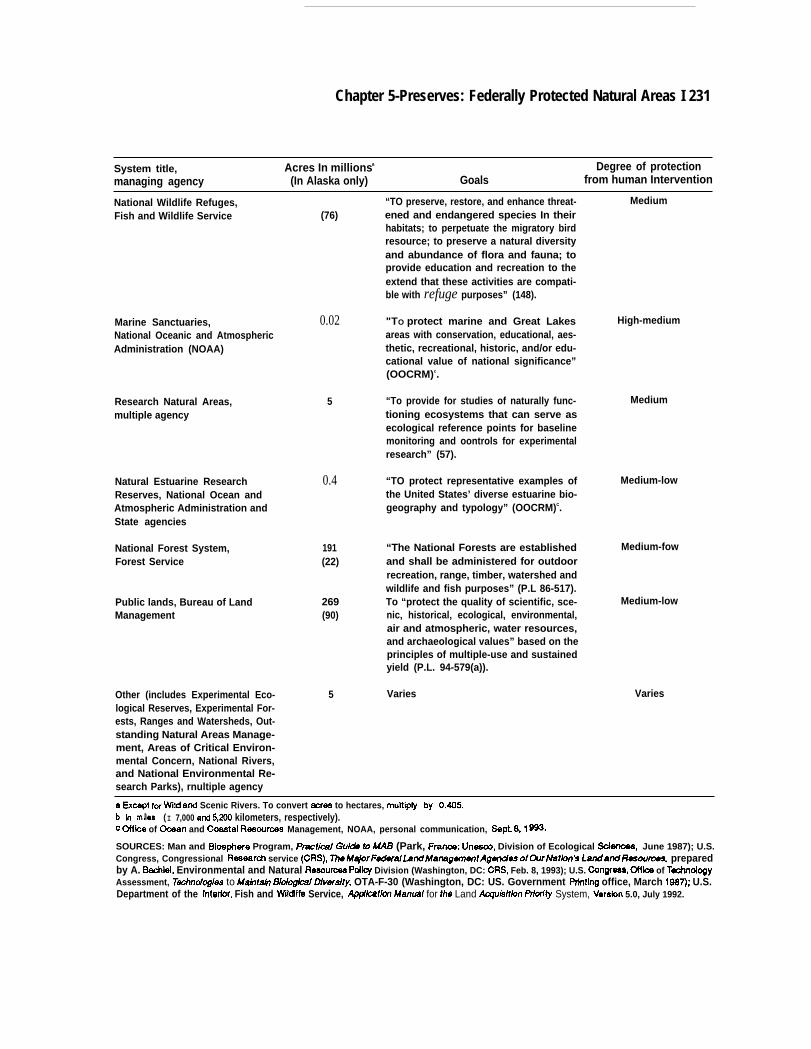
Chapter 5-Preserves: Federally Protected Natural Areas I 231
System title, Acres In millionsa Degree of protectionmanaging agency (In Alaska only) Goals from human Intervention
National Wildlife Refuges, “TO preserve, restore, and enhance threat- MediumFish and Wildlife Service (76) ened and endangered species In their
habitats; to perpetuate the migratory birdresource; to preserve a natural diversityand abundance of flora and fauna; toprovide education and recreation to theextend that these activities are compati-ble with refuge purposes” (148).
Marine Sanctuaries,National Oceanic and AtmosphericAdministration (NOAA)
Research Natural Areas,multiple agency
Natural Estuarine ResearchReserves, National Ocean andAtmospheric Administration andState agencies
National Forest System,Forest Service
Public lands, Bureau of LandManagement
0.02 "TO protect marine and Great Lakesareas with conservation, educational, aes-thetic, recreational, historic, and/or edu-cational value of national significance”(OOCRM)c.
5 “To provide for studies of naturally func-tioning ecosystems that can serve asecological reference points for baselinemonitoring and oontrols for experimentalresearch” (57).
0.4 “TO protect representative examples ofthe United States’ diverse estuarine bio-geography and typology” (OOCRM)C.
191 “The National Forests are established(22) and shall be administered for outdoor
recreation, range, timber, watershed andwildlife and fish purposes” (P.L 86-517).
269 To “protect the quality of scientific, sce-(90) nic, historical, ecological, environmental,
air and atmospheric, water resources,and archaeological values” based on theprinciples of multiple-use and sustainedyield (P.L. 94-579(a)).
High-medium
Medium
Medium-low
Medium-fow
Medium-low
5 Varies VariesOther (includes Experimental Eco-logical Reserves, Experimental For-ests, Ranges and Watersheds, Out-standing Natural Areas Manage-ment, Areas of Critical Environ-mental Concern, National Rivers,and National Environmental Re-search Parks), rnultiple agency
a ExMpt for Wild and Scenic Rivers. To convert -es to hectares, mUh@ly by 0.W5.b In miles (I 7,000 and 5,2oo kilometers, respectively).C off~e of -an and Ctia] Resouroes Management, NOAA, personal communication, *pt. 811 ~3.
SOURCES: Man and f3i08phW3 Program, Practicai Gukie to MA8 (Park, Franoe: Uneaco, Division of Ecological Sobnoea, June 1987); U.S.Congress, Congressional Reseamh service (CRS), ~M#orFdm/htiMa~gmwtAgti* of~rNat/on’s LandandR6sourmw, preparedby A. Bachiel, Environmental and Natural Resouroes Pdlcy Division (Washington, DC: CRS, Feb. 8, 1993); U.S. Cangresa, Offke of TeohndogyAssessment, Ttim%gies to Mahtain ~dogkal Dlvefslty, OTA-F-30 (Washington, DC: US. Government Prfnting office, March 1887); U.S.Department of the Interfor, Fish and Wildllfe Service, Appk@on Mwwa/ for the Land Aqu&/tlon Pdorfty System, Versbn 5.0, July 1992.
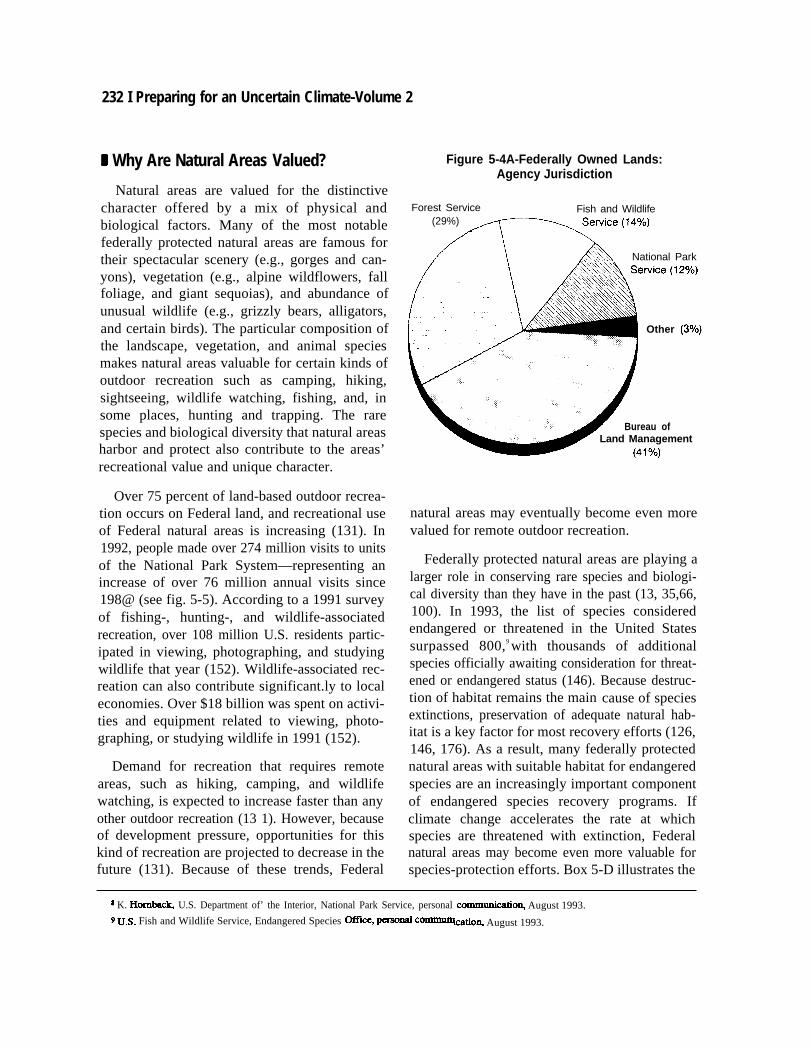
232 I Preparing for an Uncertain Climate-Volume 2
I Why Are Natural Areas Valued?
Natural areas are valued for the distinctivecharacter offered by a mix of physical andbiological factors. Many of the most notablefederally protected natural areas are famous fortheir spectacular scenery (e.g., gorges and can-yons), vegetation (e.g., alpine wildflowers, fallfoliage, and giant sequoias), and abundance ofunusual wildlife (e.g., grizzly bears, alligators,and certain birds). The particular composition ofthe landscape, vegetation, and animal speciesmakes natural areas valuable for certain kinds ofoutdoor recreation such as camping, hiking,sightseeing, wildlife watching, fishing, and, insome places, hunting and trapping. The rarespecies and biological diversity that natural areasharbor and protect also contribute to the areas’recreational value and unique character.
Over 75 percent of land-based outdoor recrea-tion occurs on Federal land, and recreational useof Federal natural areas is increasing (131). In1992, people made over 274 million visits to unitsof the National Park System—representing anincrease of over 76 million annual visits since198@ (see fig. 5-5). According to a 1991 surveyof fishing-, hunting-, and wildlife-associatedrecreation, over 108 million U.S. residents partic-ipated in viewing, photographing, and studyingwildlife that year (152). Wildlife-associated rec-reation can also contribute significant.ly to localeconomies. Over $18 billion was spent on activi-ties and equipment related to viewing, photo-graphing, or studying wildlife in 1991 (152).
Demand for recreation that requires remoteareas, such as hiking, camping, and wildlifewatching, is expected to increase faster than anyother outdoor recreation (13 1). However, becauseof development pressure, opportunities for thiskind of recreation are projected to decrease in thefuture (131). Because of these trends, Federal
Figure 5-4A-Federally Owned Lands:Agency Jurisdiction
Forest Service Fish and Wildlife(29%)
National Park
Other (3?40)
rBureau of
~ Land Management
natural areas may eventually become even morevalued for remote outdoor recreation.
Federally protected natural areas are playing alarger role in conserving rare species and biologi-cal diversity than they have in the past (13, 35,66,100). In 1993, the list of species consideredendangered or threatened in the United Statessurpassed 800,9 with thousands of additionalspecies officially awaiting consideration for threat-ened or endangered status (146). Because destruc-tion of habitat remains the main cause of speciesextinctions, preservation of adequate natural hab-itat is a key factor for most recovery efforts (126,146, 176). As a result, many federally protectednatural areas with suitable habitat for endangeredspecies are an increasingly important componentof endangered species recovery programs. Ifclimate change accelerates the rate at whichspecies are threatened with extinction, Federalnatural areas may become even more valuable forspecies-protection efforts. Box 5-D illustrates the
8 K. H~ U.S. Department of’ the Interior, National Park Service, personal COIMIUlliCXltiO~ August 1993.
9 U.S. Fish and Wildlife Service, Endangered Species OffiCc, pcXSO~ co~.QltiOIl, August 1993.
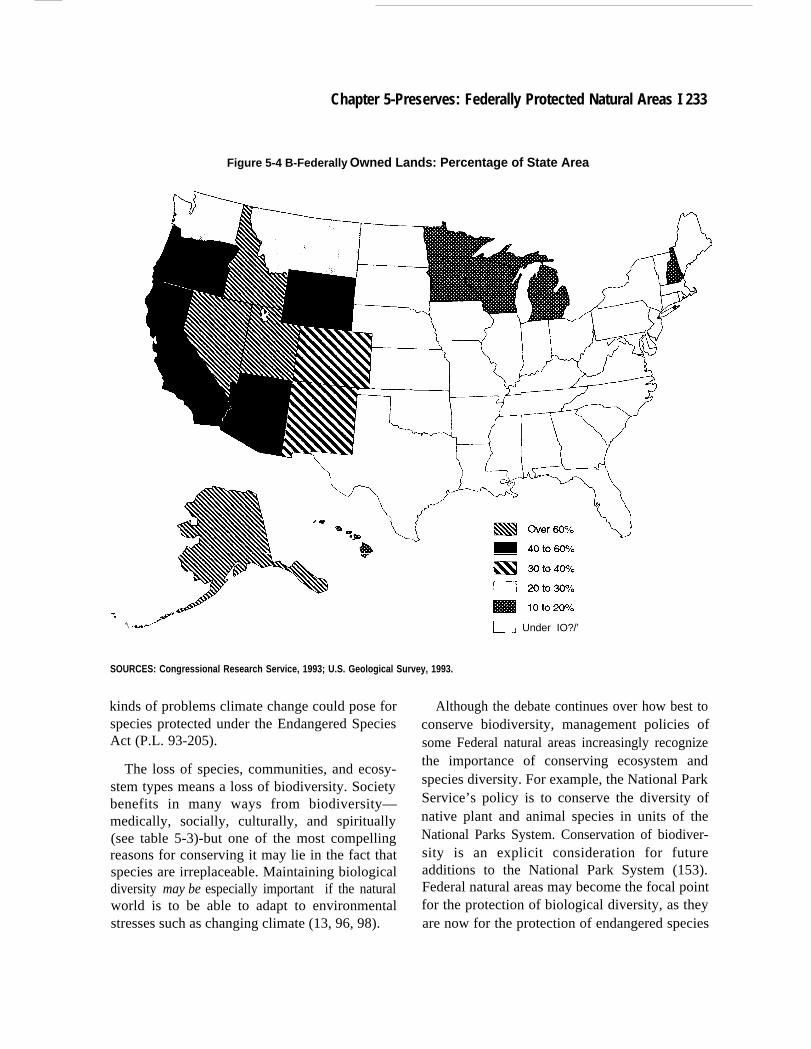
Chapter 5-Preserves: Federally Protected Natural Areas I 233
Figure 5-4 B-Federally Owned Lands: Percentage of State Area
-.‘\
\ \ i!——\r—A———d
~ Iotozo%
U Under IO?/’
SOURCES: Congressional Research Service, 1993; U.S. Geological Survey, 1993.
kinds of problems climate change could pose forspecies protected under the Endangered SpeciesAct (P.L. 93-205).
The loss of species, communities, and ecosy-stem types means a loss of biodiversity. Societybenefits in many ways from biodiversity—medically, socially, culturally, and spiritually(see table 5-3)-but one of the most compellingreasons for conserving it may lie in the fact thatspecies are irreplaceable. Maintaining biologicaldiversity may be especially important if the naturalworld is to be able to adapt to environmentalstresses such as changing climate (13, 96, 98).
Although the debate continues over how best toconserve biodiversity, management policies ofsome Federal natural areas increasingly recognizethe importance of conserving ecosystem andspecies diversity. For example, the National ParkService’s policy is to conserve the diversity ofnative plant and animal species in units of theNational Parks System. Conservation of biodiver-sity is an explicit consideration for futureadditions to the National Park System (153).Federal natural areas may become the focal pointfor the protection of biological diversity, as theyare now for the protection of endangered species
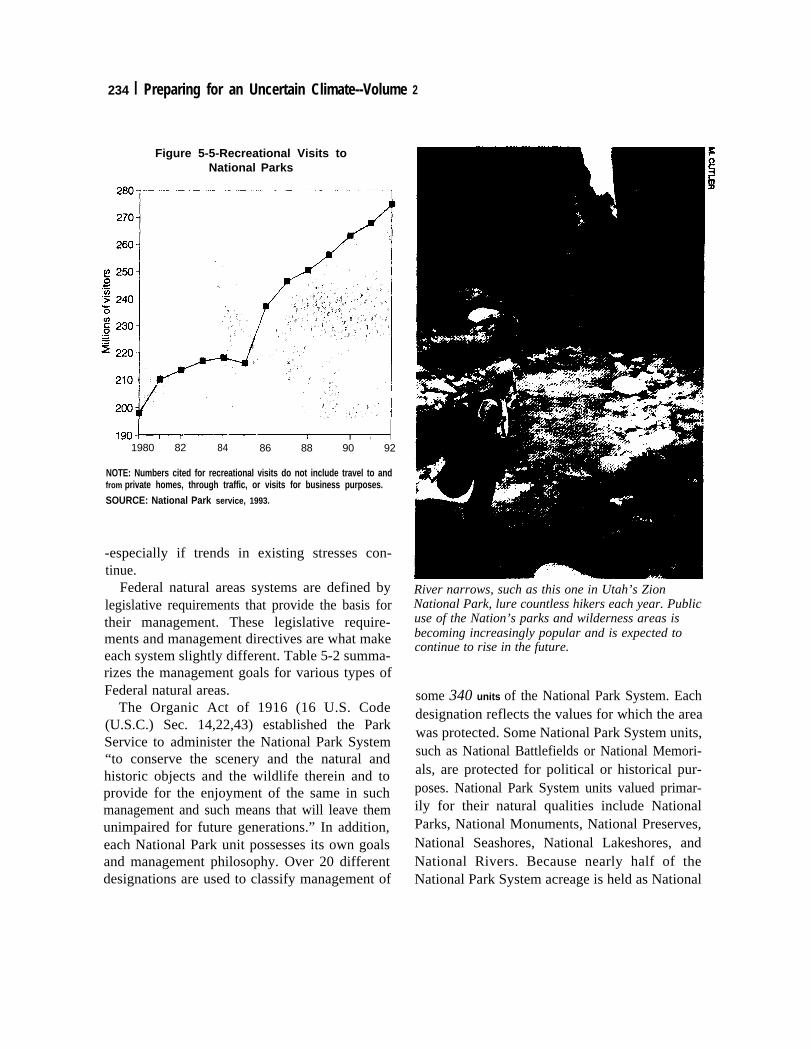
234 I Preparing for an Uncertain Climate--Volume 2
Figure 5-5-Recreational Visits toNational Parks
IA-—TV—— I 1 I I I
1980 82 84 86 88 90 92
NOTE: Numbers cited for recreational visits do not include travel to andfrom private homes, through traffic, or visits for business purposes.SOURCE: National Park service, 1993.
-especially if trends in existing stresses con-tinue.
Federal natural areas systems are defined bylegislative requirements that provide the basis fortheir management. These legislative require-ments and management directives are what makeeach system slightly different. Table 5-2 summa-rizes the management goals for various types ofFederal natural areas.
The Organic Act of 1916 (16 U.S. Code(U.S.C.) Sec. 14,22,43) established the ParkService to administer the National Park System“to conserve the scenery and the natural andhistoric objects and the wildlife therein and toprovide for the enjoyment of the same in suchmanagement and such means that will leave themunimpaired for future generations.” In addition,each National Park unit possesses its own goalsand management philosophy. Over 20 differentdesignations are used to classify management of
River narrows, such as this one in Utah’s ZionNational Park, lure countless hikers each year. Publicuse of the Nation’s parks and wilderness areas isbecoming increasingly popular and is expected tocontinue to rise in the future.
some 340 units of the National Park System. Eachdesignation reflects the values for which the areawas protected. Some National Park System units,such as National Battlefields or National Memori-als, are protected for political or historical pur-poses. National Park System units valued primar-ily for their natural qualities include NationalParks, National Monuments, National Preserves,National Seashores, National Lakeshores, andNational Rivers. Because nearly half of theNational Park System acreage is held as National
Chapter 5-Preserves: Federally Protected Natural Areas | 235
Box 5-O-Implications for Endangered Species Conservation Under a Changing Climate
Climate change is likely to alter the environment and habitat for all organisms. Many rare or endangeredspades require specialized environmental conditions and are extremely sensitive to changes in their habitat. Inmany cases, these species are already threatened by habitat loss. Climate change could accelerate their declineand push them to the brink of extinction (see box 2-E for details on how species may respond to climate change).The United States has one major mechanism for protecting species in danger of extinction: the EndangeredSpecies Act (ESA) of 1973 (P.L. 93-205). Despite this law, species are still declining at increasing rates, thebacklog of species awaiting protection under ESA is growing, and conflicts between protection of species habitatand human development are intensifying. The 1982 amendments to ESA provide an avenue that may help resolvethe potentially bitter conflicts between species protection and economic development: habitat conservation plans(HCPS). These are voluntary agreements among the Federal Government, developers, and other stakeholdersthat provide species protection while allowing some small amount of habitat destruction. Although HCPS are nota substitute for species protection, they do offer a creative solution to some conflicts and backlog problems.
Natural areas, rare species, and climate change-Most species depend on suitable natural habitat forsurvival. The rapid conversion of natural habitat to agriculture and settlements over the past century has led tothe decline of a diverse array of species that depend on them. Because there is little opportunity to regulate theuse of private lands, protected natural areas on public lands have become the focus of habitat protection fordeclining species. Nearly 200 species of threatened and endangered amphibians, birds, clams, crustaceans, fish;insects, mammals, reptiles, snails, and plants live on National Wildlife Refuges. Many refuges contain severalendangered species, and over 30 National Wildlife Refuges have been established specifically to protectendangered species. Also, lands of the National Park System provide protection for one-third to one-half of therare and endangered species in the United States (1 77). Wilderness Areas on Bureau of Land Management andForest Service lands also contain numerous rare species.
Climate change could accelerate the rate of species decline, thereby adding substantially to the list of speciesthreatened with extinction. Habitats for rare or declining species are often already isolated or fragmented and areextremely sensitive to any environment! changes (see box 5-E). Many endangered species require specializedenvironmental conditions. Climate change is likely to substantially change the conditions of many habitats withinand outside natural areas and perhaps make them unsuitable to sustain certain species (see ch. 2). Some speciesmay not be able to adapt.
The implications for natural areas are numerous. Natural areas may become like large-scale zoos, requiringintensive management to protect species from extinction. Widespread species decline coupled with continuedhabitat destruction and modification could make natural areas more valued for species protection. Because naturalareas may offer the only option for survival other than captivit y in zoos or botanical gardens, public pressures maybuild to use increasingly intensive management to sustain species mixes and concentrations that might no longerotherwise be self-sustaining. On the other hand, the impacts of climate change on natural areas may make themless able to provide choice habitat for species, and thus less able to protect species from decline or extinction.If species are no longer adequately protected in natural areas, fulfilling the mandate of ESA may increasinglyrequire the cooperation of private landowners.
The Endangered Species Act—The Endangered Species Act of 1973 was enacted to stem loss of species.It represents a commitment to preventing extinction even if that means tempering economic gain and development(8, 50). Under the act, which is administered primarily by the Fish and Wildlife Service (FWS),I a scientificassessment determines whether a species is threatened with extinction by habitat destruction or overuse, disease,
1 Future administration of the Endangered Species Act, or parts of it, may beCOKW the responsibility of thenew National Biological Survey in the Department of the Interior.
(Continued next page)
236 I Preparing for an Uncertain Climate-Volume 2
Box !W-implications for Endangered Species ConservationUnder a Changing Climate--Continued)
or other factors. If such a determination is made, the species is “listed” and awarded Federal protection. To protecta listed species, the act directs all Federal agencies to “use all methods and procedures necessary” to help thelisted species recover. Specifically, all Federal agencies (through consultation with the Fish and WildlifeService)are to ensure that their actions do not jeopardize the existence of the species.
Since its enactment, several important lessons and issues have emerged that were not foreseen in the act’searly years. First it is now clear that the threat of extinction is much more far-reaching in the United States thanwas recognized 20 years ago(8). Over 800 species are currentl`y listed as endangered, and thousands more arecandidate species, awaiting consideration for listing. Second, programs focused on recovery and protection effortsrequire far more resources than have been made available (8). The Fish and Wildlife Service's EndangeredSpecies Program has grown from about $4.5 million in 1974 to over $30 million in 1988, and still the status(improving or declining) of about 20 percent of listed species is unknown, and backlogs for listing candidate speciescontinue to grow (103, 145). By the time the winged maple leaf mussel was listed as endangered in 1990, 99percent of its habitat had been lost and only one population remained (71). Similarly, the polo de jasmine plantwas listed in 1991 with only one individual remaining (71). Many candidate species maybe completely extinctbefore they are listed (103). Habitat destruction caused by human development is the main cause of continuingspecies decline, and conflicts over development and destruction of habitat are becoming more frequent and moreintense.
There is a growing consensus that those administering the Endangered Species Act are overburdened. Yetit is likely that climate change will accelerate species decline. Adding more species to the list may dilute effortsto protect other listed species so that none are protected adequately. On the other hand, earlier listing may helprecovery prospects. By the time species are listed, their habitats are usually destroyed or badly degraded, theirpopulations are dangerously low, and their genetic diversity is seriously reduced (19, 175). To date, less than 10percent of all listed species are considered to be improving (145), 2 percent (1 1 species) are extinct, and despitesome herculean efforts, species loss continues. Only 15 species in the history of the act have recovered (103).Protection for imperiled species may simply come too late. In 1992, the Fish and Wildlife service announcedmeasures to expedite the listing process, which are expected to help improve the chances for survival for manyspecies currently awaiting listing (106).
One partial solution to this problem maybe to begin protecting species before they become endangered-bypreserving habitats at a broad, ecosystem level (109). This “preventive care” approach may help augment the“emergency room” efforts under the Endangered Species Act. Conservationists have long called for abroadbased, multispecies protection effort and the current administration is beginning to embrace this conceptfor Federal conservation efforts (5).
Habitat conservation plans: Hope for species under climate change?—The Endangered Species Actrequires the designation of critical habitat (areas that are “essential to the conservation of the species”) when aspecies is listed, as well as development of a recovery plan, detailing actions to aid species recovery. Recoveryplans for listed species must identify specific recovery actions (which mayor may not include protection andmanagement of critical habitat), estimate a time frame and costs for recovery, and establish criteria by which tomeasure recovery status. Economic impacts can be considered in both the designation of critical habitat and thedevelopment of a recovery plan. However, because of the lack of personnel, resources, and adequate scientificinformation, many species do not have designated critical habitat and over 40 percent of Iisted species do nothave a recovery plan.
Because Federal agencies are explicitly directed under ESA to conserve endangered species and areforbidden to jeopardize the existence of endangered species, conservation rnechanisms such as the designation
Chapter 5-Preserves: Federally Protected Natural Areas | 237
of critical habitat and development of recovery plans have focused on regulating Federal activities. However, theincreasing decline of species and continued habitat destruction have required more aggressive extension of ESAprovisions to private landowners and local governments. Conflicts have increased in the past decade over theapplication of Section 9, which prohibits any “taking” of spa-es, to private property. The 1982 amendments to ESAestablished a mechanism to address this issue.
The 1982 ESA amendments allow the fish and Wildlife Service to issue incidental “take” permits (e.g.,permits to destroy a certain amount of species) in cases where developers and landowners have an approved HCPthat would provide for long-term protection for the species elsewhere.2 This approach explicitly makes acompromise between economic development and endangered species protection. Typically, an HCP establishesa Federal natural area and employs other land-management techniques such as zoning, habitat restoration, andmanagement agreements to provide habitat protection (1 O). This approach to species conservation may becomea favored mechanism in the future because it approaches long-term conservation at a larger, ecosystem level, itcould provide an alternative to large direct acquisitions, and it provides a forum for bringing together manylandowners and interest groups. However, it is too early to tell whether the HCPS that have been prepared willprovide the long-term protection of the species t hey are designed to protect.
One notable example is the Coachella Valley Fringe-Toed Lizard. HCP, designed to protect an endangeredIizard that is uniquely adapted to its sandy desert habitat in California. Fringed toes, wedged snout, double-sealedeyelids, and ear flaps are all features unique to this species and serve some function for its survival in the desert.In 1983, conflicts overdevelopment of 400 acres (162 hectares)3 of the lizard’s habitat resulted in an agreementamong conservation groups, developers, local governments, State governments, and Federal agencies to developan HCP for the area (1 O). Biological assessments are required under ESA to help design the protection plan thatwould maximize chances for long-term survival. The final plan included the establishment of three habitat reserves,each with its own sand source, and an agreement t hat adjacent Bureau of Land Management (BLM) lands wereto be managed to protect about 15 percent of the lizard’s potential habitat (about 370,000 acres) (1 O). Acquisitionfunds were provided by the Federal Land and Water Conservation Fund, a BLM land exchange, The NatureConservancy, and mitigation fees paid by developers.
Although HCPS are an attractive model for resolving conflicts over endangered species preservation onprivate lands, they are not without problems. It is not clear that HCPS themselves ensure long-term habitatprotection. Some criticize that an HCP essentially amounts to a license to destroy critical habitat in exchange forestablishing a “zoo” requiring intensive management (10). If HCPS allow development just outside the preservedhabitat, the effects of fragmentation and habitat isolation could degrade the protected habitat (e.g., developmentcould leave only the 15 percent of protected fringe-toed lizard habitat intact). In addition, most conflict that resultsin the development of HCPS are near urban areas. Close proximity to urban development may indirectly degradehabitat despite protection under the plan. On the other hand, HCPS may be the only alternative for habitatprotection in densely populated areas.
To effectively protect the national interest in these plans and perhaps to address some of these concerns,FWS personnel who are involved in these negotiations and responsible for implementing the act should have theskills necessary for negotiating with developers, economists, and politicians. Many negotiators from FWS are
2 me development of habitat conservation plans is different from the designation of critical habitat or thedevelopment of recovery plans. HCPS are voluntary agreements pursuant to the “taking” prohibition of Section 9,whereas designation of critioal habitat and development of recovery plans are mandated. However, the developmentof an HCP mayor may not Include the formal protection of a designated critical habitat, and some recovery plansmay overtap with portions of the HCP. Nevertheless, because an HCP is a localized plan, It is not a substitute for thedevelopment of an overall recovery plan for a spedes or for the designation of its critical habitat.
3 TO convert acres to hectares, multiply by 0.405.
(Continued on nexlpage)
238 I Preparing for an Uncertain Climate-Volume 2
Box 5-D-implications for Endangered Species ConservationUnder a Changing Climate-(Continued)
wildlife biologists with expertise infield biology and perhaps few skills in negotiation involving multiple interestsand disciplines.4 In addition, the scientific knowledge required to maximize species survival under a localized planis often not available (scientific information is also lacking for the mandated recovery plans and for designationof critical habitat), and HCP preparation and implementation are not cheap (1 O). Because most sensitive habitatis near urban areas, market values are high and acquisitions are expensive. Moreover, most funding for HCPSto date has come from Federal sources.
HCPS also do not consider the larger issues of biodiversity because they are targeted to a single speciesunder the Endangered Species Act. A multispecies approach to conservation is frequently cited as the mosteffective, but a few plans, such as the Balcones Canyonlands HCP, are beginning to take a broader approach (10).The Balcones Canyonlands HCP seeks to provide protection for three endangered species as well as several rareplants and invertebrates by preserving large habitat areas pursuant to an overall biological assessment of habitatrequirements for several species. Even so, HCPS are only pursued when a species is on the brink of extinction.There is no mechanism for instituting conservation efforts when populations are still healthy. As conflicts betweenhuman development and species survival become more frequent and intense, and as more and more species arethreatened with extinction from climate change and other stresses, new approaches to conservation will beneeded. HCPS, if properly developed and implemented, could be expanded from focusing on endangered andthreatened species to addressing a broader set of conservation efforts, including conservation of biodiversity (120).
4 M. Bean, Environmental Defense Fund, personal communication, May 1993.
SOURCE: Office of Technology Assessment, 1993.
Parks, and the other types, such as National geological features, rare or unique species orMonuments, make up a relatively small propor-tion of the units valued for natural qualities, thischapter focuses primarily on National Parks.10
The “crown jewels” of the National ParkSystem (the oldest and largest National Parkssuch as Yellowstone, Yosemite, Grand Canyon,and Glacier) were originally preserved for recrea-tion opportunities, outstanding scenery, and uniquegeologic features (177). Current managementpolicies reflect an expansion of National ParkService emphasis to include the preservation ofecosystems and biological diversity. Today, areasare designated as new National Parks only if theycontain rare remnant or disappearing landscapesor biotic types, exceptional biological diversity or
communities, or outstanding scenic qualities(153). 11
Most National Wildlife Refuges were estab-lished to protect and manage populations of asingle species or species group such as migratorywaterfowl (6, 125). The Fish and Wildlife Serviceis beginning to take a broader approach tomanaging the refuges. More and more refuges areusing the “ecosystem management” approach,and a biodiversity target has been developed fornew acquisitions. Its current mission is to ‘‘pro-vide, preserve, restore, and manage a nationalnetwork of lands and waters sufficient in size,diversity, and location to meet society’s needs forareas where the widest possible spectrum of
10 However, bma~e many of the other designated units (e.g., National Preserves) are designed to protect IMhmd qtities ~d ~~ the
_ement of the= M* is simi~ to tit of Natio~ parks, much of this chapter applies to these units as well.11 T@ Natio~ pmk se~ice uses these criteria to rank proposed additions to the National Park System, but Congress ~d.mMely designates
through legislation which land will be acquired for use as National Parks.
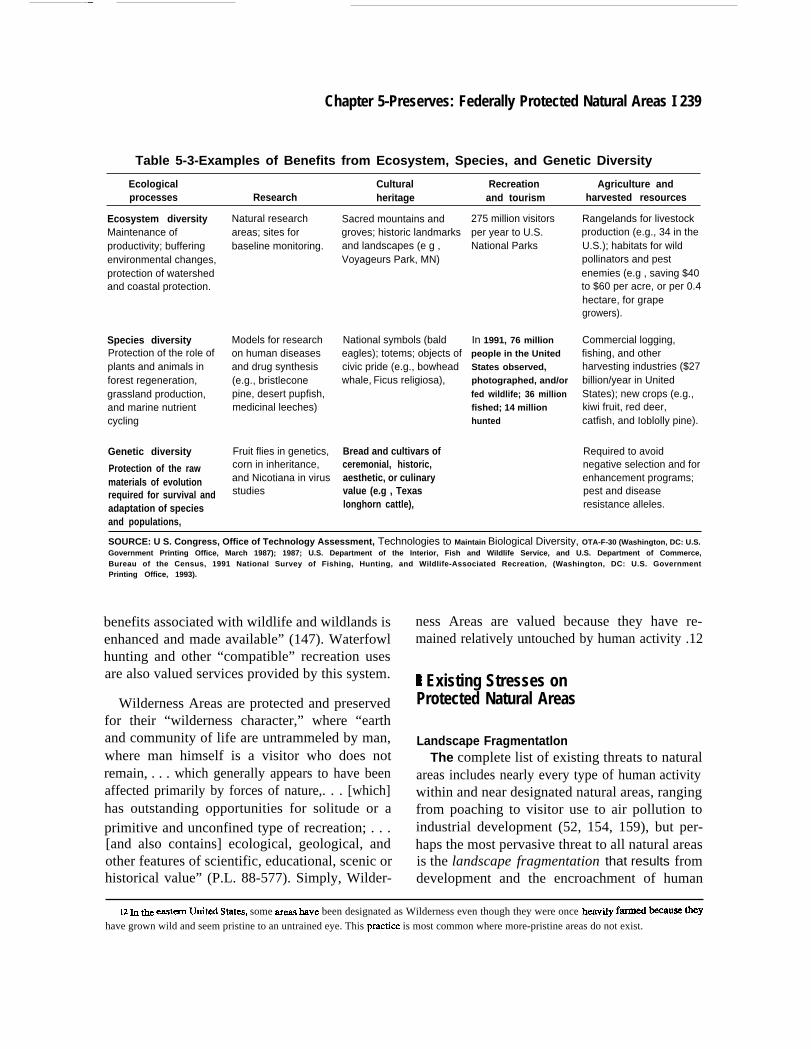
Chapter 5-Preserves: Federally Protected Natural Areas I 239
Table 5-3-Examples of Benefits from Ecosystem, Species, and Genetic Diversity
Ecological Cultural Recreation Agriculture andprocesses Research heritage and tourism harvested resources
Ecosystem diversityMaintenance ofproductivity; bufferingenvironmental changes,protection of watershedand coastal protection.
Species diversityProtection of the role ofplants and animals inforest regeneration,grassland production,and marine nutrientcycling
Genetic diversity
Protection of the rawmaterials of evolutionrequired for survival andadaptation of speciesand populations,
Natural researchareas; sites forbaseline monitoring.
Models for researchon human diseasesand drug synthesis(e.g., bristleconepine, desert pupfish,medicinal leeches)
Fruit flies in genetics,corn in inheritance,and Nicotiana in virusstudies
Sacred mountains andgroves; historic landmarksand landscapes (e g ,Voyageurs Park, MN)
National symbols (baldeagles); totems; objects ofcivic pride (e.g., bowheadwhale, Ficus religiosa),
Bread and cultivars ofceremonial, historic,aesthetic, or culinaryvalue (e.g , Texaslonghorn cattle),
275 million visitorsper year to U.S.National Parks
In 1991, 76 millionpeople in the UnitedStates observed,photographed, and/orfed wildlife; 36 millionfished; 14 millionhunted
Rangelands for livestockproduction (e.g., 34 in theU.S.); habitats for wildpollinators and pestenemies (e.g , saving $40to $60 per acre, or per 0.4hectare, for grapegrowers).
Commercial logging,fishing, and otherharvesting industries ($27billion/year in UnitedStates); new crops (e.g.,kiwi fruit, red deer,catfish, and Ioblolly pine).
Required to avoidnegative selection and forenhancement programs;pest and diseaseresistance alleles.
SOURCE: U S. Congress, Office of Technology Assessment, Technologies to Maintain Biological Diversity, OTA-F-30 (Washington, DC: U.S.Government Printing Office, March 1987); 1987; U.S. Department of the Interior, Fish and Wildlife Service, and U.S. Department of Commerce,Bureau of the Census, 1991 National Survey of Fishing, Hunting, and Wildlife-Associated Recreation, (Washington, DC: U.S. GovernmentPrinting Office, 1993).
benefits associated with wildlife and wildlands isenhanced and made available” (147). Waterfowlhunting and other “compatible” recreation usesare also valued services provided by this system.
Wilderness Areas are protected and preservedfor their “wilderness character,” where “earthand community of life are untrammeled by man,where man himself is a visitor who does notremain, . . . which generally appears to have beenaffected primarily by forces of nature,. . . [which]has outstanding opportunities for solitude or aprimitive and unconfined type of recreation; . . .[and also contains] ecological, geological, andother features of scientific, educational, scenic orhistorical value” (P.L. 88-577). Simply, Wilder-
ness Areas are valued because they have re-mained relatively untouched by human activity .12
I Existing Stresses onProtected Natural Areas
Landscape FragmentatlonThe complete list of existing threats to natural
areas includes nearly every type of human activitywithin and near designated natural areas, rangingfrom poaching to visitor use to air pollution toindustrial development (52, 154, 159), but per-haps the most pervasive threat to all natural areasis the landscape fragmentation that results fromdevelopment and the encroachment of human
12 k b ~tm UniM s~tes, some areas ~ve been designated as Wilderness even though they were once IWLWilY f-d tiuse tiCYhave grown wild and seem pristine to an untrained eye. This pmctice is most common where more-pristine areas do not exist.
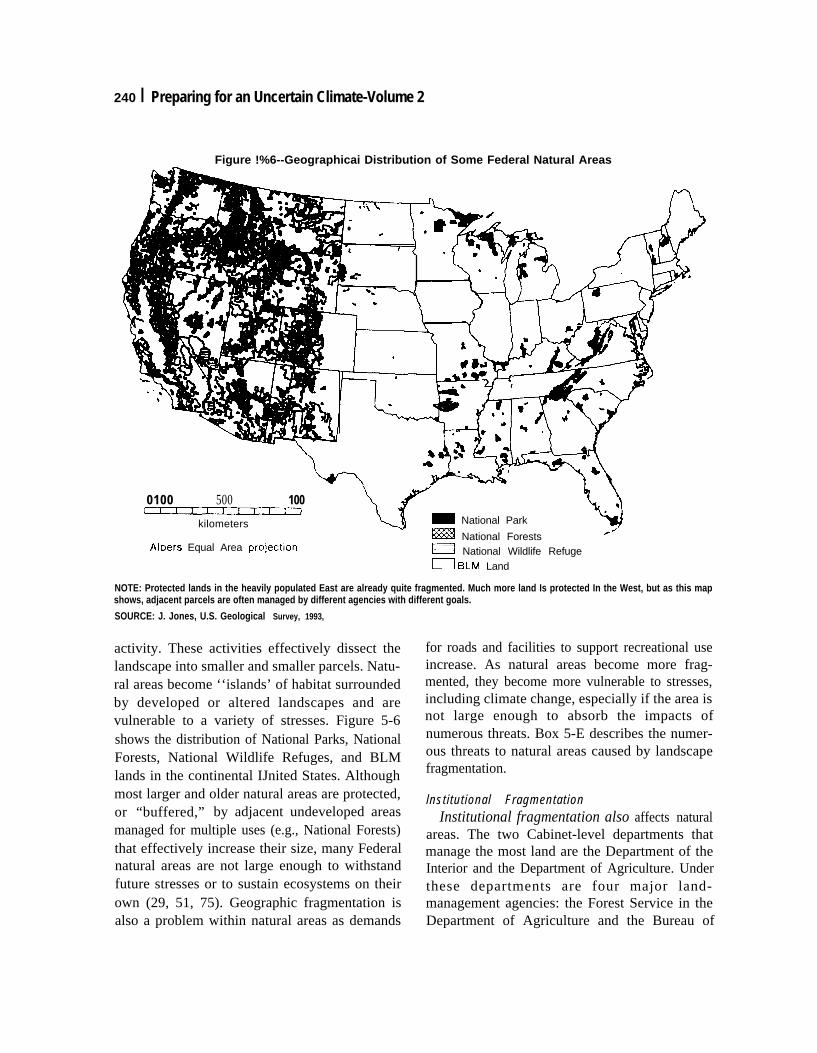
240 I Preparing for an Uncertain Climate-Volume 2
Figure !%6--Geographicai Distribution of Some Federal Natural Areas
n*l\ \
.
●. “.F!!Z2L%
r —
if
>
Lf-0100 500 100~zl=Ia
kilometers
*
_ National Park
m National ForestsAlbers Equal Area prc)jection ~ National Wildlife Refuge
m BLM Land
NOTE: Protected lands in the heavily populated East are already quite fragmented. Much more land Is protected In the West, but as this mapshows, adjacent parcels are often managed by different agencies with different goals.
SOURCE: J. Jones, U.S. Geological Survey, 1993,
activity. These activities effectively dissect thelandscape into smaller and smaller parcels. Natu-ral areas become ‘‘islands’ of habitat surroundedby developed or altered landscapes and arevulnerable to a variety of stresses. Figure 5-6shows the distribution of National Parks, NationalForests, National Wildlife Refuges, and BLMlands in the continental IJnited States. Althoughmost larger and older natural areas are protected,or “buffered,” by adjacent undeveloped areasmanaged for multiple uses (e.g., National Forests)that effectively increase their size, many Federalnatural areas are not large enough to withstandfuture stresses or to sustain ecosystems on theirown (29, 51, 75). Geographic fragmentation isalso a problem within natural areas as demands
for roads and facilities to support recreational useincrease. As natural areas become more frag-mented, they become more vulnerable to stresses,including climate change, especially if the area isnot large enough to absorb the impacts ofnumerous threats. Box 5-E describes the numer-ous threats to natural areas caused by landscapefragmentation.
lnstitutional FragmentationInstitutional fragmentation also affects natural
areas. The two Cabinet-level departments thatmanage the most land are the Department of theInterior and the Department of Agriculture. Underthese departments are four major land-management agencies: the Forest Service in theDepartment of Agriculture and the Bureau of
Chapter 5–Preserves: Federally Protected Natural Areas | 241
Box 5-E-Landscape Fragmentation: Islands of Nature in a Sea of Human Activity
Since civilization began, humans have been shaping the landscape with tools ranging from hand-held axesand hoes to chainsaws and bulldozers. Throughout much of history, these activities carved out relatively smallpatches of land for uses including agriculture, timber harvesting, mining, and dwelling. The intensively usedpatches were still surrounded by vast natural areas where ecosystems continued to function more or lessundisturbed. As the human population has grown and encroachments into the landscape have expanded, humanactions have affected ever larger areas and have carved the landscape into ever smaller patches. In many areas,the landscape is now characterized by a predominance of land used for human activities surrounding smallremnant patches of the original ecosystems-islands of nature in a sea of human activit y. Barriers such as roads,buildings, and vast stretches of cleared and chemically treated agricultural fields may separate the plants andanimals that inhabit the remnants of formerly extensive ecosystems. These remnant wildlands contain much ofthe diversity of terrestrial species that remains in this country, and afford the last invaluable glimpses of thestructure and function of ecosystems as they were once composed. Many remnant wildlands are already too smallto sustain habitat for some species without active management (1 9).
Although fragmentation of the landscape is not necessarily bad, it becomes a problem when species cannoteasily migrate from one area to another and when a habitat area is too small or poor in quality to sustain viablespecies populations. The effects are often not immediately obvious nor are they always noticeable in each location,but they accumulate over time and space. Fragmentation poses several distinct types of problems for plants andanimals and the larger communities in which they interact.
Small size-Fragmented landscapes may simply be too small to supply the forage and habitat needed byindividuals of various wide-ranging species. For example, the Florida panther routinely roams over a territory of200 square miles (520 hectares)1. The highly developed Southern Florida landscape offers an obstacle courseof roads and fields that limit the panther’s possibilities for finding prey and leave the panther vulnerable to dangerssuch as cars. The endangered red cockaded woodpecker prefers to stay in wooded areas. When it must travelthrough open fields to find new forest dwellings, it is at a much higher risk of predation from owls and hawks. Pairsof northern spotted owls require a territory of several thousand acres to support food gathering, nesting, andreproduction. The owls scout out territory in more or less random directions from their former sites; if t hey do notfind suitable nesting sites within several weeks, they may fail to reproduce or, in extreme cases, even die fromhunger and exhaustion (16). Numerous other species such as bears, wolves, moose, and elk range over largeterritories but have rather specialized requirements for food and habitat (see fig. 5-3). If climate change altersvegetation patterns, such species may have to travel even farther to satisfy their nutritional requirements. For somespecies, an open space such as a field or road imposes an enormous behavioral barrier that will be crossed onlywith great reluctance. Such species may effectively become trapped in a small area even if other suitable habitatsare relatively close by. When suitable habitat has been diminished to small and distantly separated parcels,populations of many of these species decline. Isolation can also interfere with effective pollination and seeddispersal.
Local extinctions-Another consequence of fragmentation is that the populations of plants and animals thatremain on a patch may have less genetic variability than does the species as a whole. Limited variability offersfewer possibilities for adaptation to changes in the environment (see ch. 2). Small, isolated populations maybemore vunerable to extreme events, such as fires, storms, drought, and late spring or early fall frosts-many ofwhich could become more common as the climate changes, and any of which could lead to local extinction. Whenenough local populations become extinct, the species as a whole is endangered.
1 To convert square miles to hectares, multiply by 2.590.
(Continued on next page)
242 I Preparing for an Uncertain Climate--Volume 2
Box 5-E—Landscape Fragmentation: Islands of Nature in aSea of Human Activity-(Continued)
More edges-Fragmentation also creates many more edge areas compared with the amount of land in theinterior of a habitat zone. As the landscape is divided up into more and smaller patches, the area that lies at theedge of a patch increases. Forest edges are often zones of high diversity because the varied light conditions offera range of habitats and because they are areas where species from surrounding ecosystems may mix with forestspecies However, many of the species that inhabit the edges are invasive species that can displace forest floraand fauna For example, the cowbird, which rarely travels deeper into a forest than several hundred feet from aclearing, is an aggressive competitor with many songbirds. What many ecologists fear is that increasing theamount of edge may lead to a predominance of invasive and opportunistic species at the expense of an array ofhistoric species. The drying effects of the wind are generally greater at the edges of forests and wetlands than inthe interior, so as the ratio of edge to interior increases, so does the area susceptible to drought. In some areas,cutting back forests has been linked to changes in wind and precipitation patterns, and in extreme cases, it maylead to desertification.
Loss of transition zones-Fragmentation may obliterate the transition zones between different types ofvegetation or leave them separated by a large distance. This poses a problem for species that rely on differenttypes of habitat during different stages of their life cycles or during some seasons. For example, some speciesof butterflies spend their larval stages on cordgrass, which grows in coastal wetlands, but live their adult lives inhabitats farther upland and inland. Land-use patterns that diminish or destroy the gradual transition betweenwetlands and upland areas disrupt the butterflies’ reproductive cycles. The clapper rail, an endangered bird inSouthern California, is a another example. Although dapper rails dwell within the tidal zone of coastal wetlands,they prefer to remain just above the reach of the water, past the high-tide line. However, in many areas (even thosebordering protected natural areas), development has occurred right up to the high-tide line. To escape Januaryand June high tides and numerous storm surges throughout the year, clapper rails often end up perched on carsin seaside parking lots or near the edges of roads, where t hey are vulnerable not only to cars but also to predationby domestic cats and dogs. Sea level rise due to climate change could further squeeze, if not eliminate, thetransition zone between coastal wetlands and uplands.
Natural areas in the United States today often make up relatively small patches in a larger fragmentedlandscape. Although most large and older natural areas are buffered, or protected, by adjacent natural areas orby de facto natural areas (such as multiple-use lands managed by the Forest Service or Bureau of LandManagement) that effectively increase their size, many ecologists claim that most Federal natural areas are notIarge enough to sustain ecosystems without suffering from some impacts of fragmentation (29). Combating thoseimpacts is not easy. In general, the !arger the contiguous area of land maintained with minimal human disturbance,the less severe will be the consequences of fragmentation. However, even if the public wanted to set aside vastnew natural areas to protect a range of ecosystems, large relatively undisturbed sites simply do not exist anymorein the East, and opportunities are quickly disappearing in the West. Many actions that humans may make inresponse to climate change could accelerate the process and damage of fragmentation; the movement ofagriculture into new areas and increased water diversions could aggravate existing problems (see vol. 1, chs. 5and 6).
Buffer zones around natural areas and corridors connecting different natural areas can help guard againstsome fragmentation effects and allow for greater movement by species. (Some innovative programs forestablishing buffers around natural areas are described in box 5-F.) Although the concept of corridors is simple,establishing optimal corridors is a complex, controversial, and incompletely understood process. The size, shape,and location of corridors all affect their utility for any particular species. Furthermore, although corridors offermigration pathways for the native flora and fauna that are often the target of protection efforts, they can serveequally well as a conduit for the passage of invasive or opportunistic nonindigenous species Despite the potentialproblems and the considerable amount of research that remains to be done, corridors have already been
Chapter 5-Preserves: Federally Protected Natural Areas | 243
established and used in a few cases, and the concept of linking natural areas is receiving increasing attention fromland-management agencies and private organizations. For example, there are new linkages between the OceolaNational Forest and Okefenokee Swamp in Florida and Georgia and an expanded network of corridor connectionsacross Florida is under consideration (90).
In sum, setting aside a given amount of land in natural areas within the modern fragmented landscape doesnot alone ensure that the biological features for which they are valued will be preserved. To best conserve species,natural areas should include an array of ecosystems and the transition zones between them, which will allow forthe many complex interactions that rely on links between different parts of the landscape.
SOURCES: P.L. Fiedler and S.K. Jain (eds.), Conservation Bb/ogy: T/w Theory and Practkx ofhlature Conservation, Prasarvatkm andManagement (New York, NY: Routfedge, Chapman, and Hall, 1992); W.E. Hudson, Landscape LMagas and Biodivmdfy (Washington,DC: Defenders of Wildlife and Island Press, 1992); P. Karieva et al. (eds.), Blotich?temctbns andG/oba/Change (Sunderland, MA: SinauerAssociates, Inc., 1993); D.A. Saunders, RJ. Hobbs, and C.R. Margules, “Biological Consequences of Ecosystem Fragmentation: AReview,” Conservation Biology, vol. 5, March 1991, pp. 18-32.
Land Management, the National Park Service, her own mission and as a result, the landscape isand the Fish and Wildlife Service in the Depart-ment of the Interior. Each manages its own systemof natural areas under its own mission. TheNational Wilderness Preservation System is man-aged by these four separate agencies and subjectto varying management policies depending onwhich agency administers a particular WildernessArea. To speak of one Federal system of naturalareas as a single entity is, therefore, misleading.
The Greater Yellowstone Ecosystem, for ex-ample, comprises two National Parks, one Na-tional Parkway, six National Forests in twodifferent Forest Service regions (four of whichhave designated Wilderness Areas adjacent topark boundaries), three National Wildlife Ref-uges, BLM lands, State lands, Indian reserva-tions, and private lands. The entire area encom-passes about 19 million acres and is referred to asthe “largest single, essentially intact, functional‘natural’ ecosystem“ in the lower 49 States (92).The ecosystem has been able to support anabundance and diversity of wildlife because theland has remained relatively unfragmented. Main-taining a “whole” ecosystem depends on thecondition of its parts. In recent years, increasedvisitor use, tourism, recreation, resource develop-ment (e.g., dam building and mining), timberharvesting, and air pollution have been posingthreats to the ecosystem. Each landowner man-ages these stresses differently according to his or
managed in isolated fragments that may not leadto effective protection of the entire ecosystem.
Problems that cross agency and ownershipboundaries may not be addressed uniformly.Timber harvesting, construction, and heavy visi-tor use brought about by different managementregimes can pose a threat to the large habitatsrequired by some species, such as threatenedgrizzly bears, bighorn sheep, endangered pere-grine falcons, and trumpeter swans, by disruptingthe behavior and habitat of these species. A 1986congressional evaluation of the Greater Yellow-stone Ecosystem concluded that ‘regional bound-aries fragment the area into three [parcels].. .Even within the regions, individual unit bounda-ries often have little relevance to the Ecosys-tem. . . In virtually all agency decision-making,the whole is subordinated to its fragments” (122).In addition, efforts that do aim to coordinatemanagement over the entire ecosystem eitherexclude important parties or are aimed at certainspecies, reflecting a fragmentation of coordinat-ing bodies (122).
To help minimize landscape and institutionalfragmentation and its consequences, there havebeen movements toward practicing more coordi-nated management under the existing agencystructure with the goal of ecosystem management(see box 5-F). However, reconciling differingmissions of agencies and interests of landowners
244 I Preparing for an Uncertain Climate-Volume 2
Box 5-F-Some Innovative Management ModeIs:Toward Ecosystem Management in Natural Areas
As climate change begins to affect the plants and animals that reside on natural areas in the United States,managers may seek to establish buffer zones and migration corridors to continue protecting the living resourcesthat these areas were designated to protect. Indeed, entire landscapes maybe required to accommodate rangeshifts. However, differing ownerships, management structures, agency missions, and jurisdictions often precludemanagement of areas larger than each individual management unit. Conserving biological resources is alreadybecoming increasingly difficult because problems like pollution, development, and landscape fragmentationtranscend management and ownership boundaries. Climate change is likely to compound these problems as yetanother global-scale threat to some natural resources.
Within the past few years, land managers have recognized these problems and the need to address land andresource conservation on a larger scale. This relatively new concept for conservation has many names: ecosystemmanagement, landscape management, cooperative management, integrated management, regional manage-ment, watershed management, or river basin management. Although no specific definition of this large-scalemanagement concept has emerged, some generalizations can be made. Ecosystem, or landscape, managementgenerally refers to the management of natural resources on a scale that crosses management boundaries andseeks to protect a variety of species and natural processes over the long term. Currently, no mechanism thateffectively facilitates this kind of cooperative management on a large scale is in place. However, some programsare beginning to help bring some practical definition to the “ecosystem management” concept.
Many natural areas are located in regions where land is highly valued for economic uses, and attempts toexpand protection around a natural area often conflicts directly with pressures for economic development. In manycases, especially in the eastern United States, land is simply no longer available. Thus, managers throughout thecountry have begun to explore new and innovative management strategies other than acquisition for balancingthe needs of people who live and work near natural areas with t he needs of the ecosystems those natural areasaim to protect. In some cases, these strategies involve greater coordination among various Federal agencies thatmanage public lands; in other cases, they establish interactions between Federal land managers and local andprivate interests. In all cases, these strategies seek to bring together a diverse set of interested parties andharmonize conflicting needs before controversy erupts and complicates further action.
The Greater Yellowstone Ecosystem-As the first National Park (designated in 1872), Yellowstone hasrepresented land-management leadership for the past century. Now, it is beginning to encompass a newmanagement philosophy based on regional landscapes (64, 68). The Greater Yellowstone Ecosystem is a regionunder multiple ownership that scientists believe encompasses one of the largest and most important remainingecosystems in the United States. Two-thirds of the 19 million-acre (7.7 million-hectare)l area is owned by theFederal Government: 2.5 million acres in Yellowstone and the Grand Teton National Parks, over 9 million acresin seven National Forests (nearly 4 million acres are designated as wilderness), and another million acres aremanaged by the U.S. Fish and Wildlife Service (FWS) and by the Bureau of Land Management (BLM). Over6 million acres are State, private, and tribal lands. The region covers parts of t three States: Wyoming, Idaho, andMontana. Although each ownership and management scheme has its own philosophy and mission, regional issuessuch as wildfire and wildlife management are forcing these diverse groups together.
The Greater Yellowstone Coordinating Committee was created in the 1960s to address these issues. Thecommittee includes regional and local representatives of the National Park Service (NPS) and the U.S. Departmentof Agriculture’s (USDA’s) Forest Service.2 The historical distrust among the differing Federal agencies limited the
1 TO convert from acres to hectares, multiply by 0.405.
2 Although the Fish and Wildlife Service and the Bureau of Land Management also hold land in the GreaterYellowstone region, they are not represented on the Greater Yellowstone Coordinating Committee. In addition,private landowners, Indian tribes, and State agencies holding land in the Greater Yellowstone Area are also not onthe committee.
— . — —
Chapter 5-Preserves: Federally Protected Natural Areas | 245
effectiveness of the committee and resulted in a Congressional report criticizing the committee-especially, thelack of coordination between the Forest Service andNPS(125). The committee was revitalized in the late 1980safter congressional threats of legislative reform and pressure from grass-roots organizations. The Committee thendeveloped an integrated management plan (or “vision” document) for the Greater Yellowstone Ecosystem.
Proposals included using a “compatible management” approach in which the surrounding National Forestswould essentially serve as buffers to the Park; however, diverse mandates of NPS and the Forest Serviceprecluded any management plan that would make one agency’s mission subservient to the other. Nevertheless,a report entitled Yellowstone Vision Statement was released in 1990 and outlined how interagency cooperationcould lead to ecosystem management (48). Fierce opposition to the report by politicians, commodity groups, andprivate landowners was so intense that the 70-page report was re-released as an 1 l-page document that removedmany of the original preservation and coordination themes (49, 114). Despite the failure to actually formulate anecosystem-management strategy for the region, the fact that such an effort was undertaken is significant giventhe intense and almost war-like friction between environmentalists and members of the wide use movement (i.e.,resource-development advocates) in this area. indeed, several obstacles to attaining cooperative managementof the Greater Yellowstone Ecosystem remain. However, there is still hope that some consensus can be reachedto protect the integrity of Nation’s first National Park.
The New Jersey Pine Barrens-The New Jersey Pine Barrens is a unique region of habitat for rare andunusual plant and animal species that has remained largely undeveloped despite its proximity to New York City,Philadelphia, and Atlantic City. in the 1960s, proposals emerged to develop the area for retirement villages andjet ports (21). Forces aiming to preserve the area also grew (74). After several years of debate over how to bestprotect the resources and interests of the Pinelands, the Pinelands National Reserve was established in 1978.The 935,000-acre region is now managed by the Pinelands Commission, an intergovernmental (Federal, State,and local) authority with the responsibility to implement a regional plan “designed to guide development away fromenvironmentally sensitive areas and into designated growth centers” (68). A variety of techniques is used toimplement this plan, including imposing levels of restricted development according to a zoning system and usingtransferable development “credits” to help compensate landowners in restricted zones.
Early strategies for protecting the Pine Barrens recognized that acquisition by the Federal Government wasnot feasible because oft he high costs of direct purchase and because traditional uses such as agriculture, logging,and mining would have been disrupted. Early attempts by the State of New Jersey to form a conservation planwere perceived as pro-development and drew criticism from conservationists. Interest in a cooperativeFederal-State effort grew. As a condition for Federal involvement, a Department of the Interior (DOI) task-forcereport challenged the State to increase its land and water conservation policies for the area (141). The Stateresponded with a proposal for managing the area with a “graded” management scheme designed to protect thecore of the Pinelands and also to provide an intermediate “buffer” area (1 00).
In 1978, the National Parks and Recreation Act (P.L. 95-625) became law and established the PinelandsNational Reserve. However, the Federal Government had minimal authority to manage the reserve. A commissionwas established with representatives from county and State governments, private interest groups, and one DOImember to develop a Comprehensive Management Plan (CMP) for the area. Under the final protection andmanagement plan, only 100,000 acres of key parcels were directly acquired by the State. Innovative incentiveswere employed to ensure flexibility in land use and equity among interests and to facilitate long-term protection.For example, a Pinelands Development Credit System was established to compensate landowners in areas withspecial zoning restrictions. Development credits can be sold to developers in designated growth areas, allowingthem to build housing over the density limits specified in the CMP. In addition, local governments are compensatedfor lost tax opportunities through payments in lieu of taxes. Tax credits and special loan and grant assistance arealso offered for management practices that promote land uses consistent with preservation of the reserve.
Because the Pinelands management scheme seeks to protect the region without placing excessive burdens
(Continued on next page)
246 I Preparing for an Uncertain Climate-Volume 2
Box 5-F-Some Innovative Management Models:Toward Ecosystem Management in Natural Areas--(Continued)
on any particular group, it has been called one of the most successful regional land-use-planning efforts in theUnited States and is to be regarded as a model for future protection efforts (99). Much of the success of thismanagement scheme stems from the diverse methods used to protect the Preserve, the involvement and supportof local residents, and the joint protection by the State and Federal Governments.
Unesco’s Man and the Biosphere Program--The United Nations Educational, Scientific and CulturalOrganization (Unesco) established the international Man and Biosphere (MAB) Program in 1970 to “develop ascientific basis linking the natural and social sciences for the rational use and conservation of the biosphere . . .and for the development of the relationship between humans and their environment" (73). This objective is realizedthrough the establishment of an international network of Biosphere Reserves representing the wide range of theEarth’s ecosystems. Although designation of an area as a Biosphere Reserve is purely honorary, cooperativemanagement, research, and education are strongly encouraged and are seen as integral components of fulfillingMAB’s mission. MAB Biosphere Reserves seek to correct fragmentation of the landscape by approaching researchand management-training issues on a regional scale. Another purpose of the Biosphere Reserve program is tocombat fragmentation of institutions and landownership by bringing diverse interests and disciplines togetherthrough education and research.
The Biosphere Reserves are generally composed of three regions in a Biogeographic Area (an area withdistinctive biological, geological, and geographical characteristics).3 These three regions are categorized as coreareas, buffer zones, and transition areas. A core area is managed to preserve natural processes and geneticresources and is therefore usually under legal protection by the country (e.g., a National Park); a bufferzone ismanaged to minimize harm to the core area by human activity; and a transition area is where traditional land usesare found.
The U.S. component of the MAB program (U SMAB) was started in 1974, and 47 Biosphere Reserves havebeen designated thus far, covering 49 million acres (60, see figure). Five directorafes were formed to ensureinterdisciplinary research in a variety of areas.4 Most core areas are National Parks, Wilderness Areas, or areasunder other legal protection (e.g., the Adirondack State Park in New York and the New Jersey Pinelands have beendesignated Biosphere Reserves). Although management of a region does not change once it has been designateda Biosphere Reserve, the various MAB committees facilitate integrated management through interdisciplinary,region-wide research and education projects. The intent is t hat these programs and projects will serve as catalystsfor cooperative management. To help focus Biosphere Reserve activities, each USMAB directorate has a set of“interest areas” that include sustainable development, cooperative policy development, global change monitoring,and biodiversity protection (73).
The Nature Conservancy’s Last Great Places Initiative--The Nature Conservancy (TNC) is a privateconservation organization, founded in 1951, with a mission to “preserve plants, animals, and natural communitiesthat represent the diversity of life on Earth by protecting the lands and waters they need to survive” (118). Inaddition to owning and managing over 1,300 preserves covering over 1.3 million acres, TNC launched a newprogram, the Last Great Places Initiative, in May 1991, aimed at using a broader approach to protection effortsby protecting entire ecosystems-not just isolated species.
Twelve sites, ranging in size from 40,000 to 11 million acres and spread around the country, are currentlyincluded in the program, which has the potential of growing to 40 or more sites in the future. The sites are chosen
3 Bios@ere Re~rve isthetermusedin official MAB documents. The distinction between Biosphere Reserve
and Biogeographic Area is that a Biosphere Reserve is a site that has been explicMy designated by Unesoo whereasa Biogeographic Area is a more conceptual term referring to an area exhibiting a given set of biological and geolo-gical characteristics. However, the terms are sometimes used interchangeably.
4 me USMAB directorates are: High Latitude Ecosystems, Human Dominated Ecosystems, Marine and
Coastal Ecosystems, Temperate Ecosystems, and Tropical Ecosystems (73).— ———————.—.--.—— ——. .————.—. ._ ——-— ——-.————
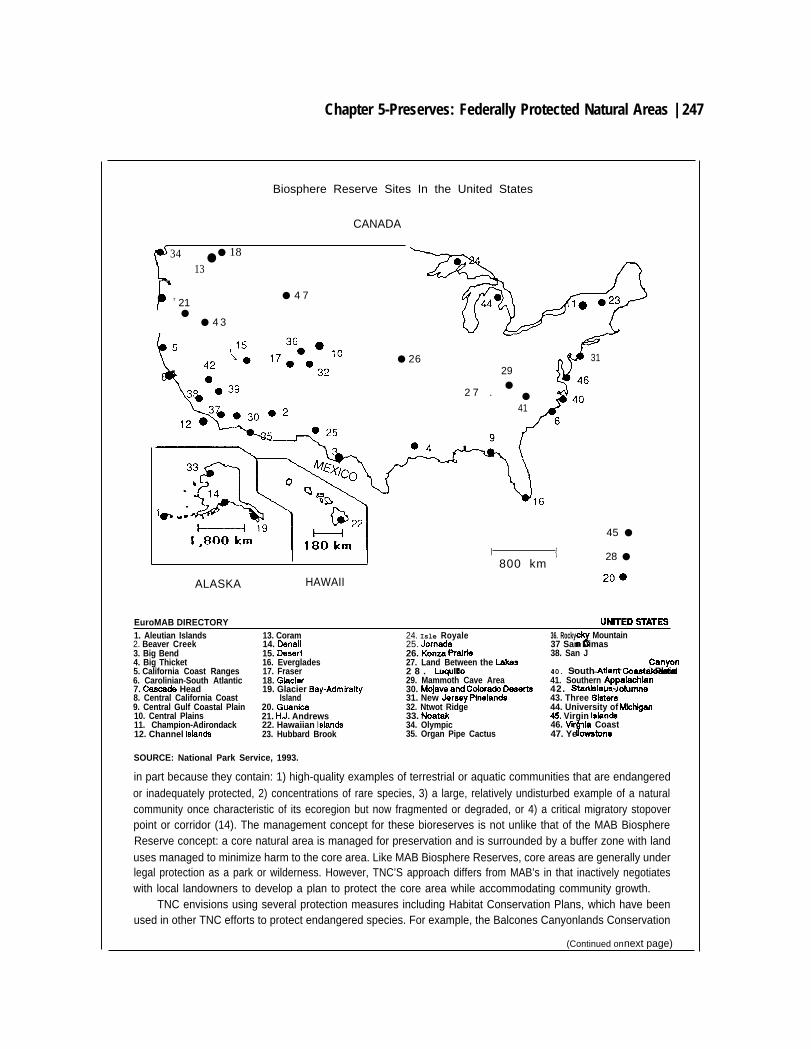
Chapter 5-Preserves: Federally Protected Natural Areas | 247
Biosphere Reserve Sites In the United States
CANADA
34 ●● 18
13
7 21● 4 7
I●
● 4 3
ALASKA
EuroMAB DIRECTORY
HAWAII
● 26
2 7 .
3129●
●
41
45 ●
I {800 km
28 ●
1. Aleutian Islands 13. Coram 24. Isle Royale 36. Rocky%
Mountain2. Beaver Creek 14. Denali 25. Jornada 37 San Dimas3. Big Bend 15. Deaert 26. Konza PraMe 38. San J4. Big Thicket 16. Everglades 27. Land Between the *S5. California Coast Ranges 17. Fraser 2 8 . LU’UIIIO ‘ “ - ’w = : rcanyOn40. South Atiant Coaatal Plain6. Carolinian-South Atlantic 18. Glader 29. Mammoth Cave Area 41. Southern7. Caeoede Head 19. Glacier Bay-Admkalty 30. Mojave andcoiorado Deeerts %
palaohlan42. Stanlalaua- olumne
8. Central California Coast Island 31. New Jereey PlnekInd8 43. Three Slaters9. Central Gulf Coastal Plain 20. Guanioa 32. Ntwot Ridge 44. University of Mlchlgan10. Central Plains 21. H.J. Andrews 33. Noatak *. Virgin Made11. Champion-Adirondack 22. Hawaiian Islande 34. Olympic 46. W Inia Coast12. Channel Islande 23. Hubbard Brook 35. Organ Pipe Cactus f47. Ye owetone
SOURCE: National Park Service, 1993.
in part because they contain: 1) high-quality examples of terrestrial or aquatic communities that are endangeredor inadequately protected, 2) concentrations of rare species, 3) a large, relatively undisturbed example of a naturalcommunity once characteristic of its ecoregion but now fragmented or degraded, or 4) a critical migratory stopoverpoint or corridor (14). The management concept for these bioreserves is not unlike that of the MAB BiosphereReserve concept: a core natural area is managed for preservation and is surrounded by a buffer zone with landuses managed to minimize harm to the core area. Like MAB Biosphere Reserves, core areas are generally underlegal protection as a park or wilderness. However, TNC’S approach differs from MAB’s in that inactively negotiateswith local landowners to develop a plan to protect the core area while accommodating community growth.
TNC envisions using several protection measures including Habitat Conservation Plans, which have beenused in other TNC efforts to protect endangered species. For example, the Balcones Canyonlands Conservation
(Continued on next page)
248 I Preparing for an Uncertain Climate--Volume 2
Box 5-F-Some Innovative Management Models:Toward Ecosystem Management in Natural Areas-(Continued)
Plan was developed by environmentalists, developers, local government officials, and Federal agency personnelto protect seven threatened and endangered species and other rare plants in the area and to fend off the threatof habitat fragmentation.5 A 65,000-acre preserve was created near Austin, Texas, with about 30,000 acres to bemanaged by FWS as a National Wildlife Refuge and the rest acquired by and/or managed in cooperation with Iocalindustries. Acquisitions will be funded by a combination of Federal, State, and local grants as well as by privatecontributions. In addition, an impact fee imposed on new construction in designated areas will provide additionalrevenues.
The Nature Conservancy's Last Great Places Initiative seeks to coordinate and balance very diverse interestsin order to preserve environmentally important regions that transcend ownership boundaries through variousincentives and agreements. As a result, it represents yet another innovative approach to land management thatdoes not require government ownership.
New York’s Adirondack Park—This 6 million-acre State Park Consists of a 2.6 million-acre Forest Preserveestablished in 1885 and additional land under both State and private ownership added in 1892. The Park isprotected indefinitely by Article XlV Section 1, of the New York State Constitution. It is the largest State Park inthe continental United States and the largest single forested area east of the Mississippi, and it represents oneof the most significant hardwood ecosystems in the world. Protection of the area was prompted by timberharvesting and other activities over a century ago and has been strongly supported until very recently (68).
The Adirondack Park Agency (APA), created in 1971 by the State of New York manages the developmentpressures on public and private lands in the park. It set up a zoning system in its 1973 Land Use and DevelopmentPlan that resembles the core and buffer idea with designations and density limits ranging from “resourcemanagement areas” (with most protection of naturalness) to “hamlets” (population and commercial centers) (173).Although APA established the density limits in the six land-use areas, actual control, enforcement, andimplementation of the plan lies with the local communities. As of 1990, only 11 of the 105 communities in the regionhad developed zoning plans because of resistance to restrictions that would limit private-property rights.
Now, a century after the park was established, development pressures are threatening park protection.Projected growth trends would fragment about 3 million acres of the park and increase the park’s populationfivefold (68). A commission was established by New York Governor Mario Cuomo in 1989 to study implicationsof these pressures on t he park. The commission recommended a new administration for the park that would havebroad authority over land use and development with a focus on limiting fragmentation. The commission alsoadvocated the use of corridors to link the Adirondack natural community with those of the northeastern UnitedStates and Canada and it recommended that “the processes which maintain habitats most likely to be affectedor lost through climate change should be determined” and that mechanisms to ensure their perpetuation beinvestigated. However, it is estimated that implementing the plan would cost at least $15 million annually, withproposed funding from luxury-home taxes and user fees. Not surprisingly, many residents and local governmentsstrongly oppose the commission’s recommendations.
Although tension between diverse interests is growing over future management of the Adirondack Park are%the management ideas first suggested by APA incorporated some of the novel methods (e.g., graded protectionthrough zoning) that seem successful in other areas, such as the New Jersey Pinelands. If the residents of the
5 ~ -es Canyon[an& conservation Plan is a Habitat Conservation Plan required under theEndangered Species Act (see box 5-D). The threatened and endangered species that the plan seeks to proteotInclude two species of migratory songbird+he biaok-oapped vireo and the golden~eeked warbier, and fivespecies of invertebrates that have adapted to the unique oave environment-one spider, two types of beetfe, ac$pseudo” scorpion, and a daddy iongiegs (10).
Chapter 5-Preserves: Federally Protected Natural Areas | 249
Adirondack Park region and other interested parties can jointly support a conservation goal for the region, effortsfor coordinated management may find greater success.
The Northern Forest Lands Study—As a result of rising land values and development pressures in NewEngland’s forests, the governors of New York, Vermont, New Hampshire, and Maine appointed a Governors’ TaskForce on Northern Forest Lands in 1966 to study the status and trends of roughly 26 million acres of their States’forests with the help of the USDA Forest Service. The resulting report proposed several strategies for maintainingundeveloped areas of private forest lands while keeping them open to the public (53). A variety of protectionmeasures was evaluated, including zoning, conservation easements, acquisition, and tax incentives. In essence,the report challenges the States to find a common vision and to take the lead in developing a regional protectionplan for the area by encouraging the States and the Governors’ Task Force to evaluate the region’s resources andto develop strategies for their protection in the future. It also includes a proposal for Federal assistance in theseplanning efforts and for purchasing key parcels of land.
In 1990, the Northern Forest Lands Council was established to continue the Northern Forest Lands Studyfor another four years. This council will further develop the themes and challenges raised in the report and presenta set of specific recommendations to the New England States and to Congress by the fall of 1994.
Because the 1990 report favors a variety of protection measures and cooperation among differingownerships, a “pinelands-like” management model may emerge from future negotiations. If successful, thecoordinated-management effort will be among the largest because of the degree of interstate cooperation requiredin an area 25 times the size of the Pinelands National Reserve.
Glacier National Park Biogeographic Area, Crown of the Continent Project—This research andeducation project represents an attempt tore-integrate a fragmented landscape by "creat[ing] and implement[ing]a coordination process and the necessary facilities to achieve a quantitative understanding of the natural andhuman environment of the Crown of the Continent Ecosystem” (36). This idea is similar to the MAB approach inthat integrated, regionwide research and education will ideally lead to better-coordinated management of theregion. The “crown of the continent ecosystem” includes Glacier National Park, the Bob Marshall/GreatBear-Scapegoat National Wilderness complex, and surrounding Indian Reservations and private land. AnEcosystem Center, administered by an independent board of directors, would fill five specified roles: policyexploration, basic research, monitoring and database management, ecosystem interpretation, and education (36).The activities of the Ecosystem Center would generate an integrated and reliable source of information for variousmanagement decisions. In addition, various advisory councils (representing interest groups, tribal governments,Federal and State agendas, and local landowners) are envisioned to help facilitate communication andcooperation. There are already significant efforts under way to begin to synthesize information for decisionmaking.Both Glacier National Park and Flathead National Forest maintain well-developed Geologic Information Systemsthat could contribute to better cooperative management. Although this project has not yet been funded orimplemented, the ideas embodied in its proposal illustrate yet another way to begin to consider landscapes as awhole without undermining the owners and management regimes of individual parcels.
Rio Grande Basin Consortium-Although not directly targeted at natural areas, the Rio Grande BasinConsortium (RGBC) is a recent attempt to engage disparate public agencies and private interests in amultidisciplinary effort to conduct research and share information aimed at improving planning for the river basin.The consortium was launched in 1990 after a well-attended and enthusiastic conference held in Albuquerque onglobal climate change scenarios for the basin, “The Rio Grande Basin: Global Climate Change Scenarios.”RGBC’S goals are to serve as a clearinghouse of environmental, social, and economic information on the region,to match researchers with suitable projects and increase the effectiveness of those projects through greatercoordination, to provide a forum for interaction through means such as conferences and newsletters, and totranslate knowledge and guide planning in ways that will promote the sustainable development of the area’s
(Continued on next page)
250 I Preparing for an Uncertain Climate-Volume 2
Box 5-F-Some Innovative Management Models:Toward Ecosystem Management in Natural Areas-(Continued)
resources (166). Members of RGBC’S steering committee include representatives from the Forest Service, theBureau of Reclamation, NPS, the U.S. Army Corps of Engineers, and the U.S. Geological Survey, as wellresearchers from the University of New Mexico, New Mexico State University, and New Mexico Tech and officialsfrom local agencies ranging from the City of Albuquerque to the Indian Health Service. The consortium is alsoexploring the possibility of working with the Houston Area Research Center to address Rio Grande issues on bothsides of the U.S. border. Although not directly linked to land management, RGBC’S activities are designed to furtherprotect the biological resources of the Rio Grande while at the same time meeting the needs of the diverse culturalgroups that inhabit the basin area.
SOURCE: RJ. Lilieholm, Preserves at Risk An hvestlgatim of Resouma Management Strategies, hnpkatiorrs and OpportunMes,contractor report prepared for the Office of Technology Assessment, January 1993.
is not easy and will require unprecedented leader- sion and agitation of water), and disrupt nesting.ship and vision. The Yellowstone area is notunique-institutional fragmentation threatensecosystems throughout the United States. Someinnovative first efforts are in place that aim tominimize both landscape and institutional frag-mentation for ecosystems or habitat areas. Al-though the effectiveness of these cooperativemanagement schemes is sometimes limited bycompeting interests, the schemes signify promis-ing frost steps toward innovative solutions tofragmentation problems.
Human ImpactsIn addition to the different types of fragmenta-
tion that impinge on natural areas, numerousother threats exist within and outside their bound-aries. Within designated natural areas, damagefrom overuse and overcrowding by tourists andrecreationists is often cited as a major concern,especially with respect to long-term impacts andfuture management (76). These activities maydestroy vegetation and cause erosion that disturbswildlife habitat. Increased exposure to humanactivity can disrupt breeding and modify animalbehavior. Other activities in federally protectednatural areas such as cattle grazing and boatingcan increase water pollution, facilitate the spreadof exotic species, damage habitat (through ero-
For example, power boating and water skiingallowed on Des Lacs National Wildlife Refuge inNorth Dakota during the 1980s has been found todirectly disturb migratory bird nesting and broodsof newly hatched chicks-the refuge’s primarypurpose (163). Grazing cows in the Browns ParkNWR in Colorado disturb the habitat of geese andducks by eating the vegetation necessary for birdhabitat (163). The cumulative effect of thesevarious threats can lead to the decline of sensitivespecies that the reserves aim to protect andincrease the proportion of species that are tolerantof landscapes disturbed by humans (44, 56).
A survey of managers of the Fish and WildlifeRefuge System concerning the harmful effects ofsecondary uses on the primary mission of refugesfound that at least one harmful use was occurringon 59 percent of the refuges. Harmful usesincluded public use (camping, hunting, boating,and off-road-vehicle use), economic use (grazing,logging, commercial fishing, and mining), a n dmilitary use (air and ground exercises). Forexample, airboats were considered harmful on 69percent of the refuges where airboat activity takesplace, and beach use and swimming were consid-ered harmful on 41 percent of the refuges wherebeach use and swimming occur. More than one
Chapter 5-Preserves: Federally
harmful use was occurring on several refuges(163).13 These activities can disturb wildlifedirectly or indirectly by disturbing their habitat.Resource damage from recreational activitiessuch as erosion caused by hiking and camping hasled to diminished wilderness character in one ofevery four Wilderness Areas according to a 1988Forest Service survey (93). Several reports on thestate of National Park resources cited visitor use,consumptive uses, vehicle noise, soil erosion, andinvasion of exotic species as among the mostcommon internal threats to native vegetation,animal habitat, and other resources (17, 154). Thelarger National Parks, including Yosemite, Yel-lowstone, Glacier, Great Smoky Mountains, theEverglades, and those designated as BiosphereReserves, endure over 30 different human-causedinternal and external threats (17)--over twice asmany as the NPS-wide norm (52).
Because internal stresses canto some extent beregulated by the designated agency, they aregenerally less threatening than external stresses,which cross agency and ownership boundariesand often fall out of the purview of agencyinfluence. The primary external threats includeencroaching development, air and water pollu-tion, logging, encroaching exotic plant species,fire, poaching, livestock grazing, and military airexercises (93). These activities have the potentialto alter the natural processes in protected areas,contribute to erosion, damage habitat and scarewildlife, and contribute to a decline in biodiver-sity in protected areas, especially for speciessensitive to human disturbance (45, 87). Forexample, resources in the Everglades NationalPark have been severely affected by herbicides,pesticides, and fertilizers in the agricultural run-off water that feeds into the park. In YosemiteNational Park, a buildup of Calthane (an agricul-tural pesticide) in the bodies of endangeredperegrine falcons causes a weakening of their egg
shells and makes
Protected Natural Areas I 251
them unable to breed in theirthird to fifth year (154). Also, Kesterson NationalWildlife Refuge in California is threatened byselenium toxicity from agricultural runoff (seevol. 1, box 4-E). The sonic booms and low-elevation flybys associated with military airexercises over the Cabeza Prieta NWR in Arizonaare believed to adversely affect the fawning andcalving of Sonoran pronghorn antelope and desertbighorn sheep (163).
Water conflicts can also constitute a threat tonatural areas, especially in the arid West, wherewater allocation is determined by the priorappropriation doctrine (see vol. 1, ch. 5). Underthis doctrine, those who first put water to a certainuse obtain a‘ ‘right’ to use the water. The conflictover water surrounding the Stillwater NationalWildlife Management Area, described in box5-G, shows the complexity of water-allocationissues. Unfortunately, water rights under Statelaw for wildlife and fish and other environmentalbenefits are very junior (where they exist at all),making water supplies dependent on those whohold more senior rights. Securing adequate waterfor Federal natural areas by claiming Federalwater rights (and overriding the State prioritysystem) is a continuing point of debate (see box5-H).
The cumulative effect of landscape fragmenta-tion, institutional fragmentation, and other threatshas taken its toll on federally protected naturalareas. In a recent survey, only around one-third ofall National Park units reported their resources in“good” condition (154). Although similar sur-veys have not been conducted for other Federalnatural areas, there are indications that multiplestresses are degrading them (159, 163). Climatechange may only intensify these existing threatsto resources, especially in the arid West, wherewater is already a scarce resource.
13 WS IIM C@ pm au~ori~ over fier~-reso~~-development and military activities on some refuge lands &ZaUSe authO@ Overthese resources often falls under the jurisdiction of other agencies (145, 163).
252 I Preparing for an Uncertain Climate-Volume 2
Box 5-G-Competition for Water:The Case of the Stillwater National Wildlife Management Area
Wildlife refuges occupy a precarious position in the arid West. Most refuges are centered around waterbodies--rivers, lakes, or marshes-but competing human demands for water have significantly reduced theamount of water that actually remains in streams to flush through and replenish refuges. A study by the Bureauof Reclamation on refuge water supplies and needs in the central valley of California found that only one refuge1
has a firm supply of water “in the amount considered necessary for proper management of existing wetlands andfacilities within the refuge boundaries” (142). If, as most climate models predict, the interior Western Statesbecome hotter and drier due to climate change, Western refuges could themselves become threatened withextinction (see chs. 2, and 4 and vol. 1, ch. 5).
Water has long been a precious commodity in the arid West. Scarce water flows from rivers and streams arein high demand by farmers and urban residents, who seek to dam, divert, and pump water into offstrearn uses,such as irrigation and municipal water supplies. At the same time, the maintenance of fish and wildlife habitat, aswell as traditional uses by Native Americans and recreational uses by Western residents and tourists, relies onprotecting instream flows--that is, keeping a certain minimum volume of water flowing through streams year-round(the necessary volume depends on the type of habitat or use to be maintained). A complex legal structure hasgrown up over the past century to mediate hotly contested battles over who gets water, and how much each partygets. The legal doctrine for water allocation that has prevailed in the West is one of prior appropriation, whichmeans that those who historically used the water first have the highest priority in claiming present water suppliesfor continuing use? Ironically, fish and wildlife habitat and traditional uses by native Americans were the initial usesof most Western rivers in their natural conditions, yet these uses have rarely been quantified or been allocatedwater; if water has been allocated to these uses, the rights are often considered junior to agricultural and municipalclaims.
The case of the Stillwater National Wildlife Management Area (NWMA) and Pyramid Lake in theTruckee-Carson River basins illustrates the complex conflicts among competing human and natural area uses forwater, and suggests that the situation for refuges may worsen if climate change intensifies the squeeze for Westernwater. The Truckee River originates in the Sierra Nevada Mountains. It is the only outlet of Lake Tahoe and flowsnortheast from the lake through California and Nevada to drain into Pyramid Lake in northwestern Nevada (seefigure). The Carson River originates southeast of Lake Tahoe, near the California-Nevada State line, and flowsroughly parallel to the Truckee River to empty into a marshy area known as the Carson Sink. The Stillwater NWMAwas established in this area in 1948 and offers food and habitat to bald eagles, American white pelicans, andnumerous species of waterfowl. A dam upstream of Carson Sink created the Lahontan Reservoir, which hasdiminished the flows to Stillwater Marsh and other wetlands in the Sink. A canal connecting the Truckee andCarson Rivers was constructed in 1905 as part of the Bureau of Reclamation’s Newlands Project to supply waterfor irrigated agriculture.
Four major users compete for water from the Truckee and Carson rivers: l) farmers served by the NewlandsProject, 2) Native American tribes, 3) Reno-area residents, and 4) the wetland ecosystem. The Newlands Projectwhich includes the Truckee Canal, is used by farmers to irrigate some 63,100 acres (25,600 hectares)3 down-
1 [nthestudy, 15 refugeswere mnsidered: lONational Wildlife Refuges, 4 StatewldlifeMana~e~tAreaS,and 1 privately managed wetland area within the central valley hydrologic basin of California.
2 For example, if farmers occupying an area near a dam and reservoir have traditionally pumped 10,000gallons (9,500 liters) a year for irrigation and a nearby munidpal area has only recently begun pumping from thereservoir, the farmers would receive their water allocation first in drought years, when the reservoir might not be abfeto supply all claims on the water.
3 TO convert acres to hectares, multiply by 0.405.
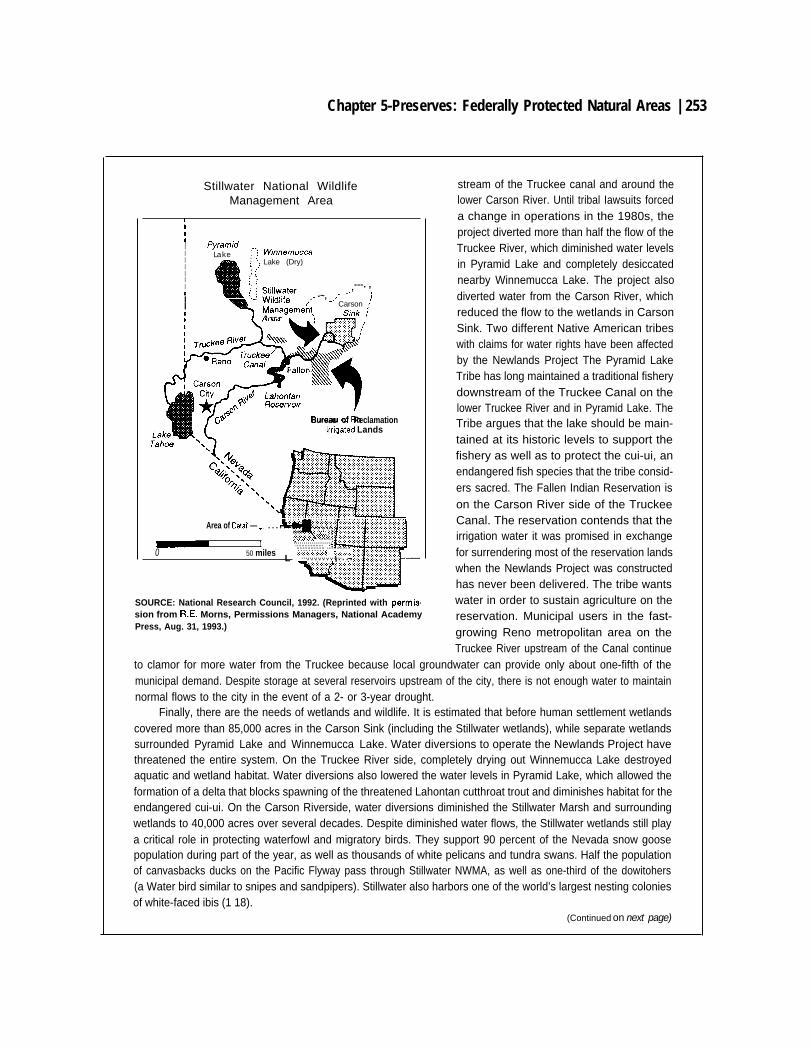
Chapter 5-Preserves: Federally Protected Natural Areas | 253
Stillwater National WildlifeManagement Area
IIII PyrarndI Lake I-’!I : ‘$,I :,; ,,.I ;’ tI ,,I :, O.
< ~ StNwater---. ,,
II - Wlldllfe
---” j,- -~, -,,I Manageme~t
Carson /I
Area ,Smk ;
I ‘t.. ...::.:,:
(’.,,,.,,,,..,.,. . . ,(
‘“”’ “::~~:;”’i
&#i
WinnemuccaLake (Dry)
City
m{
.4d Lahontan&G%@QP Reservow
/
Bureau of Reclamation,, Imaated Lands
Area of Detail — ~,.,, . . . . . . . . . . . . . . . . .,.,.,.,
1
L \
.::::.:.:.:.: :,,,.,.,.,.,.,..., . . . . . . . . . . ... . . . . . . . . . . . . . . . . . .. . . . . . . . . . . . . . . . . . . ..:.:.:.:. . . . . . . . . . . . . . . . . . . . . . . . . . . . . . . . . .0 50 miles . . . . . . . . . . . ..:.::::::::::::::::::::., ..::::,:,:::::. . . . . . . . . . . . . . . . . . . . . .:.: :.:.:.:.:.. . . . . . . . . . . .
SOURCE: National Research Council, 1992. (Reprinted with permis.sion from R.E. Morns, Permissions Managers, National AcademyPress, Aug. 31, 1993.)
stream of the Truckee canal and around thelower Carson River. Until tribal Iawsuits forceda change in operations in the 1980s, theproject diverted more than half the flow of theTruckee River, which diminished water levelsin Pyramid Lake and completely desiccatednearby Winnemucca Lake. The project alsodiverted water from the Carson River, whichreduced the flow to the wetlands in CarsonSink. Two different Native American tribeswith claims for water rights have been affectedby the Newlands Project The Pyramid LakeTribe has long maintained a traditional fisherydownstream of the Truckee Canal on thelower Truckee River and in Pyramid Lake. TheTribe argues that the lake should be main-tained at its historic levels to support thefishery as well as to protect the cui-ui, anendangered fish species that the tribe consid-ers sacred. The Fallen Indian Reservation ison the Carson River side of the TruckeeCanal. The reservation contends that theirrigation water it was promised in exchangefor surrendering most of the reservation landswhen the Newlands Project was constructedhas never been delivered. The tribe wantswater in order to sustain agriculture on thereservation. Municipal users in the fast-growing Reno metropolitan area on theTruckee River upstream of the Canal continue
to clamor for more water from the Truckee because local groundwater can provide only about one-fifth of themunicipal demand. Despite storage at several reservoirs upstream of the city, there is not enough water to maintainnormal flows to the city in the event of a 2- or 3-year drought.
Finally, there are the needs of wetlands and wildlife. It is estimated that before human settlement wetlandscovered more than 85,000 acres in the Carson Sink (including the Stillwater wetlands), while separate wetlandssurrounded Pyramid Lake and Winnemucca Lake. Water diversions to operate the Newlands Project havethreatened the entire system. On the Truckee River side, completely drying out Winnemucca Lake destroyedaquatic and wetland habitat. Water diversions also lowered the water levels in Pyramid Lake, which allowed theformation of a delta that blocks spawning of the threatened Lahontan cutthroat trout and diminishes habitat for theendangered cui-ui. On the Carson Riverside, water diversions diminished the Stillwater Marsh and surroundingwetlands to 40,000 acres over several decades. Despite diminished water flows, the Stillwater wetlands still playa critical role in protecting waterfowl and migratory birds. They support 90 percent of the Nevada snow goosepopulation during part of the year, as well as thousands of white pelicans and tundra swans. Half the populationof canvasbacks ducks on the Pacific Flyway pass through Stillwater NWMA, as well as one-third of the dowitohers(a Water bird similar to snipes and sandpipers). Stillwater also harbors one of the world’s largest nesting coloniesof white-faced ibis (1 18).
(Continued on next page)
254 I Preparing for an Uncertain Climate-Volume 2
Box 5-G-Competition for Water:The Case of the Stillwater National Wildlife Management Area-(Continued)
Ironically, efforts starting in the 1960s to improve the operating efficiency of the Newlands Project in orderto conserve water for tribal claims, restore Pyramid Lake, and protect the cui-ui and cutthroat trout have furtherdiminished the Stillwater wetlands. After water flows from the Carson River had been diverted, runoff fromagricultural fields became a major water source for the marsh. As improved efficiency cut the amount of runoff,more wet!ands dried out. The various water diversions, combined with recent droughts, have reduced the marshesin the Stillwater NWMA to an area of only 4,000 to 6,000 acres. In 1989, The Nature Conservancy purchased waterrights on 150 acres of marginal farmland to support Stillwater conservation efforts, but that supplied only a fractionof the water needed to restore the area.
The conflict over water in the Truckee-Carson, which started early in the century, grew to such proportionsthat Congress finally stepped in to help negotiate a settlement. The Truckee-Carson-Pyramid Lake Watersettlement Act (P.L. 101-618), passed in 1990, established a new allocation of water rights that attempts tobalance the competing uses and claims for the water. The act will allow water to be reallocated from agriculturalto other uses by increasing the operating efficiency of the Newlands Project and by retiring up to 23 percent ofthe agricultural land it serves. Municipal users will be able to purchase water rights from agricultural users.Congress authorized the Fish and Wildlife Service to purchase water rights from willing sellers in amounts sufficientto maintain 25,000 acres of Stillwater wetlands in perpetuity.
Stillwater NWMA does not yet have all the water it needs, but at least there is now a mechanism for acquiringit. A drier climate linked to greenhouse warming could delay, or even prevent, the restoration effort becausedrought conditions would likely lead to increased demands for agricultural and municipal water conversions. Ifconditions become dry enough, however, water prices may rise high enough to drive some adjacent farmlandsout of production, potentially freeing some water supplies. On the other hand, if urban growth in Reno continuesat the present rate, municipal uses could well absorb any water released from agriculture. Indeed, in the event ofa prolonged drought in which water supplies become critical, demand for municipal water could challenge thelegislative settlement that now supplies Stillwater wetlands with water rights.
The distribution of limited water among competing uses will continue to be a complicated and controversialtask as the climate changes. “The West is defined . . .by inadequate rainfall,” notes Western author WallaceStegner. “We can’t create water, or increase the supply. We can only hold back and redistribute what there is.”Congress has intervened to ensure that at least some water will remain to nourish 25,000 acres of Stillwater refugewetlands in perpetuity. Whether other western refuges will reap any rewards from similar redistribution remainsto be seen.
SOURCES: National Research Coundl, Water Transfers In the Wsst Effkfwrcy, Equity, andhs Emdronrnent(Washlngton, DC: NationalAcademy Press, 1992); The Nature Conservancy, “Turning on the Tap at Stiliwater,” IVature Conservancy, vol. 40, July/August 1990, pp.2s29.
THE PROBLEM OF CLIMATE CHANGE: A induced climate changes in the future (see ch. 2).SHIFTING CLIMATE OVER A STATIC MAP Climate zones are expected to shift significantly
at unprecedented rates during the next century. AThe conditions that accompanied natural cli- warming of 5.4 OF (3 ‘C) by the year 2100 could
mate changes in the past are significantly differ- shift optimal climate regimes for some speciesent from those expected to accompany human- roughly 200 to 300 miles (300 to 500 kilometers)14
M ~ convw miles to kilometers, multiply by 1.6W.
Chapter 5-Preserves: Federally Protected Natural Areas | 255
Box 5-H-Water and Natural Areas Under Climate Change
Water is important for natural areas for a variety of reasons. More than 75 percent of wildlife and fish speciesin the arid West depend on riparian (riverside) habitat at some point in their lives (43, 140). The Nation’s dwindlingwetlands (including those in riparian areas), which provide critical habitat for popular game and many endangeredspecies and numerous services such as flood control, depend on adequate water flows (see vol. 2, ch. 4). Inaddition, instream water flows have become a primary concern for many types of outdoor recreation such asrecreational fishing, waterfowl hunting, canoeing, shoreline camping, and sightseeing (15, 110).
For example, the wetlands in California’s central valley provide essential habitat for migratory birds, residentwildlife, and several threatened and endangered plant and animal species. These wetlands contain 10 NationalWildlife Refuges, 4 State Wildlife Management Areas, and several privately managed wetlands and are a criticalpart of the Pacific Flyway, a migratory route ranging from Mexico to Canada (142). Over 10 million waterfowl andother migratory birds pass through the Central Valley wetlands every year (142). Water supplies are controlled bydams and water-delivery systems. Water withdrawals and diversions for agriculture and other developmentactivities have reduced the wetlands in this area from over 4 million acres to roughly 300,000 acres (1.6 millionto 122,000 hectares)1 (142). Biologists stress that unless a dependable supply of water is maintained, waterfowland wildlife could significantly decline (142).
Climate change and water supplies-lf climate change leads to drier conditions, pressures to divert waterto sustain growing cities and agriculture could contribute to additional habitat decline, increased species losses,and reduced recreational opportunities. Efforts to secure water for fish and wildlife and other environmentalpurposes have increased in recent years. Securing water rights for Federal natural areas would help ensure thatthe functions of these areas are not sacrificed in the future and are given consideration in times of water shortage.
Water rights and Federal natural areas-Water rightsfor Federal natural areas can be obtained at the Stateor Federal level. Most States have passed laws that recognize instrearn flows for the benefit of fish and wildlifeas a legitimate “beneficial use” under the prior appropriation doctrine in the West (see vol. 1, ch. 5, for more details).The Federal Government Can try to secure water for the benefit of fish and wildlife by obtaining water rights underState law just as any other landowner in a State can. However, unless purchased from more-senior rightsholders,these rights would be junior, meaning they would be among the first to be sacrificed under extreme situations (123).Water law also varies considerably from State to State. Instream flows can also be considered under the NationalEnvironmental Policy Act (P.L. 91-190), under the Endangered Species Act (P.L. 93-205) (during critical habitatdesignation), while acquiring State permits, or relicensing darns (1 10).
Normally, the allocation of water is determined by State water law, but the Federal Government has exercisedits power to claim “implied” water rights for “lands withdrawn from the public domain and reserve[d] for a federalpurpose” (Cappaert v. United States as cited by 123). Consideration of the purposes for which the land wasreserved and whether water is necessary to carry out those purposes are important factors in determining whetherFederal water rights were indeed “implied” when the land was reserved. Under this rule, only lands reserved fromthe public domain are eligible for Federal reserved water rights; lands purchased or otherwise acquired by theFederal Government from outside the public domain are not eligible. In addition, only unappropriated water canbe claimed, the right is prioritized by the date of the reservation, only water sufficient to carry out Federal purposesIs granted under the right, and the right is lost if it is not put to immediate use (123).
Because they were reserved from the public domain, Federal water rights maybe claimed for most NationalParks. Even though the National Park Service states that it “will assert claims to reserved federal water rights forwater quantities determined to be the minimum amounts needed to protect the primary purposes of a given park”(153), these rights have not been quantified for most National Parks, and there is no policy or program in placeto quantify necessary instream flows (110).
1 TO convert acres to hectares, multiply by 0.405.(Continued on next page)
256 I Preparing for an Uncertain Climate-Volume 2
Box 5+1-Water and Natural Areas Under Climate Change--Continued)
Although it is a matter of considerable controversy, Federal water rights are currently not reserved forWilderness Areas because it is not dear whether they are areas “reserved” for a Federal purpose or simply aspecial management designation. In addition, it is debated whether the creation of water rights is necessary tocarry out the purposes of the Wilderness Act (P.L. 88-577) (123). Water rights for most of the early Wildernesslands were not an issue because many of these areas included headwaters, and, therefore, water supplies werenot at risk from upstream diversions. However, recent and potential future designations include areas in the aridWest that lie downstream from other water users. Increased demands for water from population growth of climatechange could increase pressure to divert water that now feeds Wilderness areas and could escalate the debatesurrounding water rights for Wilderness Areas.
In many cases (especially in the West), the Fish and Wildlife Service has acquired water rights for NationalWildlife Refuges with land purchases and applied for rights under State law (147). However, these rights are oftenvery “junior” or of low priority compared with those of other water-rights holders, and they are subject to varyingState water laws. As a result sufficient water may not reach a refuge in water-stressed times. In addition, the waterflowing into many western refuges is in upstream reservoirs that are controlled by other agengies or subject tocertain Iimits that dictate the amount of water available to the refuge. Federal water rights have been reserved forsome refuges. Currently, 78 refuges west of the Mississippi River have Federal reserved water rights, but theserights have not been quantified for most refuges (147).
Unlike other laws governing natural areas, the Wild and Scenic Rivers Act (P.L. 90-542) expressly claimedFederal water rights in the amounts necessary to preserve the values for which the rivers were designated, andauthorized condemnation of existing rights, if necessary, to carry out the act. However, to date, no designationof a river has included the condemnation of existing water rights (123).
SOURCE: Office of Technology Assessment, 1993.
northward and 1,600 feet (500 meters)15 upward regimes. However, although climate zones andin elevation (58, 94). In response, plants and
. may either migrate to more suitablelocations, adapt to new climate conditions, ordecline and possibly face extinction (see box 2-E)(91, %). Groups of species will not all respond thesame way, so the species composition found inany given area will likely change (46, 172).16
Climate conditions for which some species arebest adapted could shift out of natural areas thatare now protected and into adjacent (or evendistant) areas that are more developed, frag-mented, or subject to different management
ecosystems may shift in response to climatechange, the legislatively established boundariesof protected natural areas are generally fixed (seefig. 5-l).
• VulnerabilityNatural area vulnerability to climate change
depends largely on why the area is valued and onthe nature of the existing complex interactionsamong climate and ecological systems. There-fore, although some general risks can be identi-fied, it is difficult to determine exactly which
13 ~ convmt feet to meters, multiply by 0.305.
lb ~u@it isnot CIMU Cmcayhow species will respond to a change in their optimal climatic regime, paleoclirnatic evidence andmddhganalysis suggest that species may migrate at different rates, and that some species may not be able to migrate or adapt to new conditions fastenough (40, 46, 172).
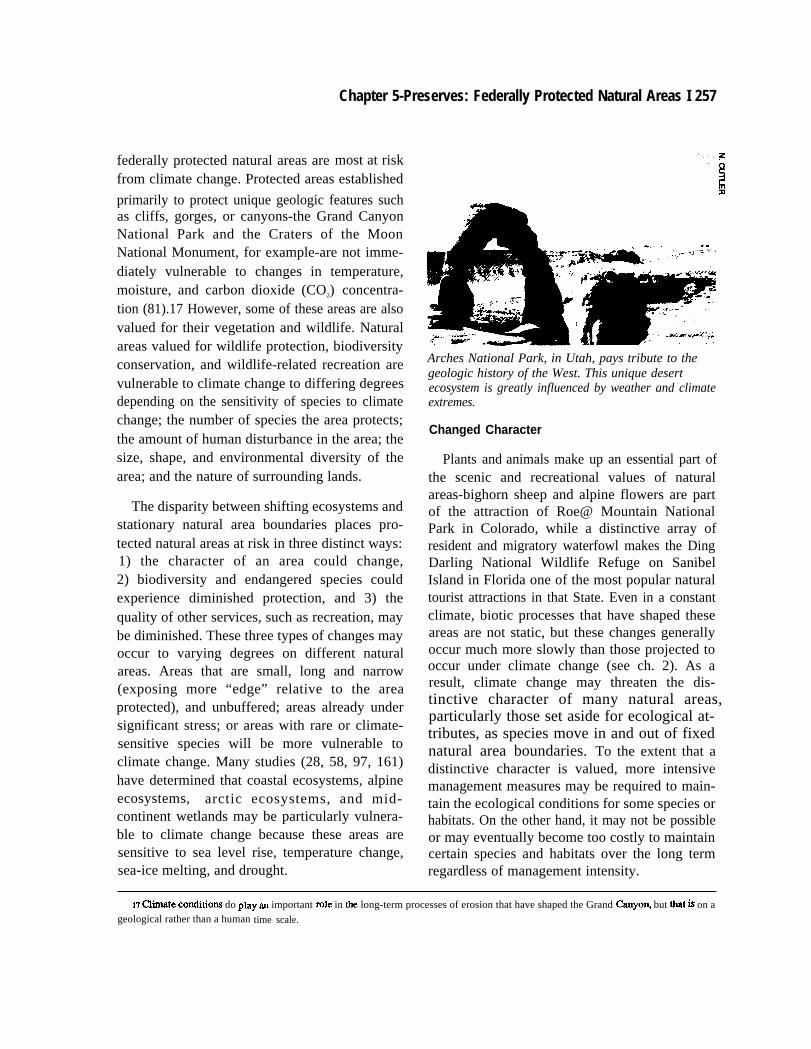
Chapter 5-Preserves: Federally Protected Natural Areas I 257
federally protected natural areas are most at riskfrom climate change. Protected areas established
primarily to protect unique geologic features suchas cliffs, gorges, or canyons-the Grand CanyonNational Park and the Craters of the MoonNational Monument, for example-are not imme-diately vulnerable to changes in temperature,moisture, and carbon dioxide (CO2) concentra-tion (81).17 However, some of these areas are alsovalued for their vegetation and wildlife. Naturalareas valued for wildlife protection, biodiversityconservation, and wildlife-related recreation arevulnerable to climate change to differing degreesdepending on the sensitivity of species to climatechange; the number of species the area protects;the amount of human disturbance in the area; thesize, shape, and environmental diversity of thearea; and the nature of surrounding lands.
The disparity between shifting ecosystems andstationary natural area boundaries places pro-tected natural areas at risk in three distinct ways:1) the character of an area could change,2) biodiversity and endangered species couldexperience diminished protection, and 3) thequality of other services, such as recreation, maybe diminished. These three types of changes mayoccur to varying degrees on different naturalareas. Areas that are small, long and narrow(exposing more “edge” relative to the areaprotected), and unbuffered; areas already undersignificant stress; or areas with rare or climate-sensitive species will be more vulnerable toclimate change. Many studies (28, 58, 97, 161)have determined that coastal ecosystems, alpineecosystems, arctic ecosystems, and mid-continent wetlands may be particularly vulnera-ble to climate change because these areas aresensitive to sea level rise, temperature change,sea-ice melting, and drought.
Arches National Park, in Utah, pays tribute to thegeologic history of the West. This unique desertecosystem is greatly influenced by weather and climateextremes.
Changed Character
Plants and animals make up an essential part ofthe scenic and recreational values of naturalareas-bighorn sheep and alpine flowers are partof the attraction of Roe@ Mountain NationalPark in Colorado, while a distinctive array ofresident and migratory waterfowl makes the DingDarling National Wildlife Refuge on SanibelIsland in Florida one of the most popular naturaltourist attractions in that State. Even in a constantclimate, biotic processes that have shaped theseareas are not static, but these changes generallyoccur much more slowly than those projected tooccur under climate change (see ch. 2). As aresult, climate change may threaten the dis-tinctive character of many natural areas,particularly those set aside for ecological at-tributes, as species move in and out of fixednatural area boundaries. To the extent that adistinctive character is valued, more intensivemanagement measures may be required to main-tain the ecological conditions for some species orhabitats. On the other hand, it may not be possibleor may eventually become too costly to maintaincertain species and habitats over the long termregardless of management intensity.
17 ~te co~itio~ do play an important ro]e in tie long-term processes of erosion that have shaped the Grand CanyO% but tit h on ageological rather than a human time scale.
258 I Preparing for an Uncertain Climate--Volume 2
Dimikshed Protection of Biodiversity andEndangered Species
Many natural areas are already islands in a seaof development and human activity. The land-scape outside protected natural area boundariesmay be fragmented and offer little suitable habitatfor species able to migrate. Moreover, if fewhabitat types are available within the preserve,then species have even fewer alternatives asclimate changes (89). As a result, some speciesmay decline in number or become extinct. Al-though not necessarily designed specifically forthe protection of species and biodiversity, theFederal system of natural areas now plays a bigrole in protecting habitat for rare and endangeredspecies and preventing additional species loss anddecline. Species that leave the boundaries ofprotected natural areas in their attempts to findsuitable climate may no longer be protected.Thus, to the extent that federally protected naturalareas are valued for nurturing biodiversity andprotecting endangered species, changes in cli-mate may threaten and diminish their value.
Several types of species have been identified asparticularly vulnerable to climate change, includ-ing rare or threatened species, migratory species(species that rely on appropriate habitat through-out their range), species that disperse slowly orover very short distances, and some species inalpine and coastal communities (see ch. 2). Table5-4 summarizes the kinds of species and ecosys-tems most at risk from climate change. Endan-gered species may be especially at risk becausethey are already significantly stressed and manyrequire a narrow band of environmental condi-tions for survival. The Endangered Species Act(P.L. 93-205) is currently the primary mechanismfor protecting these species. Federally protectednatural areas may have difficulty fulfilling t h e i rroles of endangered species protection in thefuture under climate change. As a result, pres-sures to protect species may increasingly shift toFederal lands not currently protected as natural
areas and lands underlands are suitable for
other ownership, if thosespecies habitat. Box 5-D
highlights implications for this act under climatechange.
Diminished Ability to Provide Other ServicesSpecies shifts that occur in a changing climate
will likely affect wildlife-related recreation inexisting natural areas. Many waterfowl habitatsalready require intensive management to providefor recreational hunting. Natural shifts in water-fowl migration patterns pose problems for wild-life management in some States.18 Species valuedfor hunting that move out of protected preserveswill decrease the population of game available inthe preserve. On the other hand, rare or endan-gered wildlife that moves out of protected naturalareas and into private or multiple-use lands maybe more susceptible to hunting and poaching,making their survival more tenuous. Conse-quently, opportunities for watching wildlife, pho-tography, and nature study could be diminished inmany protected natural areas. One assessment offuture recreation supply and demand indicatesthat, for many reasons, wildlife-related recreationmay be in the shortest supply relative to demandof all outdoor recreation by the middle of the nextcentury (131). Climate change is likely to com-pound this problem if it makes wildlife moresusceptible to decline.
U AdaptabilityWhether a natural area can “adapt,” that is,
persist and thrive, under climate change, dependssomewhat on what species live within its bounda-ries, but also on the management efforts that helpor inhibit adaptation. Climate-induced changes inspecies composition, pest outbreaks, and thefrequency and intensity of fire and drought willcomplicate the management of protected naturalareas. The challenge for managers will be toconserve the processes and resources that charac-terize a natural area given that the boundaries of
18 M. B-, senior Attorney, Envmmrnental Defense F?@ pCXSOA CO_~_tiOU ah 23, 1993.
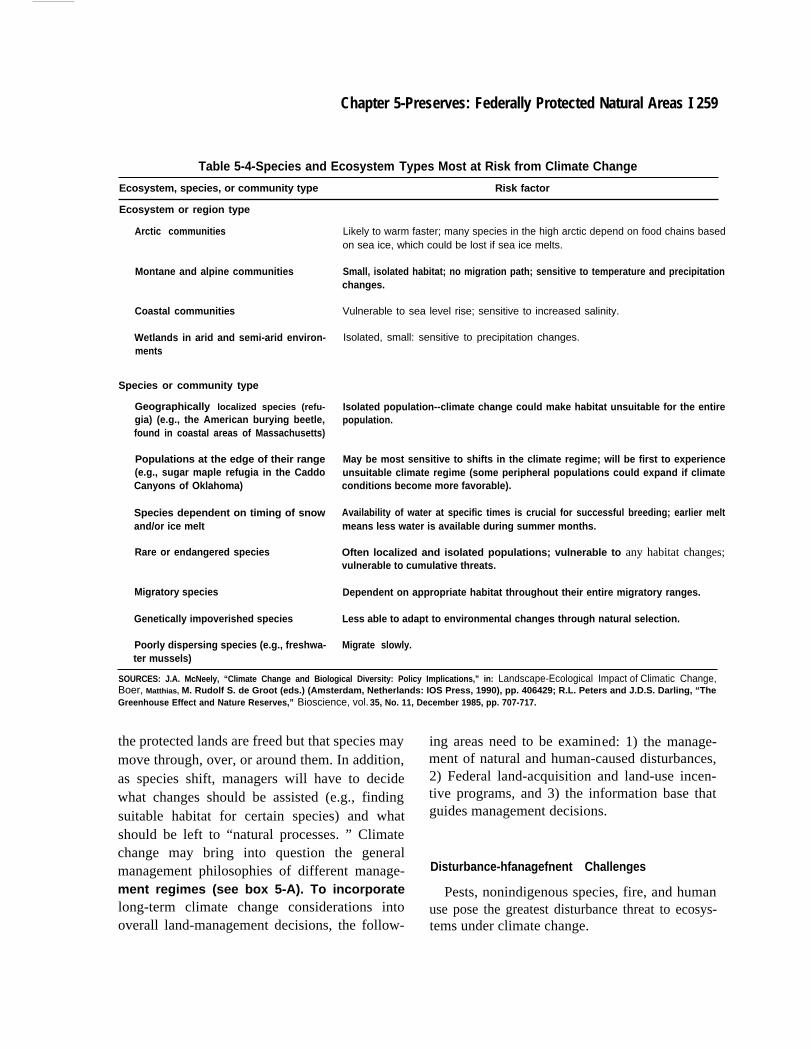
Chapter 5-Preserves: Federally Protected Natural Areas I 259
Table 5-4-Species and Ecosystem Types Most at Risk from Climate Change
Ecosystem, species, or community type Risk factor
Ecosystem or region type
Arctic communities
Montane and alpine communities
Coastal communities
Wetlands in arid and semi-arid environ-ments
Species or community type
Geographically localized species (refu-gia) (e.g., the American burying beetle,found in coastal areas of Massachusetts)
Populations at the edge of their range(e.g., sugar maple refugia in the CaddoCanyons of Oklahoma)
Species dependent on timing of snowand/or ice melt
Rare or endangered species
Migratory species
Genetically impoverished species
Poorly dispersing species (e.g., freshwa-ter mussels)
Likely to warm faster; many species in the high arctic depend on food chains basedon sea ice, which could be lost if sea ice melts.
Small, isolated habitat; no migration path; sensitive to temperature and precipitationchanges.
Vulnerable to sea level rise; sensitive to increased salinity.
Isolated, small: sensitive to precipitation changes.
Isolated population--climate change could make habitat unsuitable for the entirepopulation.
May be most sensitive to shifts in the climate regime; will be first to experienceunsuitable climate regime (some peripheral populations could expand if climateconditions become more favorable).
Availability of water at specific times is crucial for successful breeding; earlier meltmeans less water is available during summer months.
Often localized and isolated populations; vulnerable to any habitat changes;vulnerable to cumulative threats.
Dependent on appropriate habitat throughout their entire migratory ranges.
Less able to adapt to environmental changes through natural selection.
Migrate slowly.
SOURCES: J.A. McNeely, “Climate Change and Biological Diversity: Policy Implications,” in: Landscape-Ecological Impact of Climatic Change,Boer, Matthias, M. Rudolf S. de Groot (eds.) (Amsterdam, Netherlands: IOS Press, 1990), pp. 406429; R.L. Peters and J.D.S. Darling, “TheGreenhouse Effect and Nature Reserves,” Bioscience, vol. 35, No. 11, December 1985, pp. 707-717.
the protected lands are freed but that species may ing areas need to be examined: 1) the manage-move through, over, or around them. In addition, ment of natural and human-caused disturbances,
as species shift, managers will have to decide 2) Federal land-acquisition and land-use incen-
what changes should be assisted (e.g., finding tive programs, and 3) the information base that
suitable habitat for certain species) and what guides management decisions.
should be left to “natural processes. ” Climatechange may bring into question the generalmanagement philosophies of different manage- Disturbance-hfanagefnent Challenges
ment regimes (see box 5-A). To incorporate Pests, nonindigenous species, fire, and humanlong-term climate change considerations into use pose the greatest disturbance threat to ecosys-overall land-management decisions, the follow- tems under climate change.
260 I Preparing for an Uncertain Climate-Volume 2
Pests and nonindigenous (exotic) species. Itis likely that climate change could acceleratethe spread of undesirable plants, insects, andpathogens (128). Usually, indigenous species arebetter adapted to the environment and competesuccessfully with introduced species, thus, mostundesirable exotic species do not become estab-lished. However, under climate change, manynonindigenous species considered undesirableare predicted to be favored (see ch. 2) (72). Thus,Opportunistic weedy species, pests, and disease-carrying organisms may replace or infect indige-nous species (95, 128, 161).
Invasion of nonindigenous species can haveprofound effects on biological diversity. Forexample, in the western United States, bunchgrasses, sagebrush, and other species dominatedthe arid region of southern Idaho before humansettlement. Now, cheatgrass, an annual grassintroduced from Europe, dominates the region(28). Cheatgrass is valuable as forage in thespring, but in the summer, it becomes flammableand worthless as forage. The Fish and WildlifeService estimates that nonindigenous specieshave contributed to the decline of roughly 30percent of the listed endangered species in theUnited States (9). Increased invasions underclimate change pose a significant problem tonatural area management.
National Parks emphasize the maintenance ofhistorically, naturally occurring species withintheir boundaries. The current policy explicitlystates that species that move onto the park as aresult of direct or indirect human activity are notconsidered “native” (i.e., indigenous to the park)and that “non-native species will not be allowedto displace native species if this displacement canbe prevented by management” (153). Under astrict application of this policy, trees or otherorganisms that migrate into a park in response toclimate change would be considered ‘ ‘nonna-tive. ” Such a policy might be desirable today to
stem the spread of weedy and undesirable species,but a three-pronged problem could emerge underclimate change: 1) control of undesirable nonna-tive species may become more costly in the futureif these species are favored under climate change,2) policies may prevent “naturally” migratingspecies from moving into parks, and 3) efforts toprotect existing or historical species composition,if not impossible, may become more difficult andcostly. In short, what is considered “exotic,” ornonnative, today may become ‘‘native” underclimate change. For the case of migration, it maybe useful to distinguish exotic but nationallyindigenous neighbors from exotic and nationallynonindigenous neighbors.
The Fish and Wildlife Service policy onnonindigenous species is not as clear as theNational Park Service policy. Clarification of thispolicy could aid future management decisionsunder climate change. Although FWS policymaintains that the National Wildlife RefugeSystem exists for the “protection and manage-ment of plants and animals native to the UnitedStates,” this policy makes no regional distinc-tions among “native” species and is heavilyqualified elsewhere in other FWS policies: “[t]heattainment of natural diversity is not an over-riding objective of refuge management, but itshould be an underlying consideration for all. . .management activities” (143). This tension re-flects the fact that many refuges are actively andintensively manipulated to attain certain objec-tives that may or may not conflict with efforts toprotect “native” species.19 Other ‘‘nonnative”species, including pests, not purposefully intro-duced or already present on refuge lands arecontrolled when they interfere with refuge objec-tives (128). Thus, despite a policy to considernatural diversity on refuge lands and a policy toprotect ‘‘native,’ or indigenous species, sometolerance for “nonnative” species is allowed andsometimes encouraged.
19 Forcxample, “nonnative” grasses may be planted in rcikges “whcnnative grassland management will not achieve the * waterfowlproduction objective” (144).
Chapter 5-Preserves: Federally Protected Natural Areas I 261
The policy regarding nonindigenous species isalso unclear for Wilderness Areas.20 Given thegeneral ‘hands-off” management philosophy formost Wilderness Areas, increased invasions andinfestations of nonindigenous species under cli-mate change could be considered consistent withwilderness-management objectives. Yet, signifi-cant change caused by such invasions could alsobe interpreted as diminishing the wildernesscharacter and wilderness values of the area.Noxious farm weeds (i.e., pests that damageagriculture plants), which are defined by Stateagencies and may or may not be indigenous to thearea, can be controlled on Forest Service Wilder-ness when they threaten lands surrounding thewilderness. Nonindigenous wildlife species al-ready established on Bureau of Land Manage-ment Wilderness Areas ‘‘may continue wherethey enhance the wilderness character of a partic-ular wilderness’’21; however, management ofnonindigenous plant species has not been explic-itly addressed (139). Forest Service WildernessArea policy does not permit control of “pests”except in cases where resources on adjacent landsare threatened or if the pest is nonnative andcontributes to a significant loss of the wildernessresource (129). Only control measures that havethe least adverse impact on the wilderness areacan be taken.
Fire Management. Tree-ring studies in Se-quoia and Kings Canyon National Parks inCalifornia have shown that regional intense andfrequent fries have been associated with droughtevents in the past (116). Climate change couldincrease the frequency and intensity of fires fornatural areas if droughts become more frequent
and if forest dieback accelerates and/or spreads.22
Several problems could emerge. Pressures tosuppress all fires in natural areas could intensify(despite a change in the natural fire regime), andcosts of fire control could consequently in-crease. 23 Removal of fuel buildup may becomemore important for catastrophic-fire prevention,but as areas become drier and drier, it becomesdangerous to bring heavy machinery into dryforested areas to remove fuel because sparks andmotors may easily ignite frees. In addition, somefire-control measures could damage natural areavalues. Finally, efforts to maintain the ‘natural’function of fire in ecosystem development inprotected natural areas may be severely ham-pered.
Fires have been recognized as an importantnatural process that shapes an ecosystem as itscomponents evolve over time (67, 177). In recentyears, lightning-ignited frees have been allowedto bum naturally in National Parks, if life orproperty are not seriously threatened. This naturalfire policy was subject to considerable scrutinyafter the 1988 fires in Yellowstone National Park(see box 5-I). Dry, hot weather conditions com-bined with years of fire suppression and excessivefuel buildup caused over 740,000 acres of the parkto bum (167). A National Fire ManagementPolicy Review Team was established by theSecretaries of Agriculture and the Interior toreview fire policies for parks and other federallyprotected natural areas and to make recommenda-tions for fire management in the future. Theteam’s report reaffirmed the positive role of firein ecological processes for natural areas, buturged that the policies be clarifled and strength-
m However, management policies for Wilderness Areas under the jurisdiction of the National Park Service generally follow managementpolicies for NPS natural areas. Some of these policies maybe more strict than wilderness management policies in other Federal agencies,
21 It ~ not cl- ~w @ de termination is made that a species “enhances the wilderness character’ of a Wilderness Area.22 ~ Cqle of~e comb~~ fip~ts of &ou@t ~d dim spread is evident k the Blue hfOUXI@hM of ~gon- ~ p~~ ~~tio~
in the West bave left drought-intolerant Douglas-firs vulnerable to disease spread. Currently, over 50 percent of many forests and Wildem~SAreas in these mountains arc dead or dying (133). The area has been described aa a tinderbox for wildfiies (see box W! for more detail).
~ M fiplcrn~t fie Ffie po]icy Review ‘Ikarn’s recommendations and to effectively carry out a comprehmsive, .@e f~~gunentprogram, both the Forest Service and the Park Service have stated that substantial increases in funds and personnel are needed (165).
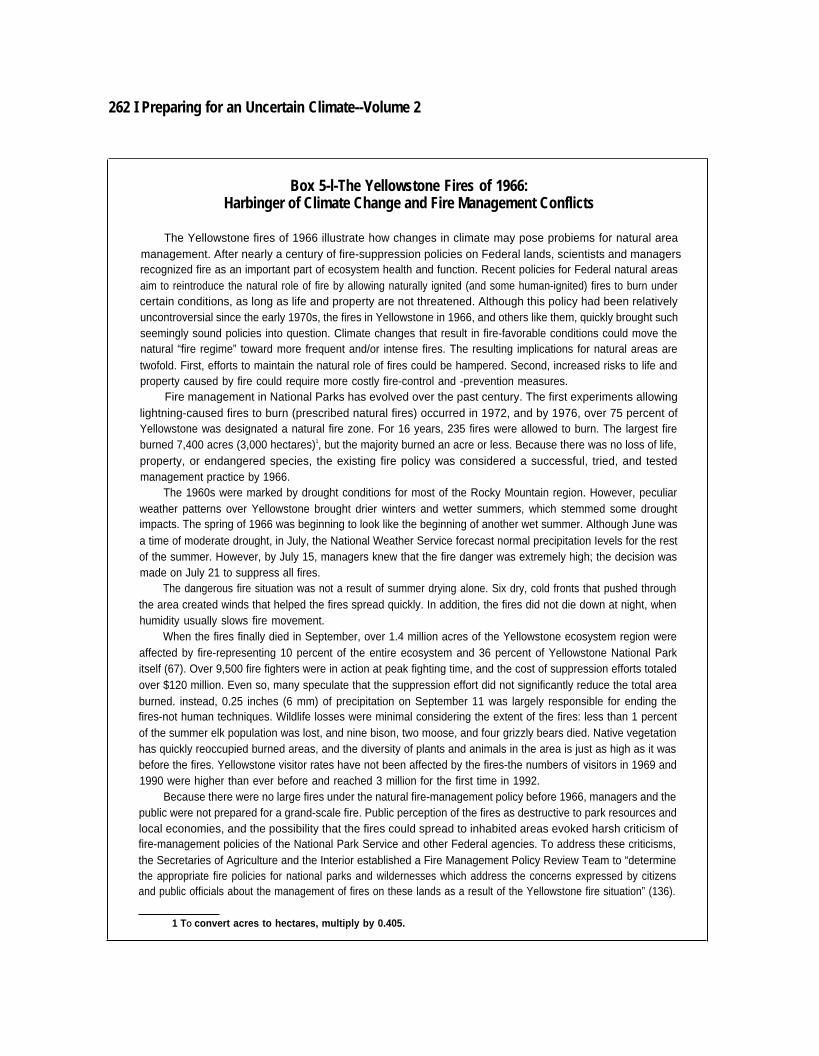
262 I Preparing for an Uncertain Climate--Volume 2
Box 5-l-The Yellowstone Fires of 1966:Harbinger of Climate Change and Fire Management Conflicts
The Yellowstone fires of 1966 illustrate how changes in climate may pose probiems for natural areamanagement. After nearly a century of fire-suppression policies on Federal lands, scientists and managersrecognized fire as an important part of ecosystem health and function. Recent policies for Federal natural areasaim to reintroduce the natural role of fire by allowing naturally ignited (and some human-ignited) fires to burn undercertain conditions, as long as life and property are not threatened. Although this policy had been relativelyuncontroversial since the early 1970s, the fires in Yellowstone in 1966, and others like them, quickly brought suchseemingly sound policies into question. Climate changes that result in fire-favorable conditions could move thenatural “fire regime” toward more frequent and/or intense fires. The resulting implications for natural areas aretwofold. First, efforts to maintain the natural role of fires could be hampered. Second, increased risks to life andproperty caused by fire could require more costly fire-control and -prevention measures.
Fire management in National Parks has evolved over the past century. The first experiments allowinglightning-caused fires to burn (prescribed natural fires) occurred in 1972, and by 1976, over 75 percent ofYellowstone was designated a natural fire zone. For 16 years, 235 fires were allowed to burn. The largest fireburned 7,400 acres (3,000 hectares)1, but the majority burned an acre or less. Because there was no loss of life,property, or endangered species, the existing fire policy was considered a successful, tried, and testedmanagement practice by 1966.
The 1960s were marked by drought conditions for most of the Rocky Mountain region. However, peculiarweather patterns over Yellowstone brought drier winters and wetter summers, which stemmed some droughtimpacts. The spring of 1966 was beginning to look like the beginning of another wet summer. Although June wasa time of moderate drought, in July, the National Weather Service forecast normal precipitation Ievels for the restof the summer. However, by July 15, managers knew that the fire danger was extremely high; the decision wasmade on July 21 to suppress all fires.
The dangerous fire situation was not a result of summer drying alone. Six dry, cold fronts that pushed throughthe area created winds that helped the fires spread quickly. In addition, the fires did not die down at night, whenhumidity usually slows fire movement.
When the fires finally died in September, over 1.4 million acres of the Yellowstone ecosystem region wereaffected by fire-representing 10 percent of the entire ecosystem and 36 percent of Yellowstone National Parkitself (67). Over 9,500 fire fighters were in action at peak fighting time, and the cost of suppression efforts totaledover $120 million. Even so, many speculate that the suppression effort did not significantly reduce the total areaburned. instead, 0.25 inches (6 mm) of precipitation on September 11 was largely responsible for ending thefires-not human techniques. Wildlife losses were minimal considering the extent of the fires: less than 1 percentof the summer elk population was lost, and nine bison, two moose, and four grizzly bears died. Native vegetationhas quickly reoccupied burned areas, and the diversity of plants and animals in the area is just as high as it wasbefore the fires. Yellowstone visitor rates have not been affected by the fires-the numbers of visitors in 1969 and1990 were higher than ever before and reached 3 million for the first time in 1992.
Because there were no large fires under the natural fire-management policy before 1966, managers and thepublic were not prepared for a grand-scale fire. Public perception of the fires as destructive to park resources andlocal economies, and the possibility that the fires could spread to inhabited areas evoked harsh criticism offire-management policies of the National Park Service and other Federal agencies. To address these criticisms,the Secretaries of Agriculture and the Interior established a Fire Management Policy Review Team to “determinethe appropriate fire policies for national parks and wildernesses which address the concerns expressed by citizensand public officials about the management of fires on these lands as a result of the Yellowstone fire situation” (136).
1 TO convert acres to hectares, multiply by 0.405.
Chapter 5-Preserves: Federally Protected Natural Areas | 263
The review team found that the basic approach of allowing natural fires to play a role in ecological processes wassound, but that policies regarding the treatment of wildfires needed to be refined. As a result, the agencies haveamended their policies to clarify procedures, improve coordination, and tighten criteria for using and managingprescribed fires. For example, prescribed fires in Forest Service Wilderness Areas must be contained within aspecified perimeter, and resources must be available at all times to keep the fire in the prescribed area (1 73). Tobe allowed to burn, fires in the National Parks must meet a set of criteria that include drought and sizeconsiderations. When these criteria are not met the fire is to be considered “wild” and must be suppressed (79).However, problems remain in implementing an effective, coordinated prescribed fire program (165). Interpretationof the review team’s recommendations has not been uniform across land-management agencies, leading toinconsistencies and revealing a lack of coordination in areas with common boundaries (3, 34, 79). Lack ofadequate funding, personnel, and equipment as well as internal resistance from some land managers have alsobeen cited as impediments to implementing a more controlled and coordinated prescribed-fire program (40).
If climate change leads to shifts in the natural fire patterns for some regions or leads to weather situationsconducive to large fires, it may be more difficult to allow fire to behave as a natural process in natural areas; t heremay be more pressure to control the fire regime and suppress large “natural” fires.
SOURCES: Tha Offica of Technology Assessment, 1993; J.D. Vaday and P. Schullery, “Reallty and Opportunity In the Yellowstone Firesof 19SS,” in: T/w Greabr Ye//owstone I%xystern, R.B. Keiter and M.S. Boyce (eds.) (New Haven, CT: Yale University Prass, 1991).
ened (136). 24 Despite the review team’s recom- are also not widely used in Wilderness Areas,mendation that Federal agencies should coopera-tively develop prescribed fire programs andcontingency plans, there have been problems inachieving a truly coordinated program acrossagencies (165). Lack of funding, personnel, andequipment, and a resistance to instituting aprescribed fire policy among some agency per-sonnel have also been cited as impediments toimplementing an effective, safe, prescribed fireprogram (34, 40, 165).
Although these policies pertain to both naturaland prescribed fires, use of prescribed fires is notencouraged in some National Parks because of thepolicy to let natural processes govern to the extentpossible (67). (However, prescribed fires aremore widely used in other National Parks tocontrol unnatural fuel buildup.25) Prescribed fires
especially during drought conditions, when firerisks are high.2G Ironically, this could be the verytime that most ecologically significant fires haveoccurred in the past. Removing trees to reducefuel loads is allowed only in emergency situationsin some Wilderness Areas. Fire management inprotected natural areas presents a dilemma tomanagers: to minimize fire risk during dry years,many fires are suppressed and few are ignited.Yet, multiple dry years without frees result ingreater fuel buildup and very high risks ofcatastrophic fires.
Human-Use Management. In recent years,reports on the condition of the National Parkshave cited overcrowding and damage from visitoruse as among the main threats to park resources(17, 154, 158). Because the parks were estab-
~ NPS ~d w agencies wir,hjurisdiction over Wilderness Areas (including FWS, the Forest Service, and BLM) have mvkd tiir Policiesto allow “prescribed” ties (human or lightning ignited) to burn only under speeillc conditions as stated in a Fire Management Plan. All firesthat do not conform to the specified conditions of the plan (e.g., they become more intense or spread outside the specified fire perimeter) areconsidered “wildfiies” and are to be suppressed (79, 155, 173).
~ D. ptUSOnS, Research sci~ti~ National Park Service, Sequoia and Kings Canyon National Parks, pOId COmUrdWtiOIh --AP~
1993.26 J.’I’. wi~~, Branch Chief, Fire Use and Fuels, Fhe and Aviation hkmagemen~ USDA Forest Service, personal COImUmkdiOIL -h
22, 1993.
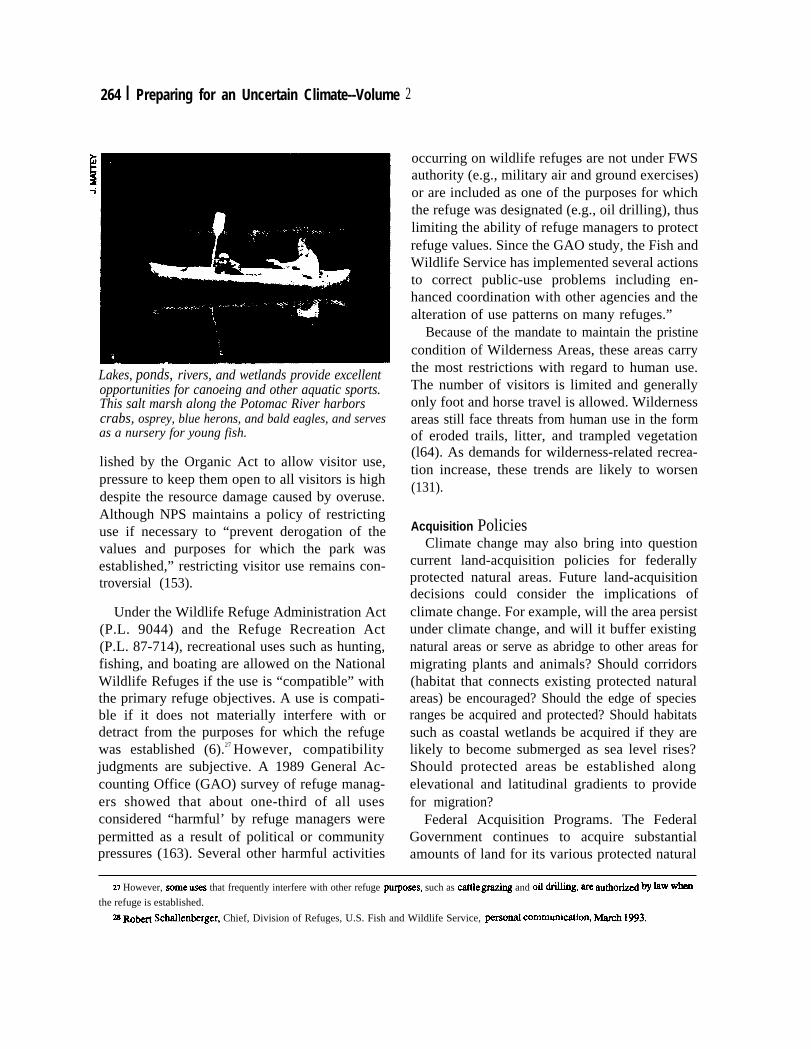
264 I Preparing for an Uncertain Climate--Volume
Lakes, ponds, rivers, and wetlands provide excellentopportunities for canoeing and other aquatic sports.This salt marsh along the Potomac River harborscrabs, osprey, blue herons, and bald eagles, and servesas a nursery for young fish.
lished by the Organic Act to allow visitor use,pressure to keep them open to all visitors is highdespite the resource damage caused by overuse.Although NPS maintains a policy of restrictinguse if necessary to “prevent derogation of thevalues and purposes for which the park wasestablished,” restricting visitor use remains con-troversial (153).
Under the Wildlife Refuge Administration Act(P.L. 9044) and the Refuge Recreation Act(P.L. 87-714), recreational uses such as hunting,fishing, and boating are allowed on the NationalWildlife Refuges if the use is “compatible” withthe primary refuge objectives. A use is compati-ble if it does not materially interfere with ordetract from the purposes for which the refugewas established (6).27 However, compatibilityjudgments are subjective. A 1989 General Ac-counting Office (GAO) survey of refuge manag-ers showed that about one-third of all usesconsidered “harmful’ by refuge managers werepermitted as a result of political or communitypressures (163). Several other harmful activities
2
occurring on wildlife refuges are not under FWSauthority (e.g., military air and ground exercises)or are included as one of the purposes for whichthe refuge was designated (e.g., oil drilling), thuslimiting the ability of refuge managers to protectrefuge values. Since the GAO study, the Fish andWildlife Service has implemented several actionsto correct public-use problems including en-hanced coordination with other agencies and thealteration of use patterns on many refuges.”
Because of the mandate to maintain the pristinecondition of Wilderness Areas, these areas carrythe most restrictions with regard to human use.The number of visitors is limited and generallyonly foot and horse travel is allowed. Wildernessareas still face threats from human use in the formof eroded trails, litter, and trampled vegetation(l64). As demands for wilderness-related recrea-tion increase, these trends are likely to worsen(131).
Acquisition PoliciesClimate change may also bring into question
current land-acquisition policies for federallyprotected natural areas. Future land-acquisitiondecisions could consider the implications ofclimate change. For example, will the area persistunder climate change, and will it buffer existingnatural areas or serve as abridge to other areas formigrating plants and animals? Should corridors(habitat that connects existing protected naturalareas) be encouraged? Should the edge of speciesranges be acquired and protected? Should habitatssuch as coastal wetlands be acquired if they arelikely to become submerged as sea level rises?Should protected areas be established alongelevational and latitudinal gradients to providefor migration?
Federal Acquisition Programs. The FederalGovernment continues to acquire substantialamounts of land for its various protected natural
27 However, ~e~~ that frequently interfere with other refuge pwposes, such as eattlegrazing and ofl dribg, We authorhd W kw wti
the refuge is established.
~ ROM sc~len~rger, Chief, Division of Refuges, U.S. Fish and Wildlife Service, ptxsOd COIIlnl~CtiO& -h 1993.
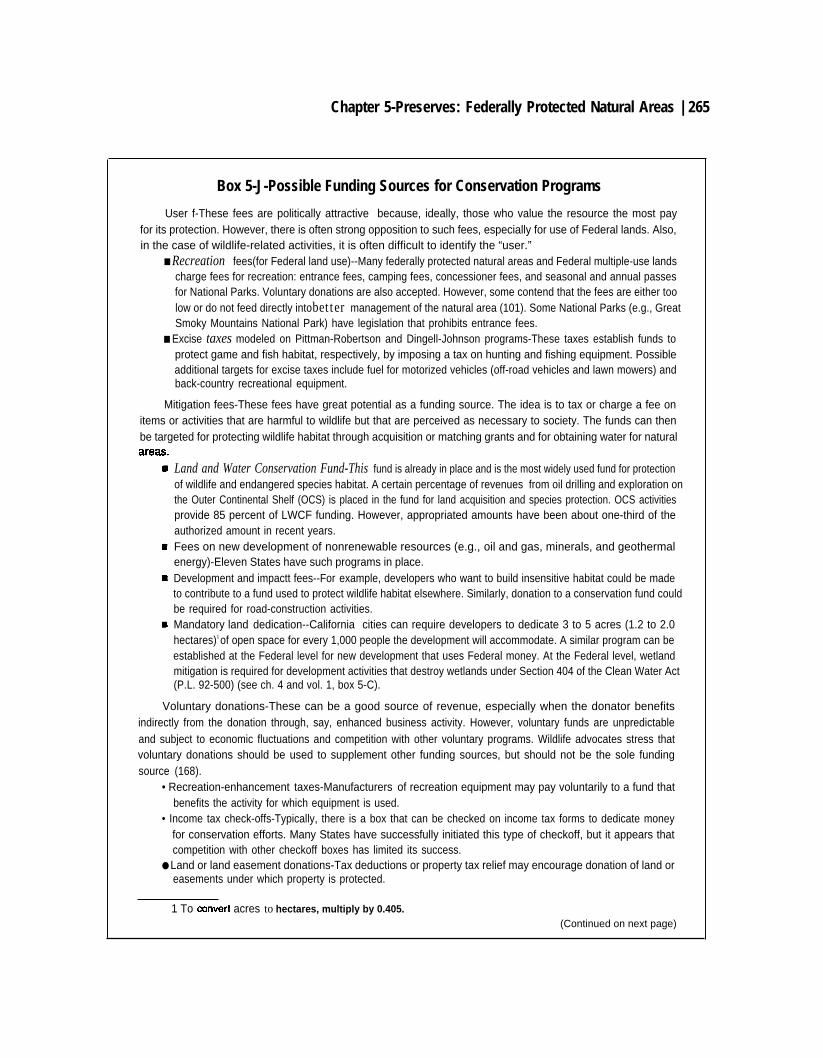
Chapter 5-Preserves: Federally Protected Natural Areas | 265
Box 5-J-Possible Funding Sources for Conservation Programs
User f-These fees are politically attractive because, ideally, those who value the resource the most payfor its protection. However, there is often strong opposition to such fees, especially for use of Federal lands. Also,in the case of wildlife-related activities, it is often difficult to identify the “user.”
■ Recreation fees(for Federal land use)--Many federally protected natural areas and Federal multiple-use landscharge fees for recreation: entrance fees, camping fees, concessioner fees, and seasonal and annual passesfor National Parks. Voluntary donations are also accepted. However, some contend that the fees are either toolow or do not feed directly into better management of the natural area (101). Some National Parks (e.g., GreatSmoky Mountains National Park) have legislation that prohibits entrance fees.
■ Excise taxes modeled on Pittman-Robertson and Dingell-Johnson programs-These taxes establish funds toprotect game and fish habitat, respectively, by imposing a tax on hunting and fishing equipment. Possibleadditional targets for excise taxes include fuel for motorized vehicles (off-road vehicles and lawn mowers) andback-country recreational equipment.
Mitigation fees-These fees have great potential as a funding source. The idea is to tax or charge a fee onitems or activities that are harmful to wildlife but that are perceived as necessary to society. The funds can thenbe targeted for protecting wildlife habitat through acquisition or matching grants and for obtaining water for natural
Land and Water Conservation Fund-This fund is already in place and is the most widely used fund for protectionof wildlife and endangered species habitat. A certain percentage of revenues from oil drilling and exploration onthe Outer Continental Shelf (OCS) is placed in the fund for land acquisition and species protection. OCS activitiesprovide 85 percent of LWCF funding. However, appropriated amounts have been about one-third of theauthorized amount in recent years.Fees on new development of nonrenewable resources (e.g., oil and gas, minerals, and geothermalenergy)-Eleven States have such programs in place.Development and impactt fees--For example, developers who want to build insensitive habitat could be madeto contribute to a fund used to protect wildlife habitat elsewhere. Similarly, donation to a conservation fund couldbe required for road-construction activities.Mandatory land dedication--California cities can require developers to dedicate 3 to 5 acres (1.2 to 2.0hectares)1 of open space for every 1,000 people the development will accommodate. A similar program can beestablished at the Federal level for new development that uses Federal money. At the Federal level, wetlandmitigation is required for development activities that destroy wetlands under Section 404 of the Clean Water Act(P.L. 92-500) (see ch. 4 and vol. 1, box 5-C).
Voluntary donations-These can be a good source of revenue, especially when the donator benefitsindirectly from the donation through, say, enhanced business activity. However, voluntary funds are unpredictableand subject to economic fluctuations and competition with other voluntary programs. Wildlife advocates stress thatvoluntary donations should be used to supplement other funding sources, but should not be the sole fundingsource (168).
• Recreation-enhancement taxes-Manufacturers of recreation equipment may pay voluntarily to a fund thatbenefits the activity for which equipment is used.
• Income tax check-offs-Typically, there is a box that can be checked on income tax forms to dedicate moneyfor conservation efforts. Many States have successfully initiated this type of checkoff, but it appears thatcompetition with other checkoff boxes has limited its success.
● Land or land easement donations-Tax deductions or property tax relief may encourage donation of land oreasements under which property is protected.
1 To ~nvert acres to hectares, multiply by 0.405.(Continued on next page)
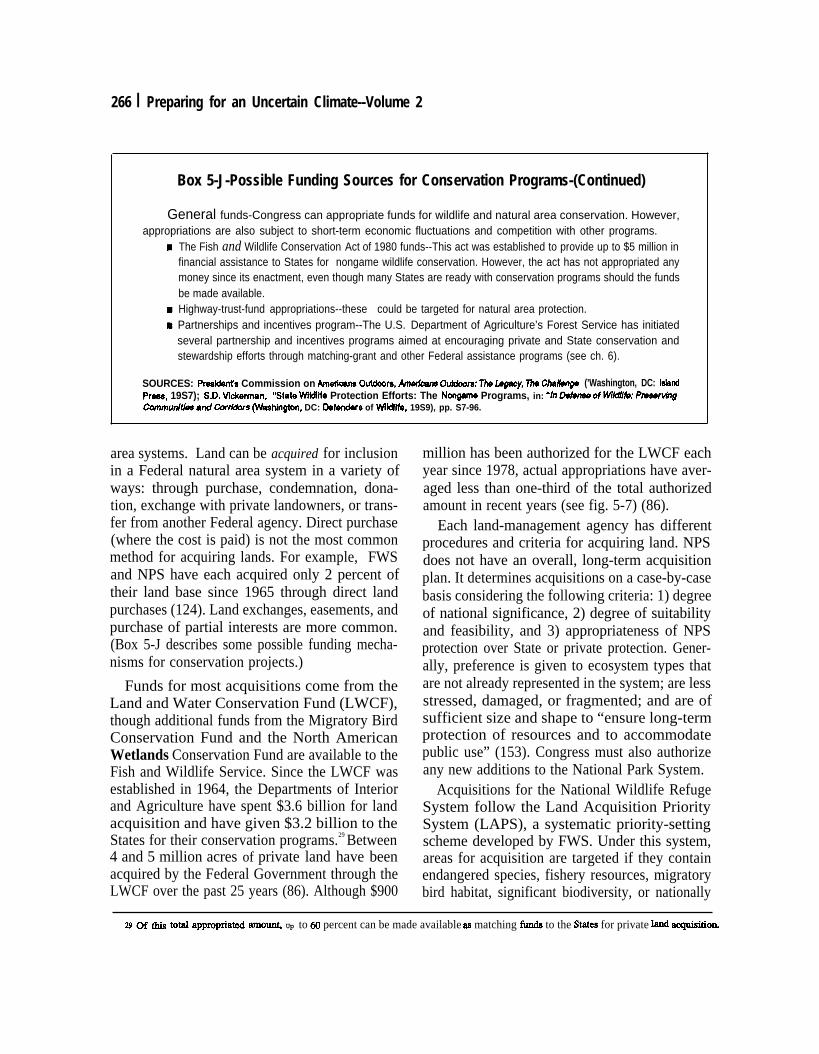
266 I Preparing for an Uncertain Climate--Volume 2
Box 5-J-Possible Funding Sources for Conservation Programs-(Continued)
General funds-Congress can appropriate funds for wildlife and natural area conservation. However,appropriations are also subject to short-term economic fluctuations and competition with other programs.
The Fish and Wildlife Conservation Act of 1980 funds--This act was established to provide up to $5 million infinancial assistance to States for nongame wildlife conservation. However, the act has not appropriated anymoney since its enactment, even though many States are ready with conservation programs should the fundsbe made available.Highway-trust-fund appropriations--these could be targeted for natural area protection.Partnerships and incentives program--The U.S. Department of Agriculture’s Forest Service has initiatedseveral partnership and incentives programs aimed at encouraging private and State conservation andstewardship efforts through matching-grant and other Federal assistance programs (see ch. 6).
SOURCES: Presidarrth Commission on Amedcan8 Outdoom, Amerfcarw Outdoonx Tbe Lagacy, 7be Chaknge (’Washington, DC: islandProea, 19S7); S.D. Viekarman, “State Wiidlifai Protection Efforts: The Nongame Programs, in: “h Dehwsa of Wk#h: PreseNngOommun/t/us and Curd&rs (W%shin@on, DC: Dafenders of WVdiife, 19S9), pp. S7-96.
area systems. Land can be acquired for inclusionin a Federal natural area system in a variety ofways: through purchase, condemnation, dona-tion, exchange with private landowners, or trans-fer from another Federal agency. Direct purchase(where the cost is paid) is not the most commonmethod for acquiring lands. For example, FWSand NPS have each acquired only 2 percent oftheir land base since 1965 through direct landpurchases (124). Land exchanges, easements, andpurchase of partial interests are more common.(Box 5-J describes some possible funding mecha-nisms for conservation projects.)
Funds for most acquisitions come from theLand and Water Conservation Fund (LWCF),though additional funds from the Migratory BirdConservation Fund and the North AmericanWetlands Conservation Fund are available to theFish and Wildlife Service. Since the LWCF wasestablished in 1964, the Departments of Interiorand Agriculture have spent $3.6 billion for landacquisition and have given $3.2 billion to theStates for their conservation programs.29 Between4 and 5 million acres of private land have beenacquired by the Federal Government through theLWCF over the past 25 years (86). Although $900
million has been authorized for the LWCF eachyear since 1978, actual appropriations have aver-aged less than one-third of the total authorizedamount in recent years (see fig. 5-7) (86).
Each land-management agency has differentprocedures and criteria for acquiring land. NPSdoes not have an overall, long-term acquisitionplan. It determines acquisitions on a case-by-casebasis considering the following criteria: 1) degreeof national significance, 2) degree of suitabilityand feasibility, and 3) appropriateness of NPSprotection over State or private protection. Gener-ally, preference is given to ecosystem types thatare not already represented in the system; are lessstressed, damaged, or fragmented; and are ofsufficient size and shape to “ensure long-termprotection of resources and to accommodatepublic use” (153). Congress must also authorizeany new additions to the National Park System.
Acquisitions for the National Wildlife RefugeSystem follow the Land Acquisition PrioritySystem (LAPS), a systematic priority-settingscheme developed by FWS. Under this system,areas for acquisition are targeted if they containendangered species, fishery resources, migratorybird habitat, significant biodiversity, or nationally
29 ~ N toti app~priat~ aIT,IOUXI~ Up to 60 percent can be made available aa matching funda to the Statea for private hmd X@SitiOm
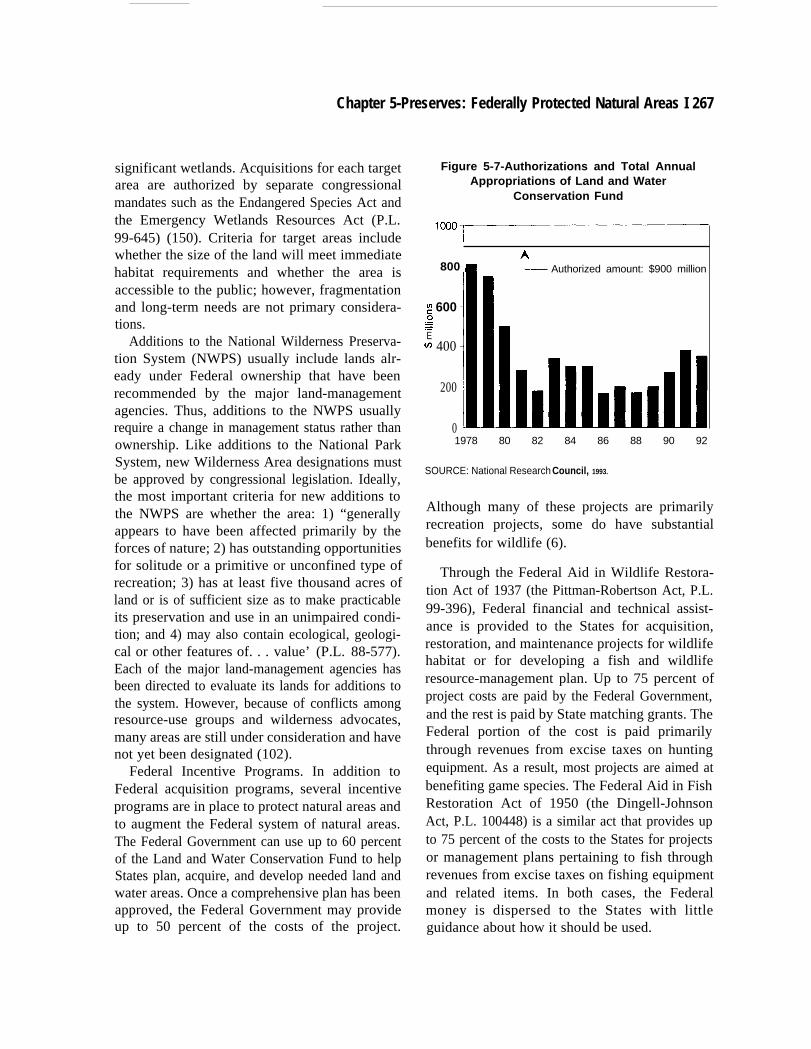
Chapter 5-Preserves: Federally Protected Natural Areas I 267
significant wetlands. Acquisitions for each targetarea are authorized by separate congressionalmandates such as the Endangered Species Act andthe Emergency Wetlands Resources Act (P.L.99-645) (150). Criteria for target areas includewhether the size of the land will meet immediatehabitat requirements and whether the area isaccessible to the public; however, fragmentationand long-term needs are not primary considera-tions.
Additions to the National Wilderness Preserva-tion System (NWPS) usually include lands alr-eady under Federal ownership that have beenrecommended by the major land-managementagencies. Thus, additions to the NWPS usuallyrequire a change in management status rather thanownership. Like additions to the National ParkSystem, new Wilderness Area designations mustbe approved by congressional legislation. Ideally,the most important criteria for new additions tothe NWPS are whether the area: 1) “generallyappears to have been affected primarily by theforces of nature; 2) has outstanding opportunitiesfor solitude or a primitive or unconfined type ofrecreation; 3) has at least five thousand acres ofland or is of sufficient size as to make practicableits preservation and use in an unimpaired condi-tion; and 4) may also contain ecological, geologi-cal or other features of. . . value’ (P.L. 88-577).Each of the major land-management agencies hasbeen directed to evaluate its lands for additions tothe system. However, because of conflicts amongresource-use groups and wilderness advocates,many areas are still under consideration and havenot yet been designated (102).
Federal Incentive Programs. In addition toFederal acquisition programs, several incentiveprograms are in place to protect natural areas andto augment the Federal system of natural areas.The Federal Government can use up to 60 percentof the Land and Water Conservation Fund to helpStates plan, acquire, and develop needed land andwater areas. Once a comprehensive plan has beenapproved, the Federal Government may provideup to 50 percent of the costs of the project.
Figure 5-7-Authorizations and Total AnnualAppropriations of Land and Water
Conservation Fund
‘ooo~
4800 w 1- Authorized amount: $900 million
g 6000.-=E- 400
200
01978 80 82 84 86 88 90 92
SOURCE: National Research Council, 1993.
Although many of these projects are primarilyrecreation projects, some do have substantialbenefits for wildlife (6).
Through the Federal Aid in Wildlife Restora-tion Act of 1937 (the Pittman-Robertson Act, P.L.99-396), Federal financial and technical assist-ance is provided to the States for acquisition,restoration, and maintenance projects for wildlifehabitat or for developing a fish and wildliferesource-management plan. Up to 75 percent ofproject costs are paid by the Federal Government,and the rest is paid by State matching grants. TheFederal portion of the cost is paid primarilythrough revenues from excise taxes on huntingequipment. As a result, most projects are aimed atbenefiting game species. The Federal Aid in FishRestoration Act of 1950 (the Dingell-JohnsonAct, P.L. 100448) is a similar act that provides upto 75 percent of the costs to the States for projectsor management plans pertaining to fish throughrevenues from excise taxes on fishing equipmentand related items. In both cases, the Federalmoney is dispersed to the States with littleguidance about how it should be used.
268 I Preparing for an Uncertain Climate-Volume 2
The Fish and Wildlife Conservation Act of1980 (P.L. 96-366) sought to fill the gaps in thePittman-Robertson, Dingell-Johnson, and Endan-gered Species Programs by providing protectionthrough a similar matching-grant program forspecies that are not game and not endangered.However, the program is funded at the Federallevel with direct congressional appropriation(unlike the fish and game acts, which are fundedby taxes), and no money has ever been appropr-iated for this purpose since the law was passed in1980. Under this program, the Federal Gover-nment would provide up to 75 percent of the coststo the States of preparing a comprehensivemanagement plan for all vertebrate species. Thislaw—already on the books--could be funded andamended to encourage an ecosystem-level ap-proach to management by including protectionfor plant and invertebrate species and by requiringStates to prepare ecosystem-management plansbefore receiving funds.
In addition to these grant and cost-sharingprograms, other Federal programs provide ease-ments and other incentives for resource protec-tion. The Environmental Conservation AcreageReserve Program, which combined the Conserva-tion Reserve Program and the Wetlands ReserveProgram in the Food, Agriculture, Conservation,and Trade Act of 1990 (P. L. 101-508), encour-ages owners to enroll certain wetlands and highlyerodible lands in the program in return foreasement payments and access to cost-sharingprograms. In addition, the “Sodbuster” and“Swampbuster” programs established by theFood Security Act of 1985 (P.L. 99-198) and theFood, Agriculture, Conservation, and Trade Actseek to combat erosion and wetland destructionby withholding Federal benefits if erodible landsare planted or wetlands are converted. (See chs. 4and 6 for more detail on these programs.) TheseFederal programs encourage State and private
landowners to manage lands in particular ways.The programs could be used to augment theexisting Federal system of natural areas whileaccomplishing their broader environmental goalsand without changing landownership patterns.
1 Research, Inventorying, and MonitoringThere are many gaps in our understanding of
ecosystem structure and function. The EcologicalSociety of America’s (ESA’s) Sustainable Bio-sphere Initiative identified five priority areas inneed of increased ecological research: 1) ecologi-cal causes and consequences of changes inclimate, soil, water chemistry, and land-usepatterns; 2) 'ecologica1 determinants and conse-quences of biodiversity and the effects of globaland regional change on biological diversity;3) definition and detection of stress in natural andmanaged ecosystems; 4) restoration of damagedsystems; and 5) management of pests, pathogens,and disease on a sustainable basis (70, 85). (Seebox 5-K.)
Our ability to detect and verify resourcechanges and climate impacts is insufficient.Nevertheless, there are some notable programs(highlighted in box 5-L) that are beginning tobridge the information gaps and could serve asbuilding blocks for future programs. These pro-grams include the Environmental Protection Agency’s(EPA’s) Environmental Monitoring and Assess-ment Program, FWS’S Gap Analysis Project, andthe National Science Foundation’s (NSF’s) Long-Term Ecological Research Program.
In early 1993, President Clinton announced theestablishment of a National Biological Survey(NBS) in the Department of the Interior.30 Al-though the scope and structure of the NBS is stillin the formative stages, there are indications thatthe NBS will consolidate the biological research,inventorying, and monitoring activities for theDepartment of the Interior into a free-standing,
M ~p~wnhtive ~ Stud@, D-w introdu~ H.R. 1S45 to establish the National BioIo@~ S~@Y ~ ~ DeP artment of the Intaioron April 22, 1993. The President’s FY 1994 budget requested that $179,445,000 be transferred from the eight DOI bureaus to the NBS. HR.2520, appropriations for DOI and related agencies for FY 1994, suggests transferring $163,604,0(X).
Chapter 5-Preserves: Federally Protected Natural Areas | 269
Box 5-K—The Sustainable Biosphere Initiative:Articulating an Ecological Research Agenda for Global Change
Responding to the need for definitive scientific priorities in a world of constrained research dollars and arapidly deteriorating environment, the ecological research community, through the Ecological Society of America,has identified three areas of high-priority research that address fundamental ecological questions as well asconcerns about the sustainability of the biosphere: global change, biological diversity, and sustainable ecologicalsystems. The societyhasformalized these priorities in a program called the Sustainable Biosphere initiative (SBI).SBI is a “call to arms” for ecologists as well as a framework for the “acquisition, dissemination, and utilization ofecological knowledge which supports efforts to ensure the sustainability of the biosphere” (70). SBI is envisionedto be broader than a basic research program by contributing to efforts in research, education, and environmentaldecision making.
Several of the research areas identified by the Office of Technology Assessment (OTA) as important forunderstanding the nature of climate impacts on natural areas and ecosystems in order to maximize adaptationpossibilities (such as restoration ecology and climate-ecosystem interactions) are also identified as high-priorityresearch areas by SBI. The key research topics identified by SBI are listed below (70):
■ the ecological causes and consequences of global climate change,■ the effects of global and regional change on biodiversity,• indicators of ecological responses to stress,■ biological inventory,■ the biology of rare and declining species,■ the restoration of ecological systems,• the ecology of disease spread,■ the consequences of land and water-use change,■ the causes and consequences of changes in atmospheric, soil, freshwater, or marine chemistry (including
changes in carbon dioxide), and• the development and application of ecological theory to the management of ecological systems.
The Sustainable Biosphere initiative fosters the application of good science to large-scale questions and theuse of scientific knowledge to solve critical management issues. An interagency Working Group has been formedto enhance communication and interaction between agencies and to promote decisions that solve criticalmanagement issues in away that recognizes the need for sustainable ecological systems.
The Interagency Working Group has identified two interagency demonstration projects, one in south Florida,and one in the Southwestern U. S., focused on the Rio Grande Basin. The vision is to use these projects todemonstrate that several agencies (regulatory, scientific, and management based; Federal, State, and local) plusacademia can work together to meet a common objective: sustainability of critical ecological systems.
SOURCES: J. Lubchenco et al., “The Sustainable Biosphere Initiative: An Ecological Research Agenda,” &o/ogy, vol. 72, No. 2,1991,pp. 371-412; Office of Technology Assessment 1993.
nonregulatory bureau (5). This change provides contribute to this process by identifying the gapsan opportunity for the Department to seriously and strengths of existing research efforts that areexamine its existing and future research needs, important for the long-term management ofimprove existing programs, eliminate ineffective Federal protected areas and other natural areas.ones, and address gaps in research, inventorying, Research. Although ecological research is oneand monitoring that have developed over the of the overall priorities in the United Statesyears. An examination of existing research pro- Global Change Research Program (USGCRP),grams, as they relate to climate change would relatively little research is being supported that
270 I Preparing for an Uncertain Climate--Volume 2
Box 5-L-Building Blocks for Integrated Information Systems
The U.S. Environmental Protection Agency’s (EPA’s) Environmental Monitoring and AssessmentProgram-The Environmental Protection Agency (EPA) launched the Environmental Monitoring and AssessmentProgram (EMAP) program in 1967. It is aimed at: 1) estimating the current condition of the Nation’s ecologicalresources, 2) monitoring indicators of pollutant exposure and habitat condition, and 3) providing periodicsummaries and interpretive reports on ecological status and trends to resource managers and the public (162).The program stemmed from EPA’s Science Advisory Board recommendations for a comprehensive program tomonitor the status and trends of ecosystems so that environmental problems can be anticipated. This programcould be used to help detect and monitor climate-induced changes in the environmental EMAP is meant primarilyto provide a “national overview” of ecological status and trends. Because of the large grid size for monitoring, itis not a substitute for intensive, site-specific monitoring that maybe required for actual land management.
The program is organized by resource category: estuaries, Great Lakes, surface waters, wetlands, forests,agroecosystems, and arid ecosystems. The monitoring program for forests is the most developed so far. Severalecological indicators are measured at each monitoring site. Condition indictators represent the ecological conditionor physical attributes of an organism, population, community, ecosystem, or landscape (e.g., vegetation andspecies). Stressor Indicators can be measured to indicate contact with specific stressors or to quantify naturalprocesses and human-caused events that may affect biota and their habitats (e.g., pollutants). Data are acquiredthrough field surveys, remote sensing (e.g., satellite images and aerial photography), and other monitoringprograms. Much of this work is carried out in conjunction with other Federal agencies including the U.S.Department of Agriculture (USDA), the Department of Interior (DOI), the Department of Energy (DOE), the NationalOceanic and Atmospheric Administration (NOAA), and the National Aeronautics and Space Administration(NASA). EMAP also draws on other monitoring initiatives, such as the Forest Health Monitoring Program of theUSDA’s Forest Service and the U.S. Geological Surveys (USGS’s) National Water Quality Assessment Program.Twelve Federal agencies and 19 States are participating in EMAP through imperative agreements.
EMAP activities are not Iimited to monitoring. Other main components of the program include integration andcoordination activities that aim to ensure uniform, high-quality sampling and assessment methods, consistentdocumentation, and effective information management. Research is under way to help improve EMAP throughpilot projects. The entire program, when fully implemented, should cost about $100 million annually.2
The U.S. Fish and Wildlife service’s Gap Analysis Pro]ect-in 1991, the U.S. Fish and Wildlife Serviceinitiated the Gap Analysis Project (GAP), which was intended to aid in State and Federal wildlife acquisition andprotection efforts by identifying areas of high biodiversity that are not under formal protection (107)3 This“pro-active” strategy aims to stem the accelerated rates of extinctions by allowing managers and planners toprotect species-rich areas and unprotected vegetation types before they are threatened and on the brink ofextinction.
GAP uses information from The Nature Conservancy (a private, nonprofit conservation organization), theForest Service, the Bureau of Land Management USGS, State agencies and Heritage Programs,4 and satelliteimages to map the potential distribution of plants, vegetation cover types, terrestrial vertebrates, endangered andcandidate species, and other indicator species to identify areas of potential species richness and uniqueness
1 ltis not~ear howthls program will contribute to ordrawfromthe inventory and M@Wtinfj aCtivhi9s of thenew National Blologicai Survey in the Department of the interior.
2 E.A. !vlartlnko, Direotor for the Environmental Monitoring and Assessment Program at the EnvironmentalProtection Agency, ietter to the OffIce of T6chnoiogy Assessment, Oct. 14, 1992.
3 it IS Possibie that GAP activities wiii beoome part of the new National BMogkai survey.4 state Hwitage Programs areoooperative programs between State agendes and The Nature Conservancy
for conducting State-wide biological Inventories.
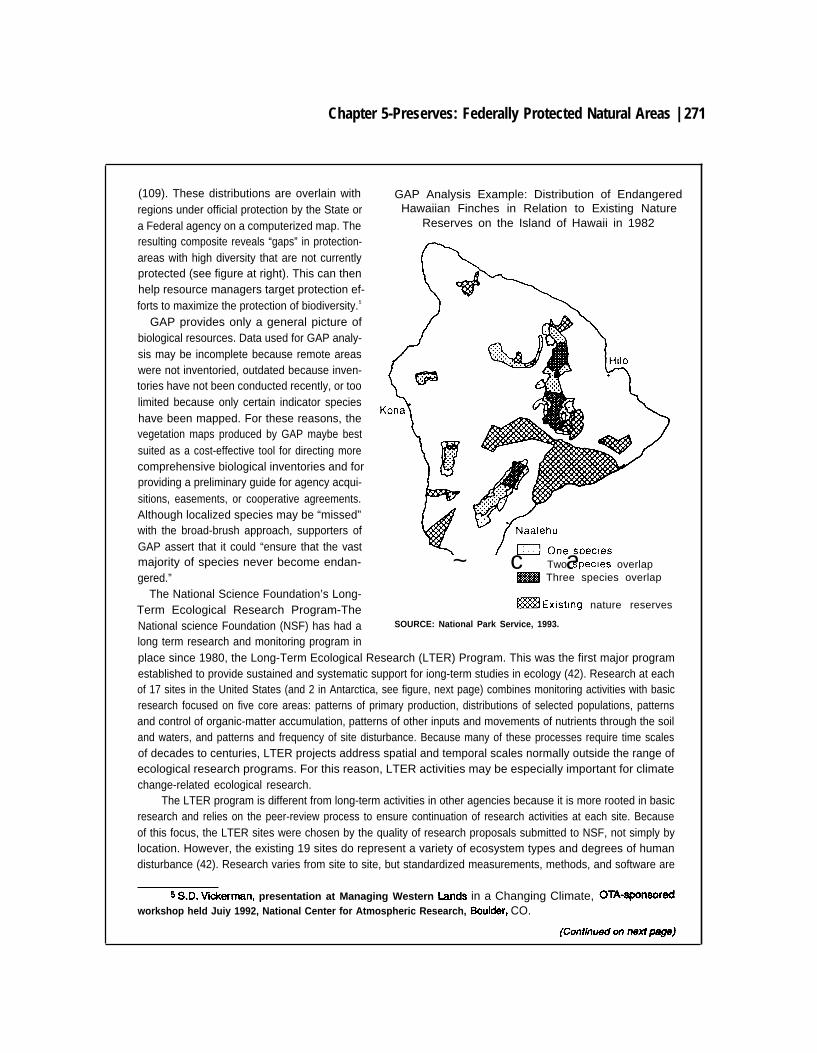
Chapter 5-Preserves: Federally Protected Natural Areas | 271
(109). These distributions are overlain withregions under official protection by the State ora Federal agency on a computerized map. Theresulting composite reveals “gaps” in protection-areas with high diversity that are not currentlyprotected (see figure at right). This can thenhelp resource managers target protection ef-forts to maximize the protection of biodiversity.5
GAP provides only a general picture ofbiological resources. Data used for GAP analy-sis may be incomplete because remote areaswere not inventoried, outdated because inven-tories have not been conducted recently, or toolimited because only certain indicator specieshave been mapped. For these reasons, thevegetation maps produced by GAP maybe bestsuited as a cost-effective tool for directing morecomprehensive biological inventories and forproviding a preliminary guide for agency acqui-sitions, easements, or cooperative agreements.Although localized species may be “missed”with the broad-brush approach, supporters ofGAP assert that it could “ensure that the vastmajority of species never become endan-gered.”
The National Science Foundation’s Long-Term Ecological Research Program-TheNational science Foundation (NSF) has had along term research and monitoring program in
GAP Analysis Example: Distribution of EndangeredHawaiian Finches in Relation to Existing Nature
Reserves on the Island of Hawaii in 1982
~ c aTwo species overlap= Three species overlap
m Existing nature reserves
SOURCE: National Park Service, 1993.
place since 1980, the Long-Term Ecological Research (LTER) Program. This was the first major programestablished to provide sustained and systematic support for iong-term studies in ecology (42). Research at eachof 17 sites in the United States (and 2 in Antarctica, see figure, next page) combines monitoring activities with basicresearch focused on five core areas: patterns of primary production, distributions of selected populations, patternsand control of organic-matter accumulation, patterns of other inputs and movements of nutrients through the soiland waters, and patterns and frequency of site disturbance. Because many of these processes require time scalesof decades to centuries, LTER projects address spatial and temporal scales normally outside the range ofecological research programs. For this reason, LTER activities may be especially important for climatechange-related ecological research.
The LTER program is different from long-term activities in other agencies because it is more rooted in basicresearch and relies on the peer-review process to ensure continuation of research activities at each site. Becauseof this focus, the LTER sites were chosen by the quality of research proposals submitted to NSF, not simply bylocation. However, the existing 19 sites do represent a variety of ecosystem types and degrees of humandisturbance (42). Research varies from site to site, but standardized measurements, methods, and software are
5 S.D. Vi&Mman, presentation at Managing Western Umds in a Changing Climate, OTA-SFWWX*workshop held Juiy 1992, National Center for Atmospheric Research, Bouider, CO.
(Conthwedon nextpag8)
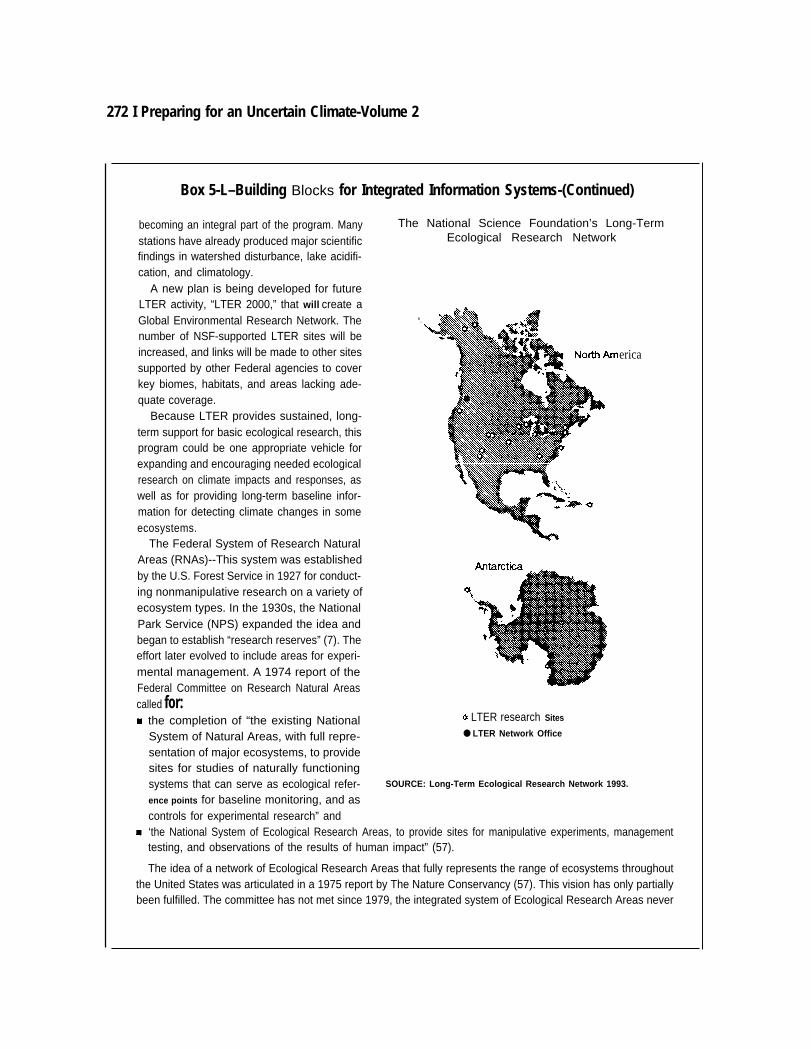
272 I Preparing for an Uncertain Climate-Volume 2
Box 5-L–Building Blocks for Integrated Information Systems-(Continued)
becoming an integral part of the program. Many The National Science Foundation’s Long-Term
stations have already produced major scientific Ecological Research Network
findings in watershed disturbance, lake acidifi-cation, and climatology.
A new plan is being developed for futureLTER activity, “LTER 2000,” that will create aGlobal Environmental Research Network. Thenumber of NSF-supported LTER sites will beincreased, and links will be made to other sitessupported by other Federal agencies to coverkey biomes, habitats, and areas lacking ade-quate coverage.
Because LTER provides sustained, long-term support for basic ecological research, thisprogram could be one appropriate vehicle forexpanding and encouraging needed ecologicalresearch on climate impacts and responses, aswell as for providing long-term baseline infor-mation for detecting climate changes in someecosystems.
The Federal System of Research NaturalAreas (RNAs)--This system was establishedby the U.S. Forest Service in 1927 for conduct-ing nonmanipulative research on a variety ofecosystem types. In the 1930s, the NationalPark Service (NPS) expanded the idea andbegan to establish “research reserves” (7). Theeffort later evolved to include areas for experi-mental management. A 1974 report of theFederal Committee on Research Natural Areascalled for:
“.
erica
the completion of “the existing National 0 LTER research Sites
System of Natural Areas, with full repre- ● LTER Network Office
sentation of major ecosystems, to providesites for studies of naturally functioningsystems that can serve as ecological refer- SOURCE: Long-Term Ecological Research Network 1993.
ence points for baseline monitoring, and ascontrols for experimental research” and‘the National System of Ecological Research Areas, to provide sites for manipulative experiments, managementtesting, and observations of the results of human impact” (57).
The idea of a network of Ecological Research Areas that fully represents the range of ecosystems throughoutthe United States was articulated in a 1975 report by The Nature Conservancy (57). This vision has only partiallybeen fulfilled. The committee has not met since 1979, the integrated system of Ecological Research Areas never
Chapter 5-Preserves: Federally Protected Natural Areas | 273
materialized, and the existing system of RNAs, a subset of the Ecological Research Areas, is not coordinated andis not representative of major U.S. ecosystems (7, 33). There are now about 340 RNAs constituting roughly5 miIlion acres (2.1 million hectares)6 of land under various Federal ownerships, although most RNAs arewith theForest Service. Because RNAs are under the purview of various agencies and because there is no legislative orinstitutional mechanism to guide management of the system, the RNA system remains a disjointed collection oflands with no overarching management direction.
If the original vision for RNAs is revived, these areas could become an ideal and important part of natural areaconservation under climate change. These areas could function as centers for research on impacts of climatechange as well as vehicles for studying natural adaptation. However, because RNAs are typically small (14 to9,000 acres), they should not be solely relied on for long-term protection (1 74).
The Nature Conservancy’s National Natural Heritage Program-The National Natural Heritage Programis an inventory program coordinated by The Nature Conservancy, but implemented by state conservationagencies. The goal of t he program is to maintain a “permanent and dynamic atlas and data bank on the existence,identity, characteristics, numbers, condition, status, location, and distribution oft he elements of natural biologicaland ecological diversity . . . “ (86). Rather than attempting to catalog all biological resources, efforts are targetedtoward “the last of the least and the best of the rest”: rare, endangered, and vulnerable species (86).Comprehensive (though slightly less detailed) inventories are also conducted for communities and ecosystemswithin each state.
State participation in the program is entirely voluntary, and except for some private start-up funds, fundedprimarily by the States. Generally, TNC provides training, standards, procedures, and methods and facilitatescoordination with other States while the State conservation agencies are primarily responsible for conducting theactual inventories. Heritage programs have been established in all 50 States. Because the program has been inplace and refined for nearly 20 years, because it is national in scope, because it has active State participation,and because the methodologies have been established, this program could serve as a model for a federally basedinventory and monitoring effort.
Geographic Information Systems-A Geographic information System (GIS) is a computer-based tool usedto manipulate and analyze spatial data such as topography, soils, and vegetation. With a GIS, digitized thematicdata can be entered, stored, transformed, measured, combined, retrieved, and displayed. Various databasescontaining information on flora and fauna topography, soils, geology, and hydrology are standardized and overlaidto display a composite picture. The relative ease in analyzing and displaying these data can allow planners andmanagers to explore and anticipate the results of various planning decisions at various spatial scales.
GISs have been used to predict the occurrence of populations of certain species, to identify potentiallysuitable sites for certain species, to estimate the quality and quantity of some habitats, to quantify changes inlandscape patterns, and to examine some spatial interrelationships (e.g., distances to various habitats could becomputed for different conservation strategies). In addition, because “GIS could be used to identify areasundergoing the most rapid change in which conservation needs might be most crucial,” it could be a valuable toolfor land management and planning under climate change (86). Although use of GISs is increasing, it variessubstantiality among Federal agencies, and the extent of interagency coordination is not clear (86).
The Terrestrial Research Interest Group (TRIG)-The Terrestrial Research interest Group (TRIG) is anad hoc coordinating committee of Federal agencies and other organizations that conduct terrestrial research.Formation of this informal group was spurred by the perception that research on terrestrial impacts of climatechange was not adequately addressed in the Global Change Research Program (GCRP). TRIG seeks to providea forum for the exchange of information on terrestrial research efforts (including climate change research efforts)and to develop a strategy by which these research efforts can be coordinated (65). The strategy includesidentifying relevant geographical regions, management concerns, information needs, and scientific research
6 To convert acres to hectares, multiply by 0.405.(Continued on next page)
274 I Preparing for an Uncertain Climate--Volume 2
Box 5-L-Building Blocks for Integrated Information Systems-(Continued)
needs and developing plans for efficiently coordinating research efforts and Iinking them to management and foreffectively managing data (65).
Although this group is not a funded entity and its members are volunteers, several efforts are under way tohelp coordinate research activities across agencies. These efforts include the identification of major issues forterrestrial research and management including issues relating to climate change, and the development of anoverall strategy document. Because many of the agencies voluntarily involved in TRIG are also represented onthe Committee on Earth and Environmental Sciences in the office of science and Technology Policy, TRIG couldhelp facilitate coordination and collaboration between agencies on both research and management issues.However, further expansion of this group would require some formalization so that members could devote moretime to coordinating activities.7
The Consortium for International Earth Science Information-The Consortium for International EarthScience Information (CIESIN), a nonprofit corporation, was established in 1969 by FY 1990 appropriations forNational Air and Space Administration (NASA) as one of the nine data centers for the Earth Observing System,the satellite component of NASA’s Global Climate Change Program. By establishing this corporation, the FederalGovernment sought to broaden the information-management programs and facilities planned for NASA’s EarthObserving System (EOS) and to take the lead in creating an integrated information network accessible todecisionmakers at all levels of government (23). However, in 1993, the Senate Committee on Appropriationsdeleted the full FY 1994 budget request for CIESIN (CIESIN received $75 million in FY 1993)8 citing a lack ofprogram focus and duplication of effort with the National Science Foundation.
As a part of its missbnio CIESIN was directed to investigate ways to improve data utilization and managementfor global change. This effort encompassed several functions: 1) develop and maintain the Socio-Economic DataApplications Center for EOS, 2) foster research on the human dimensions of global change, 3) link existingenvironmental and global change data centers, 4) serve as an international gateway to scientists, educators, andpolicy makers, 5) conduct regional cause-and-effect studies of global change, and 6) provide data to otherinternational programs and research efforts. Many of these plans were never implemented.
The Terrestrial Ecosystems Regional Research and Analysis Laboratory (TERRA)--TERRA is aninteragency research laboratory formed in 1992 under a Memorandum of Understanding (MOU) agreementbetween the USDA’s Agricultural Research Service, Soil Conservation Service, and Forest Service and the US.Geological Survey in the Department of the Interior. As a part of the global change research activities in theseagencies, TERRA is organized to “provide a mechanism for strengthening the linkages between terrestrialecosystem, atmospheric, and human process components of large-scale ecosystem models” (1 17). The objectiveof the Laboratory is to provide scientific information in support of national and regional decisionmaking that cutsacross scientific disciplines and conventional agency responsibilities; TERRA hopes to characterize theinteractions between land use, ecological resources, and land management through the development and analysisof regional models (39). It is hoped that these models will ultimately be able to “test” the consequences of variouspolicies and management decisions affecting natural resources by predicting changes in the distribution andnature of terrestrial ecosystems and developing quantitative methods of assessing ecosystem sustainability undervarious climate change and land-use-change scenarios. To facilitate information transfer to land managers,TERRA envisions creating a “neutral” facility where scientists, managers, and other stake holders can work withthe models to help address regional issues and problems.
7 J.A. Kdrnells, U.S. Geological Survey, ietter to the Offioe of Technology Assessment *W 14, 1992.a J.R. LOUS~ president and CEO of CiESIN, letter to the Office of Ttinoiogy Assessment mt 8,1992.
SOURCE: Office ofkhndqy Assessme~ 1S83.
Chapter 5--Preserves: Federally Protected Natural Areas I 275
addresses the uncertainties surrounding the im-pacts of climate change on ecosystems (see ch. 3).Funding for climate change research within DOIhas not been well-supported. In FY 1993, NPSwas the only DOI agency to request any increasein USGCRP funding (from $2.6 million to $3.7million between FY 1992 and FY 1993) (25, 26).DOI was the only participating department thatrequested a decrease in USGCRP funding inFY 1993 and FY 1994 (25, 26).
Much remains to be discovered about how andto what degree climate factors influence wildlifeand plant species, how wildlife interactions en-hance or inhibit their ability to adapt, how variouschanges in vegetation and landscape affect spe-cies populations, or what makes a species sensi-tive to climate change. More generally, little isknown about how to facilitate adaptation througheither reserve or corridor design, although edu-cated guesses can be made. Transplantation andrestoration ecology may become important forsaving and protecting more species in a changingclimate. However, this discipline is relativelynew. Some techniques are not well-developedand others are not widely known (see boxes 5-Mand 4-A). The National Research Council (85),the Council on Environmental Quality (30) andthe Ecological Society of America (70) have allcalled for increased efforts in ecological re-search, especially on larger spatial and temporalscales. One of the functions of the NBS mightbe to implement research on a large, ecosystembasis (5).
Research for the National Park System isconducted in each individual park unit, throughthe 10 regional offices, and through some 23Cooperative Park Study Units with various uni-versities. However, no research is systematicallyconducted throughout NPS (83). In addition, it isnot clear that the existing research efforts areadequate for meeting current management needs,much less management needs for the future. The
National Park Service’s component of theUSGCRP (NPSGCRP)31 seeks to “provide pre-dictive and holistic understanding of the effects ofglobal change on species populations, ecologicalcommunities, watershed processes and landscapedynamics through the coordinated use of parksand benchmark research sites within large [bioge-ographic areas]” (22). Research activities arecentered around the biogeographic area (BGA)concept developed by Unesco’s32 Man and theBiosphere Program (MAB) (see box 5-F), andmost NPS research activities for global changetake place in U.S. MAB Biosphere Reserves.Although this effort is innovative because it is oneof the few USGCRP programs to take a regionalapproach to climate change research, its scoperemains relatively limited, and the program hasproceeded more slowly than planned. In addition,scientific research beyond the scope needed forshort-term, site-specific management does notreceive much support from NPS (83). ‘‘The NPSscience program is unnecessarily fragmented andlacks a coherent sense of direction, purpose, andunity,” according to a recent study (83).
Most research for the Fish and Wildlife Serviceaims to aid management efforts and objectives ateach refuge. Consequently, “research on systemsand species most susceptible to consequences ofglobal climate change is lacking” (66). Researchactivities at the Fish and Wildlife Service areconducted through 13 national research centersand 89 field stations. The Cooperative ResearchProgram of FWS facilitates cooperative researchbetween FWS, State wildlife agencies, and about41 universities. Climate change research effortstake place under the FWS Global Change Re-search Program (FWSGCRP), which seeks toestablish a reference base to clearly demonstrateand assess the extent, magnitude, and rate ofecological impacts of global change and to assessthe significance of global climate change onFWS resources, especially coastal ecosystems,
31 ‘1’MS pro- aloW with other NPS re~ch activities, is slated to become part of the National Biological Survey.
32 unit~ Natiom E.ducatio@ Scientitlc, and Cultural @gtiZiltioI1.
276 I Preparing for an Uncertain Climate-Volume 2
Box 5= M-Restoration Ecology: Giving Nature a Helping Hand Under Climate Change
Changes in climate will likely alter the balance of plants and animals that now characterizes natural areas,and could be accompanied by any number of changes in the physical environment including more erosion,flooding or drying, and more frequent or more intense fires. The impacts of climate change will pose a dilemmafor managers of natural areas, who must balance the conflicting needs of protecting a specific set of resources,such as endangered species or migratory waterfowl habitat, with the goal of allowing natural ecological processesto proceed (see box 5-B). In some areas, managers may decide that the need to maintain a specific habitat maycall for active efforts to protect the plants and animals already in place and to restore habitat that is damaged. Inother cases, habitat that has already been damaged by pollution, road building, water diversions, erosion,timbering and grazing, overuse by visitors, and fragmentation (see box 5-E) may now contain the most favorableclimate conditions for some species or communities; managers may attempt to add such sites to the boundariesof natural areas and restore them to increase the chances that a given community will survive. In both cases,restoration will be a key part of the management strategy.
Ecological restoration is the attempt to fully restore ecosystems by recreating the entire community oforganisms that originally inhabited them. It is different from habitat creation, reclamation, and rehabilitation-eachof which can involve manipulation of a small set of species. Restoration involves recreating both the form and thefunction of a natural ecosystem that is integrated with t he landscape in which it occurs. Restoration varies fromsite to site, but generally involves two major steps: site preparation to restore desired physical, chemical and waterconditions, and biological manipulation including the reintroduction of absent native plant and animal species Tobegin with, the site is prepared by clearing unwanted vegetation (nonindigenous species), removingcontamination, adding topsoil if necessary, and, possibly, grading to create a varied topography. Vegetation isplanted, either with seeds from nearby sources of native species or by transplantation of plants from another site.In some cases, measures to restore vegetation maybe more passive--a prepared site maybe allowed to reseednaturally from the surrounding areas or from seed that has remained dormant on-site. However, naturalregeneration may be difficult in areas where native species are no longer prevalent or where invasivenonindigenous species are likely to take root quickly. In many cases, animals are allowed to migrate into the areaof their own accord, under the assumption that once native vegetation is reestablished, animals will follow. In thecase of endangered species, however, managers may devote considerable effort to rearing the species off-siteand reintroducing them into the restored habitat.
Early efforts to go beyond simple reclamation and reforestation in attempts to restore full ecosystems werepioneered by ecologists at the University of Wisconsin Arboretum in the 1930s. Researchers there began exploringtechniques for restoring the full array of species and functions to prairies and forests that had been cleared foragricultural use. Long-term research on the plots established there continues to yield new information onrestoration techniques. Since then, restoration has been applied with varying degrees of frequency and successon other ecosystem types ranging from savanna and shrubland to coastal salt marshes, freshwater wetlands, andrivers and lakes.
One impetus for the development of restoration techniques has been an increasing demand by the FederalGovernment. Restoration is called for in three separate contexts--regulation, planning, and management.Restoration has entered the regulatory arena through the permit requirements of Section 404 of the Clean WaterAct (P.L. 92-500), in which restoration of wetlands can be demanded to compensate for activities that destroywetlands (see ch. 4), as well as through the requirements covering reclamation of surface mines. Restoration maybe part of the planning and construction of federally supported projects as required by the National EnvironmentalProtection Act (NEPA; P.L. 91-190), under which potential damages to the environment and alternatives formitigating those harms must be evaluated. Finally, restoration is part of ongoing management efforts of manyFederal natural areas to combat problems such as overuse by visitors and to protect and restore habitat forendangered species.
Chapter 5-Preserves: Federally Protected Natural Areas | 277
An Example of Ongoing Federal Restoration Efforts-More than 3,000 species of wildlife and fish Iive onBureau of Land Management (BLM) lands, including 216 federally listed threatened and endangered species and1,200 candidate plant and animal species BLM manages more fish and wildlife habitat than any otherorganization. These highly diverse habitats encompass deserts, rangelands, mountains, forests, and tundra.
In 1988, BLM launched an action-oriented program aimed at the more efficient management of the fish andwildlife resources on public lands. The program, Fish and Wildlife 2000, seeks to “ensure optimum populationsand natural abundance and diversity of wildlife resources on public lands by restoring, maintaining, and enhancinghabitat conditions.” A related BLM effort, the Riparian-Wetland Initiative for the 1990’s, which was launched in1991, focuses on restoration and maintenance projects for riparian areas and wetlands with the goal of havingover 75 percent of these areas in functioning order by 1997 (138). BLM has utilized a variety of outreach andcooperative programs with States and private citizens to achieve its goals in habitat restoration and improvementefforts. This collaborative approach with partners is enabling BLM to stretch Federal funds and accelerateon-the-ground management and restoration efforts.
BLM estimates that the Fish and Wildlife 2000 will require about $90 million per year for 10 years and theRiparian-Wetlands Initiative will require a total of $127 million for full implementation. However, these programshave not obtained the funds or personnel requested to date. The FY 1993 budget for Fish and Wildlife 2000 issome $36 million, or about one-third of the planned funding level. Despite this, BLM has made substantial progressin several areas. In California, efforts are under way to restore the hydrologic function and improve the habitatquality for the Modoc sucker on a 9-mile (16-km) segment of Cedar Creek. In Montana, 3,800 acres (1,520hectares)l of wetlands are to be created in native prairie to increase nesting habitat for waterfowl. In addition, othervegetation management is planned to create habitat for a variety of other species in this area.
Despite the increasing demand for restoration techniques, restoration ecology is still a young science.Problems encountered in restoration include site selection, survival of transplanted flora and fauna inadequatenutrient supplies for plant growth, and pest invasions (83). Restoring an ecosystem to its former condition requiresa detailed understanding of the numerous components and functions that characterize it; for many types ofecosystems, ecological knowledge is incomplete at that level of detail. To date, restoration research has tendedto focus primarily on techniques of reestablishing species composition and community structure. The functionalvalues of restored areas, although widely recognized, are seldom evaluated. For example, it has not been shownthat restored wetlands maintain regional biodiversity and recreate functional ecosystems (83). Considerableresearch is needed in many areas of basic ecological interactions as well as further experimentation on a widearray of ecosystems to ensure that the practice of restoration yields predictable and desired results.
Even as restoration techniques are being refined, the potential for climate change raises new challenges.Past restoration efforts have generally sought to recreate self-sustaining ecosystems in their originalconditions-the way they were before human actions disturbed them. But as climate changes, the environmentalconditions that originally shaped an ecosystem may fundamentally change, so that an ecosystem restored to itsoriginal or natural condition may no longer be self-sustaining. Whereas ecologists are trained to think ofecosystems as dynamic and evolving, much of our natural resource legislation focuses on saving a particularresource in a particular place-a freeze-frame in the film of ecosystem evolution. At what point shouldrestorationists take t hat snapshot? To what should an ecosystem be restored if t he climate has changed aroundit? As species migrate in response to a changing climate, which will be considered the native species, and whichwill still be considered nonindigenous? What are the implications of introducing new species that maybe moreadapted to the new climate conditions? A changing climate will test the boundaries of the Nation’s present thinkingabout species and ecosystems.
1 TO convert acres to hectares, multiply by 0.405.
SOURCES: J.L. Berger and L.A. Riggs, Ecolog/ca/ Restoration and Norr-/nd@mous Speck, contractor paper prepared for the Office ofTtinology Assessment August 1991; W.R. Jordan, R.L Peters, and E. E?. Allen, /3doglca/ F?estorat&rr as a Strategy fbr ConssrdngBbdiversity, contractor paper prepared for the Office of Technology Assessment, January 19SS; National Research Council, Restoratlorrof Aquat/c Ecosystems (Washington DC: National Academy of Sden~s Press, 1992).
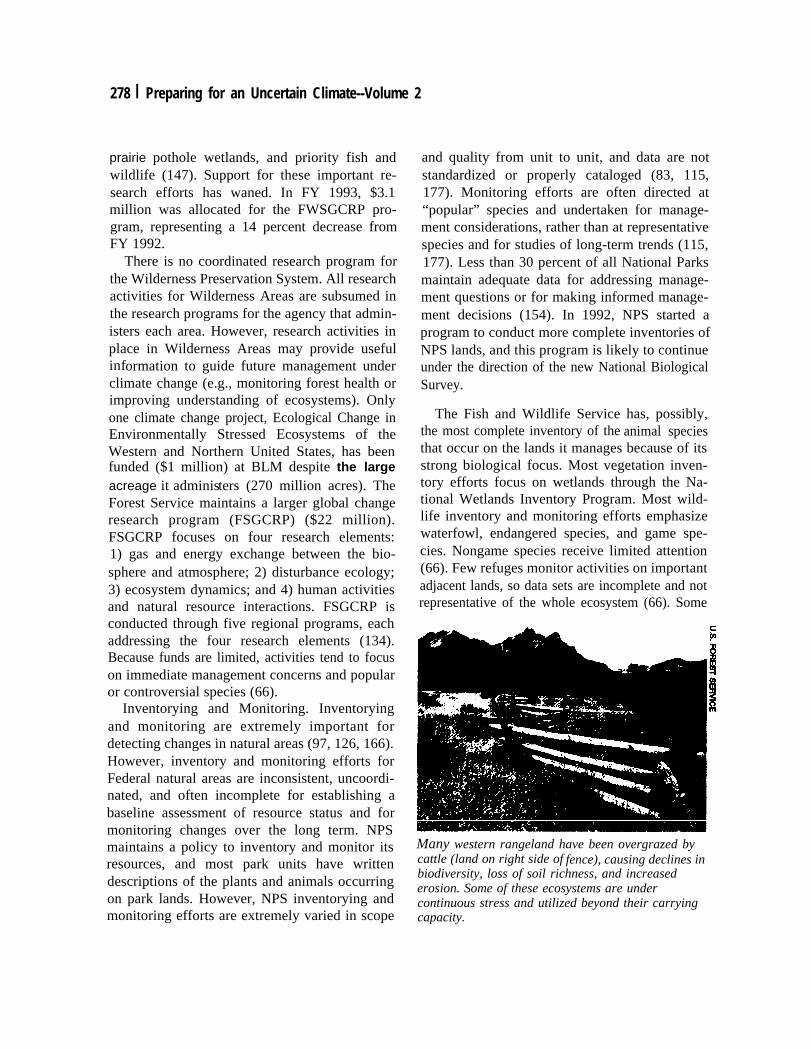
278 I Preparing for an Uncertain Climate--Volume 2
prairie pothole wetlands, and priority fish andwildlife (147). Support for these important re-search efforts has waned. In FY 1993, $3.1million was allocated for the FWSGCRP pro-gram, representing a 14 percent decrease fromFY 1992.
There is no coordinated research program forthe Wilderness Preservation System. All researchactivities for Wilderness Areas are subsumed inthe research programs for the agency that admin-isters each area. However, research activities inplace in Wilderness Areas may provide usefulinformation to guide future management underclimate change (e.g., monitoring forest health orimproving understanding of ecosystems). Onlyone climate change project, Ecological Change inEnvironmentally Stressed Ecosystems of theWestern and Northern United States, has beenfunded ($1 million) at BLM despite the largeacreage it adminis ters (270 million acres). TheForest Service maintains a larger global changeresearch program (FSGCRP) ($22 million).FSGCRP focuses on four research elements:1) gas and energy exchange between the bio-sphere and atmosphere; 2) disturbance ecology;3) ecosystem dynamics; and 4) human activitiesand natural resource interactions. FSGCRP isconducted through five regional programs, eachaddressing the four research elements (134).Because funds are limited, activities tend to focuson immediate management concerns and popularor controversial species (66).
Inventorying and Monitoring. Inventoryingand monitoring are extremely important fordetecting changes in natural areas (97, 126, 166).However, inventory and monitoring efforts forFederal natural areas are inconsistent, uncoordi-nated, and often incomplete for establishing abaseline assessment of resource status and formonitoring changes over the long term. NPSmaintains a policy to inventory and monitor itsresources, and most park units have writtendescriptions of the plants and animals occurringon park lands. However, NPS inventorying andmonitoring efforts are extremely varied in scope
and quality from unit to unit, and data are notstandardized or properly cataloged (83, 115,177). Monitoring efforts are often directed at“popular” species and undertaken for manage-ment considerations, rather than at representativespecies and for studies of long-term trends (115,177). Less than 30 percent of all National Parksmaintain adequate data for addressing manage-ment questions or for making informed manage-ment decisions (154). In 1992, NPS started aprogram to conduct more complete inventories ofNPS lands, and this program is likely to continueunder the direction of the new National BiologicalSurvey.
The Fish and Wildlife Service has, possibly,the most complete inventory of the animal speciesthat occur on the lands it manages because of itsstrong biological focus. Most vegetation inven-tory efforts focus on wetlands through the Na-tional Wetlands Inventory Program. Most wild-life inventory and monitoring efforts emphasizewaterfowl, endangered species, and game spe-cies. Nongame species receive limited attention(66). Few refuges monitor activities on importantadjacent lands, so data sets are incomplete and notrepresentative of the whole ecosystem (66). Some
Many western rangeland have been overgrazed bycattle (land on right side of fence), causing declines inbiodiversity, loss of soil richness, and increasederosion. Some of these ecosystems are undercontinuous stress and utilized beyond their carryingcapacity.
Chapter 5--Preserves: Federally Protected Natural Areas I 279
managers only inventory animals found on therefuge, and some inventory both animals andplants. There is no explicit statutory mandate toconduct inventory and monitoring activities onWildlife Refuges (66).
There is no systematic mechanism for invento-rying and monitoring resources in the WildernessPreservation System as a whole. Inventory andmonitoring efforts for Wilderness Areas aregenerally subsumed in the inventories of eachland-management agency that contains them.Most efforts focus on the most visible impacts,whereas monitoring for more subtle changes in airquality and vegetation status are ignored becauseadequate funds and personnel are not available.Both the Forest Service and BLM have explicitstatutory mandates to inventory their resources,including those in Wilderness Areas. Despite thismandate, many units have not been inventoried(164), and the most detailed inventories areconducted for timber resource lands-not Wil-derness Areas (66). Only about 15 percent ofBLM-administered land has been inventoriedaccording to minimum standards for vegetationset by USDA’s Soil Conservation Service. Lessthan 5 percent of BLM lands have been invento-ried for their wildlife habitat, according to BLM’sHabitat Inventory and Classification System, andless than 5 percent of BLM riparian areas andwetlands have been inventoried, according to aparallel inventory system for wetlands (66). Inaddition, a comprehensive listing of fragile orendangered species is not available, and very fewspecies are included in BLM’s Threatened andEndangered Species Data System (66).
Since the early 1980s, the Forest Service haspromoted a system--called “Limits of Accepta-ble Change’—for detecting changes in the condi-tions of wilderness resources and for guidingmanagement activities. Under this step-by-stepapproach, issues of concern are identified, indica-tors of condition are chosen, standards for thecondition of wilderness resources are set accord-ing to these indicators, and management activitiesare designed and chosen based on the entire
evaluation (113). However, the success of thismanagement tool relies heavily on complete andaccurate inventories and routine monitoring ofchanging conditions. According to a 1988 survey,76 percent of wilderness managers had not usedthis tool for wilderness management (164).
In response to the public’s concern about awide range of environmental impacts, such asacid rain and the subdivision of large forest tracksfor residential use, Congress directed the ForestService to initiate a program to monitor the healthof the Nation’s forests (Forest Ecosystems andAtmospheric Pollution Act of 1988, P.L. 100-521). Forest health monitoring under this act iscarried out by the Forest Service, EPA, and Stateforestry agencies (132).
POLICY OPTIONS
1 The Policy ChallengeClimate change threatens the security of the
Nation’s investment in natural areas. Substantialland, money, and time have been invested inestablishing various systems of natural areasthroughout the country to ensure that they areprotected for future generations to enjoy. Avariety of problems, such as fragmentation, pollu-tion, and overuse, faces natural areas today, andclimate change will likely compound these prob-lems and pose new threats to protected naturalareas.
The optimal climatic regime for many naturalarea resources may shift to well outside thelegislatively established boundary that protectsthem. It is not clear how climate change willaffect certain species in protected natural areas,but it is certain that species composition willchange, and that research to establish baselineinformation and to detector anticipate that changeis currently inadequate to inform decisionmaking.It is also unclear which species will adapt,migrate, or become extinct. However, it is clearthat development and fragmentation around andwithin natural areas are already contributing to
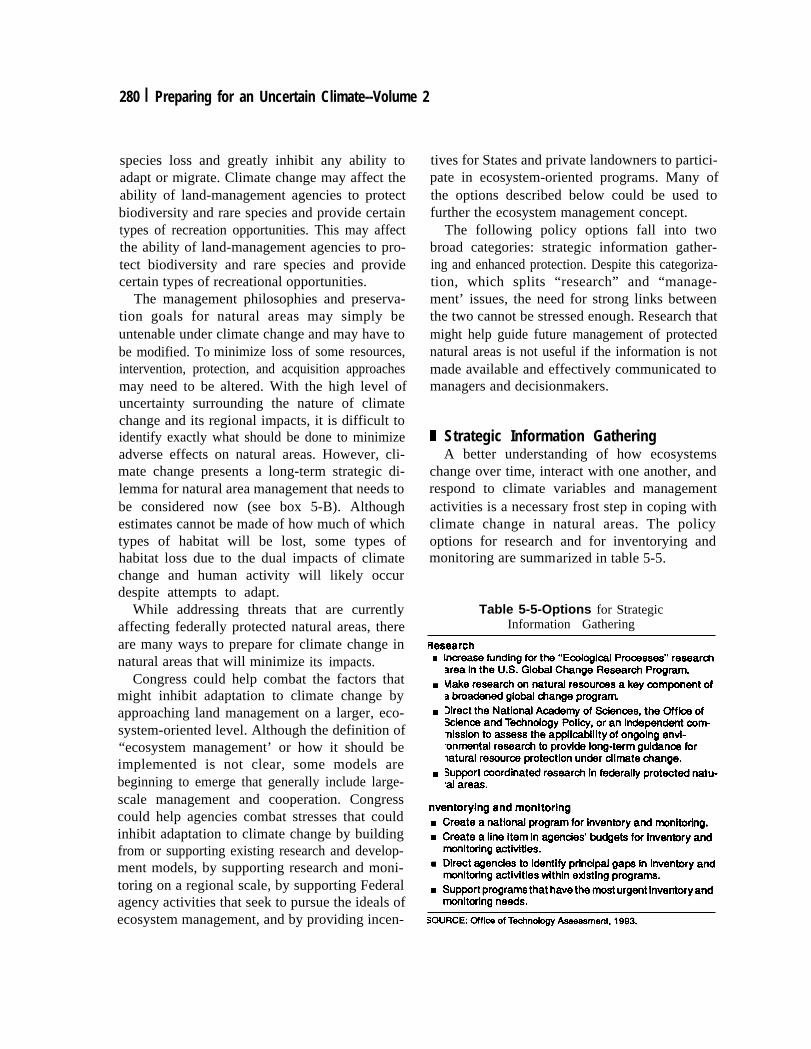
280 I Preparing for an Uncertain Climate--Volume 2
species loss and greatly inhibit any ability toadapt or migrate. Climate change may affect theability of land-management agencies to protectbiodiversity and rare species and provide certaintypes of recreation opportunities. This may affectthe ability of land-management agencies to pro-tect biodiversity and rare species and providecertain types of recreational opportunities.
The management philosophies and preserva-tion goals for natural areas may simply beuntenable under climate change and may have tobe modified. To minimize loss of some resources,intervention, protection, and acquisition approachesmay need to be altered. With the high level ofuncertainty surrounding the nature of climatechange and its regional impacts, it is difficult toidentify exactly what should be done to minimizeadverse effects on natural areas. However, cli-mate change presents a long-term strategic di-lemma for natural area management that needs tobe considered now (see box 5-B). Althoughestimates cannot be made of how much of whichtypes of habitat will be lost, some types ofhabitat loss due to the dual impacts of climatechange and human activity will likely occurdespite attempts to adapt.
While addressing threats that are currentlyaffecting federally protected natural areas, thereare many ways to prepare for climate change innatural areas that will minimize its impacts.
Congress could help combat the factors thatmight inhibit adaptation to climate change byapproaching land management on a larger, eco-system-oriented level. Although the definition of“ecosystem management’ or how it should beimplemented is not clear, some models arebeginning to emerge that generally include large-scale management and cooperation. Congresscould help agencies combat stresses that couldinhibit adaptation to climate change by buildingfrom or supporting existing research and develop-ment models, by supporting research and moni-toring on a regional scale, by supporting Federalagency activities that seek to pursue the ideals ofecosystem management, and by providing incen-
tives for States and private landowners to partici-pate in ecosystem-oriented programs. Many ofthe options described below could be used tofurther the ecosystem management concept.
The following policy options fall into twobroad categories: strategic information gather-ing and enhanced protection. Despite this categoriza-tion, which splits “research” and “manage-ment’ issues, the need for strong links betweenthe two cannot be stressed enough. Research thatmight help guide future management of protectednatural areas is not useful if the information is notmade available and effectively communicated tomanagers and decisionmakers.
9 Strategic Information GatheringA better understanding of how ecosystems
change over time, interact with one another, andrespond to climate variables and managementactivities is a necessary frost step in coping withclimate change in natural areas. The policyoptions for research and for inventorying andmonitoring are summarized in table 5-5.
Table 5-5-Options for StrategicInformation Gathering
Chapter 5-Preserves: Federally Protected Natural Areas I 281
Strengthen Research EffortsEven if climate scientists determine the exact
rate and nature of climate change tomorrow,land-management experts would not know how torespond appropriately. Research in federally pro-tected natural areas is currently focused onimmediate management issues, and very littleresearch is being done to provide fundamental,long-term data (e.g., on species response andsensitivity to various climate variables, speciesinteractions and dependence on one another,restoration ecology, preserve design, corridordesign and effectiveness, and transplantationecology).
A commonly cited solution for accommodatingspecies shifts in a fragmented landscape is tofacilitate species or ecosystems migration byestablishing corridors or by transplanting speciesto their ‘‘appropriate’ new range. Althoughtheoretically possible, the knowledge base forsuch options is very incomplete. Pilot projects areongoing in some places, especially for wetlands(see box 4-A). Research activities that do addressthese issues are often carried out in centersseparated from where management and decision-making take place, so they are less able to directlyinfluence management.
Option 5-1: Increase funding for the “Eco-logical Processes’ research area in the U.S.Global Climate Research Program. The Subcom-mittee on Global Change Research under theCommittee on Earth and Environmental Sciences(see fig. 3-1) has prioritized global changeresearch for all scientitfic disciplines to help guideFederal funding of the U.S. Global ChangeResearch Program (USGCRP). Under this struc-ture, “Ecological Processes” is the third-highest(out of seven) national priority research area forglobal change (see fig. 3-2). However, 17 percentof the USGCRP budget is allocated for researchunder ecological systems and dynamics. In 1993,of this $224 million, 66 percent ($148 million) isfor NASA programs, 15 percent ($37 million) isfor USDA (25), and 4 percent ($9 million) is forDOI.
Increased funding for land-management agen-cies to carry out ecological research related toglobal change (e.g., larger spatial and longertemporal scales) would more directly addressmanagement concerns. Whatever the fundingsource, relatively modest funding increasesspread over a few years could significantly helpto advance the understanding of ecological sys-tems under climate change (see ch. 3).
Option 5-2: A-fake research on natural re-sources a key component of a broadened globalchange program. Arguably, research that wouldmost help prepare for climate change in naturalareas (i.e., on reserve design, migration patterns,and translocation ecology) is not applicablesolely to the climate change problem. Suchresearch would also be valuable for other environ-mental goals such as preserving biodiversity,conserving rare species, and mitigating impactsfrom landscape fragmentation. In fact, climatechange may not be the most compelling reason toconduct the kind of research needed for long-termprotection of natural areas. Therefore, the existingUSGCRP, now primarily a climate researchprogram, may not be the most appropriate mecha-nism for promoting natural resources researchthat has significant application to a much broaderset of global environmental problems.
On the other hand, no other mechanism coordi-nates research on global-scale environmentalproblems across the Federal Government under aprioritized scheme to accomplish specified scien-tific goals and objectives. USGCRP offers thebest alternative to agency-by-agency research onglobal environmental problems. If USGCRP isexpanded to address broad issues of globalchange, it could better promote research forlong-term protection of natural areas on severalfronts. (See ch. 3 for more discussion of theseissues.)
Option 5-3: Direct the National Academy ofSciences, the Office of Science and TechnologyPolicy (OSTP), or an independent commission toassess the applicability of ongoing environmentalresearch to provide long-term guidance for
282 I Preparing for an Uncertain Climate--Volume
natural resource protection under climatechange and other global changes. It is evidentthat one of the most prudent approaches to naturalarea conservation under climate change is morecoordinated management on the ecosystem orregional scale. This approach would also helpaddress threats to biodiversity and maximizepossibilities for species survival under climatechange. However, relatively little research isbeing done on ecosystem or regional-level inter-actions (30, 70)---most research is site- or species-specific. Several efforts in various agencies couldbe supported and expanded to facilitate ecosystem-level research (see boxes 5-F and 5-L).
Several recent studies have called for anassessment of U.S. environmental research (seech. 3). The Federal Government spends about$900 million on environmental research annu-ally. 33 Although this figure is huge (almost asmuch as the entire USGCRP budget; see ch. 3),the term “environment” is also quite broad. It isunclear how much of the research is applicable tounmanaged ecosystems, and how much is coordi-nated to provide answers for long-term problemslike climate change and biodiversity. A task forcecould attempt to categorize this pot of money forenvironmental research in several ways: Howmuch is being spent on various natural resources:air, water, land, wildlife, soil, forests, crops? Howmuch is being spent on various environmentalproblems: pollution, biodiversity loss, climatechange, contamination, hazardous waste, naturaldisasters? How much is being spent on long-termissues?
A study conducted by the National Academy ofSciences, OSTP in the Office of the President, oran independent commission could examine pro-grams addressing these areas, including programswithin USGCRP, and suggest how they could beexpanded, augmented, or integrated. Such a studycould build on NSF’s ongoing analysis of envi-ronmental research (unpublished).
2
Option 5-4: Support coordinated research infederally protected natural areas. The researchprograms for Wilderness Areas, National Parks,and National Wildlife Refuges are uncoordinatedor inadequate. Because the agencies that adminis-ter these areas have traditionally been seen asmanagement agencies, scientific research has notbeen a high priority--except to address immedi-ate, agency-by-agency management concerns.However, with the uncertain impacts of climatechange coupled with existing threats on naturalarea resources, informed management decisionswill be nearly impossible in the future without astrong research effort. The National Academy ofSciences has recommended the development of aNational Environmental Research Plan (85). Thisplan would set a research agenda and identifyagency responsibilities.
NSF’s Long-Term Ecological Research Pro-gram conducts basic ecological research andlong-term monitoring at 18 sites (see box 5-L).This program could be investigated as a model forlong-term research in the Federal system ofnatural areas. Although LTER research is notformally focused on management activities, muchof this basic research has contributed to a betterunderstanding of specific sites with direct impli-cations for future management (42). NSF alsosupports basic research in areas such as sensitivityof species to climate change and restoration andtranslocation ecology.
A formal mechanism for linking researchresults to management decisions and planningshould be incorporated into any natural areasresearch agenda. There is a danger that if researchresponsibility is taken away from the land-management agencies without sufficient links tomanagement in place, land managers will not beaware of or will even be uninterested in scientificresults that could lead to more effective manage-ment.
33 J, ~sL ~mtive Sm~, !3ubcornmittee on EnviroxuxE~ BiOIOSY, C ommittee on Life Scienees and Heal@ Federal Coordbt@Council for Science, En@nee@, ~d ~kology, ~XMI co~tiom Sept. 14, 1993.
Chapter 5--Preserves: Federally Protected Natural Areas I 283
Strengthen Inventorying and Monitoring Efforts
Adequate information about the existing stateof U.S. resources in natural areas and elsewhereis an important element in a strategy to addressthe impact of climate change in these areas.Baseline information on species and their rangesare not available for all species or species types inthe United States. In addition, virtually no infor-mation is available on land-use patterns thatmight affect those species. Inventory and moni-toring programs are usually the last to get fundsand the first to be cut in a budget crisis (83, 177).Many monitoring programs that have been estab-lished in protected natural areas have beendiscontinued because of personnel changes, pol-icy alterations, or budget cuts (177).34 Baselineinformation is needed on the status and trends ofvegetation cover, plant distributions, animal dis-tributions, soils, and water resources to detect andmonitor climate-induced changes. All Federalagencies conduct some type of inventory as amatter of policy, but these efforts vary widely incompleteness and quality, are not consistentlyimplemented and funded, and are not coordinatedat the national or even agency level. In addition,many species and ecosystems are not found in theFederal system of preserved areas and, therefore,they are not included in any Federal inventory andmonitoring efforts. The Federal Gov ernmentcould play a key role in improving inventory andmonitoring activities.
Option 5-5: Create a national program forinventory and monitoring. A nationwide inven-tory and monitoring program with consistent andcomparable inventory methods across all Federaland State agencies would help assess the state ofthe Nation’s resources. Such a program couldhelp facilitate regional planning by providing abroad understanding of the resources withinvarious regions, guiding Federal acquisition and
conservation incentive programs, and detectinglarge-scale changes in natural areas.
An interagency task force could evaluate exist-ing efforts, identify shortcomings, and outline anational program that addresses gaps in datagathering. Nationwide minimum standards,methods, and, possibly, reporting procedures forinventory and monitoring activities could bedeveloped. All Federal agencies with land-management responsibilities could be required toadhere to these standards, and States and privateorganizations could be encouraged to adopt thesestandards as an eligibility requirement for receiv-ing conservation-oriented Federal grants. TheNational Biological Survey within the Depart-ment of the Interior could help integrate activitieswithin DOI and serve as a liaison with othergroups. Although the NBS could take the lead inthis effort, it is essential that the Forest Serviceand other USDA agencies, the National ScienceFoundation, the Environmental Protection Agency,and the Department of Energy be included in thetask force. In addition, State agency representa-tives and private organizations, with existinginventory programs, such as The Nature Conser-vancy should also be included. Several existingefforts, such as EPA’s Environmental Monitoringand Assessment Program (EMAP), the U.S. Fishand Wildlife Service’s Gap Analysis Project(GAP) program, and The Nature Conservancy’sNational Heritage Program, could be expanded orincorporated into an integrated Federal effort (seebox 5-F). At the request of the Secretary of theInterior, the National Research Council hasformed the Committee on the Formation of theNational Biological Survey to study these issues.
A national inventory and monitoring programshould include a clearinghouse, possibly throughNSF or NBS (see box 5-L), for storing andevaluating information so that it would be easilyaccessible to interested parties.
34 ~ ~mple, ~~ 1993, BLM C*M 6 of is 16 ~id-fi stations to release about $30,000 for Other BLM activities. Seved of the
six stations had been in operation for 10 yearn and had been maintaining data sets to monitor the health of formts and the effeeta of acid rain.Continuation of this longer-term record was lost as a result of these cuts.
284 I Preparing for an Uncertain Climate--Volume 2
In developing a nationwide comprehensiveinventory and monitoring system, it is importantto ensure that the minimum standards and meth-ods can be reasonably applied to all types of landunder all types of ownership and management.Many National Parks and other protected naturalareas, for example, have special inventory andmonitoring needs, depending on their missionsand specific legislative purposes (e.g., managingthreatened and endangered species or encourag-ing visitor use). Whatever standards are devel-oped should allow enough flexibility to accom-modate the needs of individual areas whileachieving national objectives.
Finally, a concerted effort to connect, in atimely manner, the information contained in anational inventory and monitoring program to theresource management and land-use planning proc-ess is vital. If these connections are not ade-quately addressed, the gap between research andmanagement could increase with the establish-ment of a separate research agency in DOI.
Option 5-6: Create a line item in agencies’budgets for inventory and monitoring efforts. Aline item in agency budgets will ensure thatinventory and monitoring is receiving consistent,adequate, and long-term attention. However,although a budget line item may help ensure morespecific attention to the activity, it does notguarantee consistent or long-term funding. Itmay, in fact, become a more visible target forcutting in budget-stressed times. NSF’s Long-Term Ecological Research (LTER) Program isfunded on 5-year cycles (see box 5-L). A similarfunding cycle for other agency programs mighthelp give them more long-term funding stability.
Option 5-7: Direct agencies to identify princi-pal gaps in inventory and monitoring activitieswithin their existing programs. Congress couldaddress inventory and monitoring issues at theagency level by focusing on the essential informa-tion that is missing from existing programs.Agencies could be directed to develop a prioritylist for inventory and monitoring needs with costestimates. This priority list could be used to guide
funding decisions for agency activities over aperiod of time. However, it is likely that these listswill vary according to each agency’s missions.
Option 5-8: Support programs that addressthe most urgent inventory and monitoring needs.A national-scale survey of the Nation’s biologicalresources (even if it is a broad-brush survey) isneeded now to help foster regional land-useplanning and to provide better protection, nowand in the future, for the Nation’s natural areas.Remote-sensing technologies and geographicalinformation systems (GISS) are powerful toolsthat provide regional information on biologicalresources, topography, and land use. The Fish andWildlife Service’s Gap Analysis program synthe-sizes information from satellites, State heritageprograms, and Federal agencies to identify vege-tation-cover types, potential habitat for particularspecies, and areas of potentially high speciesrichness as well as information on land-use andprotection status (see box 5-L). Support for thisprogram could produce a crude national inventoryby 1998. Although EPA’s EMAP project isanother national-scale inventory and monitoringprogram that may be valuable in detecting long-term trends and assessing the status of variousresources, methodologies are still being devel-oped. Land use and ownership are currently notpart of the program, and its spatial resolution maybe too coarse to guide regional-scale planning.
1 Enhanced ProtectionFederally protected natural areas are a haven
for some species, and they have become a centralpart of species-protection efforts. But naturalareas and the habitats they protect are not immuneto human disruption-habitat destruction, pollu-tion, and other stresses threaten more and morespecies with extinction (126), and climate changemay exacerbate these stresses. Many federallyprotected natural areas are already too small tocontain functioning ecosystems for many large
.animals (29, 51, 76). Because of these combinedfactors, existing natural areas may be less able to
Chapter 5-Preserves: Federally Protected Natural Areas I 285
protect species in the future; other currentlyunprotected lands may become more importantfor species survival. Protection for existing andfuture natural areas can be enhanced in severaltargeted ways through both direct and indirectFederal actions and by encouraging multi-government-level partnerships. Options for en-hanced protection are summarized in table 5-6.
Direct Federal ActIonDirect Federal action-such as revising agency
mandates and modifying criteria used for acquisi-tion, land transfers, and exchanges-could beused to enhance the Federal system of naturalareas and make them less vulnerable to climatechange.
Acquisition policies for the National ParkService and the Fish and Wildlife Service doconsider biological diversity and reflect a desireto include a variety of ecosystem types. Inaddition, all agencies that administer natural areashave some kind of size requirement in theiracquisition policies that gives preference to largerareas for protection. No acquisition policy givespreference to areas that are adjacent to or linkexisting natural areas-a criteria that could greatlybenefit the preservation of natural areas in thefuture. Biodiversity is not considered in USDAForest Service and BLM wilderness designations.In addition, although a variety of ecosystems isfederally protected, there is little duplication andmany ecosystems types are still unprotected. Onestudy revealed that of 135 ecosystem types,24 percent were inadequately represented and7 percent were not represented in any Federal landsystem (see figs. 5-8 and 5-9).35 Another study ofjust the Wilderness Preservation System foundthat of 233 ecosystem types, 65 percent were
found to be inadequately represented (occurringon less than two units of 1,000 acres or more) and21 percent were not represented (32).36
Research Natural Areas (RNAs), first officiallyestablished in the 1970s as lands from eachland-management agency designated for specialresearch and monitoring, were to form a systemthat would have representatives of all ecosystemtypes (57) (see box 5-L).37 The Federal Commit-tee on Ecological Reserves, established by theJohnson adminis tration, was to explore possibili-ties of expanding the RNA system to includeadditional Federal lands as well as State, local,and private lands, and to develop guidelines andcriteria for management. Though it has not beenformally disbanded, the committee has not metsince 1979 due to lack of funding and staff (7).
35 ~ study used 1982 OW3MZShip maps based on Kuchlex’s Potential Natural Vegetation ~s (33). “Inadequately represented” meantthat relatively small aaeages were protected in the Fedend system of protected lands (includingNational Forests and BLM-administered PublicLands as well as Indian reservations).
36 ~ ~~dy @ ~ sli~fly diff=nt detiation of ecosystem types 8S SpCC@d f~ * F-t ServiU’S fid~ evaluations.
37 Mthou@~~ M USDA F~est s-ice in the 1920s and the National Park Serviec in the 1930s sel aside some Of their hM.Kis for mearehand monitoring, these lands did not become part of a coordinated Federal system of Research Natural Areas until the 1970s.
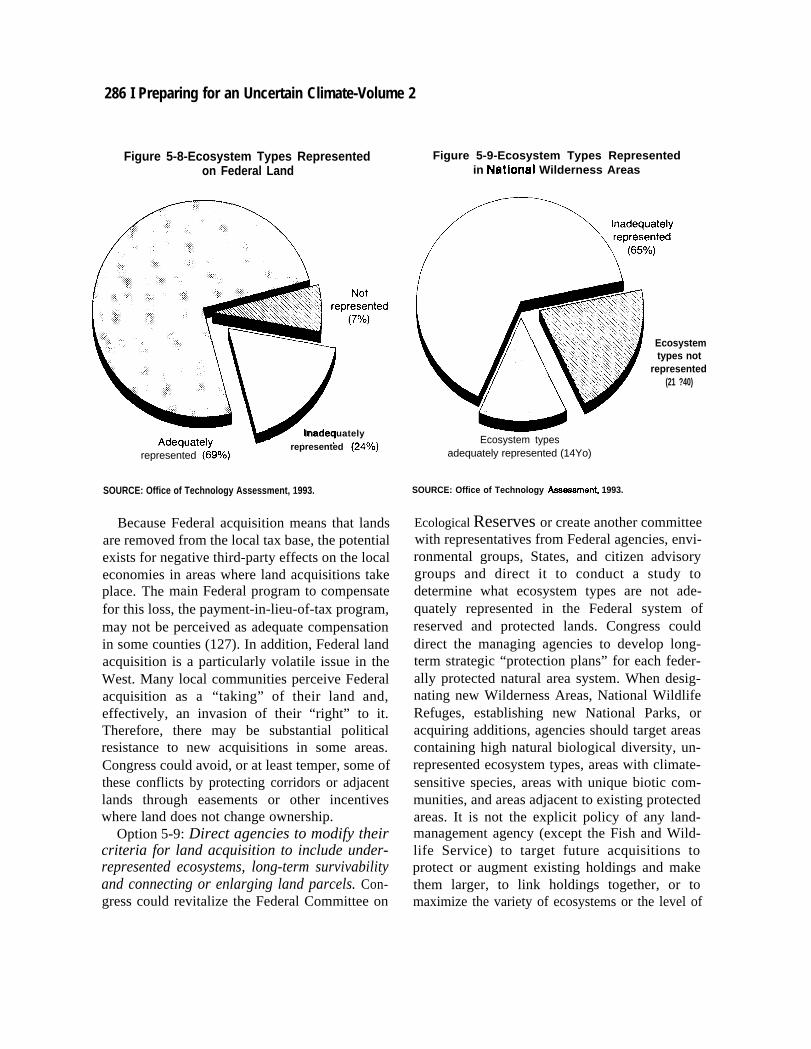
286 I Preparing for an Uncertain Climate-Volume 2
Figure 5-8-Ecosystem Types Representedon Federal Land
.)Inadequatelyequalely
-— represented (24°\o)*df . ..-, u
represented (69Yo)
SOURCE: Office of Technology Assessment, 1993.
Because Federal acquisition means that landsare removed from the local tax base, the potentialexists for negative third-party effects on the localeconomies in areas where land acquisitions takeplace. The main Federal program to compensatefor this loss, the payment-in-lieu-of-tax program,may not be perceived as adequate compensationin some counties (127). In addition, Federal landacquisition is a particularly volatile issue in theWest. Many local communities perceive Federalacquisition as a “taking” of their land and,effectively, an invasion of their “right” to it.Therefore, there may be substantial politicalresistance to new acquisitions in some areas.Congress could avoid, or at least temper, some ofthese conflicts by protecting corridors or adjacentlands through easements or other incentiveswhere land does not change ownership.
Option 5-9: Direct agencies to modify theircriteria for land acquisition to include under-represented ecosystems, long-term survivabilityand connecting or enlarging land parcels. Con-gress could revitalize the Federal Committee on
Figure 5-9-Ecosystem Types Representedin Nationai Wilderness Areas
Ecosystemtypes not
represented(21 ?40)
Ecosystem typesadequately represented (14Yo)
SOURCE: Office of Technology Aseeesment, 1993.
Ecological Reserves or create another committeewith representatives from Federal agencies, envi-ronmental groups, States, and citizen advisorygroups and direct it to conduct a study todetermine what ecosystem types are not ade-quately represented in the Federal system ofreserved and protected lands. Congress coulddirect the managing agencies to develop long-term strategic “protection plans” for each feder-ally protected natural area system. When desig-nating new Wilderness Areas, National WildlifeRefuges, establishing new National Parks, oracquiring additions, agencies should target areascontaining high natural biological diversity, un-represented ecosystem types, areas with climate-sensitive species, areas with unique biotic com-munities, and areas adjacent to existing protectedareas. It is not the explicit policy of any land-management agency (except the Fish and Wild-life Service) to target future acquisitions toprotect or augment existing holdings and makethem larger, to link holdings together, or tomaximize the variety of ecosystems or the level of
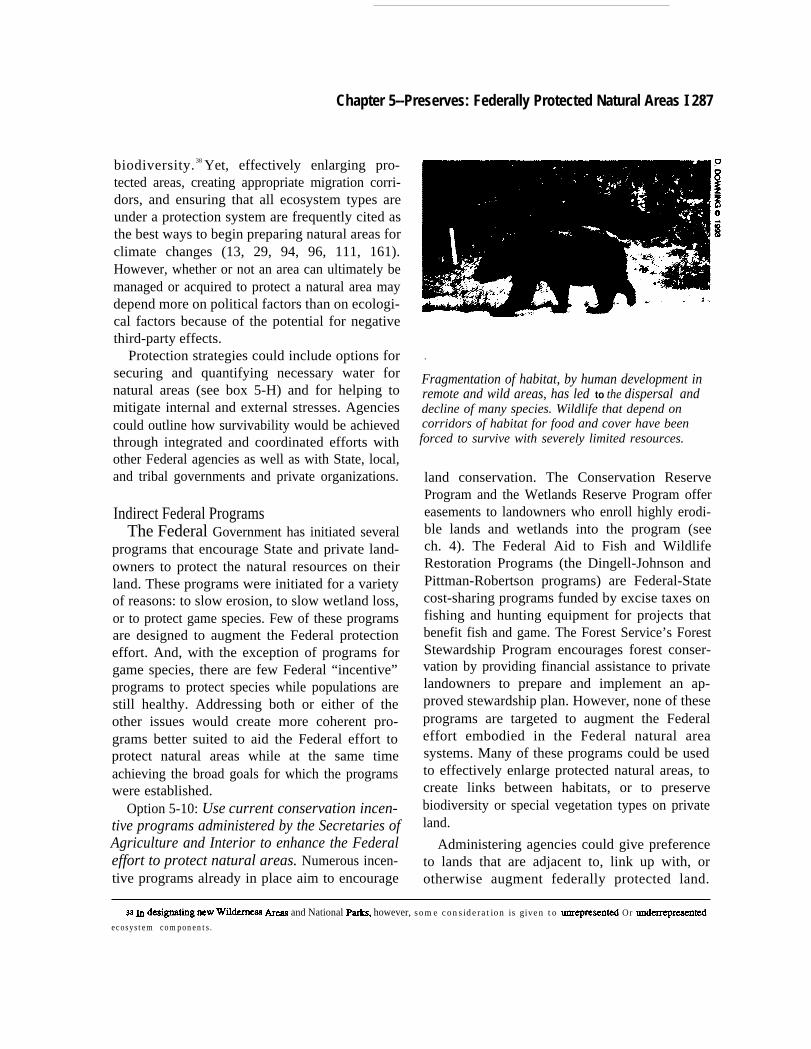
Chapter 5--Preserves: Federally Protected Natural Areas I 287
biodiversity. 38 Yet, effectively enlarging pro-tected areas, creating appropriate migration corri-dors, and ensuring that all ecosystem types areunder a protection system are frequently cited asthe best ways to begin preparing natural areas forclimate changes (13, 29, 94, 96, 111, 161).However, whether or not an area can ultimately bemanaged or acquired to protect a natural area maydepend more on political factors than on ecologi-cal factors because of the potential for negativethird-party effects.
Protection strategies could include options forsecuring and quantifying necessary water fornatural areas (see box 5-H) and for helping tomitigate internal and external stresses. Agenciescould outline how survivability would be achievedthrough integrated and coordinated efforts withother Federal agencies as well as with State, local,and tribal governments and private organizations.
Indirect Federal ProgramsThe Federal Government has initiated several
programs that encourage State and private land-owners to protect the natural resources on theirland. These programs were initiated for a varietyof reasons: to slow erosion, to slow wetland loss,or to protect game species. Few of these programsare designed to augment the Federal protectioneffort. And, with the exception of programs forgame species, there are few Federal “incentive”programs to protect species while populations arestill healthy. Addressing both or either of theother issues would create more coherent pro-grams better suited to aid the Federal effort toprotect natural areas while at the same timeachieving the broad goals for which the programswere established.
Option 5-10: Use current conservation incen-tive programs administered by the Secretaries ofAgriculture and Interior to enhance the Federaleffort to protect natural areas. Numerous incen-tive programs already in place aim to encourage
.
Fragmentation of habitat, by human development inremote and wild areas, has led to the dispersal anddecline of many species. Wildlife that depend oncorridors of habitat for food and cover have beenforced to survive with severely limited resources.
land conservation. The Conservation ReserveProgram and the Wetlands Reserve Program offereasements to landowners who enroll highly erodi-ble lands and wetlands into the program (seech. 4). The Federal Aid to Fish and WildlifeRestoration Programs (the Dingell-Johnson andPittman-Robertson programs) are Federal-Statecost-sharing programs funded by excise taxes onfishing and hunting equipment for projects thatbenefit fish and game. The Forest Service’s ForestStewardship Program encourages forest conser-vation by providing financial assistance to privatelandowners to prepare and implement an ap-proved stewardship plan. However, none of theseprograms are targeted to augment the Federaleffort embodied in the Federal natural areasystems. Many of these programs could be usedto effectively enlarge protected natural areas, tocreate links between habitats, or to preservebiodiversity or special vegetation types on privateland.
Administering agencies could give preferenceto lands that are adjacent to, link up with, orotherwise augment federally protected land.
38 b desi~~g ncw Wild-ss Areas and National Ptuks, however, some consideration is given to UXtrw8$2ntCd Or und~-nt.cd
ecosystem components.
288 I Preparing for an Uncertain Climate--Volume 2
Alternatively Clongress could increase the ease-ment benefits or the Federal share of paymentoffered for desirable lands.
Option 5-11: Encourage ecosystem-level con-servation at the State level by funding the Fishand Wildlife Conservation Act of 1980. Federa1laws are now in place to protect both game speciesand endangered species on non-Federal land, butthere is no mechanism to protect species betweenthe two extremes of “hunted” or “totally pro-tected” until they decline to the point of nearextinction. The Fish and Wildlife ConservationAct passed in 1980 could fill a large gap in theFederal protection effort and help minimizespecies loss under climate change. This actestablishes a cost-sharing program with the Statesfor nongame wildlife-conservation projects. Fund-ing for the program must be congressionallyappropriated, but no money has ever been appro-priated. The program could augment Federalprotection efforts especially if geared more broadlyto protect ecosystems rather than individualspecies.
Partnerships Among Different Agencies andLevels of Government
Because of shortages in funds and lack of largepieces of available land to establish new protectednatural areas, protection of natural area resourceswill require unprecedented levels of coordinationand cooperation in management and researchamong Federal agencies; State, local and tribalgovernments; private landowners; and interestgroups. There are many examples of innovativeprotection mechanisms to draw on in establishingeffective partnerships. Most use a graded man-agement system, where the innermost areas re-ceive the most strict protection and more uses areallowed for the outer areas. This is the manage-ment scheme supported by Unesco’s Man and theBiosphere program (MAB), The Nature Conser-vancy’s Last Great Places Initiative, and the PineBarrens National Preserve in New Jersey. All ofthese programs and others are outlined inbox 5-F.A high degree of local participation and support,
willingness to compromise, and adequate com-pensation for those who sacrifice developmentrights are vital to project success (68, 168).Congress could encourage cooperative effortsand spur local support by funding cost-sharingprograms and challenge grants, by linking aportion of agency funds with cooperative efforts,and by offering other incentives, such as incometax breaks, to those who are willing to participatein conservation and protection programs.
In addition, partnerships are becoming a popu-lar way to enforce the Endangered Species Act(P.L. 93-205). Under Section 10 of the revised act,a party may be permitted some destruction of anendangered or threatened species if a habitatconservation plan (HCP) is prepared with thecooperation of Federal, State, and local gover-nments to arrange for the “permanent’ protectionof critical habitat elsewhere. The development ofan HCP often results in the establishment of afederally protected natural area. If this methodbecomes more widely used to protect endangeredspecies, the Federal Government will need toensure that national interests are protected duringnegotiations. (See box 5-D for a more detaileddiscussion of the Endangered Species Act andHCP.)
Whatever the protection mechanism, effortsshould aim to create a diverse network (regionallyand biologically) of protected areas of maximumsize (111). Although federally protected naturalareas will remain the focus of conservationefforts, a complete, diverse, and representativepreserve network will require consideration ofother Federal systems as well as State and privateholdings.
Option 5-12: Use “cooperative research andmanagement funds” to foster cooperative man-agement among agencies. Under the currentfunding structure, there is little financial incentivefor Federal land managers to actively participatein cooperative ventures with other agencies, Stategovernments, or private parties. Congress couldappropriate a certain sum of money for eachagency with terrestrial research and management
Chapter 5-Preserves: Federally Protected Natural Areas I 289
responsibilities. These monies could be used formultiagency or multigovernment-level projectsthat address identified research priorities. Con-gress could also appropriate funds for regionallybased, cooperative pilot projects. These projectscould include the development of interagencystrategic kind-management plans.
Many programs already in place in someagencies could be expanded and supported withthese funds. Both the Forest Service and BLMhave Challenge Cost Sharing Programs in whichmatching funds are made available to the Statesfor habitat-improvement projects. HCPS underthe Endangered Species Act are developedthrough a coordinated effort with Federal agen-cies, landowners, industry, environmentalgroups, and developers. Although not centered inany Federal agency, Unesco’s MAB is an exam-ple of a regional research effort involving manyFederal agencies.
Option 5-13: Create a Federal CoordinatingCouncil for Ecosystem Management. Congresscould build from the idea that produced theFederal Coordinating Council for Science, Engi-neering, and Technology, to create a FederalCoordinating Council for Ecosystem Manage-ment that would provide a forum for facilitatingcooperative management at the national level.This council could evaluate interagency projectsand make recommendations regarding neededcollaboration. Such an evaluation may identifythe extent of existing research or activity in thisarea, and enable an easier identification of areasin need of more emphasis. Although this councilcould be effective in facilitating integrated activ-ity at the national level, the successful implemen-tation of national programs would rely on incen-tives and support for “ecosystem management,”or cooperation at the land-management (grass-roots) level.
FIRST STEPSBecause money to implement all the above
options and the scientific understanding of howclimate change will affect natural areas arelimited, the following frost steps represent reason-able actions for facilitating adaptation to climatechanges in natural areas. The first steps identifiedhere are those that meet one of several criteria:
—they should be undertaken early becausethey will take a long time to complete;
—they address “front-line,” or urgent, issuesthat need attention first in order to makeinformed policy decisions in the future;
—they can be approached through mechanismsalready in place or efforts already underway;
—they are beneficial for reasons other thanhelping to prepare for climate change; or
—there is a near-term ‘target of opportunity.”
These first steps begin to address the research,monitoring, and protection needs identified in thischapter. By starting with these options, the Nationcan respond to the impacts of climate change infederally protected natural areas while strength-ening its commitment to natural area protection ingeneral. These are first steps to pursue because ofpresent climate change concerns; they are not allthe things one could do to prepare natural areasfor the future impacts of climate change.
● Use the National Biological Survey toassess biological and ecological inventoryand monitoring needs. A nationwide ‘map’of biological resources, topography, landuse, and protected areas is needed now.Future strategies to protect natural areas andtheir resources will require a national pictureof what biological resources currently existand where they are located, what lands areunder protection, and how adjacent lands areused. Simply, a baseline resource map isnecessary before detection of long-term changesin resource conditions can be made andprotection efforts modified. A national in-ventory and monitoring program would also
290 I Preparing for an Uncertain Climate--Volume 2
be beneficial for protecting endangered spe-cies and biodiversity.
The new National Biological Survey inthe Department of the Interior is the closestmechanism to a single, multiagency, na-tional effort to address global change issuesfor biological resources. Because the NBS isin its formative stages, it presents a clearopportunity to implement some of the op-tions outlined above. However, unlike theU.S. Geological Survey, the only agency thatdeals extensively with geological researchand information, there are several agenciesoutside DOI with responsibilities for biologi-cal resources. The ideal, nationwide NBSprogram would effectively incorporate theactivities of these other agencies as well asState and private organizations (see box5-L). To do so, the NBS will have to createa formal mechanism to link and coordinatewith activities in other agencies.
Because most basic ecological research isfunded through NSF, that agency should beactively and formally involved in any comprehen-sive ecological research. Other agencies thatmanage biological resources should also beinvolved. This office could be charged toproduce a document that synthesizes thecondition of the Nation’s biological re-sources and the state of the scientific under-standing about how they work and interact.
Congress could ask the NBS to develop apriority plan for expanding protection ofnatural areas to include all ecosystem typesand areas with environmentally sensitivespecies and high biological diversity. Theplan could incorporate a variety of tech-niques including acquisition, easements, co-operative management, incentive programs,and cost-sharing programs.
■ Support basic research on key gaps in ourunderstanding of ecosystems, such as:1) past climate changes and correspond-ing species responses, 2) restoration and
translocation ecology, 3) the effectivenessof corridors and buffer zones, 4) thedevelopment of ecological models, and 5)the effect of elevated CO2 on assemblagesof plants and animals. Basic research inthese areas is needed now to determmi e howspecies might respond to climate change andhow to best provide for their protection in thefuture. Agencies could attempt to redirectexisting funds in the USGCRP or procurenew funds for addressing these basic eco-logical research needs under the “EcologicalProcesses” research area (see ch. 3). Alterna-tively, NSF, whose mission is to supportbasic scientific research, could take the leadin supporting these research areas outside theauspices of USGCRP. The new NBS couldalso be an appropriate vehicle to use inaddressing some of the research that directlyrelates to land-management issues.
= Conduct a review of ecological researchwithin USGCRP and across Federal agen-cies, evaluate how much long-term ecosystem-level research relevant to climate change,biodiversity and other multidecadal prob-lems is being done, and identify importantgaps. A review of all research conducted on“natural resource” has not yet been comp-iled across the Federal agencies. Existinganalyses suggest a great deal of money isspent on research relevant to the environ-ment but how much is useful to under-standing long-term ecological problems (suchas biodivesity and climate change) is notknown.
Further, there is currently no mechanismfor consolidating results from disparate re-search efforts into “general patterns andprinciples that advance the science and areuseful for environmental decisionmaking.Without such synthesis studies, it will beimpossible for ecology to become the pre-dictive science required by current and futureenvironmental problems” (70).
Chapter 5-Preserves: Federally Protected Natural Areas | 291
An effort to characterize and synthesizeongoing research could help bridge the gapbetween basic research and natural resourceplanning. Such a review could be conductedby OSTP, NAS, or an independent commis-sion.
● Provide funding for the Fish and WildlifeConservation Act of 1980 to promotenatural area conservation and protectionat the State level. This law establishes aFederal cost-share program for “nongame”species conservation. It is already enacted,and many States have prepared initial plansthat could qualify for Federal matchingfunds, making it a target of opportunity topromote natural area conservation at theState level. With some amendments to pro-
Setting aside a given amount of land withinthe modem fragmented landscape does notalone ensure that the ecological features forwhich they are valued will be preserved. Tobest conserve species, natural areas shouldinclude an array of ecosystems and transitionzones between them to allow for the manycomplex interactions that rely on links be-tween different parts of the landscape.
By asking agencies to incorporate suchconcerns into future acquisitions, Congresscould minimize future geographic fragmen-tations and use limited monies to maximizethe range of protected ecosystems.
CHAPTER 5 REFERENCESmote multispecies, or “ecosystem,” pro- 1tection at the State level and adequate 2.funding, the Fish and Wildlife Coordination “Act could be used to encourage natural areaprotection and conservation on State and 3.private lands.
■ Direct management agencies to explicitlyconsider three ecosystem criteria in all 4“future land acquisitions: 1) likely to per-sist over the long term despite current and 5.anticipated stresses, 2) augments under-represented ecosystems in the Federalnatural area holdings, and 3) buffers orconnects other preserved land parcels.
Ackerso~ VJ., “Effects of Global Climate Change on MontaneIsland Biodiversity,” draft repo~ Apr. 30, 1992.Anerican Forest Council, The A-”can Forest: Fact andFigures J991 (Washington DC: The American Forest Councfi1991).Amicarellq L.A., Director, Fire and Aviation Managernen$USDA Forest Service, testimony before the Subcommittee onEnergy and Natural Resources, House committee on Gover-nment Operations, May 24, 1990.Andersoq R., and M. Rockelj Econonu”c Valuation of Wetkands,Discussion Paper #605 (Washington DC: American Petroleuminstitute, April 1991).Babbitt, B., Secretary of the Interior, U.S. Department of theInterior, testimony at hearings before the House Committee onMerchant Marine and Fisheries, Subcommittee on Environmentan. Natural Resources and the House Cornrnittee on NaturalResources, Subcommittee on National Parks, Fonxts and PublicLands, Jtdy 15, 1993.
PRESERVES-FIRST STEPS
■ Use the National Biological Survey to assess biological and ecological inventory and
monitoring needs■ Support basic research on species and ecosystem sensitivity to climate change,
restoration and translocation ecology, and the design and effectiveness of corridors andbuffer zones
• Conduct a review of ecological research within the U.S. Global Change ResearchProgram and across Federal agencies
• Provide funding for the Fish and Wildlife Conservation Act of 1980 to promote naturalarea conservation and protection at the State level
• Direct agencies to acquire areas that are likely to persist in their natural state over thelong term, link or buffer existing holdings, and increase representation of ecosystemsnot currently under Federal protection
292 I Preparing for an Uncertain Climate--Volume 2
6. Beam MJ., The Evolution qfNata”onal WiltfhjleLuw (New Yo~NY: Pracfyxpublishcrs, 1983), 448 pp.
7 . Beaq MJ., ‘TcdcraI Laws and Politic9 Pmainhg to theMaintenance of Biological Diversity on Federal and pIiV*C
hnds,” Contractor- pmparcdfor the office of ‘r&bnoIogyhwament’s Report Technologies to Maintain BwlogicaiDiversity, wt. 1, 1985.
8. BcaQ MJ., “TIE 1973 Endan&rcd species Act: Look @BackOver the First 15 Years,” Endangered Species Wpdate, vol. 5,No. 10, August 1988, pp. 4-6.
9. Bcanj M.J., “No*hd@cnous Specks intlw United States: TIMRok of the United States Department of the Interior inNonindigcmua Species Issues,” contractor paper prqared forthe mice of lmnology Asscmn@ Novcxnba 1991.
10. Bcatlcy, T., “USC of Habitat Conservation Plans Under the~ ~ Species Ac&” in Wildl#e Conservaa”on in
Metropolitan Environments, L. W. Adams ad D. L. Lee@(cds.) (Colum~ MD: National Institute for Urban Wildlife,1991), pp. 123-137.
11. Bcrgcr, J.L., and L.A. Riggq “Ecological and Restoration andNon-Indigcnoua Spcciq” contractor PF Pm for theOffice of ‘lbchnology Asscmmc@ August 1991.
12. Boa D.B., and RA. Nisbcg “projecting the Effects ofclimate Change on Biological Diversity in Forests,” in: GZohafWfing and Biological Diversity, RL. Peters and T E.hwejoy (cds.) (Ncw Havm ~: Yale University Press, 1992),pp. 277-2%.
13. Bridgcwatcr, P., and SJ. Wood@ “Global Warming andNature Conscrv atioq” Land Use Policy, April 1990, pp.165-168.
14. B- B.A., “Landscape Rutection and the Nature Conscr-vamy,” m: Lan&cape Linkages andBiodi”versity, W.E. Hudson(cd.) (Wash@tm, DC: Island hss, 1991), pp. 66-71.
15. BrowIL TC., “Wata for Wilderness Areas: Ins&cam FlowNeeds, Pmtcctioq and Economic Mluq” Rivers, vol. 2, No. 4,October 1991, pp. 311-325.
16. Brmvq ‘EC., J.C?. lhylor, and B. Shelby, “Asscsalng the DirectEffects of Strcamflow on Rcucatl “(XU A Literature IWvicw,”Water Resources Bulktin of the Armxican Water Rcsoumcs&sochti~ VO1. 27, No. 6, IMembcr 1991, pp. 979-989.
17. Cahq R, “TIM Conservation Challenge of the 1980’ s,” hNational Par& in Crisis (WasMngtoq DC: National Parka andconservation Associdon 1982), pp. 7-W.
18. CaMmda J@artrncnt of Watcx Rmunxs, California’s Con-tinuing Drought: A Summary ofhnpacts and Conditions as ofDecetier 1,1991 (Sacramcnto, CA: CaMornia Department ofW- Remurccs, December 1991).
19. Carroll, CR., “Ecological Mana@mm t of Sensitive NaturalArea&” in: Conservalz”on Biology, P.L. Ficdkr and S.K. Jain(da.) (NCW YoriL NY: Chapman and Hall 1992), pp. 347-372.
20. Clawsq M., The Federal Lands Revisited (Washin@q DC:Resources For the Future, 1983).
21. Collins, B.R., and E.W.B. Russell (cds.) Protecting the NewJersey PineLands:A New Direction in Land-Use Planning (NCWB~ NJ: Rutgers University Press, 1988),
22. Colnanor, P.L., and WY. Gregg, Jr., “Role of U.S. NationalParka in Global Change Raearc4° paper ~ at theI%urtk World Congress on National Parka and Protected h
Caracas, Vcnczu~ Feb. l@21, 1992, George WrightFORUM,(in press).
23. Commiss ion on the Adirondacks in the llvcnty-First Ccsmuy,The M”rondack Park in the IWenty-First Century (NY: 1990),97 pp.
24. Committee on ~ and &VhWMIKS@ Scicrxcs, Ecologicalsystems (CEEs) and Dynmica lhsk Group, Ecological Net-works of Networks, Workshop Report Sponsored by CEES,October 1991 (w “~ DC: ~ of s- ~9m
25. Committee on Earth and Bnvimnmental sciences (cBBS), ourChanging Planet: The FY 1993 Us. Global Change ResearchProgram (Washin@oq DC: CRES, 1992).
26. Committee on Earth and Environmental Sciuxe.s (CEBs), ourChanging Planet: The FY 1994 U.S. Global Change ResearchProgram (WasMngtoq DC: CEES, 1993).
27. Consordum for International Earth Sciemc Information Net-work (CIBSIN), Pathways qfUnderstanding: The Interactionsof Humanfty and Global Environmental Change (UniversityCultor, m: CIESIN, May 1992).
28. Coopes, C.F., “salaitivitics of Wcstan Us. EcoayStCma to.~ -6,. contractor report prepared for b Omcc of
‘Rchnology Asscssrnal ~ 1992.29. Cooprridcr, A., “Conservation of Biodhmity on Wcstan
Rar@ands,” h Dqfendkrs of Wfldffe, fundmrpe finkagtwand Bbdiverdty, W.E. Hudson (cd.) (Washir@q DC: IslandPress, 1991), pp. 40-53.
30. Council on EnvironmcnEd Quality, “Environmental Ww21st Annual Rx” (Wash@toQ DC: U.S. GovCmKncntPlinting office, 1991).
31. Crawky, MJ., “’IIM Responses of ‘Ikrrestrial Ecosystems toGlobal Climate Change,” im Global Climate and EcosystemChange, OJ. Macdmdd (cd.), h“ Proceedings @ a N“AdvancedResearch Workshop on Afo&lEcosystems and ThdrChanges, Sept. 44, 1989, A4eratea, Italy (NCW Y- NY:Plenum w& 1990), pp. 141-164.
32. Crurnpacker, D., “Status and ‘lYcrxk of Natural~rnthe U.S.,’* Contractor mpat plwpamd for b Office of ‘lbdlllol-ogy Assessment’s Report Technologies to Maintain BiologicalDiversity September, 1985.
33. Cmnpa&r, D.W., S.W. Hodgq D. Frkdky, and W.P. Gregg,Jr., “ A Prchninary Assesamnt of * status of Majorlbrreatrial and Wetland Bmystesns on Federal and IndianLands in the United States,” Conservation Biology, vol. 2, No.1, March 1988, pp. 103-115.
34. Dabncy, W.D., Cbicf, Division of Ranger Activitica, NationalParkscNicc, testimony before the Subcomml“ttcc on EntrgyandNatural Resources, House cOrxnittce on Govcrmnent @=-tions, May 24, 1990.
35. Davia, G.D., “NaturalDivcrsityf ort.bcFuturc Gemrations: ‘meRole of Wiklemcq” k Proceedings @the Natural Dbersityin Forest Ecosystems Wotihop, J.L. Cooky ad J.H. Cooky(cds.) (Athens, GA: hivcrsity of Gcoq@L 1984).
36. Darrow,CLF., etal., “CrownofthcConthmtPm@t” (CMciLZMT: Glacier National ~ Mar. 20, 1990).
37. Dam (Ml., “Prcsmration of Natural Diversity: llx Role of
--wmentadm within Wildancss,” b WildernessBenchmark 1988: Proceedings of the National WiMernessCOI!O* Gcmral ‘khnkal Report SB-51 (AsbillG NC:
Chapter 5-Preserves: Federally Protected Natural Areas I 293
38.
39.
40.
41.
42.
43.
44.
45.
46,
47,
48.
49.
50.
51.
Us. Departmalt of AgIicultlm, RmSt Servi(x, southeasternForest Expcnme“ nt Statioq January 1989), pp. 7682.Davis, M.B., and C. Zabins& “Changes in Geographical RangeResulting h Greenhouse Wmming: Effects on Biodiversityin Forests,” in: Global Warmin g and Biological Diversity, R.L.Peta and T E. Imvejoy (eds.) ( N e w Havenj (X7 Y a l eUniwxsity press, 1992), pp. 297-308.
DeCmusey, D.G., D.G. RX, RG. Woodmwkc, B.G. Faber,and W.W. Wallace, “TerrestrM Ecosystems Regional Re-search and Analysis: An Interagency Laborato~”, im Ad-vances in Hy&oscience and Engineering, vol. 1, S.S, Wang(cd.) (1993), pp. 61-70.
Duffus, J,, Director, Natural Resource Managem at Issues,Wxourccs, Community, and Economic Devcloprmmt Divisio~U. S. Government Accounting Office, testimony at hearingsbefore the Subcommittee on Energy and Natural Resources,House Comrm“ttee on Government Operations, May 24, 1990.Fiedler, P.L., and S.K. Jain (eds.), Conservation Biology: TheTheory and Practice ofNature Conservation, Presemation, andManagement (New York NY: Routledge, ~ and w1992).
Frankl@ J.F., C.S. Bledsoe, and J,T. C- “Contributionsof the Imng-%rrn Ecological Research pro-” Bioscience,vol. ~, No. 7, July/August 1990, pp. 509-523.
Gillis, A.lvL, “Should Cows Chew Cheatgrass on Com-monlands?” Bioscience, vol. 41, No. 10, November 1991, pp.668-675.Gle~ S.M., “Regional Analysis of Mammal DistributionsAmong Canadian Parks: Implications for Park Plann@,”Canadian Journal of Zoology, vol. 68, 1990, pp. 2457-64.
Gle~ S.lvt, and T.D. Nudds, “Insular Biogeography ofMammals in Canadian“ Parks,” Journal of Biogeography, vol.16, 1989,261-268.Grahanq RW., ‘Late Pleistocene Faunal Changes as a Guide toUnderstanding Effects of Greenhouse Warming on the Mam-malian Fauna of Norih hmri~” in: Global Warming andBiological Diversi~, RL. Peters and T.E. Xavejoy (eds.) (NewI-Iaveq CT: Yale University Ress 1992), pp. 76-90.Great Lakes Commissiow A Gui&book to Drought Planning,Management, and Water Level Change in the Grtwtfukes (AnnArbor, MI: Great bkes Commission 1990),
Greater Yellowstone Coordinating Committee, The GreaterYellowstone Area: An Aggregation of National Park andNational Forest Management Plans, (TVashingto~ DC: U.S.
*artment of the Interior, National Park Sewice and U.S.Depmtm@ of Agriculture, Forest Service, 1987).Greater Yellowstonc Coordma“ dng Committee, A Framew orkfor Coordinata”on of National Parks and National Forests in theGreater Yellowstone Area, September 1991.Grecnwalc L.A., “Reflections on the Power andpotentird of theqer~ SFRX5eS AcL” Endangered Species Update, vol. 5,No. 10, August 1988, pp. 7-9.Gregg, W.P., Jr, “Potential Impacts of Climate Change andAdaptive Strategies for Natural Areas,” paper presented atconference on Forests and Global Change, convened by theAmerican Forestry Assocmh“ “o% June 11-12, 1991 (Arlingto~VA: American Forestry Associatio~ in press).
52.
53.
54.
55.
56.
57.
58.
59.
60.
61.
62.
63.
64.
65.
660
~ory,a., “StateoftheParks 1980: Roblansandplans,” i.wNational Parks in Crisis (Washin@oq DC: National Parks andConservation AssocMioq 1982), pp. 75-90.Harper, S.C., L.L. F* and E.W. _ The Northern FormLami3 Study of New England and New York (RutlaQ4 VT: U.S.Department of Agricultmq Forest Service, and @v_OfS’ ‘IhskForce on Northern Forest IAUI&, April 199Q 2rxl @ntin&Fcbrualy 1992).Harris, L.D., and K. Atkins, “Faunal Movement corridors inFlori@” k Landscape Linkages and Biodiversity, W.Ii.Hudson (cd.) (Washington DC: Island Prw, 1991), pp.117-134.HudsoL W.E., iiandscape b“nkagesandBio@ersity (Washing-ton DC: Defenders of Wildlife and Island Press, 1992).Humphreys, W.F., and DJ. Kitchener, “TIM Effect of HabitatUtilization Species-Area Curves: Implication for OptimalReserve Are&” Journal of Biogeography, vol. 9, 1982, pp.391-3%.Institute of Ecology, Experimental Ecological Reserves: AProposed National Network, report prepared for the Nationalscience Foundation (TVMhingtq DC: U.S. Government Prim-ing office, June 1977).Intergovernmental Panel on Climate Change, World Meteomlogical Grganidon, and United National Enviromnent hgranq Climate Change: The IPCC Impacts Assessment, reportprepared for IPCC by Working Group II, WJ. lkgarg G.W.Sheldoq and D.C. Griffith (C@.) (Canberrw Austmlim Govan-ment Publishing Service, 1990).Intergovcrnnmmd Panel on Climate Change, World Meteoro-logical Orgamza“ tiom and United National Environment Ro-gramj Chhwte Change: The lPCC Sciendjic Assessment, reportprepared for IPCC. by Working Group I, J.T Hou@~ GJ.Jenkins, and JJ. Ephraums (eds.) (Cambridge: CambridgeUniversity Press, 1990).International Union for the Conservation of Nature and NaturalResources (KEN), United Nations List of National Parks andProtected Areas (Gla@ Switzerland, and Cambridge, UK:IUCN, 1990), 284 PP.Jordanj W.R, R.L. P e t e r s , a n d E.B. AUeq “fiob@cdRestoration as a Strategy for Consaving Biodiversity,” con-tractor report prepared for the Office of ‘lkchnology Assess-rmq January 1986.Juday, G1., “State I@slative Initiatives on Natural Areas,”Natural Areas Journal, vol. 8, No. 2, 1988, pp. 107-114.Karievq P.M., JX3. Kingsolver, and R.B. Huey (da.) BioticInteractions and Global Change (Sunderlax@ MA: SinauerAssociates Inc., 1993).Keiter, RB., and M.S. Boycq “Greater Yellowstone’s Future:Ecosystem Management in a Wilderness Environment” ixx TheGreater Ye210wstone Ecosystem, R.B. Keiter and M. S. Boyce(eds.) (New Hava CT: Yale University Press, 1991).KeIrnelis, J.A., and S.E. Ragone, “A Geographically-BasedStrategy for ‘IhTcstrial-EfTccts Research Orgamzq‘ “ Science toSupport Policy on a Global Scale,” World Resoume Rew”ew,vol. 4, No. 2, 1992, pp. 156174.Keysto~ Center, Biological Diversity on Fe&ralLandr, reportof a Keystone Policy Dialogue (Keystonq CO: KeystoneCenter, April 1991).
294 I Preparing for an Uncertain Climate--Volume 2
67. Knigh4D.K., “’IhcYcllowstoneF ireControversy,” pp. 87-104iru The Greater Yellowstone Ecosystem, R.B, Keiter and M.S.Boyce (eds.) (New Havenj CT: Yale Univemity Press 1991)
68. LilieholnA RJ., Preserves atRisk:An Investigm”on of ResourceManagement Strategies, Implications, and Opportunities, con-tractor report prepared for the Office of lkchnology Assess-ment, January 1993.
69. Lovejoy, ‘KE., “Diverse Considerations,” Biodi”versity, E.0,Wilson (cd,) (Washington DC: National Academy Press, 1988).
70. Lubchenco, J., etal., “The Sustainable Biosphere Initiative: AnEcological Research Age~” Ecology, vol. 72, No, 2, 1991,pp. 371412.
71. LuosmiL J.R., “Listing of Endangered Species Said to ComeTbo Late to Help,” New York Times, Mar. 16, 1993, p. C4.
72. Macdonald, I.A.W., “Global Change and Alien Invasions,” irxBiodiversity and Global Change, Monograph 8, O.T Sohig,HAL van Emdm and P.G.WJ. van Oordt (eds.) (Paris, France:International Union of Biological Sciences, 1992), pp. 197-208.
73. Man and Biosphere Program, Practical Guide to AMB (Paris,France: Unesco, Division of Ecological Sciences, June 1987).
74. McCormi& J., A St@ of the Sign@cance of the Pine BarrensofNewJersey (Philadelpb@ PA: Academy of Natural Sciences,1%8).
75. McNeely, J. A., “climate Change and Biological Diversity:Policy Implications,” irx Lundscape-Ecological Impact ofClimatic Change, M Boer, and R.S. de Gmot (eds.) (Amster-darq Netherlands: 10S Press, 1990), pp. 406-429.
76, McNeely, J.A., ‘‘The Future of the National Parks,’ Environ-ment, vol. 32, No. 1, 1990, pp. 1620 and 3741.
77. Meyers, N., “Tropical forests and Their Species: Going, Going,. . . ?“ im Bid”versity, E.O. Wilson (cd.) (WashingtorL DC:National Academy Press, 1988), pp. 28-35.
78. Meyers, N., “Synergisms: Joint Effects of Climate Change andOk Forma of Habitat Destruction” ixu Global Wwm”ng andBiological Diversity, RL. Peters and TE. hvepy (da.) (NewHav~ CT: Yale University Press, 1992), pp. 344-354.
79. [email protected]., Associate Director, Operations, National ParkService, U. S. Department of Interior, statement before theSubcommi ttee on Energy and Natural Resources, House Com-mittee on Govemrnent Operations, on the implementation of thenewly established fire management policy for federal landmmaging agencies, May 24, 1990, pp. 48-56.
80. Murphy, D.D., and S.B. Weiss, “Effects of Climate Change inBiological Diversity in Western North America: Species Imssesand Mechanisms,” im Global Warming and Biological Diver-m“ty, R.L. Peters and T. E. Lovejoy eds. (New Haveu C’I’: YaleUnivcmity Press 1992), pp. 355-368.
81. National Research Council, Toward an Understating ofGlobal (Mange (Washington DC: National Academy Press,1988).
82. National Research CounciL Restoration of Aqutic Ecosystem(National Academy Sciences Press, 1992).
83. National Reaearc h Counc& Science and the National Parks
(WXOQ DC: Natio~ Aademy press, 1992).84. National Research coum~ Water Transfers in the West:
E~ciency, Equi”ty, and the Environment (W@ingtoq DC:National Academy Press, 1992).
85. National Research COW% Research to Protect, Re.w.we, andManage the Environment (Washington, DC: National AcademyPress, 1993).
86. National Research Council, Setn”ng Priorities fbrLandConser-vation (Washington DC: National Academy press, 1993).
87. Newmark W.D., “Species-Area Relationship and its Detami-nants for Mammals in Western North American NationalParks,” Biological Journal of the Linnean Society, No. 28,1986, pp. 83-98.
88. NodvirL S.C,, “RegionalC onservationManagemeMRelative toNPS Policy and the Conservation Ethic,” G. Wright FORUM,VO1. 6, No. 4, 1990, pp. 10-15.
89. NOSS, R.F., “From Plant Communities to Landscapm inConservation Inventories: A bok at the Nature Conser-vancy,” Biological Conservation, vol. 41, 1987, pp. 11-37.
90. Ness, RF., “Landscape Connectivity: Different Functions atDifferent Scales,” im Landscape Linkages and Biodiversity,W.E. Hudson (cd.) (WaahingtoU DC: Island Press 1991), pp.27-39.
91. Parsons, D., “Plannin g for Climate Change in National Parksand Other Natural Areas,” The Northwest EnvironmentalJournal, vol. 7, 1991, pp. 255-269.
92. PatterL D.X, “Defii the Oreater Yellowstone Ecosy~”in: The Greater Yellowstone Ecosystem, R.B. Keitcr and M.S.Boyce (eds.) (New Hav4 CI’: Yale University press 1991).
93. Peine, J., J. Burde, and W. Hammi4 “Threats to the NationalWildem=s Preservation Sys~” iru Wil&rness Benchmark1988: Proceedings of the National Wilderness Coll~”um,General ‘I&hnical Report SE-51, HR. Freilia (comp.)(Asheville, NC: U.S. Department of Agriculture, ForestWrv@ Southeastern Forest ExpdmeM Statioq 1989), pp.133-141.
94. Peters, RL., “The Effect of Global ~tiC Change onNatural Comrnunities,” im BiA”versz”ty, E.O. Wilson (cd.)(W@@@q DC: National Academy Press, 1988), pp. 450-464.
95. Peters, RL., “ConservationofBiologicdDiversity intheFaceof Climate Change,“ iru Global Wm”ng and BiologicalDiversity, R.L. Peters and T E. Lovejoy (eds.) (New Hav~CT: Yale University Press, 1992), pp. 15-30.
%. Peters, R.L., and J.D.S. Darling, “The Greenhouse Effect andNature Reserves,” Bioscience, vol. 35, No, 11, December1985, pp. 707-717.
97. Petera, R.L., and T.E. hwejoy (eds.), Global Warming andBiological Diversity (New Hav~ CT: Yale University Press,1992).
98. Petersoq D.L., A. Woodward, and R.DHamrner, “GlobalEnvironmental Change in Mountain Protected Areas: Cons&quenees for hfanagement” iru Proceedings of the Workshopon Protected Areas in Mountain Environments, S. Fhller (cd.)(Volcano, HI: East-West Center, in press).
99. Pinelands Commiss io~ “U.S. Interior Secretary praises Pine-lands ~“ The Pine/an&r, vol. 9, No. 2, 1989, p. 1.
100. Pineland Review Committee, Plannz”ng and Management ofthe New Jersey PineZands (lkntom NJ: Pinelands Reviewcommittee, 1979).
Chapter 5-Preserves: Federally Protected Natural Areas I 295
101. President’s Commission on Americans Outdoors, AmericanOutdbors: The Legacy, The Challenge (WashingtorL DC:Island Press, 1987).
102. Reed, P.C., “The National Wilderness Preservation System:The First 23 Years and Beyond,” in: Wilderness Benchmark1988: Proceedings of the National Wilderness Colloquium,General lkchnical Report SB51 (Asheville, NC: USDAForest Service, Southeastern Experiment Statio% January1989), pp. 2-20.
103. Reffa14 W. C., “United States Listing for Endangered Species:Chronicles of Extinction?” Enabngered Species UPDATE,vol. 5, No. 10, 1988, pp. 10-13.
104. Salwasser, H., “Roles and Approaches of the USDA ForestSewice,” irx Landrcape Linkages and Biodiversity, W.E.Hudson (cd.) (Washington, DC: Island Press, 1991), pp. 54-65.
105. Saunders, D.A., R.J. Hobbs, and C.R. Margules, “BiologicalConsequences of Ecosystem Fragmentation: A Review, ”Conservation Biology, vol. 5, No. 1, March 1991, pp. 18-32.
106. Schneider, K., “U.S. to Speed up Saving of Species,” NewYork Times, Dec. 16, 1992, p. Al.
107. ScoK M.J., B. Csuti, and S. Caicco, “Gap Analysis: AssessingProtection Needs,” in: Latalreape Linkages and Biodiversity(Washingto~ DC: Island fiW, 1991), pp. 15-26.
108. Sco~ MJ., et al., “Beyond Endangered Species: An inte-grated Strategy for the Preservation of Biological Diversity, ”Endangered Species Update, vol. 5, No. 10, August 1988, pp.43-48.
109. Scow MJ., et al., ‘‘Gap Analysis: A Geographic Approach toProtection of Biological Diversity, ” Wildll~e Monographs, asupplement to the Journal of Wildlife Management, vol. 57,No. 123, January 1993.
110. Shelby, B., T.C. Brow and J.G. Taylor, Streamflow andRecreation, General ‘Ikchnical Report RM 2D209 (Fort Col-lins, CO: USDA Forest Semice, Rocky Mountain Forest andRange Experiment StatioW March 1992).
111. Soule, Ml!., ‘‘Theory and Strategy, “ in: Landscape Linkagesand Biodiversity, W.E. Hudson (cd.) (Washingto% DC: IslandPress 1991), pp. 91-104.
112. Soule, M.E., and D.S. Simberloff, “What Do Genetics andEcology ‘IM1 Us About the Design of Nature Reserves?”Bioiogicai Conservation, vol. 35, 1986, pp. 19-40.
113. Stankey, G.H., et al., The Limts of Acceptable Change (LAC)System for Wil&rness Planning, Genend lkchnical ReportINT-176 (Ogdem UT: USDA Forest Service, IntermountainForest and Range Experiment Statio% January 1985).
114. Stapletoz R. M., “On the Western Fron4° National Parks,vol. 67, Nos. 1-2, Januarymebm.my 1993, pp. 32-36.
115. Stohlgre~ T., et al., “National Park Biotic InventoriesAssessed,” Park Science, vol. 11, No. 4, Fall 1991, pp. 1617.
1 1 6 . Swe- TW., et al., “ Maximum Fire Frequency andSynchrony in Giant Sequoia Groves During Medieval Perio&”paper presented at the Workshop on the Medieval WarmPeriod, NOV. 68, 1991, ~CSO~ /%.
117. ~ ~ R-Reseamhandhalysis (TERRA )Laboratory, Memorandum of Understanding among U.S.Department of Agriculture, Agricultural Reseamh Service,Forest Service, Soil Conservation Service, and the U.S.Department of the Interior, U.S. Geological Survey, Regarding
the Establishment of a Cooperative Interagency lkrrestrialEcosystems Regional Research and Analysis (TERRA) Labo-ratory, Signed Aug. 28, 1992, by each agency head.
118. The Nature Conservancy, ‘“Ilming on the ‘I@ at Stil.lwater,’Nature Conservancy, vol. 40, July/August 1990, pp. 28-29.
119, The Nature Conservancy, Facts: Background Information(Arlington, VA: The Nature Conservancy, 1992).
120. Thomto% R.D., “Searching for Consensus and PIU!iCtitit’y:
Habitat Conservation Planrdng Under the Endangered SpeciesAct of 1973, ” Environmental Law, vol. 21, No. 3, 1991, pp.605-656.
121. Tracy, C.R., “Ecological Responses of .Ammals to climate, ”in: Global Warming and Biological Diversity, R.L. Peters andT. E. Imvejoy (eds.) (New Havem CT: Yale University Press1992), pp. 171-179.
122. U. S. Congress, CongressionalResearchSexvice(CRS) ,GreaterYellowstone Ecosystem: An Analysis of Data Submitted byFederal and State Agencies (Washingto% DC: Govemm entPrinting ~lce, December 1986). ~eproduced by the Libraryof Congress, CRS, June 25, 1987.]
123. U.S. Congress, Congressional Research Service (CRS), Wil-a%rness Areas and Federal Water Rights (Washington DC:CRS, Jan. 4, 1989).
124. U.S. Congress, Congressional Research Service (CRS), LandPurchases and Acquisitions of Four Federal Land iUanage-ment Agencies, prepared by B.A. Cody, Environment andNatural Resources Policy Division (WashingtorL DC: CRS,1991).
125. U.S. Congress, Congressional Research Service (CRS), TheMajor Federal Land Management Agencies of Our Nation’sLundandResources, prepared by A. Bachiel, Environment andNatural Resows Policy Division (Washington DC: CRS,Feb. 8, 1993).
126. U.S. Congress, Office of ‘Ikdmology Assessment Technolo-gies to Maintain Biological Diversity, OTA-F-30 (Washing-ton DC: U.S. Government Printing Office, March 1987).
127. U.S. Congress, Offke of Technology Assessment ForestService PIanning: Accornmo&ting Uses, Producing Outputs,and Sustaining Ecosystems, OZA-F-505 (Washington DC:Government Printing ~lce, February 1992).
128, U.S. Congress, GIXce of ‘lkchndogy Assessment HarmfulNon-Indigenous Species in the United States (Washington+DC: Government Printing Office, in press).
129, U.S. Department of Agriculture (USDA), Forest Service,Forest Service Manual, Title 2300, RecreatiO~ Wilderness,and Related Resource Management, Chapter 2320, WildernessManagermmt (WashingtorL DC: USDA, Forest Service, April1986).
130. U.S. Department of Agriculture (USDA), Forest Service, AnAnalysis of the Wildl#e andFish Situation in the UnitedStates:1989-2040, a technical docum ent SUppOltiIlg the 1989 USDAForest Service AssmmenL General ‘Rdmical Report RM-178, prepared by C.H. Glather and T W. Hoekstra (FortCollins, CO: Rocky Mountain Forest and Range ExperimentStatioq September 1989).
131. U.S. Department of Agriculture (USDA), Forest Semicc, AnAnalysis of the Outdoor Recreation and Wilderness Situationin the United States: 1989-2040, a technical document
296 I Preparing for an Uncertain Climate-Volume 2
132.
133.
134.
135.
136.
137.
138.
139.
140.
141.
142.
143.
144.
145.
146.
147.
supporting the 1989 USDA Forest Service RPA Assessmen4General ‘fkchnical Report RM-189, prep- by H.K, CordeUJ.C. Bergstrom, L.A. H~ and D.BIL English April1990.
U.S. Department of Agriculture, Forest Service, Forest ffea2thMow”tort”ng in New England: 1990 Annual Report.
U.S. Department of Agriculture, Forest Service, Blue Moun-tains Forest Health Report: New Perspectives in ForestHealth, Pacific Northwest Regional Office, April 1991.
U.S. Department of Agriculture, Forest Service, Forest ServiceGlobal Change Research Program: Program Plan U+te,October 1992.
U.S. Department of Agriculture, Forest Service, Report of theForest Service: Fiscal Year 1992 (WSShingtoxq DC: U.S.Government printing Office, 1993),U.S. Department of Agriculture and U. S. Department of theInterior, Final Report on Fire Management Policy, preparedlythe Fire Management Policy Review lkaIw May 5, 1989.
U.S. Department of the Interior, “The U.S. Department of theInterior Global Change ResearchPro~ working documen~spring 1992.
Us. Department of the Interior (USDOI), Bureau of LandManagement (13LM), Annual Report of Accomplishments FY1992: Fish and Wildl~e 2000, Riparian-Wetland Im”tiativeforthe 1990’s (TVashir@oU DC: USDOI, Bw 1993).
U.S. Department of the Interior, Bureau of Land lvfanagemen~Manual Transmittal Sheeg Section 8560, Management ofDeS@llf@f Wilderness Areas, Apti 1983.
Us. Departmen t of the Interior, Bureau of Land ManagementFish and Wildl~e 2000: AnnuafReportofAccomplishmentsFY1991 (washin@m DC: Governme nt Printing Offke, 1991).
U.S. Department of the interior, Bureau of Outdoor Recrw-tiow New Jersey Pine Barrens: Concepts for Preservation(Washingtorq DC: USDOI Bureau of Outdoor Recreation1976).
U.S. Department of the Interior (7JSDOI), Bureau of Reclama-tion Mid-pacific RegiorL Report on Refuge Water SupplyInvestigations (Washingto% DC: USDOI, Bureau of Reclama-tion March 1989).U.S. Department of the Interior (USDOI), Fish and Wildlife!%avice Rejhge Manual, 7 RM 14 Pest Control (Washingto~DC: USDOI, Fish and Wildlife Service, March 1982).
U.S. Department of the Interior (USDOI), Fish and WildlifeService, R@ge Manual, 6 RM 1-9 Habitat Management(Waahingtom DC: USDOI, Fish and Wildlife Service, May1986).
Us. Department of Interior, Fish and Wildlife Service, Reportto the Director: A Review of Second@ Wses Occum”ng onNational Wd.&e Rejbges, submitted by the Compatibility‘fhsk Group, June 1990.U.S. Department of the Interior, Fish and Wildlife Service,En&ngeredandThreatened Species Recovery Progmm (Msh-ingtoq DC: Government Printing Office, December 1990).
U.S. Department of the Interior, Fkh and Wildlife Service,R@ges 200U Plan for the Future of the National WildlfeRefhge System, Issue 2, March 1991.
148. U.S. Department of the Interior (USDOI), Fish and WildlifeService (TWS), Vision For the Future (Was@toU DC:USDOI, FWS, 1991).
149. U.S. Department of the Interior (DOX_), Fish and Wildlife
150.
151.
152.
153.
154.
155.
156.
157.
158.
159,
160.
161.
162.
163.
Service (IT/S), Annual Report of Lands Under Control of theU. S. Fish and Wildlife Servi”ce as of September 30, 1992(Wash@to% DC: DOI, FWS, 1992).U.S. Department of Interior, Fish and Wildlife Semicc,Application Manual for the LatdAcquisition Pn”on’ty System,Version 5.0, July 1992.U.S. Department of the Interior, Fkh and Wildlife Service,Rejhgees 200- Plan for the Future of the National Wifdli$eRejhge System, draft environmenttd impact stateme@ Issue 5,January 1993.U.S. Department of the I.ntedor, Fish and Wildlife Service, andU.S. Department of Commerce, Bureau of the Census, J991National Survey of Fish”ng, Hum”ng, and Wildfife-AssociatedRecreation (TVasMngtoIL DC: U.S. Government PrintingOffice, 1993).U.S. Department of the Interior (USDOI’), National ParkService (NPS), Management Policies (WasldngtmL DC:USDOI, NPS, December 1988).U.S. Department of the Interior (USDOl), National ParkService (NP!I), Natural Resources Assessment and ActionProgram (Washin@oq DC: USDOI, NPS, March 1988).U.S. Department of the Interior (USDOI), National ParkSesvice @PS), Wiidland Fire Management Guideline, NPS18, release no. 3, Appendix A (WashingtoXL DC: USDOI, NPS,June 1990) .U.S. Department of the Interior (USDOI), National ParkService (NPS), J991 Annual Abstract (Denver, CO: USDOI,NPS, Soci&Ecmnornic Studies Divisioq 1991).U.S. Department of the Interior (USDOI), National ParkStice ~), The National Parks: Shaping the System(W-Q DC: USDOI, NPS, 1991).
U.S. Department of the Interior (USDOI), National ParkService (NPS), Nm”onal Parks for the 21st Century: The ViiAgenda, report to the National Park Scmice by the SteuingCommittee of the 75th Anniversary Symposi~ NPS Docu-ment D-726 (Washington DC: USDO~ NPS, 1992).U.S. Departrmmt of the Interior, National Park Sewicc, Threatsto the National Wilderness Preservation System: The Manage-rial Response, ‘Rchnical Session Handbook A.C. Schmiemr,comp,, Apti 1992.U.S. Department of the Interior, National Park Service, andU.S. Department of Agriculture, The Greater YellowstoneArea: An Aggregation of National Park and Nattonal ForestService Management Plans (Washington DC: US. Govern-ment Print@ office, 1987).US. Environmental Protection Agency, The Potential E#ectsof Globr.d Climate change on the United States, EPA-230-05-89-050, JB. smithandD. Tirpak(eds.)(w “aahmgbqxx:u.s.Environmental Protection Agency, Dwcmber 1989).U.S. Environmental Protection Agency @PA), Office ofRescarchand Developme@ EM24P Monitor, EPA 6CtOO/M-91-051 @hShhl@OQ DC: U.S. EPA August 1992).U.S. Congress, General Accounting office (GAO), NationalWildlife R@ges: Continuing Problems with Incompatible
.
Chapter 5-Preserves: Federally Protected Natural Areas I 297
Uses Call for Bold Action, GAOIRCED-89-1% (WashingtonDC: U.S. GAO, September 1989).
164. U.S. Congress, General Acmunting Office (GAO), Wi2&rnessPreservation: Problems in Some National Forests ShouJd BeA&iressed, GAO/RCED-89-202 (WashingtorL DC: U.S. GAO,September 1989).
165. U.S. Congress, General Accounting Office (GAO), FederalFire Management: Linu”ted Progress in Restarting the Pre-scribed Fire Program, GAO/RCED-91=12 (Washington DC:U.S. GAO, Decembex 1990).
166. U.S. Environmental Protection Agency (EPA); U.S. Depart-ment of Commerce, National Oceanic and AtmosphericAdrninistratiorY U.S. Department of Agricuhure (USDA),Forest Service and Agricultural Research Service; U.S. Depart-ment of the Interior, Fish and Wildlife Service, Monitoring theCondition of Our Nation’s Ecological Resources, EPAJ600fM-90/011 (wMhingtoq DC: EPA July 1990).
167. Mrley, J.D., and P. Schullery, “Reality and Opportunity in theYellowstone Fires of 1988, ” in: The Greater YellowstoneEcosystem, R.B. Keiter and M.S. Boyce (eds.) (New Have~CT: Yale University Press, 1991).
1 6 8 . V i e _ S . D . , “State Wildlife Protection Efforts: TheNongarne Progmms, “ irx In De$ense of Wildlife: Preservz”ngc o~“ties and Corridors (Washington DC: Defenders ofWildlife, 1989), pp. 67-%.
169. Vie_ S.D., paper prewmtedathhnagmg“ Western Landsina Chan@ng Climate, an OTA-sponsored workshop held July1992, National Center for Atmospheric Research Boulder,c o .
170. Wailer, D.M., “ConservingBiodiversity: alhified ApproaclLIntroductioxL” im Landscape L“nkages andBiti”versity, W.E.Hudson (cd.) (%hhin@om DC: Island Ress, 1991), pp. 3-15,
171. Water Resource Research Institute, “The Rio Grande BaaimGlobal Climate Change Scenarios,’ WURl Report, No. M24,1991.
172, Webb, ‘E, Ill, “Past Changes in Vegetation and Climate:Lessons for the Puture,” irx Global Warming and Biological
- Divers@, RL. Peters and T E. Imvejoy (eds.) (New HavmCT: Yale University Press 1992), pp. 59-75.
173. West AJ., Deputy Chief, Forest Service, U. S. De@mentofAgriculture, testimony before the Subcommittee on Energyand Natural Resources, House Committee on GovernrmmtOperations, May 24,1990, pp. 2147,
174, Wilcove, D. S., National Forests: Policies for the Future,Volume 2: Protecting Biological Diversity (Washingto% DC:The Wilderness Society, 1988).
175, Wilcove, DA,, M. McMilltuL and K.C. WinstotU “ W h a tExactly is an Endangered Species? An Analysis of the U.S.Endangered Species List: 1985-1991,” Conservation Biology,VO1. 7, NO. 1, March 1993, pp. 87-93.
176. World Resources Institute (WRI), The World ConservationUnion (IUCN), and United Nations Environment Prograrnme(UNEP), Global Biodiversity Strategy: Policy-Makers’ Guide(Baltimore, MD: WIU Publications, 1992).
177. WrighL G.R., Wildlife Research and Management in theNational Parks (Chicago, IL: University of Illinois press,1992).
178. Zinzer, CL, The Econonu”c Impact of the Adirondack ParkPrivate Land Use and Development Plan (Albany, NY: StateUniversity of New York Press, 1980), 319 pp.
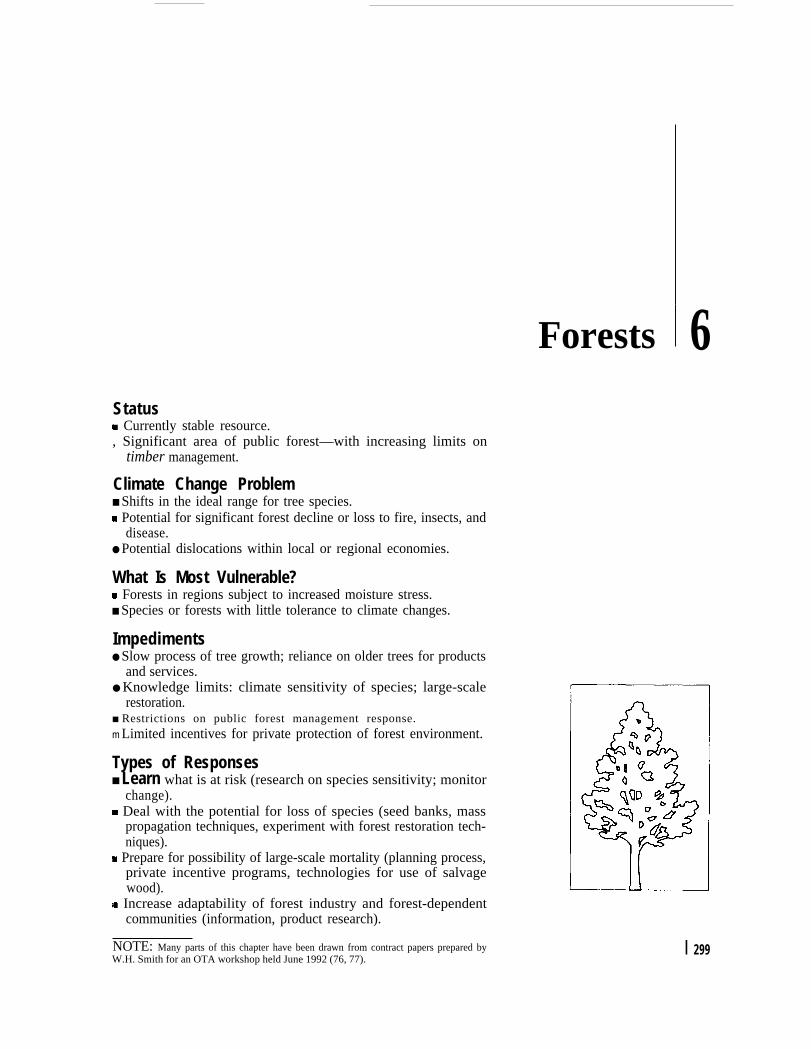
Forests 6Status- Currently stable resource., Significant area of public forest—with increasing limits on
timber management.
Climate Change Problem■ Shifts in the ideal range for tree species.m Potential for significant forest decline or loss to fire, insects, and
disease.● Potential dislocations within local or regional economies.
What Is Most Vulnerable?~ Forests in regions subject to increased moisture stress.■ Species or forests with little tolerance to climate changes.
Impediments● Slow process of tree growth; reliance on older trees for products
and services.● Knowledge limits: climate sensitivity of species; large-scale
restoration.■ Restrictions on public forest management response.m Limited incentives for private protection of forest environment.
Types of Responses■ Learn what is at risk (research on species sensitivity; monitor
change).~ Deal with the potential for loss of species (seed banks, mass
propagation techniques, experiment with forest restoration tech-niques).
m Prepare for possibility of large-scale mortality (planning process,private incentive programs, technologies for use of salvagewood).
1- Increase adaptability of forest industry and forest-dependentcommunities (information, product research).
NOTE: Many parts of this chapter have been drawn from contract papers prepared byW.H. Smith for an OTA workshop held June 1992 (76, 77).
I 299
300 I Preparing for an Uncertain Climate-Volume 2
OVERVIEW
Forests cover roughly one-third of the U.S.land area shape much of the natural environment,and provide the basis for a substantial forest-products industry. Forest management has alwaysbeen a challenging endeavor due to the long-livednature of forests, the varied random events thatperturb them, and an incomplete understanding offorest development and structure.
Considerable uncertainty is associated withpredictions of climate change and its effects onforests. However, global warming could shift theideal range for some North American forestspecies as much as 300 miles (500 kilometers) l tothe north. Such a shift would almost certainlyexceed the ability of the natural forest to migrate(34, 35, 56, 75). Forests stranded outside theirideal climatic range could suffer from periods ofdeclining growth and increased mortality fromclimate-related stresses such as insects, disease,and fires. Some forest systems may collapse, andspecies or unique populations may be lost fromisolated ranges. Although mortality and the de-cline of a forest ecosystem can occur quiterapidly, the regrowth of a productive forest maytake many decades or even centuries. A naturalforest system will not necessarily regrow quicklyinto similar or equally valuable forest cover.
Both the lifetime of trees and the timescale forclimate change are multi-decadal. Therefore,most trees living today could beat some risk fromclimate change. The most vulnerable forests maybe those in regions already subject to moisturestress, as in the dry continental interior. Forests incoastal regions of the Southeast may be at riskfrom rising sea levels and damaging wind storms,leading to flooding and saltwater intrusion. For-ests with small or highly fragmented ranges maybe lost, perhaps including those at the upperelevations of mountains, which have nowhere tomigrate.
Of course, not every change in the forest resultsin an economic or aesthetic loss or is reason forpublic concern. Forests have always changedover time and will continue to do so with orwithout climate change. The significance of anychange differs across forest types, determined bythe nature of ownership, the values for which theforest is managed, the magnitude of change, andthe rate at which change occurs. Some decline ingrowth rates or moderate increases in tree mortal-ity may be acceptable on wilderness lands; thesame decline would be of great consequence onindustry timberland. For many users of the frostand industries dependent on the forest resource, itis the rate at which change occurs that will mattermost. For example, if climate change occursgradually, the forest-products industry mightadjust with little cost, eventually focusing onmore suitable locations or adopting technologiesthat make best use of available wood supplies.
If climate changes quickly, impacts could bequite different. The potential for widespreadmortality or extinction of some forest species is ofgeneral concern. Substantial forest decline--withlosses in species, uniquely valued forest stands, orentire ecosystems--would put at risk much of thesocial and environmental value that the Nation’sforests now provide. Rapid and unanticipatedchanges in the forest could lead to extensive localand regional impacts, including:
■ losses in species, uniquely valued foreststands, or entire ecosystems;
■ widespread catastrophic damage from fires,insects, or disease; and
■ extensive dislocations within local or re-gional economies.
The threat of these potential impacts appears to bethe primary justification for public action inpreparation for the uncertainties of climatechange.
The challenge of these threats to managers ofthe forest resource is the limited extent to which
1 lb convert miles to kilometers, multiply by 1.609.
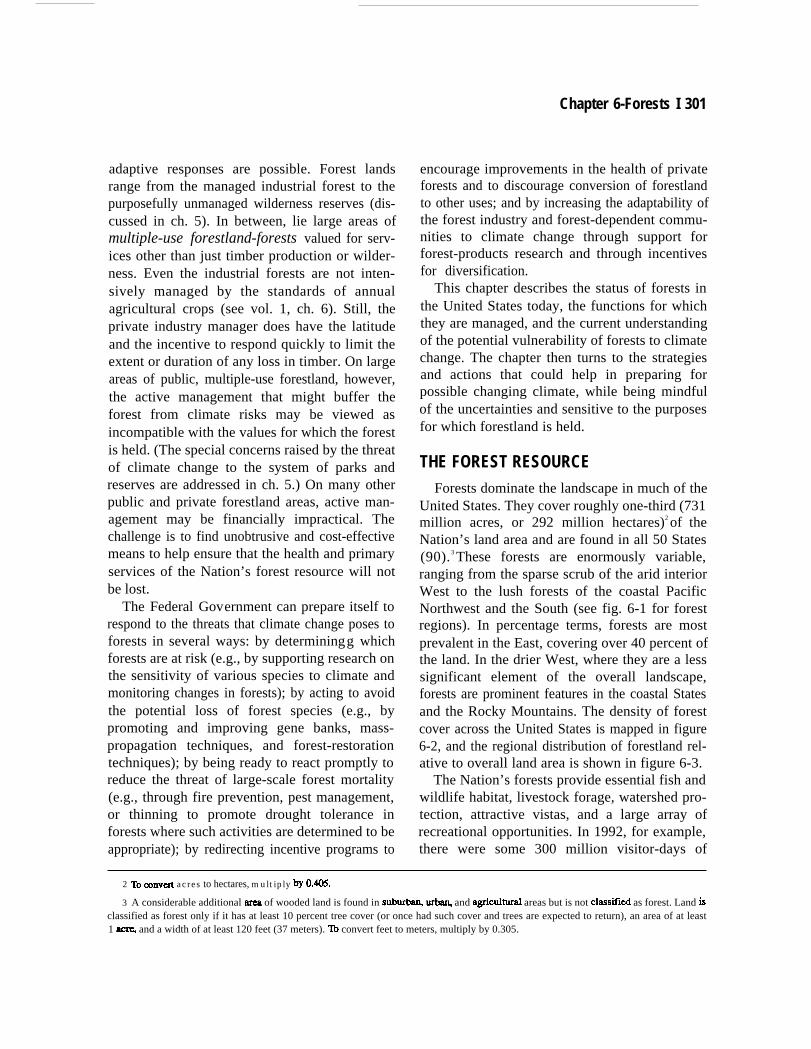
Chapter 6-Forests I 301
adaptive responses are possible. Forest landsrange from the managed industrial forest to thepurposefully unmanaged wilderness reserves (dis-cussed in ch. 5). In between, lie large areas ofmultiple-use forestland-forests valued for serv-ices other than just timber production or wilder-ness. Even the industrial forests are not inten-sively managed by the standards of annualagricultural crops (see vol. 1, ch. 6). Still, theprivate industry manager does have the latitudeand the incentive to respond quickly to limit theextent or duration of any loss in timber. On largeareas of public, multiple-use forestland, however,the active management that might buffer theforest from climate risks may be viewed asincompatible with the values for which the forestis held. (The special concerns raised by the threatof climate change to the system of parks andreserves are addressed in ch. 5.) On many otherpublic and private forestland areas, active man-agement may be financially impractical. Thechallenge is to find unobtrusive and cost-effectivemeans to help ensure that the health and primaryservices of the Nation’s forest resource will notbe lost.
The Federal Government can prepare itself torespond to the threats that climate change poses toforests in several ways: by determiningg whichforests are at risk (e.g., by supporting research onthe sensitivity of various species to climate andmonitoring changes in forests); by acting to avoidthe potential loss of forest species (e.g., bypromoting and improving gene banks, mass-propagation techniques, and forest-restorationtechniques); by being ready to react promptly toreduce the threat of large-scale forest mortality(e.g., through fire prevention, pest management,or thinning to promote drought tolerance inforests where such activities are determined to beappropriate); by redirecting incentive programs to
encourage improvements in the health of privateforests and to discourage conversion of forestlandto other uses; and by increasing the adaptability ofthe forest industry and forest-dependent commu-nities to climate change through support forforest-products research and through incentivesfor diversification.
This chapter describes the status of forests inthe United States today, the functions for whichthey are managed, and the current understandingof the potential vulnerability of forests to climatechange. The chapter then turns to the strategiesand actions that could help in preparing forpossible changing climate, while being mindfulof the uncertainties and sensitive to the purposesfor which forestland is held.
THE FOREST RESOURCEForests dominate the landscape in much of the
United States. They cover roughly one-third (731million acres, or 292 million hectares)2 of theNation’s land area and are found in all 50 States(90).3 These forests are enormously variable,ranging from the sparse scrub of the arid interiorWest to the lush forests of the coastal PacificNorthwest and the South (see fig. 6-1 for forestregions). In percentage terms, forests are mostprevalent in the East, covering over 40 percent ofthe land. In the drier West, where they are a lesssignificant element of the overall landscape,forests are prominent features in the coastal Statesand the Rocky Mountains. The density of forestcover across the United States is mapped in figure6-2, and the regional distribution of forestland rel-ative to overall land area is shown in figure 6-3.
The Nation’s forests provide essential fish andwildlife habitat, livestock forage, watershed pro-tection, attractive vistas, and a large array ofrecreational opportunities. In 1992, for example,there were some 300 million visitor-days of
2 lb cOnwt acres to hectares, multiply by O.a.
3 A considerable additional arm of wooded land is found in au- urbaq and agricuhura.1 areas but is not classifkd as forest. Land isclassified as forest only if it has at least 10 percent tree cover (or once had such cover and trees are expected to return), an area of at least1 acrG and a width of at least 120 feet (37 meters). ‘Ib convert feet to meters, multiply by 0.305.
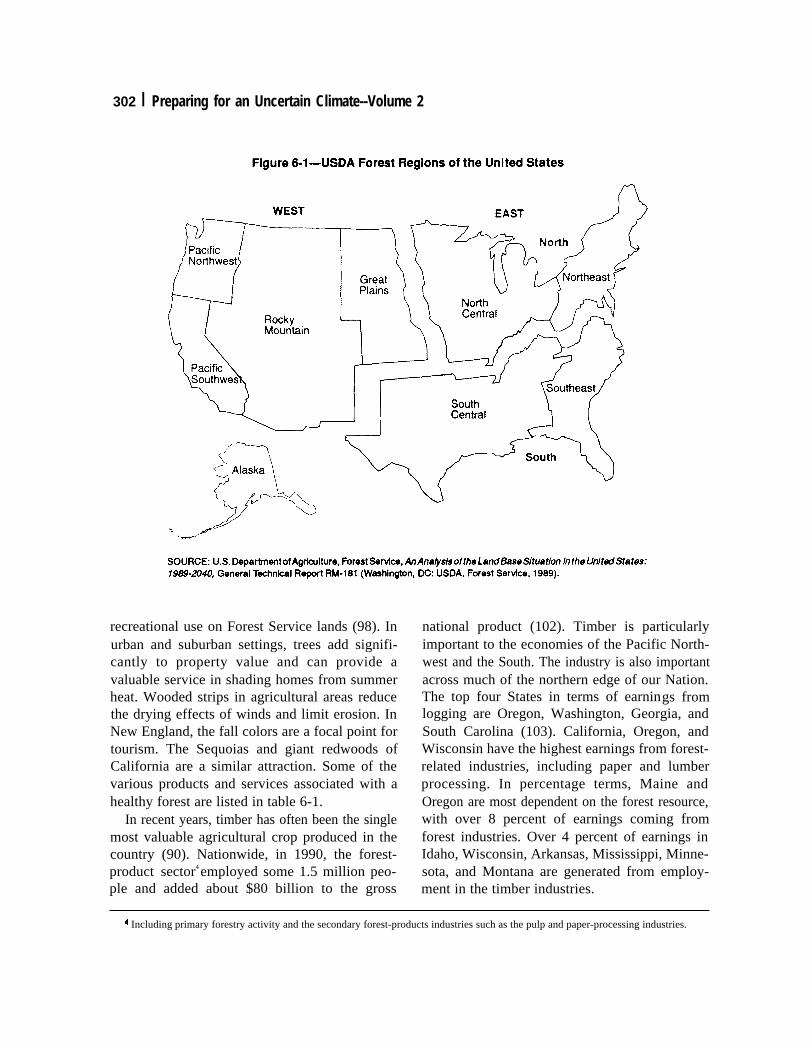
302 I Preparing for an Uncertain Climate--Volume 2
recreational use on Forest Service lands (98). Inurban and suburban settings, trees add signifi-cantly to property value and can provide avaluable service in shading homes from summerheat. Wooded strips in agricultural areas reducethe drying effects of winds and limit erosion. InNew England, the fall colors are a focal point fortourism. The Sequoias and giant redwoods ofCalifornia are a similar attraction. Some of thevarious products and services associated with ahealthy forest are listed in table 6-1.
In recent years, timber has often been the singlemost valuable agricultural crop produced in thecountry (90). Nationwide, in 1990, the forest-product sector4 employed some 1.5 million peo-ple and added about $80 billion to the gross
national product (102). Timber is particularlyimportant to the economies of the Pacific North-west and the South. The industry is also importantacross much of the northern edge of our Nation.The top four States in terms of earnings fromlogging are Oregon, Washington, Georgia, andSouth Carolina (103). California, Oregon, andWisconsin have the highest earnings from forest-related industries, including paper and lumberprocessing. In percentage terms, Maine andOregon are most dependent on the forest resource,with over 8 percent of earnings coming fromforest industries. Over 4 percent of earnings inIdaho, Wisconsin, Arkansas, Mississippi, Minne-sota, and Montana are generated from employ-ment in the timber industries.
4 Including primary forestry activity and the secondary forest-products industries such as the pulp and paper-processing industries.
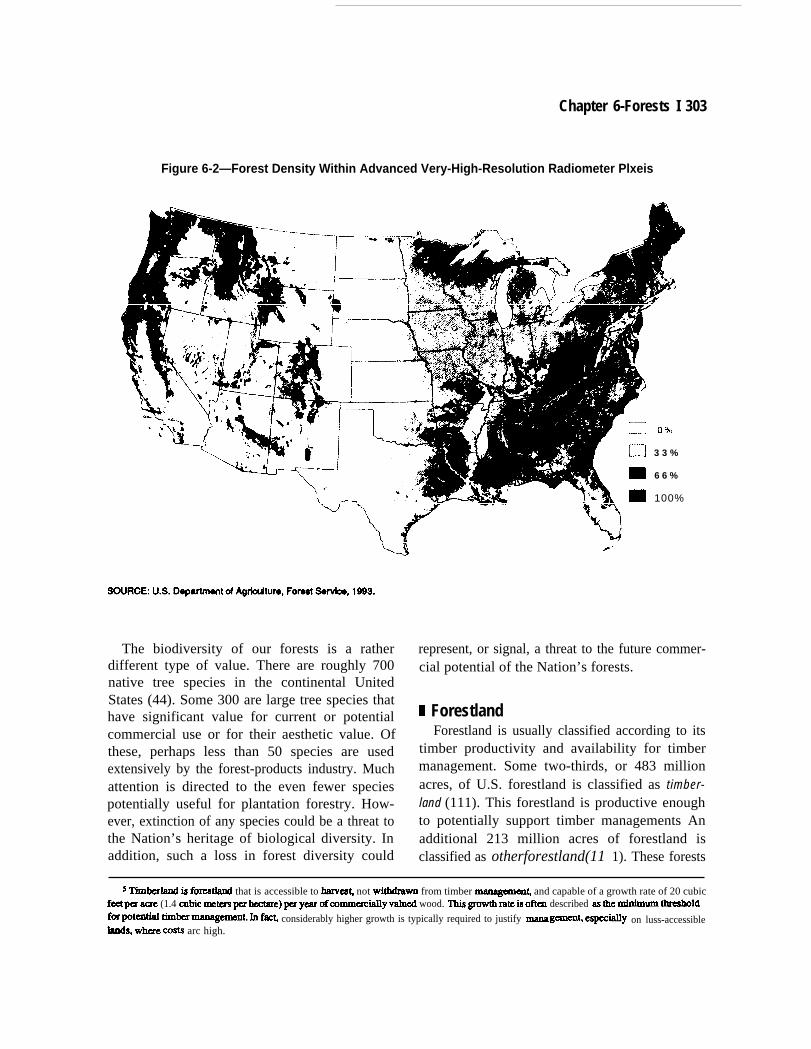
Chapter 6-Forests I 303
Figure 6-2—Forest Density Within Advanced Very-High-Resolution Radiometer Plxeis
E3 0%
n 3 3 %
m 6 6 %
m 100%
The biodiversity of our forests is a ratherdifferent type of value. There are roughly 700native tree species in the continental UnitedStates (44). Some 300 are large tree species thathave significant value for current or potentialcommercial use or for their aesthetic value. Ofthese, perhaps less than 50 species are usedextensively by the forest-products industry. Muchattention is directed to the even fewer speciespotentially useful for plantation forestry. How-ever, extinction of any species could be a threat tothe Nation’s heritage of biological diversity. Inaddition, such a loss in forest diversity could
represent, or signal, a threat to the future commer-cial potential of the Nation’s forests.
1 ForestlandForestland is usually classified according to its
timber productivity and availability for timbermanagement. Some two-thirds, or 483 millionacres, of U.S. forestland is classified as timber-land (111). This forestland is productive enoughto potentially support timber managements Anadditional 213 million acres of forestland isclassified as otherforestland(11 1). These forests
s ‘rimbdand h forcsuand that is accessible to Iuirvcsc not witldmwn from timber managcmc@ and capable of a growth rate of 20 cubicf~pcr ~ (1.4 CUbiC meters pcrhcctarc) per y= Of~lnfn~~yVllhX!d wood. This growth rate is OfkJl described W the mirdrnulll thrcabldforpotcntial tirnbcrrnanap. ~ f- considerably higher growth is typically required to justify rnanahnds, where ~StS arc high.
- especially on luss-accessible
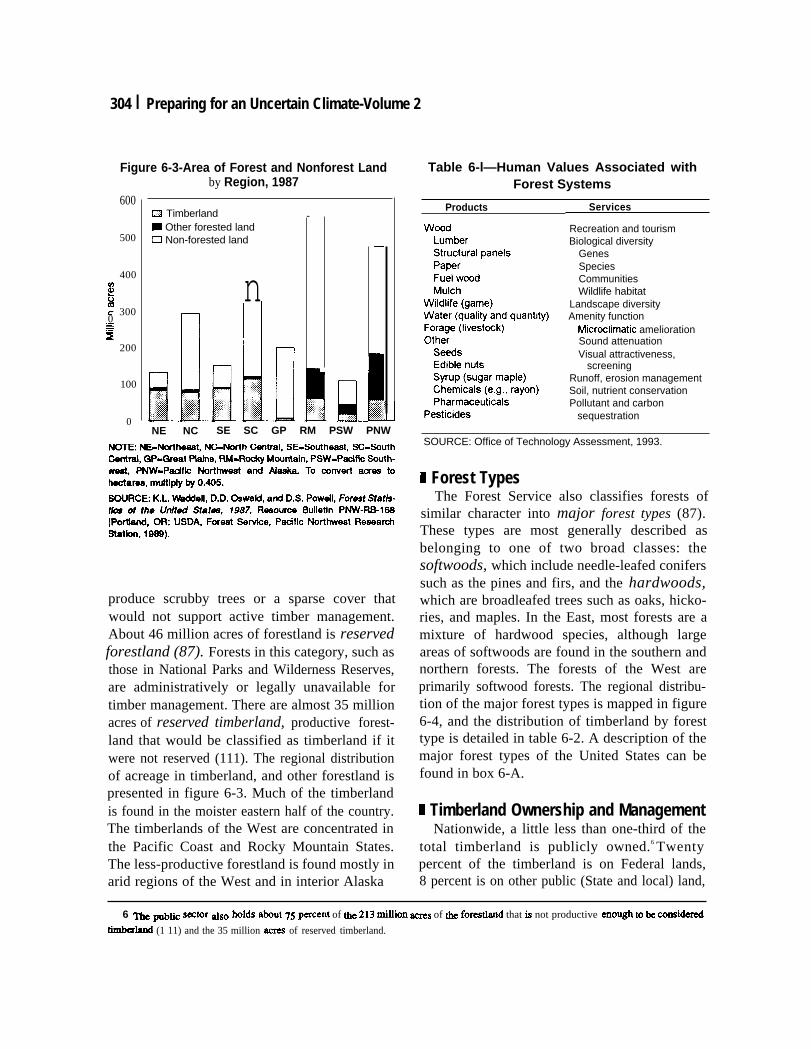
304 I Preparing for an Uncertain Climate-Volume 2
Figure 6-3-Area of Forest and Nonforest Land
600
500
400;%c 3000.-=s
200
100
0
by Region, 1987
C2 Timberland -- Other forested landu Non-forested land
n—
NE NC SE SC GP RM PSW PNW
produce scrubby trees or a sparse cover thatwould not support active timber management.About 46 million acres of forestland is reservedforestland (87). Forests in this category, such asthose in National Parks and Wilderness Reserves,are administratively or legally unavailable fortimber management. There are almost 35 millionacres of reserved timberland, productive forest-land that would be classified as timberland if itwere not reserved (111). The regional distributionof acreage in timberland, and other forestland ispresented in figure 6-3. Much of the timberlandis found in the moister eastern half of the country.The timberlands of the West are concentrated inthe Pacific Coast and Rocky Mountain States.The less-productive forestland is found mostly inarid regions of the West and in interior Alaska
Table 6-l—Human Values Associated withForest Systems
Products Services
Recreation and tourismBiological diversity
GenesSpeciesCommunitiesWildlife habitat
Landscape diversityAmenity function
Microciimatic ameliorationSound attenuationVisual attractiveness,
screeningRunoff, erosion managementSoil, nutrient conservationPollutant and carbon
sequestration
SOURCE: Office of Technology Assessment, 1993.
B Forest TypesThe Forest Service also classifies forests of
similar character into major forest types (87).These types are most generally described asbelonging to one of two broad classes: thesoftwoods, which include needle-leafed coniferssuch as the pines and firs, and the hardwoods,which are broadleafed trees such as oaks, hicko-ries, and maples. In the East, most forests are amixture of hardwood species, although largeareas of softwoods are found in the southern andnorthern forests. The forests of the West areprimarily softwood forests. The regional distribu-tion of the major forest types is mapped in figure6-4, and the distribution of timberland by foresttype is detailed in table 6-2. A description of themajor forest types of the United States can befound in box 6-A.
9 Timberland Ownership and ManagementNationwide, a little less than one-third of the
total timberland is publicly owned.6 Twentypercent of the timberland is on Federal lands,8 percent is on other public (State and local) land,
6 ~ ~bli~ ~~tor ~~o holds abut 75 p~ent of ~ 213 fiflion _ of ~ foresfland that is not productive enough to be ~tid~
dmbcxlsnd (1 11) and the 35 million acres of reserved timberland.
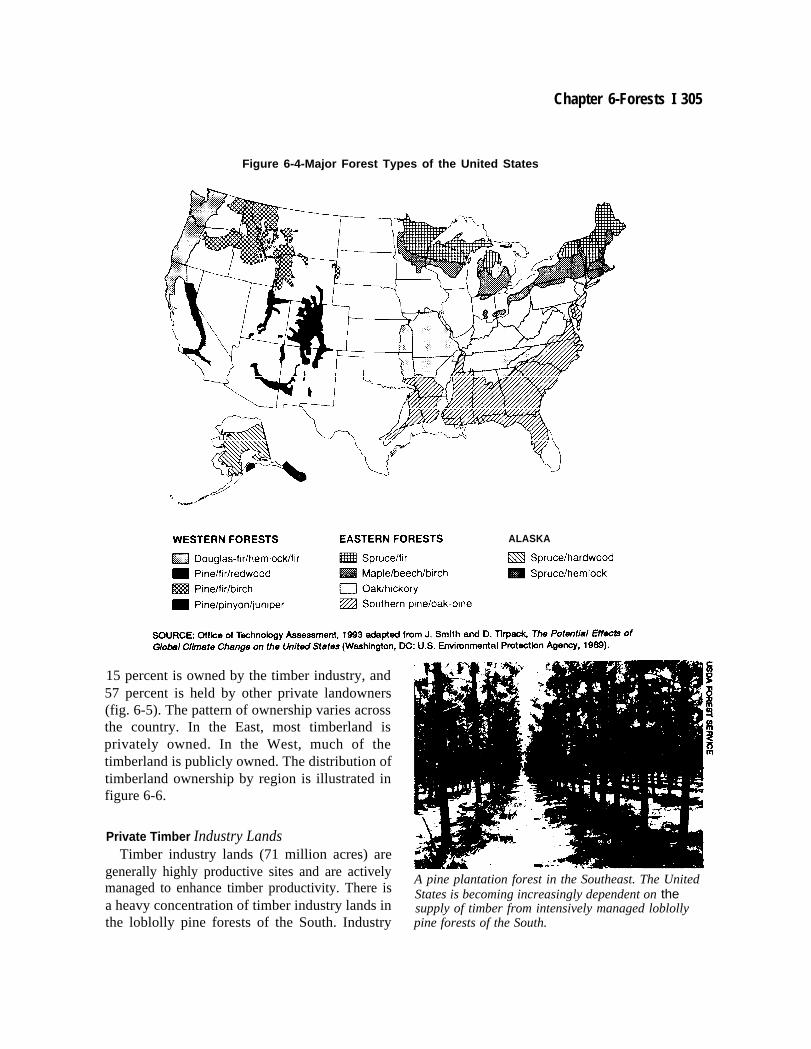
Chapter 6-Forests I 305
Figure 6-4-Major Forest Types of the United States
//-.,—’”
ALASKA
15 percent is owned by the timber industry, and57 percent is held by other private landowners(fig. 6-5). The pattern of ownership varies acrossthe country. In the East, most timberland isprivately owned. In the West, much of thetimberland is publicly owned. The distribution oftimberland ownership by region is illustrated infigure 6-6.
Private Timber Industry LandsTimber industry lands (71 million acres) are
generally highly productive sites and are activelymanaged to enhance timber productivity. There isa heavy concentration of timber industry lands inthe loblolly pine forests of the South. Industry
A pine plantation forest in the Southeast. The UnitedStates is becoming increasingly dependent on thesupply of timber from intensively managed loblollypine forests of the South.
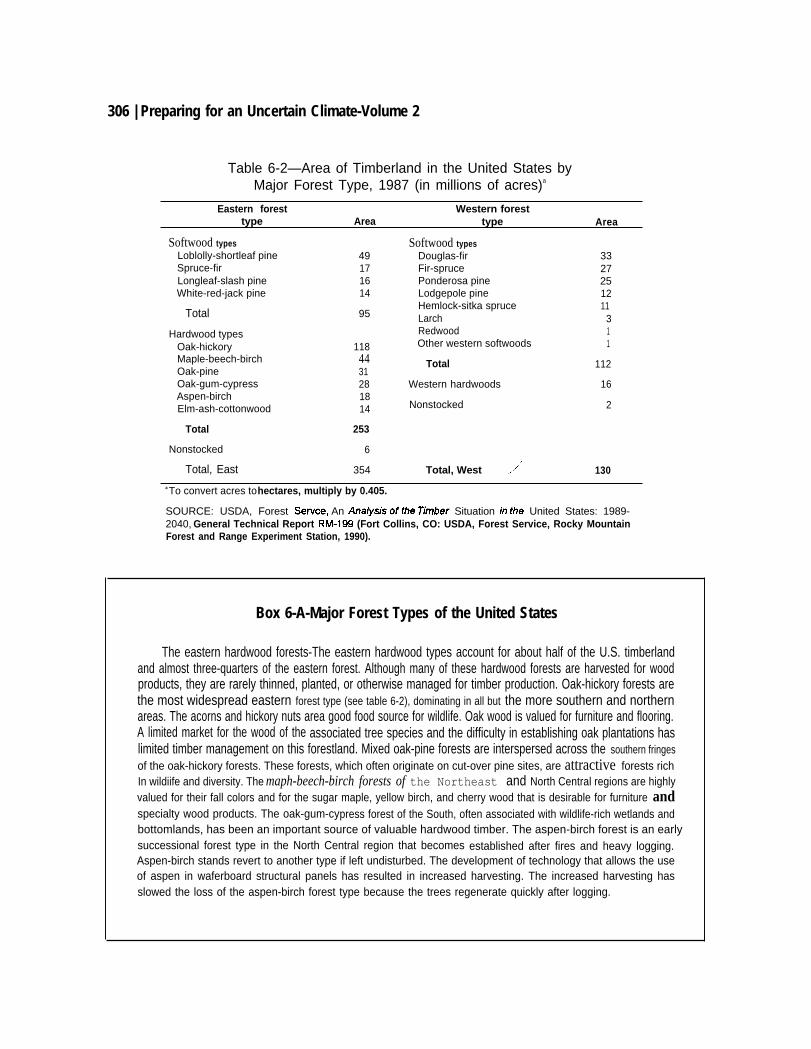
306 | Preparing for an Uncertain Climate-Volume 2
Table 6-2—Area of Timberland in the United States byMajor Forest Type, 1987 (in millions of acres)a
Eastern forest Western foresttype Area type Area
Softwood typesLoblolly-shortleaf pineSpruce-firLongleaf-slash pineWhite-red-jack pine
Total
Hardwood typesOak-hickoryMaple-beech-birchOak-pine
Softwood types49 Douglas-fir17 Fir-spruce16 Ponderosa pine14 Lodgepole pine
Hemlock-sitka spruce95 Larch
Redwood
118 Other western softwoods
4431
Total
3327251211
311
112
Oak-gum-cypress 28 Western hardwoods 16Aspen-birch 18Elm-ash-cottonwood 14 Nonstocked 2
Total 253
Nonstocked 6
Total, East 354 Total, West / 130a To convert acres to hectares, multiply by 0.405.
SOURCE: USDA, Forest Servce, An An8/ysis of the Timber Situation in the United States: 1989-2040, General Technical Report RM-199 (Fort Collins, CO: USDA, Forest Service, Rocky MountainForest and Range Experiment Station, 1990).
Box 6-A-Major Forest Types of the United States
The eastern hardwood forests-The eastern hardwood types account for about half of the U.S. timberlandand almost three-quarters of the eastern forest. Although many of these hardwood forests are harvested for woodproducts, they are rarely thinned, planted, or otherwise managed for timber production. Oak-hickory forests arethe most widespread eastern forest type (see table 6-2), dominating in all but the more southern and northernareas. The acorns and hickory nuts area good food source for wildlife. Oak wood is valued for furniture and flooring.A limited market for the wood of the associated tree species and the difficulty in establishing oak plantations haslimited timber management on this forestland. Mixed oak-pine forests are interspersed across the southern fringesof the oak-hickory forests. These forests, which often originate on cut-over pine sites, are attractive forests richIn wildiife and diversity. The maph-beech-birch forests of the Northeast and North Central regions are highlyvalued for their fall colors and for the sugar maple, yellow birch, and cherry wood that is desirable for furniture andspecialty wood products. The oak-gum-cypress forest of the South, often associated with wildlife-rich wetlands andbottomlands, has been an important source of valuable hardwood timber. The aspen-birch forest is an earlysuccessional forest type in the North Central region that becomes established after fires and heavy logging.Aspen-birch stands revert to another type if left undisturbed. The development of technology that allows the useof aspen in waferboard structural panels has resulted in increased harvesting. The increased harvesting hasslowed the loss of the aspen-birch forest type because the trees regenerate quickly after logging.
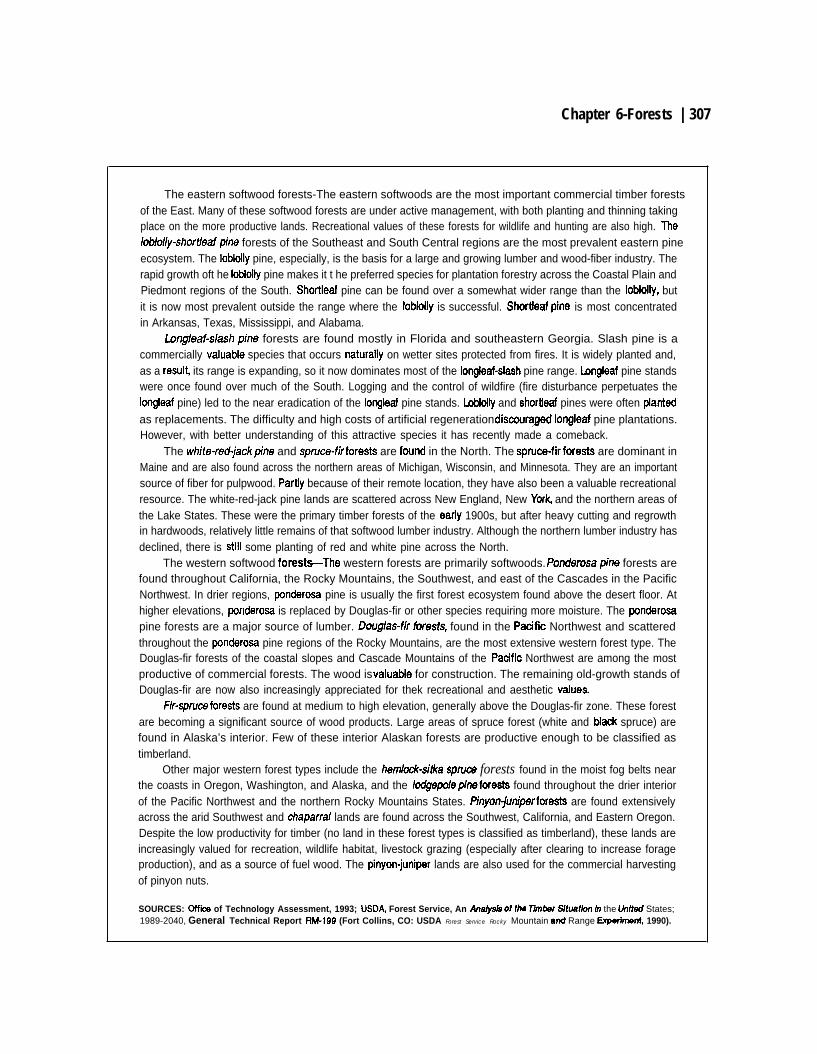
Chapter 6-Forests | 307
The eastern softwood forests-The eastern softwoods are the most important commercial timber forestsof the East. Many of these softwood forests are under active management, with both planting and thinning takingplace on the more productive lands. Recreational values of these forests for wildlife and hunting are also high. lle/ob/o//y-short/eaf pine forests of the Southeast and South Central regions are the most prevalent eastern pineecosystem. The Ioblolly pine, especially, is the basis for a large and growing lumber and wood-fiber industry. Therapid growth oft he Iobloliy pine makes it t he preferred species for plantation forestry across the Coastal Plain andPiedmont regions of the South. Shortleaf pine can be found over a somewhat wider range than the Iobioily, butit is now most prevalent outside the range where the Ioblolly is successful. Shortieaf pine is most concentratedin Arkansas, Texas, Mississippi, and Alabama.
Lmg/eaf-s/ash phe forests are found mostly in Florida and southeastern Georgia. Slash pine is acommercially vaiuable species that occurs naturaily on wetter sites protected from fires. It is widely planted and,as a result its range is expanding, so it now dominates most of the Iongleaf-slash pine range. lmgleaf pine standswere once found over much of the South. Logging and the control of wildfire (fire disturbance perpetuates thekmgleaf pine) led to the near eradication of the Iongieaf pine stands. i.ablolly and shortieaf pines were often piantedas replacements. The difficulty and high costs of artificial regeneration discoura~ Iongleaf pine plantations.However, with better understanding of this attractive species it has recently made a comeback.
The white-red-jackpine and spruce-firforests are fwnd in the North. The spru~-firforests are dominant inMaine and are also found across the northern areas of Michigan, Wisconsin, and Minnesota. They are an importantsource of fiber for pulpwood. Partiy because of their remote location, they have also been a valuable recreationalresource. The white-red-jack pine lands are scattered across New England, New York and the northern areas ofthe Lake States. These were the primary timber forests of the earty 1900s, but after heavy cutting and regrowthin hardwoods, relatively little remains of that softwood lumber industry. Although the northern lumber industry hasdeclined, there is stili some planting of red and white pine across the North.
The western softwood forest%The western forests are primarily softwoods. F’onubmsa phe forests arefound throughout California, the Rocky Mountains, the Southwest, and east of the Cascades in the PacificNorthwest. In drier regions, ponderosa pine is usually the first forest ecosystem found above the desert floor. Athigher elevations, Porlderosa is replaced by Douglas-fir or other species requiring more moisture. The ponderosapine forests are a major source of lumber. Lkx.gks-fir tiesk, found in the Paafic Northwest and scatteredthroughout the ponderosa pine regions of the Rocky Mountains, are the most extensive western forest type. TheDouglas-fir forests of the coastal slopes and Cascade Mountains of the Paafic Northwest are among the mostproductive of commercial forests. The wood is valuabie for construction. The remaining old-growth stands ofDouglas-fir are now also increasingly appreciated for thek recreational and aesthetic vaiues.
1%-sprweforests are found at medium to high elevation, generally above the Douglas-fir zone. These forestare becoming a significant source of wood products. Large areas of spruce forest (white and biack spruce) arefound in Alaska’s interior. Few of these interior Alaskan forests are productive enough to be classified astimberland.
Other major western forest types include the hem/o&-sMa spnm forests found in the moist fog belts nearthe coasts in Oregon, Washington, and Alaska, and the Mg@epineforests found throughout the drier interiorof the Pacific Northwest and the northern Rocky Mountains States. Pinyonjum’’rforests are found extensivelyacross the arid Southwest and chaparra/ lands are found across the Southwest, California, and Eastern Oregon.Despite the low productivity for timber (no land in these forest types is classified as timberland), these lands areincreasingly valued for recreation, wildlife habitat, livestock grazing (especially after clearing to increase forageproduction), and as a source of fuel wood. The pinyon-juniper lands are also used for the commercial harvestingof pinyon nuts.
SOURCES: OffIca of Technology Assessment, 1993; USDA Forest Service, An Anal@a of tha Thnbw S/tuatlon h the Un/ted States;1989-2040, General Technical Report RM-199 (Fort Collins, CO: USDA Forest Service Rocky Mountain and Range Experime~ 1990).
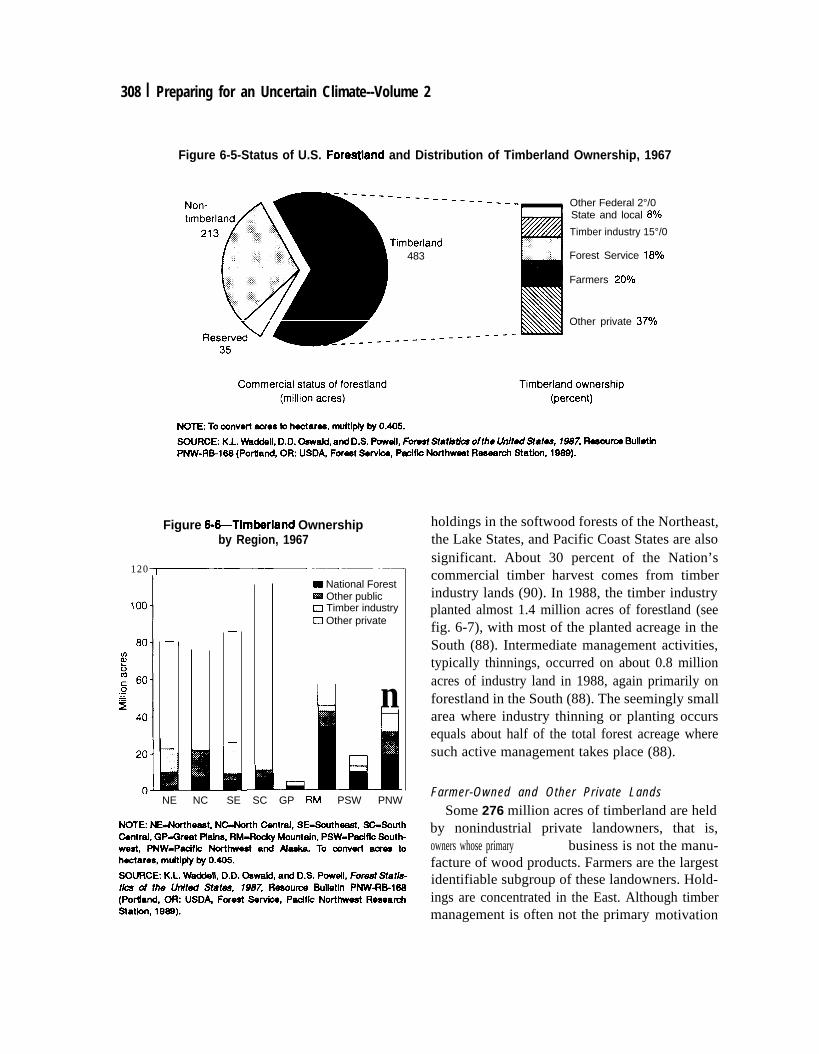
308 I Preparing for an Uncertain Climate--Volume 2
Figure 6-5-Status of U.S. Forestland and Distribution of Timberland Ownership, 1967
---- -.
~berland483
-----
----- ----t 1
---- ----
Other Federal 2°/0State and local 89’o
Timber industry 15°/0
Forest Service 18?40
Farmers 20V0
Other private 37?40
Figure 6-&Timberiand Ownershipby Region, 1967
120 ~
——
.
- National Forest= Other publicc1 Timber industryo Other private
u n
NE NC SE SC GP RM PSW PNW
holdings in the softwood forests of the Northeast,the Lake States, and Pacific Coast States are alsosignificant. About 30 percent of the Nation’scommercial timber harvest comes from timberindustry lands (90). In 1988, the timber industryplanted almost 1.4 million acres of forestland (seefig. 6-7), with most of the planted acreage in theSouth (88). Intermediate management activities,typically thinnings, occurred on about 0.8 millionacres of industry land in 1988, again primarily onforestland in the South (88). The seemingly smallarea where industry thinning or planting occursequals about half of the total forest acreage wheresuch active management takes place (88).
Farmer-Owned and Other Private LandsSome 276 million acres of timberland are held
by nonindustrial private landowners, that is,owners whose primary business is not the manu-facture of wood products. Farmers are the largestidentifiable subgroup of these landowners. Hold-ings are concentrated in the East. Although timbermanagement is often not the primary motivation
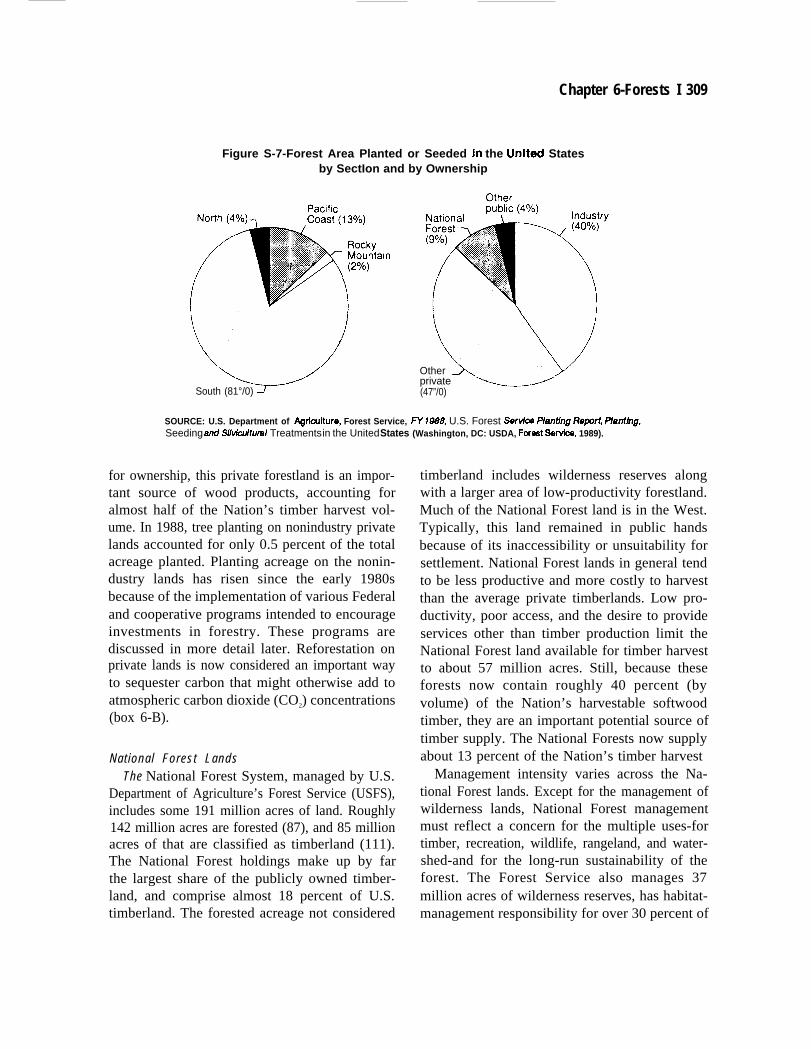
Chapter 6-Forests I 309
Figure S-7-Forest Area Planted or Seeded h the Unhd Statesby SectIon and by Ownership
Other
South (81°/0)private(47”/0)
SOURCE: U.S. Department of A@culture, Forest Service, W 1988, U.S. Forest Sendoe Planting Repmt, Phmthg,Seeding and Si/vicu/tura/ Treatments in the United States (Washington, DC: USDA, Foreet Servioe, 1989).
for ownership, this private forestland is an impor-tant source of wood products, accounting foralmost half of the Nation’s timber harvest vol-ume. In 1988, tree planting on nonindustry privatelands accounted for only 0.5 percent of the totalacreage planted. Planting acreage on the nonin-dustry lands has risen since the early 1980sbecause of the implementation of various Federaland cooperative programs intended to encourageinvestments in forestry. These programs arediscussed in more detail later. Reforestation onprivate lands is now considered an important wayto sequester carbon that might otherwise add toatmospheric carbon dioxide (CO2) concentrations(box 6-B).
National Forest LandsThe National Forest System, managed by U.S.
Department of Agriculture’s Forest Service (USFS),includes some 191 million acres of land. Roughly142 million acres are forested (87), and 85 millionacres of that are classified as timberland (111).The National Forest holdings make up by farthe largest share of the publicly owned timber-land, and comprise almost 18 percent of U.S.timberland. The forested acreage not considered
timberland includes wilderness reserves alongwith a larger area of low-productivity forestland.Much of the National Forest land is in the West.Typically, this land remained in public handsbecause of its inaccessibility or unsuitability forsettlement. National Forest lands in general tendto be less productive and more costly to harvestthan the average private timberlands. Low pro-ductivity, poor access, and the desire to provideservices other than timber production limit theNational Forest land available for timber harvestto about 57 million acres. Still, because theseforests now contain roughly 40 percent (byvolume) of the Nation’s harvestable softwoodtimber, they are an important potential source oftimber supply. The National Forests now supplyabout 13 percent of the Nation’s timber harvest
Management intensity varies across the Na-tional Forest lands. Except for the management ofwilderness lands, National Forest managementmust reflect a concern for the multiple uses-fortimber, recreation, wildlife, rangeland, and water-shed-and for the long-run sustainability of theforest. The Forest Service also manages 37million acres of wilderness reserves, has habitat-management responsibility for over 30 percent of
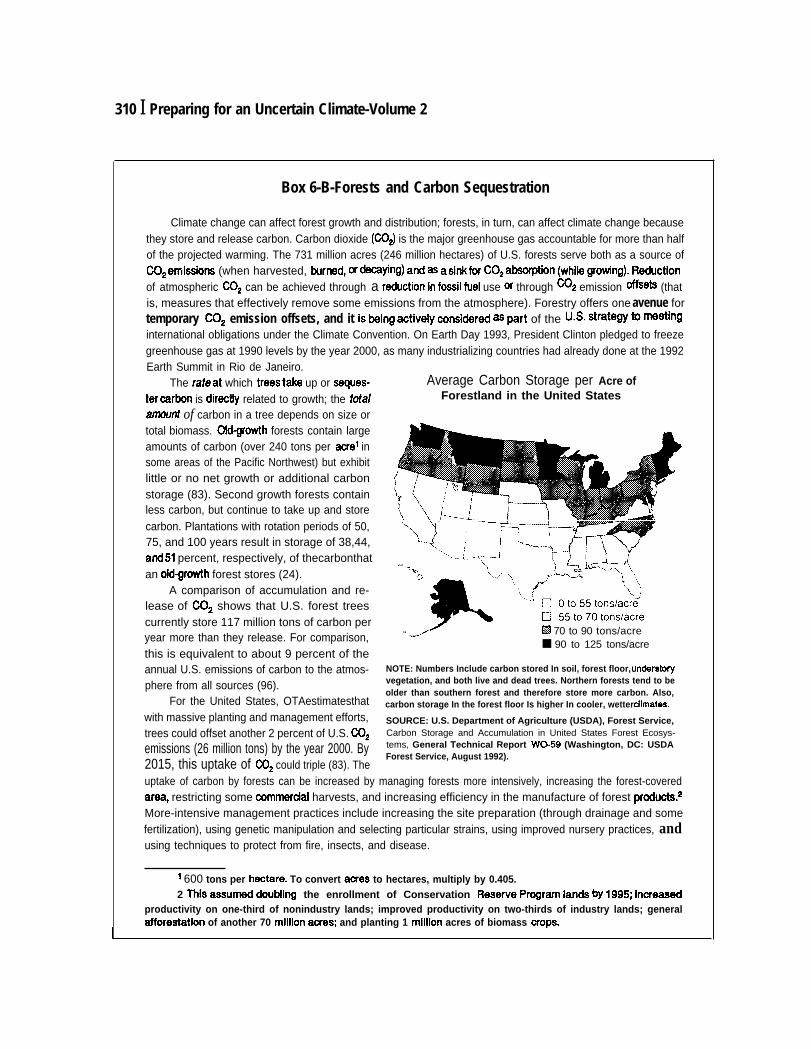
310 I Preparing for an Uncertain Climate-Volume 2
Box 6-B-Forests and Carbon Sequestration
Climate change can affect forest growth and distribution; forests, in turn, can affect climate change becausethey store and release carbon. Carbon dioxide (CO~ is the major greenhouse gas accountable for more than halfof the projected warming. The 731 million acres (246 million hectares) of U.S. forests serve both as a source ofC02emissions (when harvested, tnmed, wd=a@g) and as asi~for C02amhn (whi~ WO~w). Reactionof atmospheric C02 can be achieved through a wductbn in fossil ~el use of through ~z emission offwts (thatis, measures that effectively remove some emissions from the atmosphere). Forestry offers one avenue fortemporary C02 emission offsets, and it is @ing actively cond*rd as pat of the U.S. strategY to ~~inginternational obligations under the Climate Convention. On Earth Day 1993, President Clinton pledged to freezegreenhouse gas at 1990 levels by the year 2000, as many industrializing countries had already done at the 1992Earth Summit in Rio de Janeiro.
The fateat which treestake up or seques-tercarbon is directiy related to growth; the totalamomf of carbon in a tree depends on size ortotal biomass. Oldgrowth forests contain largeamounts of carbon (over 240 tons per acre’ insome areas of the Pacific Northwest) but exhibitlittle or no net growth or additional carbonstorage (83). Second growth forests containless carbon, but continue to take up and storecarbon. Plantations with rotation periods of 50,75, and 100 years result in storage of 38,44,and51 percent, respectively, of thecarbonthatan oidgrowth forest stores (24).
A comparison of accumulation and re-lease of C02 shows that U.S. forest treescurrently store 117 million tons of carbon peryear more than they release. For comparison,this is equivalent to about 9 percent of theannual U.S. emissions of carbon to the atmos-phere from all sources (96).
For the United States, OTAestimatesthatwith massive planting and management efforts,trees could offset another 2 percent of U.S. C02emissions (26 million tons) by the year 2000. By2015, this uptake of C02 could triple (83). The
Average Carbon Storage per Acre ofForestland in the United States
“ .-x’ IS 70 to 90 tons/acre■ 90 to 125 tons/acre
NOTE: Numbers Include carbon stored In soil, forest floor, understo~vegetation, and both live and dead trees. Northern forests tend to beolder than southern forest and therefore store more carbon. Also,carbon storage In the forest floor Is higher In cooler, wetter dlmates.
SOURCE: U.S. Department of Agriculture (USDA), Forest Service,Carbon Storage and Accumulation in United States Forest Ecosys-tems, General Technical Report WO-59 (Washington, DC: USDAForest Service, August 1992).
uptake of carbon by forests can be increased by managing forests more intensively, increasing the forest-coveredare% restricting some commerdal harvests, and increasing efficiency in the manufacture of forest products.2More-intensive management practices include increasing the site preparation (through drainage and somefertilization), using genetic manipulation and selecting particular strains, using improved nursery practices, andusing techniques to protect from fire, insects, and disease.
I 600 tons per heotare. To convert aores to hectares, multiply by 0.405.2 ITIiS assIJti doubling the enrollment of Conservation Resewe Pr~ram lands by lw5; in~m
productivity on one-third of nonindustry lands; improved productivity on two-thirds of industry lands; generalafforestatlon of another 70 milllon acxes; and planting 1 miilion acres of biomass orops.
Chapter 6-Forests 1311
Increased forest cover can be accomplished through afforestation, reforestation, and urban planting.Afforestation-planting trees on land that has never supported forests or where forests have been cleared fordecades-offers opportunities to store carbon and help stabilize soil. Reforestation-planting trees on land thathas recently been deared oftrees+an be encouraged by incentive programs such as the Conservation ReserveProgram (CRP), which aims to plant trees on 6 million acres of cropland. Urban planting can help to reduce the“heat isJand” effect common in cities and can reduce the need for air conditioning.
There are several caveats tousing trees tooffset C02emissions. C rbonwill eventually be released tothe1atmosphere either when trees die and decompose, when they are harve ed or burned, or when products made
from them decompose. Unless wood is used todisplacefossil fuels or is permanently stored under conditions thatdo not allow decomposition, carbon offsets in later years will dwindle. The average fore# in the United Statesholds approximately 60 tons of organic carbon per acre. However, the quantity of carbon sequestered, or stored,varies considerably by forest type and region. Douglas-fir forests and Spruce-fir forests hold roughly 100 tons ofcarbon per acre, whereas Pinyon-juniper forests and Ioblolly pine forests hold around 40 to 75 tons of carbon peracre respectively (96)4. Forests in the Pacific Coast States store approximately 100 tons of carbon per acre (40percent of the total carbon stored in U.S. forest ecosystems) (96). Forests in the South Central States storeapproximately 60 tons of carbon per acre (10 percent of the total carbon stored in U.S. forest ecosystems) (96).Soil stores the largest portion of carbon in U.S. forest ecosystems, 50 percent (29 billion tons).
If timber harvests are restricted to avoid releasing C02 and to store carbon, alternatives to wood productswould have to be found to meet an increasing demand for wood and paper products. Small-scale restrictions, suchas restrictions on harvesting old-growth forests, will not have a large effect on C02 emissions; however, this actioncan be justified for a variety of other reasons such as the preservation of biodiversity and virgin forests.
Forestry options designed to reduce or offset COz emissions in the United States cannot be considered asubstitute for reducing total energy use or for developing alternatives to fossil fuel. However, they can be usedas an avenue to ease the transition to developing alternative sources and improving the eff iciency of energy usein general.
3 Forests refer@ s~l, forest f~r, and tr~s.
4 ne average annual carbon storage rate for all U.S. timberland was 0.3 rnetflc tons Carb POr a=e;potentially, fully Stocked forests could average about 0.6 metrlctonscarbon peraae. Under experknental conditions,genetically improved Ioblolly pine aohieved 1.2 metric tons carbon per acre over a 3S-year pertod.
SOURCE: Offka of Techno@y Astwssment, 1993.
the Nation’s threatened and endangered species Other Public Landsof plant and animals, and attracts a growingnumber of visitors who participate in recreationalactivities (89). (Box 6-C summariz es the majorFederal laws that regulate forest management.)National Forest lands account for about 9 percentof total acreage of forest that is replanted in theUnited States and about 25 percent of the forestacreage that is thinned.7
Other public timberland accounts for about 11percent of U.S. timberland. This includes 5.4million acres of the Federal public lands held bythe U.S. Department of the Interior’s Bureau ofLand Management (BLM) and acreage adminis-tered by the Bureau of Indian Affairs and theDefense Department, along with a much largerarea of State and local timberland. The greatest
7 III lg$xl, 215,000 wes of National Forest lands were planted or reseeded, while 140,000 acres were wowed to mge-@ ~~Y *=harvesting (94). In the same year, 190,000 acres (less than l/500thof the Forest Senkefomsted acreage) received some intermediate treatmentmostly thinnkg to remove lower-valued timber and to improve the growth of the mmdning trees.
312 I Preparing for an Uncertain Climate-Volume 2
Box 6-C-Major Federal Laws Related to Forest Management
The Multiple-Use and Sustained-Yield Act of 1960-The Multiple-Use and Sustained-Yield Act (MUSY;P.L 86-517) provided formal statutory authority to the Forest Service for managing the National Forests for outdoorrecreation, range, timber, watershed, and wildlife. The authority to manage for these “multiple uses” supplementedthe Forest Service’s original charge, provided by the Forest Service Organic Act of 1897, to furnish a continuoussupply of timber and to secure water flows. MUSY does not setup any new management system or provide aplanning structure, but it is the legal foundation for the concepts of balancing use and preservation. Despite thelack of management direction, the MUSY philosophy continues to be the cornerstone of both Forest Service andBureau of Land Management practices, affecting a total of some 460 million acres (190 million hectares)1 in theUnited States (81).
The National Environmental Policy Act of 1969-The National Environmental Policy Act (NEPA; P.L.91-190) responded to a growing concern that Federal agencies were placing excessive emphasis on economicvalues over environmental values. This act represents a major divergence from the traditional focus on economicgain by suggesting that environmental goals might outweigh economic gain in some cases. NEPA mandatescertain decision making procedures and requires public participation in major Federal activities to ensure thatenvironmental values are given appropriate consideration in decisionmaking. The environmental impact statement(EIS) required for Federal activies that “significantly affect? the human environment must include the identificationof adverse environmental effects, alternatives to minimize adverse impacts, and short-and long-term ramificationsof the proposed project, and it must be made available to the public for comment.
The Forest and Rangeland Renewable Resources Planning Act of 1974 (RPA) as amended by theNational Forest Management Act of 1976 (NFMA)-These two laws taken together specify and direct ForestService management and planning activities. Enactment of RPA (P.L. 93-378) and NFMA (P.L. 94-588) stemsfrom: 1) concern over adverse environmental impacts on forest resources in the 1970s, 2) the lack of specificdirection in MUSY and 3) NEPA’s mandate that all agencies use a systematic approach in their decisionmakingprocesses. Whereas RPA sets goals, objectives, and planning strategies at the national level, NFMA directs forestplanning at the local level, closely following the EIS process. Together, RPA and NFMA allow for a top-down andbottom-up approach to National Forest planning. Goals and objectives are set out at the national level under RPA,while the actual balancing of various resource uses is generally left to the National Forest manager under NFMA.The acts represent a comprehensive and relatively specific planning directive for the Forest Service based on theprinciples of multiple use and sustained yield.
RPA is based on the assertion that the “renewable resource program must be based on a comprehensiveassessment of present and anticipated uses, demand for, and supply of renewable resources from the Nation’spublic and private forests and range lands, through analysis of environmental and economic impacts, coordinationof rnultiple use and sustained yield opportunities.” Four documents are required periodically: an Assessment aNational Program, a Presidential Statement of Policy, and an Annual Report.
The RPA Assessment which is updated every 10 years and considers a 50-year planning horizon, containsan analysis of expected uses and price trends, an inventory of all renewable resources, and an outline anddescription of Forest service responsibilities and other policy considerations (e.g., laws and regulations). The RPAProgram which is updated every 5 years with a 50-year planning horizon, contains a listof needs and opportunitiesin National Forest management and identifies benefits and costs. The Presidential Statement of Policy is used toframe budget requests when the RPA Program is sent forward. By enacting this provision, Congress sought toretain and assert control over the Forest Service budget by specifying its ability to disapprove and revise the policystatement. The Annual Report is intended to evaluate the effectiveness of the program. Specifically, it provides
1 To convert acres to hectares, multiply by 0.405.
Chapter 6-Forests 1313
information to assist Congress in its oversight responsibilities, requiring the Forest Service to account for ex-penditures and to evaluate progress in implementing the RPA Program.
The National Forest Management Act directs the Forest Service to produce long-term, integrated forest plansfor each National Forest unit at least every 15 years, with updates as needed. NFMA directs the Forest Serviceto set substantive standards and guidelines for timber managenwmt and protection of water and other renewableresources. Some provisions of NFMA are very specific to harvest practices and reflect a concern that the ForestService’s timber-harvesting methods were degrading the environment unreasonably. NFMA also provides forextensive public involvement in Forest Service planning processes.
The Federal Land Policy and Management Act of 197&The Federal Land Policy and Management Act(FLPMA; P.L. 94-579) established the Bureau of Land Management (BLM) as a permanent agency and claimedpermanent Federal ownership of 270 million acres of public lands, primarily in the VWt and Alaska. FLPMA setsgoals for BLM, prescribes a pianning process, and allows for public involvement. Under the provision of FLPMA,the public lands are managed in a manner that protects the quality of scientific, scenic, historical, ecological,environmental, air and atmospheric, water resource, and archaeological values; that provides food and habitat forfish and wildlife and dor&tic animals; that provides outdoor recreation; and that recognizes the Nation’s needfor domestic sources of minerals, food, timber and fitwr.z Clearly, BLM is charged with balancing a wide varietyof values.
FLPMA requires BLM to prepare Resource Management Plans for each region. These plans, prepared witha 15-year planning horizon, must reflect the multiple-use and sustained-yield principle. In practice, a benefit-costanalysis is required before any implementation project begins. FLPMA requires that the public be allowed anopportunity to participate in the planning process and that BLM conduct an inventory of its resources. Further,FLPMA does not give any timetables or deadlines for compieted plans and does not require that they be regularlyupdated. However, it does set up provisions for some management of BLM land.
The Wilderness Act of 1964-The stated purpose of the Wilderness Act (P.L. 66-577) is to provide for theprotection of the wilderness resource in such a manner that it is left unimpaired for future use and enjoyment andthat the preservation of its wilderness character is ensured. The Forest Service, the Fish and wildlife Service, theNational Park Service, and, later, the Bureau of Land Management were required to study their lands and submitappropriate tracts to Congress for admission into the WMerness Preservation System (areas atready designatedas wild or primitive were automatically included). Administration of t he Wilderness Preservation Systen current!yat 92 million acres, is the continued responsibility of the land-management agency that applied for admission. EachXncY*t~mi~s fm itSOtitiat is appropriate management of the wilderness lands, consistent with the directions
given by the act. This act does give more explicit guidelines than MUSYA. In general, it prohibits timber harvestingand motorized access, thus severely limiting active management in wilderness areas.
The Endangered Species Act of 1973-The endangered species legislation, as amended (P.L. 100-707),is the most restrictive and binding of all preserve laws. The puqmse of the Endangered Species Act (ESA) is toconserve the ecosystems on which endangered species and threatened species depend. A species is consideredendangered if it is in danger of extinction throughout atl or a significant portion of its range, or threatened if it islikely to become endangered in the foreseeable future. A speaes is listed as endangered or threatened basedsolelyon sckmtificevidence, without regard to the costs of protection. Federal agencbs are then required to ensurethat their actions do not jeopardize the continued existence of these species. Once a species is listed, it is unlawfulto harm, capture, or kill it. The Secretary of the Interior may designate critical habitat for the specie~n area inwhich both private and pubiic activity is restricted-after taking into consideration the scientific evidence and thepotential economic impact.
243 U.S. code (U. S. C.) 1701(8).
(Continued on next page)
314 I Preparing for an Uncertain Climat*Volume 2
Box 6-C-Major Federal Laws Related to Forest Management--(Continued)
In Oregon, Californi% and Washington, the ESA has led to heated conflicts between logging communitiesand proponents of protection for the northern spotted owl. The spotted owl, which nests in valuable forests ofthe Pacific Northwest is listed as endangered. Iqging activities in many areas have been halted by ciaims thatfurther logging would cause extinction. If the restrictions on logging are upheld, some 5,000 or more jobs maybeat stake (17).
The National Park Service Organic Act of 191&This act (P.L. 85434) spells out the goals of the NationalPark System, administered by the National Park Service (NPS) of the Department of Interior. The general missionis to conserve the scenery, wildlife, and natural and historic objects within the parks, managing the parks to providefor public enjoyment and to leave them unimpaired for future generations. This directive sets up a dual missionfor NPS to conserve and preserve the values in the parks and to provide for public enjoyment. Specific goals andpurposes for each National Park unit are spw”fied in its establishing legislation and management documents.
The National Parks and Recreation Act of 197%Planning has evolved in the National Parks since the1960s to allow for zoning within park boundaries to protect pristine areas and allow greater development andmanagement in other specified areas. The National Parks and Recreation Act of 1978 (P.L. 95-625) required thepreparation of general management plans for each unit of the National Park System. Generally, three documentsare prepared. The Statement for Management, prepared by the park superintendent and updated every 2 years,provides a concise description of the park’s purpose and current management practices. The GeneralManagement Plan sets forth the basic philosophy for the park and provides strategies to meet the issues andobjectives (specified in the Statement for Management) within a 5-to 10-year time frame. Finally, the Outline ofPlanning Requirements, prepared by an interdisciplinary team, is an analysis of the plans and tasks that must bedone to address the issues and objectives (105).
The Clean Air Act of 1970 (as amended in 1977 and 1990)--The purpose of the Clean Air Act (P.L. 91*)is to promote and enhance the quality of the Nation’s air resources in order to protect pubiic health and welfare.Generally, the act sets two types of National Air Quality Standards, primary and secondary. Primary standards areset to protect human health, and secondary standards seek to protect public welfare.3 Prescribed burns onforesttand can be limited by the need to comply with the requirements of the Clean Air Act.
The Clean Water Act of 1972 (as amended in 1977,1981, and 198+l%e goal of the Clean Water Act(P.L. 92-500) is to restore and maintain the chemical, physical, and biological integrity of the Nation’s water. me1987 amendments to the act encourage “best management practices” (BMPs) to control non-point-sourcepollution. Best management practices required to control soil erosion will often restrict the nature of harvestingactivity allowed within stream zones. Section 404 of the act is a regulatory mechanism for wetland protection,restricting the draining or filling of wetlands. Standard forestry activities are exempted from the permittingrequirements of Section 404, allowing temporary drainage during harvesting and planting. Activity byaforestiandowner that would permanently alter wetiands, through drainage or filling, may be restricted.
3 Sco@ry standards generally seek to protect all aspects of the human and natural entiron~nt Wmptfor human health and may Include protection for soil, water, cxops, vegetation, materials, animals, wildllfe, weather,vlslbllity, climate, transportation hazards, and personal oomfort (45).
SOURCE: Offh of Technology Assessment, 1993.
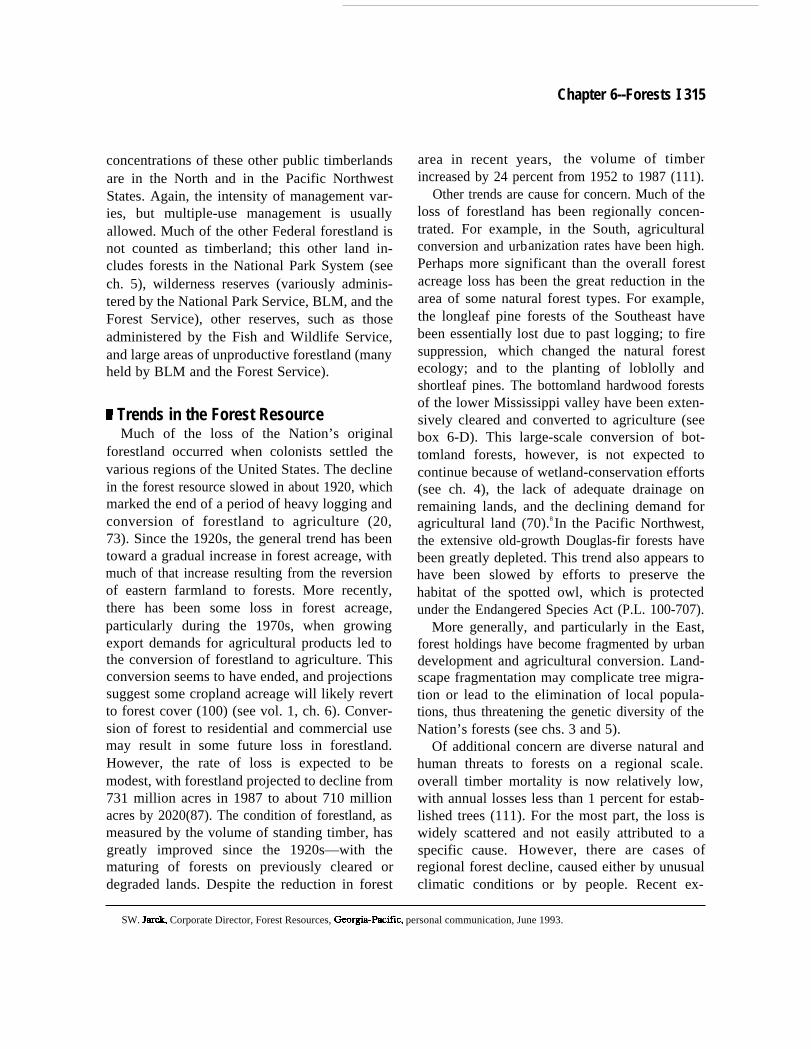
Chapter 6--Forests I 315
concentrations of these other public timberlandsare in the North and in the Pacific NorthwestStates. Again, the intensity of management var-ies, but multiple-use management is usuallyallowed. Much of the other Federal forestland isnot counted as timberland; this other land in-cludes forests in the National Park System (seech. 5), wilderness reserves (variously adminis-tered by the National Park Service, BLM, and theForest Service), other reserves, such as thoseadministered by the Fish and Wildlife Service,and large areas of unproductive forestland (manyheld by BLM and the Forest Service).
~ Trends in the Forest ResourceMuch of the loss of the Nation’s original
forestland occurred when colonists settled thevarious regions of the United States. The declinein the forest resource slowed in about 1920, whichmarked the end of a period of heavy logging andconversion of forestland to agriculture (20,73). Since the 1920s, the general trend has beentoward a gradual increase in forest acreage, withmuch of that increase resulting from the reversionof eastern farmland to forests. More recently,there has been some loss in forest acreage,particularly during the 1970s, when growingexport demands for agricultural products led tothe conversion of forestland to agriculture. Thisconversion seems to have ended, and projectionssuggest some cropland acreage will likely revertto forest cover (100) (see vol. 1, ch. 6). Conver-sion of forest to residential and commercial usemay result in some future loss in forestland.However, the rate of loss is expected to bemodest, with forestland projected to decline from731 million acres in 1987 to about 710 millionacres by 2020(87). The condition of forestland, asmeasured by the volume of standing timber, hasgreatly improved since the 1920s—with thematuring of forests on previously cleared ordegraded lands. Despite the reduction in forest
area in recent years, the volume of timberincreased by 24 percent from 1952 to 1987 (111).
Other trends are cause for concern. Much of theloss of forestland has been regionally concen-trated. For example, in the South, agriculturalconversion and urbanization rates have been high.Perhaps more significant than the overall forestacreage loss has been the great reduction in thearea of some natural forest types. For example,the longleaf pine forests of the Southeast havebeen essentially lost due to past logging; to firesuppression, which changed the natural forestecology; and to the planting of loblolly andshortleaf pines. The bottomland hardwood forestsof the lower Mississippi valley have been exten-sively cleared and converted to agriculture (seebox 6-D). This large-scale conversion of bot-tomland forests, however, is not expected tocontinue because of wetland-conservation efforts(see ch. 4), the lack of adequate drainage onremaining lands, and the declining demand foragricultural land (70).8 In the Pacific Northwest,the extensive old-growth Douglas-fir forests havebeen greatly depleted. This trend also appears tohave been slowed by efforts to preserve thehabitat of the spotted owl, which is protectedunder the Endangered Species Act (P.L. 100-707).
More generally, and particularly in the East,forest holdings have become fragmented by urbandevelopment and agricultural conversion. Land-scape fragmentation may complicate tree migra-tion or lead to the elimination of local popula-tions, thus threatening the genetic diversity of theNation’s forests (see chs. 3 and 5).
Of additional concern are diverse natural andhuman threats to forests on a regional scale.overall timber mortality is now relatively low,with annual losses less than 1 percent for estab-lished trees (111). For the most part, the loss iswidely scattered and not easily attributed to aspecific cause. However, there are cases ofregional forest decline, caused either by unusualclimatic conditions or by people. Recent ex-
SW. J- Corporate Director, Forest Resources, Georgia-Pacflc, personal communication, June 1993.
316 I Preparing for an Uncertain Climate--Volume 2
Box 6-D-Southern Bottomland Hardwoods: Converting Wetland Forests to Agriculture
The Mississippi Delta is home to the largest contiguous wetland in the lower48 States. Swthern bottomlandhardwood forests cover 5.2 million acres (2.2 million hectares)l along the waterways of this delta wetland region,including areas of Imuisiana, Mississippi, and Alabama. These southern bottomland hardwood (SBH) forests hosta variety of tree species that are of high economic value for forestry. They also play a vita! role in flood prevention,in erosion control, and as flyways and habitat for millions of migratory birds. To date, 80 percent of this once vastsystem of forested wetlands has been lost (18). Past Federal flood-control and drainage projects in the Delta ledto the clearing, draining, leveling, and conversion of large parcels of SBH to agricultural use (1 04). These activitiescreated the potential for irreversible damage to the entire wetland system. Global climate change promises to placethe system under further stress.
The cumulative impacts of small changes in the SBH of the Delta can have wide-ranging effects on species,hydrologic function, soil erosion, and water quality. The hardwood reserve is home to a multitude of deciduousspeaes (cottonwood, cypress, tupelo, sycamore, red@ green ash, sugarberry, and sweetgum). The hardwoodtimber industry of the southern United States depends on these productive forests as a source of highqualitywoodproducts and pulpwood supplies. The underbrush provides essential habitat for a variety of waterfowl (e.g., woodduck, pintail, teal, and black duck). A host of geese, diving ducks, and migratory songbirds relies on this ecosystemfor a wintering and nesting area. In addition, an active hunting economy is supported by the plethora of squirrels,white-tailed deer, and wild turkey that make their home in these bottomland communities. These systems aredependent on fluctuations in water level to maintain their high productivity, and altering the SBH ecosystem, bydisturbing the hydrology, alters the forest vegetation and soils and ultimately can leave the land incapable ofhandling high flood peaks and large storm events. Such flood-cxmtroi functions andvaluesare difficulttoquantify,but as the Mississippi floods of 1993 demonstrated, t hey are essential to maintain. (See box 4-D for a discussionof wetland values.)
Federal flood-control and drainage projects common in the Delta during the 1930s resulted in levees,floodways, channelization, and tributary basin modifications. These projects, while providing flood protection fornearly 20 million acres of land in t he Delta, also paved t he way for agricultural conversion in t he bottomJands. Theadvent of these projects made agriculture not only technically feasible but economically attractive. In addition, theFederal Government created myriad farm programs that further supported conversion and promoted agriculturaluse. These farm programs came in the form of production subsidies, technical assistance, and support for theexpansion of exports. Flood-control and drainage projects, farm programs, and periods of high agricultural priceswere together the causes of most of the wettand forest depletion from 1935 to 1984 (see ch. 4, figs. 4-3 and 4-4,for illustrations of wetiand losses).
With an end to the Federal drainage projects, a decline in the markets for agricultural products, a strongmarket for higher-quality hardwoods, and growing interest in the protection of wetiands, there has been aslowdown or reversal in the conversion of the SBH forest to agriculture over the past decade. The new economicrealities have brwght agricultural conversion to a virtual halt. Instead, there has been increased investment inrestoring once-forested wetland and in managing the forest resource on those still intact.2 Some of thesereconversion efforts are being championed and even subsidized by members of the timber industry who havesignificant economic interests in maintahing southern timber reserves. Small landowners are turning to the timberindustry for support in these projects, with ecological restoration of lost forest acreage as a long-term goal. Thesilvicultural activity is generally not incompatible with maintaining the wetland services of the lands. Indeed,relatively high values for hardwood forest products and other economic incentives for hardwood forest
1 To convert acres to hectares, multiply by 0.405.z R. C)lezsewSM, Georgia-Pacific Corporation, personal cmmmunkdon, JUIY 1993.
Chapter 6--Forests 1317
management should help promote the continued conservation of wetlands. Global climate change may bring newphysical stresses and changes to the nature of human demands on the bottomlands. Increases in temperatures,changes in preapitation, and altered hydrofogy of the wetland systems may change the economics of agriculturalproduction and lead to disturbance and changes in forest composition. In addition, sea level rise might cause someinundation of coastal systems. Asa result SBH could suffer from alterations in biodiversity influenced by changesin vegetative composition and soil characteristics and distribution (95). Collectively, these changes could changethe future of agriculture and silviculture in the Delta region, incre~”ng uncertainty about whether there will becontinued maintenance of these valuable wetland forest resources.
SOURCES: A. Bartuska, U.S. Fish and Wildlife ServicxA personal communication, July 1993; Environmental Deferwe Fund (EDF) and theWMd Wildlife Fund (WWF), How Wbt Is a k#4tkmf7 lhe Impacts of the Proposed Revisions to the Fedeml Wb%n& Delineation Manual(New York NY and VVaehington, DC: EDF and WWF, 1992); U.S. Department of Agriculture (USDA), Foreet Service, Researti Nee&Aesodatad with Gbba/ Change /mpacts on Southern Foreated Wt/anck, Summary of a VWkshop Convened by the Consortium forReeearch on Southern Forest Wtande, Feb. 13-14,1991, Baton Rouge, IA (Washington, DC: USDA, A@ 1991); U.S. Department ofthe Interior, 7he Impact of Fedwa/ Prvgranm, Vime 1: The lowar Mk?sissipplAkvial PM and the Prairie Pothole Region, a report toCongrees by the Secretary of the Interior, October 19SS; U.S. Department of the Interior, F&h and Wildlife Service, “Synopsis of WetlandFunctione and Values Bottomland Hardwoode with Special Emphasis on Eastern Texas and Oklahoma,’” Blok@ca/ Report vol. 87, No.12, September 1987.
tended droughts in California and in many interiorareas of the West (particularly eastern Oregon andIdaho) have been a major factor in locally veryhigh rates of insect infestation, fire, and forestmortality (see box 6-E). Excessive fiie suppres-sion and selective harvesting of drought-tolerantponderosa pines in the past may have increasedthe forest’s vulnerability to drought and disease(92). Airborne pollution is implicated in thedeath of high-elevation red spruce in the North-east and in the decline in the growth of pines in theSoutheast (87). Ozone and smog are implicated indamage to forests near urban areas, such as thoseof Southern California (82). Acid rain and heavymetals may eventually alter forest soils and havesome cumulative effects on forest productivity.Acidic deposition and management activities aresuspected causes of the apparent sugar mapledecline in the northeastern United States (76).
One of the striking tkends in forestry over thepast 70 years has been the reduction in forestacreage burned by wildfire (20, 94). Until 1945,forest fires often burned over 30 million acresannually. Individual catastrophic frees in the Westhave at times burned more than a million acres offorestland (20). Since the early 1950s, however,the annual acreage burned has never exceeded 10
million acres and is usually below 5 million acres.This reduction in loss to f~e has resulted fromchanges in private land-management practices(less brush buming for pasture clearing, fewersparks from logging equipment, and less arson),better access and equipment for fire suppression,and increased State and Federal fire-suppressionefforts. The droughts of the late 1980s did lead toan increase in the number of fires and the acreageburned, but not to levels that were high by paststandards (fig. 6-8).
E Trends in Forest ManagementOver the course of the past few decades, the
perception of the value of forests has changedamong scientists and the public, and so has theacceptability of certain forest-management prac-tices. Scientists have learned more about thecomplexity of forest ecosystems and about howoverall productivity of forests can be damaged inways that had not been anticipated. Together,these changing public and scientific perceptionsare altering the manner in which all forestkmd canbe managed.
The decades a.fler World War II were a periodof rapid growth in the use of the public forestland,with increases in both timber harvests and recrea-
318 I Preparing for an Uncertain Climate-Volume 2
Box 6-E–The Blue Mountains: Forest Decline and Climate Change
If climate change leads to hotter and drier conditions in the M&t, forests will become more vulnerable todrought stress, disease, and infestations. Increased mortality rates could lead to rapid fuel buildup and increasethe risk of intense, widespread wildfire. In many parts of the M&t, the impacts of drought stress on forests arealready well-known. The 7 years of drought in the klkst coupled with over 100 years of fire suppressiontransformed many western forests from healthy, robust stands to weakened, overcrowded, and disease-riddentinderboxes. These conditions exist today without the added impacts of climate change. Because a drier climatein the VWst can only exacerbate drought stress, an examination of this situation may give some dues about thecomplicated nature of future climate impacts in other forested areas.
The forests of the Blue Mountains in Oregon are facing the most severe and widespread effects of droughtand drought-induced disease. In 1850, this region was characterized by stands of mature pine and western larch,large grassy openings, and lack of underbrush. Frequent fires were a critical part of preventing overcrowding andof stemming disease spread. A series of droughts and intense logging of the valuable pines in this area aroundthe turn of the century set the stage for a new generation of trees. Fire suppression allowed shade-tolerant firspecies to sprout and fill areas where the pines had been logged. Because new sprouts and weak trees were noteliminated by fire, the stands have become dense. Furthermore, fir species are generally less disease- andfire-resistant than the pines they are replacing. Although disease has plagued the forests of the Blue Mountainsmany times this century, the most recent outbreak, fueled by the continuing drought, poses grave threats to localcommunities, industry, wildlife, and the ecosystem.
Drought impacts-in 1990,53 percent of three Nationai Forests in the Blue Mountains contained dead orinsect-defoliated trees. Over 20 types of insects and diseases, including the Douglas-fir tussock moth and thewestern spruce budworm, were identified as causing forest mortality. In 1992, the Paimer drought index showedthe area under extreme drwght conditions (triple the size of 1991 ), “covering nearly ali of the western forests”(48). Conditions were ripe for catastrophic fires that could destroy homes and communities. However, drought isnot the only threat to forest resources in the Biue Mwntains. The upper Grand Ronde River that runs thrwgh theBlue Mountains has lost 70 percent of its salmon pool habitat in the past 45 years due to road building and logging.Salmon fishing is an integral part of Indian tradition in this area, but many have been unable to pass it on to theirchiidren because the fish populations have gotten so low. Logging in this area has created a fragmentedlandscape, with more wildlife habitat at the vulnerable fringes.
Fragmentation and risk allocation-Although most agree that there isaseriousforest-health problem andfire risk in the Biue Mountains, it is less clear what the solutions are. These Blue Mwntain problems transcendownership and management boundaries. Three National Forests with up to 25 different management areas, sixtowns, several Indian reservations, several private forests, and a smattering of private homes are intertwined inthe Biue Mwntains. Any management decision for the Blue Mountain forests wiil affect all of these parties, andeven if ecologically sound, it may be met with resistance by inhabitants and communities that depend on the forestsfor their economic base.
One suggested solution includes the use of fire to reduce fuel ioads and prevent the disease spread.However, this poses a risk to small communities and homes that are nestled within forested iands. In addition,Ciean Air Act provisions restrict fire use because of particulate pollution. In many places, the risk that prescribedfire would burn wt of control is very great, and the fuel buildup is so dense that any such fire wwld be extremelyhot and wouid destroy soil nutrients, turn day soils to brick, and cause massive erosion and environmentaldarnage.
Salvage harvests are another proposed solution supported by the timber and forest products industries.Diseased timber is only good for commercial use up to 2 years after it dies. Salvage harvests wwld “salvage” someof this revenue, reduce fuel loads, and provide local jobs. In addition, the thinned stands would enhance the
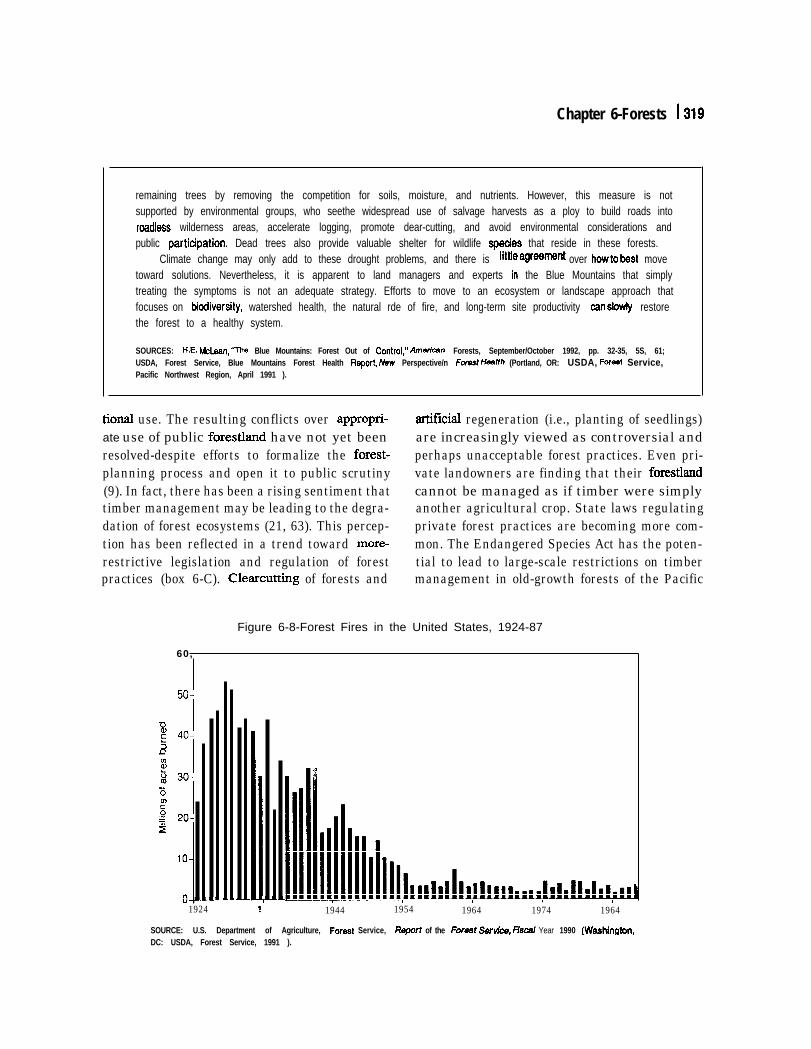
Chapter 6-Forests 1319
remaining trees by removing the competition for soils, moisture, and nutrients. However, this measure is notsupported by environmental groups, who seethe widespread use of salvage harvests as a ploy to build roads intoroadless wilderness areas, accelerate logging, promote dear-cutting, and avoid environmental considerations andpublic partiapation. Dead trees also provide valuable shelter for wildlife spedes that reside in these forests.
Climate change may only add to these drought problems, and there is Iittleagreement over howtobest movetoward solutions. Nevertheless, it is apparent to land managers and experts in the Blue Mountains that simplytreating the symptoms is not an adequate strategy. Efforts to move to an ecosystem or landscape approach thatfocuses on biodiversity, watershed health, the natural rde of fire, and long-term site productivity oan slowly restorethe forest to a healthy system.
SOURCES: H.E. Mcban, ‘q’he Blue Mountains: Forest Out of Oontrol,” Arnekarr Forests, September/October 1992, pp. 32-35, 5S, 61;USDA, Forest Service, Blue Mountains Forest Health ReporC hkw Perspective/n Forest Health (Portland, OR: USDA, Foreet Service,Pacific Northwest Region, April 1991 ).
tional use. The resulting conflicts over appropri- tilcial regeneration (i.e., planting of seedlings)ate use of public forestland have not yet beenresolved-despite efforts to formalize the forest-planning process and open it to public scrutiny(9). In fact, there has been a rising sentiment thattimber management may be leading to the degra-dation of forest ecosystems (21, 63). This percep-tion has been reflected in a trend toward more-restrictive legislation and regulation of forestpractices (box 6-C). Clearcutting of forests and
are increasingly viewed as controversial andperhaps unacceptable forest practices. Even pri-vate landowners are finding that their forestlandcannot be managed as if timber were simplyanother agricultural crop. State laws regulatingprivate forest practices are becoming more com-mon. The Endangered Species Act has the poten-tial to lead to large-scale restrictions on timbermanagement in old-growth forests of the Pacific
Figure 6-8-Forest Fires in the United States, 1924-87
60,
50-
-u2 40-3G(/)al$j 30-
T5U)
g 20-2
lo-
0--1924 1944 1954 1964 1974 1964
SOURCE: U.S. Department of Agriculture, Foreet Service, Report of the Forest Sendcs, E/sad Year 1990 (Waehin@on,DC: USDA, Forest Service, 1991 ).
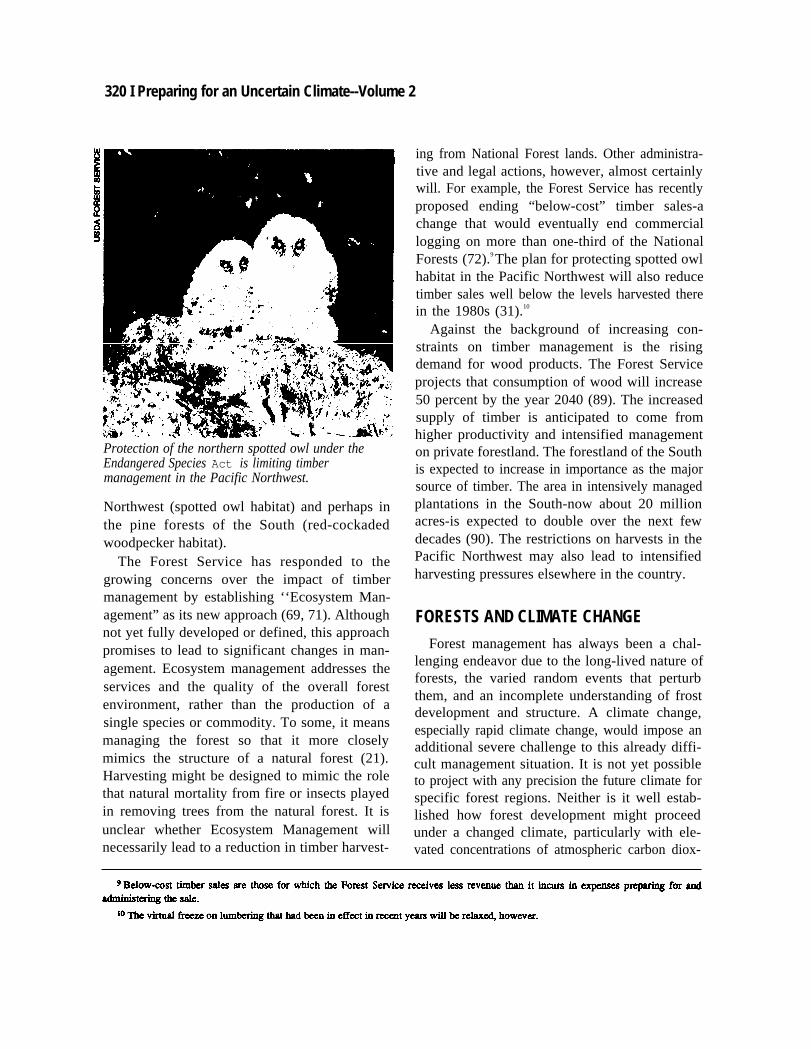
320 I Preparing for an Uncertain Climate--Volume 2
Protection of the northern spotted owl under theEndangered Species Act is limiting timbermanagement in the Pacific Northwest.
Northwest (spotted owl habitat) and perhaps inthe pine forests of the South (red-cockadedwoodpecker habitat).
The Forest Service has responded to thegrowing concerns over the impact of timbermanagement by establishing ‘‘Ecosystem Man-agement” as its new approach (69, 71). Althoughnot yet fully developed or defined, this approachpromises to lead to significant changes in man-agement. Ecosystem management addresses theservices and the quality of the overall forestenvironment, rather than the production of asingle species or commodity. To some, it meansmanaging the forest so that it more closelymimics the structure of a natural forest (21).Harvesting might be designed to mimic the rolethat natural mortality from fire or insects playedin removing trees from the natural forest. It isunclear whether Ecosystem Management willnecessarily lead to a reduction in timber harvest-
ing from National Forest lands. Other administra-tive and legal actions, however, almost certainlywill. For example, the Forest Service has recentlyproposed ending “below-cost” timber sales-achange that would eventually end commerciallogging on more than one-third of the NationalForests (72).9 The plan for protecting spotted owlhabitat in the Pacific Northwest will also reducetimber sales well below the levels harvested therein the 1980s (31).10
Against the background of increasing con-straints on timber management is the risingdemand for wood products. The Forest Serviceprojects that consumption of wood will increase50 percent by the year 2040 (89). The increasedsupply of timber is anticipated to come fromhigher productivity and intensified managementon private forestland. The forestland of the Southis expected to increase in importance as the majorsource of timber. The area in intensively managedplantations in the South-now about 20 millionacres-is expected to double over the next fewdecades (90). The restrictions on harvests in thePacific Northwest may also lead to intensifiedharvesting pressures elsewhere in the country.
FORESTS AND CLIMATE CHANGE
Forest management has always been a chal-lenging endeavor due to the long-lived nature offorests, the varied random events that perturbthem, and an incomplete understanding of frostdevelopment and structure. A climate change,especially rapid climate change, would impose anadditional severe challenge to this already diffi-cult management situation. It is not yet possibleto project with any precision the future climate forspecific forest regions. Neither is it well estab-lished how forest development might proceedunder a changed climate, particularly with ele-vated concentrations of atmospheric carbon diox-
—.
horn forest fires, insects, and pathogens might bedriven by climate change is also unknown.Despite these uncertainties, it is known thatclimate and shorter-term weather extremes areimportant regulators of natural-forest structureand health. Climate is the long-term regulator offorest distribution; weather extremes and iweather-related stresses are the primary drivers of changesin forest structure.
The projected global temperature increases of5 “F (3 ‘C) could mean that the ideal range formany forest species shifts north by 200 to 300miles (33, 34, 50). In the long-term, perhaps aftermany hundreds of years, species will graduallymigrate or compete to become established in newranges, changing the composition of forests.However, the slow rate at which trees mature andthe limited distance over which seed is naturallydispersed by wind and animals (15, 68) arethought to limit forest migration to about 25 milesper century. In the mean time, forests stranded ina climate unlike that of their present range maybeexposed to stresses that will lead to declininggrowth rates and increased mortality. The vulner-ability of a forest to climate change may dependupon the forest’s location, biology, and manage-ment. Whether the effects of climate change areof concern, will depend upon the purposes forwhich the forest is owned or managed. Changesin forest condition may trigger adjustments inregional timber industries and alter the recrea-tional and amenity services provided by eachregion’s forests.
9 The Long TermClimatic variables, principally temperature and
moisture, establish the geographic range ofplants, animals, and ecosystems. The currentdistribution of forests represents species assem-
Chapter 6--Forests I 321
blages adapted to the range of today’s climate.Climate change can alter this mix. The ultimateresponse would be a change in the geographicaldistribution of species and in forest communitytypes. There could be impacts on reproductivebiology, on the efficiency of resource acquisitionand use, and on the relative competitiveness of thespecies in each community. If climate change israpid, new trees that become established maythemselves later be threatened by the continu-ously changing climate.
The very long-term effects of climate changemay vary widely by region, but they are expectedto include a shifted and reduced range for manytree species, along with changes in the speciescomposition of forests. In the end, some forest-land could become more productive as longergrowing seasons, greater warmth, and risingatmospheric CO2 concentrations promote growth.Other forest regions could decline due to thedrying effects of warmer temperatures, changes inthe seasonal distribution of rainfall, or the inabil-ity of existing trees to compete against grasses,shrubs, and less-valued trees.
Various methods have been used to predictlong-term forest responses to altered climate.Some researchers have attempted to relate cli-matic requirements of individual tree species tothe conditions thought to be likely under a futureclimate.110thers have looked at historical changesin vegetation-those that occurred during thewarming that followed the ice ages—to predictfuture vegetation changes.12 Mathematical simu-lations of forest growth provide an alternativeapproach to estimating the response of forests toa changing climate (5, 74).13 The general conclu-sions from these predictive exercises suggest thatproductivity in areas where cold temperatures
11 ~ ~~~e IMS been used to e xmni.ne potential effects of future climates on forests in California (1 16), the Southeast (53, 116), andthe we5tern United States (46).
12 fit titriktiom ofvegeutionc~be reconstructed~ using fossil pollen from the periods of abrupt climate C- dti b ~t _transition (59). These distributions have been used to model the Iong-term response of current forest vegetation to a change in climate (58, 61).
13 Stition ~~Wes ~ve ken u~ t. m~el forest development ~ tie ~tem u~t~ S~&S (62, ’79, 110), M A&ik bo~ fo~t
(4), and the Paciilc Northwest forests (14, 40).
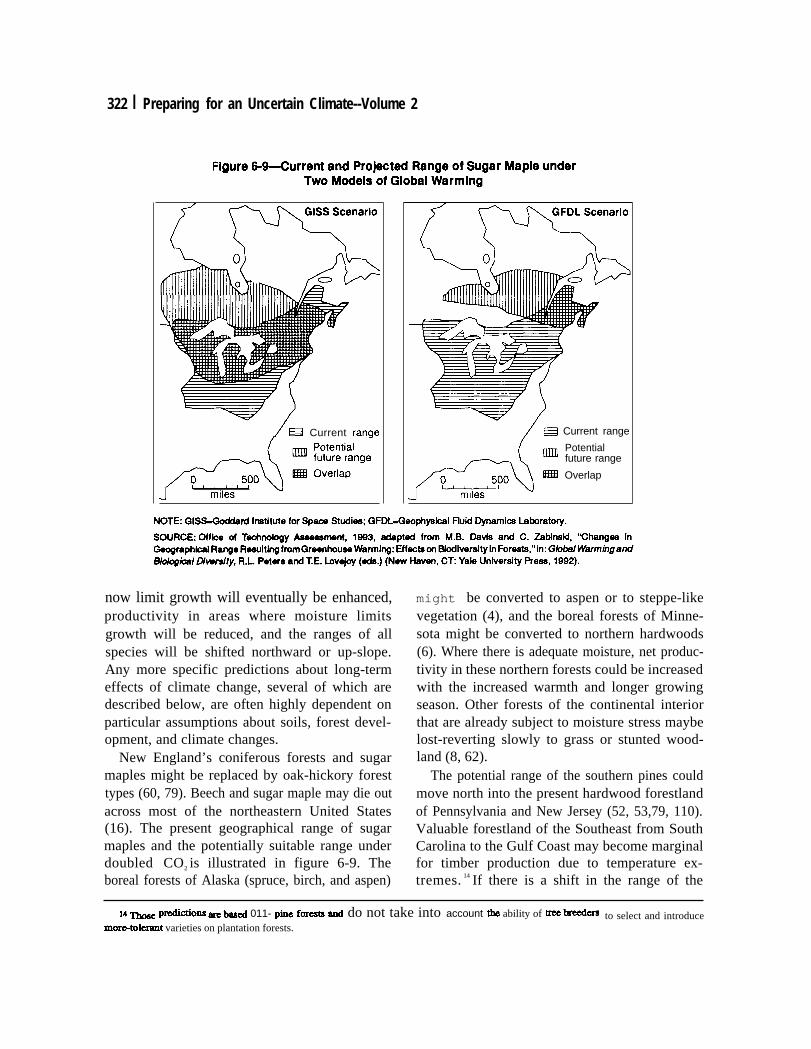
322 I Preparing for an Uncertain Climate--Volume 2
(’L
/ ~ Current ra.ge
?’ mGFDL’enar’O\ 0)
~ Current range
UIIn Potentialfuture range
EBB Overlap
now limit growth will eventually be enhanced,productivity in areas where moisture limitsgrowth will be reduced, and the ranges of allspecies will be shifted northward or up-slope.Any more specific predictions about long-termeffects of climate change, several of which aredescribed below, are often highly dependent onparticular assumptions about soils, forest devel-opment, and climate changes.
New England’s coniferous forests and sugarmaples might be replaced by oak-hickory foresttypes (60, 79). Beech and sugar maple may die outacross most of the northeastern United States(16). The present geographical range of sugarmaples and the potentially suitable range underdoubled CO2 is illustrated in figure 6-9. Theboreal forests of Alaska (spruce, birch, and aspen)
might be converted to aspen or to steppe-likevegetation (4), and the boreal forests of Minne-sota might be converted to northern hardwoods(6). Where there is adequate moisture, net produc-tivity in these northern forests could be increasedwith the increased warmth and longer growingseason. Other forests of the continental interiorthat are already subject to moisture stress maybelost-reverting slowly to grass or stunted wood-land (8, 62).
The potential range of the southern pines couldmove north into the present hardwood forestlandof Pennsylvania and New Jersey (52, 53,79, 110).Valuable forestland of the Southeast from SouthCarolina to the Gulf Coast may become marginalfor timber production due to temperature ex-tremes. 14 If there is a shift in the range of the
Mm= PIUIMOQS m bSSd 011- pine f- and do not take into account the ability of tree br=xkra to select and introducemortMolcrant varieties on plantation forests.
Chapter 6-Forests I 323
loblolly pine forests into more mountainousnorthern regions, it could mean higher costs oftimber management. Rising sea levels in thecoastal plain could threaten perhaps 10 percent ofthe southern pines and some of the associatedpulp and paper mills (29).
In the West, the range of ponderosa pine ispredicted to move up-slope at the expense ofspecies that are less tolerant of dry soils, such asfirs (46). The Douglas-fro may expand or at leastmaintain its range over most of its commerciallyimportant distribution. The upper elevation ofDouglas-fir is expected to move up-slope (14);coastal Douglas-fir stands are expected to berelatively unchanged. Douglas-fir stands in drierregions may be lost, however.
The potential effects of elevated CO2 o nlong-term forest productivity are not well-understood. Trees, like other plants, are expectedto benefit from elevated CO2 by showing im-proved growth and greater efficiency in water use.Laboratory studies do, in fact, find that seedlingsof many tree species respond positively to ele-vated C02 (36, 43, 53). However, the large sizeand long life span of trees make extendedexperimental studies difficult. There are someindications that the increases in productivity donot continue over long time periods or if nutrientsand/or water are limiting (3, 64). Forest trees facecompetition from other trees and plants. Thosespecies most favored by elevated CO2 may not bethe species that are valued within the forest; forexample, more rapid growth by shrubby or smalltrees could tend to suppress development of largerspecies. For these reasons, many researchers arecautious in extrapolating from experimental stud-ies that show increased growth rates to ecosystemeffects.
9 The Transition PeriodThe frost observable effects of climate change
will not be so much climate-related as weather-related. 15 The near-term effects of climate changewill be driven by changes in weather extremesand mediated through those stressors that havealways been the primary controllers of foreststructure and health-insects, disease, winds, andfire. Even in regions where forest productivitymay be ultimately improved, the transition periodcould be extended and punctuated by suddendieback and decline.l6 Forests are complex,long-lived systems that can only slowly adjust toclimate but that can suddenly be threatened byweather-related stresses.
The near-term response of forest systems toclimate change will involve complex reactions tonew averages, new patterns, and new extremes inweather variables. Some forest species that arespecialized to current climate conditions may notthrive (44). Altered patterns of exposure to highand low temperatures could mean that winterchilling requirements will not be met (38).Flowering, seed-formation, and seed-dispersalprocesses could be disrupted especially if polle-nators do not adjust to changing conditions (11).With longer growing seasons, trees might addmore light earlywood relative to the dense late-wood that forms at the end of the growing season(66). This would mean a lower-quality wood forstructural lumber and higher costs for pulp mills.Changes in early-growing-season weather condi-tions, particularly moisture and frosts, may effectthe establishment of seedlings. Warmer andmoister weather might favor the spread and boostthe significance of certain fungal diseases andinsect pests. Elsewhere, the drying effects ofhigher temperatures could be especially damag-ing, especially where the frequency of drought isincreased. Associated with droughts would be
15 Thoughtful discussions of the importance of clearly defii climate (average) vs. weather (extreme) effects ~ provided in mfmnus22 and 23. See also chapter 2.
16A model of the kcreme in atmospheric C02 that could result from the dieback in forests is discussed in reference 39. The POtmuy @erelease of COZ to the atmosphere could speed up the rate of climate change.
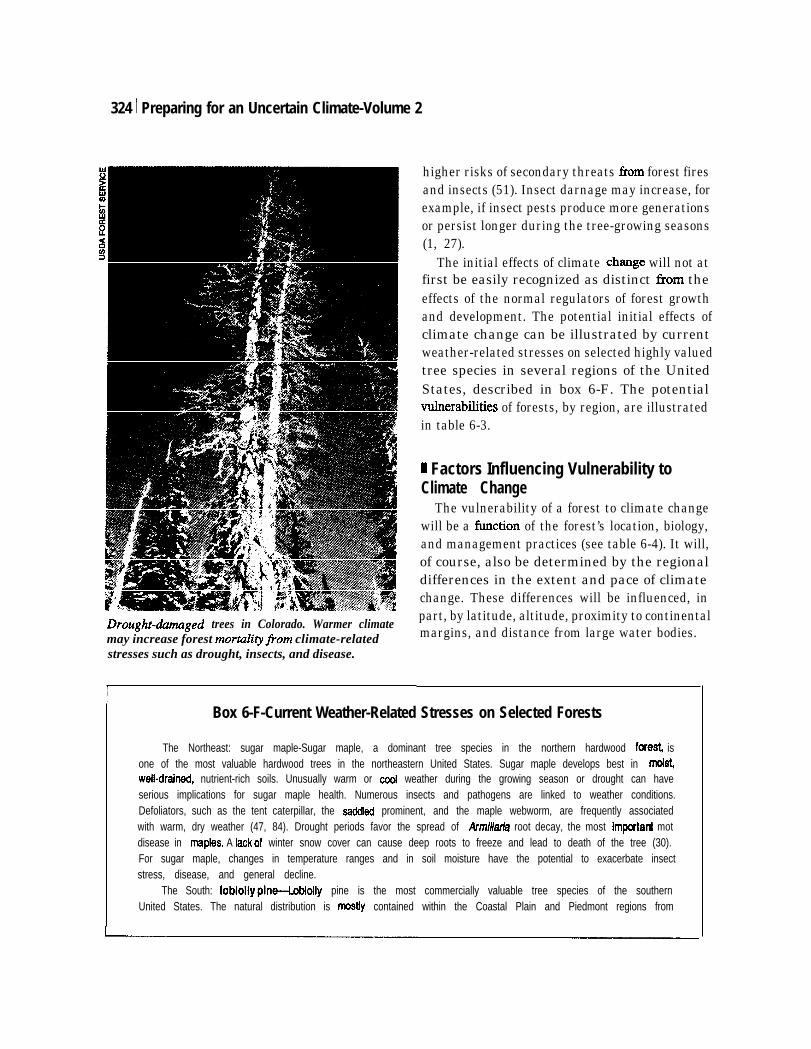
324 I Preparing for an Uncertain Climate-Volume 2
Drought-dumaged trees in Colorado. Warmer climatemay increase forest mortalityfiom climate-relatedstresses such as drought, insects, and disease.
I
higher risks of secondary threats fkom forest firesand insects (51). Insect darnage may increase, forexample, if insect pests produce more generationsor persist longer during the tree-growing seasons(1, 27).
The initial effects of climate chauge will not atfirst be easily recognized as distinct horn theeffects of the normal regulators of forest growthand development. The potential initial effects ofclimate change can be illustrated by currentweather-related stresses on selected highly valuedtree species in several regions of the UnitedStates, described in box 6-F. The potentialvulnerabilities of forests, by region, are illustratedin table 6-3.
H Factors Influencing Vulnerability toClimate Change
The vulnerability of a forest to climate changewill be a fimction of the forest’s location, biology,and management practices (see table 6-4). It will,of course, also be determined by the regionaldifferences in the extent and pace of climatechange. These differences will be influenced, inpart, by latitude, altitude, proximity to continentalmargins, and distance from large water bodies.
Box 6-F-Current Weather-Related Stresses on Selected Forests
The Northeast: sugar maple-Sugar maple, a dominant tree species in the northern hardwood forem isone of the most valuable hardwood trees in the northeastern United States. Sugar maple develops best in mds$welldrained, nutrient-rich soils. Unusually warm or COOI weather during the growing season or drought can haveserious implications for sugar maple health. Numerous insects and pathogens are linked to weather conditions.Defoliators, such as the tent caterpillar, the saddied prominent, and the maple webworm, are frequently associatedwith warm, dry weather (47, 84). Drought periods favor the spread of Afrn///ada root decay, the most impwtant motdisease in maptes. A Iackof winter snow cover can cause deep roots to freeze and lead to death of the tree (30).For sugar maple, changes in temperature ranges and in soil moisture have the potential to exacerbate insectstress, disease, and general decline.
The South: Ioblolly pln~dly pine is the most commercially valuable tree species of the southernUnited States. The natural distribution is mostiy contained within the Coastal Plain and Piedmont regions from
Chapter 6-Forests 1325
Virginia to eastern Texas. It is often mixed with shortleaf or Iongleaf pines, dominating these stands in areas withhigh soil moisture. Numerous important biotic stressors of Ioblolly pine are intimately related to weather conditions.The southern pine beetle is the most destructive forest insect of the Southeast. Prolonged drought stress and warmweather favor expansion of beetle populations, predisposing trees to being attacked and allowing extragenerations to develop during the growing season (26, 27). Fungal diseases, such as fusiform rust, which causessignificmt economic loss, are favored by warmer and moister weather conditions (93). Fires can be a significantfactor in shaping these forests. An increased fire frequency, which might result under warmer and drier conditions,would favor Iongleaf pine or shrub growth over Ioblolly pine. Increased frequencies of hurricanes or major stormswould add to existing risks to pines of the coastal plain. Warmer weather, with or without altered preapitation, isjudged to have the potential to increase the risks to most southeastern forests.
The Mountain West: ponderosa pin&Ponderosa pine is extensively distributed west of the Great Plains,primarily at lower elevations and relatively dry sites. Many of its insect and pathogen stressors are Iinkedto weathercycles. The most damaging insects to ponderosa pine are bark beeties, which are favored by drought conditions.For example, during the drought in the late 1960s, California saw increased ponderosa pine mortality due to beetleactivity (93). Fires in much of the ponderosa pine regions are frequent, often large, and sometimes damaging.Although ponderosa pine is favored in a fire regime, the overall productivity of the forest could dedine with morefrequent fires. Any increase in the frequency of lightning strikes or in drought severity will increase the risk of fire.Because of the dry habitat of ponderosa pine, this species may become more competitive undera warmer climate(46). Success at the stand level, however, depends more on near-term weather events and the interactions ofweather extremes with pest, fire, and other stresses.
The Pacific Northwest: Douglas-fir—Douglas-fir is the most important commercial tree species of theNorthwest. The Douglas-fir has developed in a region dominated by wet winters and dry summers. Much of themorbidity, mortality, and growth loss in the Pacific Northwest is caused by dwarf mistletoe infection and stemwooddecay. These stressors are not particularly important in the more productive coastal forest and do not appear tobe regulated by weather. insect defoliators are relatively unimportant in the moist coastal forests. Root diseases,which are of somewhat greater concern, seem to be only indirectly affected by temperature. With the relatively longinterval between fire and wind events and with the lack of cfimate-driven stress, it appears that the coastalDouglas-fir forests will be relatively resistant to near-term stresses under a changing climate, unless there is severedrying. Insects and fire present a greater risk to the Douglas-fir in the less-humid interior West. Outbreaks of theDouglas-fir tussock moth occur in the drier regions where fir overlaps in range with ponderosa pine. l%e westernspruce budworm and Douglas-fir bark beetle can also be damaging to fir growing under drier conditions. Extensivemortality from insects and diseasa has already occurred in the Douglas-fir of the drought-stricken Blue Mountainsof eastern Oregon (see box 6-E). Further drying under climate change would be very damaging to the Douglas-firof the interior W6st.
Alaska: spruce-White and black spruce are the principal components of the boreal forest ofinterior Alaska.The environment of irtterior Alaska is harsh, and abiotic stresses are numerous and severe. Fire is an integral partof the ecosystem. Snow, ice, and wind damage are frequent, and permafrost development and poor soil drainageare often problems. The most damaging forest insect in Alaska is the spruce beetie, a bark beetle that is verysensitive to weather events. Extended growing seasons would increase the period of exposure to beetfepopulations and allow for greater damage. The weather-related nature of the many stresses on these forestssuggests that they could be rapidly affected by a changed climate.
SOURCE: office of Technology Aasessmen~ 1993; W.H. Smith, “United States Forest Response and Vulnerability to Climate Change,”contractor paper prepared for the office of T~hnology Assessment, June 1992; C.F. Cooper, “Sensitivities of V&etern Ecoeysteme toClimate Change,” contractor paper prepared for the Offke of Technology keessmen~ August 1992.
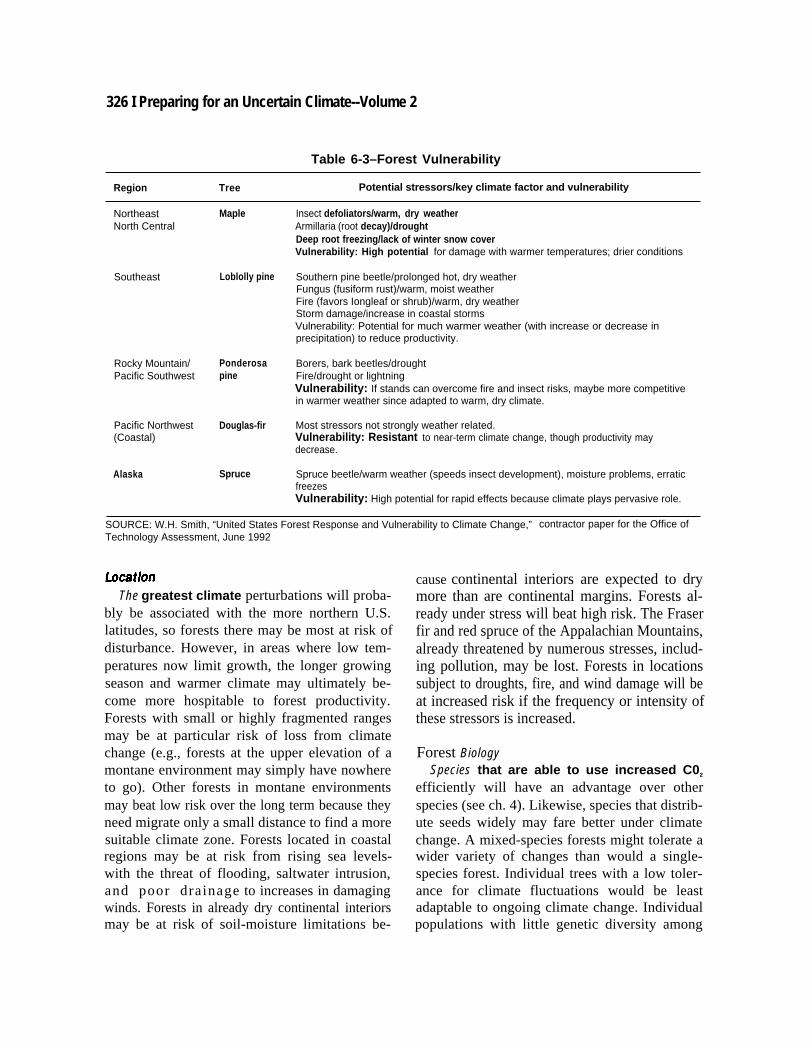
326 I Preparing for an Uncertain Climate--Volume 2
Table 6-3–Forest Vulnerability
Region Tree Potential stressors/key climate factor and vulnerability
NortheastNorth Central
Southeast
Rocky Mountain/Pacific Southwest
Pacific Northwest(Coastal)
Alaska
Maple
Loblolly pine
Ponderosapine
Douglas-fir
Spruce
Insect defoliators/warm, dry weatherArmillaria (root decay)/droughtDeep root freezing/lack of winter snow coverVulnerability: High potential for damage with warmer temperatures; drier conditions
Southern pine beetle/prolonged hot, dry weatherFungus (fusiform rust)/warm, moist weatherFire (favors Iongleaf or shrub)/warm, dry weatherStorm damage/increase in coastal stormsVulnerability: Potential for much warmer weather (with increase or decrease inprecipitation) to reduce productivity.
Borers, bark beetles/droughtFire/drought or lightningVulnerability: If stands can overcome fire and insect risks, maybe more competitivein warmer weather since adapted to warm, dry climate.
Most stressors not strongly weather related.Vulnerability: Resistant to near-term climate change, though productivity maydecrease.
Spruce beetle/warm weather (speeds insect development), moisture problems, erraticfreezesVulnerability: High potential for rapid effects because climate plays pervasive role.
SOURCE: W.H. Smith, “United States Forest Response and Vulnerability to Climate Change,” contractor paper for the Office ofTechnology Assessment, June 1992
LocationThe greatest climate perturbations will proba-
bly be associated with the more northern U.S.latitudes, so forests there may be most at risk ofdisturbance. However, in areas where low tem-peratures now limit growth, the longer growingseason and warmer climate may ultimately be-come more hospitable to forest productivity.Forests with small or highly fragmented rangesmay be at particular risk of loss from climatechange (e.g., forests at the upper elevation of amontane environment may simply have nowhereto go). Other forests in montane environmentsmay beat low risk over the long term because theyneed migrate only a small distance to find a moresuitable climate zone. Forests located in coastalregions may be at risk from rising sea levels-with the threat of flooding, saltwater intrusion,and poor drainage to increases in damagingwinds. Forests in already dry continental interiorsmay be at risk of soil-moisture limitations be-
cause continental interiors are expected to drymore than are continental margins. Forests al-ready under stress will beat high risk. The Fraserfir and red spruce of the Appalachian Mountains,already threatened by numerous stresses, includ-ing pollution, may be lost. Forests in locationssubject to droughts, fire, and wind damage will beat increased risk if the frequency or intensity ofthese stressors is increased.
Forest BiologySpecies that are able to use increased C02
efficiently will have an advantage over otherspecies (see ch. 4). Likewise, species that distrib-ute seeds widely may fare better under climatechange. A mixed-species forests might tolerate awider variety of changes than would a single-species forest. Individual trees with a low toler-ance for climate fluctuations would be leastadaptable to ongoing climate change. Individualpopulations with little genetic diversity among
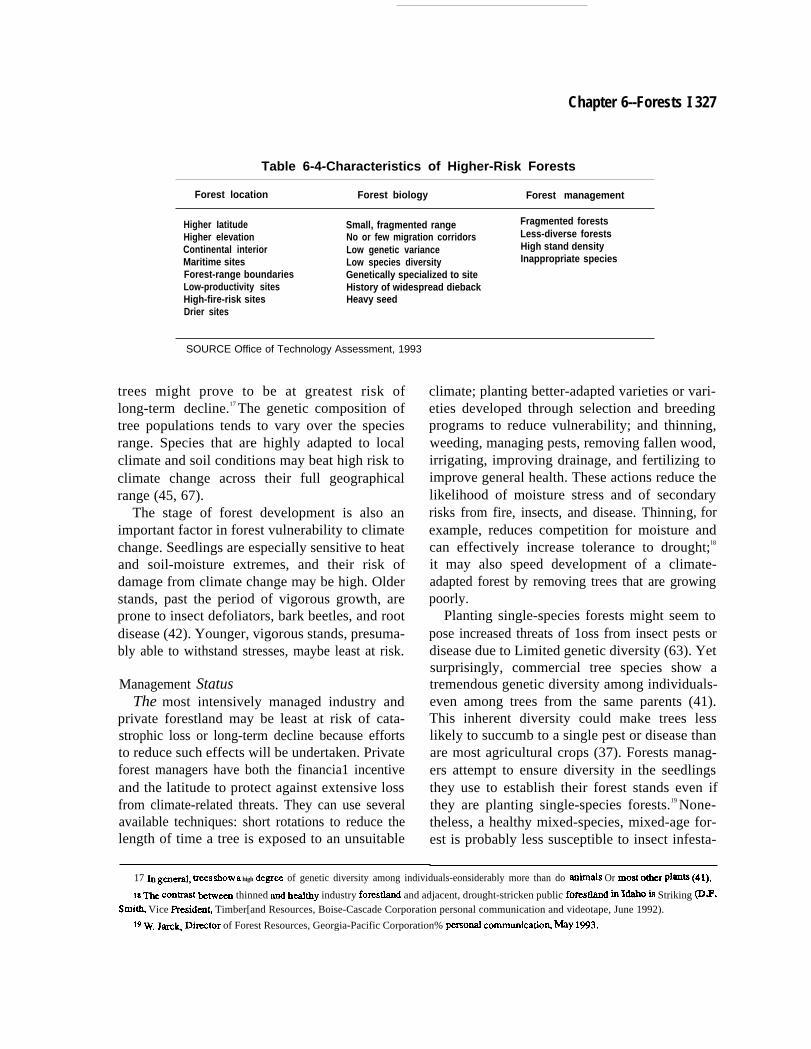
Chapter 6--Forests I 327
Table 6-4-Characteristics of Higher-Risk Forests
Forest location Forest biology Forest management
Higher Iatitude Small, fragmented range Fragmented forests
Higher elevation No or few migration corridors Less-diverse forestsContinental interior Low genetic variance High stand densityMaritime sites Low species diversity Inappropriate speciesForest-range boundaries Genetically specialized to siteLow-productivity sites History of widespread diebackHigh-fire-risk sites Heavy seedDrier sites
SOURCE Office of Technology Assessment, 1993
trees might prove to be at greatest risk oflong-term decline.17 The genetic composition oftree populations tends to vary over the speciesrange. Species that are highly adapted to localclimate and soil conditions may beat high risk toclimate change across their full geographicalrange (45, 67).
The stage of forest development is also animportant factor in forest vulnerability to climatechange. Seedlings are especially sensitive to heatand soil-moisture extremes, and their risk ofdamage from climate change may be high. Olderstands, past the period of vigorous growth, areprone to insect defoliators, bark beetles, and rootdisease (42). Younger, vigorous stands, presuma-bly able to withstand stresses, maybe least at risk.
Management StatusThe most intensively managed industry and
private forestland may be least at risk of cata-strophic loss or long-term decline because effortsto reduce such effects will be undertaken. Privateforest managers have both the financia1 incentiveand the latitude to protect against extensive lossfrom climate-related threats. They can use severalavailable techniques: short rotations to reduce thelength of time a tree is exposed to an unsuitable
climate; planting better-adapted varieties or vari-eties developed through selection and breedingprograms to reduce vulnerability; and thinning,weeding, managing pests, removing fallen wood,irrigating, improving drainage, and fertilizing toimprove general health. These actions reduce thelikelihood of moisture stress and of secondaryrisks from fire, insects, and disease. Thinning, forexample, reduces competition for moisture andcan effectively increase tolerance to drought; l8
it may also speed development of a climate-adapted forest by removing trees that are growingpoorly.
Planting single-species forests might seem topose increased threats of 1oss from insect pests ordisease due to Limited genetic diversity (63). Yetsurprisingly, commercial tree species show atremendous genetic diversity among individuals-even among trees from the same parents (41).This inherent diversity could make trees lesslikely to succumb to a single pest or disease thanare most agricultural crops (37). Forests manag-ers attempt to ensure diversity in the seedlingsthey use to establish their forest stands even ifthey are planting single-species forests.19 None-theless, a healthy mixed-species, mixed-age for-est is probably less susceptible to insect infesta-
17 l.ugm~ai, trees ShOW a high dqpe of genetic diversity among individuals-eonsiderably more than do rmimah Or mOSt O~r p@tS (41).
la TIM con-t &mv~ thinned and hcdthy industry forestland and adjacent, drought-stricken public forestland ti IdahO is Striking ([email protected]& Vice president Timber[and Resources, Boise-Cascade Corporation personal communication and videotape, June 1992).
19 W. JWC~ D&tor of Forest Resources, Georgia-Pacific Corporation% peIsOrud COmm~CatiO14 My 1993.
328 I Preparing for an Uncertain Climate--Volume 2
tion than are extensive contiguous areas ofuniformly aged forests.20
Less-managed forests may not be inherently atany greater risk than actively managed forests.However, once a decline in forest health begins,less-managed forests may face greater tire andpest damage. At particular risk will be thoseforests already subject to moisture stress and firehazard. Once they are subjected to stress, wilder-ness forests and National Parks may be at elevat-ed risk of substantial decline due to policyrestrictions imposed on silvicultural and pest-management activities. Similarly, because man-agement is currently limited on most NationalForest lands and the less-productive nonindustrialprivate forestland, those forests could be at risk ofunchecked loss. If the general health of theseforests declines, vulnerability to large-scale mor-tality could increase.
B Forest Values at RiskThe services for which forests are managed
range from the protection of naturalness (see ch.5) to timber production. The significance of forestdecline or change depends almost entirely onwhat the forest is being used for. For example,decay of the trunk and loss of timber would be ofgreat concern in a forest managed for woodproducts. However, it would be relatively withoutconsequence in a forest managed for watershedprotection, and could be of value in a forestmanaged to favor habitat for cavity-nesting birds.
Commercial Timber ProductsForests maintained for the production of wood
products and fiber would benefit from any near-term or long-term increase in productivity. Re-duced growth or increased mortality would havea damaging effect on them. Managers of industryforests and other private timberlands can beexpected to respond with adaptive measures ifand when they perceive changes in climate andmarket conditions. Although no timber company
is altering forest practices today, some are ac-tively preparing for the types of risks posed byclimate change. Weyerhaeuser, for example, isconducting experimental silvicultural programsto examine the effects of thinning practices onameliorating the effects of droughts (19). It isalso sponsoring research on the genetics, physiol-ogy, and biotechnology of heat- and drought-tolerant seedlings. Such technological develop-ments should help protect the timber industry andfuture wood supplies.
Despite the possibility of some adaptive man-agement responses, climate change could still bevery costly to the timber industry. In the southernUnited States, declining timber volumes couldlead to $300” million in lost annual revenues,whereas the increased management measuresneeded to compensate for poorer conditions couldadd $100 million to the annual costs of produc-tion (29, 66). A sea level rise could force themovement of coastal pulp and paper mills, furtherincreasing the costs of climate change. Some ofthese mills would cost as much as $1 billion toreplace.
For the Pacific Northwest, an expanded up-slope range of the Douglas-fir forests might addsome 5 percent to the regional timber harvest (29).However, the increased costs of logging at higherelevations could offset much of this potentialgain. Furthermore, with the increasing institu-tional and environmental constraints on harvest-ing in the Pacific Northwest (e.g., the spotted owlrecovery plan), increased harvest levels from thisregion seem unlikely.
Recreation, Wildlife, and AmenitiesModest changes in forest productivity may
have little impact on the recreational or aestheticvalues of the forest. However, extensive diebackand mortality could have considerable impacts. Astudy of the economic costs associated with forestmortality caused by an insect infestation in theFront Range of the Colorado Rocky Mountains
m R. H~de@ Profssor, Department of Forest Resourees, Clemson University, personal CommtiCtiow J~UUY 1993.
Chapter 6-Forests 1329
gives a sense of the importance of these recrea-tional and aesthetic values (113). Each house-hold in the region would have been willing to pay~ost $60 per year to avoid the reduced attract-iveness of the forest caused by insect infesta-tion. Dry timber in dead forests adds to fire risks,threatening adjacent forests and property (see box6-G). Indeed, the costs of removal of dead treesand the temporary loss in property value in theurban and suburban settings might be among thehighest costs associated with climate change.
Longer-term change in forest composition maybe of little sigtilcance to the value of some
services, including providing recreation, enhanc-ing landscape and water quality, and protectingagainst soil erosion. However, certain species thatdepend on the unique structure of an existingforest could be at great risk (e.g., Kirtland’swarbler and the spotted owl). The costs ofprotecting threatened and endangered speciescould rise considerably if it becomes difficult tomaintain specialized habitat (see ch. 5). Theproduction of certain forest outputs-for exam-ple, seeds, nuts, pharma ceuticals, resins, andsyrupis also highly species dependent. Simi-larly, some tourist and recreational activities
Box 6-G-Private Property and Fire Risk
If dirnate change leads to drier conditions in forested areas (as some climate models predict), wildfire riskis likely to increase as trees become more susceptible to disease and mortatit y. Because of recent droughts and100 years of fire-suppression policy, many forests are already experiencing massive diebacks and holdingexcessive fuel loads. Over half of some western forests, like those in the Blue Mountains in Oregon (see box S-A),contain dead and dying trees and are especially prone to catastrophic fire (92). Combining prescribed fire and agradual reintroduction of the natural fire regime to some forested areas is one proposed way to reduce fire riskin places already primed for wildfire as well as to reduce risk in a drier climate (48). However, many forests arealready so dry that even controlled burning carries unacceptable risks of turning into an uncontrolled wildfire. Inaddition, a natural fire regime in many natural areas is much less feasible now than 150 years ago, when preservescontained virtually no development. Because natural areas are increasingly popular places for people seekingescape and solitude from urban life to build vacation and weekend homes, a “let-burn” policy is nearly impossiblewithout destroying life and property.
Wildfires have contributed to significant losses in recent years. In 1990, eight large wildfires contributed toover $305 million losses in property damage+7 percent of total losses due to large fires in the United States thatyear. Over 700 homes were destroyed and 270,000 acres (110,000 hectares)l burned. Wildfires were the largestsingle type of fire in 1990, and in all fires with large losses, dry weather and vegetation were named as majorcontributing factors. More recently, fires near Lake Tahoe, caused by extremely dry weather conditions, charred24,000 acres, destroyed over 30 homes, and incurred roughly $250 million in damage.
As climate becomes drier and more people build vacation and weekend homes on forestland, the potentiallosses due to uncontrolled wildfire become even more devastating. As widespread use of prescribed fire in theseareas to reduce fuel loading becomes less feasible-because it carries great risks of becoming uncontroliabte-alternatives to reduce fire risk must be examined. The sheer magnitude of the problem makes it impossible toenforce codes on all properties. Also, the public benefit derived from using risk-reducing measures on privateproperty is not recognized as a public benefit. Conversely, private owners are not held liable for neglecting to usefire safety measures that result in passing the fire risk to adjacent lands. In addition, It Is generally accepted thatthe public agencies ultimately have the responsibility to protect homes from fire.
1 To convert acres to hectares, multiply by 0.405.(Continuedon rmxtpage)
3301 Preparing for an Uncertain Climate-Volume 2
Box 6-G–Private Property and Fire Risk-(Continued)
Although many aspects of this problem are best handled by State and local authorities, there are opportunitiesfor Federal involvement, especially for areas containing large Federal holdings mixed with private parcels. Somepossible land-protection measures include fuel management (thinning dead, flammable wood) combined with aconversion to a less hazardous type of tree around structures and in strategic locations such as ridge tops. This“fuel-break” method has proven effective in saving life, property, and fire-suppression costs. It is costiy, however,and may therefore be feasible only in smaller areas or in areas where the fuel breaks are used for multipb purposes(e.g., wildlife, recreation, and rangeland) to offset the costs. Opportunities for the Federal Government toencourage fuel-break use on lands mingled with public land include outright purchase of land or an easementagreement where the private landowner is paid to let the public agency build a fuel-break system using some ofthe private land. Improvements in fuel-defense systems through road building and enhanced water facilities maybe feasible in some areas, but less so in or near areas where such development is restricted (i.e., wildernessareas). An improved fire-alert system that informs residents about critical fire and weather conditions regularlycould also reduce risk. Although this may be most appropriate for State and local authorities, the Federal agenciescould play a vital role for residences in or near public holdings.
Although some management actions may partially reduce fire hazards, fire risks are likely to remain fordwellings in natural areas in the future. The presence of private homes in preserves poses an enormous problemfor land managers in dangerously dry areas. There are no dear solutions. A growing population will continue tobe drawn to remote areas, and a drier climate will increase fire risk in National Forests. Although a natural fireregime or a let burn policy maybe the best ecological solution, it may no longer be feasible in wild land tamed bythe presence of private homes.
SOURCES: K.T. Taylor and MJ. Sullivan (ad.) (Quincy, MA: NFPA, May 1992); Anonymous, “Sierra f% BattJe Haats Up,” RenoGazetklournal, June 28,1992, p.lA; Forest Service, Blue Mountains FbrestHealth RepOrLe NewPerspectives in ForestHaalth (Portfand,OR: USDA, Forest SeMce, Paafic Northwest Region, April 1991); USDA, Forest Servicq Protecting Reskdances fmm Wildfkes: A GUMS
for Homeowners, Lawmakers, and Planners, prepared by H.E. More, May 1981.
depend on the nature of the existing forest (e.g., ing the health of nonindustrial private forests.enjoying the colors of autumn foliage and theold-growth and giant sequoia and redwoodstands). For example, a northward retreat of thesugar maple could have significant effects on thetourist industry of the Northeast.
RESPONDING TO CLIMATE CHANGE
The Federa.lGovemment plays several primaryroles in forestry, all of which may be relevant inresponding to climate change concerns. TheGovernment must plan for and manage its ownforests, which make up about one-quarter of thetotal U.S. forestland and include much of theless-managed forest.land. The Government alsohas a cooperative role in protecting and monitor-
Federal forest research, monitoring, and assess-ment efforts will also be valuable in facilitatingbetter adaptation to climate change within theprivate forest sector. The array of major Federallaws and programs under which forest manage-ment and research is regulated or influenced ispresented in table 6-5.
The Federal Government could respond to thethreats that climate change poses to forests invarious ways. Forest-management pmctices—such as seeding, tree planting, thinnm“ g, harvest-ing, and free, weed, and pest control-mi ght bedesigned to delay or offset forest decline or to takeadvantage of new opportunities. Institutionalresponses—incentives programs, cooperative
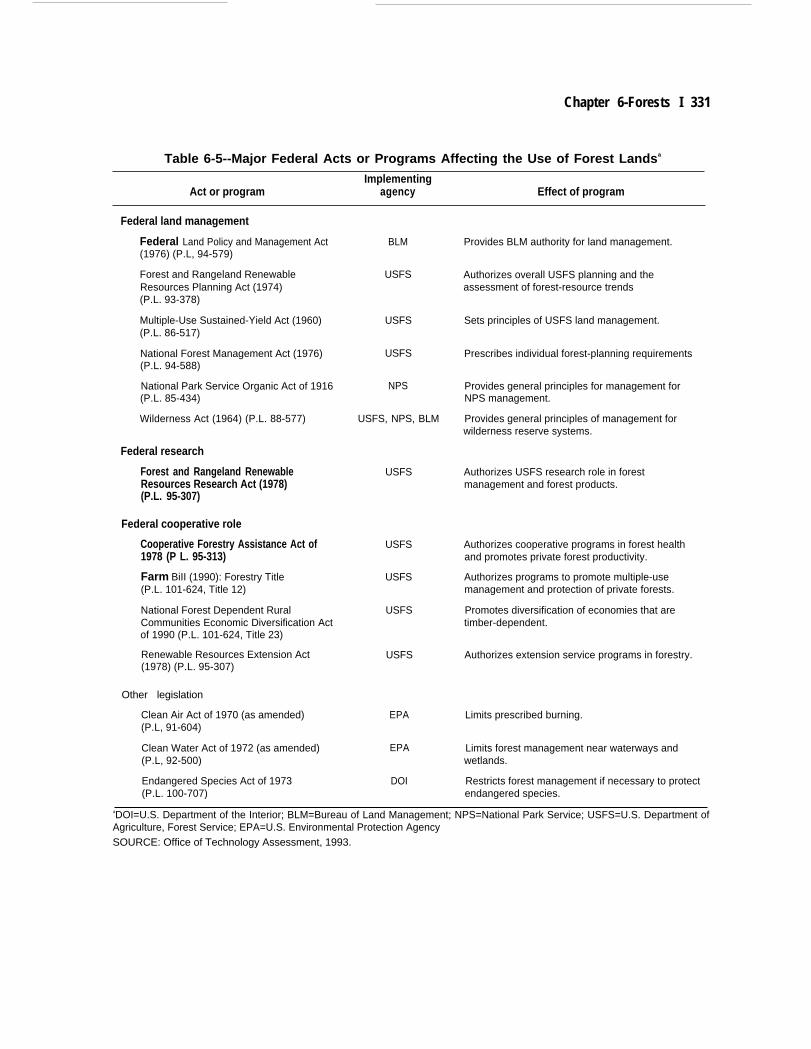
Chapter 6-Forests I 331
Table 6-5--Major Federal Acts or Programs Affecting the Use of Forest Landsa
ImplementingAct or program agency Effect of program
Federal land management
Federal Land Policy and Management Act(1976) (P.L, 94-579)
Forest and Rangeland RenewableResources Planning Act (1974)(P.L. 93-378)
Multiple-Use Sustained-Yield Act (1960)(P.L. 86-517)
National Forest Management Act (1976)(P.L. 94-588)
National Park Service Organic Act of 1916(P.L. 85-434)
Wilderness Act (1964) (P.L. 88-577)
Federal research
Forest and Rangeland RenewableResources Research Act (1978)(P.L. 95-307)
Federal cooperative role
Cooperative Forestry Assistance Act of1978 (P L. 95-313)
Farm BiII (1990): Forestry Title(P.L. 101-624, Title 12)
National Forest Dependent RuralCommunities Economic Diversification Actof 1990 (P.L. 101-624, Title 23)
Renewable Resources Extension Act(1978) (P.L. 95-307)
Other legislation
Clean Air Act of 1970 (as amended)(P.L, 91-604)
Clean Water Act of 1972 (as amended)(P.L, 92-500)
Endangered Species Act of 1973(P.L. 100-707)
BLM
USFS
USFS
USFS
NPS
USFS, NPS, BLM
USFS
USFS
USFS
USFS
USFS
EPA
EPA
DOI
Provides BLM authority for land management.
Authorizes overall USFS planning and theassessment of forest-resource trends
Sets principles of USFS land management.
Prescribes individual forest-planning requirements
Provides general principles for management forNPS management.
Provides general principles of management forwilderness reserve systems.
Authorizes USFS research role in forestmanagement and forest products.
Authorizes cooperative programs in forest healthand promotes private forest productivity.
Authorizes programs to promote multiple-usemanagement and protection of private forests.
Promotes diversification of economies that aretimber-dependent.
Authorizes extension service programs in forestry.
Limits prescribed burning.
Limits forest management near waterways andwetlands.
Restricts forest management if necessary to protectendangered species.
aDOI=U.S. Department of the Interior; BLM=Bureau of Land Management; NPS=National Park Service; USFS=U.S. Department ofAgriculture, Forest Service; EPA=U.S. Environmental Protection AgencySOURCE: Office of Technology Assessment, 1993.
332 I Preparing for an Uncertain Climate--Volume 2
Table 6-6–Suitability of Silvicultural Practices
National NationalSilvicultural practices
Small landForests Parks Industrial owners
Shorter rotations Low Low High IntermediateThinning Intermediate Low High HighSite preparation Low Low High IntermediatePlanting Intermediate Low High IntermediateManage to promote mixed species High Low Low IntermediatePrescribed fire Intermediate Low Low Low
SOURCE: W.H. Smith, “United States Forest Response and Vulnerability to Climate Change,” contractorpaper for the Office of Technology Assessment, June 1992
support, research, monitoring, planning, and pol-icy setting-can serve to reduce the social impactsof change.
Perhaps most importantly, the Federal Gover-nment could ensure technical preparedness forquick response in the event of large-scale mortal-ity. Central to such planning would be thedevelopment of the storage capacity and the fieldtesting of a variety of seeds.
I Federal ForestlandThe large Federal share in forest ownership
allows a significant, direct Federal role in prepar-ing for climate change. Nevertheless, decidinghow or when to respond will not be straightfor-ward. Although forest-management activitiescould speed forest adaptation, any intensificationin management activity might be controversial ifbroadly applied to public forests. On Federalforestland, the response to climate change mustdepend very much on the different services of theforests and on the degree to which those servicesare threatened.
The management approach used on Federalforestland ranges from preserving natural systemsto the moderately active timber managementfound on some multiple-use forests (see box 6-C).Forestland within the wilderness reserve systemis by law off limits to active timber management.Within the National Parks, manipulation of theforest resource is held to the minimum needed topreserve the ecological integrity of the park. The
more extensive multiple-use forestland, includingthe National Forests managed by the ForestService and the smaller area of forested landsmanaged by BLM, is generally available fortimber management. Even on this land, theintensity of management is rarely high. Much ofthe multiple-use forest is valued primarily for itsrecreational or aesthetic services; other areas areremote and not very productive, making them toocostly to manage.
For Federal forestland, climate change maypresent some difficult challenges. Under rapidand substantial climate change, it is unlikely thatall services of the public forests could be main-tained. The threat of large-scale mortality or theextinction of forest species might call for unusualand costly management interventions to facilitateforest protection or forest migration-perhapseven on those lands where active management isnow prohibited. The intervention that might berequired to sustain or restore the long-termservices of the Federal forest resource may beinconsistent with protecting the naturalness or therecreational services for which many publicforests are valued. In table 6-6 the suitability ofvarious silvicultural practices to different forestlands is summarized.
For the National Park Service, the realities ofglobal climate change may raise questions aboutthe mandates for forest management and protec-tion provided for under existing managementpolicies and laws. How much effort should bespent to preserve and protect a forest system that
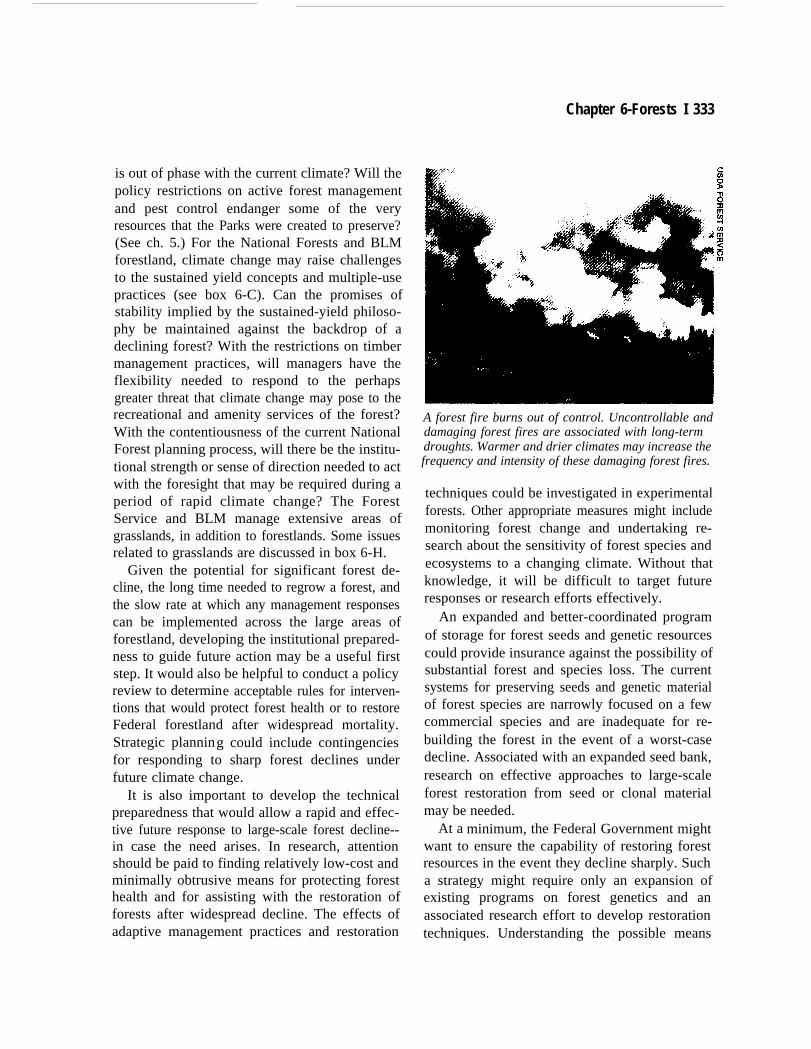
is out of phase with the current climate? Will thepolicy restrictions on active forest managementand pest control endanger some of the veryresources that the Parks were created to preserve?(See ch. 5.) For the National Forests and BLMforestland, climate change may raise challengesto the sustained yield concepts and multiple-usepractices (see box 6-C). Can the promises ofstability implied by the sustained-yield philoso-phy be maintained against the backdrop of adeclining forest? With the restrictions on timbermanagement practices, will managers have theflexibility needed to respond to the perhapsgreater threat that climate change may pose to therecreational and amenity services of the forest?With the contentiousness of the current NationalForest planning process, will there be the institu-tional strength or sense of direction needed to actwith the foresight that may be required during aperiod of rapid climate change? The ForestService and BLM manage extensive areas ofgrasslands, in addition to forestlands. Some issuesrelated to grasslands are discussed in box 6-H.
Given the potential for significant forest de-cline, the long time needed to regrow a forest, andthe slow rate at which any management responsescan be implemented across the large areas offorestland, developing the institutional prepared-ness to guide future action may be a useful firststep. It would also be helpful to conduct a policyreview to determine acceptable rules for interven-tions that would protect forest health or to restoreFederal forestland after widespread mortality.Strategic planning could include contingenciesfor responding to sharp forest declines underfuture climate change.
It is also important to develop the technicalpreparedness that would allow a rapid and effec-tive future response to large-scale forest decline--in case the need arises. In research, attentionshould be paid to finding relatively low-cost andminimally obtrusive means for protecting foresthealth and for assisting with the restoration offorests after widespread decline. The effects of
Chapter 6-Forests I 333
A forest fire burns out of control. Uncontrollable anddamaging forest fires are associated with long-termdroughts. Warmer and drier climates may increase thefrequency and intensity of these damaging forest fires.
techniques could be investigated in experimentalforests. Other appropriate measures might includemonitoring forest change and undertaking re-search about the sensitivity of forest species andecosystems to a changing climate. Without thatknowledge, it will be difficult to target futureresponses or research efforts effectively.
An expanded and better-coordinated programof storage for forest seeds and genetic resourcescould provide insurance against the possibility ofsubstantial forest and species loss. The currentsystems for preserving seeds and genetic materialof forest species are narrowly focused on a fewcommercial species and are inadequate for re-building the forest in the event of a worst-casedecline. Associated with an expanded seed bank,research on effective approaches to large-scaleforest restoration from seed or clonal materialmay be needed.
At a minimum, the Federal Government mightwant to ensure the capability of restoring forestresources in the event they decline sharply. Sucha strategy might require only an expansion ofexisting programs on forest genetics and anassociated research effort to develop restoration
adaptive management practices and restoration techniques. Understanding the possible means
334 I Preparing for an Uncertain Climat&Volume 2
Box &H—Public Grazing Lands: Management Dilemmas
The Bureau of Land Management (BLM) is the Nation’s single largest manager of public lands, withjurisdiction over one~ighth of all land in the United States, which is more than the U.S. Forest Service, the NationalPark Service, and U.S. fish and Midlife Service combined. These lands are generally used as rangelands (grazinglands) or managed for timber, depending on location and resources. The land-use policies that govern rangelandmanagement have begun to come under dose scrutiny, with mounting pressure to raise grazing fees and toincrease control over the use of these lands. BLM claims that US. rangelands are in better condition now thanever before, but conservation groups point to a lack of proper management and t he deterioration of many of t heselands. Climate change effects resulting from temperature and seasonal changes will only exacerbate existingstresses. As t his Administration revisits current BLM polices regarding rangeland management, changes maybemade that address these and other concerns.
In 1976, passage of the Federal Land Policy and Management Act (FLPMA) (P.L. 94-579) gave BLM amultiple-use mandate for rangelands. In 1978, the Public Rangelands Improvement Act (P.L. 95-514) was passedwith the goal of improving upon declining rangeland conditions. These congressional mandates were meant toguide BLM in developing and promoting sound mangement practices that would help to promote the wise use ofresources on Federal lands. Part of this effort included inventory and monitoring protocols t hat would provide BLMwith a picture of present range conditions and help document trends in range condition. In addition, the actinstructed the BLM to develop and periodically review allotment management plans. Unfortunately, the agencyhas been unable to meet the mandates of these acts, and as a result rangelands have experienced extensivedeterioration.
Many of the western rangelands have been exposed to severe overgrazing and mismanagement. Wetlands,riparian areas, and springs have been developed for livestock watering to the point of extreme environmentalimpact. As a result, many of these areas have experienced near complete vegetative loss and radical dedinesin biodiversity. The environmental impacts of both are often staggering. Defoliation and exposure of the soil resultsin erosion and a loss of nutrients, as well as an increase in sedimentation and pollutant loading in nearbywaterways. Such upsets in aquatic ecosystems have far-reaching ramifications for fish and other organismsdependent on aquatic health. A loss of biodiversity and the resultant influx of exotic species may, in some =ses,be irreversible (65). Climate change and its effects may make recovery of some of these areas mre difficult byfuther stressing plant communities and water systems.
and consequences of restoration would require may be wise to begin to implement a diverseactive experimentation on public forestland. Par-ticuku attention should be paid to finding low-cost and environmentally benign ways to facili-tate migration and restoration of natural forests.
A more proactive response might call forincreased efforts to improve the general health ofthe existing forest and to reduce the likelihood offorest free, pests, and drought damage. Suchefforts might increase the forest’s ability to facefuture climate threats. The uncertainties of cli-mate change seem to suggest that there are fewprescriptions that can be offered for immediatechanges in management practices. However, it
portfolio of strategies, experimenting with differ-ent strategies across a forest to provide somehedge against the risky future. This is ofien thebest way to deal with risk.
I Nonfederal ForestlandThe Federal role in protecting the health of
private forestland may take on greater importanceunder a changing climate. Nonfederal forestlandcomprises ahnost three-quarters of the Nation’stotal forestkmd. Along with its role in providingmuch of the Nation’s supply of wood products,this forestland provides wildlife habitat, recrea-
Chapter 6-Forests ] 335
Poor rangeland conditions are generally attributed to poor livestock distribution (65). In the past, BLM hasaddressed these “distribution problems” with water developments, grazing systems and other range“improvements,” which generally move livestock into areas previously Iightiy or unused, without makingimprovements in degraded areas (65). Range improvement projects are a major BLM management emphasis,however rangelands that are steep sloped or lacking in a water source are often relegated to livestock use andgrazing. These improvements include spring development (by diverting water from natural springs to troughs), theconstruction of reservoirs (usually in wetlands or other natural depressions along watercourses), and large-scalevegetation changes on uplands (usually due to overstocking), all of which have contributed to a decrease in usablerangeland through resultant environmental effects. In some cases these areas can recover if livestock use islimited for prescribed periods of time.
Currentiy, two of the most debated issues surrounding public rangeland management are grazing fees andthe land-use permitting process (57, 112). BLM collects a (per head) monthly fee for grazing cattle on Federalland= fee that is considerably less than would be charged on private lands. In addition, Federal permits areissued to ranchers, miners, and others who use the resources (i.e., water) on these Federal lands. The low feesare generally viewed, by all parties, as a necessary subsidy for the western livestock industry. In the past, industryproponents have balked at suggestions of raising grazing fees to bring them in line with market values. The currentmovement is to phase in the increase over a 3-year period, but after that time the new fees will still remain belowthose charged on most private lands. In addition, if rangeland management poiiaes are revamped, the reissuanceofgra.zing permits would be contingent on past management practices and could potentially be vvithheidforabuseof resources.
Decisions regarding the management of Federal rangelands are currently made by those with an interest inprofitable resource consumption (i.e., cattle grazers). However, there has been increasing interest in how theselands are being used by the scientific and conservation communities, which are generaliyinterested in preservingthese resources for their ecological, recreational, and aesthetic value. As a result, BLM may begin to seek inputon rangeland management issues from an expanded group of advisors.
SOURCES: New York 77mes, “Clinton Planning to Increaee Fees on Grazing Lande,” Aug. 10, 1993; Public Employeea for EnvironmentalReeporwibility (PEER), “Public TNSt Betrayed: Employee Critique of Bureau of Land Management Rangeland Management,” a reportwritten by BLMemp/oyeee, Mehlngton, OC, June 1993; W/ Sfreet&urna/, “U.S. Renewa Its Efforta to Overtmul Grazing Polky, callingfor Higher Feee,” Aug. 10, 1993.
J
tional opportunities, watershed protection, and My under the Cooperative Forestry Assistanceamenities that are valued by the general public.To protect these services, the Federal Gover-nment plays a cooperative role in monitoring thehealth of these forests and in limiting forest fireand pest hazards. With climate change increasingthe potential threat to forest health-adding to thethreats of spreading forest fires and pests-theimportance of existing programs of forest healthmonitoring and of cooperative support for forestprotection will be enhanced.
The Federal Government has no direct regula-tory role in nonfederal forestkmd. However,through a variety of existing programs, particu-
Act of 1978 (P.L. 95-313), as amended by theForestry Title of the 1990 Farm Bill (the Food,Agriculture, Conservation, and Trade Act, P.L.101-624, Title XII), direct financial incentivescan be provided to owners of small forest areas forreforestation, forest improvement, and forestprotection. The recently funded Forest Steward-ship and Forest Legacy Programs have beeninnovative in their attention to maintaining theenvironmental services on private forestkmd (incontrast to the more traditional emphasis of theForestry Incentives program on enhancing timbersupplies). Cooperative support is also provided
336 I Preparing for an Uncertain Climate-Volume 2
under the new programs to States and localitiesfor forest health monitoring and for fire and pestcontrol.
Existing Federal programs that help to diver-sify the economy of rural communities may alsobe increasingly important. Within the privatesector, adaptive responses to climate change willoccur as the owners of timberland, the relatedforest industries, and the consumers of forestproducts and services take action to reduce thethreat to their income, property, or welfare. In theend, though, the timber industry will decline inregions where relative production costs haverisen, perhaps abandoning some dependent com-munities. If this transition is sudden, the resultinglocal economic decline could become a source ofpublic concern. A key to reducing the potentialfor such regional declines is to act now to improvethe resiliency and adaptability of the forest sector.
The Federal Government can improve theadaptability of the forest sector through itssupport for innovation, particularly those innova-tions that reduce the dependence of local industryon forest species or log sizes that may not beavailable in the future. Forest Service researchprograms developed under the Forest and Range-land Renewable Resources Research Act of 1978(P.L. 95-307) have long supported such innova-tion in forest-product technologies and forestmanagement. 21 Existing programs designed toimprove the diversification of income sourceswithin rural communities, such as were author-ized under the National Forest-Dependent RuralCommunities Economic Diversification Act of1990 (P.L. 101-624; Title 23 of the 1990 FarmBill), may become increasingly important, Smallcost-sharing programs, such as the EconomicDiversification Grant program and the RuralDevelopment Initiative, have recently beenfunded to improve the stability of rural communi-ties through diversification away from resource-dependent industry and through projects designed
to promote flexibility and efficiency within thewood-products industry.
The process of adaptation within the privatesector may also be improved if the FederalGovernment conveys accurate information aboutthe risks and opportunities associated with cli-mate change. Forest users should be aware of thechanging nature of forests and the fact that changemight be accelerated under a warming climate.The industry purchasing timber from Federallands can best plan for the future if uncertaintiesin the future supply of timber are known and notmisguided by false promises of sustained flows oftimber harvests. A well-informed public may alsobe more likely to accept the Federal land-management actions needed to respond to chang-ing forest conditions. Information on climatechange is best conveyed through: the periodicassessments of the Nation’s forest resource trendsprovided by the Forest Service; the Forest Serv-ice’s National Forest management plans; theBureau of Land Management resource-manage-ment plans; the management statements for eachNational Park; the results of Forest Serviceresearch, inventory, and forest health monitoring;and the cooperative research and extension pro-grams.
POLICY OPTIONSPotential strategies for adapting to climate
change are considered below for the three prob-lems we have identified as being of primaryconcern: the potential loss of species, uniquelyvalued forest stands, or entire ecosystems; theincreased potential for catastrophic mortality; andthe potential for regional or local dislocations inforest-dependent communities.
1 Biodiversity and Forest LosSOption 6-1: Enhance forest seed banks and
forest genetics research. A national effort to
21 Fe&al fomtry rewarch is organized through eight regional USDA Forest Service Rctwarch and Experiment Stations and one F-tProducts Labolatoly.
Chapter 6-Forests I 337
collect and conserve a wide variety of forest seedswould ensure that the means are available torespond to the potential loss of forest species orpopulations under climate change. The coordina-tion and cataloging of existing public and privateforest seed-storage programs would be a usefulfirst step. Use of the seed bank for restoration willrequire the development of improved techniquesfor long-term storage of seeds and large-scalepropagation of trees from stored genetic material.Such efforts should most logically be coordinatedby the U.S. Department of Agriculture’s (USDA’s)Forest Service, which already has seed storage,forest nurseries, and forest genetic research pro-grams supporting current planting needs. Con-gress could fired a National Forest GeneticResources Program within the Forest Service,providing funds for seed collection, for an expan-sion of seed-storage facilities, and for associatedresearch needs.
There is currently no national program forforest genetic resource conservation. Currentseed-collection activities are uncoordinated andfocused on a relatively small number of species(45, 55). The systematic storage of seeds is doneprimarily for the few species that have highcommercial value, such as the pines. Somearboretums, universities, and Forest Service re-searchers also have limited programs associatedwith threatened or endangered species or speciesof particular interest to the researchers. ExistingForest Service seed-storage facilities and nurser-ies are limited and intended to meet the currentregeneration needs of the National Forests. Manyof the existing genetic research programs withinthe Forest Service also have modest seed collec-tions, usually established as the basis for commer-cial tree-improvement work.
A much broader national program focused onprotecting the seeds of most major forest treespecies and associated shrubby and herbaceous
forest plants may be needed.22 Maintaining thelarge quantities of seeds needed for a majorreplanting would bean unrealistically costly goal.Instead, a useful goal for the seed banks might beto maintain a sufficient variety of seeds that theoriginal genetic diversity of forests could eventu-ally be rebred. The capabilities exist for storingthe seeds of the majority of woody species forabout 50 years under refrigeration (about 200 ofthe 270 major tree species) (45). Certain othertrees, particularly the white oaks and poplars,have seeds that deteriorate quite rapidly. For thesespecies, conservation in plantations might beconsidered. From this ‘Noah’s Ark,” the gradualrestoration of lost species or forest populationsmight be attempted, if the need ever arises. Thesystematic storage of seeds would also provevaluable to commercial tree breeding and forbiotechnology efforts in tree improvement.
Seed storage requires refrigerated facilities,with primary and secondary collections. Thesecondary collections serve as the working col-lections, with seeds made available for ongoingresearch and breeding purposes. Working collec-tions could be distributed regionally and coordi-nated through existing Forest Service Researchand Experiment Stations. Distributing seeds re-gionally allows species to be matched to the areasin which they grow. The primary collectionsmight be located in the USDA’s National SeedLaboratory in Fort Collins, Colorado--now usedfor agricultural-seed storage. 23 Use of these -
storage facilities and existing databases on storedgenetic resources might avoid some duplicationof effort. Alternatively, the primary collectioncould be located in one or more of the same ForestService facilities used for the secondary collec-tions, taking advantage of staff expertise intree-seed storage.
Eight Forest Service Research and ExperimentStations currently have genetics research pro-
338 I Preparing for an Uncertain Climate--Volume
grams. Three additional programs have beenproposed (for Alaska, Hawaii, and Puerto Rico).These 11 programs could serve as homes forthe working seed collections-collections madeavailable for ongoing research and breeding—and as expanded centers for forest genetics re-search. One or two of these programs (e.g.,one eastern and one western) might be designatedto coordinate the seed-storage program and toserve as primary centers for genetics research.Associated with the genetics research programsmight be efforts addressing the genetic distribu-tion of tree species, sampling strategies for seedcollection, the sensitivity of trees to climate,large-scale propagation techniques, and cryo-genic techniques for improved long-term storageof genetic material.
Seed collections should represent the variety ofgenotypes for each species. Ideally, a samplingscheme would capture the genetic extremeswithin the species as well as some intermediatepopulations. In the absence of knowledge aboutthe genetic distribution, a practical approach is tosample on a geographic grid following ForestService guidelines already frequently used forseed-collection zones (every 50 to 100 miles, orevery 1,000 feet of elevation) (41).24 A collectioncould be accumulated over the next decade.Collections could be made on a priority basis.First, those species already at risk or least able toadapt to climate change might be collected. Thenext priority might be those species of obvioushigh ecological, economic, or aesthetic value.
Currently, the Forest Service spends about$1.25 million annually on its genetic researchprograms and tree-improvement programs. It isestimated that a new forest genetic-conservationprogram would require continued funding ofabout $5.5 million annually,25 with an additional
2
$30 million in one-time construction and seed-collection costs.26 This would include research ongenetic diversity and sampling design, construc-tion of new or expanded storage facilities at 11program centers, maintenance of the seed collec-tion, and establishment of plantations for geneticconservation and continuing seed production.Some funds to support this expanded program ofseed storage and genetics research might comefrom fees charged for access to the workingcollection by industry or private researchers.Access to an extensive and well-cataloged seedcollection would be valuable to industry tree-breeding programs.27 A fund that draws on ForestService and Bureau of Land Management reve-nues, a tax on timber and outdoor recreationproducts, or existing tariffs on timber productsmight be other appropriate sources of funds. Forexample, the Reforestation Trust Fund estab-lished in 1980 (P.L. 96-451) drew about $30million annually from the tariff on timber imp-orts, supporting an expanded reforestation effortin the early 1980s.
Option 6-2: Use the Experimental Forests forresearch on adaptation to climate change. Exper-imental Forests are established by the chief of theForest Service to serve as the outdoor laboratoriesfor testing and demonstrating new managementtechniques (86). Some 60 Experimental Forestsare spread across the National Forests, eachtypically 5,000 to 10,000 acres in size. Researchefforts on these Experimental Forests are impor-tant in establishing the scientific basis for themanagement practices that will be applied topublic multiple-use forestland in the future.
A new research program in ExperimentalForests could be directed toward finding practicaltechniques for accelerating and improving theadaptation of forests to climate change, with a
~ w a widely dism SpCC&, this might mean ICK) sampling points with 30 to 50 _ ~pkd at * POti M -E 1,~s-per tree (45).
2S Wih -~ ~xp= of $2.5 million for research $1 million@ maintain the collections, and $2 million for genetic plantations.us. ~= D~tor, Forest Managermmt Research, USDA Forest Stice, p~ c ommunimtiou August 1S93.27 R ~~ou~ ~~or, Fo~t R~o~~ R.esea@ Weyerhaeuser Company, personal (xmummicatio% June 1992,
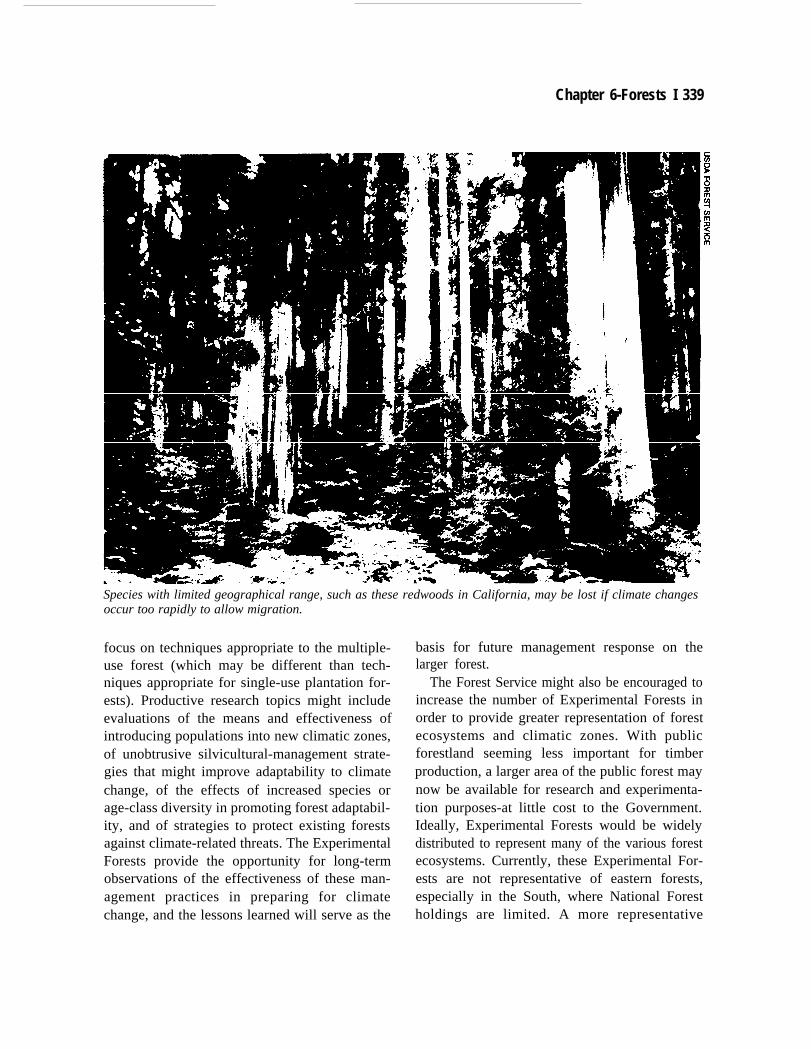
Chapter 6-Forests I 339
Species with limited geographical range, such as these redwoods in California, may be lost if climate changesoccur too rapidly to allow migration.
focus on techniques appropriate to the multiple-use forest (which may be different than tech-niques appropriate for single-use plantation for-ests). Productive research topics might includeevaluations of the means and effectiveness ofintroducing populations into new climatic zones,of unobtrusive silvicultural-management strate-gies that might improve adaptability to climatechange, of the effects of increased species orage-class diversity in promoting forest adaptabil-ity, and of strategies to protect existing forestsagainst climate-related threats. The ExperimentalForests provide the opportunity for long-termobservations of the effectiveness of these man-agement practices in preparing for climatechange, and the lessons learned will serve as the
basis for future management response on thelarger forest.
The Forest Service might also be encouraged toincrease the number of Experimental Forests inorder to provide greater representation of forestecosystems and climatic zones. With publicforestland seeming less important for timberproduction, a larger area of the public forest maynow be available for research and experimenta-tion purposes-at little cost to the Government.Ideally, Experimental Forests would be widelydistributed to represent many of the various forestecosystems. Currently, these Experimental For-ests are not representative of eastern forests,especially in the South, where National Forestholdings are limited. A more representative
340 I Preparing for an Uncertain Climate--Volume 2
distribution of eastern forest types could beachieved by adding some areas on military landsor through cooperative arrangements with Statesand universities.”
Research on the Experimental Forests is under-taken by Forest Service research staff and cooper-ating private researchers. Current annual expendi-tures on each Experimental Forest average $0.5million or less, which covers maintenance ofroads and structures and on-site expenses of theexperimental program.
29 An expanded effort On
Experimental Forests would result in an increasein these support costs, but no new research staffwould be required. An experimental climatechange program, with one or two active projectsper forest, could probably be supported with anadditional annual appropriation of about $250,000to $500,000 per forest.30 Included in this might bea small cooperative grants program to attractuniversity research projects, increasing the poolof new ideas. Some existing Experimental Forestshave been so extensively managed already, how-ever, that experiments that require more-naturalforest conditions cannot be considered. Any newExperimental Forest would require start-up ex-penditures for access roads and facilities.
Option 6-3: Encourage diverse managementpractices on portions of the public forests as abuffer against climate change. This option ex-tends the idea of option 6-2, to suggest consider-ing cautious implementation of experimentalpractices on public multiple-use forests. TheForest Service and BLM could be encouraged toactively hedge against the risk of an uncertainfuture climate by using different silvicultural andplanting practices across the forest and techniquesthat introduce genetic, species, or age diversity
within stands. The diversity in practices, strate-gies, and species may provide a buffer against theuncertainties of climate change, with some effortssucceeding while others fail.
For example, a mix of different planting prac-tices might be used to help reduce vulnerability tofuture climate change. A greater variety of speciesmight be planted--either within a single stand oracross stands. The effectiveness of using diverseseed sources for plantings could also be consid-ered. It is standard practice now for seeds to bedrawn from a variety of local sources that closelymatch the conditions on the harvested site. It maybe appropriate to regenerate some modest propor-tion of the forest with seeds or seedlings drawnfrom climate zones that are somewhat warmerthan the planting site’s.31 Initial planting densitiesmight also be increased to compensate for thepossibility of higher mortality in poorly adaptedseedlings (10, 45). These practices all presentsome risk of failure, but if warming does occur,losses may be less severe than they might havebeen without the experimental efforts.
A mix of different timber-harvesting strategiesoffers another way to promote forest diversity.The Forest Service has recently committed itselfto an Ecosystem Management approach, underwhich forests are to be managed with greatersensitivity to the ecological processes of theforest (69). Among the suggestions for manage-ment are the ‘new forestry’ techniques proposedfor the Douglas-fir forests of the Pacific North-west (21). These harvesting techniques create adiverse forest through selective cutting that even-tually produces a multiple-aged forest stand. Thisor other harvest-management strategies designedto promote ecological diversity might be intro-
2$ A r- prepared for the National Scien~ Foundation in 1977 (32) su~ests tk d f~ _CZ@ wlO@d R~~ ~a wide array of ecosystems. ‘I’M report suggests possible site locations that would add to the emwrage of forest ecosystems.
29 S. fi- D~tor, Forest Managmat Rcse~ USDA F~st StiCG pCIXOd COmmUIliUttiOw Au~t 1993.
N ~ ~up~ ~~ consid~ tit fiII utikation of these -CUM Fo-ts wodd ~ ~@’~ w’i~ ~ increase of perhaps $1.5 to $2.5million per forest (S. Km- personal eommunicatiorL August 1993).
31 It is comide~ pti~le to draw secdshorn lower elevations tbanfkornmore southerly SitCS. -S frommorc SOu~y si@ ~ @Wtito different day-length regimes (45),
Chapter 6-Forests I 341
duced in some areas of multiple-use forestland.Harvesting practices designed to achieve a mixt-ure of species and age classes are likely to protecta forest against the spread of insects and fires. Atthe other extreme, some areas of the forest—perhaps those subject to high risk of pest and fire
damage managed with shortened harvest-rotation periods. Shortened rotations are thoughtto allow faster adaptation to a changing climatebecause each harvest creates an opportunity toachieve a new stand composition that is bettersuited to current climatic conditions.32
Option 6-4: Protect highly valued forest sites,The Federal land-management agencies shouldidentify and evaluate whether there are measuresthey could take to protect some highly valued orunique forest stands (such as the giant sequoia andredwood stands of California) from loss underclimate change. These sites are highly valuedbecause of specific characteristics of the existingforest, which might be threatened by climatechange. The decision could be made to protectsome of these stands against change or loss,
where practical. If conditions allow, this mightmean developing irrigation systems and usingintensive efforts to control insect and fire threats.Congress may need to be prepared to act quicklyin funding protective actions, if they becomeappropriate.
Option 6-5: Provide incentives to reducefragmentation of private forestland. Fragmenta-tion and loss of private forestland may threaten
the ability of forests and forest species to migrateor adapt to changing climate. Some expansion ofFederal funding might be considered for existingincentives programs that encourage multiple-usemanagement on private forestland (e.g., the For-est Stewardship and Stewardship Incentive Pro-
grams) and the maintenance of forest cover inareas of ecological value threatened by land-useconversion (e.g., the Forest Legacy program).Such funding might come from a reallocation of
funds now directed toward providing incentivesfor enhanced timber production from privatelands. Some modifications to the U.S. Tax Codecould also be considered to encourage landown-ers to keep lands in forest cover.
The Forest Legacy program, authorized underthe 1990 Farm Bill (the Food, Agriculture,Conservation, and Trade Act, P.L. 101-624), is aconservation-easement program that encouragesforest protection in areas of environmental impor-tance and areas threatened by conversion. Theprogram is a cooperative State and Federal effort.Priority is given to protecting areas of high scenicor recreational value; riparian areas; and habitatsof particular wildlife, including threatened andendangered species. Property owners are paid inexchange for agreeing to property easements (i.e.,restrictions on the deed of ownership) that willensure continued protection of the resource.Implementation of this program is beginning insix States (New York, New Hampshire, Vermont,Maine, Massachusetts, and Washington) with thedevelopment of criteria for potential acquisitions.So far, only 12 tracts have been placed undereasement . 33 Other States are consideringwhether to join the program. Funding was almost$10 million in 1993, but it is expected to bereduced in the 1994 budget.
An advantage of easement programs is thatthey are cheaper than outright purchase of land.Still, the costs of acquiring easements can behigh, including administrative costs of tailoringeasements to each property and the costs ofmonitoring for compliance, in addition to thepurchase costs. In areas where development isimminent, the cost of acquiring an easement maybe little less than the cost of outright purchase.Easement programs are also somewhat controver-sial. Because this program will involve onlywilling sellers, it imposes no unwanted restric-tions on use of private property. Still, a programthat will create permanent Federal rights restrict-
3Z Mwmd A. am USDA Forest Service, personal communication June 1992.
33 J. Norm ~Wmtive Fores~, USDA Forest Semice, personal comlmmicatiow Au@t 1993.
342 I Preparing for an Uncertain Climate--Volume 2
ing the future use of private property is trouble-some to some. The fact that easements can bepurchased only from willing sellers also suggeststhat easement programs alone, although they maybe effective at protecting individually valuablepieces of lands, may not be able to stop a generalfragmentation of forest holdings.34
The Forest Stewardship and Stewardship In-centive Programs, authorized by the 1990 FarmBill, provide technical assistance and financialsupport to landowners who wish to manage theirforestland to provide multiple-use benefits. Underthe Forest Stewardship Program, funds go to theStates to cover costs of developing multiple-usemanagement plans for nonindustrial private for-estland. These plans encourage management thatenhances multiple-use values-such as the pro-ductivity of fish and wildlife habitat, waterquality, wetlands, or recreational resources-inaddition to timber productivity. The declared goalis to enroll 25 million acres in the ForestStewardship Program by 1995. By 1992, some3.7 million acres across the country had author-ized plans (98). In many States, demand for thesestewardship plans is outstripping the State’sability to develop them.35
Funding for the cost-sharing Stewardship In-centive Program was about $18 million for 1993.This popular program may encourage landownersto keep their lands in well-maintained forestcover. Congress could provide clearer prioritiesfor which forest areas and what types of activityare to be funded. For example, some funds couldbe explicitly targeted. Areas identified as havinghigh environmental value and being threatened byconversion, such as those identified under theForest Legacy Program, might be given highpriority. Areas at high risk for fire and insect
damage could also be given priority. The extent towhich this incentive program can fund the con-version of natural forests to plantation forestrycould be clarified by Congress; much of thefunding could be reserved for management thatmaintains a more natural forest cover.
Certainly more controversial than the incentiveprogram would be modifications to the U.S. TaxCode that might encourage protection of forest-lands.36 One possible modification is to reduce oreliminate the capital gains tax due on receiptsfrom the sale of conservation easements. Thiswould tend to make landowners more willing toagree to the sale of an easement. On the otherhand, this might be viewed as a budget maneuverthat results in foregone tax revenues instead ofhigher expenditures on easements. Another possi-ble approach is to tax inheritance of land at fairmarket value, rather than at current use value,unless the new owners agree not to develop theland for some specified period.37 This wouldprovide a strong incentive not to break up forestedestates on the death of the previous owner. Thiswould have some effect in preserving very largeforested estates.
# Threats of Catastrophic MortalityPrudent management, in view of the risk of
climate change, would anticipate an increasedprobability of weather-related stresses and in-creased forest mortality. Not all increases in forestmortality will require intervention. Indeed, theopening of a forest that results from fires andinsect damage may speed the regrowth of better-adapted species in the natural forest, much asharvesting and thinning do. However, large-scalemortality poses a threat to forest values, andplaces adjacent properties at increased risk to
~ A &~~ “dlamssioil of the bcncfita and Shortumhgs of easunalt progmns can be find in b Northern Forest Lands study, whichaddrcsd ways to slow forest fhlglnealtation in b Dortheastun united statea (25).
ND. m, coo~tive Forcatry, USDA Forest ~, ~~ ~w August W93.K M of these possibil.itics is analyzed in more detail in the N- Forest Lands Study (M).
37 Cumently, land is taxed at current usc value rather than at fair market vaiuc, ahhough adjustmtmt Wnnot reduce b value of b estate bymore than $750,000.
Chapter 6-Forests I 343
damage from spreading fires and pest infesta-tions.
Option 6-6: Use existing monitoring andinventorying efforts to identify causes and effectsofforest decline. Monitoring strategies are essen-tial for determiningg changes or trends in forestsystems and in the environmental variables influ-encing these systems. To be useful for manage-ment decisions, such monitoring programs mustbe maintained over long periods and their designshould be scientifically based so that the causes offorest change can be determined. The recentlyestablished Forest Health Monitoring Programcould be provided with secure and long-termfunding to ensure its usefulness and to sustaincooperation with the States.
Congress directed the Forest Service to initiatea program to monitor the health of the Nation’sforests about 5 years ago through the ForestEcosystem and Atmospheric Pollution Act of1988 (P.L. 100-521). The act calls on the ForestService to conduct the surveys necessary tomonitor long-term trends in the health andproductivity of domestic forest ecosystems. Anew national initiative, the Forest Health Moni-toring Program, a cooperative effort of the USDAForest Service, the States, and the U.S. Environ-mental Protection Agency (EPA), has begununder this forest health-monitoring authority(97).38 The program has ongoing efforts in 12eastern States and initial efforts in two westernStates. Further expansion is planned, as budgetsallow. 39 Participating States share in the costs ofthe surveys. The frequency and scope of thesurveys planned under this program are designedto detect unexpected changes in forest conditionsand to help correlate these changes with potentialstressors. The Forest Health Monitoring Programprovides frequent monitoring at a set of forest
inventory sites, tracking soil, air, water, climate,and land-use conditions-along with details onvegetation and forest pests—at frequent intervals.If significant changes in forest conditions arefound, intensive research efforts will be directedat determining specific causes of decline.
In a related activity, the Forest Service con-ducts periodic inventories of timber resources inall States, under the authority of the Forest andRangeland Renewable Resource Planning Act(RPA) of 1974 (P.L. 93-378). These infrequentinventories (done approximately every 10 to 15years) detect major trends in forest mortality andvigor, but provide little understanding of causeand effect. The Forest Service also makes aerialand ground surveys of existing pest damage onFederal forestland. With Federal assistance, Stateforestry agencies provide similar forest healthsurveys of State and private forestland. Thesesurveys provide the support for ongoing pest-management activity but, again, provide littleinformation on the causes of the existing pestproblems. These inventories and surveys could berequired to include analyses of potential causes ofobserved trends.
Option 6-7: Establish criteria for interventionin order to protect or restore forest healththrough a forest health bill. Congress couldestablish criteria-through a forest health bill—for prompt intervention that would guard againstthreats of catastrophic mortality or that wouldrestore forests tier large-scale mortality anddecline. Given the emotional level of debate thatoften accompanies public forest management, itcan be difficult to make timely responses to majordeclines. The congressional debate on a foresthealth bill in the 102d Congress highlights thecontroversy that forest management can arouse;efforts to ease restrictions on salvage harvests in
SE me Forest Health Monitoring Program also serves as one component of the Environmental Monitoring ~d ASStiSInent ~p@hIAP), an interagency program coordinated by EPA and designed to monitor the health of the Nation’s ecological resources (106). Seechapter 6.
39 ~~ F~e~ fm~ to tie Forest SeNice has been flat at about $14 million, H. F. Kaiser, Director, Forest Inventory S@ff, USDA
Forest Service, personal communication% August 1993.
344 I Preparing for an Uncertain Climate--Volume 2
the drought-stricken interior Pacific Northwestforests became entwined with the broader andvery contentious debate over old-growth-forestmanagement in 1992 (109). Climate change,however, may increase the urgency for interven-tion designed to protect forest resources. Policiesshould be in place that set appropriate criteria forsalvage harvests (i.e., the removal of dead,damaged, or insect-infested trees), for the use ofsilvicultural management practices (e.g., thin-nings) to protect against threats to forest health,for aggressive insect and fire prevention andcontrol, and for restoration activities after forestdecline.
Congress might request that the Forest Serviceand BLM forma policy-review group made up ofoutside academics and Federal forestry officials.The group could consider appropriate responsesto the threat of large-scale forest decline andcriteria that should be met before such responsesare undertaken. These criteria would have to takeinto account the environmental services of theforest, as well as the financial interest in thetimber resource. Once such criteria have beendetermined, Congress could again consider aforest health bill that would help streamline thefunding process and the procedures for undertak-ing actions appropriate for maintaining foresthealth.
A new forest health bill could allow for thedeclaration of temporary forest health emergen-cies, under which the Secretary of Agriculture andthe Secretary of the Interior could accelerateactions to protector restore forest health, as longas these actions are consistent with establishedstandards and guidelines for protecting of allforest values. During the period of emergency,funds available for forest salvage, timber-saleactivities, reforestation, and insect or fire man-agement might be reallocated to forest healthprojects. This flexibility in funding would allowfor prompt response. A salvage fired, comparableto that now available to the Forest Service, shouldbe created for BLM. The provisions of the Forest”Service salvage and reforestation funds could be
amended to allow the use of those funds in effortsto restore or protect forest health. Procedures toexpedite the public review and appeals processes,consistent with forest management and nationalenvironmental laws, might be considered.
Particular attention should be paid to establish-ing the criteria for treatments in existing roadlessareas and reserved forestland. Management stand-ards and guidelines may be needed to ensure thatsalvage harvests do not open roadless areas tofuture timber management or lead to higher levelsof timber harvests than are called for in currentforest plans. On the other hand, certain policiesrestricting management activities may need to bereconsidered in light of climate change. Forexample, currently, the National Park Servicecontrols only introduced pests (see ch. 5). Underclimate change, with changed dynamics of thenatural pest populations (see ch. 2), controllingonly “exotic” species may prove unwise. Thereis a risk that extensive fires and pest infestationswill increase in unmanaged forestland.
Option 6-8: Increase fire- and pest-preventionactivities. With climate change likely to increasethe risk of forest loss to fire and pests, Congressmay consider funding increased prevention activ-ities in order to reduce the likelihood of highfuture costs of fire suppression and pest control.Consideration should be given to promoting abalanced and flexible program that promotes thegeneral health of the forest, allowing for fundingof silvicultural activities as well as the moretraditional elements of fire and pest management.Appropriate silvicultural practices can reduce thesusceptibility of forests to fire and pest risks.
If climate change kills trees, the result will bea buildup of dead and downed wood that may leadto damaging forest fires. A reduction in fire riskcan be accomplished through fuel management(i.e., removal of fallen logs and dead and dyingtrees)--with prescribed burns or mechanical re-moval of excessive fuels-and through thinningsthat reduce forest density and improve the vigorof remaining trees. A National Fire ManagementPolicy Review Team, established by the Secretar-
—
Chapter 6-Forests I 345
ies of Agriculture and Interior, recently recom-mended substantial increases in funds and person-nel to deal with existing hazards from fuel buildup(101, 107, 108). The risks associated with climatechange may strengthen this call for fundingpreventative activities that reduce the fuel hazardson forestland.
Prescribed fire is a practice by which fire isstarted or allowed to burn under carefully con-trolled conditions. The goal is the removal offuels before they accumulate and lead to intenseand uncontrollable fires. Although the use ofprescribed fire is broadly accepted as beneficialecologically (101), it can be costly and controver-sial. Public sentiments aroused by runaway firesand the associated property losses have made theuse of prescribed fire difficult.40 The limitedhumanpower available for setting and controllingthe prescribed fires and complying with therequirements of the Clean Air Act limit theirgreater use. Although cautious use of controlledfire is possible in areas with heavy fuel accumula-tion, more expensive mechanical means of re-moving brush and fuels are often also needed.Salvage harvesting, the removal of dead or dyingtrees, can also be useful in reducing current firerisks.
Forest thinning can be effective in reducing thelong-term potential for future forest mortality.
. .Thinning a forest reduces moisture demands onremaining trees. With less moisture stress, mor-tality from the secondary threats of pests and freescan be reduced(51 ). The most striking example ofthe benefits of “thinning can be found in thedrought-stricken regions of the West, After sev-eral successive years of drought in Idaho and
eastern Oregon, mortality rates on some NationalForest lands have been extraordinarily high, withmuch of the forest lost (see box 6-E). On adjacent,thinned industry lands, the forest remains healthy .41
Extensive thinnrn“ g is now being undertaken onsome of the drought-stricken National Forests ofIdaho (49). When the wood from thinning andsalvage cutting can be marketed,42 these activitiescan often be cost-effective ways of reducing thethreat of large forest fires. However, silviculturalmanagement is not appropriate under all condi-tions. Thinnm“ g, for example, can sometimes leadto excessive damage to residual trees. Salvageharvesting— like any large-scale harvestingactivity--can lead to environmental problems(e.g., erosion and watershed damage) and isgenerally not appropriate where harvesting wouldotherwise be excluded.
Long-term reductions in forest pest problemscan be accomplished through integrated pestmanagement programs, which combine monitor-ing, thinning to control stand density and speciesmix, quick salvage or removal of infested stands,and suppression through pesticides and fungi-cides. Just as it enhances fire prevention, improvi-ng the general health of the forest throughsilvicultural activity may be the best way toreduce the likelihood of future mortality causedby pests.
In 1992, the Forest Service received about $13million for fuel management, that is, for pre-scribed fires and mechanical removal of downedW O Od .43 In contrast, about $175 million WaS
allocated for the other elements of fire protec-tion--equipment and personnel needed to main-tain readiness for firefighting-while roughly
~ The reation to tie Yeflowstone fires of 1988 illustrates the problems of applying prescribed b- (101). Some of tic= tis, whicheventually burned 740,000 acres of the Park, were initially allowed to bum as prescribed fins. It is doubtful, however, whether more rapidsuppression of those fues would have done much to limit the overall damage (101; see box 5-I).
41 D.F. sfi~ Vice ~esiden~ Timberland Resources, Bois&Cascade Corporation+ personal communication ~d videotape, Jue 1992.
42 way can ffily rapidly r~uce he po~ntial sale value of wood once a - has died. Witi 2 ye~ of dea@ much of tie ~nomic value
of the wood is lost.
43 About $50 million in brush-disposal funds-deposits by timber purchasers fOr cka.nup after sde~ also be considered support forfuel-management activity, although this money does not help address existing fuel buildup.
346 I Preparing for an Uncertain Climate--Volume 2
$400 million (including $300 million in emer-gency appropriations) went to firefighting itself.Increasing interest in the ecological benefits ofprescribed fire and modifications in the ForestService’s fire-management-planning system tobetter incorporate the benefits of fuel manage-ment are thought likely to lead to an increase inthe relative emphasis the Forest Service will placeon fuel management in future budget requests.44
Climate change would seem to add to the reasonsfor supporting such a shift in fire fundingpriorities.
On Forest Service lands, special funding forsalvage harvests is provided through moniesdrawn from timber-sale revenues, making itrelatively easy to undertake salvage harvests asneeded. “Thimnings are usually undertaken fortimber management reasons. There may be in-creasing demands to fund thinning programs thatpromote general forest health-as has alreadyhappened in the National Forests of Idaho andeastern Oregon-rather than explicitly for timbermanagement. Support for “thinning activities maybe increasingly appropriate, as climate changeposes a threat to future forest health.
Option 6-9: Ensure that potential restrictionson below-cost sales do not prohibit activitiesneeded to maintain forest health. Much of thetimber supplied from National Forests hasbrought in less in revenues than it cost to put thetimber up for sale (114). It appears that below-cost sales on National Forests may be increas-ingly restricted (72). Congress may wish to ensurethat timber-harvesting or thinning activities nec-essary to maintain the health of National Forests(e.g., to counteract damage from insects, disease,
and fires) are not made impossible by legislativeaction designed to end below-cost sales.
Option 6-10: Provide incentives and informa-tion to private forest owners to reduce hazardsand to improve forest health. The Forest Serviceoffers technical and financial assistance to Stateand private forest owners through a variety ofprograms aimed at protecting and improving themanagement of forestland. Several cooperativeprograms in hazard control through fire protec-tion and insect suppression are in place and maybecome increasingly valuable if climate changethreats materialize.45 Other useful programs areaimed at reducing exposure to risk.
Under authority of the Cooperative ForestryAssistance Act of 1978 (P.L. 95-313), as amendedby the 1990 Farm Bill (P.L. 101-624), theForestry Incentives Program (FIP) and variousother forestry assistance programs offer financialsupport to owners of small, private forests. Fundsunder the FIP are allocated on the basis ofpotential improvement in commercial timberproduction, with much of the money goingtoward planting pine forests. This program is nowscheduled to end in 1995. The amendments to theCooperative Forestry Assistance Act have estab-lished broader goals for cooperative support,including increased emphasis on the environ-mental and multiple-use services of private lands.No specific program, however, targets support toprivate landowners to promote activities thatmight protect forest health.46 A forest healthincentives program might be considered, whichwould target funds to forest landowners in areaswhere there are high risks of insect and firedamage, encouraging silvicultural activity toimprove the health of private forestland.
44 D. ~~e, F~ @ Avi~on qmmt Staff, USDA Forest S&vice, personal W-ticatiOn Au8ust 1993.
45 m ~~ report of the Forest Service (98) describes the many State and p~va~ fo~@y W%WM.
46 ~ g~ wo~d k compatible with the broader criteria for support under the Forest st~“p Progra@ however. support is providedthrough the States for pest sumeys, pesticide applications, and technical information services.
Chapter 6-Forests I 347
Among the greatest costs of wildfires are thelosses of property and life in buildings at the edgeof forests.47 The issues related to the high costs
these homeowners impose on the general tax-payer for firefighting activity will certainly be-come more prominent as development adjacent toforests increases or if fire becomes more preva-lent. There is perhaps little direct Federal leverageto discourage owners from building in high-fire-hazard zones. However, the Federal Governmentcan encourage appropriate building practices forstructures built near forests by supporting infor-mation and education programs for homeownersin such areas. The Forest Service’s Urban/Wildland Fire Protection Initiative disseminatesinformation on measures that homeowners cantake to protect against forest-fire risks. Suchprograms should be continued.
~ Economic DislocationsThe timber industry will inevitably move from
regions where relative profitability has declinedunder climate change. Such movements in thelocation of the forest industry could result in theabandonment of forest dependent local communi-ties. If rapid or unexpected, dislocations of thissort can be costly. Although little can be done tostop the movement of industry from less produc-tive regions, there may be options that would helpreduce the likelihood of economic disruptions.
One approach is to increase the flexibility ofthe timber industry and the diversity of theeconomy in forest-dependent communities. Thatis, increase the ability of communities to adapt tochanging forest conditions by expanding thetechnologies for using forest products and serv-ices. A second approach is to provide accurateinformation about the risks and uncertainties thatclimate change may pose for forests and timbersupplies. The industry and communities thatdepend on forests might then have time to respond
and to lessen the potential for sudden economiclosses.
Option 6-11: Incorporate climate change sce-narios into forest plans and assessments. Ensurethat National Forest plans and BLM resourceplans provide one or more climate change scenar-ios that project timber supplies and resourcetrends under potential climate changes. The plansshould address the potential stresses that climatechange poses to the forest resource. However,forest plans are already deficient in addressing theuncertainties associated with current stresses thatlead to fire and insect damage (91).
The Forest Service has expressed some reluc-tance to use specific projections for a changingclimate in its National Forest plans because ofdoubts about the precise nature of climate changein any specific location. Although understand-able, this reluctance may be misguided because itis precisely this uncertainty that should be con-veyed to the public. The timber industry, whichdepends on Federal timber sales, and dependenttimber communities may be better able to takeappropriate precautions in a timely manner if theyare made aware of the uncertainties in futuretimber supplies.
No new legislative authority is needed for theland-management agencies to begin addressingthe uncertainties that climate change presents.With previous encouragement from Congress, theForest Service’s next RPA assessment (in prepa-ration for the 1995 update) is considering climatechange scenarios in its national projections offuture timber supply trends.48 More encourage-ment may be needed before similar efforts aremade at the level of individual forest plans.
Option 6-12: Eliminate the even-flow-harvestrequirement of the National Forest ManagementAct (NFMA). The NFMA j Section 13(a), requiresthat timber sales from National Forests generallybe limited to a level that can be sustained in
47 Reference 13 offers some thoughts on policies for dealing with fire risks ad the urban-forest ktdwe.
~ Linda Joyce, USDA Forest Servim, persomd communicatio~ June 1993. titial efforts app~ently have not addressed tie PO@ntiId ~a
that climate change poses for existing forest.
348 I Preparing for an Uncertain Climate--Volume 2
perpetuity, a requirement usually known as non-declining even flow. This well-intentioned provi-sion was meant to help maintain stability in localcommunities and to avoid biologically damagingrates of harvest. The policy as applied has notproduced the intended results. Instead, it createsa false promise of sustained timber supplies,distorting the planning decisions of timber indus-tries and workers. Perversely, it has also tended toencourage unsustainable forestry practices onFederal forestland, increasing the land area onwhich active timber management is practiced andencouraging intensification of management onpoorer-quality lands. These consequences add tothe costs and reduce the area left as natural forest(7, 94).
Under climate change, with the possibility of adeclining forest, the even-flow policy will havefurther undesirable effects. The policy creates astrong incentive for Forest Service managers toignore climate change considerations in the NFMAplanning process. Under the nondeclining-even-flow constraint, any expected reduction in thefuture timber productivity of the forest wouldrequire an immediate reduction in current allow-able timber sales. Thus, the acceptance of thepossibility of negative effects of climate couldlead to disruptions in the local timber industry andcommunities-a result the forest managers wouldprefer to avoid. A more gradual decrease inharvest levels would be preferable. Federal timbersales could be based on supply-and-demandconditions, subject to reasonable market tests ofprofitability and to the requirement of maintain-ing the multiple-use and environmental servicesof the overall forest.
Option 6-13: Increase flexibility in the timberindustry. Rapid climate change may result inchanges in the quality or type of timber availablefor harvesting on the Nation’s forestland. Theremay be changes in the species available forharvest; younger trees might be harvested ifclimate risks discourage long-rotation forestryand damage existing older stands; and there maybe increases in the availability of low-quality and
salvaged logs. Research directed at increasing theflexibility with which industry can adapt to thesepotential changes in timber supplies may helpreduce the costs of climate change. This increasein flexibility might be accomplished throughresearch and product development that allows thetimber industry to use more varied log sizes, logqualities, and tree species. Although these areasof research and development are already of activeinterest, many think that forest-products researchhas been greatly underfunded (54, 99). In realdollars, Federal funding of forestry research hasdeclined by more than 10 percent over the pastdecade (99) despite the high economic returns ofthis research (28).
Option 6-14: Increase flexibility in forest-dependent communities. Forest Service programsto diversify within forest-dependent rural com-munities were authorized by Title 23 of the 1990Farm Bill, the National Forest-Dependent RuralCommunities Economic Diversification Act of1990 (P.L. 101-624). Under this authority, theForest Service has begun to play a role inimplementing the President’s initiative on ruraldevelopment. The existing efforts include techni-cal assistance and small cost-sharing programs tohelp improve the stability of rural communitiesthrough diversification away from resource-dependent industry and through projects thatpromote diversification within the wood-productsindustry. Funding has been modest. For example,about $0.5 million annually is available in Eco-nomic Diversification Grants to assist communi-ties in developing plans for attracting new indus-tries that might reduce dependence on timber.There are other specially funded programs, suchas those that assist economically distressed com-munities in the Pacific Northwest, an initiativethat encourages the use of wood in buildingbridges, and demonstration projects of uses ofwaste wood, including recycling. Climate changesmay increase the importance of programs de-signed to diversify forest-dependent communi-ties, but it is still unclear how successful theseeffort can be.
—.——
An opportunity may exist to turn salvaged andthinned wood into a useful resource. The ForestService should be encouraged to expand efforts,through its Forest Products Research and Cooper-ative Assistance Programs, to develop and pro-mote wood-product technologies that use sal-vaged wood. Rural development grants could begiven to identify and encourage local industries tocreate highly valued products from these low-quality wood resources. The risks associated withsuch strategies include the perception that subsi-dized industries in one region are unfairly com-peting against existing similar industries else-where. The stability of supply is critical; industryis unlikely to become established where thesupply is erratic.
FIRST STEPS
Although all of the options presented in thepreceding section could be considered, not all areequally feasible and not all are equally appropri-ate as immediate responses to the threat of climatechange. Given the limited money available tofund programs and the poor level of scientificunderstanding of impacts of climate change onforests, the following subset of policies havebeen identified as the “first steps” Congresscould take. Initiating all of them now is justifiablebecause of current concerns about climatechange. By beginning with this package, theNation can position itself t{. respond to the effectsof climate change on both timber and nontimberforests. Some of these options must begin todaybecause of existing problems (such as fire, pests,and drought) that will be exacerbated by climatechange or because current programs are alreadywanting. Others must begin today because it willbe years before the process can be completed(such as developing a seed bank and understand-ing how to facilitate migration). The optionslisted below were chosen because they meet twocriteria: they reduce vulnerability to climatechange, and there is a clear advantage to acting
Chapter 6-Forests I 349
~ Establish an expanded forest seed-bankprogram. A National effort in the conserva-tion of forest seeds would provide an oppor-tunity to respond to the potential for loss ofgenetic diversity in the forest resource underclimate change. There is currently no na-tional forest-seed conservation program. Anappropriate goal for such a program wouldbe to maintain sufficient seed variety, orother genetic material, so that much of theoriginal diversity of the Nation’s forestscould eventually be restored.
A forest genetics conservation programwould require facilities for seed storage.Primary storage facilities would provide forsafekeeping; secondary collections wouldprovide working access to seeds and securitythrough redundancy in storage. Workingcollections could be based at regional cen-ters for forest genetics, such as those nowlocated at several Forest Service Researchand Experiment Stations. The primary col-lection could be maintained at those samefacilities or at the existing USDA agricul-tural seed storage facility in Fort Collins,Colorado. Associated with the working col-lections should be a research program ad-dressing issues related to seed collection,storage, large-scale propagation, and climatesensitivity of forest trees.
To accomplish these goals, Congress couldauthorize and fund a National Forest GeneticResources Program within the Forest Serv-ice, providing funds for the construction andoperation of storage facilities needed for theseed collections, for the forest geneticsresearch program, and for the establishmentof plantations to be used for continuing seedproduction. Funding is estimated to requireabout $5.5 million annually, plus a one-timeexpense of about $30 million for construc-tion. Such a program could be partiallysupported through fees for private access to
now. the seed collection.
350 I Preparing for an Uncertain Climate--Volume 2
H Prepare to respond to major forest de-clines. Increased risk of fires and insectdamage may result under a warmer climate.The relative value of preventive activitiesthat reduce risk and the need for promptintervention to protect forest resources mayincrease. Because of the need for promptaction and because of the contentiousnessthat often accompanies forest management,policy rules for salvage harvesting, pest-control activity, and silvicultural manage-ment to reduce forest health risks are bestestablished before they are needed.
Congress could provide a forest health billthat would establish criteria that wouldallow prompt action to protect againstthreats of catastrophic mortality or to restoreforests after large-scale mortality and de-cline. Such a bill might allow for thedeclaration of temporary forest health emer-gencies, under which accelerated actions toprotect or restore forest health would beauthorized-as long as these actions wereconsistent with established standards forprotection of all forest values. A policy-review group made up of outside academics,representatives of interest groups, and Fed-eral forestry personnel could develop criteriafor undertaking actions to stem forest de-cline. During the period of emergency, fundsavailable for forest salvage, timber-sale ac-tivity, reforestation, and insect or fire man-agement could be freely reallocated to foresthealth projects, allowing a prompt response.In conjunction with this bill, Congressshould be prepared to increase funding forforest health maintenance and for activitiesthat reduce potential fire hazards (e.g., re-moving fuels and thinning the stands at risk);such efforts might reduce the likelihood ofmuch greater future costs.
Prepare for a forest-managernent responseto climate change. A changing climate mayeventually require innovations in forest-
management and planting practices. Experi-mental efforts will be important in estab-lishing a scientific basis for any necessarychanges to future-management practices thatmight later be applied to public multiple-useforestland. Congress could support a pro-gram of research on the Forest Service’sExperimental Forests, or other research facili-ties, to address adaptation to climate change.The Experimental Forests are in place anddesignated as the outdoor laboratory forevaluating forestry practices. The researchcould be directed toward finding practicaland environmentally appropriate techniquesfor managing the public forests that will helpbuffer them or help them adapt to a changingclimate. Funds would be necessary to sup-port the cost of managing the forests. Somefunds might be allocated on a competitivebasis to support experiments suggested byuniversity and other private forestry re-searchers, helping ensure a creative pool ofideas.
Improve incentives for maintaining andprotecting private forestland. The FederalGovernment controls only about one-quarterof the Nation’s forestland. In the Eastespecially, where Federal holdings are limi-ted, efforts at supporting the protection ofprivate forestland may take on increasedimportance. The Federal Government willhave to use incentives, disincentives, andcooperative approaches to management topromote the health and productivity of thisforestland.
Existing programs under the CooperativeForestry Assistance Act as amended by the1990 farm bill provide cost-sharing assist-ance to owners of small, private forests.Traditional forest-support programs (e.g.,the Forestry Incentives Program) targetedfunds on the basis of potential gains intimber supply. The support programs couldbe modified to target money to: 1) areas at
Chapter 6-Forests 1351
high risk of catastrophic insect and firedamage, encouraging silvicultural activity tomaintain the health of the private forestland,and 2) activities that prevent fragmentationand further loss of scarce or ecologicallyvaluable forest types. Expanding the role ofthe Forest Stewardship and Forest bgacyPrograms, and reducing support for com-mercial foresfry under the Forestry IncentivesProgram might promote better protection onprivate forestland. The Forest StewardshipProgram could remodified to provide clearerfunding priorities, thus ensuring that somefi.mds are targeted to the areas identifiedabove.
2. honymous, Reno GazetteJournal, “Sierra Fire Battle HeatsUp,” $une 28, 1992, p. 1A.
3. Bazzaz, F.A., and E.D. Fajer, “Plant Life in a C02-RichWorl&” Scientific American, January 1992.
4. Bonq G.B., et al., “The Sensitivity of Some High-Latitude
Boreal Forests to Climate Parameters,” Climatic Change, vol.16, No. 1, February 1990, pp. 9-29.
5. Botkiq D.B., J.F. Janak and J.R. Wdlis, “some mOIOf@dConsequences of a Computer Model of Forest Grow@”Journal of Ecology, VO1. 60, 1972, pp. 849-72.
6. Botkiq D.B., R.A. NisbeL and TX. Reynales, “Effeets ofClimate Change on Forests of the Great Lake States,” im ThePotential Effects of Global Climate Change on the Wu”tedStates, AppendixD: Forests, J.B. Smith and D.A. Tirpak (eds.)(Wt@@tOIL DC: U.S. Environmental Roteetion Ageney,OftW of Policy, Planning and Evdu2tiOIL 1989).
7. Bowes, M.D., andJ.V. Krutill&Multiple-UseManagement: TheEcononu”cs of Public Forestlands (Washington DC: Resourcesfor the Future, 1989).
8, Bowes, M.D., and R.A. Sedjo, “Irnpaets and Responses to
CHAPTER 6 REFERENCES Climate Change in Forests of the MZNK Regioq” CZimrtic
1. AndersoxL R.L., “Ef&cts of Global Climate Chauge on Tme Change, in press, 1993.
Survival and Forest Pests in the South” Daner mesented at the 9. Boyle, B., andJ.H. Beuter, “TheFutureofForestry: TWo Views. . K
Society of American Foresters Convention in Washington DC, tim the ‘lbp,’’Ametican Forests, June 1993, pp. 13-16.
Jdy 30, 1990.
FORESTS-FIRST STEPS
w Establish an expanded forest seed-bank program-Establish a national program in forest seed oonsewation to help preserve the diversity of our forests.-Fund a National Forest Genetic Resources Program within the USDA Forest Service, providing funds
for storage, seed coiiection, and research.--Establish vvoridng ooliections at regionai centers for forest genetics (e.g., Forest Service Experiment
Stations).
~ Prepare to respond to rnaJor forest decllnes-Estabiish criteria for prompt intervention in the event of iarge-scaie mortality or decline thrwgh a new
West Health Biii.-initiate a policy review group to deveiop standards for undertakhig actions to stem forest dedine.--Aiiow reallocation of funds (forest 8aivage, timber 8aie activity, reforestation, and irwect or fire
management) for prompt response in times of forest health emergency.
B Prepare for a forest-management response to climate change-Fund research on the USDA experimental forests to find practical and environmentally appropriate
techniques to heip forests adapt to a changing climate.
■ Improve incentives for maintaining and protecting private forestland-FkMent the Forestry incentives Program away from its current focus on timber production to forest
health.--Ciarify the funding priorities of the Forest Stewardship Program to target areas of high environmental
value and promote natural forest cover.
352 I Preparing for an Uncertain Climate--Volume 2
10.
11.
12.
13,
14.
15.
16.
17.
18.
19.
20.
21.
22.
23.
24.
Campbell, R. K., “Adaptational Requirements of PlantingStock” irx Global Forestry and the Western Role, proceedingsfrom the Western Forest Conservation AssociatioxL Portlan&OR 1975, pp. 103-107.Canneu M.G.R., “Climate Warming and Spring Fhenology ofTrees, ” im Woody Plant Growth in a Changing Chemical andPhysical Environment, D.P. Lavender (cd.), proeedngs fkomthe Workshop IUFRO Working Party on Shoot GrowthPhysiology, Wneouver, BC, 1987, pp. 283-295.Cooper, C.F., “Sensitivities of Western Ecosystems to ClimateChange,” contractor report prepared for the Office of 7kchnol-ogy Assessment, August 1992.Cortner, H.J., and R.D, Gale, “People, Fire, and WildkmdEnvironments,” Population and Environment: A Journal ofInterdisciplinary Studies, vol. 4, summer 1990, pp. 245-57.Dale, V.H., and J.F. Franklin, “Potential Effects of ClimateChange on Stand Development in the PacKlc Northwes~”Canaalan Journal of Forest Research, vol. 19, pp. 1581-1590,Davis, M.B., “Quatenary History and the Stability of ForestCommunities, “ in: Forest Succession: Concepts and Applica-tion, D.C. Wesg H.H. Shugar$ and D.B. Botkin (eds.) (NewYork: Springer-Verlag, 1981).Davis, M.B., and C. ZabinsM “Changes in Geographical RangeResulting from Greenhouse Warming: Effects on Biodiversityin Forests, ” in: Global Warming and Biological Diversity, R.L.Peters and T,E. Lovejoy (eds.) (New Have~ CT: YaleUniversity Press, 1992).Davis, P,A., “Economy, Politics Threaten Species Act Re-newal,” Congressional Quarterly, Jan. 4, 1992, p. 16.Environmental Defense Fund (EDF) and the World WildlifeFund (WWF), How Wet Is a Wetland? The Impacts of theProposed Revisions to the Federal Wetlands DelineationManual (New York, NY and Washington DC: EDF and WWF,1992).Famuq P., “Forest Adaptation to Global Climate ChangeThrough Silvicultural Treatments and Genetic hnprovemen~”discussion paper, Weyerhaeuser Co., Feb. 4, 1992.Fedkiw, J., The Evolving Use and Management of the Nation’sForests Grassland, Croplands and Related Resources (Wash-ington DC: U.S. Deparbmmt of Agriculture, Forest SewiceResources Program and Assessment Staff, 1988).Frankl@ J.F., et al., “Mod.if@g Douglas-Fir ManagementRegimes for Non-Timber Objectives,” in: Douglas-Fir StandManagement for the Future Proceedings ofa Symposium, C.D.Oliver, D,P, H.anley, and J.A. Johnson (eds.) (Seattle, WkCollege of Forest Resourws, University of Washingto@ 1986).Greenland, D., and L.W. SwifL “Overview of Climate Friabil-ity and Ecosystem Response,” in: Climate Van-ability andEcosystem Response, D. Greenhmd and L.W. swift (dS.),USDA Forest Service General ‘Ikchnical Report SE-65(Aaheville, NC: USDA Forest Sewice, Southeastern ForeatExperiment statiom 1990).Grahar% R.L., M-G. ‘fhrner, and V.H. Dale, “How Inemuing@ and Climate change Affect Forests,” Bioscience, VO1. 40,
No. 8, September 1990, pp. 575-87.Harmon M., W. Femell, and W, Frankliq “Effects on CarbonStorage of Concession of Old-growth Forests to YoungForests,” Science, 247, 1990, pp. 699-702.
25.
26.
27.
28.
29.
30.
31.
32.
33.
34.
35.
36.
37.
Harper, S.C., L.L. F- and E.W. Rat@ The Northern ForestLands Study of New England and New York (Rutlan& VT: U.S.Department of Agriculture, Foreat Savice and Governors’ HForce on Northern Forest Lands, April 1990: 2nd printing,Februmy 1992).Heddem RL., “Impact of Climate Change on Forest InsectPests in the Southern U. S., “ in: Proceedings, Symposium onClimate Change in the Southern United States: Future Impactsand Present Policy Issues, M. Meo (cd.) (Washingto~ DC: USEnvironmental Protection Agency, 1987).Hedde~ R.L., “Global Climate Change: Implications forSilviculture and Pest lkfanagemen~” in: proceedings, Fif?hBiennial Southern Silvicuhural Research Conference, General‘Ikehnical Report, No. SO-74 (New Orkmns, LA: USDA ForestService, Southern Forest Experiment StatiorL 1989).Hodges, D.G., PJ. Jakes, and F,W. Cubbage, Status of ForestManagement Research in the United States, General ‘Ikchnieal
Report NC 126 (Saint Paul, MN: U.S. Department of Agricul-ture, Forest Service, North Central Forest Experiment StatioQDecember 1988).Hodges, D.G., et al., ‘‘Regional Forest Migrations and PotedalEconomic Effects,’ Environmental Tom”cology and Chema”stry,vol. 11, 1992, pp. 1129-1136.Houstou et al., “Beech Bark Disease: A Comparison of theDisease in North Amenc& Great BritahL France and Ger-many,” European Journal ofForest Pathology, vol. 9, 1979, pp.199-211.IfiL G., “Clinton Backs a $1 Billion Plan to Spare Trees andAid Loggers,” The New York Times, July 1, 1993, p. Al,Institute of Ecology, Expen”mental Ecological Reserves: AProposed National Network, a report prepared for the NationalScience Foundation (WashingtorL DC: U.S. Govemment Print-ing Office, June 1977).Intergovernmental Panel on Climate Change, World Meteoro-logical Organization, and United National Environment Fro-gr~ Climate Change: The JPCC Scientiic Assessment, reportprepared for WCC by Working Group I, J.T Houghtom G.J.Jenkins, and JJ. Ephraums (eds.) (Cambridge, England: Cambr-idge University Press, 1990).tntergovemmental Panel on Climate Change, World Meteoro-logical Org*“oq and United Nations EIIVirOMleIlt ~-
gtUQ climate Change: The iPCC Impacts Assessment, reportP- for WC by Working Group II, WJ. n= G.w.Shelddo% a n d D.C. Griffitha (eds.) (Canti AustralixAustralian Government Publishing Semice, 1990).Intergovernmental Panel on Climate Change, World Mctecmxlogical Organizatl“oq and United Nations Environment Pro-m 1992 IPCC Supplement, February 1992.Jarvis, P.G., “Atmospheric Carbon Dioxide and Forests,”Philosophical fiansactions of Royal Society Lmdon, vol. B324, 1989, pp. 369-92.Kellisoq R.C., and RJ. Weir, “Breeding Strategies in FormTree Populations to Buffer Against Elevated AtmosphericCarbon Dioxide hvels,” ixx The Greenhouse Eflect, ClimateChange and U.S. Forests, W.E. Shands and J.S. Hoffinan (eds.)
(washingto@ DC: The Conservation Foundation 1987).
Chapter 6-Forests I 353
38. Kimmins , J.P. and Lavender, D.P., “Implications of ClimateChange for the Distribution of Biogeoclirnatic Zones in BritishColumbia and for the Growth of Temperate Forest Species,’ in:Woody Plant Growth in a Changing Chem”cal and PhysicalEnvironment, D.P. Lavender (cd.), proceedings from theWorkshop IUFRO Working Party on Shoot Growth Physiology,%lCOUVeT, BC, 1987, pp. 297-309.
39. King, G.A., and R.P. Neilso& “The Transient Response ofVegetation to Climate Change: A Potential Source of COZ to theAtmosphere,” Water, Air, and Soil Pollution, vol. 64, 1992, pp.365-83.
40. King, G.A., and D. Tingey, U.S. Environmental ProtectionAgency, Corvallis, OR., ‘‘Potential Impacts of Climate Changeon Pacflc Northwest Forests,” discussion paper, May 1991.
41. Kitzmiller, J.H., “Genetic Considerations in Propagating Di-verse Tree Species, “ in: Proceedings, Western Forest NurseryAssociation, General Tkchnical Report RM-221, T.D. Landis,(cd.) (Fofi Collins, CO: U.S. Department of Agriculture, ForestService, Rocky Mountain Forest and Range Experiment StatiorL1993).
42. Kozlowski, T.T. (cd.), “Tree Physiology and Forest Pests, ”Journal of Forestry, vol. 67, 1%9, pp. 118-123.
43. Kramer, PJ., and N. Sionit, ‘‘Effects of Increasing CarbonDioxide Concentrations on the Physiology and Growth of ForestTrees, “ in: The Greenhouse Effect, Climate Change and U.S.Forests, W.E. Shands and J.S. Hoffman (eds.) (Washingto~DC: The Conservation FoundatiorL 1987).
44. Ledig, F. T., A Strategy to Manage Forest Genetic Resources inthe United States (Berkeley, CA: U.S. Department of Agricul-ture, Forest Semice, Institute of Forest Genetics, PacitlcSouthwest Research StatiorL 1992).
45. ~g, FT., md J.H. Kitzmiller, “ G e n e t i c Strateg’ie.. fOr
Reforestation in the Face of Global Climate Change,” ForestEcology and Management, 1991.
46. bverenz, J. W., and D.J. bv, “Effects of Carbon Dioxide-Induced Climate Changes on the Natural Ranges of Six MajorCommercial Tree Species in the Western United States, ” in: TheGreenhouse Eflect, Climate Change, and U.S. Forests, W.E.Shartds and J.S. Hoffman (eds.) (Washington, DC: The Conser-vation Foundation, 1987), pp. 123-155.
47. McI1veeu W.D., S.T. Rutherford, and S.N. Linmn+ “AHistorical Perspective of Sugar Maple Decline Within Ontarioand Outside Ontario, ARB-141-86 (Toronto, Canada: OntarioMinistry of the Environmen~ 1986).
48. Mckm, H.E., “The Blue Mountains: Forest Out of Control, ”American Forests, September/October 1992, pp. 32-35, 58,61.
49. McLean, H.E,, “The Boise Quickstep, ” American Forests, vol.99, No. l&2, January/February 1993, pp. 11-14.
50. MacArthur, R.H. Geographical Ecology: Patterns in theDis~”bution of Species (New York NY: Harper& Row, 1972).
51. Mattsoq W.J., and R.A. Haack, “The Role of Drought inOutbreaks of Plant-Eating Insects, ” Bioscience, vol. 37, No. 2,February 1987, pp. 110-18.
52. Miller, W,F., “AlternativeFutures for Resource Managemen~”in: Wafer-A Resource in Demand, proceedings of a symposiumon Future Climate and Potential Impacts of Natural ResourceManagement, ‘Mas A&M University, College StatioL Texas,Aug. 16-18, 1982, pp. 17-28.
53. Miller, W.F., P.M. Dougherty, and G.L. Switzer, “Effect ofRising Carbon Dioxide and Potential Climate Change onI.mblolly Pine Distribution Growth+ Survival and Productivity,”in: The Greenhouse Effect, Climate Change and U.S. Forests,W.E. Shands and J.S. Hoffman (MS.) (%ShiD@O~ DC: TheConservation Foundation 1987).
54. National Research Council+ Forestry Restmrch:A MatiteforChange (Washington DC: National Academy Press, 1990).
55. National Research Council, Managing Global Genetic Re-
sources: Forest Trees (Washington DC: National AcademyPress, 1991).
56. National Research Council, Policy Implications of GreenhouseWarndng (WashingtotL DC: National Academy Press, 1991).
57. New York Times, “ClintonPlanning to IncreaseFeesonGrazingLands,” Aug. 10, 1993.
58. OverPeck, J.T., “Modeling the Transient Response of Vegeta-tion to Climatic Change: A Paleoecological Time SeriesPerspective, ” Bulletin of the Ecological Society ofAmerica, vol.69, 1988, p. 251.
59. Overpcxk, J.T., et al., “Climate Change in the Circum NorthAtlantic Region During the Last Delegation” Nature, vol. 338,1984, pp. 553-557.
60. Overpeck, J.T, and PJ, Bartlem in: U.S. E n v i r o n m e n t a lProtection Agency Report, EPA-23@05-89-54, (Washin@oILDC: U.S. Environmental Protection Agency, 1989), ch. 1, pp.1-32.
61. OverPeck, J.T, P.J. Bartle@ and TW. Webb, “PotentialMagnitude of Future Vegetation Changes in Eastern NorthAmerica: Comparisons with the Past,” Science, Nov. 1, 1991.
62. Pastor, J., and W.M Post, “Response of Northern Forest toCOz-Induced Climate Change,” Nature, vol. 334, No. 7, July1988, pp. 55-58.
63. Perry, DA., and J. Maghembe, ‘‘Ecosystem Concepts andCurrent Trends in Forest Management: Time for Reappraisal,”Forest Ecology and Management, vol. 26, 1989, pp. 123-40.
64. PitelQ L., “Forest Response to Carbon Dioxide, ” EPRIJournal, January/February 1992, pp. 3841.
65. Public Employees for Environmental Responsibility (PEER),‘‘Public Trust Betrayed: Employee Critique of Bureau of LandManagement Rangeland Management,’ a report written byBLM employees, WashingtorL DC, June 1993.
66. Regens, J.L., F.W. Cubbage, and D.G. Hodges, “GreenhouseGases, Climate Change, and U.S. Forest Markets,” Environ-ment, vol. 31, No. 4, May 1989, pp. 4-5, 51.
67. Rehfeldt, G,E., “Microevolution of Conifers in the NorthernRocky Mountains: A View From the Common Garde~” iruProceedings, of the Eighth North American Forest BiologyWorkshop, ImgU w 1984, pp. 32-46.
68. Roberts, L. “How Fast Can Trees Migmte?” Science, Feb. 10,1989.
69. RobertsorL F.D., Chief, U.S. Department of Agriculture, ForestService, memorandum to Regional Foresters and StationDirectors on Ecosystem Management of the National Forestsand Grasslands, June 4, 1992.
354 I Preparing for an Uncertain Climate--Volume 2
70. Rudis, V.A., and R.A. Birdsey, “Forest Resourw Trends andCurrent Conditions in the Mississippi Mdley,” ResourceBulletin SO-1 16 (Nw Orleans, IA: U.S. Department ofA@dure, Forest Service, Soutkrn Forest Experiment Sta-tiO~ 1986).
71. Salwasscr, H., D.W. MacCleczy, and TL4. Snellgrove, “NewPcMpectives on Mana@ns the U.S. National Forest Systa”report to the North American Forestry Commission SixteenthSession, C- Mexico, February 1992 (Washington, DC:U.S. Deplmmt of Agriculture Forest Service, 1992).
72. Schneider, K., “U.S. Would Bnd cutting of Trees in M$lllyForc&s,” TheNew York Thnes, Apr. 30, 1993.
73. Sedjo, RA., “ForestResources: Resilient and Serviceable,” hAmerica’s Renewable Resources: Historical Trends and Cur-rent Chdenges, RA. Sedjo and K.D. Frederick (eds.) (Wash-
@tom DC: Resources for the Future, 1991).74. Sh~ H-H., A Theory of Forest Dynamics: The Ecological
Implications of Forest Succession Models (New York NY:Springer-vczlag, 1984).
75. SmitlAJ., and D. Tirpak ThePotentialEflects ofG1obal ClimateChange on the Utu”ted States (WasMngtoIL DC: U.S. Enviro-nmental Protection Agency, 1989).
76. Smi@ W.H., Air Pollution and Forests (New York+ NY:Springer-vcrlag, 1990).
77. Sxtdtlq WH., “Man@ng For@ Undcz A Chan@ng Climate:workshop summary,” summary of workshop convened by theOffice of lkchnology Assessment, Washin@XU DC, June18-19, 1992.
78. Smi@ W.H., “United States Forest Response and V Idnerabilityt o ”~ -Q” c-~ WP_ fOI tk Office ofRXhrlology Assesamcl14 June 1992.
79. Solom~ A.M., ‘Transient Response of Forests to C02-Induccd Climste Change: Simulation Modeling Experiments inEastesnNorth ArnX” Oeco20gia, vol. 68,1986, pp. 567-79.
80. ‘I)tyIor, K.T, and M.J. Sullivm Lu.rge-Loss Fires in the UnitedStates During 1990 Quincy, MA: National Fire ProtectionAssdatioa May 1992).
81. U.S. Congress, Co-siond Resesmh Service, The MajorFe&ral Lund Management Agencies Management of OurNation’s Lunds and Resources (WasMngtoG DC: Congres-sional Research service, 1990).
82. U.S. con@’ess, OHkx of lbcbnology Assessmen4 Catc&”ngOurBreath:NtxtSteps forReducing Urban Ozone, OTA-(M12
~XoXL DC: U.S. OOVernm=t Printing Office, July1989).
83. U.S. congmq Office of’kchnologykmsxncn; Changin8ByDegrees: Steps to Reduce Greenhouse Gases, O’llMl-482
(w@@i@& DC: us. Government Printing Office, February1991).
84. U.S. Deprtmw of A@ukare, Forest Semice, “The Causes ofMaple Blight in the Lake Stat@,” Researc h Paper LS-10 (St.Paul, MN: USDA Forest Su-vicq Lake States Foreat Expai-lrmrlt statioa 1964).
85. U.S. Department of Agriculture, Forest Scrvict+ “ProtectingIkiderwes from WiM13rea: A Guide for Homeowners, ~w-
~S ~ ~,” prepared by H.B. More, May 1981.
86. U.S. Departmmt of Agriculture, Forest Service, Forest ServiceManual 4062, Experimental Forest and Ranges (WashingtonDC: USDA Forest Service, 1985).
87. U.S. Departnwatof Agriculture, Forest Semicc, An Anafysis #the Land Base Situation in the Uru”ted States: 1989-2040,General lkcbnic.al Report RM-181 (Fort Collins, CO: USDAForest Semice Rocky Mountain Forest and Ran@ ExperhnentStatiou 1989).
88. Us. Department of Agriculture, Forest Service, FY J988, US.Forest Service Planting Report, Forest Plhnting, Seeding, andSilvicultural Treatntents in the United States (Washington DC:USDA Forest service, 1989).
89. U.S. Departxmat of Agriculture, Forest Service, RRA Assess-ment of the Forest and Rangefand Situatfon in the UnitedStates, FRR-26 (Washing&W DC: USDA, Forest Service,1989).
90. u.s. Depsrrrnen t of Agriculture, Forest Scrvice,AnAnalyds ofthe Timber Situation in the Um”ted States: 1989-20#0, Oenaal%ChniCd Report RM-199 @Oti Cob, CO: USDA, ForemService, Rocky Mountain Forest and Range ExperimentStatioq 1990).
91. U.S. Dq)artment of Agriculture, Fmwt Service, Critique ofLand Management Plannin8, Analytical Tools and I@onna-tion, FS-455 (Washington, DC: USD4 Forest Service, PolicyAnalysis Sti, June 1990).
92. U.S. Department of Agriculture, Forest Service, Blue Moun-tains Forest Health Report: New Perspective in Forest Health
(Porth@t OR USDA Forest Service, PllCifiC NortbestRegioq April 1991).
93. U.S. Department of Agricul~ Forat Suvice, Forest Insectand Disease Conditions in the United States, 1990 (WasMng-tonj DC: USDA Forest Service, 1991).
94. U.S. Department of Agriculture, Forest ServiW Report of theForest Service, Fiscal Year 1990 (TVasMgtoq DC: USD~Forest Service, 1991).
95. Us. Department of Agriculture, Forest service, “ReseamhNeeda Associated with C310bal Change Impacts on SouthernForested Wetlands,” summary ofaworkshop convened by theConsortium for Research on Southern Forest Wetlands, Feb.13-14; 1991, Baton Rougq LA (Washin@q DC: USDAApril 1991).
96. U.S. ~t O f @~~! Fo~t SIXVi% CarbonStora8eandAccumuhtion in United States ForestEcosystems,Oeneral ‘lbchnical Report WO-59, August W92.
97. u.s.~tof A@~tmF~tS~* For~tHe~thMonitoring in New f?nghld: ]M Annual Report, ReaourceBulletin NE-125 (Radnor, PA: USDA Forest Service, North-eastern Fore??t Ex@ment Statiorq October 1992).
98. U.S. Department of Agriculm Forest Sewicq Repon of theForest Service, Fiscal Year 1992 (Vhshingtq DC: USD~Forest Service, 1993).
99. Us. Department of Agriculture Ikmst Suvice, NationalAssociation of Professional Foremy Sclmls ad Collegqand USDA Cooperative State Resmrch Service, Forests forAmerica’s Future: A Research Program jbr the 1990s(washingmQ DC: USDA Forest kvice, JtuM 1989).
Chapter 6-Forests I 355
100. U.S. Department of Agriculture, Soil Conservation Semice,The Second RCA Appraisal (WashingtorL DC: USDA SoilConserv ation Service, 1989).
101. U.S. Department of Agriculture and U.S. Department of thelnterior,FinalReport on Fire ManagementPolicy, prepared bythe Fire Management Policy Review ‘E-amj May 5, 1989.
102. U.S. Department of Commerce, Bureau of the Census, J990Annual Survey of Man@actures (WashingtorL DC: Bureau ofthe Census, 1992).
103. U.S. Department of Commerce, Bureau of Economic Analysis,Regional Economic Information Systems (Washington DC:Bureau of Economic Analysis, 1988).
104. U.S. Department of the Interior, Fish and Wildlife Service,“Synopsis of Wetland Functions and Values: BottomhmdHardwoods with Special Emphasis on Eastern ‘Ikxas andOklahow” Biological Report, vol. 87 No. 12, September1987.
105. U.S. Department of the Interior, National Park Service,Management Policies (Washingto& DC: Government PrintingOffice 1988).
106. U.S. Environmental Protection Agency (EPA), EM4P A40ni-for, EPA 60WM-9 1-051 (Washington DC: U.S. EPA, March1992).
107. U.S. General Accounting OIYlce (GAO), Federal Fire Man-agement: Lim”ted Progress in Restarn”ng the Prescn’bed FireProgram, GAO/RCED-9-42 (WashingtorL DC: U.S. GAO,December 1990).
108. U.S. General Accounting Gftlce (GAO), Budget Zs.mes:Funding Alternatives for Fire-Fighting Activities at USDA andlntetior, GAO/AFMD -91=$5 (Wa.shingto@ DC: U.S. GAO,April 1991).
109. U.S. Senate, Forest Ecosystem Health and Recovery Act,Senate Hearing 102-980, hearing before the Subcommittee on
Public Lands, National Parks and Forests of the Committee onEnergy and Natura.1 Resources, U.S. Senate, 102d Congess, 2dSessiou on S. 1156, July 28, 1992 (Washington, DC: U.S.Government MMin.g Office, 1993).
110. Ur@ D.L., and H.H. Shug@ “Forest Response to ClimaticChange: A Simulation Study for Southeastern Forests,” i.wThe Potential Effects of Global Climate Change on the UnitedStates, AppendixD, J. Smith and D. Tirpak (eds,) (W@ingtowDC: U.S. Environmental Protection Agency, 1989).
111. Wadde~ K.L., D.D. Oswal~ and D.S. Powell, Forest Statis-tics of the United States, 1987, Resource Bulletin PNW-RB-168 (Port.lan6 OR: U.S. Department of Agriculture, Forest!kvice, Pacific Northwest Research StatioU 1989).
112. Wall Street Journal, “U.S. Renews Its Efforts to Overhaul_ policY, Calling for Higher Fees,” Aug. 10, 1993.
113. Wal@ R.G., et al., “Estimating the Public Benefits ofProtecting Forest Quality,” Journal of Environmental hfan-agement, vol. 30, 1990.
114. WoIf, R.E., State-by-State Estimates of Situations WhereTimber Will be Sold by the Forest Service at a Loss or Profit:A Report to the Subcommittee on htten”or Appropn’an”ons(WashingtoIL DC: Congressional Reseamh Sewice, Library ofCongress, 1984).
115. Wolf, S.M., Pollution Luw Handbook: A Guide to FederalEnvironmental Luws (Westpor$ CT: Greenwood Press, Inc.,1988).
116. WoodrmuL J.N., “The Potential Impact of COZ InducedClimate Changes on Management of Douglas Fir and WesternHernloc~” in: proceedings of the Conference on Rising COZand Changing Climate; Forest Risks and Opportunities, W.E.Shands (cd.) (WashingtorL DC: The Conservation Foundatio%1989).

Appendix A:List ofTables
andFigures
T A B L E S
Chapter l—Summary PageTable l-l—List of Boxes in Report. . . . . . . . . . . . . . . . . . . . . . . . . . . . . . . . . . . . . . . . . . . . . . . . . . . . . . . . . . . . . 8Table in box l-A-The Sensitivity and Adaptability of Human Activities and Nature, . . . . . . . . . . . . . . . . 6Table in box l—B-Potential Climate Change Impacts for Various Systems, . . . . . . . . . . . . . . . . . . . . . . . . . 15
Chapter 3—ResearchTable 3-1—List of Departments and Agencies or Bureaus Involved in USGCRP Research, ..,... . . . . . 119Table 3-2-Congressional Authorization Committees and Appropriations Subcommittees with
Significant Legislative Authority over Agencies with a USGCRP Component . . . . . . . . . . . . 124Table 3-3A—FY 1991 and 1992 Focused Research by Agency and Function. . . . . . . . . . . . . . . . . . . . . . . . 134Table 3-3B—FY 1991 and 1992 Focused Adaptation Research by Agency and Element. ,... . . . . . . . . . 134Table 3-4A-Percent of Total FY 1992 USGCRP Budget for the Third Science Element, Ecological
Systems and Dynamics (ESD), Compared with Percent of Each Agency’s GCRPBudget for ESD. . . . . . . . . . . . . . . . . . . . . . . . . . . . . . . . . . . . . . . . . . . . . . . . . . . . . . . . . . . . . . . . . 135
Table 3-4B-Percent of Total FY 1992 USGCRP Budget for the Fifth Science Element, HumanInteractions (HI), Compared with Percent of Each Agency ’s GCRP Budget for HI...... 135
Table in box 3-A-Potential Uses of Remote-Sensing Data..............,...,.. . . . . . . . . . . . . . . . . . . 128
Volume 1
Chapter 4-CoastsTable 4-l—Estimates of Insurance-Industry Potential Losses in 1987 Resulting from a Recurrence
of Past Hurricanes . . . . . . . . . . . . . . . . . . . . . . . . . . . . . . . . . . . . . . . . . . . . . . . . . . . . . . . . . . . . . . . . . 164Table 4-2-Estimated Cost of a Major Hurricane Striking Densely Populated Areas (or Major Cities). . 165Table 4-3—Insured Losses Likely To Be Experienced Under Different Maximum-Wind-Speed
Scenarios. .....................,.......,.,.. . . . . . . . . . . . . . . . . . . . . . . . . . . . . . . . . . . . . . . 166Table 4-4--Estimated Probabilities of Exceeding Given Levels of Flood-Insurance Losses. . . . . . . . . . . 170Table 4-5—Results of a Mail Survey of 132 Owners of Beachfront Property in South Carolina After
Hurricane Hugo. . . . . . . . . . . . . . . . . . . . . . . . . . . . . . . . . . . . . . . . . . . . . . . . . . . . . . . . . . . . . . . . . . . 177
For a list of boxes, see chapter 1, pages 8-9.
I 357
358 I Preparing for an Uncertain Climate--Volume 2
Table 4-6-Community Rating System Designed by the Federal Emergency ManagementAgency to Encourage Communities to Minimize Flood Damage.. . . . . . . . . . . . . . . . . . . . . . . 183
Table 4-7—Premium Reductions for Special Flood Hazard Areas (SFHAS) and Non-SFHAs inthe Federal Emergency Management Agency’s Community Rating System. . . . . . . . . . . . . . 184
Table 4-8—Rank of Project Categories by Dollar Amount and Percent of EstimatedObligations in the Hazard Mitigation Grant Program (January 1989 to August 1992) . . . . . . 184
Table 4-9—Status of U.S. Setback Authorities.,.....,...............,,., . . . . . . . . . . . . . . . . . . . . . . . . 187Table 4-10-Federal Programs and Laws Influencing Coastal Development:
Status and Potential Changes...........,...,.. . . . . . . . . . . . . . . . . . . . . . . . . . . . . . . . . . . . . 195
Chapter 5—WaterTable 5-1—Federal Offices Involved in Water Resource Planning, Development, or Management . . . . . 226Table 5-2—Ways to Use Water More Efficiently.......,.,.,.,.,.,.,.,.. . . . . . . . . . . . . . . . . . . . . . . . . 241Table 5-3—Possible Risk-Management and Risk-Minimization Measures the Federal Government
Could Consider to Lessen the Effects of Drought. . . . . . . . . . . . . . . . . . . . . . . . . . . . . . . . . . . . . 255Table 5-4--Summary of Options to Improve Water Resource Management . . . . . . . . . . . . . . . . . . . . . . . . . 263
Chapter 6-AgricultureTable 6-1—Harvested Acreage and Valueof Principal Crops, 1991.. . . . . . . . . . . . . . . . . . . . . . . . . . . . . . . 284Table 6-2—Projected Annual Rates of Growth in Agricultural Yields, . . . . . . . . . . . . . . . . . . . . . . . . . . . . . 306
Volume 2
Chapter 4-WetlandsTable 4-1—Wetland Vulnerabilities to Climate Change. . . . . . . . . . . . . . . . . . . . . . . . . . . . . . . . . . . . . . . . . . . 177Table 4-2—Responding to Climate Change Impacts on Wetlands: Summary of Reported
State Wetland Protection Programs. , . . . . . . . . . . . . . . . . . . . . . . . . . . . . . . . . . . . . . . . . . . . . . . . . 196Table 4-3-Examples of Laws and Agencies That May Be Affected by Various Policy Options. . . . . . . 197Table in box 4-D-Economic Values of Wetlands. . . . . . . . . . . . . . . . . . . . . . . . . . . . . . . . . . . . . . . . . . . . . . . 164
Chapter 5—PreservesTable 5-1—National Parks, Wildlife Refuges, and Wilderness Areas in the United States, . . . . . . . . . . . . 227Table 5-2—Management Goals for Some Federally Protected Natural Areas., . . . . . . . . . . . . . . . . . . . . . . 230Table 5-3—Examples of Benefits from Ecosystem, Species, and Genetic Diversity .......,. . . . . . . . . . 239Table 5-4-Species and Ecosystem Types Most at Risk from Climate Change. . . . . . . . . . . . . . . . . . . . . . 259Table 5-5-Options for Strategic Information Gathering . . . . . . . . . . . . . . . . . . . . . . . . . . . . . . . . . . . . . . . . . . 280Table 5-6-Options for Enhanced Protection. . . . . . . . . . . . . . . . . . . . . . . . . . . . . . . . . . . . . . . . . . . . . . . . . . . . 285
Chapter 6-ForestsTable 6-1—Human Values Associated with Forest Systems . . . . . . . . . . . . . . . . . . . . . . . . . . . . . . . . . . . . . . . 304Table 6-2—Area of Timberland in the United States by Major Forestst Type, 1987... . . . . . . . . . . . . . . . . 306Table 6-3—Forest Vulnerability . . . . . . . . . . . . . . . . . . . . . . . . . . . . . . . . . . . . . . . . . . . . . . . . . . . . . . . . . . . . . . . 326Table 64--Characteristics of Higher-Risk Forests. . . . . . . . . . . . . . . . . . . . . . . . . . . . . . . . . . . . . . . . . . . . . . . 327Table 6-5—Major Federal Acts or Programs Affecting the Use of Forest Lands... . . . . . . . . . . . . . . . . . . 331Table 6-6-Suitability of Silvicultural Practices. . . . . . . . . . . . . . . . . . . . . . . . . . . . . . . . . . . . . . . . . . . . . . . . . 332
FIGURES
Chapter l—SummaryFigure l-1-Potential Soil-Moisture Changes Under Two GCM Climate Change Scenarios . . . . . . . . . . . . 11Figure 1-2—Soil-Moisture Changes for Agricultural Lands and Areas of Natural Cover, by GCM
Climate ChangeScenario.. ...............,.. . . . . . . . . . . . . . . . . . . . . . . . . . . . . . . . . . . . . . . . 11
Appendix A–List of Tables and Figures I 359
Figure 1-3-The Delaware River Basin. . . . . . . . . . . . . . . . . . . . . . . . . . . . . . . . . . . . . . . . . . . . . . . . . . . . . . . . . . 24Figure 14--An Assessment of Coastal Hazards: Texas and Louisiana.. . . . . . . . . . . . . . . . . . . . . . . . . . . . . . 40Figure l-5-Water Withdrawals and Consumption in the Coterminous United States, 1985. . . . . . . . . . . . 43Figure l-&Preserves and Climate Change . . . . . . . . . . . . . . . . . . . . . . . . . . . . . . . . . . . . . . . . . . . . . . . . . . . . . . 49Figure l-7-Current and Projected Range of Beech Under Climate Change . . . . . . . . . . . . . . . . . . . . . . . . . . 55
Chapter 2—PrimerFigure 2-l-Long-Term Global Temperature Record, . . . . . . . . . . . . . . . . . . . . . . . . . . . . . . . . . . . . . . . . . . . . . 67Figure 2-2-The Greenhouse Effect.. . . . . . . . . . . . . . . . . . . . . . . . . . . . . . . . . . . . . . . . . . . . . . . . . . . . . . . . . . . . 72Figure 2-3-Measured and Equivalent C02 Concentrations in the Atmosphere. . . . . . . . . . . . . . . . . . . . . . . 73Figure 2-4-Expected CO2 Concentrations in the Atrnosphere According to Various Emissions
Scenarios . . . . . . . . . . . . . . . . . . . . . . . . . . . . . . . . . . . . . . . . . . . . . . . . . . . . . . . . . . . . . . . . . . . . . . . . . 73Figure 2-5-GCM-Estimated Changes in Temperature and Precipitation from a Doubling of C02. . . . . . 76Figure 2-&-Potential Soil-Moisture Changes Under the GISS Climate Change Scenario . . . . . . . . . . . . . . 77Figure 2-7-Potential Soil-Moisture Changes Under the GFDL Climate Change Scenario . . . . . . . . . . . . . 78Figure 2-8-Approximate Distribution of the Major Biotic Regions . . . . . . . . . . . . . . . . . . . . . . . . . . . . . . . . . 80Figure 2-9—Long-Terrn Temperature and CO2 Records from Antarctic Ice Cores and Recent
Atmospheric Measurements.. . . . . . . . . . . . . . . . . . . . . . . . . . . . . . . . . . . . . . . . . . . . . . . . . . . . . . . . 80Figure 2-l&The Distribution of Holdridge Life Zones Undercurrent Climate Conditions. . . . . . . . . . . . 95Figure 2-11 -Percent of U.S. Land Area Shifting Holdridge Life Zones After CO2 Doubling . . . . . . . . . . 96Figure 2-12—The Hydrologic Cycle Shows How Water Moves Through the Environment . . . . . . . . . . . . . 97Figure 2-13—Soil-Moisture Changes Under the GFDL and GISS Climate Change Scenarios,
by Land-Use and Cover .. . . . . . . . . . . . . . . . . . . . . . . . . . . . . . . . . . . . . . . . . . . . . . . . . . . . 101Figure in box 2-A— Modeled Topography of the United States by Use of Two Different Grid Sizes. . . . 69Figure in box 2-C—U.S. Coastal Marine Fisheries. . . . . . . . . . . . . . . . . . . . . . . . . . . . . . . . . . . . . . . . . . . . . . . . 82
Chapter 3—ResearchFigure 3-l A-Organizational Chart for the Federal Coordinating Council for Science, Engineering,
and Technology (FCCSET). . . . . . . . . . . . . . . . . . . . . . . . . . . . . . . . . . . . . . . . . . . . . . . . . . . . . . 113Figure 3-lB-Organizational Chart for the Committee on Earth and Environmental Sciences (CEES).. 114Figure 3-2—Priority Framework for USGCRP. . . . . . . . . . . . . . . . . . . . . . . . . . . . . . . . . . . . . . . . . . . . . . . . . . 116Figure 3-3-Functional Architecture of USGCRP. . . . . . . . . . . . . . . . . . . . . . . . . . . . . . . . . . . . . . . . . . . . . . . . 117Figure 3-4-U.S. Global Change Research Program Budget by Agency.. . . . . . . . . . . . . . . . . . . . . . . . . . . 120Figure 3—5-USGCRP Focused Budget by Activity Stream . . . . . . . . . . . . . . . . . . . . . . . . . . . . . . . . . . . . . . . 121Figure 3-6---USGCRP Budget by Science Element. . . . . . . . . . . . . . . . . . . . . . . . . . . . . . . . . . . . . . . . . . . . . . . 122Figure 3-7-FY1993 USGCRP Budget of Focused and Contributing Programs by Agency . . . . . . . . . . . 123Figure 3-8-Alternative Organizational Schemes for Global Change Research . . . . . . . . . . . . . . . . . . . . . . 145Figure in box 3-A-Incoming, Reflected, and Scattered Solar Radiation . . . . . . . . . . . . . . . . . . . . . . . . . . . . 128
Volume 1
Chapter 4--CoastsFigure 4-l—Historical Land Loss of Poplar Island in Chesapeake Bay as a Result of
Sea Level Rise and Erosion . . . . . . . . . . . . . . . . . . . . . . . . . . . . . . . . . . . . . . . . . . . . . . . . . . . . . . . . 157Figure 4—2-Schematics of a Developed and an Undeveloped Barrier Island . . . . . . . . . . . . . . . . . . . . . . . . 158Figure 4-3 A-Intensity of Historic Hurricanes.. . . . . . . . . . . . . . . . . . . . . . . . . . . . . . . . . . . . . . . . . . . . . . . . . . 160Figure 4-3 B-Damage-Producing Potential of Historic Hurricanes . . . . . . . . . . . . . . . . . . . . . . . . . . . . . . . . . 161Figure 4-4-Coastal Hazard Assessment . . . . . . . . . . . . . . . . . . . . . . . . . . . . . . . . . . . . . . . . . . . . . . . . . . . . . . . . 167Figure 4-5—FEMA’s Criteria for Imminent-Collapse and Setback Determinations Under the
Upton-Jones Amendment . . . . . . . . . . . . . . . . . . . . . . . . . . . . . . . . . . . . . . . . . . . . . . . . . . . . . . . . . . 181Figure 4-6-New Zones Established by Beachfront Legislation . . . . . . . . . . . . . . . . . . . . . . . . . . . . . . . . . . . . 191Figure in box 4-A--Saffir-Simpson Hurricane-Intensity Scale. . . ... , . . . . . . . . . . . . . . . . . . . . . . . . . . . . . . 162
360 I Preparing for an Uncertain Climate-Volume 2
Chapter 5—WaterFigure 5-l-Water Withdrawals and Consumption in the Coterminous United States, 1985. . . . . . . . . . . 211Figure 5-2-Average Consumptive Use and Renewable Water Supply by Water Resource Region . . . . . 214Figure 5-3-U.S. Groundwater Overdraft . . . . . . . . . . . . . . . . . . . . . . . . . . . . . . . . . . . . . . . . . . . . . . . . . . . . . . . 223Figure in box5-B-The Rio Grande Basin . . . . . . . . . . . . . . . . . . . . . . . . . . . . . . . . . . . . . . . . . . . . . . . . . . . . . . 217Figure in box 5-E-Navigable Waters of the Mississippi River System. . . . . . . . . . . . . . . . . . . . . . . . . . . . . 229
Chapter 6-AgricultureFigure 6-1-U.S. Production, Domestic Consumption, and Exports of Wheat, Corn, and Soybeans. . . .Figure 6-2-The USDA Agricultural Regions of the United States. . . . . . . . . . . . . . . . . . . . . . . . . . . . . . . . .Figure 6—3-Regional Distribution of Cropland and Irrigated Cropland in the United States. . . . . . . . . . .Figure 6-4-Characteristics of Nine Farming Regions . . . . . . . . . . . . . . . . . . . . . . . . . . . . . . . . . . . . . . . . . . . .Figure 6-5-Corn Yields in the United States, 1950-91. . . . . . . . . . . . . . . . . . . . . . . . . . . . . . . . . . . . . . . . . . .Figure 6-6-- Net Outlays of the Commodity Credit Corporation, 1982-91. . . . . . . . . . . . . . . . . . . . . . . . . . .Figure 6-7--Costs of Federal Disaster-Assistance Payments Over the Period 1980-90. . . . . . . . . . . . . . . .Figure 6-8-Appropriations for USDA Agricultural Research and Extension Programs for
FY 1972-93. . . . . . . . . . . . . . . . . . . . . . . . . . . . . . . . . . . . . . . . . . . . . . . . . . . . . . . . . . . . . . . . . . . . . .Figure in box 6-C-Change in Simulated Crop Yields After Doubling of CO2, by Region,
Under Two GCM Climate Change Scenarios. . . . . . . . . . . . . . . . . . . . . . . . . . . . . . . . . .Figure in box 6-D-The Arkansas River Basin of Southeastern Colorado. . . . . . . . . . . . . . . . . . . . . . . . . . .Figure in box 6-E--Kesterson Reservoir and Surrounding Areas . . . . . . . . . . . . . . . . . . . . . . . . . . . . . . . . . . .Figure in box 6-E-The Potential for Water-Salinity Problems . . . . . . . . . . . . . . . . . . . . . . . . . . . . .Figure in box 6-F-Extent of the Hard Red Winter Wheat Zone in 1920 and 1980, . . . . . . . . . . . . . . . . . .
. . . . . . .
Figure in box 6-F-Proportion of Wheat Planted to Leading Varieties in the United States . . . . . . . . . . .Figure in box 6-F-Midwestern Soybean Acreage in 1949 and 1982, . . . . . . . . . . . . . . . . . . . . . . . . . . . . . .Figure in box 6-G-The Ogallala Aquifer.. . . . . . . . . . . . . . . . . . . . . . . . . . . . . . . . . . . . . . . . . . . . . . . . . . . . . .
278281282283289314314
317
290293295296298299300301
Volume 2
Chapter 4-WetlandsFigure 4-1-Cross-Sectional Diagrams of a Northeaster Salt Marsh and a Riparian Wetland System. . 167Figure 4-2--General Distribution of Wetlands in the United States. . . . . . . . . . . . . . . . . . . . . . . . . . . . . . . . 169Figure 4-3-Wetland Acreage Lost in the United States, 1780s to 1980s. . . . . . . . . . . . . . . . . . . . . . . . . . . 170Figure 4&Extent and Location of Artificially Drained Agricultural Land in the United States, 1985. 171Figure in box 4-D --Relationship Between Wetland Processes and Values, . . . . . . . . . . . . . . . . . . . . . . . . . 163Figure in box4-F--Wetland Changes in the Mississippi River Active Delta (1956-78). . . . . . . . . . . . . . . 173
Chapter 5-PreservesFigure 5-1-Preserves and Climate Change. ...,.... . . . . . . . . . . . . . . . . . . . . . . . . . . . . . . . . . . . . . . . . . . . . 222Figure 5—2-Landownership of the U.S. Land Base. . . . . . . . . . . . . . . . . . . . . . . . . . . . . . . . . . . . . . . . . . . . . . 225Figure 5-3-Habitat Needs of Elk, Eagles, and Grizzly Bears in the Greater Yellowstone Ecosystem. . 226Figure 5-4A-Federally Owned Lands: Agency Jurisdiction . . . . . . . . . . . . . . . . . . . . . . . . . . . . . . . . . . . . . . 232Figure 5-4B--Federally Owned Lands: Percentage of State Area. . . . . . . . . . . . . . . . . . . . . . . . . . . . . . . . . . 233Figure 5—5-Recreational Visits to National Parks . . . . . . . . . . . . . . . . . . . . . . . . . . . . . . . . . . . . . . . . . . . . . . . 234Figure 5-6--Geographical Distribution of Some Federal Natural Areas. . . . . . . . . . . . . . . . . . . . . . . . . . . . . 240Figure 5-7-Authorizations and Total Annual Appropriations of Land and Water Conservation Fund.. 267Figure 5-8-Ecosystem Types Represented on Federal Land. . . . . . . . . . . . . . . . . . . . . . . . . . . . . . . . . . . . . . 286Figure 5-9-Ecosystem Types Represented inNationa1 Wilderness Areas. ... ...... . . . . . . . . . . . . . . . 287Figure in box 5-F-Biosphere Reserve Sites in the United States . . . . . . . . . . . . . . . . . . . . . . . . . . . . . . . . . . 247Figure in box 5-G-Stillwater National Wildlife Management Area. . . . . . . . . . . . . . . . . . . . . . . . . . . . . . . . 253Figure in box 5-L-GAP Analysis Example: Distribution of Endangered Hawaiian Finches in
Relation to Existing Nature Reserves on the Island of Hawaii in 1982. . . . . . . . . . . . 271Figure in box 5-L-The National Science Foundation’s Long-Term Ecological Research Network. . . . 272
Appendix A–List of Tables and Figures I 361
Chapter 6-ForestsFigure 6-l—USDA Forest Regions of the United States. . . . . . . . . . . . . . . . . . . . . . . . . . . . . . . . . . . . . . . . . . 302Figure 6-2—Forest Density Within Advanced Very-High-Resolution Radiometer Pixels. . . . . . . . . . . . . 303Figure 6-3-Area of Forest and Nonforest Land by Region, 1987. . . . . . . . . . . . . . . . . . . . . . . . . . . . . . . . . . 304Figure 6-4--MajorForest~s of the United States . . . . . . . . . . . . . . . . . . . . . . . . . . . . . . . . . . . . . . . . . . . . . 305Figure 6—5-Status of U. S. Forestland and Distribution of Timberland Ownership, 1987. . . . . . . . . . . . . . 308Figure 6-6-Timberland Ownership by Region, 1987 . . . . . . . . . . . . . . . . . . . . . . . . . . . . . . . . . . . . . . . . . . . . 308Figure 6-7-Forest Area Planted or Seeded in the United States bisection and by ownership . . . . . . . . 309Figure 6-8-Forest Fires in the United States, 1924-87 . . . . . . . . . . . . . . . . . . . . . . . . . . . . . . . . . . . . . . . . . . . 319Figure 6-9-Current and Projected Range of Sugar Maple under Two Models of Global Warming. . . . 322Figure in box 6-B-Average Carbon Storage per Acre of Forestland in the United States . . . . . . . . . . . . . 310
Appendix B:Acknowledgments
In addition to the workshop participants and the advisory panel listed in the front of this Report, OTA wishesto thank the individuals and organizations listed below for their assistance with this Report. These individuals andorganizations do not necessarily approve, disapprove, or endorse this Report. OTA assumes full responsibility forthe Report and the accuracy of its content.
Joe AbeEPA
Carlton AgeeOTA
Dave AlmandBLM
Patricia AndersonNSF
Cecil ArmstrongUSFS
Dick ArnoldUSDA
Marilyn ArnoldEnvironmental and Energy
Study Institute
Adela BackielCongressional Research Service
Tom BaerwaldNSF
Dick BallDOE
Robert BarbeeNPS
Mary BarberScience & Policy Associates, Inc.
Keith BeaCongressional Research Service
Michael BeanEnvironmental Defense Fund
Barbara BedfordCornell University
James BeeverFlorida Game & Freshwater
Fish Commission
Michael BesslerBOR
Clark BinkleyUniversity of British Columbia
H. Suzanne BoltonN O A A
Mark BrinsonEast Carolina University
Blabby BrownOTA
Mike BuckleyF E M A
Bill BuschN O A A
Dixon ButlerNASA
I 363

364 I Preparing for an Uncertain Climate--Volume 2
Anne CareyUSDA
Katherine DuffyDuffy and Associates
Indur GoklanyDOI
Pete CarlsonAlaska Division of Tourism
Jae EdmondsPacific Northwest Laboratory
Julie GorteOTA
John ElklndCouncil on Environmental
Quality
Barbara CherryNASA
Ross GorteCongressional Research Service
Elizabeth ChorneskyOTA
James GosselinkLouisiana State UniversityJoanna Ellison
Bermuda Biological Stationfor Research, Inc.James Clark
Duke UniversityJames GoszNSF
Gary EvansUSDAStan Coloff
BLMWilliam Gregg, Jr.NPS
Jack FellowsOMB Dennis Grossman
The Nature ConservancyPeter ComanorNPS
Arthur FeltsUniversity of Charleston Howard Gruenspecht
DOECharles CooperSan Diego State University
Robert FischmanIndiana University Joan Ham
OTALynne CornCongressional Research Service
Len FiskNASA Frank Harris
NSFPierre CrossonResources for the Future
Wendell FletcherOTA Chuck Hassebrook
Center for Rural AffairsJim CurlinOTA Mike Fosberg
USFS Jimmy HickmanUSFS
William DavisEPA Carl Fox
University of Nevada Robert HirschUSGS
Todd Davison
Doug FOX
USFS Donald HodgesMississippi State University
John Dennis
Jerry FranklinUniversity of Washington Marjorie Holland
Ecological Society of AmericaA.V. DiazNASA Bob Friedman
OTA John HousleyCOE
Erich DitschmanClinton River Watershed
councilMary GantHi-Is LeeI Ischinger
FWSBert DrakeSmithsonian Environmental
Research Center
Thomas GednaOklahoma School of Electrical
and Computer EngineeringDale JamiesonUniversity of Colorado
Paul Dressier Tom GeorgeUSDA
Anthony JanetosNASA

Appendix B–Acknowledgments I 365
Katherine JeschUSFS
Larry LarsonAssociation of State Floodplain
Managers, Inc.
Paul McCawleyUSDA
Stanley JohnsonInstitute for Policy Studies
John McShaneFEMADon Laurine
NOAAWilliam Jordan IllUniversity of Wisconsin
Arboretum
Gary McVickerBLMSteven Leatherman
University of MarylandMark MeoUniversity of OklahomaEugene LeComte
National Committee onProperty Insurance
Linda JoyceUSFS
Jerry MelilloWoods Hole Ecosystems CenterFred Kaiser
USFS Bob LedzionBOR Robert Mendelssohn
Yale UniversitySally KaneNOAA Simon Levin
Princeton University Ben MieremetN O A AKerry Kehoe
Coastal States Organization Roy Lewis IllLewis Environmental Services, Inc. Hal Mooney
Stanford UniversityJohn KelmelisUSGS Steven Light
South Florida WaterManagement District
Lewis MooreBORPaul Ketty
University of OttawaDavid MouatDesert Research Institute
Harry LinsUSGS
John KirkpatrickUSFS
Tom MuirUSGS
Orie LoucksUniversity of Miami
Robert KnechtUniversity of Delaware
Kit MullerBLM
Jane LubchencoOregon State University
Gordon KnightBLM
Mary Fran MyersUniversity of Colorado
Alan LucierNational Council of the Paper
Industry for Air and StreamImprovement
Marge KolarFWS
Dan NewIonNSF
Paul KomarOTA
Ariel LugoPuerto Rico Department of
Natural Resources
Elvia NieblaUSFS
Stanley KrugmanUSFS
Stephen NodvinNPS
James KushlinUniversity of Mississippi
Kathy MaloneyUSFS
John NordinUSFS
Maria Lacayo-EmeryUSFS
Stephanie MartinUniversity of Washington
Douglas NortonNASA
Larry LangnerUSFS
Mark MaurielloNew Jersey Department of
Environmental Protectionand Energy
Edward LaRoeD O I
John PastorUniversity of Minnesota
366 I Preparing for an Uncertain Climate--Volume 2
Ari PatrinosDOE
Robert SchallenbergerFWS
Steven SonkaUniversity of Illinois
Jon PershingDepartment of State
Joel ScheragaEPA
Raymond SquitieriCouncil of Economic Advisors
Rob PetersConsultant
Karen SchmidtEnvironmental and Energy
Study Group
Eugene StakhivCOE
Mike PhillipsOTA
Linda StanleyDOIRust y Schuster
BORRutherford PlattUniversity of Massachusetts
at Amherst
Marty StrangeCenter for Rural AffairsJ. Michael Scott
University of Idaho Norton StrommenUSDA
Boyd PostU.S. Department of Agriculture
Cooperative State ResearchService
Fran SharpeisOak Ridge National Laboratory Byron Tapley
University of Texas at AustinEileen SheaNOAABrooks Preston
Senate Committee on Agriculture,Nutrition, and Forestry
Eugene TehruDOTDavid Shriner
Oak Ridge National Laboratory Jack Ward ThomasPacific Northwest Forest and
Range Experiment Station
J.C. RandolphIndiana University
Max SimmonsCongressional Research Service
Peter RavenMissouri Botanical Garden
Benjamin SimonDOI
Shelby TilfordNASA
Steve RawlinsUSDA David Smith
Southeast Regional ClimateCenter
Dennis TirpakEPA
Francis ReillyDon TrillingDOTJoel Smith
EPAJohn ReillyUSDA Dennis Truesdale
USFSLowell SmithEPACourtney Riordan
EPA Eugene TurnerLouisiana State UniversityWilliam Smith
Yale UniversitySteve RagoneUSGS Lim Vallianos
COEDave SoIenbergerGeneral Accounting Office
Michael RuggieroNPS Jan van Schilfgaarde
USDAWayne SolleyUSGS
Nora SabadellNSF Virginia Van Sickle-Burkett
FWSBill SommersUSFS
R. Neil SampsonAmerican Forestry Association Hassan Virgi
Working Group on GlobalChange, Executive Secretary
David SandbergUSFS
Jack Sommers

Charles WahleCongressional Research Service
Geoffrey WallUniversity of Waterloo
Jonathon WeinerDOJ
Rodney WeirNOAA
Trina WellmanNOAA
William WerickCOE
Robin WhiteOTA
Don WilhiteUniversity of Nebraska
Jeffress WilliamsUSGS
Paul WindleEPA
Appendix B–Acknowledgments I 367
Phyllis WindleOTA
Frank YoungHHS
Mike YoungUSDA
Joy ZedlerSan Diego State University
Jeffery ZinnCongressional Research Service
Index
adaptation to climate changeagricultural, 6, 13, 18-19,44-46 ~; 276-277,
286-328 ~anticipatory actions, 3 ~choosing strategies, 15-16 ~coastal areas, 6, 18,40 ~]; 154-204 ~communication of risk and, 25-26 ~contingency plannindefin~2-3~ “2627flcxibi.li’ty in pd.icy making, 16-17, 18 ~forests, 6, 15, 19,23,55 ~; 320-330,347-349 ~]fragmentation, 19,2325hiStOIiCd exampks, 298-300 ~manag~ VS. unmanaged systems, 102-103 ~photoperiod and, 87 ~; 287,299,303 ~]preserves, 19, 53 ~; 235-238, 244-250, 258-268,
276-277,279-291 ~rate of change and, 4 ~research, 16-17, 23, 27, 30,35, 111, 132-139, 147-
148 ~species adjustments, 91-95 ~; 179-181 ~water resources systems, 6, 18,42 ~; 232-235 ~]WCtkIldS, 12, 111 ~/II]; 172-185 ~
agricultureadaptability, 6, 13,18-19,44-46 ~]; 276-277,
286-328 D]biotechnology applications, 284,306-307,315,323,
325 ~climate change effects, 5, 13, 15,45 ~; 286-296 ~]commodity support programs, 17, 19, 45, 46 ~; 276,
297,310,311-312,317-319, 326,327 ~competition for world markets, 284 ~crop insurance, 21, 26, 33, 36-37, 45 ~; 254-255,
312-313,320,321,328 ~]cropping systems, 46 ~; 287, 308-309 ~
disaster assistance, 19, 26,36-37,45-47 ~; 276,310,312-313,319-322,326-328 ~]
domestic demand, 282 ~drought and, 13,45 ~; 288,293,304-305 @Jdryland, 33 ~; 218,291,296,299 ~economic issues, 276,277-278,280,288, 291,292 ~environmental concerns, 284, 289, 292,294-2% ~farm structural changes, 286,304-305 ~Federal programs, 278-280,284 ~fertilizers, 88 ~; 219,307 ~growing season, 13,33 ~; 287,303 ~information and management technologies, 46 ~; 284,
305,307-308,323-328 ~institutional setting, 310-316 ~intensive farming practices, 33,46,87-88 ~; 304 ~legislation, 46-47 ~; 278-279,311,312,318, 321 ~microclime mod.Mcation, 303 ~policy options, 46=$7 ~]; 316-328 ~in prairie pothole region, 26, 33-34 ~regions of United States., 281, 283 ~research and extension, 16-17, 22, 26, 35, 46, 133, 135
~]; 279,297,299,305,308, 309,310,317,323-324,326 ~
salinization problems, 259,284,294-296,297 ~Sodbuster Program, 284 ~soil conservation, 278,279, 301,310,322,324 ~]soil moisture and, 10, 11 ~; 303 ~subsidies, 17, 19 ~; 192, 297, 310, 312-313,318,
320 ~Swampbuster Program, 284 n]; 192-194,201 ~technologies, 45,46 ~; 297-309 ~trends, 281-286 ~water demand and supply, 31,45 ~; 288-289,292-294,
296,300,313,322 ~
NOTE: Volumes 1 and 2 of the report are indicated by U] and ~, respectively.
1369
370 I Preparing for an Uncertain Climate--Volume 2
water pollution, 29,32 ~/II]; 217,219,278-279,284, 292,294,296,328 ~; 168, 170-171,251 ~]
wetlands, 26, 28, 31, 33-34, 47 ~; 276, 278 ~);170-171, 192-194, 199,200 ~]
world demand, 282-284 ~see aZso crops; irrigation; livestock; U.S. Department of
AgricultureAlabama, 270,273,305 ~]Alaska, 13,50-52,81,82 ~]; 166,221 ~; 161, 163, 168,
185,209,221 ~alpine areas, 91 ~]; 181,225 ~American Indians, 212,222,243 ~Antarctic
ice cores, 80 ~ozone layer hole, 73 ~]
arid Westagriculture, 276 ~drought, 210,288 ~irrigation subsidies, 240, 313 ~precipitation pattern shifts, 9 ~]protected natural areas, 52 ~snowrnelt, 213 ~]water supplies, 212 ~]water transfers, 18 ~]; 292-293 ~]wetlands, 13, 47, 125 ~; 167, 176, 178-179, 181,
184-186,201, 202,209 ~Arizona, 215,223,224,237,246, 250,272-273 ~]Arkansas, 13 ~; 270, 280 ~Arkansas River Basin, 228,292,293 ~&sociation of State Floodplain Managers, 184 ~]
Babbitt, Bruce, 30,37 ~/ITlbarrier islands, 39, 79 ~]; 154, 156, 158, 165, 176-178,
185-186, 199-200 U]; 194 ~Battelle Pacific Northwest Laboratory, 141,143 ~bears, 225,226,241 ~]biodiversity
consematioh, 49, 55-56, 109 ~; 220, 232-233 ~; seealso natural areas
Everglades, 29 ~fomts and, 336-342 ~Gap Analysis Project, 129 ~; 270-271 ~National Biological Survey, 37,48,53,129,137,149, 150
~/II]; 283-284 &I]preserves and, 19,49 V/H]; 239,258 ~protection, 53 ~; 258 ~]wetlands, 167, 172, 178, 180, 182-183, 186 ~
Biosphere Reserves, 29 ~/11’J; 230,246-248,275,288,289 ~]
biotechnology, 23 ~]; 284,306-307,315,323, 325 ~birds, 29,33,51,93,96 ~]; 218,226,301 ~]; 165,
226-228 ~Brown, George, 117 ~Bureau of Land Management, 50 ~; 222, 248 ~]; 188,
222,224,225,229,231, 235,237,240,242-244, 261,270,277,279,289,313, 332-334,336,338,340, 344,347 pI]
Bureau of Reclamation, 43, 136 ~; 233-234, 240, 243,246,248,249-250,254, 257,263,294,295,313 ~;204,252 pq
California, 273 ~agricukum, 31 ~; 280,294-297,304,315 ~Central Wley Project, 31 ~; 219,223,224,236,238,
241,296-297 ~; 209,252,255 @Ilcoastal population, 31 ~drought, 22,32 ~; 238-239,261 ~Drought Water Bank, 236,238-239 ~fiIM, 1,90 ~, 261 ~f100dS, 253 ~Imperial Valley, 237 ~irrigation districts, 237-238 ~Kesterson National Wildlife Refuge, 294-2% ~Metropolitan Water District, 224, 236, 237, 241, 247,
261-262 ~]Owens Valley, 216,237,238 ~Peripheral Canal, 32 ~; 237 ~San Joaquin Vid.ley, 294-296,297 ~San Luis Darn, Canal, and Reservoir, 295 ~State Water Project, 31 ~; 236,238,251,259 ~water issues, 13,31-32 ~; 214-215,216,219,222, 223,
224, 227, 236, 237, 240-241, W, 247, 259-262,294-2% ~; 210 ~
wetlands, 155, 160-161, 183, 209, 277 ~Canada, 33 ~; 230-231,260,298,299 PI; 190 I?llcarbon dioxide, 71-74, 75,87-89,94,98 ~
Antarctic ice cores, 66,71,80 ~atmospheric concentrations, 50,65,66,73,80,89 ~doubling effkcts, 70,75,76,93 ~; 166,290 ~ecosystem productivity, 88-89 ~emission scenarios, 72,73 ~fertilization effect, 11, 66, 70, 87-89 ~; 287 ~;
175-176,323 ~long-term records, 71,80 ~Sinks, 51 ~; 165, 168, 185,310-311 ~
CtibOU, 50 ~; 185, 225 ~Carnegie Comrnission, 143 ~Carnegie Mellon University, 140, 143 ~Carson River Basin, 248, 2S1 ~]Chesapeake Bay, 81,87 ~; 157 ~; 163, 175, 176, 183,
199 m]chlorofluorocarbons, 65,72, 73, 112 ~Clean Water Act
fishery improvement, 82 ~municipal sewage treatment funding, 197-198, 202, 220-
221,242 U]non-point-source pollution, 215,220 ~; 200 ~reauthorization, 44 ~; 219,220-221 ~water constnation, 44 ~; 264 ~watershed management, 25,48 ~; 205,206,209,210,
220,215,256 ~wetlands protection, 36, 48 ~; 202, 221 ~; 154, 155,
157, 159, 178-179, 188, 189, 191, 195-196, 198,200,203,205-206,209-212 ~
clouds and cloud cover, 68, 87 ~
Index I 371
coastal areasbarrier islands, 39,79 ~]; 185-186, 199-200 ~beach nourishment and shoreline protection, 41-42 ~];
154, 168, 172-176,202,204 ~building COCkS, 199 m
demographic trends 155-156 ~development pressures, 39,40 ~; 166 ~development subsidies, 17,18,21 ~; 172,176,177 ~disaster assistance, 21,41 ~; 171-173, 198-199 ~erosion, 9,26,39,41,51,79 ~; 155,156,157,170-171,
181, 187-188, 191, 194-195, 201 ~; 173, 182, 183,186 ~
flood insurance, 18, 21, 26, 41 ~; 168-171, 180-182,194-198 ~]
flooding, 155, 156, 157 ~; 186 ~hazard assessment and mitigation, 26,40 ~]; 166, 167,
174-175, 183-185, 198-199,200,201,203 ~hurricanes and coastal storms, 13,39,90 ~; 154, 155,
159-166, 171, 188-191 ~]institutional fragmentation and regulato~ obstacles, 18
~]; 178-179 ~]land acquisition, 200,201 ~management legislation and programs, 21,41 ~]; 154,
178-179, 185-194, 196,201 ~; 193 ~mangroves, 29,99 ~; 160, 172 ~pdiCy O@OI’LS, 4042 ~]; 194-204 ~]population pressures, 5, 13,31,39,82 ~; 154, 156 ~retreat policies, 175, 179, 188, 192-193, 197 ~; 207 ~risk allocation and management, 154 ~; 201 ~sahvater intrusion, 13,32,96 ~; 215 ~; 176, 182 ~]sea level rise, 8-9, 13, 39, 79, 93,94 ~; 154, 155-157,
159, 197 ~; 173-174, 182, 186 ~setback provisions, 175, 179, 181, 187, 196,201,202 ~;
193, 195,206 ~“takings” issue, 177-178, 191 ~]tax code subsidies, 21-22 ~; 168, 176,200 ~V zones, 168, 169, 171, 181, 196 ~vulnerability, 5,6, 13, 15,39 ~; 154-166 ~wetlands, 9, 12, 15, 21, 47 ~; 159, 160, 165, 190, 202
~]; 169-170,180-183,186, 193,201 ~]Coastal Barrier Resources System, 185,200 ~]Colorado, 213,215,238,246,248, 272,280,285,292,293
~; 179,257 ~Colorado River Compact, 224-225 ~Colorado River Basin, 13 ~; 216, 2X-225, 237,239,246,
259 ~Columbia River, 260 ~; 175 ~Committee on Earth and Environmental Sciences (CEES),
113-115, 118, 121, 132, 133, 136, 138, 146 ~committee on Science, Engineering, and Public Policy
(COSEPUP), 4,6, 110 ~Comecticut, 269 ~conservation
biological diversity, 49,55-56, 109 ~Federal programs, 278-280 ~forest, 55-56 ~; 346 ~funding, 54 ~; 265-266 ~]habitat, 236-238 ~
incentives, 21 ~/IIJ; 287-288 ~SOti, 278, 279, 301 ~species, 54, 127 ~]; 235-238 ~wetlands, 278 ~]; 192-193 ~see also water conservation
Conservation Reserve Progrw 233,278,284,318 ~; 190,191, 194,268, 287 ~
Consortium for International Earth Science Information,274 ~]
conventions and treatiesBiodiversity Convention, 109 ~Framework Convention on climate Change, 2, 109 ~Montreal Protocol, 73, 109 ~
crop insurance, 21, 26, 33, 36-37, 45 w]; 172, 199,254-255,312-313,320, 321,328 ~
croplanddistribution and land are% 277,282,294 ~forest clearance for, 296 ~harvested acreage, by crop, 284 ~irrigated, 282, 287-289, 294-2%, 301-302 ~soil moisture, 100 ~
cropsadaptation to climate change, 17 ~]; 291, 298-300,
308-309 ~]barley, 302,311 ~breeding, 277,289,298-299,306, 323,325,327 Mcontingency planning, 22 mcorn, 278,284,285,287,288, 289,291,298,299,300, 302,
303,305,306,311 ~cotton, 87 [I/II]; 284, 301, 302, 306, 308, 311 ~disease- and pest-resistant, 299,306-307 ~drought-tolerant species, 300 ~]exports, 277-278 ~genetically engineered, 307,325 ~Kenaf, 309,311 ~]new crops, 300, 308-309, 325 ~nutritional quality, 287 ~oats, 300, 311 ~oilseeds, 309, 311 ~]range, 9 [I/II]; 276, 277 ~rice, 284, 287, 611 ~sensitivity to climate change, 13,45, 81 ~; 287-289 ~simulation, 290, 308 ~]sorghum, 284, 287, 301, 302, 303, 305, 309, 311 ~SOJtMIS, 45,81 ~]; 278,284,285,287,300, 305,306,
311 ~sugar cane, 287 ~]wheat, 33, 34 ~]; 277, 278, 284, 285, 287, 288, 291,
298-299,300,301,303, 305,306,311 &l]yields, 290,305,306,322-323 ~see aZso crop insurance
Crown of the Continent Project, 249 ~]
darns, 17 (VII]; 215, 258,293 ~Delawarv, 269 (i]Delaware River Basin, 23,24 ~Delmana Peninsula, 157 ~desalination, 259-260 ~
372 I Preparing for an Uncertain Climate--Volume 2
disaster assistanceagricultural programs, 19, 26, 36-37, 4547 ~; 276,
310,312-313,319-322, 326-328 Ncongressional oversight, 199 ~for crop losses, 7,21,45,46-47 ~;deftig disasters, 21,4647 ~; 320,328 ~Federal share, 198,310 ~crop insurance, 21, 26, 33, 36-37, 45 ~; 172, 199,
254-255,312-313,320, 321,328 ~]emergency loans, 173, 176,279,313 v]hazard-reduction programs and, 166,198-199 ~for hurricanes, 7 ~; 154, 172 ~legislation, 41,4647 ~; 171,183-185,203,312, 313,
321 ~Mississippi River floods, 7 ~, 228-231 ~, 175 ~payments, 7,47 ~; 154,172,310,312,321, 328 ~]policy options, 47-48 ~; 198-199,203,310,319-322,
326,327 ~Residential disaster declarations, 178,185, 199,312 ~]public assistance grants, 168-169,171-172, 198,199 ~]reforms, 19,21,40,46-47 ~; 154,172-173,198-199 ~riak perception and, 21,26 ~self-insurance program, 322 ~
disease, 14,88-89 ~; 224 ~drought
agricultural effects, 13,45 ~; 288,293,304-305 ~assessment programs, 255 ~Aust@i& drought policy, 252,320 [email protected]% 22,32 ~; 238-239 ~economic eflkcts, 228 ~~OIiC@ 28-29 ~~uency, 69 ~government assistance, 34 ~inland water transportation and, 227-231 ~, 288 ~interagency task force, 22,43 ~legislation, 255 ~management, 27,42 ~; 251-256 ~pests and, 94 ~policy OptiOllS, 43 ~; 254-256 ~prairie potholes and, 33-34 ~precipitation pattern shifts and, 9 ~preparedness planning, 255 ~public-awareness programs, 255 ~SWCIity iMkX, 69 ~; 228 ~State l)kms, 27 ~, 252 ~water bank, 236,238-239,279 ~water resources and, 42 ~; 210,251, 293 ~; 179 ~
DUCkS Unlimited, 129 ~; 195 ~
Earth Day 1993,2 ~tilogicid Society of Arneric% 138 ~; 268,269 ~economic issues-On research, 133-134 ~in agriculture, 276-278,280,288, 291 ~drought, 228 ~fiSkliCS, 31 ~; 163-164, 183 ~forests, 302, 316, 328-330, 332, 335-336, 341-342,
345-349 ~
gross national product, 10 ~preserves, 232 @ltransportation, 14, 15 ~; 227,231 ~water quality and quantity, 5,7 ~wetlands, 154-155, 162-164, 166, 178, 183 ~
ecosystemsadaptability to climate change, 6,79-80 ~anthropogenic stresses, 66,88, 90-91 ~iUCtiC, 8 7 ~corridors, 242-243 ~declines and diebacks, 93-94 ~direct climate impacts, 91-% ~@Wn~tion, 19,49,66,90 ~; 239-MO ~Greater YelIowstone, 19 ~; 226,243-245,250 ~Hokiridge Life Zones, 91, 95, % ~management models, 244-250 ~research, 35,53-54, 111, 148-150 ~; 269 ~restoration, 17 ~; 154-156,276-277 ~water resources and, %-98 ~]
education, see public educationElectric Power Research Institute, 143 ~endangered and threatened SpCCkS, 29, 30, 31,47, 53, 93
~; 219,221,235-238 ~; 162,165,183,186,190,192,208,221,225,232-233, 241,258,268 ~
energy usesensitivity and adaptability, 6, 14, 15 ~water resources and, 211-213,227 ~
Environmental and Energy Study Institute, 150 ~Environmental Conservation Acxeage Reaerve Prow
268 ~Environmental Protection Agency (EPA)
adaptation research, 133,135 ~agricuhurc-relatai programs, 280 ~assessments of climate change, 100, 102-103, 110,
143 ~climate change research, 75, 133 ~; 289, 290 ~;
207 pqEnvironmental Monitoring and Assemment Rogram, 193,
199,200,210-211,268, 270 @IJwatershed management, 245 ~wetland management,48 ~; 178 ~; 155,157,179,188,
189, 193,205,206 ~evapotranspiration, 13,33,65,69,77,97,98 ~Executive OrdeXX
Executive Or&r 11988 (Flood Plain Management), 192,198 ~
Executive Order 11990 (Protection of Wdands), 155,192, 198 ~
Executive Order 12656,252,254 ~Experimental Forests, Ranges and Watmheds, 23,56 ~;
231 ~extreme events
CW change and frequency of, 1,66 ~; 250-251 ~contingency plarming, 5,22-23,26-27 ~z~nt 42A3 ~; 250-257,262-263 plpolicy OptiOnS, 22-23 ~; 194-24)2, 254257, 319-322
~; 342-347 ~uncertainty abou$ 10-11 ~
wetlands effects, 172, 176, 183-184 ~see also droughts; fires; floods
farms, see agriculture; cropsFarmers Home Administration, 173, 176,279,313 ~; 192,
201,203,212 ~Federal Coordinating Council on Science, Engineering, and
‘Ikchnology (FCCSET), 20, 30 n.7, 38-39, 110, 113,139, 146, 148 ~; 324 ~
Federal Crop Insurancs Program, see crop insuranceFederal Emergency Management Agency, 156, 168 ~
Community Rating System, 180, 182 ~; 208 ~disaster assistance, 171-173, 179, 198-199,254 ~flood insurarm, 178-179, 180, 197 ~; 193 ~floodplain mapping, 171, 197 ~ha.zard-mitigation requirements, 41 ~; 198-199,203 ~
Federal Energy Regulato~ Coremission, 233 ~Federal Insurance Admuus‘ “ tration (FIA), 168, 171, 1% ~FiR Island, 171 ~fires
ecological benefits, 51, 90, 100 ~]forest, 1,9, 12,22,26,27, 100 ~], 317,324,325,327,
329,330,342-347management in protected areas, 261-263 ~
f~heriesAleutian-North PacFlc, 13,50,51-52,81-82,86 ~;
185 @Ilanadromous species, 82,95 ~commercially important species, 83-85 ~die-offs and declines, 29,31,81 ~effects of climate change, 13,51-52,81-82 ~; 173-174,
183 ~]endangered and threatened, 31 ~estuarine-dependent, 81 ~industry, 50, 81-82 ~; 190 ~Imuisiana-Gulfof Mexico, 84 ~; 173-174 ~overfishing of, 51-52 ~OySterS, 81 ~; 186 ~regional characteristics of, 83-85 ~Sacramento-San Joaquin River System, 31 ~salmon, 31, 50, 81, 82 ~; 215 ~; 226Shrimp, 29 w]; 174, 186 ~StlipCd bass, 31, 81 ~; 183 ~temperature effects, 81 ~]; 215,219 ~wetlands role, 47, 81 ~]; 163-164, 174, 181 ~
Fish and Wildlife 2000,277 ~flood-control measures
coastal areas, 174-175 ~; 183 ~Federal agencies involved in, 254 ~jurisdictional fragmentation, 25 ~]; 233-234 ~migration of wetlands and, 12 ~; 182 ~and storm surges, 213 ~water resource plarming and, 42 ~and wetlands, 47 ~; 162, 164, 166, 168, 174, 182,
183 ~]floodplain
development, 10 ~]; 253 ~; 192 ~management, 43 ~; 168, 179-180,253,256 ~; 208 ~
Index I 373
mapping! 171, 197 ~wetlands, 161 ~
floodscoastal areas, 39 ~; 155 mi.llfIWtIllCtlKC aging and, 227 ~insurance, 168-171, 180-182 ~land area subject to, 253 ~managemen~ 253-254,256-257 ~Midwest (1993), 1,7, 10,15,22 ~; 231 ~; 203 ~national assessment board, 22,43 ~; 256 ~policy options, 22 ~; 256-257 ~vulnerability to, 253-254 ~see also National Flood Insurance Program
Floridaagriculture, 280,285,305 ~barrier islands, 39 I?/111building codes, 179, 193 ~coastal management, 187, 191, 193,200 ~coastal population and development, 155, 156, 164, 174,
179 ~dIOU@S, 28-29 ~endangered species, 241 ~Everglades, 25,28-30 ~; 219 ~; 205,209 ~f~heries, 84 ~flood control, 28 ~hurricanes, 1,7,22,28,29 ~; 154-156,163-165,171 ~mangroves, 172 ~protected anms, 257 ~sea level rise, 79 ~; 156, 157 ~water issues, 28,42 ~; 215,219, 223,261,270 ~;
210 ~wetlands, 160, 161, 164, 175, 182, 207,209 ~
Forest hgacy Programs, 57 ~; 335,341,341 ~fonX management, 6 ~
Uirement, 22 ~; 347-348 ~even-flow-hamest req@@tC lands, 56 ~; 334-336 ~protection of forest health, 22,56 ~; 343-347 ~public lands, 332-334 ~risk communication, 22,26 ~response to climate change, 17,55,56 ~; 330-336 @3Jtrends, 27 ~]; 317,319-320 ~
Forest Stewardship progr~ 57 ~; 335,341,342 ~Forestry Incentives Progmrn, 57 ~; 335,341,342,346 @IJforests
adaptability, 6,15,19,23,54,55 ~; 320-330 ~Blue Mountains, 27 ~; 318-319,329 @IJboreal, 50,51 ~carbon releases, 51 ~COZ concentrations and, 66 ~; 323 ~consewation and preservation methods, 55-56 ~declines and dieback, 9, 12, 54, 55, 56, 93-94 ~;
342-346 ~dispersal and colonization rates, 12 ~; 304-305,
308-309,311,315 ~fins, 1,9,12,22,26,27,100 ~; 261-263,317, 3M, 325,
327,329,330,342-347 ~forest health, 22,56 ~; 343-347 mfragmentation, 21,55 ~; 326 ~
374 I Preparing for an Uncertain Climate--Volume 2
hunicane damage, 189-190 ~incentive programs, 56-57 ~; 342,346-349land are% 54 ~; 303-304,308-309,311, 315 ~legislation, 56-57 ~; 312-314,343,346,348 ~-don, 12,14,52,54,94 ~; 321-323,332-333,336monitoring, 125 ~policy OptiOllS, 21,22 ~; 336-349 ~precipitation pattern shifts and, 9 ~PriVtlte lands, 21 ~; 341-342,346-347,348-349research, 23,55 ~resou.rws, 301-303,315-317 ~seed banks, 23, 55-56 ~; 336-338 ~vulnerability, 6, 15,19,54-55 ~; 324,326-328 ~types, 304 ~see also timberlandfossil fuels, 2 ~; 212,227 ~
General Accounting Office (GAO), 186,200,252 ~; 189,264pIl
general circulation models (GCMs), 78,91,99 ~C02 doubling effect, 76 ~; 166,290 l?’1global climate change predictions, 68-70 ~precipitation changes, 76 ~principles, 68 ~11.UIOff pIdiCtiOnS, 212-213 ~soil-moisture predictions, 9, 11,69,77-78,99, 101 ~]tempmmm pI’diCtiOIIS, 2,29,67,76 ~uncertainties and generalities in, 68-70 ~]; 213 ~]vegetation shifts, 91 ~
Geophysical Fluid Dynamics Laboratory (GFDL), 9,11,76,78,99-101 ~; 290 ~; 322 ~
Geor~ 157,186,194,215,270 ~; 164,210 ~C3ibbons, John, 112 ~&cklard Institute for Space Studies (GISS), 9, 11, 76-78,
100-101 ~; 290 ~; 322 ~Gore, Albert, 147 ~&athikcs, 13,14,75 ~; 166,186,192,228,230-231 ~;
186 ~greenhouse gases
atmospheric concentrations, 65,74,75 ~.
Chmate Convention and, 2 ~emissions, 2, 74 ~feasibility of reduction, 2 ~predicted changes in, 71-73 ~sources, 72,73 ~
groundwateradaptation to declines in, 301-302 ~]integrated management with surface water, 23, 25 ~];
210,250,246-247,301-302 ~overdrafts, 9 ~; 212,218,223-224 ~pollution, 219,284 ~precipitation pattern shifts and, 9 ~reasonable use doctrine, 222 ~saltwater intrusion, 29 ~; 155, 212, 213,217, 219 ~;
176 ~Gulf Coast (U.S.), 12, 13, 39 ~; 156, 159, 164, 167,
217-218 ~
Gulf of Mexico, 79 w]; 156-157 ~; 175 ~Gunison River Basin, 248 ~
habitatsconservation plans, 236-238 ~fragmentation, 3,5,13,19,86,92-93, % ~needs of wildlife, 226 ~wetlands, 164-165 ~
Hawaii, 1,71,85 ~; 166,273 ~; 168 ~hazard assessment, coastal, 26,40 ~; 166, 167,
183-185 ~Hazard Mitigation Grants program, 180, 183-185 ~health (human), 6, 14,15 ~Holdridge Life Zones, 91, 95, % ~hurricanes and storms
Andrew, 7,22,29 ~; 154-156,163,165,168, 171,172,179, 193 ~
coastal effects, 13, 39 ~; 159-166, 189-191 ~contingency plans, 22 ~damage-producing potential, 161, 163, 166,202 ~economic costs, 163, 165, 168, 172, 189-191 ~Federal disaster payments, 7 ~; 154, 172 ~flood-insurance claims and payments, 168 ~historic, 159-160 ~Hugo, 7,22 ~; 154, 155, 163, 165, 168, 172, 175-176,
188-191 ~m 154,155, 168 ~intensity, 11,75 ~; 159, 160, 162-163 ~personal losses, 159, 191 ~property damages, 189 ~redevelopment in high-risk areas, 25 ~Saffir-Simpson scale, 162-163 ~
hydrologic cycle, %-97 ~]; 212-213 ~; 165, 174,175,186 ~
hydropower, 9 ~; 211,227,231,233,248 ~
ice/snow meltsagricultural effects, 289 ~mountain snowpacks, 32,67,71 ~oceanic effects, 79 ~IUIIOff and, 213 ~]sea ice, 50-51,71,79 ~]sea level rise and, 69,79 ~; 156 ~temperature increases and, 70 ~transportation and, 14 ~
Idaho, 273,280 ~; 244,260 ~m.iIIOiS, 186,231,271,280,285, 288,305,315 ~]Illinois River, 228,230 ~Indian Reservations, 222-223,243 ~Indiana, 270,285 ~indigenous cultures, 50,51, 83-85 ~; 212 ~; 185 ~information technologies
agricultural applications, 46 ~]; 284, 305, 307-308,323-328 ~]
Geographic Information Systems, 129 ~; 273 ~inland waterways
barge traffic, 227-228,288 ~dredge and fill activities, 188, 189, 198,229-230 ~
Index I 375
drought effects, 227-231,288 ~shipping, 14 m
insects, 81, 86, 88-89, 94 ~; 288Intergovemmental Panel on Climate Change (WCC), 2,4,6,
72, 115 ~climate change predictions, 10, 32,68,73, 111 ~scientific assessment of climate change, 71,74, 100, 102,
103, 110, 118 ~sea level predictions, 78-79 ~; 156, 159 fl]
Interstate Coremission on the Potomac River Basin, 245,249 m
Interstate Council on Water Policy, 252 ~Iowa, 33 ~; 271,280,285 ~; 181 ~]irrigation
adaptation to climate change, 303-304 ~]alternatives to, 296,301 ~conservation technologies, 4 ~; 282, 301-305 U]cropland distribution and acreage, 280, 282, 294,301 ~groundwater withdrawals for, 301 ~]moisture conservation and, 303 ~Newlands Project, 252-253 ~]with reclaimed water, 261, 293 ~in saline soils, 294-296 ~scheduling, 303, 305 ~subsidies, 17, 26 ~]; 240, 310, 313, 322, 326, 327 ~;
200 p]water quality and, 294-296 ~water supplies and, 217, 237, 239, 276,288-289,304 ~]wetlands losses and, 184 ~]
Kansas, 271,285,298,301 ~]; 183 ~Kentucky, 271 ~Kissirnmee River, 28,29-30 ~; 204 ~]
Land Acquisition Priority System, 208,266 ~Land and Water Conservation Fund, 230,237 ~Land-use pl arming, 129 ~/II]; 201 ~]; 159, 206, 207, 229,
248 ~]bgislation
Acid Precipitation Act, 141 ~Agricultural Credit Act, 203 ~]Alaska National Interest Lands Conservation Act, 221 [111Baucus-Chafee Water Pollution Prevention and Control
Act, 220 ~Central valley Project Improvement Act, 224,264 ~]Clean Air Act, 314,318 ~]Clean Water Act, see Clean Water ActCoastal Barrier Improvement Act, 186 ~Coastal Barrier Resources Act, 40,48 ~; 180,185-186,
199-200 ~; 193, 194,201,212 ~]coastal development, 191 ~Coastal Zone Management Act, 21,37,40,41 ~; 180,
186-188, 191-194, 199,201 ~; 192, 193 ~]Coastal Wetlands Plannin g, Protection and Restoration
Act, 192, 194,202 ~Cooperative Forestry Assistance Act of 1978,56-57 ~/11],
335,346 ~Dingell-Johnson Act, 191 ~
drought-related, 255 ~Duck Stamp Act (see Migratov Bird Hunting and
Conservation Stamp Act)Earthquake, Volcanic Eruption, and Hurricane Hazards
Insurance Act of 1993,41 ~; 203,204 ~Emergency Wetlands Resources Act of 1986, 48 ~;
190, 191-192, 194,208,209,212,267 ~]Endangered Species Act, 30,31 ~; 219 ~; 192,
210,223,233,235-236, 255,258,267,288,313, 315,319 ~
Energy Policy Act of 1992,44 ~; 242,264 ~Energy Security Act, 141 ~environmental impact assessments, 38 ~Everglades National Park Protection and Expansion Act,
29 ~]existing statutory language, 37-39 ~Farm Bi.h, 36-37,46,56 ~; 278-279, 312, 313,321,
324,327 [TJ; 335,341,346,348 ~Federal Aid in Wildlife Restoration Act of 1937, 191,
267-268 ~Federal Aid in Fish Restoration Act of 1950, 191,267-
268 ~Federal Crop Insurance Act, 312 ~Federal Crop Insurance Reform Act of 1990,321 ~Federal Disaster Preparedness and Response Act of 1993,
41 ~; 203 ~Federal J.nsecticide, Fungici&, and Rodenticide Act, 279,
280 ~Federal Land Policy and Management Act of 1976,313,
334 ~Federal Power Act, 38 ~Federal Water Pollution Control Act, 189 ~]Fish and Wildlife Conservation Act of 1980,54 ~; 291,
266, 268,288 ~Fish and Wildlife Coordination Act, 38 ~; 192 ~Flood Disaster Protection Act, 168 ~Food, Agriculture, Conservation, and Trade Act, 309,312
~; 190,192, 194,268,335,341 ~Food Security Act of 1985,312 ~; 191, 192, 194 ~Forest ~osysterns and Atmospheric Pollution Act of
1988,279,343 ~Forest and Rangeland Renewable Resources Reseaxh
Act, 336,343 ~Fonxt and Renewable Resources Plmnin g Act of 1974,
312,325 ~forest management, 56 ~Hatch Act, 315 ~Henderson Wetlands Act of 1984,209 ~Housing and Community Development Act, 180-181 ~Land and Water Conservation Fund Act of 1965, 190 ~Magnuson Fishery Act, 82 ~Migratory Bird Conservation Act, 228 ~Migratory Bird Hunting and Conservation Stamp Act
(DUCk Stamp kt), 184,189,190,194,200 ~Migratory Bird Treaty Act, 228 ~MorriU Act, 315 ~Multiple Use and Sustained-Yield Act, 312 ~National Environmental Protection Act, 276 ~
376 I Preparing for an Uncertain Climate--Volume 2
National Environmental Policy @ 38 ~; 155, 192,199,255,312 ~
National FONSt Management Act, 347 ~National Flood Insursnce Act, 168,180 ~; 193 ~National Flood Insurance Compliance, Mitigation, and
Erosion Management Act of 1993,41,43 ~; 194,203,256,263 ~
National Flood Insurance Reform Act, 194,203 ~National Fom@ependent Rural COmrnunities Bconomic
Diversification Act of 1990,336,348 ~NationaI Forest Management Act, 22 ~; 312 ~National Psrk Semice Organic Act of 1916,228,234,
314 fyt-JNational Parks and Recreation Act, 245,314 ~National Wildlifb Refuge System Administmtion Act of
1966,228 ~North American Wetlands Consawtion Act of 1989,190,
208 ~Omnibus Budget Reconciliation Act, 311,318 ~Open Space Pmwrvation Act of 1991,200 ~Pacific Northwest Electric Power Planning and Conserva-
tion Ac\ 38 ~Pittman-Robertson Act, 191 ~]protected natural areas, 228-230 ~public land acquisitio~ 38 ~Public Rangclands Improvement Act, 334 ~Reclamation Act of 1902,313 ~Reclamation Projects Authorization and Adjustment Act
of 1992,44 ~; 264 ~Refige Recreation Act of 1%2, 228,264 @TJresearch authorization, 38 ~Rivers and Harbors Act of 1899189 ~Robert T. Stafford Disaster Relief and Emergency Assist-
ance Act, 171, 180, 184, 198 ~Safe Drinkm“ g Water Act, 227,280 ~Science Policy AX of 1976,20,38-39,146-147 IJ/llJSrnith-hver Act, 316 NSoil and Water Resources Conservation Act, 326 ~Tax Reform Act of 1986,242 ~; 194,200 ~Txuckee-Carson-Pyramid Lske-Water Settlement Ax,
254 p.rlU.S. Global Change Research Act, 39, 113,150 ~Water Bank Act, 190,194,200 ~Water Pollution Prevention and Control Act, 219,245,249
m; 209 ~Water Quality Act, 280 ~Water Resources Developmmt Act, 29,44 ~; 250,264
~; 192 ~Water Resources Plarming Act, 38 ~; 249 ~wetlsnd protection, 47,48 ~; 188 ~Wild and Scenic RiVCrS Act 179,229,256 ~Wikkrness Act, 221,224,229,239,256, 267,312 ~Wildlife Refuge Admrms“ “ tration Act, 264 ~
livestock, 200,202,280-281,285, 288-290,300,304,306,309-310 ~; 178 ~
hmg-~rm Biological Research pro- 268,271,2$3 ~Louis~ 39,40 ~; 156-157,166,215,270, 280,315 ~;
160, 163, 173-174,182, 192, 194,204,209 ~
Maine, 159,170,188,192,269 ~; 182,206,207 @IJMan and the Biosphere Prognuq M-247, 275,2$8,289 ~;
see abo Biospharc RCSCNCSmarine mammals, 50,51,52 ~; 190-191 ~Marine Sanctuaries PrograQ 194 ~Maxyland, 157,176,269,315 ~Massachusetts, 225,240,269 m; 164,210,259 mMassachusetts Institute of lkchnology, 143 ~Mauna Loa Observatory, 71 ~methane, 51,65,72,73 ~h&CiCO, 215,217-218 ~; 190 ~MiCh@l, 192-193,271,285 ~; 189 ~migration
corridors, 12 ~; 223-224, X2-244, 286,287 ~facilitation of, 187,206-208 ~flyways, 183,227,247,253,255 ~forests, 12 ~; 321-323,332 ~@pnentation of habitats snd, 92-93 ~; 181, X2 ~obstacles to, 12,93,94 ~; 180, 182, 186 ~pnxellms, 247,250-251 ~WCtltlIldS, 12,47,93,94,99, 100 ~; 166, 192 ~; 176,
180, 182,186,206-208 ~M@ltOry Bird Conservation Fu@ 189 @IJMinncso@ 33 ~; 271,240,285,290 ~; 173, 181 ~Mississippi, 270 ~; 164,173,174 ~Mississippi Delta, 12,79, 129 ~; 157,215 ~; 173-175,
182, 183 ~Mississippi River
barge backups, 227-231,288 ~diversions, 260 ~drought effects, 10 ~; 228-231 ~; 175 ~flooding, 7,10, 15,22 ~; 228-231 ~; 175,204 ~Gulf outlet, 204 ~international controversy, 230-231 ~navigation on, 22$-231 ~
MiSSOUIi, 13 ~; 229,230,271,285 ~Missouri River, 227,229,232 ~Mitigation and Adaptation Reseamh strategies (MARS),
118, 132-134, 138 ~models/modeling
crop simulation, 290,308 ~Extended SWarnflow Prediction, 248 ~funding for, 250 ~hydrological, 38,44 ~; 248 ~Integrated “Chrnate Change Assessnmt Model, 143 ~for water-rnana ement decisiomnaking, 248 ~weather Reso~s Forecasting Sys- 248 ~see also general circuhtion models
Mon~ 33 ~; 232,272,285,313 ~; 173,181,244,277 ~
municipal sewage treatment, 220-221 ~; 155,200-201 ~
National kSdCmy of Sciences (NAS), 54, 100,102-104,140,143,149, 252 ~; 157,166,185-186,281-282 ~
National Acid Precipitation Assessment Program (IWIPAP),140-142 ~
Index I 377
National Aeronautics and Space Administration,136, 141 ~
ecological studies, 125, 134-135 ~Global Climate Change Program, 274 ~]Mission to Planet Earth, 122-124 ~
National Biological Survey, 37,48,53, 149, 150200,210-211,283-284, 289-290 UIl
119, 131,
I./IQ; 199,
National Commission on the Environment; 145 ~National Committee on Property Insurance, 165 ~]National Estuary Program, 234,280 ~; 193 ~National Flood Insurance Fund, 169-170 ~National Nood hxmrance fiO~iUIl, 166 ~
claims and payments, 163, 168, 170 ~]coastal high-hazard (V) zones, 168, 169, 171, 196-197 ~community participation, 168-169, 253 ~]costs per structure, 170 ~disaster-assistance grants, 168-169, 172, 199 ~erosion zones and management standards, 170-171, 194-
195 ~Federal financial liability, 169, 1% ~flooded-properties-purchase program, 175, 180 ~floodplain-management standards, 168, 179-180 ~]hurricane darnages, 163 ~legislation, 41,43 ~; 168, 194,203 ~mandatory participation, 168, 170 ~mapping and rate structure, 197 ~premium rates, 21 ~; 169, 194, 197 ~reform options, 21,22,40,41 ~; 154, 194-198,203 ~risk calculations, 257 ~sea level rise and, 22 ~; 197 ~Section 1362 Flooded Properties Purchase Program,
180 ~Upton-Jones Relocation Assistance, 175, 178, 180-182,
197-198 ~wetland development and, 193,206, 208 ~
National Forest Genetic Resources Program, 56 ~; 337 ~National Forests, 50 ~; 190,222,223 ~; 229,230,231,
309 m]National Institutes of Health, 315 ~National Marine Fisheries Service, 31 ~; 155, 157, 188,
189 ~National Marine Sanctuaries, 231 ~National Oceanic and Atmospheric Administration; 231 ~]
adaptation research, 133, i36-137 ~coastal-hazards-management progmm, 41 ~; 178, 186
194,201,203 ~Estuarine Habitat program, 208-209 ~Habitat Restoration Program, 203 ~National Acid Precipitation Assessment Plan, 141 ~]non-point-source-pollution-management program, 201 ~Office of ocean and Coastal Resource Management,
188 ~USGCRP research budget, 131 ~Water Resources Forecasting System, 248,250,264 ~wetlands protection, 188, 193, 194 ~
National PA Service, 30,136 ~; 188,220,221,223,224,226,228,233, ~3-245, 251,255,260,275,278, 285,313-315,332,334,344 ~
National Parksacquisition of sites, 266, 267,286 ~categories, 228 ~Everglades, 25,28-30 ~]; 219 ~]; 205,209,251 ~Glacier, 238,249,251 ~Grand Canyon, 238 @l]endangered species, 235 ~land area and sites, 226 ~legislative framework, 228,234 ~management philosophies and goals, 221, 223, 230,
262-263 ~research needs, 282 ~]Rocky Mountain, 257 ~]value, 232, 238 ~water rights, 222, 223 ~Yellowstone, 100, 132 ~; 220,227,238,251,
261-263 ~Yosemite, 238,251 ~]
National Research Council, 112,136-139,145 ~; 306 ~;181, 185 D]
natural resourcesagriculture, 275-329 ~]coasts, 153-204 ~]forests, 299-351 ~preserves, 219-291 ~water, 209-273 D]wetlands, 153-213 [II]
National Science and ‘lkchnology Council, 147 ~National Science Foundation, 35, 133, 137, 141, 143, 149
~]; 315 ~; 193 ~L.ong-’knn Ecological Research Program, 271-272 ~
National Water Commis sion, 265 ~NationaI Weather Service, 193 ~National Wetlands Inventory Program, 125, 129 ~; 162,
165, 199,200,278 ~National Wetlands Policy Forum, 185,200,208 ~National Wetlands priority Conservation Plan, 190, 191 ~National Wild and Scenic River System 229,230 ~]National Wilderness Preservation System, 221, 224, 228-
230, 243,267, 278, 279, 285 @J; see also wilderness
Nation~$ildlife Refbges, 50 ~; 220,227,279 ~acquisitions, 190, 194, 266, 286 ~Balcones Canyonkmds Consenation Plan, 238,247-
248 ~Browns Park, 250 ~Cheyeme Bottoms Wildlife Area, 301-302 ~Des Lacs, 250 ~Ding Darling, 257 ~]endangered and threatened species, 235 ~Greater Yellowstone Ecosystem, 243 ~Kesterson, 294-296 ~; 251 ~land area, 226,240 ~legislative framework, 228 ~management philosophies and goals, 221, 223, 225, 231,
238-239,260,264 ~]Pelican Island, 228 ~policy options, 282,286 ~]
378 I Preparing for an Uncertain Climate--Volume 2
Stillwater, 251,252-254 ~water-allocation issues, 252-254 ~]wetlands, 171, 255 ~
natural areasacquisition policies, 17,21,22,36,54 ~; 222,264-268,
291 ~]adaptability, 19,53 ~; 220,258-264,266-268 ~Alaskan, 50 mbuffer zones, 242-243,244,245,246 ~climate change and, 49 ~; 222,254,256-258 ~defined, 224-22S, 227 ~distribution, 227,240,247 ~disturbance management challenges, 259-264 ~economic issues, 232,236 ~and endangered species conservation, 235-238,258 ~exotic species, 260-261 ~fn management, 261-263 ~human imp-, X8, 250-251, 263-264 ~institutional fragmentation, 20, 52 ~; 220, 222, 240,
243,250 ~inventorying, and monitoring, 22, 23 ~; 268-279,
280-285 ~land acquisition, 189-190 ~landscape fragmentation, 239-240,241-243 ~legislative framework, 228-230 ~management philosophies and goals, 52 ~; 220, 221,
222,223,230-231,244-246 ~pest control, 260-261 ~protection strategies, 284-289 ~research, 22,23 ~; 268-279,280-284 ~_ with climate change, 49 ~; 220 ~size considerations, 5, 19,23 ~; 225-226,241 ~S&&X4CS (existing), 49 l?/IX]; 220,239-253 ~Sustainable Biosphere Initiative, 138 ~; 269 ~water allocation issues, 251, 252-256 ~see UZSO national parks; national wildlife refuges; wilder-
ness areas~] Natun Conservancy
Last Great Places Initiative, 246-248,273,283,288 ~National Natural Heritage Program, 230,273 ~]wetlands protection, 195 ~
Nebr~ 271,280,285,298,301 ~; 183 ~Nevada, 12 ~; 215,216,273 ~; 183 ~New Hampshire, 269 ~New Jersey, 157, 176, 187,269 ~
Pine Barrens, 245-246 ~New Mexico, 216,217,246,272 U]New York, 156, 157, 171,173, 187,269 ~
Adirondack Park, 248-249 ~non-point-source pollution, 201, 220 ~; 199,200 ~North American Free Trade Agreement, 217 ~North tiha, 133 ~; 172,179,187,188,191, 193,195,
270 ~; 161, 182 ~North Dako@ 33,34,48 ~]; 232,250,272,285,289 ~;
181 @I]Northern Forest Lands Study, 249 ~]
Office of Management and Budget, 117, 121,147 ~Office of Science snd lkchnology Policy (OSTP), 20,38-39,
54, 113,149 ~; 281-282 @l_lOgallala Aqui.fkr, 223,301-302,304 @JOhio, 271,285 ~Ohio River, 227-229 ~oil and gas exploration and development, 50,52 ~;
190 mOkefenokee Swamp, 90 ~Oklahom 272,285 ~; 183,259 ~Oregon, 159,273 ~; 155,210 ~
Blue Mountain forests, 27 ~; 318-319,329 ~Oroville, Lake, 251 ~ozone layer depletion, 67,73, 112 ~
Pennsylvania, 270,315 ~; 173 ~pest control, 14,56,81,86,89 ~; 260-261,279,292,
307 ~]photosynthesis, 87,88, % ~; 175 ~policy issues and options
adaptation andmitigationresearchprogram, 147-148 ~agricultural, 4647 ~; 316-328 ~barrier island subsidies, 199-200 ~beach-nourishment and shoreline-protection programs,
202,204 ~biodiversity protection, 336-342 ~classification criteria for research, 147 ~coastal zone management, 200,201,203-204 ~;
206-208 ~commodity support programs, 17, 19, 45, 46 ~;
317-319,326,327communication of risk, 19,21-22, 25-26 ~consewation incentives, 21 ~; 287-288 @Ilcontingency plarming, 19,22-23,26-27 ~cross-agency coordination, 48 ~; 201 ~; 186-187,202,
282,288-289 ~disaster assistance, 4748 ~; 198-199, 203, 319-322,
326,327 ~drought management, 43 ~; 254-256 ~flood insurance, 194-198,203 ~flood management, 256-257 ~forests, 21,55-56 ~; 336-349 ~geographic fragmentation, 19-21, 23 ~; 186-187,
244-250 ~irrigation subsidies, 322,326, 327 ~land acquisition, 21,54 ~; 200 ~; 1%-197, 207,
291 ~National Biological Survey, 37, 48, 53, 149, 150 ~;
283-284,289-290 ~prOtCCtCd areas, 21,53-54 ~; 210,279-291 ~reauthorization cycle, 36-37 ~research and information gaps, 19,23,27,30,35 ~research augmentation, 19, 20, 53-64 ~; 144-150 ~;
210-211,213,281,290-291 ~science interface with, 117-119 ~statutory language, 37-39 ~U.S. Global Change Research Act amendments, 150 ~
d management, 242-243 ~water-deman

Index I 379
water-marketing, 243-244 ~water-quality management, 48 ~water-supply management, 249-250, 262 ~]wetlands protection, 21,4749 ~]; 200, 202 ~];
195-213 ~
poph.r Island, 157 ~population growth
agricultural demand and, 282,284 ~coastal areas, 5, 13, 31, 39 ~water supplies and, 212, 214-215, 218 ~
Potomac River Basin, 245 ~]prairie potholes, 9,12,26,33-34,47,48 ~; 160-161,181,
183-184, 186, 190,202 ~precipitation
distribution and forms, 79,98 w]predicted changes, 9,65,69,75-76,98 ~soil moisture and, 10, 77 ~]temperature increases and, 10,68 v~water resources and, 13 ~~wetlands and, 19 ~; 175 ~]
preserves, see natural areasPresidential Initiatives, 113 ~public education
COaStd hazards, 41 ~]; 203-204 ~drought mitigation, 255 D]risk communication through, 26,41 ~]water consemition, 240, 302 ~
public landsacquisition policies, 17,21,22,36 ~; 2tM-268 ~administration of, 50 ~]; 226,231 ~]for nature conservation, see natural areaswater rights, 222, 223 ~
Puerto Rico, 189 ~]; 209 ~]Puget Sound, 159 ~; 175, 182 ~
recreation, 6, 25 ~; 211-212, 228, 231, 232, 248 ~;162-164, 168, 183, 184,202,232,239,328-330 ~
remote sensing, 123-132 ~; see also satellitesresearch
adaptation, 30, 111,132-139,147-148 ~agricultural, 16-17, 22, 26, 46 ~; 279, 297, 299, 305,
308-310,317,323-324, 326 ~appropriations process, 35-36 ~]cross-agency coordination, 20, 22, 54, 131-132 ~;
282-283 ~ecosystem-scale, 35,53-54, 111 ~; 290 ~integration of information systems, 270-274 ~new developments, 115-117 ~]policy options, 20, 53-64 ~]; 144-150 ~; 281,
290-291 ~in protected areas, 239 ~; 282 ~satellite vs. nonsatellite measurements, 122-131 ~wetlands, 23, 4849 ~]; 193-195, 210-211, 213 ~
see also U.S. Global Change Research ProgramResearch Natural Areas, 229,231,272-273 ~]
reservoirs and reservoir systems, 7, 32, 43 ~; 210, 227,232, 244-N, 251,257-259,263-264, 294-2%,313 ~
Resource Conservation and Development Program, 279 NRhode Island, 269 ~Rio Grande Basin, 13 ~; 215,217-218,249-250, 298,
309 mriver basin management, 20 ~; 210,224-225,244,249 ~rivers, flood+sontrol measures, 10, 12 ~IUIIOff, 69-70,77,86 ~; 212-213, 217 ~
Sacramento-San Joaquin Delta, 159,239,295 ~Sacramento-San Joaquin River System, 26,31-32 ~;
216 ~San Francisco Bay, 32 ~; 159 ~; 155-156,175, 182 ~San Joaquin River, 294-296 ~satellites
Earth Observing System, 122-124, 127, 139, 140 ~Landsat, 126-127, 129, 130,131, 132 ~limitations of, 130-131 ~passive sensors, 126 ~temperature measurement, 67 ~
sea level risecause, 68-69,78-79 ~coastal effects, 8-9, 13,39,79,93,94 ~; 155-157, 159,
213 ~flood insurance and, 197 ~historic, 78 ~Imuisiana, 173-174 ~Poplar Island erosion, 157 ~predicted changes, 32,65,74,78-79 ~saltwater intrusion, 13,55 ~; 213 ~; 182 ~setback legislation and, 187 ~storm surges and, 8-9 ~; 155, 162-163,213 ~; 173 ~wetlands and, 9, 12, 19, 29,47 ~; 192 ~; 176 M
seed banks, 23, 55-56 ~Small Business Adrrums“ “ tration, 163, 173 ~Small Watershed Program, 233 ~soil moisture
agriculhue and, 10, 11, 34 ~; 303, 308 ~precipitation patterns and, 10,77,86 ~predicted changes, 11,69,77-78,99, 101 ~remote sensing, 127, 129, 131 ~
soilscarbon emissions, 51,98 ~; 185 ~consewation, 233, 254, 279 ~erosion control, 284 ~; l@l ~nutrient cycling, 88, %, 98-99 ~; 175 ~percolation rates, 77 ~salinization, 259,284, 296, 297 ~vegetation changes and, 98-99 ~
South Carolina, 155, 157, 175, 177-179, 188-191, 193,270 ~
South Dakota, 272,285,289 ~; 181 @TJSouth Florida Water Management District, 29 ~South Platte River, 293 ~species
adaptation to climate change, 49 ~; 179-181 ~
380 I Preparing for an Uncertain Climate--Volume 2
cXtinCtiOXIS, 5, 17-18 ~; 224i 241-242 ~nonnative (exotic) and nuissnce, 29,89,90,92 ~; 169,
223,260-261,288 ~reproductive failure, 91,94 w]vulnerable, 259 ~see also endangered and threatened species
statesComprehensive Outdoor Recreation Plans, 190,192 ~contingency plans for extreme events, 27 ~protected areas, 230 ~wetlands protection, 195 ~
statutes, see legislationsubsidies
agricultural, 17, 19 ~; 192,297,310,312-313, 318,320 ~
coastal development, 17 ~; 176, 177 ~forestry, 56-57 ~; 342,346-349 ~irrigation, 17, 26 ~; 240, 310, 313 ~risk communication through reforms, 21 ~], 26
Superior, Lake, 230 ~surface water
integrated management with groundwater, 210,246-247 ~
prior appropriation doctrine, 222 ~IipaI’iaIl doctrine, 222 ~
Sustainable Biosphere Initiative, 268,268 ~
“takings” issue, 177-178, 191 ~; 159,200 ~taxes
CWldty-10SS ddUCtiOIIS, 176, 186, 200 ~coastal development subsidies, 40 ~; 168, 176, 186,
200 ~losses due to hurricanes, 190 ~reforms, 40 ~; 242-243 ~policy OptiOIIS, 21-22 ~; 200,322 ~risk communication through reforms, 21-22 ~water-conservation incentives, 242 ~wetlands conservation incentives, 190, 191, 194, 200,
212 ~temperature
changes in, 1,2, 10, 14, 65,66,68,73, 75,76, 91 ~crop yields and, 288 ~global long-term record, 67,80 ~plant productivity and survival and, 80-81 ~role of, 80-81, 86 ~water, 81 ~; 215, 217 ~
lknnessee, 126 ~; 258,227-231,271 ~lknnessee Valley Authority, 133, 141 ~; 234, 254, 257,
258 ~lkrmstrial Ecosystems Regional Research and Analysis
Laboratory, 274 ~‘lkrrestrial Research Interest Group, 138-139 ~; 273-274
m‘kXSS, 272,309 ~, 209 ~)
agriculture, MO, 280,285,301 ~building COdCS, 179 ~coastal hazards, 40 ~; 156, 157, 179 ~]; 173 ~]coastal management program, 186, 194 ~]
flooding, 157,170 ~High Plains, 223,240 ~hurricanes, 159, 163, 193 @jpreserve, 248 ~sea level rise, 156, 157 ~water issues, 13 ~; 215, 217,222, 223, 240, 246, 301,
302 ~wetlands, 160, 182, 183 ~
Tijuana River, 175, 182 ~timberland
fanner-owned, 308-309 @IJhurricane damage, 189-190 ~National Forest lands, 309,311ownership and management, 304-305, 308-309,311,
315 ~private timber industry lsnds, 305,308 ~public lands, 311,315 ~revenues for conservation, 202 @Il
tourism, 6,50,52 ~; 189 ~; 239 ~transportation, 14, 15 ~; 228-231,288 ~; see ako inland
waterwaystreaties, see conventions and treatiesTruckee River Basin, 248,252 ~tundr~ 185 ~
a&@tion to climate change, 185 ~ildC, 178, 179, 181, 185 ~carbon releases, 51 ~; 185 ~COZ fertilization effect, 87 ~indigenous people, 185 ~Pemm&ost, 13,51 ~; 161, 175, 176, 185 ~vegetation changes, 51 ~wetlands, 13,47 ~; 161, 175, 176, 179, 181, 185 ~
United NationsConference on Environment and Development, 2,
109 mEducational, Scientilc , and Cultural organi.mtio~
246~Environment Program, 71,103 ~
Us. Army corps of EngineersDredged hhtCX’iidS Program, 204-205 ~drought-management assessment, 252,254 ~]flood control, 254 ~inland water projects, 175,229 ~Institute for Water Resources Municipal and Industrial
Needs, 242 ~Kissimmee River restoration, 29-30 ~policy options for improvements in, 249-250 ~reservoir management, 43 ~; 232,246,257,263-264 ~responsibilities, 233 (I_Jshoreline protection and beach no “undunent, 41-42 ~;
159, 173-175,202,204 ~water demand-rnsnagement evaluation program, 248 ~wetlands protection, 48 ~; 178,202 ~; 155, 157, 158,
164, 174, 188, 189, 192-194, 199,203-206,210,212 pq
U.S. Department of Agriculture, 141 ~agriculture regions, 278, 280, 281 ~
Index I 381
Agricultural Stabilization and Conservation Service, 311~; 188,191 @q
Alternative Agricultural Research and CommercializationCenter, 309 ~
8SSiSt/N103 ~O~i3mS, 279 ~Commodity Cnxlit Corporation,311, 314 ~&ought-watch system, 256 ~Economic Research Sewicc, 316 ~Farmers Home Adnums‘ “ tration, 173, 176, 279, 313 ~;
192,201,203,212 ~]National Resource Inventory, 193 ~research and extension, 16-17, 22, 26, 35, 46, 133, 135
~; 279,297,308,310,315-316, 323-325 ~resource assessment and program evaluation, 325-326 ~Soil Conservation Service, 233,254, 157,279,302,310,
316,322,324,326 ~; 157,188, 190,193 ~Water Bank Program, 190 ~water-related mpcmsibilities, 190, 233 ~wetlands protection, 48 ~; 157,171,184,188,190, 191,
203,212 ~see also U.S. Fonxt Service
U.S. Department of Commerce, 141 ~; 233 ~; 163 ~U.S. Department of Defense, 133 ~; 188 ~]U.S. Department of Energy, 131, 133, 136, 141, 143 ~;
233+ 315 ~U.S. Department of Health and Human Services, 136, 141
U.S. Department of Housing and Urban Development, 133~; 176 ~
U.S. Department of Interioradaptation mearch, 133,135 ~coastal banier mapping, 186 ~conservation incentive programs, 287 ~ecosystems research, 274,281 ~Everglades policy, 30 ~]global change research budgeg 119-120 ~interagency activities, 141 ~]; 245 ~land acquisition, 266 ~land-management agencies, 224,225,228,240-241 ~monitoring initiatives, 270, 274 ~National Biological Survey, 37, 48, 53, 149-150 ~;
199,200,268,278,283 ~public lands, 35, 131-132 ~water-marketing role, 44 ~]; 243, 264 ~]water-related responsibilities, 233-234 ~see also National Park Service; U.S. Fish and Wildlife
SelviceU.S. Department of State, 141 ~U.S. Department of Transptation, 173,176 ~U.S. Department of Veterans AfYairs, 168,176 ~; 200 ~U.S. Fish and Wildlife Service, 220,226,231 ~
Endangered Species Program, 235-238 ~fag limits, 31 ~]Gap AIMi@iS pfOjCCt, 129 ~; 193, 199,208,
270-271 ~land acquisition, 200 ~; 190 ~lands administered by, 225,228,244 ~management philosophy, 221, 238-239 ~
National Wetlands Inventory Progmm, 125, 129 ~;162, 192,193, 199,200 ~
National Wetlands Research Center, 193,210 ~North American Waterfowl Management Plan, 202,
208 ~responsibilities, 234 ~“take” permits, 237 ~wetlands protection,48 ~; 155,157,164,165,170, 179,
188-190, 192, 193, 199,212 ~water rights, 244 ~
U.S. Forest Sewice, 56, 125 ~; 188,222,225-227,229,231,240,242,244,249-251, 261,263,266,270,274,279,289,309,312,313, 325,326,332,334,336, 338,340,343-345,347,349 m
U.S. Geological Survey, 136, 137 ~; 166,234,248,250~; 193,199 ~
U.S. Global Change Research Program (USGCRP)adaptation and mitigation research, 23, 110, 112, 116,
138-139, 147-148 ~appropriations, 121-122 ~Assessment program, 23, 111, 115-117 ~balance among participating agencies, 110,131-132 ~broadening, 145-148 ~budget, 23,35, 112, 116, 119-132, 139, 143, 148 ~;
281 ~Climate and Hydrologic Systems and Biogeochernical
Dynamics research, 120 ~Earth Process Research, 120, 136 ~Ecological Systems and Dynamics research, 23, 53-54,
111,120,134-136,139, 148-150 ~; 269,275,281,290-291 ~
Economics Initiative, 136 ~Human Interactions research, 120,134, 136, 139 ~integrated assessments, 111, 112, 140-143, 146, 150 ~mission and priorities, 3,4-5, 30,49, 110-112, 114, 116,
118-133, 136-138,139 ~Integrated Modeling and Prediction, 115, 120 ~oversight, 143-144, 150 ~policy options, 143-150 ~; 281 ~structure, 110, 112-115, 117 ~
Utah, 272 ~; 183 ~
Vermont, 269 ~Virgin Islands, 189 ~Virginia, 163,198,270,313 ~
Washington, 159,227,273,285 ~water allocation
agricultural &rnand and, 288-289,292-294, 2%, 313 ~cmmvation practices and, 240-244 ~&mand management and reallocation, 42A13, 44 ~;
210, 235-U, 264 ~“dry-year” option contracts, 293 ~illstitUtiOI@ problems, 18 ~; 224-225 ~marketing and transfer ammgernents, 32, 42, 4344, 45
~; 210,235-239,243-244, 264,313,322 ~pricing xeform, 21,42 ~; 210,218,235,239-240,
243 ~
382 I Preparing for an Uncertain Climate--Volume 2
prior appropriation doctrine, 179,251 ~Sacramento-San Joaquin River System, 31,32 ~transfers, 18 ~; 225,250,292-293,322 ~
Water Bank Program, 279 ~water conservation, 210, 240-244 ~]
demand management and, 42 ~; 210,240-243,264 u]and drought management, 254 ~economic incentives and disincentives, 240-243,263 ~in Federal facilities, 44 ~; 242 ~interruptible water service programs, 247 ~metering and use restrictions, 301-302 ~municipal programs, 241,242 ~policy options, 242-244 ~pricing ~forms and, 239-240,243 ~public education and, 240-241,302 ~reclamation and recycling, 43A14 ~; 210, 218, 243,
260-262,264,322 ~seasonal storage progrsms, 247 ~[supply management, 244-250 ~tax reforms and, 242-243,322 ~technologies, 242-243,289,301 ~wetlands protection and, 184 ~
water qualityagriculture and, 29, 32 ~; 217, 219, 278-279, 284,
294-296 ~drought and, 215 ~Fcxleral programs, 279 ~fish pO@tiOXIS and, 215,219 ~incentive programs, 318 U]legislation, 29 ~; 219,220-221,278-279 ~non-point-source pollution, 215, 220 ~RiO Grande and, 217-218thermal pollution, 81 ~; 215,217,227 ~]
Water Quality Incentives Program, 278-279 ~water resowce system stress
population, 214,216 ~water quality, 215-219 ~, 28-29 ~environmental needs and, 219 ~reserved water rights, 221-222groundwater overdraft, 223-224outmoded institutions, 224-225 ~, 18 ~aging water infrastructure, 225c W change and, 210,212-213 ~, 15 ~, 75-78 ~
Water Resources Council, 249 ~; 1% ~water rights, 18 ~]; 212,221-223,225, 240, 243-X5, 302
~; 178,179,251,255 ~water supply augmentation, 257-262 ~
IWWOifS, 257-259desalination, 259-260interregional diversions, 260wastewater reclamation, 260-262
water supply managementcoordination, 21,23-25,36,42 ~], 210,244-245,263 ~]reservoir system management, 245-246 ~conjunctive use, 246 ~]analytical tools and forecast systems, 247-248,250,264 ~]river basin mnunksions, 249 ~water resouxces council, 289 ~
water project reassessment, 249-250 ~groundwater management, 250,301 ~extreme events management, 250-257,262-263 @Jfloods, 253-254,256-257,262-263 ~droughts, 27,42,251-252,254-256, 262-263 ~
waterfowl, 13,29, 33,34, 126 ~; 235-238,294,301-302~; 155,162,164,183-186, 194,218,221,228 ~
watershed management 25,36 ~; 220,225, M245, 249,250 ~; 209-210 ~
West (U.S.), see arid WestWest Virginia, 190,271 ~Western Governor’s Association, 243,252 ~Western Water Policy Review, 44 ~; 212,264-265 ~wetlands
adaptation to climate change, 12,15,111 ~;172-185 ~
agriculture, 26, 28,47 ~; 276, 278,294 ~; 170-171,192-193, 199,200 ~
@k, 181 ~biodiversity, 167,172, 178, 180, 182-183, 186 ~btir zones, 192,200 ~; 207 Wcoastal,9, 12,15,47 ~; 159,190 ~; 160,169-170,179,
181-183, 186, 194 ~conservation, 278 ~; 159, 192-193 ~coordination of protective efforts, 48 ~; 191-192,
212-213 ~deftition for n@atory purposes, 157-158,165 ~distribution, 50 ~; 160-161,168, 170 ~economic issues, 154-155, 162-164, 166, 178, 183 ~extreme events an~ 172, 175, 176, 183-184 ~Federal programs and legislation, 47A8 ~; 154-159,
187-208,211-212,278 ~fuheries, 81,96 ~; 163-164, 174, 179, 181, 183,
185 ~flood management and, 22,47 ~]; 162, 166, 167, 174,
181-183, 186 ~forested, 129, 161 ~, 176, 183 ~fragmentation, 25 ~, 171-172,176,181,186 ~bshwater nontidal, 160, 168 ~groundwater declines and, 301-302 U]importance, 47 ~; 162-166, 168, 183, 188 ~interagency ti force, 198 ~inventory, 125, 129 ~]; 162, 199, 200 ~land acquisition, 189-190, 194, 198-199,207-209 ~10ss, 19,47 ~]; 170, 179, 180-181, 184 ~management, 17 ~; 178 ~; 186-187,208-210 @Tlmangroves, 160, 175 @l’1migration, 12,47,93,94,99, 100 ~; 192 ~; 176, 180,
181, 182,186, 187,206-208 ~mitigation and restoration, 12,48 ~; 221 ~; 154-155,
174, 188, 190-191, 194,201-206,250 ~monitoring, 23,47,48, 129, 131 ~; 186, 187, 193-194,
199-200,202,208-210, 213 ~“no-net-loss” policy, 5,47 ~; 185-186, 192, 195, 198,
209 @l]policy challenges and options, 47-48 ~]; 200,201 ~;
185-186, 195-213 ~
* U.S. GOVERNMENT PRINTING OFFlCE.1993-301 -804/98971
Index I 383
prairie potholes, 9, 12, 26, 33-34,47,48 ~]; 160-161,181, 183-184, 186, 190,202,208,278 ~]
priorities, 21,47 fl/II]; 157-158,206-209 ~protection, 48 fl/II]; 200-202 ~; 165, 178-179, 184,
195-201 ~research, 23,48-49, 111 ~/II]; 193-195,210-211,213 ~]lipti~, 13, 47, 125 ~/IIl; 167, 176, 178-179, 181,
184-186,201,202,206 ~salt marshes, 87 ~]; 160, 167, 175 ~]saltwater intrusion, 176, 182 ~sea level rise and, 9, 12, 19,47 ~/II]; 173-174, 182,
186 ~]species adaptation to climate change, 179-181 ~]State, 10CS.I and private programs, 195 ~]tidal fi-eshwater marshes, 160, 175, 182, 188 ~tundra, 13,47,87 ~; 161, 175, 176, 179, 181, 185 ~types, 160-161 ~
vegetation, 93, 94 ~~; 160-161 ~]vulnerable areas, 12, 13,47 ~]; 181-185 ~
Wetlands Reserve Program, 48 ~; 233,278,318 ~; 190,191, 194,202,212,268,287 ~
White House Office of Environmental Policy, 196,212 ~wilderness areas, 50 ~]; 221,225-227,235,239, 243,246,
251,256,261,263,267, 278,279,282,286 ~wildlife
adaptation, 92 ~habitat fragmentation, 86 ~management, 192 ~migration ability, 92-93 ~trapping, 165 ~
Wisconsin, 271, 285 ~]wise use movement, 178 ~]World Meteorological Organization, 71, 103 ~Wyoming, 272 ~; 244 ~]