Correlation Functions EEE3086F Signals and Systems II 2013
14
Correlation Functions A.J.Wilkinson, UCT EEE3086F Signals and Systems II 212 Page 1 March 7, 2013 EEE3086F Signals and Systems II 2013 A.J. Wilkinson [email protected] http://www.ee.uct.ac.za Department of Electrical Engineering University of Cape Town Correlation Functions A.J.Wilkinson, UCT EEE3086F Signals and Systems II 212 Page 2 March 7, 2013 2.7 Matched Filter 1. Goal of the Matched Filter 2. Derivation of the Matched Filter 3. Examples Contents: Reference: F.G. Stremler, Introduction to Communication Systems, 3rd Edition
-
Upload
independent -
Category
Documents
-
view
2 -
download
0
Transcript of Correlation Functions EEE3086F Signals and Systems II 2013
Correlation FunctionsA.J.Wilkinson, UCT EEE3086F Signals and Systems II212 Page 1 March 7, 2013
EEE3086FSignals and Systems II
2013
A.J. Wilkinson
http://www.ee.uct.ac.zaDepartment of Electrical Engineering
University of Cape Town
Correlation FunctionsA.J.Wilkinson, UCT EEE3086F Signals and Systems II212 Page 2 March 7, 2013
2.7 Matched Filter
1. Goal of the Matched Filter2. Derivation of the Matched Filter 3. Examples
Contents:
Reference: F.G. Stremler, Introduction to Communication Systems, 3rd Edition

Correlation FunctionsA.J.Wilkinson, UCT EEE3086F Signals and Systems II212 Page 3 March 7, 2013
Goal of the Matched Filter
A.J.Wilkinson, UCT Correlation Functions EEE3086F Signals and Systems II212 Page 4 March 7, 2013
Aim and Applications of the Matched Filter
The matched filter is a linear filter that is designed to detect the presence of a waveform (or pulse) x(t) of known structure buried in additive noise. i.e. within a signal
where A and t0 are unknown constants, and n(t) is noise.
The output of a matched filter will typically exhibit a sharp peak in response to the presence of the desired waveform (or pulse) at its input. From this peak may be determined time location t
0, and amplitude A of the pulse within the received waveform.
E.g. 1. Radars transmit electromagnetic pulses which reflect off distance objects (or “targets”). The echoes are captured by a receiving antenna. The echoes may be very weak signals buried in additive noise (picked up by the antenna, and also created by the receiver itself). Matched filters are used to process the received waveform, and hence optimize the chance of detecting a target.
E.g. 2. In telecommunications systems using pulse code modulation, a bank of N filters may be constructed, with each filter specifically designed to respond to the presence of a particular pulse code. Comparison of the responses at the outputs identifies the received code.
v (t )=A x (t−t0)+ n(t)

A.J.Wilkinson, UCT Correlation Functions EEE3086F Signals and Systems II212 Page 5 March 7, 2013
Model of Transmitted and Received Signal with Additive Noise
Transmitted pulse
Received signal
where t0 is the propagation time delay,
A is an amplitude scaling factor, and n(t) is additive noise, described by its PSD S
n().
The SNR of the received pulse is defined as the ratio of the the peak signal power to average noise power, i.e.
SNR=peak signal power
average noise power=
max {∣A x (t−t0)∣2}
∣n(t)∣2=
∣A x (0)∣2
∣n(t)∣2
x (t)
v (t )=A x (t−t0)+ n(t)t 0
0
A.J.Wilkinson, UCT Correlation Functions EEE3086F Signals and Systems II212 Page 6 March 7, 2013
Definition of the Matched Filter
Given an input signalwhere x(t) is a pulse of known structure,t0 is an unknown delay, and A is an unknown scaling factor.
A “matched filter” is a linear filter h(t) or H() that is designed to optimize the peak SNR at its output at some specified instant relative to t
0.
The output is
The aim is to find h(t) or equivalently H() that maximizes(at some instant t
x, usually t
x >t
0):
v (t)=A x (t−t0)+ n(t)
peak SNR=∣y (t x)∣
2
∣no(t )∣2
vo(t)=v (t )⊛ h(t )= y (t )+ no (t )

Correlation FunctionsA.J.Wilkinson, UCT EEE3086F Signals and Systems II212 Page 7 March 7, 2013
Derivation of the Matched Filter
A.J.Wilkinson, UCT Correlation Functions EEE3086F Signals and Systems II212 Page 8 March 7, 2013
Simplified Signal Model
Let the input be:
Filter output:
Let
Output written as
vo(t )=v (t)⊛ h(t )=x (t )⊛ h(t )+ n(t )⊛ h(t )
v (t)=x (t )+ n(t )
vo(t )= y (t )+ no(t )
y (t )=x (t )⊛ h(t )
no(t )=n(t )⊛ h(t )
(output signal component)
(output noise component)
(where x(t) is a known waveform plus stationary noise n(t) )
A.J.Wilkinson, UCT Correlation Functions EEE3086F Signals and Systems II212 Page 9 March 7, 2013
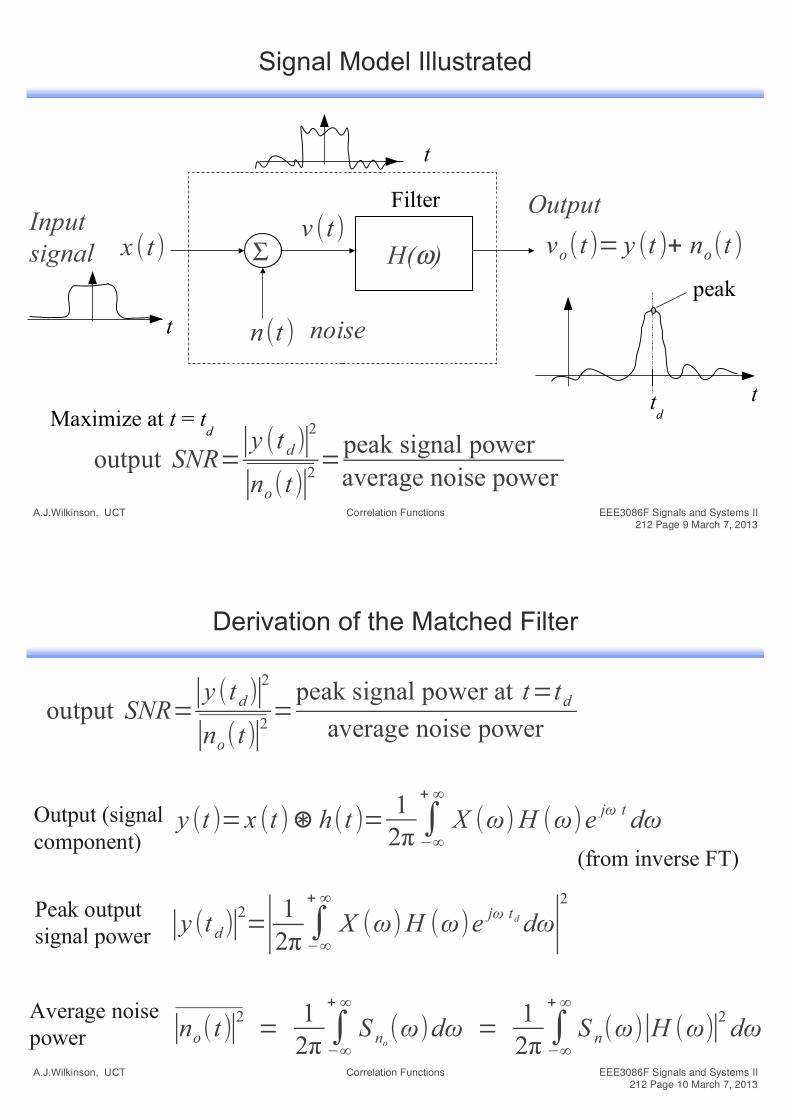
Signal Model Illustrated
H()
noise
Inputsignal
Output
output SNR=∣y (t d)∣
2
∣no(t)∣2=
peak signal poweraverage noise power
td
t
t
peak
Maximize at t = td
vo(t )= y (t )+ no(t )
Filter
t
v (t)
n(t )
x (t)
A.J.Wilkinson, UCT Correlation Functions EEE3086F Signals and Systems II212 Page 10 March 7, 2013
Derivation of the Matched Filter
output SNR=∣y (t d)∣
2
∣no(t)∣2=
peak signal power at t=td
average noise power
y (t )=x (t )⊛ h(t )=1
2π ∫−∞
+ ∞
X (ω)H (ω)e jω t dω
∣y (t d)∣2=∣ 1
2π∫−∞
+ ∞
X (ω)H (ω)e jω td dω∣2
Peak outputsignal power
Average noisepower ∣no(t)∣
2=
12π ∫
−∞
+ ∞
S no(ω)dω =
12π ∫
−∞
+ ∞
S n(ω)∣H (ω)∣2dω
Output (signal component)
(from inverse FT)

A.J.Wilkinson, UCT Correlation Functions EEE3086F Signals and Systems II212 Page 11 March 7, 2013
Optimization Problem
The objective is to find a/the filter H() that optimizes the SNR at the time instant t = t
d:
∣y (td)∣2
∣no(t)∣2=
∣ 12π ∫
−∞
+∞
X (ω) H (ω)e jω t d dω∣2
12π
∫−∞
+∞
S n(ω)∣H (ω)∣2dω
To do this, we make use of a (provable) mathematical relationship calledthe Schwartz (or Cauchy-Schwartz) inequality.
A.J.Wilkinson, UCT Correlation Functions EEE3086F Signals and Systems II212 Page 12 March 7, 2013
Schwartz Inequality for Integrals
The Schwartz inequality states that for two complex functions, f(x) and g(x), integrable over [a,b]
The equality holds (i.e. LHS = RHS) if where k is a real constant.
If then the left side is less than the right side.
∣∫a
b
f ( x )g (x)dx∣2
≤∫a
b
∣ f ( x)∣2dx ∫
a
b
∣g (x)∣2dx
g (x )=k f ∗( x)
g (x)≠k f ∗( x )
Proof? Google it!

A.J.Wilkinson, UCT Correlation Functions EEE3086F Signals and Systems II212 Page 13 March 7, 2013
To maximize SNR, apply Schwartz Inequality
∣y(td )∣2
∣no(t)∣2=
∣ 12π ∫
−∞
+ ∞
X (ω)H (ω)e jω t d dω∣2
12π ∫
−∞
+ ∞
S n(ω)∣H (ω)∣2 dω
∣y (t d )∣2
∣no(t)∣2
=∣ 12π
∫−∞
+ ∞
[ X (ω)
√S n(ω) ] [√S n(ω) H (ω)e jω t d ]dω∣2
12π ∫
−∞
+ ∞
S n(ω)∣H (ω)∣2dω
∣y(t d )∣2
∣no(t)∣2
≤
12π ∫
−∞
+ ∞
∣ X (ω)
√S n(ω)∣2
dω1
2π ∫−∞
+ ∞
∣√S n(ω)H (ω)e jω td∣2dω
12π
∫−∞
+ ∞
S n(ω)∣H (ω)∣2dω
f (x)≡[ X (ω)
√S n(ω) ] g (x )≡√S n(ω) H (ω)e jω t dApply Schwartz Inequality with:
Notice that the term on the right of the numerator cancels with the denominator.
SNR:
and
Rewrite expression as:
A.J.Wilkinson, UCT Correlation Functions EEE3086F Signals and Systems II212 Page 14 March 7, 2013
∣y (td )∣2
∣no(t )∣2≤
12π
∫−∞
+ ∞ ∣X (ω)∣2
S n(ω)dω
12π
∫−∞
+ ∞
S n(w)∣H (ω)∣2dω
12π
∫−∞
+ ∞
S n(ω)∣H (ω)∣2dω
∣y (t d )∣2
∣n0(t )∣2
≤1
2π ∫−∞
+ ∞ ∣X (ω)∣2
S n(ω)dω
Swartz inequality becomes an “equality” i.e. LHS = RHS ifor in our case, if:
g (x )=k f ∗(x )
√S n(ω)H (ω)e jω td=k [ X (ω)
√S n(ω) ]∗
=> H (ω)=kX (ω)∗
S n(ω)e− jω td
The term on the rightof the numeratorcancels with the denominator.

A.J.Wilkinson, UCT Correlation Functions EEE3086F Signals and Systems II212 Page 15 March 7, 2013
Matched Filter
H (ω)=kX ∗
(ω)
S n(ω)e− jω t d
For the special case of white noise,
H (ω)=k X ∗(ω)e− jω td
h(t )=k x∗(−t+t d )
The filter that maximizesthe peak SNR at time t
d is:
k is a real constant, usually positive, and is often set to 1.
S n (ω)=constant
Inverse transforming gives:
Apply Fourier: X ∗(ω)→ x∗
(−t )
and Y (ω)e− jω t d→ y (t−t d)
A.J.Wilkinson, UCT Correlation Functions EEE3086F Signals and Systems II212 Page 16 March 7, 2013
Matched Filter (additive white noise)
H (ω)=X ∗(ω)e− jω t d
h(t)=x∗(−t+ t d)
t ωx (t )
tx (−t)
tt d
tt d
y (t )=x (t )⊛ h(t )≈c2 2BSa (2π B (t−t d))
ω
X (ω)
ω
Y (ω)=∣X (ω)∣2e− jω t d
−2π B 2π B
“Flip h(t), slide, mult. and integrate”
c
−2π B 2π B
≈c2 rect (ω/4π B)

A.J.Wilkinson, UCT Correlation Functions EEE3086F Signals and Systems II212 Page 17 March 7, 2013
Interpretation in Frequency Domain:
In the frequency domain, the matched filter magnitude boosts the frequency components for which the signal is large compared to the noise and suppresses those that are weak compared to the noise i.e.
The phase of the filter cancels the phase of X(), and hence the inverse Fourier transform integral gives a strong peak at t = t
d. In the white noise case
∣H (ω)∣∝∣X (ω)∣S n(ω)
H (ω)∝ X ∗(ω)
y (t )=1
2π ∫−∞
+ ∞
X (ω)H (ω)e jω t dω=12π ∫
−∞
+ ∞
∣X (ω)∣2e− jω td e jω t dω
H (ω)=kX ∗
(ω)
S n(ω)e− jω t d
H (ω)= X ∗(ω)e− jω t d
y (t d)=E x (by Parseval)
A.J.Wilkinson, UCT Correlation Functions EEE3086F Signals and Systems II212 Page 18 March 7, 2013
Interpretation in Time Domain
In the time domain, the matched filter for white noise is seen as the conjugate of a time-reversed (“flipped”) version of x(t).
It is easiest to consider the case of k=1 and td = 0, which is a
matched filter with “zero-delay”.
Performing a graphical convolution, “flips” h(t), which re-flips such that it will now match (or correlate well) with the “x(t)” contained in the received signal v(t) as one slides from left to right and integrates the product.
The “width” of the peak in the time domain depends on the bandwidth B of X(). To get y(t), we inverse transform:
h(t )=x∗(−t )
x∗(−t)
v (t)⊛ h(t )=x (t )⊛ h(t )+ n(t )⊛ h(t )
X (ω)H (ω)∝∣X (ω)∣2

A.J.Wilkinson, UCT Correlation Functions EEE3086F Signals and Systems II212 Page 19 March 7, 2013
Interpretation in Time Domain:
The width of the peak in the time domain depends on the bandwidth B of X(), since we are inverse transforming
If has an approximately rectangular bandwidth,then the output will have a Sa( ) shape.
The “3dB” width of the lobe will be [s].
∣X (ω)∣2
∣X (ω)∣2
δ t≈1
2 B
H()
noise
Bandlimitedinput signal
Output
td
tt
peak
Matched Filter
x (t )δ t≈
12 B
A.J.Wilkinson, UCT Correlation Functions EEE3086F Signals and Systems II212 Page 20 March 7, 2013
Physically Realizable Filters
The impulse response of the matched filter for waveform x(t) with additive white noise is
If this filter is to be constructed as a filter operating in “real-time”, then the output cannot respond before the input arrives.
Thus for “physical realizability”, the impulse response h(t) must begin after t = 0. i.e. h(t) = 0 for t <= 0.
In a real matched filter (built either with passive LRC components or using A/D, D/A and DSP technology), the MF peaks after the “entire waveform” has been fed into the input.
In designing a filter, one can always make it physically realizable by shifting h(t) to the right (by increasing t
d). This will simply delay the
output response by the corresponding amount.
h(t )=x∗(−t+ td )

A.J.Wilkinson, UCT Correlation Functions EEE3086F Signals and Systems II212 Page 21 March 7, 2013
Relationship to Correlation
Feeding a signal into a matched filtermatched to waveform (with white noise), is equivalent to a correlation operation between x(t) and v(t).
Recall correlation for energy signals:
The matched filter output is:
Rvx (τ )=∫−∞
∞
v*(t )x (t+ τ )dt
vo(t)=v (t)⊛ h(t )
vo(t) = ∫t '=−∞
∞
v (t ' )h(t−t ' )dt '=∫−∞
∞
v (t ' ) x∗(t '+ td−t )dt '
h(t )=x∗(−t+ t d)
vo(t ) = ∫u=−∞
∞
x∗(u)v (u+ [ t−t d ])du = Rxv (t−t d)
put u=t '+ t d−t
v (t)x (t)
A.J.Wilkinson, UCT Correlation Functions EEE3086F Signals and Systems II212 Page 22 March 7, 2013
Relationship to Correlation cont...
Thus if one correlates x(t) and v(t), and shifts the result to the right by an amount t
d, one gets the same output as from the
matched filter operation.
The matched filter output is
Note: if (the case where the input matches perfectly) then the MF output iswhich is just the autocorrelation function of x(t), shifted by t
d.
vo(t)=Rvx(t−t d)
vo(t)=v (t)⊛ h(t )
v (t)=x (t)vo(t)=Rx (t−t d)

A.J.Wilkinson, UCT Correlation Functions EEE3086F Signals and Systems II212 Page 23 March 7, 2013
Output SNR
The output SNR of the matched filter is
For white noise case,
Thus the output SNR is proportional to the energy of the received signal (and hence the energy of the transmitted signal).
∣y (td )∣2
∣n0(t)∣2
=12π ∫
−∞
+ ∞ ∣X (ω)∣S n(ω)
2
dω
(previously derived general case)
∣no(t )∣2
=12π ∫
−∞
+∞ η
2∣H (ω)∣
2 dω= =η
21
2π ∫−∞
+∞
∣X (ω)∣2 dω=
η
2E x
H (ω)=X ∗(ω)e− jω t d
⇒ ∣y ( t d)∣
2
∣n0(t)∣2
=E x
2
η
2E x
=E x
η/2
∣y (t d )∣2=∣ 1
2π ∫−∞
+∞
X (ω)H (ω)e jω t d dω∣2
=E x2
S n(ω)=η/2
A.J.Wilkinson, UCT Correlation Functions EEE3086F Signals and Systems II212 Page 24 March 7, 2013
Example of Matched Filter: detection of a received pulse
x( t )=A rect ( t−T /2T ) T
0
A
t
td+T
td
kA
t
Transmittedpulse.
Noisy receivedwaveform.
td
kA2T
Note: output peak is proportional to energy in pulse (A2T)
t
Delayed, scaled pulse.
Output of matched filter; SNR at peak is optimised.
Peak SNR
h(t )=x∗(−t )Matched Filter. T
A
t
h(t )⊛ v (t )
k x (t−t d)
v (t)=k x (t−t d)+ n(t )
td-Tt

A.J.Wilkinson, UCT Correlation Functions EEE3086F Signals and Systems II212 Page 25 March 7, 2013
Example of Matched Filter: detection of a received pulse
x (t )T0
A
t
td+T
td
kA
t
Transmittedpulse.
Noisy receivedwaveform.
tdNote: output peak is proportional to energy in pulse
t
Delayed, scaled pulse.
Output of matched filter; SNR at peak is optimised.
Peak SNR
h(t )=x∗(−t )Matched Filter.T
A
t
h(t )⊛ v (t )
k x (t−t d)
v (t)=k x (t−t d)+ n(t )
td-Tt
k Ex
A.J.Wilkinson, UCT Correlation Functions EEE3086F Signals and Systems II212 Page 26 March 7, 2013
Applications of Matched Filter
The matched filter is very useful for detecting known waveforms in the presence of additive noise .
E.g. 1. Radars use correlation receivers to detect weak echoes from distant targets. A replica of the transmitted pulse is correlated with the received waveform. The radar resolution (ability to separate close targets) depends on the bandwidth of the transmitted pulse.
E.g. 2. In telecommunications systems using pulse amplitude modulation, a matched filter, matched to the shape of the pulse, can be used to estimate optimally the pulse amplitude, since the height of the peak at the output of the matched filter is proportional to the amplitude of the received pulse.
h(t )⊛ v (t )
v (t)t
t
Received
Output of MF

Correlation FunctionsA.J.Wilkinson, UCT EEE3086F Signals and Systems II212 Page 27 March 7, 2013
EEE3086FSignals and Systems II
End of handout