Changes in Active Behaviours, Physical Activity, Sedentary ...
Upload
independentCategory
view
0download
0
ORIGINAL ARTICLE
Correlates of objectively measured physical activity in adultsand older people: a cross-sectional study of population-basedsample of adults and older people living in Norway
Bjørge Herman Hansen • Yngvar Ommundsen •
Ingar Holme • Elin Kolle • Sigmund Alfred Anderssen
Received: 4 July 2012 / Revised: 30 March 2013 / Accepted: 11 April 2013
� Swiss School of Public Health 2013
Abstract
Objectives The aims of the study were to identify corre-
lates of objectively measured physical activity and to
determine whether the explanatory power of the correlates
differed with sex, weight status or level of education.
Methods Physical activity was assessed objectively in 3,867
participants, aged 20–85 years, for a consecutive 7 days using
the ActiGraph GT1M activity monitor. Demographic and
biological variables and levels of psychological, social envi-
ronmental and physical environmental correlates were self-
reported.
Results The complete set of correlates explained 18.6 %
(p \ 0.001) of the variance in overall physical activity.
Age and physical activity identity were the most important
factors, explaining 4.8 and 3.2 % of the variance, respec-
tively, whereas social environmental and physical
environmental correlates did not significantly increase the
amount of explained variance. Small interaction effects
between demographic and biological variables and the
correlates were observed.
Conclusions Self-efficacy, perceived behavioural control
and physical activity identity might be important targets for
intervention. Intervention efforts aimed at influencing
psychological correlates of physical activity may prove
equally effective regardless of sex, weight status and level
of education.
Keywords Actigraphy � Physical activity �Correlates of physical activity � Epidemiology �Public health
Introduction
Regular physical activity yields numerous health benefits
(Haskell et al. 2007). However, the available data on
population levels of physical activity indicate that this
evidence has failed to stimulate a large proportion of adults
and older people to become more physically active (Bou-
chard et al. 2012; Hagstromer et al. 2010). To counteract
increases in sedentariness, effective interventions are
required to increase physical activity at the population
level. To develop such interventions, a comprehensive
platform of knowledge on the factors that correlate with
physical activity is needed (Bryan et al. 2007). Although
the literature includes many findings of cross-sectional
associations and longitudinal relationships between demo-
graphic, biological, psychological, social environmental,
and physical environmental variables (commonly referred
to as correlates) and physical activity (Trost et al. 2002;
Bauman et al. 2002; Bauman et al. 2012), these are gen-
erally based on self-reported physical activity. The use of
self-reports of physical activity has limitations, and may
B. H. Hansen (&) � I. Holme � E. Kolle � S. A. Anderssen
Department of Sports Medicine, Norwegian School of Sport
Sciences, Ullevaal Stadion, P.O. Box 4014, 0806 Oslo, Norway
e-mail: [email protected]
I. Holme
e-mail: [email protected]
E. Kolle
e-mail: [email protected]
S. A. Anderssen
e-mail: [email protected]
Y. Ommundsen
Department of Coaching and Psychology, Norwegian School
of Sport Sciences, Ullevaal Stadion, P.O. Box 4014,
0806 Oslo, Norway
e-mail: [email protected]
Int J Public Health
DOI 10.1007/s00038-013-0472-3
123
provide imprecise estimates of physical activity (Sallis and
Saelens 2000). The complexity of measuring physical
activity or even the failure to do so adequately is one of the
problems that have impeded our understanding of what
motivates individuals to adopt and maintain an active
lifestyle (Seefeldt et al. 2002).
Objective assessment of physical activity using activity
monitors such as accelerometers has the potential to over-
come many of the challenges related to self-reported physical
activity. There is a paucity of studies using objectively
assessed physical activity to investigate the association
between physical activity and a broad range of biological,
psychosocial and social environmental variables in a large
population of adults and older people living in Scandinavia.
Furthermore, given the broad range and complexity of
the factors that influence physical activity, research aimed
at identifying its correlates should be conceptualized within
a socio-ecological framework, allowing the integration of
multiple levels and contexts to provide us with the best
possible understanding of physical activity behaviour.
Additionally, as gradients in physical activity behaviour
have been observed across ages and sexes, weight groups,
and socio-economic positions in adults (Trost et al. 2002),
it is important to assess whether such gradients interact
with the predictive power of the correlates. If so, the
directions and strengths of such interactions will indicate
whether certain strata of the population require tailored
interventions to increase their physical activity.
Therefore, the aims of this study were (1) to ascertain
the predictive power of a broad range of demographic,
biological, psychological, social environmental, and phys-
ical environmental correlates of physical activity on
objectively measured overall physical activity in a popu-
lation of adults and older people; and (2) to identify and
assess the potential moderating effects of demographic and
biological variables on the relationship between the cor-
relates and objectively measured physical activity.
Methods
Study design and sample
This was a nationally representative cross-sectional multi-
centre study of objectively measured physical activity con-
ducted in 2008–2009. In total, ten test-centres collected data
from selected adjacent municipalities across Norway.
Written informed consent was obtained from 3,867 indi-
viduals (34 % of the invited sample). Detailed information
on the flow of invitees and the results of a drop-out analysis
performed via registry linkage are presented elsewhere
(Hansen et al. 2012). In brief, compared with the responders,
the non-responders were somewhat less educated and had a
slightly lower income, and more likely to originate from
countries other than Norway. The study was approved by the
Regional Ethics Committee for Medical Research and the
Norwegian Social Science Data Services AS.
Measures
Physical activity
Physical activity was measured using the ActiGraph GT1M
activity monitor (ActiGraph, LLC, Pensacola, FL, USA), a
valid (Plasqui and Westerterp 2007) and reliable (McClain
et al. 2007) hip-worn electronic motion sensor. Vertical
acceleration is converted into movement counts that increase
linearly with the magnitude of the acceleration (i.e. inten-
sity). A SAS-based macro was used to reduce the raw
movement counts into an estimate of overall physical
activity. The movement counts registered each user-defined
time interval (epoch) were averaged over the total wearing
time (counts per minute; CPM). Sequences of consecutive
zero counts lasting C60 min were interpreted as representing
non-wear time and excluded from each individual recording.
A valid recording of a participant‘s activity level was defined
as having at least 10 h of daily wear time for at least 4 days.
Demographic and biological variables
Age, sex, height, and weight were self-reported. As reported
previously, overall physical activity remained steady with
age, until 65 years, after which activity levels declined
(Hansen et al. 2012). Age was therefore dichotomised into
two age groups (20–64 and 65? years) before entered into
the regression analysis. Body mass index (BMI) was com-
puted as weight (kg) divided by metres squared (m2) and
categorised according to WHO guidelines (World Health
Organization 2000), with overweight and obesity defined as
BMIs of 25–30 and[30 kg/m2, respectively. Because of the
small sample size, underweight participants (n = 35) were
included in the normal weight category; this did not cause
any significant changes in physical activity for the normal
weight participants. Participants were asked to rate their
perceived health status as very poor, poor, fair, good, or
very good. Because of the low prevalence of poor health
(n = 104, 3.0 %) and very poor health (n = 3, 0.1 %), the
answers were grouped into two categories for the analysis:
very poor/poor/fair and good/very good (‘‘not good’’ vs.
‘‘good’’). Educational attainment was categorised into four
groups: less than high school, high school, less than 4 years
of university, and university for 4 years or more. Smoking
habits, marital status and number of children were reported
and dichotomised before the variables were entered into the
analysis (smoking vs. not smoking, married vs. not married
and children vs. no children, respectively).
B. H. Hansen et al.
123

Theoretical framework
The theoretical framework used to understand physical
activity was the socio-ecological model (McLeroy et al.
1988; Stokols et al. 1996), which describes multiple levels
of influence, from the intra-individual level to the com-
munity/environmental level. All psychological, social
environmental and physical environment variables were
derived from previously developed and validated scales.
Psychological variables
The psychological variables considered likely to be corre-
lates of physical activity were self-efficacy for physical
activity (Bandura 2004; Fuchs and Schwarzer 1994), per-
ceived behavioural control over physical activity (Ajzen
and Madden 1986; Norman and Smith 1995), and physical
activity identity (Jackson et al. 2003; Lorentzen et al.
2007b). Self-efficacy for physical activity was assessed
using a five-item measure, where the participants indicated
on a seven-point Likert scale (with ‘‘not at all confident’’
and ‘‘very confident’’ at opposite ends of the continuum)
the extent to which they were confident in their ability to
perform planned physical activity in the face of potential
barriers. A mean score for all the constituent items was
computed, with higher scores indicating a greater amount
of self-efficacy for physical activity. Only participants with
a response rate of 75 % or greater for the respective item in
each subscale were included when the mean scores were
computed (allowance for two missing items). The self-
efficacy measure displayed a high degree of internal con-
sistency (Cronbach’s alpha [a] of 0.91). Perceived
behavioural control was assessed with items assessing the
individual’s perception of his/her personal control over
being regularly physically active. The measure showed a
relatively high degree of internal consistency (a = 0.67).
Physical activity identity was assessed with four items,
which the participants rated on a five-point scale ranging
from 1 (fits badly) to 5 (fits well) of the degree to which
different statements described them with respect to physi-
cal activity. The measure showed good internal consistency
(a = 0.91).
Social environmental variables
The social environmental variables likely to correlate with
physical activity were social support, from either family or
friends. Social support was measured using an 11-item
scale divided into two sections: one concerning support
received from family, and the other concerning the support
received from friends, acquaintances, and co-workers.
Participants rated separately how often their family and
friends/acquaintances/co-workers had been supportive of
their physical activity. The response to each item was
based on a five-point scale, ranging from 1 (never) to 5
(very often). The participants could also answer ‘‘does not
apply to me’’, which was treated as missing data. A family
support measure and a friend support measure comprising
five of the 11 items used in the present friend support scale
have previously shown acceptable reliability and criterion-
related validity (Sallis et al. 1987; Lorentzen et al. 2007a).
In the present study, Cronbach’s a was 0.86 for the family
support subscale and 0.89 for the friend support subscale.
For each scale/subscale, a mean score of all constituent
items was computed, with higher scores indicating a
greater amount of support for PA, and only participants
with a response rate of 75 % or greater for the respective
item in each subscale were included when the mean scores
were computed (allowance for one missing item).
Physical environmental variables
The inclusion of the physical environmental variables was
guided by the empirical literature on the environmental
factors that have been associated with physical activity in
various settings and population groups (Brownson et al.
2001; Saelens and Handy 2008; Van Holle et al. 2012).
Hence, perceived community attributes were measured
with a seven-item measure, in which the participants
indicated on a four-point Likert scale the extent to which
they agreed or disagreed with statements describing their
community (regarding pedestrian street safety, safety of
recreation areas/parks, walking/cycling facilities, access to
shops, access to physical activity facilities/places and
organised offers for physical activity) on a scale ranging
from 1 (don’t agree) to 4 (agree) (Saelens et al. 2003;
Booth et al. 2000). The measure showed good internal
consistency (a = 0.79).
Statistical methods
All statistical analyses were performed with PASW Sta-
tistics 18 for Windows (IBM Corporation, Somers, NY,
USA). Descriptive data are presented as proportions, means
and standard deviations (SD) or standard errors of the mean
(SE), and 95 % confidence intervals (CI) where appropri-
ate. Differences in objectively assessed physical activity
and anthropometric data were assessed with analyses of
variance with the Bonferroni post hoc test for multiple
comparisons.
To analyse the relationships between the outcome
variables, CPM and the sets of potential correlates for
physical activity, hierarchical regression was applied with
the principle of hierarchical ordering of proximal versus
distal variables based on a socio-ecological framework
(Stokols et al. 1996). Preliminary analyses were conducted
Correlates of objectively measured physical activity
123

to ensure that there was no violation of the assumptions of
linear regression. The analysis was built up from consec-
utive blocks containing categories of variables, in which
the order of the blocks was based on their relative prox-
imity to the individual. This approach ensures that
increases in the explained variance in overall physical
activity between individuals (multiple correlations squared,
R2) added by adding a new block can be attributed solely to
the variables in the added block. Demographic and bio-
logical variables were entered as block 1. The inclusion of
demographic and biological variables in block 1 was based
on their association with physical activity shown in epi-
demiological studies (Trost et al. 2002) and ensured that
the amount of variance explained in the following blocks
was independent of these variables. Block 2 contained the
psychological variables (self-efficacy, perceived behav-
ioural control, and physical activity identity), reflecting
greater proximity to the individual than the more distal
social environmental variables (social support from family
and friends), which were included in block 3. The physical
environmental variables (perceived community attributes)
were entered in block 4. Unstandardized coefficients
(b) and the individual contribution of each predictor vari-
able to the explained variance (semi-partial correlation
squared) are reported.
To investigate the potential moderating effects of the
demographic and biological variables on the relationships
between the psychological, social environmental and
physical environmental variables and physical activity, the
interaction terms for the demographic and biological
variables and the potential correlates were computed (e.g.
sex multiplied by self-efficacy). The potential correlates
were mean centred before the interaction terms were
computed to avoid the potential bias of multicollinearity.
The initial regression analyses were re-run, with block 1
consisting of the demographic and biological variables,
excluding the potential moderator being investigated, block
2 containing the potential moderator and the potential
correlate being investigated, while the corresponding
interaction term was added in block 3. This procedure was
repeated for each potential correlate, resulting in six sep-
arate regressions for each potential moderator variable. To
graphically display and explore the directions and strengths
of the significant interactions, the potential correlates were
ordered in moderator-split tertiles (tertile 1: low score;
tertile 2: moderate score; and tertile 3: high score), and
analysis of covariance was then applied to explore the
overall physical activity for each tertile, adjusted for the
demographic and biological variables.
Results
Descriptive data are provided in Table 1. The mean age
(SD) of the sample was 49.1 years (14.9) and the average
BMI was 25.5 kg/m2 (4.0), with 47 % of the study popu-
lation being either overweight or obese. Women and men
did not differ in their overall physical activity levels and
activity remained constant with increasing age until
65 years, after which activity levels declined (data not
shown).
The mean scores for the psychological and social
environmental variables were moderate and relatively high,
respectively, while the mean scores for the physical
Table 1 Physical activity and anthropometric data for all participants and by sex, Norway (2008–2009)
Mean (SD) Mean (SD) Mean (SD)
Physical activitya All (n = 3,267) Women (n = 1,747) Men (n = 1,520)
Overall PA (counts/min) 338 (2.4) 335 (3.3) 342 (3.6) ns
Anthropometric data
Age (years) 49.1 (14.9) 48.3 (15.0) 50.0 (15.0) **
Height (cm) 173.0 (9.1) 166.9 (6.1) 180.1 (6.5) **
Weight (kg) 76.6 (14.8) 69.3 (12.3) 85.0 (12.8) **
BMI (kg/m2) 25.5 (4.0) 24.9 (4.3) 26.2 (3.5) **
Overweight (%)b 35.3 29.7 45.6 **
Obese (%)d 11.4 10.9 13.3 **
Values are means (SD), except for overall PA where standard error of the mean (SE) is reported
NS non-significant, SD standard deviationa Activity variables are adjusted for age and test centreb Values are presented as proportions (%)
Significant test for women compared with men* p \ 0.05** p \ 0.001
B. H. Hansen et al.
123

environment variables were high (a mean score of 3.3 of
4.0) (Table 2). Compared with women, men reported lower
levels of social support from friends (2.5 vs. 2.7, respec-
tively, p B 0.001), and higher levels of perceived
behavioural control (5.1 vs. 4.9, p B 0.001). No other sex-
based differences were observed.
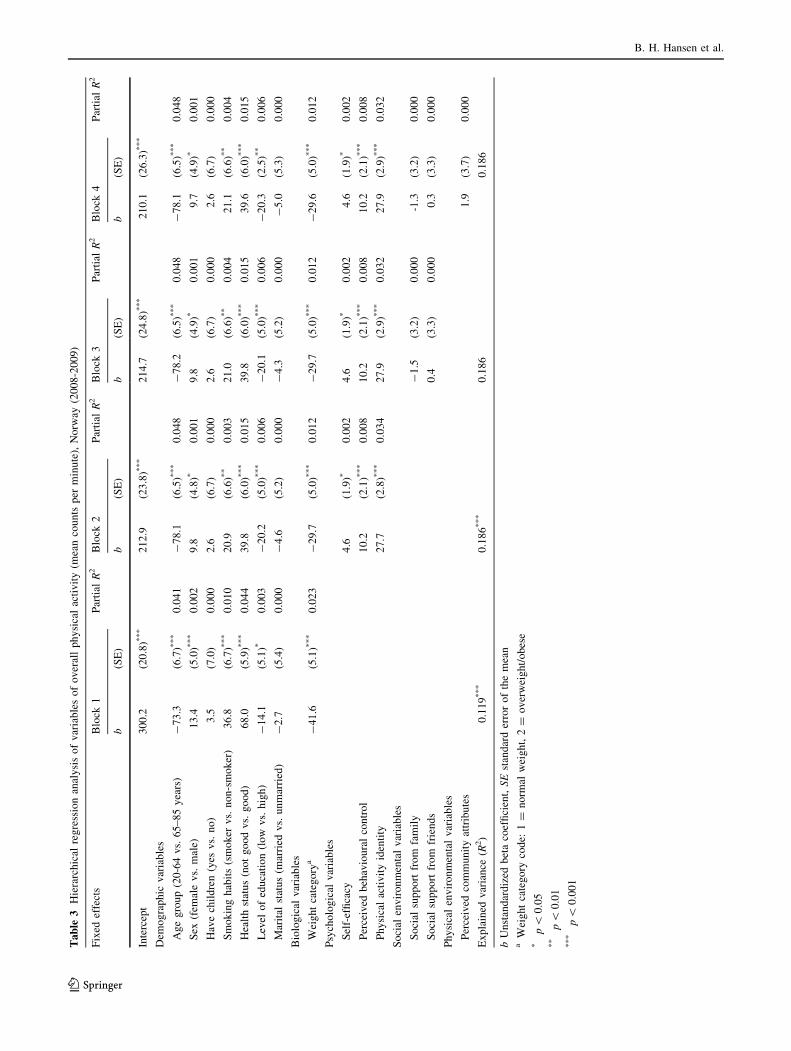
The demographic and biological factors included in the
model (block 1) accounted for 11.9 % of the variance in
overall physical activity (R2 = 0.119, p B 0.001)
(Table 3). Age group, health status, and weight status
displayed the largest amount of explanatory power,
explaining 4.1, 4.4 and 2.3 % of the variance, respectively
(p B 0.001). The psychological variables of self-efficacy,
perceived behavioural control and physical activity identity
(block 3) increased the total explained variance to 18.6 %
(p B 0.001). Although age group, health status, and weight
status remained significant throughout the addition of the
blocks of variables, their predictive power changed some-
what. In the fully adjusted model, age group accounted for
4.8 % of the explained variance (p B 0.001), whereas the
predictive power of health status and weight status
decreased to 1.5 and 1.2 %, respectively (p B 0.001). Each
of the psychological correlates individually contributed to
increasing the explanatory power of the model, with
physical activity identity being the most important factor,
individually explaining 3.4 % of the variance (p B 0.001).
The social environmental variables (block 3) (perceived
social support from family and friends) and the physical
environmental variable (block 4) yielded no further
significant increases in amount of variance explained by
the total set of variables.
Altogether, seven of the 22 interaction terms contributed
significantly to increasing the explanatory power of the
predictor variables, indicating that these moderated the
relationships between the sets of variables, now established
as correlates, and physical activity. However, the effect
sizes were small (Table 4), and visual inspection of the
relationships between the correlates and physical activity,
split by the potential moderator, indicated that none of
the interaction terms altered the relationships sufficiently
to have any significant relevance to the predictive
power of the correlates in any of the specified subgroups
(Figs. 1, 2, 3).
Discussion
Using a social ecological framework, this study examined
correlates of accelerometer-determined overall physical
activity in a large population-based sample of Norwegian
adults and older people.
The total independent variable set accounted for 18.6 %
of the explained variance in overall physical activity. Age
group (below or above 65 years) was the most important
predictor of overall activity level, uniquely explaining
4.8 % of the variance in the dependent variable, a finding
that is consistent with findings from studies using self-
reported measures of physical activity (Trost et al. 2002).
Table 2 Psychosocial and socio-environmental variables with Cronbach’s a, and examples of scale items, Norway (2008–2009)
Scale range Mean (SD) a
Biological variable
Weight category: overweight/obese (%) NA 46.7 (NA) NA
Psychological variables
Self-efficacy 1–7 5.2 (1.4) 0.91
‘‘I am sure that I can perform the planned physical activity even though I am tired’’
Perceived behavioural control 1–7 5.0 (1.3) 0.67
‘‘I control whether I perform regular physical activity or not’’
Physical activity identity 1–5 3.5 (1.0) 0.91
‘‘Being physically active is a part of being the person I am’’
Social environmental variables
Social support from family 1–5 2.9 (0.9) 0.86
‘‘How often do members of your family change their plans so that they can be physically active with you’’
Social support from friends 1–5 2.6 (0.9) 0.89
‘‘How often do your friends change their plans so that they can be physically active with you?’’
Physical environmental variables
Perceived community attributes 1–4 3.3 (0.7) 0.79
‘‘To what extent does your community have: safe places where you can walk?’’
NA; not applicable
Correlates of objectively measured physical activity
123
Ta
ble
3H
iera
rch
ical
reg
ress
ion
anal
ysi
so
fv
aria
ble
so
fo
ver
all
ph
ysi
cal
acti
vit
y(m
ean
cou
nts
per
min
ute
),N
orw
ay(2
00
8-2
00
9)
Fix
edef
fect
sB
lock
1P
arti
alR
2B
lock
2P
arti
alR
2B
lock
3P
arti
alR
2B
lock
4P
arti
alR
2
b(S
E)
b(S
E)
b(S
E)
b(S
E)
Inte
rcep
t3
00
.2(2
0.8
)***
21
2.9
(23
.8)*
**
21
4.7
(24
.8)*
**
21
0.1
(26
.3)*
**
Dem
og
rap
hic
var
iab
les
Ag
eg
rou
p(2
0-6
4v
s.6
5–
85
yea
rs)
-7
3.3
(6.7
)***
0.0
41
-7
8.1
(6.5
)***
0.0
48
-7
8.2
(6.5
)***
0.0
48
-7
8.1
(6.5
)***
0.0
48
Sex
(fem
ale
vs.
mal
e)1
3.4
(5.0
)***
0.0
02
9.8
(4.8
)*0
.00
19
.8(4
.9)*
0.0
01
9.7
(4.9
)*0
.00
1
Hav
ech
ild
ren
(yes
vs.
no
)3
.5(7
.0)
0.0
00
2.6
(6.7
)0
.00
02
.6(6
.7)
0.0
00
2.6
(6.7
)0
.00
0
Sm
ok
ing
hab
its
(sm
ok
erv
s.n
on
-sm
ok
er)
36
.8(6
.7)*
**
0.0
10
20
.9(6
.6)*
*0
.00
32
1.0
(6.6
)**
0.0
04
21
.1(6
.6)*
*0
.00
4
Hea
lth
stat
us
(no
tg
oo
dv
s.g
oo
d)
68
.0(5
.9)*
**
0.0
44
39
.8(6
.0)*
**
0.0
15
39
.8(6
.0)*
**
0.0
15
39
.6(6
.0)*
**
0.0
15
Lev
elo
fed
uca
tio
n(l
ow
vs.
hig
h)
-1
4.1
(5.1
)*0
.00
3-
20
.2(5
.0)*
**
0.0
06
-2
0.1
(5.0
)***
0.0
06
-2
0.3
(2.5
)**
0.0
06
Mar
ital
stat
us
(mar
ried
vs.
un
mar
ried
)-
2.7
(5.4
)0
.00
0-
4.6
(5.2
)0
.00
0-
4.3
(5.2
)0
.00
0-
5.0
(5.3
)0
.00
0
Bio
log
ical
var
iab
les
Wei
gh
tca
teg
ory
a-
41
.6(5
.1)*
**
0.0
23
-2
9.7
(5.0
)***
0.0
12
-2
9.7
(5.0
)***
0.0
12
-2
9.6
(5.0
)***
0.0
12
Psy
cho
log
ical
var
iab
les
Sel
f-ef
fica
cy4
.6(1
.9)*
0.0
02
4.6
(1.9
)*0
.00
24
.6(1
.9)*
0.0
02
Per
ceiv
edb
ehav
iou
ral
con
tro
l1
0.2
(2.1
)***
0.0
08
10
.2(2
.1)*
**
0.0
08
10
.2(2
.1)*
**
0.0
08
Ph
ysi
cal
acti
vit
yid
enti
ty2
7.7
(2.8
)***
0.0
34
27
.9(2
.9)*
**
0.0
32
27
.9(2
.9)*
**
0.0
32
So
cial
env
iro
nm
enta
lv
aria
ble
s
So
cial
sup
po
rtfr
om
fam
ily
-1
.5(3
.2)
0.0
00
-1.3
(3.2
)0
.00
0
So
cial
sup
po
rtfr
om
frie
nd
s0
.4(3
.3)
0.0
00
0.3
(3.3
)0
.00
0
Ph
ysi
cal
env
iro
nm
enta
lv
aria
ble
s
Per
ceiv
edco
mm
un
ity
attr
ibu
tes
1.9
(3.7
)0
.00
0
Ex
pla
ined
var
ian
ce(R
2)
0.1
19
***
0.1
86
***
0.1
86
0.1
86
bU
nst
and
ard
ized
bet
aco
effi
cien
t,S
Est
and
ard
erro
ro
fth
em
ean
aW
eig
ht
cate
go
ryco
de:
1=
no
rmal
wei
gh
t,2
=o
ver
wei
gh
t/o
bes
e*
p\
0.0
5**
p\
0.0
1***
p\
0.0
01
B. H. Hansen et al.
123

Further, in contrast to much of the published literature on
levels of physical activity, no sex gradient in overall phys-
ical activity was observed (Trost et al. 2002). This is,
however, consistent with more recent studies of population
levels of objectively measured physical activity (Hagstromer
et al. 2010), and might reflect the activity monitors increased
ability to capture a broader spectrum of physical activity
compared to self-reported measures (Hansen et al. 2012).
Concerning the remaining demographic and biological
variables, the results of the current study are in conjunction
with other studies. As reported by others, civil status was
not associated with physical activity (Brownson et al. 2000;
King et al. 2000) and smoking status was inversely related
to physical activity (Johnson et al. 1998; Brownson et al.
2000). Overweight and obesity was associated with lower
levels of physical activity after controlling for potential
demographic confounders, as consistently reported in the
literature (Martinez-Gonzalez et al. 1999).
Self-efficacy was a significant independent contributor
to overall physical activity in the present study. This
finding confirms earlier findings of self-efficacy as a cor-
relate that is positively associated with adoption and
maintenance of physical activity (Bandura 1997; Bauman
et al. 2012; Sallis et al. 1986). Perceived behavioural
control is an individual’s perception of the extent to which
regularly maintaining the behaviour is easy or difficult and
may influence behaviour directly and through the inten-
tions to act (Ajzen and Madden 1986). A number of studies
have found that perceived behavioural control predicts
physical activity behaviour (Hagger et al. 2002; Jackson
et al. 2003), which was also observed in the present study.
Physical activity identity was the strongest predictor of all
the correlates and yielded a significant independent addi-
tion of variance accounted for in physical activity, equal to
age group in size. The explanatory power of physical
activity identity is supported by others. In a community-
based study of 2,336 adults living in Norway, physical
activity identity was found to be the strongest predictor of
forward transition in the stages of change in physical
activity (Lorentzen et al. 2007b). The relevance of activity
identity as a correlate of physical activity was also con-
firmed in earlier studies of self-reported physical activity
(Anderson and Cychosz 1995), and these earlier findings
combined with the results of the current study provide
strong evidence for the inclusion of attempts to foster the
development of individual‘s physical activity identity in
interventions aimed at enhancing physical activity behav-
iour. However, past interventions to increase physical
activity aimed solely at cognitive and psychosocial
Table 4 Interaction effects of potential moderators of the relation-
ship between correlates and moderate-to-vigorous physical activity,
Norway (2008–2009)
Variables included in block R2*100 p value
Sex and self-efficacy 13.9
Interaction term: sex 9 self-efficacy 14.2 0.001
Sex and perceived behavioural control 14.9
Interaction term: sex 9 perceived behavioural
control
15.0 0.014
Sex and perceived community attributes* 12.1
Interaction term: sex 9 perception of community
attributes
12.3 0.003
Weight status and self-efficacy 13.9
Interaction term: weight status 9 self-efficacy 14.2 0.001
Weight status and perceived behavioural control 14.9
Interaction term: weight status 9 perceived
behavioural control
15.0 0.016
Level of education and self-efficacy 13.9
Interaction term: level of education 9 self-
efficacy
14.1 0.004
R2*100 percentage explained variance in overall physical activity
(mean counts per minute)
Fig. 1 Relationship between overall physical activity and self-
efficacy (a) or perceived behavioural control (b) by sex, Norway
(2008–2009)
Correlates of objectively measured physical activity
123

variables have generally produced small effect sizes and
usually the behaviour changes were not sustainable, pro-
liferating ecological models of health behaviour that posit
the need for multi-level interventions (Sallis et al. 2008;
Stokols et al. 1996).
According to the literature, social support is a consistent
correlate of physical activity (Bauman et al. 2012; Trost
et al. 2002). In our model, however, social support neither
from friends nor family emerged as a significant contrib-
utor to the explanatory power of the model after controlling
for demographic and biological variables and psychologi-
cal correlates. This has also been observed by others (Hall
and McAuley 2010). Further, perceived community attri-
butes did not relate significantly to overall physical
activity. A similar finding was reported in a review by
Wendel-Vos et al. (2007), reporting that availability,
accessibility and convenience of recreational facilities were
less consistent correlates of physical activity, possibly due
to the use of non-validated measures of environments and/
or behaviour. The item measuring perceived community
attributes in the present study displayed reasonable internal
consistency, but the mean score was relatively high with
little variance and might, therefore, not be able to dis-
criminate sufficiently between high and low levels of
community attributes. Furthermore, the addition of per-
ceived environment measures that assessed multiple
features of physical environment would have strengthened
the study. Ideally, objective measurement of neighbour-
hood walkability, street connectivity, population density
and sidewalk conditions would be ideal for this purpose,
and might yield different results (Wendel-Vos et al. 2007).
There were significant interaction effects of the demo-
graphic and biological variables in the relationship between
the different correlates and physical activity. However, the
size of the interaction effects (as displayed in Table 4 and
Figs. 1, 2, 3) should be considered as relatively modest.
Hence, the interaction findings would seem encouraging by
indicating that tailoring strategies to increase overall
physical activity in the population according to sex, weight
or level of education do not seem necessary.
Fig. 3 Relationship between overall physical activity and self-
efficacy (a) or perceived behavioural control (b) by level of
education, Norway (2008–2009)
Fig. 2 Relationship between overall physical activity and self-
efficacy (a) or perceived behavioural control (b) by weight status,
Norway (2008–2009)
B. H. Hansen et al.
123

The study is not without limitations. The cross-sectional
design of the study prohibits the establishment of causality.
Furthermore, the response rate might be considered low,
which increases the risk for selection bias (Sogaard et al.
2004; Van Loon et al. 2003). Analyses of the non-
responders in our study revealed that non-responders were
more likely to be either at the younger or older end of the
age spectrum, unmarried and with lower educational and
income levels, compared to the responders (Hansen et al.
2012), as observed in most population-based surveys
(Sogaard et al. 2004; Strandhagen et al. 2010). In addition,
the prevalence of overweight or obesity and other non-
communicable diseases, such as type 2 diabetes, was
similar to other national estimates. Therefore, we believe
that the results of the current study have a general validity
corresponding to similar studies.
We also acknowledge that the choice of CPM as the
main outcome variable might be debatable as it provides
some challenges related to the interpretation of the public
health significance of the study. This might have been
avoided using an indicator of intensity-specific physical
activity, such as number of minutes above a certain count
threshold (e.g. moderate-to-vigorous physical activity;
MVPA). However, the appliance of cut-points for inten-
sity-specific physical activity is associated with challenges,
especially in a sample that is heterogeneous with respect to
age and weight status. The CPM variable is not affected by
any external manipulation and we believe that this variable
is the best indicator of the participants‘ level of overall
physical activity. However, additional analysis with MVPA
as the dependent variable yielded very similar results (data
not shown). The overall explained variance with MVPA as
the dependent variable was 17.7 %, compared to 18.6 %
when CPM was used, and the same variables were signif-
icant correlates of activity.
Lastly, there is emerging evidence on other possible
correlates of physical activity, such as genetic and policy
related determinants. The inclusion of such factors has the
potential to increase our understanding of the correlates of
physical activity, but this is beyond the scope of this article.
In spite of these limitations, the present study contrib-
utes to the understanding of physical activity and its
correlates. The results of the study can serve as an
empirical evaluation of a social ecological model of
physical activity and the order of entry of blocks of vari-
ables into the hierarchical regression model is of relevance
to intervention design. Demographic and biological vari-
ables that are not modifiable were entered first, allowing
the explained variance (R2) for the following blocks to
serve as a theoretical estimate of change that could be
expected by changing variables in the blocks. Although the
independent explanatory power of each correlates was
relatively modest, they yield important information as there
is consistent evidence showing that small increases in
physical activity can benefit people‘s health significantly
(Hill 2009; Levine et al. 2000).
Conclusion
Several correlates that might be important targets for
intervention were identified. These variables include self-
efficacy, perceived behavioural control and physical
activity identity.
The observed interaction effects of the demographic and
biological variables on the relationships between the cor-
relates and physical activity did not seem to have a
sufficient impact to justify interventions that are specific
for sex, weight status, or level of education.
Acknowledgments The authors thank all the test personnel at the
ten institutions involved in the study, for their work during the data
collection: Finnmark University College, Hedmark University Col-
lege, NTNU Social Research AS, Sogn og Fjordane University
College, University of Agder, University of Nordland, University of
Stavanger, Telemark University College, Vestfold University Col-
lege, and Norwegian School of Sport Sciences.
Conflict of interest The authors declare that they have no com-
peting interests.
References
Ajzen I, Madden TJ (1986) Prediction of goal directed behavior:
attitudes, intentions, and perceived behavioral control. J Exp Soc
Psychol 22:453–474
Anderson DF, Cychosz CM (1995) Exploration of the relationship
between exercise behavior and exercise identity. J Sport Behav
18:159–166
Bandura A (1997) Self-efficacy: the exercise of control. W.H.
Freedman and Company, New York
Bandura A (2004) Health promotion by social cognitive means.
Health Educ Behav 31:143–164
Bauman AE, Sallis JF, Dzewaltowski DA, Owen N (2002) Toward a
better understanding of the influences on physical activity: the
role of determinants, correlates, causal variables, mediators,
moderators, and confounders. Am J Prev Med 23:5–14
Bauman AE, Reis RS, Sallis JF, Wells JC, Loos RJ, Martin BW
(2012) Correlates of physical activity: why are some people
physically active and others not? Lancet 380:258–271
Booth ML, Owen N, Bauman A, Clavisi O, Leslie E (2000) Social-
cognitive and perceived environment influences associated with
physical activity in older Australians. Prev Med 31:15–22
Bouchard C, Blair SN, Haskell WL (2012) Physical activity and
health. Human Kinetics, Champaign
Brownson RC, Eyler AA, King AC, Brown DR, Shyu YL, Sallis JF
(2000) Patterns and correlates of physical activity among US
women 40 years and older. Am J Public Health 90:264–270
Brownson RC, Baker EA, Housemann RA, Brennan LK, Bacak SJ
(2001) Environmental and policy determinants of physical
activity in the United States. Am J Public Health 91:1995–2003
Bryan A, Hutchison KE, Seals DR, Allen DL (2007) A transdisciplin-
ary model integrating genetic, physiological, and psychological
correlates of voluntary exercise. Health Psychol 26:30–39
Correlates of objectively measured physical activity
123

Fuchs R, Schwarzer R (1994) Selbstwirksamheit zur sportlichen
aktivitat: reliabilitat und validitat eines neuen meßinstruments—
Self-efficacy towards physical exercise: reliability and validity
of a new instrument. Zeitschrift fur Differentielle und Diagnos-
tische Psychologie 15:141–154
Hagger MS, Chatzisarantis NLD, Biddle SJ (2002) A meta-analytic
review of the theories of reasoned action and planned behavior in
physical activity: predictive validity and the contribution of
additional variables. J Sport Exerc Psychol 24:3–32
Hagstromer M, Troiano RP, Sjostrom M, Berrigan D (2010) Levels
and patterns of objectively assessed physical activity—a com-
parison between Sweden and the United States. Am J Epidemiol
171:1055–1064
Hall KS, McAuley E (2010) Individual, social environmental and
physical environmental barriers to achieving 10,000 steps per
day among older women. Health Educ Res 25:478–488
Hansen BH, Kolle E, Dyrstad SM, Holme I, Anderssen SA (2012)
Accelerometer-determined physical activity in adults and older
people. Med Sci Sports Exerc 44:266–272
Haskell WL, Lee IM, Pate RR, Powell KE, Blair SN, Franklin BA,
Macera CA, Heath GW, Thompson PD, Bauman A (2007)
Physical activity and public health: updated recommendation for
adults from the American College of Sports Medicine and the
American Heart Association. Circulation 116:1081–1093
Hill JO (2009) Can a small-changes approach help address the obesity
epidemic? A report of the Joint Task Force of the American
Society for Nutrition, Institute of Food Technologists, and
International Food Information Council. Am J Clin Nutr
89:477–484
Jackson C, Smith RA, Conner M (2003) Applying an extended
version of the theory of planned behaviour to physical activity.
J Sports Sci 21:119–133
Johnson MF, Nichols JF, Sallis JF, Calfas KJ, Hovell MF (1998)
Interrelationships between physical activity and other health behav-
iors among University women and men. Prev Med 27:536–544
King AC, Castro C, Wilcox S, Eyler AA, Sallis JF, Brownson RC
(2000) Personal and environmental factors associated with
physical inactivity among different racial-ethnic groups of US
middle-aged and older-aged women. Health Psychol 19:354–364
Levine JA, Schleusner SJ, Jensen MD (2000) Energy expenditure of
nonexercise activity. Am J Clin Nutr 72:1451–1454
Lorentzen C, Ommundsen Y, Jenum AK, Holme I (2007a) The
‘‘Romsas in Motion’’ community intervention: program expo-
sure and psychosocial mediated relationships to change in stages
of change in physical activity. Int J Behav Nutr Phys Act 4:15
Lorentzen CA, Ommundsen Y, Holme I (2007b) Psychosocial
correlates of stages of change in physical activity in an adult
community sample. Eur J Sports Sci 7:93–106
Martinez-Gonzalez MA, Martinez JA, Hu FB, Gibney MJ, Kearney J
(1999) Physical inactivity, sedentary lifestyle and obesity in the
European Union. Int J Obes Relat Metab Disord 23:1192–1201
McClain JJ, Sisson SB, Tudor-Locke C (2007) Actigraph acceler-
ometer interinstrument reliability during free-living in adults.
Med Sci Sports Exerc 39:1509–1514
McLeroy KR, Bibeau D, Steckler A, Glanz K (1988) An ecological
perspective on health promotion programs. Health Educ Q
15:351–377
Norman P, Smith L (1995) The theory of planned behaviour and
exercise: an investigation into the role of prior behaviour,
behavioural intentions and attitude variability. Eur J Soc Psychol
25:403–415
Plasqui G, Westerterp KR (2007) Physical activity assessment with
accelerometers: an evaluation against doubly labeled water.
Obesity (Silver Spring) 15:2371–2379
Saelens BE, Handy SL (2008) Built environment correlates of
walking: a review. Med Sci Sports Exerc 40:S550–S566
Saelens BE, Sallis JF, Black JB, Chen D (2003) Neighbourhood-
based differences in physical activity: an environment scale
evaluation. Am J Public Health 93:1552–1558
Sallis JF, Saelens BE (2000) Assessment of physical activity by self-
report: status, limitations, and future directions. Res Q Exerc
Sport 71:S1–S14
Sallis JF, Haskell WL, Fortmann SP, Vranizan KM, Taylor CB,
Solomon DS (1986) Predictors of adoption and maintenance of
physical activity in a community sample. Prev Med 15:331–341
Sallis JF, Grossman RM, Pinski RB, Patterson TL, Nader PR (1987)
The development of scales to measure social support for diet and
exercise behaviors. Prev Med 16:825–836
Sallis JF, Owen N, Fisher EB (2008) Ecological models of health
behavior. In: Glanz K, Rimer BK, Viswanath K (eds) Health
behavior and health education. Jossey-Bass, San Fransisco,
pp 465–486
Seefeldt V, Malina RM, Clark MA (2002) Factors affecting levels of
physical activity in adults. Sports Med 32:143–168
Sogaard AJ, Selmer R, Bjertness E, Thelle D (2004) The Oslo Health
Study: the impact of self-selection in a large, population-based
survey. Int J Equity Health 3:3
Stokols D, Allen J, Bellingham RL (1996) The social ecology of
health promotion: implications for research and practice. Am J
Health Promot 10:247–251
Strandhagen E, Berg C, Lissner L, Nunez L, Rosengren A, Toren K,
Thelle DS (2010) Selection bias in a population survey with
registry linkage: potential effect on socioeconomic gradient in
cardiovascular risk. Eur J Epidemiol 25:163–172
Trost SG, Owen N, Bauman AE, Sallis JF, Brown W (2002)
Correlates of adults’ participation in physical activity: review
and update. Med Sci Sports Exerc 34:1996–2001
Van Holle V, Deforche B, Van CJ, Goubert L, Maes L, Van de
Weghe N, De Bourdeauij I (2012) Relationship between the
physical environment and different domains of physical activity
in European adults: a systematic review. BMC Public Health
12:807
Van Loon AJ, Tijhuis M, Picavet HS, Surtees PG, Ormel J (2003)
Survey non-response in the Netherlands: effects on prevalence
estimates and associations. Ann Epidemiol 13:105–110
Wendel-Vos W, Droomers M, Kremers S, Brug J, van Lenthe F
(2007) Potential environmental determinants of physical activity
in adults: a systematic review. Obes Rev 8:425–440
World Health Organization. Obesity: preventing and managing the
global epidemic. Report of a WHO consultation (2000) Geneva.
World Health Organization, Switzerland
B. H. Hansen et al.
123
Copyright © 2022 FDOKUMEN