What factors are associated with physical activity in older people, assessed objectively by...
10
What factors are associated with physical activity in older people, assessed objectively by accelerometry? T J Harris, 1,2 C G Owen, 1 C R Victor, 3 R Adams, 2 D G Cook 1 c A questionnaire is published online at http://bjsm.bmj.com/ content/vol43/issue6 1 Division of Community Health Sciences, St George’s, University of London, London, UK; 2 Sonning Common Health Centre, Sonning Common, UK; 3 School of Health & Social Care, Reading University, Reading, UK Correspondence to: Dr Tess Harris, Senior lecturer in general practice, Division of Community Health Sciences, St George’s, University of London, Cranmer Terrace, Tooting, London, SW17 ORE, UK; [email protected] Accepted 3 April 2008 Published Online First 16 May 2008 ABSTRACT Objectives: To assess physical activity (PA) levels measured objectively using accelerometers in community- dwelling older people and to examine the associations with health, disability, anthropometric measures and psychosocial factors. Design: Cross-sectional survey. Setting: Single general practice (primary care centre), United Kingdom. Participants: Random selection of 560 community- dwelling older people at least 65 years old, registered with the practice. 43% (238/560) participated. Assessment of risk factors: Participants completed a questionnaire assessing health, disability, psychosocial factors and PA levels; underwent anthropometric assessment; and wore an accelerometer (Actigraph) for 7 days. Main outcome measures: Average daily accelerometer step-counts and time spent in different PA levels. Associations between step-counts and other factors were examined using linear regression. Results: Average daily step-count was 6443 (95% CI 6032 to 6853). Men achieved 754 (84 to 1424) more steps daily than women. Step-count declined steadily with age. Independent predictors of average daily step- count were: age; general health; disability; diabetes; body mass index; exercise self-efficacy; and perceived exercise control. Activities associated independently with higher step-counts included number of long walks and dog- walking. Only 2.5% (6/238) of participants achieved the recommended 150 minutes weekly of at least moderate- intensity activity in >10 minute bouts; 62% (147/238) achieved none. Conclusions: This is the first population-based sample of older people with objective PA and anthropometric measures. PA levels in older people are well below recommended levels, emphasising the need to increase PA in this age group, particularly in those who are overweight/obese or have diabetes. The independent effects of exercise self-efficacy and exercise control on PA levels highlight their role as potential mediators for intervention studies. Physical activity (PA) benefits older people’s health: preventing disease, 1 reducing disability 2 and improving well-being. 1 Adults, including older adults, are advised to perform at least moderate- intensity PA (leading to increases in breathing, heart rate and temperature) for >30 minutes (in >10 minute bouts) on at least 5 days weekly. 13 However, recent self-reported findings suggest that only 18% of men and 14% of women aged 65–74 and 8% of men and 4% of women aged 75 or over achieve this. 4 Benefits may occur from lower- intensity PA in older age; walking (light-intensity if strolling, 2 mph, moderate-intensity if faster) remains important for maintaining activities. 1 Factors associated with decreased PA levels in older people include: increasing age; female gender; obesity; medical problems; disability; pain; depres- sion; smoking; reduced education; social isolation; low exercise self-efficacy; attitudinal barriers; bad weather; and unsafe neighbourhoods. 5–7 These findings are from self-reported activity; however, the predominant activity, walking, is unreliably recalled. 8 Questionnaires also suffer from recall bias and floor effects, with the baseline too high for most respondents. 8 Motion sensors (pedometers and accelerometers) are sensitive to walking, objectively quantify PA as a continuous variable and are unrestricted by floor values. 89 Pedometers are cheap and easy to wear; they measure step-count but not intensity and therefore cannot distinguish walking speeds. They are super- ior to questionnaires 10 and logs, 11 but may under- report at slower speeds, 12 including frail elderly, 13 and in the obese. 14 The media-promoted 10 000 daily steps target ignores the guidelines’ intensity component 15 and may be unsustainable for older adults with chronic disease. 16 Older people’s pedometer studies are limited to those with specific disorders, 17–19 volunteers 18 20 21 or cohort survivors. 22 Several population-based adult studies include small numbers of older people (,200). 9 23–26 Those examining PA determinants found that step- counts were inversely associated with age, 9 18 20 23–26 female gender, 9 23–25 body mass index, 9 18 21 24–26 waist circumference 21 and lower income. 9 26 Most lacked health, disability or psychological variables, but Ashe found that mobility, depression and chronic disease self-efficacy predicted step-counts. 20 Accelerometers record activity counts, the pro- duct of movement frequency and intensity, with results downloaded for computer analysis. They have been validated in older people 27 and objec- tively measure activity. 8 Accelerometers are worn like pedometers and similarly cannot measure swimming or cycling activities, but can record continuously for up to 21 days. 27 Accelerometers give participants no PA feedback; pedometers do, which could lead to participants increasing their PA whilst monitoring it, advantageous in inter- vention studies 19 28 but problematic for observa- tional studies. This has not been tested empirically. Accelerometers are expensive, approximately $350/ £175/J230. Dual-mode accelerometers (e.g. Actigraph: Actigraph, LLC Florida 32502 USA. Actigraph. 2008. www.theactigraph.com) provide simultaneous, time-stamped activity count and step-count measurements. Those using acceler- ometers have reported step-counts as a simple Original article 442 Br J Sports Med 2009;43:442–450. doi:10.1136/bjsm.2008.048033 group.bmj.com on May 22, 2011 - Published by bjsm.bmj.com Downloaded from
-
Upload
independent -
Category
Documents
-
view
0 -
download
0
Transcript of What factors are associated with physical activity in older people, assessed objectively by...
What factors are associated with physical activity inolder people, assessed objectively by accelerometry?
T J Harris,1,2 C G Owen,1 C R Victor,3 R Adams,2 D G Cook1
c A questionnaire is publishedonline at http://bjsm.bmj.com/content/vol43/issue6
1 Division of Community HealthSciences, St George’s,University of London, London,UK; 2 Sonning Common HealthCentre, Sonning Common, UK;3 School of Health & Social Care,Reading University, Reading, UK
Correspondence to:Dr Tess Harris, Senior lecturer ingeneral practice, Division ofCommunity Health Sciences, StGeorge’s, University of London,Cranmer Terrace, Tooting,London, SW17 ORE, UK;[email protected]
Accepted 3 April 2008Published Online First16 May 2008
ABSTRACTObjectives: To assess physical activity (PA) levelsmeasured objectively using accelerometers in community-dwelling older people and to examine the associationswith health, disability, anthropometric measures andpsychosocial factors.Design: Cross-sectional survey.Setting: Single general practice (primary care centre),United Kingdom.Participants: Random selection of 560 community-dwelling older people at least 65 years old, registeredwith the practice. 43% (238/560) participated.Assessment of risk factors: Participants completed aquestionnaire assessing health, disability, psychosocialfactors and PA levels; underwent anthropometricassessment; and wore an accelerometer (Actigraph) for7 days.Main outcome measures: Average daily accelerometerstep-counts and time spent in different PA levels.Associations between step-counts and other factors wereexamined using linear regression.Results: Average daily step-count was 6443 (95% CI6032 to 6853). Men achieved 754 (84 to 1424) moresteps daily than women. Step-count declined steadilywith age. Independent predictors of average daily step-count were: age; general health; disability; diabetes; bodymass index; exercise self-efficacy; and perceived exercisecontrol. Activities associated independently with higherstep-counts included number of long walks and dog-walking. Only 2.5% (6/238) of participants achieved therecommended 150 minutes weekly of at least moderate-intensity activity in >10 minute bouts; 62% (147/238)achieved none.Conclusions: This is the first population-based sample ofolder people with objective PA and anthropometricmeasures. PA levels in older people are well belowrecommended levels, emphasising the need to increasePA in this age group, particularly in those who areoverweight/obese or have diabetes. The independenteffects of exercise self-efficacy and exercise control onPA levels highlight their role as potential mediators forintervention studies.
Physical activity (PA) benefits older people’shealth: preventing disease,1 reducing disability2
and improving well-being.1 Adults, including olderadults, are advised to perform at least moderate-intensity PA (leading to increases in breathing,heart rate and temperature) for >30 minutes (in>10 minute bouts) on at least 5 days weekly.1 3
However, recent self-reported findings suggest thatonly 18% of men and 14% of women aged 65–74and 8% of men and 4% of women aged 75 or overachieve this.4 Benefits may occur from lower-intensity PA in older age; walking (light-intensity
if strolling, 2 mph, moderate-intensity if faster)remains important for maintaining activities.1
Factors associated with decreased PA levels in olderpeople include: increasing age; female gender;obesity; medical problems; disability; pain; depres-sion; smoking; reduced education; social isolation;low exercise self-efficacy; attitudinal barriers; badweather; and unsafe neighbourhoods.5–7 Thesefindings are from self-reported activity; however,the predominant activity, walking, is unreliablyrecalled.8 Questionnaires also suffer from recall biasand floor effects, with the baseline too high formost respondents.8 Motion sensors (pedometersand accelerometers) are sensitive to walking,objectively quantify PA as a continuous variableand are unrestricted by floor values.8 9
Pedometers are cheap and easy to wear; theymeasure step-count but not intensity and thereforecannot distinguish walking speeds. They are super-ior to questionnaires10 and logs,11 but may under-report at slower speeds,12 including frail elderly,13
and in the obese.14 The media-promoted 10 000daily steps target ignores the guidelines’ intensitycomponent15 and may be unsustainable for olderadults with chronic disease.16 Older people’spedometer studies are limited to those withspecific disorders,17–19 volunteers18 20 21 or cohortsurvivors.22 Several population-based adult studiesinclude small numbers of older people (,200).9 23–26
Those examining PA determinants found that step-counts were inversely associated with age,9 18 20 23–26
female gender,9 23–25 body mass index,9 18 21 24–26
waist circumference21 and lower income.9 26 Mostlacked health, disability or psychological variables,but Ashe found that mobility, depression andchronic disease self-efficacy predicted step-counts.20
Accelerometers record activity counts, the pro-duct of movement frequency and intensity, withresults downloaded for computer analysis. Theyhave been validated in older people27 and objec-tively measure activity.8 Accelerometers are wornlike pedometers and similarly cannot measureswimming or cycling activities, but can recordcontinuously for up to 21 days.27 Accelerometersgive participants no PA feedback; pedometers do,which could lead to participants increasing theirPA whilst monitoring it, advantageous in inter-vention studies19 28 but problematic for observa-tional studies. This has not been tested empirically.Accelerometers are expensive, approximately $350/£175/J230. Dual-mode accelerometers (e.g.Actigraph: Actigraph, LLC Florida 32502 USA.Actigraph. 2008. www.theactigraph.com) providesimultaneous, time-stamped activity count andstep-count measurements. Those using acceler-ometers have reported step-counts as a simple
Original article
442 Br J Sports Med 2009;43:442–450. doi:10.1136/bjsm.2008.048033
group.bmj.com on May 22, 2011 - Published by bjsm.bmj.comDownloaded from

stable metric to monitor PA.29 The step-count function exactlycounts observed steps at all treadmill speeds, whereas ped-ometers may under-record at low speeds.12 Most PA in olderpeople is walking-based and hence activity counts and step-counts are likely to be highly correlated. Accelerometers havebeen used successfully to describe PA levels in small groups ofolder patients.17 19 27 A larger study of 163 volunteers aged 70 orover showed low PA levels and weak associations with qualityof life30 31 and a further study of 184 volunteers aged 65–85showed that depressive mood was associated with acceler-ometer-assessed step-count.32 However, no physical health,disability or anthropometric variables were presented in eitherstudy.31 32 There are no large population-based studies of olderpeople using accelerometers or pedometers, including physicalhealth, disability, psychological and anthropometric measures.
Our main objectives were to assess customary PA levelsmeasured objectively, using accelerometers, in a population-based sample of older people and to examine associations withother factors. A further objective was to assess whether wearingpedometers increases PA in those asked to maintain usual levels.
METHODSTarget populationCommunity-dwelling older people at least 65 years old, able towalk outside and registered with a general practice (primarycare centre) in Oxfordshire, United Kingdom.
Exclusion criteriaOne thousand, five hundred and twenty-nine patients aged atleast 65 were registered. Two hundred and seventy-three (18%)were excluded by computer record search and by generalpractitioner and district nurse examination of patient lists for:dementia (50), care home resident (28), terminally ill plusspouses (32), housebound (86), uncontrolled cardiac failure/unstable angina/recent myocardial infarction/angioplasty/cor-onary artery bypass (29), in another research study (48).
Sample size and selectionThis was a pilot study assessing objective PA levels in olderpeople. The pilot was also designed as a randomised controlledtrial to test the effect of two interventions on recruitment(questionnaire inclusion with the study invitation and tele-phone contact a week later). Random selection and randomisa-tion were performed at household level, to avoid contaminationof partners receiving different interventions. The requiredsample size was 560. Full details of these interventions andtheir recruitment effects have been reported.33
RecruitmentAll 560 patients were invited to participate in a study measuringcustomary PA levels for a week using accelerometers andpedometers. Invitations were sent out over 20 weeks fromSeptember 2006, allowing time for recruitment. 280 patientsselected at random also received a 12 page questionnaire withtheir invitation, assessing self-reported PA, health, disability andpsychosocial measures (table 1). A questionnaire is publishedonline only. Subjects were encouraged to reply, even if notparticipating in the PA study, allowing comparisons betweenparticipants and non-participants.
Baseline and objective PA assessmentParticipants completed the questionnaire if it had not beenrandomly sent with their invitation. Weight was assessed using
calibrated, sensitive scales, height measured with a wall-mounted tape measure and waist circumference assessed usinga constant-tension, spring-loaded tape and a standard techni-que. Participants were given an accelerometer (ActigraphGT1M, Fl, USA) to wear over the hip on a belt, all day fromwaking, for 7 days, only removing it for bathing or swimming.They were asked to maintain usual activities and record them ina log. Half of participants, selected at random, were additionallygiven a Yamax Digi-walker SW-200 pedometer to wear over theother hip, and recorded daily step-counts on their logs.
Follow-upParticipants were seen 7 or more days later, to allow 7 full days’recording. Accelerometer traces were checked using theActigraph-provided ActiLife Monitoring System, alongsideactivity logs.
Table 1 Details of questionnaire measures and sources
Questionnairemeasure Detail Reference
Self-reportedphysical activity
Seventeen-item Zutphen Physical ActivityQuestionnaire (including questions onfrequency and duration of walking, cycling,gardening, odd jobs, sporting activities,hobbies).
Caspersen et al199134
Added two questions on housework (light andheavy) frequency and duration from PASE(Physical Activity Scale for the Elderly).
Washburn et al199335
Added single question on dog-walking:
‘‘Do you walk a dog?’’
Functional ability/disability
Modified Townsend disability score. Nineitems assessing self-reported ability toperform everyday tasks. Score 0 if they canperform the task without difficulty, 1 for tasksthey have difficulty with, and 2 for tasks theyare unable to do alone (score range 0, nodisability to 18, severe disability).
MRC CognitiveFunction andAgeing Study199836
Depressivesymptoms
Fifteen-item Geriatric Depression Scale (GDS-15). Fifteen yes/no items, taking cut-point 4/5for high level of depressive symptoms.
D’Ath et al199437
General HealthLongstanding illnessLimitinglongstanding illness
Single questions Health Surveyfor England199838
Pain Two questions from MOS 36-item short formhealth survey
Ware JE,Sherbourne CD.199239
Chronic diseasescore
Adapted from self-reported checklist ofdoctor/nurse-diagnosed chronic medicalconditions used in Alameda County Study
Roberts RE et al199740
Loneliness Single question Tunstall J.195741
Exercise self-efficacy
Nine-item four-point Likert scale withresponses from ‘‘very sure’’ to ‘‘not at allsure’’. Mean score across nine itemscomputed; a higher score indicated greaterexercise-related self-efficacy.
Jette et al199842*
Exercise control Six-item five-point Likert scale withresponses from ‘‘strongly agree’’ to ‘‘stronglydisagree’’. The mean score across items wascomputed, with a higher score indicatinggreater perceived control.
Jette et al199842*
Exercise attitudes Four-item five-point Likert scale withresponses from ‘‘strongly agree’’ to ‘‘stronglydisagree’’. The mean score across items wascomputed, with a higher score indicating amore positive attitude about exercise.
Jette et al199842*
*From Strong for Life programme, available on website http://www.brandeis.edu/projects/lifespan/scales.html
Original article
Br J Sports Med 2009;43:442–450. doi:10.1136/bjsm.2008.048033 443
group.bmj.com on May 22, 2011 - Published by bjsm.bmj.comDownloaded from

Data managementActivity was recorded using 5 second epochs. Participants withless than 5 days of data were excluded. Cut-points were used todistinguish between different PA levels: sedentary ,200 count/min, light 200–1999 count/min, moderate 2000–3999 count/min, vigorous >4000 count/min.30
Outcome measuresAverage accelerometer daily step-count was chosen as the mainobjective PA outcome, as walking is the predominant PA in thisage group and step-counts give readily understandable effectestimates. Average daily activity counts were also analysed, aswas the proportion of time spent in different PA levels and thenumber of minutes spent weekly in at least moderate PA, in atleast 10 minute bouts.
AnalysisThe effects of age and sex on study participation were examinedusing logistic regression (STATA 9) while allowing for house-hold clustering using the ‘‘cluster’’ option. The correlationbetween average daily step-counts and activity counts wasestimated. Associations between average daily step-counts andother factors were examined using linear regression, givingcrude estimates and then adjusting for structural factors (age,sex, pedometer use and household clustering). General healthand disability were strongly associated with daily step-counts,so adjustment for these factors was performed. Backwardstepwise linear regression (p,0.05) identified those factorsindependently associated with average daily step-counts.(Structural factors were locked into the model.) The analyseswere repeated using average daily activity count as the outcome.The associations between self-reported PA measures andaverage daily step-count were also analysed using linearregression.
Step-count validationActivity logs of individuals recording average daily step-countslower than 2500 were examined alongside hourly accelerometerdata to see whether low step-counts were due to low PA levelsor to not wearing the accelerometer.
Ethical approvalOxfordshire REC A (reference no. 06/Q1604/94).
RESULTS
Response rate and participant/non-participant comparisonsOf 560 individuals randomly invited, 240 (43%) participated.Overall comparison of participants (n = 240) and non-partici-pants (n = 320), adjusted for age, sex and household clustering,found that men participated more (OR 1.4 (1.1 to 1.8)), butfound no association with age (baseline age 65–69 OR 1, age 70–79 OR 0.8 (0.5 to 1.1), age 80 or over OR 0.8 (0.5 to 1.4)). Acomparison of non-participants who returned a questionnaire(n = 76) with participants (n = 240) found that participantsreported more PA than non-participants.43
FeasibilityAll participants wore the accelerometers and completed follow-up. Two records with less than 5 days’ data were excluded.Results are therefore based on 238 participants.
ValidationTwenty activity logs of participants averaging daily step-countslower than 2500 were examined. All reported wearing theaccelerometer and very low PA levels were recorded (e.g. resting,watching television), consistent with the low step-countsreported.
Distributions of outcome variablesFigure 1 shows the distributions of: (1) average daily step-counts, mean 6443 (95% CI 6032 to 6853); and (2) average dailyactivity counts, mean 224 963 (95% CI 209 419 to 240 506).These accelerometer outcomes were highly correlated (r = 0.95).
Mean percentage time spent in different PA levelsSedentary (including sleeping) 89.5% (89.0% to 89.9%); light8.1% (7.8% to 8.4%); moderate 1.8% (1.7% to 2.0%); vigorous0.6% (0.5% to 0.7%). Only 2.5% (6/238) participants achievedrecommended levels of at least 150 minutes/week (in at least10 minute bouts) and 61.8% (147/238) achieved none.
Step-count and structural variables (table 2)Men achieved higher average daily step-counts than women,after adjusting for structural variables, but not after adjustingfor disability and general health. There was a strong, graded
Figure 1 Distributions of average daily total step-counts and averagedaily total activity counts (both from accelerometers).
Original article
444 Br J Sports Med 2009;43:442–450. doi:10.1136/bjsm.2008.048033
group.bmj.com on May 22, 2011 - Published by bjsm.bmj.comDownloaded from
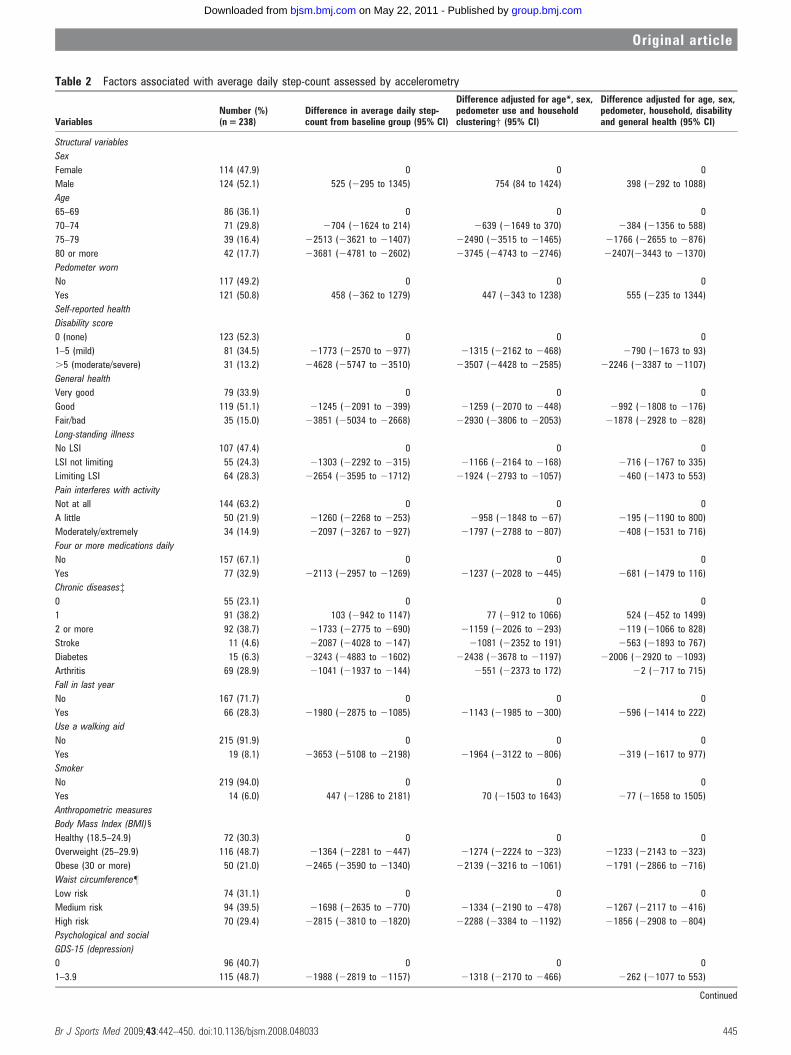
Table 2 Factors associated with average daily step-count assessed by accelerometry
VariablesNumber (%)(n = 238)
Difference in average daily step-count from baseline group (95% CI)
Difference adjusted for age*, sex,pedometer use and householdclustering{ (95% CI)
Difference adjusted for age, sex,pedometer, household, disabilityand general health (95% CI)
Structural variables
Sex
Female 114 (47.9) 0 0 0
Male 124 (52.1) 525 (2295 to 1345) 754 (84 to 1424) 398 (2292 to 1088)
Age
65–69 86 (36.1) 0 0 0
70–74 71 (29.8) 2704 (21624 to 214) 2639 (21649 to 370) 2384 (21356 to 588)
75–79 39 (16.4) 22513 (23621 to 21407) 22490 (23515 to 21465) 21766 (22655 to 2876)
80 or more 42 (17.7) 23681 (24781 to 22602) 23745 (24743 to 22746) 22407(23443 to 21370)
Pedometer worn
No 117 (49.2) 0 0 0
Yes 121 (50.8) 458 (2362 to 1279) 447 (2343 to 1238) 555 (2235 to 1344)
Self-reported health
Disability score
0 (none) 123 (52.3) 0 0 0
1–5 (mild) 81 (34.5) 21773 (22570 to 2977) 21315 (22162 to 2468) 2790 (21673 to 93)
.5 (moderate/severe) 31 (13.2) 24628 (25747 to 23510) 23507 (24428 to 22585) 22246 (23387 to 21107)
General health
Very good 79 (33.9) 0 0 0
Good 119 (51.1) 21245 (22091 to 2399) 21259 (22070 to 2448) 2992 (21808 to 2176)
Fair/bad 35 (15.0) 23851 (25034 to 22668) 22930 (23806 to 22053) 21878 (22928 to 2828)
Long-standing illness
No LSI 107 (47.4) 0 0 0
LSI not limiting 55 (24.3) 21303 (22292 to 2315) 21166 (22164 to 2168) 2716 (21767 to 335)
Limiting LSI 64 (28.3) 22654 (23595 to 21712) 21924 (22793 to 21057) 2460 (21473 to 553)
Pain interferes with activity
Not at all 144 (63.2) 0 0 0
A little 50 (21.9) 21260 (22268 to 2253) 2958 (21848 to 267) 2195 (21190 to 800)
Moderately/extremely 34 (14.9) 22097 (23267 to 2927) 21797 (22788 to 2807) 2408 (21531 to 716)
Four or more medications daily
No 157 (67.1) 0 0 0
Yes 77 (32.9) 22113 (22957 to 21269) 21237 (22028 to 2445) 2681 (21479 to 116)
Chronic diseases{0 55 (23.1) 0 0 0
1 91 (38.2) 103 (2942 to 1147) 77 (2912 to 1066) 524 (2452 to 1499)
2 or more 92 (38.7) 21733 (22775 to 2690) 21159 (22026 to 2293) 2119 (21066 to 828)
Stroke 11 (4.6) 22087 (24028 to 2147) 21081 (22352 to 191) 2563 (21893 to 767)
Diabetes 15 (6.3) 23243 (24883 to 21602) 22438 (23678 to 21197) 22006 (22920 to 21093)
Arthritis 69 (28.9) 21041 (21937 to 2144) 2551 (22373 to 172) 22 (2717 to 715)
Fall in last year
No 167 (71.7) 0 0 0
Yes 66 (28.3) 21980 (22875 to 21085) 21143 (21985 to 2300) 2596 (21414 to 222)
Use a walking aid
No 215 (91.9) 0 0 0
Yes 19 (8.1) 23653 (25108 to 22198) 21964 (23122 to 2806) 2319 (21617 to 977)
Smoker
No 219 (94.0) 0 0 0
Yes 14 (6.0) 447 (21286 to 2181) 70 (21503 to 1643) 277 (21658 to 1505)
Anthropometric measures
Body Mass Index (BMI)1
Healthy (18.5–24.9) 72 (30.3) 0 0 0
Overweight (25–29.9) 116 (48.7) 21364 (22281 to 2447) 21274 (22224 to 2323) 21233 (22143 to 2323)
Obese (30 or more) 50 (21.0) 22465 (23590 to 21340) 22139 (23216 to 21061) 21791 (22866 to 2716)
Waist circumference"
Low risk 74 (31.1) 0 0 0
Medium risk 94 (39.5) 21698 (22635 to 2770) 21334 (22190 to 2478) 21267 (22117 to 2416)
High risk 70 (29.4) 22815 (23810 to 21820) 22288 (23384 to 21192) 21856 (22908 to 2804)
Psychological and social
GDS-15 (depression)
0 96 (40.7) 0 0 0
1–3.9 115 (48.7) 21988 (22819 to 21157) 21318 (22170 to 2466) 2262 (21077 to 553)
Continued
Original article
Br J Sports Med 2009;43:442–450. doi:10.1136/bjsm.2008.048033 445
group.bmj.com on May 22, 2011 - Published by bjsm.bmj.comDownloaded from

association with increasing age and decreased PA, which wasreduced by adjustment for disability and general health, butremained significant. Those randomised to a pedometerachieved a higher daily step-count, but this did not reachstatistical significance at p = 0.05.
Step-count and self-reported health (table 2)Poorer health in the following variables was associated with areduced step-count: general health; disability; long-standingillness; pain; medication use; chronic disease; falls; and walkingaid use. Several variables showed a dose–response effect. Someindividual chronic diseases showed a negative association withdaily step-count (stroke, diabetes and arthritis), but only fordiabetes did this persist after adjustment. No association wasseen with smoking.
Step-count and anthropometric measures (table 2)Body mass index and waist circumference were stronglynegatively associated with daily step-count in a dose–responsemanner.
Step-count and psychological and social measures (table 2)Depression score was inversely associated with step-count, butnot after controlling for general health and disability. Attitudesto activity, exercise self-efficacy and belief in control overexercise were all positively related to step-count in a dose–response manner. Living alone and loneliness were not related.
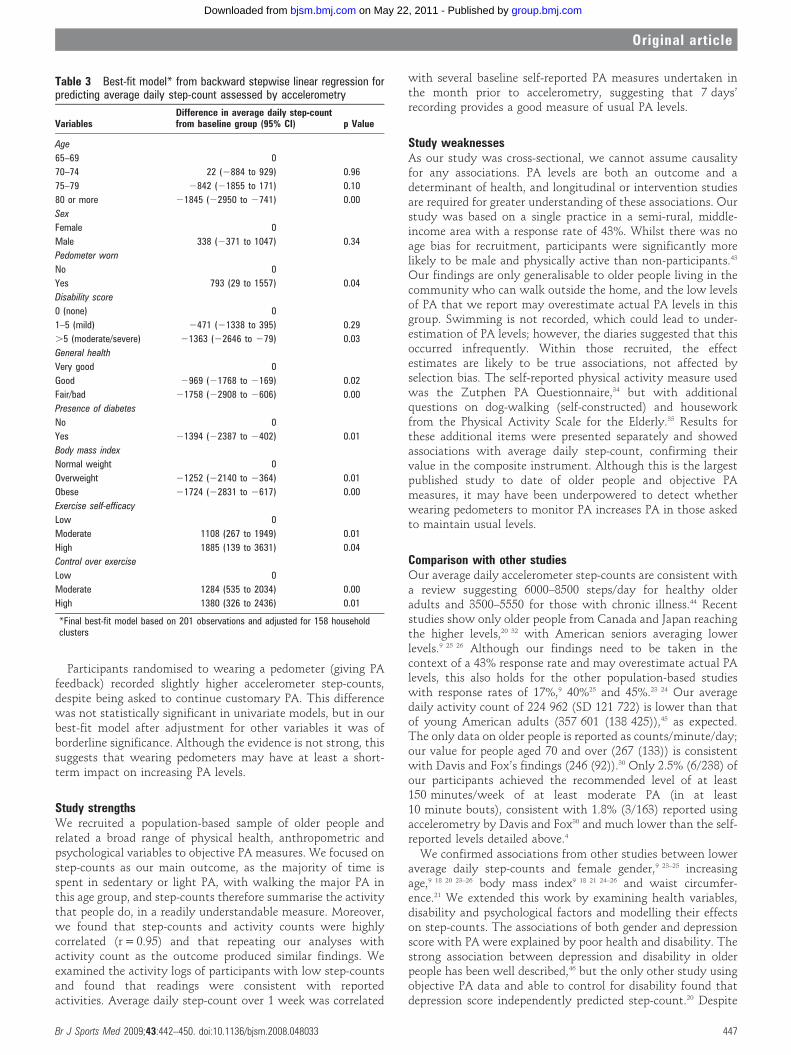
Model of factors predicting average daily step-count (table 3)Step-count was lower with increasing age, greater disability,poorer general health, a high body mass index and diabetes.Higher levels of exercise self-efficacy and stronger exercisecontrol beliefs independently predicted higher step-counts. In
the model, after controlling for other factors, wearing apedometer had a borderline effect on increasing step-count.
Model of factors predicting average daily activity count(supplementary table)Analyses using average daily activity count as the outcomeshowed very similar associations in direction and strength as forstep-counts (data not shown). Modelling showed that the samefactors predicted both outcomes, except that self-efficacy andpedometer use were not significant at p = 0.05 for activitycount.
Comparison of objective (accelerometer) and self-reported PAmeasures (table 4)Most self-reported PA measures were associated with averagedaily step-counts in the predicted direction; several showeddose–response relationships. The strongest associations werewith number of long walks, comparative activity level and dog-walking.
DISCUSSION
Main study findingsThis is the first moderately sized population-based study ofolder people published to date with objective PA measures and abroad range of health, psychological and anthropometricvariables. It was feasible to monitor PA levels in community-dwelling older people for a week using accelerometers. Wefound low PA levels; only 2.5% achieved recommended levels,1 3
considerably lower than self-report.4 The following factorsindependently predicted lower accelerometer step-counts:increasing age, poor general health, disability, diabetes, higherbody mass index, low exercise self-efficacy and low perceivedexercise control.
Table 2 Continued
VariablesNumber (%)(n = 238)
Difference in average daily step-count from baseline group (95% CI)
Difference adjusted for age*, sex,pedometer use and householdclustering{ (95% CI)
Difference adjusted for age, sex,pedometer, household, disabilityand general health (95% CI)
4 or more 25 (10.6) 22692 (24042 to 21342) 21833 (23053 to 2614) 35 (21214 to 1284)
Attitudes to activity
Low 72 (31.4) 0 0 0
Moderate 95 (41.5) 1877 (967 to 2787) 1558 (736 to 2380) 1058 (231 to 1885)
High 62 (27.1) 3102 (2093 to 4111) 2611 (1580 to 3642) 1976 (967 to 2985)
Exercise self-efficacy
Low 84 (39.6) 0 0 0
Moderate 102 (48.1) 2214 (1342 to 3085) 1941 (1148 to 2734) 1546 (691 to 2402)
High 26 (12.3) 3748 (2420 to 5075) 3348 (1801 to 4894) 2512 (777 to 4247)
Control over exercise
Low 54 (23.4) 0 0 0
Moderate 114 (49.4) 2441 (1474 to 3409) 1963 (1167 to 27600 1609 (820 to 2398)
High 63 (27.3) 3453 (2367 to 4538) 2861 (1848 to 3874) 2257 (1261 to 3254)
Live alone
No 201 (85.2) 0 0 0
Yes 35 (14.8) 2655 (21819 to 508) 266 (21097 to 966) 2300 (21264 to 663)
Ever lonely
No 169 (71.9) 0 0 0
Yes 66 (28.1) 2304 (21228 to 618) 154 (2730 to 1039) 584 (2276 to 1445)
*Age – adjustment for age in five year age bands.{Household clustering – adjusted for 182 households.{Chronic disease – been told by a doctor or nurse that they have one or more of the following: angina, heart attack, stroke, high blood pressure, chronic bronchitis, asthma, diabetes,arthritis, cancer, depression, Parkinson’s disease.1Body Mass Index (BMI) calculated by dividing weight in kg by height in metres squared."Waist circumference: for men cut-offs low risk ,94 cm, medium risk >94–101.9 cm, high risk>102 cm; for women low risk ,80 cm, medium risk >80–87.9 cm, high risk>88 cm.
Original article
446 Br J Sports Med 2009;43:442–450. doi:10.1136/bjsm.2008.048033
group.bmj.com on May 22, 2011 - Published by bjsm.bmj.comDownloaded from
Participants randomised to wearing a pedometer (giving PAfeedback) recorded slightly higher accelerometer step-counts,despite being asked to continue customary PA. This differencewas not statistically significant in univariate models, but in ourbest-fit model after adjustment for other variables it was ofborderline significance. Although the evidence is not strong, thissuggests that wearing pedometers may have at least a short-term impact on increasing PA levels.
Study strengthsWe recruited a population-based sample of older people andrelated a broad range of physical health, anthropometric andpsychological variables to objective PA measures. We focused onstep-counts as our main outcome, as the majority of time isspent in sedentary or light PA, with walking the major PA inthis age group, and step-counts therefore summarise the activitythat people do, in a readily understandable measure. Moreover,we found that step-counts and activity counts were highlycorrelated (r = 0.95) and that repeating our analyses withactivity count as the outcome produced similar findings. Weexamined the activity logs of participants with low step-countsand found that readings were consistent with reportedactivities. Average daily step-count over 1 week was correlated
with several baseline self-reported PA measures undertaken inthe month prior to accelerometry, suggesting that 7 days’recording provides a good measure of usual PA levels.
Study weaknessesAs our study was cross-sectional, we cannot assume causalityfor any associations. PA levels are both an outcome and adeterminant of health, and longitudinal or intervention studiesare required for greater understanding of these associations. Ourstudy was based on a single practice in a semi-rural, middle-income area with a response rate of 43%. Whilst there was noage bias for recruitment, participants were significantly morelikely to be male and physically active than non-participants.43
Our findings are only generalisable to older people living in thecommunity who can walk outside the home, and the low levelsof PA that we report may overestimate actual PA levels in thisgroup. Swimming is not recorded, which could lead to under-estimation of PA levels; however, the diaries suggested that thisoccurred infrequently. Within those recruited, the effectestimates are likely to be true associations, not affected byselection bias. The self-reported physical activity measure usedwas the Zutphen PA Questionnaire,34 but with additionalquestions on dog-walking (self-constructed) and houseworkfrom the Physical Activity Scale for the Elderly.35 Results forthese additional items were presented separately and showedassociations with average daily step-count, confirming theirvalue in the composite instrument. Although this is the largestpublished study to date of older people and objective PAmeasures, it may have been underpowered to detect whetherwearing pedometers to monitor PA increases PA in those askedto maintain usual levels.
Comparison with other studiesOur average daily accelerometer step-counts are consistent witha review suggesting 6000–8500 steps/day for healthy olderadults and 3500–5550 for those with chronic illness.44 Recentstudies show only older people from Canada and Japan reachingthe higher levels,20 32 with American seniors averaging lowerlevels.9 25 26 Although our findings need to be taken in thecontext of a 43% response rate and may overestimate actual PAlevels, this also holds for the other population-based studieswith response rates of 17%,9 40%25 and 45%.23 24 Our averagedaily activity count of 224 962 (SD 121 722) is lower than thatof young American adults (357 601 (138 425)),45 as expected.The only data on older people is reported as counts/minute/day;our value for people aged 70 and over (267 (133)) is consistentwith Davis and Fox’s findings (246 (92)).30 Only 2.5% (6/238) ofour participants achieved the recommended level of at least150 minutes/week of at least moderate PA (in at least10 minute bouts), consistent with 1.8% (3/163) reported usingaccelerometry by Davis and Fox30 and much lower than the self-reported levels detailed above.4
We confirmed associations from other studies between loweraverage daily step-counts and female gender,9 23–25 increasingage,9 18 20 23–26 body mass index9 18 21 24–26 and waist circumfer-ence.21 We extended this work by examining health variables,disability and psychological factors and modelling their effectson step-counts. The associations of both gender and depressionscore with PA were explained by poor health and disability. Thestrong association between depression and disability in olderpeople has been well described,46 but the only other study usingobjective PA data and able to control for disability found thatdepression score independently predicted step-count.20 Despite
Table 3 Best-fit model* from backward stepwise linear regression forpredicting average daily step-count assessed by accelerometry
VariablesDifference in average daily step-countfrom baseline group (95% CI) p Value
Age
65–69 0
70–74 22 (2884 to 929) 0.96
75–79 2842 (21855 to 171) 0.10
80 or more 21845 (22950 to 2741) 0.00
Sex
Female 0
Male 338 (2371 to 1047) 0.34
Pedometer worn
No 0
Yes 793 (29 to 1557) 0.04
Disability score
0 (none) 0
1–5 (mild) 2471 (21338 to 395) 0.29
.5 (moderate/severe) 21363 (22646 to 279) 0.03
General health
Very good 0
Good 2969 (21768 to 2169) 0.02
Fair/bad 21758 (22908 to 2606) 0.00
Presence of diabetes
No 0
Yes 21394 (22387 to 2402) 0.01
Body mass index
Normal weight 0
Overweight 21252 (22140 to 2364) 0.01
Obese 21724 (22831 to 2617) 0.00
Exercise self-efficacy
Low 0
Moderate 1108 (267 to 1949) 0.01
High 1885 (139 to 3631) 0.04
Control over exercise
Low 0
Moderate 1284 (535 to 2034) 0.00
High 1380 (326 to 2436) 0.01
*Final best-fit model based on 201 observations and adjusted for 158 householdclusters
Original article
Br J Sports Med 2009;43:442–450. doi:10.1136/bjsm.2008.048033 447
group.bmj.com on May 22, 2011 - Published by bjsm.bmj.comDownloaded from

the study only including 15 subjects with diabetes, thisindependently predicted decreased step-count, even after con-trolling for body mass index, disability and general health. Asheet al20 did not find this and it has not been examined in mostother pedometer studies,9 21–23 25 26 but it fits with the wide bodyof work showing the importance of PA for both primaryprevention and management of diabetes47 and with the lowstep-counts reported in diabetes subjects.48 Psychological vari-ables were important: exercise control (perceived control overyour exercise levels) and exercise-related self-efficacy (belief inyour ability to exercise) both predicted step-count. This fitswith other work showing that control predicts exerciseadherence in older people42 and that the Chronic Disease self-efficacy scale predicted daily step-counts.20
Other studies have highlighted the importance of dog-walking for maintaining mobility in older people.49 We believethis is the first study objectively showing the effect that dog-walking can have, resulting in approximately 1700 further dailysteps, even after adjusting for confounders such as age, poorhealth and disability.
Implications for future workObjective PA measurement using accelerometers and ped-ometers is feasible and acceptable to older people and providesresearchers with a significant improvement in the characterisa-tion of PA. Although accelerometers have the advantage ofproviding time-stamped activity records for up to 21 dayswithout needing manual recording, they are expensive. Our
Table 4 Associations between self-reported PA measures and accelerometer average daily step-count
VariablesNumber (%)(n = 238)
Difference in average daily step-countfrom baseline group (95% CI)
Difference adjusted for age, sex,pedometer use and householdclustering (182 households) (95% CI)
Difference adjusted for age, sex,pedometer use, household,disability and general health (95%CI)
Total walking last week
None 37 (15.6) 0 0 0
Up to 2.5 h 95 (39.9) 216 (21192 to 1159) 71 (2788 to 930) 4 (2878 to 885)
.2.5 h 106 (44.5) 1919 (760 to 3077) 1861 (949 to 2773) 1563 (595 to 2532)
Walking pace
Slow 22 (9.4) 0 0 0
Average 99 (42.5) 1322 (224 to 2688) 442 (2638 to 1523) 2545 (21607 to 517)
Brisk 112 (48.1) 3802 (2460 to 5143) 2966 (1851 to 4079) 1591 (423 to 2760)
Single walk .1 h lastmonth?
None 102 (43.6) 0 0 0
1–2 times 46 (19.7) 2208 (1239 to 3177) 1719 (806 to 2632) 1127 (260 to 1993)
3 or more times 86 (36.8) 3727 (2927 to 4526) 3075 (2213 to 3937) 2570 (1722 to 3416)
Do you ride a bike?
No 186 (79.2) 0 0 0
Yes 49 (20.9) 881 (2132 to 1893) 191 (2783 to 1166) 22 (2974 to 969)
Average weekly gardening
None 23 (10.1) 0 0 0
Up to 3.5 hours 100 (43.9) 1662 (228 to 3096) 1263 (210 to 2315) 633 (2315 to 1582)
.3.5 hours 105 (46.1) 2516 (1088 to 3944) 1848 (791 to 2905) 990 (210 to 1990)
Odd jobs at home?
No 98 (41.4) 0 0 0
Yes 139 (58.7) 1197 (373 to 2021) 429 (2436 to 1294) 2101 (2968 to 764)
Average weekly heavyhousework
None 49 (22.5) 0 0 0
Up to 3.5 h 103 (47.3) 1470 (379 to 2563) 1233 (373 to 2093) 505 (2354 to 1365)
.3.5 h 66 (30.3) 1785 (575 to 2995) 1472 (396 to 2548) 919 (2144 to 1983)
Perspired last week?
Never 100 (43.9) 0 0 0
1–2 times 74 (32.5) 1396 (472 to 2320) 825 (270 to 1721) 299 (2581 to 1178)
3 or more times 54 (23.7) 2578 (1561 to 3596) 1780 (684 to 2877) 1334 (242 to 2425)
Participate in sport?
No 144 (61.8) 0 0 0
Yes 89 (38.2) 2095 (1561 to 3596) 1719 (953 to 2485) 1284 (555 to 2014)
Climb stairs regularly?
No 60 (28.2) 0 0 0
Yes 169 (73.8) 760 (2151 to 1672) 160 (2656 to 978) 222 (2496 to 939)
Comparative activity level
Less active/same 49 (20.8) 0 0 0
More active 115 (48.7) 2350 (1359 to 3342) 1955 (1122 to 2787 1537 (756 to 2318)
Far more active 72 (30.5) 3644 (2568 to 4721) 3043 (1983 to 4103) 2367 (1337 to 3397)
Do you walk a dog?
No 183 (78.5) 0 0 0
Yes 50 (21.6) 1903 (915 to 2891) 1786 (842 to 2730) 1670 (801 to 2598)
Original article
448 Br J Sports Med 2009;43:442–450. doi:10.1136/bjsm.2008.048033
group.bmj.com on May 22, 2011 - Published by bjsm.bmj.comDownloaded from

findings show that in older people step-counts and activitycounts are highly correlated and therefore cheaper pedometersmay be adequate for most observational studies in this agegroup. The strong independent relationships seen between bothdiabetes and obesity and decreased step-counts underline theimportance of continuing work in this area to try to increase PAin these groups.50 The associations between objective PAmeasures and psychological factors such as exercise self-efficacyand control suggest that their potential as possible mediators ofPA should be explored further in intervention studies to increasePA.
CONCLUSIONSThis is the first population-based sample of older people withobjective PA and anthropometric measures. PA levels in olderpeople are well below recommended levels, emphasising theneed to increase PA levels in this age group, particularly in thosewho are overweight/obese or have diabetes. The independenteffects of exercise self-efficacy and control on PA levels highlighttheir role as potential mediators for intervention studies.
Acknowledgements: We are grateful to all the partners, staff and patients ofSonning Common Health Centre, Oxfordshire, UK for their help and support with thisstudy. Thanks to Professor Ulf Ekelund, MRC Epidemiology Unit, Cambridge, UK forpermission to use MAH/UFFE software for preprocessing data.
Funding: Thames Valley Primary Care Research Partnership (WCRM03). The fundingbody played no part in any of the following: study design, data collection, dataanalysis, data interpretation, report writing, decision to submit for publication.
Competing interests: None.
REFERENCES1. Chief Medical Officer. At least five a week: evidence on the impact of physical
activity and its relationship to health. London: Department of Health, 2004.
2. Keysor JJ. Does late-life physical activity or exercise prevent or minimizedisablement? A critical review of the scientific evidence. Am J Prev Med2003;25:129–36.
3. World Health Organisation. Diet, nutrition and the prevention of chronic diseases.Geneva: World Health Organisation, 2003. World Health Organisation TechnicalReport Series 916.
4. National Centre for Social Research. Health Survey for England 2004. London:Department of Health, 2005.
5. King AC, Rejeski WJ, Buchner DM. Physical activity interventions targeting olderadults. A critical review and recommendations. Am J Prev Med 1998;15:316–33.
6. Rasinaho M, Hirvensalo M, Leinonen R, et al. Motives for and barriers to physicalactivity among older adults with mobility limitations. J Aging Phys Act 2007;15:90–102.
7. Simonsick EM, Guralnik JM, Fried LP. Who walks? Factors associated with walkingbehavior in disabled older women with and without self-reported walking difficulty.J Am Geriatr Soc 1999;47:672–80.
8. Tudor-Locke CE, Myers AM. Challenges and opportunities for measuring physicalactivity in sedentary adults. Sports Med 2001;31:91–100.
9. Tudor-Locke C, Ham SA, Macera CA, et al. Descriptive epidemiology of pedometer-determined physical activity. Med Sci Sports Exerc 2004;36:1567–73.
10. Bassett DR Jr, Cureton AL, Ainsworth BE. Measurement of daily walking distance-questionnaire versus pedometer. Med Sci Sports Exerc 2000;32:1018–23.
11. Tudor-Locke C. A preliminary study to determine instrument responsiveness tochange with a walking program: physical activity logs versus pedometers. Res Q ExercSport 2001;72:288–92.
12. Le Masurier GC, Lee SM, Tudor-Locke C. Motion sensor accuracy under controlledand free-living conditions. Med Sci Sports Exerc 2004;36:905–10.
13. Cyarto EV, Myers AM, Tudor-Locke C. Pedometer accuracy in nursing home andcommunity-dwelling older adults. Med Sci Sports Exerc 2004;36:205–9.
14. Crouter SE, Schneider PL, Bassett DR Jr. Spring-levered versus piezo-electricpedometer accuracy in overweight and obese adults. Med Sci Sports Exerc2005;37:1673–9.
15. Le Masurier GC, Sidman CL, Corbin CB. Accumulating 10,000 steps: does this meetcurrent physical activity guidelines? Res Q Exerc Sport 2003;74:389–94.
16. Tudor-Locke C, Bassett DR Jr. How many steps/day are enough? Preliminarypedometer indices for public health. Sports Med 2004;34:1–8.
17. Sieminski DJ, Cowell LL, Montgomery PS, et al. Physical activity monitoring inpatients with peripheral arterial occlusive disease. J Cardiopulm Rehabil 1997;17:43–7.
18. Strycker LA, Duncan SC, Chaumeton NR, et al. Reliability of pedometer data insamples of youth and older women. Int J Behav Nutr Phys Act 2007;4:4.
19. Talbot LA, Gaines JM, Huynh TN, et al. A home-based pedometer-driven walkingprogram to increase physical activity in older adults with osteoarthritis of the knee: apreliminary study. J Am Geriatr Soc 2003;51:387–92.
20. Ashe MC, Eng JJ, Miller WC, et al. Disparity between physical capacity andparticipation in seniors with chronic disease. Med Sci Sports Exerc 2007;39:1139–46.
21. Krumm EM, Dessieux OL, Andrews P, et al. The relationship between daily steps andbody composition in postmenopausal women. J Womens Health (Larchmt)2006;15:202–10.
22. Stel VS, Smit JH, Pluijm SM, et al. Comparison of the LASA Physical ActivityQuestionnaire with a 7-day diary and pedometer. J Clin Epidemiol 2004;57:252–8.
23. Sequeira MM, Rickenbach M, Wietlisbach V, et al. Physical activity assessmentusing a pedometer and its comparison with a questionnaire in a large populationsurvey. Am J Epidemiol 1995;142:989–99.
24. McCormack G, Giles-Corti B, Milligan R. Demographic and individual correlates ofachieving 10,000 steps/day: use of pedometers in a population-based study. HealthPromot J Austr 2006;17:43–7.
25. Bennett GG, Wolin KY, Puleo E, et al. Pedometer-determined physical activity amongmultiethnic low-income housing residents. Med Sci Sports Exerc 2006;38:768–73.
26. Wyatt HR, Peters JC, Reed GW, et al. A Colorado statewide survey of walking andits relation to excessive weight. Med Sci Sports Exerc 2005;37:724–30.
27. Ekelund U, Tingstrom P, Kamwendo K, et al. The validity of the Computer Scienceand Applications activity monitor for use in coronary artery disease patients duringlevel walking. Clin Physiol Funct Imaging 2002;22:248–53.
28. Bravata DM, Smith-Spangler C, Sundaram V, et al. Using pedometers to increasephysical activity and improve health: a systematic review. JAMA 2007;298:2296–304.
29. Esliger DW, Probert A, Gorber SC, et al. Validity of the actical accelerometer step-count function. Med Sci Sports Exerc 2007;39:1200–4.
30. Davis MG, Fox KR. Physical activity patterns assessed by accelerometry in olderpeople. Eur J Appl Physiol 2007;100:581–9.
31. Fox KR, Stathi A, McKenna J, et al. Physical activity and mental well-being in olderpeople participating in the Better Ageing Project. Eur J Appl Physiol 2007;100:591–602.
32. Yoshiuchi K, Nakahara R, Kumano H, et al. Yearlong physical activity and depressivesymptoms in older Japanese adults: cross-sectional data from the Nakanojo study.Am J Geriatr Psychiatry 2006;14:621–4.
33. Harris T, Victor C, Carey I, et al. Optimising recruitment into a study of physicalactivity in older people: a randomised controlled trial of different approaches. Age &Ageing 2008;37:659–65.
34. Caspersen CJ, Bloemberg BP, Saris WH, et al. The prevalence of selected physicalactivities and their relation with coronary heart disease risk factors in elderly men: theZutphen Study, 1985. Am J Epidemiol 1991;133:1078–92.
What is already known on this topic
c Physical activity (PA) is beneficial to older people’s health.c Self-report studies suggest that few older people meet
recommended PA guidelines, but they have not reliablymeasured walking, the predominant activity in this age group.
c Studies using motion sensors that reliably measure walking(pedometers or accelerometers) in this age group have beensmall, not population-based, or have lacked data on physicalhealth, disability, psychological, social and anthropometricmeasures.
What this study adds
c In a population-based sample of community-dwelling olderpeople, average daily step-count was 6443 (6032–6853) andwas independently predicted by age, general health, disability,diabetes, body mass index, exercise self-efficacy andperceived exercise control.
c Only 2.5% (6/238) of participants achieved the recommended150 minutes weekly of at least moderate-intensity activity inbouts of at least 10 minutes; 62% (147/238) achieved none.
c Objectively measured PA levels were well belowrecommended levels, emphasising the need to increase PAlevels in this age group, particularly in those who areoverweight/obese or have diabetes.
Original article
Br J Sports Med 2009;43:442–450. doi:10.1136/bjsm.2008.048033 449
group.bmj.com on May 22, 2011 - Published by bjsm.bmj.comDownloaded from

35. Washburn RA, Smith KW, Jette AM, et al. The Physical Activity Scalefor the Elderly (PASE): development and evaluation. J Clin Epidemiol1993;46:153–62.
36. McGee MA, Johnson A, Kay D. The Medical Research Council Cognitive Functioningand Ageing Study (MRC CFAS). The description of activities of daily living in fivecentres in England and Wales. Age & Ageing 1998;27:605–13.
37. D’Ath P, Katona P, Mullan E, et al. Screening, detection and management ofdepression in elderly primary care attenders. I: The acceptability and performance ofthe 15 item Geriatric Depression Scale (GDS15) and the development of shortversions. Fam Pract 1994;11:260–6.
38. Department of Health. Health Survey for England 1998. London: The StationeryOffice, 2000.
39. Ware JE, Sherbourne CD. The MOS 36-item short form health survey: conceptualframework and item selection. Med Care 1992;30:473–83.
40. Roberts RE, Kaplan GA, Shema SJ, et al. Prevalence and correlates of depression inan aging cohort: the Alameda County Study. J Gerontol B Psychol Sci Soc Sci1997;52:S252–S258.
41. Tunstall J. Old and Alone. London: Routledge and Kegan, 1957.42. Jette AM, Rooks D, Lachman M, et al. Home-based resistance training: predictors of
participation and adherence. Gerontologist 1998;38:412–21.
43. Harris TJ, Victor CR, Carey IM, et al. Less healthy, but more active: opposingselection biases when recruiting older people to a physical activity study throughprimary care. BMC Public Health 2008;27:182.
44. Tudor-Locke CE, Myers AM. Methodological considerations for researchers andpractitioners using pedometers to measure physical (ambulatory) activity. Res Q ExercSport 2001;72:1–12.
45. Tudor-Locke C, Ainsworth BE, Thompson RW, et al. Comparison of pedometer andaccelerometer measures of free-living physical activity. Med Sci Sports Exerc2002;34:2045–51.
46. Prince M, Harwood R, Thomas A, et al. A prospective population-based cohort studyof the effects of disablement and social milieu on the onset and maintenance of late-life depression. The Gospel Oak Project VII. Psychological Medicine 1998;28:337–50.
47. Warburton DE, Nicol CW, Bredin SS. Health benefits of physical activity: theevidence. CMAJ 2006;174:801–9.
48. Tudor-Locke CE, Bell RC, Myers AM, et al. Pedometer-determined ambulatoryactivity in individuals with type 2 diabetes. Diabetes Res Clin Pract 2002;55:191–9.
49. Thorpe RJ Jr, Simonsick EM, Brach JS, et al. Dog ownership, walking behavior, andmaintained mobility in late life. J Am Geriatr Soc 2006;54:1419–24.
50. Kirk AF, Mutrie N, Macintyre PD, et al. Promoting and maintaining physical activity inpeople with type 2 diabetes. Am J Prev Med 2004;27:289–96.
Original article
450 Br J Sports Med 2009;43:442–450. doi:10.1136/bjsm.2008.048033
group.bmj.com on May 22, 2011 - Published by bjsm.bmj.comDownloaded from
doi: 10.1136/bjsm.2008.0480332008
2009 43: 442-450 originally published online May 16,Br J Sports Med T J Harris, C G Owen, C R Victor, et al. objectively by accelerometry?activity in older people, assessed What factors are associated with physical
http://bjsm.bmj.com/content/43/6/442.full.htmlUpdated information and services can be found at:
These include:
References
http://bjsm.bmj.com/content/43/6/442.full.html#related-urlsArticle cited in:
http://bjsm.bmj.com/content/43/6/442.full.html#ref-list-1This article cites 45 articles, 8 of which can be accessed free at:
serviceEmail alerting
the box at the top right corner of the online article.Receive free email alerts when new articles cite this article. Sign up in
Notes
http://group.bmj.com/group/rights-licensing/permissionsTo request permissions go to:
http://journals.bmj.com/cgi/reprintformTo order reprints go to:
http://group.bmj.com/subscribe/To subscribe to BMJ go to:
group.bmj.com on May 22, 2011 - Published by bjsm.bmj.comDownloaded from