Copper Flat Mine Sierra County, New Mexico - EMNRD
296
Baseline Data Characterization Report for Copper Flat Mine Sierra County, New Mexico June 2012 Prepared for: New Mexico Copper Corporation Submitted to: Mining and Minerals Division New Mexico Energy, Minerals and Natural Resources Department Prepared by: with support from Parametrix, JSAI, Stetson Engineering, SRK, and Class One Technical Services
-
Upload
khangminh22 -
Category
Documents
-
view
1 -
download
0
Transcript of Copper Flat Mine Sierra County, New Mexico - EMNRD

Baseline Data Characterization Report for
Copper Flat Mine Sierra County, New Mexico
June 2012
Prepared for: New Mexico Copper Corporation Submitted to: Mining and Minerals Division New Mexico Energy, Minerals and Natural Resources Department
Prepared by:
with support from Parametrix, JSAI, Stetson Engineering, SRK, and
Class One Technical Services

New Mexico Copper Corporation Copper Flat Baseline Data Characterization Report
Copper Flat Mine i June 2012
Table of Contents List of Tables ........................................................................................................................................................... iv
List of Figures ......................................................................................................................................................... vi
List of Appendices .................................................................................................................................................. ix
Acronyms and Abbreviations .................................................................................................................................. x
1 Introduction ............................................................................................................................................... 1-1
2 Climate ....................................................................................................................................................... 2-1
2.1 Regional Climate ............................................................................................................................... 2-1
2.2 Observed Meteorology at the Mine Permit Area ............................................................................. 2-1
2.2.1 Precipitation.......................................................................................................................... 2-2 2.2.2 Temperature ......................................................................................................................... 2-2 2.2.3 Wind ...................................................................................................................................... 2-2 2.2.4 Relative Humidity.................................................................................................................. 2-3 2.2.5 Net Radiation ........................................................................................................................ 2-3 2.2.6 Barometric Pressure ............................................................................................................. 2-3 2.2.7 Evaporation ........................................................................................................................... 2-3 2.2.8 Data Capture ......................................................................................................................... 2-3
2.3 Observed Air Quality at the Mine Permit Area ................................................................................. 2-4
2.3.1 Site 1 PM10 Results ................................................................................................................ 2-4 2.3.2 Site 2 PM10 Results ................................................................................................................ 2-4
2.4 References ........................................................................................................................................ 2-4
3 Topography................................................................................................................................................ 3-1
4 Vegetation Survey Results ......................................................................................................................... 4-1
4.1 Introduction and Background ........................................................................................................... 4-1
4.2 Study Areas ....................................................................................................................................... 4-1
4.2.1 Copper Flat Mine Permit Area .............................................................................................. 4-1 4.2.2 Pipeline Corridor ................................................................................................................... 4-2 4.2.3 Las Animas Creek .................................................................................................................. 4-2 4.2.4 Percha Creek ......................................................................................................................... 4-2
4.3 Methodology .................................................................................................................................... 4-3
4.3.1 Copper Flat Mine Permit Area .............................................................................................. 4-3 4.3.2 Pipeline Corridor ................................................................................................................... 4-8 4.3.3 Arizona Sycamores at Las Animas Creek .............................................................................. 4-8 4.3.4 Percha Creek ....................................................................................................................... 4-11
4.4 Baseline Data Results ...................................................................................................................... 4-11
4.4.1 Copper Flat Mine Permit Area ............................................................................................ 4-11 4.4.2 Pipeline Corridor ................................................................................................................. 4-22

New Mexico Copper Corporation Copper Flat Baseline Data Characterization Report
Copper Flat Mine ii June 2012
4.4.3 Arizona Sycamores at Las Animas Creek ............................................................................ 4-22 4.4.4 Percha Creek ....................................................................................................................... 4-25
4.5 References ...................................................................................................................................... 4-27
5 Wildlife Survey Results .............................................................................................................................. 5-1
5.1 Introduction ...................................................................................................................................... 5-1
5.2 Study Area ......................................................................................................................................... 5-1
5.2.1 Copper Flat Mine Permit Area .............................................................................................. 5-1 5.2.2 Off-Site Reference Areas ...................................................................................................... 5-2 5.2.3 Las Animas Creek, Percha Creek / Percha Box, and Isolated Springs ................................... 5-2
5.3 Methodology .................................................................................................................................... 5-3
5.3.1 Copper Flat Mine Permit Area .............................................................................................. 5-3 5.3.2 Off-Site Reference Areas ...................................................................................................... 5-6 5.3.3 Las Animas Creek, Percha Creek, Percha Box, and Isolated Springs .................................... 5-7
5.4 Baseline Data Results ........................................................................................................................ 5-8
5.4.1 Copper Flat Mine Permit Area .............................................................................................. 5-8 5.4.2 Off-Site Reference Areas .................................................................................................... 5-10 5.4.3 Las Animas Creek, Percha Creek, Percha Box, and Isolated Springs .................................. 5-11
5.5 References ...................................................................................................................................... 5-13
6 Topsoil Survey and Sampling Results ........................................................................................................ 6-1
6.1 Summary ........................................................................................................................................... 6-1
6.2 Order 2 Survey .................................................................................................................................. 6-1
6.3 Order 1 Survey .................................................................................................................................. 6-1
6.4 Determination of Suitability for Topdressing Material ..................................................................... 6-2
6.5 Laboratory Testing ............................................................................................................................ 6-2
6.6 Quantity of Suitable Material ........................................................................................................... 6-2
6.7 Tailing Discussion .............................................................................................................................. 6-2
6.8 References ........................................................................................................................................ 6-2
7 Geology ...................................................................................................................................................... 7-1
7.1 Regional Geologic Setting ................................................................................................................. 7-1
7.2 Geology of Copper Flat Mine Site ..................................................................................................... 7-1
7.2.1 Stratigraphy .......................................................................................................................... 7-1 7.2.2 Structure ............................................................................................................................... 7-2
7.3 Description of the Ore Body ............................................................................................................. 7-3
7.3.1 Structure and Model ............................................................................................................. 7-3 7.3.2 Mineralization ....................................................................................................................... 7-4
7.4 Copper Flat Material Types ............................................................................................................... 7-5

New Mexico Copper Corporation Copper Flat Baseline Data Characterization Report
Copper Flat Mine iii June 2012
7.5 Geochemical Characterization .......................................................................................................... 7-6
7.5.1 Overview of Current and Historic Geochemical Characterization Programs ....................... 7-6 7.5.2 Geochemical Characterization Program Summary ............................................................... 7-8 7.5.3 Ongoing Geochemical Assessments ................................................................................... 7-11
7.6 References ...................................................................................................................................... 7-11
8 Surface Water and Groundwater Information .......................................................................................... 8-1
8.1 Surface Water ................................................................................................................................... 8-1
8.1.1 Introduction .......................................................................................................................... 8-1 8.1.2 Surface Water Sampling and Analysis by Drainage Basin ..................................................... 8-1
8.2 Groundwater .................................................................................................................................. 8-17
8.2.1 Objective of Baseline Data Collection Program .................................................................. 8-17 8.2.2 Regional Hydrogeology ....................................................................................................... 8-17 8.2.3 Hydrogeology of the Permit Area Locality .......................................................................... 8-20 8.2.4 Groundwater Data .............................................................................................................. 8-21 8.2.5 Baseline Hydrologic Consequences from Existing Operations and Reclamation ............... 8-33 8.2.6 Probable Hydrologic Consequences from Proposed Operations and Reclamation ........... 8-34 8.2.7 Ongoing Groundwater Monitoring ..................................................................................... 8-36 8.2.8 References .......................................................................................................................... 8-37
9 Prior Mining Operations ............................................................................................................................ 9-1
9.1 Mining History .................................................................................................................................. 9-1
9.2 Surface Features of the Copper Flat Mine ........................................................................................ 9-1
9.3 Historical Investigations .................................................................................................................... 9-2
9.4 Prior Mining Operations ................................................................................................................... 9-2
9.5 References ........................................................................................................................................ 9-3
10 Cultural Resources – Summary ................................................................................................................ 10-1
10.1 Interpretive Summary ..................................................................................................................... 10-1
10.2 Eligibility and Management Summary ............................................................................................ 10-2
10.3 References ...................................................................................................................................... 10-4
11 Present and Historic Land Use ................................................................................................................. 11-1
11.1 Present Land Use ............................................................................................................................ 11-1
11.1.1 Land Planning and Regional Land Use ................................................................................ 11-1 11.1.2 Current Land Use and Structures at Mine Permit Area ...................................................... 11-1
11.2 Historic Land Use ............................................................................................................................ 11-2
11.3 Soil Survey ....................................................................................................................................... 11-3
11.4 References ...................................................................................................................................... 11-3

New Mexico Copper Corporation Copper Flat Baseline Data Characterization Report
Copper Flat Mine iv June 2012
List of Tables Table 2-1 Copper Flat Met 1 Monthly Precipitation Totals October 2010 through September 2011 Table 2-2 Copper Flat Met 1 Monthly Temperature Summaries October 2010 through September 2011
10-Meter Table 2-3 Copper Flat Met 1 Monthly Temperature Summaries October 2010 through September 2011
2-Meter Table 2-4 Copper Flat Met 1 Monthly Wind Speed Summaries October 2010 through September 2011 Table 2-5 Copper Flat Met 1 Wind Summary Report Wind Direction 10m versus Wind Speed 10m
October 2010 through September 2011 Table 2-6 Copper Flat Met 1 Monthly Relative Humidity Summaries October 2010 through September
2011 Table 2-7 Copper Flat Met 1 Monthly Net Radiation Summaries October 2010 through September 2011 Table 2-8 Copper Flat Met 1 Monthly Barometric Pressure Summaries October 2010 through September
2011 Table 2-9 Copper Flat Met 1 Net Evaporation Summary October 2010 through September 2011 Table 2-10 Copper Flat Met 1 Data Capture Summary October 2010 through September 2011 Table 2-11 Copper Flat PM10 24-Hour Average PM10 Concentrations October 2010 through September
2011 Site 1 Table 2-12 Copper Flat PM10 24-Hour Average Standard PM10 Concentrations October 2010 through
September 2011 Site 2 Table 2-13 Copper Flat Met 1 Percent Data Capture by Quarter October 2010 through September 2011 Table 4-1 Total Acreage and Measurement Transects of Sampling Strata in Copper Flat Mine Permit Area Table 4-2 Copper Flat Mine Permit Area Vegetation Transect Location Table 4-3 Hink and Ohmart (H&O) Structure Types Table 4-4 Hink and Ohmart (H&O) Species Acronyms Table 4-5 Mean Lifeform Cover in Copper Flat Mine Permit Area Strata Table 4-6 Mean Primary Production (lbs/acre) in Copper Flat Mine Permit Area Strata Table 4-7 Mean Woody Plant Density (plants/acre) in Copper Flat Mine Permit Area Strata Table 4-8 Copper Flat Mine Permit Area Plant Species List Table 4-9 General Shannon-Weiner (S-W) Index Results Based on Percent Cover for Copper Flat Mine
Permit Area Strata Table 4-10 Species Richness Based on Species Intercepts at Cover Transects for Copper Flat Mine Permit
Area Strata Table 4-11 Number of Transects Required to Meet Sample Adequacy (as ± 10% of the mean) for Copper
Flat Mine Permit Area Strata Table 4-12 Threatened, Endangered, and Plant Species of Concern with Occurrences in Sierra County Table 4-13 Structure Type Acreage in the Detailed Arroyo/Riparian Mapping for the Permit Area Study
Site Table 4-14 Summary of the Acres in which Species were Considered (Co-) Dominants in the Detailed
Arroyo/Riparian Mapping for the Permit Area Study Site Table 4-15 Plant Species Encountered in the Pipeline Corridor Table 4-16 Structure Type Acreage in the Detailed Arroyo/Riparian Mapping for the Las Animas Creek
Study Site Table 4-17 Summary of the Acres in which Species were Considered (Co-) Dominants in the Detailed
Arroyo/Riparian Mapping for the Las Animas Creek Study Site

New Mexico Copper Corporation Copper Flat Baseline Data Characterization Report
Copper Flat Mine v June 2012
Table 4-18 Height, Diameter Breast Height, and Condition of Arizona Sycamore Reference Trees in the Las Animas Creek Study Area
Table 4-19 Structure Type Acreage in the Detailed Arroyo/Riparian Mapping for the Percha Creek Study Site
Table 4-20 Summary of the Acres in which Species were Considered (Co-) Dominants in the Detailed Arroyo/Riparian Mapping for the Percha Creek Study Site
Table 5-1 Listed and Sensitive Species with Known Occurrence or Habitat at Copper Flat Mine Permit Area, Las Animas Creek, or Percha Creek
Table 5-2 Bird Species Recorded by Habitat at the Copper Flat Mine Permit Area Table 5-3 Bird Species Recorded or Likely Present at Copper Flat Mine Permit Area, Las Animas Creek,
and Percha Creek Table 5-4 Mammal Species Recorded or Likely Present at Copper Flat Mine Permit Area, Las Animas
Creek, and Percha Creek Table 5-5 Number and Diversity of Small Mammals Trapped in Copper Flat Mine Permit Area and
Reference Areas, Standardized to Animals per 100 Trap Nights Table 5-6 Bat Species Detected by Habitat at Copper Flat Mine Permit Area and Reference Areas Table 5-7 Reptiles Observed or Possibly Occurring at Copper Flat Mine Permit Area, Reference Areas, Las
Animas Creek, and Conchas Creek Table 6-1 Soil and Site Evaluation as Source for Topdressing, Copper Flat Mine, New Mexico Table 7-1 Stratigraphy of the Copper Flat Area Table 7-2 Major Material Types in Proposed Copper Flat Mining Project Table 8-1 Historical Flow and Water Quality Parameters Table 8-2 Las Animas Creek Stream Flow Calculations from 1996 through 1998 near LAC-E (ABC, 1998) Table 8-3 Las Animas Creek Stream Flow Calculations Collected on June 28, 2011 Table 8-4 Seepage Rates for the Measured Reaches of Las Animas Creek Table 8-5 Percha Creek Stream Flow Calculations Collected on June 29 and 30, 2011 Table 8-6 Seepage Rates for the Measured Reaches of Percha Creek Table 8-7 Pit Lake Water Depths Table 8-8 Geologic Units and Their Characteristics Table 8-9 Summary of Water Level Measurements Table 8-10 Summary of Quarterly Groundwater Monitoring Frequency by Well Table 8-11 Groundwater Quality Analytical Results Table 8-12 Descriptive Statistics of Historical Data Table 8-13 Descriptive Statistics of Baseline Data Table 8-14 Descriptive Statistics of All Historical and Baseline Data Combined Table 8-15 Wells Identified in the SAP for Sampling that Were Not Sampled as Part of the BDR Program Table 8-16 Summary of Hydraulic Properties Estimated from Wells in the Vicinity of the Tailing
Impoundment Table 8-17 Summary of 2011 Water Level Measurements Used for Developing the Groundwater Elevation
Contour Map Table 8-18 Measured Water Levels in Copper Flat Mine Pit Table 8-19 Identified Dissolved Constituents of Concern for the Pit Lake Table 8-20 Summary of Hydraulic Conductivity (Permeability) Estimates from Wells in the Vicinity of the
Pit and Waste Rock Piles Table 8-21 Proposed Monitoring Plan for Copper Flat Mine Area

New Mexico Copper Corporation Copper Flat Baseline Data Characterization Report
Copper Flat Mine vi June 2012
List of Figures Figure 1-1 Site Location Figure 2-1 Copper Flat Met 1 Precipitation Event Summary October 2010 through September 2011 Figure 2-2 Copper Flat Met 1 Precipitation Summary October 2010 through September 2011 Figure 2-3 Copper Flat Met 1 Hourly Two-Meter Temperature Summaries October 2010 through
September 2011 Figure 2-4 Copper Flat Met 1 Hourly Delta Temperature (10m-2m) Summary October 2010 through
September 2011 Figure 2-5 Copper Flat Met 1 Hourly Wind Speed Summary October 2010 through September 2011 Figure 2-6 Wind Direction vs Wind Speed Ten-Meter Level Copper Flat Met 1 2010 through September
2011 Figure 2-7 Copper Flat Met 1 Monthly Precipitation and Maximum Hourly Relative Humidity October
2010 through September 2011 Figure 2-8 Copper Flat Met 1 Hourly Net Radiation Summaries October 2010 through September 2011 Figure 2-9 Copper Flat Met 1 Hourly Barometric Pressure Summaries October 2010 through September
2011 Figure 2-10 Copper Flat Met 1 Net Evaporation Summary October 2010 through September 2011 Figure 2-11 Locations of the Particulate (PM10) and Meteorological Monitoring Stations Figure 3-1 Aerial Photograph of the Site Figure 3-2 Topographic Map of the Site and Surrounding Area Figure 3-3 2011 Aerial Survey with 5-Foot Contours Figure 3-4 Utility Corridor from Production Wells to Mine Site Figure 4-1 Vegetation Study Areas Figure 4-2 Copper Flat Permit Area Sampling Strata Figure 4-3 Monthly precipitation (inches) in 2010 compared to mean monthly precipitation from
1893-2011 in Hillsboro, NM Figure 4-4 Representative Field Photographs of the Chihuahuan Desert Grassland Stratum (CDG), Copper
Flat Mine Permit Area, 2010 Figure 4-5 Representative Field Photographs of the Chihuahuan Desert Shrubland Stratum (CDS), Copper
Flat Mine Permit Area, 2010 Figure 4-6 Representative Field Photographs of the Disturbed Area/Waste Rock Pile Stratum, Copper Flat
Mine Permit Area, 2010 Figure 4-7 Representative Field Photographs of the Tailing Dam Stratum (TD), Copper Flat Mine Permit
Area, 2010 Figure 4-8 Representative Field Photographs of the Pit Stratum, Copper Flat Mine Permit Area, 2010 Figure 4-9 Representative Field Photographs of Baccharis and/or Burro Bush Communities in the Copper
Flat Mine Permit Area, 2011 Figure 4-10 Representative Field Photographs of Cottonwood or Goodding’s Willow Communities in the
Copper Flat Mine Permit Area, 2011 Figure 4-11 Representative Field Photographs of Saltcedar Communities in the Copper Flat Mine Permit
Area, 2011 Figure 4-12 Representative Field Photographs of Isolated Wetland Plant Communities in the Copper Flat
Mine Permit Area, 2011 Figure 4-13 Representative Field Photographs of Isolated Arizona Sycamore Recruitment Observations in
the Las Animas Creek Study Area, 2011

New Mexico Copper Corporation Copper Flat Baseline Data Characterization Report
Copper Flat Mine vii June 2012
Figure 4-14 Representative Field Photographs of the Active Channel Condition in the Las Animas Creek Study Area, 2011
Figure 4-15 Representative Field Photographs of Arizona Sycamore Reference Trees in the Las Animas Creek Study Area, 2011
Figure 4-16 Representative Field Photographs of Baccharis Dominated Communities in the Percha Creek Study Area, 2011
Figure 4-17 Representative Field Photographs of Goodding's Willow Dominated Communities in the Percha Creek Study Area, 2011
Figure 4-18 Representative Field Photographs of Cottonwood Dominated Communities in the Percha Creek Study Area, 2011
Figure 4-19 Representative Field Photographs of Coyote Willow Dominated Communities in the Percha Creek Study Area, 2011
Figure 4-20 Representative Field Photographs of Little Walnut Dominated Communities in the Percha Creek Study Area, 2011
Figure 4-21 Representative Field Photographs of Siberian Elm and Tree of Heaven Dominated Communities in the Percha Creek Study Area, 2011
Figure 5-1 Wildlife Habitat Types at Copper Flat Mine Site Figure 5-2 Sonobat Sampling Locations Figure 5-3 Las Animas Creek Riparian Area Figure 5-4 Percha Creek Riparian Area Figure 5-5 Bird Transects at the Copper Flat Mine Site and Reference Areas Figure 5-6 Pellet Count Plot Locations at the Copper Flat Mine Site and Reference Areas Figure 5-7 Small Mammal Trapping Locations at the Copper Flat Mine Site and Reference Areas Figure 6-1 Copper Flat Mine Permit Area Currently Disturbed Areas August 2011 Figure 7-1 Regional Surface Geology Figure 7-2 Schematic Geologic Cross Section (A-A’) Figure 7-3 Geologic Structural Features of the Region Figure 7-4 Geologic Schematic of the Hillsboro Mining District, New Mexico Figure 7-5 Geologic Map of the Main Pit Area (Adapted from Dunn, 1984) Figure 7-6 Locations of Geologic Samples Figure 8-1 Map of Drainage Basins Figure 8-2 Las Animas Creek Drainage Basin with Sampling Locations Figure 8-3 Las Animas Creek Flow Chart Figure 8-4 Percha Creek Drainage Basin with Sampling Locations Figure 8-5 Percha Creek USGS Gauge, Maximum Flow 1957 - 2010 Figure 8-6 Percha Creek Flow Chart Figure 8-7 Greenhorn Arroyo Drainage Basin with Sampling Locations Figure 8-8 Bathymetric Map of Pit Lake with Water-Depth Measurement Locations Figure 8-9 Seasonal Pit Lake Profiles Figure 8-10 Map Showing Regional Geology Figure 8-11 Conceptual Model Figure 8-12 Map Showing Location of Crystalline Bedrock, Santa Fe Group Sediments, and Alluvial Aquifer
Zones Figure 8-13 Regional West to East Hydrogeologic Cross Section Figure 8-14 Regional December 2011 Groundwater Elevation Contours Figure 8-15 Geologic Map of Copper Flat Mine Permit Area Figure 8-16 Copper Flat Pit Area Hydrogeologic Cross Sections PA-PA’ and PX-PX’

New Mexico Copper Corporation Copper Flat Baseline Data Characterization Report
Copper Flat Mine viii June 2012
Figure 8-17 Copper Flat Tailing Impoundment Cross Section TA-TA’ Figure 8-18 Copper Flat Tailing Impoundment Cross Section TB-TB’ Figure 8-19 Aerial Photograph Showing Water-Level Elevation Contours and Direction of Groundwater
Flow for the Copper Flat Mine Pit Lake Area, Sierra County, New Mexico Figure 8-20 Baseline Monitoring Wells Figure 8-21 Regional Groundwater Wells Figure 8-22 Trends in Sulfate and Total Dissolved Solids in Well GWQ96-22A Figure 8-23 Trends in Metals in Well GWQ96-22A Figure 8-24 Trends in Sulfate and Total Dissolved Solids in Well GWQ96-23A Figure 8-25 Trends in Metals in Well GWQ96-23A Figure 8-26 Map of Project Area Showing Copper Flat Mine Permit Boundary, Water Supply Wells, and
Region of Baseline Groundwater Data Collection Figure 8-27 Aerial Photograph Showing Pumping and Observation Wells from Historic Pumping Test Figure 8-28 Trends in Sulfate and TDS in Well NP-2 Figure 8-29 Trends in Sulfate and TDS in Well NP-3 Figure 8-30 Trends in Sulfate and TDS in Well NP-4 Figure 8-31 Hydrograph Location Map Figure 8-32 Map of Artesian Well Inventory Figure 8-33 West to East Hydrogeologic Cross Section of Artesian Zone in Santa Fe Group Aquifer Figure 8-34 Map of Artesian Well Inventory Along Las Animas Creek Figure 8-35 Graph of Water Levels in Las Animas Creek Alluvial Aquifer and Underlying Regional Santa Fe
Group Aquifer Figure 8-36 Graph of Declining Flow from Artesian Wells Figure 8-37 Map Showing Locations of Existing Mine Pit, Waste-Rock Piles, and Tailing Impoundment,
Copper Flat Mine, Sierra County, New Mexico Figure 8-38 Map Showing Proposed Site Conditions within Copper Flat Mine Permit Area Figure 8-39 Map Showing Grid for Copper Flat Mine Regional Groundwater Flow Model Figure 8-40 Aerial Photograph Showing Pumping and Observation Wells Proposed for Pumping Test Figure 8-41 Copper Flat Mine Site Data Collection Figure 9-1 Disturbance from Prior Mining Operations

New Mexico Copper Corporation Copper Flat Baseline Data Characterization Report
Copper Flat Mine ix June 2012
List of Appendices Appendix 2-A Meteorological Monitoring Quarterly Reports Appendix 2-B Air Quality PM10 Monitoring Quarterly Reports Appendix 4-A Detailed Plant Cover Summaries by Stratum and Transect in the Copper Flat Mine
Permit Area Appendix 4-B Detailed Primary Plant Production Summaries by Stratum and Transect in the Copper Flat
Mine Permit Area Appendix 4-C Detailed Shrub Density Summaries by Stratum and Transect in the Copper Flat Mine
Permit Area Appendix 4-D Hink and Ohmart Vegetation Mapping in the Copper Flat Mine Permit Area Appendix 4-E Hink and Ohmart Vegetation Mapping in the Las Animas Creek Study Area Appendix 4-F Hink and Ohmart Vegetation Mapping in the Percha Creek Study Area Appendix 5-A Biological Resources Survey Report, Copper Flat Pipeline and Well Sites, Sierra County, New
Mexico Appendix 5-B Winter Bird Survey Report Appendix 6-A Copper Flat Mine Order 1 Soil Survey of Permit Area Appendix 7-A Geochemical Review of Waste Rock, Pit Lake Water Quality and Tailings (SRK 1996) Appendix 7-B Copper Flat Preliminary Waste Management Plan, New Mexico Copper Corporation
(NMCC June 2011) Appendix 7-C Copper Flat Static and Kinetic Test Recommendations (SRK Dec 2010) Appendix 7-D Copper Flat Geochemical Characterization Program (SRK Feb 2011) Appendix 7-E Copper Flat Geochemical Characterization Program Incorporation of the 1997 Static Test
Data (SRK Mar 2011) Appendix 7-F Copper Flat Kinetic Testwork Update (SRK July 2011) Appendix 8-A Surface Water and Seepage Measurement Location Field Data Appendix 8-B Seepage Study Report Appendix 8-C Surface Water Analytical Results Appendix 8-D Surface Sediment Analytical Results Appendix 8-E Pit Lake Analytical Results Appendix 8-F Pit Lake Sediment Analytical Results Appendix 8-G Water Level Data Appendix 8-H List of Inventoried Wells

New Mexico Copper Corporation Copper Flat Baseline Data Characterization Report
Copper Flat Mine x June 2012
Acronyms and Abbreviations °C degrees Celsius °F degrees Fahrenheit μg/m3 micrograms per cubic meter µS/cm microSiemen per centimeter ABA Acid Base Accounting amsl above mean sea level ANPP aboveground net primary production ARD acid rock drainage ARDML Acid Rock Drainage and Metal Leaching BDR Baseline Data Characterization Report BLM Bureau of Land Management CAW Class A weeds CBW Class B weeds CCW Class C listed weeds CDG Chihuahuan Desert Grassland CDS Chihuahuan Desert Shrubland CFQM Copper Flat Quartz Monzonite CFR Code of Federal Regulations cfs cubic feet per second COC contaminant of concern CWA Clean Water Act DA/WR Disturbed Area/Waste Rock dbh diameter at breast height DEIS draft environmental impact statement DO dissolved oxygen EC electrical conductivity EMNRD New Mexico Energy, Minerals and Natural Resources Department EPA United States Environmental Protection Agency ESD Ecological Site Description ft feet/foot gpm gallons per minute GPS Global Positioning System H&O Hink and Ohmart HCT humidity cell testing HSU hydrostratigraphic unit

New Mexico Copper Corporation Copper Flat Baseline Data Characterization Report
Copper Flat Mine xi June 2012
km kilometers lpm liters per minute m meters Ma million years ago mg/L milligrams per liter mm millimeters MMD New Mexico Mining and Minerals m/s meters per second MSF Middle Santa Fe Group hydrostratigraphic unit Mst million standard tons MWMP Meteoric Water Mobility Procedure NAD North American Datum NAG Net Acid Generation NAIP National Agricultural Improvement Program NMAC New Mexico Administrative Code NMCC New Mexico Copper Corporation NMED New Mexico Environment Department NMOSE New Mexico Office of the State Engineer NMRPTC New Mexico Rare Plant Technical Council NRCS Natural Resources Conservation Service NRHP National Register of Historic Places NWI National Wetlands Inventory PFEIS preliminary final environmental impact statement PHC probable hydrologic consequence Project Copper Flat Project Quintana Quintana Minerals Corporation RH relative humidity ROW right of way SAG mill semiautogenous mill SAP Sampling and Analysis Plan SHB Sergent, Hauskins, and Beckwith SHPO State Historic Preservation Officer Site Copper Flat Mine Permit Area SoF start of flow SRK SRK Consulting SWQB New Mexico Surface Water Quality Bureau S-W Index Shannon-Weiner Index TD Tailings Dam TDS total dissolved solids

New Mexico Copper Corporation Copper Flat Baseline Data Characterization Report
Copper Flat Mine xii June 2012
THEMAC THEMAC Resources Group Limited TP Tailings Pile USACE United States Army Corps of Engineers USF Upper Santa Fe Group hydrostratigraphic unit USFWS United States Fish and Wildlife Service USGS United States Geological Survey UTM Universal Transverse Mercator watts/m2 watts per square meter WETLab Western Environmental Testing Laboratory WQCC (New Mexico) Water Quality Control Commission

New Mexico Copper Corporation Copper Flat Baseline Data Characterization Report
Copper Flat Mine 1-1 Section 1: Introduction June 2012
1 Introduction The Copper Flat Project (Project) is the proposed re-establishment of a poly-metallic mine and processing facility near Hillsboro, New Mexico. The proposed Project would consist of an open pit mine, flotation mill, tailing impoundment, waste rock disposal areas, a low-grade ore stockpile, and ancillary facilities. The Project is owned and operated by the New Mexico Copper Corporation (NMCC), a wholly owned subsidiary of THEMAC Resources Group Limited (THEMAC).
The Project is located in Sierra County, New Mexico, approximately 30 miles southwest of Truth or Consequences and five miles northeast of Hillsboro (Figure 1-1). The Copper Flat Mine Permit Area can be reached by traveling south 15 miles from Truth or Consequences on Interstate Highway 25, then 12 miles west on New Mexico Highway 152. The Mine Permit Area lies two miles west-northwest from Highway 152 and is 2,190 acres in size.
Baseline data has been collected in the Mine Permit Area and in surrounding areas of interest since the late 1970s by various mining companies. Collected historic data provide a background and context for the data collected in 2010 and 2011 presented in this Baseline Data Report (BDR). This BDR is submitted to the New Mexico Energy, Minerals and Natural Resources Department (EMNRD) Mining and Minerals Division (MMD) by NMCC following the Sampling and Analysis Plan (SAP) (September 2010) per NMAC 19.10.6.602.D.(13). As required, data has been collected over a period of at least 12 months and in some cases, longer to allow for the evaluation of water quality and quantity, wildlife and wildlife habitat and vegetation in the Mine Permit Area and the vicinity. Baseline data were collected in the Copper Flat Mine Permit Area as well as surrounding areas deemed significant due to unique properties, proximity to the Mine Permit Area, and the real or perceived potential for sensitivity to mine operation and reclamation.
This report presents baseline data for these required categories governed by requirements, NMCC’s 2010 SAP, field conditions, agency comments and accessibility:
Climatological factors Topographic maps Vegetation Wildlife Topsoil Geology and ore body Surface water and groundwater Prior mining operations Cultural resources and known cemeteries and human burials Land use
Additional studies regarding potential impacts of mine operation and reclamation are planned and future reports will present findings for these investigations.
All baseline data collection was performed in compliance with the procedures defined in the NMCC 2010 SAP and the Quality Assurance Project Plan contained therein. Adjustments to the SAP necessary due to field conditions are noted herein. Additional information regarding the proposed Project is available in separate reports.

Figure

New Mexico Copper Corporation Copper Flat Baseline Data Characterization Report
Copper Flat Mine 2-1 Section 2: Climate June 2012
2 Climate
2.1 Regional Climate The Copper Flat Mine Permit Area lies within the belt of mid-latitude westerlies where the prevailing wind direction is from the west. Winds at the Truth or Consequences, New Mexico, airport, located about 30 miles northeast of the Mine Permit Area, are generally from the northwest; however, the Black Range and foothills cause local variations in the winds. At Copper Flat, the wind direction is predominantly west to east, and secondarily north to south. Local wind speeds average about 10 to 15 miles per hour, although winds in excess of 50 miles per hour may occur at times. Temperature inversions are rare at Copper Flat, but are more common farther east along the Rio Grande valley, especially during the winter months. Vertical air dilution is generally good because of the area’s high surface temperatures, creating strong daytime thermal mixing. Thermal mixing and moderate winds generally tend to suppress occasional nighttime inversions. The presence of higher winds and the lack of inversions contribute to a relatively clean atmosphere at the Mine Permit Area since any pollutants are readily mixed and dispersed (BLM, 1999).
Temperature data for the Mine Permit Area show a wide diurnal and seasonal variability, which is typical of dry climates. The warmest temperatures occur in June and July and the coldest temperatures usually occur in December and January. In spring and fall, daily maximum temperatures are moderate, typically averaging 65 to 85 degrees Fahrenheit (°F). Nights are cooler, with low temperatures averaging 32 to 50°F. Winter temperatures are frequently below freezing at night, but can be above 50°F during the day. During summer, temperatures can approach 100°F during the day. Daily temperature fluctuations of 30°F are common throughout the year (BLM, 1999).
Precipitation at the Mine Permit Area averages about 13 inches per year (ranging from nearly 3 inches in 1956 to over 20 inches in 1986). As much as half of the annual precipitation occurs in the form of intense thunderstorms during July, August, and September, when moist air enters the region from the Gulf of Mexico. Summer thunderstorms can result in heavy rainfall and flash floods. Average monthly precipitation in January through June is typically 0.50 inch or less. Snowfall is possible from October through April, but most likely (greater than 1 inch) between December through February (BLM, 1996).
Evaporation exceeds precipitation in southwestern New Mexico. Pan evaporation data, the most commonly collected data, are correlated with lake evaporation (i.e., free water surface evaporation) to predict evaporation from reservoirs and lakes. Lake evaporation at the Mine Permit Area is estimated to be approximately 58 to 65 inches per year, and pan evaporation is estimated to be approximately 80 to 90 inches per year (SRK, 1995).
2.2 Observed Meteorology at the Mine Permit Area New Mexico Copper Corporation installed a 10-meter meteorological tower on August 2, 2010, with full data collection beginning September 1, 2010. Wind direction, wind speed, sigma theta of wind direction, and temperature data are collected at the 10-meter level. Temperature, relative humidity, and solar radiation are collected at the 2-meter level. Delta temperature is measured between the 10-meter temperature and the 2-meter temperature. At the ground level, precipitation is collected as well as evaporation. The tower is located in the vicinity of the proposed mill site and tailings near Hillsboro, New Mexico. Quarterly reports are included as Appendix 2-A.
The PM10 samplers are BGI PQ200 units with United States Environmental Protection Agency (EPA) reference method designation. Site 1 is located at the meteorological tower and Site 2 is located at the west property boundary west of the mine pit. Air quality quarterly monitoring reports are included as Appendix 2-B.

New Mexico Copper Corporation Copper Flat Baseline Data Characterization Report
Copper Flat Mine 2-2 Section 2: Climate June 2012
Site Elevation (feet) UTM (N) UTM (E) Tower I 5,402 3650419 m 0265721 m PM10 Site 1 5,402 3650419 m 0265721 m PM10 Site 2 5,596 3651000 m 0262618 m Note: Coordinates were taken with a handheld Global Positioning System (GPS) in NAD83 Datum mode.
The remainder of Section 2.2 presents summary reports of the key meteorological parameters collected for the period October 1, 2010, through September 30, 2011. The project chose this time period to coincide with regular calendar quarters and to include the most recent data available for the months with the most complete data capture. All results are based on averages or totals (precipitation and evaporation).
2.2.1 Precipitation
The precipitation sensor is located at ground level and consists of a tipping bucket gauge representing 0.01 inches of rainfall per bucket tip.
Total precipitation for the year accumulated to 4.82 inches (Table 2-1). This total amount is significantly lower than the long-term average for the region, confirming the drought conditions observed for the fall, spring, and early of 2010 and 2011 (Figure 2-1).
Seventy-four (74) percent of the precipitation occurred during the summer season, represented by the months of June, July, and August. The total recorded precipitation during this period is 3.57 inches. The month with the greatest precipitation total is August at 3.12 inches (Figure 2-2). The driest three-month period corresponded to the spring months March, April, and May with 0.00 inches of recorded precipitation (Figure 2-2).
2.2.2 Temperature
Temperature sensors are located at the 10- and 2-meter levels (Tables 2-2 and 2-3). The probes are matched thermistors housed in fan-aspirated radiation shields. The matched thermistor set provides 10- and 2-meter temperature values as well as temperature flux over an 8-meter interval.
The mean annual 2-meter temperature is 19.5° C (67.1° F). The maximum annual 2-meter temperature of 37.7° C (99.9° F) occurred in the month of June (Figure 2-3). The minimum annual 2-meter temperature of -21.9° C (-7.4° F) occurred in the month of February. Hourly delta temperatures are shown in Figure 2-4.
2.2.3 Wind
Cup and vane wind speed and wind direction sensors are located at the 10-meter level. Data are in Table 2-4. All values reported here are based on one-hour averages. The starting threshold for the anemometer is 0.13 meters/second (m/s).
The mean annual wind speed is 5.3 m/s or 11.8 miles per hour. The maximum annual wind speed of 19.2 m/s occurred in the month of April. The minimum annual wind speed of 0.7 m/s first occurred in the month of December. April recorded the highest monthly average wind speed of 6.7 m/s. See Figure 2-5.
The prevailing wind direction for the year was from the west sector with a frequency of 14.1 percent (Figure 2-6). Winds from the west occurred 5.0 percent of the time in the >3.0 to 5.0 m/s range and 3.6 percent of the time in the >5.0 to 9.0 m/s range (Table 2-5).

New Mexico Copper Corporation Copper Flat Baseline Data Characterization Report
Copper Flat Mine 2-3 Section 2: Climate June 2012
The second most common wind direction occurred from the southwest with a frequency of 8.9 percent. The least common wind directions occurred from the northeast and east-northeast, each with a frequency of 2.3 percent.
2.2.4 Relative Humidity
Relative humidity is monitored at the 2-meter level. The probe is located in a gill plate naturally aspirated radiation shield.
The mean annual relative humidity is 26.6 percent (Table 2-6). The maximum annual relative humidity of 94.0 percent occurred in the month of September. The minimum annual relative humidity of 1.2 percent occurred in the months of May and June. August recorded the highest monthly average relative humidity of 40.9 percent. This value is consistent with August having the highest total monthly precipitation (Figure 2-7).
2.2.5 Net Radiation
Net radiation is monitored at the 2-meter level from a separate post located approximately 40 feet (ft) south of the tower (Table 2-7). The remote location avoids tower and guy wire shadows and reflections.
The mean annual net radiation value is 98 watts per square meter (watts/m2). The maximum annual net radiation of 664 watts/m2 occurred in the month of August. May and July recorded the highest monthly average, each with 126 watts/m2. December recorded the lowest monthly average at 20 watts/m2 (Figure 2-8).
2.2.6 Barometric Pressure
Barometric pressure is monitored at the 2-meter level. The sensor is located inside the datalogger enclosure and is vented to the atmosphere.
The mean annual barometric pressure is 844 mBars (Table 2-8). The maximum barometric pressure of 858 mBars occurred in the month of July. The minimum barometric pressure of 823 mBars occurred in the month of December (Figure 2-9).
2.2.7 Evaporation
Evaporation is monitored at ground level. The gauge outputs to the datalogger on a scale of 0 to 9 inches. The evaporation pan has an automatic fill device which re-fills the pan during night time hours on a pre-determined schedule. The pan was shut down for the winter months from November 10, 2010, through April 2, 2011.
The total measured annual evaporation is 62.53 inches (Table 2-9). Forty-eight (48) percent of the evaporation occurred during the summer season, represented by the months of June, July, and August. The total recorded evaporation during this period is 30.53 inches. The month with the greatest evaporation total is June at 14.25 inches (Figure 2-10).
2.2.8 Data Capture
The annual average percent data capture is 99.5 across all months and parameters (Table 2-10). Data capture rates for each parameter across all months exceeded 99 percent for the period with the exception of pan evaporation. All of this data loss is attributed to routine maintenance, field performance audits, and data missed in recovery.
Pan evaporation data capture ranged monthly from 89.8 percent (May 2011) to 97.4 percent (November 2010). Station percent data capture (Table 2-10 last column) assumed 100 percent data capture for the months of

New Mexico Copper Corporation Copper Flat Baseline Data Characterization Report
Copper Flat Mine 2-4 Section 2: Climate June 2012
December, January, February, and March, corresponding to the period of winter shut down for the evaporation pan. Likewise evaporation data capture for the partial months of November and April is based on days of actual attempted data collection prior to and following the winter shutdown.
2.3 Observed Air Quality at the Mine Permit Area New Mexico Copper Corporation currently operates an ambient particulate monitoring program consisting of two low-volume PM10 particulate samplers at the Copper Flat surface copper mine (Figure 2-11).
Each sampler runs once every six days for a full 24-hour period from midnight to midnight. All samplers run simultaneously. The sample run schedule is based on the national sample day schedule published by the EPA.
During quarterly sampler flow checks, flow rate is adjusted to be within 4 percent of 16.67 liters per minute (lpm) under ambient conditions. Ambient temperature and pressure taken at the time of the flow checks/adjustments are used to calculate a correction factor. The correction factor is used to calculate actual flow rates (QACT).
Actual flow rates are converted into standard flow rates (QSTD) at standard temperature (298 degrees Kelvin) and pressure (760 mm Hg). The filter weight gain is determined to be the difference between the unexposed filter weight and the exposed filter weight. Both QACT and QSTD together with net weight gain are used to determine the 24-hour particulate concentration in micrograms per cubic meter (μg/m3).
2.3.1 Site 1 PM10 Results
The average of all 24-hour PM10 concentrations for this period is 18.5 µg/m3 at Site 1. The maximum 24-hour PM10 concentration is 68 µg/m3 recorded on September 30, 2011 (Table 2-11).
Site 1 collected 58 out of an attempted 61 samples during the period from October 1, 2010, through September 30, 2011. This correlates to 95 percent data capture.
2.3.2 Site 2 PM10 Results
The average of all 24-hour PM10 concentrations for this period is 16.4 µg/m3 at Site 2. The maximum 24-hour PM10 concentration is 66 µg/m3 recorded on September 30, 2011 (Table 2-12).
Site 2 collected 58 out of an attempted 61 samples during the period from October 1, 2010, through September 30, 2011. This correlates to 95 percent data capture (Table 2-13).
2.4 References Bureau of Land Management (BLM), 1996, Draft environmental impact statement (DEIS), Copper Flat Project:
Las Cruces, N. Mex., U.S. Department of the Interior. Prepared by ENSR, Fort Collins, Colo.
Bureau of Land Management (BLM), 1999, Preliminary final environmental impact statement: Copper Flat project: Las Cruces, N. Mex. U.S. Department of the Interior, 491 p.
Steffen Robertson and Kirsten (U.S.), Inc. (SRK), 1995, Copper Flat Mine hydrogeological studies. Copper Flat, New Mexico: Steffen Robertson and Kirsten, Inc.

Tables

Table 2-1, Page 1 of 1
Table 2-1 Copper Flat Met 1
Monthly Precipitation Totals October 2010 through September 2011
Month Precipitation
(Inches) October 0.37
November 0.02
December 0.16
January 0.00
February 0.02
March 0.00
April 0.00
May 0.00
June 0.02
July 0.43
August 3.12
September 0.68
Total Precipitation 4.82

Table 2-2, Page 1 of 1
Table 2-2 Copper Flat Met 1
Monthly Temperature Summaries October 2010 through September 2011
10-Meter
Month Maximum Temp (deg C)
Minimum Temp (deg C)
Mean Temp (deg C)
October 28.2 6.9 17.6
November 23.1 -4.1 9.9
December 19.6 -8.0 9.3
January 21.1 -10.0 5.6
February 20.9 -20.9 6.0
March 25.5 2.7 15.0
April 27.8 3.1 17.7
May 32.7 2.5 19.6
June 36.1 16.9 27.6
July 33.8 18.7 26.6
August 34.7 17.9 26.3
September 31.7 12.8 22.5
Annual 36.2 -20.9 19.4

Table 2-3, Page 1 of 1
Table 2-3 Copper Flat Met 1
Monthly Temperature Summaries October 2010 through September 2011
2-Meter
Month Maximum Temp (deg C)
Minimum Temp (deg C)
Mean Temp (deg C)
October 29.4 5.8 17.4
November 24.3 -5.1 9.6
December 19.8 -8.2 8.8
January 21.0 -10.9 5.0
February 22.4 -21.9 5.7
March 26.6 2.0 14.8
April 29.6 3.3 18.0
May 34.4 2.3 19.8
June 37.7 16.2 27.8
July 35.3 18.7 27.0
August 35.8 17.8 26.4
September 33.0 12.5 22.5
Annual 37.7 -21.9 19.5

Table 2-4, Page 1 of 1
Table 2-4 Copper Flat Met 1
Monthly Wind Speed Summaries October 2010 through September 2011
Month Maximum Wind
Speed (m/s)
Minimum Wind Speed (m/s)
Mean Wind Speed (m/s)
October 14.0 0.8 4.2
November 15.7 1.1 5.2
December 19.0 0.7 3.9
January 12.5 0.9 3.8
February 16.3 0.7 5.5
March 17.5 0.8 5.4
April 19.2 1.1 6.7
May 16.6 0.9 6.2
June 16.2 0.9 5.8
July 13.3 0.9 4.6
August 12.9 0.9 4.5
September 11.6 0.9 4.4
Annual 19.2 0.7 5.3

Table 2-5, Page 1 of 1
Table 2-5 Copper Flat Met 1
Wind Summary Report Wind Direction 10m versus Wind Speed 10m
October 2010 through September 2011
WS CLASS N NNE NE ENE E ESE SE SSE S SSW SW WSW W WNW NW NNW TOTALS
CALM 0 0 0 0 0 0 0 0 0 0 0 0 0 0 0 0 0
0.5 TO 1.0 0.001 0 0 0 0 0 0 0 0 0 0 0 0 0.001 0 0 0.0038
>1.0 TO 3.0 0.013 0.009 0.007 0.012 0.014 0.018 0.017 0.011 0.008 0.009 0.009 0.019 0.042 0.035 0.022 0.016 0.2602
>3.0 TO 5.0 0.019 0.013 0.011 0.01 0.009 0.015 0.029 0.035 0.013 0.017 0.02 0.016 0.05 0.02 0.019 0.031 0.3276
>5.0 TO 9.0 0.025 0.011 0.004 0.001 0.001 0.004 0.015 0.028 0.015 0.022 0.036 0.033 0.036 0.022 0.021 0.035 0.31
>9.0 TO 15.0 0.004 0.002 0 0 0 0 0.001 0.003 0.003 0.011 0.022 0.023 0.013 0.006 0.004 0.004 0.0944 >15.0 TO
20.0 0 0 0 0 0 0 0 0 0 0.001 0.001 0.001 0 0 0 0 0.0039
>20.0 0 0 0 0 0 0 0 0 0 0 0 0 0 0 0 0 0
TOTAL 0.061 0.034 0.023 0.023 0.024 0.036 0.062 0.077 0.04 0.059 0.089 0.092 0.141 0.083 0.067 0.086

Table 2-6, Page 1 of 1
Table 2-6 Copper Flat Met 1
Monthly Relative Humidity Summaries October 2010 through September 2011
Month Maximum RH
(%) Minimum RH
(%) Mean RH
(%) October 88.1 8.6 37.9
November 72.9 8.1 28.3
December 93.9 7.2 37.1
January 68.5 9.8 33.5
February 82.5 3.1 31.8
March 61.3 2.4 18.8
April 54.5 2.4 16.5
May 62.2 1.2 16.5
June 54.7 1.3 12.5
July 85.7 12.0 35.7
August 90.9 8.2 40.9
September 94.0 10.7 37.7
Annual 94.0 1.2 26.6

Table 2-7, Page 1 of 1
Table 2-7 Copper Flat Met 1
Monthly Net Radiation Summaries October 2010 through September 2011
Month Maximum Net
Radiation (watts/m2)
Minimum Net Radiation (watts/m2)
Mean Net Radiation (watts/m2)
October 586 -153 60
November 419 -105 31
December 373 -105 20
January 432 -100 31
February 494 -106 53
March 559 -114 82
April 605 -118 110
May 628 -127 126
June 610 -195 118
July 656 -181 126
August 664 -176 111
September 610 -149 94
Annual 664 -195 98
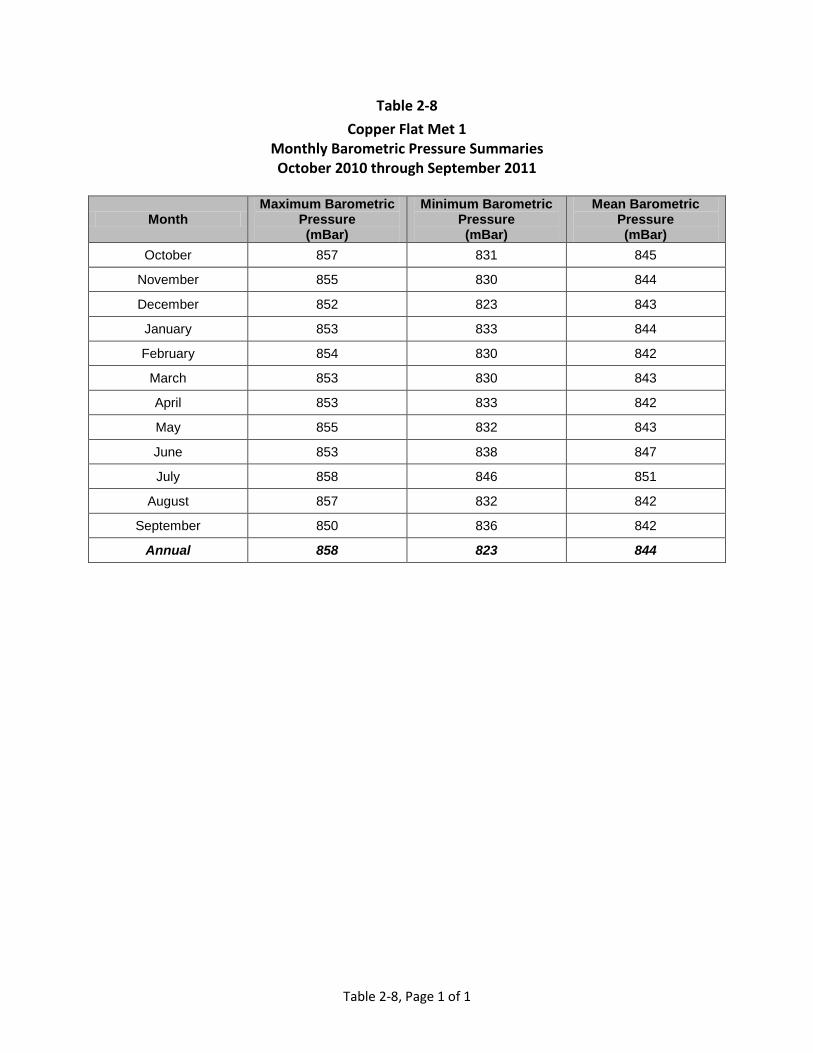
Table 2-8, Page 1 of 1
Table 2-8 Copper Flat Met 1
Monthly Barometric Pressure Summaries October 2010 through September 2011
Month Maximum Barometric
Pressure (mBar)
Minimum Barometric Pressure (mBar)
Mean Barometric Pressure (mBar)
October 857 831 845
November 855 830 844
December 852 823 843
January 853 833 844
February 854 830 842
March 853 830 843
April 853 833 842
May 855 832 843
June 853 838 847
July 858 846 851
August 857 832 842
September 850 836 842
Annual 858 823 844

Table 2-9, Page 1 of 1
Table 2-9 Copper Flat Met 1
Net Evaporation Summary October 2010 through September 2011
Month Monthly Net Evaporation
(inches) Cumulative Net Evaporation
(inches) October 3.959 3.959
November 1.152 5.111
December *** ***
January *** ***
February *** ***
March *** ***
April 9.562 14.673
May 11.146 25.819
June 14.249 40.069
July 10.339 50.407
August 5.938 56.345
September 6.181 62.526
Total 62.526
Note: Evaporation offline from 11/10/10 at 0900 through 04/02/2011 at 0700 for winter months.

Table 2-10, Page 1 of 1
Table 2-10 Copper Flat Met 1
Data Capture Summary October 2010 through September 2011
Month Wind Speed 10m
Wind Direction
10m
Sigma Theta 10m
Temp 10m
Temp 2m
Delta Temp
Relative Humidity
Net Radiation Precip Evaporation Barometric
Pressure Station
Pct
October 100.0 100.0 100.0 100.0 100.0 100.0 100.0 100.0 100.0 92.9 100.0 99.4
November 100.0 100.0 100.0 100.0 100.0 100.0 100.0 100.0 100.0 97.4 100.0 99.8
December 99.7 99.7 99.7 99.7 99.7 99.7 99.7 99.7 99.7 0.0 99.7 99.7
January 99.7 99.7 99.7 99.7 99.7 99.7 100.0 100.0 100.0 0.0 100.0 99.9
February 100.0 100.0 100.0 100.0 100.0 100.0 100.0 100.0 100.0 0.0 100.0 100.0
March 100.0 100.0 100.0 100.0 100.0 100.0 100.0 100.0 100.0 0.0 100.0 100.0
April 100.0 100.0 100.0 100.0 100.0 100.0 100.0 100.0 100.0 91.7 100.0 99.2
May 100.0 100.0 100.0 100.0 100.0 100.0 100.0 100.0 100.0 89.8 100.0 99.1
June 100.0 100.0 100.0 100.0 100.0 100.0 100.0 100.0 100.0 92.2 100.0 99.3
July 99.7 99.7 99.7 99.7 99.7 99.7 99.7 99.7 99.7 95.0 99.7 99.3
August 99.1 99.1 99.1 99.1 99.1 99.1 99.1 99.1 99.1 95.3 99.1 98.7
September 99.9 99.9 99.9 99.9 99.9 99.9 99.9 99.9 99.9 94.7 99.9 99.4
TOTALS 99.8 99.8 99.8 99.8 99.8 99.8 99.9 99.9 99.9 95.7 99.9 99.5
Note: Station percent data capture does not deduct for missing evaporation values during winter shut down. Evaporation data capture for November is based on attempted data collection from 11/1 through 11/10/10 prior to winter shutdown.
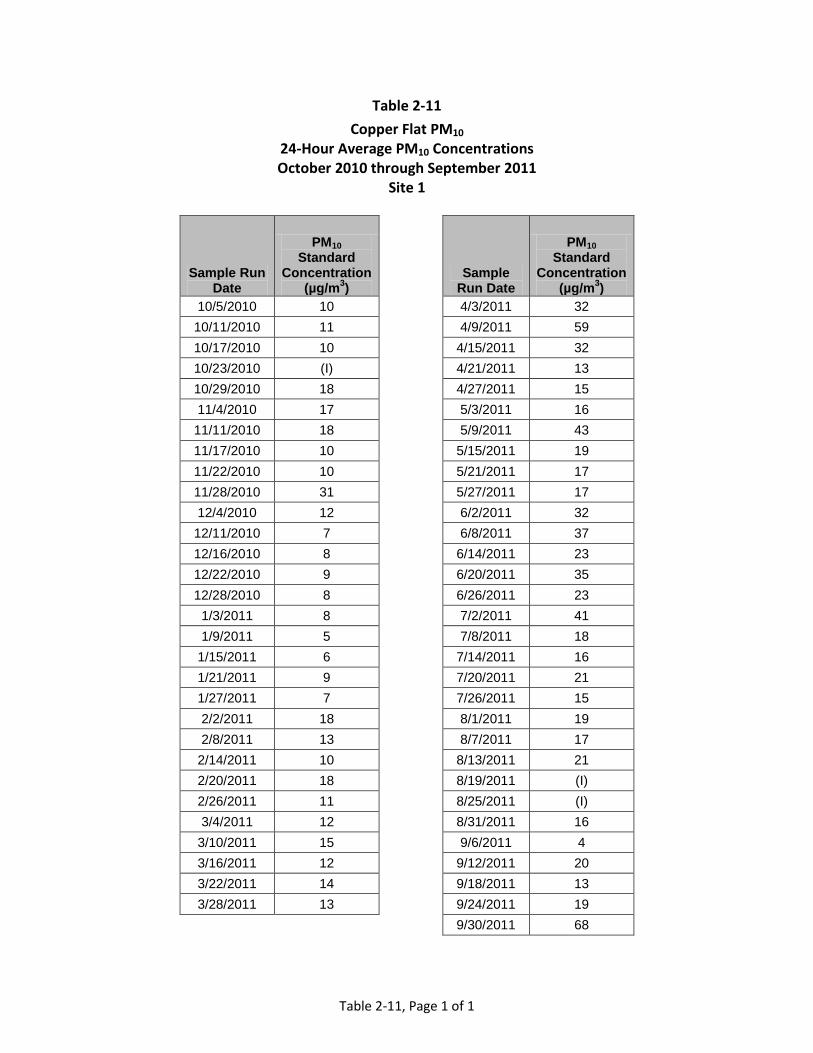
Table 2-11, Page 1 of 1
Table 2-11 Copper Flat PM10
24-Hour Average PM10 Concentrations October 2010 through September 2011
Site 1
Sample Run Date
PM10 Standard
Concentration (µg/m3)
Sample Run Date
PM10 Standard
Concentration (µg/m3)
10/5/2010 10 4/3/2011 32 10/11/2010 11 4/9/2011 59 10/17/2010 10 4/15/2011 32 10/23/2010 (I) 4/21/2011 13 10/29/2010 18 4/27/2011 15 11/4/2010 17 5/3/2011 16 11/11/2010 18 5/9/2011 43 11/17/2010 10 5/15/2011 19 11/22/2010 10 5/21/2011 17 11/28/2010 31 5/27/2011 17 12/4/2010 12 6/2/2011 32 12/11/2010 7 6/8/2011 37 12/16/2010 8 6/14/2011 23 12/22/2010 9 6/20/2011 35 12/28/2010 8 6/26/2011 23
1/3/2011 8 7/2/2011 41 1/9/2011 5 7/8/2011 18
1/15/2011 6 7/14/2011 16 1/21/2011 9 7/20/2011 21 1/27/2011 7 7/26/2011 15 2/2/2011 18 8/1/2011 19 2/8/2011 13 8/7/2011 17
2/14/2011 10 8/13/2011 21 2/20/2011 18 8/19/2011 (I) 2/26/2011 11 8/25/2011 (I) 3/4/2011 12 8/31/2011 16
3/10/2011 15 9/6/2011 4 3/16/2011 12 9/12/2011 20 3/22/2011 14 9/18/2011 13 3/28/2011 13 9/24/2011 19
9/30/2011 68

Table 2-12, Page 1 of 1
Table 2-12 Copper Flat PM10
24-Hour Average Standard PM10 Concentrations October 2010 through September 2011
Site 2
Sample Run Date
PM10 Standard Concentration
(µg/m3)
Sample Run Date
PM10 Standard
Concentration (µg/m3)
10/5/2010 9 4/3/2011 23 10/11/2010 8 4/9/2011 39 10/17/2010 9 4/15/2011 44 10/23/2010 7 4/21/2011 13 10/29/2010 52 4/27/2011 14 11/4/2010 15 5/3/2011 17 11/11/2010 3 5/9/2011 42 11/17/2010 11 5/15/2011 18 11/22/2010 7 5/21/2011 13 11/28/2010 19 5/27/2011 14 12/4/2010 12 6/2/2011 36 12/11/2010 5 6/8/2011 37 12/16/2010 10 6/14/2011 21 12/22/2010 29 6/20/2011 6 12/28/2010 (I) 6/26/2011 23 1/3/2011 (I) 7/2/2011 39 1/9/2011 6 7/8/2011 3 1/15/2011 6 7/14/2011 (I) 1/21/2011 10 7/20/2011 9 1/27/2011 8 7/26/2011 7 2/2/2011 11 8/1/2011 9 2/8/2011 13 8/7/2011 14 2/14/2011 11 8/13/2011 9 2/20/2011 14 8/19/2011 10 2/26/2011 10 8/25/2011 13 3/4/2011 1 8/31/2011 14 3/10/2011 15 9/6/2011 18 3/16/2011 12 9/12/2011 16 3/22/2011 13 9/18/2011 12 3/28/2011 11 9/24/2011 15
9/30/2011 66

Table 2-13, Page 1 of 1
Table 2-13 Copper Flat Met 1
Percent Data Capture by Quarter October 2010 through September 2011
Quarter Site 1 Site 2
4th Qtr 2010 93 93
1st Qtr 2011 100 93
2nd Qtr 2011 100 100
3rd Qtr 2011 88 94
Annual 95 95

Figures

Appendix 2-A Meteorological Monitoring Quarterly Reports

Appendix 2-B Air Quality PM10 Monitoring Quarterly Reports

New Mexico Copper Corporation Copper Flat Baseline Data Characterization Report
Copper Flat Mine 3-1 Section 3: Topography June 2012
3 Topography The topography of the Copper Flat Mine Permit Area and the surrounding area is shown at a scale of 1:24,000 (where 1 inch equals 2,000 ft) in Figures 3-1 and 3-2. The topography shown in Figure 3-2 is from the USGS quadrangle maps, which pre-date the 1982 Quintana mine disturbance. The current topography based on a 2011 aerial survey is presented as Figure 3-3. In addition to topography, each figure shows the boundary of the Mine Permit Area and the Copper Flat Mine office/Core building, which is within ½ mile of the permit boundary.
Figure 3-1 presents the site boundary overlain on a May 2011 aerial photograph taken by Cooper Aerial of Tucson, Arizona for NMCC. Disturbances from previous mining and mineral development activities, including roads, pit, waste dumps, tailings, a diversion channel, scraped and developed plant facilities areas, and other disturbed lands, are captured in this image.
Figure 3-2 presents the mine boundary superimposed on the Skute Stone Arroyo and Hillsboro USGS 7.5 minute quadrangle maps. The topography shown on Figure 3-2 pre-dates the surface disturbance created by the Quintana Minerals mining operations in the late 1970s and early 1980s. It is shown because it is the most current USGS quadrangle map of the area.
Figure 3-3 shows the topography as it exists as of the May 2011 aerial survey completed by Cooper Aerial. Five-foot contour intervals are included to provide detailed and current information regarding the topography for the Mine Permit Area and surrounding area. To capture the detail of the 5-ft contour intervals, this figure is presented at a scale larger than 1:24,000. The scale represented on Figure 3-3 is 1-in = 1,200-ft or approximately 1:14,460.
Figure 3-4 presents the pipeline corridor that connects NMCC’s production well field to the mine permit boundary. Due to the need to show the pipeline corridor, a scale larger than 1:24,000 is required as it is approximately 8 miles from the mine to production wells. The scale represented on Figure 3-4 is actually 1-in = 3,500-ft or approximately 1:42,170.

Figures

New Mexico Copper Corporation Copper Flat Baseline Data Characterization Report
Copper Flat Mine 4-1 Section 4: Vegetation Survey Results June 2012
4 Vegetation Survey Results
4.1 Introduction and Background Parametrix, Inc. was contracted by New Mexico Copper Corporation to assess vegetation conditions within the Copper Flat Mine Permit Area, as well as surrounding riparian habitats along Las Animas Creek and Percha Creek. This chapter summarizes the approach and results for characterizing or quantifying vegetation attributes throughout the study sites. The study approach implemented for this report was based on the vegetation section from the Copper Flat SAP (Parametrix, 2010a). Comments received from the state and federal agency reviewers were used to adjust and expand the methodology proposed in the SAP into the actual sampling approach that was implemented. Fieldwork in support of this document was completed by Parametrix botanists during several field sessions through the 2010 and 2011 growing seasons.
4.2 Study Areas Several areas of interest outside of the Copper Flat Mine Permit Area (sometimes referred to as “Permit Area” in this chapter) were identified by regulatory and management agencies in the SAP comments. Specific study locations outside of the Permit Area were Las Animas Creek and its riparian zone; Percha Creek, including Percha Box and riparian habitats therein; Warm Springs Canyon; and nearby cold- and warm-water springs and seeps. Unfortunately, the botanists were not granted access permission by private landowners for all of the areas of interest outside of the Permit Area. It was not possible to access Warm Springs Canyon, many of the springs and seeps surrounding the Permit Area, and Las Animas Creek on the Ladder Ranch during vegetation field work.
The study sites were located in the western half of Sierra County, New Mexico. The sampling method, intensity, and objective varied by location. For the purposes of clarifying the specific study approach and study results in particular areas, content throughout this chapter is organized according to sampling location. Areas surveyed in support of this report include (Figure 4-1):
Copper Flat Mine Permit Area; Pipeline Corridor; Riparian Habitats along Las Animas Creek; and Riparian Habitats along Percha Creek, including Percha Box.
4.2.1 Copper Flat Mine Permit Area
Under this report, the Copper Flat Mine Permit Area includes approximately 2,200 acres of Chihuahuan desert hills, much of which was previously disturbed during previous mining ventures. Mining activities and infrastructure constructed by the Copper Flat Partnership, ca. 1982, combined with previous mining-related activities, have contributed to the disturbance of approximately 690 acres within the Copper Flat Mine Permit Area (BLM, 1999); 358 acres is on public lands and 331 acres is estimated on private lands (according to disturbance acreages listed in BLM [1999]). New calculations by Parametrix (Parametrix, 2010a) designated a total disturbed area of 965 acres for the Permit Area, based on digitizing high-resolution 2009 aerial photography. The Permit Area was reclaimed in 1986, although it appears that active revegetation was inconsistent, patchy, and yielded variable results.
The history of repeated disturbance in the Permit Area has dramatically affected vegetation communities. Current vegetation community distribution in the mined areas is perhaps more strongly correlated with previous land use than with the biotic or abiotic factors that typically render the distribution of vegetation types or vegetation potential. The “baseline” vegetation condition for portions of the Permit Area include: a tailing dam,

New Mexico Copper Corporation Copper Flat Baseline Data Characterization Report
Copper Flat Mine 4-2 Section 4: Vegetation Survey Results June 2012
barren areas, various roads, a diversion channel, pit and pit lake, waste rock piles, prospector mining disturbance, grazing, and other disturbed areas. However, relatively intact vegetation communities are also still present within the Permit Area.
The proposed sampling and analysis approach was intended to capture the current vegetation attributes and conditions throughout the Permit Area. The study goals included
1. Delineate a current vegetation map stratified according to disturbance history and dominant vegetation type.
2. Describe specific vegetation attributes for plant communities delineated within the Permit Area through quantitative measurements of:
• Basal vegetation cover by species and ground cover, • Aerial vegetation cover by species, • Woody plant density, • Annual productivity, and • Plant species richness and diversity.
3. Complete a plant species inventory.
4. Perform a threatened or endangered species survey.
5. Conduct a noxious weed survey.
6. Complete a wetlands survey.
4.2.2 Pipeline Corridor
New Mexico Copper Corporation is in the process of exploring the feasibility of using an existing subsurface pipeline to fulfill the mine’s operational water needs. The pipeline runs from a well field approximately 8 miles off-site to the east into the Permit Area. A 100-foot-wide corridor (50 ft on either side of the underground pipe) was included in the vegetation survey. The pipeline corridor survey area was approximately 10 miles long. The corridor crosses through state, private, and Bureau of Land Management (BLM) property.
4.2.3 Las Animas Creek
Las Animas Creek, located in the Caballo Lake watershed, lies approximately 4 miles north of the Permit Area and contains variable stream flow. The creek has ephemeral, intermittent, and perennial reaches along approximately 40 total river miles. The Las Animas Creek study area fell entirely on private land. Ladder Ranch did not grant access permission for this study; as a result, the study area for Las Animas Creek includes the riparian habitats along approximately 7 river miles of the creek from the eastern Ladder Ranch boundary to Interstate Highway 25.
4.2.4 Percha Creek
Percha Creek lies approximately 2 miles south of the Permit Area, and like Las Animas Creek, it has ephemeral, intermittent, and perennial sections. Percha Creek lies in the Caballo Lake watershed and enters Caballo Lake on the south end of the reservoir. The reach surveyed for this report also includes Percha Box, a steep-walled canyon with perennial flows. The Percha Creek study area includes the riparian habitats along approximately 15 river miles from Hillsboro, New Mexico to just above Interstate Highway 25. Most of the study area was on private land with the exception of the Percha Box reach and a small section of State Trust land. Percha Box is carved through a portion of BLM property.

New Mexico Copper Corporation Copper Flat Baseline Data Characterization Report
Copper Flat Mine 4-3 Section 4: Vegetation Survey Results June 2012
4.3 Methodology Sampling objectives in each of the individual study areas were selected based on the specific habitat(s) that occur, projected type and level of disturbance or impact, and recommendations from the SAP agency comments. Information collected in each study area is intended to capture baseline conditions for the particular area. The methods implemented under this report included variable levels of quantitative and semi-quantitative studies as well as visual presence/absence surveys.
4.3.1 Copper Flat Mine Permit Area
Information collected in the Copper Flat Mine Permit Area was intended to document baseline vegetation characteristics before mining operations continue. Some of the vegetation assessment transects lie outside of the disturbance footprint in current mine engineering drawings. Parametrix intended for these locations to be suitable for long-term monitoring. These data may be useful in the future for gauging reclamation success or monitoring climatic, natural, or other (non-mining) disturbance-driven changes to vegetation in the Permit Area.
In 1996, SRK conducted a vegetation survey in the Permit Area (SRK, 1997). Their study was implemented in support of Alta Gold Company’s proposal to re-open the Copper Flat Project. The 1996 survey employed a modified Parker Three-Step method to characterize vegetation composition, density, and biomass production of native perennial plants. The Parker Three-Step method uses a cluster of three transects in a stratum to characterize the desired vegetation attributes. Unfortunately, the original datasheets or data summaries by cluster are no longer available. A recent effort to relocate metal stakes marking the 1996 transects was unsuccessful. Consequently, the previous SRK data cannot be incorporated into the current vegetation assessment for trend analysis or other purposes.
During late-summer 2010 and June 2011, Parametrix botanists completed a quantitative vegetation survey of the Permit Area in support of the current permit application. The survey period was timed to accurately capture annual biomass production and cover. The growing season for warm season (C4 photosynthetic pathway) grass species is typically April through August in New Mexico. Because biomass production rates typically increase with precipitation, quantitative data collection was performed during the late summer following monsoons to accurately capture annual production. This time period is also representative of peak vegetation cover during most years and is considered a favorable period to identify many plant species. Plant cover (especially by annuals) can be greatly reduced after the first frost. A total of 96 stratified random transects were measured in the Baseline Study Area.
The Permit Area lies within the transition zone between Chihuahuan Desert Scrub and the Desert Grassland Ecotone according to Dick-Peddie (1999). Though the entire permit boundary technically lies within the Chihuahuan Desert Scrub type, the delineation line between these two types is only about 200 meters (m) west of the permit boundary. Two Natural Resources Conservation Service (NRCS) Major Land Resources Areas converge within the Permit Area. Much of the western half is considered Mogollon Transitions (Interior Chaparral – Woodlands/Grassland subclass), while the eastern half is predominantly characterized as Southern Desertic Basins, Plains, and Mountains (Chihuahuan Desert Shrubs subclass) (NRCS, 2007).
Prior to fieldwork, the Permit Area was stratified according to existing disturbance, proposed disturbance, and NRCS Ecological Site Description (ESD) (NRCS, 2010). This stratification served as an initial vegetation map and also facilitated a stratified random-sampling design for field data collection. Two NRCS ESDs were delineated by the NRCS in the Permit Area—Gravelly (R042XB010NM) and Hills (R038XB102NM). ESD delineations formed the basis for stratifying currently undisturbed portions of the Permit Area and also coincided with distinctly different vegetation types. Following quantitative data collection and analysis, the Parametrix botanists reclassified the Gravelly portions of the Permit Area as Chihuahuan Desert Shrubland. Areas that the NRCS had defined as the

New Mexico Copper Corporation Copper Flat Baseline Data Characterization Report
Copper Flat Mine 4-4 Section 4: Vegetation Survey Results June 2012
Hills ESD were reclassified as Chihuahuan Desert Grassland. As described in the results section of this chapter, these two general vegetation types had distinctly different lifeform cover and species composition.
As already mentioned, previous mining activities have significantly affected vegetation in portions of Copper Flat. Statistical analyses of the data collected during a 2010 preliminary assessment by Parametrix found significant differences in shrub density, grass cover, and species diversity among the tailing dam, waste rock piles, and control areas. In consideration, the disturbed areas were stratified according to whether the area is a waste rock pile, pit, or tailing dam. Some areas (previous mining pits) were nearly void of vegetation altogether but reflect the pre-mining vegetation condition in these areas under the current permit application. Consequently, this stratum was included in the sampling.
The proposed mine permit boundary occupies approximately 2,200 acres (Table 4-1). Figure 4-2 shows the location of each transect and the distribution of different strata. A sample size of 93 transects was recommended within the permit boundary in the SAP. Two additional vegetation measurement transects were established in the arroyo bottom and another transect was recorded in the diversion channel (Table 4-1). These three transects were installed in response to SAP agency comments. The three additional transects were measured in June 2011, yielding a total of 96 transects. Table 4-2 includes the Universal Transverse Mercator (UTM) coordinate locations for each of the 96 transects.
Before fieldwork, transect locations were randomly selected using the random point generation function within Hawth’s Analysis Tools ArcGIS plug-in. During this process, the required number of random transects was placed in each stratum. A 40-m buffer was enforced at transition lines between strata and also between individual transects to reduce cross sampling. The resulting geographic coordinates were transferred to a GPS receiver for field navigation to the target locations. After arriving at the sample point, personnel captured a digital photograph in the transect location, and then stretched a 50-m transect tape to record quantitative information specific to characterizing cover, production, density, and diversity at each individual stratum.
Unknown plant species were collected from the field and a species determination was made, if possible, using regional floras. Some unknown species were also verified at the University of New Mexico herbarium. In cases where a species could not be determined because critical floral structures or fruit were not obtained, the individual was determined to at least the genus level. If no regional species of concern shared the genus, no further examination was completed. Each field datasheet was checked for data quality and completeness before moving onto the next transect location. After fieldwork was completed, data were entered into MS Excel. A thorough quality control review was completed to check for omissions, outliers, and inaccuracies in electronic data tables prior to data summary. Corrections were completed by reviewing the original datasheets, meeting with field personnel, or reviewing collected plant samples.
4.3.1.1 Cover
At the beginning point of each transect, a 50-m tape was stretched along the ground in a random direction determined by spinning the compass dial without looking. Cover was measured with a laser device at stations along the transect using the point-intercept method. The laser device consisted of two green-light laser pointers fixed to a piece of angled aluminum beam and mounted on a camera tripod. Each laser produced a point of light 1 to 2 millimeters (mm) in diameter. Intercepts were recorded to the right and left of the tape 1 m apart along the entire 50-m tape, resulting in a total of 100 point measurements along each transect.
Both aerial vegetation cover and ground cover were recorded at each sample point. Cover was recorded by species if a plant was intercepted; in situations where multiple species were intersected by the laser, both species were recorded. A single species was not recorded more than once at the same point. Ground cover was also determined at each sample point according to whether basal vegetation, litter, bare soil, downed wood, or

New Mexico Copper Corporation Copper Flat Baseline Data Characterization Report
Copper Flat Mine 4-5 Section 4: Vegetation Survey Results June 2012
various rock categories (i.e., cobble, gravel, rock, bedrock, etc., differentiated by size) were intersected at the ground surface.
For this report, absolute plant species covers recorded by the laser point intercept method were converted to relative covers by lifeform (grass, forb, shrub, annual), by perennials, and as all live vegetation (perennials and annuals). In this manner, the relative perennial cover contributions were compared. Cover summaries in this study were calculated as “first hit” analysis.
4.3.1.2 Annual Biomass Production
Production was assessed by clipping all herbaceous vegetation within 1-m² quadrats placed at 25-m intervals along the transect. Vegetation from the current growing season was clipped and stored in paper bags labeled by species and transect. Care was taken to remove and discard vegetation from the previous growing season (which is usually gray and sometimes partially blackened). When a large shrub covered more than 75 percent of the quadrat area, these shrubs were clipped within a 0.25-m² quadrat nested inside the 1-m² quadrat.
Biomass collections were then air-dried at room temperature for 6 to 10 weeks. Samples were weighed regularly during the drying process to monitor when weight loss stopped (i.e., the samples were air dry). Following drying, sample bags were weighed on an Ohaus Scout II electronic balance to the nearest 0.1 gram.
4.3.1.3 Woody Plant Density
Woody plant density was determined on belt transects 2 m wide by 50 m long (100 m²) nested along the sample transect with 1 m on each side of the tape. Field personnel tallied all woody plants rooted within the belt by species. Individual plants were tallied at ground level. Multi-stemmed shrubs were considered one individual plant if they appeared to emerge from a single root crown. Woody plants were also tallied according to whether they were considered “large” or “small.” Shrubs were considered “large” if they were ≥1 m in height or diameter (breadth); or “small” if they were <1 m in height. Trees were considered “small” if their height was <2 m or “large” if they exceeded this height.
4.3.1.4 Diversity
Species diversity in the Permit Area was evaluated using two different approaches. A plant species inventory was completed over the course of three field visits. A more quantitative measure of diversity was also employed to assess species richness, species evenness, and community complexity from the transect data.
There are a variety of quantitative statistical measures that assess plant species diversity. Measures can be used to describe species richness, species evenness, and/or the structural complexity of a community. Species richness is simply the total number of species that occur within a transect, stratum, or the entire site. Species evenness expresses how evenly or unevenly species are distributed within the plant community. Evenness can be expressed as the proportion or percentage that each species represents of the whole (sum of all species).
The Shannon-Weiner (S-W) Index is one commonly used measure of species diversity (Krebs, 1989; Shannon, 1948). Both species richness and species evenness are factors in this index. The greater the number of species, the higher the index value becomes. In addition, the more evenly matched species are with each other with respect to quantities (whether the quantity is cover, production, or other parameter), the higher the index value. In other words, if certain species are too dominant, the index value decreases. If the species have relatively similar dominances, the index value will go up. Statistically, the index monitors the probability of whether the next sample will contain the same species as the previous sample or whether the next sample will be a new species (Krebs, 1989; Shannon, 1948). The S-W equation is given below (Krebs, 1989; Shannon, 1948).

New Mexico Copper Corporation Copper Flat Baseline Data Characterization Report
Copper Flat Mine 4-6 Section 4: Vegetation Survey Results June 2012
Where:
H is the diversity index
Σ means to sum the values for each species
i refers to the ith species
s refers to the total number of species
pi is the proportion of individuals of the total sample (in this case, cover) belonging to the ith species
ln is the same as the natural log
Cover was the only parameter used in the S-W Index calculations published in this report.
4.3.1.5 Sample Adequacy
Sample adequacy is a statistical calculation or determination, estimating the minimum number of transects (i.e., samples) needed to meet a defined confidence level (e.g., 90 percent). Another approach towards assessing sample adequacy is stabilization of the mean (Clark, 2001). Some vegetation parameters may not be normally distributed, particularly under conditions where quadrat or sample area size does not appropriately match plant dispersion in the field (e.g., sparse vs. clumped plant distributions). Evaluating numerous data sets in New Mexico, Clark (2001) has shown that mean cover frequently stabilizes after 15 to 20 samples, while other parameters appear to stabilize between 30 and 40 transects. The stabilization of the mean calculation was employed for calculating sample adequacy in this report. The calculation uses the overall (or total) sample size mean and then sets limits of ± 10 percent of the mean (similar to a 90 percent confidence interval) as the statistical target to achieve. A running mean of successive samples (or transects) was then calculated from the results.
Information collected during an April 2010 preliminary vegetation pilot study (Parametrix, 2010b) defined the minimum sampling intensity for each stratum. During the preliminary assessment, eighteen 25-m-long vegetation transects (six each in the control, tailing dam, and waste rock piles) were completed. These data were then used to statistically predict the adequate number of samples to meet statistical sample adequacy for perennial plant cover. The total number of transects per stratum was determined by reviewing these results and also weighting the sample size according to total acreage of the stratum. According to the preliminary assessment (Parametrix, 2010b), the minimum transect number per stratum needed to be increased to a minimum of six transects and the transect length extended to 50 m. Both of these recommendations were implemented during sampling. A minimum of 10 transects were installed in each stratum besides the arroyo.
Our sampling objective was to meet statistical sampling adequacy (± 10 percent of the mean) for perennial plant species cover in each stratum besides the arroyo. Sample adequacy was calculated and reported for multiple variables. Results of sample adequacy analyses were included in detailed vegetation summary tables produced for the permit area results section.
4.3.1.6 Plant Species Inventory
Plant species inventories were completed in the Permit Area during three field efforts: April 2010, late-summer 2010, and May/June 2011. The intent behind staggering these surveys was to capture a relatively complete plant
New Mexico Copper Corporation Copper Flat Baseline Data Characterization Report
Copper Flat Mine 4-7 Section 4: Vegetation Survey Results June 2012
species list in the Baseline Study Area, including fall or spring annuals and species that can be difficult to definitively identify outside of their flowering and/or fruiting period. Inventories paid particular attention to the presence or absence of agency-, state-, or federally regulated rare, threatened, or endangered species. Field botanists researched documented nearby locations and habitat requirements of species of concern before completing the inventory. If a species of concern was encountered, a GPS file would have been recorded. Species closely resembling a species of concern were photographed and/or collected following the discretion of the field botanist and appropriate regulations. When state- or federally listed noxious weeds were encountered, the specific location and extent of infestation was also to be documented with a GPS receiver.
4.3.1.7 Detailed Riparian Vegetation and Wetlands Mapping
In accordance with the New Mexico Department of Game and Fish’s suggestion (in their SAP comments), a detailed riparian map was delineated for Greyback Arroyo through the Permit Area. The map also included vegetation along the diversion channel. Vegetation map units were characterized for areas dominated by typical riparian species (such as cottonwood [Populus sp.] and willow) (Salix sp.), as well as communities characteristic of arroyo riparian habitats in this portion of the state, such as habitats dominated by seepwillow (Baccharis sp.) or burro bush (Hymenoclea monogyra). If terraces were dominated by similar vegetation species in the surrounding uplands, then the particular area was not mapped. The intent was to characterize communities most directly affected by arroyo functional processes.
Vegetation types were assigned according to the Hink and Ohmart (H&O) mapping convention. The H&O system was developed in support of the Middle Rio Grande Biological Survey (Hink and Ohmart, 1984) and is now widely used to characterize riparian vegetation types in New Mexico. Their vegetation classification system defined a community type as a “distinctive, local assemblage of species, the designation of which is based on the dominant or co-dominant species in canopy and shrub vegetation layers” (Hink and Ohmart, 1984). In this system, structure types corresponded to sub-association level in the Brown-Lowe-Pase system (Brown et al., 1979 as cited in Hink and Ohmart, 1984). The H&O system has also been useful for characterizing habitat potential for various songbirds and other wildlife species.
Two canopy layers (overstory and understory) are distinguished in the H&O system. The overstory (tree) canopy layer is defined as trees with foliage cover concentrated above 20 ft. The understory (shrub and young tree) canopy layer consists of perennial, woody vegetation with foliage cover concentrated below 15 ft. Six structure types are recognized (1–6) according to vertical distribution of foliage (i.e., foliage density along a vertical gradient) within the two canopy layers (Table 4-3).
Species composition in the woody structure types is characterized using predetermined species acronyms. Many of the species encountered through Parametrix’s detailed mapping of the study areas did not have pre-assigned species acronyms; therefore, acronyms were assigned for these species (Table 4-4). By H&O convention, a slash (/) distinguishes species composition of the overstory from the understory, with dominant overstory species listed on the left side of the slash and dominant understory species listed to the right. When more than one species dominates a single canopy layer (i.e., “co-dominant” species), a hyphen (-) is placed between the species acronyms. Each species classified as a dominant or co-dominant in the H&O type composes at least 25 percent of the relative foliage cover in that canopy layer; thus, up to four species may be considered co-dominants in each canopy layer. Species acronyms are listed in descending order of dominance for each canopy layer.
During field data collection, a Parametrix botanist marked transitions between vegetation communities with a GPS unit and assigned the appropriate H&O type. Percent total cover of overstory and understory canopy layers and percent relative species cover for each layer were recorded using ocular estimates. Most of the individual vegetation units were also photographed. GPS data were transferred to a laptop computer and overlaid on 2009 National Agricultural Improvement Program (NAIP) aerial photography. Unique vegetation polygons were

New Mexico Copper Corporation Copper Flat Baseline Data Characterization Report
Copper Flat Mine 4-8 Section 4: Vegetation Survey Results June 2012
digitized at 1:5,000 map scale in ESRI ArcGIS 10. Additional field notes containing other tree or shrub species observed in the polygon, but not considered a co-co-dominant under the H&O convention, were also attributed in the shapefile’s database table.
This mapping effort was also intended to capture wetlands and jurisdictional waters of the United States. Waters of the United States are defined by 33 CFR Part 328.3 (b) and are protected by Section 404 of the Clean Water Act (CWA) (33 USC 1344), which is administered and enforced by the U.S. Army Corps of Engineers (USACE). The Baseline Study Area was assessed for the presence of waters of the United States using U.S. Geological Survey (USGS) topography maps and county soil survey maps, followed by field verification during riparian vegetation mapping.
4.3.2 Pipeline Corridor
In accordance with state and federal natural resources protection laws, a field survey of the pipeline corridor was conducted to evaluate potential impacts on threatened or endangered species, wetlands/waterways, noxious weeds, and other sensitive plant species. The proposed corridor was surveyed by Parametrix field botanists in April 2010, and May, June, and August 2011. A visual survey of the adjacent environment was also conducted to evaluate the potential for and presence of habitat suitable for state- and federally listed, and sensitive species. An assessment of waters of the United States that could be affected by the proposed project was performed using USGS quadrangles, National Wetlands Inventory (NWI) maps, aerial photography, and county soil survey maps in-house, and then verified during the field visits.
Federal and state lists for protected species in Sierra County were examined for this report. In addition, lists were obtained from the New Mexico Rare Plant Technical Council (NMRPTC, 2011) and the BLM. The habitat requirements of listed species were compared to the habitat at the proposed project location to identify potentially affected species or “target species.” Species considered unlikely to occur due to their known distribution in a county, or for which suitable habitat does not exist within the proposed Baseline Study Area, were removed from further consideration. It was determined that direct and short-term impacts on vegetation resulting from proposed project-related ground disturbance activities would be minimal, so a more quantitative study was not considered necessary.
4.3.3 Arizona Sycamores at Las Animas Creek
The New Mexico Department of Game and Fish requested (in their SAP comments) that NMCC characterize riparian communities along Las Animas Creek in this report. Arizona sycamore (Platanus wrightii) stands extend from approximately 3 miles west of the confluence of Las Animas Creek and Caballo Reservoir through the Ladder Ranch property. Las Animas Creek contains the eastern-most naturally occurring Arizona sycamore populations in New Mexico (Plant Maps, 2011). Arizona sycamore is a relatively unique resource in this portion of New Mexico; therefore, this species was a particular focus in the Las Animas Creek study area.
The Arizona sycamore is a deciduous, pioneer, obligate riparian tree of the Southwest United States and northern Mexico. Previous dendrological studies have shown that Arizona sycamores can have a lifespan of more than 200 years (Stromberg, 2001a). Arizona sycamore provides habitat for many different bird species (Stromberg, 2001a). Hydrologic and geomorphic conditions that favor recruitment and survival of other obligate riparian trees such as cottonwoods and willows are better understood than biohydrology in Arizona sycamore. To bridge this gap, Dr. Juliet Stromberg, associate professor at Arizona State University, has published several research papers over the last 10 years to document the influence of environmental conditions such as stream flow regimes, temperature, and depth to groundwater on Arizona sycamore.

New Mexico Copper Corporation Copper Flat Baseline Data Characterization Report
Copper Flat Mine 4-9 Section 4: Vegetation Survey Results June 2012
Arizona sycamore reproduces both sexually (shoots referred to as gamets) and vegetatively (ramets). The sexual reproduction strategy and requirements in Arizona sycamore are similar to other riparian obligates in this region such as cottonwoods and willows (Stromberg, 2001a; Stromberg, 2001b; Stromberg, 2002). Arizona sycamore trees produce an abundance of small seeds on achenes fastened in clusters of round balls (heads) that are green in flower and become brown in fruit (Carter, 1997). Heads remain on the tree throughout the winter (Carter, 1997), gradually detach in the winter/spring, and then release seeds coated with tufted hairs (Stromberg, 2002). Seed viability lasts approximately 6 months (Zimmerman, 1969; Bock and Bock, 1989). With favorable conditions, seeds germinate in the spring.
Studies have indicated that germination events are episodic and sometimes sporadic, with frequent germination and establishment coinciding with winter and early spring flooding and wet springs (Stromberg, 2002). Winter flooding creates desirable geomorphic conditions and fresh alluvium while spring moisture (flooding or precipitation) moistens seeds and provides adequate water for seedling sustenance (Stromberg, 2002). Seedling growth is also more rapid in sites with perennial stream flow and shallower groundwater than at sites with ephemeral stream flow and groundwater deeper below the surface (Stromberg, 2001a). Summer flooding via monsoonal events may be suitable for germination, but this was not observed in Stromberg (2002).
Typically, ramet production is more abundant and frequent than gamet production (Stromberg, 2002). Ramet production periods do not appear to necessarily coincide with favorable or unfavorable years of seedling establishment (Stromberg, 2002). Earlier research (Glinski, 1977) found no correlation between sprout densities and percent of canopy dieback, soil texture, or distance from channel (as cited in Stromberg, 2002). However, Stromberg (2002) suggests that vegetative reproduction may be triggered by disturbance, changes in resource availability, and/or disease.
Growth rates of Arizona sycamore are influenced by growing season flows (Stromberg, 2001b). Winter flooding recharges groundwater while summer flooding recharges nutrients and replenishes soil water. Summer flood frequency significantly increases growth rates on both perennial and intermittent reaches (Stromberg, 2001b). Growth is more frequently limited by moisture availability in non-perennial reaches, and high temperature and drought result in very low growth rate (Stromberg, 2001b). Growth in older trees is more strongly correlated with total annual flow than summer flow (Stromberg, 2001b). However, growth rates in younger trees show a high correlation with both summer and annual flow (Stromberg, 2001b). Older trees are also more tolerant of deeper groundwater than younger cohorts (Stromberg, 2001b; Stromberg, 2001a).
Arizona sycamore is most productive when groundwater averages less than 2 m below the tree during the growing season, and less than 0.5 m below the stream thalweg, and where groundwater fluctuates less than 1 m annually (Stromberg, 2001a). Forests measured under these conditions also have the highest compositional diversity (Stromberg, 2001a). When groundwater depth ranges between 3 and 5 m (low, seasonally fluctuating stem water potentials), low growth rates and moisture stress are observed (Stromberg, 2001a).
Because the perennial reaches of Las Animas Creek were excluded from our survey, the study area occurs where conditions are more likely to show indications of moisture stress, with reduced probability of natural regeneration for Arizona sycamore. The general intent of this study was to develop a basic understanding of the current distribution and extent of this species in general, as well as the distribution and extent of important biotic integrity indicators such as stress, disease, and natural recruitment.
The specific objectives of the current Arizona sycamore study at Las Animas Creek included:
Map the current distribution and extent of Arizona sycamores throughout the study area; Map the distribution of other (non-sycamore) riparian vegetation types; Understand with which riparian tree and shrub species the Arizona sycamore most frequently coexists;

New Mexico Copper Corporation Copper Flat Baseline Data Characterization Report
Copper Flat Mine 4-10 Section 4: Vegetation Survey Results June 2012
Complete a preliminary assessment of the size classes and health conditions of Arizona sycamore trees; Map the distribution and extent of current regeneration of sycamore trees; Identify favorable and limiting reaches for natural sycamore sustenance and recruitment; Map the distribution and extent of trees showing increased signs of canopy dieback or stem dieoff; and Establish 25 reference trees for long-term monitoring that capture the current variation of age/size
classes and health conditions currently present along the creek.
4.3.3.1 Detailed Riparian Vegetation Mapping
Riparian vegetation mapping at the Las Animas Creek study site was completed during an initial field assessment in September 2011. The H&O mapping convention was used to characterize vegetation communities along the creek for portions in which access was permitted. A botanist visited each unique polygon and delineated the vegetation type following similar methods as described under Section 4.3.1.7 (Detailed Riparian Vegetation and Wetlands Mapping) above. Contrary to the other riparian study areas in this report, mapping was only completed for zones meeting typical riparian habitat criteria (areas dominated by riparian indicator tree and shrub species). Arroyo vegetation mapping (areas dominated by Baccharis, burro brush, or mesquite) was not completed along Las Animas Creek. It was also not possible to enter some of the fenced private properties during the field survey; thus, a vegetation type was not determined for inaccessible portions. Isolated properties also contained small patches of cultivated trees, even sometimes planted Arizona sycamores, and the maps in this report do not accurately characterize some of these cultivated tree clusters.
4.3.3.2 Arizona Sycamore Study
In addition to completing the general H&O survey protocol and delineating a riparian vegetation map, the team of botanists focused on characterizing the general distribution and extent of Arizona sycamore age/size classes and condition classes. Percent canopy dieback for Arizona sycamore trees and observations of sexual recruitment were recorded at each polygon.
A second field trip was completed in November 2011 to document Arizona sycamore recruitment zones and characterize current constraints for natural Arizona sycamore sustenance and recruitment along sub-reaches through the study area. An ecologist walked the entire creek bottom through the study area during this second visit and searched for younger individuals in the channel bottom, on the channel banks, and in the adjacent floodplain if conditions appeared to be favorable for regeneration. When stands of younger trees (seedlings, saplings, or poles) were encountered, the botanist recorded a GPS point and a digital photograph. Seedlings were defined as trees less than approximately 2 inch diameter at breast height (dbh). Saplings (approximately two to four dbh), or clusters of saplings; and poles (approximately four to ten dbh), or clusters of poles, were distinguished by dbh and then documented. After returning from the field, GPS locations of seedlings, saplings, and poles were plotted in ArcGIS 10 and used to digitize zones where recruitment was still favorable. If younger stems arose from the base of a parent tree or emerged in rings around a larger tree, they were considered ramets. Otherwise, younger trees were considered gamets. Each ramet observed was not documented during the survey since they are not necessarily indicators of sycamore population viability and they’re relatively common throughout the study area.
A total of 25 Arizona sycamore trees were also documented as reference trees for potential long-term monitoring. This activity was completed during the September 2011 field visit. Each reference tree was photographed and marked with a tree tag. The dbh, height, and percent canopy dieback was measured for each tree. Percent canopy dieback was determined using an ocular estimate of cover. Tree height was estimated according to the tangent method, with a measuring tape and clinometer. The dbh was recorded with a standard

New Mexico Copper Corporation Copper Flat Baseline Data Characterization Report
Copper Flat Mine 4-11 Section 4: Vegetation Survey Results June 2012
dbh tape. If multiple stems arose from the tree, a dbh was recorded for each stem individually. Initially, the botanists had also intended to use boring instruments to age-reference trees; however, some private landowners objected to penetrating trees on their property. As a result, no increment cores were collected.
4.3.4 Percha Creek
Vegetation mapping along Percha Creek characterized the extent and distribution of riparian and wetland communities through the study area, including Percha Box. The botanists also included arroyo riparian habitats to provide a complete, current data set to detect potential long-term change in the future. For consistency, the H&O mapping convention was used to characterize vegetation types along Percha Creek. A botanist visited each unique polygon and characterized the vegetation type following the same methods as described under Section 4.3.1.7 (Detailed Riparian Vegetation and Wetlands Mapping) above. A GPS point was also collected in the field to document reaches where stream flow was encountered during fieldwork. Field work was completed during October 2011.
4.4 Baseline Data Results
4.4.1 Copper Flat Mine Permit Area
Several levels of data collection occurred during the 2010 and 2011 field seasons in the Permit Area. Presence/absence surveys were conducted for noxious weeds, plant species of concern, and wetlands. Semi-quantitative cover estimates were used to delineate and map riparian and arroyo riparian vegetation communities through Greyback Arroyo, while quantitative methods were employed to measure cover, shrub density, species richness, and annual biomass production.
Quantitative data summaries for cover, species richness, and production were not adjusted for annual precipitation in this report, as is common in range science. It should be noted, however, that the 2010 growing season was wetter than average, which may have inflated the cover, production, and diversity (of annuals) results published in this report. All but three (the arroyo transects) of the vegetation transects were measured during August and September 2010. Based on precipitation records obtained from the Western Regional Climate Center (http://www.wrcc.dri.edu/index.html), precipitation from January through August 2010 was nearly 60 percent above the mean (Figure 4-3). The April through August growing season, which represents the typical growing season for warm season grasses, was 47 percent above the mean. Precipitation during November and December 2009 was also above average.
Most of the quantitative vegetation data were collected during a single season; therefore, the results cannot be considered representative of typical conditions at the site. However, previous research has shown that aboveground net primary production (ANPP) is highly correlated with annual precipitation (Webb et al., 1978). This is particularly the case across North American grasslands where variation in precipitation explains more than 90 percent of variation in ANPP (Sala et al., 1982). Hadley and Szarek (1981) measured strong year-to-year variation in ANPP in response to rainfall, specifically in the northern Chihuahuan Desert grasslands.
Muldavin et al. (2008) showed a similar positive correlation between annual precipitation and ANPP in shrublands and grasslands of the northern Chihuahuan Desert. Much of the yearly variation in ANPP in C4 grassland was attributed to precipitation (Muldavin et al., 2008). Variations in ANPP in the grassland were nearly 500 lbs/acre annually. The three most productive years also coincided with an early onset (July) monsoon, analogous to weather records for Hillsboro in 2010.
Annual precipitation can also influence plant cover in the Chihuahuan Desert ecosystem. Ernest et al. (2000) indicated that inter-annual differences in plant cover were most strongly correlated with precipitation during

New Mexico Copper Corporation Copper Flat Baseline Data Characterization Report
Copper Flat Mine 4-12 Section 4: Vegetation Survey Results June 2012
the same growing season. Plant cover at long-term monitoring plots varied by 30 percent over the 9-year monitoring period in response to annual rainfall variations of nearly 8 inches over the same period (Ernest et al., 2000).
4.4.1.1 Cover
(Please note that cover is represented as “first hit” analysis. Since “first hit” analysis was used in report summaries, the combined cover between vegetation canopy and ground cover sums to 100 percent. However, ground in itself does not add to 100 percent in “first hit” analysis. Aerial cover and canopy cover are used interchangeably throughout this section. Also, “cover” refers to mean aerial vegetation cover unless “ground cover” is specified. Stated cover values are means for species or lifeforms across transects within a stratum unless otherwise specified).
Tables in Appendix 4-A include detailed cover summaries for individual transects by stratum. Total aerial vegetation cover (64 percent) and perennial vegetation cover (55 percent) was higher in the Chihuahuan Desert Grassland (CDG) than any other stratum (Table 4-5). CDG also had the highest perennial grass aerial cover (38 percent) and the greatest canopy cover by annual species (9 percent). The pit stratum contained the lowest aerial vegetation cover values. Total vegetation canopy cover was 4 percent in the pit stratum. No annual plant species were encountered along cover transects in the pit site.
The Chihuahuan Desert Shrubland (CDS) stratum had the second highest total vegetation cover (42 percent) and aerial perennial plant cover (37 percent). The CDS had the highest shrub cover (20 percent) and perennial forb cover (8 percent) measured across strata in the permit area. The disturbed area/waste rock pile stratum, tailing dam, and the arroyo stratum had total vegetation cover values of 39, 34, and 25 percent, respectively. However, mean perennial plant cover was slightly higher on the tailing dam stratum (34 percent) than the disturbed area/waste rock pile (31 percent). Detailed summaries for measured cover are discussed by stratum in the following sub-sections.
4.4.1.1.1 Chihuahuan Desert Grassland
The CDG stratum included Animas Peak, the primary natural landform in the permit area. Dense patches of Wheeler sotol (Dasylirion wheeleri) grew on the slopes of Animas Peak; however, on this landform and throughout the CDG, the stratum was dominated by warm season grasses. Typical shrubs characteristic of the northern Chihuahuan Desert were also common. This stratum occupied 933 acres of the Permit Area. Creosote bush (Larrea tridentata), a species that is sometimes considered an indicator for ecosystem degradation in this system, was encountered infrequently. Small oak or netleaf hackberry (Celtis laevigata) woodlands were present in isolated drainages on the northern and western portions of the Permit Area. One-seed juniper (Juniperus monosperma) was most common on hill slopes with a north-facing aspect on the western half of the site.
Representative photographs of the CDG stratum are included as Figure 4-4. Perennial grasses composed 68.1 percent of the relative perennial plant cover as well as 58.7 percent of the relative total plant cover in the CDG. Two grass species, black grama (Bouteloua eriopoda) and side oats grama (Bouteloua curtipendula) were relatively abundant. Side oats grama aerial cover was 13.1 percent while mean aerial black grama cover was 11.2 percent. Tobosa grass (Pleuraphis mutica) had the third highest mean aerial cover (3.90 percent) for graminoid species. Other perennial grass species with greater than 1 percent mean aerial cover included Harvard’s three-awn grass (Aristida harvardii), cane bluestem (Bothriochloa barbinodis), blue grama (Bouteloua gracilis), hairy grama (Bouteloua hirsuta), and fluff grass (Dasyochloa pulchella).
Perennial plant cover ranged from 36 to 74 percent in the CDG. Perennial forb cover composed 7.4 percent of the relative perennial plant cover and 6.4 percent of the relative live vegetation cover. Total perennial forb cover
New Mexico Copper Corporation Copper Flat Baseline Data Characterization Report
Copper Flat Mine 4-13 Section 4: Vegetation Survey Results June 2012
was 4.1 percent. Spreading buckwheat (Eriogonum effusum) had 2 percent cover or 48.7 percent of the relative cover for perennial forbs. Other perennial forb species occurred with lower cover on average. Total shrub cover was 13.6 percent in the CDG stratum. Shrubs composed 24.5 percent of the relative perennial vegetation cover and 21.1 percent of the relative total plant cover. Four shrub species had more than 1 percent cover. They included broom snakeweed (Gutierrezia sarothrae), cat-claw mimosa (Mimosa aculeaticarpa), honey mesquite (Prosopis glandulosa), and spiny dogweed (Thymophylla acerosa). Threadstem chinchweed (Pectis filipes) composed 73 percent of the relative cover from annual species. The cover of annual species was 8.9 percent. Rock, litter, and cobble were evenly distributed across the ground surface when plant species were not intercepted. Gravel and bedrock were present in cover results but with very low values (<3 percent). Bare soil cover in the CDG was fairly low (7.1 percent).
4.4.1.1.2 Chihuahuan Desert Shrubland
A 261-acre section lying in the southeast corner of the Permit Area was classified as the CDS stratum. The CDS type was composed primarily of shrub species indicative of the Chihuahuan Desert. Representative photographs of the CDS type are included as Figure 4-5 in this report. Grasses and perennial forbs were both fairly well represented. Terrain in this type was generally more even than in the CDG. Previous disturbance was relatively limited with the exception of grazing and isolated pockets of prospector mining. Based on results of quantitative data measured in support of this report, shrubs compose 53.0 percent of the relative perennial plant cover and 46.3 percent of the relative live plant cover.
Tables in Appendix 4-A include a detailed cover summary from data collected at each transect in the CDS. Total shrub cover was 19.5 percent. Honey mesquite had more cover than any other individual species recorded (6.4 percent). Tarbush (Flourensia cernua) with 5.7 percent cover and broom snakeweed (2.89 percent), both shrubs, were the next most prominent species. The only other shrub species with more than 1 percent cover was creosote bush. Total grass cover was 9.5 percent. Grass species composition was relatively even. Black grama grass (1.16 percent), side oats grama (1.8 percent), fluff grass (1.8 percent), bush muhly grass (Muhlenbergia porteri, 1.3 percent cover), and tobosa grass (Pleuraphis mutica, 1.4 percent cover) were the most abundant grass species.
Total perennial forb cover was 7.8 percent. Rattlesnake weed (Chamaesyce albomarginata) was the only perennial forb with cover (2.6 percent) in excess of 1 percent. This species composed 33.6 percent of the relative perennial forb cover.
Annual plant cover was 5.3 percent. Six-weeks grama (Bouteloua barbata), an annual grass, and woolly honeysweet (Tidestromia lanuginosa), an annual forb, both had cover values >1 percent. Woolly honeysweet and six-weeks grama cover were 1.1 and 1.7 percent, respectively.
As mentioned earlier, cover data are represented as “first hit” analysis. As a result, ground cover values by themselves do not add up to 100 percent, as is true if ground cover is characterized as a separate cover layer. Cobble ground cover was 22.9 percent in the CDS, which greatly exceeded other ground cover categories. Gravel (5.7 percent) and litter (4.4 percent) were the next most common ground cover classes. Bedrock (2.4 percent) and rock (2.7 percent) were also encountered in the CDS stratum. Bare soil cover in the CDS was 20.8 percent.
4.4.1.1.3 Disturbed Areas/Waste Rock Piles
Based on the botanists’ observations, the disturbed area/waste rock pile stratum was the most variable and difficult to characterize due to previous mining activities and associated reclamation efforts. Scraped areas, mining waste dumps, waste rock piles, and/or placer mining overburden are scattered throughout this 866-acre stratum. Vegetation potential changes drastically over very short distances in the disturbed areas/waste rock

New Mexico Copper Corporation Copper Flat Baseline Data Characterization Report
Copper Flat Mine 4-14 Section 4: Vegetation Survey Results June 2012
piles. Soil substrate, terrain, and plant distribution were heterogeneous. According to vegetation cover data recorded at the waste rock pile stratum, total perennial plant cover was 31.2 percent and grasses were the most abundant lifeform (18.7 percent cover). Graminoids composed 59.8 percent of the relative perennial cover and perennial grasses composed 49.5 percent of the relative live vegetation cover. Side oats grama was the most dominant grass species with 5.6 percent cover. Cane bluestem (3.7 percent), black grama (1.68 percent), and fluff grass (2.2 percent) were also prominent. Representative photographs of the waste rock pile stratum are displayed in Figure 4-6.
Total shrub cover was 8.8 percent in the disturbed area/waste rock pile stratum. Total perennial plant cover was composed of 28.3 percent shrub cover. Shrubs also composed 22.9 percent of the total vegetation cover. Honey mesquite, broom snakeweed, and feather dalea (Dalea formosa) each had greater than 1 percent cover. Honey mesquite, with 2.8 percent cover, was the most abundant shrub.
Total cover for perennial forbs was 3.7 percent. Spreading buckwheat was the most dominant perennial forb (1.20 percent cover).
Annual species cover was 7.3 percent. Six-weeks grama, threadstem chinchweed, and tansy aster (Machaeranthera tanacetifolia) each had a mean cover greater than 1 percent. Tansy aster was the most dominant annual. Cobble ground cover was 23.6 percent. Bare soil cover in the disturbed area/waste rock pile stratum was 21.8 percent. Litter and gravel each had mean cover values of 5.5 percent. Rock (4.6 percent cover) and bedrock (0.4 percent cover) were also intercepted as ground cover.
4.4.1.1.4 Tailing Dam
The tailing dam stratum consisted of an approximately 4,600-foot-long by 200-foot-wide earthen tailing dam engineered during previous mining at the site. The total area of the tailing dam stratum was 17 acres. The botanists were not able to confirm whether or not this structure was revegetated during previous reclamation efforts; however, based on the current vegetation distribution and diversity it is likely that this area was seeded. Representative transect photographs from the tailing dam stratum are shown in Figure 4-7.
Total cover of perennial plants was 34.1 percent (Table 4-5). Silver bluestem (Bothriochloa laguroides) occurred at each transect sampled in the stratum. Perennial grass cover was 20.6 percent, perennial forb cover was 1.1 percent, and shrub/tree cover was 12.4 percent. Annual species cover was present in trace quantities (0.3 percent). Grasses, forbs, and shrubs composed 60.4, 3.2, and 36.4 percent, respectively, of the relative perennial plant cover.
Silver bluestem cover was 17.30 percent, which composed 84.0 percent of the relative perennial grass cover. Side oats grama (1.30 percent) was the only other grass species with greater than 1 percent cover. None of the perennial forbs encountered in the stratum had more than 1 percent cover. Honey mesquite (6.6 percent), broom snakeweed (1.20 percent), and feather dalea (2.6 percent) were the three most abundant shrubs.
Gravel (31.5 percent cover) was the most prominent ground cover in the tailing dam stratum. Cobble had 20.7 percent cover. Rock (6.9 percent cover) and litter (5.7 percent) had relatively similar cover values. Bare soil cover in the tailing dam stratum was very low (2.3 percent). No bedrock was encountered at the 10 transects in the tailing dam stratum.
4.4.1.1.5 Pit
The pit stratum occurred in previous mining pits covering 21 acres of the Permit Area. Representative transect photographs of the pit stratum are shown in Figure 4-8. Most of the ground surface was composed of crushed, cobble-sized rock. Plant cover was very low in the stratum. Seven of the 10 transects measured in the stratum

New Mexico Copper Corporation Copper Flat Baseline Data Characterization Report
Copper Flat Mine 4-15 Section 4: Vegetation Survey Results June 2012
were void of vegetation altogether. Bare soil was the most abundant cover type (62.6 percent). Total live vegetation cover was 4.4 percent. No annual plant species were encountered at transects in the stratum.
Perennial grasses were intercepted at two of the transects in the pit stratum. Mean grass cover was 1.6 percent. Most of the grass cover recorded in the stratum, however, was contributed by one outlier transect. Grass cover at this transect was 15.0 percent. The only other transect with any measured grass cover had 1.0 percent cover. Three grass species were intercepted in the stratum—Harvard’s three-awn (Aristida harvardii), silver bluestem, and side oats grama. Silver bluestem (1.2 percent cover) was the only species with more than 1 percent cover.
Three perennial forb species and three shrub species were also recorded in the pit stratum. Forbs were only recorded at one transect location. Shrubs were intercepted at two transects. California brickelbush (Brickellia californica, 1.9 percent) was the only shrub species with more than 1 percent cover. Most of the ground cover was composed of cobble (65.8 percent). No bedrock was intercepted in the stratum. Gravel, litter, and rock cover was 11.2, 5.6, and 5.6 percent, respectively.
4.4.1.1.6 Arroyo
Two vegetation transects were placed in the arroyo and another transect was recorded at the bottom of the diversion channel. These three transects were installed in response to SAP agency comments, which requested that two additional transects be installed in the arroyo. The most detailed characterization of arroyo habitat was a detailed riparian/arroyo vegetation map developed with semi-quantitative methods, as described later in Section 4.4.1.8 (Riparian Vegetation Types). The three vegetation monitoring transects in this stratum were completed during June 2011. Given the very small sample size in the stratum, these data do not accurately characterize the entire 50-acre habitat; however, they do provide a snapshot of the current conditions.
Total vegetation cover in the arroyo stratum was 25.0 percent. Shrubs were the most abundant lifeform. Total shrub cover was 19.0 percent, which composed 76.0 percent of the relative live plant cover. No annual plant species or perennial forbs were encountered at the three transects in the stratum. This was likely attributed to the timing of the survey and the small sample size. Total grass cover was 6.0 percent, or 24.0 percent of the relative live vegetation cover. Vine mesquite (Panicum obtusum) contributed most of the grass species cover. Mean cover for vine mesquite was 6.0 percent.
Emory’s baccharis (Baccharis emoryi) was the most abundant shrub species in the arroyo stratum. Note that this species is now considered seepwillow (B. salicifolia) by some sources (FNA, 2011). Baccharis cover was 13.0 percent but likely would have been much higher if transects had been recorded later in the season. Baccharis plants appeared to be moisture stressed during the monitoring period. Many of the individuals in the arroyo bottom had died back down to the base and were in the early stages of resprouting when the transects were recorded. Baccharis also appeared to be heavily browsed by cattle, which also reduced its cover. Burro bush was also abundant in the arroyo stratum (5.0 percent cover or 20.0 percent of the relative live plant cover).
Litter cover was 45.7 percent in the arroyo stratum. The high litter cover was mostly attributed to baccharis leaves along the soil surface. Bare soil cover was 21.7 percent. Gravel, cobble, and rock cover was 6.0, 1.0, and 0.7 percent, respectively. No bedrock was recorded in the stratum.
4.4.1.2 Annual Production
Net annual production was extremely variable across strata. Tables in Appendix 4-B include detailed summaries of production by species data captured along each transect in a stratum. Mean annual production by lifeform is also summarized in Table 4-6. The CDG stratum was the most productive. Mean production was 1,433.4 lbs/acre. Perennial graminoids were the most productive lifeform (952.7 lbs/acre) and contributed 66 percent of biomass composition. Perennial forbs produced 112.1 lbs/acre (8 percent composition), shrubs and trees

New Mexico Copper Corporation Copper Flat Baseline Data Characterization Report
Copper Flat Mine 4-16 Section 4: Vegetation Survey Results June 2012
produced 200.7 lbs/acre (14 percent composition), and annuals produced 167.9 lbs/acre (12 percent composition). Perennial plant composition comprised 88 percent of the net annual production, or 1,265 lbs/acre in the CDG stratum. Black grama and side oats grama were by far the most productive graminoids in the CDG. Mean black grama grass production was 276.1 lbs/acre while mean side oats grama production was 403.0 lbs/acre. These two species combined made up 71 percent of the graminoid composition in the CDG. Shrub/tree, perennial forb, and annual species were more variable in the CDG because production values were more evenly distributed across several species in these lifeforms.
Graminoid production was much lower in the CDS stratum. Black or side oats grama grass production did not achieve the mean values recorded for these species in the CDG stratum. Mean annual perennial graminoid production in the CDS was 260.3 lbs/acre (or 20 percent composition) and highly variable across transects. The standard deviation for perennial graminoid production was 377.7 lbs/acre. Shrubs produced an average of 654.0 lbs/acre (51 percent composition) in the CDS. Three shrub species, tarbush, broom snakeweed, and honey mesquite, each produced an average of more than 100 lbs/acre in the CDS. Creosote bush was encountered at production plots at four of the 19 transects, and creosote was also the fourth most productive shrub species in the CDS. Total annual production in the CDS was 1,274 lbs/acre, with perennial species contributing 1,086 lbs/acre (85 percent of the composition).
Mean annual production for all species totaled 917.6 lbs/acre in the waste rock pile stratum. Of this, 90 percent of the composition (826.2 lbs/acre) was perennial plants with perennial grasses contributing 417.9 lbs/acre (46 percent composition), forbs contributing 98.1 lbs/acre (11 percent composition), and shrubs/trees contributing 310.2 lbs/acre (34 percent composition). Silver bluestem was the most productive perennial graminoid in the waste rock pile stratum. This species alone produced a mean total of 178.5 lbs/acre, which composed 43 percent of the perennial grass production. Side oats grama was also relatively productive in the disturbed area/waste rock pile stratum. Side oats grama had a mean annual production of 85.5 lbs/acre in the disturbed area/waste rock pile stratum. Production at two transects (TP-12 and TP-16) was more representative of the CDG stratum. Both transects fell in a transition zone between strata, where previous disturbance was less evident.
Silver bluestem was also the most prominent graminoid in the tailing dam stratum. This species composed nearly 98 percent (360.8 lbs/acre) of the perennial grass production in this stratum. Only four other grass species were encountered at production quadrangles in this stratum. Honey mesquite was by far the most productive shrub species on the tailing dam, with a mean production of 273.6 lbs/acre. This species comprised 67 percent of the shrub production. These two species combined (honey mesquite and silver bluestem) produced 78 percent of the annual perennial plant production in the tailing dam. Total annual production in the tailing dam stratum was 822.0 lbs/acre. Perennial grasses produced 396.9 lbs/acre (48 percent composition), perennial forbs contributed 3.6 lbs/acre (<1 percent composition), shrubs/trees produced 406.9 lbs/acre (50 percent composition), and annual plants produced 14.6 lbs/acre (2 percent composition) in the tailing dam stratum.
The pit was the least productive stratum. Production quads only encountered live plants at one of the ten transects (PI-5). Silver bluestem, side oats grama, and California brickelbush were beginning to recolonize the transition zone between a previous mining pit and the waste rock piles at this location. Mean production would have been 0 lbs/acre in this stratum without this transect. Including this outlier transect, mean annual production was 248.1 lbs/acre.
Production quantities were not recorded in the arroyo stratum because these three transects were tallied in June. Warm season grasses encountered along these transects contained very little green growth; thus, net annual production would not have been accurately represented from data collected during this time period.
New Mexico Copper Corporation Copper Flat Baseline Data Characterization Report
Copper Flat Mine 4-17 Section 4: Vegetation Survey Results June 2012
4.4.1.3 Woody Plant Density
The arroyo stratum had the highest woody plant density followed by the CDS, disturbed area/waste rock pile, CDG, tailing dam, and pit stratum, in that order (Table 4-7). Tables in Appendix 4-C include detailed summaries of individuals recorded by species for each stratum. Broom snakeweed had the highest species density at four of the six strata.
Mean woody plant density in the CDS was 3,249 plants/acre. Broom snakeweed had the highest species density measured in the CDS stratum (1,308 plants/acre). This species was followed in descending order of density by tarbush (594.5 plants/acre), burro bush (298.3 plants/acre), mariola (Parthenium incanum, 291.9 plants/acre), and creosote bush (240.8 plants/acre). Individuals from eight species, four-wing saltbush (Atriplex canescens), yerba-de-pasmo (Baccharis pteronioides), desert willow (Chilopsis linearis), tarbush, burro bush, creosote bush, Torrey wolfberry (Lycium torreyi), and honey mesquite, exceeded 1 m in height. A total of 17 woody species were recorded at the density belt transects in the CDS.
In the CDG, mean woody plant density was 2,381 plants/acre. Four species in the CDG had densities greater than 200 plants/acre. These species include broom snakeweed, cat-claw mimosa (Mimosa aculeaticarpa), mariola, and honey mesquite. A total of 11 species in this stratum had stem heights greater than 1 m. High mass (Aloysia wrightii), netleaf hackberry, tarbush, one-seed juniper, creosote bush, cat-claw mimosa, honey mesquite, scrub-live oak (Quercus turbinella), little-leaf sumac (Rhus microphylla), and three-leaf sumac (Rhus trilobata) each had stems taller than 1 m in the CDG. The CDG stratum had the highest woody species richness according to density data. A total of 27 woody species were encountered within belt transects in this stratum.
Mean woody plant density in the disturbed area/waste rock pile stratum was 2,779 plants/acre. Twenty woody species were recorded at belt transects in the disturbed area/waste rock pile stratum. Feather dalea had a much higher density (519.8 plants/acre) here than in both of the control sites (CDS and CDG). Stems taller than 1 m were encountered on nine species including, yerba-de-pasmo, California brickelbush, Apache plume (Fallugia paradoxa), tarbush, creosote bush, Torrey’s wolfberry, cat-claw mimosa, honey mesquite, and little-leaf sumac.
The tailing dam had a mean woody plant density of 1,951 plants/acre. Like the disturbed area/waste rock pile stratum, feather dalea had a relatively high density (785.4 plants/acre) in the tailing dam stratum. Stems taller than 1 m were observed on five species—yerba-de-pasmo, California brickelbush, Apache plume, honey mesquite, and little-leaf sumac. Only seven woody species were encountered along density belt transects at this stratum.
Woody species were encountered along five of the 10 belt transects in the pit stratum. Mean woody plant density across transects was 291.5 plants/acre. Only two species, saltcedar (Tamarix chinensis) and California brickelbush, had stems taller than 1 m. In addition to these two species, Wright’s buckwheat (Eriogonum wrightii), Apache plume, broom snakeweed, and honey mesquite were recorded at density transects in the pit stratum.
Mean woody plant density in the arroyo stratum was 6,005 plants/acre. Nine woody species occurred in density transects in this stratum. Burro bush and Emory’s baccharis each had a mean density in excess of 1,800 plants/acre. These two species were also the only species with stem heights greater than 1 m according to the field-collected data; however, this is somewhat misleading. Trees such as Plain’s cottonwood (Populus fremontii), Goodding’s willow (Salix gooddingii), netleaf hackberry, soapberry (Sapundus saponaria), little walnut (Juglans microcarpa), and Emory oak (Quercus emoryi) were present in other portions of the arroyo. Several additional shrub species that occurred in the arroyo stratum would have also contributed more stems greater than 1-m tall if the sampling intensity had been higher.
New Mexico Copper Corporation Copper Flat Baseline Data Characterization Report
Copper Flat Mine 4-18 Section 4: Vegetation Survey Results June 2012
4.4.1.4 Diversity
Table 4-8 lists all the plant species observed during species inventories and quantitative data collection in the Permit Area along with native status, lifeform, and duration (or life history). A total of 175 species were encountered during the various surveys. Ten tree species, 32 shrub species, 93 forb species, and 40 grass species were observed in the Permit Area. Tree species contributed 5 percent of all the species observed at the site while shrubs, forbs, and grasses contributed 18, 53, and 23 percent, respectively. Only 27 species observed at the site during inventories were not captured in quantitative transect data.
In previous projects, Parametrix botanists observed inconsistencies among authors, databases, and other regional or nationwide sources in descriptions of the longevity or life history (annual, perennial, biennial) of plant species, as well as the native status (native or introduced). As a result of variable precipitation and temperature throughout a growing season, including habitat, a plant species may complete its lifecycle from germination to seed production in a single year or multiple years. This factor sometimes led to other professionals assigning multiple durations for a single plant species, as is also common in the USDA PLANTS database (plants.usda.gov). After reviewing multiple sources, and with consideration of field observations at the project site, a Parametrix botanist assigned the most appropriate class for each species.
Perennial plant species or species coded as perennial/biennial contributed 125 plant species, or 71 percent of the total number of species observed at the site. Annuals, biennials, or combinations therein (annual/biennial, annual/biennial/perennial, etc.) contributed 29 percent towards the total number of plant species observed, or 50 species. A total of 160 native plant species and 15 non-native plant species were recorded at the site.
Results of the S-W Index analyses yielded somewhat surprising results. Perennial plant and total plant cover index scores were highest in the disturbed area/waste rock pile stratum followed by the CDS, CDG, tailing dam, pit, and arroyo, in that order (Table 4-9). High index scores in the disturbed areas/waste rock piles might be attributed to their early successional nature and overall variable conditions, which perhaps contributed to a higher than expected diversity. Some portions of this stratum contain piles of waste rock nearly void of vegetation and other portions have been reclaimed. Species evenness was also relatively high in the disturbed area/waste rock pile stratum, which contributed to the high score. This may be a result of previous reseeding efforts. Results of this index are promising for future reclamation potential at this site.
S-W Index scores were relatively high in each of the control sites. The CDG and CDS strata had perennial plant cover index scores of 2.89 and 3.01, respectively. Both communities contained high diversity and evenness. The difference in index scores between perennial plant cover and total plant was higher in the CDS community than the CDG community. This is attributed to higher annual plant diversity in the CDS community. A total of 21 annuals were encountered in the CDS stratum while 14 were recorded at transects in the CDG stratum. Note that cover results tables in Appendix 4-A also contain detailed S-W Index results.
A total of 84 species were intercepted with cover hits in the CDG stratum, which had a higher species richness than any of the other strata sampled (Table 4-10). Twenty-three perennial grass species, 24 perennial forbs, 23 shrub/tree species, and 14 annuals were encountered at cover transects in this stratum. The CDS had the second highest total number of species captured along cover transects, with 69. This stratum also had the highest number of annuals (21). A total of 15 grass species, 17 perennial forb, and 16 shrub/tree species were recorded in the CDS cover data. Cover transects at the disturbed area/waste rock pile stratum intercepted 65 total species. Perennial grasses, perennial forbs, shrubs/trees, and annuals contributed 19, 16, 13, and 17 species, respectively. Cover transects captured a much lower diversity at the tailing dam (23 total species), pit (10), and arroyo (8) strata than the other types. Low diversity in the arroyo type could partially be attributed to the small sample size and the timing of the survey (early June).

New Mexico Copper Corporation Copper Flat Baseline Data Characterization Report
Copper Flat Mine 4-19 Section 4: Vegetation Survey Results June 2012
4.4.1.5 Sample Adequacy
A total of 96 vegetation monitoring transects were sampled in the Permit Area. Sampling intensity within each stratum was based on a small pilot study at the site (Parametrix, 2010b). While obtaining statistical sampling adequacy for each variable measured under this study would have been unrealistic, sometimes requiring several thousand transects per stratum, the goal was to meet statistical sampling adequacy for perennial plant species cover in each stratum with the exception of the arroyo. This goal was achieved at two of the five remaining strata (Table 4-11). Cover summary tables in Appendix 4-A also contain detailed sampling adequacy results at the lifeform level. Because of the history of disturbance at the site, variable soil depths, unnaturally variable soil substrate from previous mining, variable water collection patterns in crevices or at the base of waste rock, and patchy earlier reclamation efforts, anomalous vegetated microsites are frequently found throughout the site. Vegetation communities with this distribution create variability both within a transect and across transects in a stratum. This distribution creates extreme challenges to obtaining sample adequacy. The botanists also hesitated to move transects into other strata to achieve lower standard deviation values because this could have led to underestimating the amount of heterogeneity within a stratum.
Vegetation on the tailing dam was more evenly distributed than in the disturbed area/waste rock pile stratum. Based on the cover data, 9.7 transects were adequate for meeting statistical sampling adequacy in the tailing dam stratum; therefore, the ten transects selected for study were sufficient. These ten transects were also adequate for capturing total vegetation cover and total cover. Vegetation species distribution was relatively even in the disturbed area/waste rock pile stratum as illustrated by the relatively high S-W Index. Perennial cover, however, was extremely variable between transects. Statistical sample adequacy for perennial cover in the disturbed area/waste rock pile stratum required 104 transects. A total of 25 transects were read in this stratum.
Any vegetation encountered in the pit stratum resulted in extremely high standard deviation values. Standard deviation values exceeded the mean cover for each lifeform in this stratum. Based on sample adequacy calculations, 3,032 transects were required in this very small stratum.
Sample adequacy was achieved in the CDG stratum for perennial plant cover, total vegetation cover, and total cover. This stratum included the majority of the projected mine footprint. In fact, according to sample adequacy calculations, this stratum was oversampled. A total of 8.9 transects were adequate whereas 29 were measured in the CDG. Total cover sample adequacy was obtained in the CDS stratum but 49 transects would have been required to adequately capture total vegetation cover. A total of 39 transects would have met statistical sample adequacy in the CDS stratum; however, only 19 were measured.
4.4.1.6 Noxious Weeds
The State of New Mexico, under the administration of the Department of Agriculture, lists certain weed species as noxious weeds. “Noxious” in this context means plants not native to New Mexico that are targeted for management and control and that have a negative impact on the economy or environment. Class C listed weeds (CCW) are common, widespread species that are fairly well established within the state. Class B weeds (CBW) are considered fairly common, but not yet widespread within certain regions of the state. Class A weeds (CAW) have limited distributions within the state.
Only one noxious weed species was observed in the Permit Area. Saltcedar patches were encountered along the pit lake and sporadically along Greyback Arroyo. Detailed riparian vegetation maps (Appendix 4-D) show locations where saltcedar is most prominent in the Permit Area. Polygons with “SC” noted as a co-co-dominant species contained saltcedar with at least 25 percent of the relative overstory or understory cover, depending on

New Mexico Copper Corporation Copper Flat Baseline Data Characterization Report
Copper Flat Mine 4-20 Section 4: Vegetation Survey Results June 2012
which side of the slash (“/”) SC is listed. For more information on the total acres dominated by saltcedar in the Permit Area, see Section 4.4.1.8 (Riparian Vegetation Types) below.
4.4.1.7 Rare, Threatened, or Endangered Species
No rare, threatened, or endangered species, or plant species of concern were encountered in the Permit Area. Table 4-12 lists plant species of concern known to occur in Sierra County, agency status, and habitat notes. General habitat requirements were present in the Permit Area for two New Mexico species of concern: Sandberg pincushion cactus (Escobaria sandbergii) and Wright’s campion (Silene wrightii). Habitat criteria for the U.S. Fish and Wildlife Service (USFWS) species of concern and state-listed endangered Duncan’s pincushion cactus (Escobaria duncanii) was marginally present in the Permit Area, although the only known New Mexico population is northeast of the Permit Area at the base of Mud Mountain near Black Chute Mine (SEINet, 2011). Mud Mountain lies approximately 4 miles west of Truth or Consequences.
4.4.1.8 Riparian Vegetation Types
A detailed riparian and arroyo vegetation map was delineated for arroyo habitats along Greyback Arroyo, the pit lake fringe, and the diversion channel. As described in Section 4.3 (Methodology), the H&O vegetation classification was used to assign appropriate types based on ocular estimates of species cover in the overstory and understory canopy layers. Some species, baccharis in particular, appeared moisture stressed. It was commonly observed that baccharis plants had senesced leaves down to the base and resprouted new leaves from below ground rather than on existing aboveground stems. The Parametrix botanists did not commonly observe this habit in sites with higher soil moisture where baccharis is common, such as riverside sandbars in southern reaches of the Rio Grande. They were not able to determine from reviewing previous research from scientific journals, or other sources, if this is a typical response to moisture stress or other environmental conditions for this species. During ocular estimates of baccharis cover, the field botanist used best professional judgment to decide if baccharis or total shrub cover (as a result of likely increased baccharis cover) would exceed 25 percent later in the growing season—the minimum threshold for a woody structure type or co-dominant species designation in the H&O system. The probable late-season height for baccharis was also used to determine the appropriate structure type. Based on dead baccharis stems from the previous growing season, most of the baccharis was taller than 5 ft in 2010.
Figures in Appendix 4-D map the distribution of individual H&O types delineated throughout the Permit Area. Table 4-3 explains how structure types are differentiated in the H&O system. In order to meet co-dominant species criteria in the H&O system, a species must comprise at least 25 percent of the relative cover in the canopy layer. A total of 49.8 acres of riparian/arroyo habitat was delineated in the Permit Area (Table 4-13). Structure type 5 (shrubs taller than 5 ft with >25 percent total shrub cover) was the most common structure type observed. A total of 34.0 acres (or 68 percent of the arroyo/riparian habitat) was classified as structure type 5.
Structure types 3 and 4 were relatively similar in area. Areas characterized as structure type 3 included two canopy layers—an overstory structure that is between 20 and 40 ft tall growing above a shrub understory. Structure type 4 is a woodland with similar overstory structure as a type 3, minus the understory layer. A total of 7.4 acres were mapped as structure type 3 while 5.9 acres were mapped as structure type 4.
Structure type 6 was also encountered in the arroyo habitat. Structure type 6 is composed of shorter (generally <5 ft tall) shrubs with >25 percent cover. Many of the surrounding CDS portions of the Permit Area may meet structure type 6 criteria. However, this type was only included in the arroyo/riparian vegetation mapping if

New Mexico Copper Corporation Copper Flat Baseline Data Characterization Report
Copper Flat Mine 4-21 Section 4: Vegetation Survey Results June 2012
typical arroyo indicator species were present. Arroyo vegetation mapping stopped as the vegetation community became more similar to surrounding uplands. A total of 2.4 acres were mapped as structure type 6.
A small (0.1 acre) cattail (Typha latifolia) community was observed along the fringe of the pit lake. Cattail marshes were assigned a “MH” type (for “Marsh Habitat”) according to the H&O convention. This type occurred in a small depression along the outside edge of the pit perimeter. No open water was present in the cattail community during the time of the survey although the location had relatively high soil moisture.
With the exception of the pit lake, open water was only observed in one location in the Permit Area. This occurred in the arroyo bottom immediately downstream of a large culvert (see maps in Appendix 4-D). The riparian vegetation surrounding the small (approximately 10 ft x 20 ft during the time of the survey) open water feature was dominated by Goodding’s willow, referred to as “TW” (for “Tree Willow”) in H&O vegetation maps, and Emory’s baccharis, referred to as “B” (for “Baccharis”) in the H&O convention.
Note that since multiple species can be assigned as co-dominants in both the overstory and understory canopy layers in the H&O system, the sum of acres for co-dominant species is not equal to the sum of the total acres mapped. In other words, a 5-acre area can contain both baccharis and cottonwood as co-dominant species; therefore, 5 acres would be reported for both species in the following paragraphs.
Baccharis was the most prominent species in the arroyo/riparian habitats in the Permit Area based on the vegetation delineations (Table 4-14) conducted by Parametrix. This species was included as a co-dominant species in 22.2 acres. Burro bush (15.5 acres) was the next most abundant co-dominant species after baccharis. Baccharis and burro bush were frequently found together in the same polygon in Greyback Arroyo although baccharis appeared to prefer slightly more moist conditions than burro bush. Baccharis was common on microsites within the arroyo bottom or the immediate fringe. Burro bush appeared to be more frequent from the arroyo fringe to lower terraces. Figure 4-9 includes photographs of typical burro bush and baccharis habitats in the Permit Area.
More typical southwestern riparian indicators such as cottonwood and Goodding’s willow were encountered in relatively small areas of the Permit Area. Cottonwood (“C” in the H&O designations) was classified as a co-dominant species in 5 acres. Goodding’s willow-dominated communities totaled 1.8 acres. Cottonwood (Populus fremontii) was more widely distributed than Goodding’s willow. Willow trees were restricted to a single location within the Permit Area. Figure 4-10 contains representative photographs of cottonwood and willow habitat at the site.
Netleaf hackberry (“NLH” in the H&O designations) woodlands composed 2.5 acres of the Permit Area. This species appeared to favor higher terraces along the arroyo or the transition zone between the arroyo and surrounding hills. Emory’s oak (“Qu” in the H&O designations) was found in isolated drainages in the Permit Area. Because Greyback Arroyo and the diversion channel were the primary areas of interest for this mapping effort, small oak woodlands that occurred in drainages outside of Greyback Arroyo were likely under-represented in the detailed mapping.
Honey mesquite (“HM” in the H&O designations) was included as a co-dominant species in arroyo habitat types across 13.8 acres of the Permit Area. Honey mesquite communities were only included in the detailed mapping if they either were found as a tree growth form or they coexisted with more typical arroyo habitat species.
Saltcedar (“SC” in the H&O designations) was mapped as a co-dominant species in 7.6 acres of the Permit Area. Patches were concentrated along the fringe of the pit lake and the bottom of Greyback Arroyo near the main entrance to the mine. Figure 4-11 includes representative photographs of saltcedar communities at both locations.

New Mexico Copper Corporation Copper Flat Baseline Data Characterization Report
Copper Flat Mine 4-22 Section 4: Vegetation Survey Results June 2012
Apache plume was a co-dominant species in 10 acres of the arroyo habitat. Apache plume (see “AP” in the H&O designations) occurred on relatively high terrace surfaces along Greyback Arroyo. Rubber rabbitbrush (Ericameria nauseosus) and velvet ash (Fraxinus velutina) were also considered co-dominant species in portions of the arroyo habitat. Rabbitbrush (“RB” in the H&O designations) dominated a small, 0.4-acre section of the diversion channel while velvet ash (“VA” in the H&O designations) was mapped in 0.7 acres. Isolated single soapberry (Sapundus saponaria) and little walnut (Juglans microcarpa) trees were observed along the arroyo but never with sufficient cover quantities to warrant inclusion in a map unit.
4.4.1.9 Wetlands and Jurisdictional Waters of the U.S.
Jurisdictional wetlands, those protected from unauthorized dredge and fill activities under CWA Section 404 (33 USC 1344), have three essential characteristics: (1) dominance by hydrophytic vegetation, (2) hydric soils, and (3) wetland hydrology. To be jurisdictional, a wetland must have a significant connection to a known jurisdictional, navigable waterway. Executive Order 11990 (Protection of Wetlands) requires the avoidance, to the greatest extent possible, of both long- and short-term impacts associated with the destruction, modification, or other disturbance of wetland habitats.
Two locations within the Permit Area appeared to meet vegetation, soil, and hydrologic conditions defined by the CWA, although formal wetland delineations were not completed. The first location was a small cattail wetland adjacent to the pit lake (see vegetation maps in Appendix 4-D). Based on preliminary discussions with the USACE, this wetland was not considered jurisdictional because there was no significant connection to a jurisdictional, navigable waterway.
The second location that met general wetland criteria was the Goodding’s willow forest (Figure 4-12) near the main mine entrance (visible on maps in Appendix 4-D). For vegetation mapping purposes, the patch size was determined to be 1.5 acres. However, Goodding’s willow trees extended beyond the smaller area that would likely meet hydric soils and hydrologic criteria. It is likely that the portion of the polygon that met all three wetland criteria was <0.5 acre.
4.4.2 Pipeline Corridor
Much of the proposed Baseline Study Area consists of existing roads (paved and unpaved), associated rights-of-way, a power utility corridor, and areas previously cleared around well sites. In addition, heavy cattle grazing has affected vegetation over large portions of the proposed project corridor. During the 2010 and 2011 field surveys, 67 species of plants were observed within the proposed pipeline corridor (Table 4-15). The dominant plant species observed within the site consisted of low woollygrass (Dasyochloa pulchella), weeping lovegrass (Eragrostis curvula), spreading buckwheat, tarbush, broom snakeweed, creosote bush, tobosa grass (Pleuraphis mutica), and honey mesquite. These species were observed fairly uniformly throughout the proposed pipeline corridor.
No state-listed noxious weeds were observed within the pipeline corridor during the 2010 and 2011 botanical surveys. Based on NWI data and field verification, wetlands are not present within the proposed pipeline corridor. Suitable habitat for state- or federally listed threatened, endangered, or sensitive plant species, or species of concern observed during the field surveys was marginal due to previous and current disturbance. No species listed as threatened or endangered were observed during the surveys.
4.4.3 Arizona Sycamores at Las Animas Creek
Arizona sycamore was the primary species of interest at Las Animas Creek. While this species was relatively widespread through the study area, recent sycamore recruitment was restricted to a 0.5 mile long segment of
New Mexico Copper Corporation Copper Flat Baseline Data Characterization Report
Copper Flat Mine 4-23 Section 4: Vegetation Survey Results June 2012
Las Animas Creek where isolated seedlings or saplings and sometimes patches of saplings or poles were observed (Figure 4-13). This portion of the study area, referred to as the “recruitment zone”, is delineated in maps under Appendix 4-E. The 12.5 acre recruitment zone was relatively unique compared to the rest of the site in that: (1) young Arizona sycamores were present, (2) the upstream portion of the recruitment zone had a floodplain surface that appeared to be regularly flooded during peak runoff or monsoonal flash floods, (3) surface water was present through most of this stream segment, and (4) recent alluvial deposition was sometimes encountered.
As previous research from other river systems (see Section 4.3.3) has described, Arizona sycamore recruitment also appeared to be episodic and sporadic along Las Animas Creek. Most of the individuals classified as pole, sapling, or seedling cohorts appeared to be similar age, and may have established during identical recruitment episodes. Recruitment did not appear to be an annual occurrence, even in the recruitment zone, and we suspect that none of the individuals observed germinated during the past year. Many of the new recruits were also in the channel bottom and vulnerable to uprooting during high flow events.
Favorable conditions for gamet reproduction were rarely observed in the Baseline Study Area. The entire study reach was privately owned and homes and other structures have been constructed immediately along the banks of the creek, especially in the eastern half of the study area. Previous and on-going channel construction projects have straightened the active channel, removed vegetation, bermed the banks, and confined the creek to a deep, narrow channel to varying degrees (Figure 4-14). While canalization of the active channel was critically important to protecting structures, these efforts have greatly reduced the potential for Arizona sycamore recruitment thereby reducing the biotic integrity of the population. It’s also likely that these activities have lowered alluvial groundwater in the study area, which according to previous research (summarized in Section 4.3.3), results in reduced growth rates and vigor in Arizona sycamore.
To date, however, the Arizona sycamore population through the study area has displayed relatively little canopy dieback or mortality. While stressed individuals were observed, their distribution was inconsistent. Map notations in Appendix 4-E identify a location where pronounced canopy dieback was consistently observed. Middle aged trees appeared to most commonly display indications of stress. According to a local resident of the Animas valley, bark sloughing has become more pronounced in recent years (Chatfield, 2011). Increased bark sloughing has not been identified as a response to moisture stress or disease in existing research to our knowledge.
Previous mining ventures distributed potted Arizona sycamore trees to property owners in the Animas valley (Chatfield, 2011). Cultivated sycamore trees appeared to have been most extensively planted along the eastern half of the Baseline Study Area. Under the current conditions through most of the study area, this may be the most viable option for establishing a new generation of Arizona sycamore.
4.4.3.1 Riparian Vegetation Types
The riparian mapping along Las Animas Creek characterized 463 acres of riparian forest and woodland habitats. H&O structure type 1 was the most abundant structure type in the study area. A total of 231 acres (or 50 percent) of the riparian area was considered structure type 1 (Table 4-16). Much of this area, however, was very similar in canopy structure to a structure type 2 community. Understory layers were sometimes broken and scattered. About 118 acres, or 26 percent of the study area was classified as structure type 4. Structure type 4 was the second most widespread structure type. Structure types 4 and 3 composed 59 and 48 acres, respectively. Type 3 communities were most common in the floodplains adjacent to reaches with surface water observed during our field visits while open woodland communities (structure type 4) were most common in the upstream portion of the study area. Riparian shrublands (structure types 5 and 6) were not encountered and

New Mexico Copper Corporation Copper Flat Baseline Data Characterization Report
Copper Flat Mine 4-24 Section 4: Vegetation Survey Results June 2012
arroyo shrubland habitats were not mapped in this study area, though they were commonly observed in the western-most and eastern-most reaches. Isolated patches of cultivated pecan, fruit, and pistachio trees were also digitized but not assigned a riparian structure type. These cultivated patches occupied 7 acres.
Arizona sycamore (“AS” in H&O mapping) was the most abundant co-dominant species (Table 4-17). Arizona sycamore was included as a co-dominant species in 262 acres, or 57 percent of the riparian habitat along Las Animas Creek. Sycamore gallery forests were more common in the eastern-half of the study area. Most of the Arizona sycamore co- dominated communities were considered mature forests (structure type 1 or 2). Cottonwood gallery forests were delineated throughout the study area, but more consistently in the western half. A total of 213 acres (46 percent) of the riparian area contained cottonwood (“C” in H&O maps) as a co-dominant. Cottonwood was considered a co-dominant in structure type 1, 2, 3, and 4 habitats.
A total of 226 acres (49 percent) of the riparian habitat was co- dominated by netleaf hackberry (“NLH” in H&O designations). Netleaf hackberry was associated with several species through the study area. This species was even a common understory component beneath Arizona sycamore and cottonwood gallery forests. Very few monotypic netleaf hackberry woodlands were observed in the Las Animas Creek study area compared to the Percha Creek site.
Velvet ash was the fourth most abundant co-dominant species. This species (“VA”) was a significant component in riparian types across 38 percent (176 acres) of the study area. Velvet ash and little walnut frequently displayed canopy dieback throughout the study area. Stress indicators were most evident with these species in the western-most and southern portions of the study area. Little walnut was a co-dominant component in 23 acres.
Tree willow (53 acres) and coyote willow (26 acres) co- dominated stands were restricted to areas with surface water. Areas with surface water in the channel had an increased compositional diversity compared with surrounding, drier sites. Young tree willow (“TW”) and cottonwood seedlings were commonly observed along the channel bottom through this portion of the study area, though they’ll easily wash away during a flash flood. Tree willow was also observed but not considered a co-dominant in the upstream portion while coyote willow (“CW” in H&O) distribution was more restricted to polygons where it was considered a co-dominant. Coyote willow individuals, though not widespread, were extremely tall and robust compared to the species’ typical growth habit.
Approximately 85 acres of the riparian habitat contained a burro bush understory. Burro bush (“BB”) communities were underrepresented since arroyo shrublands were not included in map delineations for the Las Animas Creek study area. Baccharis (“B”) communities were also not entirely delineated. Baccharis and burro bush were abundant components of the arroyo habitats in the upstream- and downstream-most reaches. Desert willow was also sometimes associated with these two species along with honey mesquite.
Honey mesquite was also a component in riparian forests and woodlands across 72 acres (15 percent) of the study area. Honey mesquite was frequently associated with velvet ash in open woodlands or as an understory component beneath Arizona sycamore and/or cottonwood gallery forests. This species (“HM”) was typically observed in its tree growth form under these conditions. Soap berry (“SB”) and grey oak (“GO”) were mapped as co-dominants across approximately 3 acres.
Several invasive exotic species were also observed in the Las Animas Creek study area. Siberian elm (2 acres), mulberry (<1 acre), and saltcedar (<1 acre) were considered co-dominants across a relatively small area. A very small linear band of tree of heaven was observed along a property fence in the eastern half of the study area but not captured in riparian mapping. Each of these species have been challenging to manage in the Rio Grande valley.
New Mexico Copper Corporation Copper Flat Baseline Data Characterization Report
Copper Flat Mine 4-25 Section 4: Vegetation Survey Results June 2012
4.4.3.2 Reference Tree Characteristics
Tagged and measured Arizona sycamore trees significantly varied in size and health condition. Reference tree height estimated ranged from just over 5 ft to 116 ft (Table 4-18). The dbh was also highly variable, as intended. A young seedling-sized individual growing on the bank of Las Animas Creek had a measured dbh of 0.2 inches. The largest dbh recorded was 88.5 inches. Several trees had multiple stems and a dbh of each stem was recorded when multiple stems were encountered. This sometimes occurred on large trees, taller than 100 ft, such as tree tag 993.
Stress indicators such as canopy dieback and dead branches were also highly variable (Figure 4-15). Two of the reference trees (tags 897 and 995) had >25 percent canopy dieback. Both trees were approximately 25 ft tall. Based on general observations in the study area, trees in this size class displayed stress indicators most frequently. Another tree (tree tab 885) had an estimated canopy dieback of 10 percent. This individual was much larger (76.8 dbh) than the other two reference trees with significant canopy dieback. Each of these three reference trees also contained dead branches.
The majority of the reference trees measured, however, appeared healthy -- showing little to no indication of moisture stress or disease. We recommend re-visiting each of the 25 reference trees on a regular, semi-annual basis, to re-photograph and re-measure.
4.4.4 Percha Creek
Riparian and arroyo-riparian vegetation communities were documented along a 15-mile segment of Percha Creek in support of this report. The survey area included the Percha Box reach. Detailed riparian vegetation mapping was integrated into this study in response to agency comments on the SAP (Parametrix, 2010a). Vegetation types were delineated for approximately 950 acres (Table 4-19). Similar to the other detailed riparian vegetation maps in this report, stand classification followed the H&O convention with minor adaptations to include additional (non-Rio Grande bosque) species in the system. The botanists mapped arroyo habitat types in addition to more typical riparian types to allow potential future researchers to measure net gains or losses for either general type. Stream flow was observed during the October 2011 fieldwork along a 4-mile-long section of the stream through Percha Box (see maps in Appendix 4-F). The perennial reach of Percha Creek contained more riparian indicator species than areas downstream or upstream of Percha Box. Based on general observations in Percha Box, disturbances important for maintaining ideal biohydrology for riparian species, such as regular flooding, are still relatively intact. Recent flood debris deposits were observed as high as approximately 20 ft above the active channel in portions of the narrow slot canyon. Flood disturbance appears to be so frequent in one short, particularly narrow section of the canyon, that riparian tree species are short-lived and absent.
The detailed vegetation maps for the areas along Percha Creek are provided in Appendix 4-F. The most prominent H&O structure type delineated was type 5 (shrubs). See Table 4-3 for a general description of H&O structure types. A total of 654.6 acres (or 69 percent of the Percha Creek study area) were considered structure type 5 (Table 4-19). Dense multistoried riparian communities (structure types 1 and 3) were also documented during the assessment. Structure type 3 communities composed 17 percent of the riparian/arroyo area, or 156.9 acres. Communities designated as structure type 1 totaled 11.3 acres or 1 percent of the Baseline Study Area. Woodland types (structure types 2 and 4) were also well represented in the Percha Creek study area. A total of 91.3 acres of structure type 4 communities were delineated. Structure type 4 communities consisted of 10 percent of the detailed mapping area. Structure type 2 communities composed 4 percent of the riparian/arroyo mapping area, or 34.7 acres. No structure type 6 or non-woody structure types (such as cattail marshes) were recorded in the site although two very small (20 by 50 ft2) streamside patches of cattail were

New Mexico Copper Corporation Copper Flat Baseline Data Characterization Report
Copper Flat Mine 4-26 Section 4: Vegetation Survey Results June 2012
observed in Percha Box. It should be noted, however, that many of the baccharis and burro bush-dominated communities in the study area could arguably be better represented as type 6 structure types.
Burro bush (“BB” in the H&O designations) was the most widespread co-dominant species (Table 4-20). Burro bush was considered a co-dominant species in 636.0 acres of the Percha Creek study site. This species was common on side terraces upstream and downstream of Percha Box. Relatively little burro bush was found in the perennial reach. Burro bush-dominated terraces also typically contained upland shrub species and Apache plume. Baccharis (“B” in the H&O designations) was also abundant throughout the study area. A total of 419.4 acres were composed of baccharis as a co-dominant. Baccharis was common within the arroyo bottom and along the active channel margins in most of the site. Figure 4-16 includes representative photographs of the baccharis communities along Percha Creek. This species also sometimes inhabited lower terraces and side bars. Baccharis shrubs appeared moisture stressed in the non-perennial reaches. Relatively large areas were observed with dieback and resprouting. Seepwillow flourished in the perennial reach. Vibrant stems and generally taller individuals were observed in Percha Box.
Cottonwood, Gooding’s willow, or a combination of both species was observed at 307 acres of the Percha Creek site (32 percent of the mapped area). Goodding’s willow and cottonwood were mapped as co-dominant species in 50.5 acres and 156.4 acres, respectively. Figure 4-17 includes representative photographs of the Goodding’s willow communities observed along Percha Creek. This species was particularly abundant throughout Percha Box. Recent recruitment of Goodding’s willow was observed regularly in the Percha Box reach. Seedling and sapling-sized willow trees were frequently encountered. Goodding’s willow-dominated stands were almost exclusively restricted to portions of Percha Creek with perennial water.
A broad range of cottonwood age/size cohorts were observed in the Percha Creek study area, although seedling recruitment was encountered less frequently than for Goodding’s willow. Extremely large cottonwood trees were present on historic floodplain surfaces as the canyon widened in the downstream portions of Percha Box, while narrower portions of Percha Box had an abundance of cottonwood poles. Cottonwood was more widely distributed throughout the Percha Creek study area than Goodding’s willow. The current health of cottonwood trees was variable throughout the Percha Creek study site. Isolated trees in the arroyo bottom or on low floodplain terraces upstream of Percha Box had dead upper branches. Cottonwood trees in the perennial reaches, however, showed no signs of stress. Figure 4-18 contains photographs of cottonwood-dominated stands along Percha Creek.
Coyote willow (Salix exigua) was less common than cottonwood or Goodding’s willow. This species (“CW” in the H&O designations) was considered a co-dominant species in 13.4 acres of the Percha Creek study area. Coyote willow was encountered in an isolated depression upstream of Percha Box and also (but infrequently) within Percha Box. Figure 4-19 shows representative photographs of coyote willow-dominated communities in the Percha Creek study area.
Netleaf hackberry (“NLH” in the H&O designations) was observed throughout the study area at Percha Creek. This species frequently occurred on higher geomorphic surfaces than the other riparian tree species. Hackberry woodlands (type 4 communities) were common at the base of surrounding upland hill slopes. Netleaf hackberry-dominated types were delineated in 152 acres.
Little walnut (“LW” in the H&O designations) was mapped as a co-dominant species in 45.2 acres. Woodlands and forests, composed at least partially of little walnut, were primarily restricted to downstream of Percha Box. Little walnut frequently displayed indications of stress. Most of the trees observed in the study area had senesced leaves from their upper branches (Figure 4-20).
Velvet ash (“VA” in the H&O designations) was fairly well distributed in the riparian portions of Percha Creek. Ash was mapped as a co-dominant species across 43.2 acres. Stands co- dominated by this species were
New Mexico Copper Corporation Copper Flat Baseline Data Characterization Report
Copper Flat Mine 4-27 Section 4: Vegetation Survey Results June 2012
observed both upstream and downstream of Percha Box. This species displayed signs of moisture stress in the non-perennial reaches less frequently than little walnut.
Two state-listed noxious weed species were classified as co-dominants in the Percha Creek study area. Tree of heaven (Ailanthus altissima) and Siberian elm (Ulmus pumila) were each encountered. Tree of heaven (“TH” in the H&O designations) was a co-dominant in 4.5 acres of the site. Tree of heaven was restricted to areas just downstream of the bridge crossing in Hillsboro (Figure 4-21). Siberian elm was more widely distributed, as individuals were observed upstream and downstream of Percha Box. Elm was a co-dominant in 22.3 acres.
Desert willow was a co-dominant species in 34.2 acres. Most of the acreage from this species was attributed to a fairly large, isolated patch well downstream of Percha Box. Desert willow and burro bush composed most of this particular stand.
Honey mesquite and burro bush terraces dominated the downstream portions of the Percha Creek study area. Honey mesquite-dominated communities were mapped across 319.7 acres. These terraces typically also contained Apache plume and a diverse suite of upland shrubs such as cat-claw acacia (Acacia greggii), whitethorn acacia (Acacia constricta), and cat-claw mimosa. Three-leaf sumac and little-leaf sumac were also associated with this type. In some cases, shrub species distribution was so variable that it was difficult to assign an appropriate H&O type; as a result, the botanists assigned the honey mesquite-burro bush complex for consistency.
Planted ponderosa pine (Pinus ponderosa) trees and cedar cultivars were mapped around houses in Hillsboro. These trees occurred on the north side of the Creek.
4.5 References Bock, J.E. and Bock, C.E., 1989, Factors limiting sexual reproduction in Plantanus wrightii in southeastern
Arizona: Aliso 12, p. 285-301.
Bureau of Land Management (BLM), 1999, Preliminary final environmental impact statement: Copper Flat project: Las Cruces, N. Mex. U.S. Department of the Interior, 491 p.
Carter, J.L., 1997, Trees and Shrubs of New Mexico: Silver City, N. Mex., Mimbres Publishing, 534 p.
Chatfield, Harvey, 2011, personal communication.
Clark, D.L., 2001, Stabilization of the mean as a demonstration of sample adequacy: Albuquerque, N. Mex., American Society for Surface Mining and Reclamation Annual Meeting, June 3-7, 2001.
Dick-Peddie, W.A., 1999, New Mexico vegetation: past, present, and future: Albuquerque, N. Mex., University of New Mexico Press, 280 p.
Ernest, S.K., Brown, J.H. and Parmenter, R.R., 2000, Rodents, plants, and precipitation: spatial and temporal dynamics of consumers and resources: Oikos 88, p. 470-482.
Flora of North America (FNA), 2011, eFloras available online at: http://www.efloras.org.
Glinski, R.L., 1977, Regeneration and distribution of sycamore and cottonwood trees along Sonoita Creek, Santa Cruz County, Arizona: USDA Forest Service General Technical Report RM-43, p. 116-123.
Hadley, N.F. and Szarek, S.R., 1981, Productivity of desert ecosystems: BioScience 31, p. 747-753.
Hink, V.C. and Ohmart, R.D., 1984, Middle Rio Grande Biological Survey. Final Report to the U.S. Army Corps of Engineers: Albuquerque, NM, 193 pages.

New Mexico Copper Corporation Copper Flat Baseline Data Characterization Report
Copper Flat Mine 4-28 Section 4: Vegetation Survey Results June 2012
Krebs, Charles, 1989, Ecological methodology: New York, HarperCollins.
Muldavin, E.H., Moore, D.I., Collins, S.L., Wetherill, K.R. and D.C. Lightfoot, 2008, Aboveground net primary production dynamics in a northern Chihuahuan Desert Ecosystem: Oecologia 155, p. 123-132.
Natural Resources Conservation Service (NRCS), 2007, Reference sheet for Gravelly R042XB010NM, available online at: http://www.nm.nrcs.usda.gov/technical/fotg/section-2/esd/1983mlramap/sd-2/sd-2gravelly.pdf.
Natural Resources Conservation Service (NRCS), 2010, Ecological site descriptions, available online at: http://esis.sc.egov.usda.gov/ESIS/About.aspx.
New Mexico Rare Plant Technical Council (NMRPTC), 2011, Threatened, Endangered, and Rare plants of Sierra County, NM. Available online at: http://nmrareplants.unm.edu/
Parametrix, Inc., 2010a, Sampling and Analysis Plan for Copper Flat Mine: Parametrix Project 563-6671-001. Submitted to Mining and Minerals Division; New Mexico Energy, Minerals and Natural Resources Department in September 2010. Available online at: http://www.emnrd.state.nm.us/MMD/MARP/ permits/documents/SI027RN_20100909_Copper_Flat_SAP_Vegetation.pdf
Parametrix, Inc., 2010b, Technical memorandum: Preliminary vegetation survey results, Copper Flat Mine: Parametrix Project 563-6671-001.
Plant Maps, 2011, Plantanus wrightii – Arizona sycamore Interactive Native Range Distribution Map. Accessed online at: http://www.plantmaps.com/nrm/platanus-wrightii-arizona-sycamore-native-range-map.php
Sala, O.E. and Lauenroth W.K., 1982, Small rainfall events and ecological role in semi-arid regions: Oecologia 53, p. 301-304.
Shannon, C.E., 1948, A mathematical theory of communication: Bell System Technical Journal 27, p. 379–423 and 623–656.
Southwest Environmental Information Network (SEINet), 2011, Accessed online at: http://swbiodiversity.org/ seinet/index.php
Steffen Robertson and Kirsten, Inc. (SRK), Southwest Rangeland Services, and Adrian Brown, 1997, Copper Flat Mine project monitoring plans: SRK Project 68607.
Stromberg, J.C., 2001a, Biotic integrity of Plantanus wrightii riparian forests in Arizona: first approximation: Forest Ecology and Management 142, p. 251-266.
Stromberg, J.C., 2001b, Influence of stream flow regime and temperature on growth rate of the riparian tree, Plantanus wrightii, in Arizona: Freshwater Biology 46, p. 227-239.
Stromberg, J.C., 2002, Flood flows and population dynamics of Arizona sycamore (Plantanus wrightii): Western North American Naturalist 62, p. 170-187.
Webb, W., Szarek, S., Lauenroth, W.K., Kinerson, R. and Smith, M., 1978, Primary productivity and water use in native forest, grassland, and desert ecosystems: Ecology 59, p. 1239-1247.
Zimmermann, R.L., 1969, Plant ecology of an arid basin, Tres Alamos-Redington Area: U.S. Geological Survey Professional Paper 485-D.

Tables

Table 4-1, Page 1 of 1
Table 4-1 Total Acreage and Measurement Transects of Sampling Strata in Copper Flat Mine Permit Area
Stratum Acres Number of Transects
Access Road 36.5 0
Chihuahuan Desert Grassland (CDG) 932.9 29
Chihuahuan Desert Shrubland (CDS) 260.9 19
Pit 21.4 10
Pit Lake 5.0 0
Arroyo/Riparian 50.5 3
Tailing Dam (TD) 16.6 10
Disturbed Area/Waste Rock Pile 865.7 25
Grand Total: 2,189.5 96

Table 4-2, Page 1 of 4
Table 4-2 Copper Flat Mine Permit Area Vegetation Transect Location
Plot ID Easting Northing ESD Name
General Current Condition Sample Stratum
BD-1 263209 3651245 Hills Relatively Undisturbed Chihuahuan Desert Grassland BD-10 265001 3650562 Hills Relatively Undisturbed Chihuahuan Desert Grassland BD-11 265363 3651055 Hills Relatively Undisturbed Chihuahuan Desert Grassland BD-12 265508 3650873 Hills Relatively Undisturbed Chihuahuan Desert Grassland BD-13 266167 3650510 Gravelly Relatively Undisturbed Chihuahuan Desert Shrubland BD-14 266515 3650374 Gravelly Relatively Undisturbed Chihuahuan Desert Shrubland BD-15 266518 3650239 Gravelly Relatively Undisturbed Chihuahuan Desert Shrubland BD-16 266573 3648908 Gravelly Relatively Undisturbed Chihuahuan Desert Shrubland BD-17 266596 3650026 Gravelly Relatively Undisturbed Chihuahuan Desert Shrubland BD-18 266631 3649237 Gravelly Relatively Undisturbed Chihuahuan Desert Shrubland BD-19 266630 3649489 Gravelly Relatively Undisturbed Chihuahuan Desert Shrubland BD-2 263531 3651087 Hills Relatively Undisturbed Chihuahuan Desert Grassland BD-20 266653 3649388 Gravelly Relatively Undisturbed Chihuahuan Desert Shrubland BD-21 266707 3649813 Gravelly Relatively Undisturbed Chihuahuan Desert Shrubland BD-22 266761 3649749 Gravelly Relatively Undisturbed Chihuahuan Desert Shrubland BD-3 263547 3651220 Hills Relatively Undisturbed Chihuahuan Desert Grassland BD-4 263627 3651004 Hills Relatively Undisturbed Chihuahuan Desert Grassland BD-5 264706 3650991 Hills Relatively Undisturbed Chihuahuan Desert Grassland BD-6 264716 3650838 Hills Relatively Undisturbed Chihuahuan Desert Grassland BD-7 264788 3651116 Hills Relatively Undisturbed Chihuahuan Desert Grassland BD-8 264797 3650967 Hills Relatively Undisturbed Chihuahuan Desert Grassland BD-9 263718 3650681 Hills Relatively Undisturbed Chihuahuan Desert Grassland BU-1 262530 3651053 Hills Relatively Undisturbed Chihuahuan Desert Grassland BU-10 264457 3651476 Hills Relatively Undisturbed Chihuahuan Desert Grassland BU-11 264583 3650016 Hills Relatively Undisturbed Chihuahuan Desert Grassland
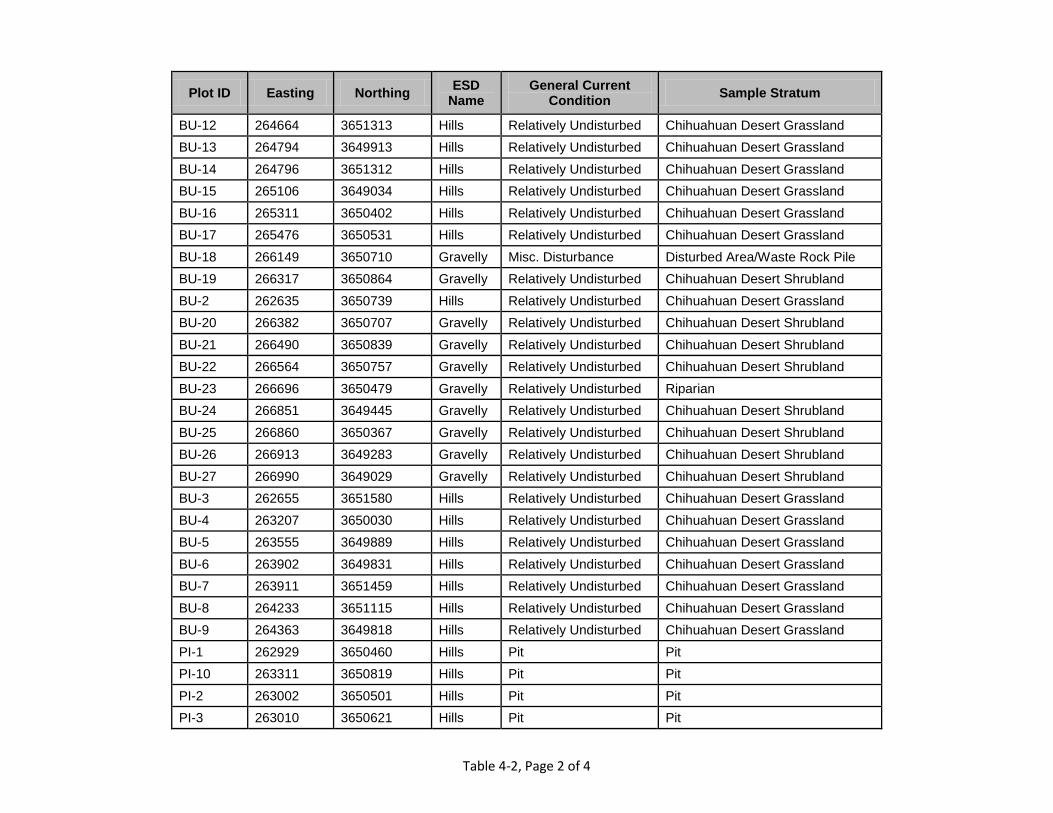
Table 4-2, Page 2 of 4
Plot ID Easting Northing ESD Name
General Current Condition Sample Stratum
BU-12 264664 3651313 Hills Relatively Undisturbed Chihuahuan Desert Grassland BU-13 264794 3649913 Hills Relatively Undisturbed Chihuahuan Desert Grassland BU-14 264796 3651312 Hills Relatively Undisturbed Chihuahuan Desert Grassland BU-15 265106 3649034 Hills Relatively Undisturbed Chihuahuan Desert Grassland BU-16 265311 3650402 Hills Relatively Undisturbed Chihuahuan Desert Grassland BU-17 265476 3650531 Hills Relatively Undisturbed Chihuahuan Desert Grassland BU-18 266149 3650710 Gravelly Misc. Disturbance Disturbed Area/Waste Rock Pile BU-19 266317 3650864 Gravelly Relatively Undisturbed Chihuahuan Desert Shrubland BU-2 262635 3650739 Hills Relatively Undisturbed Chihuahuan Desert Grassland BU-20 266382 3650707 Gravelly Relatively Undisturbed Chihuahuan Desert Shrubland BU-21 266490 3650839 Gravelly Relatively Undisturbed Chihuahuan Desert Shrubland BU-22 266564 3650757 Gravelly Relatively Undisturbed Chihuahuan Desert Shrubland BU-23 266696 3650479 Gravelly Relatively Undisturbed Riparian BU-24 266851 3649445 Gravelly Relatively Undisturbed Chihuahuan Desert Shrubland BU-25 266860 3650367 Gravelly Relatively Undisturbed Chihuahuan Desert Shrubland BU-26 266913 3649283 Gravelly Relatively Undisturbed Chihuahuan Desert Shrubland BU-27 266990 3649029 Gravelly Relatively Undisturbed Chihuahuan Desert Shrubland BU-3 262655 3651580 Hills Relatively Undisturbed Chihuahuan Desert Grassland BU-4 263207 3650030 Hills Relatively Undisturbed Chihuahuan Desert Grassland BU-5 263555 3649889 Hills Relatively Undisturbed Chihuahuan Desert Grassland BU-6 263902 3649831 Hills Relatively Undisturbed Chihuahuan Desert Grassland BU-7 263911 3651459 Hills Relatively Undisturbed Chihuahuan Desert Grassland BU-8 264233 3651115 Hills Relatively Undisturbed Chihuahuan Desert Grassland BU-9 264363 3649818 Hills Relatively Undisturbed Chihuahuan Desert Grassland PI-1 262929 3650460 Hills Pit Pit PI-10 263311 3650819 Hills Pit Pit PI-2 263002 3650501 Hills Pit Pit PI-3 263010 3650621 Hills Pit Pit

Table 4-2, Page 3 of 4
Plot ID Easting Northing ESD Name
General Current Condition Sample Stratum
PI-4 263084 3650561 Hills Pit Pit PI-5 263135 3650618 Hills Pit Pit PI-6 263254 3650917 Hills Pit Pit PI-7 263257 3650718 Hills Pit Pit PI-8 263295 3650729 Hills Pit Pit PI-9 263298 3650884 Hills Pit Pit TD-1 266504 3650118 Gravelly Tailing Dam Tailing Dam TD-10 266552 3649955 Gravelly Tailing Dam Tailing Dam TD-2 266510 3649075 Gravelly Tailing Dam Tailing Dam TD-3 266525 3649010 Gravelly Tailing Dam Tailing Dam TD-4 266529 3649226 Gravelly Tailing Dam Tailing Dam TD-5 266532 3649519 Gravelly Tailing Dam Tailing Dam TD-6 266533 3649429 Gravelly Tailing Dam Tailing Dam TD-7 266542 3649789 Gravelly Tailing Dam Tailing Dam TD-8 266544 3649594 Gravelly Tailing Dam Tailing Dam TD-9 266550 3649891 Gravelly Tailing Dam Tailing Dam TP-1 262639 3651045 Hills Misc. Disturbance Disturbed Area/Waste Rock Pile TP-10 264167 3650424 Hills Misc. Disturbance Disturbed Area/Waste Rock Pile TP-11 264578 3650464 Hills Misc. Disturbance Disturbed Area/Waste Rock Pile TP-12 265126 3649279 Hills Misc. Disturbance Disturbed Area/Waste Rock Pile TP-13 265187 3649868 Hills Misc. Disturbance Disturbed Area/Waste Rock Pile TP-14 265323 3649119 Hills Misc. Disturbance Disturbed Area/Waste Rock Pile TP-15 265397 3649502 Gravelly Misc. Disturbance Disturbed Area/Waste Rock Pile TP-16 265485 3650305 Gravelly Misc. Disturbance Disturbed Area/Waste Rock Pile TP-17 265601 3649276 Gravelly Misc. Disturbance Disturbed Area/Waste Rock Pile TP-18 265699 3649518 Gravelly Misc. Disturbance Disturbed Area/Waste Rock Pile TP-19 266002 3649459 Gravelly Misc. Disturbance Disturbed Area/Waste Rock Pile TP-2 262704 3651075 Hills Misc. Disturbance Disturbed Area/Waste Rock Pile
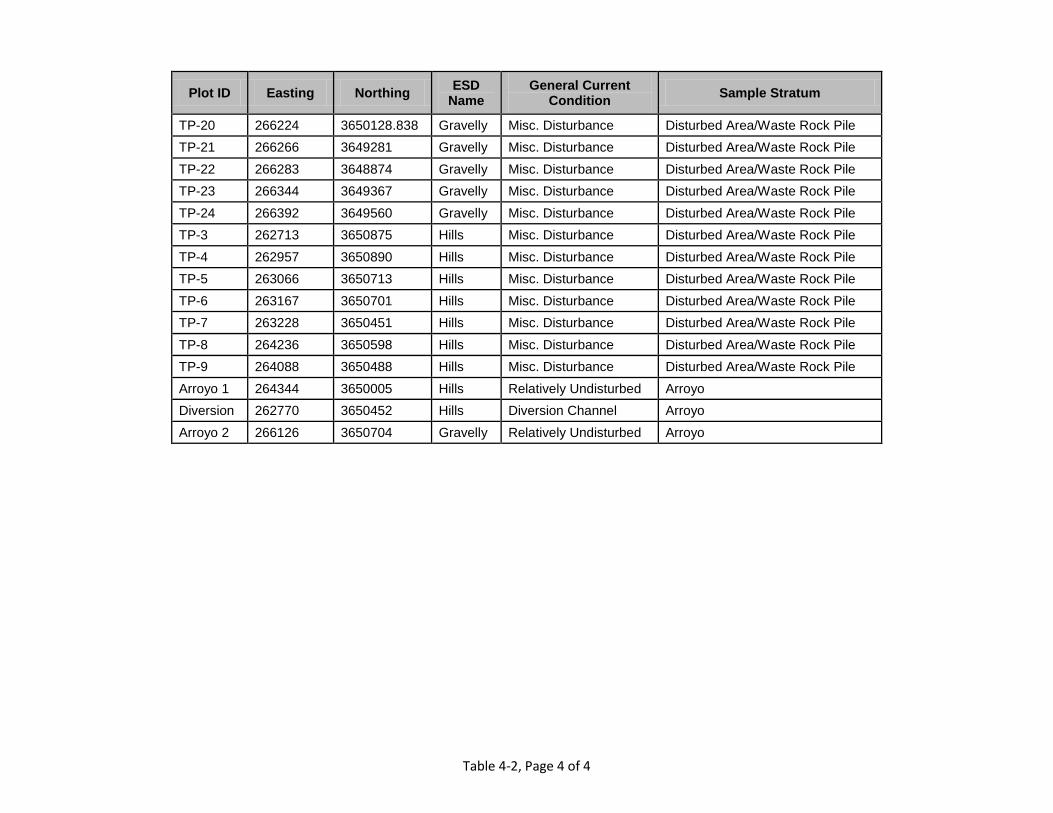
Table 4-2, Page 4 of 4
Plot ID Easting Northing ESD Name
General Current Condition Sample Stratum
TP-20 266224 3650128.838 Gravelly Misc. Disturbance Disturbed Area/Waste Rock Pile TP-21 266266 3649281 Gravelly Misc. Disturbance Disturbed Area/Waste Rock Pile TP-22 266283 3648874 Gravelly Misc. Disturbance Disturbed Area/Waste Rock Pile TP-23 266344 3649367 Gravelly Misc. Disturbance Disturbed Area/Waste Rock Pile TP-24 266392 3649560 Gravelly Misc. Disturbance Disturbed Area/Waste Rock Pile TP-3 262713 3650875 Hills Misc. Disturbance Disturbed Area/Waste Rock Pile TP-4 262957 3650890 Hills Misc. Disturbance Disturbed Area/Waste Rock Pile TP-5 263066 3650713 Hills Misc. Disturbance Disturbed Area/Waste Rock Pile TP-6 263167 3650701 Hills Misc. Disturbance Disturbed Area/Waste Rock Pile TP-7 263228 3650451 Hills Misc. Disturbance Disturbed Area/Waste Rock Pile TP-8 264236 3650598 Hills Misc. Disturbance Disturbed Area/Waste Rock Pile TP-9 264088 3650488 Hills Misc. Disturbance Disturbed Area/Waste Rock Pile Arroyo 1 264344 3650005 Hills Relatively Undisturbed Arroyo Diversion 262770 3650452 Hills Diversion Channel Arroyo Arroyo 2 266126 3650704 Gravelly Relatively Undisturbed Arroyo

Table 4-3, Page 1 of 1
Table 4-3 Hink and Ohmart (H&O) Structure Types
Structure Type
Dominant Overstory
Height (feet)
Overstory Cover
(percent)
Understory Cover
(percent) General Description
Woody Structure Types
1 >40 >25 >25 Tall trees with well-developed understory. Substantial foliage in all height layers.
2 >40 >25 <25 Tall trees with little or no understory. Most of foliage over 30–40 feet.
3 20a–40 >25 >25 Intermediate-sized trees with dense understory. Majority of foliage between 0–40 feet.
4 20–40 >25 <25 Open woodlands of intermediate-sized trees. Majority of foliage between 15–30 feet.
5 N/A <25 >25 Taller shrubs or young trees (>5 feet tall). Most foliage between 0–15 feet.
6 N/A <25 >25 Short statured shrubs or young trees and shrubs (<5 feet tall). Most foliage between 0–5 feet.
Non-Woody Structure Types
MH N/A <25 <25 "Marsh Habitat," emergent wetland vegetation >5 feet tall.

Table 4-4, Page 1 of 1
Table 4-4 Hink and Ohmart (H&O) Species Acronyms
H&O Species
Code H&O Common Name Scientific Name
AP Apache Plume Fallugia paradoxa
AS Arizona Sycamore Plantanus wrightii
B Baccharis Baccharis emoryi, B. salicina, B. salicifolia
BB Burro Bush Hymenoclea monogyra
C Cottonwood Populus fremontii
Ce Cedar (cultivated) Various Species
Cu Culivated Various Species
CW Coyote Willow Salix exigua
DW Desert Willow Chilopsis linearis
GO Grey Oak Quercus grisea
HM Honey Mesquite Prosopis glandulosa
LW Little Walnut Juglans microcarpa
MB Mulberry Morus sp.
NLH Netleaf Hackberry Celtis laevigata
PP Ponderosa Pine (cultivated) Pinus ponderosa
Qu Oak Quercus sp.
RB Rubber Rabbitbrush Ericameria nauseosus
SB Soapberry Sapundus saporina
SC Saltcedar Tamarix sp.
SE Siberian Elm Ulmus pumila
TH Tree of Heaven Ailanthus altissima
TW Goodding's Willow Salix gooddingii
VA Velvet Ash Fraxinus velutina

Table 4-5, Page 1 of 1
Table 4-5 Mean Lifeform Cover in Copper Flat Mine Permit Area Strata
Stratum Perennial Grasses
Perennial Forbs
Shrubs/ Trees
Total Perennial Annuals Total
Cover
Chihuahuan Desert Grassland 38% 4% 14% 55% 9% 64% Chihuahuan Desert Shrubland 9% 8% 20% 37% 5% 42% Disturbed Area/Waste Rock Pile 19% 4% 9% 31% 7% 39% Tailing Dam 21% 1% 12% 34% 0% 34% Pit 2% 1% 2% 4% 0% 4% Arroyo 6% 0% 19% 25% 0% 25%

Table 4-6, Page 1 of 1
Table 4-6 Mean Primary Production (lbs/acre) in Copper Flat Mine Permit Area Strata
Stratum Perennial Grasses
Perennial Forbs
Shrubs/ Trees
Total Perennial Annuals Total Annual
Production
Chihuahuan Desert Grassland 952.7 112.1 200.7 1,265.5 167.9 1,433.4 Chihuahuan Desert Shrubland 260.3 172.3 654.0 1,086.6 187.5 1,274.1 Disturbed Area/Waste Rock Pile 417.9 98.1 310.2 826.2 91.4 917.6 Tailing Dam 396.9 3.6 406.9 807.4 14.6 822.0 Pit 96.5 0.0 150.8 247.3 0.8 248.1

Table 4-7, Page 1 of 1
Table 4-7 Mean Woody Plant Density (plants/acre) in Copper Flat Mine
Permit Area Strata
Stratum Mean Woody Plants per Acre
Chihuahuan Desert Grassland 2,381.7 Chihuahuan Desert Shrubland 3,249.5 Disturbed Area/Waste Rock Pile 2,779.0 Tailing Dam 1,951.4 Pit 291.5 Arroyo 6,005.4

Table 4-8, Page 1 of 9
Table 4-8 Copper Flat Mine Permit Area Plant Species List
Scientific Name Common Name Abbrev. Lifeform Life History
Transect Sample
State-listed Weed
Native or Non-native
Acourtia nana Dwarf desert holly ACNA forb perennial yes no nat
Aloysia wrightii High mass or Wright's lippia ALWR shrub perennial yes no nat
Amaranthus hybridus Hybrid pigweed AMHY forb annual yes no non
Amaranthus palmeri Palmer's pigweed AMPA forb annual yes no nat
Amaranthus powellii Powell's pigweed AMPO forb annual yes no nat
Ambrosia artemisiifolia Common ragweed AMAR forb annual no no nat
Ambrosia confertiflora (A. confertifolia, Franseria tenuifolia, F. confertiflora)
Slimleaf bursage AMCO forb perennial yes no nat
Amorpha fruticosa False indigo bush AMFR shrub perennial yes no nat
Andropogon hallii Sand bluestem ANHA grass-w perennial yes no nat
Aristida adscensionis Six-weeks three-awn grass ARAD grass-w annual yes no nat
Aristida divaricata Poverty three-awn grass ARDI grass-w perennial yes no nat
Aristida havardii Havard's three-awn grass ARHA grass-w perennial yes no nat
Aristida purpurea Purple three-awn grass ARPU grass-w perennial yes no nat
Aristida ternipes Spider three-awn grass ARTE grass-w perennial yes no nat
Artemisia franserioides Rageweed sage ARFR forb perennial yes no nat
Artemisia ludoviciana subsp. ludoviciana
Louisiana (prairie) sage ARLUL forb perennial yes no nat
Asclepias subverticillata Poison milkweed ASSU forb perennial no no nat
Astragalus crassicarpus Ground plum ASCR forb perennial yes no nat
Astragalus sp. Milkvetch (species not identified) AST forb perennial yes no nat

Table 4-8, Page 2 of 9
Scientific Name Common Name Abbrev. Lifeform Life History
Transect Sample
State-listed Weed
Native or Non-native
Atriplex canescens Four-wing saltbush ATCA shrub perennial yes no nat
Baccharis emoryi, B. salicina, or B. salicifolia
Emory baccharis, seepwillow, Baccharis
BAEM shrub perennial yes no nat
Baccharis pteronioides Yerba-de-pasmo BAPT shrub perennial yes no nat
Bahia absinthifolia Sageleaf (or silverleaf) bahia BAAB forb perennial yes no nat
Baileya multiradiata Desert marigold BAMU forb perennial/biennial
yes no nat
Boerhaavia coccinea Scarlet spiderling BOCO forb perennial yes no nat
Boerhaavia erecta Erect spiderling BOER forb annual no no nat
Boerhaavia spicata Annual pink spiderling BOSP forb annual yes no nat
Boerhaavia sp. Spiderling (unidentified) BOE forb annual yes no nat
Bothriochloa barbinodis Cane bluestem BOBA grass-w perennial yes no nat
Bothriochloa laguroides (Andropogon saccharoides)
Silver bluestem BOLA grass-w perennial yes no nat
Bouteloua aristidoides Needle grama BOAR grass-w annual yes no nat
Bouteloua barbata Six-weeks grama BOBA grass-w annual yes no nat
Bouteloua curtipendula Side oats grama grass BOCU grass-w perennial yes no nat
Bouteloua eriopoda Black grama BOER grass-w perennial yes no nat
Bouteloua gracilis Blue grama grass BOGR grass-w perennial yes no nat
Bouteloua hirsuta Hairy grama grass BOHI grass-w perennial yes no nat
Brickellia californica California brickelbush BRCAL shrub perennial yes no nat
Calliandra humilis Low fairy duster CAHU forb perennial yes no nat
Calliandra eriophylla Fairy duster or mesquitilla CAER shrub perennial yes no nat
Celtis leavigata (C. reticulata) Netleaf hackberry CELE tree perennial yes no nat

Table 4-8, Page 3 of 9
Scientific Name Common Name Abbrev. Lifeform Life History
Transect Sample
State-listed Weed
Native or Non-native
Chaetopappa ericoides Baby aster CHER forb perennial yes no nat
Chamaesaracha coronopus Green-leaf five eyes CHCO forb perennial yes no nat
Chamaesaracha sordida (C. conioides)
Gray five-eyes CHSO forb perennial yes no nat
Chamaesyce albomarginata Rattlesnake weed CHAL forb perennial yes no nat
Chamaesyce serpyllifolia Thyme-leaved spurge CHSE forb annual no no nat
Chamaesyce sp. Spurge (species not identified) CHA forb perennial yes no nat
Chamaesyce sp. Spurge (species not identified) CHA forb annual yes no nat
Chenopodium album Lamb's quarters CHALM forb annual yes no non
Chenopodium leptophyllum Narrow-leaved goosefoot CHLE forb annual yes no nat
Chenopodium neomexicanum New Mexico goosefoot CHNE forb annual yes no nat
Chenopodium sp. Goosefoot (species unidentified) CHE forb annual yes no nat
Chilopsis linearis Desert willow CHLI shrub perennial yes no nat
Chloris virgata Feather finger grass CHVI grass-w annual yes no nat
Cirsium neomexicanum New Mexico thistle CINE forb perennial no no nat
Cryptantha cinerea (C. jamesii) Bownut popcorn flower (James' cat's-eye)
CRCI forb perennial no no nat
Dalea aurea Golden silkthumb DAAU forb perennial no no nat
Dalea formosa Feather dalea (feather indigo) DAFO shrub perennial yes no nat
Dalea jamesii James' dalea DAJA forb perennial yes no nat
Dalea lanata Woolly dalea DALA forb perennial yes no nat
Dalea pogonathera Bearded dalea DAPO forb perennial no no nat
Dasylirion wheeleri Wheeler sotol DAWH shrub perennial yes no nat
Dasyochloa pulchella (Erioneuron pulchellum)
Fluff grass DAPUL grass-w perennial yes no nat

Table 4-8, Page 4 of 9
Scientific Name Common Name Abbrev. Lifeform Life History
Transect Sample
State-listed Weed
Native or Non-native
Descurainia pinnata Western tansy mustard DEPI forb annual yes no nat
Descurainia sophia Flixweed DESO forb annual no no non
Desmanthus cooleyi Bundleflower DECO forb perennial yes no nat
Digitaria sp. Crab grass DIG grass-w annual yes no non
Elymus longifolius (Sitanion hystrix)
Squirrel-tail (bottlebrush) grass SIHY grass-c perennial yes no nat
Enneapogon desvauxii Spike pappusgrass ENDE grass-w perennial yes no nat
Ephedra trifurca Big joint-fr (Mormon tea) EPTR shrub perennial yes no nat
Eragrostis cilianensis Stinkgrass ERCI grass-w annual no no non
Eragrostis curvula Weeping lovegrass ERCU grass-w perennial yes no non
Eragrostis intermedia Plains lovegrass ERIN grass-w perennial yes no nat
Eragrostis lehmanniana Lehmann's lovegrass ERLEH grass-w perennial yes no non
Eragrostis pectinacea Carolina lovegrass ERPE grass-w annual yes no nat
Ericameria (Chrysothamnus) nauseosa
Rubber rabbitbrush CHNA shrub perennial yes no nat
Erigeron flagellaris Whiplash daisy fleabane ERFL forb biennial yes no nat
Eriogonum effusum Spreading buckwheat EREF forb (subshrub)
perennial yes no nat
Eriogonum cf. pharnaceoides Wirestem buckwheat ERPH forb annual yes no nat
Eriogonum rotundifolium Round-leaf buckwheat ERRO forb annual yes no nat
Eriogonum sp. Buckwheat (unidentified) ERO forb perennial yes no nat
Eriogonum wrightii Wright's buckwheat ERWR forb (subshrub)
perennial yes no nat
Erodium cicutarium Red-stemmed filaree ERCI forb biennial no no non
Evolvulus nuttallianus Hairy evolvulus EVNU forb perennial yes no nat
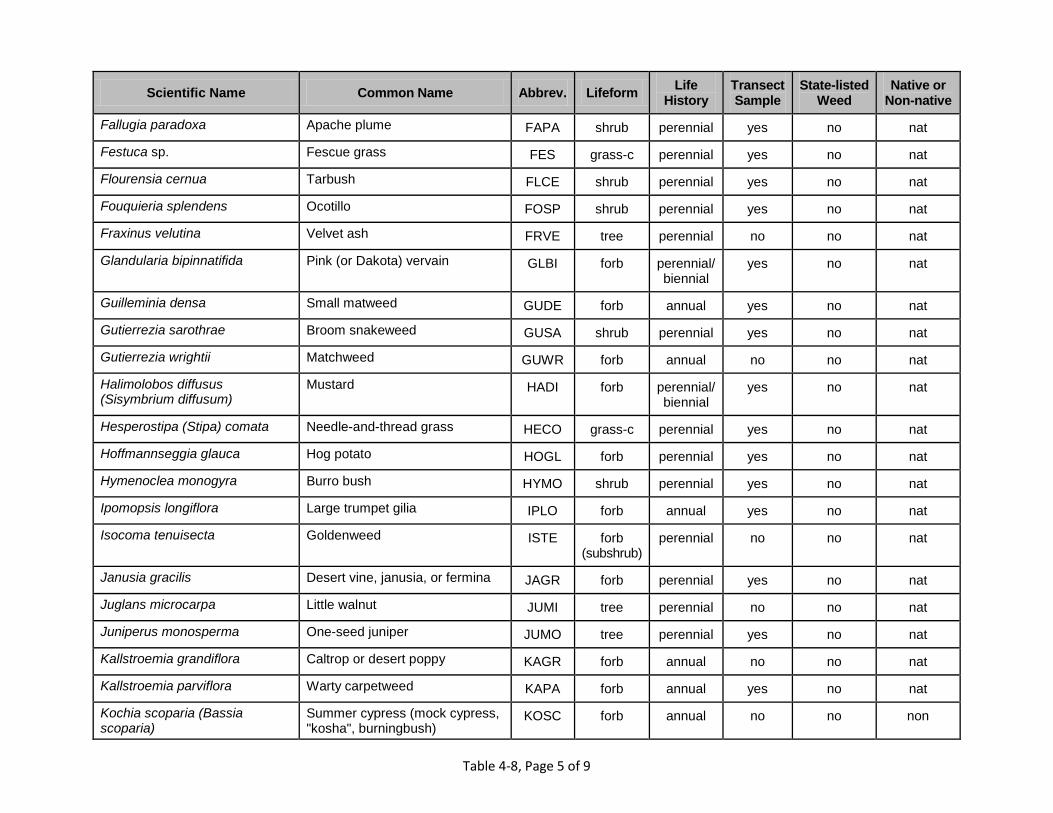
Table 4-8, Page 5 of 9
Scientific Name Common Name Abbrev. Lifeform Life History
Transect Sample
State-listed Weed
Native or Non-native
Fallugia paradoxa Apache plume FAPA shrub perennial yes no nat
Festuca sp. Fescue grass FES grass-c perennial yes no nat
Flourensia cernua Tarbush FLCE shrub perennial yes no nat
Fouquieria splendens Ocotillo FOSP shrub perennial yes no nat
Fraxinus velutina Velvet ash FRVE tree perennial no no nat
Glandularia bipinnatifida Pink (or Dakota) vervain GLBI forb perennial/biennial
yes no nat
Guilleminia densa Small matweed GUDE forb annual yes no nat
Gutierrezia sarothrae Broom snakeweed GUSA shrub perennial yes no nat
Gutierrezia wrightii Matchweed GUWR forb annual no no nat
Halimolobos diffusus (Sisymbrium diffusum)
Mustard HADI forb perennial/biennial
yes no nat
Hesperostipa (Stipa) comata Needle-and-thread grass HECO grass-c perennial yes no nat
Hoffmannseggia glauca Hog potato HOGL forb perennial yes no nat
Hymenoclea monogyra Burro bush HYMO shrub perennial yes no nat
Ipomopsis longiflora Large trumpet gilia IPLO forb annual yes no nat
Isocoma tenuisecta Goldenweed ISTE forb (subshrub)
perennial no no nat
Janusia gracilis Desert vine, janusia, or fermina JAGR forb perennial yes no nat
Juglans microcarpa Little walnut JUMI tree perennial no no nat
Juniperus monosperma One-seed juniper JUMO tree perennial yes no nat
Kallstroemia grandiflora Caltrop or desert poppy KAGR forb annual no no nat
Kallstroemia parviflora Warty carpetweed KAPA forb annual yes no nat
Kochia scoparia (Bassia scoparia)
Summer cypress (mock cypress, "kosha", burningbush)
KOSC forb annual no no non

Table 4-8, Page 6 of 9
Scientific Name Common Name Abbrev. Lifeform Life History
Transect Sample
State-listed Weed
Native or Non-native
Lactuca serriola Prickly lettuce LASE forb biennial no no non
Larrea tridentata Creosote bush LATR shrub perennial yes no nat
Lepidium cf. montanum Mountain pepperweed LEMO forb perennial/biennial
yes no nat
Leptochloa dubia Green sprangletop LEDU grass-w perennial yes no nat
Linum neomexicanum New Mexico yellow flax LINE forb annual yes no nat
Lycium pallidum Pale wolfberry LYPA shrub perennial yes no nat
Lycium torreyi Torrey wolfberry LYTO shrub perennial yes no nat
Lycurus phleoides Common wolftail grass LYPH grass-w perennial yes no nat
Machaeranthera gracilis Annual goldenweed MAGR forb annual yes no nat
Machaeranthera pinnatifida Perennial goldenweed MAPI forb perennial yes no nat
Machaeranthera tanacetifolia Tansy aster MATA forb annual/biennial
yes no nat
Marrubium vulgare Horehound MAVU forb perennial yes no non
Melampodium leucanthum Ash-gray blackfoot daisy MELE forb perennial yes no nat
Melilotus officinalis Yellow sweet clover MEOF forb annual/ biennial/ perennial
no no non
Menodora scabra Rough menodora MESC shrub perennial yes no nat
Mentzelia pumila Blazing star stickleaf MEPU forb biennial yes no nat
Mimosa aculeaticarpa Cat-claw mimosa or wait-a-bit MIAC shrub perennial yes no nat
Muhlenbergia depauperata Six-weeks muhly MUDE grass-w annual yes no nat
Muhlenbergia porteri Bush muhly grass MUPO grass-w perennial yes no nat
Opuntia chlorotica Pancake prickly pear OPCH shrub (subshrub)
perennial yes no nat

Table 4-8, Page 7 of 9
Scientific Name Common Name Abbrev. Lifeform Life History
Transect Sample
State-listed Weed
Native or Non-native
Opuntia phaeacantha Brown-spine prickly pear OPPH shrub (subshrub)
perennial yes no nat
Panicum capillare Common witchgrass PACA grass-w annual yes no nat
Panicum obtusum Vine mesquite PAOB grass-w perennial yes no nat
Parthenium confertum (P. lyratum)
Rubberbush PACO forb perennial no no nat
Parthenium incanum Mariola PAIN shrub perennial yes no nat
Pectis angustifolia Lemonweed or limoncillo PEAN forb annual yes no nat
Pectis filipes Threadstem chinchweed PEFI forb annual yes no nat
Pectis longipes Barestem chinchweed PELO forb perennial yes no nat
Phacelia sp. Scorpion weed (unidentified) PHA forb annual yes no nat
Phaseolus metcalfei Metcalf limabean PHME forb perennial no no nat
Phemeranthus aurantiacus (Talinum auranticacum)
Orange flame-flower PHAU forb perennial yes no nat
Piptatherum micranthum (Oryzopsis micrantha)
Little-seed ricegrass PIMI grass-c perennial yes no nat
Plantago patagonica Woolly plantain PLPA forb annual yes no nat
Pleuraphis mutica Tobosa grass PLMU grass-w perennial yes no nat
Polanisia dodecandra Clammy weed PODO forb annual yes no nat
Populus fremontii Fremont's cottonwood, Plains cottonwood
POFR tree perennial no no nat
Portulaca pilosa (P. mundula) Rose purslane or verdolaga POPI forb perennial yes no nat
Portulaca suffrutescens Copper purslane POSU forb perennial no no nat
Prosopis glandulosa Honey mesquite PRGL shrub perennial yes no nat
Quercus emoryi Emory oak QUEM tree perennial yes no nat
Quercus turbinella Scrub live oak QUTU tree perennial yes no nat

Table 4-8, Page 8 of 9
Scientific Name Common Name Abbrev. Lifeform Life History
Transect Sample
State-listed Weed
Native or Non-native
Rhus microphylla Little-leaf sumac RHMI shrub perennial yes no nat
Rhus trilobata Three-leaf sumac RHTR shrub perennial yes no nat
Salsola tragus (S. kali) Russian thistle or tumbleweed SATR forb annual yes no non
Salix exigua Coyote willow or sandbar willow SAEX shrub perennial no no nat
Salix gooddingii Goodding's willow SAGO tree perennial no no nat
Sapundus saponaria Soapberry SASA tree perennial no no nat
Scleropogon brevifolius Burrograss SCBR grass-w perennial yes no nat
Senecio flaccidus Threadleaf groundsel SEFL shrub (subshrub)
perennial yes no nat
Senna bauhinioides Twinleaf SEBA forb perennial yes no nat
Setaria leucopila Plains bristle grass SELE grass-w perennial yes no nat
Sida abutifolia (S. filicaulis, S. procumbens)
Spreading fanpetals SIAB forb perennial yes no nat
Sisymbrium altissimum Tumble mustard SISA forb annual/ biennial/ perennial
no no non
Solanum elaeagnifolium Silver-leaf nightshade SOEL forb perennial yes no nat
Solanum rostratum Buffalo burr SORO forb annual yes no nat
Sphaeralcea angustifolia Narrowleaf globemallow SPAN forb perennial yes no nat
Sphaeralcea grossulariifolia Gooseberryleaf globemallow SPGR forb perennial yes no nat
Sphaeralcea hastulata Wrinkled globemallow SPHA forb perennial yes no nat
Sporobolus contractus Spike dropseed SPCON grass-w perennial yes no nat
Sporobolus cryptandrus Sand dropseed SPCR grass-w perennial yes no nat
Sporobolus giganteus Giant dropseed SPGI grass-w perennial yes no nat
Stephanomeria pauciflora Wire lettuce STPA forb perennial yes no nat

Table 4-8, Page 9 of 9
Scientific Name Common Name Abbrev. Lifeform Life History
Transect Sample
State-listed Weed
Native or Non-native
Tamarix chinensis Saltcedar or tamarisk TACH tree perennial yes yes non
Thymophylla acerosa (Dyssodia acerosa)
Spiny dogweed THAC shrub (subshrub)
perennial yes no nat
Thymophylla pentacheata Five-needle dogweed THPE forb perennial yes no nat
Tidestromia lanuginosa Woolly honeysweet TILA forb annual yes no nat
Tragia sp. Noseburn TRA forb perennial yes no nat
Tridens muticus Slim tridens grass TRMU grass-w perennial yes no nat
Verbesina encelioides Cowpen daisy or golden crownbeard
VEEN forb annual yes no nat
Yucca elata Soaptree yucca YUEL shrub perennial yes no nat
Zinnia grandiflora Wild zinnia ZIGR forb perennial yes no nat
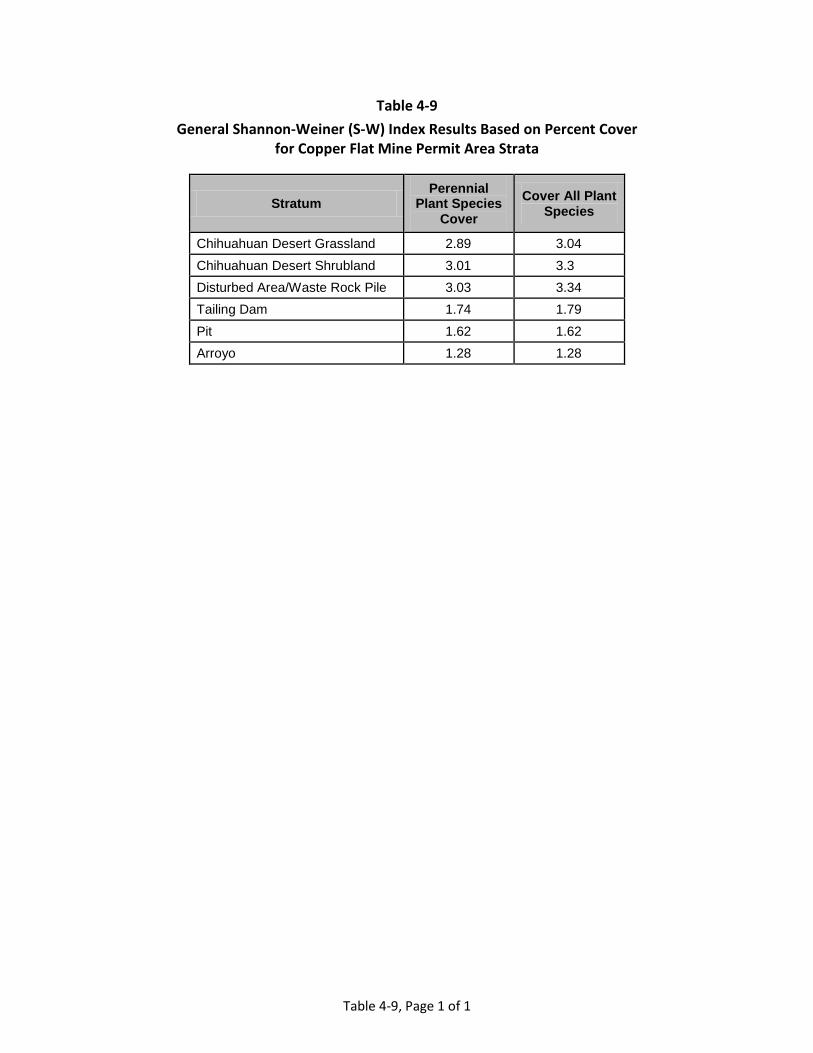
Table 4-9, Page 1 of 1
Table 4-9 General Shannon-Weiner (S-W) Index Results Based on Percent Cover
for Copper Flat Mine Permit Area Strata
Stratum Perennial
Plant Species Cover
Cover All Plant Species
Chihuahuan Desert Grassland 2.89 3.04 Chihuahuan Desert Shrubland 3.01 3.3 Disturbed Area/Waste Rock Pile 3.03 3.34 Tailing Dam 1.74 1.79 Pit 1.62 1.62 Arroyo 1.28 1.28

Table 4-10, Page 1 of 1
Table 4-10 Species Richness Based on Species Intercepts at Cover Transects for
Copper Flat Mine Permit Area Strata
Stratum Perennial
Plant Species Cover
Cover All Plant Species
Chihuahuan Desert Grassland 2.89 3.04 Chihuahuan Desert Shrubland 3.01 3.3 Disturbed Area/Waste Rock Pile 3.03 3.34 Tailing Dam 1.74 1.79 Pit 1.62 1.62 Arroyo 1.28 1.28

Table 4-11, Page 1 of 1
Table 4-11 Number of Transects Required to Meet Sample Adequacy (as ± 10% of the mean) for
Copper Flat Mine Permit Area Strata
Stratum Sample Adequacy
Perennial Plant Species Cover
Sample Adequacy All Plant Species
Cover
Sample Adequacy
Total Cover
Total Number of Transects
Actually Recorded
Chihuahuan Desert Grassland 8.9 12.6 2.5 29
Chihuahuan Desert Shrubland 38.8 49.1 13.1 19
Disturbed Area/Waste Rock Pile 104.3 86.8 17.5 25
Tailing Dam 9.7 10.0 0.2 10 Pit 3,032.1 3,032.1 231.5 10 Arroyo 257.8 257.8 31.3 3
96

Table 4-12, Page 1 of 3
Table 4-12 Threatened, Endangered, and Plant Species of Concern with Occurrences in Sierra County
Species Name Common Name Habitat Notes Agency Status Habitat
Present (Y/N) USFWS NM
Agastache cana Grayish-white giant hyssop
Crevices and bases of granite cliffs or in canyons with small-leaved oaks at the upper edge of the desert and lower edge of the piñon-juniper zone, at 1,400-1,800 m (4,600-5,900 ft).
– Species of Concern No
Astragalus castetteri
Castetter's milkvetch
Dry, rocky slopes in montane scrub and open juniper woodland; 1,520 - 2,150 m (5,000 - 7,050 ft). – Species of
Concern No
Chenopodium cycloides
Sandhill goosefoot
Open sandy areas especially around blowouts on sand dunes; 800 - 1,500 m (2,600 - 5,000 ft).
Species of Concern
Species of Concern No
Cirsium wrightii Wright's marsh thistle
Wet, alkaline soils in spring seeps and marshy edges of streams and ponds; 1,130 -2,600 m (3,450 - 8,500 ft). – Endangered No
Cuscuta warneri Warner's dodder Grows on Phyla in open wet areas that support the host species; 1,430 - 1,460 m (4,700 - 4,800 ft.) – Species of
Concern No
Desmodium metcalfei
Metcalfe's ticktrefoil
Rocky slopes, canyons in grasslands, oak/pinion-juniper woodland, and riparian forests at 1,310 - 2,000 m (4,000 - 6,500 ft.)
– Species of Concern No
Draba mogollonica Mogollon whitlowgrass
Cool, moist northern slopes of mountains, ravines and canyons on volcanic rocks and soil in montane forests at 1,500 - 2,900 m (5,000 - 9,000 ft.)
– Species of Concern No
Draba standleyi Standley's whitlowgrass
Igneous rock faces, bases of overhanging cliffs, clefts of porphyritic and andesitic rocks and soil; 1,675-1,980 m (5,500-6,500 ft).
– Species of Concern No
Erigeron scopulinus Rock fleabane Crevices in cliff faces of rhyolitic rock in lower montane
coniferous forests at 1,800 - 2,800 m (6,000 - 9,000 ft). – Species of Concern No
Escobaria (Corypantha) duncanii
Duncan's pincushion cactus
Cracks in limestone and limy shale in broken terrain in Chihuahuan desert scrub at 1,550 (5,100 ft).
Species of Concern Endangered
Possible but not
observed
Escobaria sandbergii
Sandberg pincushion cactus
Rocky, igneous and limestone soils in Chihuahuan desert scrub and open oak and pinion-juniper woodland in mountainous terrain; 1,300 - 2,250 m (4,200 - 7,400 ft).
– Species of Concern
Possible but not
observed
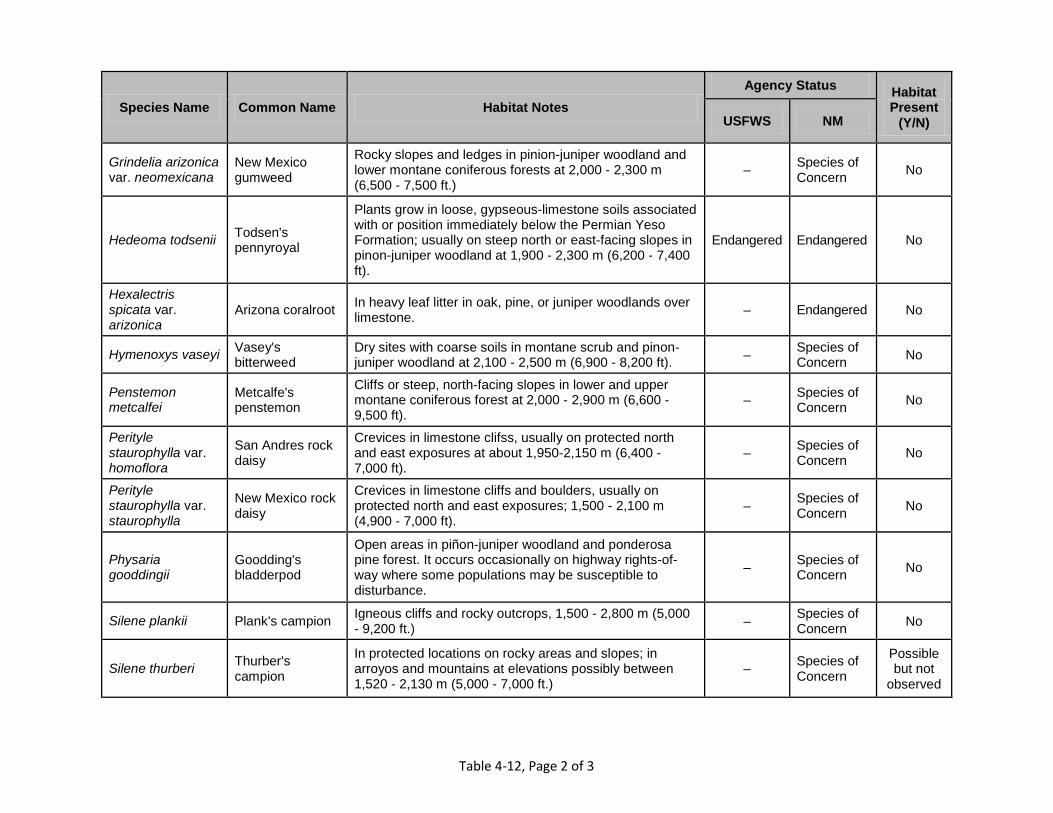
Table 4-12, Page 2 of 3
Species Name Common Name Habitat Notes Agency Status Habitat
Present (Y/N) USFWS NM
Grindelia arizonica var. neomexicana
New Mexico gumweed
Rocky slopes and ledges in pinion-juniper woodland and lower montane coniferous forests at 2,000 - 2,300 m (6,500 - 7,500 ft.)
– Species of Concern No
Hedeoma todsenii Todsen's pennyroyal
Plants grow in loose, gypseous-limestone soils associated with or position immediately below the Permian Yeso Formation; usually on steep north or east-facing slopes in pinon-juniper woodland at 1,900 - 2,300 m (6,200 - 7,400 ft).
Endangered Endangered No
Hexalectris spicata var. arizonica
Arizona coralroot In heavy leaf litter in oak, pine, or juniper woodlands over limestone. – Endangered No
Hymenoxys vaseyi Vasey's bitterweed
Dry sites with coarse soils in montane scrub and pinon-juniper woodland at 2,100 - 2,500 m (6,900 - 8,200 ft). – Species of
Concern No
Penstemon metcalfei
Metcalfe's penstemon
Cliffs or steep, north-facing slopes in lower and upper montane coniferous forest at 2,000 - 2,900 m (6,600 - 9,500 ft).
– Species of Concern No
Perityle staurophylla var. homoflora
San Andres rock daisy
Crevices in limestone clifss, usually on protected north and east exposures at about 1,950-2,150 m (6,400 - 7,000 ft).
– Species of Concern No
Perityle staurophylla var. staurophylla
New Mexico rock daisy
Crevices in limestone cliffs and boulders, usually on protected north and east exposures; 1,500 - 2,100 m (4,900 - 7,000 ft).
– Species of Concern No
Physaria gooddingii
Goodding's bladderpod
Open areas in piñon-juniper woodland and ponderosa pine forest. It occurs occasionally on highway rights-of-way where some populations may be susceptible to disturbance.
– Species of Concern No
Silene plankii Plank's campion Igneous cliffs and rocky outcrops, 1,500 - 2,800 m (5,000 - 9,200 ft.) – Species of
Concern No
Silene thurberi Thurber's campion
In protected locations on rocky areas and slopes; in arroyos and mountains at elevations possibly between 1,520 - 2,130 m (5,000 - 7,000 ft.)
– Species of Concern
Possible but not
observed

Table 4-12, Page 3 of 3
Species Name Common Name Habitat Notes Agency Status Habitat
Present (Y/N) USFWS NM
Silene wrightii Wright's campion Cliffs and rocky outcrops in Rocky Mountain montane and subalpine conifer forests; about 2,070 - 2,440 m (6,800 - 8,000 ft).
– Species of Concern No
Talinum humile (Phemeranthus humilis)
Pinos Altos flame flower
Shallow, gravelly, usually clayey soils overlying rhyolite, usually on rock benches in sloping terrain, but also in soil pockets overlying rock in nearly level areas; Madrean grassland, oak woodland or pinion-juniper woodland; often growing with Nolina microcarpa and Agave parryii.
Species of Concern
Species of Concern No

Table 4-13, Page 1 of 1
Table 4-13 Structure Type Acreage in the Detailed Arroyo/Riparian Mapping
for the Permit Area Study Site
Structure Type Acres
1 0.0
2 0.0
3 7.4
4 5.9
5 34.0
6 2.4
MH 0.1 TOTAL 49.8

Table 4-14, Page 1 of 1
Table 4-14 Summary of the Acres in which Species were Considered (Co-) Dominants in the
Detailed Arroyo/Riparian Mapping for the Permit Area Study Site
H&O Species Code Common Name Acres
AP Apache Plume 10.0
B Baccharis 22.2
BB Burro Bush 15.5
C Cottonwood 5.0
HM Honey Mesquite 13.8
NLH Netleaf Hackberry 2.5
Qu Oak 6.6
RB Rubber Rabbitbrush 0.4
SC Saltcedar 7.6
TW Goodding's Willow 1.8
VA Velvet Ash 0.7

Table 4-15, Page 1 of 2
Table 4-15 Plant Species Encountered in the Pipeline Corridor
Scientific Name Common Name
Acourtia nana Dwarf desertpeony Amaranthus powellii Powell’s amaranth Ambrosia acanthicarpa Flatspine bur ragweed Ambrosia confertiflora Weakleaf bur ragweed Ambrosia trifida Great ragweed Andropogon hallii Sand bluestem Aristida adscensionis Sixweeks threeawn Aristida purpurea Purple threeawn Aristida ternipes Spidergrass Astragalus crassicarpus Groundplum milkvetch Atriplex canescens Fourwing saltbush Baccharis pteronioides Yerba de pasmo Baileya multiradiata Desert marigold Bothriochloa laguroides Silver beardgrass Bouteloua barbata Sixweeks grama Bouteloua curtipendula Side-oats grama Bouteloua eriopoda Black grama Bouteloua gracilis Blue grama Brickellia californica California brickellbush Celtis laevigata Netleaf hackberry Chamaesyce albomarginata Whitemargin sandmat Cirsium neomexicanum New Mexico thistle Cirsium ochrocentrum Yellowspine thistle Corispermum americanum American bugseed Cuscuta sp. Dodder Cylindropuntia imbricata Tree cholla Cylindropuntia leptocaulis Christmas cactus Dalea formosa Featherplume Dasyochloa pulchella Low woollygrass Datura wrightii Sacred thorn-apple Dyssodia papposa Fetid marigold Echinocereus coccineus Scarlet hedgehog cactus Ephedra trifurca Big jointfir Eragrostis curvula Weeping lovegrass Eriogonum effusum Spreading buckwheat

Table 4-15, Page 2 of 2
Scientific Name Common Name
Evolvulus nuttallianus Shaggy dwarf morning-glory Fallugia paradoxa Apache plume Flourensia cernua Tarbush Gutierrezia sarothrae Broom snakeweed Hoffmannseggia glauca Indian rushpea Koeberlinia spinosa Crown of thorns Lappula occidentalis Flatspine stickseed Larrea tridentata Creosote Leptochloa dubia Green sprangletop Lycium pallidum Pale wolfberry Lycium torreyi Torrey wolfberry Machaeranthera gracilis Slender goldenweed Menodora scabra Rough menodora Muhlenbergia porteri Bush muhly Opuntia engelmannii Cactus apple Opuntia macrocentra Purple pricklypear Panicum obtusum Vine mesquite Parthenium incanum Mariola Pectis angustifolia Lemonscent Pleuraphis mutica Tobosagrass Prosopis glandulosa Honey mesquite Rhus microphylla Littleleaf sumac Scleropogon brevifolius Burrograss Solanum elaeagnifolium Silverleaf nightshade Sphaeralcea hastulata Spear globemallow Stephanomeria pauciflora Brownplume wirelettuce Thelesperma megapotamicum Greenthread Thymophylla acerosa Spiny dogweed Tidestromia lanuginosa Woolly tidestromia Yucca baccata Banana yucca Yucca elata Soaptree yucca Ziziphus obtusifolia Graythorn

Table 4-16, Page 1 of 1
Table 4-16 Structure Type Acreage in the Detailed Arroyo/Riparian Mapping for
the Las Animas Creek Study Site
Structure Type Acres
1 230.8
2 47.7
3 59.0
4 118.2
5 0.0
6 0.0
Cultivated 7.3
TOTAL 462.9

Table 4-17, Page 1 of 1
Table 4-17 Summary of the Acres in which Species were Considered (Co-) Dominants in the
Detailed Arroyo/Riparian Mapping for the Las Animas Creek Study Site
H&O Species
Code Common Name Acres
C Cottonwood 213.1
SE Siberian Elm 1.8
VA Velvet Ash 175.7
NLH Netleaf Hackberry 226.0
Qu Oak 1.6
BB Burro bush 85.3
LW Little Walnut 22.7
CW Coyote Willow 25.7
TW Goodding’s Willow 52.9
SC Saltcedar 0.7
B Baccharis 51.6
Cu Culivated 10.7
HM Honey Mesquite 71.6
SB Soapberry 3.2
AS Arizona Sycamore 261.6
GO Grey Oak 3.1
MB Mulberry 0.2

Table 4-18, Page 1 of 1
Table 4-18 Height, Diameter Breast Height, and Condition of Arizona Sycamore Reference Trees in
the Las Animas Creek Study Area
Tree Tag Diameter Breast Height (in) Height
(ft) % Dead % Stress Photo File Name
882 15.0, 16.2 53 1% 0% 2996 886 76.9 65 1% 0% 2997 878 5.3 19 5%
3005
893 33.8 93 5%
3006-3009 899 88.5 116 <1%
3010-3012
892 0.7 7.2 0% 0% 3041 891 7.7, 5.0 23 0% 0% 3046-3047 428 13.7 40.5 <1% 0% 3053 894 42.1 87 0% 0% 3054 889 2.8 16 0% <1% 3055 879 8 24.5 0% 1-5% 3059 900 13.7, 11.5 57.5 0% 0% 3058 896 0.2 5.3 0% 1-5% 3060 895 49.3 65 1% 0% 3061-3062 888 28.5, 29.0, 23.1, 35.2, 47.7 97 1-5% 1-5% 3063-3064 885 76.8 115 10% 10% 2981-2983 897 20.0, 6.1, 5.1 25.5 25% 25-50% 3065-3066 993 72.2, 34.1 111 1-5% 1-5% 3067-3069 887 42.1 58 <1% 0% 3072-3074 1000 43.4 90 <1% 0% 3075-3077 996 1 6.4 0% 0% 3078-3080 994 11.5 59.5 5% 1-5% 3081 995 5.7, 2.6 23.5 25-50% 10-25% 3082-3083 999 9.5 32.5 0% 0% 3084-3085 997 26.2 45 1-5% 5-10% 3086-3088

Table 4-19, Page 1 of 1
Table 4-19 Structure Type Acreage in the Detailed Arroyo/Riparian Mapping for
the Percha Creek Study Site
Structure Type Acres
1 11.3
2 34.7
3 156.9
4 91.3
5 654.6
6 0.0
Bedrock/No Vegetation 1.4
TOTAL 950.2
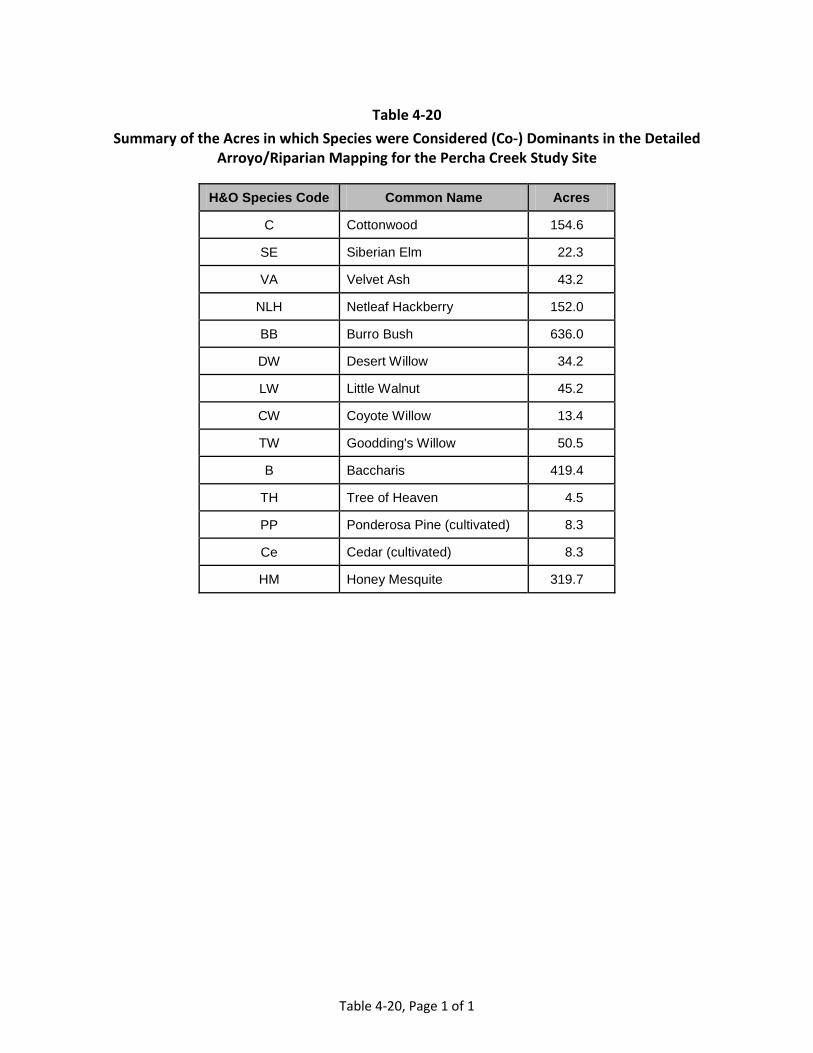
Table 4-20, Page 1 of 1
Table 4-20 Summary of the Acres in which Species were Considered (Co-) Dominants in the Detailed
Arroyo/Riparian Mapping for the Percha Creek Study Site
H&O Species Code Common Name Acres
C Cottonwood 154.6
SE Siberian Elm 22.3
VA Velvet Ash 43.2
NLH Netleaf Hackberry 152.0
BB Burro Bush 636.0
DW Desert Willow 34.2
LW Little Walnut 45.2
CW Coyote Willow 13.4
TW Goodding's Willow 50.5
B Baccharis 419.4
TH Tree of Heaven 4.5
PP Ponderosa Pine (cultivated) 8.3
Ce Cedar (cultivated) 8.3
HM Honey Mesquite 319.7

Figures

Appendix 4-A Detailed Plant Cover Summaries by Stratum and Transect in the
Copper Flat Mine Permit Area

Appendix 4-B Detailed Primary Plant Production Summaries by Stratum and
Transect in the Copper Flat Mine Permit Area

Appendix 4-C Detailed Shrub Density Summaries by Stratum and Transect in the
Copper Flat Mine Permit Area

Appendix 4-D Hink and Ohmart Vegetation Mapping in the
Copper Flat Mine Permit Area
Appendix 4-E Hink and Ohmart Vegetation Mapping in the
Las Animas Creek Study Area

Appendix 4-F Hink and Ohmart Vegetation Mapping in the
Percha Creek Study Area

New Mexico Copper Corporation Copper Flat Baseline Data Characterization Report
Copper Flat Mine 5-1 Section 5: Wildlife Survey Results June 2012
5 Wildlife Survey Results
5.1 Introduction Parametrix, Inc. was contracted by New Mexico Copper Corporation to complete a wildlife assessment within the Copper Flat Mine permit area and off-site reference areas, as well as surrounding riparian habitats along Las Animas Creek and Percha Creek. This chapter summarizes the approach and results for characterizing wildlife abundance and habitat quality throughout the study sites, with a particular focus on species of concern. The study approach implemented for this report was adapted from the wildlife section of the Copper Flat SAP (Parametrix, 2010). Agency review comments and requests were incorporated into the methodology.
The area of the Copper Flat Mine is located within the Mexican Highlands section of the Basin and Range Physiographic Province. The dominant plant communities are Chihuahuan Desert Grassland (CDG), Chihuahuan Desert Shrubland (CDS), Arroyos, and heavily disturbed areas, some of which have been reclaimed. There is relatively little water on the permit area, except for the man-made pit lake, the area immediately east of the tailing dam where surface water collects, a stock pond in the southern portion of the site, and intermittent pools created by storms in the bottom of Greyback Arroyo. Greyback Arroyo, though intermittent, does support some riparian vegetation such as willows and saltcedar, which provides important wildlife habitat. Off-site reference areas provided comparison areas with the Arroyo, CDG, and CDS sites, though similarly little perennial water is present, except at the pond which was used for a reference area for the bat surveys. Animas and Percha Creeks, which were evaluated with differing methodologies from those used at the mine and reference areas, have perennial water and significantly different vegetation. Habitats delineated and described in Chapter 4 (Vegetation) are the same used for discussion of wildlife habitats.
5.2 Study Area
5.2.1 Copper Flat Mine Permit Area
The Copper Flat Mine permit area consists of several terrestrial habitats within the approximately 2,200-acre Copper Flat Mine permit area (Figure 5-1) and the pipeline corridor east of the mine site. Quantitative data collection was completed by stratum in the permit area, while walking surveys were implemented along the pipeline corridor. Observations from the pipeline surveys regarding the presence and absence of species were incorporated into the results of this report. A separate Biological Assessment (Parametrix, 2011) is also being drafted by Parametrix biologists (Appendix 5A). Please see that report for conditions and observations specific to the pipeline corridor. Habitat areas in the mine permit study area included:
Chihuahuan Desert Shrubland. Areas mostly on the eastern half of the site consist of flatter land with gravelly soils and surface vegetation dominated by shrubs (honey mesquite [Prosopis glandulosa], American tarwart [Flourensia cernua], and creosote bush [Larrea tridentata]); grasses (low woolygrass [Dasyochloa pulchella], sixweeks grama [Bouteloua barbata], and tobosa grass [Pleuraphis mutica]); and forbs (whitemargin sandmat [Chamaesyce albomarginata], wooly tidestromia [Tidestromia lanuginosa], and hairyseed bahia [Bahia absinthifolia]). For sampling on the mine site, areas were grouped into those expected either to be disturbed during mining activities or anticipated to remain undisturbed.
Chihuahuan Desert Grassland. Areas mostly on the western half of the site consist of hillier land with rocky soils and surface vegetation dominated by shrubs (broom snakeweed [Gutierrezia sarothrae], honey mesquite, and pricklyleaf dogweed [Thymophylla acerosa]) and scattered one-seed juniper (Juniperus monosperma); grasses (sideoats grama [Bouteloua curtipendula], black grama [Bouteloua eriopoda], and tobosa grass); and forbs
New Mexico Copper Corporation Copper Flat Baseline Data Characterization Report
Copper Flat Mine 5-2 Section 5: Wildlife Survey Results June 2012
(fivebrack cinchweed [Pectis filipes], spreading buckwheat [Eriogonum effusum], and slender goldenweed [Machaeranthera gracilis]). For sampling on the mine site, areas were grouped into those expected either to be disturbed during mining activities or anticipated to remain undisturbed.
Pit. The pit is a heavily disturbed area created by previous mining activity. The little existing surface vegetation in the pit is dominated by brickellbush (Brickellia californica), silver beardgrass (Bothriochloa laguroides), and longstalk cinchweed (Pectis longipes).
Pit Lake. The pit includes a 5-acre freshwater lake at the bottom of the pit. The lake is perennially wet, as it sits at the level of the SF Group aquifer.
Arroyo. The Arroyo consists of several intermittent drainages such as Greyback Arroyo and other arroyos. Denser stands of more mesic trees and shrubs such as Emory oak (Quercus emoryi), saltcedar (Tamarix ramosissima), Emory’s baccharis (Baccharis emoryi), and burro brush (Hymenoclea monogyra) are located in the Arroyo.
Tailing Dam. The approximately 200 ft wide and 4,600 ft long dam consists of compacted soil and rock. The dam is more heavily vegetated than the disturbed area/waste rock pile and is dominated by silver beardgrass, honey mesquite, and featherplume (Dalea formosa).
Disturbed Area/Waste Rock Pile (DA/WR). The DA/WR habitat consists of both partially reclaimed and generally loose rock piles and mostly flat and disturbed areas west of the tailing dam and in the areas previously disturbed by the previous mine processing and operational activities. The Disturbed Areas are dominated by grasses such as sideoats grama, cane bluestem (Bothriochloa barbinodis), and black grama, and forbs such as spreading buckwheat. The Waste Rock Piles are dominated by shrubs (broom snakeweed, honey mesquite, and Apache plume [Fallugia paradoxa]); grasses (low woolygrass, sideoats grama, and silver beardgrass); and forbs (spreading buckwheat and hairyseed bahia).
5.2.2 Off-Site Reference Areas
Off-site reference areas (Figures 5-2 through 5-7) were chosen by relative proximity to the mine and similarity in elevation and habitat, though no in-depth vegetation mapping was done in these areas. For some sites (e.g., the upland terrestrial sites where mammal trapping was done), it was relatively easy to locate similar habitat close to the mine. For other areas (e.g., the riparian and perennial wet areas where bat boxes were placed), locating similar habitat was more difficult. Habitat areas in off-site reference areas included:
Chihuahuan Desert Shrubland. (See description above) Arroyo. (See description above) Lake/Riparian. Consisting of stock ponds and other areas of dense vegetation with permanent or
intermittent water.
5.2.3 Las Animas Creek, Percha Creek / Percha Box, and Isolated Springs
Surface water and the habitat it creates are of particular interest because these sites often provide higher quality wildlife habitat and greater wildlife species density than surrounding desert areas, especially in desert areas (Hubbard, 1971; Carothers et al., 1974; Rice et al., 1983) similar to those present at the Copper Flat Mine permit area. In addition, concern has been voiced about the potential impacts to surface water from mine operations, particularly in Las Animas Creek. This is a riparian area that supports a diverse botanical and wildlife community that includes one of the very few active stands of Arizona sycamore (Platanus wrightii) trees east of the Continental Divide in New Mexico. Several riparian areas were examined, including approximately 12 km of Las Animas Creek and 24 km of Percha Creek (Figures 5-3 and 5-4). The bird and other wildlife data also refer to
New Mexico Copper Corporation Copper Flat Baseline Data Characterization Report
Copper Flat Mine 5-3 Section 5: Wildlife Survey Results June 2012
areas of the Upper Las Animas Creek on the Ladder Ranch that were not surveyed by Parametrix but have been visited by bird watchers and other observers. Other habitat areas of potentially high wildlife value that could have been examined in this study included isolated springs and springs and seeps. However, these areas were nearly all on private land and inaccessible.
Habitat in Las Animas and Percha Creeks was characterized by riparian forests and woodlands, burro bush (Hymenoclea monogyra), and/or seep willow (Baccharis sp.) arroyo shrublands. The vegetation chapter of this report (Chapter 4) includes detailed mapping and descriptions of riparian and arroyo habitat types in these areas. Riparian forests in the Percha Creek study area were typically dominated by cottonwood (Populus fremontii) and willow (Salix sp.). The Las Animas Creek study area contained large groves of Arizona sycamore (along with cottonwood and velvet ash (Fraxinus velutina). Willow trees and shrubs were also sometimes encountered along Las Animas Creek. Short segments of flowing water were observed along both creeks.
5.3 Methodology
5.3.1 Copper Flat Mine Permit Area
5.3.1.1 Sampling Objectives
The wildlife sampling objectives for the Copper Flat Mine permit area were to:
Map current habitat, including disturbed areas. Describe wildlife use with:
a. Big game fecal pellet group counts for mule deer (Odocoileus hemionus), elk (Cervus elaphus), pronghorn (Antilocapra americana), and lagomorphs, especially desert cottontails (Sylvilagus audubonii) and black-tailed jackrabbits (Lepus californicus).
b. Walking transects for birds, with recorded observations of reptiles, amphibians, and mammals or their sign.
c. Ultrasonic recordings for bats.
d. Pit-fall traps, funnel traps, and visual observations for reptiles.
e. Sherman trap lines for small mammals.
f. Incidental observations of other wildlife.
Create a species inventory set for birds, mammals, reptiles, and amphibians through researching past studies, lists created by other workers and other agencies, and our own observations.
Complete a threatened or endangered species survey by comparing known records and habitat requirements with current field conditions to determine the likelihood of occurrence of any federal and state listed wildlife species.
Describe species distribution by habitat and season, where appropriate. Identify other key habitat areas (e.g., cliffs, talus slopes, ponds, springs, riparian areas, known nests).
New Mexico Copper Corporation Copper Flat Baseline Data Characterization Report
Copper Flat Mine 5-4 Section 5: Wildlife Survey Results June 2012
5.3.1.2 Data Collection
5.3.1.2.1 Special Status Species
This study included a search of online databases, published books, and reports; as well as communication with local experts to determine the potential occurrence and habitat needs of state and federally listed and sensitive species in Sierra County. We also examined the potential presence and habitat for special status species. Special status species are those found on public lands administered by the BLM or other agencies whose survival is of concern due to their limited distribution, low number of individuals and/or populations, or potential threats to habitat. The BLM uses the term "special status" to include federal endangered, threatened, proposed, and candidate species; and state endangered, threatened, and rare species.
Although non-federally listed species do not carry the same legal protection as federally listed species, it is useful to know of their presence or potential habitat for management considerations. The compiled information was compared with the conditions on site to determine if each species would likely be present in the project area.
5.3.1.2.2 Birds
When gathering bird data for this study, 37 bird transects were established running north-south across the project area (Figure 5-5). The transects were 125 meters apart in all habitats except the disturbed areas/waste rock pile where the transects were 250 meters apart. (The disturbed areas/waste rock pile, being nearly devoid of surface vegetation, was expected to contain relatively few birds and was deemed to provide good visibility for the few that were observed.) The transects ranged in length from 150 meters to slightly more than 5,000 meters long. Each transect was walked once during the breeding season beginning near sunrise until approximately 9:00 a.m., after which bird activity declined due to heat. The transects were not walked during high wind or when conditions would not allow species identification. Information was recorded about all birds seen or heard, including the quantity, age, and sex (if discernible); the habitat it was using; and the approximate distance from the observer. The location of any nests found was also recorded; however, not much time was spent searching for nests.
In addition to field surveys, on-line databases were searched for bird records by other observers. The databases included the New Mexico Ornithological Society for Sierra County database (New Mexico Ornithological Society, 2011), the ebird database of the Cornell Lab of Ornithology for Sierra County (Cornell Lab of Ornithology 2011), and the records of the New Mexico Audubon Society (Audubon Society, 2011a, 2011b, and 2011c). Discussions were also conducted with local experts and birders from around the state who have spent time birding in the area, including birders from the Mesilla Valley Audubon Society, and Wings West Tours.
A winter bird survey was also completed during December 2011. Methods and results from that assessment are included in Appendix 5-B.
5.3.1.2.3 Large Mammals
Due to their wariness, large mammals are often difficult to observe directly. Pellet plot counts were used in this study, which have been shown to be an effective indirect index of relative abundance (Neff, 1968; Davis and Winstead, 1972). Thirty random pellet plot locations were generated across all habitat types at the mine site (Figure 5-6). Field staff navigated to each spot with a handheld GPS unit, establishing a transect of ten 0.01-acre (435.6 ft2) circular transects. The transects were marked by hammering an 18-inch rebar into the ground at the plot center, looping an 11.75-foot length of rope over the rebar (the 11.75-foot radius produced the circular 0.01-acre area). All pellets within this radius were tallied, identified to species (mule deer, elk, predator,

New Mexico Copper Corporation Copper Flat Baseline Data Characterization Report
Copper Flat Mine 5-5 Section 5: Wildlife Survey Results June 2012
cottontail, black-tailed jackrabbit, or other/unidentified), and removed from the plot so a future reading of the plot would count only pellets left since the previous reading. Eastern cottontail and white-tailed deer may also be present at the mine (J. Frey, pers comm., 2011), but it was assumed that the signs found were of the more abundant desert cottontail and mule deer.
5.3.1.2.4 Small Mammals
Small mammals were sampled using 2-inch by 2-inch by 8-inch folding aluminum Sherman live traps baited with oats, peanut butter, and molasses. Traps were set in the CDS, CDG, and Arroyo habitats (Figure 5-7). In total, 8 sets of 10 traps each were established on the mine site (one set had 13 traps), spaced approximately 10 meters apart. Traps were opened and baited in the late afternoon, and checked early in the morning, at which time the traps were closed, to avoid trapping animals during the heat of the day. The trapped animals were released into a clear plastic Ziploc bag. The animals were weighed and the length of the body, tail, ear, and hind foot were measured to aid in species identification. The captured animals were then marked with either magic marker or nail polish on the head to differentiate between newly captured animals and recaptured ones (which were not re-measured). The animals were then photographed and released at the spot of capture. The field staff took precautions against Hantavirus and other infectious diseases by wearing respirators and rubber gloves, and cleaning tools and hands with diluted bleach.
5.3.1.2.5 Bats
Bat presence was recorded using a Songmeter SM2BAT 384kHz ultrasonic recorder placed in the CDG (Bat 4), Pit Lake (Bat 5), and Arroyo (Bat 1) habitats at the mine site, and in the Arroyo (Bat 2), CDG (Bat 3), and lake habitats (Bat 6) off-site (Figure 5-2). The Songmeter is an automated device that records and stores the echolocation ultrasound signals of bats and other creatures. Detection ability varies with geography, weather, and microphone placement, but the device will typically record calls within a few hundred ft of the microphone. The unit is enclosed in a weatherproof case and placed on an elevated pole. Two (or, for one location, one) omni-directional microphones were used with a sensitivity of -36+/-4dB (0dB=1V/pa@1kHz), a frequency response of flat 20Hz-20 kHz, and a signal-to-noise ratio of >62dB. Full specifications of the unit can be found in Wildlife Acoustics (2011). The boxes were placed near likely feeding or flying areas, including ponds, water sources, riparian corridors, and passes between hills. Boxes were left in place for between 7 and 10 nights. (The units have a battery-saving timer, which was utilized to turn the unit on approximately one hour before sunset and off one hour after sunrise.) The data was then downloaded onto a laptop computer and the bat box moved to the next sampling location. After the calls were analyzed, a species list was developed for each site, which was analyzed by Dr. Jennifer Frey, a mammalogist who is very familiar with the species of southern New Mexico. Because sonograph recording and analysis does not guarantee 100 percent accuracy in species identification, species identified fewer than three times by the Songmeter software or that would be considered by experts as highly unusual for the area were removed from the database.
5.3.1.2.6 Reptiles and Amphibians
Reptiles and amphibians were searched for during walking bird transects and during the course of other field work. These species were recorded when possible. Field staff made two failed attempts to capture and identify reptiles. The SAP initially called for establishing drift fences and pitfall traps using silt fence and 5-gallon buckets. However, the soil at the mine site and surrounding area was too rocky to enable digging holes for the pitfall traps. Wire mesh funnel traps were constructed and placed along drift fences. These types of traps have been shown to be effective in some cases (Finch, 1951; Greenberg et al., 1994) in similar habitats. Although six drift fence arrays were set up, no reptiles were trapped in this manner. Instead, published reference materials

New Mexico Copper Corporation Copper Flat Baseline Data Characterization Report
Copper Flat Mine 5-6 Section 5: Wildlife Survey Results June 2012
(Degenhardt et al., 1996; Stebbins, 1985) and discussions with local experts were used to develop a species list of reptiles and amphibians that could possibly occur at the site based on range and habitat.
5.3.2 Off-Site Reference Areas
5.3.2.1 Sampling Objective
The sampling objective for using off-site reference areas was for comparison of species with similar existing habitats that were present in established, undisturbed areas outside of the project boundary. This data was used to record the presence of the same taxa tallied at the mine site.
5.3.2.2 Data Collection
5.3.2.2.1 Special Status Species
Survey methods for special status species in off-site reference areas were the same as for the Copper Flat Mine permit area.
5.3.2.2.2 Birds
A total of 18 bird transects were established in off-site reference areas in the CDG and CDS habitats. Reference areas for the Pit, Pit Lake, Tailing Dam, and Disturbed Areas/Waste Rock Pile habitats were not surveyed as areas of this kind would have been almost impossible to locate. The research and discussions described for the Copper Flat area were also used in off-site reference areas. Off-site transect locations were selected in the field. Areas with habitat conditions similar to undisturbed strata in the mine permit area were targeted.
5.3.2.2.3 Large Mammals
A total of 10 pellet plot transects were established in off-site reference areas in the CDG and CDS habitats (Figure 5-6), but reference areas for the Pit, Pit Lake, Tailing Dam, and Disturbed Areas/Waste Rock Pile habitats were not found. The same protocols were used as for on-mine site plots. Plot locations were hand-selected in areas with habitat conditions similar to undisturbed strata in the mine permit area, and also where access was permitted.
5.3.2.2.4 Small Mammals
Four small mammal trapping transects were established in off-site reference areas in the Arroyo, CDG, and CDS habitats (Figure 5-7), but reference areas for the Pit, Pit Lake, Tailing Dam, and Disturbed Areas/Waste Rock Pile habitats were not found. The protocols that were used for on-mine site trapping were used for off-site trapping.
5.3.2.2.5 Bats
Three bat detection stations were established in off-site reference areas in the Arroyo, Lake, and CDG habitats, but no reference areas for the Pit, Tailing Dam, and Disturbed Areas/Waste Rock Pile habitats were found. The CDG and Arroyo sites were within approximately 1 mile of the boundary of the Copper Flat Mine permit area (Figure 5-2). The “Lake Site” consists of a 32-foot-diameter stock pond on Ladder Ranch approximately 2 miles from the boundary of the Copper Flat Mine permit area.

New Mexico Copper Corporation Copper Flat Baseline Data Characterization Report
Copper Flat Mine 5-7 Section 5: Wildlife Survey Results June 2012
5.3.2.2.6 Reptiles and Amphibians
As with surveys on the Copper Flat Mine permit area, reptiles and amphibians were searched for during walking bird transects and during the course of other field work. Species were recorded when possible.
5.3.3 Las Animas Creek, Percha Creek, Percha Box, and Isolated Springs
5.3.3.1 Sampling Objectives
The sampling objectives for the off-site riparian areas were to conduct a reconnaissance of the habitat, describe the potential for wildlife habitat, and record any notable wildlife species or signs present.
5.3.3.2 Data Collection
5.3.3.2.1 Special Status Species
Survey methods for special status species in off-site reference areas were the same as for the Copper Flat Mine permit area and the off-site reference areas.
5.3.3.2.2 Birds
In October 2011, field staff visited Las Animas Creek and Percha Creek, including Percha Box, to evaluate wildlife habitat and make incidental bird observations. In the weeks following the visit, on-line research was conducted, along with phone interviews with people knowledgeable about the wildlife in these areas. Research included using the database of the New Mexico Ornithological Society (New Mexico Ornithological Society, 2011); the ebird database of the Cornell Lab of Ornithology (Cornell Lab of Ornithology, 2011); records of the New Mexico Audubon Society (Audubon Society, 2011a, 2011b, and 2011c), and discussions with local experts and birders from around the state who have spent time birding in the area. Several groups or individuals have extensive records for Las Animas Creek. It should be noted that bird records are by their nature spotty and inexact. Bird records are highly biased based on when visits were made. For example, many more records are in the database for winter, when the Christmas bird counts occur in these areas. Also, bird records in the databases do not necessarily specify where the sightings were made. For example, a sighting for Las Animas Creek might be anywhere from the headwaters to the mouth of the creek, or even areas outside the riparian zone. Finally, many sightings, probably the vast majority, never make it into these databases. These cautions aside, there has been considerable birding done in the area (especially along Las Animas Creek) by very knowledgeable birders, and their records provide excellent information on what species have occurred along these creeks at one time or another.
5.3.3.2.3 Large Mammals
During October 2011, field staff recorded sightings and signs of animals in these areas. On-line research was conducted, as well as interviews with observers that are familiar with the area.
5.3.3.2.4 Small Mammals
Aside from the occasional squirrel, no small mammals were observed or recorded during the site visits in October 2011. Some gopher mounds were encountered. On-line research was used instead to develop possible species lists.

New Mexico Copper Corporation Copper Flat Baseline Data Characterization Report
Copper Flat Mine 5-8 Section 5: Wildlife Survey Results June 2012
5.3.3.2.5 Bats
Bats were not surveyed in and along Animas or Percha Creeks. It is likely that species lists developed for the Copper Flat Mine permit area and reference sites would apply to this area. One bat box was placed on the Ladder Ranch, approximately 2.5 km from Las Animas Creek.
5.3.3.2.6 Reptiles and Amphibians
Few reptiles were observed during the field visits. It is assumed that species lists developed for the Copper Flat Mine permit area and reference sites would apply to these sites.
5.4 Baseline Data Results
5.4.1 Copper Flat Mine Permit Area
5.4.1.1 Special Status Species
Five special status species were identified that occur in the Copper Flat Mine area: Texas horned lizard (Phrynosoma cornutum), loggerhead shrike (Lanius ludovicianus), Townsend’s pale big-eared bat (Corynorhinus townsendii pallescens), fringed myotis (Myotis thysanodes thysanodes), and Yuma myotis (Myotis yumanensis yumanensis) (Table 5-1). None of these species is federally listed as endangered or threatened. Habitat appears to exist that could support up to ten other listed or sensitive species, at least marginally or during migration, that are known to occur in Sierra County: aplomado falcon (Falco femoralis), American peregrine falcon (Falco peregrinus anatum), Arctic peregrine falcon (Falco peregrinus tundrius), ferruginous hawk (Buteo regalis), Baird’s sparrow (Ammodramus bairdii), gray vireo (Vireo vicinior), Allen’s big-eared bat (Idionycteris phyllotis), desert pocket gopher (Geomys arenarius brevirostris), common hog-nosed skunk (Conepatus leuconotus mearnsi), and western spotted skunk (Spilogale gracilis) (Table 5-1). The aplomado falcon is the only species of these that is federally-listed as endangered. It has not been documented near the site, but does occur in Sierra County in habitats similar to those near the mine site. No critical habitat has been designated for this species.
5.4.1.2 Birds
There were 46 species of birds identified on the transects during the breeding season (Table 5-2), and eight additional species were encountered during other work. The diversity of species in different habitats was also considered. One measure of biological diversity is the Shannon-Weaver Index (H’), which uses the following algorithm to calculate relative diversity:
Where:
S is the total number of species encountered
pi is the frequency of the ith species (the probability that any given individual belongs to the species)
The use of this index avoids the difficulty of identifying habitats with large populations of individuals as necessarily diverse. Areas that have high numbers of one or two individuals and very few of all others will receive a low diversity score, while areas that have numbers of individuals, even perhaps fewer total but spread

New Mexico Copper Corporation Copper Flat Baseline Data Characterization Report
Copper Flat Mine 5-9 Section 5: Wildlife Survey Results June 2012
more evenly over many species (in other words, habitats that support a greater array of species) will score higher. This algorithm was used for the analysis of the bird and small mammal survey results.
The number of bird species recorded in this study was 39 in the Arroyo habitat, 15 in the CDS, 38 in the CDG, 4 in the Pit Lake habitat, and 21 in the Disturbed Areas/Waste Rock Pile habitat (Table 5-2). In addition to having the most species, the Arroyo and CDG habitat were the most diverse. (See Chapter 4 for a full definition of the habitats and lists of plant species occurring there).
Research indicated that at least 78 additional species that occur in Sierra County have potential habitat at the Copper Flat Mine permit area at some time during the year (Table 5-3).
5.4.1.3 Large and Medium-Sized Mammals
Mule deer signs were encountered on 16 of the 30 (53 percent) transects read. Most of the signs were in the western half of the project area, in the CDG habitat, though signs were found in all parts of the mine. Deer were frequently observed in the Greyback Arroyo and other arroyos on the site. Desert cottontail signs were found on 29 of 30 (97 percent) of the transects, black-tailed jackrabbit signs were found in 23 of 30 (77 percent) of the transects, and predators or other signs were found on 4 of 30 (13 percent) of the transects.
In addition, one pronghorn (Antilocapra americana) was encountered during walking the transects on the southeastern portion of the Copper Flat Mine permit area. Also, signs of collared peccary (Pecari tajacu) mountain lion (Puma concolor), bobcat (Lynx rufus), coyote (Canis latrans), and fox, likely gray fox (Urocyon cinereoargenteus) were noted during field work. Other large to medium mammals that are likely present on the Copper Flat Mine permit area but were not encountered are listed in Table 5-4, which was developed by consulting range maps and species lists in published reports, including Bailey (1932), Chapman and Feldhammer (1982), Findley et al. (1975), and Frey (1998, 2010), and by consulting with local experts (J. Frey, pers. comm., 2011).
5.4.1.4 Small Mammals
A total of 86 individuals of eight species of small mammals were trapped at the Copper Flat Mine permit area: brush mouse (Peromyscus boylii), desert cottontail, Merriam’s kangaroo rat (Dipodomys merriami), Northern grasshopper mouse (Onchomys leucogaster), Mearn’s grasshopper mouse (Onychomys arenicola), rock pocket mouse (Chaetodipus intermedius), white-footed mouse (Peromyscus leucopus), and white-throated woodrat (Neotoma albigula) (Table 5-5). Species noted as “unknown” or “sp.” in the table are mostly animals that escaped from the trap or handling before the species of the animal could be identified.
For analysis, the trapping effort was standardized to compensate for different effort required in the different habitats and to eliminate sprung traps from consideration (if a trap is sprung, often by a coyote or other curious animal, it cannot trap a small mammal, and should not be counted toward the trapping effort). Effort is represented as number of animals per 100 trap nights of open traps. Diversity of small mammals was highest in CDS, where six species were trapped. The greatest number of animals trapped per effort was in the Arroyo site, followed by the CDS and CDG sites. Diversity, however, was greatest in the CDS habitat, followed by the CDG and Arroyo habitats. Although a relatively high density of individuals was trapped in the Arroyo, only two species were encountered: brush mouse and one unknown (escaped) species. Six species of small mammals were trapped in the CDS and five in the CDG.
In addition to trapping, research was conducted with several sources (see above) to determine species of mammals in the region that might be present and not detected during trapping (Table 5-4).

New Mexico Copper Corporation Copper Flat Baseline Data Characterization Report
Copper Flat Mine 5-10 Section 5: Wildlife Survey Results June 2012
5.4.1.5 Bats
A total of 12 species of bats was detected at the Copper Flat Mine permit area (Table 5-6, Figure 5-2): pallid bat (Antorzus pallidus), Townsend’s pale big-eared bat (Corynorhinus townsendii), big brown bat (Eptesicus fuscus), silver-haired bat (Lasionycteris noctivagans), southern hoary bat (Lasiurus cinereus), western small-footed myotis (Myotis ciliolabrum), California myotis (Myotis californicus), Arizona myotis (Myotis occultus), fringed myotis (Myotis thysanodes), Yuma myotis (Myotis yumanensis), canyon bat (Parastrellus hesperus), and Brazilian free-tailed bat (Tadarida brasiliensis). Species detected and identified by the Sonobat software but not observed were quality checked by local experts, who suggested changes to the list (J. Frey, pers. comm., 2011). Species that were detected but are of questionable occurrence (e.g., they would be very rare if detected) are denoted with a “?”. At least three other species were not detected, but likely occur in the region and have appropriate habitat at or near the Copper Flat Mine permit area (Table 5-6).
The number of calls by species at each site was also briefly examined. Though this provides an index of short-term relative abundance, results should be interpreted with caution as more calls do not necessarily correlate to more individuals using a site (for example, 100 calls could mean one bat calling 100 times, or 100 bats calling once). However, it can be relatively safe to assume that more calls and more activity indicate a higher density of prey. The most species and the most calls were detected at the Pit Lake, where insects provide the greatest feeding opportunities. The second highest abundance and diversity was from the CDG, followed by the Arroyo.
In addition to feeding habitat at the Lake, roosting habitat is provided by crevices in the rocky hills at the Copper Flat Mine permit area and, probably more importantly, by the many abandoned mine shafts. A thorough survey of shafts was not conducted for bat activity.
5.4.1.6 Reptiles and Amphibians
Pitfall and funnel trapping of reptiles and amphibians was not successful. Mine site soils were too rocky to effectively dig pitfall traps, and constructed wire mesh funnel traps failed to trap any reptiles. During walking transects and other survey efforts, nine species of reptiles were encountered at the mine site: coachwhip (Masticophis flagellum), whiptail lizard (Cnemidophorus sp.), bullsnake (Pituophis melanoleucus), Texas horned lizard, roundtail horned lizard (Phrynosoma modestum), desert spiny lizard (Sceloporus magister), black-tailed rattlesnake (Crotalus molossus), lesser earless lizard (Holbrookia maculata), and rock rattlesnake (Crotalus lepidus). Whiptails were the most abundant species seen, but field staff were unable to capture one to identify the species (six species occur in Sierra County).
Research was also conducted on the species that likely or possibly occur at the mine site based on expected range and the habitat present (Degenhardt et al., 1996; Stebbins, 1985). Up to forty-three species of reptiles and amphibians that are known to occur in Sierra County have suitable habitat present at the mine site (Table 5-7).
5.4.2 Off-Site Reference Areas
5.4.2.1 Special Status Species
Fourteen special status species were identified that occur in Sierra County, with habitat that occurs in off-site reference areas (Table 5-1). Although only three of these species (all bats) were encountered, it is likely that other species occur at other times. The only federally-listed species in the group, aplomado falcon, has not been detected near the mine site, but it has been recorded in Sierra County in habitat similar to that which occurs in the mine site reference areas. Sprague’s pipit (Anthus spraguei), a federal candidate species, has been documented in CDG near the mine (B. West, pers. comm., 2011).

New Mexico Copper Corporation Copper Flat Baseline Data Characterization Report
Copper Flat Mine 5-11 Section 5: Wildlife Survey Results June 2012
5.4.2.2 Birds
Field staff recorded 28 species of birds in off-site reference areas (Table 5-2), including 13 species in the Arroyo habitat, 7 species in the CDS, and 19 species in the CDG. Overall diversity was highest in the Arroyo, followed by the Grassland and Shrubland.
5.4.2.3 Large Mammals
One species of ungulate, mule deer, was recorded in the pellet transects in the off-site reference areas. The presence and relative abundance of desert cottontail and black-tailed jackrabbit was also noted. In addition, elk, pronghorn, and collared peccary have been reported in similar habitat just off the mine site. Other mammals that definitely, or likely, occur in off-site reference areas are listed in Table 5-4.
5.4.2.4 Small Mammals
Eight species of small mammals were trapped on the reference sites: brush mouse, white-footed mouse, Merriam’s kangaroo rat, Mearn’s grasshopper mouse, rock pocket mouse, Mexican woodrat, and white-throated woodrat (Table 5-5). Species noted as unknown or “sp.” in the table are mostly animals that escaped from the trap or handling before the species of the animals could be identified. One species, Mexican woodrat, was trapped in reference areas and was also trapped at Copper Flat Mine permit area. Both abundance and diversity of reference area small mammals was highest in the Arroyo habitat, followed by the CDS and CDG. All reference sites had a higher diversity, though not a higher abundance, of small mammals than the Copper Flat Mine permit area.
5.4.2.5 Bats
Sonobat detectors were placed at three off-site reference areas (Figure 5-2): the Arroyo, CDG, and Lake habitats. Ten species were detected (Table 5-6). Additionally, habitat likely exists for five other species (Table 5-6). Bat abundance, diversity, and bat use was highest by far at the Pit Lake, followed by the CDG and Arroyo habitats.
5.4.2.6 Reptiles and Amphibians
Pitfall and funnel trapping of reptiles and amphibians was not successful. Six species of reptiles were encountered along transects at off-site reference areas: coachwhip, whiptail, bullsnake, Texas horned lizard, roundtail horned lizard, and lesser earless lizard. Whiptails were the most abundant species seen; however, field staff were unable to capture one to identify the species (six species occur in Sierra County). The Sierra County species list (Table 5-7), which is drawn from Degenhardt et al. (1996), Stebbins (1985), and discussions with local experts, presents species likely to occur in reference areas near the mine site.
5.4.3 Las Animas Creek, Percha Creek, Percha Box, and Isolated Springs
5.4.3.1 Special Status Species
Animas and Percha Creeks provide important habitat and, despite being a relatively small area in the region, have a much higher proportion of sensitive species. This is largely, if not exclusively, due to the presence of intermittent to occasional perennial surface water fed by a shallow aquifer that supports a diverse and unique riparian area. A gallery forest of Arizona sycamore is present at Las Animas Creek, a habitat that is very rare east of the continental divide. Percha Creek, which does not contain sycamore, does have perennial water for approximately 4 miles. Portions of Percha Creek support a diverse riparian community. Ten special status species are known from this area and nine others likely occur based on their known distribution in Sierra County
New Mexico Copper Corporation Copper Flat Baseline Data Characterization Report
Copper Flat Mine 5-12 Section 5: Wildlife Survey Results June 2012
and habitat present in this area (Table 5-1). The federally threatened Chiricahua leopard frog (Rana chiricahuensis) is being cooperatively managed on the Ladder Ranch, and the federally threatened Mexican spotted owl (Strix occidentalis lucida), has been detected there.
5.4.3.2 Birds
Because surveys of Las Animas and Percha Creeks were not part of the original scope of work, bird surveys were not conducted at these sites, aside from making incidental observations during one brief visit in October 2011. However, considerable work has been done by birders. Using several sources (Audubon Society, 2011a, 2011b, and 2011c; Cornell Lab of Ornithology, 2011; B. West, pers. comm., 2011; D. Cleary, pers. comm., 2011; D. Griffin, pers. comm., 2011), a preliminary list of seasonal bird presence for Las Animas and Percha Creeks (Table 5-3) has been developed. In addition to listed species such as spotted owl and candidate species such as the yellow-billed cuckoo (Coccyzus americanus), the area contains many sensitive, rare, and endemic species that are found in a very limited range in the state, including common black hawk (Buteogallus anthracinus), gray hawk (Buteo nitidus), zone-tailed hawk (Buteo albonotatus), bald eagle (Haliaeetus leucocephalus), peregrine falcon, elf owl (Micrathene whitneyi), summer tanager (Piranga rubra), brown-crested flycatcher (Myiarchus tyrannulus), Hammond’s flycatcher (Empidonax hammondii), vermilion flycatcher (Pyrocephalus mexicanus), Bell’s vireo (Vireo bellii), Brewer’s sparrow (Spizella breweri), red-naped sapsucker (Sphyrapicus nuchalis), bridled titmouse(Baeolophus wollweberi), and hooded oriole (Icterus cucullatus). The area has been listed as an “Important Bird Area” by the Audubon Society.
5.4.3.3 Large Mammals
Surveys were not conducted for large mammals at Las Animas or Percha Creeks, though other observers have described some species abundance there. Most of the species documented for the Copper Flat Mine permit area and reference areas would all be expected to be present along Animas and Percha Creeks (Table 5-4), with a few differences. Pronghorn are less abundant, and collared peccary, elk, and American black bear (Ursus americanus) are more abundant. Frey (pers. comm., 2011) noted that white-tailed deer (Odocoileus virginianus) are possible in the upper reaches of Las Animas Creek. Other species that would be expected along these creeks but were not observed include ringtail (Bassariscus astutus), and porcupine (Erethrizon dorsatum).
5.4.3.4 Small Mammals
No small mammals were documented in these areas. Published literature and discussions with local experts were used to develop a list of possible species (Table 5-5).
5.4.3.5 Bats
One bat box was placed at the Ladder Ranch (Figure 5-2) within 4.0 miles of Las Animas Creek. The Ladder Ranch site was considered as one of the reference areas; however, most of the bats are close enough to the creek to support an assumption that the bats use the creek area for feeding and, for many of the species, roosting habitat as well. Eleven species of bats were detected at this site: pallid bat, silver-haired bat, southern hoary bat, western small-footed myotis, California myotis, Arizona myotis, fringed myotis, long-legged myotis, Yuma myotis, canyon bat, and Brazilian free-tailed bat. In addition, the riparian habitat likely provides habitat for up to five additional species that are known to occur in Sierra County (Table 5-4).

New Mexico Copper Corporation Copper Flat Baseline Data Characterization Report
Copper Flat Mine 5-13 Section 5: Wildlife Survey Results June 2012
5.4.3.6 Reptiles and Amphibians
Reptiles and amphibians were not sampled in this study. A few, however, were observed during field visits. The species listed in Table 5-7 present those that are known to occur in the area, or are known to occur in Sierra County in habitat that is present in Animas Creek or Percha Creek.
In summary, several overall observations can be noted from the field and other data collected for this study:
Arroyo habitat provides relatively high diversity for small mammals, songbirds, reptiles, and amphibians. Habitat along Percha Creek, and especially Las Animas Creek, provides very high biodiversity and habitat
for several federally listed, state, and BLM listed or sensitive, or rare species, of birds and other wildlife. Concentrated sources of water provide feeding habitat for a diverse array of bats. Chihuahuan Desert Grasslands provide good habitat for big game, especially mule deer.
5.5 References Audubon Society. 2011a. Checklist of the birds of Southwest New Mexico. Available online at:
http://nm.audubon.org/swnmbt/swnm_checklist.html.
Audubon Society. 2011b. Registry or Important Bird Areas – Ladder Ranch. Available online at: http://nm.audubon.org/NM_birding/iba/ibawriteups/ladderranch.html.
Audubon Society. 2011c. Listing of birding hotspots in southwest New Mexico. Available online at: http://nm.audubon.org/swnmbt/swnm_sites/animascreek.html.
Bailey, V. 1932. Mammals of the Southwestern United States, with Special Reference to New Mexico. Dover Publisher, New York.
Carothers, S.W., R.R. Johnson, and S.W. Atchison. 1974. Population, structure and social organization of Southwestern riparian birds. American Zoologist 14: 97-108.
Chapman, J.A., and G.A. Feldhammer (eds.). 1982. Wild Mammals of North America. Johns Hopkins Univ. Press. Baltimore.
Cleary, D. 2011. Personal communication via phone, October 2011.
Cornell Lab of Ornithology. 2011. Database field records for Las Animas Creek, Sierra County. Available online at: http://ebird.org/ebird/GuideMe?step=saveChoices&getLocations=hotspots&parentState=US-NM&bMonth=01&bYear=1900&eMonth=12&eYear=2011&reportType=location&hotspots=L156468&continue.x=35&continue.y=8.
Davis, D.E. and R.L. Winstead. 1972. Estimating the numbers of wildlife populations. Pages 221-246 in S.D. Schemnitz, ed. Wildlife Management Techniques Manual. The Wildlife Society.
Degenhardt, W.G., C.W. Painter, and A.H. Price. 1996. Reptiles and amphibians of New Mexico. University of New Mexico Press.
Finch, H.S. 1951. A simplified type of funnel trap for reptiles. Herpetologica Vol. 7(2):77-80.
Findley, J.S., A.H. Harris, D.E. Wilson, and C. Jones. 1975. Mammals of New Mexico. University of New Mexico Press, Albuquerque. 360pp.
Frey J. 2011. Personal communication. New Mexico State University.

New Mexico Copper Corporation Copper Flat Baseline Data Characterization Report
Copper Flat Mine 5-14 Section 5: Wildlife Survey Results June 2012
Frey, J.K. 1998. Field Identification of terrestrial small mammals from the vicinity of the Fra Cristobal Mountains, Sierra County, New Mexico. Museum of Southwestern Biology.
Frey, J.K. 2010. Mammals of the Upper Gila River Watershed, Arizona and New Mexico: Patterns of diversity and species of concern. Proceedings of the Second Natural History of the Gila Symposium, October 2008/ The New Mexico Botanist, Special Issue No. 2, October 2010.
Greenberg, C.H., D.G. Neary, and L.D. Harris. 1994. A comparison of herpetofaunal sampling effectiveness of pitfall, single-ended, and double-ended funnel traps used with drift fences. Journal of Herpetology 28(3): 319-324.
Griffin, D. 2011. Personal communication via phone, October 2011.
Hubbard, J. 1971. The summer birds of the Gila Valley, New Mexico. Nemouria: Occasional paper 2. Delaware Museum of Natural History, Greenville, Delaware.
Neff, D.J. 1968. The Pellet-Group count technique for big game trend, census, and distribution: A review. The Journal of Wildlife Management 32(3): 597-614.
New Mexico Ornithological Society. 2011. Database of field records for Las Animas Creek. Available online at: http://nhnm.unm.edu/partners/NMOS/results.php5.
Parametrix, Inc. 2010. Sampling and analysis plan for Copper Flat Mine: Parametrix Project 563-6671-001. Submitted to Mining and Minerals Division; New Mexico Energy, Minerals and Natural Resources Department in September 2010. Available online at: http://www.emnrd.state.nm.us/MMD/ MARP/permits/documents/SI027RN_20100909_Copper_Flat_SAP_Wildlife.pdf.
Parametrix, Inc. 2011. Biological resources survey report: Copper Flat pipeline and well sites, Sierra County, NM. Submitted to the Bureau of Land Management.
Rice, J., R.D. Ohmart, and B.W. Anderson. 1983. Turnovers in species composition of avian communities in contiguous riparian habitats. Ecology 64: 1444-1455.
Stebbins, R.C. 1985. Field guide to western reptiles and amphibians. Houghton Mifflin.
West, B. 2011. WingsWest Tours, personal communication via phone, October 2011.
Wildlife Acoustics. 2011. Specifications for the SM2BAT Songmeter. Available online at: http://www.wildlifeacoustics.com/products/ultrasonic-monitoring.

Tables

Table 5-1, Page 1 of 2
Table 5-1 Listed and Sensitive Species with Known Occurrence or Habitat at Copper Flat Mine Permit Area,
Las Animas Creek, or Percha Creek
Common Name Scientific Name Federal State BLM
Species Present Habitat Present
CF Mine Site
Animas/ Percha
• = Recoded species; ○ = Not detected but habitat present/species occur in the region Reptiles and Amphibians
Chiricahua Leopard Frog Rana chiricahuensis T S -
•
Arizona Toad Bufo microscaphus microscaph. - S S
○
Texas Horned Lizard Phrynosoma cornutum - - S •
Birds
Common Black Hawk Buteogallus anthracinus S T -
• Varied Bunting Passerina versicolor - T -
Yellow-billed Cuckoo Coccyzus americanus occid. C S -
•
Bald Eagle Haliaeetus leucocephalus - T -
• Aplomado Falcon Falco femoralis septent. E E - ○ ○ Peregrine Falcon Falco peregrinus anatum S T - ○
Arctic Peregrine Falcon Falco peregrinus tundrius S T - ○
Southwest Willow Flycatcher
Empidonax traillii extimus E E -
Ferruginous Hawk Buteo regalis - - S ○
Mexican Spotted Owl Strix occidentalis lucida T - -
• Loggerhead Shrike Lanius ludovicianus excub. - S S • • Baird's Sparrow Ammodramus bairdii S T S
•
Sprague's Pipit Anthus spragueii C - -
Bell's Vireo Vireo bellii arizonae S T -
○ Gray Vireo Vireo vicinior - T - ○
Mammals
Allen’s Big-eared Bat Idionycteris pyllotis S S S ○ ○ Townsend's Pale Big-eared Bat
Corynorhinus townsendii pall. S S S • •
Fringed Myotis Bat Myotis thysanodes thysanodes - S S • •
Yuma Myotis Bat Myotis yumanensis yuman. - S S • • Desert Pocket Gopher Geomys arenarius brevirostris S S - ○
Ringtail Bassariscus astutus - S -
○

Table 5-1, Page 2 of 2
Common Name Scientific Name Federal State BLM
Species Present Habitat Present
CF Mine Site
Animas/ Percha
• = Recoded species; ○ = Not detected but habitat present/species occur in the region Common Hog-nosed Skunk
Conepatus leuconotus mearnsi - S - ○ ○
Western Spotted Skunk Spilogale gracilis - S - ○ ○ Other Taxa
Obsolete Viceroy Butterfly Basilarchia archippus obsoleta S - -
○
Note: Abbreviations: Endangered, Threatened, Sensitive, Species of Concern, Candidate Species

Table 5-2, Page 1 of 2
Table 5-2 Bird Species Recorded by Habitat at the Copper Flat Mine Permit Area
Species
Copper Flat Mine Permit Area Reference Sites
Arroyo CDS CDG Pit DA/WR Arroyo CDS CDG
American Kestrel •
• American Robin •
•
Ash-throated Flycatcher • • •
• •
• Barn Swallow
•
Bewick's Wren
• Black-chinned Hummingbird •
•
Black-throated Sparrow • • • • • • • • Blue Gray Gnatcatcher •
•
•
•
Blue Grosbeak
•
•
• Broad-tailed Hummingbird •
•
Brown-headed Cowbird •
•
• Bullock's Oriole
•
Cactus Wren • • • • •
• Canyon Towhee •
•
•
•
Canyon Wren •
•
• Common Nighthawk
•
•
Common Raven • • •
• • • • Crissal Thrasher
•
Curve-billed Thrasher •
•
• Flycatcher sp. •
•
•
•
Gambel's Quail • • •
• • • Great Horned Owl •
Greater Roadrunner Horned Lark
•
• House Finch • •
•
Lesser Goldfinch •
•
• Loggerhead Shrike
•
Montezuma Quail
• Mourning Dove • • •
•
• • Northern Flicker
•
•
Northern Mockingbird • • •
• •
• Oriole sp. •
•
Red-tailed Hawk • • •

Table 5-2, Page 2 of 2
Species
Copper Flat Mine Permit Area Reference Sites
Arroyo CDS CDG Pit DA/WR Arroyo CDS CDG
Rock Wren •
•
• •
• Rufous-crowned Sparrow •
•
•
Say's Phoebe • • •
• • Scaled Quail •
•
Sparrow sp. • Spotted Towhee • Swainson's Hawk •
• Swallow sp.
•
Thrasher sp. •
•
• Townsend's Warbler •
Turkey Vulture •
•
•
• Unknown • • •
• •
•
Violet-green Swallow • • •
• Warbler sp. •
•
Western Kingbird •
•
•
• Western Meadowlark
•
Western Wood-Pewee • • •
• White-winged Dove •
•
Wilson's Warbler • Wren sp.
•
•
Total Species Encountered: 39 15 38 4 21 13 7 19
Shannon-Weaver Diversity Score: 15.1 5.3 16.9 2.3 9.9 11.3 2.6 10.8
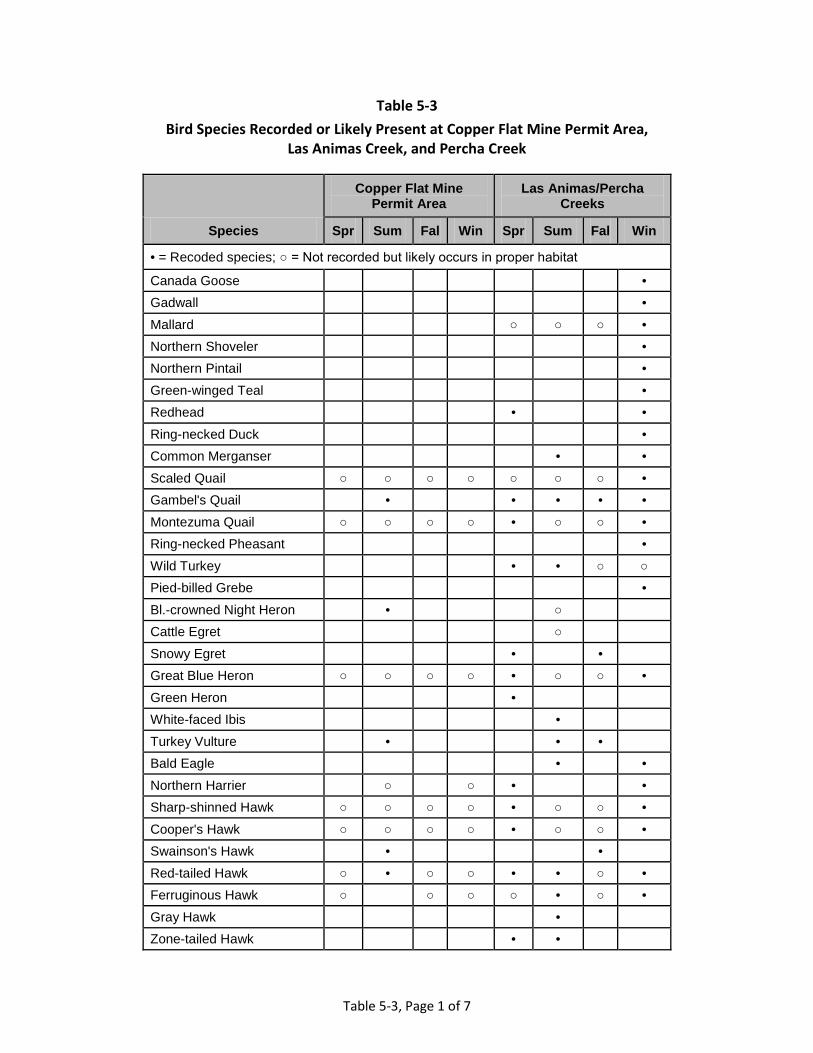
Table 5-3, Page 1 of 7
Table 5-3 Bird Species Recorded or Likely Present at Copper Flat Mine Permit Area,
Las Animas Creek, and Percha Creek
Species
Copper Flat Mine Permit Area
Las Animas/Percha Creeks
Spr Sum Fal Win Spr Sum Fal Win
• = Recoded species; ○ = Not recorded but likely occurs in proper habitat
Canada Goose
• Gadwall
•
Mallard
○ ○ ○ • Northern Shoveler
•
Northern Pintail
• Green-winged Teal
•
Redhead
•
• Ring-necked Duck
•
Common Merganser
•
• Scaled Quail ○ ○ ○ ○ ○ ○ ○ • Gambel's Quail
•
• • • •
Montezuma Quail ○ ○ ○ ○ • ○ ○ • Ring-necked Pheasant
•
Wild Turkey
• • ○ ○ Pied-billed Grebe
•
Bl.-crowned Night Heron
•
○ Cattle Egret
○
Snowy Egret
•
• Great Blue Heron ○ ○ ○ ○ • ○ ○ •
Green Heron
• White-faced Ibis
•
Turkey Vulture
•
• • Bald Eagle
•
•
Northern Harrier
○
○ •
• Sharp-shinned Hawk ○ ○ ○ ○ • ○ ○ • Cooper's Hawk ○ ○ ○ ○ • ○ ○ • Swainson's Hawk
•
•
Red-tailed Hawk ○ • ○ ○ • • ○ • Ferruginous Hawk ○
○ ○ ○ • ○ •
Gray Hawk
• Zone-tailed Hawk
• •
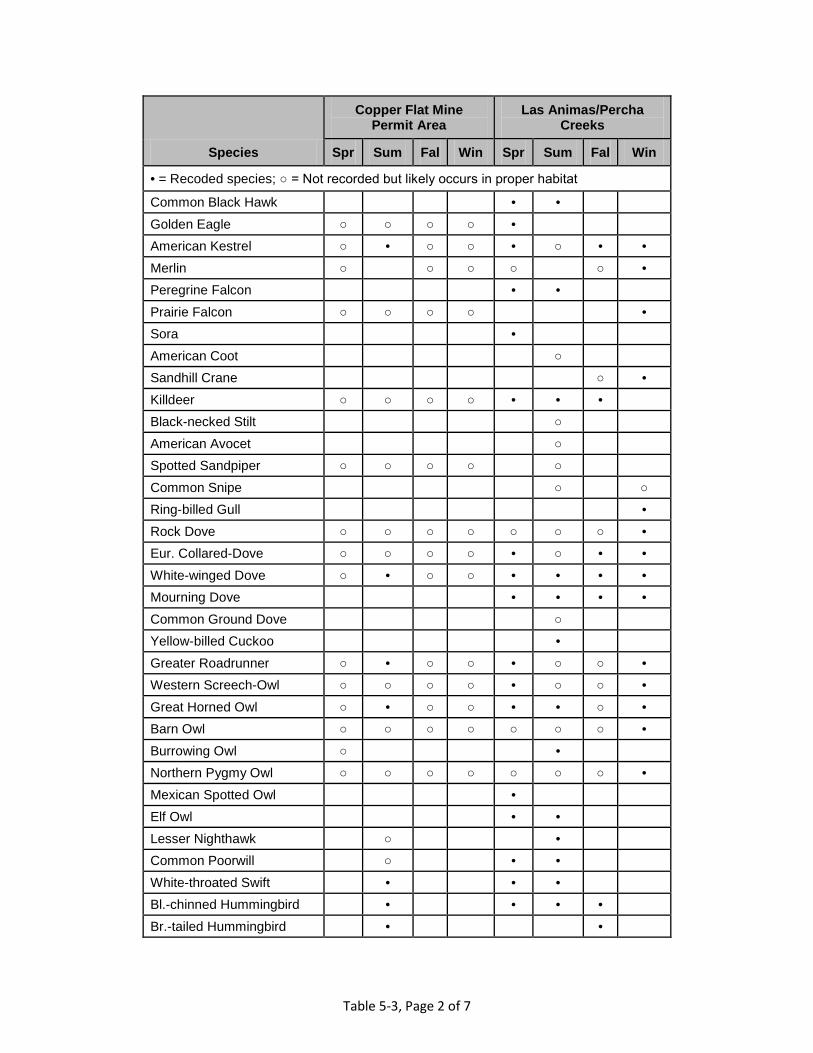
Table 5-3, Page 2 of 7
Species
Copper Flat Mine Permit Area
Las Animas/Percha Creeks
Spr Sum Fal Win Spr Sum Fal Win
• = Recoded species; ○ = Not recorded but likely occurs in proper habitat
Common Black Hawk
• • Golden Eagle ○ ○ ○ ○ •
American Kestrel ○ • ○ ○ • ○ • • Merlin ○
○ ○ ○
○ •
Peregrine Falcon
• • Prairie Falcon ○ ○ ○ ○
•
Sora
• American Coot
○
Sandhill Crane
○ • Killdeer ○ ○ ○ ○ • • •
Black-necked Stilt
○ American Avocet
○
Spotted Sandpiper ○ ○ ○ ○
○ Common Snipe
○
○
Ring-billed Gull
• Rock Dove ○ ○ ○ ○ ○ ○ ○ • Eur. Collared-Dove ○ ○ ○ ○ • ○ • • White-winged Dove ○ • ○ ○ • • • • Mourning Dove
• • • •
Common Ground Dove
○ Yellow-billed Cuckoo
•
Greater Roadrunner ○ • ○ ○ • ○ ○ • Western Screech-Owl ○ ○ ○ ○ • ○ ○ • Great Horned Owl ○ • ○ ○ • • ○ • Barn Owl ○ ○ ○ ○ ○ ○ ○ • Burrowing Owl ○
•
Northern Pygmy Owl ○ ○ ○ ○ ○ ○ ○ • Mexican Spotted Owl
•
Elf Owl
• • Lesser Nighthawk
○
•
Common Poorwill
○
• • White-throated Swift
•
• •
Bl.-chinned Hummingbird
•
• • • Br.-tailed Hummingbird
•
•

Table 5-3, Page 3 of 7
Species
Copper Flat Mine Permit Area
Las Animas/Percha Creeks
Spr Sum Fal Win Spr Sum Fal Win
• = Recoded species; ○ = Not recorded but likely occurs in proper habitat
Belted Kingfisher
• • • • Lewis's Woodpecker
•
Red-headed Woodpecker
•
• Red-naped Sapsucker
•
Acorn Woodpecker
• • • • Red-naped Sapsucker
•
• •
Yel.-bellied Sapsucker
• Lad.-backed Woodpecker
• •
•
Downy Woodpecker ○ ○ ○ ○ • ○ ○ • Hairy Woodpecker ○ ○ ○ ○ • ○ ○ ○ Northern Flicker ○ • ○ ○ • ○ • • Western Wood-Pewee
•
• •
Hammond's Flycatcher
•
• Willow Flycatcher
•
Brown-crested Flycatcher
•
• Eastern Phoebe
•
Black Phoebe
•
• •
• Say's Phoebe ○ • ○ ○ • • • • Vermilion Flycatcher
○
• •
•
Ash-throated Flycatcher
•
• Brown-crested Flycatcher
• •
Dusky Flycatcher
• Dusky-capped Flycatcher
•
Cassin's Kingbird
• • Western Kingbird
•
• •
Loggerhead Shrike ○ • ○ ○ • • ○ • Bell's Vireo
•
Plumbeous Vireo
• Warbling Vireo
•
Hutton's Vireo
○
○
• • Steller's Jay
•
Western Scrub-Jay ○ ○ ○ ○ ○ ○ • • American Crow ○ ○ ○ ○ ○ ○
•
Chihuahuan Raven
○ • ○ • •

Table 5-3, Page 4 of 7
Species
Copper Flat Mine Permit Area
Las Animas/Percha Creeks
Spr Sum Fal Win Spr Sum Fal Win
• = Recoded species; ○ = Not recorded but likely occurs in proper habitat
Common Raven ○ • ○ ○ • ○ • • Horned Lark ○ • ○ ○ • ○ ○ • N. Rough-winged Swallow
○
• •
Violet-green Swallow ○ • ○
• • ○ Barn Swallow ○ • ○
• • •
Cliff Swallow
○
• Mountain Chickadee
○
•
Bridled Titmouse ○ ○ ○ ○ • • ○ • Juniper Titmouse ○ • ○ ○
•
Verdin •
•
• • Bushtit ○ ○ ○ ○ ○ ○ ○ ○ Red-breasted Nuthatch
•
White-breasted Nuthatch
• • • • Brown Creeper ○ ○ ○ ○ ○ ○ ○ • Cactus Wren ○ • ○ ○ • ○ • • Rock Wren ○ • ○ ○ •
•
Canyon Wren ○ • ○ ○
• Bewick's Wren ○ ○ ○ ○ • • • •
House Wren ○
• Winter Wren
•
Bl.-tailed Gnatcatcher ○
• Blue-Gray Gnatcatcher
○
•
Golden-crowned Kinglet
• Ruby-crowned Kinglet ○ ○ ○ ○ • ○ ○ • Eastern Bluebird
•
Western Bluebird ○ ○ ○ ○ • ○ ○ • Mountain Bluebird ○ ○ ○ ○
•
Townsend's Solitaire
○ •
• Hermit Thrush
•
•
Rufous-backed Robin
•
• American Robin ○ • ○ ○ • • ○ • Northern Mockingbird ○ • ○ ○ • • ○ • American Dipper
•
Curve-billed Thrasher ○ • ○ ○ •
• •
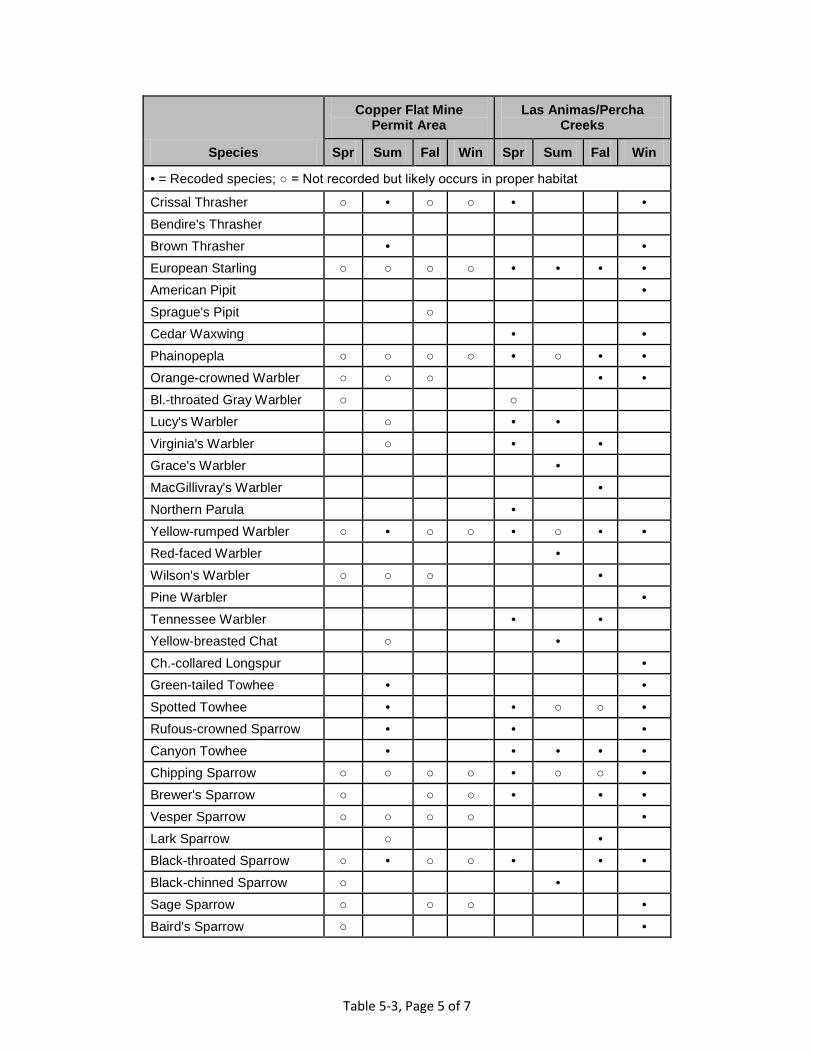
Table 5-3, Page 5 of 7
Species
Copper Flat Mine Permit Area
Las Animas/Percha Creeks
Spr Sum Fal Win Spr Sum Fal Win
• = Recoded species; ○ = Not recorded but likely occurs in proper habitat
Crissal Thrasher ○ • ○ ○ •
• Bendire's Thrasher
Brown Thrasher
•
• European Starling ○ ○ ○ ○ • • • • American Pipit
•
Sprague's Pipit
○ Cedar Waxwing
•
•
Phainopepla ○ ○ ○ ○ • ○ • • Orange-crowned Warbler ○ ○ ○
• •
Bl.-throated Gray Warbler ○
○ Lucy's Warbler
○
• •
Virginia's Warbler
○
•
• Grace's Warbler
•
MacGillivray's Warbler
• Northern Parula
•
Yellow-rumped Warbler ○ • ○ ○ • ○ • • Red-faced Warbler
•
Wilson's Warbler ○ ○ ○
• Pine Warbler
•
Tennessee Warbler
•
• Yellow-breasted Chat
○
•
Ch.-collared Longspur
• Green-tailed Towhee
•
•
Spotted Towhee
•
• ○ ○ • Rufous-crowned Sparrow
•
•
•
Canyon Towhee
•
• • • • Chipping Sparrow ○ ○ ○ ○ • ○ ○ • Brewer's Sparrow ○
○ ○ •
• •
Vesper Sparrow ○ ○ ○ ○
• Lark Sparrow
○
•
Black-throated Sparrow ○ • ○ ○ •
• • Black-chinned Sparrow ○
•
Sage Sparrow ○
○ ○
• Baird's Sparrow ○
•

Table 5-3, Page 6 of 7
Species
Copper Flat Mine Permit Area
Las Animas/Percha Creeks
Spr Sum Fal Win Spr Sum Fal Win
• = Recoded species; ○ = Not recorded but likely occurs in proper habitat
Grasshopper Sparrow
• Clay-colored Sparrow
•
Lark Bunting ○
○ ○ • Indigo Bunting
•
Lazuli Bunting
• Varied Bunting
•
Song Sparrow
○ •
• • Lincoln's Sparrow ○
○ ○ •
• •
White-crowned Sparrow ○
○ ○ •
• • White-throated Sparrow
•
Swamp Sparrow
• American Tree Sparrow
•
Dark-eyed Junco ○ ○ ○ ○ •
• • Summer Tanager
• • • •
Hepatic Tanager
• Western Tanager
•
Northern Cardinal
○ Pyrrhuloxia
○ • •
•
Blue Grosbeak
•
• • • Red-winged Blackbird ○ ○ ○ ○ • ○ • •
Western Meadowlark ○ • ○
• ○ ○ • Yellow-headed Blackbird ○ ○
○
•
Brewer's Blackbird ○ ○ ○ ○
• Rusty Blackbird
•
Common Grackle
• Great-tailed Grackle ○ ○ ○ ○ • ○ ○ •
Brown-headed Cowbird
•
•
• Hooded Oriole ○
• •
Bullock's Oriole ○
• Scott's Oriole ○
•
Purple Finch
• Cassin's Finch
• ○ ○
•
House Finch ○ • ○ ○ • • • • Red Crossbill
•

Table 5-3, Page 7 of 7
Species
Copper Flat Mine Permit Area
Las Animas/Percha Creeks
Spr Sum Fal Win Spr Sum Fal Win
• = Recoded species; ○ = Not recorded but likely occurs in proper habitat
Pine Siskin ○ ○ ○ ○
• Lesser Goldfinch
•
• • • •
Lawrence's Goldfinch
• American Goldfinch
○
•
•
Evening Grosbeak
•
House Sparrow
•
• • • •

Table 5-4, Page 1 of 3
Table 5-4 Mammal Species Recorded or Likely Present at Copper Flat Mine Permit Area,
Las Animas Creek, and Percha Creek
Species Scientific Name
Encountered or Possible at Copper Flat Mine Permit
Area
Known or Possible at
Animas/ Percha Creeks
• = Detected; ○ = Not detected but habitat present and species occurs in the region Large Mammals
Pronghorn Antilocapra americana • Coyote Canis latrans • •
Elk Cervus elaphus ○ • Bobcat Lynx rufus • • Mule Deer Odocoileus hemionus • • White Tailed Deer Odocoileus virginianus
○
Collared Peccary Pecari tajacu ○ • Mountain Lion Puma concolor • • Gray Fox Urocyon cineroargenteneus • • American Black Bear Ursus americanus ○ •
Bats Pallid Bat Antorzus pallidus • •
Townsend's Pale Big-eared Bat Corynorhinus townsendii • ○ Big Brown Bat Eptesicus fuscus • • Spotted Bat Euderma maculatum ○ ○ Allen's Big-eared Bat Idionycteris phyllotis ○ ○ Silver-haired Bat Lasionycteris noctivagans • • Western Red Bat Lasiurus blossevillii • ○ Southern Hoary Bat Lasiurus cinereus • • Southwestern Myotis Myotis auriculus ○ ○ California Myotis Myotis californicus • • Arizona Myotis Myotis occultus
○
Fringed Myotis Myotis thysanodes • • Long-legged Myotis Myotis volans • ○ Yuma Myotis Myotis yumanensis • • Canyon Bat Parastrellus hesperus • ○ Brazilian Free-tailed Bat Tadarida brasiliensis • •

Table 5-4, Page 2 of 3
Species Scientific Name
Encountered or Possible at Copper Flat Mine Permit
Area
Known or Possible at
Animas/ Percha Creeks
• = Detected; ○ = Not detected but habitat present and species occurs in the region Medium-sized Mammals
Ringtail Bassariscus astutus
○ Coatimundi Nasua narica
○
American Beaver Castor canadensis
○ American Hog-nosed Skunk Conepatus leuconotus ○ ○ Black-tailed Jackrabbit Lepus californicus • ○ Hooded Skunk Mephitis macroura ○ ○ Striped Skunk Mephitis mephitis ○ ○ Long-tailed Weasel Mustela frenata ○ ○ Raccoon Procyon lotor ○ ○ Western Spotted Skunk Spilogale gracilis ○ ○ Desert Cottontail Sylvilagus audubonii • ○ Eastern Cottontail Sylvilagus floridanus
Kit Fox Vulpes macrotis American Badger Taxidea taxus ○ ○
Small Mammals Merriam's Kangaroo Rat Dipodomys merriami • ○
Ord's Kangaroo Rat Dipodomys ordii ○ ○ Banner-tailed Kangaroo Rat Dipodomys spectabilis ○ ○ North American Porcupine Erethrizon dorsaturn
○
Mogollon Vole Microtus mogollonensis ○ House Mouse Mus musculus ○ ○
White-throated Woodrat Neotoma albigula • ○ Mexican Woodrat Neotoma mexicana ○
Southern Plains Woodrat Neotoma micropus • Desert Shrew Notiosorex crawfordi ○ ○
Mearn's Grasshopper Mouse Onchomys arenicola • Northern Grasshopper Mouse Onchomys leucogaster • ○
Silky Pocket Mouse Peognathus flavus • Brush Mouse Peromyscus boylii • Cactus Mouse Peromyscus eremicus ○ White-footed Mouse Peromyscus leucopus • ○
Piñon Mouse Peromyscus truei ○ Western Harvest Mouse Reithrodontomys megalotis ○ ○
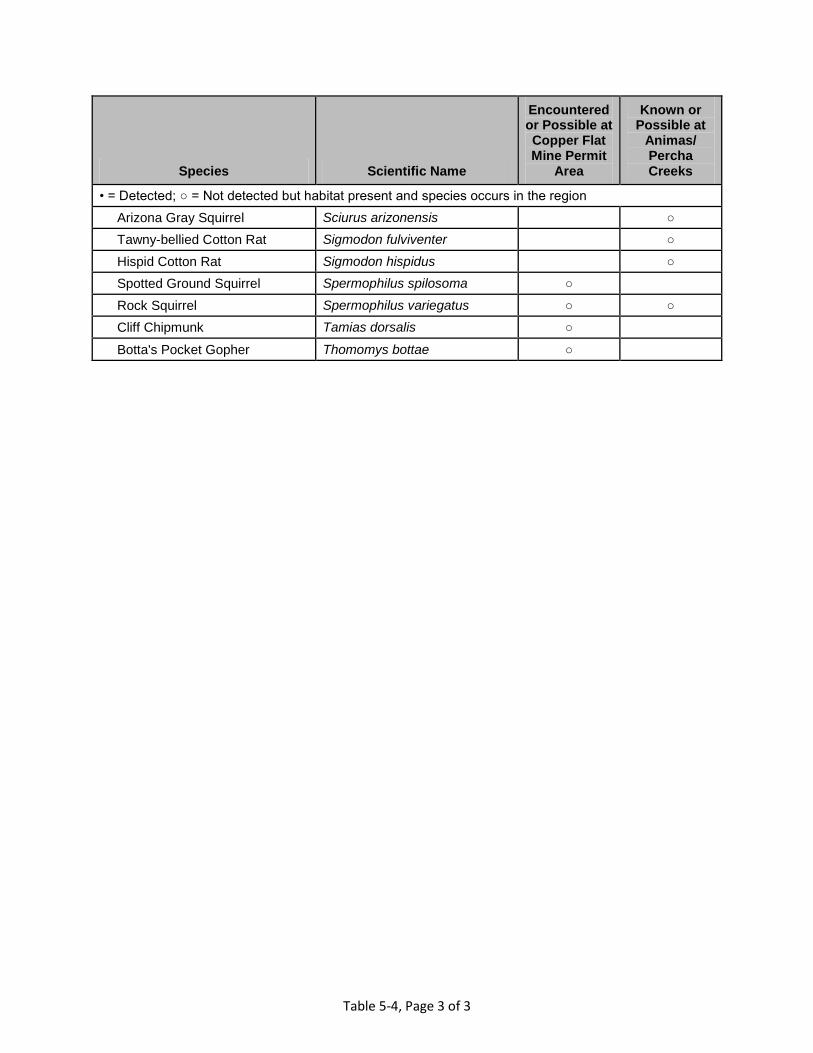
Table 5-4, Page 3 of 3
Species Scientific Name
Encountered or Possible at Copper Flat Mine Permit
Area
Known or Possible at
Animas/ Percha Creeks
• = Detected; ○ = Not detected but habitat present and species occurs in the region Arizona Gray Squirrel Sciurus arizonensis
○
Tawny-bellied Cotton Rat Sigmodon fulviventer
○ Hispid Cotton Rat Sigmodon hispidus
○
Spotted Ground Squirrel Spermophilus spilosoma ○ Rock Squirrel Spermophilus variegatus ○ ○
Cliff Chipmunk Tamias dorsalis ○ Botta's Pocket Gopher Thomomys bottae ○

Table 5-5, Page 1 of 1
Table 5-5 Number and Diversity of Small Mammals Trapped in Copper Flat Mine Permit Area and
Reference Areas, Standardized to Animals Per 100 Trap Nights Note: Some rounding error may make columns not sum correctly
Species
Copper Flat Mine Permit Area Reference Areas
Arroyo CDS CDG Arroyo CDS CDG
Desert Cottontail 0.9 Brush Mouse 22.7 0.9 11.0 6.3 1.8 1.6 Mearn's Grasshopper Mouse
1.8
Northern Grasshopper Mouse 0.9 1.8 White-footed Mouse 9.0 2.5 1.8 Kangaroo Rat sp.
3.1 3.5
Rock Pocket Mouse
0.8
4.9 Merriam's Kangaroo Rat 15.5 3.1 8.8 Mexican Woodrat
3.1
White-throated Woodrat 2.6 1.7 6.3
4.9 Woodrat sp.
0.8 3.1
1.6
Unknown sp. 4.5
Total Animals/100 Trap Nights: 27.3 29.7 16.9 25.0 19.3 13.1
Shannon-Weaver Score: 1.6 3.4 2.6 5.7 4.7 3.5 Nights Trapped 5 15 20 5 5 10 Total Trap Nights 50 140 210 50 60 100 Trap Nights Sprung 28 24 92 18 3 39 Net Trap Nights 22 116 118 32 57 61
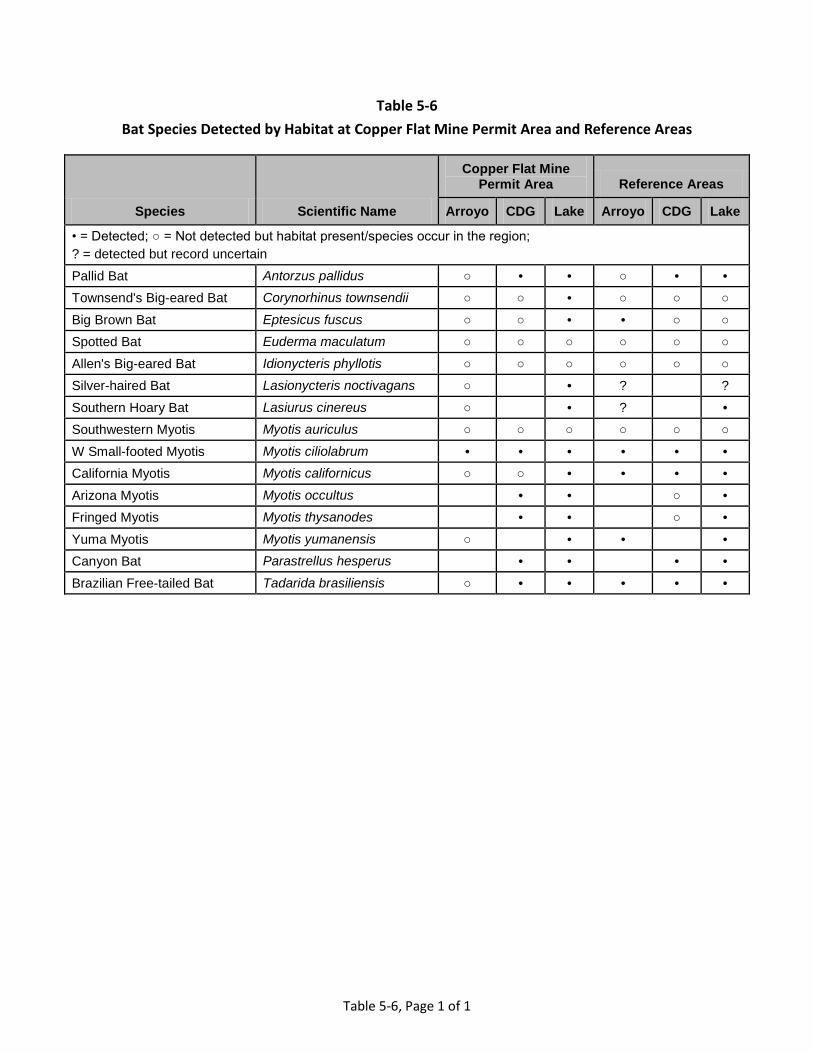
Table 5-6, Page 1 of 1
Table 5-6 Bat Species Detected by Habitat at Copper Flat Mine Permit Area and Reference Areas
Species Scientific Name
Copper Flat Mine Permit Area Reference Areas
Arroyo CDG Lake Arroyo CDG Lake
• = Detected; ○ = Not detected but habitat present/species occur in the region; ? = detected but record uncertain Pallid Bat Antorzus pallidus ○ • • ○ • • Townsend's Big-eared Bat Corynorhinus townsendii ○ ○ • ○ ○ ○ Big Brown Bat Eptesicus fuscus ○ ○ • • ○ ○ Spotted Bat Euderma maculatum ○ ○ ○ ○ ○ ○ Allen's Big-eared Bat Idionycteris phyllotis ○ ○ ○ ○ ○ ○ Silver-haired Bat Lasionycteris noctivagans ○
• ?
?
Southern Hoary Bat Lasiurus cinereus ○
• ?
• Southwestern Myotis Myotis auriculus ○ ○ ○ ○ ○ ○ W Small-footed Myotis Myotis ciliolabrum • • • • • • California Myotis Myotis californicus ○ ○ • • • • Arizona Myotis Myotis occultus
• •
○ •
Fringed Myotis Myotis thysanodes
• •
○ • Yuma Myotis Myotis yumanensis ○
• •
•
Canyon Bat Parastrellus hesperus
• •
• • Brazilian Free-tailed Bat Tadarida brasiliensis ○ • • • • •

Table 5-7, Page 1 of 2
Table 5-7 Reptiles Observed or Possibly Occurring at Copper Flat Mine Permit Area,
Reference Areas, Las Animas Creek, and Conchas Creek
Species Scientific Name Copper Flat Mine
Permit Area Las Animas or Percha Creeks
• = Encountered; ○ = Not encountered but habitat present and species occurs in Sierra County Salamanders
Tiger Salamander Ambystoma tigrinum • • Frogs and Toads
Couch's Spadefoot Toad Scaphiopus couchii ○ ○ Plains Spadefoot Spea bombifrons ○
New Mexico Spadefoot Spea multiplicata ○ ○ Great Plains Toad Bufo congnatus ○ ○ Green Toad Bufo debilis
Arizona Toad Bufo microscaphus
○ Red-spotted Toad Bufo punctatus ○ ○ Woodhouse's Toad Bufo woodhouseii ○ ○ Canyon Tree Frog Hyla arenicolor
•
Bullfrog Rana catesbiana
• Chiricahua Leopard Frog Rana chiricahuensis
•
Plains Leopard Frog Rana blairi
• Northern Leopard Frog Rana pipiens
○
Turtles Ornate Box Turtle Terrapene ornata
○?
Lizards Collared Lizard Crotaphytus collaris ○ ○
Greater Earless Lizard Cophosaurus texanus ○ Lesser Earless Lizard Holbrookia maculata • Texas Horned Lizard Phrynosoma cornutum • Short-horned Lizard Phrynosoma douglasii • Roundtail Horned Lizard Phrynosoma modestum • Clark's Spiny Lizard Sceloporus clarkii ○ Desert Spiny Lizard Sceloporus magister • Crevice Spiny Lizard Sceloporus poinsetti ○ Prairie Lizard Sceloporus undulatus ○ ○
Tree Lizard Urosaurus ornatus ○ ○ Side-blotched Lizard Uta stansburiana •
Chiricahua Spotted Whiptail Cnemidophorus exsanguis ○ ○

Table 5-7, Page 2 of 2
Species Scientific Name Copper Flat Mine
Permit Area Las Animas or Percha Creeks
• = Encountered; ○ = Not encountered but habitat present and species occurs in Sierra County Checkered Whiptail Cnemidophorus grahamii ○ ○ Little Striped Whiptail Cnemidophorus inornatus ○
New Mexico Whiptail C. neomexicanus ○ Western Whiptail Cnemidophorus tigris ○ Desert Grassland Whiptail Cnemidophorus uniparens ○ ○
Many-lined Skink Eumeces multivirgatus
○ Great Plains Skink Eumeces obsoletus ○ ○ Madrean Alligator Lizard Elgaria kingii ○ ○
Snakes Texas Blind Snake Leptotyphlops dulcis ○
Western Blind Snake Leptotyphlops humilis ○ Glossy Snake Arizona elegans ○ Ringneck Snake Diadophus punctatus
○
Western Hooknose Snake Gyalpion canum ○ Western Hognose Snake Heterodon nasicus ○ Night Snake Hypsiglena torquata ○ ○
Common Kingsnake Lampropeltis pyromelana
○ Coachwhip Masticophus flagellum •
Striped Whipsnake Masticophus taeniatus ○ Gopher Snake Pituophis melanoleucus • ○
Longnose Snake Rhinochelius lecontei
○ Big Bend Patchnose Snake Salvadora deserticola ○
Mountain Patchnose Snake Salvadora grahamiae ○ Ground Snake Sonora semiannulata
○
Plains Black-headed Snake Tantilla nigriceps Blackneck Garter Snake Thamnophis cyrtopsis
○ W. Terrestrial Garter Snake Thamnophis elegans
○
Checkered Garter Snake Thamnophis marcianus
○ Lyre Snake Trimorphodon biscutatus ○
W. Diamondback Rattlesnake Crotalus atrox ○ ○ Rock Rattlesnake Crotalus lepidus •
Blacktail Rattlesnake Crotalus molossus • ○ Western Rattlesnake Crotalus viridis ○
Massassagua Sistrurus catenatus

Figures

Appendix 5-A Biological Resources Survey Report, Copper Flat Pipeline and Well Sites,
Sierra County, New Mexico

Appendix 5-B Winter Bird Survey Report
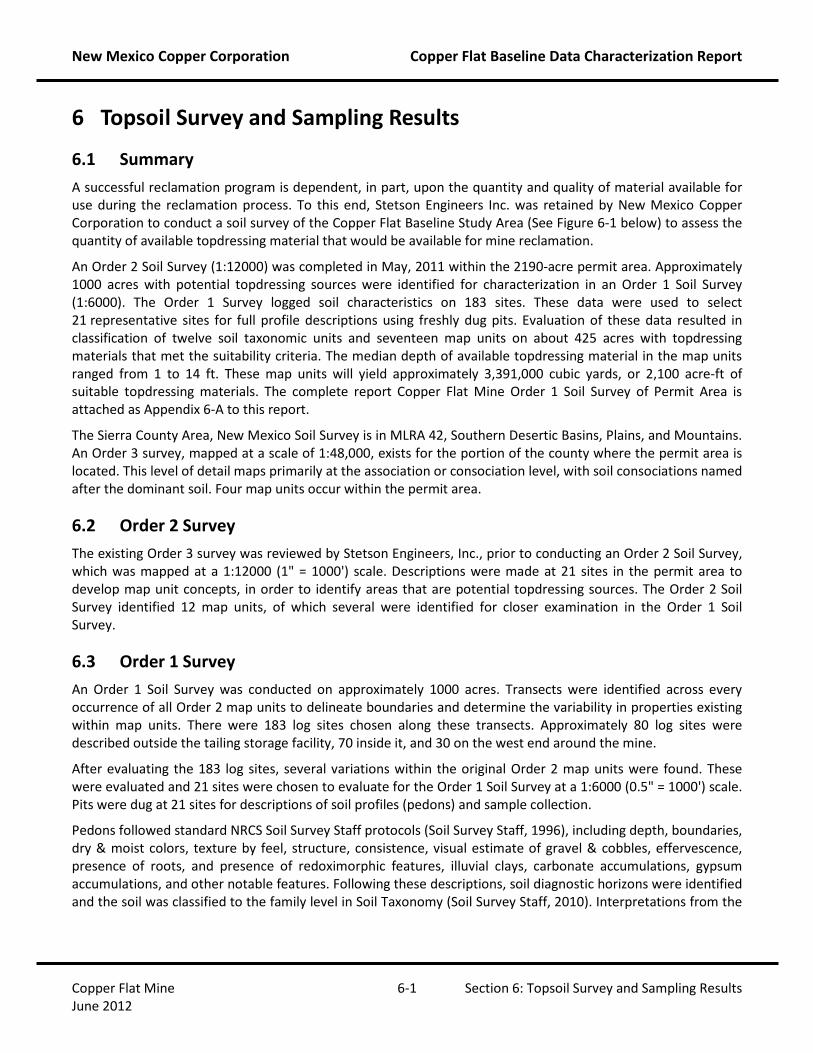
New Mexico Copper Corporation Copper Flat Baseline Data Characterization Report
Copper Flat Mine 6-1 Section 6: Topsoil Survey and Sampling Results June 2012
6 Topsoil Survey and Sampling Results
6.1 Summary A successful reclamation program is dependent, in part, upon the quantity and quality of material available for use during the reclamation process. To this end, Stetson Engineers Inc. was retained by New Mexico Copper Corporation to conduct a soil survey of the Copper Flat Baseline Study Area (See Figure 6-1 below) to assess the quantity of available topdressing material that would be available for mine reclamation.
An Order 2 Soil Survey (1:12000) was completed in May, 2011 within the 2190-acre permit area. Approximately 1000 acres with potential topdressing sources were identified for characterization in an Order 1 Soil Survey (1:6000). The Order 1 Survey logged soil characteristics on 183 sites. These data were used to select 21 representative sites for full profile descriptions using freshly dug pits. Evaluation of these data resulted in classification of twelve soil taxonomic units and seventeen map units on about 425 acres with topdressing materials that met the suitability criteria. The median depth of available topdressing material in the map units ranged from 1 to 14 ft. These map units will yield approximately 3,391,000 cubic yards, or 2,100 acre-ft of suitable topdressing materials. The complete report Copper Flat Mine Order 1 Soil Survey of Permit Area is attached as Appendix 6-A to this report.
The Sierra County Area, New Mexico Soil Survey is in MLRA 42, Southern Desertic Basins, Plains, and Mountains. An Order 3 survey, mapped at a scale of 1:48,000, exists for the portion of the county where the permit area is located. This level of detail maps primarily at the association or consociation level, with soil consociations named after the dominant soil. Four map units occur within the permit area.
6.2 Order 2 Survey The existing Order 3 survey was reviewed by Stetson Engineers, Inc., prior to conducting an Order 2 Soil Survey, which was mapped at a 1:12000 (1" = 1000') scale. Descriptions were made at 21 sites in the permit area to develop map unit concepts, in order to identify areas that are potential topdressing sources. The Order 2 Soil Survey identified 12 map units, of which several were identified for closer examination in the Order 1 Soil Survey.
6.3 Order 1 Survey An Order 1 Soil Survey was conducted on approximately 1000 acres. Transects were identified across every occurrence of all Order 2 map units to delineate boundaries and determine the variability in properties existing within map units. There were 183 log sites chosen along these transects. Approximately 80 log sites were described outside the tailing storage facility, 70 inside it, and 30 on the west end around the mine.
After evaluating the 183 log sites, several variations within the original Order 2 map units were found. These were evaluated and 21 sites were chosen to evaluate for the Order 1 Soil Survey at a 1:6000 (0.5" = 1000') scale. Pits were dug at 21 sites for descriptions of soil profiles (pedons) and sample collection.
Pedons followed standard NRCS Soil Survey Staff protocols (Soil Survey Staff, 1996), including depth, boundaries, dry & moist colors, texture by feel, structure, consistence, visual estimate of gravel & cobbles, effervescence, presence of roots, and presence of redoximorphic features, illuvial clays, carbonate accumulations, gypsum accumulations, and other notable features. Following these descriptions, soil diagnostic horizons were identified and the soil was classified to the family level in Soil Taxonomy (Soil Survey Staff, 2010). Interpretations from the

New Mexico Copper Corporation Copper Flat Baseline Data Characterization Report
Copper Flat Mine 6-2 Section 6: Topsoil Survey and Sampling Results June 2012
profile descriptions include drainage, permeability, and available water holding capacity. Samples were collected from representative horizons for lab testing (See Section 6.5).
Characterization of these profiles resulted in the selection of representative profiles for each of the twelve taxonomic units. Those twelve taxonomic units were further subdivided into map units based upon the thickness of suitable topdressing material. Map units are described in detail in Appendix 6-A.
6.4 Determination of Suitability for Topdressing Material Three suitability categories were identified, based on such factors as slope, texture, sand/silt/clay content, water holding capacity, percent cobbles/boulders, calcium carbonate accumulations, pH, and salinity: good, fair, and unsuitable. Each pedon included in the attached report received a good or fair rating. The suitability criteria standards for these soil and landscape features (Table 6-1) have been adapted from those used by the Natural Resources Conservation Service, and New Mexico Mining and Minerals Division. They were modified by project soil scientists to reflect the conditions that exist within the Copper Flat area.
Tailings substrata were considered unsuitable as top dressing because of their processed origins, though none of the available element levels were present in amounts likely to be toxic to plants or to bioaccumulate in animals as they were within or below the normal ranges of these elements commonly found in soil (Baker and Pilbeam, 2007; Havlin et al., 1999).
6.5 Laboratory Testing Representative samples from each soil taxonomic unit were collected for laboratory analysis. Lab tests performed include standard USDA tests: soil texture, pH, electrical conductivity, calcium, magnesium, and sodium adsorption ratio (on all samples), as well as soil organic matter by loss on ignition, nitrate-nitrogen, phosphorus, calcium carbonate equivalent, and sand size fraction (on specified samples). Samples inside the tailing facility or mine were screened for arsenic, boron, cadmium, calcium, copper, iron, magnesium, manganese, molybdenum, potassium, nickel, sodium, sulfur, zinc, chloride, mercury, and selenium, as well as for acid-base potential. Plant available fractions were determined with AB-DTPA extraction and ICP detection. Detailed laboratory results are included in Appendix 6-A.
6.6 Quantity of Suitable Material Surveys identified about 425 acres that will yield approximately 3,391,000 cubic yards, or 2,100 acre-ft of suitable topdressing materials (detailed maps are included in Appendix 6-A).
6.7 Tailing Discussion Though available copper, iron, zinc, molybdenum and selenium were elevated in mine tailing, available research suggests these values are not toxic (Baker and Pilbeam, 2007; Havlin et al., 1999). These conditions apparently have little negative impact on the plant communities currently growing on soils underlain by tailings. However, because of their origins as processed mine material, the tailings were deemed unsuitable for use as top dressing.
6.8 References Barker, A.V., and D.J. Pilbeam. 2007. Handbook of Plant Nutrition. CRC Press. Taylor & Francis Group. Boca
Raton, FL.

New Mexico Copper Corporation Copper Flat Baseline Data Characterization Report
Copper Flat Mine 6-3 Section 6: Topsoil Survey and Sampling Results June 2012
Havlin, J.L., J.D. Beaton, S.L. Tisdale, W.L. Nelson. 1999. Soil Fertility and Fertilizers: An Introduction to Nutrient Management, 6th ed. Prentice Hall, Inc. Upper Saddle River, NJ.
Soil Survey Staff. 1996. National Soil Survey Handbook, Title 430-VI. USDA-Natural Resources Conservation Service. US Gov. Printing Office, Washington, DC.
Soil Survey Staff. 2010. Keys to Soil Taxonomy, 11th ed. USDA-Natural Resources Conservation Service, Washington, DC.

Table

Table 6-1, Page 1 of 1
Table 6-1 Soil and Site Evaluation as Source for Topdressing, Copper Flat Mine, New Mexico
Property Good Fair Unsuitable Feature
Slope % <15 15-25 >25 Too Steep
Texture
-
SCL, CL, SiCL
C, SiC, SC
Too Clayey
Texture
-
LVFS, LCOS,
COS, S, FS, VFS
Too Sandy
LS, LFS
Cobble + Gravel %
<35
35-60
>60
Too Cobbly
Stones %
<5
5-15
>15
Too Stony
CaCO3 Eq. %
<15
15-40
>40
Excess Lime
AWHC (in/in)
>0.1
0.05-0.1
<0.05
Droughty
Soil pH
<8.5
<8.5
≥8.5
Too Alkaline
Salinity (ECe, dS/m)
<4
4-8
>8
Excess Salt
SAR
<ECe x 5
<ECe x 5
<ECe x 5
Excess Sodium
Selenium (ppm)
<0.1
<0.1
≥0.1
Excess Selenium
Boron (ppm) DTPA,
<6.0
<6.0
≥6.0
Excess Boron
available
Acid/Base Potential
> -5 tons
> -5 tons
≤ -5 tons
High acid-
CaCO3/1000 T CaCO3/1000 T CaCO3/1000 T forming potential

Figure

Appendix 6-A Copper Flat Mine
Order 1 Soil Survey of Permit Area

New Mexico Copper Corporation Copper Flat Baseline Data Characterization Report
Copper Flat Mine 7-1 Section 7: Geology June 2012
7 Geology This section provides an overview of the regional and local stratigraphy and structural geology, as well as the mineralization at the Copper Flat Mine Permit Area (Site). The information has been summarized primarily from Dunn (1982, 1984), the BLM Preliminary Final Environmental Impact Statement (PFEIS) for Copper Flat (BLM, 1999), Raugust (2003), and SRK (2010). NMCC has built upon the site-wide geochemistry investigations conducted in 1995 and 1997 by SRK for a previous effort to re-establish the mine by Alta Gold Corporation. NMCC retained SRK to expand the Copper Flat geochemistry with additional sampling and analysis in 2010 and 2011. The combined results of these investigations are described in this Section. Section 8 describes the local and regional aquifers and springs.
7.1 Regional Geologic Setting The Copper Flat Mine lies within the Mexican Highlands portion of the Basin and Range Physiographic Province. It is located in the Hillsboro Mining District in Las Animas Hills, which are part of the Animas Uplift, a horst on the western edge of the Rio Grande valley (Raugust, 2003). The Animas Uplift is separated from the Rio Grande by nearly 20 miles of Santa Fe Group alluvial sediments, referred to as the Palomas Basin of the Rio Grande valley. To the west of the Animas Uplift is the Warm Springs valley, a graben that parallels the Rio Grande valley (BLM, 1999; Raugust, 2003). Further west, the Black Mountains form the backbone of the Continental Divide, rising to about 9,000 ft above mean sea level (amsl). The surface geology of the Copper Flat region is shown in Figure 7-1, and a schematic geologic cross section is shown in Figure 7-2.
Basement rocks in the area consist of Precambrian granite and Paleozoic and Mesozoic sandstones, shales, limestones, and evaporites. Sedimentary units that crop out within the Animas Uplift include the Ordovician Montoya Limestone, the Silurian Fusselman Dolomite, and the Devonian Percha Shale. The Cretaceous-age Laramide orogeny, which was characterized by the intrusion of magma associated with the subduction of the Farallon plate beneath the North American plate, affected this region between 75 and 50 million years ago (Ma). Volcanic activity during the late Cretaceous and Tertiary periods resulted in localized flows, dikes, and intrusive bodies, some of which were associated with the development of the nearby Tertiary Emory and Good Sight- Cedar Hills cauldrons (Figure 7-3); later basaltic flows resulted from the tectonic activity associated with the formation of the Rio Grande rift. Tertiary and Quaternary alluvial sediments of the Santa Fe Group and more recent valley fill overlie the older Paleozoic and Mesozoic units in the area. The regional stratigraphy of the lower Rio Grande Valley is summarized in Table 7-1 (BLM, 1999).
The geologic structure of the region is characterized by block and rift faulting (Figure 7-3). The Tertiary cauldrons associated with the earlier block faulting formed between 35 and 45 Ma. Rift faulting and associated north- south block faulting associated with continental extension and the formation of the Rio Grande rift began approximately 25 to 30 Ma. Las Animas Hills are bounded by faults associated with rifting (Dunn, 1982). Continental extension continues to the present, as evidenced by north-south trending grabens represented by the Rio Grande and Warm Springs valleys.
7.2 Geology of Copper Flat Mine Site
7.2.1 Stratigraphy
As shown in Figure 7-4, the dominant geologic feature of the Animas Hills and Hillsboro district is the Copper Flat strato-volcano, a circular body of Cretaceous andesite that is 4 miles in diameter (Raugust, 2003). The andesite is generally fine-grained with phenocrysts of plagioclase (andesine) and amphibole in a groundmass of plagioclase

New Mexico Copper Corporation Copper Flat Baseline Data Characterization Report
Copper Flat Mine 7-2 Section 7: Geology June 2012
and potassium feldspar and rare quartz. Some agglomerates or flow breccias are locally present, but the andesite is generally massive. Magnetite is a common association with the mafic phenocrysts, and accessory apatite is found in nearly every thin section (Dunn, 1984).
The strato-volcano is eroded to form a topographic low; the total depth of erosion is uncertain (SRK, 2010). To the east of the Site, this andesite body is in fault contact with Santa Fe Group sediments, which are at least 2,000 ft thick in the immediate area of Copper Flat and thickening to the east. Near-vertical faults characterize the contacts on the remaining perimeter of the andesite body; these faults juxtapose the andesite with Paleozoic sedimentary rocks. Drillholes indicate the andesite is more than 3,000 ft thick. This feature, combined with the concentric fault pattern, indicate that the local geology represents a deeply eroded Cretaceous-age volcanic complex (Dunn, 1982).
The core of the volcanic complex is a Cretaceous-age quartz monzonite stock that intruded into the center of the andesite body at the intersection of two principle structures that trend approximately N50W and N20E. Known as the Copper Flat Quartz Monzonite (CFQM), this irregular-shaped stock underlies a surface area of approximately 0.25 square miles and has been dated to approximately 75 million years before present (BLM, 1999; McLemore et al., 2000; Raugust, 2003). The monzonite crops out in only a few isolated areas, and the andesite at these contacts shows no obvious signs of contact metamorphism (Dunn, 1984). The CFQM is a medium- to coarse-grained, holocrystalline porphyry composed primarily of potassium feldspar, plagioclase, hornblende, and biotite; trace amounts of magnetite, apatite, zircon, and rutile are also present, along with localized mineralized zones containing pyrite, chalcopyrite, and molybdenite (McLemore et al., 2000). About 15 percent of the monzonite is quartz, which occurs both as small phenocrysts and as part of the groundmass; however, quartz is absent in some parts of the stock (Dunn, 1984).
Numerous dikes, mostly latite, radiate from the CFQM stock, some nearly a mile in length. Most of the dikes trend to the northeast or northwest and represent late stage differentiation of the CFQM stock (Raugust, 2003). Immediately south of the quartz monzonite, the andesite is coarse-grained, perhaps indicating a shallow intrusive phase. An irregular mass of andesite breccia along the northwestern contact of the quartz monzonite contains potassium feldspar phenocrysts and andesitic rock fragments in a matrix of sericite with minor quartz; this may represent a pyroclastic unit. Magnetite, chlorite, epidote, and accessory apatite are also present in the andesite breccia (Dunn, 1984).
The southwestern edge of the andesite body was intruded by the Warm Springs Quartz Monzonite pluton, which dates to approximately 73 Ma (Hedlund, 1974). Unlike the CFQM and the andesite, this monzonite body is not cut by the latite dikes (SRK, 2010), indicating that the dikes were emplaced prior to the Warm Springs Quartz Monzonite.
The Sugarlump Tuff (35 Ma) and the Kneeling Nun Tuff (34 Ma) unconformably overlie the local andesite flows. These tuffs erupted from the Emory caldera, and indicate that the Copper Flat volcanic/intrusive complex was buried during the Oligocene and exhumed during Miocene uplift (around 21.7 ±3.6 Ma) (Kelley and Chapin, 1997). Both the andesite and the quartz monzonite intrusions are cut by black, scoriaceous basalt dikes. These dikes remain unaltered, and appear to be associated with locally abundant Pliocene alkali basalt flows from around 4 Ma (Seager et al., 1984).
7.2.2 Structure
Three principal structural zones are present at the Site and surrounding area, the most prominent of which is a northeast-striking fault that trends N20-40E that includes the Hunter and parallel faults. In addition, west-northwest striking zones of structural weakness (N50-70W) are marked by the Patten and Greer faults, and east-northeast striking zones are marked by the Olympia and Lewellyn faults. All faults have a near-vertical dip; the

New Mexico Copper Corporation Copper Flat Baseline Data Characterization Report
Copper Flat Mine 7-3 Section 7: Geology June 2012
Hunter fault system dips 80°W, the Patten dips approximately 70°S-80°S, and both the Olympia and Lewellyn fault systems dip between 80°S and 90°S (Dunn, 1984; SRK, 2010). These three major fault zones appear to have been established prior to the emplacement of the CFQM and controlled subsequent igneous events and mineralization (SRK, 2010).
The CFQM emplacement is largely controlled by the three structural zones. The southern contact parallels and is cut by the Greer fault, although the contact is cut by the fault, and the southeastern and northwestern contacts are roughly parallel to the Olympia and Lewellyn faults, respectively. The CFQM stock is principally elongated along the Patten fault, as well as along the Hunter fault system. Whether there was movement along the fault zones before the emplacement of the stock has not been determined (Dunn, 1984; SRK, 2010).
Although latite dikes strike in all the three principal fracture directions, most of the dikes strike northeast. A narrow zone of fault gouge commonly occurs along the contact between the dikes and the andesite, with the mineralization post-dating fault movement (Harley, 1934). The northeast fault zones contain a high proportion of wet gouge, often with no recognizable rock fragments. Underground exposures of the Hunter fault zone (in previously existing mine workings) material has the same consistency as wet concrete and has been observed to flow in underground headings. However, the material in the east-northeast fault zones contains only highly broken rock and little obvious gouge. The width of the fault zones in both systems varies along strike from less than a foot to nearly 25 ft in the Patten fault east of the Project. Despite intense brecciation, the total displacement along the faults does not appear to exceed a few tens of ft (Dunn, 1984). At the western edge of the Site, a younger porphyritic dike was emplaced in a fault that had offset an early latite dike, indicating that fault movement occurred during the time that dikes were being emplaced (Dunn, 1984).
Post-dike movement is evident in all the three principal fault zones, and both the Hunter and Patten fault systems show signs of definite post-mineral movement. Fault movement has smeared sulfide deposits and offset the breccia pipe as well as the zones within the breccia pipe. Post-mineral movement along faults has resulted in wide, strongly brecciated fault zones. Some of the post-mineral dikes have been emplaced within these fault zones (Dunn, 1984; SRK, 2010).
NMCC has mapped the pit area and diversion cuts in detail at 1 inch equals 40 ft (1:480) and has examined the pre- and post-mineral stress orientations in the andesites and CFQM. Findings indicate no significant difference in the stress fields before and after mineralization (SRK, 2010).
7.3 Description of the Ore Body Copper Flat is an alkalic copper-gold mineralized breccia pipe, associated with and genetically-linked to an alkalic porphyry system. Copper Flat is situated along the eastern edge of the Cretaceous Arizona-Sonora-New Mexico porphyry copper belt and along with Tyrone, New Mexico, forms a linear mineralized feature known as the Santa Rita lineament (SRK, 2010; McLemore et al., 2000). Copper Flat is the easternmost and one of the oldest known porphyry deposits in the southwestern U.S. (Hedlund, 1974; Dunn, 1982; Titley, 1982). Analogous deposits include Terrane Metal’s Mount Milligan, British Colombia deposit and the Continental breccia pipe located in the Central Mining district of New Mexico (SRK, 2010).
7.3.1 Structure and Model
Mineralization at the Site is principally distributed within but not exclusive to a breccia pipe in the CFQM stock (Dunn, 1984; BLM, 1999; Raugust, 2003). There is a general elongation of the breccia pipe and the hosting stock along the N50W trend of the Patten fault system. The breccia pipe is characterized by biotite-breccia generally hosting higher grade copper mineralization, and quartz k-feldspar-breccia, and this pipe generally dips to the

New Mexico Copper Corporation Copper Flat Baseline Data Characterization Report
Copper Flat Mine 7-4 Section 7: Geology June 2012
S-SW. The breccia pipe has generally higher copper grades than the surrounding CFQM, hosting nearly half of the copper at the Site (SRK, 2010).
Drillholes spaced approximately 100 ft apart within the center of the deposit indicate the breccia pipe occurs as a single, continuous body, approximately 1,300 ft long by approximately 600 ft wide at the surface with the long axis parallel to the Patten fault (N50W) and perpendicular to the Hunter fault system (N20E) (Dunn, 1984). It is exposed in only a few places, but extends vertically to over 1,000 ft. Figure 7.5 illustrates the general trends and distribution of the breccia and the CFQM, as well as the principle NE and NW structures controlling mineralization.
Mineralized precious metals-bearing quartz veins, which are commonly associated with the dikes that radiate outward from the central stock, have been the target of some of the historical mining activities in the Hillsboro district. The breccia pipe zone has been cut by numerous, randomly oriented, irregular veins that are thicker and coarser grained than the narrow fracture-controlled veinlets in the surrounding stock.
Copper porphyry mineralization appears to have been contemporaneous with pipe formation (SRK, 2010). The lack of rock flour or gouge in the matrix suggests that brecciation was not the result of tectonic movement, while the apparent lack of appreciable movement between the fragments and the gradational contact between the breccia and the zone of stockwork veining indicate that an explosive mechanism was not the source of the brecciation. Likewise, the process of mineralization stoping described by Locke (1926), which would have resulted in appreciable downward movement and mixing of the fragments, is not supported by field observations. Thus the mechanism responsible for the formation of the Copper Flat mineralized breccia pipe appears to be auto-brecciation resulting from retrograde boiling, a phenomenon that occurs when the pressure of the mineralizing hydrothermal fluid exceeds the confining pressure (Phillips, 1973). The matrix of the breccia, the irregular veins in the surrounding crackle breccias, and the open space filling in the breccias consist of hydrothermal minerals and part of the second stage mineralization occurred as replacement, which modified the original breccia texture (SRK, 2010).
Unlike most deposits in the southwestern U.S., Copper Flat shows very little supergene enrichment or the symmetrical and telescoped zoning of alteration types that is considered typical of most porphyry copper deposits. This is likely due to erosion rates that exceed time required for supergene deposition and formation of significant oxide mineral formation. Instead, hypogene mineralization and alteration, including the formation of the breccia pipe, was the result of the final crystallization of the CFQM melt and related dikes (SRK, 2010).
The current model used by NMCC for further exploration at the Site is based on Richards (2003), who interprets the area as an eroded volcano. According to this model, mineralization occurred at similar depths to that found at El Teniente in Chile; since the Copper Flat breccia pipe now crops out at the surface, this assumption indicates that approximately 0.5 to 2 kilometers (km) of volcanic rocks have been eroded from the central zone of mineralization. Fluid inclusion work by Norman et al. (1989) and McLemore et al. (2000) suggest that the breccia pipe and veins formed at a depth of 1 to 2 km bgs and at temperatures ranging from 226° to 360°C.
7.3.2 Mineralization
During the early mining days, a 20- to 50-ft leached oxide zone existed over the ore body, but this material was stripped during the mining activities that occurred in the early 1980s. Most of the remaining ore is unoxidized and consists primarily of chalcopyrite and pyrite with some molybdenite and traces of galena and sphalerite. Appreciable amounts of silver and gold are also present (BLM, 1999; SRK, 2010).
The breccia consists largely of fragments of mineralized CFQM, with locally abundant mineralized latite where dikes exposed in the CFQM projected into the brecciated zone. Andesite occurs only as mixed fragments partially in contact with intrusive CFQM and appears to represent the brecciation of andesite xenoliths in the

New Mexico Copper Corporation Copper Flat Baseline Data Characterization Report
Copper Flat Mine 7-5 Section 7: Geology June 2012
CFQM (Dunn, 1984). The matrix contains varying proportions of quartz, biotite (phlogopite), potassium feldspar, pyrite, and chalcopyrite, with magnetite, molybdenite, fluorite, anhydrite, and calcite locally common. Apatite is a common accessory mineral. Much of the quartz-feldspar matrix has a pegmatitic texture. Breccia fragments are rimmed with either biotite or potassium feldspar, and the quartz and sulfide minerals have generally formed in the center of the matrix (Dunn, 1984).
The andesite in contact with the CFQM, dikes, and veins is typically altered into one of three types of mineral assemblages: biotite-potassic, potassic, or sericitic alteration (Fowler, 1982). The highest copper grades are associated with the biotite-potassic alteration, which is characterized by hydrothermal biotite, potassium feldspar, quartz, and pyrite, and which occurs in veinlets and as replacement assemblages in the monzonite (McLemore et al., 2000).
The total sulfide content ranges from 1 percent (by volume) in the eastern part of the breccia pipe and the surrounding CFQM to 5 percent in the CFQM to the south and west (SRK, 2010). Sulfide content is highly variable within the breccia, with portions containing as much as 20 percent sulfide minerals. Sulfide mineralization is concentrated in the CFQM and breccia pipe, and drops significantly at the andesite contact. Minor pyrite mineralization extends into the andesite along the pre-mineral dikes (Dunn, 1984; SRK, 2010).
Pyrite and chalcopyrite are disseminated within the CFQM and also occur along fracture-controlled veinlets and as disseminations associated with mafic minerals. Typically, pyrite is more abundant than chalcopyrite in two areas (SRK, 2010):
A narrow zone that surrounds and overlies the western end of the breccia pipe, which has the highest grade CFQM mineralization, characterized by abundant chalcopyrite in quartz-sulfide veinlets and breccia zones.
Outcrops to the southeast of the breccia and south of Grayback Wash, where disseminated chalcopyrite is present with no associated pyrite.
Molybdenite occurs occasionally in quartz veins or as thin coatings on fractures. Minor sphalerite and galena are present in both carbonate and quartz veinlets in the CFQM stock (Dunn, 1984). Preliminary 2011 evaluations of the mineralization at Copper Flat indicate that copper mineralization concentrates and trends along the N50W structural influences, whereas the molybdenum, gold and silver appear to favor a N10-20E trend.
7.4 Copper Flat Material Types The proposed Copper Flat ore body to be mined is composed chiefly of potassic altered quartz monzonite porphyry with minor argillic overprinting. The intensity of argillic alteration varies considerably from weak development along fractures and exposed rock faces to alteration of groundmass feldspars along with hematite precipitation (moderate) to alteration of groundmass and phenocrysts, often associated with more intense hematite development in fracture zones and occasional jarosite (strong). In addition, weak meteoric oxidation products of iron and copper are present in the uppermost reaches of the exposed deposit and are best developed along the Sternberg lode. Other than this, a supergene sulfide enrichment zone or oxidation zone is absent from the deposit. Propylitic alteration is observed in the distal quartz monzonite and andesite but this is likely to be outside the current proposed mining zone. Molybdenite is observed in mineralized rocks within the current pit but is a minor component overall in the ore body. The lithological and alteration material types of importance to the proposed mining operations are as shown in Table 7-2.

New Mexico Copper Corporation Copper Flat Baseline Data Characterization Report
Copper Flat Mine 7-6 Section 7: Geology June 2012
7.5 Geochemical Characterization As defined in the INTERA (2010) report, NMCC has conducted a geochemical characterization program to address the potential for waste rock, pit walls and tailing material to create acid rock drainage (ARD), to degrade surface or groundwater quality, or to cause a hindrance to reclamation. This demonstration is a requirement of MMD’s Mine Permit and will generate data sufficient to address concerns about the potential for geologic materials present within the permit boundary to generate ARD or degrade surface or groundwater.
The recent geochemical characterization program augments geochemical sampling and test work performed by Alta Gold Corporation in 1995 and 1997 with additional geochemical sampling conducted by NMCC in 2010. The geochemical characterization programs were all designed and conducted by SRK Consulting (SRK) out of SRK’s Reno, Nevada and Cardiff, UK offices. The objective of the recent geochemical characterization program is to update the previous geochemical characterization and modeling work to the revised standards outlining the characterization of mine waste that have been developed since the 1995 and 1997 work was conducted.
Below is a summary of the geochemical characterization work completed in the 1990s and 2010.
7.5.1 Overview of Current and Historic Geochemical Characterization Programs
7.5.1.1 Pre-1996 Geochemical Program
As part of the initial planning and baseline studies completed on behalf of Alta Gold, SRK collected a small suite of samples from drill core, tailings and waste rock for Acid Base Accounting (ABA), short term leachate and kinetic humidity cell testing. The kinetic testing program was run for 28 weeks. The review of this testwork was reported in the Geochemical Review of Waste Rock, Pit Lake Water Quality and Tailings (SRK, 1996). The testwork results were also utilized to develop predictive geochemical models to assess potential pit lake water quality. For reference, the SRK 1996 report is presented as Appendix 7-A.
7.5.1.2 1997 Geochemical Program
A geochemical sampling and testwork program was carried out by SRK as part of the 1997 Copper Flat Waste Rock Management Plan. The purpose of the program was to produce geological and geochemical characterization of the exposed material on the waste rock dumps and pit walls. A total of 141 surface grab samples were collected as part of the 1997 characterization program and these samples were analyzed for field paste chemistry to assess the short-term reactivity of the materials. Forty six of these samples were then subject to laboratory ABA testwork and 59 samples were submitted for Net Acid Generation (NAG) testwork in order to assess the acid generating potential of existing waste rock on site. This work was reported in Appendix A of the Copper Flat Preliminary Mine Waste Management Plan, New Mexico Copper Corporation (NMCC June 2011). For reference, Appendix A of the Waste Management Plan is presented as Appendix 7-B.
7.5.1.3 2010 Geochemical Program
Additional samples were collected by SRK representatives during a site visit in April 2010. The purpose of the 2010 sampling and testwork program was to augment the previous geochemical characterization and modeling work carried out from 1995 to 1997 and to comply with subsequent revisions to standards outlining the characterization of mine waste, which have evolved since the previous assessment was carried out. A number of statutory regulations have also been reviewed and modified since the initial assessment, including the modification of BLM and 43 CFR 3809 regulations in addition to changes to the standards applied to both EIS and New Mexico State permit applications.

New Mexico Copper Corporation Copper Flat Baseline Data Characterization Report
Copper Flat Mine 7-7 Section 7: Geology June 2012
The 2010 geochemical characterization program includes an assessment of waste rock geochemistry designed to predict the potential geochemical reactivity of waste rock and pit wall rock that has been and will be exposed during the proposed mining operation, and to provide input into a future pit lake hydrogeochemical model. This assessment also includes characterization of ore-grade materials that will be processed and deposited as tailings in the tailing impoundment.
During the site visit, two types of samples were collected including:
1. 50 drill core samples were collected at depth from exploration core holes drilled within the footprint of the Copper Flat pit in 2009 and 2010. The sample intervals were selected to represent the range of low grade ore and waste rock material types that will be encountered in the pit during mining operations.
2. 24 bulk surface grab samples from pit wall exposures, existing waste rock dumps, and the tailings impoundment. These samples provide an opportunity to compare fresh rock samples to weathered rock samples of the same material types that have been exposed to oxygen and water for over 20 years.
Samples collected as part of the 2010 characterization program augment the existing (1995-1997) geochemical dataset and are being used to update the geochemical characterization and modeling work to meet current standards. Figure 7.6 presents the locations of 1997 samples and the 2010 samples, both collected by SRK.
SRK has prepared four Technical Memorandums that describe the progress of NMCC’s 2010 geochemical program. These memorandums are attached as Appendix 7-C, 7-D, 7-E, and 7-F and summarized below,
1. Copper Flat Static Testwork Summary and Kinetic Test Recommendations dated December 2010. This memorandum details the results of the initial characterization of the collected materials and includes recommendations for additional kinetic testwork;
2. Copper Flat Geochemical Characterization Program dated February 2011. This memorandum provides additional detail on the current geochemical characterization program and addresses some of the comments that were generated from the MMD’s and NMED’s review of the SAP;
3. Copper Flat Geochemical Characterization Program; Incorporation of the 1997 Static Test Data dated March 2011. This memorandum summarizes how the three data sets from 1996, 1997, and 2010 will ultimately provide key information to address the ARD concerns of NMED as well as the requirement of the MMD Mine Permit application; and,
4. Copper Flat Kinetic Testwork Update dated July 2011. NMCC is currently undertaking a kinetic geochemical characterization study to assess the Acid Rock Drainage and Metal Leaching (ARDML) characteristics of potential waste rock from the Copper Flat deposit. This work follows on from the static testwork program previously undertaken by NMCC as described in Memorandums 1 and 2 above. Twenty-one samples representative of potential waste rock are currently undergoing humidity cell testing (HCT) at McClelland Laboratories in Sparks, Nevada. At the time that this memorandum was prepared, the cells had been operating for a 24-week period, and the purpose of the memorandum was to provide an overview of the test methods and results to week 16 and to provide recommendations for continuation of the kinetic testwork program. Per SRK’s recommendations, NMCC extended the humidity cell testing for an additional 20 weeks (cumulative 40 weeks).
The geochemical testing component of the this program addresses mineralogy, bulk geochemical characteristics, and the potential of the waste rock, pit wall rock and processed ore (tailings) to generate acid or net-neutral drainage. This program will also generate data to form the basis for prediction of future water quality that would result from precipitation contacting the material, and prediction of the impacts this water may have on groundwater, surface water, and pit lake quality at the Site. The data generated from this program will be used

New Mexico Copper Corporation Copper Flat Baseline Data Characterization Report
Copper Flat Mine 7-8 Section 7: Geology June 2012
to develop source term chemistry for the final pit walls to define the control that the pit wall rocks will have on the chemistry of a pit lake that will form after closure. The geochemical analysis combined with the hydrologic modeling will form the basis for determining whether abatement measures are, or will be required, to mitigate ARD at the Site.
Upon completion of the kinetic humidity cell program, SRK will provide a single comprehensive report of the complete geochemistry program including both static and kinetic testing analysis and results. The report will also include the predicted source term chemistry for the pit wall rock and final pit lake. The following subsections contain a general description of the geochemical characterization program.
7.5.2 Geochemical Characterization Program Summary
7.5.2.1 Data Review and Material Type Delineation
On behalf of NMCC, SRK has reviewed all data available from the previous and current exploration drilling programs, including the drillhole database, drill logs, assay data, and bulk element geochemistry. From this review, the main rock types, alteration types, and oxidation states identified by SRK in the late 1990s were updated and are identified in Appendix 7-C through 7-F. The combination of these parameters was used to define material types for the project that are the focus of the geochemical characterization program.
A recent review by NMCC of the exploration database revealed discrepancies between the 2009/2010 and 2011 core logging procedures and the overall geologic interpretation of the deposit. These changes reflect the significant expansion in the knowledge of copper porphyries, in particular the Copper Flat deposit. The change in geologic interpretation prompted a re-log of the drill core samples intervals included in the 2010 geochemical characterization program. These changes have resulted in a slight revision of the material types defined for the project. These changes will be carried forward in subsequent data evaluation and final reporting.
7.5.2.2 Sample Collection
In late 1997, SRK collected 46 samples for ABA testing, 59 for NAG testing, 1 for short-term leach testing, and 5 for humidity cell kinetic testing. In addition, 14 samples were collected from the historic tailing impoundment for static test analysis, and approximately 130 samples from waste rock and pit walls were collected for paste chemistry. Figure A.1.2 of Appendix 7-B shows the locations of the surface samples collected in 1997.
For the 2010 characterization program, a total of 74 additional samples were collected to create a sample database that is vertically and horizontally representative of potential low grade ore and waste rock associated with the current project. The sample set consists of both surface grab samples and drill core samples that were characterized based on lithology, alteration, oxidation, and absence/presence of sulfides. Drill core samples consist of coarse reject material from the recent exploration drill programs representative of waste rock. These samples were generated by collecting material from consecutive intervals within the same drillhole, and each sample consisted of a single material type as defined by rock type, alteration type, and oxidation state as defined by the exploration database. These samples were submitted to certified laboratories in Reno, Nevada, for sample preparation and laboratory testing. All 74 samples were submitted for ABA, NAG, and multi-element analysis. In addition, 40 of these samples were selected and analyzed using the Meteoric Water Mobility Procedure (MWMP), and 21 samples were selected for humidity cell testing beginning in January 2011. Figure 7-6 shows the 2009/2010 drillhole locations as well as the locations of the 2010 surface grab samples.
NMCC’s approach to sample selection was designed to ensure that samples with end-member reactivity are sufficiently represented in the program to provide a comprehensive and representative understanding of the full range of geochemical characteristics for each of the material types. To this end, NMCC has focused on

New Mexico Copper Corporation Copper Flat Baseline Data Characterization Report
Copper Flat Mine 7-9 Section 7: Geology June 2012
understanding the geological controls on the geochemical behavior of the different materials as the basis for sample selection.
7.5.2.3 Field Screening Program
Field tests including determination of paste pH and electrical conductivity (EC) were used in the 1997 geochemical characterization program to identify the presence of surficial/soluble salts in the waste rock dumps that could affect water quality. Because these tests are inexpensive and quick, a significant amount of data can be collected quickly with minimal cost. By using the field screening to define a representative sample set, the “representativeness” of the sample set is more defensible and the number of samples selected for the more expensive static test suite can be minimized. Based on the material type and paste results for that material, samples were selected for additional laboratory analysis. Samples included in the field screening program consisted of fine material (<5 mm chips) that was collected from a 1 cubic meter area on the waste rock dump surface. This method is employed because water quality in a dump is largely controlled by the fines and this is a good indication of reactivity. The paste test comprises mixing a 1:1 solid to liquid ratio of fines with distilled water and measuring EC and pH of the resulting solution. If the resulting leachate was blue in color, the sample was analyzed for copper and sulfate by field colorimetric spectrometry.
7.5.2.4 Static Test Program
The samples collected for the 2010 geochemical program were submitted to a certified laboratory for sample preparation and the first phase of static testing as follows:
1. Whole rock analysis using four-acid digest and ICP analysis to determine total metal and metalloid chemistry for 48 elements (ALS Chemex Method ME-MS61).
2. ABA using the modified Sobek method (Memorandum No. 96-79) with sulfur speciation.
3. NAG test reporting final NAG pH and final NAG value after a two-stage hydrogen peroxide digest.
This work was supervised by SRK at McClelland Laboratories of Sparks, Nevada, with analysis by Western Environmental Testing Laboratory (WETLab) of Sparks, Nevada; ALS Chemex of Reno, Nevada; and SVL Laboratories of Kellogg, Idaho.
The first phase of geochemical testing was completed to assess the range of reactivity of each of the material types and the results were used to select samples for MWMP testing with geochemical analysis of the leachate for applicable constituents. Samples demonstrating end-member reactivity, as determined from the first phase of static laboratory testing, were selected for MWMP testing to provide a comprehensive and representative understanding of the leaching characteristics of the major material types associated with the Copper Flat deposit. The results of the static testing are described in detail in Appendices 7-C, 7-D and 7-E.
7.5.2.5 Kinetic Testing Program
Based on the results of the static testing described above, any material types that exhibited uncertain or highly variable geochemical behavior were selected for further characterization using kinetic test methods to determine the rates and character of longer-term leaching. Because the static test work assumes that all minerals that have the potential to generate acid, buffer acid, or leach metals will react completely, they can only define the total acid generation and metal leaching potential of the rock and do not take into account reaction rates that will ultimately control whether the material will actually generate acid, buffer acid, or leach metals under field conditions.
New Mexico Copper Corporation Copper Flat Baseline Data Characterization Report
Copper Flat Mine 7-10 Section 7: Geology June 2012
Twenty-one samples were selected for humidity cell testing (as per ASTM D-5744-96-7 methodology), which was initiated in January 2011. Appendix 7-F provides documentation of the humidity cell results through Week 16. Based on the Week 16 data, SRK recommended, and NMCC approved, the continuation of the humidity cell testing through 40 weeks, which extends the humidity cell testing into Q4, 2011.
7.5.2.6 Data Validation and Compilation
The geochemical data are being reviewed as they are received to ensure the quality of data and consistency in analyses. NMCC’s contractor will verify the quality of all data and confirm that no anomalies are related to laboratory error prior to interpretation and reporting. At a minimum, NMCC’s contractor will utilize their internal standard data validation procedures, although guidance from other sources may also be considered (e.g., U.S. Environmental Protection Agency). All static geochemical data collected as part of the static testing program is being compiled into a single database for evaluation and the kinetic test data is being compiled into a separate database. This updated and quality checked database will be made available in the final geochemical report described in Section 7.5.3.
7.5.2.7 Geochemical Modeling
The Copper Flat Plan of Operations calls for leaving waste rock from previous mining activities in place and extending the waste rock facilities to accommodate waste rock from proposed new mining activities.
Existing and new waste rock have the potential to affect land and water resources through mobilization and transport of mine rock materials, whether as solid or dissolved phases, from the facilities to the surrounding environment. Potential receptors include soils, surface water, and groundwater resources near the facilities.
Static testing and geochemical analyses of existing waste rock and potential future waste rock and pit wall materials revealed a range of results. Some samples were characterized as having acid generation potential, whereas other samples demonstrated a potential to be acid consuming or neutral using the BLM waste rock guidelines for static testing. Kinetic testing of a subset of these mine rock samples began in January 2011 and still underway.
Upon completion of the testing program, a conceptual model will be developed to describe predicted geochemical trends of reactivity from waste management facilities, final pit walls and the tailing facility. The characterization study will also include a review of baseline groundwater chemistry and any hydrogeological studies in as far as they influence the understanding of geochemical dispersion, development of potential environmental pathways and limitations on this in the environment.
Following development of the conceptual geochemical model, it will be necessary to provide quantitative numerical predictions of the potential impacts of seepage or runoff from mining facilities to regional groundwater. In this instance, numerical predictions are proposed to use the USGS-developed software PHREEQC in order to develop a source term for the waste rock dumps, pit wall rocks, tailing impoundment and future pit lake. Data collected during the geochemical characterization program will be used to develop source term chemistry. For calculation of the waste rock dump and tailings facility source terms, the chemistry of the solution will be mass balanced to the predicted geological composition of the facilities, field solid-water ratio, contact times and then allowed to form a chemical equilibrium with rainwater and atmospheric oxygen. The resulting chemistry would be the predicted overall potential seepage chemistry from the facilities, assuming the total declared volume of meteoric water infiltrating the dumps or impoundment is fully mixed. These data, evaluated in conjunction with other data from the site (e.g., groundwater chemistry), will provide a basis for risk assessment and the evaluation of options for construction and closure of the waste rock and tailing impoundment facilities.

New Mexico Copper Corporation Copper Flat Baseline Data Characterization Report
Copper Flat Mine 7-11 Section 7: Geology June 2012
Data collected during the geochemical characterization program will also be used to develop source term chemistry for geologic material that will be exposed in the final pit walls that is needed for subsequent pit lake modeling efforts. The post-closure and long term geochemistry of a pit lake depends on the potential for rock exposed in the pit highwall to contribute acidity, metals, and other solutes to the pit lake during filling. Meteoric water contacting the pit walls enables desorption and dissolution of solutes from wall rock. The resultant chemistry of surface water reporting to the pit can be represented as the weighted sum of the water chemistry associated with each type of exposed rock. Pit lake chemistry will also be influenced by inflowing groundwater that will flow through the pit wall, where it will pick up additional solute load from secondary weathering products that are the result of oxidation that will occur during the period of dewatering. Previous studies demonstrated the current pit acts as a local terminal sink so no outflow is anticipated (See Section 8.0).
7.5.3 Ongoing Geochemical Assessments
NMCC believes the geochemical work being conducted will be sufficient to address the baseline data conditions and meet the MMD requirements to fully characterize the potential for waste rock, low grade ore and final pit walls to generate acid and leach metals, and evaluate potential degradation of surface or groundwater quality. At the conclusion of the humidity cell testing, SRK will prepare a detailed report with the results of the static and kinetic testing as well as the results of the predictive numerical modeling described in Section 7.4.7. NMCC will provide this report to the MMD and NMED as it becomes available in 2012 and believes the report will conclude the geochemical characterization with respect to the baseline data condition. To support both exploration and environmental evaluations, additional geochemical work is being executed. However, the results of these studies will principally be to satisfy NMCC’s internal understanding of the site geology and long term environmental concerns supervised by the NMED.
7.6 References
Bureau of Land Management (BLM), 1999, Preliminary final environmental impact statement, Copper Flat project: Las Cruces, N. Mex., U.S. Department of the Interior, 491 p. Prepared by ENSR, Fort Collins, Colo.
Dunn, P.G., 1982, Geology of the Copper Flat porphyry copper deposit, Hillsboro, Sierra County, New Mexico in Advances in geology of the porphyry copper deposits, southwestern North America: Tucson, Ariz., University of Arizona Press, p. 313-325.
Dunn, P., 1984, Geologic studies during the development of the Copper Flat porphyry deposit: Mining Engineering, February, 1984, 151 p.
Fowler, L.L., 1982, Brecciation, alteration, and mineralization at the Copper Flat porphyry copper deposit, Hillsboro, New Mexico: University of Arizona, Tucson, M.S. thesis, 133 p.
Harley, G.T., 1934, The geology and ore deposits of Sierra County: New Mexico Bureau of Mines and Mineral Resources, Bulletin 10, 220 p.
Hedlund, D.C., 1974, Age and structural setting of base-metal mineralization in the Hillsboro-San Lorenzo area, southwestern New Mexico in Siemers, C.R., Woodward, L.A., and Callender, J.F., eds., Silver Anniversary Guidebook; Ghost Ranch; North-Central New Mexico: New Mexico Geological Society Guidebook 25, p. 378–379.
INTERA, 2010, Sampling and analysis plan for the Copper Flat Mine, Prepared by INTERA, Inc., Albuquerque, New Mexico.

New Mexico Copper Corporation Copper Flat Baseline Data Characterization Report
Copper Flat Mine 7-12 Section 7: Geology June 2012
Kelley, S.A., and Chapin, C.E., 1997, Cooling histories of mountain ranges in the southern Rio Grande rift based on apatite fission-track analysis––A reconnaissance survey: New Mexico Geology, v. 19, no. 1, p. 1–14.
Locke, Augustus, 1926, The formation of certain ore bodies by mineralization stoping: Economic Geology, v.21, p. 431-453.
McLemore, V.T., Munroe, E.A., Heizler, M.T., McKee, C., 2000, Geology and evolution of the mineral deposits in the Hillsboro District, Sierra County, New Mexico in Geology and Ore Deposits 2000, The Great Basin and Beyond: Geological Society of Nevada, Program with abstracts, p. 63.
Norman, D.I., Kyle, P.R., and Baron, C., 1989, Analysis of trace elements including rare earth elements in fluid inclusion liquids: Economic Geology, v.84, p. 162-166.
Phillips, W.J., 1973, Mechanical effects of retrograde boiling and its probable importance in the formation of some porphyry ore deposits: Institution of Mining Metallurgy Transactions, Sec. B, v. 82, p. 90-98.
Raugust, J.S., 2003, The natural defenses of Copper Flat, Sierra County, New Mexico: New Mexico Bureau of Geology and Mineral Resources Open-file report 475, Socorro, N. Mex., New Mexico Institute of Mining and Technology.
Richards, J.P., 2003, Tectono-magmatic precursors for geophysical data over a copper gold porphyry Cu-(Mo-Au) deposit formation, in Journal of Economic Geology, v. 96, p. 1419–1431.
Seager, W.R., Shafiqullah, M., Hawley, J.W., and Marvin, R.F., 1984, New K-Ar dates from basalts and the evolution of the southern Rio Grande rift: Geological Society of America Bulletin, v. 95, p. 87–99.
SRK Consulting, 2010, NI-43-101 Preliminary Assessment, THEMAC Resources Group Limited, Copper Flat Project, Sierra County, New Mexico: Lakewood, Colo. Prepared by SRK Consulting for THEMAC Resource Group Limited, June 30, 2010.
SRK Consulting, Dec 2010, Technical memorandum, Copper Flat static testwork summary and kinetic test recommendations, Prepared by SRK Consulting, Reno, Nevada and Cardiff, UK, December 2010.
Titley, S.R., 1982, Geologic setting of porphyry copper deposits, southeastern Arizona, in Titley, S.R., ed., Advances in geology of the porphyry copper deposits, pp 37-58.

Tables

Table 7-1, Page 1 of 1
Table 7-1 Stratigraphy of the Copper Flat Area
Age Geologic Unit Thickness (ft)
Cenozoic
0–65 million years ago (Ma)
Pleistocene and Holocene valley alluvium
Pleistocene river, arroyo, and fan deposits
Pliocene basalt flows, dikes, and plugs
Upper Santa Fe Group fanglomerates (Palomas Formation) Santa Fe Group, Rincon Formation
Tertiary volcanics
10–70
50–100
50–200
300–100
1000–2000
1000
Mesozoic
65–225 Ma
Quartz latite dikes
Intermediate composition intrusive
Late Cretaceous andesite dikes
Late Cretaceous silicic intrusives
Copper Flat volcanic and
intrusive
(mineralization
associated with emplacement)
>3000
Sandstone
Mancos Shale (not exposed)
Dakota Sandstone (not exposed)
300–400
100–200
Paleozoic
225–570 Ma
Manzano Group sedimentary rocks. Abo Sandstone, Yeso Formation shales, sandstones, and gypsum deposits, and San Andres Limestone. Not exposed west of Rio Grande at Site.
Pennsylvanian carbonate rocks including Syrena, Oswaldo, and Magdalena Groups, minor conglomeratic sandstone and cherty massive limestone.
Devonian and Mississippian carbonate rocks (Kelly Limestone, Lake Valley Limestone, Caballero Formation) and Percha Shale.
Ordovician Montoya Group and Fusselman Dolomite.
Cambrian-Ordovician Bliss Sandstone and El Paso Group Limestone.
1000–2000
400–1000
200–500
250–600
500–700
Precambrian
570–1,500 Ma
Precambrian massive granite
Source: BLM, 1999, Tables 3-1 and 3-2

Table 7-2, Page 1 of 1
Table 7-2 Major Material Types in Proposed Copper Flat Mining Project
Lithology Primary Alteration
Secondary Alteration Coding Abundance
Quartz Monzonite Potassic Meteoric QMK-ox 1%
Quartz Monzonite Potassic Argillic/Meteoric QMKA ox 1%
Quartz Monzonite Potassic Argillic QMKA 32%
Quartz Monzonite Potassic QMK 18%
Quartz Monzonite Argillic QMA 1%
Quartz Monzonite Meteoric QMM 1%
Biotite Breccia Potassic Argillic BBKA 4%
Biotite Breccia Potassic BBK 3%
Quartz Breccia Potassic Argillic QBKA 4%
Quartz Breccia Potassic QBK 7%
Andesite Uncharacterized Uncharacterized AND 9%
Coarsely Crystalline Porphyry Uncharacterized Uncharacterized CCP 18%

Figures

Appendix 7-A Geochemical Review of Waste Rock, Pit Lake Water Quality and Tailings
(SRK 1996)

Appendix 7-B Copper Flat Preliminary Waste Management Plan,
New Mexico Copper Corporation (NMCC June 2011)
Appendix 7-C Copper Flat Static and Kinetic Test Recommendations
(SRK Dec 2010)
Appendix 7-D Copper Flat Geochemical Characterization Program
(SRK Feb 2011)

Appendix 7-E Copper Flat Geochemical Characterization Program
Incorporation of the 1997 Static Test Data (SRK Mar 2011)

Appendix 7-F Copper Flat Kinetic Testwork Update
(SRK July 2011)

New Mexico Copper Corporation Copper Flat Baseline Data Characterization Report
Copper Flat Mine 8-1 Section 8: Surface Water and June 2012 Groundwater Information
8 Surface Water and Groundwater Information
8.1 Surface Water
8.1.1 Introduction
The Copper Flat Mine Permit Area is located in the Lower Rio Grande watershed, as defined by the New Mexico Water Quality Control Commission (WQCC). The Lower Rio Grande watershed includes approximately 5,000 square miles in Catron, Socorro, Sierra, and Doña Ana Counties and is dominated by the Rio Grande and its tributaries as well as the two large reservoirs of Elephant Butte and Caballo. Numerous tributaries drain into the Rio Grande from the west, but none contribute perennial flow to the Rio Grande.
The Mine Permit Area is drained by ephemeral streams (arroyos) within the Greenhorn Arroyo Drainage Basin (Figure 8-1). Within the Mine Permit Area, the open pit that was created during mining in the early 1980s now contains a lake. Two creeks drain basins directly to the north and south of the Greenhorn Arroyo Drainage Basin: Las Animas Creek to the north and Percha Creek to the south (Figure 8-1). Both Las Animas and Percha Creeks have ephemeral, intermittent, and perennial reaches. Both Las Animas and Percha Creeks have perennial reaches that support fisheries.
Surface water in the Mine Permit Area and vicinity was investigated by SRK in 1995 (SRK, 1995). SRK collected flow and water quality data from Grayback Arroyo, Percha Creek, and Las Animas Creek. Newcomer et al. (1993) performed a hydrologic assessment of the Greenhorn Arroyo Drainage Basin, measuring flow and water quality along Grayback Arroyo and at a number of seeps and springs. The oldest known surface water investigation for surface water resources in the area of the Mine was performed by Davie and Spiegel (1967), who collected flow data for Las Animas Creek. Results of these investigations were compiled by Raugust (2003) and are also summarized in the BLM’s PFEIS for Copper Flat (1999). Flow rate data for streams in the vicinity of the Mine Permit Area are limited by the generally intermittent and ephemeral nature of flows. Historical field parameters and flow measurements are provided in Table 8-1.
The proposed sample locations, frequency, and methods of measurement and sample collection used during sampling activities in 2010 and 2011 are described within the Sampling and Analysis Plan (SAP) (INTERA, 2010). Overall, these data characterize baseline volumetric flow and water quality conditions of surface water resources within the Mine Permit Area and the surrounding Baseline Study Area that would be potentially affected by operations and reclamation.
8.1.2 Surface Water Sampling and Analysis by Drainage Basin
The surface water flow and water quality data provided in this BDR are organized according to the three primary drainage basins in the vicinity of the Mine Permit Area: the Outlet Las Animas Creek Basin, the Percha Creek Basin, and the Greenhorn Arroyo Basin (Figure 8-1). These drainage basins are 6th level sub-watersheds as defined by the USGS Hydrologic Unit classification system (Seaber et al., 1987). For each drainage basin, a description is provided followed by historical flow data, present (baseline data collection period) flow data, and seasonal flow patterns for streams. These data are followed by the historical water quality data, present water quality data, and seasonal patterns in the water quality data for the streams. This format is repeated for the springs in each drainage basin, concluding with a summary of modifications to the SAP during the sampling events and a brief discussion of the hydrologic consequences of mine operation on the drainage basin.
New Mexico Copper Corporation Copper Flat Baseline Data Characterization Report
Copper Flat Mine 8-2 Section 8: Surface Water and June 2012 Groundwater Information
8.1.2.1 Outlet Las Animas Creek Drainage Basin
8.1.2.1.1 Drainage Basin Description
Two creeks drain basins directly to the north and south of the Greenhorn Arroyo Drainage Basin: Las Animas Creek to the north and Percha Creek to the south (Figure 8-1). Las Animas Creek originates in the Black Range, approximately 20 miles west of the Mine Permit Area, and has ephemeral, intermittent, and perennial reaches.
In 1967, William Davie, Jr., and Zane Spiegel published a hydrograph survey report of Las Animas Creek for the New Mexico Office of the State Engineer (NMOSE). The report details the hydrogeology of the region and stream flow measurements, and provides an inventory of surface water diversions, wells, and irrigated lands along Las Animas Creek.
The Percha Shale, which underlies Las Animas Creek west of the Animas Uplift (west of TI5S R7W - TI5S R6W boundary) (Figure 8-1), likely prevents groundwater movement up into the creek and eastward (Davie and Spiegel, 1967). Most of the water in the western, upstream portion of Las Animas Creek likely discharges to the surface west of the Animas Uplift. Groundwater emerges in a number of springs near the outcrop of Percha Shale in Section 34, T14S, R7W, upstream of measurement location LAC-A (Figure 8-2). Groundwater entering Las Animas Creek from Pennsylvanian rocks, particularly NWS spring (Figure 8-2), was measured at a temperature of about 27 degrees Celsius (°C), which is about 9°C higher than normal shallow groundwater temperatures in the area, indicating groundwater origination from greater depths (Davie and Spiegel, 1967). The temperatures measured at NWS in 2010 and 2011 were also recorded at approximately 27°C. Davie and Spiegel (1967) believed this temperature indicates groundwater from NWS is coming from a depth of at least 800 ft below land surface.
The construction of diversion ditches and shallow wells along Las Animas Creek has caused local and seasonal changes in the alluvial groundwater and in surface flow (Davie and Spiegel, 1967). The pumping of groundwater from deep wells, which started around 1938, has likely had an impact on upward leakage of groundwater into the alluvium of Las Animas Creek (Davie and Spiegel, 1967). However, the increase of irrigation return flows from irrigated agriculture supplied by groundwater well pumping has also increased seasonal surface water in Las Animas Creek. Long-term monitoring of these impacts has not taken place, although the USGS has performed some limited water level monitoring from wells completed in the alluvium.
The upper portion of the Outlet Las Animas Creek Drainage Basin contains only a few dwellings; however, Ladder Ranch utilizes the water in Las Animas Creek and shallow alluvium for irrigation and stock ponds. The lower portion of Las Animas Creek, beginning approximately 1 mile upstream of LAC-E to Caballo reservoir, contains a large number of ranches, small farms, and home sites (Figure 8-2). A number of diversion ditches and return-flow ditches exist along this reach of the valley. In addition, many of the home sites have shallow wells, including some artesian flowing wells that are used for irrigated agriculture.
8.1.2.1.2 Las Animas Creek
Flow
Historical Data
Streamflow in Las Animas Creek varies from perennial to ephemeral from the area near sampling site LAC-C to Caballo Reservoir (Figure 8-2). For example, Davie and Spiegel (1967) show flow rates ranging from about 1.0 to 2.0 cubic feet per second (cfs) in the upper reach (T14S R7W, Sections 34 through 36, near sampling sites LAC-A and LAC-B in Figure 8-2) and middle reach (within T15S R5W) (near sampling sites LAC-C and LAC-D) of the creek;

New Mexico Copper Corporation Copper Flat Baseline Data Characterization Report
Copper Flat Mine 8-3 Section 8: Surface Water and June 2012 Groundwater Information
according to Davie and Spiegel, these reaches are “losing reaches” of the creek. Two measurements of flow rate are recorded for Las Animas Creek. Davie and Spiegel (1967) reported flows of between 1.0 and 2.0 cfs in the creek’s upper reaches and between 1.0 and 1.5 cfs in its middle reaches (BLM, 1999). Adrian Brown Consultants made a single flow measurement near LAC-E in 1996, reporting flow of 0.546 cfs (ABC, 1996a). These measurements are reported in Table 8-1. Later, multiple measurements were made near LAC-E from April 1996 through March 1998 during the spring runoff season with flow rates ranging from 0.87 to 0.06 cfs (ABC, 1998). As shown in Table 8-2, no flow was reported from April 10, 1996, through December 17, 1996 (ABC, 1998). On January 15, 1997, a flow of 11.2 cfs was reported, and on March 18, 1997, a flow rate of 37.7 cfs was reported (ABC, 1998). Flow was measured at 22.7 cfs on August 15, 1997, but then ceased for the remainder of 1997. Flow increased again on January 12, 1998, for which a flow rate of 60.3 cfs was reported (Table 8-2) (ABC, 1998). Though the NMED SWQB has collected flow data along Las Animas Creek, there are no historical flow data available in published reports.
Baseline Data
In August 2010, November 2010, January 2011, and April 2011, flow measurements were collected as part of the baseline data collection program from a number of measurement locations along accessible perennial and intermittent reaches of Las Animas Creek (Figure 8-2). The data are presented in Appendix 8-A. The objective of the flow measurements was to characterize the baseline volumetric flow of the springs and streams within the Outlet Las Animas Creek Drainage Basin (INTERA, 2010). Perennial stream reaches and springs were sampled four times over a one-year period, while ephemeral and intermittent reaches and springs were sampled during opportunistic sampling events after precipitation events over a one-year period. One auto-sampler was installed along an intermittent reach of Las Animas Creek. This auto-sampler, installed near LAC-E (Figure 8-2), did not collect a sample due to low flow in the creek during the sampling period.
Flow rates ranged from 0.04 to 7.09 cfs along Las Animas Creek from August 2010 to April 2011 (Appendix 8-A). Measurement location LAC-B had the greatest flow during each of the quarterly measurements except during the fall measurement, in November 2010. The summer measurements, in August 2010, consisted of the greatest flow volumes for all of the Las Animas Creek measurement locations, likely due to increased precipitation during summer months (see Section 2 [Climate] for further details).
In addition to the baseline flow measurements collected from August 2010 to April 2011, flow measurements were collected at six locations along Las Animas Creek on June 28, 2011 (inset, Figure 8-2). The measurement locations are identified as LAC-1 through LAC-6 and the data collected from these locations are summarized in Table 8-3. The results of these measurements are summarized in Appendix 8-B. Access to Las Animas Creek was not permitted upstream of LAC-1. In June 2011, calculated discharge rates were lower at each location along the creek relative to previously observed values measured from August 2010 to April 2011. Only two perennial reaches were observed along the accessible portion of Las Animas Creek. The maximum flow rate of the first reach was approximately 0.37 cfs at LAC-2. The maximum flow rate of the second measurable reach was 0.02 cfs at LAC-6.
As described in detail in Appendix 8-B, at the time of measurement, Las Animas Creek was predominately a losing stream, i.e., water was leaving the stream and entering the subsurface. The stream appears to gain water from the subsurface within two short reaches. The first gaining reach extends approximately 920 ft from the start of flow (SoF) to LAC-2 (inset, Figure 8-2) (Table 8-3 and Table 8-4). Las Animas Creek is then a losing stream from approximately 1,000 ft downstream of SoF to approximately 3,530 ft, where the stream dries out downstream of LAC-4. Approximately 5,200 ft downstream of SoF, Las Animas Creek is once again a gaining stream to LAC-5, approximately 5,830 ft downstream of SoF. At LAC-5, the surface water is very low and slow

New Mexico Copper Corporation Copper Flat Baseline Data Characterization Report
Copper Flat Mine 8-4 Section 8: Surface Water and June 2012 Groundwater Information
but does flow along the surface for approximately 950 ft before disappearing below the surface of the creek alluvium approximately 100 ft downstream of LAC-6.
Seasonal Patterns
The greatest flow rates measured in Las Animas Creek during the period August 2010 to April 2011 were recorded in the summer quarter in August (Figure 8-3). With the exception of LAC-B, all of the measurement locations showed a decrease in stream flow for each quarter (Figure 8-3). The flow rates in November were substantially lower than those recorded in August, and the measured rates trend toward a decrease with each quarter. In addition, the flow rates measured in June 2011 were considerably lower than all previously measured rates (Table 8-3). The June 2011 measurements were conducted prior to any late-summer rain events to determine low flow conditions. The seepage rates determined from the June 2011 flow measurements are provided in Table 8-4.
Water Quality
Historical Data
The water quality of Las Animas Creek was examined by Adrian Brown Consultants (1996a) and for the PFEIS (BLM, 1999). Adrian Brown Consultants obtained a single sample at LAC-E with a pH of 7.81, a sulfate concentration of 18 milligrams per liter (mg/L), and total dissolved solids (TDS) of 300 mg/L. The PFEIS reports that Las Animas Creek water quality is dominated by calcium or sodium bicarbonate, with pH in the range 7.0 to 8.0, sulfate in the range 20 to 70 mg/L, and TDS in the range 300 to 400 mg/L. Occasionally, sodium and chloride are higher, with chloride concentrations as high as 300 to 400 mg/L, possibly due to agricultural practices along the creek (BLM, 1999). Complete analytical results for Las Animas Creek are compiled in Appendix 8-C.
The New Mexico Environment Department (NMED) Surface Water Quality Bureau (SWQB) Monitoring and Assessment Section also collected water quality data in 2004 from three sampling stations along Las Animas Creek. Water quality and biological samples collected from these locations were part of a larger survey of the Lower Rio Grande and its perennial tributaries from the international boundary with Mexico to Elephant Butte Reservoir. Water quality monitoring included analysis of total nutrients, total and dissolved metals, major anions and cations, and field parameters. Biological surveys, which included the monitoring of fecal coliform and E. coli as well as the collection of macroinvertebrates and physical habitat characteristics, were conducted at select stations (NMED SWQB, 2009). Results from water quality sampling at locations along Las Animas Creek found no exceedances of water quality criteria for total nutrients, total and dissolved metals, major anions and cations, bacteria, and field parameters such as dissolved oxygen, pH, and temperature (NMED SWQB, 2009). The results of this analysis indicated that the low dissolved oxygen (DO) values documented in Las Animas Creek are likely the result of a significant groundwater input and therefore these sites were determined by NMED to be Fully Supporting its aquatic life use with respect to DO. This work, including the water quality data, is summarized in NMED SWQB (2009).
Baseline Data
In August 2010, November 2010, January 2011, and April 2011, field parameters and water quality samples were collected from various measurement locations along accessible perennial and intermittent reaches of Las Animas Creek (Figure 8-2). In April 2011, one sediment sample was collected along Las Animas Creek (Figure 8-2). Field parameters are presented in Appendix 8-A. Analytical results are presented in Appendix 8-C.
The water quality data for Las Animas Creek, as shown in Appendix 8-C, were similar to historical water quality data. For the samples collected from August 2010 to April 2011, the pH levels were slightly higher, in the range

New Mexico Copper Corporation Copper Flat Baseline Data Characterization Report
Copper Flat Mine 8-5 Section 8: Surface Water and June 2012 Groundwater Information
of 7.74 to 8.47, and the sulfate and TDS concentrations were lower, in the range 7.5 to 29 mg/L for sulfate and 173 to 357 mg/L for TDS. The sodium concentrations measured in Las Animas Creek range from 12 to 69 mg/L, and the chloride concentrations range from 2.8 to 74 mg/L. In general, the greater concentrations of sulfate, TDS, sodium, and chloride were measured from the NWS spring. The lower pH values were also measured at the NWS spring.
In April 2011, a sediment sample was collected at LAC-E in addition to the water sample. The results of both the water quality analysis and the sediment analysis were similar. Arsenic, barium, calcium, magnesium, potassium, silicon, sodium, uranium, and zinc concentrations were lower in the sediment sample than in the water sample, while aluminum, boron, iron, and manganese concentrations were higher in the sediment sample.
Seasonal Patterns
The concentrations of sulfate, TDS, sodium, and chloride increased as flow rates decreased during the baseline study period. The pH values of Las Animas Creek also increased as flow in the creek decreased (Appendix 8-C).
8.1.2.1.3 Springs
In 1967, Davie and Spiegel identified four spring or seeps within the Outlet Las Animas Creek Basin, however minimal historical data are available. As a result, there is little information on the flow rates or the quality of the springs and seeps. Two springs in the Outlet Las Animas Creek Drainage Basin were identified for sampling for baseline characterization.
Flow
Historical Data
Spring and seep flow rates are infrequently reported in the available literature for the Mine Permit Area and surrounding areas. Very little data are available for the springs in the Outlet Las Animas Creek Drainage Basin (Figure 8-2). In March of 1967, Davie and Spiegel measured NWS, also known as Warm Spring, to have a flow rate of 0.81 cfs (Davie and Spiegel, 1967). No other historical flow data were available for this spring or any others along or within the Outlet Las Animas Creek Basin.
Baseline Data
One spring, NWS, along Las Animas Creek (Figure 8-3) was identified for measurement from August 2010 to April 2011. The flow rate at NWS ranged from 0.731 cfs in November to 1.1 cfs in August (Appendix 8-A).
Seasonal Patterns
The flow rates recorded from the spring at NWS did not appear to be affected by the seasonal pattern impacting the in-stream flow rates along Las Animas Creek (Figure 8-3).
Water Quality
Historical Data
No historical water quality data were available for any springs or seeps in the Outlet Las Animas Creek Basin.
Baseline Data
Water quality samples were collected in August 2010, November 2010, January 2011, and April 2011. In general, the concentrations of arsenic, chloride, fluoride, magnesium, potassium, total residue, sodium, specific

New Mexico Copper Corporation Copper Flat Baseline Data Characterization Report
Copper Flat Mine 8-6 Section 8: Surface Water and June 2012 Groundwater Information
conductance, sulfate, and TDS were higher in samples collected from NWS than they were in samples collected from Las Animas Creek (Appendix 8-C). The pH level of the spring at NWS was lower than pH levels recorded for the creek, and the spring had lower concentrations of silicon as well.
Seasonal Patterns
The water quality parameters collected at NWS do not appear to follow a seasonal pattern and remained relatively constant from August 2010 to April 2011 (Appendix 8-C).
8.1.2.1.4 Modifications to the SAP
As NMCC executed the SAP, adjustments to the proposed SAP were necessary based on the actual site conditions encountered in the field. When making adjustments based on field conditions, NMCC strived to find equivalent or improved alternatives, where possible. Due to the ephemeral and intermittent nature of many of the reaches along Las Animas Creek, modifications occurred related to the surface water monitoring locations and sampling frequency proposed in the SAP (INTERA, 2010). In addition, many of the springs and seeps originally identified for quarterly monitoring and sampling, also identified as ephemeral in nature, were dry or had very little flow during the quarterly monitoring.
The quarterly flow measurement of one spring in the Outlet Las Animas Creek Drainage Basin was proposed in the SAP (INTERA, 2010); however, the spring, MAS, was not located in the Las Animas Creek stream bed and may have been masked by the stream flow. This spring location was replaced with NWS, further upstream, and its flow was measured in each quarter and sampled three times. Additional stream locations were sampled along Percha Creek due to the inability to sample from dry locations in other streams (Section 8.1.2.2).
In April 2011, NMCC discussed the sediment sampling plan from the SAP with the New Mexico Energy, Minerals, and Natural Resources Department, Mining and Minerals Division (MMD) (Eustice, 2011). MMD stated it would require a minimum of one sediment sample per drainage. The sediment sample was required to be from the same location as one of the surface water sample locations and downstream of sites which may affect water quality. In April, 2011 one sediment sample was collected from the Outlet Las Animas Creek Drainage Basin (near LAC-E) (Figure 8-2).
8.1.2.2 Percha Creek Drainage Basin
8.1.2.2.1 Drainage Basin Description
Percha Creek originates in the Black Range, approximately 30 miles west of the Mine Permit Area, and has ephemeral, intermittent, and perennial reaches (Appendix 8-B). In 2000, the NMOSE published a hydrographic survey report for the outlying areas of the Lower Rio Grande Basin, which included Percha Creek. This report compiled water rights information and aerial photography for each region in outlying areas of the Lower Rio Grande (NMOSE, 2000). Davie and Spiegel (1967) reported the depth of the alluvium in Percha Creek at the Interstate-25 bridge to be 40-ft thick.
Streamflow in Percha Creek is intermittent in the Hillsboro reach and perennial in the area known as the Percha Box, a steep-walled reach of the drainage that has incised into Paleozoic bedrock approximately 3 miles south of the Mine Permit Area (BLM, 1996) (Figure 8-4). Downstream of the Percha Box, the Percha Creek flows onto the Santa Fe Group, and flows are ephemeral. Though Percha Creek has perennial reaches, the creek does not contribute perennial flow to the Lower Rio Grande Basin.
The upper portion of the Percha Creek Drainage Basin contains a number of residences in the town of Hillsboro. A number of landowners have shallow alluvial wells, and surface water is used for irrigation when available in
New Mexico Copper Corporation Copper Flat Baseline Data Characterization Report
Copper Flat Mine 8-7 Section 8: Surface Water and June 2012 Groundwater Information
some areas. Downstream from Hillsboro there are a few ranches in the Percha Creek Drainage Basin. Some of the ranches utilize shallow wells in the creek alluvium to supply stock wells, and a few diversion ditches feed stock ponds when water is available.
8.1.2.2.2 Percha Creek
Flow
Historical Data
Streamflow in Percha Creek is intermittent throughout most of the reach in the Percha Creek Drainage Basin (Figure 8-4). Downstream of Hillsboro in the reach known as Percha Box, the flow is perennial. SRK (1995) reported that measurable stream flows averaged 0.44 to 0.55 cfs within and just east of Percha Box, with a range of 0.39 to 1.01 cfs. This was the only reach of Percha Creek with measurable flows during the SRK sampling period. Volumetric flow in Percha Creek was measured at 13 locations by Adrian Brown Consultants (1996a) from approximately ¼-mile upstream of the entry to Percha Box to approximately 5 miles downstream of the exit from Percha Box. Flow was found to be localized, occurring within and immediately to the east of Percha Box, and ranging from 1.02 cfs to 0.265 cfs, with many reaches dry or with standing water only.
A USGS stream-gauging station located on Percha Creek near Hillsboro has been recording peak flow data in Percha Creek since 1957 (USGS, 2011). Flow rates measured at this location have ranged from 0 (zero) up to 20,000 cfs (Figure 8-5). Peak flows are related to storm flows, and some years do not have significant storm flow events given variability in precipitation. NMED SWQB has collected flow measurements at select locations along Percha Creek. However, these data are not available in published reports.
Baseline Data
In August 2010, November 2010, January 2011, and April 2011, flow measurements were collected from various measurement locations along accessible perennial and intermittent reaches of Percha Creek (Figure 8-4). The flow measurements were collected to characterize the volumetric flow of the springs and streams within the Percha Creek Drainage Basin (INTERA, 2010). Perennial stream reaches and springs were sampled four times, while ephemeral and intermittent reaches and springs were sampled opportunistically after precipitation events. To aid in the opportunistic sampling, one auto-sampler was installed along an intermittent reach of Percha Creek. This auto-sampler, installed near PC-E (Figure 8-4), did not collect a sample due to dry conditions in this stretch of the creek during the baseline sampling period.
Flow rates ranged from 0.002 to 7.45 cfs along Percha Creek from August 2010 to April 2011 (Appendix 8-A). Location PC-C had the greatest flow during the high-volume measurements in August. Seasonal trends show that the summer month of August exhibited the greatest flow rates at all measurement locations, and that among all locations, PC-C had the greatest flow rate. The spring at PCS-A displayed less fluctuation in flow, ranging from 0.64 cfs in August to 0.41 cfs in November.
In addition to the baseline flow measurements collected from August 2010 to April 2011, flow measurements were collected at 16 locations along Percha Creek on June 29 and 30, 2011 (Figure 8-4). The measurement locations are identified as PC-1 through PC-16 and are summarized in Table 8-5. Calculated discharge rates were lower at each location along the creek relative to previously observed values measured from August 2010 to April 2011 (Appendix 8-A). Three perennial reaches were observed along Percha Creek from Hillsboro downstream (inset, Figure 8-4). The maximum flow rate of the first reach was 0.66 cfs at PC-7, approximately 150 ft downstream of the spring inflow at PCS-A (Figure 8-4). The maximum flow rate in the second measurable reach was 0.16 cfs at PC-9, and the maximum flow rate in the third measurable reach was 0.34 cfs at PC-15.

New Mexico Copper Corporation Copper Flat Baseline Data Characterization Report
Copper Flat Mine 8-8 Section 8: Surface Water and June 2012 Groundwater Information
During the June 2011 measurement event, Percha Creek had both losing and gaining reaches. Flow started approximately 400 ft upstream from PC-1 with a rate of 0.24 cfs. The rate decreased at PC-2, approximately 1,395 ft downstream of the SoF (inset, Figure 8-4). The rate varied slightly until the inflow from the springs at PC-6, approximately 4,220 ft downstream of the SoF and close to the end of Percha Box. Downstream of the springs at PC-6 and PC-7 is a facies change from the Paleozoic carbonates, which compose the bedrock in the Percha Box, to Tertiary volcanic rocks and then the Upper Santa Fe Group sediments. Flow in Percha Creek decreased significantly downstream of the Percha Box, and all surface flow disappeared for approximately 995 ft between PC-8 and PC-9. Surface flow also ceased along an approximately 4,500-ft interval downstream of PC-10. Approximately 500 ft upstream of PC-11, flow began again in Percha Creek and continued for approximately 10,700 ft (almost 2 miles) before disappearing into the sandy alluvium (Table 8-6; inset, Figure 8-4).
Seasonal Patterns
The greatest flow rates measured in Percha Creek from August 2010 to April 2011 were recorded in the summer quarter in August (Figure 8-6). With the exception of an increase in volume in January for two locations, all of the stream flow measurements decreased with time except PCS-A (Figure 8-6). The flow rates in November were substantially lower than those recorded in August, and PC-A and PC-D had a small increase in flow in January which then decreased again in April. In addition, the in-stream flow rates measured in June 2011 (Appendix 8-B) were considerably lower than all previously measured rates (Appendix 8-A). The June 2011 measurements were conducted prior to any late-summer rain events to determine low-flow conditions. The seepage rates determined from the June 2011 flow measurements are provided in Table 8-5.
Water Quality
Historical Data
Percha Creek water quality was examined by Adrian Brown Consultants (1996a) and for the PFEIS (BLM, 1999). Adrian Brown Consultants sampled Percha Creek at the entry and exit to Percha Box, and 5,000 ft downstream from the exit from Percha Box, and measured field parameters at all seven locations in which water was found (Table 8-1). For the three samples submitted for laboratory analysis, pH ranged from 7.62 to 7.82, sulfate ranged from 63 to 71 mg/L, and TDS ranged from 336 to 406 mg/L. The PFEIS (BLM, 1999) reports that surface water flowing in Percha Creek has a chemistry dominated by calcium bicarbonate, with pH in the range of 7.0 to 8.0, sulfate in the range of 20 to 70 mg/L, and TDS in the range of 300 to 400 mg/L. Complete analytical results for Percha Creek are compiled in Appendix 8-C.
Following the assessments in the 1990s, NMED SWQB collected water quality data from Percha Creek at the Box in support of a water quality survey of the Lower Rio Grande tributaries. Water quality monitoring included analysis of total nutrients, total and dissolved metals, major anions and cations, and field parameters. Biological surveys, which included the monitoring of fecal coliform and E. coli as well as the collection of macroinvertebrates and physical habitat characteristics, were conducted at select stations (NMED SWQB, 2009). As summarized by NMED SWQB (2009), results from water quality found no exceedances of water quality criteria for total nutrients, total and dissolved metals, major anions and cations, bacteria, and field parameters such as dissolved oxygen, pH, and temperature (NMED SWQB, 2009). The results of this analysis indicated that the low DO values documented in Percha Creek are likely the result of a significant groundwater input and therefore these sites were determined by NMED to be fully supporting its aquatic life use with respect to DO. In addition, stream bottom deposits collected in 2007 showed that Percha Creek was fully supporting its aquatic life uses with respect to sedimentation/siltation; a change from when the stream was found to be only partially supporting on the 1998 §303(d) list, which attributed stream bottom deposits as the cause. Consequently, NMED/SWQB intends to remove the sedimentation/siltation impairment listing for Percha Creek in the 2010-

New Mexico Copper Corporation Copper Flat Baseline Data Characterization Report
Copper Flat Mine 8-9 Section 8: Surface Water and June 2012 Groundwater Information
2012 State of New Mexico CWA §303(d)/§305(b) Integrated Report. Those data are summarized in NMED SWQB (2009).
Baseline Data
In August 2010, November 2010, January 2011, and April 2011, field parameters and water quality samples were collected from various measurement locations along accessible perennial and intermittent reaches of Percha Creek (Figure 8-4). In April 2011, one sediment sample was collected along Percha Creek. Field parameters are presented in Appendix 8-A. Analytical results are presented in Appendix 8-C.
Water quality data for Percha Creek (Appendix 8-C) were similar to historical water quality data collected by Adrian Brown Consultants (1996a) and BLM (1999). In samples collected from August 2010 to April 2011, the pH was slightly higher than the historical data, in the range of 8.23 to 8.51, and the sulfate and TDS concentrations were very similar, in the range 49 to 74 mg/L for sulfate and 298 to 378 mg/L for TDS. The sodium concentrations measured in Percha Creek range from 14 to 60 mg/L, and the chloride concentrations range from 6 to 11 mg/L.
In April 2011, a sediment sample was collected from PC-C in addition to the water sample. The results of both the water quality analysis (Appendix 8-C) and the sediment analysis were similar. Calcium, magnesium, silicon, and uranium concentrations were lower in the sediment sample (Appendix 8-D) than in the water sample, while aluminum, barium, copper, and iron concentrations were slightly higher in the sediment sample (Appendix 8-D).
Seasonal Patterns
The water quality samples collected from Percha Creek from August 2010 to April 2011 do not display a strong seasonal pattern. The concentrations of sulfate, sodium, and chloride increased as flow rates throughout the year decreased for sample locations PC-B, PC-C, and PC-D. The pH measured at PC-B, PC-C, and PC-D decreased as flow rates decreased. The concentrations and pH from sample location PC-A remained fairly constant even with a large decrease in flow volume from the August sample event to the November sample event. The TDS concentrations remained fairly similar throughout the season, increasing slightly at PC-B and PC-C, and decreasing slightly at PC-A and PC-D.
8.1.2.2.3 Springs
Several springs in the Percha Creek Basin have been identified (Figure 8-4). The SAP identified seven springs in the Percha Creek Basin for quarterly flow monitoring and two for quarterly water quality sampling. Two springs identified in the SAP for planning purposes were not identified in the field: CSCS-A and WSCS-B. In addition, three springs were identified in the field, but were dry or had minimal stagnant water in each quarter: WSC-A, CSC-A, and PWS. Five springs were identified and sampled and/or measured for flow rates: CSCS-C, CSCS-B, PCS-A, WS, and WSCS-A (Figure 8-4).
Flow
Historical Data
Spring and seep flow rates are infrequently reported in the available literature for the Mine Permit Area and surrounding areas. No historical data were available on the flow rates of springs and seeps within the Percha Creek Basin.
Baseline Data
Flow rate measurements range from less than 0.001 to 0.64 cfs in springs within the Percha Creek Basin from August 2010 to April 2011 (Appendix 8-A). Measurement location PCS-A (Figure 8-4) had the greatest flow,

New Mexico Copper Corporation Copper Flat Baseline Data Characterization Report
Copper Flat Mine 8-10 Section 8: Surface Water and June 2012 Groundwater Information
ranging from 0.41 to 0.64 cfs. The springs WS, WSCS-A, CSCS-B and CSCS-C, in Warm Spring Canyon and Cold Spring Canyon (Figure 8-4), had much lower flows, ranging from 0 (zero) to 0.748 cfs.
Seasonal Patterns
The summer measurements in August 2010 consisted of the greatest flow volumes for the springs and seeps in the Percha Creek Basin. The springs in Warm Spring Canyon and Cold Spring Canyon had very little flow, ranging from 0 (zero) to 0.748 cfs in January and April (Appendix 8-A). The flow measurements taken at PCS-A in August were more than 0.22 cfs higher than the flow rates in November, January, and April; however, the flow rate did increase again to 0.66 cfs in June 2011 (Appendix 8-A).
Water Quality
Historical Data
No historical data were available on the water quality of springs and seeps within the Percha Creek Basin.
Baseline Data
Water quality samples were collected from five springs in the Percha Creek Basin from August 2010 to April 2011 (Figure 8-4, Appendix 8-C). WS and CSCS-B were sampled four times each in August 2010, November 2010, January 2011, and April 2011. Samples collected from the springs WS, WSCS-A, CSCS-B, and CSCS-C had pH values ranging from 7.37 to 8.38, sulfate concentrations in the range of 3.5 to 300 mg/L, TDS concentrations in the range of 445 to 1,000 mg/L, sodium concentrations in the range of 4.7 to 290 mg/L, and chloride concentrations in the range of 1 to 50 mg/L. The spring at PCS-A along Percha Creek had concentrations that fell within the range of values measured at the springs upstream in Warm Spring Canyon and Cold Spring Canyon. The concentrations at PCS-A in August 2010 were 56 mg/L sulfate, 353 mg/L TDS, 33 mg/L sodium, 8.5 mg/L chloride, and a pH of 8.04.
Seasonal Patterns
The springs in Percha Creek Basin did not display a strong seasonal trend in the water quality data collected from August 2010 to April 2011. The sulfate and chloride concentrations increased as flow rates decreased.
8.1.2.2.4 Modifications to the SAP
As NMCC executed the SAP, adjustments to the proposed SAP were necessary based on the actual site conditions encountered in the field. When making adjustments based on field conditions, NMCC strived to find equivalent or improved alternatives, where possible. Modifications from the surface water monitoring locations and sampling frequency proposed in the SAP were due to the ephemeral and intermittent nature of many of the reaches along Percha Creek (INTERA, 2010). In addition, many of the springs and seeps originally identified for quarterly monitoring and sampling were dry or had very little flow during the quarterly monitoring events and alterations were made to the proposed SAP locations and sampling frequency.
Additional stream locations were sampled along Percha Creek due to the inability to sample from dry locations in other streams. Quarterly flow measurements of five springs and seeps in Percha Creek Drainage Basin were proposed in the SAP (INTERA, 2010). Only one proposed spring, WS, had enough flow in each quarter to measure flow. The spring at WSCS-A was flowing at an estimated rate of less than 2.22 x 10⁻³ cfs in August 2010 and January 2011, and was dry in November 2010 and April 2011. Two springs, PCS-A and CSCS-B, were added to the monitoring, and flow was measured at both of these locations in each quarter. In addition, the spring at

New Mexico Copper Corporation Copper Flat Baseline Data Characterization Report
Copper Flat Mine 8-11 Section 8: Surface Water and June 2012 Groundwater Information
CSCS-C was monitored, though flow was estimated to be less than 2.22 x 10⁻³ cfs in August 2010 and the spring was dry the remainder of the monitoring period.
Per guidance from Chris Eustice of MMD (2011), one sediment sample was collected in April 2011 from Percha Creek Drainage Basin near PC-C (Figure 8-4).
8.1.2.3 Greenhorn Arroyo Drainage Basin
8.1.2.3.1 Drainage Basin Description
The Mine Permit Area is drained by ephemeral streams (arroyos) within the Greenhorn Arroyo Drainage Basin, a sixth-level sub-watershed defined by the Hydrologic Unit classification system (Seaber et al., 1987), that drains 29,414 acres of land on the eastern slope of the Animas Uplift to a single outlet into the Rio Grande (Figure 8-1). Flows within the Greenhorn Arroyo Drainage Basin are ephemeral; they only occur in direct response to precipitation. As a result, this drainage, similar to others in the region, does not contribute any perennial surface water flow to the Rio Grande.
Numerous arroyos contribute to the trunk channel of Greenhorn Arroyo. Of these, Grayback Arroyo is the primary drainage through the Mine Permit Area. Grayback Arroyo originates west of the Mine Permit Area, is diverted around the mine pit, and drains eastward until it converges with the trunk channel of Greenhorn Arroyo, approximately 8 miles east of the Mine Permit Area boundary (Figure 8-1). In pre-mining times, Grayback Arroyo drained directly through the mine area, but was later re-routed around the southern perimeter of the mine area for flood control purposes (Raugust, 2003). Grayback Arroyo is an ephemeral stream and flows only during periods of snow melt or rain events.
8.1.2.3.2 Greenhorn and Grayback Arroyos
Flow
Historical Data
Flow rates in Grayback Arroyo at SWQ-3 (Figure 8-7) were measured by Newcomer et al. (1993) to be 0.028 cfs in March of 1993.
Baseline Data
Flow rates in the Grayback Arroyo were minimal during the quarterly sampling time period. Three sampling locations were identified along the Grayback Arroyo (Figure 8-7). Sampling locations SWQ-2 and SWQ-3 had standing water and not enough flow to measure in August and November. SWQ-2 was dry in January and April, while SWQ-3 had standing water in January but was dry in April. Sampling location SWQ-1 was dry during each quarter of sampling.
Seasonal Patterns
Grayback Arroyo did not exhibit any seasonal patterns.
Water Quality
Historical Data
The surface water chemistry of Grayback Arroyo was initially investigated in 1977 at three locations as part of an environmental assessment prepared by the BLM in response to an application by Quintana Minerals Corporation

New Mexico Copper Corporation Copper Flat Baseline Data Characterization Report
Copper Flat Mine 8-12 Section 8: Surface Water and June 2012 Groundwater Information
for an open pit copper mine at the Mine Permit Area (BLM, 1978). The three locations sampled in 1977 generally correspond to the sampling locations identified in Figure 8-7, with one location upstream of the permit boundary, one within the Mine Permit Area approximately 300 yards from the mine rim, and a third located where the arroyo leaves the Mine Permit Area (BLM, 1978). Water samples were collected in January, March, and July of 1977.
WQCC standards for metals were not exceeded at any location in any of the 1977 sampling events (BLM, 1978). Results for pH (7.6–8.1) were in the same range as samples collected later at these three locations. TDS results upstream of the Mine Permit Area (720-1000 mg/L) were comparable to those of samples collected later, but samples taken at locations within and downstream of the Mine Permit Area were comparatively lower (800-1,320 mg/L) than the results for later sampling events, such as those conducted by Newcomer et al. (1993) at SWQ-1 (upgradient of the pit lake), SWQ-2 (downgradient of the pit lake but within the area of mining disturbance), and SWQ-3 (approximately 1 mile downgradient of the pit lake) (Figure 8-7). Field parameters measured by Newcomer et al. (1993) are shown in Table 8-1 and complete analytical results are presented in Appendix 8-C. Results from the 1990s (Appendix 8-C) generally show, with a few exceptions, that concentrations of TDS, sulfate, and chloride increase from SWQ-1 to SWQ-3, or from west to east as surface water flows through the Mine Permit Area.
All three sample locations in Grayback Arroyo, SWQ-1, SWQ-2, and SWQ-3 (Figure 8-7), were neutral to alkaline between 1982 and 1998 (Appendix 8-C). Results for all three locations indicated a trend of increasing TDS concentrations over time. Samples from SWQ-1 were all less than 1,000 mg/L TDS, samples from SWQ-2 had a TDS range from 990 mg/L in 1983 to 4,464 mg/L in 1996, and samples from SWQ-3 ranged from 1,866 mg/L in 1992 to 4,432 mg/L in 1993 (Appendix 8-C). Sulfate results for all three sample locations also indicated increasing concentrations over time. Samples from SWQ-1 had a range of sulfate concentrations from 68 mg/L in 1982 to 323.1 mg/L in 1993, samples from SWQ-2 had a sulfate range from 271.2 mg/L in 1995 to 2,566.3 mg/L in 1996, and samples from SWQ-3 ranged from 952.2 mg/L in 1992 to 2,382 mg/L in 1995 (Appendix 8-C). The chloride results from SWQ-1 had a range of concentrations from 10 mg/L in 1982 to 47.2 mg/L in 1992, chloride results from SWQ-2 had a range of concentrations from 46 mg/L in 1981 to 223 mg/L in 1996, and chloride results from SWQ-3 had a range of concentrations from 96.7 mg/L in 1996 to 238 mg/L in 1995 (Appendix 8-C).
Baseline Data
The water quality of Grayback Arroyo at sites SWQ-2 and SWQ-3 was investigated from August 2010 to April 2011. The concentrations of TDS, sulfate, and chloride have decreased significantly from historical concentrations at sampling location SWQ-2 within the Mine Permit Area (Appendix 8-C). In the sample collected at SWQ-2 in August 2010, the concentrations were as follows: TDS was 78 mg/L, sulfate was 11 mg/L, and chloride was 0.71 mg/L. The pH measured at SWQ-2 in August 2010 was 7.42. The copper concentration at SWQ-2 was 0.085 mg/L in August 2010 (Appendix 8-C).
The concentrations of TDS and sulfate measured at SWQ-3, east of the Mine Permit Area, have increased from historical concentrations, while chloride concentrations have decreased slightly (Appendix 8-C). In August 2010, the TDS concentration was 4,500 mg/L and the sulfate concentration was 2,900 mg/L. Chloride concentrations measured in August 2010 were 130 mg/L and in April 2011 were 74 mg/L. The pH values measured at SWQ-3 range from 7.92 to 8. Copper concentrations measured at SWQ-3 were 0.062 mg/L in August 2010 and 0.011 mg/L in April 2011 (Appendix 8-C). Compared to the August 2010 sample collected from SWQ-2, concentrations of analytical parameters are generally higher at SWQ-3 than at SWQ-2.
In April 2011, sediment samples were collected from SWQ-2 and SWQ-3. The results do not show that concentrations are generally higher at one location versus another (Appendix 8-D). For example, concentrations of carbonate, copper, magnesium, selenium, silicon, and sodium are higher or slightly higher in sediment

New Mexico Copper Corporation Copper Flat Baseline Data Characterization Report
Copper Flat Mine 8-13 Section 8: Surface Water and June 2012 Groundwater Information
sampled from SWQ-2, whereas concentrations of aluminum, barium, iron, molybdenum, and uranium are higher or slightly higher in sediment sampled from SWQ-3.
Seasonal Patterns
The water quality in Grayback Arroyo does not display any seasonal patterns.
8.1.2.3.3 Springs
Three seeps were identified in BLM (1999) along Grayback Arroyo. One seep with riparian vegetation was identified as being located near a buried storm water collection pond. A second seep was identified downstream from the first seep and supports a small cottonwood/willow stand. The third seep is located south of the operations area. These seeps were not flowing during the baseline data collection program and are considered historical seeps.
Two springs are located within the Greenhorn Arroyo Drainage Basin to the north (BG-2) and west (BG) of the Mine Permit Area (Figure 8-7). Other unnamed seeps can occur in the pit walls surrounding the pit lake after precipitation events; these are likely the result of fractured flow through the bedrock exposed in the pit wall.
Flow
Historical Data
Spring and seep flow rates are infrequently reported in the available literature for the Mine Permit Area and surrounding areas. Several springs and seeps have been identified within the Greenhorn Arroyo Drainage Basin. Two springs, identified as BG and BG-2, are located to the north and west of the Mine Permit Area (Figure 8-7) and several unnamed seeps occur in the walls surrounding the pit lake. BG and BG-2 were judged by Newcomer et al. (1993) to be ephemeral. The seeps along the pit walls are observed to flow in response to precipitation events, and as mentioned above, are likely the result of fractured flow through the bedrock exposed in the pit wall. All known springs and seeps in the Greenhorn Arroyo Drainage Basin are upgradient of the proposed mine water discharge location.
Baseline Data
The springs identified in the Greenhorn Arroyo Drainage Basin, BG and BG-2, were dry during the baseline quarterly monitoring program. The pit wall seep, PWS-1, on the northwest corner of the pit wall (Figure 8-7) was measured for flow rate in August 2010. A timed fill of a known volume was conducted to estimate a flow rate of less than 2.22 x 10⁻⁵ cfs. The rate of flow at PWS-1 was too low or dry in the subsequent quarters and, as a result, flow was not measured (Figure 8-7).
Seasonal Patterns
PWS-1 and other seeps along the pit wall that were dry, flow in direct response to precipitation and are therefore likely to flow more in the late summer months after monsoon storms. The springs, BG and BG-2, upgradient of the Mine Permit Area, are also ephemeral. However, flow was not observed at either location from August 2010 to April 2011.

New Mexico Copper Corporation Copper Flat Baseline Data Characterization Report
Copper Flat Mine 8-14 Section 8: Surface Water and June 2012 Groundwater Information
Water Quality
Historical Data
Newcomer et al. (1993) sampled the BG and BG-2 springs in April 1993, and SRK observed and sampled seeps in the pit wall in 1997 (SRK, 1997b). Field parameters and water chemistry analytical data for these locations are presented in Table 8-1 and Appendix 8-C, respectively. SRK (1997b) reported concentrations in the pit wall seep from May 1993 as follows: pH of 1.9, sulfate of 10,000 mg/L, and chloride of 35 mg/L. Samples from BG and BG-2 had pH ranging from 8.0 to 8.2, sodium ranging from 90 to 124 mg/L, bicarbonate ranging from 411 to 535 mg/L, sulfate ranging from 184 to 228 mg/L, and TDS ranging from 680 to 690 mg/L. On the basis of these results, ABC (1996a) judged BG and BG-2 to be qualitatively similar to the Grayback Arroyo sample location SWQ-1, while the pit wall location appears to have been subject to a similar process as the locations at SWQ-2 and SWQ-3.
Baseline Data
The sample collected from PWS-1 in August 2010 had a pH of 2. The sulfate concentration was 11,000 mg/L, and the TDS concentration was 13,900 mg/L. The sample also had high concentrations of aluminum at 540 mg/L, calcium at 470 mg/L, copper at 80 mg/L, iron at 1,600 mg/L, and a number of other analytes (Appendix 8-C).
Seasonal Patterns
One sample was collected from PWS-1 and no samples were collected from BG and BG-2, so a seasonal pattern in the water quality from seeps and springs in the Greenhorn Arroyo Drainage Basin was not observed.
8.1.2.3.4 Pit Lake
The open pit that was mined during the early 1980s now contains a lake that is located within the Mine Permit Area (inset, Figure 8-7). Since 1989, the pit lake has been sampled for water quality at various locations and depths, including samples collected by past operators of the mine, state regulatory agencies, and academic researchers studying the mine (BLM, 1999).
Historical Water Levels
During the late 1980s and early 1990s, a 12.8-acre lake formed in the existing pit. The pit lake was estimated to be about 40-ft deep, based on a pit bottom elevation of 5,380 ft amsl and a water level elevation of 5,420 ft amsl as measured in 1986 (SRK, 2010).
Baseline Water Levels
The deepest point in the pit lake was determined during the bathymetric survey in September 2010 and was used as a single gauging station to measure water depth. Water depth was measured four times from this location during the baseline sampling program: (1) 34.6 ft in September 2010, (2) 35.8 ft in January 2011, (3) 31.6 ft in April 2011, and (4) 28.9 ft in July 2011 (Table 8-7).
A gauge to record water level elevation was set on the southern end of the pit lake in April 2011 with the zero point of the gauge set at an elevation of 5,440 ft amsl. Three water level elevation readings were recorded during the baseline program and show the following elevations: (1) 5,444.44 ft amsl on May 12, 2011, (2) 5,443.425 ft amsl on July 1, 2011, and (3) 5,443.15 ft amsl on July 20, 2011. As summarized in a recent evaluation (JSAI, 2011a), the pit lake currently covers an area of approximately 5.2 acres and contains about 60 acre-ft of water.
New Mexico Copper Corporation Copper Flat Baseline Data Characterization Report
Copper Flat Mine 8-15 Section 8: Surface Water and June 2012 Groundwater Information
Seasonal Patterns
Based on the four measurements of water depth, water level was highest in the winter month of January and lowest in the summer month of July. As shown by the gauge readings, water levels decreased from May 2011 to late July 2011 by 1.29 ft. Water levels in the pit lake appear to drop in the summer months when there is increased evaporation.
Water Quality
Historical Data
The water quality of the pit lake has been sampled over 65 times at various depths and locations since the initial samples were collected on April 13, 1989, by the New Mexico Environment Improvement Board (Raugust, 2003). Raugust (2003) concluded that the collective data show several trends in the variability of water quality over time, mainly that evapoconcentration and buffering processes are influencing the quality of the lake water. Pit water has historically exceeded the WQCC groundwater standards for sulfate, chloride, TDS, manganese, and uranium (20.6.2.3103 of the New Mexico Administrative Code [NMAC]) and has, at times, dropped below the acceptable pH range of 6 to 9.
Analytical results of samples collected from 1989 to 1998 indicate that sulfate, chloride, TDS, manganese, and pH all increased over this period. For example, sulfate increased from a range of 2,250 to 3,000 mg/L to a range of 3,500 to 4,300 mg/L over this time period. Chloride increased from an average of around 100 mg/L to around 250 mg/L, which may be attributed to lower average annual precipitation and higher annual temperatures during this period (BLM, 1999). However, the sulfate-to-chloride ratio dropped during this time period, suggesting that sulfate rose at a slower rate than chloride due to the formation of gypsum and the subsequent buffering of the sulfate concentration in pit lake water by gypsum (gypsum is observed along the margins of the pit lake during the summer months when the pit lake level has dropped). TDS ranged from 2,700 mg/L in 1991 (Newcomer et al., 1993) to about 6,000 mg/L in 1998 (Raugust, 2003). Manganese ranged from 1.8 to 4.3 mg/L (BLM, 1999). The measured pH values have generally increased over time to about 8.0. However, in 1992 and again in 2008, pH decreased to 4.4 and 4.5 (NMED GWQB, 2008), respectively, deviating from the overall trend of elevated pH values. The overall rise in the pH may be due to buffering by wall rock. There are no historical data available for uranium, other than a sample collected in 2004 that showed the uranium concentration from this sample exceeded the WQCC standard (NMED GWQB, 2008).
Other key studies that present the water quality are summarized in SRK (1997a) and include hydrogeologic and hydrogeochemical studies (SRK, 1995), post-closure pit water balance model calculations (SRK, 1997b), water quality and host rock geochemical studies (SRK, 1997c), and post-hearing submittals that followed the 1997 New Mexico Mine Permit public hearing.
Baseline Data
The pit lake was sampled at its deepest point in September 2010, January 2011, April 2011, and July 2011 (Figure 8-7 and Figure 8-8). Analytical results of samples collected from September 2010 to July 2011 generally show that sulfate, chloride, TDS, manganese, magnesium, cobalt, fluoride, sodium, and potassium have all increased from historical sampling events and some have increased from the January 2010 sample (Appendix 8-E). From January 2010, sulfate increased from 5,200 mg/L to a range of 5,500 to 6,400 mg/L, TDS increased from 7,770 mg/L to a range of 7,780 to 9,680 mg/L, magnesium increased from 570 mg/L to a range of 590 to 780 mg/L, sodium increased from 690 mg/L to a range of 730 to 920 mg/L, and potassium increased from a concentration of 25 mg/L to a range of 26 to 35 mg/L. A few constituents decreased from January 2010 to July 2011, including aluminum, which decreased from 5.5 mg/L to a range of <0.02 to 1.7 mg/L, iron, which

New Mexico Copper Corporation Copper Flat Baseline Data Characterization Report
Copper Flat Mine 8-16 Section 8: Surface Water and June 2012 Groundwater Information
decreased from 1.3 mg/L to a range of <0.02 to 0.032 mg/L, and copper, which decreased from 11 mg/L to a range of <0.006 to 2 mg/L. The measured pH values increased from 6 in January 2010 to a range of 6.67 to 7.86, within the acceptable range of 6 to 9. Uranium concentrations in all discrete-depth and composite water quality samples were either 0.11 or 0.12 mg/L.
In September 2010, a sediment core was collected from the deepest point in the pit lake (Figure 8-8). One sediment sample (PL-C2-WI) was taken from the core by homogenizing the sediment from 0 (zero) to 10 inches below the sediment-water interface. This uppermost interval from 0 (zero) to 10 inches was chosen purely based on the minimum sample volume required by the laboratory to run the suite of analytical parameters. This interval was selected in place of homogenizing the entire interval of the core because isolating the upper unit better characterizes the sediment that interacts with the water column and is of more interest for geochemical analysis of the pit lake system. The analytical result for sulfate concentration was 26,000 mg/Kg, chloride was 890 mg/Kg, manganese was 380 mg/Kg, magnesium was 610 mg/Kg, aluminum was 6,100 mg/Kg, iron was 9,300 mg/Kg, copper was 1,400 mg/Kg, and lead was 4.1 mg/Kg. The concentration of uranium in the sediment was <500 mg/Kg. All results are presented in Appendix 8-F.
Seasonal Patterns
As water levels in the pit lake dropped from increased evaporation in the warmer months, the concentrations of sulfate, chloride, TDS, calcium, sodium, and fluoride increased. The analytical results do not indicate the presence of a chemocline, or the chemical stratification in the lake, during any of the four sampling seasons (Appendix 8-E). The pit lake did display limited thermal stratification during the winter and summer sampling, with greater stratification in the summer (Figure 8-9). The temperature profiles for the winter and summer sampling showed a greater than 1oC per meter change indicating the presence of a thermocline, as defined by NMED SWQB protocols for lake sampling (NMED SWQB, 2011).
8.1.2.3.5 Modifications to the SAP
As NMCC executed the SAP, adjustments to the proposed SAP were necessary based on the actual site conditions encountered in the field. When making adjustments based on field conditions, NMCC strived to find equivalent or improved alternatives, where possible. Due to the ephemeral nature of the Greenhorn Arroyo Drainage Basin, modifications occurred based on field conditions from the surface water monitoring locations and sampling frequency proposed in the SAP (INTERA, 2010). Many of the springs and seeps originally identified for quarterly monitoring and sampling were also identified as ephemeral in nature and were dry or had very little flow during quarterly monitoring.
Flow measurements were not collected from the three auto-sampler locations along Grayback Arroyo (SWQ-1, SWQ-2, and SWQ-3) (Figure 8-7). In August 2010, the flow at SWQ-3 was estimated to be less than 0.002 cfs, SWQ-2 had standing water with no movement, and SWQ-1 was dry. SWQ-2 was sampled in August 2010 from standing water, and in April 2011, the sediment at SWQ-2 was sampled. Water samples were collected from SWQ-3 in August 2010, November 2010, and April 2011. In addition, one sediment sample was collected from SWQ-3 in April 2011.
Quarterly flow measurements of two springs in the Greenhorn Arroyo Drainage Basin were proposed in the SAP (INTERA, 2010). Both springs, BG and BG-2, were dry during the quarterly monitoring. One seep was identified within the Greenhorn Arroyo Drainage Basin, PWS-1, located on the northwest side of the pit wall. This seep was successfully sampled in August 2010; however, flow was insufficient during the remainder of the monitoring to collect a sample. The flow in August 2010 was estimated to be less than 2.2 x 10⁻⁵ cfs by monitoring the time it took to fill a known volume. Based on a communication with Chris Eustice of MMD (2011), two sediment

New Mexico Copper Corporation Copper Flat Baseline Data Characterization Report
Copper Flat Mine 8-17 Section 8: Surface Water and June 2012 Groundwater Information
samples were collected from Greenhorn Arroyo Drainage Basin near SWQ-2 and SWQ-3 in place of water quality samples (Figure 8-7).
The locations surveyed during the pit lake bathymetry survey in September 2010 deviate from the survey lines proposed in the SAP (INTERA, 2010). Severe wind on the day of the survey made it difficult for the survey crew to keep the boat on the proposed survey lines; however, the crew increased the number of lines traversed across the lake to provide adequate coverage of the depth measurements (Figure 8-8). The deepest point in the pit was marked with a buoy that marked the location for the pit lake water quality samples and the sediment sample (Figure 8-8).
On September 10, 2010, two discrete samples were collected due to a lack of stratification in the pit lake as shown in the lake profile for fall 2010 (Figure 8-9). One composite sample was also collected in September. During the sampling in the remaining quarters, three discrete samples and one composite sample were collected in accordance with the SAP (INTERA, 2010). Although the pit lake did not display a thermocline or chemocline during the April 2011 sampling event, three discrete depth samples were collected, as well as one composite, due to the depth of light penetration estimated by secchi disk transparency (Table 8-7 and Figure 8-9). The SAP (INTERA, 2010) proposed that two discrete samples should be collected in the absence of lake stratification, one in the euphotic zone and one below. During the April 2011 sampling event, light penetrated to within 1 ft of the pit lake bottom and any discrete depth sampling within that 1-ft interval would have been altered by stirring up the lake bottom sediments.
The SAP (INTERA, 2010) called for NMCC to homogenize the entire sediment core and then sample the homogenized sediment for laboratory analysis. Given the stratigraphy of the core observed in the field before homogenization, NMCC instead homogenized only the uppermost 10 inches of sediment to better characterize the sediment that interacts with the water column above. The decision to isolate the interval of 0 (zero) to 10 inches below the sediment-water interface was made solely based on the minimum sample volume required by the laboratory.
8.2 Groundwater
8.2.1 Objective of Baseline Data Collection Program
Pursuant the requirements of Part 13 of 19.10.6.602 NMAC, the objective of the baseline data characterization program for groundwater resources is to describe the water quality and water quantity of the groundwater within the proposed Mine Permit Area and, to the extent practicable, the potentially affected area. These data serve as site-specific and regional background level information to identify reclamation standards and gauge reclamation performance prior to mining operations. There were some modifications to the baseline characterization program described in the SAP; however, the baseline data set includes significant historical data and is more than adequate to achieve the ultimate goal of the program. This robust data-gathering program provides the basis for moving forward with mine permitting and for groundwater and surface water impact assessments.
8.2.2 Regional Hydrogeology
Regional geology (Figure 8-10) includes bedrock units along the western side of the Rio Grande Rift and sediments that filled the rift zone. The Baseline Study Area consists of three major hydrogeologic zones (shown conceptually on Figure 8-11 and in plan view as Figure 8-12):
1. The graben east of the Black Range and west of the Animas Uplift.

New Mexico Copper Corporation Copper Flat Baseline Data Characterization Report
Copper Flat Mine 8-18 Section 8: Surface Water and June 2012 Groundwater Information
2. The Animas Uplift, in which the ore body is located.
3. The Palomas Basin, a sediment-filled basin east of the Animas Uplift in which the mine water supply wells are located. The Palomas Basin lies within the Lower Rio Grande Underground Water (NMOSE administrative) Basin.
The Animas Uplift contains the Copper Flat Mine open pit, excavated in 1982 by Quintana Minerals, which the NMCC proposes to expand. The Project water supply wells are located within the basin on a mesa adjacent to Animas Creek (Figure 8-13). Parts of the waste rock and tailing storage facilities would also be located overlying the western margin of the Palomas Basin within the Mine Permit Area.
The geologic description is adapted from Shomaker (1993), who cites Harley (1934), Hedlund (1975), Dunn (1982), and Seager et al. (1982). Locations of wells and water level measurements are presented with potentiometric surface contours on Figure 8-14. Interpreted contours are shown for (1) bedrock of the Animas Uplift and the pit area, (2) the Santa Fe Group aquifer, and (3) the shallow alluvium along Las Animas Creek. Groundwater levels range from above 5,800 ft amsl at the western edge of the graben to about 4,200 ft amsl at Caballo Lake. Descriptions of each hydrogeologic zone, from west to east, are as follows.
8.2.2.1 Graben West of Animas Uplift
West of the Animas Uplift, between the Uplift and the Black Range, lies a half-graben in which Tertiary-age alluvial fan deposits of the Santa Fe Group overlie Tertiary-age volcanic rocks and Paleozoic-age sedimentary rocks. Dips are eastward, and the half-graben is bounded on the east by normal faults (Figure 8-13). The Santa Fe beds may reach a thickness of 1,000 ft on the east side of the half-graben (Seager et al., 1982).
Local precipitation and runoff from the Black Range provide groundwater recharge to the graben. Discharge occurs mainly as springflow and possibly also as subsurface discharge to the Animas Uplift. Springflow in the Warm Springs drainage discharges as baseflow to Percha Creek. The emergence of water at Warm Springs, at the eastern edge of the graben, demonstrates that the andesite of the Animas Uplift acts as a barrier to flow at depth from the graben. Groundwater in the graben generally flows west to east, but also flows around the low-permeability andesite south toward Percha Creek and north toward Las Animas Creek (Figure 8-14).
The graben (half graben) west of the Animas Uplift is composed of Santa Fe Group sediments and is recharged by runoff from the Black Range. The half graben is bound on the east by normal faults, and the beds dip eastward. Near the eastern edge of the Animas Uplift, groundwater discharges at Warm Springs. The contrast between the chemical makeup of Warm Springs water and that of wells and springs within the Animas Uplift indicates that the source of Warm Springs water is not within the Uplift, as might otherwise be inferred from the relative heads at the spring, and at wells and springs within the Uplift (Newcomer and Finch, 1993). The direction of groundwater flow in the graben is generally west to east, but the low permeability crystalline bedrock aquifer acts as a barrier to groundwater flow from the graben west of the Animas Uplift to the Palomas Basin and forces groundwater flow around the crystalline bedrock through preferential pathways in the carbonate bedrock units of the uplift toward Percha and Animas Creeks.
8.2.2.2 Animas Uplift
The Animas Uplift is an upthrown block bounded by north-to-south-trending faults, ranging from less than 2 to about 4 miles wide (Figure 8-12). The Copper Flat Mine ore body is located within a nearly circular remnant of a Cretaceous-age andesite volcano about 4 miles in diameter that is part of the Animas Uplift. Drilling has shown that the andesite is present to a depth of more than 3,000 ft (Dunn, 1982, p. 314). The andesite is bounded on the north and south by Paleozoic-age limestone, and on the east by the Santa Fe Group sediments of the Palomas Basin. On the west, the andesite body is in fault contact with Paleozoic-age limestones, Tertiary-age
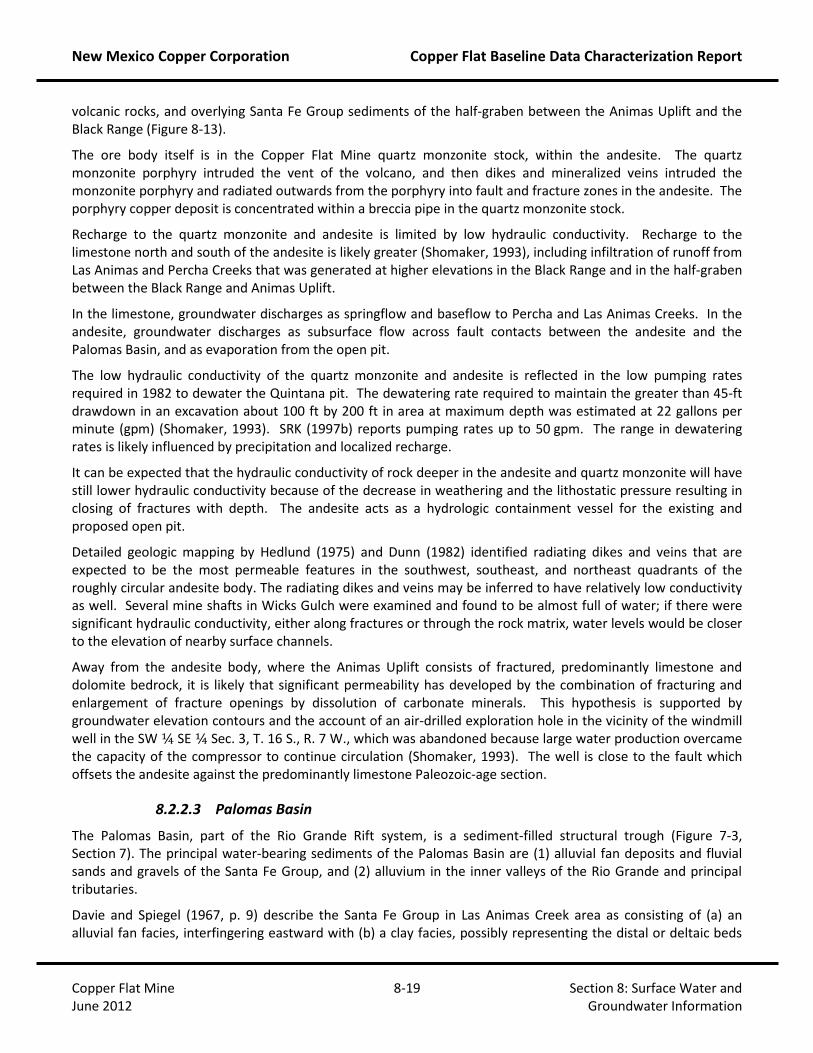
New Mexico Copper Corporation Copper Flat Baseline Data Characterization Report
Copper Flat Mine 8-19 Section 8: Surface Water and June 2012 Groundwater Information
volcanic rocks, and overlying Santa Fe Group sediments of the half-graben between the Animas Uplift and the Black Range (Figure 8-13).
The ore body itself is in the Copper Flat Mine quartz monzonite stock, within the andesite. The quartz monzonite porphyry intruded the vent of the volcano, and then dikes and mineralized veins intruded the monzonite porphyry and radiated outwards from the porphyry into fault and fracture zones in the andesite. The porphyry copper deposit is concentrated within a breccia pipe in the quartz monzonite stock.
Recharge to the quartz monzonite and andesite is limited by low hydraulic conductivity. Recharge to the limestone north and south of the andesite is likely greater (Shomaker, 1993), including infiltration of runoff from Las Animas and Percha Creeks that was generated at higher elevations in the Black Range and in the half-graben between the Black Range and Animas Uplift.
In the limestone, groundwater discharges as springflow and baseflow to Percha and Las Animas Creeks. In the andesite, groundwater discharges as subsurface flow across fault contacts between the andesite and the Palomas Basin, and as evaporation from the open pit.
The low hydraulic conductivity of the quartz monzonite and andesite is reflected in the low pumping rates required in 1982 to dewater the Quintana pit. The dewatering rate required to maintain the greater than 45-ft drawdown in an excavation about 100 ft by 200 ft in area at maximum depth was estimated at 22 gallons per minute (gpm) (Shomaker, 1993). SRK (1997b) reports pumping rates up to 50 gpm. The range in dewatering rates is likely influenced by precipitation and localized recharge.
It can be expected that the hydraulic conductivity of rock deeper in the andesite and quartz monzonite will have still lower hydraulic conductivity because of the decrease in weathering and the lithostatic pressure resulting in closing of fractures with depth. The andesite acts as a hydrologic containment vessel for the existing and proposed open pit.
Detailed geologic mapping by Hedlund (1975) and Dunn (1982) identified radiating dikes and veins that are expected to be the most permeable features in the southwest, southeast, and northeast quadrants of the roughly circular andesite body. The radiating dikes and veins may be inferred to have relatively low conductivity as well. Several mine shafts in Wicks Gulch were examined and found to be almost full of water; if there were significant hydraulic conductivity, either along fractures or through the rock matrix, water levels would be closer to the elevation of nearby surface channels.
Away from the andesite body, where the Animas Uplift consists of fractured, predominantly limestone and dolomite bedrock, it is likely that significant permeability has developed by the combination of fracturing and enlargement of fracture openings by dissolution of carbonate minerals. This hypothesis is supported by groundwater elevation contours and the account of an air-drilled exploration hole in the vicinity of the windmill well in the SW ¼ SE ¼ Sec. 3, T. 16 S., R. 7 W., which was abandoned because large water production overcame the capacity of the compressor to continue circulation (Shomaker, 1993). The well is close to the fault which offsets the andesite against the predominantly limestone Paleozoic-age section.
8.2.2.3 Palomas Basin
The Palomas Basin, part of the Rio Grande Rift system, is a sediment-filled structural trough (Figure 7-3, Section 7). The principal water-bearing sediments of the Palomas Basin are (1) alluvial fan deposits and fluvial sands and gravels of the Santa Fe Group, and (2) alluvium in the inner valleys of the Rio Grande and principal tributaries.
Davie and Spiegel (1967, p. 9) describe the Santa Fe Group in Las Animas Creek area as consisting of (a) an alluvial fan facies, interfingering eastward with (b) a clay facies, possibly representing the distal or deltaic beds
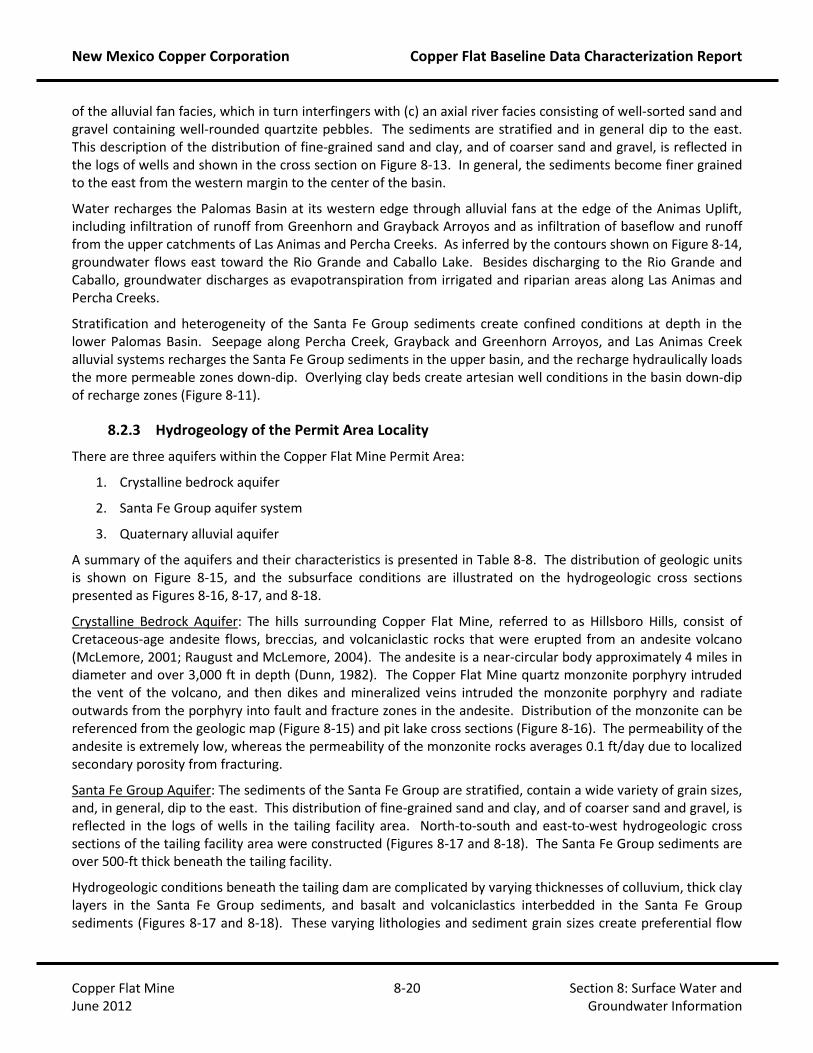
New Mexico Copper Corporation Copper Flat Baseline Data Characterization Report
Copper Flat Mine 8-20 Section 8: Surface Water and June 2012 Groundwater Information
of the alluvial fan facies, which in turn interfingers with (c) an axial river facies consisting of well-sorted sand and gravel containing well-rounded quartzite pebbles. The sediments are stratified and in general dip to the east. This description of the distribution of fine-grained sand and clay, and of coarser sand and gravel, is reflected in the logs of wells and shown in the cross section on Figure 8-13. In general, the sediments become finer grained to the east from the western margin to the center of the basin.
Water recharges the Palomas Basin at its western edge through alluvial fans at the edge of the Animas Uplift, including infiltration of runoff from Greenhorn and Grayback Arroyos and as infiltration of baseflow and runoff from the upper catchments of Las Animas and Percha Creeks. As inferred by the contours shown on Figure 8-14, groundwater flows east toward the Rio Grande and Caballo Lake. Besides discharging to the Rio Grande and Caballo, groundwater discharges as evapotranspiration from irrigated and riparian areas along Las Animas and Percha Creeks.
Stratification and heterogeneity of the Santa Fe Group sediments create confined conditions at depth in the lower Palomas Basin. Seepage along Percha Creek, Grayback and Greenhorn Arroyos, and Las Animas Creek alluvial systems recharges the Santa Fe Group sediments in the upper basin, and the recharge hydraulically loads the more permeable zones down-dip. Overlying clay beds create artesian well conditions in the basin down-dip of recharge zones (Figure 8-11).
8.2.3 Hydrogeology of the Permit Area Locality
There are three aquifers within the Copper Flat Mine Permit Area:
1. Crystalline bedrock aquifer
2. Santa Fe Group aquifer system
3. Quaternary alluvial aquifer
A summary of the aquifers and their characteristics is presented in Table 8-8. The distribution of geologic units is shown on Figure 8-15, and the subsurface conditions are illustrated on the hydrogeologic cross sections presented as Figures 8-16, 8-17, and 8-18.
Crystalline Bedrock Aquifer: The hills surrounding Copper Flat Mine, referred to as Hillsboro Hills, consist of Cretaceous-age andesite flows, breccias, and volcaniclastic rocks that were erupted from an andesite volcano (McLemore, 2001; Raugust and McLemore, 2004). The andesite is a near-circular body approximately 4 miles in diameter and over 3,000 ft in depth (Dunn, 1982). The Copper Flat Mine quartz monzonite porphyry intruded the vent of the volcano, and then dikes and mineralized veins intruded the monzonite porphyry and radiate outwards from the porphyry into fault and fracture zones in the andesite. Distribution of the monzonite can be referenced from the geologic map (Figure 8-15) and pit lake cross sections (Figure 8-16). The permeability of the andesite is extremely low, whereas the permeability of the monzonite rocks averages 0.1 ft/day due to localized secondary porosity from fracturing.
Santa Fe Group Aquifer: The sediments of the Santa Fe Group are stratified, contain a wide variety of grain sizes, and, in general, dip to the east. This distribution of fine-grained sand and clay, and of coarser sand and gravel, is reflected in the logs of wells in the tailing facility area. North-to-south and east-to-west hydrogeologic cross sections of the tailing facility area were constructed (Figures 8-17 and 8-18). The Santa Fe Group sediments are over 500-ft thick beneath the tailing facility.
Hydrogeologic conditions beneath the tailing dam are complicated by varying thicknesses of colluvium, thick clay layers in the Santa Fe Group sediments, and basalt and volcaniclastics interbedded in the Santa Fe Group sediments (Figures 8-17 and 8-18). These varying lithologies and sediment grain sizes create preferential flow

New Mexico Copper Corporation Copper Flat Baseline Data Characterization Report
Copper Flat Mine 8-21 Section 8: Surface Water and June 2012 Groundwater Information
paths and barriers to groundwater flow. The preferential flow paths are primarily related to coarser-grained colluvium and Santa Fe Group sediments. There appears to be a north-to-south-trending fault that acts as a barrier to groundwater flow east of the tailing impoundment dam (Figures 8-17 and 8-18).
The direction of groundwater flow is from west to east, except in the vicinity of the Copper Flat Mine pit lake where a hydrologic sink exists due to evaporative losses. Regional groundwater elevation contours are shown on Figure 8-14, and a close-up of groundwater contours around the pit lake is illustrated in Figure 8-19. The groundwater elevation contours indicate groundwater flows from the andesite to the alluvium and Santa Fe Group sediments.
Quaternary Alluvial Aquifer: Within the Mine Permit Area, the principal water-bearing sediments east of the andesite are (1) alluvial fan deposits and fluvial sands and gravels of the Santa Fe Group, and (2) saturated alluvium in the principal drainages. Alluvium is found east of the Copper Flat Mine in Grayback Arroyo and primarily consists of sand and gravel. Thickness of the alluvium ranges between 5 and 50 ft. Alluvium may be locally and seasonally saturated north of the tailing impoundment and downgradient of the waste rock piles along Grayback Arroyo.
8.2.4 Groundwater Data
Groundwater data described in this section are organized according to the three primary aquifers present within the Mine Permit Area and surrounding Baseline Study Area. For each aquifer, water quality, water level, and aquifer characteristics are described using those data collected on behalf of NMCC according to the SAP (INTERA, 2010), and existing data collected by previous operators that either mined the Mine Permit Area or worked on permit applications to mine the Mine Permit Area.
8.2.4.1 Crystalline Bedrock Aquifer
Groundwater is present within the crystalline rocks that constitute much of the western portion of the Mine Permit Area (Figure 8-12). Though the rocks themselves have practically no inter-granular permeability, faulting and jointing of the monzonite have created locally permeable zones through which water can move. Several groundwater wells within the crystalline rocks were studied as part of NMCC’s baseline program that provide information used to characterize the water quality and water levels within the crystalline rocks (Figure 8-20). Water level elevations were measured in nine wells (Table 8-9) and water quality samples were collected from six wells within this aquifer (Table 8-10). In addition, an open pit partially filled with water, excavated in 1982 by Quintana Minerals Corp. (a previous operator of the Mine Permit Area), exists within the crystalline rocks and provides another observation point for water quality and water level elevations. The pit lake is described further in this section with respect to the lake’s effects on groundwater quality and containment.
8.2.4.1.1 Historical Data
Groundwater levels have been measured in wells or piezometers screened in the crystalline bedrock since the early 1980s in support of previous mine permitting efforts. The oldest groundwater quality sample of water quality conditions for the crystalline bedrock aquifer comes from the Pague well (Figure 8-21), a 3.4’ x 5’, rock-lined, hand-dug well with a windmill that is currently non-operational. A sample collected on August 20, 1946, approximately ten years after the well was constructed, was analyzed for nine chemical constituents. These data provide a historical baseline for select constituents prior to implementation of formal sampling programs in the 1980s and 1990s that were part of mine permitting activities. Historical data from wells screened in the crystalline bedrock aquifer come from water supply and monitoring wells available at the time (see Table 8-11

New Mexico Copper Corporation Copper Flat Baseline Data Characterization Report
Copper Flat Mine 8-22 Section 8: Surface Water and June 2012 Groundwater Information
for historical water quality results). Historical groundwater level and water quality data from crystalline bedrock are summarized in SRK (1995) and BLM (1999).
During the preparation of the PFEIS by Alta Gold (BLM, 1999), the last attempt to permit the mine property, the historical data were used to construct groundwater elevation contour maps that showed a general flow of groundwater from west/northwest to east/southeast (Figure 3-12 in BLM, 1999). As summarized in BLM (1999), there appeared to be a difference in the groundwater geochemistry in wells upgradient of the pit versus those wells located downgradient of the pit. Using data from wells GWQ-4 and GWQ96-22 A and B (Figure 8-21), the authors described water upgradient of the pit as sodium-sulfate dominated at shallow depths and sodium-calcium-bicarbonate dominated at greater depths (BLM, 1999).
Data collected in 1981 from wells downgradient of the ore body by Sergent, Hauskins, and Beckwith (SHB) showed that groundwater in the GWQ-5 (Table 8-11; Figure 8-21), a well located east-southeast of the pit lake in Grayback Arroyo, had a pH value of 7.3, a TDS of 1,260 mg/L, sulfate of 575 mg/L, and bicarbonate of 398 mg/L. GWQ-6, which is located approximately 2,000 ft farther to the southeast of GWQ-5 (Figure 8-21), was more calcium-sodium-magnesium-bicarbonate dominated with a pH of 7.3 and concentrations as follows: 420 mg/L TDS, <50 mg/L sulfate, and about 300 mg/L bicarbonate (Table 8-11). GWQ-5 was a 20-ft deep rock-lined hand dug well (SHB, 1981) that was buried during the Quintana mining operations. When compared to data from the 1990s from another set of nested wells downgradient of the pit lake, GWQ96-23A (shallow) and GWQ96-23B (deep), water chemistry also showed that sulfate exceeded bicarbonate in both the shallow and deep wells. Groundwater chemistry from GWQ-5 likely represented shallow groundwater originating from the Copper Flat area that was influenced by the oxidation of the ore body prior to open pit mining, where the other crystalline bedrock wells (GWQ-6 and GWQ96-23[A,B]) exhibit groundwater chemistry not affected by oxidation of sulfides in the ore body.
Water quality data from two wells, GWQ96-22A and GWQ96-23A, were used to statistically evaluate and compare historical water quality data with baseline water quality data collected for the NMCC baseline program. Summary statistics for historical data (pre 2010) for a given well and a selected constituent were compared to summary statistics of populations for a given constituent and a well that represent data collected from January 2010 through May 2011 as part of the NMCC baseline program. Wells GWQ96-22A and GWQ96-23A were selected for the comparison of data sets representing historical and present baseline conditions for the crystalline bedrock aquifer because these wells have the most observations (Table 8-11).
Using Statistica ProUCL, descriptive statistics for GWQ96-22A and GWQ96-23A were generated for chloride, copper, sulfate, and TDS. These constituents were selected because they were most consistently collected throughout the history of the mine for all studied wells (Table 8-11). Descriptive statistics for historical data are presented in Table 8-12. The results of identical statistics and tests for baseline data collected as part of the NMCC baseline program are presented in Table 8-13. A comparison of summary statistics for historical and baseline data collected for the NMCC program is presented in Table 8-14. The comparison of the means, upper confidence levels, and distribution of data sets (Table 8-14) shows that the addition of baseline data to the historical data set does not significantly change the data set. Therefore, these historical data can be used in conjunction with baseline data to characterize water quality conditions of the crystalline bedrock aquifer.
In addition to evaluating historical water quality, water level measurements from wells GWQ96-22(A and B) and GWQ96-23(A and B) were used to examine the effects of the pit lake on the groundwater flow. As summarized in BLM (1999), the authors conclude that the pit lake behaves as an evaporative sump (see Section 8.1.2.3.4 for additional discussion of current conditions).

New Mexico Copper Corporation Copper Flat Baseline Data Characterization Report
Copper Flat Mine 8-23 Section 8: Surface Water and June 2012 Groundwater Information
8.2.4.1.2 Data Gaps Addressed
The absence of comparable water level measurements from groundwater monitoring wells in the area of the pit lake coupled with contemporaneous pit lake water level measurements prevented previous operators and applicants from clearly and defensibly demonstrating the pit lake water balance and hydraulic regime. Without these synchronous data from a sufficient number of wells that were positioned to evaluate the pit lake hydraulic behavior, the groundwater flow direction in the area of the pit lake could not be definitively determined.
To address this data gap, NMCC installed two additional nested piezometers in 2011, GWQ11-24(A,B) located south of the pit lake and GWQ11-25(A,B) located north of the pit lake (Figure 8-19). The four nested piezometers around the pit provide the data needed to prove the pit lake is a hydrologic sink (Figure 19, Tables 8-9 and 8-17).
8.2.4.1.3 Well Selection Rationale
Wells screened in the crystalline bedrock aquifer were selected based on the availability of well construction details and geographic distribution. Though several wells draw water from the crystalline bedrock aquifer on the Mine Permit Area and adjacent to the Mine Permit Area, the absence of construction details for many of the wells eliminated them from use in the baseline program. Wells GWQ96-22A and GWQ96-23A were selected for the program because well construction details were available; the wells draw water from only the crystalline bedrock aquifer. One is located upgradient of the pit lake (GWQ96-22 A), and one is located downgradient of the pit lake (GWQ96 23 A). In addition to these wells that were originally proposed as part of the SAP (INTERA, 2010), samples or water level measurements from private wells owned by Pitchfork Ranch (GWQ-4, LRG-04153, LRG-04158, and LRG-04159) were collected to help characterize regional conditions as these wells are located within the crystalline bedrock aquifer upgradient of the Mine Permit Area. If the wellhead construction permitted the opportunity for collecting water level measurements or water quality samples, then those data were collected from these existing wells.
Wells EIW, Pague, Delores, GWQ-5, and GWQ-6 were not included in the NMCC baseline characterization program because of the absence of well construction details, and, in the case of GWQ-5, because it was abandoned and covered. EIW is an injection well and its construction does not permit gauging or sampling. Well logs are not available for GWQ-5 and GWQ-6, which introduced some uncertainty about whether the wells could be rehabilitated and whether a representative sample could be collected to characterize water chemistry conditions. Similarly, the absence of well construction details and the poor condition of the Pague and Delores wells, both located to the north of the pit lake, presented concern regarding the ability to collect representative samples. As a result, these wells were not adopted as part of the monitoring program. NMCC has replaced GWQ-5 with a new well (GWQ-5R) located approximately 500 ft to the east of GWQ-5.
The rationale for the locations and depths for drilling additional nested piezometers on the north and south sides of the pit lake were based on proximity to the pit lake, land owned by NMCC, and geologic observations. Nested piezometers GWQ11-24(A,B) and GWQ11-25(A,B) were drilled, constructed, and tested for aquifer properties in 2011. The placement of screen intervals was based on observed fracture density and groundwater during the drilling process. Additional details can be referenced from the NMCC Stage 1 Abatement Plan Amendment (JSAI, 2011).
8.2.4.1.4 Modifications to the SAP
As NMCC executed the SAP, adjustments to the proposed SAP were necessary based on the actual site conditions encountered in the field. When making adjustments based on field conditions, NMCC strived to find equivalent or improved alternatives, where possible. Overall, more wells screened in the crystalline bedrock
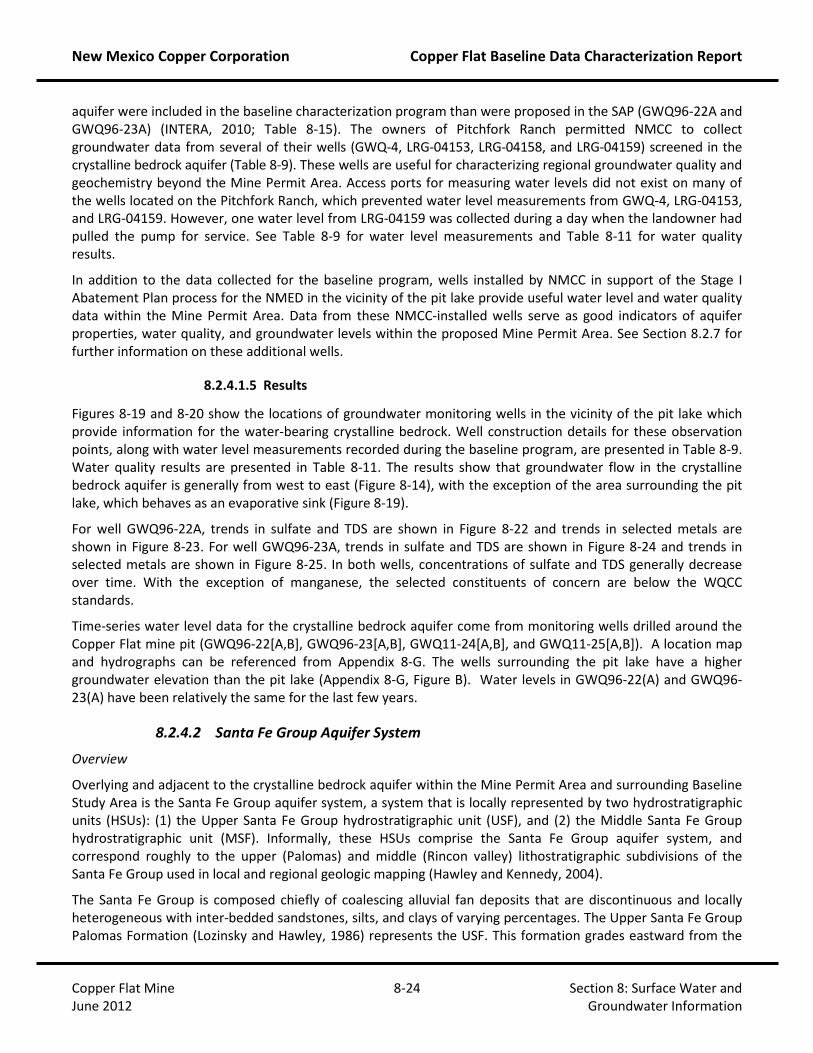
New Mexico Copper Corporation Copper Flat Baseline Data Characterization Report
Copper Flat Mine 8-24 Section 8: Surface Water and June 2012 Groundwater Information
aquifer were included in the baseline characterization program than were proposed in the SAP (GWQ96-22A and GWQ96-23A) (INTERA, 2010; Table 8-15). The owners of Pitchfork Ranch permitted NMCC to collect groundwater data from several of their wells (GWQ-4, LRG-04153, LRG-04158, and LRG-04159) screened in the crystalline bedrock aquifer (Table 8-9). These wells are useful for characterizing regional groundwater quality and geochemistry beyond the Mine Permit Area. Access ports for measuring water levels did not exist on many of the wells located on the Pitchfork Ranch, which prevented water level measurements from GWQ-4, LRG-04153, and LRG-04159. However, one water level from LRG-04159 was collected during a day when the landowner had pulled the pump for service. See Table 8-9 for water level measurements and Table 8-11 for water quality results.
In addition to the data collected for the baseline program, wells installed by NMCC in support of the Stage I Abatement Plan process for the NMED in the vicinity of the pit lake provide useful water level and water quality data within the Mine Permit Area. Data from these NMCC-installed wells serve as good indicators of aquifer properties, water quality, and groundwater levels within the proposed Mine Permit Area. See Section 8.2.7 for further information on these additional wells.
8.2.4.1.5 Results
Figures 8-19 and 8-20 show the locations of groundwater monitoring wells in the vicinity of the pit lake which provide information for the water-bearing crystalline bedrock. Well construction details for these observation points, along with water level measurements recorded during the baseline program, are presented in Table 8-9. Water quality results are presented in Table 8-11. The results show that groundwater flow in the crystalline bedrock aquifer is generally from west to east (Figure 8-14), with the exception of the area surrounding the pit lake, which behaves as an evaporative sink (Figure 8-19).
For well GWQ96-22A, trends in sulfate and TDS are shown in Figure 8-22 and trends in selected metals are shown in Figure 8-23. For well GWQ96-23A, trends in sulfate and TDS are shown in Figure 8-24 and trends in selected metals are shown in Figure 8-25. In both wells, concentrations of sulfate and TDS generally decrease over time. With the exception of manganese, the selected constituents of concern are below the WQCC standards.
Time-series water level data for the crystalline bedrock aquifer come from monitoring wells drilled around the Copper Flat mine pit (GWQ96-22[A,B], GWQ96-23[A,B], GWQ11-24[A,B], and GWQ11-25[A,B]). A location map and hydrographs can be referenced from Appendix 8-G. The wells surrounding the pit lake have a higher groundwater elevation than the pit lake (Appendix 8-G, Figure B). Water levels in GWQ96-22(A) and GWQ96-23(A) have been relatively the same for the last few years.
8.2.4.2 Santa Fe Group Aquifer System
Overview
Overlying and adjacent to the crystalline bedrock aquifer within the Mine Permit Area and surrounding Baseline Study Area is the Santa Fe Group aquifer system, a system that is locally represented by two hydrostratigraphic units (HSUs): (1) the Upper Santa Fe Group hydrostratigraphic unit (USF), and (2) the Middle Santa Fe Group hydrostratigraphic unit (MSF). Informally, these HSUs comprise the Santa Fe Group aquifer system, and correspond roughly to the upper (Palomas) and middle (Rincon valley) lithostratigraphic subdivisions of the Santa Fe Group used in local and regional geologic mapping (Hawley and Kennedy, 2004).
The Santa Fe Group is composed chiefly of coalescing alluvial fan deposits that are discontinuous and locally heterogeneous with inter-bedded sandstones, silts, and clays of varying percentages. The Upper Santa Fe Group Palomas Formation (Lozinsky and Hawley, 1986) represents the USF. This formation grades eastward from the

New Mexico Copper Corporation Copper Flat Baseline Data Characterization Report
Copper Flat Mine 8-25 Section 8: Surface Water and June 2012 Groundwater Information
Animas Uplift from coarse alluvial fan material to braided stream and deltaic sands and silts to clays near the Rio Grande. The inter-fingering with clays begins approximately 3 to 5 miles west of the current position of the Rio Grande and is responsible for the flowing wells common in this part of the Baseline Study Area (Murray, 1959; Figure 8-13). A basalt flow dated at 4.2 million years before present caps the Palomas Formation gravels near Copper Flat (Seager et al., 1984). The majority of the Santa Fe Group aquifer water supply and monitoring wells in the Baseline Study Area are completed in the USF.
The Middle Santa Fe Group Rincon Valley Formation (Seager and Hawley, 1973) is exposed near Hillsboro, New Mexico, where the reddish-brown clays and clayey silts characteristic of this basal unit are interbedded with basalts dated at 28 million years before present (Seager et al., 1984). The Rincon Valley Formation lacustrine red clays underlie the Palomas Formation and thicken southward toward Hatch, New Mexico, and the Rincon Basin (Wilson et al., 1981).
Tailing Dam Vicinity
The present tailing impoundment facility overlies the old placer workings between Grayback Arroyo and Hunkidori Gulch. Geologic cross sections from west-east and north-south are presented in Figures 8-17 and Figure 8-18, respectively. A study of these placer workings by Segerstrom and Antweiler (1975) showed that the placers were found in paleo-stream terrace alluvium approximately 25- to 30-ft thick that is underlain by a petrocalcic horizon and reddish-brown clay. SRK (1995) and SHB (1980) investigated the areal extent of this reddish-brown clay layer. According to the studies completed by SRK and SHB, the clay layer and the 25 to 30 ft of alluvium that lie above the clay have acted to impede downward migration of water draining from the eastern half of the existing tailings. A groundwater mound was created by seepage from the tailings, as evidenced in some tailing dam monitor wells completed above the clay layer. East of the inferred location of a fault (Figure 8-17) that was described by Seager et al. (1982), the USF thins. The hydraulic gradient in this area ranges from about 250 ft/mile immediately east of the tailing facility to about 100 ft/mile farther to the east (Figure 8-14). An investigation of the eastward extent of the groundwater mound is proposed for the Stage 1 Abatement Plan.
Production Wellfield Vicinity
Farther to the east, the hydraulic gradient decreases from 250 ft/mile to less than 50 ft/mile in the vicinity of the production wellfield (identified as PW wells on Figure 8-26), located about 8 miles from the Mine Permit boundary. This suggests a progressive increase in transmissivity toward the area of the production wellfield. The transmissivity of the USF in the production wellfield area ranges from about 17,000 to 20,000 ft2/day. Farther to the east, towards Caballo Reservoir, sands and gravels in the Santa Fe Group are interbedded with clays of the ancient Rio Grande. As a consequence, the transmissivity likely decreases slightly and the hydraulic gradient slightly increases (Figure 8-14). In this area just west of Caballo Reservoir, the USF appears to be confined, leading to artesian flow in wells along the lower reaches of both Las Animas Creek and Percha Creek (Figure 8-14). See Section 8.2.4.4 for additional information on artesian wells.
Groundwater gradients strongly suggest that water flows from the Santa Fe Group aquifer system to the floodplain alluvium of the Rio Grande.
8.2.4.2.1 Historical Data
Historical water quality data for chloride, copper, sulfate, and TDS from wells in the area of the tailing impoundment (IW-2, MW-6, NP-1, and NP-3) were used to statistically evaluate and compare historical water quality data with baseline water quality data collected for the NMCC baseline program. These constituents have been analyzed most continuously over the period of study (Table 8-11). Of the numerous wells in the Santa Fe

New Mexico Copper Corporation Copper Flat Baseline Data Characterization Report
Copper Flat Mine 8-26 Section 8: Surface Water and June 2012 Groundwater Information
Group aquifer system, these wells represent the only observation points which contained sufficient data to calculate meaningful statistics (Table 8-11). Following the same method described in Section 8.2.4.1.1, summary statistics were prepared for historical data collected before 2010 (Table 8-12) and baseline data collected between July 2010 through May 2011 (Table 8-13). These two data sets were compared (Table 8-14) to determine whether the addition of historical data to the baseline data significantly changed the overall data set. The comparison of the means, upper confidence levels, and distribution of data sets which contained sufficient data to calculate meaningful statistics (Table 8-14) shows that the addition of baseline data to the historical data set does not significantly change the data set. As a result, these historical data are used to characterize water quality conditions of the Santa Fe Group aquifer system, helping to extend the data set for the aquifer in the area of both the tailing dam facility to the 1980s and in the vicinity of the Production well field to 1975. Hydrographs for wells in the Santa Fe Group aquifer that are monitored by the USGS are provided in Appendix 8-G.
Pumping and specific capacity tests were performed on mine supply wells MW-4 (Water Development Corporation, 1975), GWQ-1 (Water Development Corporation, 1980), GWQ-7 (W.K. Summers & Associates, 1981), and GWQ-9 (Water Development Corporation, 1980). All of these wells are in the vicinity of the tailing impoundment. A summary of the hydraulic properties derived from the wells tested in the tailing impoundment area is listed in Table 8-16.
In 1994, Adrian Brown Consultants performed a 76-hour, constant rate pumping test on GWQ94-17 (inset, Figure 8-21), which is located below the tailing impoundment (ABC, 1996d). Neighboring monitoring wells were used as observation wells during the pumping test. The pumping well, GWQ94-17, was pumped at a rate of 23 gpm. The water levels in the pumping and observation wells never fully recovered to the pre-pumping level, indicating possible boundary effects from dewatering the groundwater mound observed beneath the tailing dam (JSAI, 2011).
Transmissivity of the Santa Fe Group aquifer derived from pumping tests of the NMCC water supply wells PW-1, 2, 3, and 4 (Figure 8-21)(Green and Halpenny, 1976) averages about 20,000 ft2/day. PW-2 was pumped at 2,020 gpm for 72 hours in January 1976. Water level drawdown and recovery were measured at observation wells PW-1 and MW-5 (Figure 8-27). Aquifer transmissivity was estimated at about 20,000 ft2/day by matching the solution of Theis (1938) to measured drawdown and recovery at PW-1 and MW-5, and to measured recovery at the pumping well PW-2. PW-1 was pumped at 1,500 gpm for 70 hours in December 1975, and water level drawdown and recovery were measured at observation well MW-5. Aquifer transmissivity of about 17,000 ft2/day was estimated by matching the solution of Theis (1938) to measured drawdown and recovery at MW-5, and to measured recovery at the pumping well PW-1.
8.2.4.2.2 Data Gaps Addressed
The need for water level measurements from wells located to the east of the Mine Permit Area (Figure 8-20) was identified as a data gap during the previous mine-permitting attempt made by Alta Gold in the 1990s (DBS&A, 1998). These data are useful for evaluating a pre-mining potentiometric surface for the Santa Fe Group aquifer system. As the basis for evaluating potential impacts from mine dewatering and pumping from the production well field, these water level data are critical to the baseline characterization program. Where access was permitted, wells screened in the Santa Fe Group aquifer system located to the east of the Mine Permit Area were included in the baseline data program for measuring water levels to fill data gaps identified in previous permitting attempts for the Mine Permit Area (DBS&A, 1998). Table 8-9 presents those water levels collected during the baseline data program. The distribution of these wells is presented in Figure 8-20. In December 2011, NMCC conducted regional groundwater level measurements in 22 wells to support the regional groundwater model. Table 8-17 presents the water level data and Figure 8-14 presents a regional potentiometric surface map based on the December 2011 regional water level measurements.
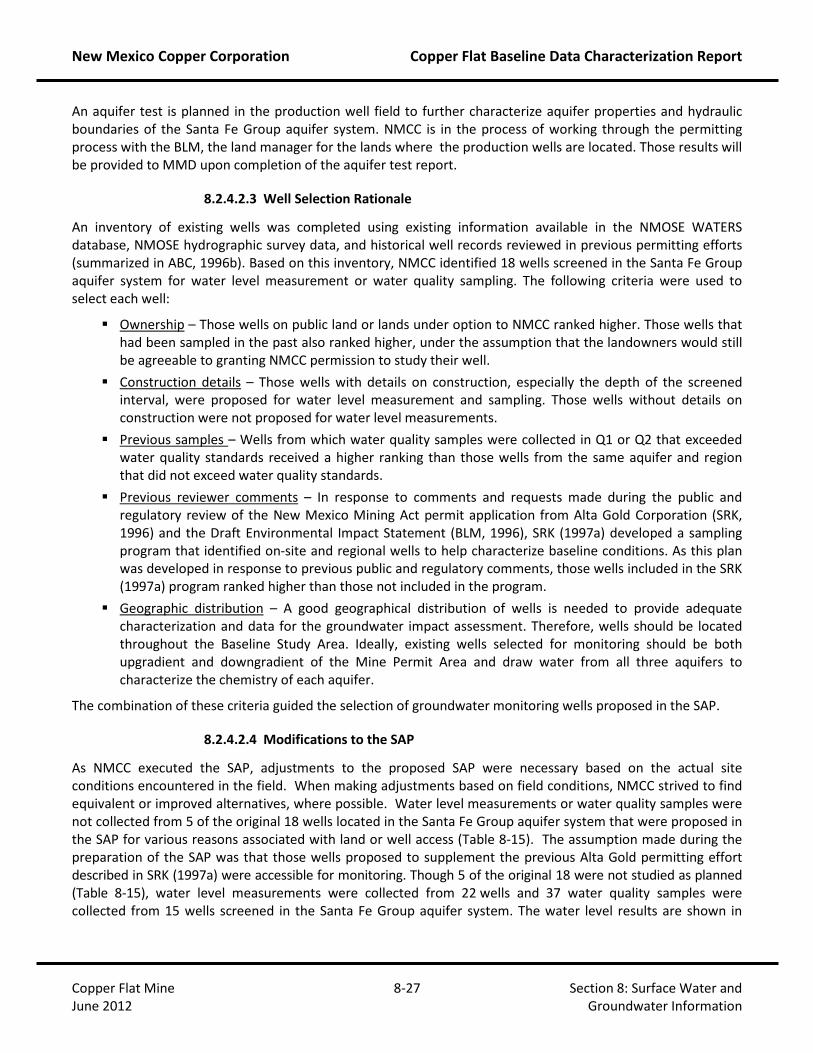
New Mexico Copper Corporation Copper Flat Baseline Data Characterization Report
Copper Flat Mine 8-27 Section 8: Surface Water and June 2012 Groundwater Information
An aquifer test is planned in the production well field to further characterize aquifer properties and hydraulic boundaries of the Santa Fe Group aquifer system. NMCC is in the process of working through the permitting process with the BLM, the land manager for the lands where the production wells are located. Those results will be provided to MMD upon completion of the aquifer test report.
8.2.4.2.3 Well Selection Rationale
An inventory of existing wells was completed using existing information available in the NMOSE WATERS database, NMOSE hydrographic survey data, and historical well records reviewed in previous permitting efforts (summarized in ABC, 1996b). Based on this inventory, NMCC identified 18 wells screened in the Santa Fe Group aquifer system for water level measurement or water quality sampling. The following criteria were used to select each well:
Ownership – Those wells on public land or lands under option to NMCC ranked higher. Those wells that had been sampled in the past also ranked higher, under the assumption that the landowners would still be agreeable to granting NMCC permission to study their well.
Construction details – Those wells with details on construction, especially the depth of the screened interval, were proposed for water level measurement and sampling. Those wells without details on construction were not proposed for water level measurements.
Previous samples – Wells from which water quality samples were collected in Q1 or Q2 that exceeded water quality standards received a higher ranking than those wells from the same aquifer and region that did not exceed water quality standards.
Previous reviewer comments – In response to comments and requests made during the public and regulatory review of the New Mexico Mining Act permit application from Alta Gold Corporation (SRK, 1996) and the Draft Environmental Impact Statement (BLM, 1996), SRK (1997a) developed a sampling program that identified on-site and regional wells to help characterize baseline conditions. As this plan was developed in response to previous public and regulatory comments, those wells included in the SRK (1997a) program ranked higher than those not included in the program.
Geographic distribution – A good geographical distribution of wells is needed to provide adequate characterization and data for the groundwater impact assessment. Therefore, wells should be located throughout the Baseline Study Area. Ideally, existing wells selected for monitoring should be both upgradient and downgradient of the Mine Permit Area and draw water from all three aquifers to characterize the chemistry of each aquifer.
The combination of these criteria guided the selection of groundwater monitoring wells proposed in the SAP.
8.2.4.2.4 Modifications to the SAP
As NMCC executed the SAP, adjustments to the proposed SAP were necessary based on the actual site conditions encountered in the field. When making adjustments based on field conditions, NMCC strived to find equivalent or improved alternatives, where possible. Water level measurements or water quality samples were not collected from 5 of the original 18 wells located in the Santa Fe Group aquifer system that were proposed in the SAP for various reasons associated with land or well access (Table 8-15). The assumption made during the preparation of the SAP was that those wells proposed to supplement the previous Alta Gold permitting effort described in SRK (1997a) were accessible for monitoring. Though 5 of the original 18 were not studied as planned (Table 8-15), water level measurements were collected from 22 wells and 37 water quality samples were collected from 15 wells screened in the Santa Fe Group aquifer system. The water level results are shown in

New Mexico Copper Corporation Copper Flat Baseline Data Characterization Report
Copper Flat Mine 8-28 Section 8: Surface Water and June 2012 Groundwater Information
Table 8-9 and water quality results are shown in Table 8-11. The wells studied in addition to those wells identified in the SAP were selected based on the criteria identified in the previous section.
8.2.4.2.5 Results
Water level measurements are presented in Table 8-9. Based on these water level data, groundwater flow in the Santa Fe Group aquifer is generally from west to east (Figure 8-14). Results from water quality analyses are presented in Table 8-11. Trends in concentrations in sulfate and TDS, two constituents of concern to the NMED, generally increase over time for wells NP-2 (Figure 8-28), NP-3 (Figure 8-29), and NP-4 (Figure 8-30). Additional analyses of these data are provided in the Stage 1 Abatement Plan.
Time series water level data for the Santa Fe Group aquifer can be divided into (1) the tailing impoundment area, and (2) the Palomas Basin region between Animas and Percha Creeks. A description of the time series water level data sources, table of data for wells with time series water level data, a location map, and hydrographs can be referenced from Appendix 8-G and Figure 8-31.
Water levels beneath the Copper Flat tailing impoundment significantly rose during Quintana Minerals operation in 1983 (see the hydrograph for monitoring wells NP-1 through NP-5 and GWQ-12 presented as Appendix 8-G, Figures C and D). The water level rise beneath the tailings impoundment is the result of a groundwater mound created by infiltration at the tailings dam, low-permeability sediments in the Santa Fe Group aquifer, and the north-to-south-trending fault approximately 800 ft east of the tailing impoundment. The fault acts as a barrier to groundwater flow. Groundwater elevations in the tailing impoundment area have not significantly changed over the last 20 years (1990 to 2010).
Water level data from Copper Flat Mine production well PW-1 and neighboring monitoring wells MW-5, MW-9, and MW-10 provide good information for assessing water level trends in the vicinity of the production wells proposed for New Mexico Copper operations. Monitoring wells MW-9, MW-10, and MW-11 are in Animas Creek Valley and the production wells and MW-5 are located on the mesa between Animas Creek Valley and Grayback Arroyo. Since the early 1990s, a water level decline of approximately 0.5 ft/year is observed from PW-1, MW-9, and MW-10 (Appendix 8-G, Figure E). In Las Animas Creek, downstream of MW-9 and MW-10, well 15S5W29 has not shown a defined water level trend (Appendix 8-G, Figure F).
The USGS has maintained several Santa Fe Group aquifer water level data monitoring points in the baseline data study area (Appendix 8-G, Figure A). Mine wells MW-2, MW-5, MW-6, and MW-8 have data points that span several decades. Each of these monitoring points shows a different water level trend (Appendix 8-G, Figures G through J), suggesting the aquifer system is highly dynamic and influenced by climate and geologic complexity rather than groundwater diversions. For example, MW-2 has shown a groundwater elevation decline of 50 ft over the last 20 years (Appendix 8-G, Figure G) in an area where there is no significant pumping, and MW-6 has shown a groundwater elevation rise of 150 ft over the last 30 years (Appendix 8-G, Figure I). MW-6 is located next to a fault mapped in the Santa Fe Group aquifer. Well 16S6W24 is located in Percha Creek upstream of the artesian zone (Appendix 8-G, Figure A) and exhibits an over 30-ft change in groundwater elevation with no particular trend (Appendix 8-G, Figure K).
8.2.4.3 Quaternary Alluvium
The uppermost aquifer in the Baseline Study Area is the Quaternary alluvial aquifer, which is composed of channel and floodplain gravels, sands, and silts. Minton (1961) describes exploratory drilling from shallow water resources in area of Ladder Ranch. Later, Davie and Spiegel (1967) summarized their early work on understanding the shallow wells that develop groundwater of the alluvial aquifer within Las Animas Creek Drainage Basin. The authors provide water level contour maps that delineate water levels in the alluvium for the

New Mexico Copper Corporation Copper Flat Baseline Data Characterization Report
Copper Flat Mine 8-29 Section 8: Surface Water and June 2012 Groundwater Information
fall of 1966 as well as a cross section of the alluvial aquifer in and along Las Animas Creek. Logs from wells drilled along Las Animas and Percha Creeks indicate that upper alluvial gravels extend from the surface to a depth of approximately 20 to 60 ft depending on the location along the creek (BLM, 1999; NMOSE files). There are fewer data available for the thickness of these deposits in the lower portion of Greenhorn Arroyo.
The alluvial aquifer in Las Animas Creek Drainage Basin consists of local alluvial deposits adjacent to and underlying Las Animas Creek. Groundwater in this narrow, sinuous aquifer is in direct hydraulic communication with Las Animas Creek surface water. Surface water in the creek and groundwater in the aquifer form a single surface-to-groundwater flow system. Surface water flow from one location to the next may be related, in part, to the proportion of total system flow being carried by the aquifer at each location. Along its course, Las Animas alluvial aquifer receives recharge by rainfall infiltration. Discharge from the aquifer occurs through evaporation and evapotranspiration from riparian vegetation and existing well pumping. A detailed seepage investigation of the drainage was conducted in June 2011 (Appendix 8-B), which characterizes the complexity of the gaining and loosing reaches of Las Animas Creek. Based on this information coupled with a survey of artesian wells described in Section 8.2.4.4., a cross section along the axis of the creek (Figure 8-32) is presented in Figure 8-33 that shows groundwater elevations, including a zone where the alluvial aquifer is perched above the Santa Fe Group aquifer system. At Caballo Reservoir, all water in Las Animas surface/groundwater system discharges to the reservoir.
Similar to the Las Animas Drainage Basin, the alluvial aquifer in both the Percha Creek and Greenhorn Arroyo Drainage Basins consists of local alluvial deposits adjacent to and underlying drainage channels that are stratigraphically above or adjacent to Santa Fe Group sedimentary rocks and sediments. The extent of the alluvial aquifer is shown in Figure 8-12. Flowing wells identified in NMOSE (2000) and in Figure 8-32 also exist within the vicinity of Caballo Reservoir. Further information on the artesian well survey is presented in Section 8.2.4.4.
8.2.4.3.1 Historical Data
During a previous effort by Alta Gold Co. to permit the Mine Permit Area in the 1990s, MW-11 was drilled as an observation point into the Quaternary alluvial aquifer. Historical water level (Table 8-9) and water quality data are available for this well (Table 8-11).
At the location of monitoring wells MW-9, MW-10, and MW-11 (Figure 8-20), north of the production well field, the groundwater level in the USF is some 58 ft lower than the water level in the overlying Quaternary alluvial aquifer (ABC, 1996c). As a result, the Quaternary alluvial aquifer is perched above the USF in the vicinity of MW-11. Such conditions are interpreted to occur along a substantial length of Las Animas Creek (ABC, 1996c). In spite of these gradients, the amount of surface water loss from the Quaternary alluvial aquifer in Las Animas Creek Drainage Basin is not significant, suggesting that vertical hydraulic conductivity in the USF is relatively low.
8.2.4.3.2 Data Gaps Addressed
The MMD (1997) noted gaps in the adequacy of historical data collected as part of the Alta Gold Co. permit application and EIS process (BLM, 1996). These gaps were largely focused on concerns about the sufficiency of baseline data used to evaluate the impact of groundwater pumping on local wells and riparian habitats in Las Animas and Percha Creek Drainage Basins as well as the assumptions about aquifer properties. In addition, concerns regarding the impact of proposed mine dewatering and groundwater pumping on flowing wells were identified as another data gap (MMD, 1997). These concerns have been addressed by data and information presented in this Baseline Data Report.
NMCC has an observation well (MW-11) in the alluvial aquifer along Las Animas Creek (Figure 8-27). MW-11 will be used as an observation well for a proposed large-scale pumping test that will characterize aquifer properties,
New Mexico Copper Corporation Copper Flat Baseline Data Characterization Report
Copper Flat Mine 8-30 Section 8: Surface Water and June 2012 Groundwater Information
including the hydraulic communication between the Santa Fe Group aquifer system, in which the production wells are screened, and the Quaternary alluvial aquifer. Water level monitoring will include pre-pumping, pumping, and recovery conditions. In addition to this pumping test, a detailed survey of artesian wells was completed to better characterize the flowing wells and understand how the artesian system is connected to adjacent and underlying aquifers and stream discharge into those aquifers (Appendix 8-H). Additional data collected from the USGS, NMOSE files, and wells drilled by others in the Baseline Study Area have helped develop an understanding of the aquifer systems, particularly the alluvial aquifer and underlying USF artesian zone.
8.2.4.3.3 Well Selection Rationale
MW-11 and Animas Station 8 wells were two alluvial groundwater wells gauged or sampled as part of the baseline program as access was granted by private landowners. Because MW-11 was installed as part of a previous permitting effort for the purposes of groundwater monitoring, the well construction details were available and permitted groundwater samples to be collected and water levels to be measured. The Animas Station 8 well is also located on private property about 2.9 miles upstream of MW-11. Spatially, it provides an upstream observation point for water levels farther from the location for proposed production well pumping.
The Upper Percha and Lower Percha Artesian wells (Figure 8-21) were also included as part of the original baseline study, as they too could provide useful observation points for the Quaternary alluvial aquifer in the Percha Creek Drainage Basin. NMCC requested permission from the well owners to gain access to both wells. However, because these wells were not constructed for groundwater monitoring purposes, modifications to the well head would have been necessary to incorporate the wells into the baseline program. Arrangements to modify the well heads were not in place during the course of the baseline program, and therefore the wells were not studied as part of the baseline program. However, as of May, 2011, NMCC has installed water level measurement ports in wells LRG-10948 and Upper Percha (Figure 8-21) and has permission to collect water level data for future hydrology studies as needed. Further information on flowing wells in the area of the Lower Percha Artesian well is presented in Section 8.2.4.4.
8.2.4.3.4 Modifications to the SAP
As NMCC executed the SAP, adjustments to the proposed SAP were necessary based on the actual site conditions encountered in the field. When making adjustments based on field conditions, NMCC strived to find equivalent or improved alternatives, where possible. The Saladone well, which was first studied by Minton (1961) and later used as part of an aquifer test (Atkins, 1992), was proposed in the SAP as a water level observation point upstream in Las Animas Creek drainage with the objective of characterizing water levels in the Quaternary aquifer to the northeast of the location for proposed mine dewatering. However, additional data were not collected from the Saladone well because the well was destroyed due to flooding (DoBrott, 2010) prior to the commencement of the baseline study program. In addition, the following wells were initially identified in the SAP as being wells that develop water from the Quaternary alluvial aquifer: GWQ-11, GWQ94-16, GWQ94-19, IW-1, and IW-2. However, after further review of available well logs, it was determined that these wells develop water from the sediments and sedimentary rocks of the USF. GWQ-11, GWQ94-16, GWQ94-19, IW-1, and IW-2 were studied, but are described in the previous discussion on the Santa Fe Group aquifer system. GWQ94-18 was dry during each visit (Table 8-9). Therefore, a water quality sample could not be collected from the well, as proposed in the SAP (Table 8-15).

New Mexico Copper Corporation Copper Flat Baseline Data Characterization Report
Copper Flat Mine 8-31 Section 8: Surface Water and June 2012 Groundwater Information
8.2.4.3.5 Results
Water level measurements for the Animas Station 8 and MW-11 wells are presented in Table 8-9. Results for water quality analysis of three samples collected from MW-11 during the baseline program are presented in Table 8-11.
Time series water level data for the Quaternary alluvial aquifer were compiled for the Baseline Study Area. A location map and hydrographs can be referenced from Appendix 8-G and Figure 8-31. With the exception of Well 15S5W24, all of the hydrographs for the Quaternary alluvial aquifer are in Las Animas Creek Valley. Groundwater elevation data from MW-11 demonstrates the Quaternary alluvial aquifer is perched above the Santa Fe Group aquifer (Appendix 8-G, Figure E). Downstream of MW-11, USGS-monitored wells 15S5W26 and 15S5W27 show annual groundwater elevation changes of about 10 ft (Appendix 8-G, Figures L and M). Well 15S5W24 is located directly north of Las Animas Creek Valley in Seco Creek Valley near I-25, and has over 166 data points. This well has a long-term water level decline with seasonal peaks related to precipitation events (Appendix 8-G, Figure N).
8.2.4.4 Artesian Well Inventory
The artesian wells within the Baseline Study Area are constructed in the Santa Fe Group sediments, and artesian conditions occur where there is a low permeability confining layer, such as clay, overlying a permeable layer of silt, sand, and gravel. Figure 8-32 is a regional map showing the locations of artesian wells in the inventory area, and Figure 8-34 is a map detailing artesian wells in the lower Las Animas Creek valley where density of wells is greatest. A west-to-east cross section down Las Animas Creek is presented as Figure 8-33. Las Animas Creek hydrogeologic cross section is based on available well logs and regional geology described by Seager et al. (1982) and Hawley and Kennedy (2004). See Appendix 8-H for an inventory of artesian wells in Las Animas Creek valley and vicinity.
As shown on Figure 8-32, all of the known artesian wells are found east of the mapped north-to-south fault zones identified by Seager et al. (1982). East of a series of north-to-south-trending faults, the beds of the Santa Fe Group sediments dip to the east (Figure 8-33). The artesian aquifer exists because the eastward dipping sand beds are recharged near the water table, and confined by clay beds down-dip to the east of the zone of recharge. There are three distinct hydrogeologic zones identified on Figure 8-33:
1. Hydrogeologic Zone 1 is where Las Animas Creek alluvial aquifer is perched above the Santa Fe Group aquifer by a horizontal clay layer in the Santa Fe Group sediments. This zone occurs where the Santa Fe Group sediments are down-dropped between two north-to-south-trending faults. The hydrograph presented as Figure 8-35 illustrates the vertical water level elevation difference between the alluvium and underlying Santa Fe Group sediments.
2. Hydrogeologic Zone 2 is where the Santa Fe Group consists of predominantly coarse-grained sediments, and the overlying Las Animas Creek and alluvium can readily recharge the regional aquifer. Zone 2 is labeled as a potential recharge zone for artesian wells. Zone 2 occurs directly east of the north-to-south-trending faults shown on Figures 8-32 and 8-33. Water level elevations in the alluvium are similar to water level elevations in the underlying Santa Fe Group sediments.
3. Hydrogeologic Zone 3 is where the Santa Fe Group sediments are highly stratified and dipping to the east. In Zone 3, wells typically deeper than 100 to 200 ft are artesian (Figure 8-33).
New Mexico Copper Corporation Copper Flat Baseline Data Characterization Report
Copper Flat Mine 8-32 Section 8: Surface Water and June 2012 Groundwater Information
8.2.4.4.1 Historical Data
The first artesian wells in the Baseline Study Area were drilled in the late 1930s, after the construction of Caballo Reservoir in 1938. Most all of the artesian wells were drilled prior to the NMOSE declaration of Las Animas Creek and Lower Rio Grande Underground Water Basins.
Most of the artesian wells are located in Las Animas Creek valley and Percha Creek valley, with a few artesian wells in the Oasis area along Highway I-25. Murray (1959) identified 26 artesian wells throughout the investigation area, the 1966 NMOSE Las Animas Creek Hydrographic Survey Sheet 1 identifies 26 artesian wells, and Davie and Spiegel (1967) identified 27 wells in Las Animas Creek area and two artesian wells in the Oasis area. Flow from selected artesian wells has been measured by Murray (1959), Davie and Speigel (1967), and JSAI (1995 unpublished field survey).
8.2.4.4.2 Data Gaps Addressed
Data gaps regarding the artesian wells have included (1) a current inventory of artesian wells in the Baseline Study Area, (2) artesian well construction details, (3) the hydrogeologic setting for artesian wells, and (4) quantified diversion rates from artesian wells.
Construction details on the artesian wells are limited, but it appears a number of artesian wells were drilled without proper annular seals to prevent flow of water from the artesian zone into the overlying alluvium and stream channels. Furthermore, many of the artesian wells were never valved and are therefore left open to flow continuously to the land surface. Since the area was declared by the NMOSE, valves to regulate artesian flow and metering have been conditions attached to many of the water right permits granted since that time.
An updated inventory of artesian wells in Las Animas Creek valley and vicinity was conducted in 2011. The primary purpose of the updated inventory was to address the data gaps listed in this section. The inventory region was divided into three areas: (1) Las Animas Creek valley, (2) Oasis (between Las Animas Creek valley and Percha Creek), and (3) Percha Creek valley.
Data sources included the following:
1. Groundwater report by Murray (1959)
2. Las Animas Creek Hydrographic Survey Report by Davie and Spiegel (1967)
3. NMOSE online WATERS database
4. NMOSE files
5. JSAI 1995 field survey
Well information from the data sources listed above was combined and verified. NMOSE files consisted of water right declarations, well records, proof of completion of works, NMOSE field check reports, and other available documents attached to water rights applications and permits. An attempt was made to match data from different sources to the correct well, and to reconcile apparent discrepancies. A list of inventoried wells is presented as Appendix 8-H.
Currently there are over 61 artesian wells identified in the investigation area. Well depths range between 120 and 505 ft below land surface. Over the last 50 years, significant changes in flow rates have been observed in the few artesian wells that have time series data. Figure 8-36 is a graph of artesian flow rates versus time. It is apparent that artesian flow rates have significantly declined in both Percha and Las Animas Creek valleys. There are many factors that affect artesian flow, including climate conditions and recharge, and Caballo Reservoir

New Mexico Copper Corporation Copper Flat Baseline Data Characterization Report
Copper Flat Mine 8-33 Section 8: Surface Water and June 2012 Groundwater Information
stage. Dewatering by artesian well upward leakage and open flow, however, appears to be mainly responsible for the long-term decline in artesian flow rates (Appendix 8-H).
8.2.5 Baseline Hydrologic Consequences from Existing Operations and Reclamation
With the exception of the water supply wells, the existing mine facilities are located within the Copper Flat Mine Permit Area (Figures 8-26 and 8-37). For the Copper Flat Mine property, potential areas of impact include the tailing impoundment, waste rock piles, and the pit lake.
The mine permit facilities can be divided into two hydrogeologic segments: (1) waste rock piles and pit areas underlain by low permeability andesite and monzonite rocks, and (2) the tailing impoundment area underlain by alluvium and Santa Fe Group sediments. The baseline hydrologic consequences from existing operations and reclamation are currently being evaluated under the NMCC Stage 1 Abatement Plan proposal (INTERA, 2011), as amended (JSAI, 2011).
8.2.5.1 Pit Lake
The Quintana pit was excavated to a maximum depth corresponding to elevation 5,400 ft amsl. The current water level in the pit is about 5,440 ft (Table 8-18). The pre-mining groundwater level (without lake evaporation) was about 5,450 ft. The pit lake is a hydrologic sink with no discharges to groundwater (JSAI, 2011). The andesite rocks act as a hydraulic container for the more fractured monzonite rocks. Prior to the pit lake, groundwater discharged from the andesite and monzonite rocks to the alluvium along Grayback Arroyo. Between June and September 2011, evaporative effects decreased the pit lake elevation from 5,443.80 to 5,442.74 ft amsl.
The pit lake quality has been affected by minor influxes of pit wall seepage and concentration of dissolved constituents from evaporation. The pit lake has buffering capacity to maintain neutral pH (6.00 to 7.72), although high-precipitation periods and subsequent pit wall seepage can temporarily exceed the pit lake buffering capacity (Newcomer and Finch, 1993). Table 8-19 lists the constituents of concern (COC) identified from the pit lake chemistry data. The primary COCs are TDS, sulfate, and pH. Pit lake chemistry data from 2010 and 2011 demonstrate that the pit lake is not stratified, and that depth sampling is not necessary.
Piezometer nests GWQ96-22(A,B) and GWQ96-23(A,B) provide adequate monitoring of upgradient (GWQ96-22(A,B)) and downgradient (GWQ96-23(A,B)) groundwater quality conditions. Recently constructed nested piezometers GWQ11-24(A,B) and GWQ11-25(A,B) have not been sampled; however, they are proposed to be sampled in ongoing monitoring described in Section 8.2.7.
8.2.5.2 Waste Reclamation Pile
The waste rock piles are more permeable than the underlying rock, and infiltrated precipitation will drain off at the waste rock-bedrock interface. The runoff from the waste rock piles and the mill site fill will be intercepted by the existing mine pit and Grayback Arroyo. As a result, the waste rock and mill site fill may be contributing to increased TDS in downgradient surface water quality. Observed groundwater impacts are being addressed though the ongoing Stage 1 Abatement program (INTERA, 2011) as amended (JSAI, 2011).
Surface water quality sampling points SWQ-2 and SWQ-3 may provide an indication of water quality impacts from the waste rock piles. The primary COCs are sulfate and TDS. Metal concentrations in surface water samples have been low or not detectable, and pH has been above neutral in the 7 to 8 range (see Section 8.1.2.3.2).

New Mexico Copper Corporation Copper Flat Baseline Data Characterization Report
Copper Flat Mine 8-34 Section 8: Surface Water and June 2012 Groundwater Information
Discharges to groundwater from potential waste rock pile leachate would occur via storm water runoff. The pit footprint will capture runoff from nearby waste rock piles to the north and northwest, and Grayback Arroyo will receive runoff from the waste rock piles east of the pit capture area. GWQ-3 is located in Grayback Arroyo and is the best location downstream of the waste rock pile for detecting discharges to groundwater from the waste rock piles.
The environmental geochemistry program described in Section 7, Geology, will be utilized to predict the geochemistry and acid rock drainage potential of the waste rock types reporting to the waste rock piles. The geochemical sample results along with the geochemical modeling will be coupled with the unsaturated flow modeling to evaluate the potential impact, if any. The baseline geochemistry program as described in Section 7.5 and the ongoing geochemical program currently underway to support the NMED groundwater discharge permit application will guide the engineering and monitoring requirements to ensure any potential impacts are detected, monitored, and mitigated.
8.2.5.3 Tailing Dam
The construction and operation of the tailing impoundment in the early 1980s created a groundwater mound and discharges of increased sulfate and TDS to groundwater. Preferential pathways for the seepage include the alluvium, fractured basalt, and coarser-grained Santa Fe Group sediments. Clay layers in the Santa Fe Group sediments act as vertical barriers to groundwater flow. The sulfate plume appears to be stable (the groundwater mound has not subsided) and downgradient migration is limited by a barrier boundary fault. The Stage 1 Abatement Plan (INTERA, 2011), as amended (JSAI, 2011) discusses this known groundwater impact and describes the activities to further characterize the extent of the limited sulfate plume.
8.2.5.4 Summary of Impacts
The existing pit lake has elevated constituents (Table 8-19), but the pit lake is a hydrologic sink because evaporative losses are greater than surface water and groundwater inflow (JSAI, 2011a). No impacts to groundwater from the pit lake have been observed. A groundwater TDS plume primarily composed of sulfate is observed below the tailing impoundment. The tailing impoundment sulfate plume appears to be stationary, and monitoring has not indicated significant migration. Evaluating the extent of potential impacts along Grayback Arroyo and directly downgradient of the tailing impoundment sulfate plume is proposed for the NMCC Stage 1 Abatement Plan.
8.2.6 Probable Hydrologic Consequences from Proposed Operations and Reclamation
Probable hydrologic consequences (PHCs) from the proposed Copper Flat Mine operations may occur from the proposed facilities within the Mine Permit Area and from pumping the water supply wells. The proposed mine pit, waste rock storage facilities, and part of the tailing storage facility would be located on the Animas Uplift. Figure 8-38 is a map showing the proposed mine facilities within the Mine Permit Area. For future mining operations, the surface runoff from the waste rock piles will be controlled as shown in the Mine Plan of Operations submitted to the BLM in June 2011 and currently under review by the NMED.
The PHCs from the proposed operations and reclamation will be evaluated using a groundwater flow model that represents the baseline study area. Historical and baseline data will be used for model calibration and verification. A summary of the groundwater modeling task is as follows:
Develop the conceptual hydrogeologic framework as the basis for model design. Simulate the local flow system including groundwater units, surface channels, and the flow of recharge
from the mountains to the Rio Grande.

New Mexico Copper Corporation Copper Flat Baseline Data Characterization Report
Copper Flat Mine 8-35 Section 8: Surface Water and June 2012 Groundwater Information
Calibrate the groundwater flow model to steady state and historical transient data sets and available pumping test data.
Project pit dewatering rates. Simulate realistic well field pumping rates based on projected dewatering rates and process water
balance (for evaluation of operational needs and environmental impacts). Project groundwater drawdown and streamflow depletion resulting from dewatering and water supply
pumping. Project post-mining recovery of pit water level and pit lake water balance. Produce a detailed pit lake water balance for use in geochemical evaluation. Project long-term and permanent drawdown and changes to basin water balance, due to pit lake
evaporation. Track any outflows from the pit and groundwater flows downgradient of the tailing impoundment,
waste rock facilities, and low-grade stockpile for potential water quality evaluation.
PHCs will be evaluated using a regional groundwater flow model that encompasses the area of potential impacts from the proposed mine facilities and supply wells. The groundwater flow model extent and grid are shown on Figure 8-39.
8.2.6.1 Crystalline Bedrock Aquifer
The PHC to the crystalline bedrock aquifer from the proposed mining operation would be related to the expansion of the mine pit to the configuration shown on Figure 8-38 and subsequent dewatering of the pit area.
Hydraulic conductivity values were derived from slug tests performed on wells GWQ96-22 and GWQ96-23 (SRK, 1997b). The slug test analysis estimated an extremely low range in hydraulic conductivity of 0.00003 to 0.003 ft/day for the unfractured andesite and quartz monzonite rocks. NMCC (in progress) has evaluated injection tests performed on GWQ-5R, GWQ11-24, and GWQ11-25. A summary of the hydraulic conductivity estimates is presented as Table 8-20.
A representative range of effective bulk hydraulic conductivity for the fractured rock surrounding the pit lake is about 0.05 to 0.1 ft/day. The andesite rocks appear to have an order of magnitude lower hydraulic conductivity than the fractured monzonite as evidenced by the slow recovery of GWQ-5R, which was dry upon well completion on September 6, 2011, but has recovered to an elevation of 5,311 ft amsl on September 29, 2011 (or approximately 23 ft of recovery).
The low permeability andesite rocks will limit dewatering rates and limit the expansion of the drawdown cone to where the majority of the aquifer dewatering will occur within the Mine Permit Area. The environmental geochemistry program described in Section 7, Geology, will be utilized to determine the impacts to the pit lake water quality. The geochemical sample results along with the geochemical modeling will be coupled with the groundwater flow modeling to evaluate the potential impact, if any, to the future pit lake water quality (Section 7.5)
8.2.6.2 Santa Fe Group Aquifer System
The PHC to the Santa Fe Group aquifer from the proposed mining operation would be related to the design of the tailing facility (NMCC, 2010) and its potential for seepage, as well as potential aquifer dewatering from pumping the water supply wells. The proposed tailing facility will be designed using modern technology that limits the potential for seepage and maximizes the recycling of water (conservation).

New Mexico Copper Corporation Copper Flat Baseline Data Characterization Report
Copper Flat Mine 8-36 Section 8: Surface Water and June 2012 Groundwater Information
Pumping and specific capacity tests were performed on mine supply wells MW-4 (Water Development Corporation, 1975), GWQ-1 (Water Development Corporation, 1980), GWQ-7 (W.K. Summers & Associates, 1981), and GWQ-9 (Water Development Corporation, 1980). All of these wells are in the vicinity of the tailing impoundment. A summary of the hydraulic properties derived from the wells tested in the tailing impoundment area is listed in Table 8-16.
Adrian Brown Consultants (1996d) performed a 76-hour constant rate pumping test on GWQ94-17 located below the tailing impoundment. Neighboring monitoring wells were used as observation wells during the pumping test. The pumping well GWQ94-17 was pumped at a rate of 23 gpm. The water levels in the pumping and observation wells never fully recovered to the pre-pumping level, indicating boundary effects from dewatering the groundwater mound observed beneath the tailing dam. Furthermore, the pumping test data confirmed the clay zones observed in the upper Santa Fe Group sediments (Figures 8-17 and 8-18) act as vertical barriers to groundwater flow.
Transmissivity of the Santa Fe Group aquifer derived from pumping tests of the NMCC water supply wells (Green and Halpenny, 1976) averages about 20,000 ft2/day. PW-2 was pumped at 2,020 gpm for 72 hours in January 1976, and water level drawdown and recovery was measured at observation wells PW-1 and MW-5 (Figure 8-27). Aquifer transmissivity is estimated at about 20,000 ft2/day by matching the solution of Theis (1938) to measured drawdown and recovery at PW-1 and MW-5, and to measured recovery at the pumping well PW-2. PW-1 was pumped at 1,500 gpm for 70 hours in December 1975, and water level drawdown and recovery was measured at observation well MW-5. Aquifer transmissivity of about 17,000 ft2/day is estimated by matching the solution of Theis (1938) to measured drawdown and recovery at MW-5, and to measured recovery at the pumping well PW-1.
The amount of potential aquifer dewatering from pumping the proposed water supply wells will depend on mining operation water demand, distribution of pumping, success with water reuse, and duration of pumping. In addition to the primary water supply wells shown on Figure 8-26, NMCC has several supply wells located in the Mine Permit Area. Nevertheless, groundwater from aquifer storage will be required for proposed mine operations and aquifer drawdown is expected to occur. However, in contrast to other water users, pumping for mine operations is for a relatively short time period. The potential effects from groundwater pumping will be evaluated by using the calibrated groundwater flow model. Data from pumping tests performed on the production wells will be used for model calibration.
8.2.6.3 Quaternary Alluvial Aquifer System
The PHC to the alluvial aquifer from the proposed mining operation would be related to pumping water supply wells. In places, the alluvial aquifer is perched above the Santa Fe Group aquifer. No hydrologic impacts are expected where the two aquifers are hydraulically disconnected. The degree of aquifer drawdown in the alluvial aquifer from proposed mining operations will be evaluated using a regional groundwater flow model calibrated to available data representative of the alluvial aquifer and surrounding regional groundwater system. Historical and baseline data are sufficient for model calibration of the alluvial aquifer system.
8.2.7 Ongoing Groundwater Monitoring
Ongoing groundwater monitoring, beyond baseline data collection requirements, will occur as part of the development of the regional groundwater flow model in support of the mine-permitting process and for the Stage 1 Abatement Plan. Pumping and observation wells for the proposed production well pumping test are shown on Figure 8-40. A summary of the proposed monitoring for the Stage 1 Abatement Plan is provided in Table 8-21, and monitoring points are shown on Figure 8-41. One to two additional monitoring wells below the tailing impoundment are proposed for defining the downgradient extent of the sulfate plume.
New Mexico Copper Corporation Copper Flat Baseline Data Characterization Report
Copper Flat Mine 8-37 Section 8: Surface Water and June 2012 Groundwater Information
8.2.7.1 Crystalline Bedrock Aquifer
Proposed groundwater monitoring for the crystalline bedrock aquifer includes collection of water level and water quality data in the Mine Permit Area for the Stage 1 Abatement Plan (Table 8-21).
8.2.7.2 Santa Fe Group Aquifer System
Proposed groundwater monitoring for the Santa Fe Group aquifer includes collection of water level and water quality data in the Mine Permit Area for the Stage 1 Abatement Plan (Table 8-21), and possibly water level monitoring .
NMCC is planning a large-scale pumping test on the mine supply wells. The proposed pumping and observation wells are shown on Figure 8-40. In January 2012, NMCC drilled and installed another well screened the artesian aquifer in Las Animas Creek as an observation well for the production well test. The new artesian well is named GWQ11-27 and is screened from 220 to 320 ft below ground surface. Its location is presented on Figure 8-40. The assessment of aquifer properties will be further refined based on (1) hydrogeologic investigations and aquifer testing planned to more fully characterize hydraulic properties of the bedrock around the existing and proposed pit, and (2) aquifer testing planned to more fully characterize hydraulic properties around the existing production wells, including vertical resistance to flow. General plans and objectives for the planned hydrogeological investigations and aquifer testing were presented by NMCC on September 19, 2011 to the State Agencies including representatives of the Mines and Minerals Division; New Mexico Environment Department, Groundwater Bureau, Mining Compliance Section; and Office of the State Engineer. The evaluation of aquifer properties will be further refined during development of the numerical groundwater flow model shown on Figure 8-39.
8.2.7.3 Quaternary Alluvial Aquifer
NMCC has an observation well (MW-11) in the alluvial aquifer along Las Animas Creek (Figure 8-27). MW-11 will be used as an observation well for the proposed large-scale pumping test. Water level monitoring would include pre-pumping, pumping, and recovery conditions.
8.2.8 References
Adrian Brown Consultants (ABC), 1996a, Appendix F of Copper Flat project hydrology impact evaluation report – Surface Water Characterization, Consultant’s Report prepared for S. Steffen Robertson and Kristen, Report 1356A/960909, September 9, 1996.
––––––, 1996b, Appendix H of Copper Flat project hydrology impact evaluation report – Historic Project Well Data, Consultant’s Report prepared for Steffen Robertson and Kristen, Report 1356A/960909, September 9, 1996.
––––––, 1996c, Copper Flat Project Hydrologic Impact Evaluation: Consultant’s report prepared for Alta Gold, September 26, 1996.
––––––, 1996d, Appendix C of Copper Flat project hydrology impact evaluation report – Las Animas Creek Pumping Test, Consultant’s Report prepared for Steffen Robertson and Kristen, Report 1356A/960909, September 9, 1996.
––––––, 1998, Technical Memorandum from Susan Wyman to Jim Goff at Alta Gold Corporation.

New Mexico Copper Corporation Copper Flat Baseline Data Characterization Report
Copper Flat Mine 8-38 Section 8: Surface Water and June 2012 Groundwater Information
Atkins Engineering Associates, Inc. (Atkins), 1992, Engineering analysis of shallow aquifer tests for Saladone Well and Shipping Pen Well within the Ladder Ranch vicinity, 44 p. Prepared for Turner Enterprises, Incorporated, Gallatin Gateway, Montana, December 1992.
Bureau of Land Management (BLM), 1978, Environmental assessment record on Quintana Minerals Corporation’s proposed open pit copper mine at Copper Flat, Sierra County, New Mexico: Las Cruces, N. Mex., 170 p.
––––––, 1996, Draft environmental impact statement (DEIS), Copper Flat Project: Las Cruces, N. Mex., U.S. Department of the Interior. Prepared by ENSR, Fort Collins, Colo.
––––––, 1999, Preliminary final environmental impact statement, Copper Flat project: Las Cruces, N. Mex., U.S. Department of the Interior, 491 p. Prepared by ENSR, Fort Collins, Colo.
Davie, W., Jr., and Spiegel, Z., 1967, Las Animas Creek hydrographic survey report, Geology and water resources of Las Animas Creek and vicinity, Sierra County, New Mexico: New Mexico State Engineer Office, Santa Fe, New Mexico, 34 p., plus tables and figures.
DBS&A, 1998, Environmental Evaluation report, Copper Flat project. Prepared for the Energy, Mining and Natural Resources Department, Mining and Minerals Division, Santa Fe, New Mexico.
DoBrott, S., 2010, Personal communication from S. DoBrott of Ladder Ranch to L. Dalton and A. Persico of INTERA on September 29, 2010.
Dunn, P. G., 1982, Geology of the Copper Flat porphyry copper deposit, Hillsboro, Sierra County, New Mexico: in Advances in Geology of the Porphyry Copper Deposits Southwestern North America, Spencer R. Titley, Editor, University of Arizona Press, Tucson, Arizona, pp. 313-325.
Eustice, C., 2011, Personal communication with S. Raugust of New Mexico Copper Corporation, April 2011.
Green, D.K., and Halpenny, L.C., 1976, Report on development of ground-water supply for Quintana Minerals Corporation Copper Flat Project, Hillsboro, New Mexico: Tucson, Water Development Corporation, 32 p.
Harley, G. T., 1934, The Geology and Ore Deposits of Sierra County, New Mexico: New Mexico School of Mines, State Bureau of Mines and Mineral Resources Bulletin No. 10, pp. 160- 170.
Hawley, J.W., and Kennedy, J.F., 2004, Creation of a digital hydrogeologic framework model of the Mesilla Basin and southern Jornada del Muerto Basin: N. M. Water Resources Research Institute, New Mexico State University; prepared for Lower Rio Grande Water Users Organization; Technical Completion Report 332, 105 p., with CD ROM including 2005 Addendum extending model into Rincon Valley and adjacent areas.
Hedlund, D. C., 1975, Geologic map of the Hillsboro quadrangle, Sierra and Grant Counties, New Mexico: U.S. Geological Survey Open-File Report 75-108, 19 p.
INTERA Incorporated (INTERA), 2010, Sampling and Analysis Plan for Copper Flat Mine, Consultant’s report prepared by INTERA Incorporated for New Mexico Copper Corporation, September 2011, 309 p.
––––––2011, Stage I Abatement Plan for the Copper Flat Mine, Consultant’s report prepared by INTERA Incorporated for New Mexico Copper Corporation, March 31, 2011, 956 p.
John Shomaker & Associates, Inc. (JSAI), 1995, letter report regarding flowing wells in vicinity of Copper Flat Project: from J. W. Shomaker to James Golf, Alta Gold Co., May 5, 1995.
––––––, 2011, NMCC Stage 1 Abatement Plan Amendment.

New Mexico Copper Corporation Copper Flat Baseline Data Characterization Report
Copper Flat Mine 8-39 Section 8: Surface Water and June 2012 Groundwater Information
______, 2011a, Hydrogeologic evaluation of pit lake and implications related to adding imported groundwater, Copper Flat Mine, Sierra County, New Mexico: consultant’s report prepared for New Mexico Copper Corporation, 34 p.
Lozinsky, R.P. and J.W. Hawley. 1986. The Palomas Formation of south-central New Mexico -- a formal definition. New Mexico Geology. 8. 4, p: 73-82.
McLemore, V., 2001, Geology and evolution of the Copper Flat porphyry system, Sierra County, New Mexico: New Mexico Bureau of Mines and Mineral Resources.
Minton, E.G., Jr., 1961, Report of Groundwater Investigation, Upper Animas Creek-Ladder Ranch, Sierra County, New Mexico, New Mexico Office of the State Engineer Library Miscellaneous Document No. 597, 35 p.
Murray, C. R., 1959, Ground-water conditions in the nonthermal artesian-water basin south of Hot springs, Sierra County, New Mexico: New Mexico Office of the State Engineer Technical Report No. 10, 33 p.
New Mexico Copper Corporation (NMCC), 2010, Copper Flat Mine Plan of Operations, December 2010, 353 p.
New Mexico Energy, Minerals, and Natural Resources Department, Mining and Minerals Division (MMD), 1997, Report of the Hearing Officer, Permit Application No. SI004RN, In the Matter of the Alta Gold Corporation’s Application for a Regular New Mine Permit to Conduct Surface Copper Mining and Reclamation Operations at the Copper Flat Mine, July 17, 1997, 7 p.
New Mexico Environment Department Groundwater Quality Bureau (NMED GWQB), 2008, Letter to Mr. George Lotspeich regarding Abatement plan required at Copper Flat Mine site, DP-1, August 20, 2 p.
New Mexico Environment Department Surface Water Quality Bureau (NMED SWQB), Water Quality Survey Summary for the Lower Rio Grande Tributaries 2004, November 2009, Available online at ftp://164.64.146.6/www/swqb/LRG/Surveys/LowerRioGrandeTributaries-2004Survey.pdf
––––––, 2011, Surface Water Quality Bureau Monitoring and Assessment Standard Operating Procedure 12.0, Lake Sampling, Effective Date June 27, 2011, 6 p.
New Mexico Office of the State Engineer (NMOSE), State of New Mexico, 2000, Lower Rio Grande Basin hydrographic survey report: Outlying areas, Part of Doña Ana, Sierra, and Grant Counties, December 2000.
Newcomer, R. W., and Finch, S. T., 1993, Water quality and impacts of proposed mine and mill at Copper flat Mine site, sierra County, New Mexico: Consultant’s report prepared by John Shomaker & Associates, Inc. (formerly John W. Shomaker, Inc.) for Gold Express Corporation, May 1993.
Newcomer, R. W., Shomaker, J. W., and Finch, S. T., 1993, Hydrologic assessment Copper Flat Project Sierra County, New Mexico: Consultant’s report prepared by John Shomaker & Associates, Inc. (formerly John W. Shomaker, Inc.) for Gold Express Corporation, May 1993. The above report contains a summary and the two reports referenced below:
Raugust, J.S., 2003, The natural defenses of Copper Flat, Sierra County, New Mexico: New Mexico Bureau of Geology and Mineral Resources Open-File report 475, Socorro, N. Mex., New Mexico Institute of Mining and Technology.
Raugust, S., and McLemore, V., 2004, The Natural Defenses of Copper Flat, Sierra County, New Mexico: American Society of Mining and Reclamation, 2004 National Meeting of the American Society of Mining and Reclamation and the 25th West Virginia Surface Mine Drainage Task Forces, April 18-24, 2004, pp. 1508 -1531.

New Mexico Copper Corporation Copper Flat Baseline Data Characterization Report
Copper Flat Mine 8-40 Section 8: Surface Water and June 2012 Groundwater Information
Seaber, P.R., Kapinos, F.P., and Knapp, G.L., 1987, Hydrologic unit maps: U.S. Geological Survey Water-Supply Paper 2294, 63 p.
Seager, W.R., Clemons, R.E., Hawley, J.W., and Kelley, R.E., 1982, Geology of northwest part of Las Cruces 1° x 2° sheet, New Mexico: New Mexico Bureau of Mines & Mineral Resources, Geologic Map 53.
Seager, W.R. and Hawley, J.W. 1973. Geology of Rincon quadrangle, New Mexico. New Mexico Bureau of Mines and Mineral Resources Bulletin 102. 56 p.
Seager, W.R., Shafiqullah, M., Hawley, J.W., and Marvin, R.F., 1984, New K-Ar dates from basalts and the evolution of the Southern Rio Grande Rift: Geological Society of America Bulletin, v. 95, p.87-99.
Segerstrom, K. and Antweiler, J.C., III, 1975, Placer-gold deposits of the Las Animas District, Sierra County, New Mexico: USGS OFR 75-206.
Sergent, Hauskins, and Beckwith (SHB), 1980, Geotechnical and design development report, tailings dam and disposal area, Quintana Minerals Corporation, Copper Flat Project, Golddust, New Mexico. Technical report prepared for Quintana Minerals.
Sergent, Hauskins, and Beckwith (SHB), 1981, Geohydrological evaluation for submission of discharge plan for Copper Flat Project, Quintana Minerals Corporation, Sierra County, New Mexico: report submitted to New Mexico State Environmental Improvement Board, SHB Job No. E80-194.
Shomaker, J. W., 1993, Effects of pumping for water supply and mine dewatering Copper Flat Project, Sierra County, New Mexico: Consultant’s report prepared by John Shomaker & Associates, Inc. (formerly John W. Shomaker, Inc.) for Gold Express Corporation, May 1993.
Steffen Robertson and Kirsten (U.S.), Inc. (SRK), 1995, Copper Flat Mine hydrogeological studies. Copper Flat, New Mexico: Steffen Robertson and Kirsten, Inc.
, 1996, Copper Flat Mining Permit Application, Volumes 1 through 4, Consultant’s Report prepared by SRK for Alta Gold Co., February 1996, SRK Project Number 68603, variously paged.
, 1997a, Copper Flat Mine Project Monitoring Plans, Consultant’s Report prepared by SRK for Alta Gold Co., May 1997, SRK Project Number 68607, 84 p.
, 1997b, Copper Flat Mine compilation of pit lake studies: consultant’s report prepared by Steffen Robertson and Kirsten, Inc. prepared for Alta Gold Co., December 1997.
, 1997c, Appendix A - Geochemical Test Results, Copper Flat Project, Compilation of Pit Lake Studies, Copper Flat Mine compilation of pit lake studies, prepared by SRK for Alta Gold Co., October 1997, 76 p.
, 2010, NI-43-101 Preliminary assessment, THEMAC Resources Group Limited, Copper Flat project, Sierra County, New Mexico: Lakewood, Colo. Prepared by SRK Consulting for THEMAC Resource Group Limited, June 30, 2010.
Theis, C.V., 1938, The significance and nature of the cone of depression in ground-water bodies: Economic Geology, V. 33, No. 8, pp. 889-902.
U. S. Geological Survey (USGS), 2011, Peak streamflow for the Nation, USGS 08361700 Percha Creek near Hillsboro, NM, Sierra County, New Mexico, available at: http://nwis.waterdata.usgs.gov/nwis//?site_no=08361700&agency_cd=USGS&.
Water Development Corporation, 1975, Letter report regarding the drilling and testing of Mine Supply Well MW-4, prepared for Quintana Minerals Corporation, July 10, 1975.

New Mexico Copper Corporation Copper Flat Baseline Data Characterization Report
Copper Flat Mine 8-41 Section 8: Surface Water and June 2012 Groundwater Information
––––––, 1980, Letter report regarding the testing of Inspiration North (IDW-2) and South (IDW-1) wells, prepared for Quintana Minerals Corporation, August 14, 1980.
W.K. Summers & Associates, 1981, Step pumping test of water well GWQ-7, Copper Flat, New Mexico: consultant’s report prepared by W.K. Summers & Associates prepared for Quintana Minerals Corporation, T or C, New Mexico, 61 p.
Wilson, C.A., Orr, C.A, White, R.R., and Roybal, R.G., 1981, Water resources of the Rincon and Mesilla Valleys and adjacent areas, New Mexico: New Mexico State Engineering Technical Report 43.

Tables

Table 8-1, Page 1 of 2
Table 8-1 Historical Flow and Water Quality Parameters
Location Date Description Flow (cfs) pH
Conductivity (µS/cm)
Temperature (°C)
Las Animas Creek
1967 Upper Reach 1.0 – 2.0 NM NM NM
Las Animas Creek
1967 Middle Reach 1.0 – 1.5 NM NM NM
Las Animas Creek
1996 LAC-E 0.546 8.2 400 17
Percha Box 1996 1200’ u/s of Box entry
Dry NA NA NA
Percha Box 1996 700’ u/s of Box entry 0 8.1 600 32
Percha Box 1996 400’ u/s of Box entry Dry NA NA NA
Percha Box 1996 Box entry 0.265 7.7 500 23
Percha Box 1996 1500’ d/s of Box entry
0.446 8.2 500 23
Percha Box 1996 Box exit 1.02 8.4 400 25
Percha Box 1996 2400’ d/s of Box exit 0 9.3 400 32
Percha Box 1996 2500’ d/s of Box exit Dry NA NA NA
Percha Box 1996 5000’ d/s of Box exit 0.394 9.0 400 28
Percha Box 1996 5400’ d/s of Box exit 0 9.0 400 32
Percha Box 1996 5500’ d/s of Box exit Dry NA NA NA
Percha Box 1996 3 miles d/s of Box exit
Dry NA NA NA
Percha Box 1996 5 miles d/s of Box exit
Dry NA NA NA
Grayback Arroyo 4/1/93 SWQ-1 1 – 2 8.3 1150 NM
Grayback Arroyo 5/7/93 SWQ-1 Dry NA NA NA
Grayback Arroyo 3/31/93 SWQ-2 < 1 7.7 3150 NM
Grayback Arroyo 3/31/93 SWQ-3 12.5 8.1 3330 NM
Spring/Seep 4/1/93 BG 1 – 2 8.2 1090 NM

Table 8-1, Page 2 of 2
Location Date Description Flow (cfs) pH
Conductivity (µS/cm)
Temperature (°C)
Spring/Seep 5/7/93 BG Dry NA NA NA
Spring/Seep 4/1/93 BG-2 < 1 8.2 1030 NM
Spring/Seep 5/7/93 BG-2 < 1 NM NM NM
Spring/Seep 1997 PW-2 NM 8.16 NM NM
Spring/Seep 1967 WS 0.8 NM NM 81.5
Spring/Seep 4/2/93 WS 0.00735 8.5 1980 NM
Notes:
Box = Percha Box u/s = upstream d/s = downstream NA = no water present for sampling NM = parameter not measured or not available

Table 8-2, Page 1 of 1
Table 8-2 Las Animas Creek Stream Flow Calculations from 1996 through 1998 near LAC-E (ABC, 1998)
Date Flow Rate Cubic Feet per Second (cfs)
4/10/1996 No Flow
5/30/1996 No Flow
7/3/1996 No Flow
9/5/1996 No Flow
10/2/1996 No Flow
12/17/1996 No Flow
1/15/1997 11.2
2/12/1997 13.9
3/18/1997 37.7
4/21/1997 20.6
5/19/1997 8.3
6/9/1997 0.9
7/1/1997 No Flow
8/15/1997 22.7
9/16/1997 No Flow
10/30/1997 No Flow
1/12/1998 60.3
2/19/1998 12.7
3/19/1998 51.8

Table 8-3, Page 1 of 1
Table 8-3 Las Animas Creek Stream Flow Calculations Collected on June 28, 2011
Site Name Discharge (cfs)
Approximate Distance Downstream from Start of Flow (ft)
LAC-1 0.21 450
LAC-2 0.37 920
LAC-3 0.05 2,300
LAC-4 0.02 3,030
End of Flow 0 3,530
Start of Flow 0 5,200
LAC-5 0.02 5,830
LAC-6 0.02 6,580
End of Flow 0 6,680

Table 8-4, Page 1 of 1
Table 8-4 Seepage Rates for the Measured Reaches of Las Animas Creek (June 2011)
Reach Seepage Rate (cfs)
Gaining or Losing Reach
SoF to LAC-1 0.21 Gaining
LAC-1 to LAC-2 0.16 Gaining
LAC-2 to LAC-3 -0.32 Losing
LAC-3 to LAC-4 -0.03 Losing
LAC-4 to Dry -0.02 Losing
Dry to LAC-5 0.02 Gaining
LAC-5 to LAC-6 0.002 Gaining
LAC-6 to End -0.02 Losing

Table 8-5, Page 1 of 1
Table 8-5 Percha Creek Stream Flow Calculations Collected on June 29 and 30, 2011
Site Name Discharge (cfs)
Approximate Distance Downstream from Start of Flow (ft)
PC-1 0.24 400
PC-2 0.18 1,395
PC-3 0.13 2,080
PC-4 0.19 3,235
PC-5 0.01 4,010
PC-6 0.66 4,220
PC-7 0.88 4,370
PC-8 0.06 7,140
End of Flow 0 7,940
Start of Flow 0 8,835
PC-9 0.16 8,935
PC-10 0.04 9,220
End of Flow 0 9,420
Start of Flow 0 13,885
PC-11 0.15 14,385
PC-12 0.23 17,800
PC-13 0.08 19,365
PC-14 0.33 20,765
PC-15 0.34 21,875
PC-16 0.03 24,105
End of Flow 0 24,605

Table 8-6, Page 1 of 1
Table 8-6 Seepage Rates for the Measured Reaches of Percha Creek (June 2011)
Reach Seepage Rate (cfs)
Gaining or Losing Reach
SoF to PC-1 0.24 Gaining
PC-1 to PC-2 -0.06 Losing
PC-2 to PC-3 -0.05 Losing
PC-3 to PC-4 0.05 Gaining
PC-4 to PC-5 -0.18 Losing
PC-6 0.66 Inflow
PC-5 to PC-7 0.87 Gaining
PC-7 to PC-8 -0.82 Losing
PC-8 to Dry -0.06 Losing
Dry to PC-9 0.16 Gaining
PC-9 to PC-10 -0.12 Losing
PC-10 to Dry -0.04 Losing
Dry to PC-11 0.15 Gaining
PC-11 to PC-12 0.08 Gaining
PC-12 to PC-13 -0.15 Losing
PC-13 to PC-14 0.25 Gaining
PC-14 to PC-15 0.01 Gaining
PC-15 to PC-16 <0 Losing
PC-16 to End -0.02 Losing

Table 8-7, Page 1 of 1
Table 8-7 Pit Lake Water Depths
Season Depth of Water (ft)
September 2010 34.6
January 2011 35.8
April 2011 31.6
July 2011 28.9

Table 8-8, Page 1 of 1
Table 8-8 Geologic Units and Their Characteristics
Geologic Unit Description Thickness (ft)
Range in Estimated Hydraulic
Conductivity (ft/day)
Alluvium 1 Sand and Gravel in Grayback Arroyo < 50 10 to 100
Colluvium 2 Fan Deposits of Poorly Sorted Angular Sand and Gravel < 50 1 to 10
Santa Fe Group Sediments 3 Highly Stratified Gravel, Sand, Silt, and Clay 1 to 2,000 0.01 to 10
Andesite 4 Fine-Grained Porphyritic Rock with Plagioclase Phenocrysts > 3,000 <0.01
Monzonite 4 Quartz Monzonite with Fracture Controlled Sulfide Mineralization; Other Common Minerals Include Magnetite, Fluorite, Calcite, and Apatite
> 3,000 0.01 to 0.1
1 - Dunn (1982); Finch et al. (2008) 2 - Hedlund (1975) 3 - Seager et al. (1982); Hawley and Kennedy (2004) 4 - Dunn (1982); SRK (1997); JSAI (work in progress)
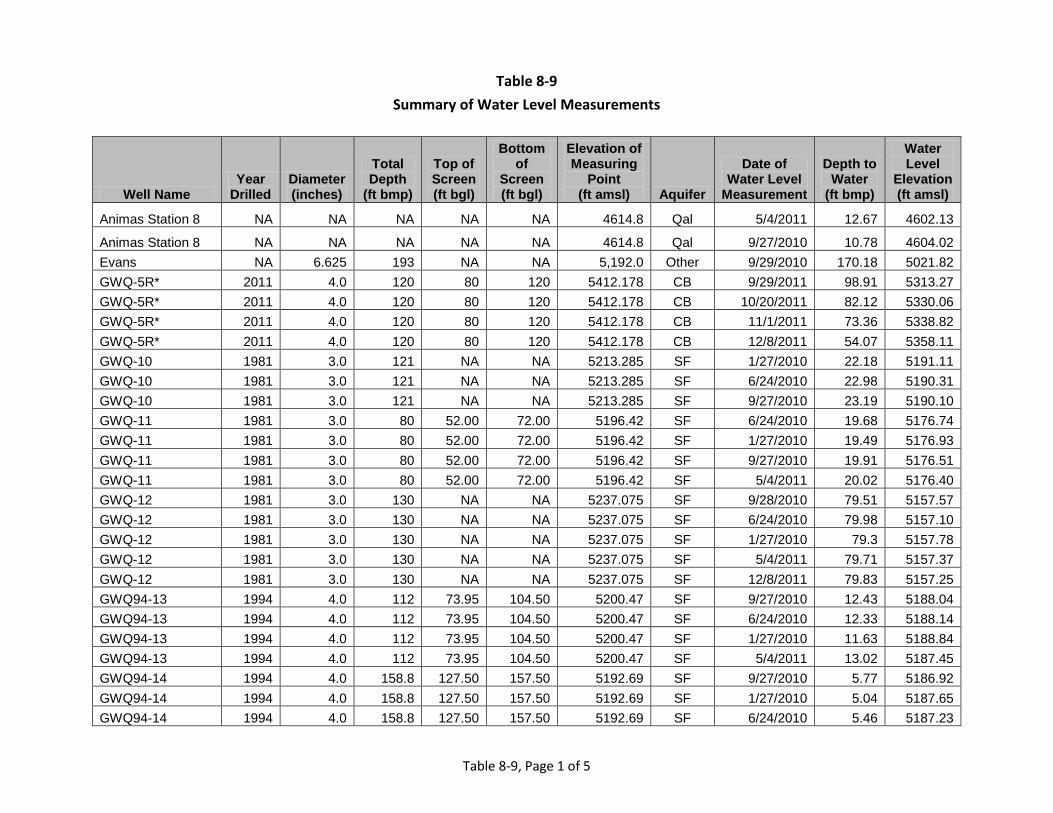
Table 8-9, Page 1 of 5
Table 8-9 Summary of Water Level Measurements
Well Name Year
Drilled Diameter (inches)
Total Depth
(ft bmp)
Top of Screen (ft bgl)
Bottom of
Screen (ft bgl)
Elevation of Measuring
Point (ft amsl) Aquifer
Date of Water Level
Measurement
Depth to Water
(ft bmp)
Water Level
Elevation (ft amsl)
Animas Station 8 NA NA NA NA NA 4614.8 Qal 5/4/2011 12.67 4602.13
Animas Station 8 NA NA NA NA NA 4614.8 Qal 9/27/2010 10.78 4604.02 Evans NA 6.625 193 NA NA 5,192.0 Other 9/29/2010 170.18 5021.82 GWQ-5R* 2011 4.0 120 80 120 5412.178 CB 9/29/2011 98.91 5313.27 GWQ-5R* 2011 4.0 120 80 120 5412.178 CB 10/20/2011 82.12 5330.06 GWQ-5R* 2011 4.0 120 80 120 5412.178 CB 11/1/2011 73.36 5338.82 GWQ-5R* 2011 4.0 120 80 120 5412.178 CB 12/8/2011 54.07 5358.11 GWQ-10 1981 3.0 121 NA NA 5213.285 SF 1/27/2010 22.18 5191.11 GWQ-10 1981 3.0 121 NA NA 5213.285 SF 6/24/2010 22.98 5190.31 GWQ-10 1981 3.0 121 NA NA 5213.285 SF 9/27/2010 23.19 5190.10 GWQ-11 1981 3.0 80 52.00 72.00 5196.42 SF 6/24/2010 19.68 5176.74 GWQ-11 1981 3.0 80 52.00 72.00 5196.42 SF 1/27/2010 19.49 5176.93 GWQ-11 1981 3.0 80 52.00 72.00 5196.42 SF 9/27/2010 19.91 5176.51 GWQ-11 1981 3.0 80 52.00 72.00 5196.42 SF 5/4/2011 20.02 5176.40 GWQ-12 1981 3.0 130 NA NA 5237.075 SF 9/28/2010 79.51 5157.57 GWQ-12 1981 3.0 130 NA NA 5237.075 SF 6/24/2010 79.98 5157.10 GWQ-12 1981 3.0 130 NA NA 5237.075 SF 1/27/2010 79.3 5157.78 GWQ-12 1981 3.0 130 NA NA 5237.075 SF 5/4/2011 79.71 5157.37 GWQ-12 1981 3.0 130 NA NA 5237.075 SF 12/8/2011 79.83 5157.25 GWQ94-13 1994 4.0 112 73.95 104.50 5200.47 SF 9/27/2010 12.43 5188.04 GWQ94-13 1994 4.0 112 73.95 104.50 5200.47 SF 6/24/2010 12.33 5188.14 GWQ94-13 1994 4.0 112 73.95 104.50 5200.47 SF 1/27/2010 11.63 5188.84 GWQ94-13 1994 4.0 112 73.95 104.50 5200.47 SF 5/4/2011 13.02 5187.45 GWQ94-14 1994 4.0 158.8 127.50 157.50 5192.69 SF 9/27/2010 5.77 5186.92 GWQ94-14 1994 4.0 158.8 127.50 157.50 5192.69 SF 1/27/2010 5.04 5187.65 GWQ94-14 1994 4.0 158.8 127.50 157.50 5192.69 SF 6/24/2010 5.46 5187.23

Table 8-9, Page 2 of 5
Well Name Year
Drilled Diameter (inches)
Total Depth
(ft bmp)
Top of Screen (ft bgl)
Bottom of
Screen (ft bgl)
Elevation of Measuring
Point (ft amsl) Aquifer
Date of Water Level
Measurement
Depth to Water
(ft bmp)
Water Level
Elevation (ft amsl)
GWQ94-14 1994 4.0 158.8 127.50 157.50 5192.69 SF 10/5/2010 5.77 5186.92 GWQ94-14 1994 4.0 158.8 127.50 157.50 5192.69 SF 5/4/2011 6.42 5186.27 GWQ94-15 1994 4.0 148.5 112.00 142.00 5183.07 SF 6/24/2010 4.48 5178.59 GWQ94-15 1994 4.0 148.5 112.00 142.00 5183.07 SF 9/27/2010 4 5179.07 GWQ94-15 1994 4.0 148.5 112.00 142.00 5183.07 SF 1/27/2010 3.73 5179.34 GWQ94-15 1994 4.0 148.5 112.00 142.00 5183.07 SF 5/4/2011 4.92 5178.15 GWQ94-16 1994 4.0 45.75 25.00 45.00 5197.41 SF 5/4/2011 21.26 5176.15 GWQ94-16 1994 4.0 45.75 25.00 45.00 5197.41 SF 1/29/2010 20.71 5176.70 GWQ94-16 1994 4.0 45.75 25.00 45.00 5197.41 SF 9/27/2010 21.13 5176.28 GWQ94-16 1994 4.0 45.75 25.00 45.00 5197.41 SF 6/24/2010 20.9 5176.51 GWQ94-17 1994 4.0 150.68 120.00 150.00 5198.13 SF 1/27/2010 9.35 5188.78 GWQ94-17 1994 4.0 150.68 120.00 150.00 5198.13 SF 6/24/2010 10.04 5188.09 GWQ94-17 1994 4.0 150.68 120.00 150.00 5198.13 SF 9/27/2010 10.11 5188.02 GWQ94-18 1994 4.0 60 10.00 50.00 5194.83 SF 6/24/2010 Dry Dry GWQ94-18 1994 4.0 60 10.00 50.00 5194.83 SF 9/27/2010 Dry Dry GWQ94-18 1994 4.0 60 10.00 50.00 5194.83 SF 1/27/2010 Dry Dry GWQ94-19 1994 4.0 54 10.00 50.00 5203.36 SF 6/24/2010 52.26 5151.10 GWQ94-19 1994 4.0 54 10.00 50.00 5203.36 SF 9/27/2010 52.22 5151.14 GWQ94-19 1994 4.0 54 10.00 50.00 5203.36 SF 1/27/2010 52.27 5151.09 GWQ94-20 1994 4.0 340 288.00 338.00 5203.49 SF 1/27/2010 18.05 5185.44 GWQ94-21A* 1994 2.0 263 213.00 263.00 5192.71 SF 12/8/2011 8.36 5184.35 GWQ94-21B* 1994 2.0 315 285.00 315.00 5192.22 SF 12/8/2011 8.05 5184.17 GWQ96-22A 1996 2.0 231.71 174.00 244.00 5596.17 CB 9/27/2010 48.59 5547.58 GWQ96-22A 1996 2.0 231.71 174.00 244.00 5596.17 CB 6/24/2010 48.52 5547.65 GWQ96-22A 1996 2.0 231.71 174.00 244.00 5596.17 CB 1/28/2010 53.69 5542.48 GWQ96-22A* 1996 2.0 231.71 174.00 244.00 5596.17 CB 6/30/2011 53.62 5542.55 GWQ96-22A* 1996 2.0 231.71 174.00 244.00 5596.17 CB 8/28/2011 54.63 5541.54 GWQ96-22A* 1996 2.0 231.71 174.00 244.00 5596.17 CB 9/8/2011 54.9 5541.27 GWQ96-22B 1996 2.0 420 340.00 380.00 5595.95 CB 10/7/2010 48.3 5547.65 GWQ96-22B* 1996 2.0 420 340.00 380.00 5595.95 CB 6/30/2011 52.95 5543.00

Table 8-9, Page 3 of 5
Well Name Year
Drilled Diameter (inches)
Total Depth
(ft bmp)
Top of Screen (ft bgl)
Bottom of
Screen (ft bgl)
Elevation of Measuring
Point (ft amsl) Aquifer
Date of Water Level
Measurement
Depth to Water
(ft bmp)
Water Level
Elevation (ft amsl)
GWQ96-22B* 1996 2.0 420 340.00 380.00 5595.95 CB 8/28/2011 54.59 5541.36 GWQ96-22B* 1996 2.0 420 340.00 380.00 5595.95 CB 9/8/2011 54.76 5541.19 GWQ96-23A 1996 2.0 102.24 50.00 100.00 5489.84 CB 6/24/2010 41.97 5447.87 GWQ96-23A 1996 2.0 102.24 50.00 100.00 5489.84 CB 10/6/2010 41.8 5448.04 GWQ96-23A 1996 2.0 102.24 50.00 100.00 5489.84 CB 1/28/2010 42.15 5447.69 GWQ96-23A 1996 2.0 102.24 50.00 100.00 5489.84 CB 5/4/2011 42.02 5447.82 GWQ96-23A 1996 2.0 102.24 50.00 100.00 5489.84 CB 9/27/2010 41.8 5448.04 GWQ96-23A* 1996 2.0 102.24 50.00 100.00 5489.84 CB 6/30/2011 40.32 5449.52 GWQ96-23A* 1996 2.0 102.24 50.00 100.00 5489.84 CB 8/28/2011 40.71 5449.13 GWQ96-23A* 1996 2.0 102.24 50.00 100.00 5489.84 CB 9/8/2011 40.74 5449.10 GWQ96-23B 1996 2.0 250.9 150.00 250.00 5489.70 CB 5/4/2011 41.99 5447.71 GWQ96-23B 1996 2.0 250.9 150.00 250.00 5489.70 CB 10/6/2010 41.72 5447.98 GWQ96-23B* 1996 2.0 250.9 150.00 250.00 5489.70 CB 6/30/2011 40.37 5449.33 GWQ96-23B* 1996 2.0 250.9 150.00 250.00 5489.70 CB 8/28/2011 40.87 5448.83 GWQ96-23B* 1996 2.0 250.9 150.00 250.00 5489.70 CB 9/8/2011 41.06 5448.64 GWQ11-24A* 2011 2.0 90 60.00 90.00 5517.37 CB 8/28/2011 52.74 5464.63 GWQ11-24A* 2011 2.0 90 60.00 90.00 5517.37 CB 9/7/2011 58.8 5458.57 GWQ11-24A* 2011 2.0 90 60.00 90.00 5517.37 CB 10/20/2011 55.92 5461.45 GWQ11-24A* 2011 2.0 90 60.00 90.00 5517.37 CB 11/1/2011 55.91 5461.46 GWQ11-24B* 2011 2.0 250 230.00 250.00 5517.26 CB 8/28/2011 59.57 5457.69 GWQ11-24B* 2011 2.0 250 230.00 250.00 5517.26 CB 9/7/2011 60.15 5457.11 GWQ11-24B* 2011 2.0 250 230.00 250.00 5517.26 CB 10/20/2011 59.99 5457.27 GWQ11-24B* 2011 2.0 250 230.00 250.00 5517.26 CB 11/1/2011 59.95 5457.31 GWQ11-25A* 2011 2.0 100 70.00 100.00 5533.60 CB 8/28/2011 50.91 5482.69 GWQ11-25A* 2011 2.0 100 70.00 100.00 5533.60 CB 9/7/2011 57.41 5476.19 GWQ11-25A* 2011 2.0 100 70.00 100.00 5533.60 CB 10/20/2011 62.15 5471.45 GWQ11-25A* 2011 2.0 100 70.00 100.00 5533.60 CB 11/1/2011 63.12 5470.48 GWQ11-25B* 2011 2.0 242 222.00 242.00 5533.41 CB 8/28/2011 62.9 5470.51 GWQ11-25B* 2011 2.0 242 222.00 242.00 5533.41 CB 9/7/2011 66.22 5467.19 GWQ11-25B* 2011 2.0 242 222.00 242.00 5533.41 CB 10/20/2011 67.25 5466.16

Table 8-9, Page 4 of 5
Well Name Year
Drilled Diameter (inches)
Total Depth
(ft bmp)
Top of Screen (ft bgl)
Bottom of
Screen (ft bgl)
Elevation of Measuring
Point (ft amsl) Aquifer
Date of Water Level
Measurement
Depth to Water
(ft bmp)
Water Level
Elevation (ft amsl)
GWQ11-25B* 2011 2.0 242 222.00 242.00 5533.41 CB 11/1/2011 67.7 5465.71 Highway Well 1934 0.0 NA NA NA 5210.962 SF 1/27/2010 22.1 5188.86 Highway Well 1934 0.0 NA NA NA 5210.962 SF 5/4/2011 22.88 5188.08 Highway Well West NA NA NA NA NA 5210.624 SF 5/4/2011 98.74 5111.88 IW-1 1982 4.0 49 NA 49.00 5198.99 SF 6/24/2010 36.11 5162.88 IW-1 1982 4.0 49 NA 49.00 5198.99 SF 9/27/2010 Dry Dry IW-2 1982 4.0 46.45 NA 45.00 5208.01 SF 5/4/2011 39.01 5169.00 IW-2 1982 4.0 46.45 NA 45.00 5208.01 SF 1/31/2010 37.41 5170.60 IW-2 1982 4.0 46.45 NA 45.00 5208.01 SF 9/27/2010 38.63 5169.38 IW-2 1982 4.0 46.45 NA 45.00 5208.01 SF 6/24/2010 37.82 5170.19 IW-3 1982 4.0 45 NA 45.00 5213.17 SF 9/27/2010 Dry Dry IW-3 1982 4.0 45 NA 45.00 5213.17 SF 1/31/2010 Dry Dry IW-3 1982 4.0 45 NA 45.00 5213.17 SF 6/24/2010 Dry Dry Ladder Airstrip NA NA NA NA NA 4998.231 SF 9/29/2010 285.31 4712.92 LRG 04158 1955 NA 150 NA NA 5533.066 CB 11/11/2010 47.01 5486.06 LRG 04159 2002 NA 200 160.00 200.00 5719.69 CB 11/4/2010 13.56 5706.13 MW-2 1975 8.0 1500 133 1500 5007.39 SF 5/12/2011 154.73 4852.66 MW-4 1975 6.0 2000 123 1500 5125.0 SF 5/13/2011 77.14 5047.86 MW-6 1975 6.0 1112 310.00 1000.00 4768.33 SF 12/9/2011 214.45 4553.88 MW-8 1975 6.0 1004 366.00 1000.00 5023.65 SF 10/5/2010 357.8 4665.85 MW-9 1994 4.0 252.2 200.00 250.00 4454.32 SF 9/27/2010 74.6 4379.72 MW-9 1994 4.0 252.2 200.00 250.00 4454.32 SF 5/4/2011 74.64 4379.68 MW-9 1994 4.0 252.2 200.00 250.00 4454.32 SF 7/7/2010 74.88 4379.44 MW-9* 1994 4.0 252.2 200.00 250.00 4454.32 SF 12/8/2011 75.1 4379.22 MW-10 1994 4.0 125 80 120 4453.672 SF 5/4/2011 72.56 4381.11 MW-10* 1994 4.0 125 80 120 4453.672 SF 6/28/2011 73.30 4380.37 MW-10* 1994 4.0 125 80 120 4453.672 SF 12/8/2011 73.31 4380.36 MW-11 1994 4.0 65 12.00 32.00 4454.00 Qal 9/27/2010 12.06 4441.94 MW-11 1994 4.0 65 12.00 32.00 4454.00 Qal 7/7/2010 11.77 4442.23 MW-11 1994 4.0 65 12.00 32.00 4454.00 Qal 5/4/2011 12.46 4441.54

Table 8-9, Page 5 of 5
Well Name Year
Drilled Diameter (inches)
Total Depth
(ft bmp)
Top of Screen (ft bgl)
Bottom of
Screen (ft bgl)
Elevation of Measuring
Point (ft amsl) Aquifer
Date of Water Level
Measurement
Depth to Water
(ft bmp)
Water Level
Elevation (ft amsl)
MW-11* 1994 4.0 65 12.00 32.00 4454.00 Qal 6/28/2011 13.95 4440.05 MW-11* 1994 4.0 65 12.00 32.00 4454.00 Qal 12/8/2011 14.17 4439.83 NP-1 1981 2.0 105.99 NA 106.00 5188.75 SF 5/4/2011 30.8 5157.95 NP-1 1981 2.0 105.99 NA 106.00 5188.75 SF 6/24/2010 31.15 5157.60 NP-1 1981 2.0 105.99 NA 106.00 5188.75 SF 9/27/2010 29.7 5159.05 NP-1 1981 2.0 105.99 NA 106.00 5188.75 SF 1/31/2010 30.36 5158.39 NP-2 1981 2.0 98.25 NA 110.00 5192.54 SF 5/4/2011 32.92 5159.62 NP-2 1981 2.0 98.25 NA 110.00 5192.54 SF 6/24/2010 33.23 5159.31 NP-2 1981 2.0 98.25 NA 110.00 5192.54 SF 1/31/2010 32.27 5160.27 NP-2 1981 2.0 98.25 NA 110.00 5192.54 SF 9/27/2010 31.49 5161.05 NP-3 1981 4.0 79.38 80.00 95.00 5199.73 SF 6/24/2010 11.4 5188.33 NP-3 1981 4.0 79.38 80.00 95.00 5199.73 SF 5/4/2011 12.02 5187.71 NP-3 1981 4.0 79.38 80.00 95.00 5199.73 SF 9/27/2010 11.45 5188.28 NP-4 1981 4.0 102.2 97.00 112.00 5225.73 SF 5/4/2011 35.22 5190.51 NP-4 1981 4.0 102.2 97.00 112.00 5225.73 SF 6/24/2010 34.35 5191.38 NP-4 1981 4.0 102.2 97.00 112.00 5225.73 SF 9/27/2010 34.61 5191.12 NP-4 1981 4.0 102.2 97.00 112.00 5225.73 SF 1/31/2010 33.51 5192.22 NP-5 1981 2.0 44 24.00 39.00 5198.81 Qb 5/4/2011 22.63 5176.18 NP-5 1981 2.0 44 24.00 39.00 5198.81 Qb 9/27/2010 22.56 5176.25 NP-5 1981 2.0 44 24.00 39.00 5198.81 Qb 6/24/2010 22.28 5176.53 Pague 1936 NA 26 NA NA 5550.814 CB 5/4/2011 11.69 5539.12 PW-1* 1975 16.0 960 368 951 4707.673 SF 12/8/2011 328.25 4379.42 PW-2* 1976 16.0 1005 367 995 4685.703 SF 12/8/2011 306.8 4378.90 PW-3* 1976 16.0 970 380 965 4731.053 SF 12/8/2011 350.6 4380.45 PW-4* 1980 16.0 957 354 954 4668.966 SF 12/8/2011 289.38 4379.59 UNKNOWN NA 4.0 61.32 NA NA 5100.584 Qal 5/4/2011 32.76 5067.82
Notes: Qal = Quaternary aquifer; Qb = Quaternary basalt; SF = Santa Fe Group aquifer system; CB = Crystalline bedrock aquifer NA = not available; Dry = well was dry *Well gauged by NMCC after fourth quarter of baseline monitoring (May 2011).

Table 8-10, Page 1 of 2
Table 8-10 Summary of Quarterly Groundwater Quality Samples Collected by Well
Quarter Collection
Date Well Name Aquifer Q1 1/29/2010 GWQ94-14 SF 1/29/2010 GWQ94-15 SF 1/30/2010 GWQ96-22A CB 1/30/2010 GWQ96-23A CB 1/31/2010 IW-2 SF 1/31/2010 NP-1 SF 1/31/2010 NP-2 SF 1/31/2010 NP-4 SF
Number of Water Quality Samples Collected in Q1
8
Q2 7/2/2010 GWQ94-13 SF 6/29/2010 GWQ94-14 SF 6/29/2010 GWQ94-15 SF 6/29/2010 GWQ94-16 SF 7/6/2010 GWQ94-17 SF 7/1/2010 GWQ96-22A CB 7/1/2010 GWQ96-23A CB 6/29/2010 IW-2 SF 7/8/2010 MW-6 SF 7/7/2010 MW-9 SF 7/7/2010 MW-11 Qal 6/28/2010 NP-1 SF 6/28/2010 NP-2 SF 7/8/2010 NP-3 SF 7/2/2010 NP-4 SF 6/28/2010 NP-5 Qb
Number of Water Quality Samples Collected in Q2
16
Q3 11/5/2010 GWQ-4 CB 10/5/2010 GWQ94-13 SF 10/5/2010 GWQ94-14 SF 10/1/2010 GWQ94-15 SF 9/30/2010 GWQ94-16 SF 10/7/2010 GWQ96-22A CB 10/7/2010 GWQ96-22B CB 10/6/2010 GWQ96-23A CB 10/6/2010 GWQ96-23B CB 9/30/2010 IW-2 SF 11/4/2010 LRG 04159 CB 9/28/2010 MW-1 SF 9/28/2010 MW-2 SF 9/27/2010 MW-6 SF 10/12/2010 MW-8 SF

Table 8-10, Page 2 of 2
Quarter Collection
Date Well Name Aquifer 10/4/2010 MW-9 SF 10/4/2010 MW-11 Qal 10/5/2010 NP-1 SF 10/7/2010 NP-3 SF 9/30/2010 NP-5 Qb
Number of Water Quality Samples Collected in Q3
20
Q4 5/11/2011 GWQ94-13 SF 5/13/2011 GWQ94-14 SF 5/13/2011 GWQ94-15 SF 5/10/2011 GWQ94-16 SF 5/12/2011 GWQ96-23A CB 5/12/2011 GWQ96-23B CB 5/9/2011 IW-2 SF 5/11/2011 MW-9 SF 5/10/2011 MW-11 Qal 5/11/2011 NP-3 SF 5/10/2011 NP-5 Qb
Number of Water Quality Samples Collected in Q4 11
Total Number of Wells
Sampled 55
Notes: Qal = Quaternary aquifer Qb = Quaternary basalt SF = Santa Fe Group aquifer system CB = Crystalline bedrock aquifer

Table 8-11Groundwater Quality Analytical Results
Table 8-11, Page 1 of 34
Well NameCollection
Date Alka
linity
, Tot
al (A
s C
aCO
3) (m
g/L
CaC
O3)
Alum
inum
(mg/
L)
Antim
ony
(mg/
L)
Arse
nic
(mg/
L)
Bariu
m (m
g/L)
Bery
llium
(mg/
L)
Bica
rbon
ate
(mg/
L)
Boro
n (m
g/L)
Cad
miu
m (m
g/L)
Cal
cium
(mg/
L)
Car
bona
te (m
g/L)
Chl
orid
e (m
g/L)
Chr
omiu
m (m
g/L)
Cob
alt (
mg/
L)
Cop
per (
mg/
L)
Cya
nide
(mg/
L)
Fluo
ride
(mg/
L)
Iron
(mg/
L)
Lead
(mg/
L)
Mag
nesi
um (m
g/L)
Man
gane
se (m
g/L)
Mer
cury
(mg/
L)
Mol
ybde
num
(mg/
L)
Nic
kel (
mg/
L)
6/4/1976 228 <0.1 117 14.3 0.52 0.002 25.6 0.0034/9/1981 <0.1 <0.005 <0.1 285.7 0.025 <0.001 22 <0.005 0.7 0.58 <0.25 <0.005 <0.05 0.005 <0.01
1/20/1981 280.6 84 0 200 0.05 14.62/2/1981 276 74 0 20 1.7 20
3/27/1981 <0.01 <0.05 <0.01 0.6 <0.026/11/1981 <0.05 <0.005 <0.005 <0.1 <0.002 <0.1 <0.0005 <0.025 <0.05 <0.025 <0.05 <0.005 <0.03 <0.001 <0.05 <0.056/15/1981 <0.25 <0.002 <1 251 0.076 <0.01 81 0 22 <0.05 <0.05 <0.02 <0.05 0.51 <0.05 <0.05 12 <0.02 <0.001 <0.1 <0.052/25/1982 <0.005 22 <0.05 <0.01 0.3 0.14 0.063 <0.001 <0.053/30/1989 <0.1 <0.1 <0.1 280 <0.1 <0.1 84 20 <0.1 <0.05 <0.1 <0.1 <0.1 16 <0.05 <0.1 <0.17/19/1991 0.003 0.01 262.4 <0.005 88 0 21.1 <0.02 <0.02 0.58 <0.05 <0.005 18 <0.02 <0.00023/31/1993 <0.01 <0.005 <0.5 297 0.03 <0.002 82 0 22 <0.02 <0.05 <0.01 <0.01 0.54 <0.05 <0.02 21 <0.02 <0.001 <0.02 <0.015/25/1994 0.025 <0.005 <0.005 <0.1 270 <0.0005 80 0 22 <0.025 <0.025 0.52 <0.05 <0.005 18 <0.03 <0.001 <0.057/21/1994 <0.05 0.0052 <0.005 <0.1 <0.002 278 <0.1 <0.0005 95 0 25 <0.025 <0.05 <0.025 0.52 <0.05 <0.005 19 <0.03 <0.001 <0.05 <0.056/15/1981 <0.01 <0.01 <0.2 242 <0.1 <0.005 102 0 20 <0.01 <0.1 <0.05 <0.01 0.5 <0.1 <0.02 16 <0.05 0.0013 <0.05 <0.056/25/1981 <0.025 <0.002 <1 261 0.162 <0.01 98 <1 24.8 <0.05 <0.05 <0.02 <0.05 0.48 0.1 <0.05 11.4 <0.02 <0.001 <0.1 <0.053/27/1981 <0.01 <0.05 <0.01 0.6 <0.026/15/1981 <0.25 0.004 <1 354 0.108 <0.01 138 <1 40.1 <0.05 <0.05 <0.02 <0.05 0.72 <0.05 <0.05 25.8 0.02 <0.001 <0.1 <0.052/25/1982 <0.005 56 <0.05 <0.01 0.6 <0.1 <0.05 <0.001 <0.055/12/1982 <0.005 56 <0.05 <0.01 0.7 <0.1 <0.05 <0.001 <0.056/30/1982 <0.005 48 <0.05 <0.01 0.7 <0.1 <0.05 <0.001 <0.05
12/23/1982 <0.005 64 <0.05 <0.01 0.7 <0.1 <0.05 <0.001 <0.052/21/1983 <0.005 68 <0.05 <0.01 0.7 <0.1 <0.05 <0.001 <0.055/13/1983 <0.005 82 <0.05 <0.01 0.6 <0.1 <0.05 <0.001 0.118/9/1983 <0.005 78 <0.05 <0.01 0.7 0.11 <0.05 <0.001 <0.05
11/1/1983 <0.005 90 <0.05 <0.01 0.7 <0.1 <0.05 <0.001 <0.053/16/1984 <0.005 74 <0.05 <0.01 0.3 <0.1 <0.05 <0.001 <0.056/10/1981 <0.01 <0.01 <0.2 376 <0.1 <0.005 137 0 30 <0.01 <0.05 <0.05 <0.01 0.6 <0.1 <0.02 27 <0.05 <0.001 <0.05 <0.0511/6/1981 <0.01 <0.01 <0.2 <0.1 <0.005 72 22 <0.01 <0.02 <0.05 <0.01 0.7 <0.1 <0.02 <0.05 <0.001 <0.05 <0.054/1/1993 <0.1 <0.005 1 404 0.02 <0.002 125 0 27 <0.02 <0.05 <0.01 <0.01 0.73 0.2 <0.02 23 <0.02 <0.001 <0.02 <0.01
5/26/1994 <0.025 <0.005 <0.005 <0.1 316 <0.1 <0.0005 93 0 30 <0.025 <0.05 <0.025 0.63 0.13 <0.005 22 <0.03 <0.001 <0.05 <0.0511/5/2010 310 <0.02 <0.001 <0.001 0.057 <0.002 310 <0.04 <0.002 120 <2 72 <0.006 <0.006 0.0075 <0.01 0.73 0.059 <0.005 25 0.029 <0.0002 <0.008 <0.01
GWQ-5 6/15/1981 <0.01 <0.01 <0.2 398 <0.1 <0.005 200 0 42 <0.01 <0.05 <0.05 <0.01 1 <0.1 <0.02 49 <0.05 <0.001 <0.05 <0.056/15/1981 <0.25 <0.002 <1 309 0.135 <0.01 68 <0.1 32.6 <0.05 <0.05 <0.02 <0.05 1.09 <0.05 <0.05 11.1 0.076 0.00235 <0.1 <0.052/25/1982 <0.005 102 <0.05 <0.01 1.1 <0.1 <0.05 <0.001 <0.054/1/1993 <0.1 <0.005 0.6 322 0.09 <0.002 49 0 22 <0.02 <0.05 0.03 <0.01 0.84 5.05 <0.02 14 0.36 <0.001 <0.02 <0.01
1/20/1981 341.6 96 0 200 0.03 14.62/2/1981 278 74 0 20 3.8 27
3/27/1981 <0.01 <0.05 <0.01 0.6 <0.024/6/1981 0.003 <0.05 0.36 0.59 <0.01
6/15/1981 <0.25 <0.002 <1 285 0.065 <0.01 88 <1 24.5 <0.05 <0.05 <0.02 <0.05 0.53 <0.05 <0.05 15.7 <0.02 <0.001 <0.1 <0.058/7/1981 268.4 80 100 0.02 19.4
GWQ-7
15.6.31.431
GWQ-1
GWQ-2
GWQ-3
GWQ-4
GWQ-6

Table 8-11Groundwater Quality Analytical Results
Table 8-11, Page 2 of 34
Well NameCollection
Date6/4/19764/9/1981
1/20/19812/2/1981
3/27/19816/11/19816/15/19812/25/19823/30/19897/19/19913/31/19935/25/19947/21/19946/15/19816/25/19813/27/19816/15/19812/25/19825/12/19826/30/1982
12/23/19822/21/19835/13/19838/9/1983
11/1/19833/16/19846/10/198111/6/19814/1/1993
5/26/199411/5/2010
GWQ-5 6/15/19816/15/19812/25/19824/1/1993
1/20/19812/2/1981
3/27/19814/6/1981
6/15/19818/7/1981
GWQ-7
15.6.31.431
GWQ-1
GWQ-2
GWQ-3
GWQ-4
GWQ-6
Nitr
ate
(As
N)+
Nitr
ite (A
s N
) (m
g/L)
Nitr
ate
as N
(NO
3)
(mg/
L)
Nitr
ogen
, Nitr
ate
(As
N) (
mg/
L)
Nitr
ogen
, Nitr
ite(A
s N
) (m
g/L)
pH Pota
ssiu
m (m
g/L)
Sele
nium
(mg/
L)
Silic
on (m
g/L)
Silv
er (m
g/L)
Sodi
um (m
g/L)
Spec
ific
Con
duct
ance
(µ
mho
s/cm
)
Sulfa
te (m
g/L)
Susp
ende
d So
lids
(mg/
L)
Thal
lium
(mg/
L)
Tota
l Dis
solv
ed
Solid
s (m
g/L)
Ura
nium
(mg/
L)
Vana
dium
(mg/
L)
Zinc
(mg/
L)
1.39 7.78 1.78 50.4 720 137 5201.14 <0.005 144.5 0.14
7.3 632 250 4507.9 60 156 520
5.5 0.16<0.005 <0.025 <0.005 <0.05
3.75 7.4 3.06 0.0022 <0.02 49.1 700 117 <0.005 500 0.0780.2 7.9 <0.005 84 410
3 <0.1 61 133 512 <0.15.19 7.34 2.7 <0.002 <0.02 39.6 799 136.4 5434.9 7.7 2.1 <0.005 <0.01 67 822 160 536 <0.014.3 7.9 2.7 <0.005 <0.025 55 760 150 614 <0.054.2 7.97 2.7 <0.005 <0.025 66 861 162 <0.005 558 <0.055.6 7.3 2.3 <0.005 <0.02 42 700 140 530 0.164.3 2.96 0.0022 <0.02 41.2 111 448 0.115.5 0.160.25 7 2.66 0.0037 <0.02 86 1100 335 868 0.0610.4 7.9 <0.005 490 10400.2 7.9 <0.005 410 9300.4 7.6 <0.005 365 8600.2 8.5 <0.005 340 9900.2 7.7 <0.005 428 9700.3 8 <0.005 437 980
<0.2 7.8 <0.005 385 10600.3 8 <0.005 529 12403.4 8.2 <0.005 530 11901.1 7.2 1.2 <0.005 <0.02 91 1000 270 770 0.0562 7.9 <0.005 <0.02 162 500 0.28
0.1 7.6 1 <0.005 <0.01 86 1060 235 702 0.38<1 8.08 1.8 <0.005 <0.025 74 1010 220 926 0.56
1.8 <0.1 7.53 1.2 0.0059 11 <0.005 110 1200 230 11 <0.001 798 0.0037 <0.05 0.140.6 7.3 1.1 <0.005 <0.02 173 1500 575 1260 0.0643.3 7.3 2.4 0.0046 <0.02 57 600 40.5 400 <0.0250.5 8.3 <0.005 220 8101.1 7.7 3.1 <0.005 <0.01 53 597 10 304 0.03
7.2 781 350 5007.9 51 156 530
1.4 0.280.9 0.240.54 7.2 2.33 <0.0005 <0.02 47.9 700 110 496 0.278
7.4 138.9 150 475

Table 8-11Groundwater Quality Analytical Results
Table 8-11, Page 3 of 34
Well NameCollection
Date Alka
linity
, Tot
al (A
s C
aCO
3) (m
g/L
CaC
O3)
Alum
inum
(mg/
L)
Antim
ony
(mg/
L)
Arse
nic
(mg/
L)
Bariu
m (m
g/L)
Bery
llium
(mg/
L)
Bica
rbon
ate
(mg/
L)
Boro
n (m
g/L)
Cad
miu
m (m
g/L)
Cal
cium
(mg/
L)
Car
bona
te (m
g/L)
Chl
orid
e (m
g/L)
Chr
omiu
m (m
g/L)
Cob
alt (
mg/
L)
Cop
per (
mg/
L)
Cya
nide
(mg/
L)
Fluo
ride
(mg/
L)
Iron
(mg/
L)
Lead
(mg/
L)
Mag
nesi
um (m
g/L)
Man
gane
se (m
g/L)
Mer
cury
(mg/
L)
Mol
ybde
num
(mg/
L)
Nic
kel (
mg/
L)
8/10/1981 <0.01 229 68 24 <0.05 <0.01 0.6 1.7 <0.02 2110/23/1981 <0.01 <0.01 <0.02 <0.1 <0.005 71 26 <0.01 <0.02 <0.05 <0.01 0.5 0.14 <0.02 <0.05 <0.001 <0.05 <0.0511/6/1981 <0.01 <0.01 <0.2 <0.1 <0.005 71 24 <0.01 <0.02 <0.05 <0.01 0.8 <0.1 <0.02 <0.05 <0.001 <0.05 <0.052/25/1982 <0.005 26 <0.05 <0.01 0.5 0.17 <0.05 <0.001 <0.05
12/28/1982 <0.005 20 <0.05 <0.01 0.3 0.26 0.16 <0.001 <0.052/21/1983 <0.005 22 <0.05 <0.01 0.4 <0.1 0.27 <0.001 <0.053/16/1983 <0.055/13/1983 <0.005 20 <0.05 <0.01 0.6 <0.1 <0.05 <0.001 <0.058/9/1983 <0.005 22 <0.05 <0.01 0.6 <0.1 <0.05 <0.001 <0.05
11/1/1983 <0.005 22 <0.05 <0.01 0.6 <0.1 <0.05 <0.001 <0.053/16/1984 <0.005 20 <0.05 <0.01 0.8 <0.1 <0.05 <0.001 0.085/30/1984 <0.005 20 <0.05 0.02 0.6 <0.1 <0.05 <0.001 <0.059/12/1984 <0.005 20 <0.05 <0.01 0.6 <0.1 <0.05 <0.001 <0.05
11/27/1984 <0.005 18 <0.05 <0.01 0.6 <0.1 <0.05 <0.001 <0.055/17/1985 20
11/13/1985 185/23/1986 2210/8/1986 223/30/1989 <0.1 <0.1 <0.1 278 <0.1 <0.1 80 15.9 <0.1 <0.05 <0.1 <0.1 <0.1 22 <0.05 <0.1 <0.13/30/1993 <0.1 <0.005 <0.5 298 0.04 <0.002 68 0 21 <0.02 <0.05 <0.01 <0.01 0.56 <0.05 <0.02 31 <0.02 <0.001 <0.02 <0.015/25/1994 0.25 <0.005 <0.005 <0.1 480 0.00058 490 0 20 <0.025 0.11 2.1 0.72 <0.005 51 1.1 <0.001 <0.057/21/1994 <0.05 <0.005 <0.005 <0.1 <0.002 349 <0.1 <0.0005 14 0 22 <0.025 <0.05 <0.025 16 1.2 <0.005 8.2 0.21 <0.001 <0.05 <0.056/4/1976 241 <0.1 122 16.7 0.51 0.002 15.5 0.0032/2/1981 276 74 20 1.7 20
8/19/1981 <0.25 <0.004 <1 283 0.076 <0.01 72.9 <1 24 <0.05 <0.05 <0.05 <0.05 0.59 <0.1 <0.05 12.1 0.047 <1 <0.1 <0.052/25/1982 <0.005 38 <0.05 <0.01 1 <0.1 0.17 <0.001 <0.053/31/1993 <0.05 <0.005 0.042 262 <0.1 <0.0005 149 <1 22 <0.01 <0.01 <0.01 <0.01 0.53 0.038 <0.002 21 <0.01 <0.0002 <0.02 <0.025/25/1994 <0.025 <0.005 <0.005 <0.1 272 <0.1 <0.0005 120 0 41 <0.025 <0.05 <0.025 0.5 0.24 <0.005 20 <0.03 <0.001 <0.05 <0.056/4/1976 188 <0.1 69.2 19.9 0.44 0.004 15.2 0.001
1/20/1981 305 92 0 200 0.05 9.72/2/1981 273 73 0 20 1.8 24
3/27/1981 <0.01 <0.05 <0.01 0.6 <0.024/6/1981 0.002 <0.05 0.15 0.56 <0.018/7/1981 268.4 80 100 0.06 19.4
8/10/1981 <0.01 268 76 22 <0.05 <0.01 0.5 0.49 0.033 2010/8/1981 <0.25 <0.004 <1 302 0.044 <0.01 51.8 <1 22.4 <0.05 <0.05 <0.05 <0.05 0.6 <0.1 <0.05 17.1 <0.02 <1 <0.1 <0.052/25/1982 <0.005 26 <0.05 <0.01 0.5 <0.1 <0.05 <0.001 <0.05
12/28/1982 <0.005 20 <0.05 <0.01 0.5 <0.1 <0.05 <0.001 <0.052/21/1983 <0.005 20 <0.05 <0.01 0.5 <0.1 <0.05 <0.001 <0.055/13/1983 <0.005 20 <0.05 <0.01 0.5 <0.1 <0.05 <0.001 <0.05
GWQ-7
GWQ-9
GWQ-8

Table 8-11Groundwater Quality Analytical Results
Table 8-11, Page 4 of 34
Well NameCollection
Date8/10/1981
10/23/198111/6/19812/25/1982
12/28/19822/21/19833/16/19835/13/19838/9/1983
11/1/19833/16/19845/30/19849/12/1984
11/27/19845/17/1985
11/13/19855/23/198610/8/19863/30/19893/30/19935/25/19947/21/19946/4/19762/2/1981
8/19/19812/25/19823/31/19935/25/19946/4/1976
1/20/19812/2/1981
3/27/19814/6/19818/7/1981
8/10/198110/8/19812/25/1982
12/28/19822/21/19835/13/1983
GWQ-7
GWQ-9
GWQ-8
Nitr
ate
(As
N)+
Nitr
ite (A
s N
) (m
g/L)
Nitr
ate
as N
(NO
3)
(mg/
L)
Nitr
ogen
, Nitr
ate
(As
N) (
mg/
L)
Nitr
ogen
, Nitr
ite(A
s N
) (m
g/L)
pH Pota
ssiu
m (m
g/L)
Sele
nium
(mg/
L)
Silic
on (m
g/L)
Silv
er (m
g/L)
Sodi
um (m
g/L)
Spec
ific
Con
duct
ance
(µ
mho
s/cm
)
Sulfa
te (m
g/L)
Susp
ende
d So
lids
(mg/
L)
Thal
lium
(mg/
L)
Tota
l Dis
solv
ed
Solid
s (m
g/L)
Ura
nium
(mg/
L)
Vana
dium
(mg/
L)
Zinc
(mg/
L)
1.2 7.7 48 162 490 0.631.1 <0.005 <0.02 160 490 0.411.2 8.1 <0.005 <0.02 158 480 0.190.8 8 <0.005 162 510
<0.2 8.1 <0.005 40 2502.8 8.3 <0.005 47 250
1.2 8.1 <0.005 158 4701 8 <0.005 130 490
1.8 8.1 <0.005 137 5001 8.3 <0.005 140 450
0.9 7.7 <0.005 154 4701.4 8 <0.005 128 5001.4 7.7 <0.005 144 490
7.9 144 5007.8 137 4507.9 142 4907.4 116 460
2 <0.1 47 131 492 0.1138 7.8 1.6 <0.005 <0.01 52 752 138 482 0.1<1 7.26 14 <0.005 <0.025 80 2630 1300 2420 <0.05<1 7.72 13 <0.005 <0.025 47 660 <5 <0.005 224 <0.05
16.8 7.48 1.72 76.1 780 114 56060 7.9 156 5202.8 7.42 4.2 0.004 <0.02 84.1 134 608 0.690.3 7.6 <0.005 220 3805.7 7.7 3.5 <0.005 <0.01 94 1110 260 290 0.0755.3 7.97 2.4 <0.005 <0.025 76 1060 290 792 <0.054 8.6 1.56 30 480 34 350
7.4 703 300 4507.9 49 156 510
1.4 0.161.2 0.13
7.4 128.9 140 4501.4 8 47 148 470 0.960.96 7.22 3.3 <0.002 <0.02 71 133 476 0.350.9 8.3 <0.005 160 4301 7.8 <0.005 150 480
1.4 8 <0.005 161 4801.1 8.2 <0.005 158 460

Table 8-11Groundwater Quality Analytical Results
Table 8-11, Page 5 of 34
Well NameCollection
Date Alka
linity
, Tot
al (A
s C
aCO
3) (m
g/L
CaC
O3)
Alum
inum
(mg/
L)
Antim
ony
(mg/
L)
Arse
nic
(mg/
L)
Bariu
m (m
g/L)
Bery
llium
(mg/
L)
Bica
rbon
ate
(mg/
L)
Boro
n (m
g/L)
Cad
miu
m (m
g/L)
Cal
cium
(mg/
L)
Car
bona
te (m
g/L)
Chl
orid
e (m
g/L)
Chr
omiu
m (m
g/L)
Cob
alt (
mg/
L)
Cop
per (
mg/
L)
Cya
nide
(mg/
L)
Fluo
ride
(mg/
L)
Iron
(mg/
L)
Lead
(mg/
L)
Mag
nesi
um (m
g/L)
Man
gane
se (m
g/L)
Mer
cury
(mg/
L)
Mol
ybde
num
(mg/
L)
Nic
kel (
mg/
L)
8/9/1983 <0.005 20 <0.05 <0.01 0.5 <0.1 <0.05 <0.001 <0.0511/1/1983 <0.005 18 <0.05 <0.01 0.5 <0.1 <0.05 <0.001 <0.053/16/1984 <0.005 18 <0.05 <0.01 0.7 <0.1 <0.05 <0.001 <0.055/30/1984 <0.005 18 <0.05 <0.01 0.5 <0.1 <0.05 <0.001 <0.059/12/1984 <0.005 20 <0.05 <0.01 0.5 <0.1 <0.05 <0.001 <0.05
11/27/1984 <0.005 16 <0.05 <0.01 0.5 <0.1 <0.05 <0.001 <0.055/17/1985 20
11/13/1985 205/23/1986 3610/8/1986 204/6/1981 0.002 <0.01 <0.05 0.02 0.53 <0.01 <1
8/10/1981 10.2 <0.004 <1 219 0.016 <0.01 74 <1 23.5 <0.05 <0.05 <0.05 <0.05 1.14 2.31 <0.05 11.3 1.18 <1 <0.1 <0.0510/27/1981 <0.01 <0.01 <0.2 <0.1 <0.005 68 22 <0.01 <0.02 <0.05 <0.01 0.6 <0.01 <0.02 <0.05 <0.001 <0.05 <0.0510/30/1981 <0.25 <0.005 <1 0.77 <0.01 22.8 <0.05 <0.05 <0.05 <0.05 0.98 <1 <0.05 <0.02 <0.001 <0.1 <0.0211/6/1981 <0.01 <0.01 <0.2 <0.1 <0.005 72 22 <0.01 <0.02 <0.05 <0.01 0.7 <0.1 <0.02 <0.05 <0.001 <0.05 <0.05
11/13/1981 0.37 <0.005 0.25 275.6 0.037 0.001 84.2 22.85 <0.005 0.001 0.62 <0.005 17.45 0.5 <0.0005 <0.01 <0.0511/17/1981 <0.01 <0.01 <0.2 <0.1 <0.005 70 26 <0.01 <0.02 <0.05 <0.01 0.6 <0.1 <0.02 <0.05 <0.001 <0.05 <0.0511/23/1981 <0.01 <0.01 <0.2 <0.1 <0.005 70 26 <0.01 <0.02 <0.05 <0.01 0.6 <0.1 <0.02 <0.05 <0.001 <0.05 <0.0512/7/1981 <0.01 <0.01 <0.2 <0.1 <0.005 67 24 <0.01 <0.02 <0.05 <0.01 0.5 <0.1 <0.02 <0.05 <0.001 <0.05 <0.05
12/15/1981 <0.01 <0.01 <0.2 <0.1 <0.005 89 24 <0.01 <0.02 <0.05 <0.01 0.7 <0.1 <0.02 <0.05 <0.001 <0.05 <0.0512/22/1981 <0.01 <0.01 <0.2 <0.1 <0.005 85 24 <0.01 <0.02 <0.05 <0.01 0.5 <0.1 <0.02 <0.05 <0.001 <0.05 <0.05
1/5/1982 <0.01 <0.01 <0.2 <0.1 <0.005 80 22 <0.01 <0.02 <0.05 <0.01 0.6 0.13 <0.02 <0.05 <0.001 <0.05 <0.051/26/1982 <0.005 24 <0.05 <0.01 0.6 <0.1 <0.05 <0.001 <0.12/22/1982 <0.005 24 <0.05 <0.01 0.6 0.12 <0.05 <0.001 <0.054/26/1982 <0.005 20 <0.05 <0.01 0.6 0.41 <0.05 <0.001 <0.055/17/1982 <0.005 28 <0.05 <0.01 0.6 0.1 <0.05 <0.001 <0.056/8/1982 <0.005 22 <0.05 <0.01 0.5 <0.1 <0.05 <0.001 <0.05
6/30/1982 <0.005 20 <0.05 <0.01 0.6 0.62 <0.05 <0.001 <0.059/2/1982 278 <0.001 82.6 22.3 0.54 17 <0.05 <0.01
12/23/1982 <0.005 26 <0.05 <0.01 0.6 <0.1 <0.05 <0.001 <0.052/21/1983 <0.005 24 <0.05 <0.01 0.6 <0.1 <0.05 <0.001 <0.055/13/1983 <0.005 32 <0.05 0.02 0.6 <0.1 <0.05 <0.001 <0.058/9/1983 <0.005 36 <0.05 <0.01 0.6 <0.1 <0.05 <0.001 <0.05
11/1/1983 <0.005 34 <0.05 <0.01 0.6 0.17 <0.05 <0.001 <0.053/16/1984 <0.005 42 <0.05 <0.01 0.5 0.11 <0.05 <0.001 <0.055/30/1984 <0.005 56 <0.05 <0.01 0.5 <0.1 <0.05 <0.001 <0.059/12/1984 <0.005 68 <0.05 0.5 <0.1 <0.05 <0.001 <0.05
11/27/1984 <0.005 64 <0.05 <0.01 0.6 <0.1 <0.05 <0.001 <0.055/17/1985 52
11/13/1985 425/23/1986 5810/8/1986 54
GWQ-9
GWQ-10

Table 8-11Groundwater Quality Analytical Results
Table 8-11, Page 6 of 34
Well NameCollection
Date8/9/1983
11/1/19833/16/19845/30/19849/12/1984
11/27/19845/17/1985
11/13/19855/23/198610/8/19864/6/1981
8/10/198110/27/198110/30/198111/6/1981
11/13/198111/17/198111/23/198112/7/1981
12/15/198112/22/1981
1/5/19821/26/19822/22/19824/26/19825/17/19826/8/1982
6/30/19829/2/1982
12/23/19822/21/19835/13/19838/9/1983
11/1/19833/16/19845/30/19849/12/1984
11/27/19845/17/1985
11/13/19855/23/198610/8/1986
GWQ-9
GWQ-10
Nitr
ate
(As
N)+
Nitr
ite (A
s N
) (m
g/L)
Nitr
ate
as N
(NO
3)
(mg/
L)
Nitr
ogen
, Nitr
ate
(As
N) (
mg/
L)
Nitr
ogen
, Nitr
ite(A
s N
) (m
g/L)
pH Pota
ssiu
m (m
g/L)
Sele
nium
(mg/
L)
Silic
on (m
g/L)
Silv
er (m
g/L)
Sodi
um (m
g/L)
Spec
ific
Con
duct
ance
(µ
mho
s/cm
)
Sulfa
te (m
g/L)
Susp
ende
d So
lids
(mg/
L)
Thal
lium
(mg/
L)
Tota
l Dis
solv
ed
Solid
s (m
g/L)
Ura
nium
(mg/
L)
Vana
dium
(mg/
L)
Zinc
(mg/
L)
0.9 8 <0.005 135 4800.8 8.2 <0.005 132 4601.7 8.1 <0.005 132 4600.9 7.6 <0.005 154 4501.3 8 <0.005 132 4701.5 7.9 <0.005 132 470
8 149 4907.8 142 4507.9 137 4907.6 125 460
4.6 8.25 0.120.22 7.48 8.32 <0.002 <0.02 58.7 143 528 0.231.1 8.2 <0.005 <0.02 168 520 0.250.66 8.1 <0.002 <0.02 122 588 0.24
2 7.9 <0.005 <0.02 162 500 0.281.8 7.75 2.34 0.01 <0.001 39.1 700 140.9 <0.005 509 0.91.8 7.9 <0.005 <0.02 156 500 0.281.8 7.7 <0.005 <0.02 161 650 0.371.8 8.2 <0.005 <0.02 168 490 0.872.6 7.9 <0.005 <0.02 181 550 0.442.5 8.1 <0.005 <0.02 168 480 0.352.9 7.5 <0.005 <0.02 174 430 0.312.3 7.8 <0.005 162 4902.1 7.6 <0.005 161 5102 7.4 <0.005 168 840
2.3 7.7 <0.005 175 4902.2 8 <0.005 162 5003.3 8 <0.005 160 5102.25 7.3 2.73 <0.005 57.5 690 143.4 5061.7 8.5 <0.005 138 5002.4 7.9 <0.005 161 4702.4 8 <0.005 161 4802.4 7.9 <0.005 142 5104.8 8.1 <0.005 125 5003.5 8.2 <0.005 128 5003.3 7.5 <0.005 161 5304.2 7.8 <0.005 158 5804.9 7.7 <0.005 163 580
7.8 163 5707.7 149 5007.9 151 5607.5 137 550
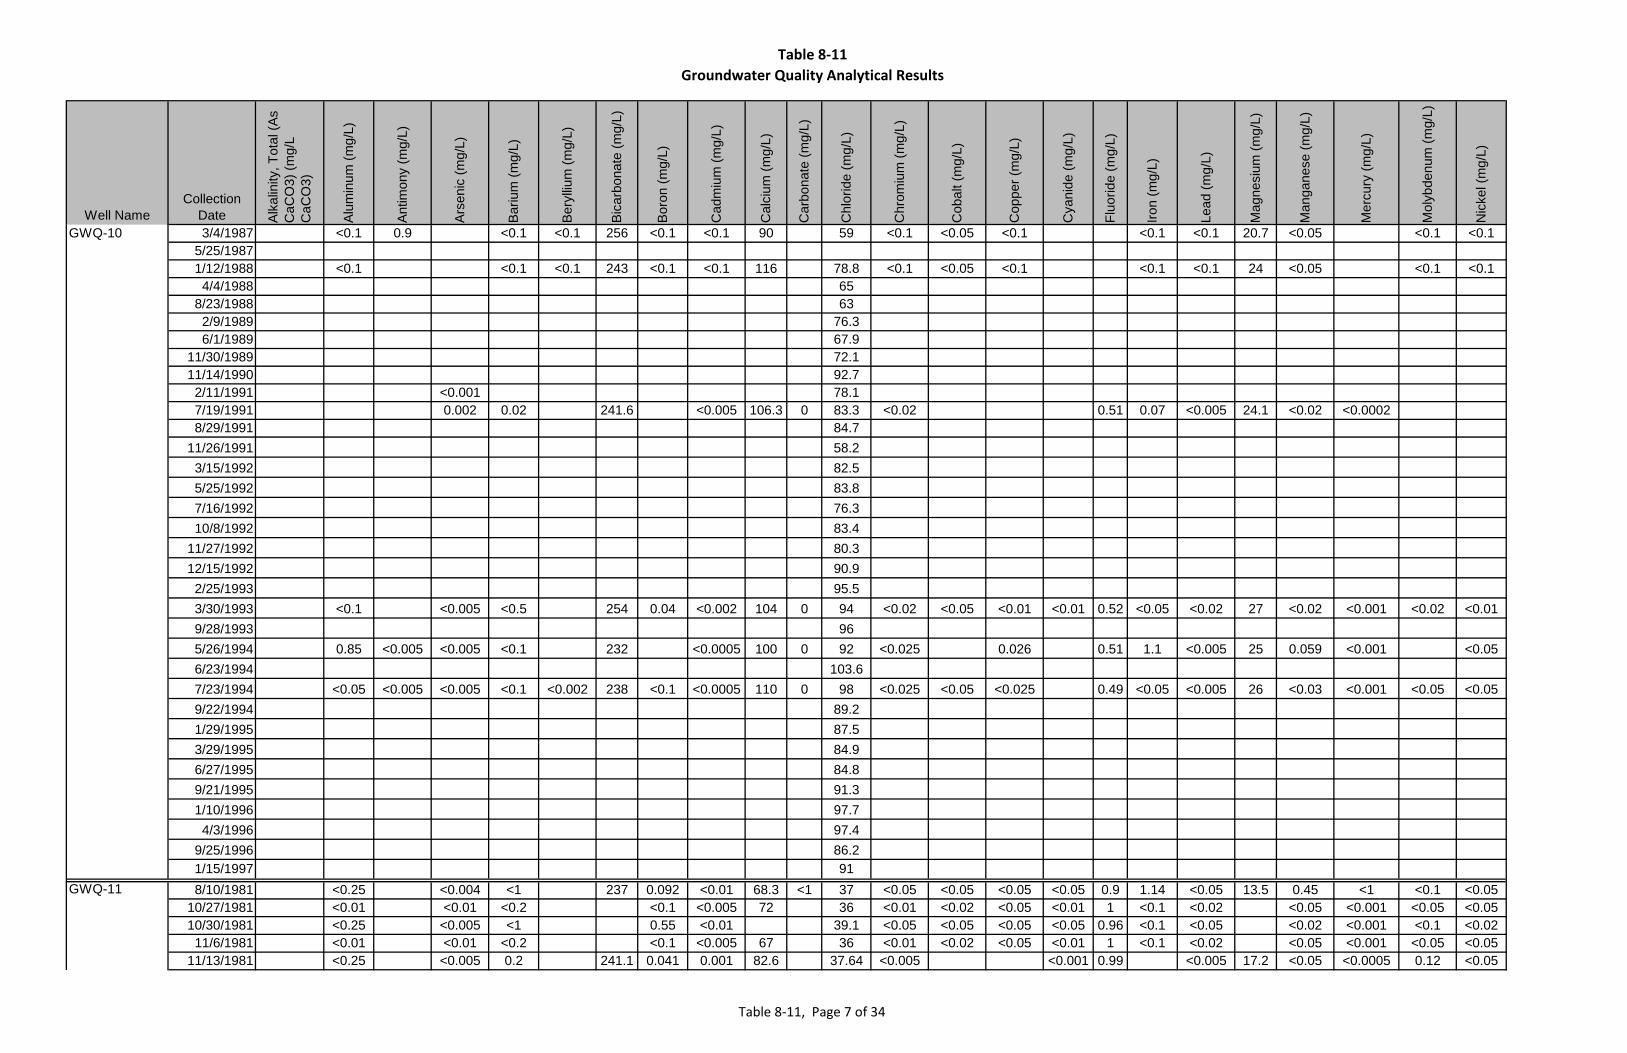
Table 8-11Groundwater Quality Analytical Results
Table 8-11, Page 7 of 34
Well NameCollection
Date Alka
linity
, Tot
al (A
s C
aCO
3) (m
g/L
CaC
O3)
Alum
inum
(mg/
L)
Antim
ony
(mg/
L)
Arse
nic
(mg/
L)
Bariu
m (m
g/L)
Bery
llium
(mg/
L)
Bica
rbon
ate
(mg/
L)
Boro
n (m
g/L)
Cad
miu
m (m
g/L)
Cal
cium
(mg/
L)
Car
bona
te (m
g/L)
Chl
orid
e (m
g/L)
Chr
omiu
m (m
g/L)
Cob
alt (
mg/
L)
Cop
per (
mg/
L)
Cya
nide
(mg/
L)
Fluo
ride
(mg/
L)
Iron
(mg/
L)
Lead
(mg/
L)
Mag
nesi
um (m
g/L)
Man
gane
se (m
g/L)
Mer
cury
(mg/
L)
Mol
ybde
num
(mg/
L)
Nic
kel (
mg/
L)
3/4/1987 <0.1 0.9 <0.1 <0.1 256 <0.1 <0.1 90 59 <0.1 <0.05 <0.1 <0.1 <0.1 20.7 <0.05 <0.1 <0.15/25/19871/12/1988 <0.1 <0.1 <0.1 243 <0.1 <0.1 116 78.8 <0.1 <0.05 <0.1 <0.1 <0.1 24 <0.05 <0.1 <0.14/4/1988 65
8/23/1988 632/9/1989 76.36/1/1989 67.9
11/30/1989 72.111/14/1990 92.72/11/1991 <0.001 78.17/19/1991 0.002 0.02 241.6 <0.005 106.3 0 83.3 <0.02 0.51 0.07 <0.005 24.1 <0.02 <0.00028/29/1991 84.7
11/26/1991 58.23/15/1992 82.55/25/1992 83.87/16/1992 76.310/8/1992 83.4
11/27/1992 80.312/15/1992 90.92/25/1993 95.53/30/1993 <0.1 <0.005 <0.5 254 0.04 <0.002 104 0 94 <0.02 <0.05 <0.01 <0.01 0.52 <0.05 <0.02 27 <0.02 <0.001 <0.02 <0.019/28/1993 965/26/1994 0.85 <0.005 <0.005 <0.1 232 <0.0005 100 0 92 <0.025 0.026 0.51 1.1 <0.005 25 0.059 <0.001 <0.056/23/1994 103.67/23/1994 <0.05 <0.005 <0.005 <0.1 <0.002 238 <0.1 <0.0005 110 0 98 <0.025 <0.05 <0.025 0.49 <0.05 <0.005 26 <0.03 <0.001 <0.05 <0.059/22/1994 89.21/29/1995 87.53/29/1995 84.96/27/1995 84.89/21/1995 91.31/10/1996 97.74/3/1996 97.4
9/25/1996 86.21/15/1997 918/10/1981 <0.25 <0.004 <1 237 0.092 <0.01 68.3 <1 37 <0.05 <0.05 <0.05 <0.05 0.9 1.14 <0.05 13.5 0.45 <1 <0.1 <0.05
10/27/1981 <0.01 <0.01 <0.2 <0.1 <0.005 72 36 <0.01 <0.02 <0.05 <0.01 1 <0.1 <0.02 <0.05 <0.001 <0.05 <0.0510/30/1981 <0.25 <0.005 <1 0.55 <0.01 39.1 <0.05 <0.05 <0.05 <0.05 0.96 <0.1 <0.05 <0.02 <0.001 <0.1 <0.0211/6/1981 <0.01 <0.01 <0.2 <0.1 <0.005 67 36 <0.01 <0.02 <0.05 <0.01 1 <0.1 <0.02 <0.05 <0.001 <0.05 <0.05
11/13/1981 <0.25 <0.005 0.2 241.1 0.041 0.001 82.6 37.64 <0.005 <0.001 0.99 <0.005 17.2 <0.05 <0.0005 0.12 <0.05
GWQ-10
GWQ-11

Table 8-11Groundwater Quality Analytical Results
Table 8-11, Page 8 of 34
Well NameCollection
Date3/4/1987
5/25/19871/12/19884/4/1988
8/23/19882/9/19896/1/1989
11/30/198911/14/19902/11/19917/19/19918/29/1991
11/26/19913/15/19925/25/19927/16/199210/8/1992
11/27/199212/15/19922/25/19933/30/19939/28/19935/26/19946/23/19947/23/19949/22/19941/29/19953/29/19956/27/19959/21/19951/10/19964/3/1996
9/25/19961/15/19978/10/1981
10/27/198110/30/198111/6/1981
11/13/1981
GWQ-10
GWQ-11
Nitr
ate
(As
N)+
Nitr
ite (A
s N
) (m
g/L)
Nitr
ate
as N
(NO
3)
(mg/
L)
Nitr
ogen
, Nitr
ate
(As
N) (
mg/
L)
Nitr
ogen
, Nitr
ite(A
s N
) (m
g/L)
pH Pota
ssiu
m (m
g/L)
Sele
nium
(mg/
L)
Silic
on (m
g/L)
Silv
er (m
g/L)
Sodi
um (m
g/L)
Spec
ific
Con
duct
ance
(µ
mho
s/cm
)
Sulfa
te (m
g/L)
Susp
ende
d So
lids
(mg/
L)
Thal
lium
(mg/
L)
Tota
l Dis
solv
ed
Solid
s (m
g/L)
Ura
nium
(mg/
L)
Vana
dium
(mg/
L)
Zinc
(mg/
L)
2.34 <0.1 73.6 740 150 568 <0.1154.2
3 <0.1 64 173 648 <0.1170.6 552179.2 692180.5 618162.7 604161.7 620178 635
213.5 6963.88 8.05 3.9 0.002 <0.02 46.9 975 166.6 645
7.44 191.7 6657.46 171.2 6487.85 191.6 6417.41 169.2 6217.51 166.6 6267.43 161.4 6597.89 174.4 6547.48 168.7 5827.39 175.8 620
3.9 7.8 2.3 <0.005 <0.01 71 1020 183 642 0.117.7 142.6 693
3.5 7.82 3.1 <0.005 <0.025 56 1050 175 1000 0.557.97 191.6 671
3.5 7.97 2.8 <0.005 <0.025 66 1050 184 <0.005 696 <0.057.45 155.8 6687.52 65.7 6727.67 176 627.29 168.7 6777.42 187.4 6937.29 197.5 6546.95 218.2 6287.56 190.8 6797.59 203.67 746
1.02 7.38 7.88 0.006 <0.02 48.1 123 612 <0.050.7 8.1 <0.005 <0.02 183 550 0.170.61 8.4 <0.011 <0.02 101 536 0.231.5 8.1 <0.005 <0.02 168 520 0.291.33 7.7 3.9 0.023 <0.001 43.7 700 155.6 544 0.79

Table 8-11Groundwater Quality Analytical Results
Table 8-11, Page 9 of 34
Well NameCollection
Date Alka
linity
, Tot
al (A
s C
aCO
3) (m
g/L
CaC
O3)
Alum
inum
(mg/
L)
Antim
ony
(mg/
L)
Arse
nic
(mg/
L)
Bariu
m (m
g/L)
Bery
llium
(mg/
L)
Bica
rbon
ate
(mg/
L)
Boro
n (m
g/L)
Cad
miu
m (m
g/L)
Cal
cium
(mg/
L)
Car
bona
te (m
g/L)
Chl
orid
e (m
g/L)
Chr
omiu
m (m
g/L)
Cob
alt (
mg/
L)
Cop
per (
mg/
L)
Cya
nide
(mg/
L)
Fluo
ride
(mg/
L)
Iron
(mg/
L)
Lead
(mg/
L)
Mag
nesi
um (m
g/L)
Man
gane
se (m
g/L)
Mer
cury
(mg/
L)
Mol
ybde
num
(mg/
L)
Nic
kel (
mg/
L)
11/17/1981 <0.01 <0.01 <0.2 <0.1 <0.005 71 36 <0.01 <0.02 <0.05 <0.01 1 <0.1 <0.02 <0.05 <0.001 <0.05 <0.0511/23/1981 <0.01 <0.01 <0.2 <0.1 <0.005 67 36 <0.01 <0.02 <0.05 <0.01 0.9 <0.1 <0.02 <0.05 <0.001 <0.05 <0.0512/7/1981 <0.01 <0.01 <0.2 <0.1 <0.005 57 56 <0.01 <0.02 <0.05 <0.01 0.9 <0.1 <0.02 <0.05 0.0064 <0.05 <0.05
12/15/1981 <0.01 <0.01 <0.2 <0.1 <0.005 85 38 <0.01 <0.02 <0.05 <0.01 1 <0.1 <0.02 <0.05 <0.001 <0.05 <0.0512/22/1981 <0.01 <0.01 <0.2 <0.1 <0.005 82 40 <0.01 <0.02 <0.05 <0.01 0.5 0.27 <0.02 0.093 <0.001 <0.05 <0.05
1/5/1982 <0.01 <0.01 <0.2 <0.1 <0.005 79 40 <0.01 <0.02 <0.05 <0.01 1 0.14 <0.02 <0.05 <0.001 <0.05 <0.051/26/1982 <0.005 40 <0.05 <0.01 1 <0.1 <0.05 <0.001 <0.12/22/1982 <0.005 38 <0.05 <0.01 0.9 0.11 <0.05 <0.001 <0.054/26/1982 <0.005 40 <0.05 <0.01 0.8 0.36 <0.05 <0.001 0.055/17/1982 <0.005 44 <0.05 <0.01 0.8 0.11 <0.05 <0.001 <0.056/8/1982 <0.005 44 <0.05 <0.01 0.8 <0.1 <0.05 <0.001 <0.05
6/30/1982 <0.005 44 <0.05 <0.01 0.8 0.39 <0.05 <0.001 <0.059/2/1982 226 <0.001 111.2 52.22 0.78 27.6 <0.05 <0.01
12/23/1982 <0.005 52 <0.05 <0.01 0.8 <0.1 <0.05 <0.001 <0.052/21/1983 <0.005 44 <0.05 <0.01 0.8 0.38 <0.05 <0.001 <0.055/13/1983 <0.005 44 <0.05 0.01 0.8 <0.1 <0.05 <0.001 <0.058/9/1983 <0.005 46 <0.05 <0.01 0.8 <0.1 <0.05 <0.001 <0.05
11/1/1983 <0.005 46 <0.05 <0.01 0.8 <0.1 <0.05 <0.001 <0.053/16/1984 <0.005 52 <0.05 <0.01 0.6 <0.1 <0.05 <0.001 <0.055/30/1984 <0.005 58 <0.05 <0.01 0.8 <0.1 <0.05 <0.001 <0.059/12/1984 <0.005 60 <0.05 <0.01 0.8 <0.1 <0.05 <0.001 <0.05
11/27/1984 <0.005 60 <0.05 <0.01 0.8 <0.1 <0.05 <0.001 <0.055/17/1985 64
11/13/1985 625/23/1986 6610/8/1986 703/4/1987 <0.1 1.1 <0.1 <0.1 220 <0.1 <0.1 108 69 <0.1 <0.05 <0.1 <0.1 <0.1 26.1 <0.05 <0.1 <0.1
5/25/19871/12/1988 <0.1 <0.1 <0.1 214 <0.1 <0.1 128 77.1 <0.1 <0.05 <0.1 <0.1 <0.1 31 <0.05 <0.1 <0.14/4/1988 74.6
8/23/1988 732/9/1989 776/1/1989 69.7
11/30/1989 79.811/14/1990 104.42/11/1991 <0.001 88.97/19/1991 0.004 0.1 220.9 <0.005 122.5 0 89.7 <0.02 0.74 <0.05 <0.002 33.6 <0.02 <0.00028/29/1991 92.6
11/26/1991 89.3
GWQ-11

Table 8-11Groundwater Quality Analytical Results
Table 8-11, Page 10 of 34
Well NameCollection
Date11/17/198111/23/198112/7/1981
12/15/198112/22/1981
1/5/19821/26/19822/22/19824/26/19825/17/19826/8/1982
6/30/19829/2/1982
12/23/19822/21/19835/13/19838/9/1983
11/1/19833/16/19845/30/19849/12/1984
11/27/19845/17/1985
11/13/19855/23/198610/8/19863/4/1987
5/25/19871/12/19884/4/1988
8/23/19882/9/19896/1/1989
11/30/198911/14/19902/11/19917/19/19918/29/1991
11/26/1991
GWQ-11
Nitr
ate
(As
N)+
Nitr
ite (A
s N
) (m
g/L)
Nitr
ate
as N
(NO
3)
(mg/
L)
Nitr
ogen
, Nitr
ate
(As
N) (
mg/
L)
Nitr
ogen
, Nitr
ite(A
s N
) (m
g/L)
pH Pota
ssiu
m (m
g/L)
Sele
nium
(mg/
L)
Silic
on (m
g/L)
Silv
er (m
g/L)
Sodi
um (m
g/L)
Spec
ific
Con
duct
ance
(µ
mho
s/cm
)
Sulfa
te (m
g/L)
Susp
ende
d So
lids
(mg/
L)
Thal
lium
(mg/
L)
Tota
l Dis
solv
ed
Solid
s (m
g/L)
Ura
nium
(mg/
L)
Vana
dium
(mg/
L)
Zinc
(mg/
L)
1.3 8 <0.005 <0.02 165 520 0.641.7 7.8 <0.005 <0.02 181 570 0.531.6 7.9 <0.005 <0.02 184 560 1.61.5 7.9 <0.005 <0.02 191 570 1.11.9 8 <0.005 <0.02 185 530 0.422.5 7.5 <0.005 <0.02 174 480 0.441.7 7.9 <0.005 168 5001.4 7.7 <0.005 168 5101.3 7.6 <0.005 165 5101.9 7.8 <0.005 185 5101.7 7.9 <0.005 185 5302.3 7.9 <0.005 198 5901.94 7.3 3.51 <0.005 57.5 940 247.6 7001.6 8.5 <0.005 235 6501.7 8 <0.005 218 6001.9 8.1 <0.005 206 5702 7.9 <0.005 168 580
4.8 8 <0.005 174 5803.8 8.3 <0.005 184 5401.9 7.5 <0.005 195 5502.3 7.9 <0.005 181 5902.3 7.7 <0.005 165 570
7.8 197 6407.7 183 6007.8 210 6507.6 200 5606.7 3.51 <0.1 62.1 820 200 696 <0.1
2304 <0.1 63 253 718 <0.1
277.7 694293.8 772258.4 730238.2 708254.3 732257.4 746233.4 790
3.93 7.36 3.9 0.002 <0.02 40.1 1100 210.2 7857.46 278.6 7717.29 240.7 770

Table 8-11Groundwater Quality Analytical Results
Table 8-11, Page 11 of 34
Well NameCollection
Date Alka
linity
, Tot
al (A
s C
aCO
3) (m
g/L
CaC
O3)
Alum
inum
(mg/
L)
Antim
ony
(mg/
L)
Arse
nic
(mg/
L)
Bariu
m (m
g/L)
Bery
llium
(mg/
L)
Bica
rbon
ate
(mg/
L)
Boro
n (m
g/L)
Cad
miu
m (m
g/L)
Cal
cium
(mg/
L)
Car
bona
te (m
g/L)
Chl
orid
e (m
g/L)
Chr
omiu
m (m
g/L)
Cob
alt (
mg/
L)
Cop
per (
mg/
L)
Cya
nide
(mg/
L)
Fluo
ride
(mg/
L)
Iron
(mg/
L)
Lead
(mg/
L)
Mag
nesi
um (m
g/L)
Man
gane
se (m
g/L)
Mer
cury
(mg/
L)
Mol
ybde
num
(mg/
L)
Nic
kel (
mg/
L)
3/15/1992 65.15/25/1992 96.210/8/1992 96
11/27/1992 9612/15/1992 98.1 0.0172/25/1993 1043/30/1993 0.2 <0.005 <0.5 227 0.04 <0.002 126 0 104 <0.02 <0.05 <0.01 <0.01 0.52 0.33 <0.02 34 0.03 <0.001 <0.02 <0.019/28/1993 105.65/25/1994 0.14 <0.005 <0.005 <0.1 199 <0.0005 120 0 110 <0.025 <0.025 0.72 0.16 <0.005 34 <0.03 <0.001 <0.056/23/1994 117.27/22/1994 <0.05 0.0055 <0.005 <0.1 <0.002 207 <0.1 <0.0005 140 0 116 <0.025 <0.05 <0.025 0.7 <0.05 <0.005 37 <0.03 <0.001 <0.05 <0.059/22/1994 112.31/29/1995 199.53/29/1995 99.46/27/1995 101.79/21/1995 112.11/10/1996 120.84/3/1996 119.2
9/25/1996 1161/15/1997 1272/21/1983 <0.005 18 <0.05 <0.01 1 <0.1 <0.05 <0.055/13/1983 <0.005 16 <0.05 <0.01 1 <0.1 <0.05 <0.001 <0.058/9/1983 <0.005 22 <0.05 <0.01 0.6 <0.1 <0.05 <0.001 <0.05
11/1/1983 <0.005 14 <0.05 <0.01 1.1 0.32 <0.05 <0.001 <0.053/16/1984 <0.005 14 <0.05 <0.01 1.1 <0.1 <0.05 <0.001 <0.055/30/1984 <0.005 16 <0.05 <0.01 1 <0.1 <0.05 <0.001 <0.059/12/1984 <0.005 16 <0.05 <0.01 1 <0.1 <0.05 <0.001 <0.05
11/27/1984 <0.005 14 <0.05 <0.01 1 <0.1 <0.05 <0.001 <0.055/27/1985 14
11/13/1985 145/23/1986 1610/8/1986 167/21/1994 <0.05 0.0064 <0.005 <0.1 <0.002 262 <0.1 <0.0005 59 0 16 <0.025 <0.05 <0.025 0.99 <0.05 <0.005 19 <0.03 <0.001 <0.05 <0.05
11/15/1994 <0.05 <0.005 <0.005 <0.1 <0.002 159 <0.1 <0.0005 270 0 190 <0.025 <0.05 <0.025 0.36 0.11 <0.005 56 <0.03 <0.001 <0.05 <0.057/1/1996 <0.025 <0.002 <0.005 <0.05 <0.002 156 <0.05 <0.0005 290 0 200 <0.025 <0.05 <0.025 0.34 <0.05 <0.005 62 <0.03 <0.001 <0.05 <0.057/2/2010 120 <0.020 <0.0010 <0.0010 0.040 <0.0020 120 <0.040 <0.0020 320 <2.0 290 <0.0060 <0.0060 <0.0060 0.35 <0.020 <0.0050 62 <0.0020 0.00026 <0.0080 <0.010
10/5/2010 120 <0.02 <0.001 <0.005 0.038 <0.002 120 <0.04 <0.002 300 <2 280 <0.006 <0.006 <0.006 0.32 <0.02 <0.005 62 <0.002 <0.0002 <0.008 <0.015/11/2011 130 <0.02 <0.001 0.0038 0.037 <0.002 130 <0.04 <0.002 310 <2 290 <0.006 <0.006 <0.006 <0.005 0.33 <0.02 <0.005 61 <0.002 <0.0002 <0.008 <0.01
GWQ-11
GWQ-12
GWQ94-13

Table 8-11Groundwater Quality Analytical Results
Table 8-11, Page 12 of 34
Well NameCollection
Date3/15/19925/25/199210/8/1992
11/27/199212/15/19922/25/19933/30/19939/28/19935/25/19946/23/19947/22/19949/22/19941/29/19953/29/19956/27/19959/21/19951/10/19964/3/1996
9/25/19961/15/19972/21/19835/13/19838/9/1983
11/1/19833/16/19845/30/19849/12/1984
11/27/19845/27/1985
11/13/19855/23/198610/8/19867/21/1994
11/15/19947/1/19967/2/2010
10/5/20105/11/2011
GWQ-11
GWQ-12
GWQ94-13
Nitr
ate
(As
N)+
Nitr
ite (A
s N
) (m
g/L)
Nitr
ate
as N
(NO
3)
(mg/
L)
Nitr
ogen
, Nitr
ate
(As
N) (
mg/
L)
Nitr
ogen
, Nitr
ite(A
s N
) (m
g/L)
pH Pota
ssiu
m (m
g/L)
Sele
nium
(mg/
L)
Silic
on (m
g/L)
Silv
er (m
g/L)
Sodi
um (m
g/L)
Spec
ific
Con
duct
ance
(µ
mho
s/cm
)
Sulfa
te (m
g/L)
Susp
ende
d So
lids
(mg/
L)
Thal
lium
(mg/
L)
Tota
l Dis
solv
ed
Solid
s (m
g/L)
Ura
nium
(mg/
L)
Vana
dium
(mg/
L)
Zinc
(mg/
L)
7.91 260.2 7657.45 258.1 7617.42 226.9 7557.85 248.4 7637.59 220 7417.64 273.3 762
4.1 7.7 2.9 <0.005 <0.01 68 1170 271 776 0.037.57 207.7 800
3.8 7.88 3.5 <0.005 <0.025 55 1130 260 820 <0.057.42 274.6 802
3.8 7.7 3.4 <0.005 <0.025 66 1210 272 <0.005 808 <0.057.37 234.5 8167.6 158.7 8617.96 136.9 7937.67 278.8 8357.58 289.5 8657.36 287.5 7777.38 276.5 7677.78 229.9 8357.68 303.9 860
2.2 7.7 <0.005 53 3602.1 8.1 <0.005 37 3301.1 7.8 <0.005 130 4802.8 8.2 <0.005 38 3403.8 8.2 <0.005 44 3202.5 8 <0.005 47 3202.2 8 <0.005 38 3302.3 7.8 <0.005 37 340
8 36 3707.8 35 3107.8 31 3307.6 35 310
2.1 7.75 3.2 <0.005 <0.025 29 537 38 <0.005 358 <0.054.6 7.74 3.9 <0.005 <0.025 110 2026 720 <0.005 1570 <0.055.2 7.76 3.6 0.0068 <0.05 120 2000 620 <0.001 1520 <0.05
5.9 8 3.4 0.024 16 <0.0050 110 2200 770 10 <0.0010 1730 0.0016 <0.050 <0.0105.8 7.39 3.4 0.024 16 <0.005 110 2100 760 <10 <0.001 1670 0.0015 <0.05 <0.016.5 7.66 3.3 0.028 16 <0.005 120 2100 800 <10 <0.001 1670 0.0017 <0.05 0.037

Table 8-11Groundwater Quality Analytical Results
Table 8-11, Page 13 of 34
Well NameCollection
Date Alka
linity
, Tot
al (A
s C
aCO
3) (m
g/L
CaC
O3)
Alum
inum
(mg/
L)
Antim
ony
(mg/
L)
Arse
nic
(mg/
L)
Bariu
m (m
g/L)
Bery
llium
(mg/
L)
Bica
rbon
ate
(mg/
L)
Boro
n (m
g/L)
Cad
miu
m (m
g/L)
Cal
cium
(mg/
L)
Car
bona
te (m
g/L)
Chl
orid
e (m
g/L)
Chr
omiu
m (m
g/L)
Cob
alt (
mg/
L)
Cop
per (
mg/
L)
Cya
nide
(mg/
L)
Fluo
ride
(mg/
L)
Iron
(mg/
L)
Lead
(mg/
L)
Mag
nesi
um (m
g/L)
Man
gane
se (m
g/L)
Mer
cury
(mg/
L)
Mol
ybde
num
(mg/
L)
Nic
kel (
mg/
L)
6/30/1996 <0.025 <0.002 <0.005 <0.05 <0.002 261 <0.05 <0.0005 87 5 26 <0.025 <0.05 <0.025 0.48 <0.05 <0.005 23 <0.03 <0.001 <0.05 <0.051/29/2010 210 <0.02 <0.0025 0.0032 0.045 <0.002 210 <0.04 <0.002 96 <2 50 <0.006 <0.006 <0.006 <0.005 0.48 <0.02 <0.005 26 <0.002 <0.0002 <0.008 <0.016/29/2010 210 <0.020 <0.0010 0.0023 0.048 <0.0020 210 <0.040 <0.0020 98 <2.0 49 <0.0060 <0.0060 <0.0060 0.48 <0.020 <0.0050 25 <0.0020 <0.00020 <0.0080 <0.01010/5/2010 210 <0.02 <0.001 0.0024 0.045 <0.002 210 <0.04 <0.002 94 <2 50 <0.006 <0.006 <0.006 0.53 <0.02 <0.005 27 <0.002 <0.0002 <0.008 <0.015/13/2011 210 <0.02 <0.001 0.0028 0.045 <0.002 210 <0.04 <0.002 97 <2 48 <0.006 <0.006 <0.006 0.012 0.55 <0.02 <0.005 27 <0.002 <0.0002 <0.008 <0.01
11/14/1994 <0.05 <0.005 <0.005 <0.1 <0.002 265 <0.1 <0.0005 110 0 110 <0.025 <0.05 <0.025 0.46 <0.05 <0.005 29 <0.03 <0.001 <0.05 <0.057/1/1996 <0.025 <0.002 <0.005 <0.05 <0.002 227 <0.05 <0.0005 140 0 130 <0.025 <0.05 <0.025 0.42 0.41 <0.005 38 <0.03 <0.001 <0.05 <0.05
1/29/2010 160 <0.020 <0.0025 0.0042 0.058 <0.0020 160 <0.040 <0.0020 180 <2.0 170 <0.0060 <0.0060 <0.0060 <0.005 0.30 <0.020 <0.0050 47 <0.0020 <0.00020 <0.0080 <0.0106/29/2010 180 <0.020 <0.0010 <0.0010 0.059 <0.0020 180 <0.040 <0.0020 140 <2.0 110 <0.0060 <0.0060 <0.0060 0.43 <0.020 <0.0050 34 0.0049 <0.00020 <0.0080 <0.01010/1/2010 190 <0.02 <0.001 <0.001 0.056 <0.002 190 <0.04 <0.002 130 <2 110 <0.006 <0.006 <0.006 <0.01 0.44 <0.02 <0.005 37 <0.002 <0.0002 <0.008 <0.015/13/2011 190 <0.02 <0.001 0.0036 0.056 <0.002 190 <0.04 <0.002 130 <2 120 <0.006 <0.006 <0.006 <0.005 0.43 <0.02 <0.005 38 <0.002 <0.0002 <0.008 <0.01
11/13/1994 <0.05 <0.005 <0.005 <0.1 <0.002 199 <0.1 <0.0005 190 0 190 <0.025 <0.05 <0.025 0.66 <0.05 <0.005 51 0.038 <0.001 <0.05 <0.057/1/1996 <0.025 <0.002 <0.005 <0.05 <0.002 193 <0.05 <0.0005 200 0 200 <0.025 <0.05 <0.025 0.57 0.22 <0.005 54 <0.03 <0.001 <0.05 <0.05
6/29/2010 180 <0.020 <0.0010 0.0022 0.039 <0.0020 180 0.048 <0.0020 210 <2.0 180 <0.0060 <0.0060 <0.0060 0.62 <0.020 <0.0050 50 <0.0020 <0.00020 <0.0080 <0.0109/30/2010 180 <0.02 <0.001 0.0024 0.038 <0.002 180 0.053 <0.002 200 <2 190 <0.006 <0.006 <0.006 <0.01 0.67 <0.02 <0.005 51 <0.002 <0.0002 <0.008 <0.015/10/2011 180 <0.02 <0.001 0.0026 0.038 <0.002 180 0.056 <0.002 200 <2 190 <0.006 <0.006 <0.006 <0.01 0.57 <0.02 <0.005 49 <0.002 <0.0002 <0.008 <0.01
11/15/1994 <0.05 <0.005 <0.005 <0.1 <0.002 232 <0.1 <0.0005 120 0 110 <0.025 <0.05 <0.025 0.46 <0.05 <0.005 33 <0.03 <0.001 <0.05 <0.056/30/1996 <0.025 <0.002 <0.005 <0.05 <0.002 227 <0.05 <0.0005 120 7 81 <0.025 <0.05 <0.025 0.46 0.062 <0.005 28 <0.03 <0.001 <0.05 <0.057/6/2010 200 <0.020 <0.0010 0.0022 0.047 <0.0020 200 <0.040 <0.0020 110 <2.0 68 <0.0060 <0.0060 <0.0060 0.52 <0.020 <0.0050 27 <0.0020 <0.00020 <0.0080 <0.010
11/15/1994 <0.05 <0.005 <0.005 <0.1 <0.002 296 0.11 <0.0005 48 0 19 <0.025 <0.05 <0.025 0.36 <0.05 <0.005 9.8 0.42 <0.001 <0.05 <0.056/30/1996 <0.025 <0.002 <0.005 0.12 <0.002 273 0.086 <0.0005 58 19 21 <0.025 <0.05 <0.025 0.29 <0.05 <0.005 10 <0.03 <0.001 <0.05 <0.05
11/13/1994 <0.05 <0.005 <0.005 <0.1 <0.002 267 <0.1 <0.0005 82 0 18 <0.025 <0.05 <0.025 0.57 <0.05 <0.005 23 0.2 <0.001 <0.05 <0.056/30/1996 <0.025 <0.002 <0.005 <0.05 <0.002 268 <0.05 <0.0005 86 0 16 <0.025 <0.05 <0.025 0.51 <0.05 <0.005 22 <0.03 <0.001 <0.05 <0.05
11/13/1994 <0.05 <0.005 <0.005 <0.1 <0.002 255 <0.1 <0.0005 71 0 19 <0.025 <0.05 <0.025 0.39 <0.05 <0.005 18 0.37 <0.001 <0.05 <0.056/30/1996 <0.025 <0.002 <0.005 <0.05 <0.002 256 <0.05 <0.0005 87 10 17 <0.025 <0.05 <0.025 0.52 <0.05 <0.005 22 <0.03 <0.001 <0.05 <0.057/13/1996 <0.025 <0.003 <0.005 <0.05 <0.002 124 <0.05 <0.0005 71 0 89 <0.025 <0.05 <0.025 3.3 <0.05 <0.005 6.7 0.075 <0.001 <0.05 <0.054/9/1997 20 <0.025 0.8 6.5 2.8 <0.0018/8/1997 0.028 <0.005 0.057 <0.002 177 0.23 <0.002 73 0 89 <0.025 <0.05 <0.05 2.2 0.13 <0.005 8.2 0.53 <0.05 <0.05
1/30/2010 320 <0.020 <0.0025 0.0029 0.094 <0.0020 320 0.28 <0.0020 51 <2.0 81 <0.0060 <0.0060 <0.0060 2.6 2.1 <0.0050 3.8 0.74 <0.00020 <0.0080 <0.0107/1/2010 310 <0.020 <0.0010 0.0035 0.079 <0.0020 310 0.28 <0.0020 53 <2.0 70 <0.0060 <0.0060 <0.0060 2.7 0.021 <0.0050 3.7 0.65 <0.00020 <0.0080 <0.010
10/7/2010 340 <0.02 <0.001 0.0035 0.084 <0.002 340 0.28 <0.002 49 <2 75 <0.006 <0.006 <0.006 2.7 0.32 <0.005 3.9 0.49 <0.0002 <0.008 <0.017/13/1996 <0.025 <0.003 <0.005 0.096 <0.002 141 0.12 <0.0005 66 0 210 <0.025 <0.05 <0.025 1.8 <0.05 <0.005 10 0.41 <0.001 <0.05 <0.0510/7/2010 480 <0.02 <0.001 0.0057 0.11 <0.002 480 0.24 <0.002 72 <2 110 <0.006 <0.006 <0.006 3 9.3 <0.005 5.7 1.2 <0.0002 <0.008 <0.017/14/1996 0.28 <0.003 <0.005 0.064 <0.002 280 <0.05 <0.0005 59 0 22 <0.025 <0.05 <0.025 0.84 0.26 <0.005 18 0.05 <0.001 <0.05 <0.054/9/1997 16 <0.025 1.4 0.1 0.75 <0.0018/8/1997 0.036 <0.005 0.13 <0.002 328 0.067 <0.002 130 0 18 <0.025 <0.05 <0.025 1.2 0.82 <0.005 36 1.6 <0.05 <0.05
1/30/2010 640 <0.020 <0.0025 0.0027 0.091 <0.0020 640 0.074 <0.0020 150 <2.0 12 <0.0060 <0.0060 <0.0060 1.7 0.66 <0.0050 45 0.63 <0.00020 <0.0080 <0.0107/1/2010 510 <0.020 <0.0010 0.0011 0.13 <0.0020 510 0.068 <0.0020 150 <2.0 14 <0.0060 <0.0060 <0.0060 1.5 0.048 <0.0050 40 0.37 <0.00020 <0.0080 <0.010
10/6/2010 580 <0.02 <0.001 <0.001 0.087 <0.002 580 0.08 <0.002 140 <2 12 <0.006 <0.006 <0.006 1.6 0.31 <0.005 45 0.41 <0.0002 <0.008 <0.015/12/2011 600 <0.02 <0.001 <0.001 0.078 <0.002 600 0.071 <0.002 150 <2 13 <0.006 <0.006 <0.006 <0.005 1.7 0.043 <0.005 42 0.29 <0.0002 <0.008 <0.01
GWQ96-22A
GWQ94-21B
GWQ96-23A
GWQ94-16
GWQ94-17
GWQ94-20
GWQ94-21A
GWQ96-22B
GWQ94-14
GWQ94-15

Table 8-11Groundwater Quality Analytical Results
Table 8-11, Page 14 of 34
Well NameCollection
Date6/30/19961/29/20106/29/201010/5/20105/13/2011
11/14/19947/1/1996
1/29/20106/29/201010/1/20105/13/2011
11/13/19947/1/1996
6/29/20109/30/20105/10/2011
11/15/19946/30/19967/6/2010
11/15/19946/30/1996
11/13/19946/30/1996
11/13/19946/30/19967/13/19964/9/19978/8/1997
1/30/20107/1/2010
10/7/20107/13/199610/7/20107/14/19964/9/19978/8/1997
1/30/20107/1/2010
10/6/20105/12/2011
GWQ96-22A
GWQ94-21B
GWQ96-23A
GWQ94-16
GWQ94-17
GWQ94-20
GWQ94-21A
GWQ96-22B
GWQ94-14
GWQ94-15
Nitr
ate
(As
N)+
Nitr
ite (A
s N
) (m
g/L)
Nitr
ate
as N
(NO
3)
(mg/
L)
Nitr
ogen
, Nitr
ate
(As
N) (
mg/
L)
Nitr
ogen
, Nitr
ite(A
s N
) (m
g/L)
pH Pota
ssiu
m (m
g/L)
Sele
nium
(mg/
L)
Silic
on (m
g/L)
Silv
er (m
g/L)
Sodi
um (m
g/L)
Spec
ific
Con
duct
ance
(µ
mho
s/cm
)
Sulfa
te (m
g/L)
Susp
ende
d So
lids
(mg/
L)
Thal
lium
(mg/
L)
Tota
l Dis
solv
ed
Solid
s (m
g/L)
Ura
nium
(mg/
L)
Vana
dium
(mg/
L)
Zinc
(mg/
L)
1.5 8.44 1.9 <0.005 <0.05 51 641 140 <0.001 520 <0.052.2 8 2 0.0068 <0.005 49 820 150 <0.0025 550 0.012.3 8 1.7 0.0052 19 <0.0050 45 820 150 <10 <0.0010 573 0.0014 <0.050 <0.0102.2 7.57 1.7 0.0053 18 <0.005 47 840 150 <10 <0.001 563 0.0013 <0.05 <0.01
2.2 <0.1 7.84 1.8 0.0061 18 <0.005 49 840 150 <10 <0.001 570 0.0015 <0.05 0.0522.1 7.74 2.5 <0.005 <0.025 68 1058 180 <0.005 790 <0.052.5 7.31 2.4 <0.005 <0.05 77 1190 240 <0.001 780 <0.05
4.1 7 3.0 0.021 <0.0050 84 1500 420 <0.0025 1080 0.0222.7 8 2.1 0.0095 18 <0.0050 60 1100 260 <10 <0.0010 805 0.0017 <0.050 <0.0102.7 7.52 2.2 0.012 17 <0.005 65 1100 260 <10 <0.001 794 0.0018 <0.05 <0.01
2.8 <2 7.74 2.3 0.012 16 <0.005 68 1200 270 <10 <0.001 808 0.0018 <0.05 <0.013.8 7.55 3.7 <0.005 <0.025 78 1600 410 <0.005 1140 <0.053.7 7.95 3.4 <0.005 <0.05 80 1620 500 <0.001 1160 <0.05
3.7 8 3.1 0.011 22 <0.0050 74 1600 440 <10 <0.0010 1190 0.0025 <0.050 <0.0103.9 7.5 3.1 0.015 21 <0.005 78 1500 440 <10 <0.001 1170 0.0024 <0.05 <0.01
4 <2 7.58 3.1 0.012 22 <0.005 74 1600 430 <10 <0.001 1150 0.0023 <0.05 0.0112.4 7.71 2.4 <0.005 <0.025 62 1147 240 <0.005 820 <0.052 8.56 2 <0.005 <0.05 61 925 190 <0.001 690 <0.05
2.0 8 1.8 0.0062 19 <0.0050 49 880 180 61 <0.0010 629 0.0016 <0.050 <0.0101 7.66 3.2 <0.005 <0.025 67 588 40 <0.005 370 <0.05
<1 8.79 3.1 <0.005 <0.05 75 597 56 <0.001 390 <0.051 7.25 2.1 <0.005 <0.025 39 672 130 <0.005 480 <0.05
1.1 8.22 1.5 <0.005 <0.05 37 649 120 <0.001 470 <0.05<1 7.57 2.6 <0.005 <0.025 56 669 130 <0.005 440 <0.051.1 8.6 1.7 <0.005 <0.05 40 648 120 <0.001 470 <0.05<1 7.5 2.5 <0.005 <0.05 150 1040 250 <0.001 700 <0.05
7.58 <0.005 930 150 770<1 7.65 6.2 <0.005 <0.025 170 1140 230 <0.001 700 <0.05
<1.0 8 2.8 <0.0025 <0.0050 160 920 44 <0.0025 557 <0.010<1.0 8 2.8 0.0011 13 <0.0050 150 920 52 19 <0.0010 573 <0.0010 <0.050 <0.010<1 8 2.8 <0.001 13 <0.005 150 720 34 11 <0.001 564 <0.001 <0.05 <0.01
<1 7.75 10 <0.005 <0.05 130 1070 79 <0.001 650 <0.052.1 7.52 3.6 0.0011 16 <0.005 200 1200 <0.5 25 <0.001 730 <0.001 <0.05 <0.01
<1 7.95 4.2 <0.005 <0.05 98 760 140 <0.001 520 <0.05<0.005 850 170 580
<1 7.68 2.5 <0.005 <0.025 72 1310 410 <0.001 920 <0.05<1.0 8 1.6 <0.0025 <0.0050 69 1100 5.6 <0.0025 689 <0.010<1.0 8 1.5 0.0014 15 <0.0050 81 1200 140 13 <0.0010 804 0.0025 <0.050 <0.010<1 7.89 1.3 0.0013 15 <0.005 80 1200 99 <10 <0.001 769 0.0037 <0.05 <0.01
<0.1 <0.1 8.16 1.3 0.0012 14 <0.005 78 1100 74 <10 <0.001 752 0.003 <0.05 0.02

Table 8-11Groundwater Quality Analytical Results
Table 8-11, Page 15 of 34
Well NameCollection
Date Alka
linity
, Tot
al (A
s C
aCO
3) (m
g/L
CaC
O3)
Alum
inum
(mg/
L)
Antim
ony
(mg/
L)
Arse
nic
(mg/
L)
Bariu
m (m
g/L)
Bery
llium
(mg/
L)
Bica
rbon
ate
(mg/
L)
Boro
n (m
g/L)
Cad
miu
m (m
g/L)
Cal
cium
(mg/
L)
Car
bona
te (m
g/L)
Chl
orid
e (m
g/L)
Chr
omiu
m (m
g/L)
Cob
alt (
mg/
L)
Cop
per (
mg/
L)
Cya
nide
(mg/
L)
Fluo
ride
(mg/
L)
Iron
(mg/
L)
Lead
(mg/
L)
Mag
nesi
um (m
g/L)
Man
gane
se (m
g/L)
Mer
cury
(mg/
L)
Mol
ybde
num
(mg/
L)
Nic
kel (
mg/
L)
7/14/1996 7.4 <0.003 <0.005 0.093 <0.002 234 0.058 <0.0005 67 0 20 <0.025 <0.05 <0.025 1.1 3.7 <0.005 20 0.13 <0.001 <0.05 <0.0510/6/2010 480 <0.02 <0.001 <0.001 0.1 <0.002 480 0.14 <0.002 78 <2 19 <0.006 <0.006 <0.006 2.1 1.4 <0.005 22 0.36 <0.0002 <0.008 <0.015/12/2011 490 <0.02 <0.001 <0.001 0.11 <0.002 490 0.14 <0.002 81 <2 17 <0.006 <0.006 <0.006 <0.005 2.1 0.93 <0.005 22 0.34 <0.0002 <0.008 <0.013/4/1987 193 564 575
7/19/1991 <0.002 <0.01 222.1 <0.005 635.5 0 632.6 <0.02 <0.02 0.69 <0.05 <0.005 181.6 <0.02 0.00058/29/1991 642.4
11/26/1991 615.13/15/1992 610.75/25/1992 598.27/16/1992 584.610/8/1992 616.9
11/27/1992 604.812/15/1992 608.99/28/1993 521.13/17/1994 404.85/24/1994 0.94 <0.005 <0.005 <0.1 248 <0.0005 550 0 470 <0.025 <0.025 0.7 1 <0.005 170 <0.03 <0.001 <0.056/23/1994 473.87/22/1994 <0.05 <0.005 <0.005 <0.1 <0.002 256 0.1 <0.0005 570 0 431 <0.025 <0.05 <0.025 0.72 <0.05 <0.005 200 <0.03 <0.001 <0.05 <0.059/22/1994 435.91/29/1995 6633/29/1995 419.46/27/1995 446.19/21/1995 458.71/10/1996 442.29/25/1996 5681/15/1997 4109/2/1982 185 <0.001 320 409.07 1.22 173.7 <0.05 <0.01
5/25/1994 22 <0.005 <0.005 0.12 534 <0.0005 430 0 340 0.046 <0.025 0.66 16 0.0073 94 0.77 <0.001 0.0977/22/1994 <0.05 <0.005 <0.005 <0.1 <0.002 300 0.15 <0.0005 390 0 380 <0.025 <0.05 <0.025 0.69 <0.05 <0.005 110 0.036 <0.001 <0.05 <0.051/31/2010 260 0.13 <0.0025 0.0092 0.024 <0.0020 260 0.075 <0.0020 390 <2.0 600 <0.0060 0.0065 <0.0060 <0.005 0.74 1.3 <0.0050 120 1.6 <0.00020 0.020 <0.0106/29/2010 250 <0.020 <0.0010 <0.0010 0.029 <0.0020 250 0.061 <0.0020 390 <2.0 580 <0.0060 <0.0060 <0.0060 0.67 0.87 <0.0050 110 2.2 0.00048 0.024 <0.0109/30/2010 250 0.044 <0.001 <0.001 0.028 <0.002 250 0.073 <0.002 360 <2 500 <0.006 <0.006 <0.006 <0.01 0.68 0.41 <0.005 110 2.2 <0.0002 0.02 <0.015/9/2011 240 <0.02 0.0032 <0.001 0.037 <0.002 240 0.081 <0.002 370 <2 520 <0.006 0.017 <0.006 <0.01 0.62 0.36 <0.005 110 3.6 <0.0002 0.021 <0.019/2/1982 179 <0.001 233.6 159.12 0.42 42.1 <0.05 <0.01
2/25/1993 589.55/26/1994 32 <0.005 <0.005 0.2 341 <0.0005 240 0 209 0.059 6 0.47 22 0.077 51 0.35 <0.001 0.197/23/1994 <0.05 0.0055 <0.005 <0.1 <0.002 255 <0.1 <0.0005 200 0 206 <0.025 <0.05 0.058 0.48 <0.05 <0.005 66 0.13 <0.001 0.062 <0.054/3/1996 432.6
LRG 04159 11/4/2010 300 <0.02 <0.001 <0.001 0.018 <0.002 300 <0.04 <0.002 110 <2 23 <0.006 <0.006 <0.006 <0.01 0.66 0.036 <0.005 23 <0.002 <0.0002 <0.008 <0.01
IW-3
GWQ96-23B
IW-2
IW-1
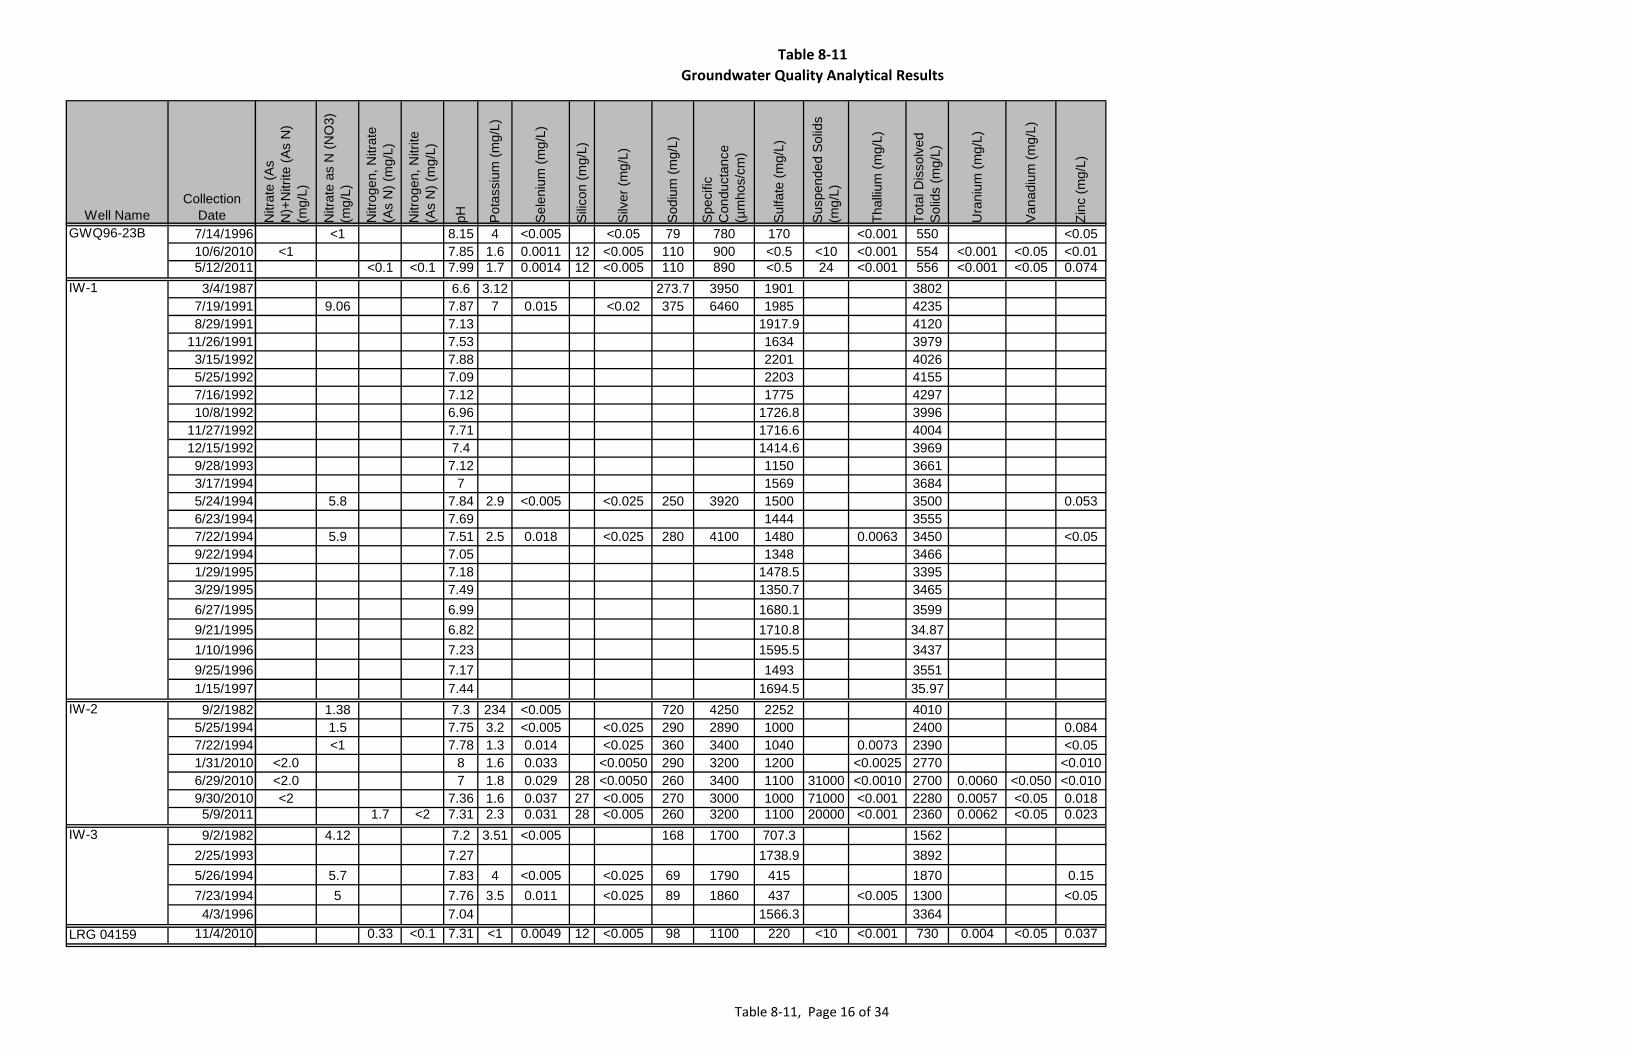
Table 8-11Groundwater Quality Analytical Results
Table 8-11, Page 16 of 34
Well NameCollection
Date7/14/199610/6/20105/12/20113/4/1987
7/19/19918/29/1991
11/26/19913/15/19925/25/19927/16/199210/8/1992
11/27/199212/15/19929/28/19933/17/19945/24/19946/23/19947/22/19949/22/19941/29/19953/29/19956/27/19959/21/19951/10/19969/25/19961/15/19979/2/1982
5/25/19947/22/19941/31/20106/29/20109/30/20105/9/20119/2/1982
2/25/19935/26/19947/23/19944/3/1996
LRG 04159 11/4/2010
IW-3
GWQ96-23B
IW-2
IW-1N
itrat
e (A
s N
)+N
itrite
(As
N)
(mg/
L)
Nitr
ate
as N
(NO
3)
(mg/
L)
Nitr
ogen
, Nitr
ate
(As
N) (
mg/
L)
Nitr
ogen
, Nitr
ite(A
s N
) (m
g/L)
pH Pota
ssiu
m (m
g/L)
Sele
nium
(mg/
L)
Silic
on (m
g/L)
Silv
er (m
g/L)
Sodi
um (m
g/L)
Spec
ific
Con
duct
ance
(µ
mho
s/cm
)
Sulfa
te (m
g/L)
Susp
ende
d So
lids
(mg/
L)
Thal
lium
(mg/
L)
Tota
l Dis
solv
ed
Solid
s (m
g/L)
Ura
nium
(mg/
L)
Vana
dium
(mg/
L)
Zinc
(mg/
L)
<1 8.15 4 <0.005 <0.05 79 780 170 <0.001 550 <0.05<1 7.85 1.6 0.0011 12 <0.005 110 900 <0.5 <10 <0.001 554 <0.001 <0.05 <0.01
<0.1 <0.1 7.99 1.7 0.0014 12 <0.005 110 890 <0.5 24 <0.001 556 <0.001 <0.05 0.0746.6 3.12 273.7 3950 1901 3802
9.06 7.87 7 0.015 <0.02 375 6460 1985 42357.13 1917.9 41207.53 1634 39797.88 2201 40267.09 2203 41557.12 1775 42976.96 1726.8 39967.71 1716.6 40047.4 1414.6 39697.12 1150 3661
7 1569 36845.8 7.84 2.9 <0.005 <0.025 250 3920 1500 3500 0.053
7.69 1444 35555.9 7.51 2.5 0.018 <0.025 280 4100 1480 0.0063 3450 <0.05
7.05 1348 34667.18 1478.5 33957.49 1350.7 34656.99 1680.1 35996.82 1710.8 34.877.23 1595.5 34377.17 1493 35517.44 1694.5 35.97
1.38 7.3 234 <0.005 720 4250 2252 40101.5 7.75 3.2 <0.005 <0.025 290 2890 1000 2400 0.084<1 7.78 1.3 0.014 <0.025 360 3400 1040 0.0073 2390 <0.05
<2.0 8 1.6 0.033 <0.0050 290 3200 1200 <0.0025 2770 <0.010<2.0 7 1.8 0.029 28 <0.0050 260 3400 1100 31000 <0.0010 2700 0.0060 <0.050 <0.010<2 7.36 1.6 0.037 27 <0.005 270 3000 1000 71000 <0.001 2280 0.0057 <0.05 0.018
1.7 <2 7.31 2.3 0.031 28 <0.005 260 3200 1100 20000 <0.001 2360 0.0062 <0.05 0.0234.12 7.2 3.51 <0.005 168 1700 707.3 1562
7.27 1738.9 38925.7 7.83 4 <0.005 <0.025 69 1790 415 1870 0.155 7.76 3.5 0.011 <0.025 89 1860 437 <0.005 1300 <0.05
7.04 1566.3 33640.33 <0.1 7.31 <1 0.0049 12 <0.005 98 1100 220 <10 <0.001 730 0.004 <0.05 0.037

Table 8-11Groundwater Quality Analytical Results
Table 8-11, Page 17 of 34
Well NameCollection
Date Alka
linity
, Tot
al (A
s C
aCO
3) (m
g/L
CaC
O3)
Alum
inum
(mg/
L)
Antim
ony
(mg/
L)
Arse
nic
(mg/
L)
Bariu
m (m
g/L)
Bery
llium
(mg/
L)
Bica
rbon
ate
(mg/
L)
Boro
n (m
g/L)
Cad
miu
m (m
g/L)
Cal
cium
(mg/
L)
Car
bona
te (m
g/L)
Chl
orid
e (m
g/L)
Chr
omiu
m (m
g/L)
Cob
alt (
mg/
L)
Cop
per (
mg/
L)
Cya
nide
(mg/
L)
Fluo
ride
(mg/
L)
Iron
(mg/
L)
Lead
(mg/
L)
Mag
nesi
um (m
g/L)
Man
gane
se (m
g/L)
Mer
cury
(mg/
L)
Mol
ybde
num
(mg/
L)
Nic
kel (
mg/
L)
McCravey-Greyback 3/31/1993 <0.1 <0.005 <0.5 302 <0.04 <0.002 97 0 30 <0.02 <0.05 <0.01 <0.01 0.51 0.05 <0.02 24 <0.02 <0.001 <0.02 <0.01
1/1/1975 215 28 0 10 0.7 19/28/2010 150 <0.02 <0.001 0.0039 0.022 <0.002 150 0.044 <0.002 43 <2 14 <0.006 <0.006 <0.006 <0.01 0.4 0.11 <0.005 6.8 0.0054 <0.0002 <0.008 <0.015/7/1975 209 9 0 8 2.3 0
7/20/1994 <0.05 <0.005 0.019 <0.1 <0.002 149 0.16 <0.0005 2.5 19 5.5 <0.025 <0.05 <0.025 3.1 0.069 <0.005 0.16 <0.03 <0.001 <0.05 <0.059/28/2010 150 <0.02 <0.001 0.02 <0.002 <0.002 120 0.15 <0.002 1.9 28 5.8 0.032 <0.006 <0.006 <0.01 3.3 <0.02 <0.005 <1 <0.002 <0.0002 <0.008 <0.016/13/1975 226 46 0 15 0.63 107/20/1994 <0.05 <0.005 <0.005 <0.1 <0.002 139 <0.1 <0.0005 15 2 17 <0.025 <0.05 <0.025 0.28 <0.05 <0.005 13 <0.03 <0.001 <0.05 <0.059/19/1975 157 26 0 30 0.61 37/20/1994 <0.05 <0.005 <0.005 <0.1 <0.002 274 <0.1 <0.0005 71 0 17 <0.025 <0.05 <0.025 0.18 <0.05 <0.005 11 <0.03 <0.001 <0.05 <0.051/1/1975 146 19 0 66 3.4 18/2/1994 <0.05 0.01 0.013 <0.1 <0.002 154 0.16 <0.0005 14 0 75 <0.025 <0.05 <0.025 1.6 0.41 <0.005 0.95 <0.03 <0.001 <0.05 <0.057/8/2010 120 <0.020 <0.0010 0.018 0.0095 <0.0020 120 0.15 <0.0020 13 <2.0 75 0.016 <0.0060 <0.0060 8.1 0.024 <0.0050 <1.0 0.0027 <0.00020 0.013 <0.010
9/27/2010 130 <0.02 <0.001 0.02 0.0093 <0.002 130 0.16 <0.002 13 <2 73 0.016 <0.006 <0.006 <0.01 8.2 0.021 <0.005 <1 <0.002 <0.0002 0.013 <0.011/1/1975 222 34 0 10 0.86 10
7/21/1994 <0.05 <0.005 0.012 <0.1 <0.002 196 <0.1 <0.0005 4.8 16 6.6 <0.025 <0.05 <0.025 1 0.14 <0.005 1 <0.03 <0.001 <0.05 <0.0510/12/2010 210 <0.02 <0.001 0.013 <0.002 <0.002 210 0.085 <0.002 2.9 <2 6.5 <0.006 <0.006 <0.006 <0.005 1.1 <0.02 <0.005 1.1 0.0033 <0.0002 <0.008 <0.0111/16/1994 <0.05 <0.005 <0.005 <0.1 <0.002 149 <0.1 <0.0005 12 0 12 <0.025 <0.05 <0.025 1.4 <0.05 <0.005 1 <0.03 <0.001 <0.05 <0.05
7/7/2010 110 <0.020 <0.0010 0.0039 0.0023 <0.0020 110 <0.040 <0.0020 12 <2.0 13 <0.0060 <0.0060 <0.0060 1.4 <0.020 <0.0050 <1.0 <0.0020 <0.00020 <0.0080 <0.01010/4/2010 110 <0.02 <0.001 0.0039 <0.002 <0.002 110 0.051 <0.002 12 <2 13 <0.006 <0.006 <0.006 1.3 <0.02 <0.005 <1 <0.002 <0.0002 <0.008 <0.015/11/2011 120 <0.02 <0.001 0.0041 0.002 <0.002 110 0.048 <0.002 12 <2 13 <0.006 <0.006 <0.006 <0.005 1.3 <0.02 <0.005 1.2 <0.002 <0.0002 <0.008 <0.01
MW-10 11/16/1994 <0.05 <0.005 <0.005 <0.1 <0.002 262 <0.1 <0.0005 59 0 14 <0.025 <0.05 <0.025 0.43 <0.05 <0.005 9.4 <0.03 <0.001 <0.05 <0.0511/16/1994 <0.05 <0.005 <0.005 <0.1 <0.002 263 <0.1 <0.0005 63 0 15 <0.025 <0.05 <0.025 0.45 <0.05 <0.005 9.7 <0.03 <0.001 <0.05 <0.05
7/7/2010 190 <0.020 <0.0010 0.0015 0.018 <0.0020 190 <0.040 <0.0020 59 <2.0 14 <0.0060 <0.0060 <0.0060 0.49 <0.020 <0.0050 8.1 <0.0020 <0.00020 <0.0080 <0.01010/4/2010 210 <0.02 <0.001 0.0016 0.02 <0.002 210 <0.04 <0.002 62 <2 14 <0.006 <0.006 <0.006 0.49 <0.02 <0.005 8.9 <0.002 <0.0002 <0.008 <0.015/10/2011 210 <0.02 <0.001 0.0017 0.02 <0.002 210 <0.04 <0.002 64 <2 15 <0.006 <0.006 <0.006 <0.01 0.5 <0.02 <0.005 8.6 <0.002 <0.0002 <0.008 <0.0110/8/1981 <0.25 <0.004 <1 266 <0.004 <0.01 55.7 <1 24.9 <0.05 <0.05 <0.05 <0.05 0.84 0.27 <0.05 13.7 0.92 <1 <0.1 <0.0511/4/1981 <0.01 <0.01 <0.2 <0.1 <0.005 54 28 <0.01 <0.02 <0.05 0.04 1 <0.1 <0.02 0.6 <0.001 <0.05 <0.05
11/13/1981 <0.25 <0.005 0.2 274.4 0.044 0.006 71.6 24.08 <0.005 0.001 0.83 <0.005 19.28 1.34 <0.0005 0.011 <0.0511/17/1981 <0.01 <0.005 0.24 <0.1 <0.005 59 24 <0.01 <0.02 0.069 <0.01 0.8 <0.1 <0.02 1.4 <0.001 0.06 <0.0511/23/1981 <0.01 <0.01 0.02 <0.1 <0.005 58 26 <0.02 <0.02 <0.05 <0.01 0.8 <0.1 <0.02 1.2 <0.001 <0.05 <0.0512/7/1981 <0.01 <0.01 <0.2 <0.1 <0.005 58 24 <0.01 <0.02 <0.05 <0.01 0.8 <0.1 <0.02 1.2 <0.001 <0.05 <0.05
12/15/1981 <0.01 <0.01 <0.2 <0.1 <0.005 68 24 <0.01 <0.02 <0.05 <0.01 0.8 <0.1 <0.02 1.2 <0.001 <0.05 <0.0512/22/1981 <0.01 <0.01 <0.2 <0.1 <0.005 66 22 <0.01 <0.02 <0.05 <0.01 0.8 <0.1 <0.02 1 <0.001 <0.05 <0.05
1/5/1982 <0.01 <0.01 <0.2 <0.1 <0.005 67 22 <0.01 <0.02 <0.05 <0.01 0.8 0.14 <0.02 0.71 0.0012 <0.05 <0.051/26/1982 <0.005 22 <0.05 <0.01 0.7 <0.1 0.45 <0.001 <0.12/22/1982 <0.005 24 0.48 <0.01 0.7 0.83 0.26 <0.001 <0.054/26/1982 <0.005 26 <0.05 <0.01 0.6 1.2 0.16 <0.001 <0.055/24/1982 <0.1 0.28
MW-5
MW-6
MW-8
MW-9
MW-11
NP-1
MW-1
MW-2
MW-4

Table 8-11Groundwater Quality Analytical Results
Table 8-11, Page 18 of 34
Well NameCollection
DateMcCravey-Greyback 3/31/1993
1/1/19759/28/20105/7/1975
7/20/19949/28/20106/13/19757/20/19949/19/19757/20/19941/1/19758/2/19947/8/2010
9/27/20101/1/1975
7/21/199410/12/201011/16/1994
7/7/201010/4/20105/11/2011
MW-10 11/16/199411/16/1994
7/7/201010/4/20105/10/201110/8/198111/4/1981
11/13/198111/17/198111/23/198112/7/1981
12/15/198112/22/1981
1/5/19821/26/19822/22/19824/26/19825/24/1982
MW-5
MW-6
MW-8
MW-9
MW-11
NP-1
MW-1
MW-2
MW-4
Nitr
ate
(As
N)+
Nitr
ite (A
s N
) (m
g/L)
Nitr
ate
as N
(NO
3)
(mg/
L)
Nitr
ogen
, Nitr
ate
(As
N) (
mg/
L)
Nitr
ogen
, Nitr
ite(A
s N
) (m
g/L)
pH Pota
ssiu
m (m
g/L)
Sele
nium
(mg/
L)
Silic
on (m
g/L)
Silv
er (m
g/L)
Sodi
um (m
g/L)
Spec
ific
Con
duct
ance
(µ
mho
s/cm
)
Sulfa
te (m
g/L)
Susp
ende
d So
lids
(mg/
L)
Thal
lium
(mg/
L)
Tota
l Dis
solv
ed
Solid
s (m
g/L)
Ura
nium
(mg/
L)
Vana
dium
(mg/
L)
Zinc
(mg/
L)
3 7.8 2 <0.005 <0.01 78 927 207 632 0.016.1 8.1 10.6 85 480 73 433
1.9 8.1 3.9 <0.005 15 <0.005 40 440 48 <10 <0.001 303 0.0016 <0.05 0.437.9 5.3 89 400 40 327
<1 9 <1 <0.005 <0.025 79 347 18 <0.005 254 <0.05<1 9.27 <1 <0.005 23 <0.005 80 360 18 <10 <0.001 274 0.0022 0.065 <0.01
7.9 4.4 73 620 110<1 8.34 3.4 <0.005 <0.025 56 408 66 <0.005 256 <0.05
<0.5 7.7 4.1 54 390 26 260<1 7.97 3.6 <0.005 <0.025 33 507 24 <0.005 440 <0.054.3 7.6 7.3 90 520 38 260<1 8.09 6.2 <0.005 <0.025 120 626 45 <0.005 436 <0.05
8.5 8 6.0 0.0015 46 <0.0050 120 610 49 <10 <0.0010 456 <0.0010 <0.050 <0.010<1 8.44 6.3 <0.005 45 <0.005 120 620 49 <10 <0.001 468 <0.001 <0.05 <0.01
15.4 7.7 6.2 45 440 21 293<1 8.88 3.4 <0.005 <0.025 89 438 18 <0.005 290 <0.05
<1 9.23 3.7 0.0016 14 <0.005 97 450 16 49 <0.001 287 0.0016 <0.05 <0.01<1 8.05 2.3 <0.005 <0.025 52 293 12 <0.005 230 <0.05
1.1 8 2.0 <0.0010 15 <0.0050 54 290 12 <10 <0.0010 206 0.0012 <0.050 <0.0107.4 8.06 2 <0.001 14 <0.005 51 300 11 <10 <0.001 194 0.0012 <0.05 <0.012.1 8.38 2.1 <0.001 15 <0.005 55 300 12 <10 <0.001 206 0.0013 <0.05 0.048
<1 7.84 1.9 <0.005 <0.025 29 473 25 <0.005 310 <0.05<1 7.79 1.5 <0.005 <0.025 23 480 21 <0.005 314 <0.05
<1.0 7 1.3 <0.0010 20 <0.0050 23 420 15 <10 <0.0010 289 <0.0010 <0.050 <0.010<1 7.32 1.5 <0.001 20 <0.005 24 470 14 12 <0.001 301 <0.001 <0.05 <0.01
<0.1 <0.1 7.54 1.4 <0.001 20 <0.005 23 470 14 <10 <0.001 308 0.0015 <0.05 <0.010.47 7.6 8.25 0.003 <0.02 61.7 108 496 0.40.3 8.1 <0.005 <0.02 148 470 0.140.09 7.65 5.85 0.029 <0.001 39.1 625 130.7 470 0.440.2 8 <0.005 <0.02 154 460 3.90.2 7.7 <0.005 <0.02 146 530 4.10.2 7.3 <0.005 <0.02 158 490 5.1
<0.2 7.8 <0.005 <0.02 151 480 5.30.3 7.8 <0.005 <0.02 149 450 4.10.7 7.6 <0.02 <0.02 163 400 4.10.5 7.9 <0.005 154 4400.6 7.9 <0.005 158 4600.7 7.9 <0.005 154 440

Table 8-11Groundwater Quality Analytical Results
Table 8-11, Page 19 of 34
Well NameCollection
Date Alka
linity
, Tot
al (A
s C
aCO
3) (m
g/L
CaC
O3)
Alum
inum
(mg/
L)
Antim
ony
(mg/
L)
Arse
nic
(mg/
L)
Bariu
m (m
g/L)
Bery
llium
(mg/
L)
Bica
rbon
ate
(mg/
L)
Boro
n (m
g/L)
Cad
miu
m (m
g/L)
Cal
cium
(mg/
L)
Car
bona
te (m
g/L)
Chl
orid
e (m
g/L)
Chr
omiu
m (m
g/L)
Cob
alt (
mg/
L)
Cop
per (
mg/
L)
Cya
nide
(mg/
L)
Fluo
ride
(mg/
L)
Iron
(mg/
L)
Lead
(mg/
L)
Mag
nesi
um (m
g/L)
Man
gane
se (m
g/L)
Mer
cury
(mg/
L)
Mol
ybde
num
(mg/
L)
Nic
kel (
mg/
L)
5/28/1982 <0.1 0.226/8/1982 <0.005 20 <0.05 <0.01 0.6 <0.1 0.25 <0.001 <0.05
6/30/1982 <0.005 18 <0.05 <0.01 0.6 <0.1 0.18 <0.001 <0.0510/27/1982 <0.005 20 <0.05 <0.01 0.7 0.45 0.058 <0.001 <0.052/21/1983 <0.005 18 <0.05 <0.01 0.7 <0.1 <0.05 <0.001 <0.055/13/1983 <0.005 24 <0.05 <0.01 0.6 <0.1 <0.05 <0.001 <0.058/9/1983 <0.005 22 <0.05 <0.01 0.6 0.22 <0.05 <0.001 <0.05
11/1/1983 <0.005 18 <0.05 <0.01 0.6 0.14 <0.05 <0.001 <0.053/16/1984 <0.005 22 <0.05 <0.01 0.6 <0.1 <0.05 0.0083 <0.055/30/1984 <0.005 22 <0.05 <0.01 0.6 <0.1 <0.05 <0.001 <0.059/12/1984 <0.005 22 <0.05 <0.01 0.6 <0.1 <0.05 <0.001 <0.05
11/27/1984 <0.005 16 <0.05 <0.01 0.6 <0.1 <0.05 <0.001 <0.055/17/1985 20
11/13/1985 165/23/1986 1810/8/1986 223/30/1989 <0.1 <0.1 <0.1 279 <0.1 <0.1 88 14.9 <0.1 <0.05 <0.1 <0.1 <0.1 23 <0.05 <0.1 <0.17/19/1991 0.003 0.02 256.3 <0.005 81.1 0 21.6 <0.02 0.58 0.59 0.007 23.9 <0.02 <0.00028/29/1991 21.1
11/26/1991 22.73/15/1992 22.15/25/1992 28.67/16/1992 21.710/8/1992 21.7
11/27/1992 21.312/15/1992 23.72/25/1993 22.63/30/1993 <0.1 <0.005 <0.5 306 0.03 <0.002 79 0 22 <0.02 <0.05 <0.01 <0.01 0.59 0.17 <0.02 27 <0.02 <0.001 <0.02 <0.019/28/1993 36.23/17/1994 245/24/1994 0.83 <0.005 0.005 <0.1 263 0.0096 79 0 22 <0.025 <0.025 0.56 9.5 0.016 23 0.1 <0.001 <0.056/23/1994 40.37/21/1994 <0.05 <0.005 <0.005 <0.1 <0.002 249 <0.1 <0.0005 71 0 23 <0.025 <0.05 <0.025 0.65 0.052 <0.005 23 0.27 <0.001 <0.05 <0.059/22/1994 24.31/29/1995 26.23/29/1995 23.36/27/1995 24.1
NP-1

Table 8-11Groundwater Quality Analytical Results
Table 8-11, Page 20 of 34
Well NameCollection
Date5/28/19826/8/1982
6/30/198210/27/19822/21/19835/13/19838/9/1983
11/1/19833/16/19845/30/19849/12/1984
11/27/19845/17/1985
11/13/19855/23/198610/8/19863/30/19897/19/19918/29/1991
11/26/19913/15/19925/25/19927/16/199210/8/1992
11/27/199212/15/19922/25/19933/30/19939/28/19933/17/19945/24/19946/23/19947/21/19949/22/19941/29/19953/29/19956/27/1995
NP-1
Nitr
ate
(As
N)+
Nitr
ite (A
s N
) (m
g/L)
Nitr
ate
as N
(NO
3)
(mg/
L)
Nitr
ogen
, Nitr
ate
(As
N) (
mg/
L)
Nitr
ogen
, Nitr
ite(A
s N
) (m
g/L)
pH Pota
ssiu
m (m
g/L)
Sele
nium
(mg/
L)
Silic
on (m
g/L)
Silv
er (m
g/L)
Sodi
um (m
g/L)
Spec
ific
Con
duct
ance
(µ
mho
s/cm
)
Sulfa
te (m
g/L)
Susp
ende
d So
lids
(mg/
L)
Thal
lium
(mg/
L)
Tota
l Dis
solv
ed
Solid
s (m
g/L)
Ura
nium
(mg/
L)
Vana
dium
(mg/
L)
Zinc
(mg/
L)
1.1 7.5 <0.005 162 5001.1 7.7 <0.005 143 5001.3 7.7 <0.005 151 4701.3 7.7 <0.005 156 4901.1 7.9 <0.005 149 4701.1 7.8 <0.005 130 4802.1 7.8 <0.005 125 5001.8 8.2 <0.005 124 4800.7 7.5 <0.005 154 5101.1 7.7 <0.005 137 4801.1 7.8 <0.005 144 480
7.6 144 5107.3 149 4807.6 142 5007.4 107 470
3 <0.1 46 137 492 2.60.99 8.04 2 <0.002 <0.02 31.2 761 133.4 530
7.69 140.7 5017.12 136.8 14847.8 146.2 5107.49 128.2 6087.5 142.2 4877.35 128.8 5177.85 142.4 4987.58 125 5027.42 138.3 510
1.1 7.7 1.8 <0.005 <0.01 52 767 145 496 1.137.48 110.1 5087.3 134.2 516
1.1 7.53 2.5 <0.005 <0.025 48 680 130 510 5.77.5 142.3 453
<1 7.87 2.2 <0.005 <0.025 47 698 133 <0.005 464 4.97.49 118.8 4887.94 125.4 4077.98 86.2 3928.02 113.7 385

Table 8-11Groundwater Quality Analytical Results
Table 8-11, Page 21 of 34
Well NameCollection
Date Alka
linity
, Tot
al (A
s C
aCO
3) (m
g/L
CaC
O3)
Alum
inum
(mg/
L)
Antim
ony
(mg/
L)
Arse
nic
(mg/
L)
Bariu
m (m
g/L)
Bery
llium
(mg/
L)
Bica
rbon
ate
(mg/
L)
Boro
n (m
g/L)
Cad
miu
m (m
g/L)
Cal
cium
(mg/
L)
Car
bona
te (m
g/L)
Chl
orid
e (m
g/L)
Chr
omiu
m (m
g/L)
Cob
alt (
mg/
L)
Cop
per (
mg/
L)
Cya
nide
(mg/
L)
Fluo
ride
(mg/
L)
Iron
(mg/
L)
Lead
(mg/
L)
Mag
nesi
um (m
g/L)
Man
gane
se (m
g/L)
Mer
cury
(mg/
L)
Mol
ybde
num
(mg/
L)
Nic
kel (
mg/
L)
9/21/1995 27.21/10/1996 26.14/3/1996 25.7
9/25/1996 23.61/15/1997 25.61/31/2010 220 <0.020 <0.0025 <0.0025 0.037 <0.0020 220 <0.040 <0.0020 87 <2.0 38 <0.0060 <0.0060 <0.0060 <0.005 0.55 0.10 <0.0050 29 0.0088 <0.00020 <0.0080 <0.0106/28/2010 230 <0.020 <0.0010 0.0034 0.043 <0.0020 230 <0.040 <0.0020 90 <2.0 37 <0.0060 <0.0060 <0.0060 0.61 <0.020 <0.0050 26 <0.0020 <0.00020 <0.0080 <0.01010/5/2010 220 0.14 <0.001 0.0035 0.041 <0.002 220 0.04 <0.002 86 <2 35 <0.006 <0.006 <0.006 0.58 <0.02 <0.005 28 <0.002 <0.0002 <0.008 <0.0110/8/1981 <0.25 0.024 <1 159 0.08 <0.01 46 <1 45.1 <0.05 <0.05 <0.05 <0.05 1.78 <0.1 <0.05 14.6 0.62 <1 <0.1 <0.0511/6/1981 <0.01 <0.01 <0.2 <0.1 <0.005 53 35 <0.01 <0.02 <0.05 <0.01 1.4 <0.1 <0.02 0.39 <0.001 0.21 <0.05
11/13/1981 <0.25 <0.005 <0.1 221.3 0.04 <0.001 65.1 30.79 <0.005 0.0026 1.14 <0.005 18.67 0.79 <0.0005 0.04 <0.0111/23/1981 <0.01 <0.01 0.02 <0.1 <0.005 57 30 <0.02 <0.02 <0.05 <0.01 0.9 <0.1 <0.02 0.54 <0.001 0.06 <0.0512/7/1981 <0.01 <0.01 <0.2 <0.1 <0.005 53 30 <0.01 <0.02 <0.05 <0.01 0.8 <0.1 <0.02 0.54 <0.001 0.06 <0.05
12/15/1981 <0.01 <0.01 <0.2 <0.1 <0.005 62 32 <0.01 <0.02 <0.05 <0.01 0.9 <0.1 <0.02 0.52 <0.001 0.072 <0.0512/22/1981 <0.01 <0.01 0.21 <0.1 <0.005 73 32 <0.01 <0.02 <0.05 <0.01 0.6 0.12 <0.02 0.51 <0.001 0.053 <0.05
1/5/1982 <0.01 <0.01 <0.2 <0.1 <0.005 65 28 <0.01 <0.02 <0.05 <0.01 0.9 0.14 <0.02 0.49 <0.001 0.07 <0.051/26/1982 <0.005 24 <0.05 <0.01 0.7 <0.1 0.34 <0.001 <0.12/22/1982 <0.005 30 0.069 <0.01 0.7 0.37 0.3 <0.001 <0.054/26/1982 <0.005 42 <0.05 <0.01 1 1.2 0.29 <0.001 <0.055/18/1982 0.015 34 <0.05 <0.01 0.6 0.68 0.078 <0.001 <0.055/24/1982 <0.1 <0.055/28/1982 <0.1 <0.056/8/1982 <0.005 26 <0.05 <0.01 0.5 <0.1 <0.05 <0.001 <0.05
6/30/1982 <0.005 26 <0.05 <0.01 0.6 <0.1 <0.05 <0.001 <0.059/2/1982 316 <0.001 73.8 26.49 0.54 17.9 <0.05 <0.01
10/27/1982 <0.005 26 <0.05 <0.01 0.6 0.29 <0.05 <0.001 <0.052/21/1983 <0.005 24 <0.05 <0.01 0.6 0.12 <0.05 <0.001 <0.055/13/1983 <0.005 24 <0.05 <0.01 0.6 <0.1 <0.05 <0.001 <0.058/9/1983 <0.005 36 <0.05 <0.01 0.6 <0.1 <0.05 <0.001 <0.05
11/1/1983 <0.005 24 <0.05 <0.01 0.6 0.17 <0.05 <0.001 <0.053/16/1984 <0.005 30 <0.05 <0.01 0.8 <0.1 <0.05 0.001 <0.055/30/1984 <0.005 32 <0.05 <0.01 0.6 <0.1 <0.05 <0.001 <0.059/12/1984 <0.005 22 <0.05 <0.01 0.6 <0.1 <0.05 <0.001 <0.05
11/27/1984 <0.005 20 <0.05 <0.01 0.6 <0.1 <0.05 <0.001 <0.055/17/1985 22
11/13/1985 225/23/1986 2810/8/1986 243/30/1989 <0.1 <0.1 <0.1 183 <0.1 <0.1 52 29.2 <0.1 <0.05 <0.1 <0.1 <0.1 18 0.06 <0.1 <0.1
NP-2
NP-1

Table 8-11Groundwater Quality Analytical Results
Table 8-11, Page 22 of 34
Well NameCollection
Date9/21/19951/10/19964/3/1996
9/25/19961/15/19971/31/20106/28/201010/5/201010/8/198111/6/1981
11/13/198111/23/198112/7/1981
12/15/198112/22/1981
1/5/19821/26/19822/22/19824/26/19825/18/19825/24/19825/28/19826/8/1982
6/30/19829/2/1982
10/27/19822/21/19835/13/19838/9/1983
11/1/19833/16/19845/30/19849/12/1984
11/27/19845/17/1985
11/13/19855/23/198610/8/19863/30/1989
NP-2
NP-1
Nitr
ate
(As
N)+
Nitr
ite (A
s N
) (m
g/L)
Nitr
ate
as N
(NO
3)
(mg/
L)
Nitr
ogen
, Nitr
ate
(As
N) (
mg/
L)
Nitr
ogen
, Nitr
ite(A
s N
) (m
g/L)
pH Pota
ssiu
m (m
g/L)
Sele
nium
(mg/
L)
Silic
on (m
g/L)
Silv
er (m
g/L)
Sodi
um (m
g/L)
Spec
ific
Con
duct
ance
(µ
mho
s/cm
)
Sulfa
te (m
g/L)
Susp
ende
d So
lids
(mg/
L)
Thal
lium
(mg/
L)
Tota
l Dis
solv
ed
Solid
s (m
g/L)
Ura
nium
(mg/
L)
Vana
dium
(mg/
L)
Zinc
(mg/
L)
7.96 145 3737.73 109.4 2777.89 123.3 3008.22 94.4 3208.42 109.13 318
1.4 8 2.0 0.0055 <0.0050 52 780 140 <0.0025 514 0.381.4 8 1.9 0.0045 19 <0.0050 46 790 150 <10 <0.0010 548 0.0019 <0.050 0.0474.9 7.63 1.9 0.0045 18 <0.005 50 800 140 13 <0.001 537 0.0018 <0.05 0.055
0.23 7.39 9.57 <0.002 <0.02 93.5 198 476 0.310.4 7.6 <0.005 <0.02 164 450 1.70.25 7.65 3.9 0.017 <0.001 59.8 675 162.4 466 3.180.7 7.7 <0.005 <0.02 156 520 3.50.6 7.5 <0.005 <0.02 160 490 4.40.5 8 <0.005 <0.02 161 480 2.90.8 8 <0.005 <0.02 161 440 2.80.9 7.6 <0.02 <0.02 158 400 3.21.1 8 <0.005 160 4500.8 8 <0.005 151 4402.4 8 <0.005 149 4501.8 7.9 <0.005 128 460
0.9 7.8 <0.005 158 4901.4 7.8 <0.005 133 4901.66 7.4 1.95 <0.005 57.5 650 127 4681.6 7.9 <0.005 120 4401.6 7.8 <0.005 127 4401.5 8.1 <0.005 139 4601.6 7.9 <0.005 148 5602.3 8 <0.005 111 4701.6 8.2 <0.005 146 5001.4 7.7 <0.005 175 5201.7 7.8 <0.005 134 4701.7 7.9 <0.005 125 470
7.8 120 4807.4 115 4607.6 113 4807.4 100 430
3 <0.1 65 124 376 0.5

Table 8-11Groundwater Quality Analytical Results
Table 8-11, Page 23 of 34
Well NameCollection
Date Alka
linity
, Tot
al (A
s C
aCO
3) (m
g/L
CaC
O3)
Alum
inum
(mg/
L)
Antim
ony
(mg/
L)
Arse
nic
(mg/
L)
Bariu
m (m
g/L)
Bery
llium
(mg/
L)
Bica
rbon
ate
(mg/
L)
Boro
n (m
g/L)
Cad
miu
m (m
g/L)
Cal
cium
(mg/
L)
Car
bona
te (m
g/L)
Chl
orid
e (m
g/L)
Chr
omiu
m (m
g/L)
Cob
alt (
mg/
L)
Cop
per (
mg/
L)
Cya
nide
(mg/
L)
Fluo
ride
(mg/
L)
Iron
(mg/
L)
Lead
(mg/
L)
Mag
nesi
um (m
g/L)
Man
gane
se (m
g/L)
Mer
cury
(mg/
L)
Mol
ybde
num
(mg/
L)
Nic
kel (
mg/
L)
7/19/1991 <0.002 <0.01 56.1 <0.005 34.2 0 60.9 <0.02 <0.02 0.64 <0.05 <0.005 24 <0.02 <0.00028/29/1991 62.8
11/26/1991 633/15/1992 67.6 <0.055/25/1992 66.6 <0.057/16/1992 65.3 <0.0510/8/1992 78.2
11/27/1992 63.712/15/1992 82.5 <0.052/25/1993 77.83/30/1993 0.5 <0.005 0.6 289 0.1 <0.002 163 0 239 <0.02 <0.05 0.01 <0.01 1.33 1.85 <0.02 61 0.07 <0.001 <0.02 <0.019/28/1993 2073/17/1994 118.25/24/1994 4.6 <0.005 <0.005 <0.1 261 0.00097 120 0 130 <0.025 <0.025 0.97 4.5 0.0079 47 0.19 <0.001 <0.056/23/1994 124.37/22/1994 <0.05 0.0059 <0.005 <0.1 <0.002 270 <0.1 <0.0005 120 0 128 <0.025 <0.05 <0.025 0.94 <0.05 <0.005 43 <0.03 <0.001 <0.05 <0.059/22/1994 123.81/29/1995 94.13/29/1995 90.76/27/1995 95.99/21/1995 86.61/10/1996 78.64/3/1996 76.8
9/25/1996 57.21/15/1997 561/31/2010 160 <0.020 <0.0025 0.0032 0.058 <0.0020 160 <0.040 <0.0020 120 <2.0 150 <0.0060 <0.0060 <0.0060 <0.005 0.48 0.089 <0.0050 35 0.19 <0.00020 <0.0080 <0.0106/28/2010 170 <0.020 <0.0010 <0.0010 0.057 <0.0020 170 <0.040 <0.0020 130 <2.0 170 <0.0060 <0.0060 <0.0060 0.44 <0.020 <0.0050 35 0.021 <0.00020 <0.0080 <0.01010/8/1981 <0.25 0.005 <1 211 0.188 <0.01 40.9 <1 28.6 <0.05 <0.05 <0.05 <0.05 1.58 <0.1 <0.05 9.55 0.81 <1 <0.1 <0.05
10/27/1981 <0.01 <0.01 0.2 <0.1 <0.005 41 28 <0.01 <0.02 <0.05 <0.01 1.9 0.39 <0.02 1 <0.001 0.16 <0.0510/30/1981 <0.25 <0.005 <1 0.29 <0.01 31.2 <0.05 <0.05 <0.05 <0.05 1.6 <0.1 <0.05 1.03 <0.001 <0.1 <0.0211/6/1981 <0.01 <0.01 <0.2 <0.1 <0.005 39 28 <0.01 <0.02 <0.05 <0.01 1.6 <0.1 <0.02 0.47 <0.001 0.26 <0.05
11/13/1981 <0.25 0.009 <0.1 190.3 0.034 <0.001 55.2 26.71 <0.005 1.39 <0.005 13.05 1.01 <0.0005 0.065 <0.0511/17/1981 <0.01 <0.01 0.24 <0.1 <0.005 44 26 <0.01 <0.02 <0.05 <0.01 1.4 <0.1 <0.02 1 <0.001 0.2 <0.0511/23/1981 <0.01 <0.01 0.02 <0.1 <0.005 47 26 <0.02 <0.02 <0.05 <0.01 1.2 <0.1 <0.02 0.96 <0.001 0.15 <0.0512/7/1981 <0.01 <0.01 <0.2 <0.1 <0.005 47 28 <0.01 <0.02 <0.05 <0.01 1.1 <0.1 <0.02 0.78 <0.001 0.13 <0.05
12/15/1981 <0.01 <0.01 <0.2 <0.1 <0.005 56 26 <0.01 <0.02 <0.05 <0.01 1.1 <0.1 <0.02 0.87 <0.001 0.094 <0.0512/22/1981 <0.01 <0.01 <0.2 <0.1 <0.005 73 26 <0.01 <0.02 <0.05 <0.01 0.9 <0.1 <0.02 0.76 <0.001 0.1 <0.05
NP-2
NP-3

Table 8-11Groundwater Quality Analytical Results
Table 8-11, Page 24 of 34
Well NameCollection
Date7/19/19918/29/1991
11/26/19913/15/19925/25/19927/16/199210/8/1992
11/27/199212/15/19922/25/19933/30/19939/28/19933/17/19945/24/19946/23/19947/22/19949/22/19941/29/19953/29/19956/27/19959/21/19951/10/19964/3/1996
9/25/19961/15/19971/31/20106/28/201010/8/1981
10/27/198110/30/198111/6/1981
11/13/198111/17/198111/23/198112/7/1981
12/15/198112/22/1981
NP-2
NP-3
Nitr
ate
(As
N)+
Nitr
ite (A
s N
) (m
g/L)
Nitr
ate
as N
(NO
3)
(mg/
L)
Nitr
ogen
, Nitr
ate
(As
N) (
mg/
L)
Nitr
ogen
, Nitr
ite(A
s N
) (m
g/L)
pH Pota
ssiu
m (m
g/L)
Sele
nium
(mg/
L)
Silic
on (m
g/L)
Silv
er (m
g/L)
Sodi
um (m
g/L)
Spec
ific
Con
duct
ance
(µ
mho
s/cm
)
Sulfa
te (m
g/L)
Susp
ende
d So
lids
(mg/
L)
Thal
lium
(mg/
L)
Tota
l Dis
solv
ed
Solid
s (m
g/L)
Ura
nium
(mg/
L)
Vana
dium
(mg/
L)
Zinc
(mg/
L)
0.02 7.55 0.8 0.018 <0.02 47.8 726 180.8 4538.11 197.6 4717.45 170 4608.07 194.2 4678.34 161.7 4568.13 183.7 4798.26 178.9 4948.38 179.4 4518.43 166.8 6128.62 197.2 475
3.3 7.7 0.9 0.005 <0.01 163 1910 436 1310 0.677.92 299.9 11707.65 300.5 971
<0.1 8.03 2.3 <0.005 <0.025 100 1250 300 878 4.17.69 267.6 848
1.5 7.88 1.3 <0.005 <0.025 120 1360 299 <0.005 878 1.27.55 252.7 9637.57 120.9 7917.69 228.7 11647.93 247.1 7787.36 211.8 7227.1 173.1 6327.23 168.7 6037.68 118 5987.44 148.4 536
2.5 8 2.4 0.017 <0.0050 75 1100 210 <0.0025 746 1.12.7 7 2.2 0.012 17 <0.0050 71 1200 260 740 <0.0010 846 0.0017 <0.050 0.26
<0.05 6.98 9.71 0.005 <0.02 79 94.5 460 1.250.4 8 <0.005 <0.02 148 390 0.98
<0.05 7.89 <0.002 <0.02 102 428 0.930.2 7.9 <0.005 <0.02 140 380 1.1
0.16 7.6 5.85 0.023 0.023 43.7 600 140.6 446 1.59<0.2 8.1 <0.005 <0.02 144 390 1.20.2 7.8 <0.005 <0.01 144 460 1.9
<0.2 7.9 <0.005 <0.02 153 450 3.50.2 7.8 <0.005 <0.02 149 450 2.50.2 7.9 <0.005 <0.02 149 410 2.1

Table 8-11Groundwater Quality Analytical Results
Table 8-11, Page 25 of 34
Well NameCollection
Date Alka
linity
, Tot
al (A
s C
aCO
3) (m
g/L
CaC
O3)
Alum
inum
(mg/
L)
Antim
ony
(mg/
L)
Arse
nic
(mg/
L)
Bariu
m (m
g/L)
Bery
llium
(mg/
L)
Bica
rbon
ate
(mg/
L)
Boro
n (m
g/L)
Cad
miu
m (m
g/L)
Cal
cium
(mg/
L)
Car
bona
te (m
g/L)
Chl
orid
e (m
g/L)
Chr
omiu
m (m
g/L)
Cob
alt (
mg/
L)
Cop
per (
mg/
L)
Cya
nide
(mg/
L)
Fluo
ride
(mg/
L)
Iron
(mg/
L)
Lead
(mg/
L)
Mag
nesi
um (m
g/L)
Man
gane
se (m
g/L)
Mer
cury
(mg/
L)
Mol
ybde
num
(mg/
L)
Nic
kel (
mg/
L)
1/5/1982 <0.01 <0.01 <0.2 <0.1 <0.005 56 26 <0.01 <0.02 <0.05 <0.01 1.1 0.31 <0.02 0.72 <0.001 0.01 <0.051/26/1982 <0.005 30 <0.05 <0.01 1 <0.1 0.7 <0.001 <0.12/22/1982 <0.005 28 <0.05 <0.01 0.9 0.14 0.66 <0.001 <0.054/26/1982 <0.005 28 <0.05 <0.01 0.8 0.24 0.4 <0.001 <0.055/17/1982 <0.005 562 <0.05 <0.01 0.7 0.16 0.23 <0.001 <0.055/24/1982 <0.1 0.0535/28/1982 <0.1 0.0636/8/1982 <0.005 30 <0.05 <0.01 0.5 <0.1 0.1 <0.001 <0.05
6/30/1982 <0.005 26 <0.05 <0.01 0.5 <0.1 0.081 <0.001 <0.059/2/1982 308 <0.001 77.4 27.82 0.53 15.1 <0.05 <0.01
10/27/1982 <0.005 26 <0.05 <0.01 0.6 <0.1 <0.05 <0.001 <0.052/21/1983 <0.005 26 <0.05 <0.01 0.5 <0.1 <0.05 <0.001 <0.055/13/1983 <0.005 64 <0.05 <0.01 0.5 <0.1 <0.05 <0.001 <0.058/9/1983 <0.005 114 <0.05 <0.01 0.5 <0.1 <0.05 <0.001 <0.05
11/1/1983 <0.005 162 <0.05 <0.01 0.5 0.14 <0.05 <0.001 <0.053/16/1984 <0.005 228 <0.05 <0.01 0.6 <0.1 <0.05 0.001 <0.055/30/1984 <0.005 248 <0.05 <0.01 0.4 <0.1 <0.05 <0.001 <0.059/12/1984 <0.005 270 <0.05 <0.01 0.4 <0.1 <0.05 <0.001 <0.05
11/27/1984 <0.005 290 <0.05 <0.01 0.4 <0.1 <0.05 <0.001 <0.055/17/1985 310
11/13/1985 2885/23/1986 28210/8/1986 2723/3/19873/4/1987 188 320 283 67.1
5/25/19871/12/1988 <0.1 <0.1 <0.1 30 <0.1 <0.1 268 359 <0.1 <0.05 <0.1 <0.1 <0.1 57 0.57 <0.1 <0.14/4/1988 254
8/23/1988 251.42/9/1989 254.36/1/1989 241.1
11/30/1989 158.911/14/1990 228.72/11/1991 <0.001 255.97/19/1991 <0.002 <0.01 191.6 <0.005 287 0 239.2 <0.02 <0.02 0.66 0.28 <0.005 53.4 0.08 0.00028/29/1991 254.3
11/26/1991 248.1
NP-3

Table 8-11Groundwater Quality Analytical Results
Table 8-11, Page 26 of 34
Well NameCollection
Date1/5/1982
1/26/19822/22/19824/26/19825/17/19825/24/19825/28/19826/8/1982
6/30/19829/2/1982
10/27/19822/21/19835/13/19838/9/1983
11/1/19833/16/19845/30/19849/12/1984
11/27/19845/17/1985
11/13/19855/23/198610/8/19863/3/19873/4/1987
5/25/19871/12/19884/4/1988
8/23/19882/9/19896/1/1989
11/30/198911/14/19902/11/19917/19/19918/29/1991
11/26/1991
NP-3
Nitr
ate
(As
N)+
Nitr
ite (A
s N
) (m
g/L)
Nitr
ate
as N
(NO
3)
(mg/
L)
Nitr
ogen
, Nitr
ate
(As
N) (
mg/
L)
Nitr
ogen
, Nitr
ite(A
s N
) (m
g/L)
pH Pota
ssiu
m (m
g/L)
Sele
nium
(mg/
L)
Silic
on (m
g/L)
Silv
er (m
g/L)
Sodi
um (m
g/L)
Spec
ific
Con
duct
ance
(µ
mho
s/cm
)
Sulfa
te (m
g/L)
Susp
ende
d So
lids
(mg/
L)
Thal
lium
(mg/
L)
Tota
l Dis
solv
ed
Solid
s (m
g/L)
Ura
nium
(mg/
L)
Vana
dium
(mg/
L)
Zinc
(mg/
L)
0.2 7.7 <0.02 <0.02 154 360 1.70.2 8.1 <0.005 151 400
<0.2 8 <0.005 137 420<0.2 7.9 <0.005 146 41012 7.6 <0.005 900 2460
1.9 7.9 <0.005 150 5001.8 7.9 <0.005 128 5101.94 7.5 3.9 <0.005 64.4 750 123.8 4981.6 8 <0.005 132 4501.4 8.2 <0.005 131 4102.1 8 <0.005 139 5002.3 7.8 <0.005 100 6303.8 7.9 <0.005 163 7603.2 8.1 <0.005 216 8702.9 7.8 <0.005 292 10603.1 7.7 <0.005 292 11403.5 7.8 <0.005 348 1150
7.7 453 14707.2 541 15207.5 624 15907.4 620 1710
6956.8 4.29 117.3 1850 695 1882
735.538 <0.1 142 755 1584 1.1
587 1772835.2 1744763.4 1583713.6 1596742.9 1600821.6 1675
255.9 970.5 15510.23 8.29 7 0.011 <0.02 189.7 2520 820.3 1663
7.84 854.1 16167.08 745.2 1613

Table 8-11Groundwater Quality Analytical Results
Table 8-11, Page 27 of 34
Well NameCollection
Date Alka
linity
, Tot
al (A
s C
aCO
3) (m
g/L
CaC
O3)
Alum
inum
(mg/
L)
Antim
ony
(mg/
L)
Arse
nic
(mg/
L)
Bariu
m (m
g/L)
Bery
llium
(mg/
L)
Bica
rbon
ate
(mg/
L)
Boro
n (m
g/L)
Cad
miu
m (m
g/L)
Cal
cium
(mg/
L)
Car
bona
te (m
g/L)
Chl
orid
e (m
g/L)
Chr
omiu
m (m
g/L)
Cob
alt (
mg/
L)
Cop
per (
mg/
L)
Cya
nide
(mg/
L)
Fluo
ride
(mg/
L)
Iron
(mg/
L)
Lead
(mg/
L)
Mag
nesi
um (m
g/L)
Man
gane
se (m
g/L)
Mer
cury
(mg/
L)
Mol
ybde
num
(mg/
L)
Nic
kel (
mg/
L)
3/15/1992 227.85/25/1992 216.47/16/1992 226.110/8/1992 211.6
11/27/1992 254.712/15/1992 223.2 0.012/25/1993 219.33/30/1993 0.1 <0.005 <0.5 29 0.02 <0.002 296 0 205 <0.02 <0.05 0.01 <0.01 0.54 4.99 <0.02 35 0.32 <0.001 <0.02 <0.019/28/1993 210.3 <0.001 <0.05 0.243/17/1994 169.5 0.012 0.24 0.336/23/1994 205.77/22/1994 <0.05 <0.005 <0.005 <0.1 <0.002 118 <0.1 <0.0005 320 0 194 <0.025 <0.05 <0.025 0.34 <0.05 <0.005 73 0.61 <0.001 <0.05 <0.059/22/1994 195.51/29/1995 566.43/29/1995 185.56/27/1995 202.79/21/1995 208.41/10/1996 208.54/3/1996 208.3
9/25/1996 190.51/15/1997 2077/8/2010 120 <0.020 <0.0010 <0.0010 0.030 <0.0020 120 <0.040 <0.0020 310 <2.0 270 <0.0060 <0.0060 <0.0060 0.36 0.049 <0.0050 60 0.031 <0.00020 <0.0080 <0.010
10/7/2010 120 <0.02 <0.001 <0.005 0.031 <0.002 120 <0.04 <0.002 290 <2 290 <0.006 <0.006 <0.006 0.29 0.1 <0.005 60 0.015 <0.0002 <0.008 <0.015/11/2011 130 <0.02 <0.001 0.0029 0.032 <0.002 130 <0.04 <0.002 300 <2 270 <0.006 <0.006 <0.006 <0.005 0.34 0.039 <0.005 57 0.022 <0.0002 <0.008 <0.014/26/1982 <0.005 46 0.051 <0.01 1.5 3.8 0.6 <0.001 0.075/17/1982 <0.005 46 <0.05 <0.01 1 0.11 <0.05 <0.001 <0.055/24/1982 <0.1 <0.055/28/1982 <0.1 <0.056/8/1982 <0.005 26 <0.05 <0.01 0.5 <0.1 <0.05 <0.001 <0.05
6/30/1982 <0.005 28 <0.05 <0.01 0.4 <0.1 <0.05 <0.001 <0.059/2/1982 63.1 <0.001 7.2 28.72 0.4 3.5 <0.05 <0.01
10/27/1982 0.0061 36 <0.05 <0.01 0.4 0.34 <0.05 <0.001 <0.052/21/1983 <0.005 48 <0.05 <0.01 0.4 0.28 <0.05 0.001 <0.055/13/1983 <0.005 76 <0.05 <0.01 0.4 <0.1 <0.05 <0.001 <0.058/9/1983 <0.005 94 <0.05 <0.01 0.3 <0.1 <0.05 <0.001 <0.05
11/1/1983 <0.005 114 <0.05 <0.01 0.3 <0.1 <0.05 <0.001 <0.053/16/1984 <0.005 126 <0.05 <0.01 0.6 <0.1 <0.05 0.001 <0.05
NP-3
NP-4

Table 8-11Groundwater Quality Analytical Results
Table 8-11, Page 28 of 34
Well NameCollection
Date3/15/19925/25/19927/16/199210/8/1992
11/27/199212/15/19922/25/19933/30/19939/28/19933/17/19946/23/19947/22/19949/22/19941/29/19953/29/19956/27/19959/21/19951/10/19964/3/1996
9/25/19961/15/19977/8/2010
10/7/20105/11/20114/26/19825/17/19825/24/19825/28/19826/8/1982
6/30/19829/2/1982
10/27/19822/21/19835/13/19838/9/1983
11/1/19833/16/1984
NP-3
NP-4
Nitr
ate
(As
N)+
Nitr
ite (A
s N
) (m
g/L)
Nitr
ate
as N
(NO
3)
(mg/
L)
Nitr
ogen
, Nitr
ate
(As
N) (
mg/
L)
Nitr
ogen
, Nitr
ite(A
s N
) (m
g/L)
pH Pota
ssiu
m (m
g/L)
Sele
nium
(mg/
L)
Silic
on (m
g/L)
Silv
er (m
g/L)
Sodi
um (m
g/L)
Spec
ific
Con
duct
ance
(µ
mho
s/cm
)
Sulfa
te (m
g/L)
Susp
ende
d So
lids
(mg/
L)
Thal
lium
(mg/
L)
Tota
l Dis
solv
ed
Solid
s (m
g/L)
Ura
nium
(mg/
L)
Vana
dium
(mg/
L)
Zinc
(mg/
L)
7.63 921.3 16447.85 752.9 16077.26 802.2 15787.69 799.1 14457.49 796.1 16407.75 545.3 15587.65 793.6 15807.4 4.1 <0.005 <0.01 129 2070 825 1560 6.987.88 619.4 1544 1.047.46 746.9 1609 2.587.77 778.6 1628
<1 7.83 4.5 <0.005 <0.025 120 2160 796 <0.005 1620 1.87.65 707.1 16917.45 651.9 16237.48 558 16397.38 717 16077.5 822 15577.32 724.1 14647.29 722.6 14157.72 536.5 14727.51 657.4 1478
6.8 8 3.6 0.023 15 <0.0050 120 2100 790 100 <0.0010 1740 0.0014 <0.050 0.445.6 7.57 3.5 0.023 15 <0.005 110 2000 830 97 <0.001 1660 0.0015 <0.05 0.316.2 7.69 3.3 0.027 15 <0.005 120 2100 790 400 <0.001 1640 0.0015 <0.05 0.24
0.6 8.6 <0.005 132 4101.3 9.4 <0.005 138 310
4.5 8.4 <0.005 140 420<0.2 9.5 <0.005 115 2700.03 8.5 3.9 <0.005 71.3 410 107.1 252<0.2 8.9 <0.005 108 2300.2 9.3 <0.005 115 250
<0.2 7.9 <0.005 134 340<0.2 8.8 <0.005 156 4300.6 8.2 <0.005 206 5300.2 8 <0.005 256 540

Table 8-11Groundwater Quality Analytical Results
Table 8-11, Page 29 of 34
Well NameCollection
Date Alka
linity
, Tot
al (A
s C
aCO
3) (m
g/L
CaC
O3)
Alum
inum
(mg/
L)
Antim
ony
(mg/
L)
Arse
nic
(mg/
L)
Bariu
m (m
g/L)
Bery
llium
(mg/
L)
Bica
rbon
ate
(mg/
L)
Boro
n (m
g/L)
Cad
miu
m (m
g/L)
Cal
cium
(mg/
L)
Car
bona
te (m
g/L)
Chl
orid
e (m
g/L)
Chr
omiu
m (m
g/L)
Cob
alt (
mg/
L)
Cop
per (
mg/
L)
Cya
nide
(mg/
L)
Fluo
ride
(mg/
L)
Iron
(mg/
L)
Lead
(mg/
L)
Mag
nesi
um (m
g/L)
Man
gane
se (m
g/L)
Mer
cury
(mg/
L)
Mol
ybde
num
(mg/
L)
Nic
kel (
mg/
L)
5/30/1984 <0.005 134 <0.05 <0.01 0.3 <0.1 <0.05 <0.001 <0.059/12/1984 <0.005 134 <0.05 <0.01 0.3 <0.1 <0.05 <0.001 <0.05
11/27/1984 <0.005 140 <0.05 <0.01 0.3 <0.1 <0.05 <0.001 <0.055/17/1985 146
11/13/1985 1425/23/1986 13610/8/1986 1345/25/19871/12/1988 <0.1 <0.1 <0.1 24.4 <0.1 <0.1 76 137 <0.1 <0.05 <0.1 <0.1 <0.1 21 0.06 <0.1 <0.14/4/1988 130.4
8/23/1988 132.12/9/1989 1306/1/1989 116.4
11/30/1989 96.911/14/1990 153.12/11/1991 <0.001 126.17/19/1991 <0.002 0.28 54.9 <0.005 63.4 0 112.3 <0.02 0.41 5.14 <0.005 20.8 <0.02 <0.00028/29/1991 110.7
11/26/1991 993/15/1992 102.95/25/1992 106.27/16/1992 94.410/8/1992 102.9
11/27/1992 97.512/15/1992 84.42/25/1993 76.63/31/1993 0.3 <0.005 <0.5 275 0.04 <0.002 76 0 45 <0.02 <0.05 0.01 <0.01 0.53 0.62 <0.02 17 0.84 0.009 <0.02 <0.019/28/1993 56.95/26/1994 3.5 <0.005 <0.005 <0.1 320 0.0034 73 0 39 <0.025 <0.025 0.46 15 0.018 15 0.16 <0.001 <0.056/23/1994 48.57/23/1994 <0.05 0.01 <0.005 <0.1 <0.002 279 <0.1 <0.0005 88 0 34 <0.025 <0.05 <0.025 0.48 <0.05 <0.005 16 <0.03 <0.001 <0.05 <0.059/22/1994 36.91/29/1995 34.53/29/1995 33.86/27/1995 33.29/21/1995 35.31/10/1996 34.7
NP-4
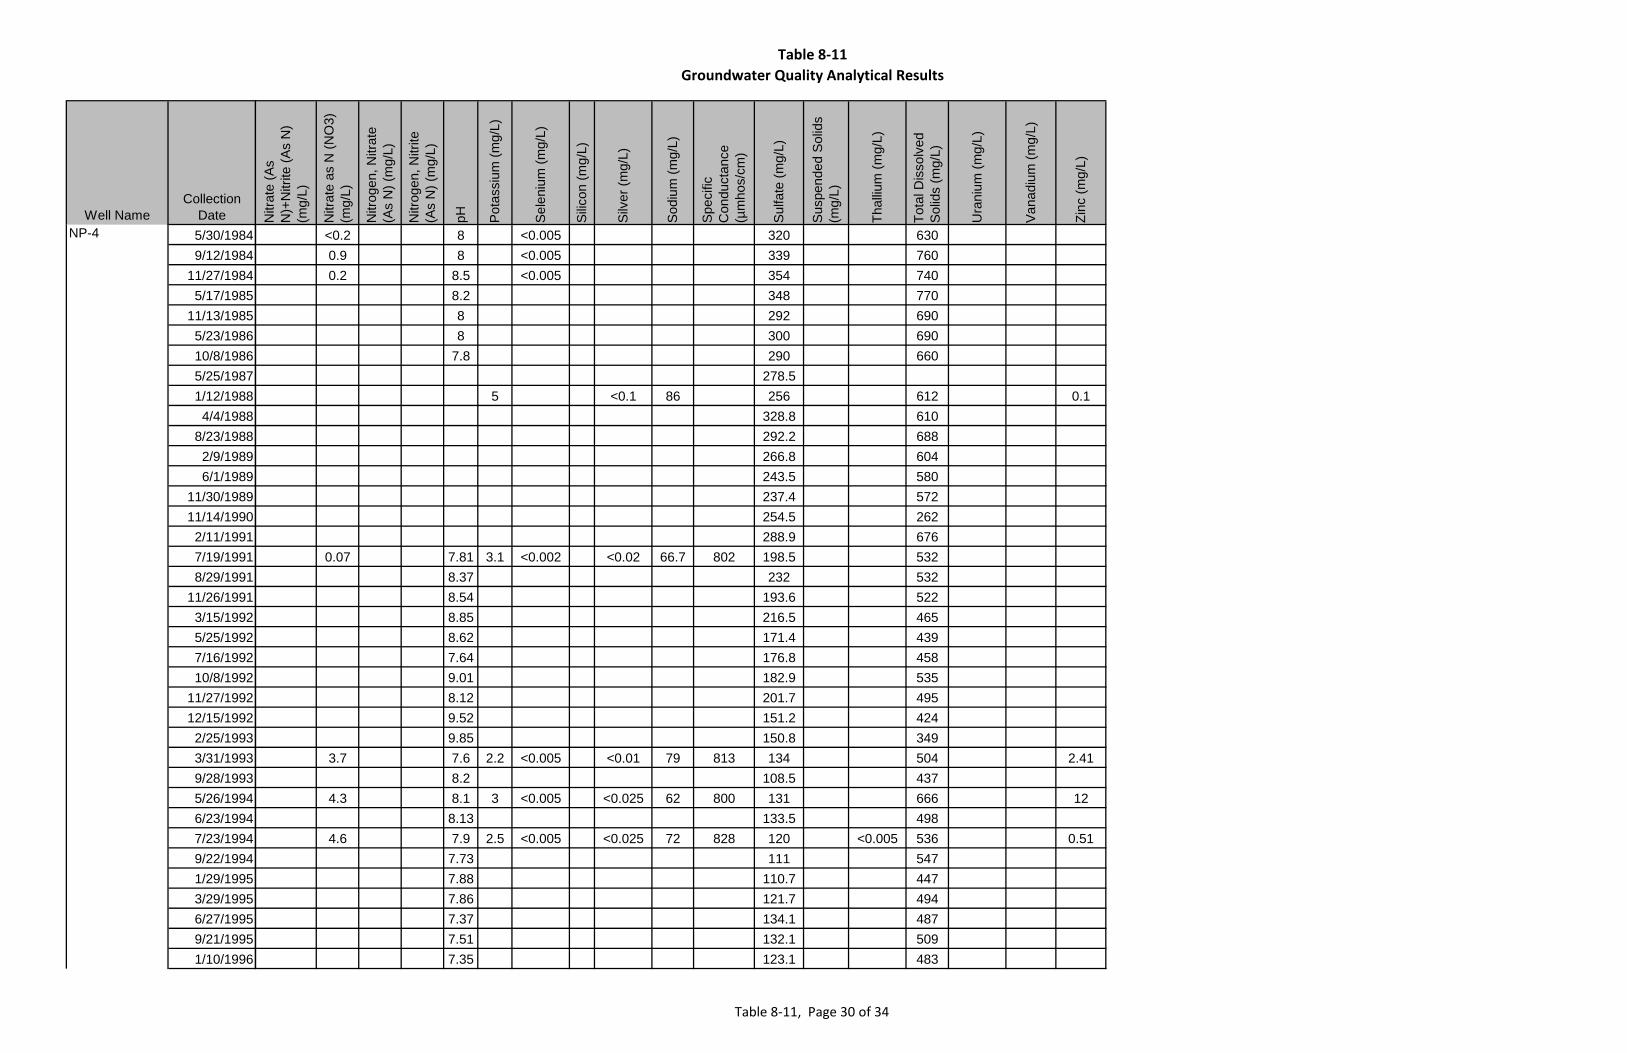
Table 8-11Groundwater Quality Analytical Results
Table 8-11, Page 30 of 34
Well NameCollection
Date5/30/19849/12/1984
11/27/19845/17/1985
11/13/19855/23/198610/8/19865/25/19871/12/19884/4/1988
8/23/19882/9/19896/1/1989
11/30/198911/14/19902/11/19917/19/19918/29/1991
11/26/19913/15/19925/25/19927/16/199210/8/1992
11/27/199212/15/19922/25/19933/31/19939/28/19935/26/19946/23/19947/23/19949/22/19941/29/19953/29/19956/27/19959/21/19951/10/1996
NP-4
Nitr
ate
(As
N)+
Nitr
ite (A
s N
) (m
g/L)
Nitr
ate
as N
(NO
3)
(mg/
L)
Nitr
ogen
, Nitr
ate
(As
N) (
mg/
L)
Nitr
ogen
, Nitr
ite(A
s N
) (m
g/L)
pH Pota
ssiu
m (m
g/L)
Sele
nium
(mg/
L)
Silic
on (m
g/L)
Silv
er (m
g/L)
Sodi
um (m
g/L)
Spec
ific
Con
duct
ance
(µ
mho
s/cm
)
Sulfa
te (m
g/L)
Susp
ende
d So
lids
(mg/
L)
Thal
lium
(mg/
L)
Tota
l Dis
solv
ed
Solid
s (m
g/L)
Ura
nium
(mg/
L)
Vana
dium
(mg/
L)
Zinc
(mg/
L)
<0.2 8 <0.005 320 6300.9 8 <0.005 339 7600.2 8.5 <0.005 354 740
8.2 348 7708 292 6908 300 690
7.8 290 660278.5
5 <0.1 86 256 612 0.1328.8 610292.2 688266.8 604243.5 580237.4 572254.5 262288.9 676
0.07 7.81 3.1 <0.002 <0.02 66.7 802 198.5 5328.37 232 5328.54 193.6 5228.85 216.5 4658.62 171.4 4397.64 176.8 4589.01 182.9 5358.12 201.7 4959.52 151.2 4249.85 150.8 349
3.7 7.6 2.2 <0.005 <0.01 79 813 134 504 2.418.2 108.5 437
4.3 8.1 3 <0.005 <0.025 62 800 131 666 128.13 133.5 498
4.6 7.9 2.5 <0.005 <0.025 72 828 120 <0.005 536 0.517.73 111 5477.88 110.7 4477.86 121.7 4947.37 134.1 4877.51 132.1 5097.35 123.1 483

Table 8-11Groundwater Quality Analytical Results
Table 8-11, Page 31 of 34
Well NameCollection
Date Alka
linity
, Tot
al (A
s C
aCO
3) (m
g/L
CaC
O3)
Alum
inum
(mg/
L)
Antim
ony
(mg/
L)
Arse
nic
(mg/
L)
Bariu
m (m
g/L)
Bery
llium
(mg/
L)
Bica
rbon
ate
(mg/
L)
Boro
n (m
g/L)
Cad
miu
m (m
g/L)
Cal
cium
(mg/
L)
Car
bona
te (m
g/L)
Chl
orid
e (m
g/L)
Chr
omiu
m (m
g/L)
Cob
alt (
mg/
L)
Cop
per (
mg/
L)
Cya
nide
(mg/
L)
Fluo
ride
(mg/
L)
Iron
(mg/
L)
Lead
(mg/
L)
Mag
nesi
um (m
g/L)
Man
gane
se (m
g/L)
Mer
cury
(mg/
L)
Mol
ybde
num
(mg/
L)
Nic
kel (
mg/
L)
4/3/1996 269/25/1996 31.71/15/1997 981/31/2010 210 <0.020 <0.0025 <0.0025 0.036 <0.0020 210 <0.040 <0.0020 100 <2.0 40 <0.0060 <0.0060 <0.0060 <0.005 0.46 0.040 <0.0050 18 0.0098 <0.00020 <0.0080 <0.0107/2/2010 210 <0.020 <0.0010 <0.0010 0.039 <0.0020 210 <0.040 <0.0020 110 <2.0 39 <0.0060 <0.0060 <0.0060 0.46 <0.020 <0.0050 18 0.0020 <0.00020 <0.0080 <0.010
11/4/1981 <0.01 <0.01 <0.2 <0.1 <0.005 86 50 <0.01 <0.02 <0.05 <0.01 1.3 <0.1 <0.02 0.1 <0.001 <0.05 <0.0511/13/1981 0.239 <0.005 0.218 186.7 0.07 <0.001 88.6 37.89 <0.005 <0.1 0.001 1.28 <0.005 14.4 0.14 <0.0005 0.015 0.01911/17/1981 <0.01 <0.01 <0.2 <0.1 <0.005 72 42 <0.01 <0.02 <0.05 <0.01 1.3 <0.1 <0.02 0.3 <0.001 0.07 <0.0511/23/1981 <0.01 <0.01 <0.2 <0.1 <0.005 73 36 <0.02 <0.02 <0.05 <0.01 1.2 <0.1 <0.02 0.091 <0.001 <0.05 <0.0512/7/1981 <0.01 <0.01 <0.2 <0.1 <0.005 66 34 <0.01 <0.02 <0.05 <0.01 1.2 <0.1 <0.02 <0.05 <0.001 <0.05 <0.05
12/15/1981 <0.01 <0.01 <0.2 <0.1 <0.005 90 36 <0.01 <0.02 <0.05 <0.01 1.2 <0.1 <0.02 0.08 <0.001 <0.05 <0.0512/22/1981 <0.01 <0.01 <0.2 <0.1 <0.005 101 36 <0.01 <0.02 <0.05 <0.01 1.1 <0.1 <0.02 <0.05 <0.001 <0.05 <0.05
1/5/1982 <0.01 <0.01 <0.2 <0.1 <0.005 87 34 <0.01 <0.02 <0.05 <0.01 1.1 0.18 <0.02 <0.05 <0.001 <0.05 <0.051/26/1982 <0.005 32 <0.05 <0.01 1.1 <0.01 <0.05 <0.001 <0.12/22/1982 <0.005 32 <0.05 <0.01 1 0.12 <0.05 <0.001 <0.054/26/1982 <0.005 30 0.31 0.04 1.1 3.8 6.9 <0.001 <0.055/17/1982 <0.005 36 <0.05 <0.01 1.1 0.14 <0.05 <0.001 <0.055/24/1982 <0.1 <0.055/28/1982 <0.1 <0.056/8/1982 <0.005 30 <0.05 <0.01 0.9 0.44 <0.05 <0.001 <0.05
6/30/1982 <0.005 28 <0.05 <0.01 0.9 0.36 <0.05 <0.001 <0.059/2/1982 206 <0.001 72.6 33.98 0.82 21.8 <0.05 <0.01
10/27/1982 <0.005 34 <0.05 <0.01 0.8 0.21 <0.05 <0.001 <0.052/21/1983 <0.005 26 <0.05 <0.01 0.5 <0.1 <0.05 <0.001 <0.055/13/1983 <0.005 70 <0.05 <0.01 0.4 <0.1 <0.05 <0.001 <0.058/9/1983 <0.005 26 <0.05 <0.01 0.8 <0.1 <0.05 <0.001 <0.05
11/1/1983 <0.005 30 <0.05 <0.01 0.8 0.1 <0.05 <0.001 <0.053/16/1984 <0.005 26 <0.05 <0.01 0.4 <0.1 <0.05 <0.001 <0.055/30/1984 <0.005 22 <0.05 <0.01 0.8 <0.1 <0.05 <0.001 <0.059/12/1984 <0.005 28 <0.05 <0.01 0.8 <0.1 <0.05 <0.001 <0.05
11/27/1984 <0.005 28 <0.05 <0.01 0.8 <0.1 <0.05 <0.001 <0.055/17/1985 28
11/13/1985 245/23/1986 2810/8/1986 283/30/1989 <0.1 <0.1 <0.1 211 <0.1 <0.1 82 32 <0.1 <0.05 <0.1 <0.1 <0.1 22 <0.05 <0.1 <0.18/29/1991 38.7
11/26/1991 37.73/15/1992 46.75/25/1992 75.57/16/1992 37.8
NP-4
NP-5

Table 8-11Groundwater Quality Analytical Results
Table 8-11, Page 32 of 34
Well NameCollection
Date4/3/1996
9/25/19961/15/19971/31/20107/2/2010
11/4/198111/13/198111/17/198111/23/198112/7/1981
12/15/198112/22/1981
1/5/19821/26/19822/22/19824/26/19825/17/19825/24/19825/28/19826/8/1982
6/30/19829/2/1982
10/27/19822/21/19835/13/19838/9/1983
11/1/19833/16/19845/30/19849/12/1984
11/27/19845/17/1985
11/13/19855/23/198610/8/19863/30/19898/29/1991
11/26/19913/15/19925/25/19927/16/1992
NP-4
NP-5
Nitr
ate
(As
N)+
Nitr
ite (A
s N
) (m
g/L)
Nitr
ate
as N
(NO
3)
(mg/
L)
Nitr
ogen
, Nitr
ate
(As
N) (
mg/
L)
Nitr
ogen
, Nitr
ite(A
s N
) (m
g/L)
pH Pota
ssiu
m (m
g/L)
Sele
nium
(mg/
L)
Silic
on (m
g/L)
Silv
er (m
g/L)
Sodi
um (m
g/L)
Spec
ific
Con
duct
ance
(µ
mho
s/cm
)
Sulfa
te (m
g/L)
Susp
ende
d So
lids
(mg/
L)
Thal
lium
(mg/
L)
Tota
l Dis
solv
ed
Solid
s (m
g/L)
Ura
nium
(mg/
L)
Vana
dium
(mg/
L)
Zinc
(mg/
L)
7.19 123.3 4757.75 125.6 5047.43 1113 2651
7.4 8 2.4 0.0057 <0.0050 79 900 190 <0.0025 626 1.37.5 8 2.1 0.0043 15 <0.0050 70 910 190 140 <0.0010 640 0.0023 <0.050 0.82
4.1 8 <0.005 <0.02 196 570 0.143.56 7.7 5.07 0.014 <0.001 43.7 650 162 488 <0.052.7 8 <0.005 <0.02 158 500 0.194 7.8 <0.005 <0.1 161 580 0.21
3.1 7.9 <0.005 <0.02 172 510 0.243.3 7.8 <0.005 <0.02 168 500 0.373.8 7.9 <0.005 <0.02 161 460 0.324.1 7.7 <0.02 <0.02 163 420 0.42.9 8 <0.005 158 4402 8 <0.005 150 450
1.1 7.9 <0.005 154 4506.7 8 <0.005 165 490
4.5 8.1 <0.005 150 4203.9 8.1 <0.005 133 4604.2 7.6 3.9 <0.005 46 650 137.2 4723.7 8 <0.005 139 4401.3 8.3 <0.005 139 4200.2 8.9 <0.005 134 2903.7 8.1 <0.005 108 4605.2 8.2 <0.005 111 4403 8 <0.005 130 380
2.9 7.8 <0.005 139 4003.4 8 <0.005 125 4203.2 8.2 <0.005 120 420
7.9 130 4507.8 134 4007.9 120 4307.8 113 420
3 <0.1 39 125 458 0.47.68 152.1 499
7 129.5 4727.89 140.7 4567.8 131.1 4907.63 132.4 476

Table 8-11Groundwater Quality Analytical Results
Table 8-11, Page 33 of 34
Well NameCollection
Date Alka
linity
, Tot
al (A
s C
aCO
3) (m
g/L
CaC
O3)
Alum
inum
(mg/
L)
Antim
ony
(mg/
L)
Arse
nic
(mg/
L)
Bariu
m (m
g/L)
Bery
llium
(mg/
L)
Bica
rbon
ate
(mg/
L)
Boro
n (m
g/L)
Cad
miu
m (m
g/L)
Cal
cium
(mg/
L)
Car
bona
te (m
g/L)
Chl
orid
e (m
g/L)
Chr
omiu
m (m
g/L)
Cob
alt (
mg/
L)
Cop
per (
mg/
L)
Cya
nide
(mg/
L)
Fluo
ride
(mg/
L)
Iron
(mg/
L)
Lead
(mg/
L)
Mag
nesi
um (m
g/L)
Man
gane
se (m
g/L)
Mer
cury
(mg/
L)
Mol
ybde
num
(mg/
L)
Nic
kel (
mg/
L)
10/8/1992 39.411/27/1992 117.212/15/1992 40.4 0.0252/25/1993 41.43/30/1993 0.2 <0.005 <0.5 221 0.04 <0.002 76 0 39 <0.02 <0.05 <0.01 <0.01 0.77 0.29 <0.02 26 0.02 <0.001 <0.02 <0.019/28/1993 48.15/24/1994 1.1 <0.005 <0.005 <0.1 211 <0.0005 86 0 41 <0.025 <0.025 0.74 1.2 0.0077 26 0.086 <0.001 <0.056/23/1994 54.17/23/1994 <0.05 <0.005 <0.005 <0.1 <0.002 206 <0.1 <0.0005 79 0 41 <0.025 <0.05 <0.025 0.71 <0.05 <0.005 24 <0.03 <0.001 <0.05 <0.059/22/1994 42.81/29/1995 43.53/29/1995 42.46/27/1995 43.49/21/1995 44.31/10/1996 41.64/3/1996 31.8
9/25/1996 42.51/15/1997 45.76/28/2010 160 <0.020 <0.0010 0.0014 0.018 <0.0020 160 <0.040 <0.0020 100 <2.0 80 <0.0060 <0.0060 <0.0060 0.68 <0.020 <0.0050 31 <0.0020 <0.00020 <0.0080 <0.0109/30/2010 170 <0.02 <0.001 0.0015 0.018 <0.002 170 0.041 <0.002 99 <2 83 <0.006 <0.006 <0.006 <0.01 0.71 <0.02 <0.005 33 0.005 <0.0002 <0.008 <0.015/10/2011 160 <0.02 <0.001 0.0018 0.019 <0.002 160 0.041 <0.002 99 <2 80 <0.006 <0.006 <0.006 <0.01 0.63 <0.02 <0.005 31 <0.002 <0.0002 <0.008 <0.01
Pague 8/20/1946 242 63 26 1.2 2112/23/1975 145 22 0 16 0.46 38/14/1981 <0.01 171 28 0 32 <0.05 <0.01 0.9 0.2 <0.02 41/15/1976 153 21 0 17 0.66 3
11/27/1984 <0.005 20 <0.05 <0.01 0.6 <0.1 <0.05 <0.0018/2/1994 <0.05 0.011 <0.005 <0.1 <0.002 273 <0.1 <0.0005 60 0 24 <0.025 <0.05 <0.025 0.39 0.062 <0.005 8.4 0.032 <0.001 <0.05 <0.05
1/27/1976 158 23 0 24 0.64 38/14/1981 <0.01 139 16 0 66 <0.05 0.01 2.5 0.31 <0.02 1
PW-4 8/2/1994 <0.05 0.0062 0.0058 <0.1 <0.002 190 <0.1 <0.0005 21 0 27 <0.025 <0.05 <0.025 0.46 <0.05 <0.005 1.7 <0.03 <0.001 <0.05 <0.05Saladone Well 12/5/1992 213.2 54.8 <0.3 23SHB-27 9/22/1976 <0.01 205 <0.1 <0.001 5.86 20.6 0.002 <0.001 0.002 0.77 0.007 <0.001 21.4 0.039 <0.0004 0.002SHB-28 9/22/1976 264 <0.1 <0.001 163 51.2 0.002 <0.001 0.005 0.97 0.015 <0.001 32 0.42 <0.0004 0.003SHB-29 9/22/1976 0.1 0.001 65.1 0.004 0.001 0.002 0.52 0.002 14.5 0.049 <0.0004 0.003SHB-30 9/22/1976 0.02 211 <0.1 <0.001 84.8 21 0.004 <0.001 0.002 0.79 0.009 <0.001 21.3 0.036 <0.0004 0.002SHB-34 9/22/1976 12 <0.1 0.001 3.67 <1 0.002 <0.001 0.002 0.14 0.009 0.001 0.52 0.004 <0.0004 <0.001
Note: Blank indicates not analyzed.
NP-5
PW-3
PW-1
PW-2

Table 8-11Groundwater Quality Analytical Results
Table 8-11, Page 34 of 34
Well NameCollection
Date10/8/1992
11/27/199212/15/19922/25/19933/30/19939/28/19935/24/19946/23/19947/23/19949/22/19941/29/19953/29/19956/27/19959/21/19951/10/19964/3/1996
9/25/19961/15/19976/28/20109/30/20105/10/2011
Pague 8/20/194612/23/19758/14/19811/15/1976
11/27/19848/2/1994
1/27/19768/14/1981
PW-4 8/2/1994Saladone Well 12/5/1992SHB-27 9/22/1976SHB-28 9/22/1976SHB-29 9/22/1976SHB-30 9/22/1976SHB-34 9/22/1976
NP-5
PW-3
PW-1
PW-2
Nitr
ate
(As
N)+
Nitr
ite (A
s N
) (m
g/L)
Nitr
ate
as N
(NO
3)
(mg/
L)
Nitr
ogen
, Nitr
ate
(As
N) (
mg/
L)
Nitr
ogen
, Nitr
ite(A
s N
) (m
g/L)
pH Pota
ssiu
m (m
g/L)
Sele
nium
(mg/
L)
Silic
on (m
g/L)
Silv
er (m
g/L)
Sodi
um (m
g/L)
Spec
ific
Con
duct
ance
(µ
mho
s/cm
)
Sulfa
te (m
g/L)
Susp
ende
d So
lids
(mg/
L)
Thal
lium
(mg/
L)
Tota
l Dis
solv
ed
Solid
s (m
g/L)
Ura
nium
(mg/
L)
Vana
dium
(mg/
L)
Zinc
(mg/
L)
7.64 133.2 4318.01 133.9 4757.8 104 4027.65 140.8 487
4 7.8 2.5 <0.005 <0.01 43 746 146 488 0.197.79 109.2 518
3.4 7.84 3.4 <0.005 <0.025 40 680 130 520 2.37.66 142.3 466
3.3 7.89 3.1 <0.005 <0.025 45 749 131 <0.005 494 <0.057.73 117.7 5267.99 101.2 4907.94 130.8 4497.64 119.4 5257.71 134.6 4838.04 136.6 4067.67 130 4058.09 129.4 5047.76 140.69 498
3.9 8 2.9 0.0067 20 <0.0050 44 900 180 23 <0.0010 623 0.0013 <0.050 0.294 7.72 2.8 0.0079 19 <0.005 46 910 170 31 <0.001 629 0.0013 <0.05 0.2
4.1 <0.1 7.76 2.9 0.0076 20 <0.005 43 940 180 130 <0.001 636 0.0013 <0.05 0.251.2 409 80 3483.5 7.8 4.5 38 340 10 2170.7 8.1 53 24 250 <0.053.5 8.1 4.3 39 310 <5 2571.7 7.9 <0.005 125 470<1 7.63 3.4 <0.005 <0.025 46 506 27 <0.005 338 <0.052.6 8 5.1 44 330 <5 2430.8 8.2 87 31 300 0.19<1 7.57 3.5 <0.005 <0.025 73 398 17 <0.005 274 <0.05
0.19 7.91 2.16 22.4 429 23 3540.8 7.61 5.86 <0.01 <0.001 51.1 720 233 434 0.004
<0.1 7.58 11.5 <0.01 <0.001 81.7 1260 353 840 0.018<0.1 7.98 5.02 <0.01 <0.001 60.3 640 384 0.160.7 7.77 4.88 <0.01 <0.001 50.6 720 145 486 0.004
<0.1 7.36 0.63 <0.01 <0.001 2.55 41 <1 50 0.014
Note: Blank indicates not analyzed.

Table 8-12, Page 1 of 1
Sample ID Chemical Number of Samples
Number of Detections
Arithmatic Mean
Geometric Mean
Standard Deviation
Mean + 2 Standard
DeviationsMinimum Maximum
Upper Confidence Level (95%)
Method of Determining
UCLDistribution
Crystalline Bedrock Aquifer WellsGWQ96-22A Chloride 3 3 66 54 40 146 20 89 NA NA NAGWQ96-22A Copper 3 0 NA NA NA NA NA NA NA NA NAGWQ96-22A Sulfate 3 3 210 205 53 316 150 250 NA NA NAGWQ96-22A TDS 3 3 723 723 40 804 700 770 NA NA NAGWQ96-23A Chloride 3 3 19 19 3 25 16 22 NA NA NAGWQ96-23A Copper 3 0 NA NA NA NA NA NA NA NA NAGWQ96-23A Sulfate 3 3 240 214 148 536 140 410 NA NA NAGWQ96-23A TDS 3 3 673 652 216 1105 520 920 NA NA NASanta Fe Group Aquifer System WellsIW-2 Chloride 3 3 376 375 35 446 340 409 NA NA NAIW-2 Copper 2 0 NA NA NA NA NA NA NA NA NAIW-2 Sulfate 3 3 1431 1328 712 2854 1000 2252 NA NA NAIW-2 TDS 3 3 2933 2844 932 4798 2390 4010 NA NA NAMW-6 Chloride 2 2 71 70 6 83 66 75 NA NA NAMW-6 Copper 1 0 NA NA NA NA NA NA NA NA NAMW-6 Sulfate 2 2 42 41 5 51 38 45 NA NA NAMW-6 TDS 2 2 348 337 124 597 260 436 NA NA NANP-1 Chloride 53 53 23 23 4 32 15 40 24 Student's-t NonParametricNP-1 Copper 26 2 0.043 0.027 0.090 0.223 0.005 0.480 NA NA NANP-1 Sulfate 53 53 136 135 17 171 86 163 140 Student's-t NormalNP-1 TDS 53 53 486 472 153 791 277 1484 522 Student's-t NonParametricNP-3 Chloride 64 64 178 122 122 422 26 566 250 Chebyshev NonParametricNP-3 Copper 32 3 0.023 0.020 0.008 0.039 0.001 0.050 NA NA NANP-3 Sulfate 66 66 505 390 296 1096 95 971 375 Chebyshev NonParametricNP-3 TDS 64 64 1186 1015 565 2316 360 2460 1519 Chebyshev NonParametricNotes:Historic data were collected 1981 through 1997NA= not applicable due to entire data set being non-detected values, or not enough data to calculate meaningful statistics
Table 8-12Descriptive Statistics of Historical Data

Table 8-13, Page 1 of 1
Sample ID Chemical Number of Samples
Number of Detections
Arithmatic Mean
Geometric Mean
Standard Deviation
Mean + 2 Standard
DeviationsMinimum Maximum
Upper Confidence Level (95%)
Method of Determining
UCLDistribution
Crystalline Bedrock Aquifer WellsGWQ96-22A Chloride 3 3 75 75 6 86 70 81 NA NA NAGWQ96-22A Copper 3 0 NA NA NA NA NA NA NA NA NAGWQ96-22A Sulfate 3 3 43 43 9 61 34 52 NA NA NAGWQ96-22A TDS 3 3 565 565 8 581 557 573 NA NA NAGWQ96-23A Chloride 4 4 13 13 1 15 12 14 NA NA NAGWQ96-23A Copper 4 0 NA NA NA NA NA NA NA NA NAGWQ96-23A Sulfate 4 4 80 49 56 192 6 140 NA NA NAGWQ96-23A TDS 4 4 754 752 48 850 689 804 NA NA NASanta Fe Group Aquifer System WellsIW-2 Chloride 4 4 550 548 48 645 500 600 NA NA NAIW-2 Copper 4 0 NA NA NA NA NA NA NA NA NAIW-2 Sulfate 4 4 1100 1098 82 1263 1000 1200 NA NA NAIW-2 TDS 4 4 2528 2519 243 3014 2280 2770 NA NA NAMW-6 Chloride 2 2 74 74 1 77 73 75 NA NA NAMW-6 Copper 2 0 NA NA NA NA NA NA NA NA NAMW-6 Sulfate 2 2 49 49 0 49 49 49 NA NA NAMW-6 TDS 2 2 462 462 8 479 456 468 NA NA NANP-1 Chloride 3 3 37 37 2 40 35 38 NA NA NANP-1 Copper 3 0 NA NA NA NA NA NA NA NA NANP-1 Sulfate 3 3 143 143 6 155 140 150 NA NA NANP-1 TDS 3 3 533 533 17 568 514 548 NA NA NANP-3 Chloride 3 3 277 277 12 300 270 290 NA NA NANP-3 Copper 3 0 NA NA NA NA NA NA NA NA NANP-3 Sulfate 3 3 803 803 23 850 790 830 NA NA NANP-3 TDS 3 3 1680 1679 53 1786 1640 1740 NA NA NANotes:Baseline data were collected January 2010 through May 2011NA= not applicable due to entire data set being non-detected values, or not enough data to calculate meaningful statistics
Table 8-13Descriptive Statistics of Baseline Data

Table 8-14, Page 1 of 1
Sample ID ChemicalNumber
of Samples
Number of Detections
Arithmatic Mean
Geometric Mean
Standard Deviation
Mean + 2 Standard
DeviationsMinimum Maximum
Upper Confidence Level (95%)
Method of Determining
UCLDistribution
Crystalline Bedrock Aquifer WellsGWQ96-22A Chloride 6 6 71 64 26 123 20 89 117 Chebyshev* NonParametricGWQ96-22A Copper 6 0 NA NA NA NA NA NA NA NA NAGWQ96-22A Sulfate 6 6 127 94 97 321 34 250 207 Student's-t* NormalGWQ96-22A TDS 6 6 644 639 91 825 557 770 719 Student's-t* NormalGWQ96-23A Chloride 7 7 15 15 4 23 12 22 18 Student's-t* NormalGWQ96-23A Copper 7 0 NA NA NA NA NA NA NA NA NAGWQ96-23A Sulfate 7 7 148 92 127 403 6 410 242 Student's-t* NormalGWQ96-23A TDS 7 7 719 708 136 991 520 920 819 Student's-t* NormalSanta Fe Group Aquifer System WellsIW-2 Chloride 7 7 476 466 101 677 340 600 574 Student's-t* NormalIW-2 Copper 6 0 NA NA NA NA NA NA NA NA NAIW-2 Sulfate 7 7 1242 1191 451 2144 1000 2252 1136 Student's-t* NormalIW-2 TDS 7 7 2701 2653 605 3912 2280 4010 2648 Student's-t* NormalMW-6 Chloride 4 4 72 72 4 81 66 75 NA NA NAMW-6 Copper 3 0 NA NA NA NA NA NA NA NA NAMW-6 Sulfate 4 4 45 45 5 56 38 49 NA NA NAMW-6 TDS 4 4 405 394 98 600 260 468 NA NA NANP-1 Chloride 56 56 24 23 5 34 15 40 25 Student's-t NonParametricNP-1 Copper 29 2 0.039 0.021 0.086 0.211 0.003 0.480 NA NA NANP-1 Sulfate 56 56 136 135 17 170 86 163 140 Student's-t NormalNP-1 TDS 56 56 488 475 149 786 277 1484 523 Student's-t NonParametricNP-3 Chloride 67 67 182 126 121 424 26 566 252 Chebyshev NonParametricNP-3 Copper 35 3 0.021 0.017 0.010 0.040 0.001 0.050 NA NA NANP-3 Sulfate 69 69 518 403 295 1109 95 971 684 Chebyshev NonParametricNP-3 TDS 67 67 1208 1038 562 2331 360 2460 1531 Chebyshev NonParametricNotes:NA= not applicable due to entire data set being non-detected values* indicates less than 8 data points, which may not be adequate to compute meaningful statistics and estimates.
Table 8-14Descriptive Statistics of All Historic and Baseline Data Combined

Table 8-15, Page 1 of 1
Table 8-15 Wells Identified in the SAP for Sampling that Were Not Sampled as Part of the BDR Program
Notes: SF = Santa Fe Group aquifer system; Qal = Quaternary alluvium; NA = Information is not available
Well Name Inferred Aquifer
Total Depth (ft bgs)
Top of Screen (ft bgs)
Bottom of
Screen (ft bgs)
Year Drilled
Diameter (inches)
Water Quality Sample
Proposed
Water Level Measurement
Proposed
Reason Water Level Not Measured or Water Quality Sample Not
Collected
Delores Well NA NA NA NA 1932 NA X Inaccessible due to safety hazard – open mine shaft
Lower Percha Artesian NA NA NA NA NA NA X
No access port for water level measurement. Water quality sample
collected from existing pump Upper Percha
Well NA NA NA NA NA NA X No access port for water level measurement. Existing pump in well.
GWQ94-18 Qal 60.0 10.0 50.0 1994 4 X X Dry IW-3 Qal 45.0 NA 45.0 1982 4 X No permission from BLM
Saladone Well Qal NA NA NA NA NA X Well is destroyed due to flooding of Las Animas Creek
MW-1 SF 1000.0 350.0 1000.0 1975 8 X X
No access port for water level measurement. Windmill only provided one water quality sample, as it broke
during the sampling program
MW-2 SF 1500.0 133.0 1500.0 1975 8 X X
No access port for water level measurement. Water quality sample collected from windmill. Port installed in May 2011. One sample collected.
MW-4 SF 2000.0 123.0 1500.0 1975 8 X X
No access port for water level measurement. Existing submersible is
plumbed directly to stock tank preventing collection of water quality
sample MW-5 SF 1380.0 306.0 1000.0 1975 8 X X No permission from BLM
MW-6 SF 1112.0 310.0 1000.0 1975 8 X X No access port. Existing submersible
pump and plumbing prevent water quality sample collection

Table 8-16, Page 1 of 1
Table 8-16 Summary of Hydraulic Properties Estimated from Wells in
the Vicinity of the Tailing Impoundment
Well Pumping
Rate (gpm)
Specific Capacity (gpm/ft)
Aquifer Thickness
Tested (ft)
Transmissivity (ft2/day)
Horizontal Hydraulic
Conductivity (ft/day)
MW-4 60 0.24 1,377 80 0.06
GWQ-1 119 1.57 328 1,540 4.7
GWQ-7 21 2.33 423 440 1.0
GWQ-9 60 0.44 700 1,710 2.4
GWQ94-17 23 0.19 146 200 1.4
Notes: gpm = gallons per minute

Table 8-17, Page 1 of 2
Table 8-17 Summary of 2011 Water Level Measurements Used for Developing
the Groundwater Elevation Contour Map
Well Qtr Date Depth to
Water (ft)
Measuring Point
Elevation (ft amsl)
Water Level Elevation (ft amsl)
Animas Station 8 Well Q4 5/4/2011 12.67 4,614.8 4,602.1 FW-1 Q4 6/30/2011 -0.30 4,316.0 4,316.3 FW-2 (Dawson irrigation well; LRG-8755) Q4 6/29/2011 -2.30 4,302.0 4,304.3 FW-3 Q4 6/30/2011 0.00 4,357.0 4,357.0 FW-4 (livestock well) Q4 6/30/2011 0.00 4,327.0 4,327.0 FW-7 (residence well) Q4 6/30/2011 -34.70 4,293.0 4,327.7 FW-8 Q4 6/29/2011 -2.00 4,328.0 4,330.0 FW-9 (LRG 08752) Q4 6/29/2011 -4.10 4,301.0 4,305.1 FW-10 (LRG 08753) Q4 6/29/2011 -0.20 4,302.0 4,302.2 FW-13 Q4 6/29/2011 -0.20 4,324.0 4,324.2 FW-14 (house well) Q4 6/29/2011 -3.00 4,296.0 4,299.0 FW-15 Q4 6/29/2011 -0.60 4,330.0 4,330.6 FW-16 Q4 6/29/2011 -2.40 4,290.0 4,292.4 FW-17 (Kirby-south) Q4 6/29/2011 -1.30 4,261.0 4,262.3 FW-18 (Kirby-north) Q4 6/29/2011 -2.40 4,266.0 4,268.4 FW-19 Q4 6/30/2011 -1.60 4,342.0 4,343.6 FW-20 Q4 6/30/2011 -1.25 4,323.0 4,324.3 FW-21 Q4 6/30/2011 -11.60 4,331.0 4,342.6 GWQ-2 Q6 12/8/2011 35.18 5,227.4 5,192.3 GWQ-3 Q6 12/8/2011 21.10 5,252.6 5,231.5 GWQ-6(N) Q6 12/8/2011 34.45 5,395.4 5,360.9 GWQ-6(S) Q6 12/8/2011 31.00 5,382.8 5,351.8 GWQ-11 Q4 5/4/2011 20.02 5,196.4 5,176.4 GWQ-12 Q6 12/8/2011 79.83 5,237.3 5,157.5 GWQ94-13 Q4 5/4/2011 13.02 5,200.7 5,187.7 GWQ94-14 Q4 5/4/2011 6.42 5,193.1 5,186.7 GWQ94-15 Q4 5/4/2011 4.92 5,183.2 5,178.3 GWQ94-16 Q4 5/4/2011 21.26 5,198.2 5,176.9 GWQ94-21A Q6 12/8/2011 8.36 5,192.7 5,184.4 GWQ94-21B Q6 12/8/2011 8.05 5,192.2 5,184.2 GWQ96-22A Q6 12/8/2011 55.00 5,596.2 5,541.2 GWQ96-22B Q6 12/8/2011 52.41 5,596.0 5,543.5 GWQ96-23A Q6 12/8/2011 40.67 5,489.8 5,449.2 GWQ96-23B Q6 12/8/2011 40.76 5,489.7 5,448.9 GWQ11-24A Q6 12/8/2011 56.28 5,517.4 5,461.1 GWQ11-24B Q6 12/8/2011 60.38 5,517.3 5,456.9

Table 8-17, Page 2 of 2
Well Qtr Date Depth to
Water (ft)
Measuring Point
Elevation (ft amsl)
Water Level Elevation (ft amsl)
GWQ11-25A Q6 12/8/2011 65.67 5,533.6 5,467.9 GWQ11-25B Q6 12/8/2011 68.97 5,533.4 5,464.4 GWQ-5R Q6 12/8/2011 54.07 5,412.2 5,358.1 IW-2 Q4 5/4/2011 39.01 5,208.5 5,169.5 MW-4 Q6 12/8/2011 82.20 5,125.0 5,042.8 MW-5 Q6 12/8/2011 332.95 4,712.5 4,379.5 MW-6 Q6 12/8/2011 214.45 4,768.33 4,553.88 MW-10 Q6 12/8/2011 73.31 4,454.3 4,381.7 MW-11 Q6 12/8/2011 14.17 4,454.5 4,442.0 MW-9 Q6 12/8/2011 75.10 4,455.2 4,380.5 NP-1 Q4 5/4/2011 30.80 5,188.9 5,158.1 NP-2 Q4 5/4/2011 32.92 5,192.7 5,159.8 NP-3 Q4 5/4/2011 12.02 5,200.1 5,188.1 NP-4 Q4 5/4/2011 35.22 5,225.9 5,190.7 NP-5 Q4 5/4/2011 22.63 5,199.2 5,176.6 Pague (LA-128) Q4 5/4/2011 11.69 5,558.1 5,546.5 PW-1 Q6 12/8/2011 328.25 4,708.1 4,379.9 PW-2 Q6 12/8/2011 306.80 4,685.7 4,378.9 PW-3 Q6 12/8/2011 350.60 4,731.5 4,380.9 PW-4 Q6 12/8/2011 289.38 4,669.0 4,379.6 Irwin Well Q6 12/8/2011 24.26 5,180.0 5,155.7 McCravey-Grayback Q6 12/8/2011 16.40 5,201.5 5,185.1 Ladder Airstrip Well (Ladder Ranch) Q6 12/8/2011 285.79 4,997.0 4,711.2 Upper Myers (Ladder Ranch) Q6 12/8/2011 260.72 5,685.0 5,424.3 John Cross (Ladder Ranch) Q6 12/8/2011 106.00 5,499.0 5,393.0 Evans (Ladder Ranch) Q6 12/8/2011 171.28 5,192.0 5,020.7 Pit Lake Q6 12/8/2011 2.18 5,440.0 5,442.2

Table 8-18, Page 1 of 1
Table 8-18 Measured Water Levels in Copper Flat Mine Pit
Date Time
Staff Gauge Reading
(ft)
Pit Lake Elevation (ft amsl)
6/13/2011 16:46 3.80 5,443.80 6/17/2011 14:29 3.72 5,443.72 6/30/2011 13:42 3.46 5,443.46 8/2/2011 3.08 5,443.08 8/28/2011 8:45 2.90 5,442.90 9/8/2011 14:31 2.74 5,442.74 10/20/2011 8:49 2.36 5,442.36

Table 8-19, Page 1 of 1
Table 8-19 Identified Dissolved Constituents of Concern for the Pit Lake
Constituent of Concern Range in Observed Concentration (mg/L)
Aluminum 0.13 to 5.5
Cadmium 0.056 to 0.064
Cobalt 0.34 to 0.39
Copper 0.11 to 11.0
Manganese 39 to 45
Selenium 0.019 to 0.030
Zinc 5.0 to 6.8
Alkalinity < 20 to 41
Chloride 380 to 420
Fluoride 15 to 18
Sulfate 5,200 to 6,200
Total Dissolved Solids (TDS) 7,770 to 8,700
Notes: mg/L - milligrams per liter

Table 8-20, Page 1 of 1
Table 8-20 Summary of Hydraulic Conductivity (Permeability) Estimates From
Wells In the Vicinity of the Pit and Waste Rock Piles
Borehole and Zone Depth Interval (ft)
Geologic Unit
Apparent Permeability (cm/sec) (ft/day)
GWQ-5R, Zone 1 64-100 Andesite ~0 ~0
GWQ11-24, Zone 1 100-147 Monzonite 7 x 10⁻⁶ 0.02
GWQ11-24, Zone 2 150-197 Monzonite 3.0 x 10⁻⁵ 0.085
GWQ11-24, Zone 3 204-251 Monzonite 4.9 x 10⁻⁵ 0.14
GWQ11-25, Zone 1 100-148 Monzonite ~0 ~0
GWQ11-25, Zone 2 150-198 Monzonite 2.9 x 10⁻⁵ 0.081
GWQ11-25, Zone 3 207-251 Monzonite 2.6 x 10⁻⁵ 0.074
Notes: cm/sec = centimeters per second
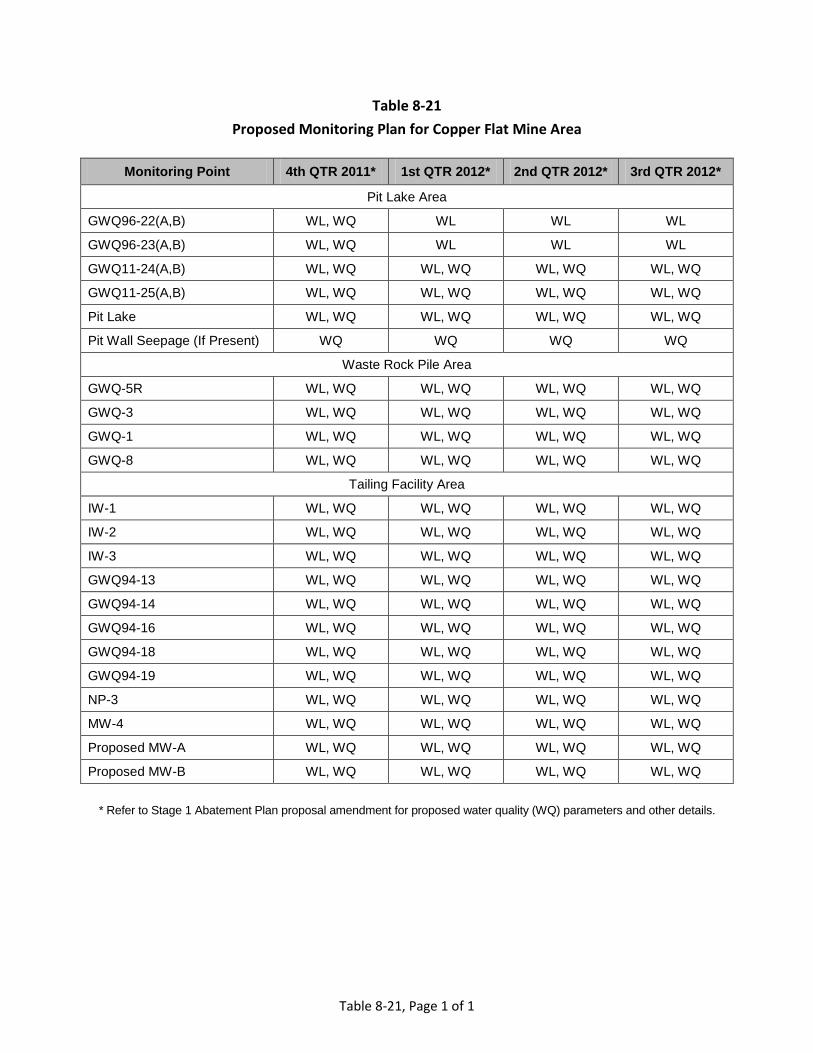
Table 8-21, Page 1 of 1
Table 8-21 Proposed Monitoring Plan for Copper Flat Mine Area
Monitoring Point 4th QTR 2011* 1st QTR 2012* 2nd QTR 2012* 3rd QTR 2012*
Pit Lake Area
GWQ96-22(A,B) WL, WQ WL WL WL
GWQ96-23(A,B) WL, WQ WL WL WL
GWQ11-24(A,B) WL, WQ WL, WQ WL, WQ WL, WQ
GWQ11-25(A,B) WL, WQ WL, WQ WL, WQ WL, WQ
Pit Lake WL, WQ WL, WQ WL, WQ WL, WQ
Pit Wall Seepage (If Present) WQ WQ WQ WQ
Waste Rock Pile Area
GWQ-5R WL, WQ WL, WQ WL, WQ WL, WQ
GWQ-3 WL, WQ WL, WQ WL, WQ WL, WQ
GWQ-1 WL, WQ WL, WQ WL, WQ WL, WQ
GWQ-8 WL, WQ WL, WQ WL, WQ WL, WQ
Tailing Facility Area
IW-1 WL, WQ WL, WQ WL, WQ WL, WQ
IW-2 WL, WQ WL, WQ WL, WQ WL, WQ
IW-3 WL, WQ WL, WQ WL, WQ WL, WQ
GWQ94-13 WL, WQ WL, WQ WL, WQ WL, WQ
GWQ94-14 WL, WQ WL, WQ WL, WQ WL, WQ
GWQ94-16 WL, WQ WL, WQ WL, WQ WL, WQ
GWQ94-18 WL, WQ WL, WQ WL, WQ WL, WQ
GWQ94-19 WL, WQ WL, WQ WL, WQ WL, WQ
NP-3 WL, WQ WL, WQ WL, WQ WL, WQ
MW-4 WL, WQ WL, WQ WL, WQ WL, WQ
Proposed MW-A WL, WQ WL, WQ WL, WQ WL, WQ
Proposed MW-B WL, WQ WL, WQ WL, WQ WL, WQ
* Refer to Stage 1 Abatement Plan proposal amendment for proposed water quality (WQ) parameters and other details.

Figures
Appendix 8-A Surface Water and Seepage Measurement Location Field Data

Appendix 8-B Seepage Study Report

Appendix 8-C Surface Water Analytical Results

Appendix 8-D Surface Sediment Analytical Results

Appendix 8-E Pit Lake Analytical Results

Appendix 8-F Pit Lake Sediment Analytical Results

Appendix 8-G Water Level Data

Appendix 8-H List of Inventoried Wells

New Mexico Copper Corporation Copper Flat Baseline Data Characterization Report
Copper Flat Mine 9-1 Section 9: Prior Mining Operations June 2012
9 Prior Mining Operations The following history of the Copper Flat Mine and the overview of previous investigations and sampling programs were summarized from BLM (1999), Raugust (2003), and SRK (2010). The results of previous sampling programs are discussed in the applicable sections of this BDR, as relevant.
9.1 Mining History Mining activities in the Hillsboro Mining District, including gold mining from both placer and vein deposits, began in 1877. From 1877 to 1893, numerous shafts and adits were developed along veins that radiate to the southwest and northeast from Copper Flat. Placer workings were developed along most of the major creeks that drain to the east and southwest from Black and Animas Peaks. Between 1911 and 1931, underground deposits were further developed; approximately 65 percent of the $7 million of ore produced from the district before 1931 came from underground veins (BLM, 1999). Placer mining increased after 1932 until World War II; small-scale placer mining continues in the area today (Hedlund, 1985; McLemore, 2003 as cited in Raugust, 2003).
Copper exploration began in the area in the 1950s and continued through the early 1970s. Quintana Minerals Corporation (Quintana) leased the property in 1974 and defined reserves sufficient for mine development through an extensive drilling and sampling program. The Copper Flat Partnership, Ltd., with Quintana acting as mine operator, developed and operated an open pit copper mine at the Copper Flat location in 1982 that included a 15,000 ton-per-day flotation mill and a tailings impoundment. Poor economic conditions led to the termination of mining after only 3 months of operation, although the mine remained on a maintenance status until 1986, at which point the facilities were dismantled and the Mine Permit Area was partially reclaimed (BLM, 1999). The mine produced 7.4 million pounds of copper, approximately 2,300 ounces of gold, and nearly 56,000 ounces of silver during its 3-month operational life (Hedlund, 1985). During the 1990s, several companies submitted plans to reopen the Copper Flat operation; however, none of the plans were realized. No mining activities have occurred at Copper Flat since 1982. More detail about copper exploration activities can be found in Section 11.3.
9.2 Surface Features of the Copper Flat Mine Activity at the Copper Flat Mine in 1982 disturbed 361 acres of BLM-managed public lands and 549 acres of private lands (Figure 9-1) (SRK, 2011). Surface features of the Copper Flat Mine include the following:
A pit lake that covers approximately 5.2 acres, contains about 60 acre-ft of water, and is roughly 30 ft deep.
Overburden rock storage piles (disposal areas) to the north, west, south, and east of the pit. Former mine and mill areas including an unpaved but maintained road from NM Highway 152 to the mill
area and a primitive road to the pit area, a 115-kilovolt power line, and a 20-inch welded steel water line.
A previously state approved and permitted diversion channel re-routing Greyback Arroyo around the mine site.
A tailing impoundment area, which is dammed by a 6,600-ft-long dam with a maximum crest height of 60 ft, and which includes at least 1.2 million tons of tailing over a 60-acre area (SRK, 1995).

New Mexico Copper Corporation Copper Flat Baseline Data Characterization Report
Copper Flat Mine 9-2 Section 9: Prior Mining Operations June 2012
9.3 Historical Investigations A number of investigations and sampling programs have been undertaken at Copper Flat in the past 30 years; several of these provide valuable sources of baseline data as these were related to various permitting processes including EAs, a Draft EIS (DEIS) in 1996, and a Preliminary Final EIS in 1999. For example, in the 8-year period before the 1982 operations began, Quintana collected baseline data at the Mine Permit Area related to climate, soils, vegetation, wildlife, surface water, groundwater, and archeology (Glover, 1977). The geology, mining history, and mineral deposits associated with Copper Flat were described by Hedlund in 1985; the results of a later field investigation that included sampling, water supply information, and ore reserves were documented by Dunn (1992). Aquifer testing was performed as early as the late 1970s and early 1980s, as well as again related to Alta Gold’s PFEIS processes in the late 1990s. At least two environmental assessments and one environmental impact statement were prepared for the Mine Permit Area during the 1990s (Raugust, 2003). A number of reports were prepared for Alta Gold in the late 1990s related to the DEIS process; these reports included but are not limited to those summarized by SRK, Adrian Brown Consultants, and ENSR; an independent evaluation was also prepared by Daniel B. Stephens & Associates, Inc. in 1997 (Raugust, 2003). During 2009 and early 2010, a Copper Flat drilling program was undertaken by NMCC to verify the historical Alta Gold data and to expand and refine the existing resources at Copper Flat (SRK, 2010).
Many of these previous investigations have focused on vegetation, wildlife, soil, potential acid rock drainage, climate and air quality, surface water and groundwater at or near the Mine Permit Area. Between 1989 and 1998, the pit lake was sampled 65 times by various investigators (BLM, 1999). Samples were typically analyzed for pH, major cations and anions, and metals (Raugust, 2003). Attempts were made to measure the flow at local springs and seeps in the 1990s and surface water sampling of creeks began before the 1982 mining operations and continued sporadically until the late 1990s. Before 1996, only one well was available at the Mine Permit Area for groundwater sampling; two additional wells were drilled during 1996 and used for subsequent sampling in the late 1990s (Raugust, 2003). Groundwater samples have also been taken from wells downgradient of the tailing impoundment dam.
Characterization of waste rock from outcrop and storage piles was undertaken in 1994 and again in 1997 to assess existing geochemical characteristics and potential for future acid generation (Raugust, 2003).Test borings in the tailing impoundment area have also been undertaken to investigate the nature of near-surface material and its suitability as borrow material (Raugust, 2003).
9.4 Prior Mining Operations In 1982, approximately 3,000 tons of overburden, alluvium and waste rock were stripped and 1,200,000 tons of ore were mined. The ore body was mined by a 20-foot high multiple bench open pit method. Mining was initiated at the “5600” bench level and excavation had reached the “5400” bench level when operation stopped three months later (Gold Express, 1991).
Ore processing included rotary diesel-driven drills for blast holes, blasting was accomplished with primacord, ammonium nitrate and fuel oil emulsion suitable for use where wet holes were encountered. Ore and waste were hauled from the pit using en-dump, 85-ton capacity trucks. Broken rock in the pit was classified as “ore” or “waste” based on assay values of samples from the blast holes. Ore was hauled to the primary crusher and waste to the waste dump. Ore was processed on a gyratory crusher, then moved to the coarse ore stockpile. Coarse ore was drawn onto conveyor belts for transport to the semiautogenous mill (SAG mill) for reduction by crushing and attrition. Water along with various reagents were added to the SAG mill to begin conditioning of the pulp. The SAG mill discharged onto a double deck vibrating screen, cyclones and belt conveyors ground material to prepare it for flotation (Gold Express, 1991).
New Mexico Copper Corporation Copper Flat Baseline Data Characterization Report
Copper Flat Mine 9-3 Section 9: Prior Mining Operations June 2012
In the flotation process, reagents were added to pulp to collect the sulfide mineral particles and cause them to adhere to bubbles caused by induced air and frothing agents. The sulfide-laden bubbles would rise to the top of the cell and be skimmed off. Lime was added to the grinding circuit to raise the alkalinity for separation of the copper sulfides from the iron sulfides. The rougher concentrate reported to the cleaner circuit for additional grinding and flotation. The concentrate from the cleaner circuit contained the copper and molybdenum sulfide minerals and was fed to the moly plant for further flotation and grinding to separate the copper and molybdenum sulfides into copper and molybdenum concentrates. Copper concentrate was dewatered by thickener and filter plant and stored for shipment to a smelter. The moly concentrate was dewatered and dried by heat before being packed into containers for shipment to the purchaser (Gold Express, 1991).
The waste fraction of the flotation process (tails) was partially dewatered in the tailings thickener and transported by pipeline to the tailing storage area for impoundment behind the tailing dam (Gold Express, 1991).
Reagents were delivered from commercial sources by truck at the plant site where facilities were in place for off-loading, storing, mixing, and handling. Lime was received in pebble form by truck (Gold Express, 1991).
9.5 References Bureau of Land Management (BLM), 1999, Preliminary final environmental impact statement, Copper Flat
project: Las Cruces, N. Mex., U.S. Department of the Interior, 491 p. Prepared by ENSR, Fort Collins, Colo.
Dunn, P.G., 1992, Development geology of the Copper Flat porphyry copper deposit, Case study in SME Mining Engineering Handbook: Littleton, Colo., Society for Mining, Metallurgy, and Exploration, Inc.
Hedlund, 1985, Economic geology of some selected mines in the Hillsboro and San Lorenzo quadrangles, Grant and Sierra Counties, New Mexico: U.S. Geological Survey Open File Report 85-0456.
Glover, F.A., 1977, Environmental assessment report, Copper Flat mine development, Copper Flat, New Mexico.
Gold Express Corporation (Gold Express), 1991, Plan of operations, submitted to Bureau of Land Management, Caballo Resource Area. January.
McLemore, V.T., 2003, Personal Communication: Socorro, N. Mex., New Mexico Bureau of Geology and Mineral Resources.
Raugust, J.S., 2003, The natural defenses of Copper Flat Sierra County, New Mexico: New Mexico Bureau of Geology and Mineral Resources Open-File Report 475, Socorro, N. Mex., New Mexico Institute of Mining and Technology.
Steffen, Robertson and Kirsten, Inc. (SRK), 1995, Copper Flat Mine, hydrological studies: Reno, Nev.
SRK Consulting, 2010, NI-43-101 Preliminary Assessment, THEMAC Resources Group Limited, Copper Flat Project, Sierra County, New Mexico: Lakewood, Colo. Prepared by SRK Consulting for THEMAC Resource Group Limited, June 30, 2010.
––––––. 2011, Copper Flat mine plan of operations: Reno Nev. Prepared by SRK Consulting for THEMAC Resource Group Limited, June 2011.

Figure
New Mexico Copper Corporation Copper Flat Baseline Data Characterization Report
Copper Flat Mine 10-1 Section 10: Cultural Resources Survey Results June 2012
10 Cultural Resources – Summary A full Cultural Resources report will be submitted to the New Mexico State Historic Preservation Officer (SHPO).
10.1 Interpretive Summary A brief history of historic mining within the Baseline Study Area and the potential Las Animas historic mining district is presented because an understanding of the historic context and period(s) of significance is necessary for interpreting and assessing potential districts and the individual properties they contain (Hardesty, 1990). The Las Animas (Hillsboro) mining district was discovered in 1877 within a vein between Copper Flat and Hillsboro and within placer deposits along Snake and Wicks gulches, south of the Baseline Study Area. These placer deposits were rich enough that a miner named George Wells reportedly collected $90,000 worth of gold in 1877 and 1878, leading to a gold rush as cabins and tents sprang up across the Animas Hills. Hard rock lode mining began in the late 1870s at various locations within Copper Flat and the surrounding Animas Hills, and ore was processed at a 10-stamp mill in Hillsboro beginning in 1878. Mills were constructed at Bobtail, Richmond, Bonanza, Snake, and other mines, and a small tent town named Gold Dust was founded at the south edge of the Baseline Study Area in 1881. Numerous mines reaching depths of 500 ft accessed a system of veins radiating out from Copper Flat across the Animas Hills, and placer extraction focused on the alluvial plain east of the Animas Hills along Greyback, Hunkidori, and Greenhorn gulches, and to the south along Wicks and Snake gulches. Important named mines within the Mine Permit Area include Chance Mine, Little Jewess Mine, Sweetwater Claim, the Petaluma Group, and Sternberg Mine. Although the Sternberg Mine (in the center of Copper Flat) was entirely destroyed by later mining activity, remains of other named mines were documented during this investigation.
Placer deposits consisting of detrital material eroded from Copper Flat and the Animas Hills are found on the alluvial plain east of the Animas Hills, which is dissected by Greyback, Greenhorn, and Hunkidori gulches. These placer deposits produced gold valued at more than $2,000,000 from 1871 to 1931 (Christensen, 2007), and the extant remains of exploration and extraction of material from these placer deposits make up most of the historic sites in the Baseline Study Area. Along Greyback Gulch, a small mining settlement gained a degree of permanence and was referred to as Placeres (Bussey and Naylor, 1975). The area of Slapjack and Jones Hills (known as the Luxemburg Placers) was developed by the Consolidated Gold Fields of New Mexico, Inc. during this period, while the Placer Syndicate Mining Company developed the Gold Dust Placers in the southern portion of the Baseline Study Area and also constructed a large reservoir and placer worked along Dutch and Greyback gulches, which supposedly had a capacity of more than 1000 cubic yards a day. Not surprisingly, the area along these gulches and on Jones and Slapjack Hills is extremely dense in historic mining features, camps, and prospects and mines.
As is often the case, the Las Animas mining district experienced numerous boom and bust cycles and changes in mining strategy over the years. However, new periods of lode mining production occurred from 1918 through 1921 and 1931 through 1933, with a total of 6,506 tons of ore (including 836 tons of gold) extracted from the district between 1911 and 1931. During the Great Depression, out-of-work migrants once again flocked to the district, although now the focus was on small-scale placer exploration rather than lode mining. Larger operators such as the J.I. Hallet Construction Company installed placer processing facilities beginning in 1936, although these efforts ended in 1942 (Christensen, 2007). Small-scale, sporadic efforts continued until 1975, when El Oro Mining Limited installed a placer processing plant along Greyback Gulch and Quintana Minerals Corporation initiated plans to mine the Copper Flat porphyry copper deposit. Quintana began production at Copper Flat Mine in 1982 but closed after three months due to declining copper prices, at which time the processing plant was dismantled.

New Mexico Copper Corporation Copper Flat Baseline Data Characterization Report
Copper Flat Mine 10-2 Section 10: Cultural Resources Survey Results June 2012
As this discussion demonstrates, the Las Animas mining district cycled through periods of exploration and prospecting, intensive extraction by companies focused on subsurface veins, periods of individual prospecting and small-scale efforts, expansion of placer processing facilities, and eventually modern industrialized mining. These stages were connected to broader economic trends, such as changes in mineral prices and the development of new technologies. The end result is a potential historic mining district that contains a wide variety of historic property types (ranging from individual prospect pits and rock houses to large mine shafts and engineering features) that reflect these historic developments and convey a variety of time periods and aspects of the mining community. Determining how well the physical remains of a mining district convey a sense of time, place, and historical patterns and assessing its ability to answer questions about mining technology and communities requires the development of historic research themes that potentially can be addressed (Hardesty, 1990). At the contextual scale of the district, research themes include the timing of boom and bust cycles, settlement and abandonment, the introduction of new technologies, the relationship between the district and broader economic and technological trends, the spatial organization of mining activity, the social and economic status of miners, ethnicity and gender, and the development of frontier or folk architectural styles (Noble and Spude, 1992)—many of which can be addressed by specific resources documented during this investigation.
The lack of prehistoric resources is consistent with previous investigations at Copper Flat (Bussey and Naylor, 1975; Sechrist and Laumbach, 1995) but is nevertheless somewhat surprising, given the presence of large Mimbres sites along Animas Creek and other nearby drainages between the Black Range and the Rio Grande (Hegmon, 2002). The prehistoric sites that are present appear to be associated with low-intensity use of the area by mobile Archaic foragers. Three sites within the Baseline Study Area can be securely dated to the Late Archaic period (1500 B.C. to A.D. 300) based on diagnostic San Pedro projectile points, and most of the remaining sites are most likely also Archaic in age, based on the lack of ceramics and characteristics of the lithic assemblages. Sites are small in size, limited in flaked-stone tool diversity, and generally lack features—characteristics that are consistent with short-term or single-use residential camps. The only evidence of a later Mogollon presence is found at LA 110763, which contains rock art panels exhibiting the distinctive Mogollon style. It does not appear, however, that this portion of the Animas Hills was used even on a logistical basis by sedentary Mogollon groups.
10.2 Eligibility and Management Summary The integrity, significance, and potential eligibility of mining properties are difficult to assess because they were often built for temporary use and then abandoned, neglected, or disturbed by subsequent mining activity over the decades (Noble and Spude, 1992). During this investigation, each site was assessed for its potential eligibility for listing in the National Register of Historic Places (NRHP) on individual merits as well as its potential to contribute to the as-yet-to-be-defined Las Animas historic mining district. The potential to contribute to the district was only assessed for sites unequivocally associated with the district’s likely period of significance (1877 to 1940). Some basic guidelines were implemented during these assessments. When considering the individual eligibility of each site, the presence of structural remains and/or large artifact scatters were important factors, as these characteristics likely indicate the location of mining camps. Such camps have the potential to provide information important in local and regional history, particularly if intact subsurface deposits are present. Named mines were also considered eligible under Criterion D, because additional archival information may be available for these sites. Sites clearly associated with settlement and development of the mining district were also considered eligible under Criterion A for their association with important historic events. However, sites lacking residential features or artifact scatters but containing mining features such as prospect pits or unnamed mine shafts were not considered individually eligible for listing in the NRHP. Finally, the condition of each site also played an important role in these assessments, as much of the Baseline Study Area is badly disturbed by modern mining and development. Sites lacking in integrity to the degree that they do not exhibit information potential or no longer convey the historic period with which they are associated were recommended as not eligible.

New Mexico Copper Corporation Copper Flat Baseline Data Characterization Report
Copper Flat Mine 10-3 Section 10: Cultural Resources Survey Results June 2012
When assessing the potential contribution of each site to the Las Animas historic mining district, the type of features present and the ability of the site to convey the feeling of the period of significance were more important than the specific information potential of the site. As a result, sites containing mining engineering features such as mine shafts, prospect pits, and waste rock piles or landscape features such as historic roads or trails were considered contributing elements of the historic district, even if residential features or artifact scatters were absent and the sites were lacking in individual distinction and did not merit individual listing in the NRHP. However, such sites were not considered contributing elements if they lacked integrity or contained only poor examples of mining feature types that are ubiquitous in the Baseline Study Area.
Fifty-three archaeological sites were discovered or re-located and fully documented during this investigation. Sites that could not be re-located, have been entirely destroyed since the time they were recorded, are mis-plotted and actually occur outside the Mine Permit Area, or should no longer be considered archaeological sites are excluded from the following eligibility discussion. Twenty-nine previously recorded sites were updated. These sites were identified during five cultural resource surveys spanning 35 years, and the recording standards and guidelines for making eligibility recommendations are understandably variable across these resources. For example, Naylor and Bussey (1975) made only informal recommendations and the SHPO does not seem to have made formal determinations for this or the subsequent Mariah Associates, Inc., survey (Evaskovich, 1991). Sites recorded during the recent Parametrix survey of the pipeline corridor (Mattson and Okun, 2011) have formal recommendations, but no SHPO or BLM determinations to date.
Of the 29 previously documented sites, 13 were previously determined eligible to the NRHP by the SHPO or were recommended as potentially eligible. Twelve of these retain sufficient integrity and are currently recommended as eligible (LA 13121, LA 13130, LA 13131, LA 82276, LA 82278, LA 82279, LA 82280, LA 82281, LA 82282, LA 110753, LA 110759, and LA 110763). LA 82277 was originally recommended as eligible but has been badly disturbed by recent mining activity, and its remaining elements no longer retain integrity; this site is now recommended as not eligible to the NRHP. Eleven sites had a previous eligibility status of undetermined. Data collected during the current investigation allowed for more definitive recommendations to be made for six of these sites: four (LA 110755, LA 110756, LA 110757, and LA 110766) are now recommended as eligible, while two (LA 110752 and LA 110764) are recommended as not eligible to the NRHP. The individual eligibility of five of the sites (LA 110754, LA 110758, LA 110760, LA 171042, and LA 171043) should remain undetermined until archaeological testing or the collection of additional data allows for a determination to be made. Five sites were previously recommended or determined to be not eligible to the NRHP under any criteria. Parametrix concurs with the previous determination of not eligible for four of these sites (LA 82334, LA 110761, LA 110765, and LA 171040). However, the status of LA 13135 should be changed to eligible. This site consists of a cemetery, and although graves and cemeteries are not usually considered eligible for inclusion in the NRHP, this site meets the NRHP special requirements under Criterion Consideration D: Cemeteries, because it has the potential to provide information on nearby sites and the Las Animas historic mining district that is not available from other sources.
Of the 23 newly documented archaeological sites in the Mine Permit Area, eight (LA 171356, LA 171359, LA 171360, LA 171364, LA 171374, LA 171372, LA 171374, and LA 171376) are recommended as individually eligible to the NRHP, 13 (LA 171353, LA 171354, LA 171355, LA 171357, LA 171358, LA 171361, LA 171363, LA 171365, LA 171366, LA 171367, LA 171368, LA 171369, LA 171375) are recommended as not eligible, and two (LA 171362 and LA 171373) are recommended as having undetermined eligibility.
Altogether, 24 sites are recommended as individually eligible to the NRHP. Most of these are recommended under Criterion A for their association with historic mining development and Criterion D for their potential to provide important historical information. Of these, 23 are also considered contributing elements of the potential Las Animas historic mining district. Seven sites are recommended as having undetermined eligibility and four of these may contribute to the historic district. Twenty-one sites are recommended as not eligible for individual

New Mexico Copper Corporation Copper Flat Baseline Data Characterization Report
Copper Flat Mine 10-4 Section 10: Cultural Resources Survey Results June 2012
inclusion in the NRHP under any criteria; these sites are either in extremely poor condition and do not exhibit integrity sufficient to convey their potential significance and/or lack information potential. Although these sites lack individual distinction and therefore do not merit individual inclusion in the NRHP, nine may be considered contributing elements of the potential Las Animas historic mining district. Individually, these sites are not likely to produce information beyond that obtained during inventory, but they help to visually convey the historic context of the district or, combined with other resources, may provide information on broader historic themes of the district such as the spatial organization of settlement of mining practices. Examples of such resources include mine shafts or landscape features such as trails.
The four historic buildings are all considered contributing elements of the potential Las Animas historic mining district, as they represent extant and highly visible examples of historic settlement during its period of significance. Two of these buildings (the Toney House and the Gold Dust Building) are also recommended eligible for individual listing, as these structures remain relatively intact, retain much of their original fenestration, and contain modifications that are historic in age or consistent with the historic style of the structures. In addition, the Toney House is a well-known local landmark associated with mining, and the Gold Dust Building is the only remaining structure associated with the location of Gold Dust. The two remaining buildings are not eligible for individual listing, as they are either in extremely poor condition and are not representative of a particular architectural style (Greyback Shack) or exhibit significant modifications including additions and changes to the front elevation (Hiltshire House).
Detailed management recommendations will be presented in a future cultural resources report. Avoidance is recommended for all archaeological sites that are recommended as eligible, undetermined, or that may be contributing elements of the potential Las Animas historic district. As avoidance will most likely not be feasible for all of these resources, it is recommended that they be included in a testing and data recovery plan in accordance with NMAC 4.10.16.11 and 4.10.16.13, as well as BLM guidelines.
10.3 References Bussey, Stanley D., and Billy J. Naylor. 1975. An Archaeological Reconnaissance Near Hillsboro, New Mexico.
Cultural Resources Management Division Report No. 24, New Mexico State University, Las Cruces.
Christensen, Odin D. 2007. Placer Gold Deposits of the Hillsboro (Las Animas) District, Sierra County, New Mexico. Hardrock Mineral Exploration Ltd. Mancos, Colorado.
Evaskovich, John. 1991. A Class III Cultural Resources Inventory for a Proposed Copper Mine Expansion. Mariah Associates, Inc., Albuquerque.
Hardesty, Donald L. 1990. Evaluating Site Significance in Historical Mining Districts. Historical Archaeology 24(4):42-51.
Hegmon, Michelle. 2002. Recent Issues in the Archaeology of the Mimbres Region of the American Southwest. Journal of Archaeological Research 10(4):307-355.
Mattson, Hannah, and Adam Okun. 2011. Cultural Resource Survey for Aquifer and Pipeline Testing, Copper Flat Mine, Sierra County, New Mexico. Parametrix Report PMX-2011-4. Albuquerque.
Noble, Bruce J., and Robert Spude. 1992. Guidelines for Identifying, Evaluating, and Registering Historic Mining Properties. National Register Bulletin. National Park Service, Department of the Interior.
Sechrist, Mark, and Karl. W. Laumbach. 1995. Archaeological Survey of Areas in the Copper Flat Project Area Near Hillsboro, Sierra County, New Mexico. Human Systems Report No. 9523.

New Mexico Copper Corporation Copper Flat Baseline Data Characterization Report
Copper Flat Mine 11-1 Section 11: Present and Historic Land Use June 2012
11 Present and Historic Land Use The information in this section is summarized primarily from SRK Consulting (2010) and BLM (1999), and informed by research conducted by Tom Van Bebber, Landman for NMCC. An online review of BLM Master Title Plats and land status on GeoCommunicator, the National Integrated Land System (http://www.geocommunicator.gov/GeoComm/index.shtm) was also performed to check the current status of rights of way (ROW) and other activities on BLM lands.
The Copper Flat Mine Permit Area and associated noncontiguous mill site claims are located between the communities of Caballo and Hillsboro, north of NM State Highway 152 and south of Animas Peak. It is covered by the Hillsboro 15-minute USGS quadrangle and occupies parts of Sections 30 and 31, Township 15 South, Range 5 West (T15S, R5W); Sections 30 and 31, T15S, R6W; Sections 23 through 27 and 34 through 36, T15S, R7W; Section 6, T16S, R6W; and Section 2, T16S, R7W (all with reference to the New Mexico Principal Meridian). Some of the noncontiguous mill site claims are outside the permit boundary and are associated with water rights and water wells approximately 8 miles east of the Mine Permit Area. The center of the mineralized zone is at approximately latitude 32.970300, longitude −107.533527. Land maps and other applicant information were presented in the SAP (INTERA, 2010).
11.1 Present Land Use
11.1.1 Land Planning and Regional Land Use
Historically, most of Sierra County has been used for mining, ranching, agriculture, and tourism. The public lands on which the unpatented mining claims and mill sites are located at the Copper Flat Mine Permit Area are managed by BLM’s Las Cruces Field Office. BLM manages public lands for multiple uses including recreation, range, forestry, mineral extraction and processing, watershed, fish and wildlife habitat, wilderness, and natural, scenic, scientific, and historical values. The current operational land use plan for this region is the 1986 White Sands Resource Management Plan, which covers all BLM-administered lands in Sierra and Otero counties; a new plan, the TriCounty Resource Management Plan, is in the process of being developed. The White Sands Resource Management Plan identifies the Copper Flat Mine as a mineral resource and recognizes that it could again become a producing mine, although no mining has occurred at the Mine Permit Area since 1982.
The town of Hillsboro, located approximately 5 miles southwest of the Mine Permit Area, has around 100 homes as well as several restaurants, other businesses, and government buildings. Truth or Consequences, approximately 20 miles northeast of the Mine Permit Area, has a population of about 8,000 and is the county seat. Few residences lie within 5 miles of the Copper Flat Mine: the Coalson and Clark ranches are located about 4 miles southeast of the Mine Permit Area and the Golddust Ranch is about 0.1 mile south of the mine and north of Highway 152 (formerly used as Quintana’s Site headquarters).
11.1.2 Current Land Use and Structures at Mine Permit Area
Livestock grazing is the primary ongoing land use in the vicinity of the Mine Permit Area. BLM grazing allotments 16040 and 10679 cover the Mine Permit Area, and livestock grazing is permitted in areas adjacent to the Mine Permit Area.
Except for a small viewing structure and a sample storage building, no buildings currently exist on the Mine Permit Area. A state and federally approved water diversion channel exists around the Mine Permit Area. A 370-acre tailing facility exists at the Mine Permit Area along with two decant towers. Three waste rock piles that were used during the 1982 operation of the mine are located near the perimeter of the pit.

New Mexico Copper Corporation Copper Flat Baseline Data Characterization Report
Copper Flat Mine 11-2 Section 11: Present and Historic Land Use June 2012
11.2 Historic Land Use Ore was first discovered in the Hillsboro district in April 1877, and the town of Hillsboro was established that same year. A number of mining claims were patented for the Mine Permit Area between 1892 and the 1940s; these now form most of the private land occupied by the Copper Flat mine.
In 1952, Newmont began exploration in the district for porphyry copper mineralization by drilling nearly 3,599 ft in six angle holes into the Copper Flat Quartz Monzonite (CFQM) (Kuellmer, 1955). Bear Creek drilled another 9,300+ ft in 1958−1959 in 20 widely spaced core holes, hoping to find an enrichment blanket of secondary copper (which was not found). Both the Newmont and Bear Creek drill and assay data is available (Dunn, 1984). Porphyry copper exploration was advanced by Inspiration again in the late 1960s. Inspiration completed 30 core drill holes by 1973, purchased the patented claims, performed metallurgical work, and completed two water wells on the property (Dunn, 1984).
In 1974, Inspiration leased the property to Quintana, which undertook a comprehensive mine development program with metallurgical work, underground drifting, bulk sampling, and drill hole composite testing (all performed by the Colorado School of Mines Research Center). The program included detailed geologic investigations into the relationship between the breccia pipe and the quartz monzonite host rocks, as well as the relationship between host rocks and mineralization. An EA was initially prepared for state and federal agencies in 1975, but low copper prices caused the project to be shelved from late 1976 until 1979. At that time, processing methods were reviewed and semi-autogenous grinding and copper-molybdenum flotation separation became the basis for subsequent design work. Mineable reserves were estimated at 60 million standard tons (Mst) with 0.42 percent copper and 0.012 percent molybdenum, plus some gold and silver (SRK, 2010).
With Quintana as the overall project manager, the Copper Flat mine began full production in March 1982 at a rated capacity of 15,000 st a day, a waste-to-ore ratio of 1.8:1, and a cut-off grade of 0.25 percent copper. The combination of low copper prices and high interest rates on the financing loan resulted in the mine closing down just 3 months later, at the end of June. During its short operational period, the mine produced 1.48 Mst of ore containing 7.4 million pounds (lbs) of copper, 2,301 ounces (oz) of gold, and 55,955 oz of silver (SRK, 2010). By the end of 1985, the surface facilities equipment had been sold and the site reclaimed as required by state and federal guidelines. However, all structural foundations, power lines, water wells, and in- ground infrastructure were left in place.
Hydro Resources of Albuquerque, New Mexico, acquired the Copper Flat property, including all royalties, from Inspiration in 1989. Rio Gold and Tenneco Minerals (Tenneco) drilled six large-diameter holes in 1990. Gold Express optioned the property in 1993, and then sold it to Alta Gold in 1994 without performing any exploration or development. A Preliminary Final EIS for the Alta Gold mining project was issued in March 1999, but Alta Gold went bankrupt (due to financial problems with other assets) before any permits were issued. Hydro Resources reacquired all the properties in 2001 along with all royalties. Hydro Resources maintains an archive of information related to the mine, including over 14,000 sample pulps and skeleton core from the Quintana drilling programs (SRK, 2010).
Approximately 60 percent of the proposed Mine Permit Area has been disturbed by previous operations. Remnants of the 1982 mining operation include an open pit and pit lake, a tailings impoundment area, waste rock disposal areas, a number of buried building foundations, and ancillary facilities including decant towers, roads, power transmission lines, and waterlines. These features are clearly delineated on BLM geographic information system maps and aerial photographs, and have been considered as part of the proposed plan of operations. Although some reclamation was done to the area in 1986, much of the Mine Permit Area remains disturbed.

New Mexico Copper Corporation Copper Flat Baseline Data Characterization Report
Copper Flat Mine 11-3 Section 11: Present and Historic Land Use June 2012
11.3 Soil Survey NMCC retained Stetson Engineers, Inc., to perform Order 2 and Order 1 soil surveys on the 2,190-acre mine permit area. The soils surveys are discussed in detail in Section 6.0. Topsoil Survey and Sampling Results.
11.4 References Bureau of Land Management (BLM), 1999, Preliminary final environmental impact statement, Copper Flat
project: Las Cruces, N. Mex., U.S. Department of the Interior, 491 p. Prepared by ENSR, Fort Collins, Colo.
Dunn, P., 1984, Geologic studies during the development of the Copper Flat porphyry deposit: Mining Engineering, February, 1984, p. 151.
INTERA Incorporated (INTERA), 2010, Sampling and Analysis Plan for Copper Flat Mine, Consultant’s report prepared by INTERA Incorporated for New Mexico Copper Corporation, September 2011, 309 p.
Kuellmer, F.J., 1955, Geology of a disseminated copper deposit near Hillsboro, Sierra County, New Mexico: New Mexico Bureau of Mines and Mineral Resources Circular 34, 46 p.
SRK Consulting, 2010, NI-43-101 Preliminary assessment, THEMAC Resources Group Limited, Copper Flat project, Sierra County, New Mexico: Lakewood, Colo. Prepared by SRK Consulting for THEMAC Resource Group Limited, June 30, 2010.