Copernicus User Uptake: from Data to Applications - MDPI
34
Citation: Apicella, L.;De Martino, M.; Quarati, A. Copernicus User Uptake: from Data to Applications. ISPRS Int. J. Geo-Inf. 2022, 11, 121. https://doi.org/ 10.3390/ijgi11020121 Academic Editor: Wolfgang Kainz Received: 15 November 2021 Accepted: 4 February 2022 Published: 9 February 2022 Publisher’s Note: MDPI stays neutral with regard to jurisdictional claims in published maps and institutional affil- iations. Copyright: © 2022 by the authors. Licensee MDPI, Basel, Switzerland. This article is an open access article distributed under the terms and conditions of the Creative Commons Attribution (CC BY) license (https:// creativecommons.org/licenses/by/ 4.0/). International Journal of Geo-Information Article Copernicus User Uptake: from Data to Applications Lorenza Apicella 1 , Monica De Martino 1, * and Alfonso Quarati 1 Institute for Applied Mathematics and Information Technologies-National Research Council, 16146 Genoa, Italy; [email protected] (L.A.); [email protected] (A.Q) * Correspondence: [email protected] Abstract: The European Programme Copernicus, one of the principal sources of free and open Earth Observation (EO) data, intends to sustain social and economic advancements to the European Union. To this end, User Uptake initiatives have been undertaken to increase Copernicus awareness, dissemination, and competencies, thus supporting the development of downstream applications. As part of the activities performed in the EO-UPTAKE project, we illustrate a set of application scenario workflows exemplifying usage practices of the data and tools available in the Copernicus ecosystem. Through the know-how gained in the design and development of the application scenarios and the bibliographic analysis on downstream applications, we discuss a series of practical recommendations to promote the use of Copernicus resources towards a wider audience of end-users boosting the development of new EO applications along with some advice to data providers to improve their publication practices. Keywords: Copernicus Programme; user uptake; sentinels data; workflow 1. Introduction In December 2019, the European Environment Agency (EEA) (https://www.eea.euro pa.eu/, accessed on 10 November 2021), in the “European Environment—State and Outlook 2020” (SOER) report [1], detailed the scale and urgency of Europe’s current environmental, climate and sustainability challenges. In responses to these challenges, the European Commission (EC) adopted the European Green Deal (EGD) road map document [2] for the EU’s climate action plan. The road map provides a framework for ambitious actions and measures towards European sustainability. Amongst these measures, the EU suggested the adoption of a new eighth Environment Action Programme [3] aiming to set out the direction for EU environmental and climate policy action up to 2030, and to support the implementation and the effective enforcement of environmental and climate policies and legislation to achieve the 2030 greenhouse gas emission reduction target and climate neutrality by 2050. Recognizing the role of data, EGD recommends to exploit the potential of digital technologies and data to support environmental policy and outlines the use of satellite observations as a strategic enabler to reach its objectives. Specifically, EEA is requested to support the Commission in improving the availability and relevance of data and knowledge, among others, by “integrating data on environ- mental, social and economic impacts, and exploiting fully other available data, such as those delivered by Copernicus” ([3], p.13). Accordingly, as one of EGD main goals is to achieve zero net emissions of greenhouse gases in 2050, as well as protecting, conserving, and enhancing the EU’s natural capital, the European Earth observation program Coperni- cus (https://www.copernicus.eu/, accessed on 10 November 2021) has a crucial role in implementing and monitoring these key objectives. Launched in 1998 by the EC and the European Space Agency (ESA), Copernicus provides free access to near real-time data, collected by dedicated EO satellites called Sen- tinels, in situ observations, and a set of core information services essential to help manage ISPRS Int. J. Geo-Inf. 2022, 11, 121. https://doi.org/10.3390/ijgi11020121 https://www.mdpi.com/journal/ijgi
-
Upload
khangminh22 -
Category
Documents
-
view
8 -
download
0
Transcript of Copernicus User Uptake: from Data to Applications - MDPI
Citation: Apicella, L.;De Martino, M.;
Quarati, A. Copernicus User Uptake:
from Data to Applications. ISPRS Int.
J. Geo-Inf. 2022, 11, 121.
https://doi.org/
10.3390/ijgi11020121
Academic Editor: Wolfgang Kainz
Received: 15 November 2021
Accepted: 4 February 2022
Published: 9 February 2022
Publisher’s Note: MDPI stays neutral
with regard to jurisdictional claims in
published maps and institutional affil-
iations.
Copyright: © 2022 by the authors.
Licensee MDPI, Basel, Switzerland.
This article is an open access article
distributed under the terms and
conditions of the Creative Commons
Attribution (CC BY) license (https://
creativecommons.org/licenses/by/
4.0/).
International Journal of
Geo-Information
Article
Copernicus User Uptake: from Data to ApplicationsLorenza Apicella 1 , Monica De Martino 1,* and Alfonso Quarati1
Institute for Applied Mathematics and Information Technologies-National Research Council, 16146 Genoa, Italy;[email protected] (L.A.); [email protected] (A.Q)* Correspondence: [email protected]
Abstract: The European Programme Copernicus, one of the principal sources of free and openEarth Observation (EO) data, intends to sustain social and economic advancements to the EuropeanUnion. To this end, User Uptake initiatives have been undertaken to increase Copernicus awareness,dissemination, and competencies, thus supporting the development of downstream applications. Aspart of the activities performed in the EO-UPTAKE project, we illustrate a set of application scenarioworkflows exemplifying usage practices of the data and tools available in the Copernicus ecosystem.Through the know-how gained in the design and development of the application scenarios and thebibliographic analysis on downstream applications, we discuss a series of practical recommendationsto promote the use of Copernicus resources towards a wider audience of end-users boosting thedevelopment of new EO applications along with some advice to data providers to improve theirpublication practices.
Keywords: Copernicus Programme; user uptake; sentinels data; workflow
1. Introduction
In December 2019, the European Environment Agency (EEA) (https://www.eea.europa.eu/, accessed on 10 November 2021), in the “European Environment—State and Outlook2020” (SOER) report [1], detailed the scale and urgency of Europe’s current environmental,climate and sustainability challenges. In responses to these challenges, the EuropeanCommission (EC) adopted the European Green Deal (EGD) road map document [2] for theEU’s climate action plan. The road map provides a framework for ambitious actions andmeasures towards European sustainability.
Amongst these measures, the EU suggested the adoption of a new eighth EnvironmentAction Programme [3] aiming to set out the direction for EU environmental and climatepolicy action up to 2030, and to support the implementation and the effective enforcementof environmental and climate policies and legislation to achieve the 2030 greenhouse gasemission reduction target and climate neutrality by 2050. Recognizing the role of data,EGD recommends to exploit the potential of digital technologies and data to supportenvironmental policy and outlines the use of satellite observations as a strategic enabler toreach its objectives.
Specifically, EEA is requested to support the Commission in improving the availabilityand relevance of data and knowledge, among others, by “integrating data on environ-mental, social and economic impacts, and exploiting fully other available data, such asthose delivered by Copernicus” ([3], p.13). Accordingly, as one of EGD main goals is toachieve zero net emissions of greenhouse gases in 2050, as well as protecting, conserving,and enhancing the EU’s natural capital, the European Earth observation program Coperni-cus (https://www.copernicus.eu/, accessed on 10 November 2021) has a crucial role inimplementing and monitoring these key objectives.
Launched in 1998 by the EC and the European Space Agency (ESA), Copernicusprovides free access to near real-time data, collected by dedicated EO satellites called Sen-tinels, in situ observations, and a set of core information services essential to help manage
ISPRS Int. J. Geo-Inf. 2022, 11, 121. https://doi.org/10.3390/ijgi11020121 https://www.mdpi.com/journal/ijgi
ISPRS Int. J. Geo-Inf. 2022, 11, 121 2 of 34
global security and the environment. Its continuity of observations with high-frequencysatellite images for atmospheric, oceanic, and terrestrial monitoring substantially benefitssocio-economic as well as smart and sustainable growth, promoting the development ofinnovative solutions in many sectors, prompting the realization of the EGD priorities forimplementing the EU climate plan.
While the provision of Copernicus data and the implementation of related serviceshave advanced enormously, it became urgent to support the users and uptake of Copernicusservices and data-sets [4,5]. In fact, as in the case of other public Open Data resources [6–10],Copernicus data and information remain under-exploited, and further efforts are neededto engage users [11].
Acknowledging this issue, the EC delivered, in 2016, a Space Strategy for Europe toencourage the uptake of space services and data [4] and to support research, innovation,and the development of skills for space and EO. Currently the need for uptake action isstill explicitly recommended in the EEA-Eionet Strategy 2021–2030 [12].
The EU-funded Italian regional project EO-UPTAKE (www.gisig.eu/projects/eouptake/, accessed on 10 November 2021), in line with the EC promoted initiatives supportingthe use of Copernicus data and services among a broader range of downstream sector’s usercommunities, aims to increase the diffusion of Information Technology (IT) and RemoteSensing (RS) knowledge and skills regarding the Copernicus ecosystem in the Ligurianproduction framework.
By bridging the worlds of research and the Small and Medium Enterprises (SMEs)and utilities involved in the environmental sector, EO-UPTAKE aims to disseminate thecapacity for innovation and technology transfer towards a productive system in whichcompanies and public bodies can benefit from Copernicus resources in the implementationof innovative and shared territorial applications.
Based on the ongoing EO-UPTAKE activities, the paper presents a double contribution.Through the discussion of four application scenarios, we exemplify how and with whatdata and tools users with primary IT and RS skills can benefit the Copernicus ecosystem todevelop applications of immediate practical use.
Furthermore, in the light of the experience gained in developing these scenarios andbased on a review of the literature on the downstream applications in different sectors, wesupply a set of recommendations to make users aware of the potentiality of the Copernicusresources and to encourage their use and integration with other Open Data sources as wellas advice to data providers to improve their publication practices.
2. Copernicus Background
In the Copernicus program data value chain, i.e., the process of creating, collecting,publishing, and adopting data, the downstream sector plays the essential role of transformingthe spatial data produced by satellite platforms into EO products and services directlyusable by the end-users [13]. The actors involved in this transformation process, also calledintermediate users, are generally experts in EO [14], such as “Value-Added Services (VAS)and geo-information companies, whose core business is to process satellite EO data andturn it into geo-information products” ([13], p. 17).
End-users may be “the citizens benefiting from a better air quality or reduced pollutionof groundwater” ([13], p. 48) as well as the “institutional actors (e.g., meteo agencies,emergency services, forestry offices, scientific laboratories. . . ) and private ones” ([15], p. 9).Those users’ main activity is usually not centered on EO and, not generally being expertsin EO, they rely on intermediate users for accessing geo-referenced information as relevantinputs for their business.
In some cases, however, end-users with IT skills, but not EO experts, could combine,through their in-house resources, the obtained geospatial products, with their “relevantsources of information for their business (e.g., the type of crops, the function of the in-frastructure, the profile of their customers, the relationships of their agents, etc.)” ([14],p. 14).
ISPRS Int. J. Geo-Inf. 2022, 11, 121 3 of 34
On the other hand, users “with at least some form of training in Earth observation/geo-information” ([5], p. 12) could use Copernicus products and services to implement simpleapplication scenarios for studying and analyzing a particular terrestrial phenomenon,without necessarily having to outsource the task to intermediate IT companies [15]. In thefollowing, we mainly address these two types of end-users to provide them with somerecommendations that we matured during the study and hands-on activities with toolsand products of the Copernicus ecosystem used to develop application scenarios in thecourse of EO-UPTAKE.
2.1. Sentinel Satellites and Copernicus Ecosystem
The Copernicus space component consists of two types of satellites: the EU-ownedSentinels constellation, which has been specifically designed to meet the needs of theCopernicus services and their users, and missions from other space agencies, called Con-tributing Missions, which exist independently and deliver complementary data. ESAand the European Organisation for the Exploitation of Meteorological Satellites (EUMET-SAT (https://www.eumetsat.int, accessed on 10 November 2021)) are in charge of thedevelopment of the program’s space component.
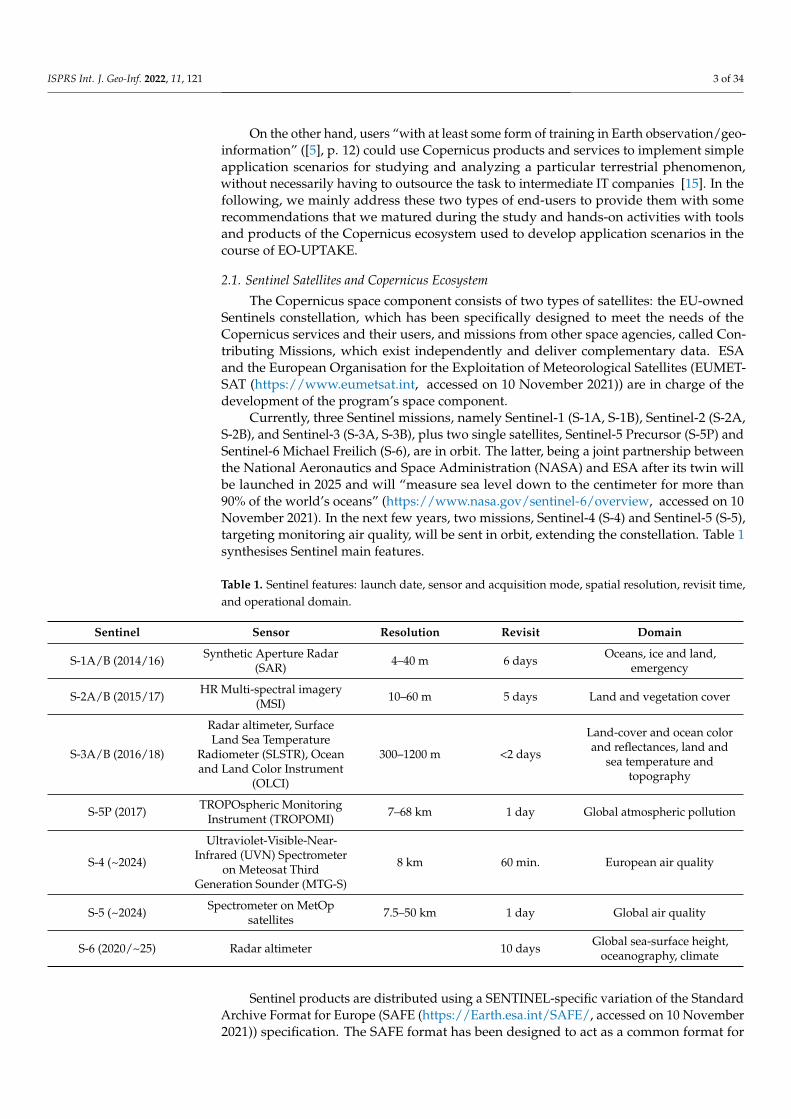
Currently, three Sentinel missions, namely Sentinel-1 (S-1A, S-1B), Sentinel-2 (S-2A,S-2B), and Sentinel-3 (S-3A, S-3B), plus two single satellites, Sentinel-5 Precursor (S-5P) andSentinel-6 Michael Freilich (S-6), are in orbit. The latter, being a joint partnership betweenthe National Aeronautics and Space Administration (NASA) and ESA after its twin willbe launched in 2025 and will “measure sea level down to the centimeter for more than90% of the world’s oceans” (https://www.nasa.gov/sentinel-6/overview, accessed on 10November 2021). In the next few years, two missions, Sentinel-4 (S-4) and Sentinel-5 (S-5),targeting monitoring air quality, will be sent in orbit, extending the constellation. Table 1synthesises Sentinel main features.
Table 1. Sentinel features: launch date, sensor and acquisition mode, spatial resolution, revisit time,and operational domain.
Sentinel Sensor Resolution Revisit Domain
S-1A/B (2014/16) Synthetic Aperture Radar(SAR) 4–40 m 6 days Oceans, ice and land,
emergency
S-2A/B (2015/17) HR Multi-spectral imagery(MSI) 10–60 m 5 days Land and vegetation cover
S-3A/B (2016/18)
Radar altimeter, SurfaceLand Sea Temperature
Radiometer (SLSTR), Oceanand Land Color Instrument
(OLCI)
300–1200 m <2 days
Land-cover and ocean colorand reflectances, land and
sea temperature andtopography
S-5P (2017) TROPOspheric MonitoringInstrument (TROPOMI) 7–68 km 1 day Global atmospheric pollution
S-4 (~2024)
Ultraviolet-Visible-Near-Infrared (UVN) Spectrometer
on Meteosat ThirdGeneration Sounder (MTG-S)
8 km 60 min. European air quality
S-5 (~2024) Spectrometer on MetOpsatellites 7.5–50 km 1 day Global air quality
S-6 (2020/~25) Radar altimeter 10 days Global sea-surface height,oceanography, climate
Sentinel products are distributed using a SENTINEL-specific variation of the StandardArchive Format for Europe (SAFE (https://Earth.esa.int/SAFE/, accessed on 10 November2021)) specification. The SAFE format has been designed to act as a common format for

ISPRS Int. J. Geo-Inf. 2022, 11, 121 4 of 34
archiving and conveying data within ESA EO archiving facilities. The SENTINEL-SAFEformat (https://sentinels.copernicus.eu/web/sentinel/user-guides/sentinel-1-sar/data-formats/safe-specification, accessed on 10 November 2021) wraps a folder containing imagedata in a flexible binary data format and product metadata in XML. This flexibility allowsthe format to be sufficiently scalable to represent all levels of SENTINEL products.
The directory folder contains a collection of information: a ’manifest.safe’ file thatholds the general product information in XML, subfolders for measurement datasetscontaining image data in various binary formats, a preview folder containing ’quicklooks’(in different formats for different missions), an annotation folder containing the productmetadata in XML as well as calibration data, and a support folder containing the XMLschemes describing the product XML or HTML preview. The folder’s wrapped informationvaries according to the Sentinel mission and the pre-processing levels, and it is detailed ina ’data format’ section of the Sentinel’s user guide (https://sentinels.copernicus.eu/web/sentinel/user-guides, accessed on 10 November 2021).
Copernicus provides Sentinel products obtained by raw data processing at variouslevels, allowing users to choose the processing level best fitting their purposes. Differentsatellite missions present different classifications; however, in general pre-processing levelsrange from 0 to 4, bringing different information along with each level. Level 0 productsare raw data at full instrument resolution, while at higher levels the data are convertedinto more readily usable metrics and formats. Copernicus products are supplied in thefollowing three processing levels:
• Level-0 data (L0), raw data. They are not not disseminated to all users.• Level-1 data (L1), products derived by L0 pre-processing based on radiometric and
geographic positioning corrections.• Level-2 data (L2), products derived from L1 pre-processing, characterized by a scene
classification. For S-2, an atmospheric correction is applied to the Top-Of-Atmosphereorthoimage and the main output is a Bottom-Of-Atmosphere corrected orthoimage(i.e., Level-2A). For S-3, the bands for sea surface temperature, land surface tempera-ture, and fire radiative power are computed.
Copernicus also provides six core services (https://www.copernicus.eu/en/copernicus-services, accessed on 10 November 2021) free of charge, which transform Sentinelproducts for six thematic areas (i.e., land, sea, atmosphere, climate change, emergencymanagement and security) in ready-to-use information. The Copernicus Land MonitoringService (CLMS) provides geographical information on land-cover and use for the develop-ment of applications in a wide range of areas, such as agricultural and food security, forestmanagement, water management, nature conservation, and restoration.
The Copernicus Emergency Management Service (CEMS) encompasses an early warn-ing component about risk assessments for floods and forest fires and a mapping componentthat provides map and geo-information resources for all types of natural and man-madedisasters. The Copernicus Atmosphere Monitoring Service (CAMS) is at the forefront ofthe monitoring efforts through its data on CO2, such as global and regional forecasts andanalyses of air concentrations, as well as monthly surface fluxes.
The Copernicus Marine Service (CMEMS) provides relevant information for the marinerenewable energy sector, where information about ocean currents, waves, sea level, salinity,and temperature support the safer implementation of energy platforms at sea.
The Copernicus Security Service (CSS) focuses on crisis prevention, preparedness,and response in three domains: border surveillance, maritime surveillance, and supportto EU External Action. It supports EU policies by providing information in response tosecurity challenges, and its use is restricted to authorized users. The Copernicus ClimateChange Service (C3S), provides authoritatively and quality-assured resources about thepast, present, and future climate.
These services have subsequently reached different degrees of maturity as they havebeen released: in 2012 for CLMS and CEMS, in 2015 for CAMS and CMEMS, in 2017 for CSS,and in 2018 for C3S. Although these services partly bridge the gap between Copernicus
ISPRS Int. J. Geo-Inf. 2022, 11, 121 5 of 34
data and end-users, “there is still, in most cases, a final step to be made by intermediateusers to tailor solutions to end-users’ needs” ([5], p. 12).
2.2. Copernicus User Uptake
The Copernicus program is expected to provide important strategic, social, and eco-nomic benefits to the EU. According to the latest EU report on the EO data market [14],the volume of data provided by Copernicus in 2019 was around 150 terabytes every day,with economic benefits estimated at € 16.2 and € 21.3 billion in the period 2018–2020, and aconstantly growing number of users (currently 780,000). Notwithstanding these promises,as for other public and research Open Data [6,8], Copernicus data have value only if theyare used across a wide range of applications in various thematic sectors to meet specificpublic or commercial needs, resulting in new opportunities for society and economy.
This fact is clearly expressed by the EC Communication on the Space Strategy for Eu-rope that stated that “The potential of space solutions has not yet been fully exploited, andnor have the wider possibilities offered by space data” [4]. The number of heterogeneousEO resources supplied and the breadth of different user communities potentially interestedrequire new skills to realize Copernicus’s full potentials [16].
Copernicus user uptake activities are essential to maximizing the adoption of Coper-nicus resources. To this end, the EU report about Copernicus User Uptake [16] fosters aneffective user engagement strategy for the Copernicus Programme, supporting an ecosys-tem of service providers, public or private, able to transform space data into accessible andusable information and promoting the use and uptake of Copernicus products, services,and good practices towards a wider users audience.
Accordingly, the Commission focused on three objectives: to increase awareness, tofacilitate access to Copernicus resources, and to support downstream actors [13]. To meetthese goals, the EC has promoted several initiatives, such as the Copernicus Relays and theCopernicus Academy Network [5,17]. Copernicus ambassadors ensure that information onthe benefits and potential applications of the program are unleashed at the local level withRelays. On the other hand, the Copernicus Academy connects universities and researchinstitutes with authorities and service providers, enhancing cooperation and research aswell as preparing teaching and training materials.
The ambition of such initiatives is to boost “the development of the professional skillsneeded by the potential users of space data, where a key added value is given to mergingskills and knowledge from different sectors, in particular, transversal skills such as IT, GISand data-handling skills” ([5], p. 81).
Following this vein, EO-UPTAKE is a two-year project, started on November 2019under the European Social Fund, Liguria Region 2014-2020, to support the EC strategyfor User Uptake, by promoting the development and the dissemination of competenciesrelated to Copernicus resources access and usage. EO-UPTAKE aims to strengthen theexisting ecosystem of skills and foster the use and integration of such resources supportinginnovative applications for end-users [18].
The project is centered on the training of a young environmental-sciences researcherfor increasing their “technical skills regarding processing of RS data”([16], p. 440) and thesubsequent transfer of their newly acquired competencies to potentially interested businessend-users. Guided by those objectives, the project focuses on designing and implementingseveral exemplary application scenarios for the Agriculture, Forestry, Urban monitoring,and Natural disasters management user segments (also known as “value chains” [14], p. 27).
3. Literature Review on Copernicus Downstream Applications
To properly frame EO-UPTAKE’s agenda, we analyzed the literature reporting therationales and findings of Copernicus downstream applications in some of the promisinguser segments listed in the EC Copernicus Market report: Agriculture, Forestry, Urbanmonitoring, Coastal And Marine Exploitation and Preservation, Renewable Energies, Air
ISPRS Int. J. Geo-Inf. 2022, 11, 121 6 of 34
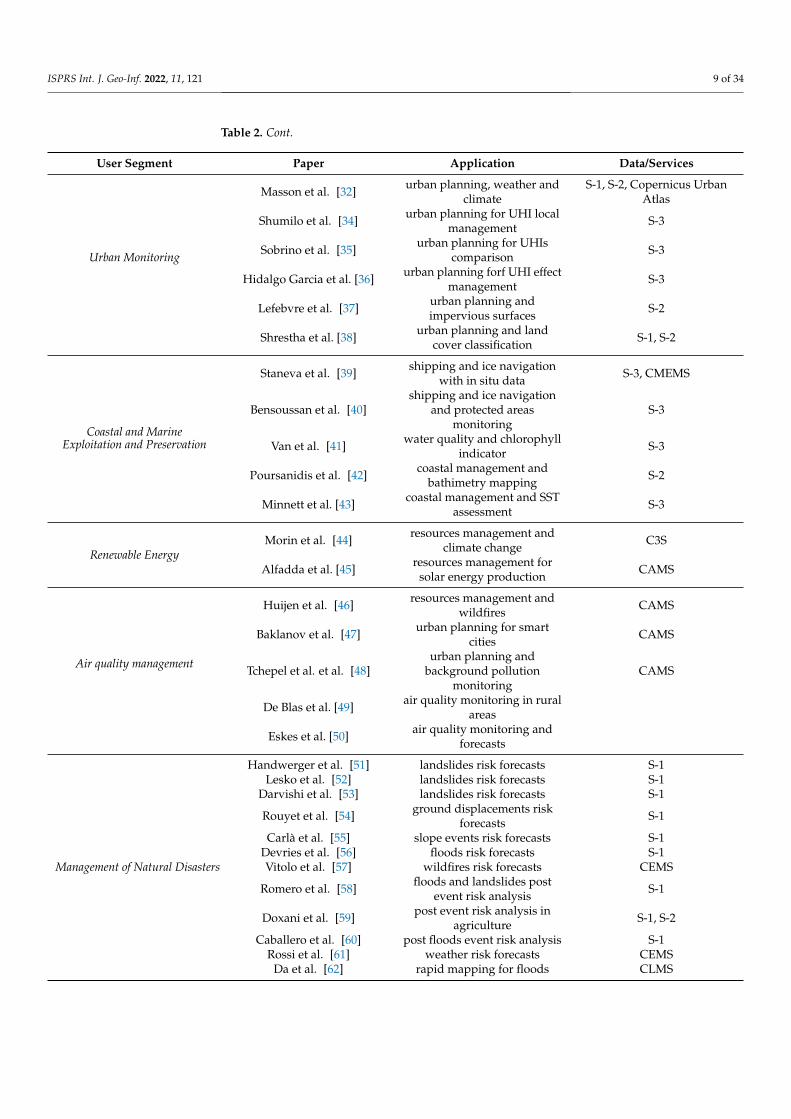
quality management, and Management of natural disasters [14]. Table 2 synthesizes thesecontributions.
Agriculture— In the digital farming field, the work of Meier et al. [19] highlights thepositive impacts of S-2 products for agricultural policies and smart farming applications,while the work of Lilienthal et al. [20] discussed the use of S-1 and S-2 products in theframework of a national project to involve farmers in digital farming, thus, to enhance andoptimize agricultural production in Germany.
Drost et al. [21] presented a study on water and drought management, proposingan architecture for processing heterogeneous in situ and RS data enabling the integrationof S-1 and S-2 with hydrological models for a water monitoring program involving theagricultural sector, water industry associations, and water suppliers.
Pulvirenti et al. [22] presented software designed for the systematic mapping of surfacesoil moisture using S-1 data, useful both for agriculture and Civil Protection tasks.
Wolanin et al. [23] and Vuolo et al. [24] presented two methods for crop monitoringand classification, exploiting, respectively, S-2 and Landsat (by NASA (https://www.nasa.gov, accessed on 10 November 2021)) products to train a neural network modelable to estimate a crop’s gross primary production and S-2 optical images to assess thevalue of multi-temporal information for crop-type classification with the Random ForestClassifier [25].
Borgogno-Mondino et al. [26] proposed a method based on S-2 band computation forthe detection of plastic-covered vineyards describing the different spectral responses of thevines compared to the uncovered ones.
Forestry—Li et al. in [27] discriminated treed and non-treed wetlands in boreal ecosys-tems using an S-1 product time-series. The authors explored the potential of within-yeartime series of C-band SAR observations from the data archive.
Tavares et al. [28] proposed methods for mapping land-cover and vegetation typeswith supervised classification algorithms on S-2 images and performing biomass assessmentaccording to S-1 data, while Ottosen et al. [29] proposed an unsupervised classificationmethod on S-2 bands combination to assess tree coverage and forest mapping.
Palas et al. [30] employed a set of 15 vegetation indices to monitor tree-logging ac-tivities with S-2 optical images in Białowieza Forest, which is one of the last and largestremaining parts of the immense primeval forests in Europe.
Fonseca et al. [31] assessed the connectivity of riparian forests located in two distinctEuropean bio-climatic regions when subject to a gradient of human disturbance, leveragingready-to-use layers of ’actual riparian zones’ and ’potential riparian zones’, providedby CLMS and also comparing them with a ’Manual Riparian Zone’ layer “produced bymanually digitizing riparian vegetation patches over a very high-resolution World Imagerylayer” ([31], p. 1).
Urban Monitoring—Since numerical modeling has become a valuable tool for analyzingdetailed urban meteorology and to design urban climate services, works, such as that ofMasson et al. [32], highlight the role of S-1, S-2 products, and the Copernicus Urban Atlas’resources (https://land.copernicus.eu/local/urban-atlas, accessed on 10 November 2021),in their survey discussing climate model requirements and the recent developments inurban monitoring.
In the context of progressive urbanization and industrialization, the phenomenonof Urban Heat Islands (UHIs) was investigated with multiple perspectives [33] and byexploiting Copernicus S-3 products: Shumilo et al. [34] assessed the UHI effect for asingle urban area considering green areas and population density distributions, whileSobrino et al. [35] proposed a new method to assess and compare UHI values of urbanagglomerations around the world. Finally, Hidalgo Garcia et al. [36] determineed nightlyfactors that enhanced the UHI effects in different seasons.
Of particular interest, among RS urban planning applications, is the change-detectiontechniques for impervious surface monitoring: Lefebvre et al. [37] presented a data fu-
ISPRS Int. J. Geo-Inf. 2022, 11, 121 7 of 34
sion method exploiting S-2 images to monitor urban areas that compute high resolutionimpervious layers, more updated than those provided by CLMS.
Shrestha et al. [38] employed S-1, S-2 products as input data for a land-cover supervisedclassification approach with the Random Forest classifier on Pakistani cities.
Coastal And Marine Exploitation And Preservation—Two applications addressing ship-ping and ice navigation were presented by Staneva et al. [39] and Bensoussan et al. [40].The former explores the synergy between the CMEMS Monitoring and Forecasting Centresmodel outputs and the newly available Satellite products (S-3). The authors outlined howthe joined satellite and model show the potential benefits of merging observational andCopernicus resources.
In [40], S-3 products were used for monitoring protected area SST (Superficial SeaTemperature) in the Mediterranean Region, by combining RS LST images and in situmonitoring systems. The authors posited that this combination “is a pillar to enhance ourunderstanding of climate change impacts in coastal areas”. S-3 Ocean and Land ColorInstrument (OLCI) images were used as well by Van et al. [41] in the evaluation of thestate of eutrophication of the North Sea, as they provide information on the color of theocean used to identify the concentration of chlorophyll.
Poursanidis et al. [42] discussed the exploitation of S-2 products for coastal habitatmapping and satellite-derived bathymetry estimation using coastal aerosol band andproviding maps of the dominant Mediterranean coastal marine habitats and the bathymetryin three survey sites in the East Mediterranean.
Minnett et al. [43] compared various sources of data for SST assessments and variationsin relation to climate change, highlighting the advantages of the S-3 products.
Renewable Energy—Morin et al. [44], in collaboration with the European Centrefor Medium-Range Weather Forecasts (ECMWF (https://www.ecmwf.int/, accessed on10 November 2021)), proposed an approach for resource management in a mountain-ous environment, for assessing “past and future operating conditions of ski resorts atthe pan-European scale in the context of climate change”, leveraging C3S resources.Alfadda et al. [45] proposed a irradiance forecast method using aerosol measurementsby CAMS regarding solar energy production.
Air quality management - Huijen et al. [46] presented an air pollution monitoring study,analyzing the effects on air quality after a huge wildfire by exploiting CAMS resources.In the urban context, Baklanov et al. [47] presented an application supported by CAMSresources to build urban services meeting the special needs of cities through a combinationof dense observation networks, high-resolution forecasts, multi-hazard early warningsystems, and climate services for reducing emissions, thus, enabling the building of resilient,thriving sustainable cities.
Tchepel et al. [48] proposed two approaches to characterize urban backgroundpollution levels for regional operational forecasts, exploiting CAMS freely available data onair pollution forecast from global and regional models and the “Chemical Transport Model”from the national forecast system of Portugal. Air quality monitoring was also performedin rural areas for specific climate-affecting compounds [49] and for the prediction andvalidation of forecasting for severe pollution events [50].
Management of Natural Disasters—Risk forecast applications target emergency situa-tions, e.g., for the monitoring of landslides, exploiting S-1 SAR products, and interferometricchange-detection techniques [51–53] or for investigating ground displacements due tochanges in the permafrost layer [54].
The work of Carlà et al. [55] used Satellite SAR Interferometric techniques to identifyprecursors to catastrophic slope failures. Devries et al. [56], in the hydrology field,addressed the monitoring of almost-real-time flood events by integrating S-1 and Landsatproducts.
Wildfire hazards from heat stress were assessed by Vitolo et al. [57], leveraging CEMSdata-sets for fire danger forecasts (produced by ECMWF, which has the role of compu-
ISPRS Int. J. Geo-Inf. 2022, 11, 121 8 of 34
tational forecast center of the CEMS), in order to launch a multi-hazard early warningsystem.
Romero et al. [58] proposed a method for monitoring post-event floods and landslidesalong coastlines, leveraging the integration with Copernicus S-1 SAR products, togetherwith ERS 1 and 2 satellite mission (https://Earth.esa.int/eogateway/missions/ers/description, accessed on 10 November 2021) data.
Applications for rapid mapping and post event risk analysis were presented inDoxani et al. [59] and Caballero et al. [60]. The former’s work realized flood mappingover agricultural areas, thus, improving the efficiency of the decision-making process onagricultural aid and reimbursement by reducing the number of in situ visits and minimiz-ing the costs and delays of controls. S-1 and S-2 products were used to compare the area ofinterest (AOI) before and after flooding events. The reference for result evaluation was thecorresponding information delivered by CEMS.
The latter specifically considers a 2019 flooding event in southern Spain, proposinga method for the creation of pre- and post-flood composite images obtained to identifychange detection and mask water pixels with S-2 products.
Floods are monitored as well in the post risk forecasts application presented byRossi et al. ([61], p. 145), where the authors proposed a set of automated services forweather forecasts, for providing “qualitative feedback for meteorological models, detectingthe occurrence of an emergency event and extracting informative content that can be usedto complement the situational awareness”, leveraging the availability of weather forecasts,event detection techniques (supported by CEMS) and selective information retrieval fromon-line social media.
A web application for the rapid mapping of floods was proposed by Da et al. [62],delineating flood-prone areas and reproducing the reference flood maps for the 64 sub-catchments of the Po River. This application leverages the CLM service EU-DEM v1.0, adigital surface model available as a core service resource.
Table 2. Summary of the literature according to the studied applications and Copernicus resourcesused.
User Segment Paper Application Data/Services
Agriculture
Meier et al. [19] digital and smart farming S-2
Lilienthal et al. [20] digital farming with farmersinvolvement S-1, S-2
Drost et al. [21] modeling architecture waterand drought management S-1, S-2
Pulvirenti et al. [22] operative water and droughtmanagement S-1
Wolanin et al. [23] crop monitoring for primaryproduction assessments S-2
Vuolo et al. [24] crop monitoring for primaryproduction S-2
Borgogno-Mondino et al. [26] crop monitoring for vineyards S-2
Forestry
Li et al. [27] resource mapping forbiodiversity monitoring S-1
Tavares et al. [28] resource mapping for biomassassessments S-1, S-2
Ottosen et al. [29] resource mapping for treecoverage S-2
Palas et al. [30] resource mapping withvegetation indices S-2
Fonseca et al. [31] resource mapping for antropicimpact monitoring CLMS
ISPRS Int. J. Geo-Inf. 2022, 11, 121 9 of 34
Table 2. Cont.
User Segment Paper Application Data/Services
Urban Monitoring
Masson et al. [32] urban planning, weather andclimate
S-1, S-2, Copernicus UrbanAtlas
Shumilo et al. [34] urban planning for UHI localmanagement S-3
Sobrino et al. [35] urban planning for UHIscomparison S-3
Hidalgo Garcia et al. [36] urban planning forf UHI effectmanagement S-3
Lefebvre et al. [37] urban planning andimpervious surfaces S-2
Shrestha et al. [38] urban planning and landcover classification S-1, S-2
Coastal and MarineExploitation and Preservation
Staneva et al. [39] shipping and ice navigationwith in situ data S-3, CMEMS
Bensoussan et al. [40]shipping and ice navigation
and protected areasmonitoring
S-3
Van et al. [41] water quality and chlorophyllindicator S-3
Poursanidis et al. [42] coastal management andbathimetry mapping S-2
Minnett et al. [43] coastal management and SSTassessment S-3
Renewable EnergyMorin et al. [44] resources management and
climate change C3S
Alfadda et al. [45] resources management forsolar energy production CAMS
Air quality management
Huijen et al. [46] resources management andwildfires CAMS
Baklanov et al. [47] urban planning for smartcities CAMS
Tchepel et al. et al. [48]urban planning and
background pollutionmonitoring
CAMS
De Blas et al. [49] air quality monitoring in ruralareas
Eskes et al. [50] air quality monitoring andforecasts
Management of Natural Disasters
Handwerger et al. [51] landslides risk forecasts S-1Lesko et al. [52] landslides risk forecasts S-1
Darvishi et al. [53] landslides risk forecasts S-1
Rouyet et al. [54] ground displacements riskforecasts S-1
Carlà et al. [55] slope events risk forecasts S-1Devries et al. [56] floods risk forecasts S-1Vitolo et al. [57] wildfires risk forecasts CEMS
Romero et al. [58] floods and landslides postevent risk analysis S-1
Doxani et al. [59] post event risk analysis inagriculture S-1, S-2
Caballero et al. [60] post floods event risk analysis S-1Rossi et al. [61] weather risk forecasts CEMS
Da et al. [62] rapid mapping for floods CLMS
ISPRS Int. J. Geo-Inf. 2022, 11, 121 10 of 34
4. Application Scenarios
The primary activity of EO-UPTAKE concerns the definition and implementation of aset of application scenarios (ASs) with the key objective of developing competencies andskills in the use of Copernicus data and information to be transferred from the field ofapplied research to that of the productive sector.
In this perspective, a primary and fundamental role is played the self-training process,which took place after attending a couple of short specific courses on remote sensingand Copernicus data, carried out by the first author of the paper, a young researcher ofenvironmental sciences but with little previous experience in the RS sector and satellite data.The design and implementation of several exemplary ASs constituted a very useful test-bed for experimenting with the new notions acquired and for learning through hands-ontraining with the tools and data of the Copernicus ecosystem.
In the spirit of the EO-UPTAKE project of transferring the acquired skills to users insimilar starting conditions (i.e., little or no RS and Copernicus skills) but with a sufficientbackground in Earth sciences, we present, in this section, the results of this training process,first providing an overview of the typical workflow of applications based on satellite data,a summary of the open-source tools used, and a sufficiently detailed description for eachASs of the main problems and the technical solutions adopted.
In light of the literature on downstream applications and the interests of the projectpartners, we present below the four implemented ASs relating to the Natural DisasterManagement, Agriculture, Forestry, and Urban Monitoring user segments.
4.1. Sentinel-based workflow
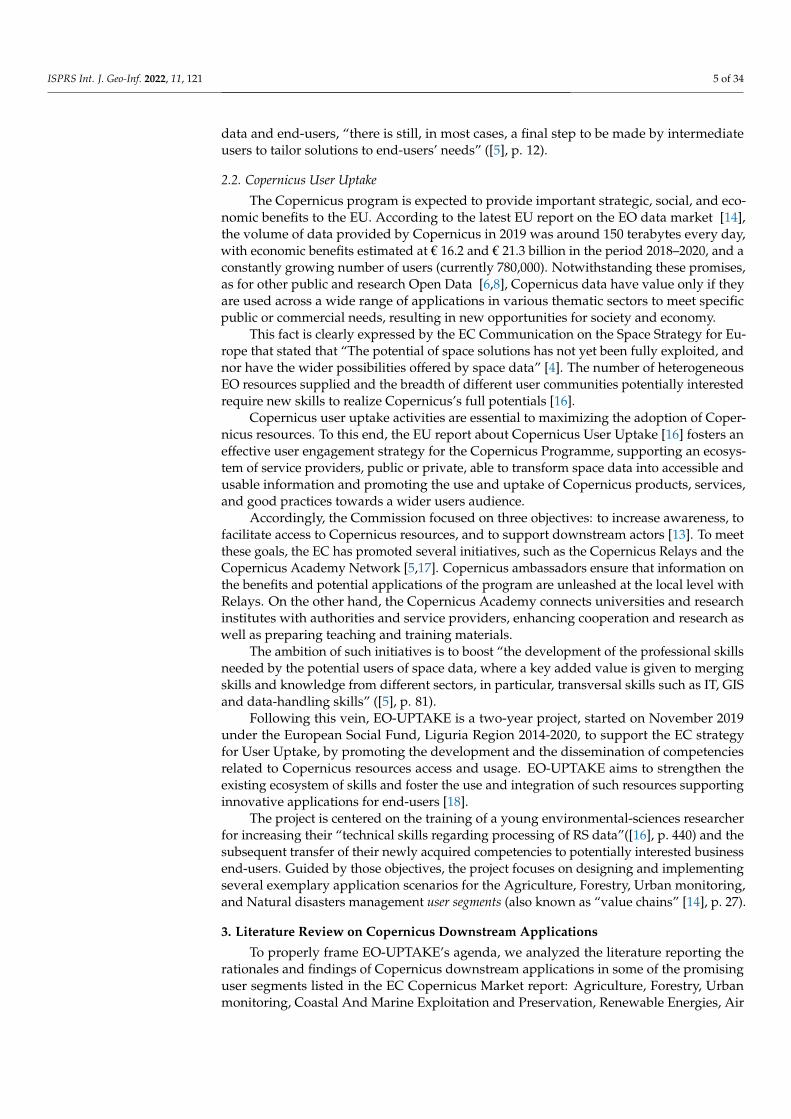
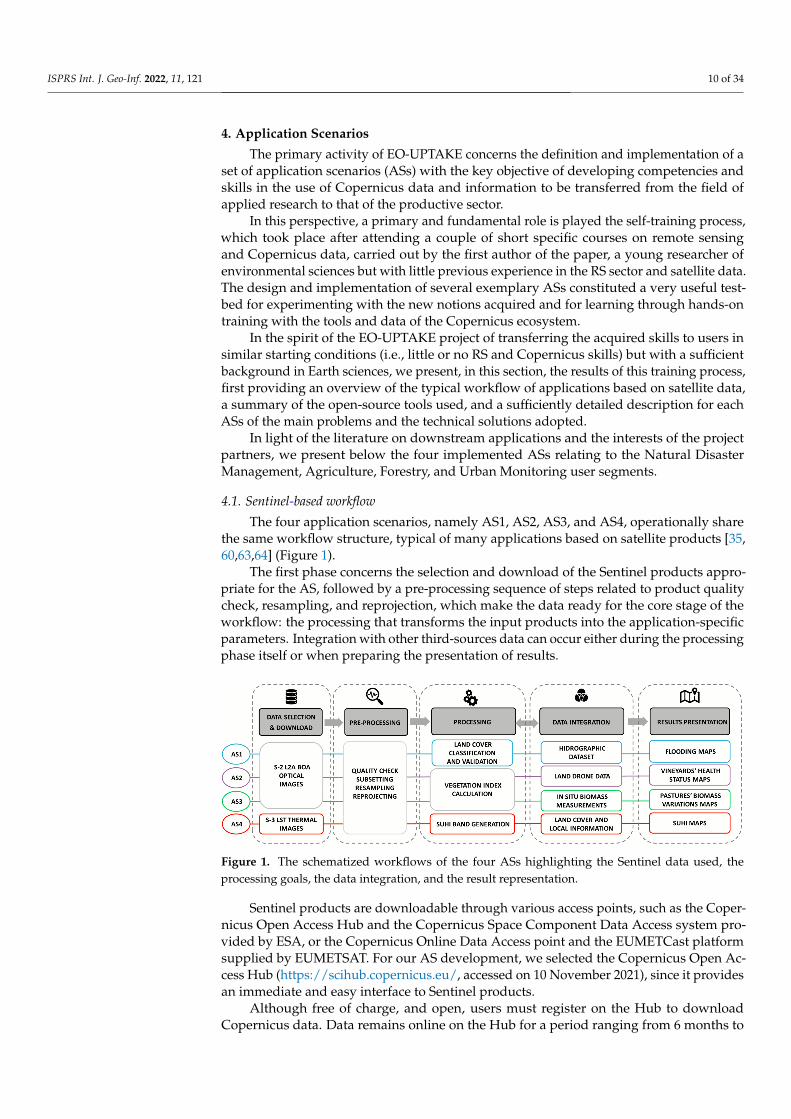
The four application scenarios, namely AS1, AS2, AS3, and AS4, operationally sharethe same workflow structure, typical of many applications based on satellite products [35,60,63,64] (Figure 1).
The first phase concerns the selection and download of the Sentinel products appro-priate for the AS, followed by a pre-processing sequence of steps related to product qualitycheck, resampling, and reprojection, which make the data ready for the core stage of theworkflow: the processing that transforms the input products into the application-specificparameters. Integration with other third-sources data can occur either during the processingphase itself or when preparing the presentation of results.
Figure 1. The schematized workflows of the four ASs highlighting the Sentinel data used, theprocessing goals, the data integration, and the result representation.
Sentinel products are downloadable through various access points, such as the Coper-nicus Open Access Hub and the Copernicus Space Component Data Access system pro-vided by ESA, or the Copernicus Online Data Access point and the EUMETCast platformsupplied by EUMETSAT. For our AS development, we selected the Copernicus Open Ac-cess Hub (https://scihub.copernicus.eu/, accessed on 10 November 2021), since it providesan immediate and easy interface to Sentinel products.
Although free of charge, and open, users must register on the Hub to downloadCopernicus data. Data remains online on the Hub for a period ranging from 6 months to
ISPRS Int. J. Geo-Inf. 2022, 11, 121 11 of 34
1 year, after which it is archived according to the ESA rolling plan (https://sentinel.esa.int/documents/247904/3677657/4_DHUS+Evolution+for+On-line+Access.pdf, accessedon 10 November 2021). Once archived on the long-term archive (LTA), downloads can onlytake place after a request for restoration by users.
After logging into the Hub, the user can access the Sentinel products through aninteractive graphical user interface that facilitates the identification of the target AOI andthe setting of parameters (e.g., orbit, data format, and time window) to filter the productcatalog based on user needs.
For each product matching the query, a preview is returned supplying metadata anda thumbnail image. Before downloading the whole product package, it is convenient toexamine those thumbnails to check the presence of clouds that could affect the imageprocessing. This check does not apply to the S-1 SAR products for which this is irrelevant.However, there are situations in which a cloud check may be more or less strict, thus,permitting the download of images even with partial clouds coverage. An example of thiscase, for S-2 products, is discussed in the following description of AS3.
For our AS1, AS2, and AS3 scenarios, we downloaded S-2 L2A products that provideECW/JP2 compressed images covering a square area of about 100 × 100 Km, with adimension of 10,980 pixels for each side. The single band images contain reflectancemeasurement of bands B02, B03, B04, and B08: Blue, Green, Red, and NIR respectively, withvalues from 0 to 65,535 and a spatial sampling of 10 m. The other bands are supplied witha resolution ranging from 20 m to 60 m. For AS4, we downloaded S-3 products providingSLSTR images which cover a swath width of 1420 km (nadir) × 750 km (backwards), witha spatial sampling of 500 m (for VIS and SWIR bands) and of 1 km (for MWIR and TIRbands).
Once downloaded, the selected images have to be pre-processed according to threetasks: (i) sub-setting, to crop the satellite image to the desired target area; (ii) re-sampling,to geometrically correct multi-size bands to a single-size band image; (iii) re-projection, tocreate an image with a projected Coordinate Reference System.
Concerning the AS processing phase, we leveraged the Sentinel Application Platform(SNAP) (https://step.esa.int/main/toolboxes/snap, accessed on 10 November 2021) archi-tecture, a processing software freely released by ESA for EO data management and analysis.SNAP also includes open-source toolboxes (https://sentinel.esa.int/web/sentinel/toolboxes0, accessed on 10 November 2021) for the scientific exploitation of the Sentinel products.The toolboxes consist of a collection of processing tools for S-1, S-2, and S-3 data, includingproduct readers and writers for data display and analysis and supporting a vast archive ofESA and other missions data, thus allowing the exploitation of several types of satellitedata.
As to data integration and results representation, we used QGIS (https://www.qgis.org/en/site/, accessed on 10 November 2021), an open-source GIS that allows the analysisand possible reworking of the information calculated in the previous step to compose andexport graphic maps. QGIS can georeference images and manage several data formats,including ESRI shapefiles, MapInfo and MicroStation file formats, and AutoCAD DXF. Webservices, including Web Map Service (https://www.ogc.org/standards/wms, accessedon 10 November 2021) and Web Feature Service (https://www.ogc.org/standards/wfs,accessed on 10 November 2021, are also supported for importing data from external sources.
4.2. AS1—Flood-Risk Assessment in Rural Environment
The ever-increasing impact on landscapes caused by human settlements and economicactivities affects hydro-geological safety and, therefore, on risk assessment practices. Cli-mate change is causing an increase in the intensity of rainfall and, therefore, of floodingphenomena, which threaten urban settlements, commercial activities, and all infrastructurelocated in hydro-geological risk areas [65,66]. Liguria is an area particularly sensitive tohydro-geological risk for both rural and urban areas [67–69].
ISPRS Int. J. Geo-Inf. 2022, 11, 121 12 of 34
The construction of artificial structures, like dams, affects the hydrological balanceof the hydrographic systems within the basins and increases the hydro-geological risk. Inparticular, this is true for areas vulnerable to precipitation events of great intensity, such asLiguria, where catastrophic events of this kind have occurred in the last century [70,71].Thus, monitoring the health of hydrographical basins is a matter of primary importance forcivil protection, economic, and environmental purposes. Satellites images are used not onlyfor emergency response, but also for risks forecasts and early warning operations [61,72].
4.2.1. Objectives and Study Area
Anticipatory measures, such as early warnings and forecasts, are the most efficientto mitigate the effects of natural disasters [14]. In this context, the AS1 integrates a land-cover map, for an area characterized by an artificial dam, with information layers, such asflood-risk areas and hydrographic networks to highlight the land-cover classes with greaterflood-risk.
The main AS1 goal was to produce a new land-cover map by processing an S-2 imagewith high spatial resolution (10 m) with a supervised classification technique. An alternativewe initially considered was to use the Corine Land Cover maps (CLC_18), provided by theCLMS service, at the spatial resolution of 100 m, updated every six years. We gave up onthis option as the most recent available map is for 2018, preferring to produce an updatedand higher resolution map.
We evaluated the effects of a possible dam break event in Lake Osiglia [44◦17′52.72′′ N,8◦11′56.44′′ E], assessing the impacts on the different types of land-cover classes surround-ing the lake. The study area around Osiglia lake is predominantly rural and not heavilypopulated: agricultural and tertiary activities are scattered with few urban agglomerations.
4.2.2. Workflow
According to the workflow of FigureGeneralPipeline, we started by selecting, fromCopernicus Open Access Hub, a Sentinel (S-2 L2A) optical image of September 2020.After we pre-processed the selected RGB image, we applied the K-nearest neighbor (K-nn)classification algorithm, provided by SNAP for optical image processing for supervisedclassification purposes. We chose this algorithm because it offers a cutting-edge approacheven for less experienced users.
In summary, K-nn ranks each pixel to the most common class among its trainingsamples k-nearest-neighbor (with k as a positive integer value that is typically small) [73].Before running the algorithm, a manual selection step was required to identify some areasof the satellite image, considered as ground truth, according to a set of pre-defined classes.
We chose this set by following the CLC_18 nomenclature guidelines (https://land.copernicus.eu/user-corner/technical-library/corine-land-cover-nomenclature-guidelines/docs/pdf/CLC2018_Nomenclature_illustrated_guide_20190510.pdf, accessed on 10 November2021) that define five main CLC classes: artificial surfaces (AS), agricultural areas (AA),forests and semi-natural areas (FA), wetlands (W), and water surfaces (WS) [74]. Afterthis characterization, we applied the K-nn algorithm and saved the land-cover layers itproduced as files with the extension ’.BIGtiff’ to be further processed and visualized viaQ-GIS.
As the final step, we integrated the resulting land-cover map, with open hydrographicdatasets generated by two free tools provided by the Brazilian ’Instituto Nacional dePesquisas Espaciais’ (INPE (https://www.gov.br/inpe/pt-br, accessed on 10 November2021)), one of the EO-UPTAKE’s partners.
The distributed system TerraHidro [75,76] allows extracting drainage networks andbasins from a regular grid Shuttle Radar Topography Mission – Digital Elevation Model(SRTM-DEM). We generated the raster map of the potential inundation by processingthe drainage network of the AOI with the Height Above the Nearest Drainage algorithm(HAND) [77–79]. Integrating different types of data requires GIS skills for the managementof the reference systems, which must be homogeneous. Notwithstanding, a tool like QGIS
ISPRS Int. J. Geo-Inf. 2022, 11, 121 13 of 34
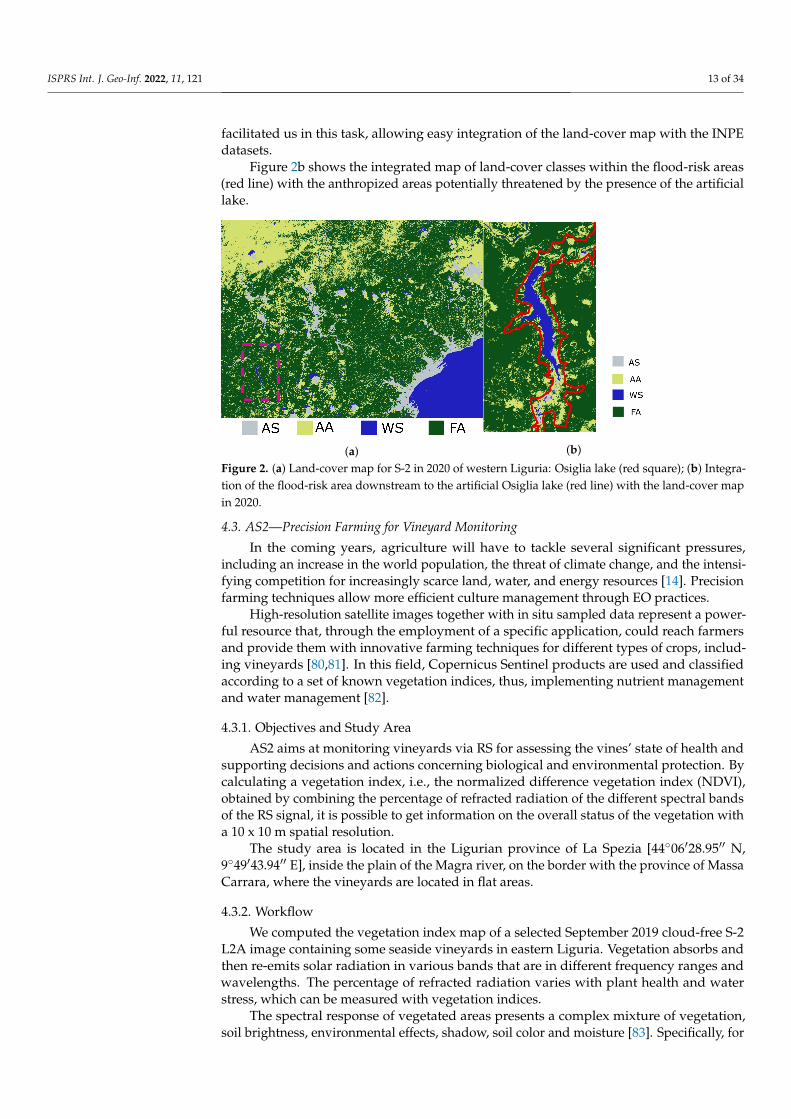
facilitated us in this task, allowing easy integration of the land-cover map with the INPEdatasets.
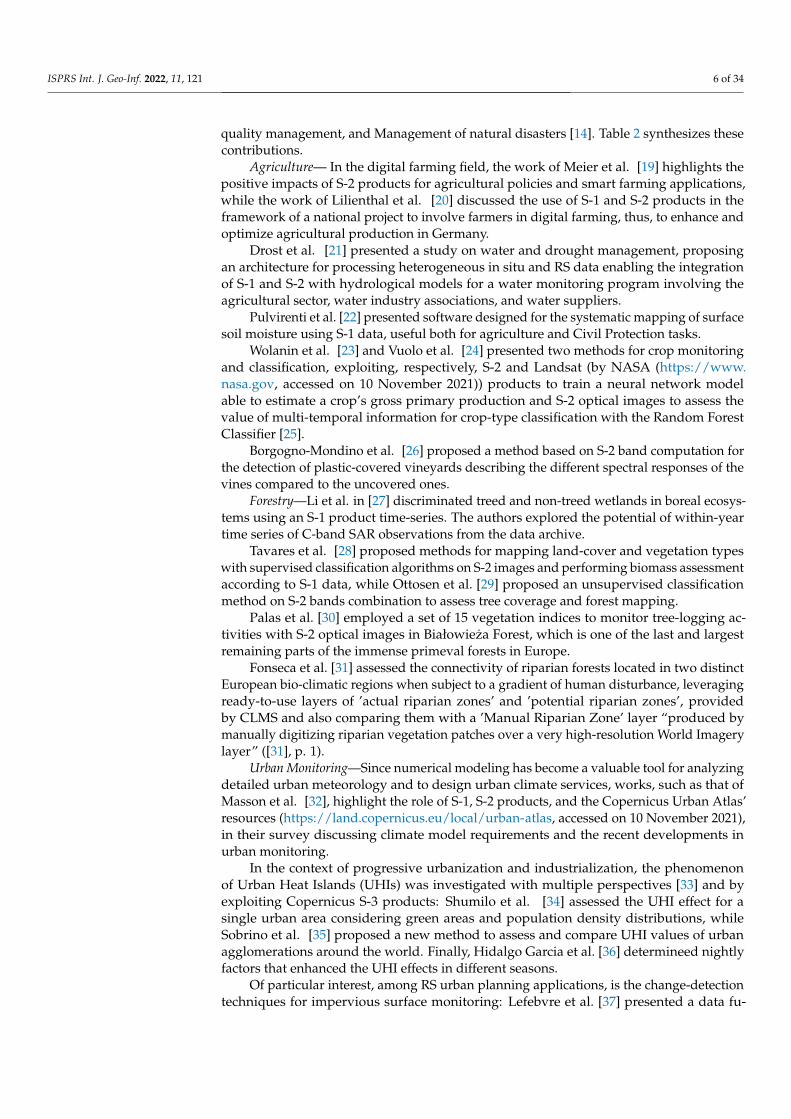
Figure 2b shows the integrated map of land-cover classes within the flood-risk areas(red line) with the anthropized areas potentially threatened by the presence of the artificiallake.
(a) (b)
Figure 2. (a) Land-cover map for S-2 in 2020 of western Liguria: Osiglia lake (red square); (b) Integra-tion of the flood-risk area downstream to the artificial Osiglia lake (red line) with the land-cover mapin 2020.
4.3. AS2—Precision Farming for Vineyard Monitoring
In the coming years, agriculture will have to tackle several significant pressures,including an increase in the world population, the threat of climate change, and the intensi-fying competition for increasingly scarce land, water, and energy resources [14]. Precisionfarming techniques allow more efficient culture management through EO practices.
High-resolution satellite images together with in situ sampled data represent a power-ful resource that, through the employment of a specific application, could reach farmersand provide them with innovative farming techniques for different types of crops, includ-ing vineyards [80,81]. In this field, Copernicus Sentinel products are used and classifiedaccording to a set of known vegetation indices, thus, implementing nutrient managementand water management [82].
4.3.1. Objectives and Study Area
AS2 aims at monitoring vineyards via RS for assessing the vines’ state of health andsupporting decisions and actions concerning biological and environmental protection. Bycalculating a vegetation index, i.e., the normalized difference vegetation index (NDVI),obtained by combining the percentage of refracted radiation of the different spectral bandsof the RS signal, it is possible to get information on the overall status of the vegetation witha 10 x 10 m spatial resolution.
The study area is located in the Ligurian province of La Spezia [44◦06′28.95′′ N,9◦49′43.94′′ E], inside the plain of the Magra river, on the border with the province of MassaCarrara, where the vineyards are located in flat areas.
4.3.2. Workflow
We computed the vegetation index map of a selected September 2019 cloud-free S-2L2A image containing some seaside vineyards in eastern Liguria. Vegetation absorbs andthen re-emits solar radiation in various bands that are in different frequency ranges andwavelengths. The percentage of refracted radiation varies with plant health and waterstress, which can be measured with vegetation indices.
The spectral response of vegetated areas presents a complex mixture of vegetation,soil brightness, environmental effects, shadow, soil color and moisture [83]. Specifically, for
ISPRS Int. J. Geo-Inf. 2022, 11, 121 14 of 34
the NDVI in a field, areas with a significantly lower than average NDVI value may denoteproblems in vegetative development, for example, nutritional stress, parasitic attacks, haildamage, or frost.
NDVI also facilitates monitoring leaf area and canopy for crop protection, canopyadjustments, Summer pruning, and leaf area management, used to regulate canopy densityand leaf distribution, promoting aeration to reduce the likelihood of diseases, and increasingberry sun exposure [64,84]. To identify the potentially problematic areas in each field, NDVIis computed according to Equation (1):
NDVI = (NIR+RED)/(NIR-RED) (1)
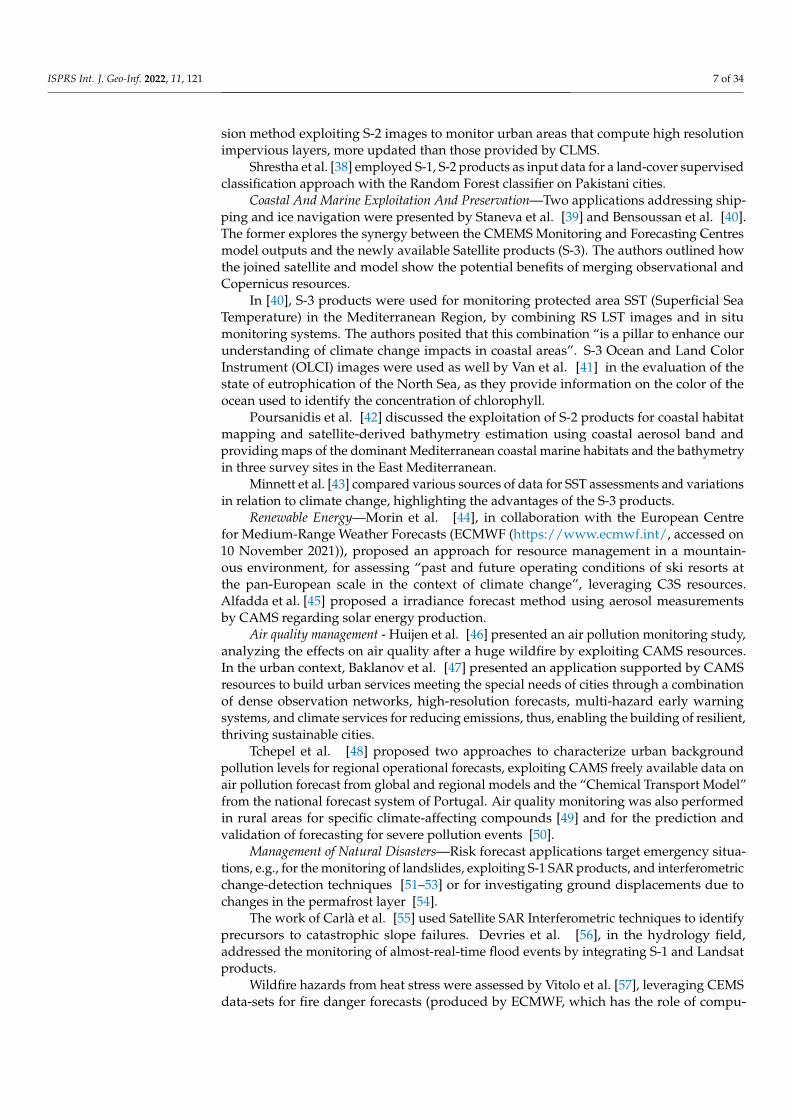
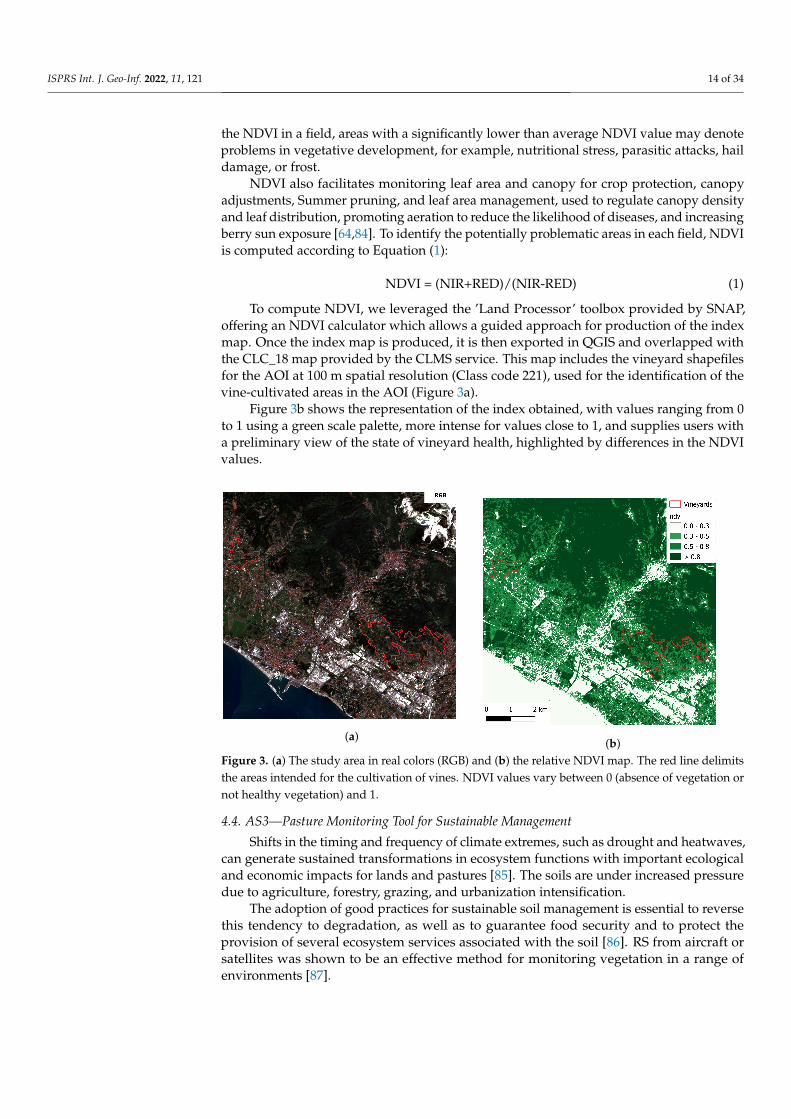
To compute NDVI, we leveraged the ’Land Processor’ toolbox provided by SNAP,offering an NDVI calculator which allows a guided approach for production of the indexmap. Once the index map is produced, it is then exported in QGIS and overlapped withthe CLC_18 map provided by the CLMS service. This map includes the vineyard shapefilesfor the AOI at 100 m spatial resolution (Class code 221), used for the identification of thevine-cultivated areas in the AOI (Figure 3a).
Figure 3b shows the representation of the index obtained, with values ranging from 0to 1 using a green scale palette, more intense for values close to 1, and supplies users witha preliminary view of the state of vineyard health, highlighted by differences in the NDVIvalues.
(a) (b)Figure 3. (a) The study area in real colors (RGB) and (b) the relative NDVI map. The red line delimitsthe areas intended for the cultivation of vines. NDVI values vary between 0 (absence of vegetation ornot healthy vegetation) and 1.
4.4. AS3—Pasture Monitoring Tool for Sustainable Management
Shifts in the timing and frequency of climate extremes, such as drought and heatwaves,can generate sustained transformations in ecosystem functions with important ecologicaland economic impacts for lands and pastures [85]. The soils are under increased pressuredue to agriculture, forestry, grazing, and urbanization intensification.
The adoption of good practices for sustainable soil management is essential to reversethis tendency to degradation, as well as to guarantee food security and to protect theprovision of several ecosystem services associated with the soil [86]. RS from aircraft orsatellites was shown to be an effective method for monitoring vegetation in a range ofenvironments [87].
ISPRS Int. J. Geo-Inf. 2022, 11, 121 15 of 34
4.4.1. Objectives and Study Area
The AS3 aims to evaluate pasture health status for Summer 2020 using satellite prod-ucts in a mountainous area, by means of a spectral vegetation index and its variationsacross different months, to support sustainable pasture monitoring and management. Thestudy area is located in the Paneveggio—Pale di San Martino natural park, a protectednatural area of Trentino-Alto Adige, at an altitude ranging from 1100 to a maximum 3200m asl, established by the Autonomous Province of Trento in 1967.
Its purpose is to protect the natural and environmental characteristics, to promote thescientific study and social use of environmental assets. The area has a complex orographythat contains ecosystems of particular environmental value, sustaining a synergy withagricultural and pastoral activity. Satellite monitoring is an innovative tool that facilitatesthe management of these resources that men have exploited for centuries.
4.4.2. Workflow
In this scenario, considering the characteristics of the AOI, its small size (a few kilo-meters), and its tendency to be climatically predisposed to the formation of “spot” cloudsduring the day in summer, we did not initially exclude all images with cloudiness but onlythose affected by clouds more markedly.
Thus, we pre-selected, before downloading, a set of nine S-2 images containing theAOI relating to the period June-September 2020. After being downloaded, we thoroughlyanalyzed those nine images to keep only the cloud-free ones in the pasture areas of thePaneveggio park. This further check led to identifying four images, one per month, that wesubsequently pre-processed.
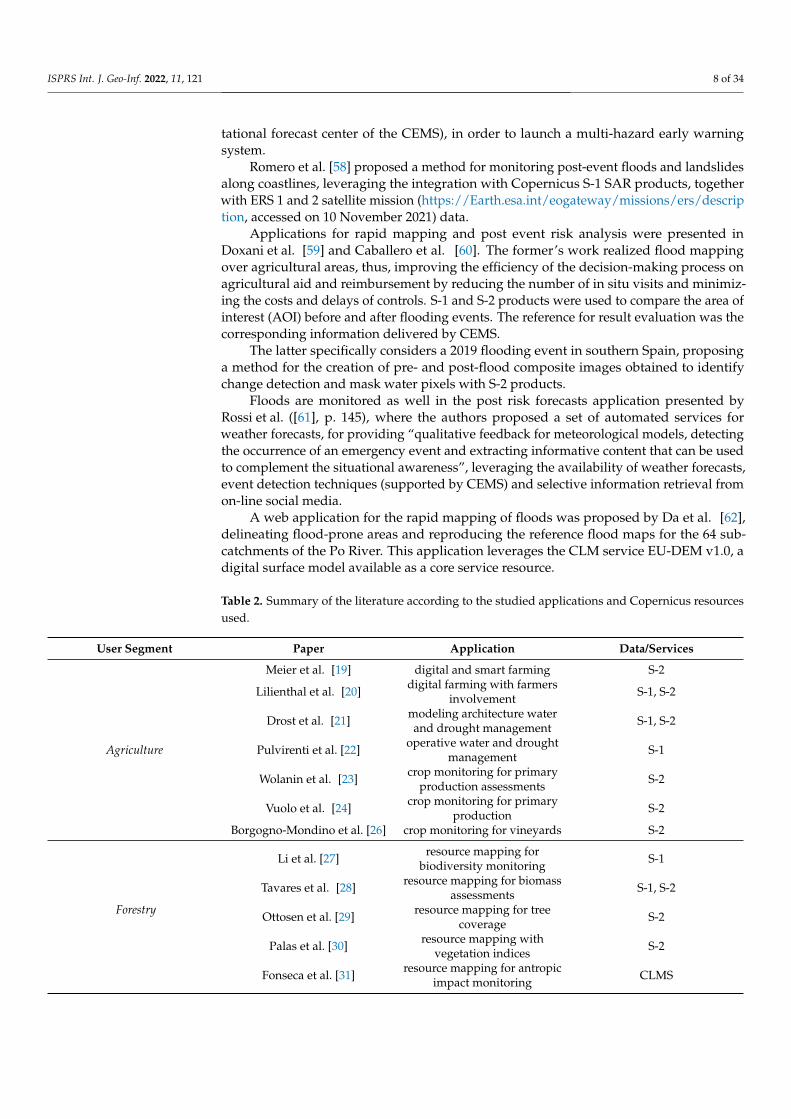
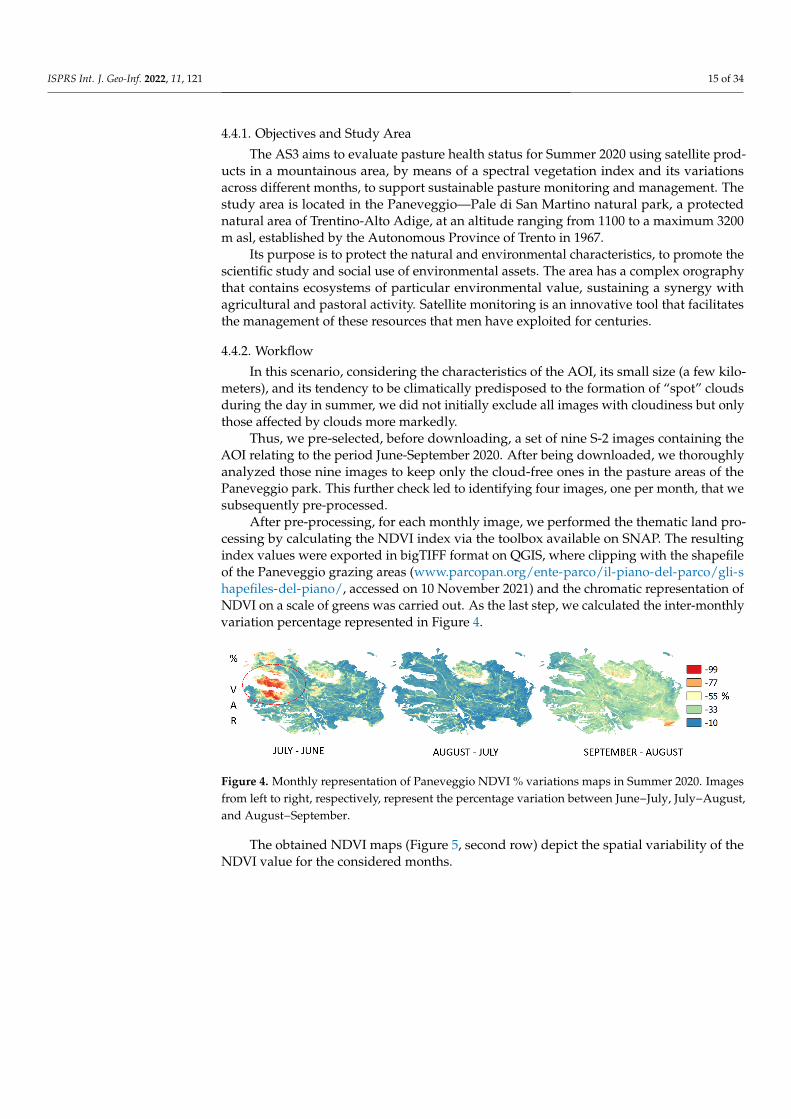
After pre-processing, for each monthly image, we performed the thematic land pro-cessing by calculating the NDVI index via the toolbox available on SNAP. The resultingindex values were exported in bigTIFF format on QGIS, where clipping with the shapefileof the Paneveggio grazing areas (www.parcopan.org/ente-parco/il-piano-del-parco/gli-shapefiles-del-piano/, accessed on 10 November 2021) and the chromatic representation ofNDVI on a scale of greens was carried out. As the last step, we calculated the inter-monthlyvariation percentage represented in Figure 4.
Figure 4. Monthly representation of Paneveggio NDVI % variations maps in Summer 2020. Imagesfrom left to right, respectively, represent the percentage variation between June−July, July−August,and August−September.
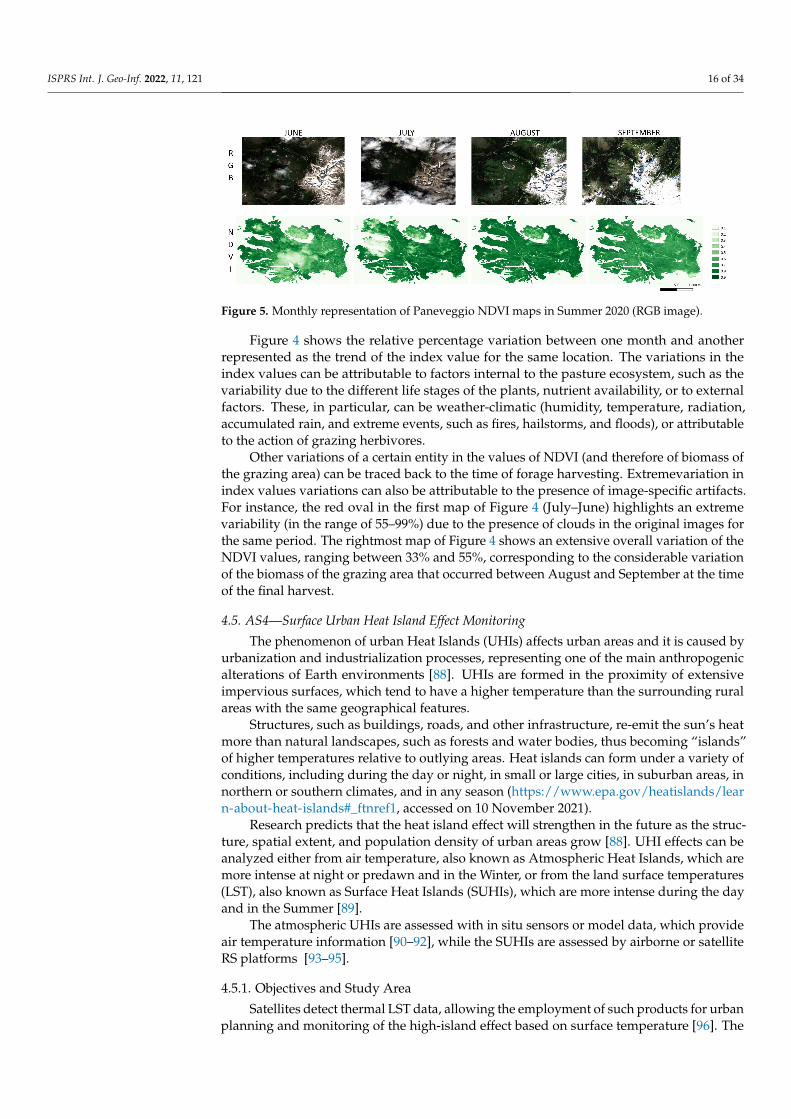
The obtained NDVI maps (Figure 5, second row) depict the spatial variability of theNDVI value for the considered months.
ISPRS Int. J. Geo-Inf. 2022, 11, 121 16 of 34
Figure 5. Monthly representation of Paneveggio NDVI maps in Summer 2020 (RGB image).
Figure 4 shows the relative percentage variation between one month and anotherrepresented as the trend of the index value for the same location. The variations in theindex values can be attributable to factors internal to the pasture ecosystem, such as thevariability due to the different life stages of the plants, nutrient availability, or to externalfactors. These, in particular, can be weather-climatic (humidity, temperature, radiation,accumulated rain, and extreme events, such as fires, hailstorms, and floods), or attributableto the action of grazing herbivores.
Other variations of a certain entity in the values of NDVI (and therefore of biomass ofthe grazing area) can be traced back to the time of forage harvesting. Extremevariation inindex values variations can also be attributable to the presence of image-specific artifacts.For instance, the red oval in the first map of Figure 4 (July–June) highlights an extremevariability (in the range of 55–99%) due to the presence of clouds in the original images forthe same period. The rightmost map of Figure 4 shows an extensive overall variation of theNDVI values, ranging between 33% and 55%, corresponding to the considerable variationof the biomass of the grazing area that occurred between August and September at the timeof the final harvest.
4.5. AS4—Surface Urban Heat Island Effect Monitoring
The phenomenon of urban Heat Islands (UHIs) affects urban areas and it is caused byurbanization and industrialization processes, representing one of the main anthropogenicalterations of Earth environments [88]. UHIs are formed in the proximity of extensiveimpervious surfaces, which tend to have a higher temperature than the surrounding ruralareas with the same geographical features.
Structures, such as buildings, roads, and other infrastructure, re-emit the sun’s heatmore than natural landscapes, such as forests and water bodies, thus becoming “islands”of higher temperatures relative to outlying areas. Heat islands can form under a variety ofconditions, including during the day or night, in small or large cities, in suburban areas, innorthern or southern climates, and in any season (https://www.epa.gov/heatislands/learn-about-heat-islands#_ftnref1, accessed on 10 November 2021).
Research predicts that the heat island effect will strengthen in the future as the struc-ture, spatial extent, and population density of urban areas grow [88]. UHI effects can beanalyzed either from air temperature, also known as Atmospheric Heat Islands, which aremore intense at night or predawn and in the Winter, or from the land surface temperatures(LST), also known as Surface Heat Islands (SUHIs), which are more intense during the dayand in the Summer [89].
The atmospheric UHIs are assessed with in situ sensors or model data, which provideair temperature information [90–92], while the SUHIs are assessed by airborne or satelliteRS platforms [93–95].
4.5.1. Objectives and Study Area
Satellites detect thermal LST data, allowing the employment of such products for urbanplanning and monitoring of the high-island effect based on surface temperature [96]. The
ISPRS Int. J. Geo-Inf. 2022, 11, 121 17 of 34
identification of UHI contributing and mitigating factors is an open challenge, addressedthrough urban development strategies and policies for making cities inclusive, safe, resilient,and sustainable; thus, the need to understand the UHI phenomenon has aroused increasingworldwide research interest since 2005 [33].
This AS aims at evaluating the presence of SUHIs during the summer season in theGenoa metropolitan area [44◦24′40′′ N, 8◦55′58′′ E]. Genoa, the capital of Liguria, with apopulation of about 800,000 inhabitants, is the largest and most densely populated urbanagglomeration in the Region, and its territory, close to the Mediterranean Sea and thesteep hills of the hinterland, over the centuries has undergone an upheaval of its naturalland-form as a result of human activities, such as modifications of the drainage network,excavations, and filling, building and street constructions, which was particularly intensein the 1960s and 1970s [97].
The peculiar climate and orography that distinguish Genoa from other European cities,such as London, Athens, and Stockholm, whose UHI effects have already been studiedthrough Copernicus S-3 images [35,93,98], prompted us to analyze the SUHI effect usingCopernicus products.
4.5.2. Workflow
Copernicus LST images are retrieved by S-3, whose mission consists of two satellites(S-3A in orbit since 2016, S-3B since 2018) with a revisit time of one day over Europe,providing land surface parameters at 1 km2 grid [10,99].
We downloaded 40 S-3 images acquired between 21 June and 22 September 2020, witheight products (4-nights and 4-days) for June and September and twelve products (6-nightsand 6-days) for July and August. To delimit the study area, we used the vector layersthat describe the provincial boundaries and the contour lines provided by the Liguriageoportal (https://geoportal.regione.liguria.it/, accessed on 10 November 2021), thatallows open access to the updated and structured catalog of geo-referenced regional mapsdata. Furthermore, for the determination of rural surfaces and rural areas, we used theCLC_18 map [100].
The images were processed with QGIS to compute the SUHI band, creating for eachmonth the average daily and nightly LST raster of the AOI. The background rural meantemperature, i.e., the LST mean value of pixels covering rural areas, is retrieved in order toassess SUHI effect computed according to Equation (2).
SUHI = LST - Background Rural Temperature (2)
Owing to Genoa’s highly variable orography and proximity to the sea, the differentareas of the municipality have different average temperatures due to the altitude thermalgradient, also considering the complex morphology in the distribution of urban agglom-erations. Accordingly, we selected only the rural areas below a given elevation, to avoidconsidering temperature-affecting factors that are not pertinent to the purpose of the study.
Consistent with the boundaries of the administrative borders and the contour lines ofthe AOI, the selection of the areas from which to calculate the average background ruraltemperature was constrained by two criteria: (i) the first constrains the non-overlappingand non-adjacency with urban areas, as defined by CLC_18; (ii) the second constrains thealtitude to values less than 140 m above sea level, which represents the altimetric belt wheremost of the urban agglomerates are present. For each month analyzed, we considered thesame rural areas to derive the background rural temperature, thus obtaining maps of SUHIcomparable to each other.
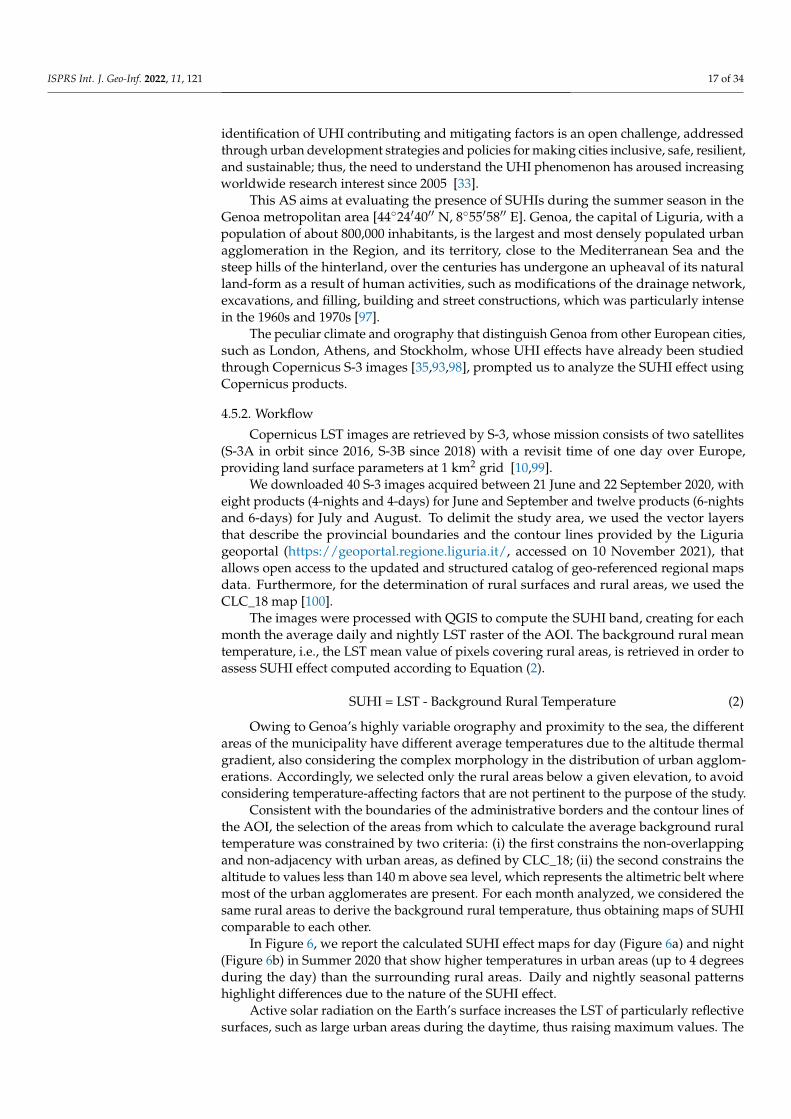
In Figure 6, we report the calculated SUHI effect maps for day (Figure 6a) and night(Figure 6b) in Summer 2020 that show higher temperatures in urban areas (up to 4 degreesduring the day) than the surrounding rural areas. Daily and nightly seasonal patternshighlight differences due to the nature of the SUHI effect.
Active solar radiation on the Earth’s surface increases the LST of particularly reflectivesurfaces, such as large urban areas during the daytime, thus raising maximum values. The
ISPRS Int. J. Geo-Inf. 2022, 11, 121 18 of 34
nightly SUHI effect, as explained by Lu et al. [101], owing to the absence of active solarradiation, is less intense in terms of temperature variations but more widespread.
(a) (b)Figure 6. SUHI daily (a) and nightly (b) average for summer 2020 in the Genoa metropolitan area.
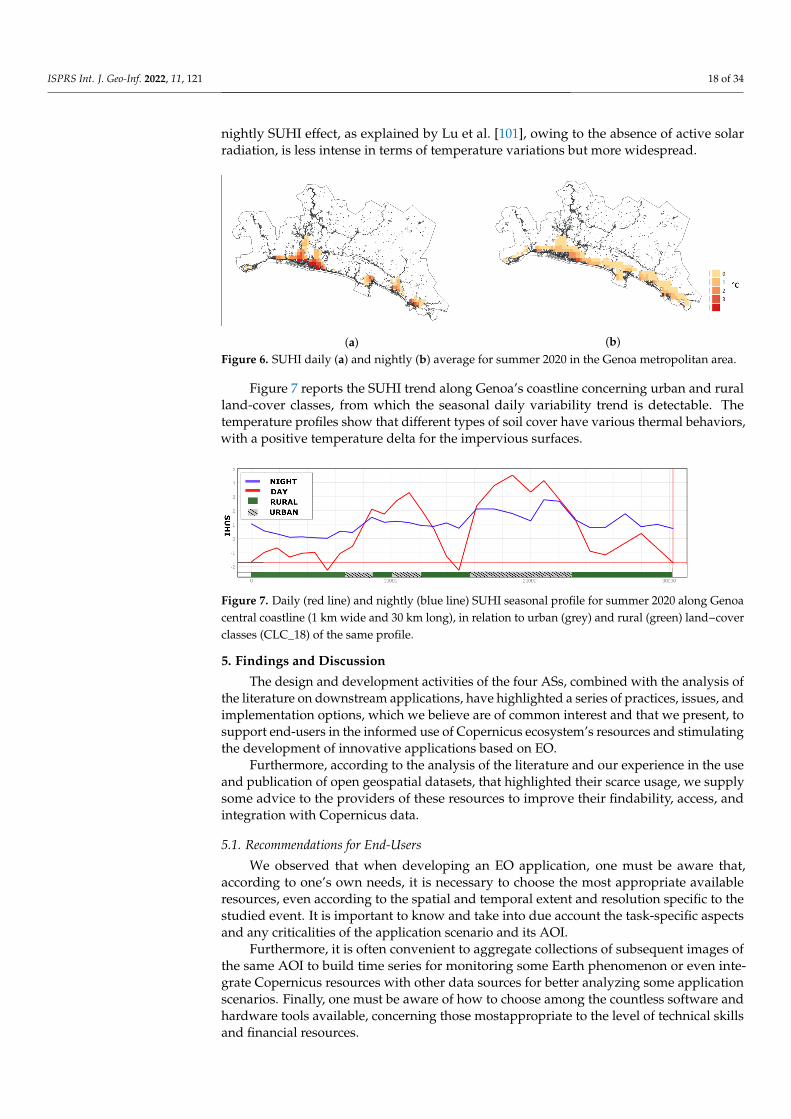
Figure 7 reports the SUHI trend along Genoa’s coastline concerning urban and ruralland-cover classes, from which the seasonal daily variability trend is detectable. Thetemperature profiles show that different types of soil cover have various thermal behaviors,with a positive temperature delta for the impervious surfaces.
Figure 7. Daily (red line) and nightly (blue line) SUHI seasonal profile for summer 2020 along Genoacentral coastline (1 km wide and 30 km long), in relation to urban (grey) and rural (green) land−coverclasses (CLC_18) of the same profile.
5. Findings and Discussion
The design and development activities of the four ASs, combined with the analysis ofthe literature on downstream applications, have highlighted a series of practices, issues, andimplementation options, which we believe are of common interest and that we present, tosupport end-users in the informed use of Copernicus ecosystem’s resources and stimulatingthe development of innovative applications based on EO.
Furthermore, according to the analysis of the literature and our experience in the useand publication of open geospatial datasets, that highlighted their scarce usage, we supplysome advice to the providers of these resources to improve their findability, access, andintegration with Copernicus data.
5.1. Recommendations for End-Users
We observed that when developing an EO application, one must be aware that,according to one’s own needs, it is necessary to choose the most appropriate availableresources, even according to the spatial and temporal extent and resolution specific to thestudied event. It is important to know and take into due account the task-specific aspectsand any criticalities of the application scenario and its AOI.
Furthermore, it is often convenient to aggregate collections of subsequent images ofthe same AOI to build time series for monitoring some Earth phenomenon or even inte-grate Copernicus resources with other data sources for better analyzing some applicationscenarios. Finally, one must be aware of how to choose among the countless software andhardware tools available, concerning those mostappropriate to the level of technical skillsand financial resources.
ISPRS Int. J. Geo-Inf. 2022, 11, 121 19 of 34
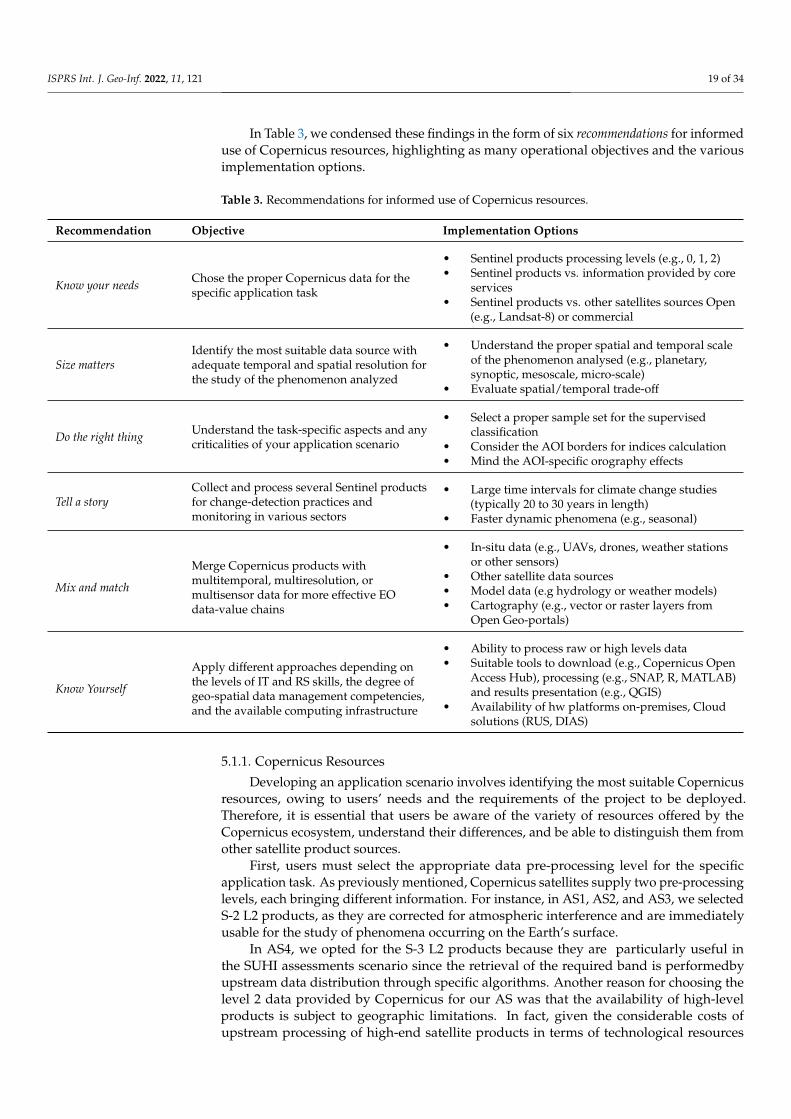
In Table 3, we condensed these findings in the form of six recommendations for informeduse of Copernicus resources, highlighting as many operational objectives and the variousimplementation options.
Table 3. Recommendations for informed use of Copernicus resources.
Recommendation Objective Implementation Options
Know your needs Chose the proper Copernicus data for thespecific application task
• Sentinel products processing levels (e.g., 0, 1, 2)• Sentinel products vs. information provided by core
services• Sentinel products vs. other satellites sources Open
(e.g., Landsat-8) or commercial
Size mattersIdentify the most suitable data source withadequate temporal and spatial resolution forthe study of the phenomenon analyzed
• Understand the proper spatial and temporal scaleof the phenomenon analysed (e.g., planetary,synoptic, mesoscale, micro-scale)
• Evaluate spatial/temporal trade-off
Do the right thing Understand the task-specific aspects and anycriticalities of your application scenario
• Select a proper sample set for the supervisedclassification
• Consider the AOI borders for indices calculation• Mind the AOI-specific orography effects
Tell a storyCollect and process several Sentinel productsfor change-detection practices andmonitoring in various sectors
• Large time intervals for climate change studies(typically 20 to 30 years in length)
• Faster dynamic phenomena (e.g., seasonal)
Mix and match
Merge Copernicus products withmultitemporal, multiresolution, ormultisensor data for more effective EOdata-value chains
• In-situ data (e.g., UAVs, drones, weather stationsor other sensors)
• Other satellite data sources• Model data (e.g hydrology or weather models)• Cartography (e.g., vector or raster layers from
Open Geo-portals)
Know Yourself
Apply different approaches depending onthe levels of IT and RS skills, the degree ofgeo-spatial data management competencies,and the available computing infrastructure
• Ability to process raw or high levels data• Suitable tools to download (e.g., Copernicus Open
Access Hub), processing (e.g., SNAP, R, MATLAB)and results presentation (e.g., QGIS)
• Availability of hw platforms on-premises, Cloudsolutions (RUS, DIAS)
5.1.1. Copernicus Resources
Developing an application scenario involves identifying the most suitable Copernicusresources, owing to users’ needs and the requirements of the project to be deployed.Therefore, it is essential that users be aware of the variety of resources offered by theCopernicus ecosystem, understand their differences, and be able to distinguish them fromother satellite product sources.
First, users must select the appropriate data pre-processing level for the specificapplication task. As previously mentioned, Copernicus satellites supply two pre-processinglevels, each bringing different information. For instance, in AS1, AS2, and AS3, we selectedS-2 L2 products, as they are corrected for atmospheric interference and are immediatelyusable for the study of phenomena occurring on the Earth’s surface.
In AS4, we opted for the S-3 L2 products because they are particularly useful inthe SUHI assessments scenario since the retrieval of the required band is performedbyupstream data distribution through specific algorithms. Another reason for choosing thelevel 2 data provided by Copernicus for our AS was that the availability of high-levelproducts is subject to geographic limitations. In fact, given the considerable costs ofupstream processing of high-end satellite products in terms of technological resources
ISPRS Int. J. Geo-Inf. 2022, 11, 121 20 of 34
used, national and international space organizations mainly carry out this process in thegeographic areas where the interest of their user pool is oriented.
AS4 provides a relevant example of this: while browsing the NASA USGS (https://earthexplorer.usgs.gov/, accessed on 10 November 2021) hub, we found ready-to-useLST data (Level 2, Collection 2 LST products). However, these products are not usable inour scenario concerning Genoa because they are supplied by NASA exclusively for theUnited States.
A second aspect to consider concerns the choice of adopting one of the Copernicuscore services available. In fact, despite their relative ease of use, users should carefullyevaluate the use of these resources since they may not always be suitable for their specificneeds [5,31,102], as we noted, for instance, in developing AS1 and AS4. Indeed, for AS1,we decided to compute a new land-cover map by processing a S-2 L2A optical image ratherthan adopt the ready-to-use classification map provided by the CLMS service but datingback to 2018, because an updated map was deemed preferable for the scenario at hand.
In the AS4 case, we initially considered the use of two resources supplied by the C3SClimate Data Store, which are, at first glance, appropriate for studying assessment of theatmospheric UHI effect. The first is a collection of day and night UHI intensity time-series,relative to 100 European cities (https://cds.climate.copernicus.eu/cdsapp#!/Software/app-health-urban-heat-islands-current-climate?tab=app, accessed on 10 November 2021),including Genoa, supplied as annual maps showing the average summer and winter values,covering the period between 2008 and 2017 with a spatial resolution of 100 m.
Since our study relates to 2020, we have not made use of this resource, preferringan updated data source. The second, UHI related, C3S resource evaluated is the ERA-5 (https://cds.climate.copernicus.eu/cdsapp#!/Dataset/reanalysis-era5-land?Tab=overview, accessed on 10 November 2021) dataset that provides a temperature layer of 2 m (T2m)on an hourly scale for the whole of Europe from 1981 to today. Although this resource issuitable for the atmospheric evaluation of the UHI effect, it is not usable for the calculationof SUHI.
Copernicus users need to be aware that other satellites products are available, asgeneral practices suggest [22,27,39,41], and to be able to discern when this data is preferableto Copernicus or could complement it [33]. For example, for our AS1, AS2, and AS3scenarios, a possible alternative to Copernicus optical data is offered by Landsat 7.
However, we excluded its use considering that it has a revisiting time of 16 days witha spatial resolution of 100 m, hence as to the visible field, Landsat 7 has a Spatio-temporalresolution three times lower than S-2. Notwithstanding, Landsat 7 data may be suitable, forexample, as in the case of the definition of long-term time series, and/or that cover longerobservation periods since Landsat 7 was launched in 1999.
Alongside the open data made available by Copernicus and Landsat, there are severalcommercial initiatives that market satellite products of different types, such as optical,thermal, atmospheric fields, providing additional functionalities/resources due to exclusiveagreements with customers. An example in the context of urban monitoring and air qualityis the data provided by GHGSat (https://www.ghgsat.com, accessed on 10 November2021) satellites, which remotely measure and detect methane emissions at the facility levelaround the globe, and whose data can find applications in sectors, such as Oil and Gas(e.g., to optimize leak detection and repair activities), Landfills (e.g., gas collection systemoperational improvements), and Agriculture (e.g., dairy and beef cattle, other productssugar, additives, and rice).
5.1.2. Spatial and Temporal Resolution
The range of phenomena that occur, or can occur, at the planetary level is very spatiallyand temporally variable and, depending on the type of event, different scales can comeinto play, ranging from the size of the Earth over the years, up to areas limited to a fewcentimeters with temporal variations of the order of minutes or seconds.
ISPRS Int. J. Geo-Inf. 2022, 11, 121 21 of 34
The behaviors can be very different. Fluid dynamics and meteorology, studying a highpercentage of Earth-system phenomena, divide these scales into classes within which thecharacteristics of motions are similar: the planetary scale, the synoptic scale (horizontallengths varying from hundreds to thousands of kilometers, averaged overtimes in the orderof 12–24 h), the mesoscale (a few tens to a few hundred kilometers with an hourly time-step), and the micro-scale for phenomena of lower-dimensional orders (up to hundreds ofmeters).
The ’scale analysis’, i.e., the identification of the most suitable scale for the analysisand reproduction of a given phenomenon, is a practical exercise in many fields and appli-cations [103]. To give an example, in forestry and agriculture, it may be necessary to studythe weekly, monthly, seasonal, or inter-annual variations in the productivity of a pasturearea in a given region (such as in AS3), or it is necessary to evaluate at what time of theweek it is more appropriate to harvest specific fruit trees (such as in AS2).
Choosing which satellite source to adopt in a given scenario is subject to a spa-tial/temporal trade-off: often in the current satellite images, a high spatial resolutionusually corresponds to a low temporal resolution. For instance, in AS4, when studying theSUHI effect, we initially evaluated using the thermal satellite images provided by Landsat-8Level 1, Collection 1, available since 2013, with a spatial resolution at 100 m for Europe,ten-times better than the ones of S-3.
However, Landsat-8 has a revisit time on the study area of 15 days, with only daytimeacquisitions, considerably less than S-3, which has a revisit cycle of less than one day atthe middle latitudes, and with daytime and nighttime images that allow the assessmentof day-night variations. For this reason, we opted for the higher number of observationsavailable from S-3 than the more detailed ones offered by Landsat.
5.1.3. Processing Task
Even when the operative task of the processing phase is relatively simple, and itsexecution almost entirely supported by tools, such as SNAP (as in the case of map clas-sification in AS1), the user needs to know the task-specific aspects and any criticalitiespotentially affecting the correctness of the processing execution outcomes. Consideringthe replicability of the operative tasks at the core of our four ASs (classification, vegetationindex calculations, and identification of SUHI) in other application contexts, we summarizesome of the salient factors that can discriminate their execution.
Map classification accuracy strongly depends on the prior available information, i.e.,the training sample ([104]); therefore, it is advisable to collect for each class a sample setcovering the whole class-specific variability relating to the selected AOI. In AS1, performingthe supervised classification with the SNAP K-nn classifier tool on the Osiglia S-2 RGBdam image, we first manually selected and prepared the dataset with at least 20 samplesfor each of the five classes.
In AS2 and AS3, we used S-2 L2A optical images to calculate the NDVI vegetationindex of two different agricultural areas: vineyards and pastures. The vegetation indicesare spectral transformations of two or more bands able to highlight the vegetation proper-ties, recovered from the backward signal. The index calculation includes all the types ofvegetation present in the AOI and, consequently, the invasive plants in the vicinity of thefields. Therefore, the reliability of a vegetation index, such as NDVI strictly depends on theground distribution of the crop.
For AS2, we considered the rows of vines placed at a distance > 1 m from each other,while for AS3 a grazing area, i.e., a meadow, was considered. We noticed that the morehomogeneous and dense a crop is on the ground (e.g., pastures), the more the index valueis representative of the crop itself, with less interference from other plants (e.g., grassbetween the rows in AS2). For correctly interpreting the results, i.e., in the index values,we recommend evaluating the potential presence of interference due to non-agriculturalvegetation in crops with discontinuous soil coverage.
ISPRS Int. J. Geo-Inf. 2022, 11, 121 22 of 34
When using satellite images, users must be aware of other characteristics and peculiar-ities of the AOI to avoid processing errors and misleading results. We found an exampleof this in AS4 when calculating the value of the SUHI effect starting from the LST band.In this case, the extraction of information on the SUHI band value from satellite imagesis relatively complex since Genoa has many mountainous reliefs in its metropolitan area,and the temperature is subject to an altitude gradient. It was, therefore, necessary to makea prior altimetric selection of the rural areas surrounding the urban districts to avoid adeviation of the results due to temperature and altimetric variations.
In AS4, the cross-information extraction between elevation lines and rural land coverareas allowed us to select rural areas with altimetric temperature variation <1°. In similarcases, where the AOI has a complex orography or other specificities, users have to takethese factors into account, which can increase the number of steps usually required in theprocessing phase compared to scenarios in which the morphology of the territory is moreregular, making processing more time-consuming, especially in the presence of long timeseries.
5.1.4. Time Series
Despite being a relatively recent practice concerning Copernicus, the systematic useof satellite images for constructing time series lays the foundations for change-detectionpractices and monitoring in various sectors, avoiding carrying out extensive and expansivefield data collection.
In particular, global phenomena, such as climate change, that have to be studied overlong time intervals (measured from typically 20 to 30 years in length (https://www.ipcc.ch/sr15/chapter/chapter-3/, accessed on 10 November 2021) ) can benefit from this wideavailability of satellite data. However, it is also possible to evaluate phenomena with afaster dynamic also considering variations during a single season. We discuss a baselineapproach for the creation of time series in AS4 and AS3, respectively for analyzing SUHIeffect and NDVI variations at a monthly scale.
In the agricultural sector [23,105–109] and the forestry sector [27], the health of cropswas assessed respectively employing vegetation indices and variation of woodland coverin protected areas. Monitoring of the temporal trend of the forest cover, when affected byintense deforestation, can be depicted by comparing two inter-annual images, as performedby Palas et al. [30], who were able to determine a quantitative measure of the ecologicalimpact of logging activities using S-2 images.
In the monitoring of urban areas, time series can inform about the variation in soilcover and the balance between anthropogenic and non-anthropogenic surfaces [32,37,110].
The same process is considered in monitoring the use of renewable energy sources [44].This aspect is equally valid in the monitoring of natural disasters [51–56,59–62] and emer-gencies [57,59,61,111], where time-series are used to carry out precautionary assessmentswith a preventive approach in estimating the risk that a given event may or may not occurin the forecast. Romero et al. [58] adopted satellite products from inactive missions (i.e.,ERS 1 and 2) for the creation of time series for monitoring coastlines, producing flood-riskmaps, which consider catastrophic events with a longer return time, taking into accountthe history of the territory.
5.1.5. Data Integration
The abundance of geo-referred data collected by a wide array of sensors have madedata integration an effective method for interpreting and analyzing Earth phenomena. Thisprocess can merge multitemporal, multiresolution, or multisensor data, and it is commonto integrate satellite imagery with other data sources, for example, to compensate for thosesources’ low resolution in studying a small-scale phenomenon [21,39,40,45–50,112,113].
Copernicus data integration with in situ data—Data integration with in-situ data, i.e.,proximal sensing, from various sources (e.g., UAVs, drones, weather stations or othersensors) is a common practice in the EO field [114]. For instance, it finds applications in
ISPRS Int. J. Geo-Inf. 2022, 11, 121 23 of 34
sea and air-quality monitoring [39,40,45,47–50,112,113]. Van et al. [41] integrated Sentinelimages with in situ ship-based observations made by water samples, for the retrievalof harmonised chlorophyll indicator maps to create an indicator displaying chlorophyllconcentration in seawater.
Bensoussan et al. [40] leveraged S-3 sea-surface temperature images for superficialtemperature assessment in the Mediterranean sea, integrating meteorological, climatic, bio-logical, and ecological parameters of Protected Areas. Despite the undoubted advantages,the integration with in situ data is not always without difficulties, as discussed, for example,by Palas et al. [30] in a forestry application integrating in situ observational data relating to“abatement sites” to validate the vegetation indices computed from S-2 products.
Copernicus data integration with other satellite data—Sentinel spatial resolution and revisittime offer an adequate coverage especially for Europe, since the acquisition frequency forsatellites sensitive to clouds is a maximum of 5 days, with an average of six acquisitions permonth, which, despite local peculiarities, can be used for monitoring purposes. Though,in some cases, coupling Copernicus resources with satellite products from other missionsmay be appropriate.
For instance, the 1 km2 grid-scale supplied by the S-3 LST band, is quite a coarse valuefor monitoring high-variability local phenomena such as SUHIs. This drawback may besolved by applying downscaling algorithms [33,115–117], which apply re-sampling steps,thus converting RS low-resolution images into high spatial resolution layers through theinformation extracted from higher spatial resolution thermal data such as the one suppliedby LANDSAT-8, from which LST can be retrieved at a 100-m spatial resolution.
Similarly, integration can be performed with products of the same satellite constella-tion, as carried out by Shrestha et al. [38], between radar and optical images of S-1 and S-2respectively, with urban-monitoring purposes.
Copernicus data integration with model data— In general, the use of data from remote orproximal sensing as input for models is a consolidated integration practice, as it allows tointroduction of the values of variables directly recorded in the environment, producing out-puts that are closer to the real conditions [118]. In meteorology and agriculture, integratingCopernicus and model data is becoming a common practice, especially concerning weatherand atmospheric applications [21,43,45,57,111].
For instance, in AS1, we used the hydrological models TerraHidro and HAND [75,77,119] to produce layers matching the classification map with a hydrological risk assessment.Data assimilation techniques combine observational data with output from a numericalmodel to produce a more precise estimate of the evolving state of the Earth system [50].
Copernicus data integration with cartography database—EO applications can also benefitfrom the integration of Copernicus data with local cartography and toponymy providedat various detail levels, in vector or raster format, by public administrations through theirgeoportal or websites or by the Copernicus services themselves.
For instance, in AS4, we used either Copernicus resources (i.e., the CLC_18 supplyinga vector-based dataset with 44 land-cover and land-use classes) provided by the CLMSservice and the maps (i.e., the shapefiles of the administrative boundaries and the contourlines of the Genoa metropolitan area) offered by the Liguria regional geoportal. As well,we used CLC_18 in AS2 for vineyard identification and the Paneveggio park shapefile togather the pasture-areas borders for AS3, and couple them with the newly classified NDVImaps.
5.1.6. Technological Know How
Each phase of the workflow, from data selection to representation of the final results,can be carried out with different approaches, depending on the level of IT skills andtechnical knowledge of users. Conversely, we observed that even the adoption of ready-to-use thematic resources such as the ones provided by Copernicus core services requiressome understanding of the specific tools and (at least) an elementary degree of geo-spatialdata management competencies. For instance, the use of CLC_18 in AS1, AS2, AS4, and of
ISPRS Int. J. Geo-Inf. 2022, 11, 121 24 of 34
local cartography datasets in AS3, required basic notions of the reference systems and skillsof GIS tools.
Sentinel level 2 products contain informative “ready to use” bands, such as the S-3 LSTband, which is provided with an accuracy of 1◦K (even higher at night when the differentialsurface heating is absent (https://sentinels.copernicus.eu/web/sentinel/user-guides/sentinel-3-slstr/overview/geophysical-measurements/land-surface-temperature, accessedon 10 November 2021) ). Conversely, LST information is provided implicitly in Landsat-8data, thus requiring a more complex SUHI processing workflow.
In general, processing raw satellite data requires a good level of EO skills and knowl-edge, and, to this end, software, such as e-Cognition (https://geospatial.trimble.com/products-and-solutions/ecognition, accessed on 10 November 2021) and SNAP allow users tomanuallycompute the application parameters. However, these tools also provide thematictoolboxes, which facilitate user calculation of indices, or images corrections and classifica-tions in “assisted” mode. For example, for optical images, the “thematic land processor” isavailable in SNAP, through which bands can be combined to obtain indices, such as NDVI,is very simple and user-friendly.
Data downloading via the Copernicus Open Access Hub—Guided User Interfaceis a valuable option for non-expert users and usually does not take much time. Evenintermediate users may prefer a manual download rather than an automatic one, especiallywhen the number of products to be downloaded is small, for instance, as in the case of theseasonal time-series construction we discussed in AS3 and AS4.
Some issues may arise when the products to be downloaded from the portal aretransferred “offline”, in the LTA. In fact, once offline, only one archived image can bedownloaded every 30 min. As an alternative solution, the LTA hub API (https://readthedocs.org/projects/sentinelsat/downloads/pdf/master, accessed on 10 November 2021)can be used. In this case, through implementing appropriate code scripts, for example, inPython, it is possible to download a batch of multiple images at once.
As we have seen, SNAP allows the creation of simple representations of the results,however, this is more than adequate for application scenarios, such as those we introduced(e.g., the generation of NDVI maps in AS2 and AS3). However, if further processing andintegration with other data are required, an additional step through a GIS environmentmay be necessary.
We applied this procedure in the application scenarios that required the integration ofSentinel data with the resources of the local cartographic databases (e.g., AS2, AS3, andAS4). For further analyses on the achieved results (such as validation or comparison assess-ments), tools, such as MATLAB or R, are available, although requiring basic programmingskills [120,121].
A non-trivial aspect when managing satellite products, often taking up a lot of diskspace and requiring good computing power, is the hardware equipment available. Forexample, the creation of time series is usually a time- and space-consuming task (dependingon the temporal and spatial extension of the study area considered), and the volume ofdata to be downloaded, stored, and processed can negatively affect the performance ofmachines not properly equipped.
For example, the SNAP guidelines recommend having at least 4 Gb of RAM and 10Gb of free memory, although, in our experience, this basic equipment has not been freefrom performance problems. A valid alternative to overcome the limitations of on-premiseresources is cloud-based technologies that leverage virtualized and distributed Informationand Communication Technologies (ICT) solutions. The flexible, pay-per-use cloud approachhas proven effective in both improving companies’ business models [122] and supportinghigh-demanding e-science applications that require running complex simulations on aglobal scale [123,124].
Regarding the Copernicus world, a first option is the free and open Research AndUser Support (RUS (https://rus-copernicus.eu/portal, accessed on 10 November 2021))cloud platform, which hosts a suite of pre-installed toolboxes on virtual machines allowing
ISPRS Int. J. Geo-Inf. 2022, 11, 121 25 of 34
registered users to manage and process data derived from the Sentinels constellation. Aftera trial period, deemed necessary to become familiar with the Copernicus ecosystem, usersshould be able to continue their activities independently, outside RUS.
A mainly commercial option is provided by five Data and Information Access Services(DIAS) cloud platforms (https://www.copernicus.eu/en/access-data/dias, accessed on10 November 2021), i.e., Creodias (https://creodias.eu, accessed on 10 November 2021),Mundi (https://mundiwebservices.com, accessed on 10 November 2021), Onda (https://www.onda-dias.eu, accessed on 10 November 2021), Sobloo (https://sobloo.eu, accessedon 10 November 2021), Wekeo (https://www.wekeo.eu, accessed on 10 November 2021),that supply a centralized access to Copernicus resources and processing tools.
Although, in general, they offer free access to Copernicus resources, their core businessis the deployment of services and EO applications and tools via virtual machines, accord-ing to pay-per-use or package offers (https://earsc.org/dias-comparison, accessed on 10November 2021). Through these virtual machines, users may find the right solution to theirneeds in a ready-to-go environment with the required physical and software devices andwithout the burden to install and configure them.
Other than the access to Sentinel products and to a variable set of Copernicus coreservices, each DIAS offers its EO applications and processing tools, and can provide datacollected by other satellite missions, both non-commercial (e.g., Mundi and Onda provideLandsat’s collection) and commercial (e.g., Soblo provides Pleiades Very High-Resolutionimages).
5.2. Advice for Data Providers
The effective integration of Copernicus with other more specific spatial data sets,including open ones, is closely related to the degree of user skills. Indeed, thanks to theprevious knowledge in this sector, we did not have particular difficulties in finding andaccessing these data and incorporating them with Copernicus resources in our four ASs.However, such problems could arise for users of other application domains (away from RSand geodata).
Although a large amount of open geospatial datasets is now available to developapplications and to meet the information needs of citizens and organizations all around theworld [125], in our previous work [9], we observed, based on an experimental evaluationof the usage of over 160,000 geospatial datasets belonging to six national and internationalOpen Government Data (OGD) portals, that these data are highly underused.
Data and service providers, such as the intermediate users, that process satellite dataand turn it into geo-information products (see Section 2), and public bodies that releasegeo-referred resources through OGD portals, should be able to understand the underlyingcauses of low data usage, to be capable implement effective countermeasures.
Among the main barriers that hinder the success of Open Data initiatives, the lowinformation quality of data sets metadata is often mentioned [6]. The presence of goodmetadata, recommended among others by the World Wide Web Consortium (W3C) Dataon the Web Best Practices (DWBP) (https://www.w3.org/TR/dwbp/, accessed on 10November 2021) Working Group and by the findability, accessibility, interoperability,and reusability (FAIR) principles [126], is essential to help “human users and computerapplications” understanding “the data as well as other important aspects that describe adataset or a distribution” (DWBP Best Practice 1: Provide metadata).
By metadata, users can filter OGD portals by keyword search and features, such astheme category, data types, format, and license, for finding and accessing the datasets closerto their needs. To enable publishers to describe datasets and data services adequately, theW3C Dataset Exchange Working Group developed the last revision of the Data CatalogVocabulary (DCAT) (https://www.w3.org/TR/vocab-dcat-2/, accessed on 10 November2021), providing a standard model and a Resource Description Framework (RDF) vocab-ulary, for facilitating the consumption and aggregation of metadata and increasing the
ISPRS Int. J. Geo-Inf. 2022, 11, 121 26 of 34
discoverability of datasets and data services (i.e., “a collection of operations or API, whichprovides access to data”).
Good quality metadata should also allow data providers to describe the provenance(i.e., the history or lineage) of the datasets (DWBP Best Practice 5: “Provide data provenanceinformation”) and their quality (DWBP Best Practice 6: Provide data quality information). TheW3C Provenance Working Group defines Provenance as the “information about entities,activities, and people involved in producing a piece of data or thing, which can be used toform assessments about its quality, reliability, and trustworthiness”.
The use of provenance metadata is also recommended by FAIR subprinciple R1.2:“(meta) data are associated with their provenance”. Accordingly, to meet DWBP practicesFive and Six, DCAT supplies “details for the ways of representing dataset provenance andquality”. In the first case, DCAT suggests using the W3C Provenance Ontology (PROV-O) (https://www.w3.org/TR/prov-o, accessed on 10 November 2021), in the second toemploy the W3C Data Quality Vocabulary (DQV) (https://www.w3.org/TR/vocab-dqv/,accessed on 10 November 2021).
In our previous work, we exemplified the adoption of these two technologies byproviding W3C compliant metadata to document the quality assessment of a set of e-Government controlled vocabularies [127] and the provenance description of a collectionof hydrographic datasets [79].
To assess the FAIRness of their resources, data providers can benefit from the frame-work designed by Wilkinson et. al. [128] and by the ‘FAIR Evaluator’ (https://fairsharing.github.io/FAIR-Evaluator-FrontEnd, accessed on 10 November 2021) tool they im-plemented, that provides a set of metrics to test the compliance of a Web resource withthose principles. The tool implements “22 Maturity Indicators Tests”, grouped by the fourprinciples respectively, in eight (Findable), five (Accessible), seven (Interoperable), and two(Reusable).
By supplying the Globally Unique Identifier (GUID) of a given (Web) resource (e.g.,the URI of a published dataset) to the tool, a data provider receives an assessment reportsummarizing the resource successes and failures for each of the 22 metrics.
6. Conclusions
The Copernicus program makes a primary contribution to the European Green Deal bysustaining the protection, conservation, and enhancement of the EU’s natural capital. Theavailability of Copernicus open data, and its integration with other spatial data, opens newhorizons to the downstream satellite applications industry, while supporting the Europeancommunity’s efforts to address increasingly pressing challenges of environmental andclimate sustainability.
For this to happen, it is necessary to improve the awareness of end-usersconcerningthe real opportunities offered by the Copernicus ecosystem and foster the dissemination ofcompetencies and practical skills for its use in various Earth user segments. In pursuingthese two objectives, the activities of the EO-UPTAKE project, which we summarizedherein, highlight a set of practices that we deem convenient to share with those who wantto begin implementing simple Copernicus-based application scenarios.
The paper presents a twofold contribution. First, to exemplify how end-users canbenefit from the Copernicus ecosystem to develop applications of immediate practicaluse, we introduced four application scenarios, based on a typical Sentinel-based workflowscheme, in four user segments: Management of Natural Disasters, Agriculture, Forestry, andUrban Monitoring. For each scenario, we provided a reference framework that identifiesthe general objectives, presenting the specific ones concerning a well-defined area of studyand detailing for each phase of the workflow what data, what tools, and what actions weperformed to obtain the expected results.
These examples can be a spur and a guide to end users, particularly those withprimary IT and RS skills, regarding the feasibility and replicability of similar scenarios in
ISPRS Int. J. Geo-Inf. 2022, 11, 121 27 of 34
their specific contexts or for developing RS applications in other user-segments, such asthose featured in related works.
Our second contribution takes the form of a series of recommendations to end-usersand advice to data providers regarding the informed use of Copernicus resources andthe provision of geospatial products that we subsumed by the practices, problems, andimplementation options derived from the four application scenarios, from the literatureanalysis and from our experience in using and publishing OD geospatial datasets.
To further strengthen the awareness of end-users about the opportunities offered byCopernicus and on the concrete possibilities of creating their analyses of the resources itoffers, we first highlighted that the development of an EO application requires the user tocarefully choose the most suitable among the various RS resources potentially available(Know your needs) while also bearing in mind the spatial and temporal extent of the studiedevent and the possible trade-offs (Size matter).
We indicated the importance for users of analyzing the task-specific aspects and anycriticalities of their application scenario and its AOI and consequent acts (Do the right things).We also stressed the opportunity of aggregating image sequences of the same AOI to createtime-series that are helpful to monitor the variations of terrestrial phenomena at differenttemporal scales (Tell a story) and the effectiveness of integrating the information resources ofCopernicus with other data sources whether in situ, from models or from Open geo-portalsto deepen the study of several application scenarios (Mix and match).
Last but not least, the user must be aware that there are many open-access or commer-cial software and hardware tools to choose from, based on their level of IT skills, the degreeof know-how in geospatial data management, the available IT infrastructures, and, clearly,their finances (Know Yourself ).
Regarding data and service providers, to cope with the underlying causes of low datausage and be capable of implementing effective countermeasures to better support usersto find, access and incorporate these data with Copernicus resources, we outlined that,among the obstacles holding back the success of Open Data initiatives, is the low quality ofdatasets metadata.
To improve metadata quality and, hence, increase dataset usage, we advised dataproviders to adopt a series of practices and recommendations, such as those provided bythe W3C and the FAIR principles, which emphasize the importance of including informa-tion on the provenance of the datasets and their quality in the metadata, using standardvocabularies, such as DCAT, PROV, and DQV. Finally, we provided a reference to the ‘FAIREvaluator’ tool that assists data providers in verifying their data compliance with the FAIRprinciples.
For future work, we intend to move in two directions. On the one hand, there is thewill to complete the picture of two ASs, namely AS2 and AS3, for integration with otherdata sources. In the first case, we foresee validating the NDVI maps produced throughobservations captured by a fleet of drones that are equipped with sensors for the analysisof the vines between the rows and also extending the study to another Ligurian AOI butcharacterized by rows located in inaccessible and mountainous areas.
In the case of AS3, the idea is to integrate the NDVI map with high-spatial-resolutiondata collected through biomass sampling in situ, near a “malga” (i.e., alpine hut) withinthe Paneveggio Park, for further calibration of the information of remote sensing throughground-truth data collection.
On the other hand, we plan to finish the implementation of two other ASs, which wehave begun to examine. One concerns the identification of slope areas at risk of landslidescaused by the presence of water leaks from underground utilities. The other aims toevaluate landfill gas emissions and slope consolidation.
These extensions and completions would allow expanding the range of applicationscenarios, thus, providing end-users with a more comprehensive picture of the opportuni-ties offered by Copernicus. Indeed, the project initially planned these ASs extensions with

ISPRS Int. J. Geo-Inf. 2022, 11, 121 28 of 34
the direct involvement of the partners. However, their actual implementation has beenhampered and prevented due to the COVID-19 epidemic.
Author Contributions: The authors contributed in the following way to the work reported in thispaper and to its writing: conceptualization, Monica De Martino and Alfonso Quarati; methodology,Lorenza Apicella, Monica De Martino and Alfonso Quarati; software, Lorenza Apicella; investigation,Lorenza Apicella, Monica De Martino and Alfonso Quarati; writing—original draft preparation,Lorenza Apicella, Monica De Martino, Alfonso Quarati; writing—review and editing, LorenzaApicella, Monica De Martino and Alfonso Quarati; supervision, Monica De Martino and AlfonsoQuarati; project administration Monica De Martino; funding acquisition, Monica De Martino andAlfonso Quarati. All authors have read and agreed to the published version of the manuscript.
Funding: This research has been funded by the European Social Fund, Liguria Region 2014–2020,Axis 3, s.o. 10.5.
Acknowledgments: The authors wish to acknowledge all of those who contributed to the projectdevelopment through scientific discussion, review, and data provision, stakeholder engagement, andfacilitation: GISIG—Geographical Information Systems International Group, in Genoa (Italy), for hisprecious collaboration as a project partner, in particular, Roderic Molina and Silva Gorni; INPE—theNational Institute for Space Research in Sao Jose dos Campos (Brazil), and the Italian companiesInfo Solution S.p.A. in Genoa and Dedagroup Public Services s.r.l. in Bologna for supporting in thedefinition of the application scenarios.
Institutional Review Board Statement: Not applicable.
Informed Consent Statement: Not applicable.
Data Availability Statement: Not applicable.
Conflicts of Interest: The authors declare no conflict of interest.
AbbreviationsThe following abbreviations are used in this manuscript:
AOI Area of InterestAS Application ScenarioCAMS Copernicus Atmosphere Monitoring ServiceCEMS Copernicus Emergency Management ServiceCLMS Copernicus Land Monitoring ServiceCMEMS Copernicus Marine ServiceCSS Copernicus Security ServiceC3S Copernicus Climate Change ServiceDCAT Data Catalog VocabularyDIAS Data and Information Access ServicesDQV W3C Data Quality VocabularyDWBP W3C Data on the Web Best PracticesEEA European Agency for the EnvironmentEC European CommissionECMWF European Centre for Medium-Range Weather ForecastEGD European Green DealEO Earth ObservationESA European Space AgencyEUMETSAT European Organisation for the Exploitation of Meteorological SatelliteFAIR Findable, Accessible, Interoperable, ReusableGUID Globally Unique IdentifierHAND Height Above the Nearest Drainage algorithmICT Information and Communication TechnologiesIT Information TechnologyINPE Instituto Nacional de Pesquisas EspaciaisL0 Level-0 data
ISPRS Int. J. Geo-Inf. 2022, 11, 121 29 of 34
L1 Level-1 dataL2 Level-2 dataLST Land Surface TemperaturesLTA Long-Term ArchiveMSI HR Multi-Spectral ImageryMTG-S Spectrometer on Meteosat Third Generation SounderNASA National Aeronautics and Space AdministrationNDVI Normalized Difference Vegetation IndexOGC Open Geospatial ConsortiumOLCI Ocean and Land Color InstrumentOGD Open Government DataPROV-O W3C Provenance OntologyRDF Resource Description FrameworkRS Remote SensingRUS Research and User SupportSAFE Standard Archive Format for EuropeSAR Synthetic Aperture RadarSMEs Small and Medium EnterprisesSNAP Sentinel Application PlatformSRTM-DEM Shuttle Radar Topography Mission–Digital Elevation ModelSST Superficial Sea TemperatureSUHIs Surface Heat IslandsSLSTR Surface Land Sea Temperature RadiometerTROPOMI TROPOspheric Monitoring InstrumentUHIs Urban Heat IslandsUVN Ultraviolet-Visible-Near-InfraredVAS Value-Added ServicesW3C World Wide Web Consortium
References1. EEA. The European Environment—State and Outlook 2020: Knowledge for Transition to a Sustainable Europe. 2019. Available
online: https://www.eea.europa.eu/soer/publications/soer-2020 (accessed on 10 November 2021).2. EC. The European Green Deal. Final Version. 2019. Available online: https://ec.europa.eu/info/sites/default/files/european-
green-deal-communication_en.pdf (accessed on 10 November 2021).3. EC. General Union Environment Action Programme to 2030 2020. Available online: https://ec.europa.eu/environment/pdf/8
EAP/2020/10/8EAP-draft.pdf (accessed on 10 November 2021).4. EU Directorate-General for Internal Market, Industry, Entrepreneurship and SMEs. Space Strategy for Europe. 2016. Available
online: https://eur-lex.europa.eu/legal-content/EN/TXT/HTML/?uri=CELEX:52016DC0705&from=EN (accessed on 10November 2021).
5. EC. Fostering the Uptake of Copernicus and Space Applications. 2017. Available online: www.copernicus.eu/sites/default/files/Fostering_the_uptake_of_Copernicus_and_Space_applications_July2017.pdf (accessed on 10 November 2021).
6. Quarati, A. Open Government Data: Usage trends and metadata quality. J. Inf. Sci. 2021, 1–24. https://doi.org/10.1177/01655515211027775.
7. Quarati, A.; De Martino, M. Open government data usage: A brief overview. In Proceedings of the the 23rd InternationalDatabase Applications & Engineering Symposium, IDEAS 2019, Athens, Greece, 10–12 June 2019; ACM: New York, NY, USA,2019, pp. 28:1–28:8. https://doi.org/10.1145/3331076.3331115.
8. Quarati, A.; Raffaghelli, J.E. Do researchers use open research data? Exploring the relationships between usage trends and meta-data quality across scientific disciplines from the Figshare case. J. Inf. Sci. 2020, 1–26.https://doi.org/10.1177/0165551520961048.
9. Quarati, A.; De Martino, M. Geospatial Open Data Usage and Metadata Quality. ISPRS Int. J. -Geo-Inf. 2021, 10, 1-30.https://doi.org/10.3390/ijgi10010030.
10. Cheval, S.; Micu, D.; Dumitrescu, A.; Irimescu, A.; Frighenciu, M.; Ioja, C.; Tadose, N.C.; Davidescu, S.; Antonescu, B. Meteorolog-ical and Ancillary Data Resources for Climate Research in Urban Areas. Climate 2020, 8, 37. https://doi.org/10.3390/cli8030037.
11. Lacava, T.; Papalia, L.B.; Paradiso, I.F.; Proto, M.; Pergola, N. On the Barriers Limiting the Adoption of the Earth ObservationCopernicus Data and Services and Their Integration with Non-Conventional (e.g., Citizen) Observations: The EU CoRdiNet ProjectContribution. In Proceedings of the 22nd EGU General Assembly, Online, 4–8 May 2020. https://doi.org/10.5194/egusphere-egu2020-18649.
12. EEA. EEA-Eionet Strategy 2021–2030. Final Version. 2021. Available online: https://www.eea.europa.eu/publications/eea-eionet-strategy-2021-2030, (accessed on 10 November 2021). https://doi.org/10.2800/92395.
ISPRS Int. J. Geo-Inf. 2022, 11, 121 30 of 34
13. PWC. Copernicus Ex-Ante Benefits Assessment, Final Report. 2017. Available online: https://www.copernicus.eu/sites/default/files/2018-10/Copernicus-Ex-Ante-Final-Report_0_0.pdf (accessed on 10 November 2021).
14. PWC. Copernicus Market Report. 2019. Available online: https://www.copernicus.eu/sites/default/files/PwC_Copernicus_Market_Report_2019.pdf (accessed on 10 November 2021)..
15. PWC. Study to examine the socioeconomic impact of Copernicus in the EU: Report on the Copernicus downstream sector anduser benefits, 2016. Available online: https://www.copernicus.eu/sites/default/files/2018-10/Copernicus_Report_Downstream_Sector_October_2016_0.pdf (access on 10 November 2021).
16. EC. Directorate-General for Internal Market, Industry, Entrepreneurship and SMEs. Copernicus user uptake. Engaging withpublic authorities, the private sector and civil society: final version. 2016. Publications Office. https://doi.org/10.2873/927715.
17. Zeil, P.; Ourevitch, S.; Debien, A.; Pico, U. Copernicus User Uptake—Copernicus Relays and the Copernicus Academy. GIForum-J. Geogr. Inf. Sci. 2017, 1, 253–259. https://doi.org/10.1553/giscience2017_01_s253.
18. Apicella, L.; Quarati, A.; Gorni, S.; Molina, R.; De Martino, M. Copernicus Users Uptake: An Overview of DownstreamApplications. In Geomatics and Geospatial Technologies; Borgogno-Mondino, E.; Zamperlin, P., Eds.; Springer InternationalPublishing: Cham, Switzerland 2022; pp. 3–14.
19. Meier, J.; Mauser, W.; Hank, T.; Bach, H. Assessments on the impact of high-resolution-sensor pixel sizes for com-mon agricultural policy and smart farming services in European regions. Comput. Electron. Agric. 2020, 169, 105205.https://doi.org/10.1016/j.compag.2019.105205.
20. Lilienthal, H.; Gerighausen, H.; Schnug, E. Agricultural remote sensing information for farmers in Germany. In Proceedings ofthe 14th International Conference on Precision Agriculture, Montreal, QC, Canada, 24–27 June 2018.
21. Drost, S.; Rieke, M.; Jirka, S.; Vogt, A.; Kirstein, V.R.; Lichtenplatzerstraße, U.; Wytzisk, A. An Event-Driven Architecture Basedon Copernicus Satellite Data for Water Monitoring. In Proceedings of the AGILE 2019, Limassol, Cyprus, 17–20 June 2019.
22. Pulvirenti, L.; Squicciarino, G.; Cenci, L.; Boni, G.; Pierdicca, N.; Chini, M.; Versace, C.; Campanella, P. A surface soilmoisture mapping service at national (Italian) scale based on Sentinel-1 data. Environ. Model. Softw. 2018, 102, 13–28.https://doi.org/10.1016/j.envsoft.2017.12.022.
23. Wolanin, A.; Camps-Valls, G.; Gómez-Chova, L.; Mateo-García, G.; van der Tol, C.; Zhang, Y.; Guanter, L. Estimating crop primaryproductivity with Sentinel-2 and Landsat 8 using machine learning methods trained with radiative transfer simulations. RemoteSens. Environ. 2019, 225, 441–457. https://doi.org/10.1016/j.rse.2019.03.002.
24. Vuolo, F.; Neuwirth, M.; Immitzer, M.; Atzberger, C.; Ng, W.T. How much does multi-temporal Sentinel-2 data improve crop typeclassification? Int. J. Appl. Earth Obs. Geoinf. 2018, 72, 122–130. https://doi.org/10.1016/j.jag.2018.06.007.
25. Pelletier, C.; Valero, S.; Inglada, J.; Champion, N.; Dedieu, G. Assessing the robustness of Random Forests to mapland cover with high resolution satellite image time series over large areas. Remote Sens. Environ. 2016, 187, 156–168.https://doi.org/10.1016/j.rse.2016.10.010.
26. Borgogno-Mondino, E.; de Palma, L.; Novello, V. Investigating Sentinel 2 Multispectral Imagery Efficiency in Describing SpectralResponse of Vineyards Covered with Plastic Sheets. Agronomy 2020, 10, 1909. https://doi.org/10.3390/agronomy10121909.
27. Li, Z.; Chen, H.; White, J.C.; Wulder, M.A.; Hermosilla, T. Discriminating treed and non-treed wetlands in boreal ecosystemsusing time series Sentinel-1 data. Int. J. Appl. Earth Obs. Geoinf. 2020, 85, 1–17. https://doi.org/10.1016/j.jag.2019.102007.
28. Tavares, P.A.; Beltrão, N.E.S.; Guimarães, U.S.; Teodoro, A.C. Integration of Sentinel-1 and Sentinel-2 for Classification and LULCMapping in the Urban Area of Belém, Eastern Brazilian Amazon. Sensors 2019, 19, 1140. https://doi.org/10.3390/s19051140.
29. Ottosen, T.B.; Petch, G.; Hanson, M.; Skjøth, C.A. Tree cover mapping based on Sentinel-2 images demonstrate high thematicaccuracy in Europe. Int. J. Appl. Earth Obs. Geoinf. 2020, 84, 101947. https://doi.org/10.1016/j.jag.2019.101947.
30. Pałas, K.W.; Zawadzki, J. Sentinel-2 Imagery Processing for Tree Logging Observations on the Białowieza Forest World HeritageSite. Forests 2020, 11, 857. https://doi.org/10.3390/f11080857.
31. Fonseca, A.; Ugille, J.P.; Michez, A.; Rodríguez-González, P.M.; Duarte, G.; Ferreira, M.T.; Fernandes, M.R. Assessing theConnectivity of Riparian Forests across a Gradient of Human Disturbance: The Potential of Copernicus “Riparian Zones” in TwoHydroregions. Forests 2021, 12, 674. https://doi.org/10.3390/f12060674.
32. Masson, V.; Heldens, W.; Bocher, E.; Bonhomme, M.; Bucher, B.; Burmeister, C.; de Munck, C.; Esch, T.; Hidalgo, J.; Kanani-Sühring,F.; et al. City-descriptive input data for urban climate models: Model requirements, data sources and challenges. Urban Climate2020, 31, 100536. https://doi.org/10.1016/j.uclim.2019.100536.
33. Zhou, D.; Xiao, J.; Bonafoni, S.; Berger, C.; Deilami, K.; Zhou, Y.; Frolking, S.; Yao, R.; Qiao, Z.; Sobrino, J.A. Satel-lite Remote Sensing of Surface Urban Heat Islands: Progress, Challenges, and Perspectives. Remote Sens. 2019, 11, 48.https://doi.org/10.3390/rs11010048.
34. Shumilo, L.; Kussul, N.; Shelestov, A.; Korsunska, Y.; Yailymov, B. Sentinel-3 Urban Heat Island Monitoring and analysis forKyiv Based on Vector Data. In Proceedings of the 2019 10th International Conference on Dependable Systems, Services andTechnologies (DESSERT), Leeds, UK, 2–7 June 2019; pp. 131–135. https://doi.org/10.1109/DESSERT.2019.8770042.
35. Sobrino, J.A.; Irakulis, I. A methodology for comparing the surface urban heat island in selected urban agglomerations aroundthe world from Sentinel-3 SLSTR data. Remote Sens. 2020, 12, 2052. https://doi.org/10.3390/rs12122052.
36. Hidalgo García, D.; Arco Díaz, J. Modeling of the Urban Heat Island on local climatic zones of a city using Sentinel 3 images:Urban determining factors. Urban Clim. 2021, 37, 100840. https://doi.org/10.1016/j.uclim.2021.100840.
ISPRS Int. J. Geo-Inf. 2022, 11, 121 31 of 34
37. Lefebvre, A.; Sannier, C.; Corpetti, T. Monitoring urban areas with Sentinel-2A data: Application to the update of the Copernicushigh resolution layer imperviousness degree. Remote Sens. 2016, 8, 606. https://doi.org/10.3390/rs8070606.
38. Shrestha, B.; Stephen, H.; Ahmad, S. Impervious Surfaces Mapping at City Scale by Fusion of Radar and Optical Data through aRandom Forest Classifier. Remote Sens. 2021, 13, 40. https://doi.org/10.3390/rs13153040.
39. Staneva, J.; Behrens, A.; Gayer, G.; Aouf, L. Synergy between CMEMS products and newly available data from SENTINEL. J.Oper. Oceanogr. 2019, 12, S1–S123. https://doi.org/10.1080/1755876X.2019.1633075.
40. Bensoussan, N.; Cebrian, E.; Dominici, J.M.; Kersting, D.K.; Kipson, S.; Kizilkaya, Z.; Ocana, O.; Peirache, M.; Zuberer, F.; Ledoux,J.B.; et al. Using CMEMS and the Mediterranean Marine Protected Areas sentinel network to track ocean warming effects incoastal areas. J. Oper. Oceanogr. 2019, 12, S1–S123. http://hdl.handle.net/10261/201832.
41. Van der Zande, D.; Eleveld, M.; Lavigne, H.; Gohin, F.; Pardo, S.; Tilstone, G.; Blauw, A.; Markager, S.; Enserink, L. JointMonitoring Programme of the EUtrophication of the NOrthSea with SATellite data user case. J. Oper. Oceanogr. 2019, 12, S56–S61.
42. Poursanidis, D.; Traganos, D.; Reinartz, P.; Chrysoulakis, N. On the use of Sentinel-2 for coastal habitat mapping and satellite-derived bathymetry estimation using downscaled coastal aerosol band. Int. J. Appl. Earth Obs. Geoinf. 2019, 80, 58–70.https://doi.org/10.1016/j.jag.2019.03.012.
43. Minnett, P.; Alvera-Azcárate, A.; Chin, T.; Corlett, G.; Gentemann, C.; Karagali, I.; Li, X.; Marsouin, A.; Marullo, S.; Maturi,E.; et al. Half a century of satellite remote sensing of sea-surface temperature. Remote Sens. Environ. 2019, 233, 111366.https://doi.org/10.1016/j.rse.2019.111366.
44. Morin, S.; Abegg, B.; Demiroglu, O.C.; Pons, M.; Weber, F.; Hoppler, A.A.; Francois, H.; George, E.; Soubeyroux, J.M.; Samacoïts,R.; et al. The mountain component of the C3S-Sectoral Information Service European Tourism: Towards Pan-European Analysisand Projections of Natural and Managed Snow Conditions. In Proceedings of the International Snow Science Workshop,Innsbruck, Austria, 7–12 October 2018. https://doi.org/10.1016/j.cliser.2021.100215.
45. Alfadda, A.; Rahman, S.; Pipattanasomporn, M. Solar irradiance forecast using aerosols measurements: A data driven approach.Sol. Energy 2018, 170, 924–939. https://doi.org/10.1016/j.solener.2018.05.089.
46. Huijnen, V.; Wooster, M.J.; Kaiser, J.W.; Gaveau, D.L.; Flemming, J.; Parrington, M.; Inness, A.; Murdiyarso, D.; Main, B.;Van Weele, M. Fire carbon emissions over maritime southeast Asia in 2015 largest since 1997. Sci. Rep. 2016, 6, 26886.https://doi.org/10.1038/srep26886.
47. Baklanov, A.; Grimmond, C.S.B.; Carlson, D.; Terblanche, D.; Tang, X.; Bouchet, V.; Lee, B.; Langendijk, G.; Kolli, R.K.; Hovsepyan,A. From urban meteorology, climate and environment research to integrated city services. Urban Clim. 2018, 23, 330–341.https://doi.org/10.1016/j.uclim.2017.05.004.
48. Tchepel, O.; Monteiro, A.; Dias, D.; Gama, C.; Pina, N.; Rodrigues, J.; Ferreira, M.; Miranda, A. Urban aerosol assessment andforecast: Coimbra case study. Atmos. Pollut. Res. 2020, 11, 1155–1164. https://doi.org/10.1016/j.apr.2020.04.006.
49. de Blas, M.; Ibáñez, P.; García, J.A.; Gómez, M.C.; Navazo, M.; Alonso, L.; Durana, N.; Iza, J.; Gangoiti, G.; de Cámara, E.S.Summertime high resolution variability of atmospheric formaldehyde and non-methane volatile organic compounds in a ruralbackground area. Sci. Total Environ. 2019, 647, 862 – 877. https://doi.org/10.1016/j.scitotenv.2018.07.411.
50. Eskes, H.; Huijnen, V.; Arola, A.; Benedictow, A.; Blechschmidt, A.M.; Botek, E.; Boucher, O.; Bouarar, I.; Chabrillat, S.; Cuevas,E.; et al. Validation of reactive gases and aerosols in the MACC global analysis and forecast system. Geosci. Model Dev. 2015,8, 3523–3543. https://doi.org/10.5194/gmd-8-3523-2015.
51. Handwerger, A.L.; Huang, M.H.; Fielding, E.J.; Booth, A.M.; Bürgmann, R. A shift from drought to extreme rainfall drives astable landslide to catastrophic failure. Sci. Rep. 2019, 9, 1–12. https://doi.org/10.1038/s41598-018-38300-0.
52. Lesko, M.; Papco, J.; Bakon, M.; Liscak, P. Monitoring of natural hazards in Slovakia by using of satellite radar interferometry.Procedia Comput. Sci. 2018, 138, 374–381. https://doi.org/doi.org/10.1016/j.procs.2018.10.053.
53. Darvishi, M.; Schlögel, R.; Kofler, C.; Cuozzo, G.; Rutzinger, M.; Zieher, T.; Toschi, I.; Remondino, F.; Mejia-Aguilar, A.; Thiebes,B.; et al. Sentinel-1 and ground-based sensors for continuous monitoring of the Corvara Landslide (South Tyrol, Italy). RemoteSens. 2018, 10, 1781. https://doi.org/10.3390/rs10111781.
54. Rouyet, L.; Lauknes, T.R.; Christiansen, H.H.; Strand, S.M.; Larsen, Y. Seasonal dynamics of a permafrost landscape, Adventdalen,Svalbard, investigated by InSAR. Remote Sens. Environ. 2019, 231, 111236. https://doi.org/10.1016/j.rse.2019.111236.
55. Carlà, T.; Intrieri, E.; Raspini, F.; Bardi, F.; Farina, P.; Ferretti, A.; Colombo, D.; Novali, F.; Casagli, N. Perspectives on the predictionof catastrophic slope failures from satellite InSAR. Sci. Rep. 2019, 9, 1–9. https://doi.org/10.1038/s41598-019-50792-y.
56. DeVries, B.; Huang, C.; Armston, J.; Huang, W.; Jones, J.W.; Lang, M.W. Rapid and robust monitoring of floodevents using Sentinel-1 and Landsat data on the Google Earth Engine. Remote Sens. Environ. 2020, 240, 111664.https://doi.org/10.1016/j.rse.2020.111664.
57. Vitolo, C.; Napoli, C.D.; Giuseppe, F.D.; Cloke, H.L.; Pappenberger, F. Mapping combined wildfire and heat stress hazards toimprove evidence-based decision making. Environ. Int. 2019, 127, 21–34. https://doi.org/10.1016/j.envint.2019.03.008.
58. Alvan Romero, N.; Cigna, F.; Tapete, D. ERS-1/2 and Sentinel-1 SAR Data Mining for Flood Hazard and Risk Assessment inLima, Peru. Appl. Sci. 2020, 10, 6598. https://doi.org/10.3390/app10186598.
59. Doxani, G.; Siachalou, S.; Mitraka, Z.; Patias, P. Decision making on disaster management in agriculture with Sentinel applications.Int. Arch. Photogramm. Remote Sens. Spat. Inf. Sci. 2019, 42, 121–126. https://doi.org/10.5194/isprs-archives-XLII-3-W8-121-2019.
60. Caballero, I.; Ruiz, J.; Navarro, G. Sentinel-2 Satellites Provide Near-Real Time Evaluation of Catastrophic Floods in the WestMediterranean. Water 2019, 11, 2499. https://doi.org/10.3390/w11122499.
ISPRS Int. J. Geo-Inf. 2022, 11, 121 32 of 34
61. Rossi, C.; Acerbo, F.; Ylinen, K.; Juga, I.; Nurmi, P.; Bosca, A.; Tarasconi, F.; Cristoforetti, M.; Alikadic, A. Early detection and infor-mation extraction for weather-induced floods using social media streams. Int. J. Disaster Risk Reduct. 2018, 30, 145–157. Commu-nicating High Impact Weather: Improving warnings and decision making processes, https://doi.org/10.1016/j.ijdrr.2018.03.002.
62. da Costa, R.T.; Manfreda, S.; Luzzi, V.; Samela, C.; Mazzoli, P.; Castellarin, A.; Bagli, S. A web application for hydrogeomorphicflood hazard mapping. Environ. Model. Softw. 2019, 118, 172–186. https://doi.org/10.31223/osf.io/q5tjc.
63. Filipponi, F. Sentinel-1 GRD Preprocessing Workflow. Proceedings 2019, 18, 11. https://doi.org/10.3390/ECRS-3-06201.64. Belgiu, M.; Csillik, O. Sentinel-2 cropland mapping using pixel-based and object-based time-weighted dynamic time warping
analysis. Remote Sens. Environ. 2018, 204, 509–523. https://doi.org/10.1016/j.rse.2017.10.005.65. Giuliani, G.; Mazzetti, P.; Santoro, M.; Nativi, S.; Van Bemmelen, J.; Colangeli, G.; Lehmann, A. Knowledge generation using
satellite earth observations to support sustainable development goals (SDG): A use case on Land degradation. Int. J. Appl. EarthObs. Geoinf. 2020, 88, 102068. https://doi.org/10.1016/j.jag.2020.102068.
66. Wasko, C.; Sharma, A. Global assessment of flood and storm extremes with increased temperatures. Sci. Rep. 2017, 7, 1–8.https://doi.org/10.1038/s41598-017-08481-1.
67. Peruccacci, S.; Brunetti, M.T.; Gariano, S.L.; Melillo, M.; Rossi, M.; Guzzetti, F. Rainfall thresholds for possible landslide occurrencein Italy. Geomorphology 2017, 290, 39–57. https://doi.org/10.1016/j.geomorph.2017.03.031.
68. Brandolini, P.; Cevasco, A.; Firpo, M.; Robbiano, A.; Sacchini, A. Geo-hydrological risk management for civil protection purposesin the urban area of Genoa (Liguria, NW Italy). Nat. Hazards Earth Syst. Sci. 2012, 12, 943–959. https://doi.org/10.5194/nhess-12-943-2012.
69. Faccini, F.; Robbiano, A.; Sacchini, A. Geomorphic hazards and intense rainfall: The case study of the Recco Stream catchment(Eastern Liguria, Italy). Nat. Hazards Earth Syst. Sci. 2012, 12, 893–903. https://doi.org/10.5194/nhess-12-893-2012.
70. G. Petaccia, C.G. Lai, C.M.; Natale, L. The collapse of the Sella Zerbino gravity dam. Eng. Geol. 2016, 211, 39–49.https://doi.org/10.1016/j.enggeo.2016.06.024.
71. Petaccia, G.; Natale, L. 1935 Sella Zerbino Dam-Break Case Revisited: A New Hydrologic and Hydraulic Analysis. J. Hydraul.Eng. 2020, 146, 05020005. https://doi.org/10.1061/(ASCE)HY.1943-7900.0001760.
72. Ciabatta, L.; Brocca, L.; Massari, C.; Moramarco, T.; Puca, S.; Rinollo, A.; Gabellani, S.; Wagner, W. Integration of Satellite SoilMoisture and Rainfall Observations over the Italian Territory. J. Hydrometeorol. 2015, 16, 1341–1355. https://doi.org/10.1175/JHM-D-14-0108.1.
73. Duda, R.; Hart, P. Pattern Classification and Scene Analysis; Wiley: New York, NY, USA, 1973; Volume 3. https://doi.org/10.2307/2286028.
74. Büttner, G.; Feranec, J.; Jaffrain, G.; Mari, L.; Maucha, G.; Soukup, T. The CORINE land cover 2000 project. EARSeL eProceedings2004, 3, 331–346.
75. Rosim, S.; Oliveira, J.d.F.; Jardim, A.C.; Namikawa, L.M.; Rennó, C.D. TerraHidro: A distributed hydrology modelling systemwith high quality drainage extraction. In Proceedings of the International Conference on Advanced Geographic InformationSystems, Applications, and Services, Nice, France, 1 March 2013; Volume 5, pp. 161–167.
76. Rosim, S.; Namikawa, L.M.; de Freitas Oliveira, J.R.; De Martino, M.; Quarati, A. Workflow provenance metadata to enhancereuse of south america drainage datasets. In Proceedings of the 2018 International Conference on eDemocracy & eGovernment(ICEDEG), Ambato, Ecuador, 4–6 April 2018; pp. 16–23.
77. Rennó, C.D.; Nobre, A.D.; Cuartas, L.A.; Soares, J.V.; Hodnett, M.G.; Tomasella, J. HAND, a new terrain descriptor us-ing SRTM-DEM: Mapping terra-firme rainforest environments in Amazonia. Remote Sens. Environ. 2008, 112, 3469 – 3481.https://doi.org/10.1016/j.rse.2008.03.018.
78. De Martino, M.; Rosim, S.; Quarati, A. Hydrographic Datasets in Open Government Data Portals: Mitigation of ReusabilityIssues Through Provenance Documentation. In MTSR International Conference 2019; Springer Nature Switzerland AG: Cham,Switzerland, 2019; Volume 1057, CCIS, pp. 307–319. https://doi.org/10.1007/978-3-030-36599-8_27.
79. De Martino, M.; Quarati, A.; Rosim, S.; Namikawa, L.M. Documenting flooding areas calculation: A PROV approach. Int. J.Metadata, Semant. Ontol. 2021, 15, 50–59. https://doi.org/10.1504/IJMSO.2021.117106.
80. Lobitz, B.; Johnson, L.; Hlavka, C.; Armstrong, R.; Bell, C. Grapevine Remote Sensing Analysis of Phylloxera Early Stress (GRAPES):Remote Sensing Analysis Summary; NASA Ames Research Center: Mountain View, CA, USA, 1997; pp. 1–36.
81. Huang, S.; Tang, L.; Hupy, J.P.; Wang, Y.; Shao, G. A commentary review on the use of normalized difference vegetation index(NDVI) in the era of popular remote sensing. J. For. Res. 2021, 32, 1–6. https://doi.org/10.1007/s11676-020-01155-1.
82. Segarra, J.; Buchaillot, M.L.; Araus, J.L.; Kefauver, S.C. Remote Sensing for Precision Agriculture: Sentinel-2 Improved Featuresand Applications. Agronomy 2020, 10, 641. https://doi.org/10.3390/agronomy10050641.
83. Bannari, A.; Morin, D.; Bonn, F.; Huete, A.R. A review of vegetation indices. Remote Sens. Rev. 1995, 13, 95–120.https://doi.org/10.1080/02757259509532298.
84. Meyers, J.M.; Dokoozlian, N.; Ryan, C.; Bioni, C.; Vanden Heuvel, J.E. A New, Satellite NDVI-Based Sampling Protocol for GrapeMaturation Monitoring. Remote Sens. 2020, 12. https://doi.org/10.3390/rs12071159.
85. Churchill, A.C.; Zhang, H.; Fuller, K.J.; Amiji, B.; Anderson, I.C.; Barton, C.V.M.; Carrillo, Y.; Catunda, K.L.M.; Chandregowda,M.H.; Igwenagu, C.; et al. Pastures and Climate Extremes: Impacts of warming and drought on the productivity and resilience ofkey pasture species in a field experiment. bioRxiv 2020. https://doi.org/10.1101/2020.12.21.423155.

ISPRS Int. J. Geo-Inf. 2022, 11, 121 33 of 34
86. Fernando, G.; Víctor, C. Pasture Monitoring Applying Normalized Difference Vegetation Index (NDVI) Time Series withSentinel-2 and Landsat 8 Images, to Improve Milk Production at Santa Mónica Farm, Imbabura, Ecuador. In ComputationalScience and Its Applications–ICCSA 2020; Gervasi, O.; Murgante, B.; Misra, S.; Garau, C.; Blecic, I.; Taniar, D.; Apduhan, B.O.;Rocha, A.M.A.C.; Tarantino, E.; Torre, C.M.; et al., Eds.; Springer International Publishing: Cham, Switzerland, 2020; pp. 560–575.https://doi.org/10.1007/978-3-030-58817-5_41.
87. Clarke, D.; Litherland, A.; Mata, G.; Burling-Claridge, R. Pasture monitoring from space. In Proceedings of the South IslandDairy Event (SIDE) Conference, Invercargill, New Zealand, 26–28 June 2006; pp. 108–123.
88. Oke, T.R. The energetic basis of the urban heat island. Q. J. R. Meteorol. Soc. 1982, 108, 1–24. https://doi.org/10.1002/qj.497108455020.89. Schwarz, N.; Schlink, U.; Franck, U.; Grossmann, K. Relationship of land surface and air temperatures and its implications
for quantifying urban heat island indicators—An application for the city of Leipzig (Germany). Ecol. Indic. 2012, 18, 693–704.https://doi.org/10.1016/j.ecolind.2012.01.001.
90. Nichol, J.E.; Fung, W.Y.; se Lam, K.; Wong, M.S. Urban heat island diagnosis using ASTER satellite images and ‘in situ’ airtemperature. Atmos. Res. 2009, 94, 276–284. https://doi.org/10.1016/j.atmosres.2009.06.011.
91. Dash, P.; Göttsche, F.M.; Olesen, F.S.; Fischer, H. Land surface temperature and emissivity estimation from passive sensor data:Theory and practice-current trends. Int. J. Remote Sens. 2002, 23, 2563–2594. https://doi.org/10.1080/01431160110115041.
92. Clay, R.; Guan, H.; Wild, N.; Bennett, J.; Vinodkumar.; Ewenz, C. Urban Heat Island traverses in the City of Adelaide, SouthAustralia. Urban Clim. 2016, 17, 89–101. https://doi.org/10.1016/j.uclim.2016.06.001.
93. Ravanelli, R.; Nascetti, A.; Cirigliano, R.V.; Di Rico, C.; Leuzzi, G.; Monti, P.; Crespi, M. Monitoring the Impact of Land CoverChange on Surface Urban Heat Island through Google Earth Engine: Proposal of a Global Methodology, First Applications andProblems. Remote Sens. 2018, 10. https://doi.org/10.3390/rs10091488.
94. Tran, H.; Uchihama, D.; Ochi, S.; Yasuoka, Y. Assessment with satellite data of the urban heat island effects in Asian mega cities.Int. J. Appl. Earth Obs. Geoinf. 2006, 8, 34–48. https://doi.org/10.1016/j.jag.2005.05.003.
95. Zhao, X.; Yang, S.; Shen, S.; Hai, Y.; Fang, Y. Analyzing the relationship between urban heat island and land use/cover changesin Beijing using remote sensing images. In Remote Sensing and Modeling of Ecosystems for Sustainability VI; Gao, W.; Jackson,T.J., Eds. International Society for Optics and Photonics, SPIE: San Diego, California, USA, 2009; Volume 7454, pp. 320–329.https://doi.org/10.1117/12.825492.
96. Voogt, J.; Oke, T. Thermal remote sensing of urban climates. Remote Sens. Environ. 2003, 86, 370–384. https://doi.org/10.1016/S0034-4257(03)00079-8.
97. Faccini, F.; Luino, F.; Paliaga, G.; Sacchini, A.; Turconi, L.; de Jong, C. Role of rainfall intensity and urban sprawl in the 2014 flashflood in Genoa City Bisagno catchment (Liguria, Italy). Appl. Geogr. 2018, 98, 224–241. https://doi.org/10.1016/j.apgeog.2018.07.022.
98. Li, H.; Zhou, Y.; Li, X.; Meng, L.; Wang, X.; Wu, S.; Sodoudi, S. A new method to quantify surface urban heat island intensity. Sci.Total Environ. 2018, 624, 262–272. https://doi.org/10.1016/j.scitotenv.2017.11.360.
99. Donlon, C.; Berruti, B.; Buongiorno, A.; Ferreira, M.H.; Féménias, P.; Frerick, J.; Goryl, P.; Klein, U.; Laur, H.; Mavrocordatos, C.;et al. The Global Monitoring for Environment and Security (GMES) Sentinel-3 mission. Remote Sens. Environ. 2012, 120, 37–57.https://doi.org/10.1016/j.rse.2011.07.024.
100. Apicella, L.; Quarati, A.; De Martino, M. Analysing the Surface Urban Heat Island Effect with Copernicus Data. In Proceedingsof the 10th International Conference, Electronic Government and the Information SystemsPerspective (EGOVIS), Virtual, Event,27–30 September 2021; pp. 61–72. https://doi.org/10.1007/978-3-030-86611-2.
101. Lu, L.; Weng, Q.; Xiao, D.; Guo, H.; Li, Q.; Hui, W. Spatiotemporal Variation of Surface Urban Heat Islands in Relationto Land Cover Composition and Configuration: A Multi-Scale Case Study of Xi’an, China. Remote Sens. 2020, 12, 2713.https://doi.org/10.3390/rs12172713.
102. Ponomarenko, M.R.; Zelentsov, V.A. Forest monitoring and analysis based on Earth observation data services. IOP Conf. Ser.Earth Environ. Sci. 2021, 806, 012003. https://doi.org/10.1088/1755-1315/806/1/012003.
103. Wallace, J.M.; Hobbs, P.V. Atmospheric Science: An Introductory Survey; Elsevier: San Diego, CA, USA, 2006; Volume 92.104. Munoz-Mari, J.; Bruzzone, L.; Camps-Valls, G. A Support Vector Domain Description Approach to Supervised Classification of
Remote Sensing Images. IEEE Trans. Geosci. Remote Sens. 2007, 45, 2683–2692. https://doi.org/10.1109/TGRS.2007.897425.105. Gomarasca, M.A.; Tornato, A.; Spizzichino, D.; Valentini, E.; Taramelli, A.; Satalino, G.; Vincini, M.; Boschetti, M.; Colombo, R.;
Rossi, L.; et al. Sentinel for Applications in Agriculture. Int. Arch. Photogramm. Remote Sens. Spat. Inf. Sci. 2019, XLII-3/W6, 91–98.https://doi.org/10.5194/isprs-archives-XLII-3-W6-91-2019.
106. Cole, B.; Smith, G.; Balzter, H. Acceleration and fragmentation of CORINE land cover changes in the United Kingdomfrom 2006–2012 detected by Copernicus IMAGE2012 satellite data. Int. J. Appl. Earth Obs. Geoinf. 2018, 73, 107–122.https://doi.org/10.1016/j.jag.2018.06.003.
107. Marco, E.; Herrmann, D.; Schwab, K.; Schweitzer, K.; Almengor, R.; Berndt, F.; Sommer, C.; Probeck, M. IMPROVEMENT OFEXISTING AND DEVELOPMENT OF FUTURE COPERNICUS LAND MONITORING PRODUCTS – THE ECOLASS PROJECT.ISPRS-Int. Arch. Photogramm. Remote Sens. Spat. Inf. Sci. 2019, XLII-2/W16, 201–208. https://doi.org/10.5194/isprs-archives-XLII-2-W16-201-2019.
108. Piedelobo, L.; Taramelli, A.; Schiavon, E.; Valentini, E.; Molina, J.L.; Xuan, A.; González-Aguilera, D. Assessment of greeninfrastructure in Riparian zones using copernicus programme. Remote Sens. 2019, 11, 2967. https://doi.org/10.3390/rs11242967.
ISPRS Int. J. Geo-Inf. 2022, 11, 121 34 of 34
109. Verron, J.; Bonnefond, P.; Andersen, O.; Ardhuin, F.; Bergé-Nguyen, M.; Bhowmick, S.; Blumstein, D.; Boy, F.; Brodeau, L.;Crétaux, J.F.; et al. The SARAL/AltiKa mission: A step forward to the future of altimetry. Adv. Space Res. 2020, 68, 808–828.https://doi.org/10.1016/j.asr.2020.01.030.
110. Dong, J.; Metternicht, G.; Hostert, P.; Fensholt, R.; Chowdhury, R.R. Remote sensing and geospatial technologies insupport of a normative land system science: Status and prospects. Curr. Opin. Environ. Sustain. 2019, 38, 44–52.https://doi.org/10.1016/j.cosust.2019.05.003.
111. van Hateren, T.; Sutanto, S.; Van Lanen, H. Evaluating skill and robustness of seasonal meteorological and hydrological droughtforecasts at the catchment scale - Case Catalonia (Spain). Environ. Int. 2019, 133, 105206. https://doi.org/10.1016/j.envint.2019.105206.
112. García-Haro, F.J.; Campos-Taberner, M.; Muñoz-Marí, J.; Laparra, V.; Camacho, F.; Sánchez-Zapero, J.; Camps-Valls, G. Derivationof global vegetation biophysical parameters from EUMETSAT Polar System. ISPRS J. Photogramm. Remote Sens. 2018, 139, 57–74.https://doi.org/10.1016/j.isprsjprs.2018.03.005.
113. Adame, J.; Notario, A.; Cuevas, C.; Lozano, A.; Yela, M.; Saiz-Lopez, A. Recent increase in NO2 levels in the southeast of theIberian Peninsula. Sci. Total Environ. 2019, 693, 133587. https://doi.org/10.1016/j.scitotenv.2019.133587.
114. Di Gennaro, S.F.; Dainelli, R.; Palliotti, A.; Toscano, P.; Matese, A. Sentinel-2 Validation for Spatial Variability Assessment inOverhead Trellis System Viticulture Versus UAV and Agronomic Data. Remote Sens. 2019, 11. https://doi.org/10.3390/rs11212573.
115. Huang, B.; Wang, J.; Song, H.; Fu, D.; Wong, K. Generating High Spatiotemporal Resolution Land Surface Temperature for UrbanHeat Island Monitoring. IEEE Geosci. Remote Sens. Lett. 2013, 10, 1011–1015. https://doi.org/10.1109/LGRS.2012.2227930.
116. Bonafoni, S. Downscaling of Landsat and MODIS Land Surface Temperature Over the Heterogeneous Urban Area of Milan. IEEEJ. Sel. Top. Appl. Earth Obs. Remote Sens. 2016, 9, 2019–2027. https://doi.org/10.1109/JSTARS.2016.2514367.
117. Stathopoulou, M.; Cartalis, C. Downscaling AVHRR land surface temperatures for improved surface urban heat island intensityestimation. Remote Sens. Environ. 2009, 113, 2592–2605. https://doi.org/10.1016/j.rse.2009.07.017.
118. Niell, A. Preliminary evaluation of atmospheric mapping functions based on numerical weather models. Phys. Chem. Earth PartA Solid Earth Geod. 2001, 26, 475–480. https://doi.org/10.1016/S1464-1895(01)00087-4.
119. J.M. Johnson, D. Munasinghe, D.E.; Cohen, A. An integrated evaluation of the National Water Model (NWM)–HeightAbove Nearest Drainage (HAND) flood mapping methodology. Nat. Hazards Earth Syst. Sci. 2019, 19, 2405–2420.https://doi.org/10.5194/nhess-19-2405-2019.
120. Jamali, A. Land use land cover mapping using advanced machine learning classifiers: A case study of Shiraz city, Iran. Earth Sci.Inform. 2020, 13, 1015–1030. https://doi.org/10.1007/s12145-020-00475-4.
121. Apicella, L.; Quarati, A.; Rosim, S.; De Martino, M. User Uptake of Copernicus Resources: A Use Case for Land Monitoring. InProceedings of the 2021 IEEE International Geoscience and Remote Sensing Symposium IGARSS, Brussels, Belgium, 11–16 July2021; pp. 5688–5691.https://doi.org/10.1109/IGARSS47720.2021.9554087.
122. Quarati, A.; D’Agostino, D.; Galizia, A.; Mangini, M.; Clematis, A. Delivering cloud services with QoS requirements: Anopportunity for ICT SMEs. In International Conference on Grid Economics and Business Models; Springer, 2012, pp. 197–211.https://doi.org/10.1007/978-3-642-35194-5_15.
123. Quarati, A.; Danovaro, E.; Galizia, A.; Clematis, A.; D’Agostino, D.; Parodi, A. Scheduling strategies for enabling meteorologicalsimulation on hybrid clouds. J. Comput. Appl. Math. 2015, 273, 438–451. https://doi.org/10.1016/j.cam.2014.05.001.
124. Yao, X.; Li, G.; Xia, J.; Ben, J.; Cao, Q.; Zhao, L.; Ma, Y.; Zhang, L.; Zhu, D. Enabling the Big Earth Observation Data via CloudComputing and DGGS: Opportunities and Challenges. Remote Sens. 2020, 12. https://doi.org/10.3390/rs12010062.
125. Coetzee, S.; Ivánová, I.; Mitasova, H.; Brovelli, M. Open geospatial software and data: A review of the current state and aperspective into the future. ISPRS Int. J. Geo-Inf. 2020, 9.
126. Wilkinson, M.D.; Dumontier, M.; Aalbersberg, I.J.; Appleton, G.; Axton, M.; Baak, A.; Blomberg, N.; Boiten, J.W.; da Silva Santos,L.B.; Bourne, P.E.; et al. The FAIR Guiding Principles for scientific data management and stewardship. Sci. Data 2016, 3, 160018.https://doi.org/https://doi.org/10.1038/sdata.2016.18.
127. Albertoni, R.; De Martino, M.; Quarati, A. Documenting Context-Based Quality Assessment of Controlled Vocabularies. IEEETrans. Emerg. Top. Comput. 2021, 9, 144–160. https://doi.org/10.1109/TETC.2018.2865094.
128. Wilkinson, M.D.; Dumontier, M.; Sansone, S.A.; da Silva Santos, L.O.B.; Prieto, M.; Batista, D.; McQuilton, P.; Kuhn, T.; Rocca-Serra,P.; Crosas, M.; et al. Evaluating FAIR maturity through a scalable, automated, community-governed framework. Sci. Data 2019,6, 1–12.