Applications of Integration
42
Applications of Integration 6 In this chapter we explore some of the applications of the definite integral by using it to compute areas between curves, volumes of solids, and the work done by a varying force. The common theme is the following general method, which is similar to the one we used to find areas under curves: We break up a quantity into a large number of small parts. We next approximate each small part by a quantity of the form and thus approximate by a Riemann sum. Then we take the limit and express as an integral. Finally we evaluate the integral using the Fundamental Theorem of Calculus or the Mid- point Rule. Q Q f x i * x Q 421 © Ziga Camernik / Shutterstock The Great Pyramid of King Khufu was built in Egypt from 2580 BC to 2560 BC and was the tallest man-made structure in the world for more than 3800 years. The techniques of this chapter will enable us to estimate the total work done in building this pyramid and therefore to make an educated guess as to how many laborers were needed to construct it. Copyright 2010 Cengage Learning. All Rights Reserved. May not be copied, scanned, or duplicated, in whole or in part. Due to electronic rights, some third party content may be suppressed from the eBook and/or eChapter(s). Editorial review has deemed that any suppressed content does not materially affect the overall learning experience. Cengage Learning reserves the right to remove additional content at any time if subsequent rights restrictions require it.
-
Upload
khangminh22 -
Category
Documents
-
view
1 -
download
0
Transcript of Applications of Integration

Applications of Integration6
In this chapter we explore some of the applications of the definite integral by using it to compute areasbetween curves, volumes of solids, and the work done by a varying force. The common theme is thefollowing general method, which is similar to the one we used to find areas under curves: We break up a quantity into a large number of small parts. We next approximate each small part by a quantity of the form and thus approximate by a Riemann sum. Then we take the limit and express as an integral. Finally we evaluate the integral using the Fundamental Theorem of Calculus or the Mid-point Rule.
QQf �xi*� �xQ
421
© Ziga Camernik / Shutterstock
The Great Pyramid of King Khufu was built in Egypt from 2580 BC to 2560 BC and was the tallestman-made structure in the world for more than 3800 years. The techniques of this chapter willenable us to estimate the total work done in building this pyramid and therefore to make aneducated guess as to how many laborers were needed to construct it.
97909_06_ch06_p421-431.qk_97909_06_ch06_p421-431 9/21/10 3:48 PM Page 421
Copyright 2010 Cengage Learning. All Rights Reserved. May not be copied, scanned, or duplicated, in whole or in part. Due to electronic rights, some third party content may be suppressed from the eBook and/or eChapter(s).Editorial review has deemed that any suppressed content does not materially affect the overall learning experience. Cengage Learning reserves the right to remove additional content at any time if subsequent rights restrictions require it.

422 CHAPTER 6 APPLICATIONS OF INTEGRATION
In Chapter 5 we defined and calculated areas of regions that lie under the graphs of functions. Here we use integrals to find areas of regions that lie between the graphs of twofunctions.
Consider the region that lies between two curves and and be-tween the vertical lines and , where and are continuous functions and
for all in . (See Figure 1.)Just as we did for areas under curves in Section 5.1, we divide S into n strips of equal
width and then we approximate the ith strip by a rectangle with base and height. (See Figure 2. If we like, we could take all of the sample points to be right
endpoints, in which case .) The Riemann sum
is therefore an approximation to what we intuitively think of as the area of S.
This approximation appears to become better and better as . Therefore we definethe area of the region as the limiting value of the sum of the areas of these approxi-mating rectangles.
We recognize the limit in as the definite integral of . Therefore we have the fol-lowing formula for area.
The area A of the region bounded by the curves , and thelines , , where and are continuous and for all in , is
Notice that in the special case where , is the region under the graph of and our general definition of area reduces to our previous definition (Definition 2 in Section 5.1).
(a) Typical rectangle
x
y
b0 a
f(x i*)f(x i*)-g(x i*)
_g(x i*)x i
*Îx
(b) Approximating rectangles
x
y
b0 a
FIGURE 2
A � yb
a� f �x� � t�x�� dx
�a, b�xf �x� � t�x�tfx � bx � ay � f �x�, y � t�x�2
f � t
A � limn l �
�n
i�1� f �xi*� � t�xi*�� �x1
SAn l �
�n
i�1� f �xi*� � t�xi*�� �x
xi* � xi
f �xi*� � t�xi*��x
�a, b�xf �x� � t�x�tfx � bx � a
y � t�x�y � f �x�S
1
fSt�x� � 01
6.1 Areas Between Curves
0
y=©
y=ƒ
S
FIGURE 1 S=s(x, y) | a¯x¯b, ©¯y¯ƒd
x
y
ba
97909_06_ch06_p421-431.qk_97909_06_ch06_p421-431 9/21/10 3:49 PM Page 422
Copyright 2010 Cengage Learning. All Rights Reserved. May not be copied, scanned, or duplicated, in whole or in part. Due to electronic rights, some third party content may be suppressed from the eBook and/or eChapter(s).Editorial review has deemed that any suppressed content does not materially affect the overall learning experience. Cengage Learning reserves the right to remove additional content at any time if subsequent rights restrictions require it.

SECTION 6.1 AREAS BETWEEN CURVES 423
In the case where both and are positive, you can see from Figure 3 why is true:
Find the area of the region bounded above by , bounded below by, and bounded on the sides by and .
SOLUTION The region is shown in Figure 4. The upper boundary curve is and thelower boundary curve is y � x. So we use the area formula with , ,
and :
In Figure 4 we drew a typical approximating rectangle with width as a reminder ofthe procedure by which the area is defined in . In general, when we set up an integral foran area, it’s helpful to sketch the region to identify the top curve , the bottom curve ,and a typical approximating rectangle as in Figure 5. Then the area of a typical rectangle is
and the equation
summarizes the procedure of adding (in a limiting sense) the areas of all the typical rectangles.
Notice that in Figure 5 the left-hand boundary reduces to a point, whereas in Figure 3 theright-hand boundary reduces to a point. In the next example both of the side boundariesreduce to a point, so the first step is to find a and b.
Find the area of the region enclosed by the parabolas and.
SOLUTION We first find the points of intersection of the parabolas by solving their equa-tions simultaneously. This gives , or . Thus ,so or 1. The points of intersection are and .
We see from Figure 6 that the top and bottom boundaries are
and
The area of a typical rectangle is
and the region lies between x � 0 and x � 1. So the total area is
EXAMPLE 1
EXAMPLE 2v
� 2� x 2
2�
x 3
3 �0
1
� 2� 1
2�
1
3� �1
3
A � y1
0�2x � 2x 2 � dx � 2 y
1
0�x � x 2 � dx
�yT � yB� �x � �2x � x 2 � x 2 � �x
yB � x 2yT � 2x � x 2
�1, 1��0, 0�x � 02x�x � 1� � 02x 2 � 2x � 0x 2 � 2x � x 2
y � 2x � x 2y � x 2
A � limn l �
�n
i�1�yT � yB� �x � y
b
a�yT � yB� dx
�yT � yB� �x
yByT
�x
� e �12 � 1 � e � 1.5
A � y1
0�ex � x� dx � ex �
12 x 2]1
0
b � 1a � 0,t�x� � xf �x� � ex
y � ex
x � 1x � 0y � xy � ex
� yb
af �x� dx � y
b
at�x� dx � y
b
a f �x� � t�x� dx
A � area under y � f �x� � area under y � t�x�
2
1
2tf
0 x
y
a b
yT
yB
yT-yB
Îx
FIGURE 5
FIGURE 3
A=j ƒ dx-j © dxajjb
ajjb
0 x
y
a b
y=ƒ
y=©
S
0 x
y
1
y=´
y=x Îx
x=1
1
FIGURE 4
Îx(0, 0)
(1, 1)
FIGURE 6
yT=2x-≈
yB=≈
x
y
97909_06_ch06_p421-431.qk_97909_06_ch06_p421-431 9/21/10 3:49 PM Page 423
Copyright 2010 Cengage Learning. All Rights Reserved. May not be copied, scanned, or duplicated, in whole or in part. Due to electronic rights, some third party content may be suppressed from the eBook and/or eChapter(s).Editorial review has deemed that any suppressed content does not materially affect the overall learning experience. Cengage Learning reserves the right to remove additional content at any time if subsequent rights restrictions require it.

424 CHAPTER 6 APPLICATIONS OF INTEGRATION
Sometimes it’s difficult, or even impossible, to find the points of intersection of twocurves exactly. As shown in the following example, we can use a graphing calculator orcomputer to find approximate values for the intersection points and then proceed as before.
Find the approximate area of the region bounded by the curvesand
SOLUTION If we were to try to find the exact intersection points, we would have to solvethe equation
This looks like a very difficult equation to solve exactly (in fact, it’s impossible), soinstead we use a graphing device to draw the graphs of the two curves in Figure 7. Oneintersection point is the origin. We zoom in toward the other point of intersection andfind that . (If greater accuracy is required, we could use Newton’s method or arootfinder, if available on our graphing device.) Thus an approximation to the areabetween the curves is
To integrate the first term we use the substitution . Then , andwhen . So
Figure 8 shows velocity curves for two cars, A and B, that start side by sideand move along the same road. What does the area between the curves represent? Use theMidpoint Rule to estimate it.
SOLUTION We know from Section 5.4 that the area under the velocity curve A representsthe distance traveled by car A during the first 16 seconds. Similarly, the area under curveB is the distance traveled by car B during that time period. So the area between thesecurves, which is the difference of the areas under the curves, is the distance between thecars after 16 seconds. We read the velocities from the graph and convert them to feet persecond .
EXAMPLE 4
EXAMPLE 3
�1 mi�h � 52803600 ft�s�
� 0.785
� s2.39 � 1 ��1.18�5
5�
�1.18�2
2
� su ]1
2.39� � x 5
5�
x 2
2 �0
1.18
A � 12 y
2.39
1
du
su� y
1.18
0�x 4 � x� dx
x � 1.18, we have u � 2.39du � 2x dxu � x 2 � 1
A � y1.18
0� x
sx 2 � 1� �x 4 � x�� dx
x � 1.18
x
sx 2 � 1� x 4 � x
y � x 4 � x.y � x�sx 2 � 1
1.5
_1
_1 2
y=x$-x
x
œ„„„„„≈+1
FIGURE 7
y=
FIGURE 8
0
10
20
30
40
50
60A
B
2 4 6 8 10 12 14 16 t(seconds)
√ (mi/h)
t 0 2 4 6 8 10 12 14 16
0 34 54 67 76 84 89 92 95
0 21 34 44 51 56 60 63 65
0 13 20 23 25 28 29 29 30
vB
vA
vA � vB
97909_06_ch06_p421-431.qk_97909_06_ch06_p421-431 9/21/10 3:49 PM Page 424
Copyright 2010 Cengage Learning. All Rights Reserved. May not be copied, scanned, or duplicated, in whole or in part. Due to electronic rights, some third party content may be suppressed from the eBook and/or eChapter(s). Editorial review has deemed that any suppressed content does not materially affect the overall learning experience. Cengage Learning reserves the right to remove additional content at any time if subsequent rights restrictions require it.

SECTION 6.1 AREAS BETWEEN CURVES 425
We use the Midpoint Rule with intervals, so that . The midpoints of theintervals are , , , and . We estimate the distance between thecars after 16 seconds as follows:
If we are asked to find the area between the curves and wherefor some values of but for other values of , then we split the
given region into several regions , , . . . with areas , , . . . as shown in Figure 9.We then define the area of the region to be the sum of the areas of the smaller regions
, , . . . , that is, . Since
we have the following expression for A.
The area between the curves and and between andis
When evaluating the integral in , however, we must still split it into integrals corre-sponding to , , . . . .
Find the area of the region bounded by the curves , ,, and .
SOLUTION The points of intersection occur when , that is, when(since ). The region is sketched in Figure 10. Observe thatwhen but when . Therefore the required area is
In this particular example we could have saved some work by noticing that the regionis symmetric about and so
EXAMPLE 5v
A � 2A1 � 2 y��4
0�cos x � sin x� dx
x � ��4
� 2s2 � 2
� � 1
s2�
1
s2� 0 � 1� � ��0 � 1 �
1
s2�
1
s2�
� [sin x � cos x]0
��4� [�cos x � sin x]��4
��2
� y��4
0�cos x � sin x� dx � y
��2
��4�sin x � cos x� dx
A � y��2
0� cos x � sin x � dx � A1 � A2
��4 � x � ��2sin x � cos x0 � x � ��4cos x � sin x0 � x � ��2
x � ��4sin x � cos x
x � ��2x � 0y � cos xy � sin x
3
A2A1
A � yb
a� f �x� � t�x� � dx
x � bx � ay � t�x�y � f �x�
� f �x� � t�x� � � �f �x� � t�x�t�x� � f �x�
when f �x� � t�x�when t�x� � f �x�
A � A1 � A2 � � � �S2S1
SA2A1S2S1S
xt�x� � f �x�xf �x� � t�x�y � t�x�y � f �x�
t4 � 14t3 � 10t2 � 6t1 � 2�t � 4n � 4
� 4�93� � 372 ft
y16
0�vA � vB� dt �t 13 � 23 � 28 � 29�
3
0 x
y
a b
y=ƒ
y=©
S¡S™ S£
FIGURE 9
FIGURE 10
0 x
y
x=0
A¡
y =cos x y=sin x
A™
π4
π2
x=π2
97909_06_ch06_p421-431.qk_97909_06_ch06_p421-431 9/21/10 3:50 PM Page 425
Copyright 2010 Cengage Learning. All Rights Reserved. May not be copied, scanned, or duplicated, in whole or in part. Due to electronic rights, some third party content may be suppressed from the eBook and/or eChapter(s). Editorial review has deemed that any suppressed content does not materially affect the overall learning experience. Cengage Learning reserves the right to remove additional content at any time if subsequent rights restrictions require it.

426 CHAPTER 6 APPLICATIONS OF INTEGRATION
Some regions are best treated by regarding x as a function of y. If a region is boundedby curves with equations , , , and , where and are contin-uous and for (see Figure 11), then its area is
If we write for the right boundary and for the left boundary, then, as Fig ure 12 illustrates, we have
Here a typical approximating rectangle has dimensions and .
Find the area enclosed by the line and the parabola.
SOLUTION By solving the two equations we find that the points of intersection areand . We solve the equation of the parabola for x and notice from Fig-
ure 13 that the left and right boundary curves are
and
We must integrate between the appropriate -values, and . Thus
NOTE We could have found the area in Example 6 by integrating with respect to xinstead of y, but the calculation is much more involved. It would have meant splitting theregion in two and computing the areas labeled and in Figure 14. The method we usedin Example 6 is much easier.
x
c
d
y
0
y=d
x=g(y) x=f(y)
y=c
Îy
FIGURE 11
0 x
y
c
dxRxL
xR-xL
Îy
FIGURE 12
EXAMPLE 6v
A2A1
� �16 �64� � 8 � 16 � ( 4
3 � 2 � 8) � 18
� �1
2 � y 3
3 � �y 2
2� 4y�
�2
4
� y4
�2(�1
2 y 2 � y � 4) dy
� y4
�2[�y � 1� � ( 1
2 y 2 � 3)] dyA � y4
�2�xR � xL � dy
y � 4y � �2y
xR � y � 1xL � 12 y 2 � 3
�5, 4���1, �2�
y 2 � 2x � 6y � x � 1
�yxR � xL
A � yd
c�xR � xL � dy
xLxR
A � yd
c� f �y� � t�y�� dy
c � y � df �y� � t�y�tfy � dy � cx � t�y�x � f �y�
x
y
_2
4
0
(_1, _2)
(5, 4)
xR=y+1
12
xL= ¥-3
FIGURE 13
�3
(5, 4)
(_1, _2)
y=x-1
A¡
y=_ 2x+6
A™
y= 2x+6œ„„„„„
œ„„„„„
FIGURE 14
0 x
y
97909_06_ch06_p421-431.qk_97909_06_ch06_p421-431 9/21/10 3:50 PM Page 426
Copyright 2010 Cengage Learning. All Rights Reserved. May not be copied, scanned, or duplicated, in whole or in part. Due to electronic rights, some third party content may be suppressed from the eBook and/or eChapter(s). Editorial review has deemed that any suppressed content does not materially affect the overall learning experience. Cengage Learning reserves the right to remove additional content at any time if subsequent rights restrictions require it.

SECTION 6.1 AREAS BETWEEN CURVES 427
1–4 Find the area of the shaded region.
1. 2.
3. 4.
5–12 Sketch the region enclosed by the given curves. Decidewhether to integrate with respect to x or y. Draw a typical approxi-mating rectangle and label its height and width. Then find the areaof the region.
5.
6.
7. ,
8.
9.
10. , ,
11. ,
12. ,
13–28 Sketch the region enclosed by the given curves and find itsarea.
13. ,
14. ,
15. , ,
16. , ,
17. ,
18. ,
19. ,
20. , , y � 0y � s2 � xx � y 4
y � 4x2 � 1y � cos �x
x � y � 1y � sx � 1
x � 4 � y 2x � 2y 2
0 � x � 2�y � 2 � cos xy � cos x
x � 0y � xe xy � e x
y � 4x � x 2y � x 2
y � x 2 � 6y � 12 � x 2
x � y4x � y2 � 12
x � y 2 � 1x � 1 � y 2
x � 0y � 2x��y � sin x
y � 1�x, y � 1�x 2, x � 2
y � x 2 � 2x, y � x � 4
y � xy � �x � 2�2
y � sin x, y � x, x � ��2, x � �
y � e x, y � x 2 � 1, x � �1, x � 1
x
y
(_3, 3)
x=2y-¥
x=¥-4y
x
x=¥-2
x=ey
y=1
y=_1
y
x=2
y=œ„„„„x+2
y=1
x+1
x
y
y=x
y=5x-≈
x
y
(4, 4)
21. , ,
22. ,
23. , , ,
24. , ,
25. , ,
26.
27. , , ,
28. , , ,
29–30 Use calculus to find the area of the triangle with the givenvertices.
29. , ,
30. , ,
31–32 Evaluate the integral and interpret it as the area of a region.Sketch the region.
31. 32.
; 33–36 Use a graph to find approximate -coordinates of the pointsof intersection of the given curves. Then find (approxi mately) thearea of the region bounded by the curves.
33. ,
34. , ,
35. ,
36. ,
; 37–40 Graph the region between the curves and use your calculatorto compute the area correct to five decimal places.
37. , 38. ,
39. ,
40. ,
41. Use a computer algebra system to find the exact area enclosedby the curves and .
CAS
y � xy � x5 � 6x3 � 4x
y � x � 2 sin4xy � cos x
y � sxy � tan2 x
y � x 4y � e1�x2
y � x 2y �2
1 � x 4
y � 2 � x 2y � e x
y � x 3 � 3x � 4y � 3x 2 � 2x
x � 0y � x 5 � xy �x
�x 2 � 1�2
y � x 4y � x sin�x 2�
x
y1
�1� 3 x � 2 x � dxy
��2
0� sin x � cos 2x � dx
��1, 1��0, 2��2, 0�
�1, 2��3, 1��0, 0�
x � 0x � y � 3y � 2x2y � 14 x 2
x � 0y � 14 xy � xy � 1�x
y � � x �, y � x2 � 2
x � 9y � 12 x
0 � x � �y � 1 � cos xy � cos x
x � ��2x � 0y � sin 2xy � cos x
y � xy � x 3
���3 � x � ��3y � 2 sin xy � tan x
y � sx
6.1 Exercises
; Graphing calculator or computer required Computer algebra system required 1. Homework Hints available at stewartcalculus.comCAS
97909_06_ch06_p421-431.qk_97909_06_ch06_p421-431 9/21/10 3:50 PM Page 427
Copyright 2010 Cengage Learning. All Rights Reserved. May not be copied, scanned, or duplicated, in whole or in part. Due to electronic rights, some third party content may be suppressed from the eBook and/or eChapter(s). Editorial review has deemed that any suppressed content does not materially affect the overall learning experience. Cengage Learning reserves the right to remove additional content at any time if subsequent rights restrictions require it.

428 CHAPTER 6 APPLICATIONS OF INTEGRATION
42. Sketch the region in the -plane defined by the inequalities, and find its area.
43. Racing cars driven by Chris and Kelly are side by side at thestart of a race. The table shows the velocities of each car (inmiles per hour) during the first ten seconds of the race. Use theMidpoint Rule to estimate how much farther Kelly travels thanChris does during the first ten seconds.
44. The widths (in meters) of a kidney-shaped swimming poolwere measured at 2-meter intervals as indicated in the figure.Use the Midpoint Rule to estimate the area of the pool.
45. A cross-section of an airplane wing is shown. Measurements ofthe thickness of the wing, in centimeters, at 20-centimeterintervals are , , , , , , , , ,
, and . Use the Midpoint Rule to estimate the area of thewing’s cross-section.
46. If the birth rate of a population is people peryear and the death rate is people per year,find the area between these curves for . What doesthis area represent?
47. Two cars, A and B, start side by side and accelerate from rest.The figure shows the graphs of their velocity functions.(a) Which car is ahead after one minute? Explain.(b) What is the meaning of the area of the shaded region?(c) Which car is ahead after two minutes? Explain.
0 � t � 10d�t� � 1460e0.018 t
b�t� � 2200e0.024 t
200 cm
6.2
5.0
7.26.8
5.6 4.84.8
2.88.715.120.523.827.327.629.026.720.35.8
1 � x � � y � � 0x � 2y 2 � 0xy (d) Estimate the time at which the cars are again side by side.
48. The figure shows graphs of the marginal revenue functionand the marginal cost function for a manufacturer. [Recallfrom Section 4.7 that and represent the revenue andcost when units are manufactured. Assume that and aremeasured in thousands of dollars.] What is the meaning of thearea of the shaded region? Use the Midpoint Rule to estimatethe value of this quantity.
; 49. The curve with equation is called Tschirn -hausen’s cubic. If you graph this curve you will see that partof the curve forms a loop. Find the area enclosed by the loop.
50. Find the area of the region bounded by the parabola , thetangent line to this parabola at , and the -axis.
51. Find the number such that the line divides the regionbounded by the curves and into two regions withequal area.
52. (a) Find the number such that the line bisects the areaunder the curve ,
(b) Find the number such that the line bisects the areain part (a).
53. Find the values of such that the area of the region bounded bythe parabolas and is 576.
54. Suppose that . For what value of is the area ofthe region enclosed by the curves , ,and equal to the area of the region enclosed by thecurves , , and ?
55. For what values of do the line and the curveenclose a region? Find the area of the region.y � x��x 2 � 1�
y � mxm
y � 0x � �y � cos�x � c�x � 0
y � cos�x � c�y � cos xc0 � c � ��2
y � c 2 � x 2y � x 2 � c 2c
y � bb1 � x � 4.y � 1�x 2
x � aa
y � 4y � x 2y � bb
x�1, 1�y � x 2
y 2 � x 2�x � 3�
Cª(x)
y
x0 10050
1
2
3Rª(x)
CRxC�x�R�x�C�
R�
0
A
B
21
√
t (min)t t
0 0 0 6 69 801 20 22 7 75 862 32 37 8 81 933 46 52 9 86 984 54 61 10 90 1025 62 71
vKvC vC vK
97909_06_ch06_p421-431.qk_97909_06_ch06_p421-431 9/21/10 3:50 PM Page 428
Copyright 2010 Cengage Learning. All Rights Reserved. May not be copied, scanned, or duplicated, in whole or in part. Due to electronic rights, some third party content may be suppressed from the eBook and/or eChapter(s). Editorial review has deemed that any suppressed content does not materially affect the overall learning experience. Cengage Learning reserves the right to remove additional content at any time if subsequent rights restrictions require it.

APPLIED PROJECT THE GINI INDEX 429
A P P L I E D P R O J E C T THE GINI INDEX
How is it possible to measure the distribution of income among the inhabitants of a given country?One such measure is the Gini index, named after the Italian economist Corrado Gini who firstdevised it in 1912.
We first rank all households in a country by income and then we compute the percentage ofhouseholds whose income is at most a given percentage of the country’s total income. We define aLorenz curve on the interval by plotting the point on the curve ifthe bottom of households receive at most of the total income. For instance, in Figure 1 thepoint is on the Lorenz curve for the United States in 2008 because the poorest ofthe population received just of the total income. Likewise, the bottom 80% of the populationreceived 50% of the total income, so the point lies on the Lorenz curve. (The Lorenzcurve is named after the American economist Max Lorenz.)
Figure 2 shows some typical Lorenz curves. They all pass through the points andand are concave upward. In the extreme case , society is perfectly egalitarian: The poorest
of the population receives of the total income and so everybody receives the same income.The area between a Lorenz curve and the line measures how much the incomedistribution differs from absolute equality. The Gini index (sometimes called the Gini coefficientor the coefficient of inequality) is the area between the Lorenz curve and the line (shadedin Figure 3) divided by the area under .
1. (a) Show that the Gini index is twice the area between the Lorenz curve and the line, that is,
(b) What is the value of for a perfectly egalitarian society (everybody has the sameincome)? What is the value of for a perfectly totalitarian society (a single personreceives all the income?)
2. The following table (derived from data supplied by the US Census Bureau) shows valuesof the Lorenz function for income distribution in the United States for the year 2008.
(a) What percentage of the total US income was received by the richest 20% of the popu-lation in 2008?
(b) Use a calculator or computer to fit a quadratic function to the data in the table. Graphthe data points and the quadratic function. Is the quadratic model a reasonable fit?
(c) Use the quadratic model for the Lorenz function to estimate the Gini index for theUnited States in 2008.
3. The following table gives values for the Lorenz function in the years 1970, 1980, 1990,and 2000. Use the method of Problem 2 to estimate the Gini index for the United Statesfor those years and compare with your answer to Problem 2(c). Do you notice a trend?
4. A power model often provides a more accurate fit than a quadratic model for a Lorenzfunction. If you have a computer with Maple or Mathematica, fit a power function
to the data in Problem 2 and use it to estimate the Gini index for the UnitedStates in 2008. Compare with your answer to parts (b) and (c) of Problem 2.
GG
G � 2 y1
0�x � L�x�� dx
y � xG
y � xy � x
y � xy � L�x�a%a%
L�x� � x�1, 1��0, 0�
�0.8, 0.5�12%
40%�0.4, 0.12�b%a%
�a�100, b�100��0, 1�y � L�x�
� y � ax k�
CAS
FIGURE 1
0 10.80.60.40.2
y
x
(0.4, 0.12)
1
Lorenz curve for the US in 2008
(0.8, 0.5)
FIGURE 2
0 1
y
x
(1, 1)
y=x
incomefraction
population fraction
1
FIGURE 3
0 1
y
x
y=x
y=L(x)
x 0.0 0.2 0.4 0.6 0.8 1.0
0.000 0.034 0.120 0.267 0.500 1.000L�x�
x 0.0 0.2 0.4 0.6 0.8 1.0
1970 0.000 0.041 0.149 0.323 0.568 1.000
1980 0.000 0.042 0.144 0.312 0.559 1.000
1990 0.000 0.038 0.134 0.293 0.530 1.000
2000 0.000 0.036 0.125 0.273 0.503 1.000
97909_06_ch06_p421-431.qk_97909_06_ch06_p421-431 9/21/10 3:50 PM Page 429
Copyright 2010 Cengage Learning. All Rights Reserved. May not be copied, scanned, or duplicated, in whole or in part. Due to electronic rights, some third party content may be suppressed from the eBook and/or eChapter(s). Editorial review has deemed that any suppressed content does not materially affect the overall learning experience. Cengage Learning reserves the right to remove additional content at any time if subsequent rights restrictions require it.
430 CHAPTER 6 APPLICATIONS OF INTEGRATION
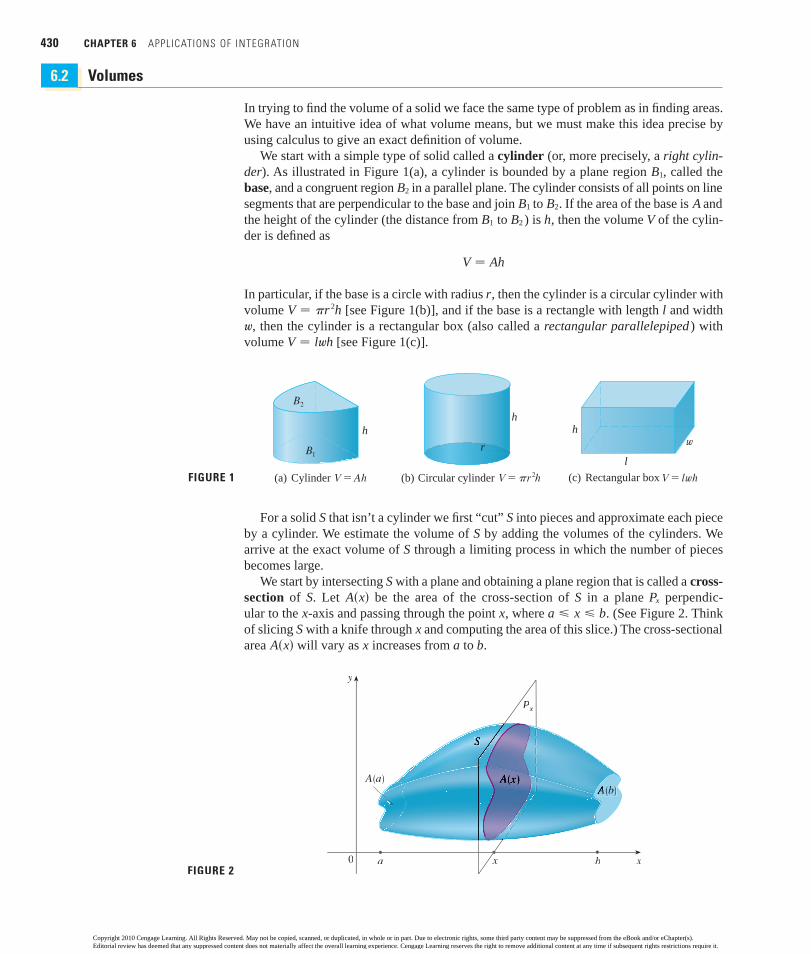
In trying to find the volume of a solid we face the same type of problem as in finding areas.We have an intuitive idea of what volume means, but we must make this idea precise byusing calculus to give an exact definition of volume.
We start with a simple type of solid called a cylinder (or, more precisely, a right cylin-der). As illustrated in Figure 1(a), a cylinder is bounded by a plane region , called thebase, and a congruent region in a parallel plane. The cylinder consists of all points on linesegments that are perpendicular to the base and join to . If the area of the base is andthe height of the cylinder (the distance from to ) is , then the volume of the cylin-der is defined as
In particular, if the base is a circle with radius , then the cylinder is a circular cylinder withvolume [see Figure 1(b)], and if the base is a rectangle with length and width
, then the cylinder is a rectangular box (also called a rectangular parallelepiped ) withvolume [see Figure 1(c)].
For a solid S that isn’t a cylinder we first “cut” S into pieces and approximate each pieceby a cylinder. We estimate the volume of S by adding the volumes of the cylinders. Wearrive at the exact volume of S through a limiting process in which the number of piecesbecomes large.
We start by intersecting S with a plane and obtaining a plane region that is called a cross-section of Let be the area of the cross-section of in a plane perpendic-ular to the -axis and passing through the point , where . (See Figure 2. Thinkof slicing with a knife through and computing the area of this slice.) The cross-sectionalarea will vary as increases from to .
FIGURE 2
y
x0 a bx
A(a)A(b)
PxPP
baxA�x�xS
a � x � bxxPxSA�x�S.
FIGURE 1 (a) Cylinder V=Ah
h
B¡
B™
(b) Circular cylinder V=πr@h
h
r
(c) Rectangular box V=lwh
h
l
w
V � lwhw
lV � �r 2hr
V � Ah
VhB2B1
AB2B1
B2
B1
6.2 Volumes
97909_06_ch06_p421-431.qk_97909_06_ch06_p421-431 9/21/10 3:51 PM Page 430
Copyright 2010 Cengage Learning. All Rights Reserved. May not be copied, scanned, or duplicated, in whole or in part. Due to electronic rights, some third party content may be suppressed from the eBook and/or eChapter(s). Editorial review has deemed that any suppressed content does not materially affect the overall learning experience. Cengage Learning reserves the right to remove additional content at any time if subsequent rights restrictions require it.

SECTION 6.2 VOLUMES 431
Let’s divide S into n “slabs” of equal width by using the planes , , . . . to slicethe solid. (Think of slicing a loaf of bread.) If we choose sample points in , wecan approximate the th slab (the part of that lies between the planes and ) by acylinder with base area and “height” . (See Figure 3.)
The volume of this cylinder is , so an approximation to our intuitive concep-tion of the volume of the th slab is
Adding the volumes of these slabs, we get an approximation to the total volume (that is,what we think of intuitively as the volume):
This approximation appears to become better and better as . (Think of the slices asbecoming thinner and thinner.) Therefore we define the volume as the limit of these sumsas . But we recognize the limit of Riemann sums as a definite integral and so wehave the following definition.
Definition of Volume Let be a solid that lies between and . If thecross-sectional area of in the plane , through x and perpendicular to the -axis,is , where is a continuous function, then the volume of is
When we use the volume formula , it is important to remember that is the area of a moving cross-section obtained by slicing through perpendicular to the
-axis.Notice that, for a cylinder, the cross-sectional area is constant: for all . So our
definition of volume gives ; this agrees with the formula
Show that the volume of a sphere of radius is .
SOLUTION If we place the sphere so that its center is at the origin (see Figure 4), then theplane intersects the sphere in a circle whose radius (from the Pythagorean Theorem)
�xi�1, xi�xi*Px2
Px1�x
�xA�xi*�Pxi
Pxi�1SSii
Px
V � 43 �r 3rEXAMPLE 1
V � Ah.V � xba
A dx � A�b � a�xA�x� � A
xxA�x�
V � xba
A�x� dx
V � limn l �
�n
i�1A�xi*� �x � y
b
aA�x� dx
SAA�x�xPxS
x � bx � aS
n l �
n l �
V � �n
i�1A�xi*� �x
V�Si � � A�xi*� �x
SiiA�xi*� �x
FIGURE 3
xi-1 xi
y
0 xx*i
Îx
S
a b
y
0 xx¶=ba=x¸ ⁄ ¤ ‹ x¢xx x∞ xß
It can be proved that this definition is inde-pendent of how is situated with respect to the -axis. In other words, no matter how weslice with parallel planes, we always get thesame answer for .V
Sx
S
FIGURE 4
y
_r
x
r
y
x
97909_06_ch06_p421-431.qk_97909_06_ch06_p421-431 9/22/10 1:45 PM Page 431
Copyright 2010 Cengage Learning. All Rights Reserved. May not be copied, scanned, or duplicated, in whole or in part. Due to electronic rights, some third party content may be suppressed from the eBook and/or eChapter(s). Editorial review has deemed that any suppressed content does not materially affect the overall learning experience. Cengage Learning reserves the right to remove additional content at any time if subsequent rights restrictions require it.

432 CHAPTER 6 APPLICATIONS OF INTEGRATION
is . So the cross-sectional area is
Using the definition of volume with and , we have
(The integrand is even.)
Figure 5 illustrates the definition of volume when the solid is a sphere with radius . From the result of Example 1, we know that the volume of the sphere is , which
is approximately . Here the slabs are circular cylinders, or disks, and the three partsof Figure 5 show the geometric interpretations of the Riemann sums
when n � 5, 10, and 20 if we choose the sample points to be the midpoints . Notice that as we increase the number of approximating cylinders, the corresponding Riemannsums become closer to the true volume.
Find the volume of the solid obtained by rotating about the x-axis theregion under the curve from 0 to 1. Illustrate the definition of volume by sketch-ing a typical approximating cylinder.
SOLUTION The region is shown in Figure 6(a). If we rotate about the x-axis, we get thesolid shown in Figure 6(b). When we slice through the point x, we get a disk with radius
. The area of this cross-section is
and the volume of the approximating cylinder (a disk with thickness ) is
A�x� � �y 2 � � �r 2 � x 2 �
y � sr 2 � x 2
� 43 �r 3
� 2��r 2x �x 3
3 �0
r
� 2��r 3 �r 3
3 �� 2� y
r
0�r 2 � x 2 � dx
V � yr
�rA�x� dx � y
r
�r� �r 2 � x 2 � dx
b � ra � �r
�x
A�x� � � (sx )2 � �x
sx
EXAMPLE 2vy � sx
(a) Using 5 disks, VÅ4.2726 (b) Using 10 disks, VÅ4.2097 (c) Using 20 disks, VÅ4.1940
FIGURE 5 Approximating the volume of a sphere with radius 1
xixi*
�n
i�1A�xi� �x � �
n
i�1� �12 � xi
2� �x
4.18879
43 �r � 1
A�x� �x � �x �x
Visual 6.2A shows an animation of Figure 5.TEC
97909_06_ch06_p432-441.qk_97909_06_ch06_p432-441 9/21/10 3:52 PM Page 432
Copyright 2010 Cengage Learning. All Rights Reserved. May not be copied, scanned, or duplicated, in whole or in part. Due to electronic rights, some third party content may be suppressed from the eBook and/or eChapter(s). Editorial review has deemed that any suppressed content does not materially affect the overall learning experience. Cengage Learning reserves the right to remove additional content at any time if subsequent rights restrictions require it.

SECTION 6.2 VOLUMES 433
The solid lies between and , so its volume is
Find the volume of the solid obtained by rotating the region bounded by , , and about the -axis.
SOLUTION The region is shown in Figure 7(a) and the resulting solid is shown in Fig-ure 7(b). Because the region is rotated about the y-axis, it makes sense to slice the solidperpendicular to the y-axis and therefore to integrate with respect to y. If we slice atheight y, we get a circular disk with radius x, where . So the area of a cross-section through y is
and the volume of the approximating cylinder pictured in Figure 7(b) is
Since the solid lies between and , its volume is
x � 1x � 0
V � y1
0A�x� dx � y
1
0�x dx � �
x 2
2 �0
1
��
2
FIGURE 6 (a)
x0 x
yy=œ„
1
œ„
(b)
Îx
0 x
y
1
EXAMPLE 3vyx � 0y � 8y � x 3
x � s3 y
A�y� � �x 2 � � (s3 y )2 � �y 2�3
A�y� �y � �y 2�3 �y
y � 8y � 0
� �[ 35 y 5�3 ]0
8�
96�
5V � y
8
0A�y� dy � y
8
0�y 2�3 dy
FIGURE 7
y=8
x=0y=˛
or
(a)
0
(x, y)Îy
(b)
x
y
0 x
y
8
x=œ„yœ3
x
Did we get a reasonable answer in Example 2? As a check on our work, let’s replace the given region by a square with base
and height . If we rotate this square, we get a cylinder with radius , height , andvolume . We computed that thegiven solid has half this volume. That seemsabout right.
� � 12 � 1 � �11
1�0, 1�
97909_06_ch06_p432-441.qk_97909_06_ch06_p432-441 9/21/10 3:52 PM Page 433
Copyright 2010 Cengage Learning. All Rights Reserved. May not be copied, scanned, or duplicated, in whole or in part. Due to electronic rights, some third party content may be suppressed from the eBook and/or eChapter(s). Editorial review has deemed that any suppressed content does not materially affect the overall learning experience. Cengage Learning reserves the right to remove additional content at any time if subsequent rights restrictions require it.

434 CHAPTER 6 APPLICATIONS OF INTEGRATION
The region enclosed by the curves and is rotated about the -axis. Find the volume of the resulting solid.
SOLUTION The curves and intersect at the points and . The region between them, the solid of rotation, and a cross-section perpendicular to the -axis are shown in Figure 8. A cross-section in the plane has the shape of a washer
(an annular ring) with inner radius and outer radius , so we find the cross-sectionalarea by subtracting the area of the inner circle from the area of the outer circle:
Therefore we have
Find the volume of the solid obtained by rotating the region in Example 4about the line .
SOLUTION The solid and a cross-section are shown in Figure 9. Again the cross-section is a washer, but this time the inner radius is and the outer radius is .
EXAMPLE 4 � y � x y � x 2
xx 2Pxx
�1, 1��0, 0�y � x 2y � x
x
A�x� � �x 2 � � �x 2 �2 � � �x 2 � x 4 �
� �� x 3
3�
x 5
5 �0
1
�2�
15
V � y1
0A�x� dx � y
1
0� �x 2 � x 4 � dx
EXAMPLE 5
2 � x 22 � x
y � 2
FIGURE 8
(1, 1)
y=≈y=x
(b)(a) (c)
x
≈
A(x)
x
y
(0, 0) x
y
0
FIGURE 90
y=2 y=2
4
x1x
y=≈y=x
y
xx
2-≈
≈
2-x
x
Visual 6.2B shows how solids of revolution are formed.TEC
97909_06_ch06_p432-441.qk_97909_06_ch06_p432-441 9/22/10 1:46 PM Page 434
Copyright 2010 Cengage Learning. All Rights Reserved. May not be copied, scanned, or duplicated, in whole or in part. Due to electronic rights, some third party content may be suppressed from the eBook and/or eChapter(s). Editorial review has deemed that any suppressed content does not materially affect the overall learning experience. Cengage Learning reserves the right to remove additional content at any time if subsequent rights restrictions require it.

SECTION 6.2 VOLUMES 435
The cross-sectional area is
and so the volume of is
The solids in Examples 1–5 are all called solids of revolution because they are obtainedby revolving a region about a line. In general, we calculate the volume of a solid of revo-lution by using the basic defining formula
and we find the cross-sectional area or in one of the following ways:
N If the cross-section is a disk (as in Examples 1–3), we find the radius of the disk(in terms of x or y) and use
N If the cross-section is a washer (as in Examples 4 and 5), we find the innerradius and outer radius from a sketch (as in Figures 8, 9, and 10) andcompute the area of the washer by subtracting the area of the inner disk from thearea of the outer disk:
The next example gives a further illustration of the procedure.
� � y1
0��2 � x 2 �2 � �2 � x�2 � dx
V � y1
0A�x� dx
S
A�x� � � �2 � x 2 �2 � � �2 � x�2
� � y1
0�x 4 � 5x 2 � 4x� dx
�8�
15
� �� x 5
5� 5
x 3
3� 4
x 2
2 �0
1
A � � �radius�2
A�y�A�x�
V � yb
aA�x� dx or V � y
d
cA�y� dy
routrin
A � � �outer radius�2 � � �inner radius�2
FIGURE 10
rinrrrroutr
97909_06_ch06_p432-441.qk_97909_06_ch06_p432-441 9/22/10 1:42 PM Page 435
Copyright 2010 Cengage Learning. All Rights Reserved. May not be copied, scanned, or duplicated, in whole or in part. Due to electronic rights, some third party content may be suppressed from the eBook and/or eChapter(s). Editorial review has deemed that any suppressed content does not materially affect the overall learning experience. Cengage Learning reserves the right to remove additional content at any time if subsequent rights restrictions require it.

436 CHAPTER 6 APPLICATIONS OF INTEGRATION
Find the volume of the solid obtained by rotating the region in Example 4about the line .
SOLUTION Figure 11 shows a horizontal cross-section. It is a washer with inner radiusand outer radius , so the cross-sectional area is
The volume is
We now find the volumes of two solids that are not solids of revolution.
Figure 12 shows a solid with a circular base of radius 1. Parallel cross-sections perpendicular to the base are equilateral triangles. Find the volume of the solid.
SOLUTION Let’s take the circle to be . The solid, its base, and a typical cross-section at a distance from the origin are shown in Figure 13.
Since lies on the circle, we have and so the base of the triangleis . Since the triangle is equilateral, we see from Figure 13(c) that its
EXAMPLE 6x � �1
� � (1 � sy )2 � � �1 � y�2
A�y� � � �outer radius�2 � � �inner radius�2
1 � sy1 � y
� � y1
0[(1 � sy )2 � �1 � y�2 ] dyV � y
1
0A�y� dy
� � y1
0(2sy � y � y 2 ) dy � ��4y 3�2
3�
y 2
2�
y 3
3 �0
1
��
2
EXAMPLE 7
FIGURE 11x=_1
y
y
x0
x=œ„y
y
x=y
y
1
1+y
1+œ„
x 2 � y 2 � 1x
FIGURE 13FIGURE 12
y
x
y y60° 60°
BA
C
œ„œ3y
(c) A cross-section
A
B(x, y)y=œ„„„„„„≈
(b) Its base
x
y
0
y
x
(a) The solid
0
A
B
1_1 x
y
C
ABCy � s1 � x 2 B
� AB � � 2s1 � x 2
Visual 6.2C shows how the solid in Figure 12 is generated.TEC
FIGURE 12Computer-generated pictureof the solid in Example 7
97909_06_ch06_p432-441.qk_97909_06_ch06_p432-441 9/21/10 3:55 PM Page 436
Copyright 2010 Cengage Learning. All Rights Reserved. May not be copied, scanned, or duplicated, in whole or in part. Due to electronic rights, some third party content may be suppressed from the eBook and/or eChapter(s). Editorial review has deemed that any suppressed content does not materially affect the overall learning experience. Cengage Learning reserves the right to remove additional content at any time if subsequent rights restrictions require it.
SECTION 6.2 VOLUMES 437
height is . The cross-sectional area is therefore
and the volume of the solid is
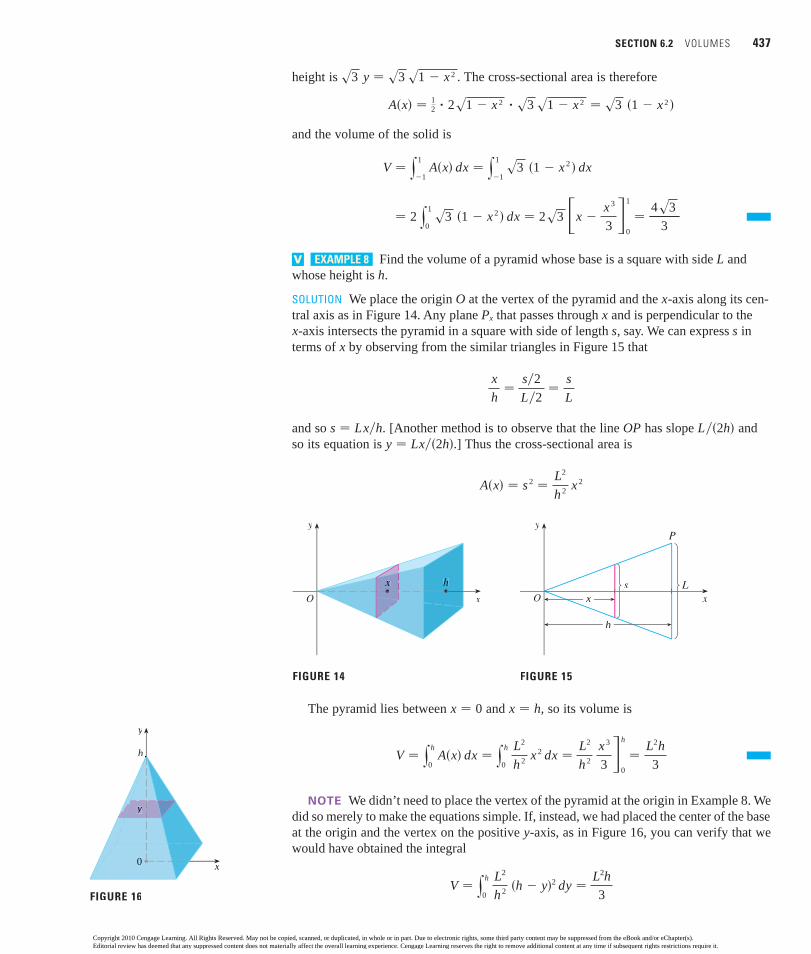
Find the volume of a pyramid whose base is a square with side andwhose height is .
SOLUTION We place the origin at the vertex of the pyramid and the -axis along its cen-tral axis as in Figure 14. Any plane that passes through and is perpendicular to the -axis intersects the pyramid in a square with side of length , say. We can express in
terms of by observing from the similar triangles in Figure 15 that
and so . [Another method is to observe that the line has slope andso its equation is .] Thus the cross-sectional area is
The pyramid lies between and , so its volume is
NOTE We didn’t need to place the vertex of the pyramid at the origin in Example 8. Wedid so merely to make the equations simple. If, instead, we had placed the center of the baseat the origin and the vertex on the positive -axis, as in Figure 16, you can verify that wewould have obtained the integral
s3 y � s3 s1 � x 2
A�x� � 12 � 2s1 � x 2 � s3 s1 � x 2 � s3 �1 � x 2 �
V � y1
�1A�x� dx � y
1
�1s3 �1 � x 2 � dx
� 2 y1
0s3 �1 � x 2 � dx � 2s3 �x �
x 3
3 �0
1
�4s3
3
LEXAMPLE 8vh
xOxPx
ssxx
x
h�
s�2
L�2�
s
L
L��2h�OPs � Lx�hy � Lx��2h�
A�x� � s 2 �L2
h 2 x 2
x � hx � 0
�L2
h 2
x 3
3 �0
h
�L2h
3V � y
h
0A�x� dx � y
h
0
L2
h 2 x 2 dx
y
V � yh
0
L2
h 2 �h � y�2 dy �L2h
3
O
x h
FIGURE 14
s L
O
P
FIGURE 15
x
y
x
y
x
h
0
y
FIGURE 16
h
x
y
97909_06_ch06_p432-441.qk_97909_06_ch06_p432-441 9/21/10 3:55 PM Page 437
Copyright 2010 Cengage Learning. All Rights Reserved. May not be copied, scanned, or duplicated, in whole or in part. Due to electronic rights, some third party content may be suppressed from the eBook and/or eChapter(s). Editorial review has deemed that any suppressed content does not materially affect the overall learning experience. Cengage Learning reserves the right to remove additional content at any time if subsequent rights restrictions require it.

438 CHAPTER 6 APPLICATIONS OF INTEGRATION
; Graphing calculator or computer required Computer algebra system required 1. Homework Hints available at stewartcalculus.comCAS
1–18 Find the volume of the solid obtained by rotating the regionbounded by the given curves about the specified line. Sketch theregion, the solid, and a typical disk or washer.
1. , , , ; about the -axis
2. , ; about the -axis
3. , , ; about the -axis
4. , , , ; about the -axis
5. , , ; about the -axis
6. , , , ; about the -axis
7. , , ; about the -axis
8. , ; about the -axis
9. , ; about the -axis
10. , , ; about the -axis
11. , ; about
12. , , ; about
13. , ; about y � 1 � sec x y � 3 y � 1
y � e�x y � 1 x � 2 y � 2
y � 1x � y 2y � x 2
yy � 0x � 2y � 14 x 2
yx � 2yy 2 � x
xy � 5 � x 2y � 14 x 2
xx � 0y � xy � x 3
yx � 0y � 2y � 1y � ln x
yy � 9x � 0x � 2sy
xx � 4x � 2y � 0y � s25 � x 2
xx � 5y � 0y � sx � 1
xy � 0y � 1 � x 2
xx � 2x � 1y � 0y � 2 �12 x
14. , , ; about
15. , , ; about
16. , , , ; about
17. , ; about
18. , , , ; about
19–30 Refer to the figure and find the volume generated by rotatingthe given region about the specified line.
19. about 20.
21. 22.�1 about AB �1 about BC
O x
y
T™
T£ T¡
B(1, 1)
A(1, 0)
C(0, 1)
y=œ„x$
�1 about OCOA�1
x � 1x � 4x � 2y � 0y � x
x � 3x � 1 � y 2x � y 2
x � �1x � 2x � 1y � 0xy � 1
x � 2x � 1y � 0y � x 3
y � �10 � x � ��4y � cos xy � sin x
6.2 Exercises
A wedge is cut out of a circular cylinder of radius 4 by two planes. Oneplane is perpendicular to the axis of the cylinder. The other intersects the first at an angleof 30 along a diameter of the cylinder. Find the volume of the wedge.
SOLUTION If we place the -axis along the diameter where the planes meet, then the base of the solid is a semicircle with equation , . A cross-section perpendicular to the -axis at a distance from the origin is a triangle , as shown in Figure 17, whose base is and whose height is
. Thus the cross-sectional area is
and the volume is
For another method see Exercise 62.
V � y4
�4A�x� dx � y
4
�4
16 � x 2
2s3dx
�16 � x 2
2s3A�x� � 1
2 s16 � x 2 �1
s3s16 � x 2
�128
3s3
�1
s3 y4
0�16 � x 2 � dx �
1
s3 �16x �x 3
3 �0
4
EXAMPLE 9
�
x�4 � x � 4y � s16 � x 2
ABCxxy � s16 � x 2
� BC � � y tan 30� � s16 � x 2 �s3
y=œ„„„„„„16-≈
x
y0
AB
C
4
FIGURE 17
A B
C
y30°
97909_06_ch06_p432-441.qk_97909_06_ch06_p432-441 9/21/10 3:55 PM Page 438
Copyright 2010 Cengage Learning. All Rights Reserved. May not be copied, scanned, or duplicated, in whole or in part. Due to electronic rights, some third party content may be suppressed from the eBook and/or eChapter(s). Editorial review has deemed that any suppressed content does not materially affect the overall learning experience. Cengage Learning reserves the right to remove additional content at any time if subsequent rights restrictions require it.

SECTION 6.2 VOLUMES 439
23. 24.
25. 26.
27. 28.
29. 30.
31–34 Set up an integral for the volume of the solid obtained byrotating the region bounded by the given curves about the speci-fied line. Then use your calculator to evaluate the integralcorrect to five decimal places.
31. , , , (a) About the -axis (b) About
32. , , (a) About the -axis (b) About
33.(a) About (b) About
34. , , (a) About the -axis (b) About the -axis
; 35–36 Use a graph to find approximate -coordinates of thepoints of intersection of the given curves. Then use your calcula-tor to find (approxi mately) the volume of the solid obtained byrotating about the -axis the region bounded by these curves.
35. ,
36.
37–38 Use a computer algebra system to find the exact volumeof the solid obtained by rotating the region bounded by thegiven curves about the specified line.
37. , , ;
38. , ;
39–42 Each integral represents the volume of a solid. Describethe solid.
39. 40.
41.
42.
43. A CAT scan produces equally spaced cross-sectional viewsof a human organ that provide information about the organotherwise obtained only by surgery. Suppose that a CATscan of a human liver shows cross-sections spaced 1.5 cmapart. The liver is 15 cm long and the cross-sectional areas,in square centimeters, are 0, 18, 58, 79, 94, 106, 117, 128, 63,39, and 0. Use the Midpoint Rule to estimate the volume ofthe liver.
� y��2
0��1 � cos x�2 � 12 � dx
� y1
0�y 4 � y 8 � dy
� y1
�1�1 � y 2�2 dy� y
�
0sin x dx
about y � 3y � xe1�x�2y � x
about y � �10 � x � �y � 0y � sin2 x
CAS
y � 3 sin�x 2 �, y � e x�2 � e�2x
y � x 4 � x � 1y � 2 � x 2 cos x
x
x
yxy � 0x 2 � y 2 � 1y � x 2
y � 2 x � 2x 2 � 4y 2 � 4
x y � 1y � 0 y � cos2 x ���2 � x � ��2
x y � �1y � e�x2
y � 0 x � �1 x � 1
�2 about BC�2 about AB
�3 about BC�3 about AB
�3 about OC�3 about OA
�2 about OC�2 about OA 44. A log 10 m long is cut at 1-meter intervals and its cross- sectional areas (at a distance from the end of the log) arelisted in the table. Use the Midpoint Rule with to esti-mate the volume of the log.
45. (a) If the region shown in the figure is rotated about the -axis to form a solid, use the Midpoint Rule with
to estimate the volume of the solid.
(b) Estimate the volume if the region is rotated about the -axis. Again use the Midpoint Rule with .
46. (a) A model for the shape of a bird’s egg is obtained by rotating about the -axis the region under the graph of
Use a CAS to find the volume of such an egg.(b) For a Red-throated Loon, , , ,
and . Graph and find the volume of an egg ofthis species.
47–59 Find the volume of the described solid .
47. A right circular cone with height and base radius
48. A frustum of a right circular cone with height , lower baseradius , and top radius
49. A cap of a sphere with radius and height
r
h
hr
R
h
r
rRh
rh
S
fd � 0.54c � 0.1b � 0.04a � �0.06
f �x� � �ax 3 � bx 2 � cx � d�s1 � x 2
xCAS
n � 4y
0 4
4
102 86
2
y
x
n � 4x
n � 5xA
x (m) A ( ) x (m) A ( )
0 0.68 6 0.531 0.65 7 0.552 0.64 8 0.523 0.61 9 0.504 0.58 10 0.485 0.59
m2m2
97909_06_ch06_p432-441.qk_97909_06_ch06_p432-441 9/21/10 3:55 PM Page 439
Copyright 2010 Cengage Learning. All Rights Reserved. May not be copied, scanned, or duplicated, in whole or in part. Due to electronic rights, some third party content may be suppressed from the eBook and/or eChapter(s). Editorial review has deemed that any suppressed content does not materially affect the overall learning experience. Cengage Learning reserves the right to remove additional content at any time if subsequent rights restrictions require it.

440 CHAPTER 6 APPLICATIONS OF INTEGRATION
50. A frustum of a pyramid with square base of side , square topof side , and height
What happens if ? What happens if ?
51. A pyramid with height and rectangular base with dimensionsand
52. A pyramid with height and base an equilateral triangle withside (a tetrahedron)
53. A tetrahedron with three mutually perpendicular faces andthree mutually perpendicular edges with lengths 3 cm, 4 cm, and 5 cm
54. The base of is a circular disk with radius . Parallel cross-sections perpendicular to the base are squares.
55. The base of is an elliptical region with boundary curve. Cross-sections perpendicular to the -axis
are isosceles right triangles with hypotenuse in the base.
56. The base of is the triangular region with vertices , , and . Cross-sections perpendicular to the -axis
are equilateral triangles.
57. The base of is the same base as in Exercise 56, but cross-sections perpendicular to the -axis are squares.
58. The base of is the region enclosed by the parabolaand the -axis. Cross-sections perpendicular to the
-axis are squares.
59. The base of is the same base as in Exercise 58, but cross-sections perpendicular to the -axis are isosceles triangles withheight equal to the base.
60. The base of is a circular disk with radius . Parallel cross-sections perpendicular to the base are isosceles triangles withheight and unequal side in the base.(a) Set up an integral for the volume of .(b) By interpreting the integral as an area, find the volume
of .
b
S
Sh
rS
xS
yxy � 1 � x 2
S
xS
y�0, 1��1, 0��0, 0�S
x9x 2 � 4y 2 � 36S
rS
a
aa
ah
2bbh
a � 0a � b
a
b
ha61. (a) Set up an integral for the volume of a solid torus (the
donut-shaped solid shown in the figure) with radii and .
(b) By interpreting the integral as an area, find the volume ofthe torus.
62. Solve Example 9 taking cross-sections to be parallel to the lineof intersection of the two planes.
63. (a) Cavalieri’s Principle states that if a family of parallel planesgives equal cross-sectional areas for two solids and ,then the volumes of and are equal. Prove thisprinciple.
(b) Use Cavalieri’s Principle to find the volume of the obliquecylinder shown in the figure.
64. Find the volume common to two circular cylinders, each withradius , if the axes of the cylinders intersect at right angles.
65. Find the volume common to two spheres, each with radius , ifthe center of each sphere lies on the surface of the other sphere.
66. A bowl is shaped like a hemisphere with diameter 30 cm. Aheavy ball with diameter 10 cm is placed in the bowl and wateris poured into the bowl to a depth of centimeters. Find thevolume of water in the bowl.
67. A hole of radius is bored through the middle of a cylinder ofradius at right angles to the axis of the cylinder. Set up,but do not evaluate, an integral for the volume cut out.
68. A hole of radius is bored through the center of a sphere ofradius . Find the volume of the remaining portion of thesphere.
69. Some of the pioneers of calculus, such as Kepler and Newton,were inspired by the problem of finding the volumes of wine
R � rr
R � rr
h
r
r
h
r
S2S1
S2S1
rR
Rr
97909_06_ch06_p432-441.qk_97909_06_ch06_p432-441 9/21/10 3:56 PM Page 440
Copyright 2010 Cengage Learning. All Rights Reserved. May not be copied, scanned, or duplicated, in whole or in part. Due to electronic rights, some third party content may be suppressed from the eBook and/or eChapter(s). Editorial review has deemed that any suppressed content does not materially affect the overall learning experience. Cengage Learning reserves the right to remove additional content at any time if subsequent rights restrictions require it.

SECTION 6.3 VOLUMES BY CYLINDRICAL SHELLS 441
barrels. (In fact Kepler published a book Stereometria doliorumin 1615 devoted to methods for finding the volumes of barrels.)They often approximated the shape of the sides by parabolas.(a) A barrel with height and maximum radius is con-
structed by rotating about the -axis the parabola, , where is a positive
constant. Show that the radius of each end of the barrel is, where .
c�h�2 � x � h�2y � R � cx 2x
Rh
d � ch 2�4r � R � d
(b) Show that the volume enclosed by the barrel is
70. Suppose that a region has area and lies above the -axis.When is rotated about the -axis, it sweeps out a solid withvolume . When is rotated about the line (whereis a positive number), it sweeps out a solid with volume .Express in terms of , , and .AkV1V2
V2
ky � �k�V1
x�xA�
V � 13 �h(2R2 � r 2 �
25 d 2 )
Some volume problems are very difficult to handle by the methods of the preceding section.For instance, let’s consider the problem of finding the volume of the solid obtained by rotating about the -axis the region bounded by and . (See Figure 1.) Ifwe slice perpendicular to the y-axis, we get a washer. But to compute the inner radius andthe outer radius of the washer, we’d have to solve the cubic equation for x interms of y; that’s not easy.
Fortunately, there is a method, called the method of cylindrical shells, that is easier touse in such a case. Figure 2 shows a cylindrical shell with inner radius , outer radius ,and height . Its volume is calculated by subtracting the volume of the inner cylinderfrom the volume of the outer cylinder:
If we let (the thickness of the shell) and (the average radius ofthe shell), then this formula for the volume of a cylindrical shell becomes
and it can be remembered as
Now let be the solid obtained by rotating about the -axis the region bounded by[where ], and , where . (See Figure 3.)
FIGURE 3
x
y
a b0
y=ƒ
a b x
y
0
y=ƒ
b � a � 0x � by � 0, x � a, f �x� � 0y � f �x�yS
V � [circumference][height][thickness]
V � 2�rh �r1
r � 12 �r2 � r1��r � r2 � r1
� 2�r2 � r1
2 h�r2 � r1�
� � �r2 � r1��r2 � r1�h
� �r22 h � �r2
1 h � � �r 22 � r 2
1 �h
V � V2 � V1
V2
V1Vhr2r1
y � 2x 2 � x 3
y � 0y � 2x 2 � x 3y
6.3 Volumes by Cylindrical Shells
FIGURE 1
y
x0 2
1
y=2≈-˛
xLxx =? xRxx =?
FIGURE 2
rr¡
r™
Îr
h
97909_06_ch06_p432-441.qk_97909_06_ch06_p432-441 9/21/10 3:56 PM Page 441
Copyright 2010 Cengage Learning. All Rights Reserved. May not be copied, scanned, or duplicated, in whole or in part. Due to electronic rights, some third party content may be suppressed from the eBook and/or eChapter(s). Editorial review has deemed that any suppressed content does not materially affect the overall learning experience. Cengage Learning reserves the right to remove additional content at any time if subsequent rights restrictions require it.

442 CHAPTER 6 APPLICATIONS OF INTEGRATION
We divide the interval into n subintervals of equal width and let bethe midpoint of the ith subinterval. If the rectangle with base and height isrotated about the y-axis, then the result is a cylindrical shell with average radius , height
, and thickness (see Figure 4), so by Formula 1 its volume is
Therefore an approximation to the volume of is given by the sum of the volumes of theseshells:
This approximation appears to become better as . But, from the definition of an inte-gral, we know that
Thus the following appears plausible:
The volume of the solid in Figure 3, obtained by rotating about the y-axis theregion under the curve from a to b, is
The argument using cylindrical shells makes Formula 2 seem reasonable, but later wewill be able to prove it (see Exercise 71 in Section 7.1).
The best way to remember Formula 2 is to think of a typical shell, cut and flattened asin Figure 5, with radius , circumference , height , and thickness or :
thicknessheightcircumference
dx� f �x���2�x�yb
a
dx�xf �x�2�x
where 0 � a � bV � yb
a2�x f �x� dx
y � f �x�2
limn l �
�n
i�12� xi f �xi� �x � y
b
a2�x f �x� dx
n l �
V � �n
i�1Vi � �
n
i�12� xi f �xi� �x
SV
x
y
b
y=ƒ
xi–
a b00 x
y
xi-1xi
y=ƒ
x
y
b
y=ƒ
Vi � �2� xi�� f �xi�� �x
�xf �xi�xi
f �xi��xi�1, xi�xi�x�xi�1, xi��a, b�
FIGURE 5
2πx Îx
ƒ
y
xx
ƒ
x
FIGURE 4
97909_06_ch06_p442-451.qk_97909_06_ch06_p442-451 9/21/10 3:57 PM Page 442
Copyright 2010 Cengage Learning. All Rights Reserved. May not be copied, scanned, or duplicated, in whole or in part. Due to electronic rights, some third party content may be suppressed from the eBook and/or eChapter(s). Editorial review has deemed that any suppressed content does not materially affect the overall learning experience. Cengage Learning reserves the right to remove additional content at any time if subsequent rights restrictions require it.

SECTION 6.3 VOLUMES BY CYLINDRICAL SHELLS 443
This type of reasoning will be helpful in other situations, such as when we rotate aboutlines other than the y-axis.
Find the volume of the solid obtained by rotating about the -axis the regionbounded by and .
SOLUTION From the sketch in Figure 6 we see that a typical shell has radius x, circumfer-ence , and height . So, by the shell method, the volume is
It can be verified that the shell method gives the same answer as slicing.
NOTE Comparing the solution of Example 1 with the remarks at the beginning of thissection, we see that the method of cylindrical shells is much easier than the washer methodfor this problem. We did not have to find the coordinates of the local maximum and we didnot have to solve the equation of the curve for in terms of . However, in other examplesthe methods of the preceding section may be easier.
Find the volume of the solid obtained by rotating about the -axis theregion between and .
SOLUTION The region and a typical shell are shown in Figure 8. We see that the shell hasradius x, circumference , and height . So the volume is
As the following example shows, the shell method works just as well if we rotate aboutthe x-axis. We simply have to draw a diagram to identify the radius and height of a shell.
Use cylindrical shells to find the volume of the solid obtained by rotatingabout the -axis the region under the curve from 0 to 1.x y � sxv EXAMPLE 3
� 2�� x 3
3�
x 4
4 �0
1
��
6
EXAMPLE 2v
V � y1
0�2�x��x � x 2 � dx � 2� y
1
0�x 2 � x 3 � dx
x � x 22�x
y � x 2y � xy
EXAMPLE 1
yx
FIGURE 7
y
x
� 2�[ 12 x 4 �
15 x 5 ]0
2� 2� (8 �
325 ) � 16
5 �
V � y2
0�2�x��2x 2 � x 3 � dx � 2� y
2
0�2x 3 � x 4 � dx
f �x� � 2x 2 � x 32�x
y � 0y � 2x 2 � x 3y
Figure 7 shows a computer-generated picture of the solid whose volume we computed inExample 1.
FIGURE 6
y
x
2≈-˛
x 2
FIGURE 8
0 x
y
y=x
y=≈
x
shellheight=x-≈
97909_06_ch06_p442-451.qk_97909_06_ch06_p442-451 9/21/10 3:57 PM Page 443
Copyright 2010 Cengage Learning. All Rights Reserved. May not be copied, scanned, or duplicated, in whole or in part. Due to electronic rights, some third party content may be suppressed from the eBook and/or eChapter(s). Editorial review has deemed that any suppressed content does not materially affect the overall learning experience. Cengage Learning reserves the right to remove additional content at any time if subsequent rights restrictions require it.
444 CHAPTER 6 APPLICATIONS OF INTEGRATION
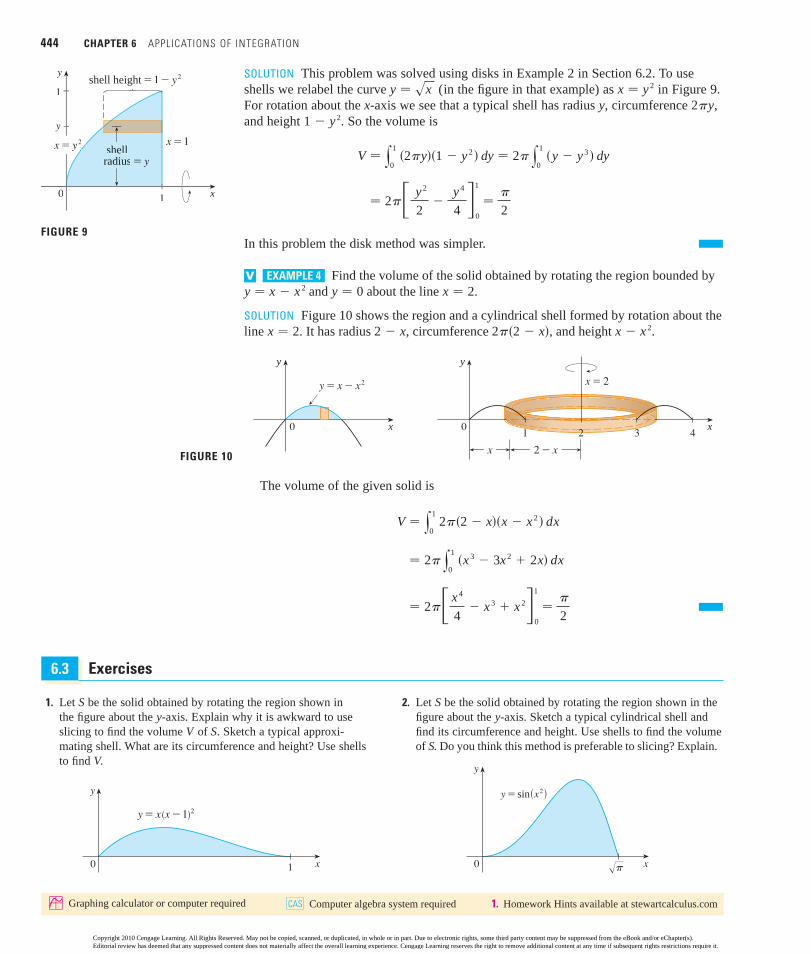
SOLUTION This problem was solved using disks in Example 2 in Section 6.2. To useshells we relabel the curve (in the figure in that example) as in Figure 9.For rotation about the x-axis we see that a typical shell has radius y, circumference ,and height . So the volume is
In this problem the disk method was simpler.
Find the volume of the solid obtained by rotating the region bounded byand about the line .
SOLUTION Figure 10 shows the region and a cylindrical shell formed by rotation about theline . It has radius , circumference , and height .
The volume of the given solid is
EXAMPLE 4v
� 2�� x 4
4� x 3 � x 2�
0
1
��
2
� 2� y1
0�x 3 � 3x 2 � 2x� dx
V � y1
02� �2 � x��x � x 2 � dx
FIGURE 10
0
y
x
y=x-≈
0
y
x
x
1 2 3 4
2-x
x=2
x � x 22� �2 � x�2 � xx � 2
x � 2y � 0y � x � x 2
V � y1
0�2�y��1 � y 2 � dy
1 � y 2
� 2�� y 2
2�
y 4
4 �0
1
��
2
� 2� y1
0�y � y 3 � dy
2�yy � sx x � y 2
; Graphing calculator or computer required Computer algebra system required 1. Homework Hints available at stewartcalculus.comCAS
1. Let be the solid obtained by rotating the region shown in the figure about the -axis. Explain why it is awkward to useslicing to find the volume of . Sketch a typical approxi -mating shell. What are its circumference and height? Use shellsto find .
0 x
y
1
y=x(x-1)@
V
SVy
S 2. Let be the solid obtained by rotating the region shown in thefigure about the -axis. Sketch a typical cylindrical shell andfind its circumference and height. Use shells to find the volumeof . Do you think this method is preferable to slicing? Explain.
S
0 x
y
œ„π
y=sin{≈}
S
y
6.3 Exercises
FIGURE 9
1
y
y
shellradius=y
shell height=1-¥
0 x
x=1
1
x==¥¥¥¥
97909_06_ch06_p442-451.qk_97909_06_ch06_p442-451 9/21/10 3:57 PM Page 444
Copyright 2010 Cengage Learning. All Rights Reserved. May not be copied, scanned, or duplicated, in whole or in part. Due to electronic rights, some third party content may be suppressed from the eBook and/or eChapter(s). Editorial review has deemed that any suppressed content does not materially affect the overall learning experience. Cengage Learning reserves the right to remove additional content at any time if subsequent rights restrictions require it.

SECTION 6.3 VOLUMES BY CYLINDRICAL SHELLS 445
3–7 Use the method of cylindrical shells to find the volume gener-ated by rotating the region bounded by the given curves about the -axis.
3. , ,
4. , , ,
5.
6. ,
7. ,
8. Let be the volume of the solid obtained by rotating about the-axis the region bounded by and . Find both
by slicing and by cylindrical shells. In both cases draw a dia-gram to explain your method.
9–14 Use the method of cylindrical shells to find the volume of thesolid obtained by rotating the region bounded by the given curvesabout the -axis.
9. , , ,
10. , ,
11. , ,
12. ,
13. ,
14.
15–20 Use the method of cylindrical shells to find the volume generated by rotating the region bounded by the given curves about the specified axis.
15. , ; about
16. , ; about
17. , ; about
18. , ; about
19. , , ; about
20. , ; about
21–26(a) Set up an integral for the volume of the solid obtained by
rotating the region bounded by the given curve about the speci-fied axis.
(b) Use your calculator to evaluate the integral correct to five decimal places.
21. , , ; about the -axis
22. , , ; about
23. , , ; about
24. , ; about
25. about y � 4x � ssin y , 0 � y � �, x � 0;
x � �1y � 2x��1 � x3�y � x
x � ����2 � x � ��2y � �cos4xy � cos4x
x � ��2x � ��4y � 0y � tan x
yx � 2y � 0y � xe�x
x � 2 y � �2x � y 2 � 1
y � 1x � 1y � 0y � x 3
x � 1y � 2 � x 2y � x 2
x � 1y � 3y � 4x � x 2
x � �1y � 0, x � 1y � sx
x � 2y � 0, x � 1y � x 4
x � y � 3, x � 4 � �y � 1�2
x � 2x � 1 � �y � 2�2
x � 0x � 4y 2 � y 3
x � 0y � 8y � x 3
y � 2x � 0y � sx
y � 3y � 1x � 0xy � 1
x
Vy � x 2y � sxyV
y � 6x � 2x 2y � x 2
y � xy � 4x � x 2
y � e�x2, y � 0, x � 0, x � 1
x � 2x � 1y � 0y � x 3
x � 1y � 0y � s3 x
y
26. about
27. Use the Midpoint Rule with to estimate the volumeobtained by rotating about the -axis the region under the curve
, .
28. If the region shown in the figure is rotated about the -axis toform a solid, use the Midpoint Rule with to estimate thevolume of the solid.
29–32 Each integral represents the volume of a solid. Describe thesolid.
29. 30.
31.
32.
; 33–34 Use a graph to estimate the -coordinates of the points ofintersection of the given curves. Then use this information andyour calculator to estimate the volume of the solid obtained byrotating about the -axis the region enclosed by these curves.
33. ,
34. ,
35–36 Use a computer algebra system to find the exact volume ofthe solid obtained by rotating the region bounded by the givencurves about the specified line.
35. , , ; about
36. , , ; about
37–43 The region bounded by the given curves is rotated about thespecified axis. Find the volume of the resulting solid by anymethod.
37. , ; about the -axis
38. , ; about the -axis
39. , ; about the -axis
40. , ; about the -axisyy � 2y 2 � x 2 � 1
xy � 2y 2 � x 2 � 1
xy � 0y � �x 2 � 6x � 8
yy � 0y � �x 2 � 6x � 8
x � �10 � x � �y � 0y � x 3 sin x
x � ��20 � x � �y � sin4 xy � sin2 x
CAS
y � �x 4 � 4x � 1y � x 3 � x � 1
y � sx � 1y � e x
y
x
y��4
02� �� � x��cos x � sin x� dx
y1
02� �3 � y��1 � y2� dy
2� y2
0
y
1 � y 2 dyy3
02�x 5 dx
0 x
y
2
4
2 4 6 8 10
n � 5y
0 � x � 1y � s1 � x 3 y
n � 5
y � 5x 2 � y 2 � 7, x � 4;
97909_06_ch06_p442-451.qk_97909_06_ch06_p442-451 9/21/10 3:58 PM Page 445
Copyright 2010 Cengage Learning. All Rights Reserved. May not be copied, scanned, or duplicated, in whole or in part. Due to electronic rights, some third party content may be suppressed from the eBook and/or eChapter(s). Editorial review has deemed that any suppressed content does not materially affect the overall learning experience. Cengage Learning reserves the right to remove additional content at any time if subsequent rights restrictions require it.

446 CHAPTER 6 APPLICATIONS OF INTEGRATION
41. ; about the -axis
42. , ; about
43. , ; about
44. Let be the triangular region with vertices , , and, and let be the volume of the solid generated when
is rotated about the line , where . Express interms of .
45–47 Use cylindrical shells to find the volume of the solid.
45. A sphere of radius
46. The solid torus of Exercise 61 in Section 6.2
47. A right circular cone with height and base radius rh
r
Vaa � 1x � a
TV�1, 2��1, 0��0, 0�T
x � �1x � y � 1x � �y � 1�2
y � 1x � 4x � �y � 3�2
yx 2 � �y � 1�2 � 1 48. Suppose you make napkin rings by drilling holes with differentdiameters through two wooden balls (which also have differentdiameters). You discover that both napkin rings have the sameheight , as shown in the figure.(a) Guess which ring has more wood in it.(b) Check your guess: Use cylindrical shells to compute the
volume of a napkin ring created by drilling a hole withradius through the center of a sphere of radius andexpress the answer in terms of .
h
h
hRr
The term work is used in everyday language to mean the total amount of effort required to perform a task. In physics it has a technical meaning that depends on the idea of a force. Intuitively, you can think of a force as describing a push or pull on an object—for example, a horizontal push of a book across a table or the downward pull of the earth’sgravity on a ball. In general, if an object moves along a straight line with position function
, then the force F on the object (in the same direction) is given by Newton’s SecondLaw of Motion as the product of its mass and its acceleration:
In the SI metric system, the mass is measured in kilograms (kg), the displacement in meters (m), the time in seconds (s), and the force in newtons ( ). Thus a forceof 1 N acting on a mass of 1 kg produces an acceleration of 1 m�s . In the US Customarysystem the fundamental unit is chosen to be the unit of force, which is the pound.
In the case of constant acceleration, the force is also constant and the work done is defined to be the product of the force and the distance that the object moves:
If is measured in newtons and in meters, then the unit for is a newton-meter, whichis called a joule (J). If is measured in pounds and in feet, then the unit for is a foot-pound (ft-lb), which is about 1.36 J.
(a) How much work is done in lifting a 1.2-kg book off the floor to put it on a desk thatis 0.7 m high? Use the fact that the acceleration due to gravity is m�s .(b) How much work is done in lifting a 20-lb weight 6 ft off the ground?
SOLUTION(a) The force exerted is equal and opposite to that exerted by gravity, so Equation 1gives
EXAMPLE 1v
2t � 9.8
WdFWdF
work � force � distanceW � Fd2
dFF
2N � kg�m�s2
F � md 2s
dt 21
ms�t�
F � mt � �1.2��9.8� � 11.76 N
6.4 Work
97909_06_ch06_p442-451.qk_97909_06_ch06_p442-451 9/21/10 3:59 PM Page 446
Copyright 2010 Cengage Learning. All Rights Reserved. May not be copied, scanned, or duplicated, in whole or in part. Due to electronic rights, some third party content may be suppressed from the eBook and/or eChapter(s). Editorial review has deemed that any suppressed content does not materially affect the overall learning experience. Cengage Learning reserves the right to remove additional content at any time if subsequent rights restrictions require it.

SECTION 6.4 WORK 447
and then Equation 2 gives the work done as
(b) Here the force is given as lb, so the work done is
Notice that in part (b), unlike part (a), we did not have to multiply by because wewere given the weight (which is a force) and not the mass of the object.
Equation 2 defines work as long as the force is constant, but what happens if the force isvariable? Let’s suppose that the object moves along the -axis in the positive direction, from
to , and at each point between and a force acts on the object, whereis a continuous function. We divide the interval into n subintervals with endpoints
and equal width . We choose a sample point in the th subinterval. Then the force at that point is . If is large, then is small, and since is
continuous, the values of don’t change very much over the interval . In otherwords, is almost constant on the interval and so the work that is done in moving theparticle from to is approximately given by Equation 2:
Thus we can approximate the total work by
It seems that this approximation becomes better as we make larger. Therefore we definethe work done in moving the object from a to b as the limit of this quantity as .Since the right side of is a Riemann sum, we recognize its limit as being a definite inte-gral and so
When a particle is located a distance feet from the origin, a force ofpounds acts on it. How much work is done in moving it from to ?
SOLUTION
The work done is ft-lb.
In the next example we use a law from physics: Hooke’s Law states that the forcerequired to maintain a spring stretched units beyond its natural length is proportional to :
where is a positive constant (called the spring constant). Hooke’s Law holds provided thatis not too large (see Figure 1).
EXAMPLE 2
x
1623
W � y3
1�x 2 � 2x� dx �
x 3
3� x 2�
1
3
�50
3
x � 3x � 1x 2 � 2xx
W � limn l �
�n
i�1f �xi*� �x � y
b
af �x� dx4
n l �n
W � �n
i�1f �xi*� �x3
Wi � f �xi*� �x
xixi�1
Wif�xi�1, xi�f
f�xnf �xi*��xi�1, xi�ixi*�xx0, x1, . . . , xn
�a, b�ff �x�baxx � bx � a
x
t
W � Fd � 20 � 6 � 120 ft-lb
F � 20
W � Fd � �11.76��0.7� � 8.2 J
3
xf �x� � kx
kx
FIGURE 1 Hooke’s Law
x0frictionlesssurface
x0 x
ƒ=kx
(a) Natural position of spring
(b) Stretched position of spring
97909_06_ch06_p442-451.qk_97909_06_ch06_p442-451 9/21/10 3:59 PM Page 447
Copyright 2010 Cengage Learning. All Rights Reserved. May not be copied, scanned, or duplicated, in whole or in part. Due to electronic rights, some third party content may be suppressed from the eBook and/or eChapter(s). Editorial review has deemed that any suppressed content does not materially affect the overall learning experience. Cengage Learning reserves the right to remove additional content at any time if subsequent rights restrictions require it.

448 CHAPTER 6 APPLICATIONS OF INTEGRATION
A force of 40 N is required to hold a spring that has been stretched fromits natural length of 10 cm to a length of 15 cm. How much work is done in stretching thespring from 15 cm to 18 cm?
SOLUTION According to Hooke’s Law, the force required to hold the spring stretched meters beyond its natural length is . When the spring is stretched from 10 cm
to 15 cm, the amount stretched is cm m. This means that so
Thus and the work done in stretching the spring from 15 cm to 18 cm is
A 200-lb cable is 100 ft long and hangs vertically from the top of a tallbuilding. How much work is required to lift the cable to the top of the building?
SOLUTION Here we don’t have a formula for the force function, but we can use an argu-ment similar to the one that led to Definition 4.
Let’s place the origin at the top of the building and the -axis pointing downward asin Figure 2. We divide the cable into small parts with length . If is a point in the
such interval, then all points in the interval are lifted by approximately the sameamount, namely . The cable weighs 2 pounds per foot, so the weight of the part is
. Thus the work done on the part, in foot-pounds, is
We get the total work done by adding all these approximations and letting the numberof parts become large (so ):
A tank has the shape of an inverted circular cone with height 10 m and baseradius 4 m. It is filled with water to a height of 8 m. Find the work required to empty the tank by pumping all of the water to the top of the tank. (The density of water is 1000 kg�m .)
SOLUTION Let’s measure depths from the top of the tank by introducing a vertical coordi-nate line as in Figure 3. The water extends from a depth of 2 m to a depth of 10 m andso we divide the interval into n subintervals with endpoints andchoose in the th subinterval. This divides the water into layers. The th layer isapproximated by a circular cylinder with radius and height . We can computefrom similar triangles, using Figure 4, as follows:
EXAMPLE 3v
f �x� � kxxf �0.05� � 40,� 0.055
k � 400.05 � 8000.05k � 40
f �x� � 800x
W � y0.08
0.05800x dx � 800
x 2
2 �0.05
0.08
� 400��0.08�2 � �0.05�2� � 1.56 J
EXAMPLE 4v
xxi*�x
ithithxi*
ith2�x
�2�x� � xi* � 2xi* �x
distanceforce
�x l 0
W � limn l �
�n
i�12xi*�x � y
100
02x dx
� x 2]100
0 � 10,000 ft-lb
EXAMPLE 5
3
x0, x1, . . . , xn�2, 10�inixi*
ri�xri
ri � 25 �10 � xi*�
ri
10 � xi*�
4
10
0
100
x*i
x
Îx
FIGURE 2
If we had placed the origin at the bottom ofthe cable and the -axis upward, we wouldhave gotten
which gives the same answer.
W � y100
02�100 � x� dx
x
97909_06_ch06_p442-451.qk_97909_06_ch06_p442-451 9/21/10 3:59 PM Page 448
Copyright 2010 Cengage Learning. All Rights Reserved. May not be copied, scanned, or duplicated, in whole or in part. Due to electronic rights, some third party content may be suppressed from the eBook and/or eChapter(s). Editorial review has deemed that any suppressed content does not materially affect the overall learning experience. Cengage Learning reserves the right to remove additional content at any time if subsequent rights restrictions require it.

SECTION 6.4 WORK 449
Thus an approximation to the volume of the th layer of water is
and so its mass is
The force required to raise this layer must overcome the force of gravity and so
Each particle in the layer must travel a distance of approximately . The work done toraise this layer to the top is approximately the product of the force and the distance :
To find the total work done in emptying the entire tank, we add the contributions of eachof the layers and then take the limit as :
� 1568� ( 20483 ) � 3.4 � 106 J
� 1568� y10
2�100x � 20x 2 � x 3 � dx � 1568��50x 2 �
20x 3
3�
x 4
4 �2
10
W � limn l �
�n
i�11568�xi*�10 � xi*�2 �x � y
10
21568�x �10 � x�2 dx
n l �n
Wi � Fi xi* � 1568�xi*�10 � xi*�2 �x
xi*Fi
Wixi*
� 1568� �10 � xi*�2 �x
Fi � mit � �9.8�160��10 � xi*�2 �x
� 1000 �4�
25 �10 � xi*�2 �x � 160��10 � xi*�2 �x
mi � density � volume
Vi � �ri2 �x �
4�
25 �10 � xi*�2 �x
i
FIGURE 3
4
10
10-xi*
FIGURE 4
0
x
2 m
4 m
10 m
xi*
ri
Îx
ri
1. A 360-lb gorilla climbs a tree to a height of 20 ft. Find thework done if the gorilla reaches that height in(a) 10 seconds (b) 5 seconds
2. How much work is done when a hoist lifts a 200-kg rock to aheight of 3 m?
3. A variable force of pounds moves an object along astraight line when it is feet from the origin. Calculate thework done in moving the object from ft to ft.
4. When a particle is located a distance meters from the origin,a force of newtons acts on it. How much work isdone in moving the particle from to ? Interpretyour answer by considering the work done from to
and from to .
5. Shown is the graph of a force function (in newtons) thatincreases to its maximum value and then remains constant.
x � 2x � 1.5x � 1.5x � 1
x � 2x � 1cos��x�3�
x
x � 10x � 1x
5x �2
How much work is done by the force in moving an object adistance of 8 m?
6. The table shows values of a force function , where ismeasured in meters and in newtons. Use the MidpointRule to estimate the work done by the force in moving anobject from to .x � 20x � 4
f �x�xf �x�
0 x (m)
F
10
1
20
30
2 3 4 5 6 7 8
(N)
6.4 Exercises
; Graphing calculator or computer required 1. Homework Hints available at stewartcalculus.com
x 4 6 8 10 12 14 16 18 20
5 5.8 7.0 8.8 9.6 8.2 6.7 5.2 4.1f �x�
97909_06_ch06_p442-451.qk_97909_06_ch06_p442-451 9/22/10 1:47 PM Page 449
Copyright 2010 Cengage Learning. All Rights Reserved. May not be copied, scanned, or duplicated, in whole or in part. Due to electronic rights, some third party content may be suppressed from the eBook and/or eChapter(s). Editorial review has deemed that any suppressed content does not materially affect the overall learning experience. Cengage Learning reserves the right to remove additional content at any time if subsequent rights restrictions require it.

450 CHAPTER 6 APPLICATIONS OF INTEGRATION
7. A force of 10 lb is required to hold a spring stretched 4 in.beyond its natural length. How much work is done in stretchingit from its natural length to 6 in. beyond its natural length?
8. A spring has a natural length of 20 cm. If a 25-N force isrequired to keep it stretched to a length of 30 cm, how muchwork is required to stretch it from 20 cm to 25 cm?
9. Suppose that 2 J of work is needed to stretch a spring from itsnatural length of 30 cm to a length of 42 cm.(a) How much work is needed to stretch the spring from 35 cm
to 40 cm?(b) How far beyond its natural length will a force of 30 N keep
the spring stretched?
10. If the work required to stretch a spring 1 ft beyond its naturallength is 12 ft-lb, how much work is needed to stretch it 9 in.beyond its natural length?
11. A spring has natural length 20 cm. Compare the work done in stretching the spring from 20 cm to 30 cm with thework done in stretching it from 30 cm to 40 cm. How are
and related?
12. If 6 J of work is needed to stretch a spring from 10 cm to12 cm and another 10 J is needed to stretch it from 12 cm to 14 cm, what is the natural length of the spring?
13–20 Show how to approximate the required work by a Riemannsum. Then express the work as an integral and evaluate it.
13. A heavy rope, 50 ft long, weighs and hangs over theedge of a building 120 ft high. (a) How much work is done in pulling the rope to the top of
the building?(b) How much work is done in pulling half the rope to the top
of the building?
14. A chain lying on the ground is 10 m long and its mass is 80 kg. How much work is required to raise one end of thechain to a height of 6 m?
15. A cable that weighs is used to lift 800 lb of coal up amine shaft 500 ft deep. Find the work done.
16. A bucket that weighs 4 lb and a rope of negligible weight areused to draw water from a well that is 80 ft deep. The bucket is filled with 40 lb of water and is pulled up at a rate of ,but water leaks out of a hole in the bucket at a rate of .Find the work done in pulling the bucket to the top of the well.
17. A leaky 10-kg bucket is lifted from the ground to a height of12 m at a constant speed with a rope that weighs . Initially the bucket contains 36 kg of water, but the water leaks at a constant rate and finishes draining just as the bucketreaches the 12-m level. How much work is done?
0.8 kg�m
0.2 lb�s2 ft�s
2 lb�ft
0.5 lb�ft
W1W2
W2
W1
18. A 10-ft chain weighs 25 lb and hangs from a ceiling. Find thework done in lifting the lower end of the chain to the ceiling sothat it’s level with the upper end.
19. An aquarium 2 m long, 1 m wide, and 1 m deep is full ofwater. Find the work needed to pump half of the water out of the aquarium. (Use the fact that the density of water is
.)
20. A circular swimming pool has a diameter of 24 ft, the sides are5 ft high, and the depth of the water is 4 ft. How much work isrequired to pump all of the water out over the side? (Use thefact that water weighs .)
21–24 A tank is full of water. Find the work required to pump thewater out of the spout. In Exercises 23 and 24 use the fact thatwater weighs 62.5 lb�ft .
21. 22.
23. 24.
; 25. Suppose that for the tank in Exercise 21 the pump breaks downafter J of work has been done. What is the depth ofthe water remaining in the tank?
26. Solve Exercise 22 if the tank is half full of oil that has adensity of .
27. When gas expands in a cylinder with radius , the pressure atany given time is a function of the volume: . Theforce exerted by the gas on the piston (see the figure) is theproduct of the pressure and the area: . Show that thework done by the gas when the volume expands from volume
to volume is
xpiston head
W � yV2
V1
P dV
V2V1
F � �r 2P
P � P�V �r
900 kg�m3
4.7 � 105
10 ft
12 ft
6 ft
6 ft
frustum of a cone
3 ft
8 ft
3 m
1 m
2 m
3 m
8 m
3 m
3
62.5 lb�ft3
1000 kg�m3
97909_06_ch06_p442-451.qk_97909_06_ch06_p442-451 9/21/10 4:00 PM Page 450
Copyright 2010 Cengage Learning. All Rights Reserved. May not be copied, scanned, or duplicated, in whole or in part. Due to electronic rights, some third party content may be suppressed from the eBook and/or eChapter(s). Editorial review has deemed that any suppressed content does not materially affect the overall learning experience. Cengage Learning reserves the right to remove additional content at any time if subsequent rights restrictions require it.

SECTION 6.5 AVERAGE VALUE OF A FUNCTION 451
28. In a steam engine the pressure and volume of steam satisfythe equation , where is a constant. (This is true foradiabatic expansion, that is, expansion in which there is no heattransfer between the cylinder and its sur roundings.) Use Exer-cise 27 to calculate the work done by the engine during a cyclewhen the steam starts at a pressure of 160 lb�in and a volumeof 100 in and expands to a volume of 800 in .
29. (a) Newton’s Law of Gravitation states that two bodies withmasses and attract each other with a force
where is the distance between the bodies and is thegravitational constant. If one of the bodies is fixed, find thework needed to move the other from to .
(b) Compute the work required to launch a 1000-kg satellitevertically to a height of 1000 km. You may assume that theearth’s mass is kg and is concentrated at itscenter. Take the radius of the earth to be m and
.
30. The Great Pyramid of King Khufu was built of limestone inEgypt over a 20-year time period from 2580 BC to 2560 BC. Its
kPV 1.4 � kVP
r � br � a
Gr
F � Gm1m2
r 2
m2m1
33
2
5.98 � 1024
6.37 � 106
G � 6.67 � 10�11 N�m2�kg2
base is a square with side length 756 ft and its height whenbuilt was 481 ft. (It was the tallest man-made structure in theworld for more than 3800 years.) The density of the limestoneis about .(a) Estimate the total work done in building the pyramid.(b) If each laborer worked 10 hours a day for 20 years, for 340
days a year, and did of work in lifting the lime-stone blocks into place, about how many laborers wereneeded to construct the pyramid?
© Vladimir Korostyshevskiy / Shutterstock
200 ft-lb�h
150 lb�ft3
It is easy to calculate the average value of finitely many numbers , , . . . , :
But how do we compute the average temperature during a day if infinitely many tempera-ture readings are possible? Figure 1 shows the graph of a temperature function , where
is measured in hours and in C, and a guess at the average temperature, .In general, let’s try to compute the average value of a function ,
We start by dividing the interval into equal subintervals, each with length. Then we choose points , . . . , in successive subintervals and calcu-
late the average of the numbers , . . . , :
(For example, if represents a temperature function and , this means that we taketemperature readings every hour and then average them.) Since , we canwrite and the average value becomes
�1
b � a �n
i�1f �xi*� �x
f �x1*� � � � � � f �xn*�b � a
�x
�1
b � a� f �x1*� �x � � � � � f �xn*� �x�
n � �b � a���x�x � �b � a��n
n � 24f
f �x1*� � � � � � f �xn*�n
f �xn*�f �x1*�xn*x1*�x � �b � a��n
n�a, b�a � x � b.y � f �x�
Tave�TtT�t�
yave �y1 � y2 � � � � � yn
n
yny2y1
6.5 Average Value of a Function
0 t
T
Tave
5
10
15
12
6
18 24
FIGURE 1
97909_06_ch06_p442-451.qk_97909_06_ch06_p442-451 9/21/10 4:00 PM Page 451
Copyright 2010 Cengage Learning. All Rights Reserved. May not be copied, scanned, or duplicated, in whole or in part. Due to electronic rights, some third party content may be suppressed from the eBook and/or eChapter(s). Editorial review has deemed that any suppressed content does not materially affect the overall learning experience. Cengage Learning reserves the right to remove additional content at any time if subsequent rights restrictions require it.

452 CHAPTER 6 APPLICATIONS OF INTEGRATION
If we let increase, we would be computing the average value of a large number of closelyspaced values. (For example, we would be averaging temperature readings taken everyminute or even every second.) The limiting value is
by the definition of a definite integral.Therefore we define the average value of f on the interval as
Find the average value of the function on the interval .
SOLUTION With and we have
If is the temperature at time , we might wonder if there is a specific time when thetemperature is the same as the average temperature. For the temperature function graphedin Figure 1, we see that there are two such times––just before noon and just before mid-night. In general, is there a number at which the value of a function is exactly equal tothe average value of the function, that is, ? The following theorem says that thisis true for continuous functions.
The Mean Value Theorem for Integrals If is continuous on , then there exists anumber in such that
that is,
The Mean Value Theorem for Integrals is a consequence of the Mean Value Theoremfor derivatives and the Fundamental Theorem of Calculus. The proof is outlined in Exer-cise 25.
The geometric interpretation of the Mean Value Theorem for Integrals is that, for posi-tive functions , there is a number such that the rectangle with base and heighthas the same area as the region under the graph of from to . (See Figure 2 and the more picturesque interpretation in the margin note.)
Since is continuous on the interval , the MeanValue Theorem for Integrals says there is a number in such that
EXAMPLE 2v��1, 2�c
��1, 2�f �x� � 1 � x 2
baff �c��a, b�cf
yb
af �x� dx � f �c��b � a�
f �c� � fave �1
b � a yb
af �x� dx
�a, b�c�a, b�f
EXAMPLE 1v
f �c� � fave
fc
tT�t�
�1
3 �x �
x 3
3 �2
�1
� 2
fave �1
b � a yb
af �x� dx �
1
2 � ��1� y2
�1�1 � x 2 � dx
b � 2a � �1
��1, 2�f �x� � 1 � x 2
fave �1
b � a yb
af �x� dx
�a, b�
limn l �
1
b � a �n
i�1f �x i*� �x �
1
b � a yb
af �x� dx
n
y2
�1�1 � x 2 � dx � f �c��2 � ��1��
For a positive function, we can think of thisdefinition as saying
area
width� average height
FIGURE 2
0 x
y
a c b
y=ƒ
f(c)=fave
You can always chop off the top of a (two-dimensional) mountain at a certain height anduse it to fill in the valleys so that the mountainbecomes completely flat.
97909_06_ch06_p452-462.qk_97909_06_ch06_p452-462 9/21/10 4:01 PM Page 452
Copyright 2010 Cengage Learning. All Rights Reserved. May not be copied, scanned, or duplicated, in whole or in part. Due to electronic rights, some third party content may be suppressed from the eBook and/or eChapter(s). Editorial review has deemed that any suppressed content does not materially affect the overall learning experience. Cengage Learning reserves the right to remove additional content at any time if subsequent rights restrictions require it.

SECTION 6.5 AVERAGE VALUE OF A FUNCTION 453
In this particular case we can find explicitly. From Example 1 we know that ,so the value of c satisfies
Therefore
So in this case there happen to be two numbers in the interval that workin the Mean Value Theorem for Integrals.
Examples 1 and 2 are illustrated by Figure 3.
Show that the average velocity of a car over a time interval is thesame as the average of its velocities during the trip.
SOLUTION If is the displacement of the car at time , then, by definition, the averagevelocity of the car over the interval is
On the other hand, the average value of the velocity function on the interval is
(by the Net Change Theorem)
EXAMPLE 3v
�s�t2 � � s�t1�
t2 � t1� average velocity
�1
t2 � t1�s�t2 � � s�t1��
vave �1
t2 � t1y
t2
t1
v�t� dt �1
t2 � t1y
t2
t1
s��t� dt
�s
�t�
s�t2 � � s�t1�t2 � t1
ts�t�
�t1, t2 �
��1, 2�c � �1
c 2 � 1so1 � c 2 � 2
f �c� � fave � 2
fave � 2c
0 1 2_1
(_1, 2)
(2, 5)
y=1+≈
fave=2
FIGURE 3
x
y
1–8 Find the average value of the function on the given interval.
1.
2.
3.
4. ,
5. ,
6.
7.
8.
9–12(a) Find the average value of on the given interval.(b) Find such that .(c) Sketch the graph of and a rectangle whose area is the same
as the area under the graph of .ff
fave � f �c�cf
h�u� � �3 � 2u��1, ��1, 1�
h�x� � cos4x sin x, �0, ��
f ��� � sec2���2�, �0, ��2�
�0, ��2�f �t� � e sin t cos t
�1, 3�t�t� �t
s3 � t 2
t�x� � s3 x , �1, 8�
f �x� � sin 4x, ���, ��
f �x� � 4x � x 2, �0, 4�
9. ,
10. ,
; 11. ,
; 12. ,
13. If is continuous and , show that takes on thevalue 4 at least once on the interval .
14. Find the numbers such that the average value ofon the interval is equal to 3.
15. Find the average value of on .�0, 8�f
�0, b�f �x� � 2 � 6x � 3x 2b
�1, 3�fx
31 f �x� dx � 8f
�0, 2�f �x� � 2x��1 � x 2�2
�0, ��f �x� � 2 sin x � sin 2x
�1, 3�f �x� � 1�x
�2, 5�f �x� � �x � 3�2
x
y
0 2 4 6
1
6.5 Exercises
; Graphing calculator or computer required 1. Homework Hints available at stewartcalculus.com
97909_06_ch06_p452-462.qk_97909_06_ch06_p452-462 9/21/10 4:01 PM Page 453
Copyright 2010 Cengage Learning. All Rights Reserved. May not be copied, scanned, or duplicated, in whole or in part. Due to electronic rights, some third party content may be suppressed from the eBook and/or eChapter(s). Editorial review has deemed that any suppressed content does not materially affect the overall learning experience. Cengage Learning reserves the right to remove additional content at any time if subsequent rights restrictions require it.

454 CHAPTER 6 APPLICATIONS OF INTEGRATION
16. The velocity graph of an accelerating car is shown.
(a) Use the Midpoint rule to estimate the average velocity ofthe car during the first 12 seconds.
(b) At what time was the instantaneous velocity equal to theaverage velocity?
17. In a certain city the temperature (in F) hours after 9 AM wasmodeled by the function
Find the average temperature during the period from 9 AM
to 9 PM.
18. The velocity of blood that flows in a blood vessel with radiusand length at a distance from the central axis is
where is the pressure difference between the ends of the ves-sel and is the viscosity of the blood (see Example 7 in Sec-tion 3.7). Find the average velocity (with respect to ) over theinterval . Compare the average velocity with themaximum velocity.
19. The linear density in a rod 8 m long is ,where is measured in meters from one end of the rod. Findthe average density of the rod.
20. (a) A cup of coffee has temperature 95 C and takes 30 minutesto cool to 61 C in a room with temperature 20 C. UseNewton’s Law of Cooling (Section 3.8) to show that the
xkg�m12�sx � 1
0 � r � Rr
�P
v�r� �P
4�l�R2 � r 2 �
rlRv
T�t� � 50 � 14 sin �t
12
� t
4 t (seconds)
20
0 8 12
40
60
√(km/h)
���
temperature of the coffee after minutes is
where .(b) What is the average temperature of the coffee during the
first half hour?
21. In Example 1 in Section 3.8 we modeled the world populationin the second half of the 20th century by the equation
. Use this equation to estimate the averageworld population during this time period.
22. If a freely falling body starts from rest, then its displace ment isgiven by . Let the velocity after a time be . Showthat if we compute the average of the velocities with respect to
we get , but if we compute the average of the veloc-ities with respect to we get .
23. Use the result of Exercise 83 in Section 5.5 to compute theaverage volume of inhaled air in the lungs in one respiratorycycle.
24. Use the diagram to show that if is concave upward on ,then
25. Prove the Mean Value Theorem for Integrals by applying theMean Value Theorem for derivatives (see Section 4.2) to thefunction .
26. If denotes the average value of on the intervaland , show that
s vave � 23 vT
vave � 12 vTt
vTTs � 12 tt 2
P�t� � 2560e0.017185t
fave �a, b� �c � a
b � afave �a, c� �
b � c
b � afave �c, b�
a � c � b�a, b�ffave �a, b�
F�x� � xxa f �t� dt
x
y
0 a ba+b
2
f
fave f� a � b
2 ��a, b�f
t
T�t� � 20 � 75e�kt
k 0.02
97909_06_ch06_p452-462.qk_97909_06_ch06_p452-462 9/21/10 4:01 PM Page 454
Copyright 2010 Cengage Learning. All Rights Reserved. May not be copied, scanned, or duplicated, in whole or in part. Due to electronic rights, some third party content may be suppressed from the eBook and/or eChapter(s). Editorial review has deemed that any suppressed content does not materially affect the overall learning experience. Cengage Learning reserves the right to remove additional content at any time if subsequent rights restrictions require it.

APPLIED PROJECT CALCULUS AND BASEBALL 455
A P P L I E D P R O J E C T CALCULUS AND BASEBALL
In this project we explore three of the many applications of calculus to baseball. The physicalinteractions of the game, especially the collision of ball and bat, are quite complex and their models are discussed in detail in a book by Robert Adair, The Physics of Baseball, 3d ed. (New York, 2002).
1. It may surprise you to learn that the collision of baseball and bat lasts only about a thou-sandth of a second. Here we calculate the average force on the bat during this collision byfirst computing the change in the ball’s momentum.
The of an object is the product of its mass and its velocity , that is,. Suppose an object, moving along a straight line, is acted on by a force
that is a continuous function of time.(a) Show that the change in momentum over a time interval is equal to the integral
of from to ; that is, show that
This integral is called the impulse of the force over the time interval.(b) A pitcher throws a 90-mi�h fastball to a batter, who hits a line drive directly back
to the pitcher. The ball is in contact with the bat for 0.001 s and leaves the bat withvelocity 110 mi�h. A baseball weighs 5 oz and, in US Customary units, its mass ismeasured in slugs: where .(i) Find the change in the ball’s momentum.
(ii) Find the average force on the bat.
2. In this problem we calculate the work required for a pitcher to throw a 90-mi�h fastball byfirst considering kinetic energy.
The kinetic energy of an object of mass and velocity is given by . Sup-pose an object of mass , moving in a straight line, is acted on by a force thatdepends on its position . According to Newton’s Second Law
where and denote the acceleration and velocity of the object. (a) Show that the work done in moving the object from a position to a position is
equal to the change in the object’s kinetic energy; that is, show that
where and are the velocities of the object at the positions and . Hint: By the Chain Rule,
(b) How many foot-pounds of work does it take to throw a baseball at a speed of 90 mi�h?
mdv
dt� m
dv
ds
ds
dt� mv
dv
ds
v0 � v�s0 � v1 � v�s1� s0
s1
W � ys1
s 0
F�s� ds � 12 mv1
2 �12 mv0
2
s0 s1
a v
F�s� � ma � mdv
dt
sm F � F�s�
K m v K � 12 mv2
m � w�t t � 32 ft�s2
p�t1� � p�t0 � � yt 1
t 0
F�t� dt
F t0 t1
�t0, t1�
p � mv F � F�t�momentum p m v
; Graphing calculator or computer required
An overhead view of the position of abaseball bat, shown every fiftieth ofa second during a typical swing.(Adapted from The Physics of Baseball)
Batter’s box
97909_06_ch06_p452-462.qk_97909_06_ch06_p452-462 9/21/10 4:01 PM Page 455
Copyright 2010 Cengage Learning. All Rights Reserved. May not be copied, scanned, or duplicated, in whole or in part. Due to electronic rights, some third party content may be suppressed from the eBook and/or eChapter(s). Editorial review has deemed that any suppressed content does not materially affect the overall learning experience. Cengage Learning reserves the right to remove additional content at any time if subsequent rights restrictions require it.

456 CHAPTER 6 APPLICATIONS OF INTEGRATION
3. (a) An outfielder fields a baseball 280 ft away from home plate and throws it directly tothe catcher with an initial velocity of 100 ft�s. Assume that the velocity of the ballafter seconds satisfies the differential equation because of air resist-ance. How long does it take for the ball to reach home plate? (Ignore any verticalmotion of the ball.)
(b) The manager of the team wonders whether the ball will reach home plate sooner if it is relayed by an infielder. The shortstop can position himself directly between theoutfielder and home plate, catch the ball thrown by the outfielder, turn, and throw theball to the catcher with an initial velocity of 105 ft�s. The manager clocks the relaytime of the shortstop (catching, turning, throwing) at half a second. How far fromhome plate should the shortstop position himself to minimize the total time for the ball to reach home plate? Should the manager encourage a direct throw or a relayedthrow? What if the shortstop can throw at 115 ft�s?
; (c) For what throwing velocity of the shortstop does a relayed throw take the same time as a direct throw?
t dv�dt � �110 v
v�t�
A P P L I E D P R O J E C T WHERE TO SIT AT THE MOVIES
A movie theater has a screen that is positioned 10 ft off the floor and is 25 ft high. The first row of seats is placed 9 ft from the screen and the rows are set 3 ft apart. The floor of the seating areais inclined at an angle of above the horizontal and the distance up the incline that you sitis . The theater has 21 rows of seats, so . Suppose you decide that the best place to sit is in the row where the angle subtended by the screen at your eyes is a maximum. Let’s alsosuppose that your eyes are 4 ft above the floor, as shown in the figure. (In Exercise 74 in Sec- tion 4.7 we looked at a simpler version of this problem, where the floor is horizontal, but thisproject involves a more complicated situation and requires technology.)
1. Show that
where
and
2. Use a graph of as a function of to estimate the value of that maximizes . In whichrow should you sit? What is the viewing angle in this row?
3. Use your computer algebra system to differentiate and find a numerical value for the root of the equation . Does this value confirm your result in Problem 2?
4. Use the graph of to estimate the average value of on the interval . Then useyour CAS to compute the average value. Compare with the maximum and minimum values of .�
0 � x � 60��
d��dx � 0�
��xx�
b 2 � �9 � x cos ��2 � �x sin � � 6�2
a 2 � �9 � x cos ��2 � �31 � x sin ��2
� � arccos�a 2 � b 2 � 625
2ab �
�0 � x � 60x
� � 20�
CAS
Computer algebra system requiredCAS
25 ft
10 ft
9 ft
¨
x
å
4 ft
97909_06_ch06_p452-462.qk_97909_06_ch06_p452-462 9/21/10 4:02 PM Page 456
Copyright 2010 Cengage Learning. All Rights Reserved. May not be copied, scanned, or duplicated, in whole or in part. Due to electronic rights, some third party content may be suppressed from the eBook and/or eChapter(s).Editorial review has deemed that any suppressed content does not materially affect the overall learning experience. Cengage Learning reserves the right to remove additional content at any time if subsequent rights restrictions require it.

CHAPTER 6 REVIEW 457
; Graphing calculator or computer required
1–6 Find the area of the region bounded by the given curves.
1.
2.
3.
4. ,
5. ,
6. , ,
7–11 Find the volume of the solid obtained by rotating the regionbounded by the given curves about the specified axis.
7. , ;
8. , ;
9. , ;
10. , ;
11. , (where , );about the -axis
12–14 Set up, but do not evaluate, an integral for the volume ofthe solid obtained by rotating the region bounded by the givencurves about the specified axis.
12. , , ; about the -axis
13. , , ; about x � ��2y � 14� x � � ��2y � cos2 x
yx � ��3y � xy � tan x
yh � 0a � 0x � a � hx 2 � y 2 � a2
about y � �1y � 9 � x 2y � x 2 � 1
about x � �1x � 9 � y 2x � 0
about the y-axisy � x � 3x � 1 � y 2
about the x-axisy � x 2y � 2x
x � 2y � x 2y � sx
y � x 2 � 2xy � sin��x�2�
x � y 2 � 3yx � y � 0
y � 1 � 2x 2, y � � x �y � 1�x, y � x 2, y � 0, x � e
y � x 2, y � 4x � x 2
14. , ; about
15. Find the volumes of the solids obtained by rotating the regionbounded by the curves and about the followinglines.(a) The -axis (b) The -axis (c)
16. Let be the region in the first quadrant bounded by thecurves and . Calculate the followingquantities.(a) The area of (b) The volume obtained by rotating about the -axis(c) The volume obtained by rotating about the -axis
17. Let be the region bounded by the curves , and . Use the Midpoint Rule with to esti-
mate the following quantities.(a) The area of (b) The volume obtained by rotating about the -axis
; 18. Let be the region bounded by the curves and. Estimate the following quantities.
(a) The -coordinates of the points of intersection of thecurves
(b) The area of (c) The volume generated when is rotated about the -axis(d) The volume generated when is rotated about the -axis
19–22 Each integral represents the volume of a solid. Describethe solid.
19. 20.
y � sx y � x 2 y � 2
�
xy � x 6 � x � 1
y � 1 � x 2�
x��
n � 4y � 0x � 1y � tan�x 2 �,�
y�x�
�
y � 2x � x 2y � x 3�
y � 2yx
y � x 2y � x
y�x�
y��2
02� cos2x dxy
��2
02�x cos x dx
Exercises
6 Review
1. (a) Draw two typical curves and , wherefor . Show how to approximate
the area between these curves by a Riemann sum andsketch the corresponding approximating rectangles. Thenwrite an expression for the exact area.
(b) Explain how the situation changes if the curves have equations and , where for .
2. Suppose that Sue runs faster than Kathy throughout a 1500-meter race. What is the physical meaning of the areabetween their velocity curves for the first minute of therace?
3. (a) Suppose is a solid with known cross-sectional areas.Explain how to approximate the volume of by aRiemann sum. Then write an expression for the exactvolume.
SS
c � y � df �y� � t�y�x � t�y�x � f �y�
a � x � bf �x� � t�x�y � t�x�y � f �x� (b) If is a solid of revolution, how do you find the cross-
sectional areas?
4. (a) What is the volume of a cylindrical shell?(b) Explain how to use cylindrical shells to find the volume
of a solid of revolution.(c) Why might you want to use the shell method instead of
slicing?
5. Suppose that you push a book across a 6-meter-long table by exerting a force at each point from to .What does represent? If is measured in new-tons, what are the units for the integral?
6. (a) What is the average value of a function on an interval ?
(b) What does the Mean Value Theorem for Integrals say?What is its geometric interpretation?
S
�a, b�f
f �x�x6
0 f �x� dxx � 6x � 0f �x�
Concept Check
97909_06_ch06_p452-462.qk_97909_06_ch06_p452-462 9/21/10 4:02 PM Page 457
Copyright 2010 Cengage Learning. All Rights Reserved. May not be copied, scanned, or duplicated, in whole or in part. Due to electronic rights, some third party content may be suppressed from the eBook and/or eChapter(s).Editorial review has deemed that any suppressed content does not materially affect the overall learning experience. Cengage Learning reserves the right to remove additional content at any time if subsequent rights restrictions require it.

21. 22.
23. The base of a solid is a circular disk with radius 3. Find thevolume of the solid if parallel cross-sections perpendicular tothe base are isosceles right triangles with hypotenuse lyingalong the base.
24. The base of a solid is the region bounded by the parabolasand . Find the volume of the solid if the
cross-sections perpendicular to the -axis are squares with oneside lying along the base.
25. The height of a monument is 20 m. A horizontal cross-sectionat a distance meters from the top is an equilateral trianglewith side meters. Find the volume of the monument.
26. (a) The base of a solid is a square with vertices located at, and . Each cross-section per-
pendicular to the -axis is a semicircle. Find the volume ofthe solid.
(b) Show that by cutting the solid of part (a), we can rearrange itto form a cone. Thus compute its volume more simply.
27. A force of 30 N is required to maintain a spring stretched fromits natural length of 12 cm to a length of 15 cm. How muchwork is done in stretching the spring from 12 cm to 20 cm?
28. A 1600-lb elevator is suspended by a 200-ft cable that weighs10 lb�ft. How much work is required to raise the elevator fromthe basement to the third floor, a distance of 30 ft?
y4
02� �6 � y��4y � y 2� dyy
�
0� �2 � sin x�2 dx
x�0, �1��1, 0�, �0, 1�, ��1, 0�
14 x
x
xy � 2 � x 2y � x 2
29. A tank full of water has the shape of a paraboloid of revolutionas shown in the figure; that is, its shape is obtained by rotatinga parabola about a vertical axis.(a) If its height is 4 ft and the radius at the top is 4 ft, find the
work required to pump the water out of the tank.
; (b) After 4000 ft-lb of work has been done, what is the depthof the water remaining in the tank?
30. Find the average value of the function on theinterval .
31. If is a continuous function, what is the limit as of theaverage value of on the interval ?
32. Let be the region bounded by , , and ,where . Let be the region bounded by ,
, and .(a) Is there a value of such that and have the same
area?(b) Is there a value of such that sweeps out the same
volume when rotated about the -axis and the -axis?(c) Is there a value of such that and sweep out the
same volume when rotated about the -axis?(d) Is there a value of such that and sweep out the
same volume when rotated about the -axis?
4 ft
4 ft
b �1 �2
xb �1 �2
x yb �1
b �1 �2
�0, 10�f �t� � t sin�t2�
�x, x � h�fh l 0f
y � b2x � 0y � x 2�2b � 0
x � by � 0y � x 2�1
y
458 CHAPTER 6 APPLICATIONS OF INTEGRATION
97909_06_ch06_p452-462.qk_97909_06_ch06_p452-462 9/21/10 4:02 PM Page 458
Copyright 2010 Cengage Learning. All Rights Reserved. May not be copied, scanned, or duplicated, in whole or in part. Due to electronic rights, some third party content may be suppressed from the eBook and/or eChapter(s).Editorial review has deemed that any suppressed content does not materially affect the overall learning experience. Cengage Learning reserves the right to remove additional content at any time if subsequent rights restrictions require it.

Problems Plus
459
1. (a) Find a positive continuous function such that the area under the graph of from 0 to is for all .
(b) A solid is generated by rotating about the -axis the region under the curve ,where is a positive function and . The volume generated by the part of the curvefrom to is for all . Find the function .
2. There is a line through the origin that divides the region bounded by the parabolaand the -axis into two regions with equal area. What is the slope of that line?
3. The figure shows a horizontal line intersecting the curve . Find thenumber c such that the areas of the shaded regions are equal.
4. A cylindrical glass of radius and height is filled with water and then tilted until the waterremaining in the glass exactly covers its base. (a) Determine a way to “slice” the water into parallel rectangular cross-sections and then
set up a definite integral for the volume of the water in the glass.(b) Determine a way to “slice” the water into parallel cross-sections that are trapezoids and
then set up a definite integral for the volume of the water.(c) Find the volume of water in the glass by evaluating one of the integrals in part (a) or
part (b).(d) Find the volume of the water in the glass from purely geometric considerations.(e) Suppose the glass is tilted until the water exactly covers half the base. In what direction
can you “slice” the water into triangular cross-sections? Rectangular cross-sections?Cross-sections that are segments of circles? Find the volume of water in the glass.
5. (a) Show that the volume of a segment of height of a sphere of radius is
(See the figure.)(b) Show that if a sphere of radius 1 is sliced by a plane at a distance from the center
in such a way that the volume of one segment is twice the volume of the other, then is a solution of the equation
where . Use Newton’s method to find accurate to four decimal places.(c) Using the formula for the volume of a segment of a sphere, it can be shown that the
depth to which a floating sphere of radius sinks in water is a root of the equation
where is the specific gravity of the sphere. Suppose a wooden sphere of radius 0.5 mhas specific gravity 0.75. Calculate, to four-decimal-place accuracy, the depth to whichthe sphere will sink.
s
x 3 � 3rx 2 � 4r 3s � 0
rx
x0 � x � 1
3x 3 � 9x � 2 � 0
x
x
V � 13 �h 2�3r � h�
rh
r
L L
r
Lr
y � 8x � 27x 3y � c
xy � x � x 2
fb � 0b 2x � bx � 0x � 0f
y � f �x�xt � 0A�t� � t 3
tff
0 x
yy=8x-27˛
y=c
FIGURE FOR PROBLEM 3
FIGURE FOR PROBLEM 5
r
h
Computer algebra system requiredCAS
97909_06_ch06_p452-462.qk_97909_06_ch06_p452-462 9/21/10 4:02 PM Page 459
Copyright 2010 Cengage Learning. All Rights Reserved. May not be copied, scanned, or duplicated, in whole or in part. Due to electronic rights, some third party content may be suppressed from the eBook and/or eChapter(s).Editorial review has deemed that any suppressed content does not materially affect the overall learning experience. Cengage Learning reserves the right to remove additional content at any time if subsequent rights restrictions require it.

(d) A hemispherical bowl has radius 5 inches and water is running into the bowl at the rate of .(i) How fast is the water level in the bowl rising at the instant the water is 3 inches deep?
(ii) At a certain instant, the water is 4 inches deep. How long will it take to fill the bowl?
6. Archimedes’ Principle states that the buoyant force on an object partially or fully submergedin a fluid is equal to the weight of the fluid that the object displaces. Thus, for an object ofdensity floating partly submerged in a fluid of density , the buoyant force is given by
, where is the acceleration due to gravity and is the area of atypical cross-section of the object (see the figure). The weight of the object is given by
(a) Show that the percentage of the volume of the object above the surface of the liquid is
(b) The density of ice is and the density of seawater is . What percent-age of the volume of an iceberg is above water?
(c) An ice cube floats in a glass filled to the brim with water. Does the water overflow whenthe ice melts?
(d) A sphere of radius 0.4 m and having negligible weight is floating in a large freshwaterlake. How much work is required to completely submerge the sphere? The density of thewater is .
7. Water in an open bowl evaporates at a rate proportional to the area of the surface of the water.(This means that the rate of decrease of the volume is proportional to the area of the surface.)Show that the depth of the water decreases at a constant rate, regardless of the shape of thebowl.
8. A sphere of radius 1 overlaps a smaller sphere of radius in such a way that their intersectionis a circle of radius . (In other words, they intersect in a great circle of the small sphere.)Find so that the volume inside the small sphere and outside the large sphere is as large aspossible.
9. The figure shows a curve with the property that, for every point on the middle curve, the areas and are equal. Find an equation for .
10. A paper drinking cup filled with water has the shape of a cone with height and semiverticalangle . (See the figure.) A ball is placed carefully in the cup, thereby displacing some of thewater and making it overflow. What is the radius of the ball that causes the greatest volume ofwater to spill out of the cup?
�h
CBAy � 2x 2PC
rr
r
1000 kg�m3
1030 kg�m3917 kg�m3
100 � f � � 0
� f
W � � 0 t yL�h
�hA�y� dy
A�y�tF � � f t x0
�hA�y� dy
� f� 0
0.2 in3�s
460
0 x
y
Py=≈
A
B
C
y=2≈
FIGURE FOR PROBLEM 9
FIGURE FOR PROBLEM 6
y=0
h
y=_h
y=L-h
L
97909_06_ch06_p452-462.qk_97909_06_ch06_p452-462 9/21/10 4:02 PM Page 460
Copyright 2010 Cengage Learning. All Rights Reserved. May not be copied, scanned, or duplicated, in whole or in part. Due to electronic rights, some third party content may be suppressed from the eBook and/or eChapter(s).Editorial review has deemed that any suppressed content does not materially affect the overall learning experience. Cengage Learning reserves the right to remove additional content at any time if subsequent rights restrictions require it.
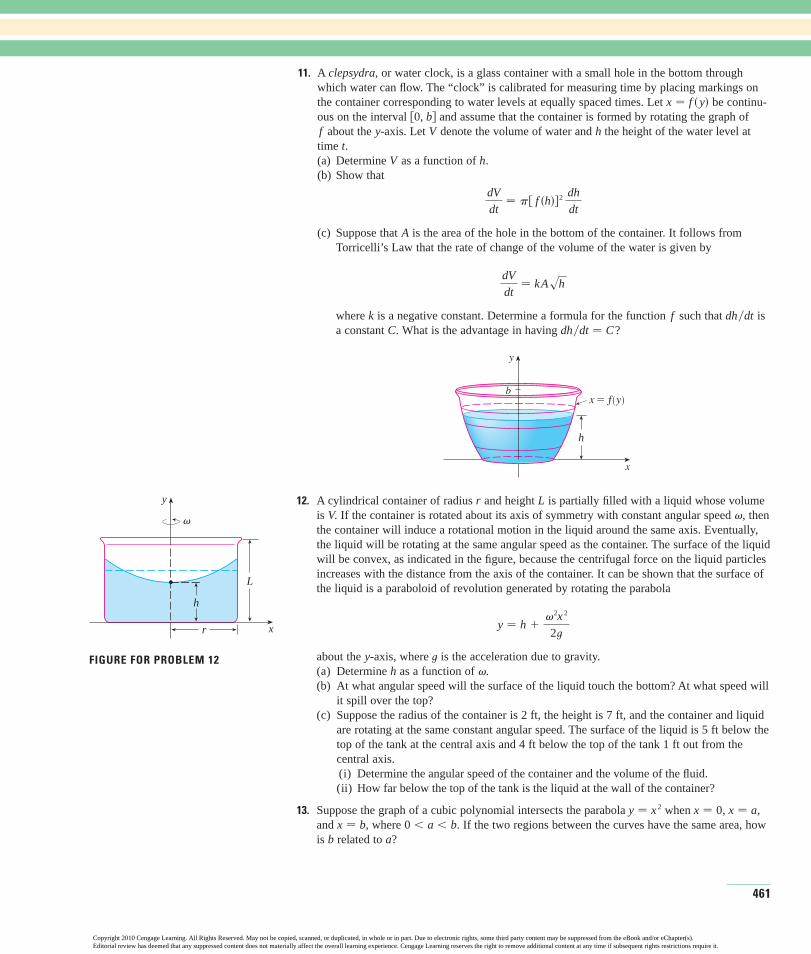
461
11. A clepsydra, or water clock, is a glass container with a small hole in the bottom throughwhich water can flow. The “clock” is calibrated for measuring time by placing markings onthe container corresponding to water levels at equally spaced times. Let be continu-ous on the interval and assume that the container is formed by rotating the graph of
about the -axis. Let denote the volume of water and the height of the water level attime .(a) Determine as a function of .(b) Show that
(c) Suppose that is the area of the hole in the bottom of the container. It follows from Torricelli’s Law that the rate of change of the volume of the water is given by
where is a negative constant. Determine a formula for the function such that isa constant . What is the advantage in having ?
12. A cylindrical container of radius and height is partially filled with a liquid whose volumeis . If the container is rotated about its axis of symmetry with constant angular speed , thenthe container will induce a rotational motion in the liquid around the same axis. Eventually,the liquid will be rotating at the same angular speed as the container. The surface of the liquidwill be convex, as indicated in the figure, because the centrifugal force on the liquid particlesincreases with the distance from the axis of the container. It can be shown that the surface ofthe liquid is a paraboloid of revolution generated by rotating the parabola
about the -axis, where is the acceleration due to gravity.(a) Determine as a function of .(b) At what angular speed will the surface of the liquid touch the bottom? At what speed will
it spill over the top?(c) Suppose the radius of the container is 2 ft, the height is 7 ft, and the container and liquid
are rotating at the same constant angular speed. The surface of the liquid is 5 ft below thetop of the tank at the central axis and 4 ft below the top of the tank 1 ft out from thecentral axis.(i) Determine the angular speed of the container and the volume of the fluid.(ii) How far below the top of the tank is the liquid at the wall of the container?
13. Suppose the graph of a cubic polynomial intersects the parabola when , ,and , where . If the two regions between the curves have the same area, howis related to ?ab
0 � a � bx � bx � ax � 0y � x 2
�hty
y � h ��2x 2
2t
�VLr
x
y
x=f(y)
h
b
dh�dt � CCdh�dtfk
dV
dt� kAsh
A
dV
dt� � � f �h��2 dh
dt
hVt
x � f �y�
f�0, b�
hVy
FIGURE FOR PROBLEM 12
x
y
h
L
r
v
97909_06_ch06_p452-462.qk_97909_06_ch06_p452-462 9/21/10 4:03 PM Page 461
Copyright 2010 Cengage Learning. All Rights Reserved. May not be copied, scanned, or duplicated, in whole or in part. Due to electronic rights, some third party content may be suppressed from the eBook and/or eChapter(s).Editorial review has deemed that any suppressed content does not materially affect the overall learning experience. Cengage Learning reserves the right to remove additional content at any time if subsequent rights restrictions require it.
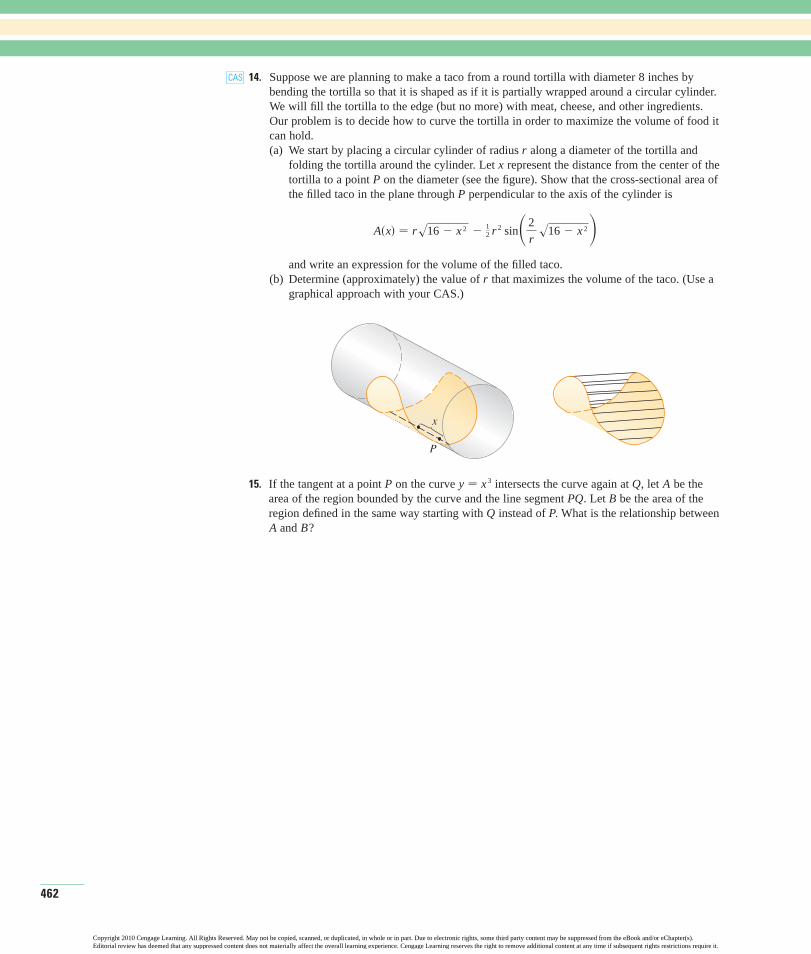
14. Suppose we are planning to make a taco from a round tortilla with diameter 8 inches bybending the tortilla so that it is shaped as if it is partially wrapped around a circular cylinder.We will fill the tortilla to the edge (but no more) with meat, cheese, and other ingredients.Our problem is to decide how to curve the tortilla in order to maximize the volume of food itcan hold.(a) We start by placing a circular cylinder of radius along a diameter of the tortilla and
folding the tortilla around the cylinder. Let represent the distance from the center of thetortilla to a point on the diameter (see the figure). Show that the cross-sectional area ofthe filled taco in the plane through perpendicular to the axis of the cylinder is
and write an expression for the volume of the filled taco.(b) Determine (approximately) the value of that maximizes the volume of the taco. (Use a
graphical approach with your CAS.)
15. If the tangent at a point on the curve intersects the curve again at , let be the area of the region bounded by the curve and the line segment . Let be the area of theregion defined in the same way starting with instead of . What is the relationship between
and ?BAPQ
BPQAQy � x 3P
P
x
r
A�x� � rs16 � x 2 �12 r 2 sin�2
rs16 � x 2 �
PP
xr
CAS
462
97909_06_ch06_p452-462.qk_97909_06_ch06_p452-462 9/21/10 4:03 PM Page 462
Copyright 2010 Cengage Learning. All Rights Reserved. May not be copied, scanned, or duplicated, in whole or in part. Due to electronic rights, some third party content may be suppressed from the eBook and/or eChapter(s). Editorial review has deemed that any suppressed content does not materially affect the overall learning experience. Cengage Learning reserves the right to remove additional content at any time if subsequent rights restrictions require it.