Contributions of Cherenkov light to the signals from lead tungstate crystals
19
arXiv:0707.4013v1 [physics.ins-det] 26 Jul 2007 Contributions of ˇ Cerenkov Light to the Signals from Lead Tungstate Crystals N. Akchurin a , L. Berntzon a , A. Cardini b , R. Ferrari c , G. Gaudio c , J. Hauptman d , H. Kim a , L. La Rotonda e , M. Livan c , E. Meoni e , H. Paar f , A. Penzo g , D. Pinci h , A. Policicchio e , S. Popescu i, 1 G. Susinno e , Y. Roh a , W. Vandelli c and R. Wigmans a, 2 a Texas Tech University, Lubbock (TX), USA b Dipartimento di Fisica, Universit` a di Cagliari and INFN Sezione di Cagliari, Italy c Dipartimento di Fisica Nucleare e Teorica, Universit` a di Pavia and INFN Sezione di Pavia, Italy d Iowa State University, Ames (IA), USA e Dipartimento di Fisica, Universit´ a della Calabria and INFN Cosenza, Italy f University of California at San Diego, La Jolla (CA), USA g INFN Trieste, Italy h Dipartimento di Fisica, Universit` a di Roma ”La Sapienza” and INFN Sezione di Roma i CERN, Gen` eve, Switzerland Abstract Results are presented of detailed measurements of the signals generated by high-energy electrons and muons in lead tungstate crystals. A significant fraction of the light produced in these crystals and detected by photomultiplier tubes is the result of the ˇ Cerenkov mech- anism. This is concluded from the angular dependence of the signals and from their time structure. Depending on the orientation of the crystals and on the particle type, ˇ Cerenkov light may account for up to 15% of the total signals. Key words: ˇ Cerenkov light, lead tungstate, hadron calorimetry 1 On leave from IFIN-HH, Bucharest, Romania. 2 Corresponding author. Email [email protected], fax (+1) 806 742-1182. Preprint submitted to Nuclear Instruments and Methods A 1 February 2008
Transcript of Contributions of Cherenkov light to the signals from lead tungstate crystals

arX
iv:0
707.
4013
v1 [
phys
ics.
ins-
det]
26
Jul 2
007
Contributions of Cerenkov Light to the Signals fromLead Tungstate Crystals
N. Akchurina, L. Berntzona, A. Cardinib, R. Ferraric, G. Gaudioc,J. Hauptmand, H. Kima, L. La Rotondae, M. Livanc, E. Meonie,H. Paarf , A. Penzog, D. Pincih, A. Policicchioe, S. Popescui, 1
G. Susinnoe, Y. Roha, W. Vandellic and R. Wigmansa, 2
a Texas Tech University, Lubbock (TX), USAb Dipartimento di Fisica, Universita di Cagliari and INFN Sezione di Cagliari, Italy
c Dipartimento di Fisica Nucleare e Teorica, Universita di Pavia and INFN Sezione diPavia, Italy
d Iowa State University, Ames (IA), USAe Dipartimento di Fisica, Universita della Calabria and INFN Cosenza, Italy
f University of California at San Diego, La Jolla (CA), USAg INFN Trieste, Italy
h Dipartimento di Fisica, Universita di Roma ”La Sapienza” and INFN Sezione di Romai CERN, Geneve, Switzerland
Abstract
Results are presented of detailed measurements of the signals generated by high-energyelectrons and muons in lead tungstate crystals. A significant fraction of the light producedin these crystals and detected by photomultiplier tubes is the result of theCerenkov mech-anism. This is concluded from the angular dependence of the signals and from their timestructure. Depending on the orientation of the crystals andon the particle type,Cerenkovlight may account for up to 15% of the total signals.
Key words: Cerenkov light, lead tungstate, hadron calorimetry
1 On leave from IFIN-HH, Bucharest, Romania.2 Corresponding author. Email [email protected], fax (+1) 806742-1182.
Preprint submitted to Nuclear Instruments and Methods A 1 February 2008

1 Introduction
In recent years, there has been a growing interest in lead tungstate (PbWO4) crys-tals as detectors for high-energy particles. At CERN’s Large Hadron Collider, boththe CMS [1] and ALICE [2] experiments are completing very large electromag-netic (em) calorimeter systems consisting of these crystals. Smaller detectors ofthis type are either operating or planned, for example for the PANDA [3] and HY-CAL [4] experiments. Lead tungstate crystals are attractive as detectors for emshowers because of their high density, which implies a shortradiation length andMoliere radius, their fast signals and their relative insensitivity to the effects of ra-diation damage. On the downside, we mention the small light yield, less than 1/300of the light yield of the widely used NaI(Tl) and CsI(Tl) crystals [5]. Because ofthis small light yield, and the large effectiveZ value, it is reasonable to assume thata significant fraction of the light produced by PbWO4 crystals is actually the resultof Cerenkov radiation, rather than molecular de-excitation.
We have shown previously that the combined availability ofCerenkov and scintil-lation signals for hadronic showers makes it possible to eliminate the effects of thedominating source of fluctuations in calorimetric hadron detection, and thus con-siderably improve hadronic calorimeter performance [6]. However, because of thesmallCerenkov light yield, sampling calorimeters are less than ideal for taking fulladvantage of this. On the other hand, homogeneous calorimeters whose light sig-nals could be split into scintillation andCerenkov components hold great promisefor high-quality hadron calorimetry [7].
For these reasons, we set out to measure the composition of the signals producedby PbWO4 crystals3 . In Sections 2 and 3, we describe the methods used to de-termine theCerenkov component of the measured signals, and the experimentalsetup in which the crystals were tested. In Section 4, we discuss the experimentaldata that were taken and the methods used to analyze these data. In Section 5, theexperimental results are presented and discussed. A summary and conclusions arepresented in Section 6.
2 Methods to distinguishCerenkov from scintillation light.
If one wants to distinguish the contributions from theCerenkov and scintillationcomponents to the signals from crystals that generate a mixture of these, such asPbWO4, one could use one or several of the following characteristics:
3 The PbWO4 crystals used for these studies were provided by the ALICE Collaboration,who use them for their PHOS calorimeter.
2

(1) Directionality. TheCerenkov light is emitted at a fixed angle with respect tothe momentum vector of the particle that generates it, whilethe scintillationlight is isotropically emitted.
(2) Time structure. TheCerenkov light isprompt, whereas scintillation processeshave one or several characteristic decay times.
(3) The spectrum. TheCerenkov light is emitted with a characteristicλ−2 spec-trum, while the scintillation processes have their own characteristic spectra.
(4) Polarization. Contrary to scintillation light,Cerenkov light is polarized.
In the present study, we have exploited the first two characteristics. It is a wellknown fact that the light yield of PbWO4 crystals is very temperature dependent.It changes by -2.3% per degree Celsius. This is obviously only true for thescintil-lation light. Therefore, the fraction of the light that is producedby theCerenkovmechanism is expected to increase with temperature. Our measurements have beenperformed at room temperature. One should keep this in mind when translating ourresults to the ALICE experiment, from which the crystals we tested were borrowed.The ALICE PbWO4 calorimeter operates at a much lower temperature (−15◦C),where the relative contributions ofCerenkov light to the signals are correspond-ingly smaller4 .
2.1 Directionality
Cerenkov light is emitted by charged particles traveling faster thanc/n, the speedof light in the medium with refractive indexn in which this process takes place.The light is emitted at a characteristic angle,θC , defined bycos θC = 1/βn. Inthe case of sufficienty relativistic particles (i.e.,β ∼ 1) traversing PbWO4 crystals(n = 2.2), θC ∼ 63◦.
In order to detect the contribution ofCerenkov light to the signals from a PbWO4
crystal, we equipped both ends of the crystal with a photomultiplier tube (PMT).By varying the detectororientationwith respect to the direction of the incomingparticles, a contribution ofCerenkov light would then manifest itself as an angle-dependent asymmetry. This is illustrated in Figure 1, whichshows the setup of theinitial measurements we performed with a cosmic-ray telescope to test this prin-ciple [7]. The PMT gains were equalized for the leftmost geometry, in which thecrystal was oriented horizontally. By tilting the crystal through an angle (θ) suchthat the axis of the crystal is at theCerenkov angleθC with respect to the particledirection,Cerenkov light produced by the cosmic rays traversing the trigger coun-ters would be preferably detected in either theL (central geometry) orR (rightmostgeometry) PMT. By measuring the response asymmetry(R−L)/R+L) as a func-tion of the tilt angleθ, the contribution ofCerenkov light to the detector signals
4 The PbWO4 ECAL of the CMS experiment is designed to operate at 18◦C.
3

Fig. 1. Principle of the asymmetry measurement used to establish the contribution ofCerenkov light to the signals from the PbWO4 crystals. Depending on the orientation, thisdirectionally emitted light contributes differently to the signals from the left and right pho-tomultiplier tubes.
could be determined.
The initial cosmic-ray measurements indicated that the contribution of Cerenkovlight was at the level of 15 - 20% [7]. Because of the extremelylow event rates andthe tiny signals (typically 20 - 30 MeV), we decided to perform systematic studiesusing particle beams. The results of these studies are the topic of the present paper.
2.2 Time structure
The scintillation process in PbWO4 has a decay constant of∼ 10 ns, whereas theCerenkov component of the signals is prompt. In the cosmic-ray measurementsmentioned above, we also studied the time structure of the signals, using a fastoscilloscope capable of storing both pulse shapes simultaneously. These measure-ments qualitatively confirmed the expected differences between the signals mea-sured in theR andL PMTs [7]. However, low statistics and very small signalslimited the quality of the information that could be derivedfrom these measure-ments. In the beam measurements described here, we measuredthe signal shapeswith very fast Flash ADCs (effective sampling frequency 800MHz). As is shownin Figure 2, this turned out to be a wonderful experimental tool. In a period of a fewdays, detailed pulse shapes were recorded for millions of events. The figure clearlyshows the additional prompt signal component that appears when the crystal is ro-tated from a position in whichCerenkov light does not contribute to the signals(θ = −30◦) to a position where it does (θ = 30◦). The trailing edge of the PMTsignals is not affected by this rotation and is indeed in great detail (including the
4

Fig. 2. Average time structure of the signals measured with the PMT reading out one end(R) of a PbWO4 crystal traversed by 10 GeV electrons, for two different orientations of thecrystal. Atθ = 30
◦, Cerenkov light contributes to the signals, atθ = −30◦, it does not.
effects of reflections in the signal cables) identical for these two pulse shapes.
3 Experimental setup
3.1 Detector and beam line
The measurements described in this paper were performed in the H4 beam line ofthe Super Proton Synchrotron at CERN. Our detector was a PbWO4 crystal witha length of 18 cm and a cross section of2.2 × 2.2 cm2. The transverse dimen-sion, relevant for our measurements, corresponds to 2.5 radiation lengths. The lightproduced by particles traversing this crystal was read out by two photomultipliertubes5 , located at opposite ends. In order to reduce the light trapping effects of thelarge refractive index of PbWO4, the PMTs were coupled to the crystal by meansof silicone “cookies” (n = 1.403).
This crystal was mounted on a platform that could rotate around a vertical axis.The crystal was oriented in the horizontal plane and the rotation axis went throughits geometrical center. The particle beam was also steered through this center, asillustrated in Figure 3. The angleθ, which is frequently used in the following, rep-resents the angle between the crystal axis and a plane perpendicular to the beamline. The angle increases when the crystal is rotated such that the crystal axis L-Rapproaches the direction of the traveling beam particles. The crystal orientationsshown in Figures 2 and 3 correspond thus toθ > 0 andθ < 0, respectively.
5 Hamamatsu R5900U, 10-stage, bialkali photocathode, borosilicate window.
5

Fig. 3. Experimental setup in which the beam tests were performed.
Two small scintillation counters provided the signals thatwere used to trigger thedata acquisition system. These Trigger Counters (TC) were 2.5 mm thick, and thearea of overlap was 6×6 cm2. A coincidence between the logic signals from thesecounters provided the trigger.
3.2 Data acquisition
Measurement of the time structure of the crystal signals formed a very importantpart of the tests described here. In order to limit distortion of this structure as muchas possible, we used 15 mm thick air-core cables to transportthe detector signalsto the counting room. Such cables were also used for the signals from the triggercounters, and these were routed such as to minimize delays inthe DAQ system6 .
Depending on the desired type of information, the crystal signals were either sentto a charge ADC, or to the FADC. The response asymmetry measurements werebased on the digitized integrated charge, the time structure was measured with theFlash ADC7 , which digitized the amplitude of the signals at a rate of 200MHz.During a time interval of 80 ns, 16 measurements of the amplitude were thus ob-tained. In order to further increase this rate, and thus improve the time resolutionof this measurement, we used several input channels for eachsignal. The crystalsignals were split (passively, with correct impedance matching) into 4 equal partsat the counting room end. These 4 signals were measured separately in 4 differentchannels of the FADC module. Signals 2, 3 and 4 were delayed by1.25 ns, 2.50 nsand 3.75 ns with respect to signal 1. By using the FADC module in this way, the
6 We measured the signal speed to be 0.78c in these cables7 Dr. Struck SIS3320, http://www.struck.de/sis3320.htm
6

time structure of the signals was thus effectively measuredwith a resolution of 1.25ns (800 MHz).
The quality of the information obtained in this way is illustrated in Figure 2, whichshows the average time structure of the signals from 10 GeV electrons traversingthe crystal forθ = 30◦ and−30◦, respectively.
The charge measurements were performed with 12-bit LeCroy 1182 ADCs. Thesehad a sensitivity of 50 fC/count and a conversion time of 16µs. The ADC gatewidth was 100 ns, and the calorimeter signals arrived∼ 20 ns after the start of thegate.
The data acquisition system used VME electronics. A single VME crate hosted allthe needed readout and control boards. The trigger logic wasimplemented throughNIM modules and the signals were sent to a VME I/O register, which also collectedthe spill and the global busy information. The VME crate was linked to a Linuxbased computer through an SBS 6208 optical VME-PCI interface that allowedmemory mapping of the VME resources via an open source driver9 . The computerwas equipped with a 2 GHz Pentium-4 CPU, 1 GB of RAM, and was running aCERN SLC 4.3 operating system10 .
The data acquisition was based on a single-event polling mechanism and performedby a pair of independent programs that communicated througha first-in-first-outbuffer, built on top of a 32 MB shared memory. Only exclusive accesses were al-lowed and concurrent requests were synchronised with semaphores. The chosenscheme optimized the CPU utilization and increased the datataking efficiency byexploiting the bunch structure of the SPS, where beam particles were provided toour experiment during a spill of 4.8 s, out of a total cycle time of 16.8 s. Duringthe spill, the readout program collected data from the VME modules and storedthem into the shared memory, with small access times. Duringthe remainder of theSPS cycle, a recorder program dumped the events to the disk. Moreover, the bufferpresence allowed low-priority monitoring programs to run (off-spill) in spy mode.With this scheme, we were able to reach a data acquisition rate as high as 2 kHz,limited by the FADC readout time. The typical event size was∼ 1 kB. All detectorsignals were monitored on-line.
3.3 Calibration of the detectors
The absolute calibration of the signals generated by the crystal was not a majorconcern in these tests. On the other hand, it was absolutely essential that the gains
8 http://www.gefanucembedded.com/products/4579 http://www.awa.tohoku.ac.jp/∼sanshiro/kinoko-e/vmedrv/10 http://linux.web.cern.ch/linux/scientific4/
7

of the 2 PMTs,L andR, that collected the light generated in the crystals at thetwo opposite ends of the crystal were equalized. We used 10 GeV electrons for thatpurpose. The crystal was oriented such that the beam enteredthe detector perpen-dicular to the crystal axis (θ = 0), so that anyCerenkov light generated by thebeam particles would be observed in the same proportion by both PMTs. The highvoltages were chosen such that the average signals were about 300 ADC countsabove the pedestal value. Off-line, the calibration constants were fine-tuned such asto equalize the responses of the two PMTs.
4 Experimental data
The crystals were exposed to beams of 150 GeVµ+ and 10 GeV electrons. Theangleθ between the crystal axis and the plane perpendicular to the beam line wasvaried from−45◦ to 45◦, in steps of7.5◦. At each angle, 100 000 events werecollected for the response asymmetry measurements, and another 100 000 for thetime structure.
Since the particles traversed the detector perpendicular to the longitudinal crys-tal axis, the effective thickness of the crystal was only a few radiation lengths(2.5X0/ cos θ) in this setup. In order to probe the em showers at greater depth,we also performed a series of measurements in which the electrons traversed 4 cmof lead (∼ 7X0) installed directly upstream of the crystal. In this way, the lightgenerated in the crystals reflected the particle distribution just beyond the showermaximum, at a depth of7 − 10X0. To avoid introducing too large a change inthis effective depth, the latter measurements were limitedto anglesθ ranging from−30◦ to 30◦. Separate measurements were performed of the response asymmetryand of the time structure. As before, 100 000 events were collected for each run.
5 Experimental results
5.1 Left-Right asymmetry
We define the response asymmetry as the ratio(R − L)/(R + L), whereR andLrepresent the average signals measured in the PMTsR andL for the same events.Since these signals were equalized forθ = 0, any non-zero value in this ratiois indicative for a non-isotropic component in the light generated in the crystals,i.e.,Cerenkov light.
The relationship between this response asymmetry (to be calledα in the following)
8

and the relative contribution ofCerenkov light to the PMT signals11 can be seenas follows. If we call the relative contributions ofCerenkov light to theR andLsignalsǫR andǫL, respectively (withǫR andǫL normalized to the scintillator signalsin each channel), then
α =ǫR − ǫL
2 + ǫR + ǫL(1)
This ratio reaches its maximum possible value whenCerenkov light reaches onlyone of the PMTs,e.g.,R. In that case,ǫL = 0, α = ǫR/(2 + ǫR), and the relativecontribution ofCerenkov light to thetotalsignal from this PMT equals
fC =ǫR
1 + ǫR=
2α
1 + α(2)
This situation may occur when a single relativistic chargedparticle traverses thecrystal. Depending on the orientation of the crystal and theindex of refraction, theacceptance of theCerenkov light emitted by that particle may in that case be limitedto one PMT only. Equation 1 shows that when theCerenkov light produced in thecrystal is shared between both PMTs,i.e.,when bothǫR andǫL are non-zero, thenthe measured value of the asymmetry is smaller than the maximum possible valuementioned above, and Equation 2 underestimates the contribution ofCerenkov lightto the signals. As we shall see below, this situation occurs in developing showers.
Figure 4 shows the response asymmetry measured for 10 GeV electrons, as a func-tion of the angleθ. This curve exhibits exactly the characteristics expectedfrom acontribution ofCerenkov light:
• It is symmetric aroundθ = 0, i.e., the measured response asymmetry at an angleθ is equal to that at−θ.
• The asymmetry rapidly increases when the crystal is rotated, reaches a maxi-mum value forθ = ±30◦, and declines again for larger angles. This reflects thechanging acceptance ofCerenkov light, as we verified with a very simple lighttracing Monte Carlo simulation.
• The maximum asymmetry is measured for an angle that is close to the expectedvalue of90◦ − θC = 27◦, at which angle the acceptance forCerenkov light islargest in this geometry.
The maximum asymmetry amounts to 0.07, and we conclude from this that whenthe crystal is oriented atθ = ±30◦, ∼ 13% of the signal measured in the PMTthat is optimally located for detectingCerenkov light, is indeedCerenkov light(Equation 2). As the orientation of the crystal is changed, this percentage decreases,reflecting the reduced acceptance forCerenkov light of the PMTs. Atθ = 0, the
11 It should be emphasized that this discussion concerns the PMT signals, andnot the num-bers of photons produced by the different mechanisms. For the latter, differences in produc-tion spectra and photocathode quantum efficiencies would have to be taken into account.
9

Fig. 4. Left-right response asymmetry measured for 10 GeV electrons showering in a2.5X0
thick PbWO4 crystal, as a function of the orientation of the crystal (theangleθ). Resultsare shown for the early and the late components of the showers. The latter measurementswere obtained by placing 4 cm of lead upstream of the crystal.
total acceptance forCerenkov light in both PMTs combined reaches its minimumvalue.
The above arguments are, strictly speaking, only valid for particles that traversethe crystal in a direction parallel to the beam. Upon traversing the crystal, thebeam electrons lose a large fraction of their energy (typically > 80%) radiatingbremsstrahlung photons. The relativistic electrons and positrons produced whenthese photons convert in the crystal travel also predominantly in the same direction.For the purpose of this experiment, the early part of the electromagnetic showersprobed in this measurement thus resembles a collection of particles traveling allapproximately in the same direction,i.e.,parallel to the beam line.
However, as the shower develops, so does its isotropic component. This componentis primarily due to shower electrons generated in Compton scattering or through thephotoelectric effect. In fully contained em showers, this component is responsiblefor about half of the signal [8]. It is also thanks to this component that0◦ quartz-fiber calorimeters, such as the CMS HF, produce meaningful signals [9].
For this reason, we also wanted to measure the effect of this increased isotropy onthe left/right response asymmetry. By placing 4 cm of lead directly upstream of thecrystal, the electron showers developed in a lead/PbWO4 combination. For 10 GeVelectrons, the shower maximum was located at a depth of∼ 5X0, (i.e., inside the
10

lead absorber), and the crystal probed the light produced ata depth of7 − 10X0.
Figure 4 also shows the response asymmetry measured for thislight. The asym-metry is considerably smaller than for the light produced inthe early part of theshower, by about a factor of three. Yet, the characteristicsof the(R − L)/(R + L)curve indicate that also in this case, the asymmetry is the result of the contribu-tion of Cerenkov light to the signals. The reduction in the net directionality of themeasured light indicates the importance of the isotropic shower component.
In another paper, we describe the results of measurements weperformed on (almostfully) contained electromagnetic showers with a PbWO4 calorimeter. In that case,the asymmetry resulted from the integration over the full longitudinal shower pro-file, with the early part contributing most to the net asymmetry and the latest partsvery little, if anything. We measured for such showers an overall response asym-metry of 0.044 [10],i.e.,∼ 60% of the asymmetry observed in the first2 − 3X0
reported here.
Fig. 5. Signal distribution for 150 GeVµ+ traversing the2.5X0 thick PbWO4 crystal per-pendicularly (θ = 0). The insert shows the results of fits to the most probable signal region.See text for details.
The signals measured in these experiments were very small. According to EGS4simulations, 10 GeV electrons deposited on average 320 MeV in the PbWO4 crys-tal, when it was placed perpendicular to the beam line. However, this was still oneorder of magnitude larger than the signals recorded for the muons. Figure 5 showsa typical signal distribution, measured in one of the PMTs for θ = 0. Based on acomparison with the 10 GeV electron signals, this distribution gave a most probableenergy deposit of 25 MeV.
11

Fig. 6. Left-right response asymmetry measured for 150 GeV muons traversing a2.5X0
thick PbWO4 crystal, as a function of the orientation of the crystal (theangleθ). The asym-metry concerns themost probablesignal value derived from a Landau fit (the triangles) ora Gaussian fit (the closed circles), or the average signal value (the open squares).
The most probable signal value was also used for the responseasymmetry measure-ment for these particles. However, the Landau fits did in general not reproduce themeasured signal distributions very well. This is because the beam spot was largerthan the transverse size of the crystal. As a result, many beam particles missedthe crystal (as evidenced by the large pedestal peak in Figure 5), whereas otherstraversed it close to the edge, scattering out, leading to sub-mip signals. For thisreason, we also studied the left-right asymmetry using two other characteristics ofthe signal distribution: the average signal and the result of a Gaussian fit around themost probable value (see insert Figure 5).
The angular dependence of the left-right asymmetry for muons traversing the PbWO4crystal is shown in Figure 6, for all three figures-of-merit derived from the sig-nal distributions. This curve shows the same general characteristics as the onemeasured for the electrons (Figure 4). The maximum asymmetry is measured forθ ≈ θC (27◦), in the PMT oriented in the optimal direction for detectingtheCerenkov light. The maximum asymmetry is∼ 0.08, which translates into a 15%contribution ofCerenkov light to the total signals at that angle (Equation 2). Italso seems that the asymmetry is somewhat smaller when the average detector sig-nal is used instead of the most probable value. This might indicate thatCerenkovlight produced in the radiative component of the energy lostby the muons is some-what less directional than that produced by the ionizing component. This wouldbe consistent with the observations of the asymmetry in electromagnetic showers
12

discussed above.
Based on the signal distributions observed in these measurements and on the as-sumption that the energy deposition by 10 GeV electrons is calculated correctlyby GEANT4, we can determine the specific energy loss of muons in PbWO4. Themost probable energy loss is 11.6 MeV/cm, while the measuredaverage energy lostby 150 GeVµ+ is 13.2 MeV/cm.
Fig. 7. Distribution of the left-right response asymmetry,measured for 10 GeV electronstraversing the crystal atθ = 30
◦, together with the results of a Gaussian fit.
We can also determine the “light yield” of the crystals and PMTs used in our stud-ies, or rather the number of photoelectrons measured (with the PMTs chosen forthese studies) per unit deposited energy. Figure 7 shows theevent-to-event distri-bution of the left-right asymmetry measured for 10 GeV electrons traversing thecrystal atθ = 30◦, together with the results of a Gaussian fit. Atθ = 0◦, thewidth of the distribution increased from 0.0334 to 0.0384. If we assume that thewidth is dominated by statistical fluctuations in the numberof photoelectrons, thena σ of 0.0384 translates into an average number of photoelectrons of∼ 340 perPMT, or∼ 1 photoelectron per MeV deposited energy. Atθ = 0◦, the width of the(R − L)/(R + L) distribution for the 150 GeVµ+ was 0.1274, which translatesinto an average signal of 31 photoelectrons per PMT.
The average signal from the 10 GeV electrons increased by 47%when the crystalwas rotated from 0◦ to 30◦. This reflects the onset of the shower development, sincea simple increase in path length (∼ cos−1 θ) would only lead to a 15% increase. Themeasured width of the asymmetry distribution at 30◦ (σ = 0.0334) corresponds tothe statistical fluctuations in 448 photoelectrons/PMT, anincrease of only 32%with respect to the 0◦ case. The fact that the decreasing width does not match theincreased signal indicates that other factors (e.g.,temperature effects, response non-uniformities) did contribute to the measured width and that, therefore, the estimated
13

light yield is in fact a lower limit.
The distribution shown in Figure 7 illustrates one other important aspect of theseexperimental data. All the measurement results reported inthis paper concernav-erages. Both the observed left/right asymmetries, and also the angular dependenceof the time structure discussed in the next subsection, concern the average charac-teristics of a large number of events, typically 100 000. Thequestion arises howaccurately one can determine theCerenkov content of the signal from one particu-lar event on the basis of these characteristics. Figure 7 provides an answer to thatquestion, for what concerns the left/right asymmetry. It shows that, if for a particu-lar 10 GeV electron traversing this crystal, an asymmetry ismeasured of 0.080, theexperimental uncertainty on this number is 0.033 (1 standard deviation). In otherwords, that particular signal contains 14.8±5.9%Cerenkov light (Equation 2). Ofcourse, this error bar is strongly determined by photoelectron statistics, especiallyat these low energies (∼ 0.4 GeV).
We want to re-emphasize that all these results concerns one particular crystal, op-erated at room temperature. No attempts were made to controlthe temperature, orto measure a temperature dependence of the observed effects.
5.2 Time structure of the signals
A second valuable tool for recognizing the contributions ofCerenkov light to thecalorimeter signals is derived from the time structure of the events. This is illus-trated in Figure 8, which shows the average time structure ofthe 10 GeV showersignals recorded with the same PMT at different angles of incidence, namelyθ =30◦ andθ = −30◦. The diagrams on the left hand site of this figure concern PMTR.Cerenkov light produced by the traversing electron and by the particles producedin the early shower component are expected to be detected by this PMT when thecrystal is oriented atθ = 30◦, while very little, if anything, will reach this PMTat θ = −30◦. The figure shows that the trailing edges of both time structures arealmost completely identical. This part of the time structure of the pulses is com-pletely determined by the decay characteristics of the scintillation processes in thePbWO4 crystals and should thus indeed be independent of the detector orientation.
However, there is a very significant difference in the leading edge of the pulses.The ones measured forθ = 30◦ exhibit a steeper rise than the ones forθ = −30◦.The top graphs show the result of subtracting the latter pulse shape from the “30◦”one: The pulses recorded atθ = 30◦ contain an additional “prompt” component ofthe type one would expect fromCerenkov light.
The reverse situation is observed in the other PMT (L). Here, the prompt additionalcomponent is observed in the time structure of the pulses recorded when the crys-tal was oriented atθ = −30◦. Also in this PMT, the time structure beyond the
14
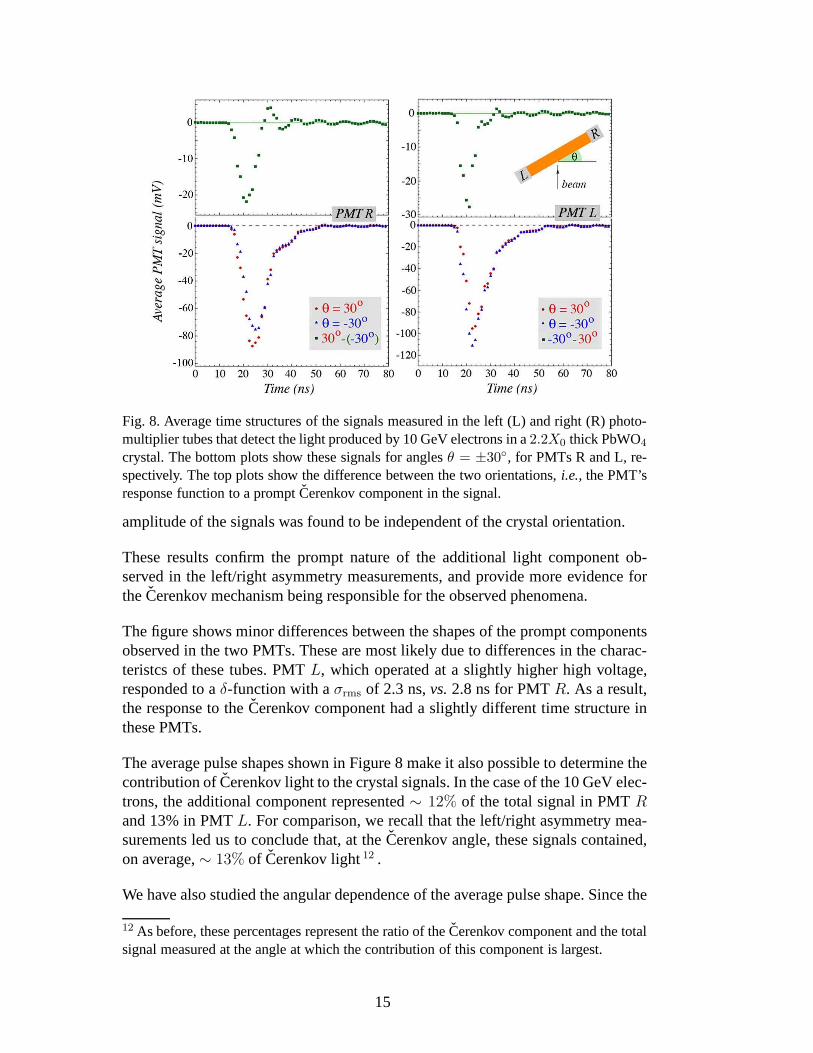
Fig. 8. Average time structures of the signals measured in the left (L) and right (R) photo-multiplier tubes that detect the light produced by 10 GeV electrons in a2.2X0 thick PbWO4
crystal. The bottom plots show these signals for anglesθ = ±30◦, for PMTs R and L, re-
spectively. The top plots show the difference between the two orientations,i.e., the PMT’sresponse function to a promptCerenkov component in the signal.
amplitude of the signals was found to be independent of the crystal orientation.
These results confirm the prompt nature of the additional light component ob-served in the left/right asymmetry measurements, and provide more evidence fortheCerenkov mechanism being responsible for the observed phenomena.
The figure shows minor differences between the shapes of the prompt componentsobserved in the two PMTs. These are most likely due to differences in the charac-teristcs of these tubes. PMTL, which operated at a slightly higher high voltage,responded to aδ-function with aσrms of 2.3 ns,vs.2.8 ns for PMTR. As a result,the response to theCerenkov component had a slightly different time structureinthese PMTs.
The average pulse shapes shown in Figure 8 make it also possible to determine thecontribution ofCerenkov light to the crystal signals. In the case of the 10 GeV elec-trons, the additional component represented∼ 12% of the total signal in PMTRand 13% in PMTL. For comparison, we recall that the left/right asymmetry mea-surements led us to conclude that, at theCerenkov angle, these signals contained,on average,∼ 13% of Cerenkov light12 .
We have also studied the angular dependence of the average pulse shape. Since the
12 As before, these percentages represent the ratio of theCerenkov component and the totalsignal measured at the angle at which the contribution of this component is largest.
15
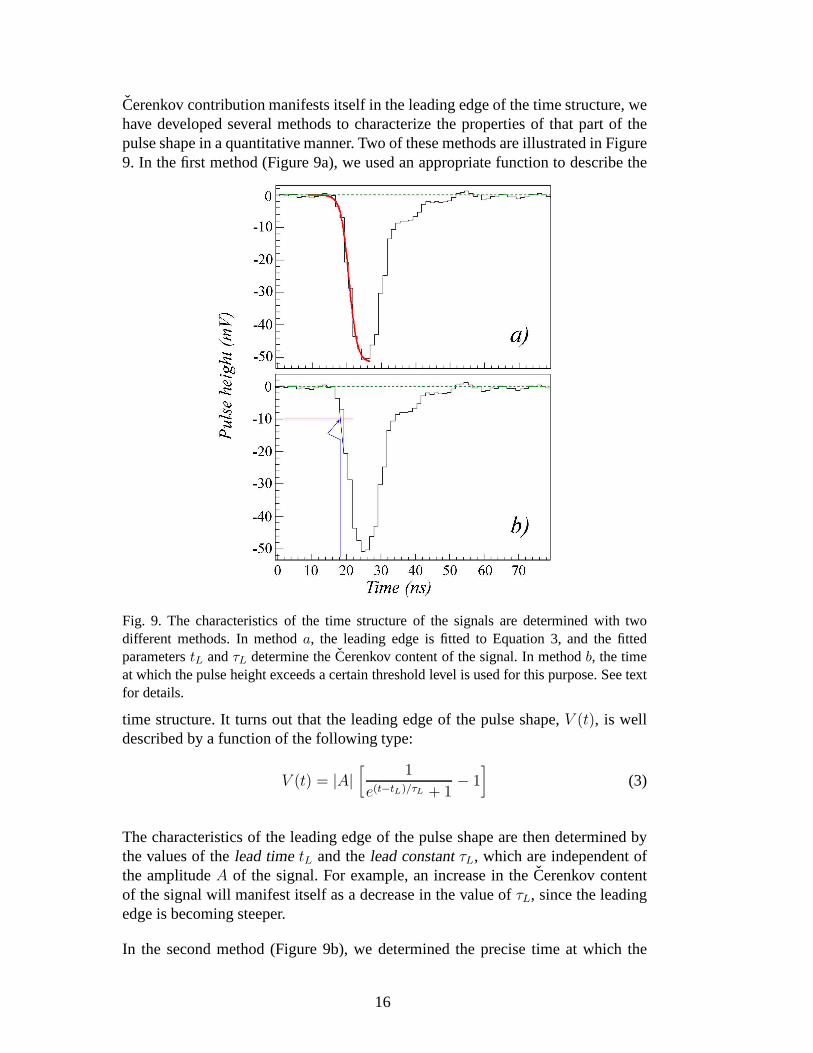
Cerenkov contribution manifests itself in the leading edgeof the time structure, wehave developed several methods to characterize the properties of that part of thepulse shape in a quantitative manner. Two of these methods are illustrated in Figure9. In the first method (Figure 9a), we used an appropriate function to describe the
Fig. 9. The characteristics of the time structure of the signals are determined with twodifferent methods. In methoda, the leading edge is fitted to Equation 3, and the fittedparameterstL andτL determine theCerenkov content of the signal. In methodb, the timeat which the pulse height exceeds a certain threshold level is used for this purpose. See textfor details.
time structure. It turns out that the leading edge of the pulse shape,V (t), is welldescribed by a function of the following type:
V (t) = |A|[
1
e(t−tL)/τL + 1− 1
]
(3)
The characteristics of the leading edge of the pulse shape are then determined bythe values of thelead timetL and thelead constantτL, which are independent ofthe amplitudeA of the signal. For example, an increase in theCerenkov contentof the signal will manifest itself as a decrease in the value of τL, since the leadingedge is becoming steeper.
In the second method (Figure 9b), we determined the precise time at which the
16

pulse height exceeds a certain fixed threshold level,e.g.,-50 mV. An increase in theCerenkov content of the signal will shift that point to an earlier moment.
Some results of these analyses are shown in Figures 10 and 11.Figure 10 shows the
Fig. 10. Average lead constant,τL (see Equation 3), of the pulses recorded by PMTR, as afunction of the orientation of the crystal,i.e., the angleθ. Data for 10 GeV electrons.
value of the lead constant,τL, measured for the 10 GeV electron signals from PMTR, as a function of the angleθ. For negative values ofθ, Cerenkov light producedby the electrons was not detected by this PMT. The pulse shapeis independent ofθ, with aτL value of 1.20 ns. However, when the crystal was rotated towards valuesof θ > 0, Cerenkov light produced by the showering particles became asignificantcomponent of the signals measured by PMTR, and the leading edge of the pulseshape steepened (τL became smaller). This process continued untilθ reached theCerenkov angle (∼ 30◦), at which pointτL reached a minimum value of∼ 1.09 ns.For larger angles, the acceptance ofCerenkov light decreased again and the leadingedge became less steep,τL increased. TheτL value measured for the signals fromPMT L shows a similar behavior: It is constant forθ > 0, decreases forθ < 0,reaches a minimum value forθ = −30◦ and increases again for larger angles.
Figure 11 shows the results of an analysis of the threshold crossing time, for signalsgenerated by 150 GeVµ+. Thedifferencebetween the crossing times of the signalsrecorded by PMTsR andL is given as a function of the angleθ, for two differentthreshold levels. This difference is set to zero forθ = 0. The figure shows thatthe difference is negative forθ > 0. As a result of the increasing contribution ofCerenkov light to the signals from PMTR, the threshold was crossed earlier in thisPMT, and therefore the plotted quantity is negative. Whenθ < 0, Cerenkov lightcontributed to the signals from PMTL, and the plotted quantity is positive. As inthe case of the response asymmetry, the maximum difference is observed for an-gles near theCerenkov angle,∼ 30◦. The results are qualitatively not significantlydifferent for the two different threshold levels, but they do indicate a slightly larger
17

Fig. 11. Average difference between the times the two PMTs reading out the two sides ofthe crystal needed to reach a certain threshold level, as a function of the orientation of thecrystal (i.e., the angleθ). Data for 150 GeVµ+, and two different threshold values.
effect for the higher threshold.
As in the case of the left/right asymmetry, the results shownin Figures 10 and11 concern the average behavior observed for large numbers of events (100 000).The error bars in these figures indicate the precision with which the parameter inquestion is determined forindividualevents. The size of these error bars, which forthese small signals is completely dominated by photoelectron statistics, is such thatthe value of the lead constant (τL) or the threshold crossing time does not providestatistically significant information about the (size of the) contribution ofCerenkovlight to the signal in question.
6 Conclusions
We have measured the contribution ofCerenkov light to the signals from elec-trons and muons in lead tungstate crystals. In the chosen geometry, which wasoptimized for detecting this component, information aboutthis contribution wasobtained from the left/right response asymmetry and from the time structure ofthe signals. For single particles traversing the calorimeter (muons), the maximumCerenkov contribution to the signals was measured to be15 − 20%. The measure-ments for electron showers indicated somewhat lower values, because of the con-tributions of isotropically distributed shower particlesto the signals. This reducedthe measured asymmetries in the response and time structureof the signals. Thiseffect was measured to increase in importance as the shower developed. The asym-metries measured for 10 GeV electrons in the first 2-3 radiation lengths were aboutthree times larger than those measured at a depth of7− 10X0, i.e., just beyond the
18

shower maximum.
Acknowledgments
The studies reported in this paper were carried out with PbWO4 crystals madeavailable to us by the PHOS group of the ALICE Collaboration.We sincerely thankDrs. Mikhail Ippolitov and Hans Muller for their help and generosity in this context.We thank CERN for making particle beams of excellent qualityavailable. Thisstudy was carried out with financial support of the United States Department ofEnergy, under contract DE-FG02-95ER40938.
References
[1] P. Rumerio,Comissioning of the CMS Electromagnetic Calorimeter and OperationalExperience, Proc. of the XIIth Int. Conf. on Calorimetry in High Energy Physics,Chicago, June 5-9, 2006, AIP Conf. Proc 867 (2006) 301.
[2] M. Ippolitov, Energy, Timing and Two-Photon Invariant Mass Resolution ofa 256-Channel PbWO4 Calorimeter, Proc. of the XIth Int. Conf. on Calorimetry in HighEnergy Physics, Perugia, March 29 - April 2, 2004, World Scientific (2006) 103.
[3] R. Novotny,The Electromagnetic Calorimeter of the Future PANDA Detector, Proc.of the XIIth Int. Conf. on Calorimetry in High Energy Physics, Chicago, June 5-9,2006, AIP Conf. Proc 867 (2006) 106.
[4] A. Gasparian,A High-Performance Hybrid Electromagnetic Calorimeter atJeffersonLab, Proc. of the XIth Int. Conf. on Calorimetry in High Energy Physics, Perugia,March 29 - April 2, 2004, World Scientific (2006) 109.
[5] R.Y. Zhu, Precision Crystal Calorimeters in High Energy Physics: Past, Present andFuture, Proc. of the XIIth Int. Conf. on Calorimetry in High Energy Physics, Chicago,June 5-9, 2006, AIP Conf. Proc 867 (2006) 61.
[6] N. Akchurin et al., Nucl. Instr. and Meth.A537 (2005) 537.
[7] R. Wigmans, Nucl. Instr. and Meth.A572 (2007) 215.
[8] R. Wigmans,Calorimetry - Energy Measurement in Particle Physics, InternationalSeries of Monographs on Physics, vol. 107, Oxford University Press (2000).
[9] N. Akchurin and R. Wigmans, Rev. Sci. Instr.74 (2003) 2955.
[10] N. Akchurin et al. (DREAM Collaboration),Dual-Readout Calorimetry with LeadTungstate Crystals, submitted to Nucl. Instr. and Meth. (2007).
[11] N. Akchurinet al., Nucl. Instr. and Meth.A548 (2005) 336.
19