Contact Center KPIs - Definitions & Correlations - MetricNet
Upload
independentCategory
view
0download
0
doi:10.1093/brain/awh681 Brain (2006), 129, 352–365
Contralateral hemimicrencephaly andclinical–pathological correlations in childrenwith hemimegalencephaly
Noriko Salamon,2 Marissa Andres,1 Dennis J. Chute,3 Snow T. Nguyen,1 Julia W. Chang,1
My N. Huynh,1 P. Sarat Chandra,1 Veronique M. Andre,6 Carlos Cepeda,6 Michael S. Levine,6
Joao P. Leite,8 Luciano Neder,7 Harry V. Vinters3,4,5,6 and Gary W. Mathern1,5,6
Divisions of 1Neurosurgery, 2Neuroradiology, and 3Neuropathology and 4Department of Neurology, 5The Brain ResearchInstitute and 6The Mental Retardation Research Center, David Geffen School of Medicine, University of California,Los Angeles, CA, USA and 7Departments of Pathology and 8Neurology, Ribeirao Preto School of Medicine,University of Sao Paulo, Ribeirao Preto, SP, Brazil
Correspondence to: Gary W. Mathern, MD, Reed Neurological Research Center, 710 Westwood Plaza, Room 2123,Los Angeles, CA 90095-1769, USAE-mail: [email protected]
In paediatric epilepsy surgery patients with hemimegalencephaly (HME; n = 23), this study compared clinical,neuroimaging and pathologic features to discern potential mechanisms for suboptimal post-hemispherectomydevelopmental outcomes and structural pathogenesis. MRImeasured affected and non-affected cerebral hemi-sphere volumes forHME and non-HME cases, includingmonozygotic twins where one sibling hadHME. Stainingagainst neuronal nuclei (NeuN) determined grey and white matter cell densities and sizes in HME and autopsycases, including the non-affected side of a HME surgical/autopsy case. By MRI, the affected hemisphere waslarger and the non-affected side smaller in HME compared with non-HME children. The affected HME sideshowed enlarged abnormal deep grey and white matter structures and/or T2-weighted hypointensity in thesubcortical white matter in 75% of cases, suggestive of excessive pre-natal neurogenesis and heterotopias.Histopathological examination of the affected HME side revealed immature-appearing neurons in 70%, poly-microgyria (PMG) in 61% and balloon cells in 45% of cases. Comparedwith autopsy cases, inHME childrenNeuNcell densities on the affected side were increased in the molecular layer and upper cortex (+244 to +18%),decreased in lower cortical layers (�35%) and increased in the white matter (+139 to +149%). Deep greymatterMRI abnormalities and/or T2-weighted white matter hypointensity correlated with the presence of immature-appearing neurons and PMG on histopathology, decreased NeuN cell densities in lower cortical layers and apositive history of infantile spasms. Post-surgery seizure control was associated with decreased NeuN densitiesin the molecular layer. In young children with HME and epilepsy, these findings indicate that there are bilateralcerebral hemispheric abnormalities and contralateral hemimicrencephaly is a likely explanation for poorerpost-surgery seizure control and cognitive outcomes. In addition, our findings support the hypothesis that HMEpathogenesis probably involves somatic mutations that affect each developing cerebral hemisphere differentlywith more neurons than expected on the HME side.
Keywords: seizures; MRI volumetric; cortical dysplasia; malformations of cortical development; unilateral megalencephaly;cell cycle; neurogenesis; corticogenesis; tuberous sclerosis complex
Abbreviations: HME = hemimegalencephaly; NeuN = neuronal nuclei; PMG = polymicrogyria
Received May 23, 2005. Revised September 7, 2005. Accepted September 28, 2005. Advance Access publication November 16, 2005
IntroductionHemimegalencephaly (HME; also termed unilateral megalen-
cephaly) is a relatively rare but clinically impressive
malformation of cortical development characterized by
marked cerebral asymmetry (Friede, 1989). Originally
described by Sims (Sims, 1835), HME can occur in isolation
or in association with neurocutaneous syndromes or
# The Author (2005). Published by Oxford University Press on behalf of the Guarantors of Brain. All rights reserved. For Permissions, please email: [email protected]
by guest on June 6, 2013http://brain.oxfordjournals.org/
Dow
nloaded from

developmental disorders such as Klippel–Trenaunay syn-
drome, Ito’s hypomelanosis, neurofibromatosis and tuberous
sclerosis complex (Vigevano et al., 1996). Non-syndromic
HME occurs in multiple ethnic groups without a gender
preference and the clinical presentation typically consists of
early onset epilepsy, psychomotor retardation and contralat-
eral hemiparesis and hemianopia (Flores-Sarnat, 2002). The
aetiology of HME is unknown, although it is presumed to be
from abnormalities of neuroglial differentiation and cell
migration involving a single hemisphere (De Rosa et al.,
1992; Vinters et al., 1992; Arai et al., 1999; Hoffmann et al.,
2000).
An approach in determining HME pathogenesis is by
evaluating clinical, neuroimaging and histopathological find-
ings for both cerebral hemispheres based on an understanding
of normal developmental neurobiology (Rakic, 1988; Uher
and Golden, 2000; Volpe, 2000; Miyata et al., 2004; Andres
et al., 2005). In mammals, cerebral cortical development
begins with progenitor cell proliferation in the periventricular
germinal zones, and neural cell divisions and cell cycling are
tightly controlled (Marin-Padilla and Marin-Padilla, 1982;
Kostovic and Rakic, 1990; Marin-Padilla, 1999; Zecevic and
Rakic, 2001; Rakic and Zecevic, 2003). In mice, for example,
the number of progenitor cell divisions is limited to 10 or 11,
and each successive cell cycle becomes progressively longer
(G1-phase) as a larger proportion of progenitor cells differ-
entiate into neurons (Caviness et al., 1995, 2003; Sommer and
Rao, 2002). The earliest differentiated cells migrate to the
cortical surface forming the preplate, which is partitioned
by subsequent generations of neurons into a primordial plexi-
form layer (eventual molecular layer or Layer 1) and subplate.
The pyramidal neurons that form the hexalaminar post-natal
neocortex migrate in successive waves to form the cortical
grey matter from the inside out (i.e. earliest neurons in lower
grey matter). After pyramidal cell migration, cells in the
molecular layer and subplate degenerate (probably via apop-
tosis), and this coincides with secondary gyral folding in the
last trimester of human gestation (deAzevedo et al., 2003;
Rakic, 2003; Zecevic, 2004).
The larger forebrain and gyral folds of the human cerebral
cortex are thought to be from an increase in the number
and/or cell cycles of progenitor cells (Rakic, 1995; Haydar
et al., 1999; Kuan et al., 2000; Chan et al., 2002). The number
of pre-neurogenesis precursors is influenced by mitotic rates,
programmed cell death and the proportion of cells that
terminally differentiate into neurons at the end of each cell
cycle (Rakic, 1988; Hayakawa et al., 1991; Uher and
Golden, 2000; Kuzniecky and Barkovich, 2001; Chenn and
Walsh, 2002; Caviness et al., 2003). Consequently, small
alterations in the number of progenitor cells, especially at
later cell cycles, have a dramatic impact on final cerebral
size, gyral shapes and cell densities in different layers of the
cortex (Chenn and Walsh, 2003; Putz et al., 2005; Tarui et al.,
2005).
In a previous study of less severe paediatric epilepsy surgery
patients with cortical dysplasia, we found increased upper
cortical neuronal packing densities without megalencephaly
supporting the hypothesis that non-HME dysplasia is prob-
ably due to increased neurogenesis in later progenitor cell
cycles and partial failure of post-neurogenesis programmed
cell death in the molecular layer and subplate (Andres et al.,
2005). We further hypothesized that intractable epilepsy was
the consequence of incomplete cortical maturation with pre-
servation of ‘pro-epileptic’ immature neurons and synaptic
circuitry (Mathern et al., 2000; Cepeda et al., 2003, 2005a, b;
Andre et al., 2004). The purpose of the current study was to
apply similar clinical–pathological comparisons to HME
cases, a more severe form of cortical dysplasia, to discern if
the probable developmental aetiology involved similar or dif-
ferent abnormalities of cerebral development than non-HME
dysplasia cases.
MethodsClinical cohort and pre-surgery evaluationPatients with HME (n = 23) were identified through the University of
California, Los Angeles (UCLA) Paediatric Epilepsy Surgery Program
database. The cases had surgery between 1990 and 2004, and the
clinical protocols have been previously published (Mathern et al.,
1999; Jonas et al., 2004, 2005). For this study, HME patients were
defined as those surgical cases where most (at least three lobes) or all
of one cerebral hemisphere was larger compared with the opposite
hemisphere on MRI. Informed consent was obtained to use clinical
data for research studies. The standardized pre-surgery evaluation
included detailed history and neurological examinations, and inter-
ictal and ictal scalp EEG recordings. Neuroimaging studies included
the aforementioned MRI and cerebral 2-[18F]fluoro-2-deoxy-D-
glucose PET.
MRI and cerebral volume measurementsQuantitative assessments were performed on MRI scans obtained
since 2000 using the same inpatient machine and sequence protocols,
and were available for 11 HME cases and were compared with 6
non-HME cases. At UCLA, there were very few scans performed in
children under 2 years of age without neurological injury or disease
on the same MRI machine. Hence, three of the non-HME cases were
children without epilepsy, including the monozygotic twin of a HME
case (see Fig. 3), and the other three were undergoing epilepsy
pre-surgery evaluations for non-HME pathologies (stroke and
mild cortical dysplasia) with ages similar to the HME group
(Andres et al., 2005). The MRI scans were performed on a General
Electric 1.5 tesla Signa scanner (Milwaukee, WI, USA). Sequences
included high-resolution coronal T1-weighted spoiled gradient-
recalled echo pulse sequences [SPGR; repetition time (TR) 13 ms,
echo time (TE) 2.8 ms, inversion time 300 ms, flip angle 25�, field of
view (FOV) 24 cm, 1.5 mm coronal thickness slices, 78–124 slices per
patient, matrix 256 · 256, number of excitations (NEX) = 1], and
coronal T2-weighted images (TR 2000 ms, TE 120 ms, FOV 24 cm,
5 mm thickness slices, matrix 192 · 192, NEX = 2). Volumetric MRI
analysis was performed with custom-designed commercial software
(Silhouette; CEDARA, Ontario, Canada; www.cedera.com), and cor-
onal T1 SPGR images were used for the analyses. The images were
transferred into the Silhouette program and each coronal section was
segmented into CSF and brain parenchyma. The volumes from each
Clinical-pathological correlations in HME Brain (2006), 129, 352–365 353
by guest on June 6, 2013http://brain.oxfordjournals.org/
Dow
nloaded from
MRI coronal section were summated and the cerebellum and brain-
stem regions removed to obtain cerebral hemispheric volumes. For
data analysis, each hemisphere was defined as the one affected by the
HME (i.e. side of surgery) or the non-affected non-operated side
(Andres et al., 2005). For the non-HME cases, the same assignments
were applied for the three pre-surgery patients except for the
perinatal stroke case where the affected side was excluded, and
the affected side was randomly selected for the other three non-
HME/non-epilepsy cases.
In addition to the volumetric assessments, the MRI scans of 16
HME cases were qualitatively assessed for neuroimaging abnormal-
ities (11 cases for volumetric plus 5 scans on older MRI machines).
The qualitative assessments included (i) the lobes involved with
megencephaly; (ii) ventricular enlargement; (iii) a straightened
frontal horn of the lateral ventricle; (iv) deep grey matter abnormal-
ities of the caudate nucleus, thalamus, basal ganglia and olfactory
tract; (v) enlargement of the cortical grey and white matter at the
anterior corpus callosum; and (vi) T2-weighted signal changes
(hypo- and hyper-intensity) in the hemispheric white matter.
HistopathologyBrain tissue from surgery for all 23 HME cases was routinely fixed in
buffered formalin and multiple serial sections reviewed as previously
published (De Rosa et al., 1992; Vinters et al., 1992; O’Kusky et al.,
1996). Two neuropathologists (D.J.C. and H.V.V.) reviewed each
case and assessed for histopathological signs of cortical dyslamina-
tion, polymicrogyria (PMG), dysmorphic cytomegalic neurons and
balloon cells, immature-appearing neurons, excessive white matter
neurons, glial/neuronal heterotopias and calcifications. PMG was
defined as an abnormal arrangement of cell layers with excessive
folding of upper layers, and fusion of gyral surfaces (Friede, 1989)
(see Fig. 4B and C). Immature-appearing neurons were defined as
cells with neuroblast-like features consisting of round to oval nuclear
configurations with a thin rim of cytoplasm (Prayson et al., 2002)
(see Fig. 4F). One previously reported HME patient died intra-
operatively, and homotopic tissue blocks from both hemispheres
were available for histopathological review and neuronal nuclei
(NeuN) immunocytochemistry (ICC) (Jahan et al., 1997).
Tissue selection for NeuN stainingFrom 14 HME cases operated since 1998, 1.5–2 cm blocks of neo-
cortex and adjoining white matter involving the crown of a gyrus in
an area of severe dysplasia were microsurgically removed at surgery
and the blocks immersion fixed for ICC. The remaining brain tissue
from the surgical resection was processed for histopathology as
described above. Neocortical blocks from 11 autopsy cases of similar
ages without known neurological disease were also collected for
comparison. Death in the autopsy group was from acute cardiac,
septic or traumatic causes, and brain tissue was collected between
3 and 11 h after death (mean 6 SD; 6.6 6 2.3 h).
NeuN ICC processingNeuN was chosen over traditional Nissl stains because of the speci-
ficity of this antibody in identifying differentiated neurons, and the
fixation protocols were regimented so that autopsy and surgical
tissue were processed in a similar fashion. Surgical and autopsy
ICC tissue blocks were immediately immersion fixed in freshly pre-
pared phosphate-buffered 4% paraformaldehyde for 24–48 h, and
then cryoprotected overnight in 20% buffered sucrose and stored at
�80�C. Cryostat-cut sections (30 mm) were collected and placed in
individual 3 ml wells containing 0.05 mol/l Tris–HCl-buffered saline
(TBS; pH 7.4). The free-floating sections were processed the same
day as follows with 10 min TBS rinses (three changes) between each
step. Five minutes in 3% hydrogen peroxide/10% methanol in TBS;
60 min in a blocking solution of 2% normal horse serum in TBS;
overnight in primary antisera against NeuN (mouse anti-neuronal
nuclei; Chemicon International; Temecula, CA, USA; Catalog #
MAB377; 1 : 2000 dilution) diluted in 2% normal blocking
serum; 60 min in diluted biotinylated anti-mouse antibody (ABC
kit, Vector Laboratories, Burlingame, CA, USA); and 30 min in a
solution of excess avidin and biotinylated horseradish peroxidase
(ABC Kit, Vector Laboratories). The sections were developed for
7–8 min in 0.5 mg/ml 3,30-diaminobenzidine tetrahydrochloride
and 0.01% hydrogen peroxide. After sufficient colourization, the
reaction was halted by washing in several rinses of cold PBS, the
sections were mounted on subbed slides, air dried, treated for 35 s in
0.1% osmium tetroxide in 0.1 mol/l phosphate buffer (pH 7.4),
dehydrated and coverslipped (Mathern et al., 1995, 1997). For the
single autopsy HME case with matched bilateral formalin fixed
paraffin blocks of the frontal, parietal and temporal neocortex,
10 mm sections were placed on slides and processed for NeuN
ICC as noted above.
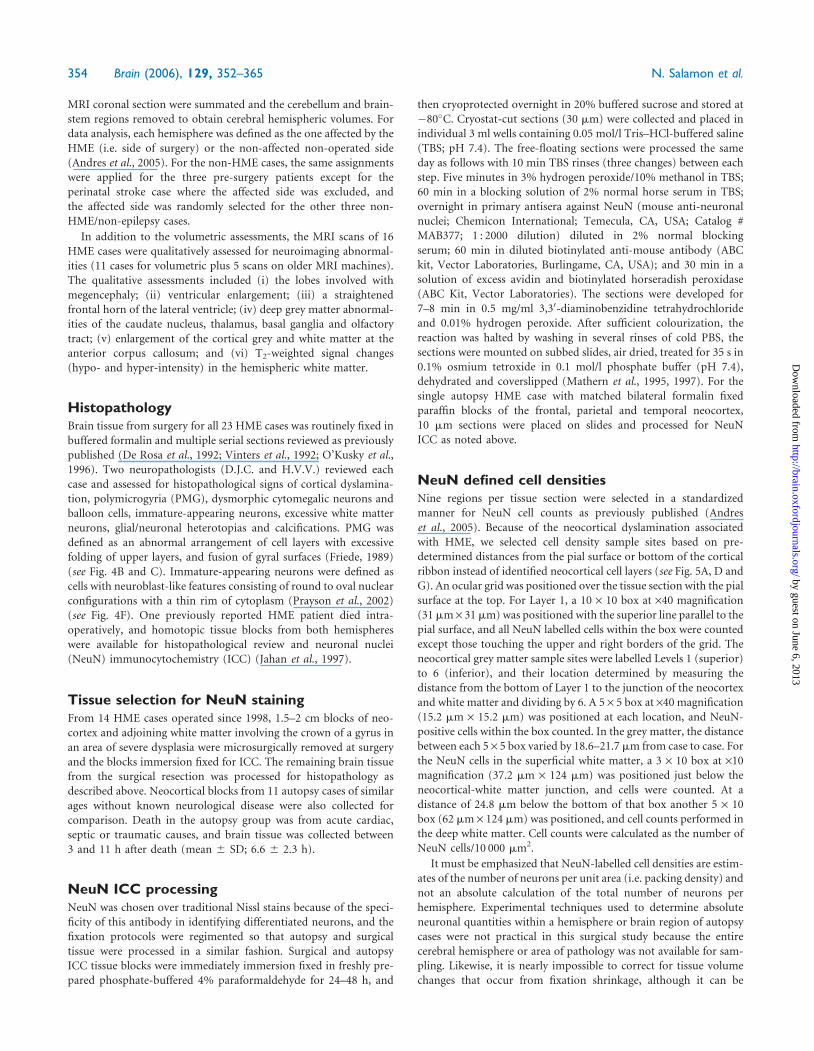
NeuN defined cell densitiesNine regions per tissue section were selected in a standardized
manner for NeuN cell counts as previously published (Andres
et al., 2005). Because of the neocortical dyslamination associated
with HME, we selected cell density sample sites based on pre-
determined distances from the pial surface or bottom of the cortical
ribbon instead of identified neocortical cell layers (see Fig. 5A, D and
G). An ocular grid was positioned over the tissue section with the pial
surface at the top. For Layer 1, a 10 · 10 box at ·40 magnification
(31 mm · 31 mm) was positioned with the superior line parallel to the
pial surface, and all NeuN labelled cells within the box were counted
except those touching the upper and right borders of the grid. The
neocortical grey matter sample sites were labelled Levels 1 (superior)
to 6 (inferior), and their location determined by measuring the
distance from the bottom of Layer 1 to the junction of the neocortex
and white matter and dividing by 6. A 5 · 5 box at ·40 magnification
(15.2 mm · 15.2 mm) was positioned at each location, and NeuN-
positive cells within the box counted. In the grey matter, the distance
between each 5 · 5 box varied by 18.6–21.7 mm from case to case. For
the NeuN cells in the superficial white matter, a 3 · 10 box at ·10
magnification (37.2 mm · 124 mm) was positioned just below the
neocortical-white matter junction, and cells were counted. At a
distance of 24.8 mm below the bottom of that box another 5 · 10
box (62 mm · 124 mm) was positioned, and cell counts performed in
the deep white matter. Cell counts were calculated as the number of
NeuN cells/10 000 mm2.
It must be emphasized that NeuN-labelled cell densities are estim-
ates of the number of neurons per unit area (i.e. packing density) and
not an absolute calculation of the total number of neurons per
hemisphere. Experimental techniques used to determine absolute
neuronal quantities within a hemisphere or brain region of autopsy
cases were not practical in this surgical study because the entire
cerebral hemisphere or area of pathology was not available for sam-
pling. Likewise, it is nearly impossible to correct for tissue volume
changes that occur from fixation shrinkage, although it can be
354 Brain (2006), 129, 352–365 N. Salamon et al.
by guest on June 6, 2013http://brain.oxfordjournals.org/
Dow
nloaded from
assumed that it should be the same for HME and autopsy cases with
our protocol. However, neuron densities, as used in this study,
are reliable relative estimates of packing densities, and statistical
differences between groups of patients that are similarly processed
and counted can be accurately determined (Mathern et al., 1995,
1997).
Cortical thicknessTo assess the average thickness of the neocortex, an image computer
was used as previously described (Mathern et al., 1997). The same
NeuN stained sections used for neuronal counts were imaged using
a video charge-coupled device camera (SPOT RT CCD; v3.2;
Diagnostic Instruments, Inc.; Sterling Heights, MI, USA) attached
to a Zeiss microscope interfaced with a PC. Once captured, the image
was analysed using image system software (Image-Pro Plus, v4.1;
Media Cybernetics, Silver Spring, MD, USA). The operator imaged
the tissue section at low magnification and outlined for the computer
straight portions of the cortical ribbon in a shape as close as possible
to a rectangle or trapezoid. Once outlined, the computer measured
the perimeter (P) and area (A). The average cortical thickness (CT)
was calculated using the quadratic equation: CT = [P � (P2 � 16 ·A)1/2]/4. One investigator performed these measures blinded to the
pathology classification, and as previously indicated for neuronal
densities neocortical thickness measurements should be considered
as relative estimates.
NeuN cell sizeThe same imaging system was used to assess NeuN labelled cell size.
Images at ·50 were captured sampling regions from Layer 1, the
upper (Levels 2 and 3) and lower (Levels 5 and 6) grey matter and
superficial and deep white matter regions. The operator outlined for
the computer all individual NeuN labelled cells within the captured
image and the computer calculated the average area per cell for that
section and region (mm2). Typically, 20 or more NeuN labelled cells
were measured for each sample site.
Data analysisMRI volumes, histopathological findings and NeuN measurements
were entered into a database and analysed using a statistical program
(StatView 5; SAS Institute, Inc., Cary, NC, USA). Differences bet-
ween autopsy or non-HME cases and HME patients involving con-
tinuous dependent variables were statistically compared using an
analysis of covariance (ANCOVA) that included the log of age at
surgery or autopsy as co-independent variables. Comparisons using
nominal variables were performed using Chi-square tests.
Results were considered different at a minimal level of significance
of P < 0.05.
ResultsClinical characteristicsTwenty-three HME cases were identified for this
clinical–pathological study, and, with the exception of one
case of tuberous sclerosis complex, none of the other patients
had neurocutaneous or other developmental syndromes asso-
ciated with HME. In other words, in this HME cohort all
but one patient were non-syndromic clinical presentations.
All 23 HME cases underwent hemispherectomy, which
included 6 anatomical, 5 functional and 12 modified
functional procedures (Cook et al., 2004). The HME patients
constituted 17% of hemispherectomy cases (n = 138), 9% of
extratemporal resections (hemispherectomy + multilobar +
non-temporal lobar; n = 255) and 7% of all paediatric epilepsy
surgery procedures at our institution (above + temporal lobe;
n = 316). There were 12 females and 12 right-sided cases (52%
respectively). Mean age (years 6 SD) at seizure onset was
0.1 6 0.15 (range 0–0.5), age at surgery was 1.5 6 1.2 (range
0.2–4.1) and seizure duration before surgery was 1.4 6
1.2 (range 0.2–4). A history of infantile spasms was noted
in 15 cases (65%), and post-surgery seizure control at last
follow-up (mean 4.3 years; range 1–10) was noted in 15 out of
22 (68%) cases. Perioperative complications were noted in
four (17%) HME cases, and included one intraoperative death
(Jahan et al., 1997), a second case that survived cardiac arrest
in the operating room from excessive blood loss, a permanent
third nerve palsy and a post-surgery cranial infection success-
fully treated with antibiotics (Di Rocco and Iannelli, 2000).
Four (17%) HME children underwent re-operations for
recurrent seizures and possible incomplete disconnections
with successful seizure control in one case after repeat surgery.
Cerebral hemisphere volumes and neuronal packing dens-
ities are known to dramatically change during the early
post-natal period as the brain rapidly grows (Andres et al.,
2005). To statistically control for post-natal brain growth we
performed an analysis of covariance (ANCOVA), and the
results (F/P-values) are shown for MRI-assessed cerebral
hemisphere volumes and NeuN-defined cell densities and
sizes (Table 1). The ANCOVA incorporated the pathology
groups (MRI, HME versus non-HME; NeuN, HME versus
autopsy) and log of age at surgery as the independent
variables. Statistically significant interactions would indicate
different changes with age between pathology groups. No
significant interactions were identified meaning that we
found either age-related change for all categories and/or
differences between HME and non-HME (or autopsy)
comparison groups. The remainder of the Results section
will sequentially discuss clinical–pathological findings for
HME cases.
MRI and cerebral hemisphere volumesPre-surgical studies for quantitative analysis were available on
11 (48%) HME cases using the same in-patient MRI machine
and scanning sequences. These 11 MRI scans were compared
with 6 scans from infants without epilepsy (n = 3) or children
undergoing pre-surgery epilepsy evaluation with different
pathologies (n = 3; one stroke and two with subtle
non-HME cortical dysplasia). The mean age (years 6 SD)
at MRI for all 17 cases was 0.70 6 0.5 (range 0.1–1.87), and
there were no statistically significant differences for age
between the HME and non-HME groups (P = 0.58). An
additional five MRI scans (total of 16) were available for
qualitative assessments.
Qualitatively, all 16 HME cases showed enlargement of the
affected compared with non-affected cerebral hemisphere
Clinical-pathological correlations in HME Brain (2006), 129, 352–365 355
by guest on June 6, 2013http://brain.oxfordjournals.org/
Dow
nloaded from
with apparent thickening of the grey matter, and poor grey/
white matter differentiation (Fig. 1). HME involved all four
lobes of the brain in nine cases (56%). In the remaining seven
cases there was no preference for which lobes of the brain were
enlarged with the frontal, temporal and occipital lobes
involved in five patients, and the parietal lobe in six cases
(21 out of 28 lobes; 75%). Enlargement of the ipsilateral lateral
ventricle (Fig. 1D and I) and a straightened appearance of the
ipsilateral frontal horn of the lateral ventricle was noted in
11 out of 16 HME cases (69%; Fig. 1C arrow). In six HME
cases (37%), deeper grey matter structures, such as the caud-
ate nucleus, thalamus, basal ganglia and olfactory tract, were
larger than expected, often displacing neighbouring white
matter structures or the ventricular system (Fig. 1D arrow,
E and F arrowhead). Likewise, in eight HME cases (50%) there
was enlarged abnormal grey and white matter structures at
the anterior corpus callosum medial to the ventricle that
displaced the lateral frontal horn (Fig. 1A and C arrow, G
and I). Thus, a total of 12 out of 16 (75%) HME patients
showed enlargement of deep grey and white matter structural
abnormalities on MRI. Seven HME cases (44%) demonstrated
a thinner corpus callosum than would be expected for age
(data not shown). Two HME cases showed normal white
matter signal symmetric to the contralateral side, three
cases had hypointense T2-weighted signal in the affected
white matter (Fig. 1D), four cases demonstrated hyperintense
T2-weighted foci and seven cases showed both hypo- and
hyper-intense T2-weighted white matter abnormalities in
the central or subcortical regions on the affected
side (Fig. 1). Ten cases showed a band-like appearance of
T2-weighted hypointense signal in the periventricular white
matter suggestive for heterotopia (Fig. 1B arrow and D). No
statistically significant correlations were found comparing the
presence and absence of the above qualitative MRI abnormal-
ities with each other (Chi-square; P > 0.09).
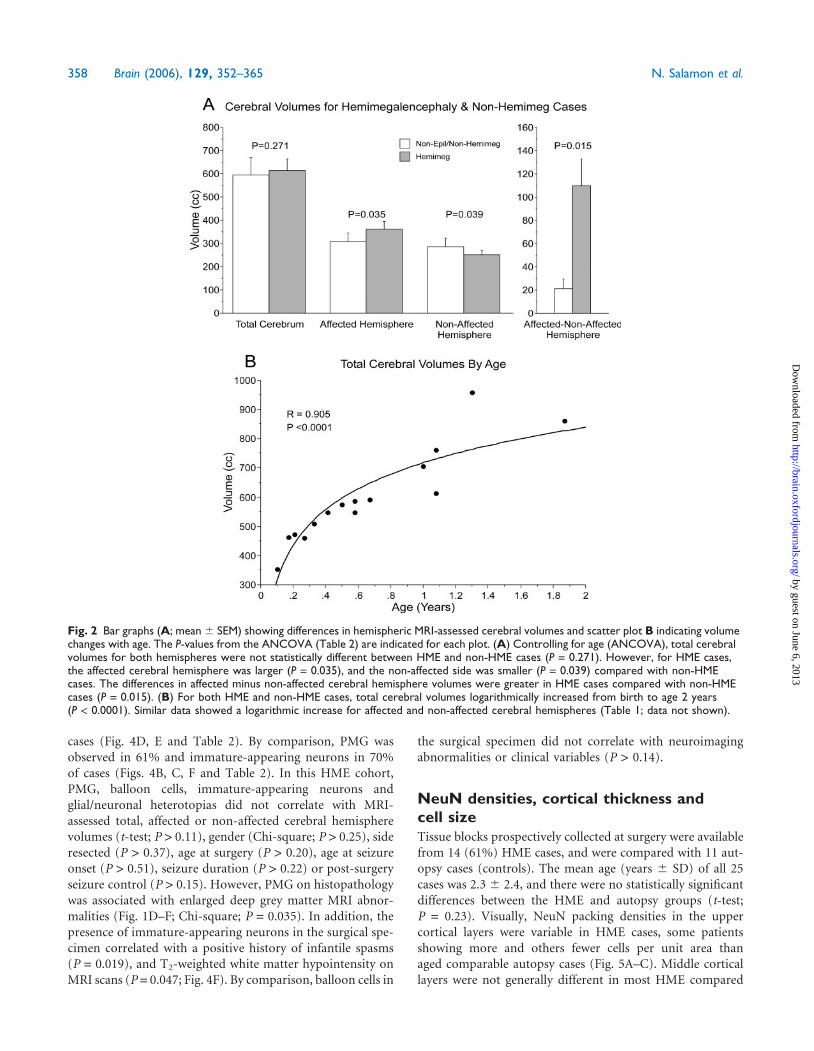
For the quantitative MRI analysis, results of the ANCOVA
found three MRI-assessed cerebral volume measures that
logarithmically increased with age and three factors that
were different between HME and non-HME patient groups
(Fig. 2 and Table 1). Total cerebral volumes along with affec-
ted and non-affected hemisphere volumes logarithmically
increased with age (Fig. 2B; P = 0.0001). The averaged
volumes were increased in the affected cerebral hemispheres
(+18%) and decreased in the non-affected hemispheres
(�13%) of HME cases compared with non-HME patients
(Fig. 2A, left; P < 0.039). Consequently, when the volumes
of the affected were subtracted from the non-affected cerebral
hemispheres (side-to-side comparison) there were greater
differences in HME (33%) compared with non-HME cases
(7%; Fig. 2A, right; P = 0.015). Seven of 11 HME cases had
affected minus non-affected cerebral hemisphere volume dif-
ferences that exceeded +2 SDs of the mean for the non-HME
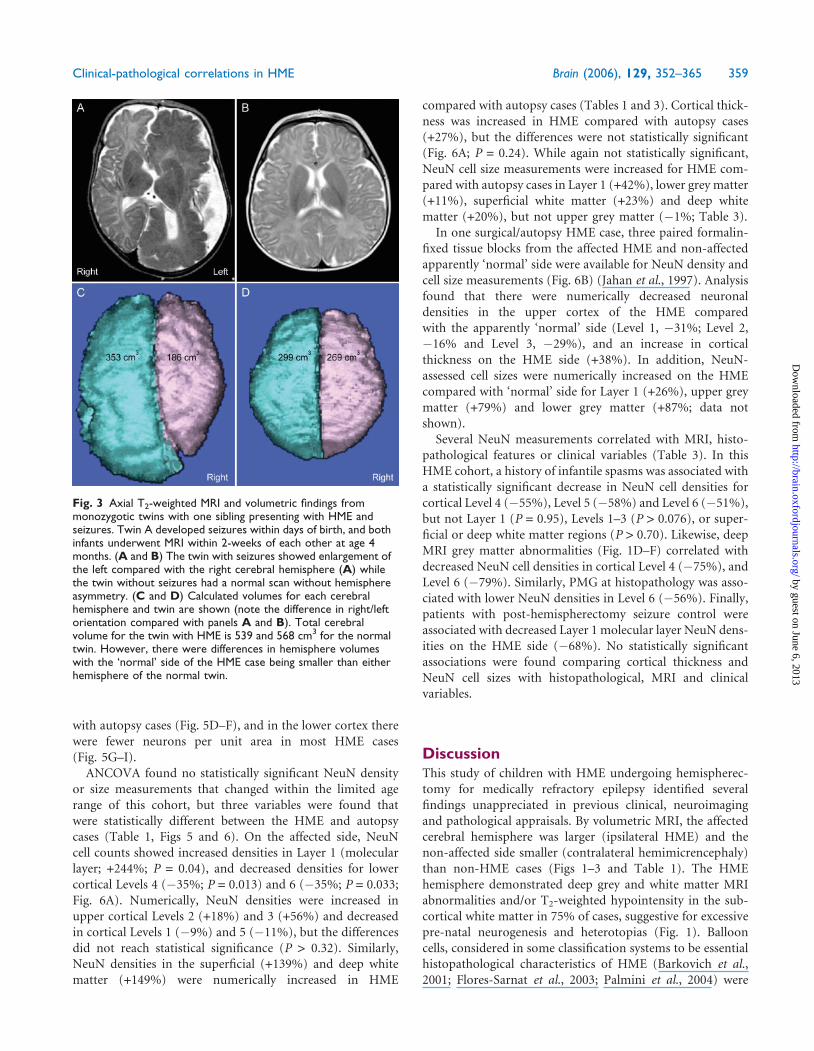
group (>63 cc; range 75–293). Cerebral hemispheric asym-
metry with contralateral hemimicrencephaly is further illus-
trated in a presentation of monozygotic twins where the child
with HME had a larger affected and smaller non-affected
cerebral hemisphere compared with the normal sibling
(Fig. 3). In this HME cohort, affected, non-affected and affec-
ted minus non-affected MRI-assessed cerebral hemisphere
volumes did not correlate with gender (t-tests; P > 0.19),
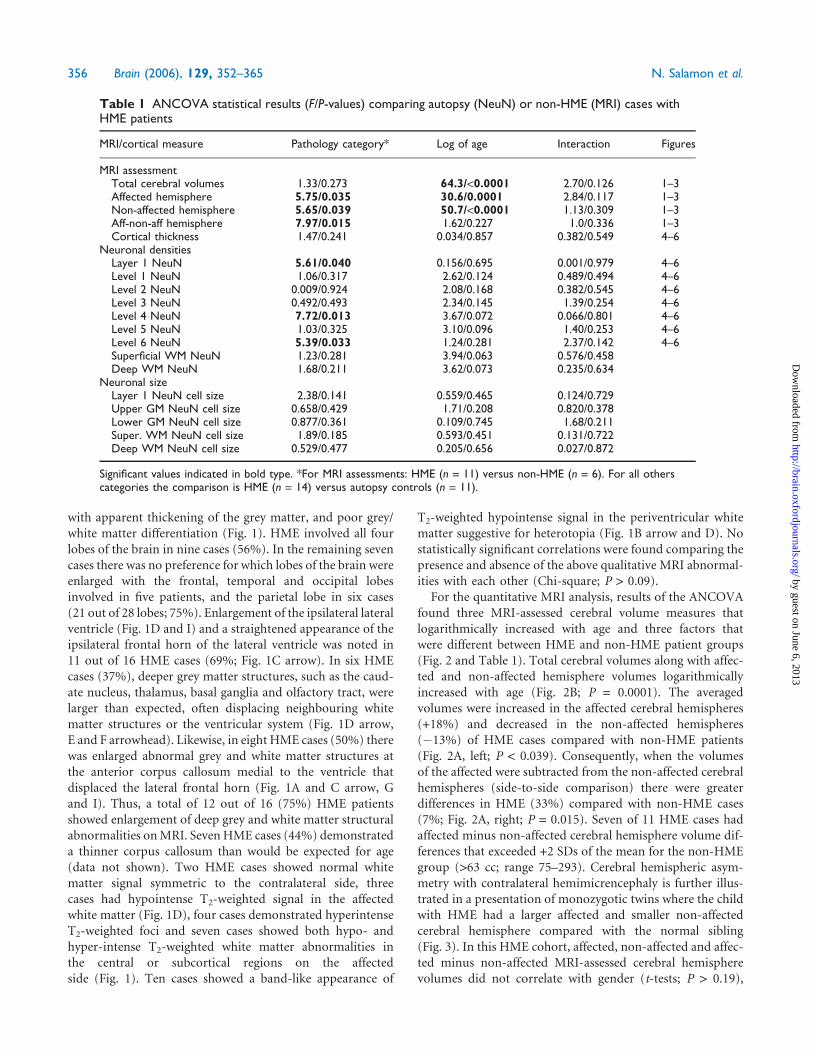
Table 1 ANCOVA statistical results (F/P-values) comparing autopsy (NeuN) or non-HME (MRI) cases withHME patients
MRI/cortical measure Pathology category* Log of age Interaction Figures
MRI assessmentTotal cerebral volumes 1.33/0.273 64.3/<0.0001 2.70/0.126 1–3Affected hemisphere 5.75/0.035 30.6/0.0001 2.84/0.117 1–3Non-affected hemisphere 5.65/0.039 50.7/<0.0001 1.13/0.309 1–3Aff-non-aff hemisphere 7.97/0.015 1.62/0.227 1.0/0.336 1–3Cortical thickness 1.47/0.241 0.034/0.857 0.382/0.549 4–6
Neuronal densitiesLayer 1 NeuN 5.61/0.040 0.156/0.695 0.001/0.979 4–6Level 1 NeuN 1.06/0.317 2.62/0.124 0.489/0.494 4–6Level 2 NeuN 0.009/0.924 2.08/0.168 0.382/0.545 4–6Level 3 NeuN 0.492/0.493 2.34/0.145 1.39/0.254 4–6Level 4 NeuN 7.72/0.013 3.67/0.072 0.066/0.801 4–6Level 5 NeuN 1.03/0.325 3.10/0.096 1.40/0.253 4–6Level 6 NeuN 5.39/0.033 1.24/0.281 2.37/0.142 4–6Superficial WM NeuN 1.23/0.281 3.94/0.063 0.576/0.458Deep WM NeuN 1.68/0.211 3.62/0.073 0.235/0.634
Neuronal sizeLayer 1 NeuN cell size 2.38/0.141 0.559/0.465 0.124/0.729Upper GM NeuN cell size 0.658/0.429 1.71/0.208 0.820/0.378Lower GM NeuN cell size 0.877/0.361 0.109/0.745 1.68/0.211Super. WM NeuN cell size 1.89/0.185 0.593/0.451 0.131/0.722Deep WM NeuN cell size 0.529/0.477 0.205/0.656 0.027/0.872
Significant values indicated in bold type. *For MRI assessments: HME (n = 11) versus non-HME (n = 6). For all otherscategories the comparison is HME (n = 14) versus autopsy controls (n = 11).
356 Brain (2006), 129, 352–365 N. Salamon et al.
by guest on June 6, 2013http://brain.oxfordjournals.org/
Dow
nloaded from

side resected (P > 0.36), history of infantile spasms (P > 0.33)
and seizure control post-surgery (P > 0.58). However, T2-
weighted hypointensity in the white matter by MRI correlated
with a positive history of infantile spasms (Chi-square; P =
0.032).
HistopathologyHME was often diagnosed in the freshly cut surgical specimen
by the obvious blurring of the cortex–white matter junction,
and variably sized gyri (Fig. 4A). Tissue sections from all
23 HME surgical specimens were reviewed, and every case
showed severe cortical dysplasia with cortical dyslamination,
excessive cells in the molecular layer, the presence of dys-
morphic neurons and excessive heterotopic neurons in the
white matter (Mischel et al., 1995). More variables were other
histopathological features of severe cortical dysplasia on the
affected HME side (Fig. 4 and Table 2). Balloon cells were
detected in 45% and cytomegalic neurons in 96% of HME
Fig. 1 Representative MRI of HME cases with intractable epilepsy. Right/left orientation of all panels is shown in A. (A and B) An 8-monthold presented in status epilepticus from right HME. Note the diffuse increase in cortical grey matter thickness and hemispheric size on theright relative to the non-affected left hemisphere. Arrow in B indicates periventricular signal change consistent with white matterheterotopia. (C) A 0.33 year old with seizures since birth. In addition to the increased size of the right hemisphere compared with the leftnotice the thickened cortex and white matter near the corpus callosum (arrow), enlarged and upward straightened tilt of the rightfrontal horn of the lateral ventricle. (D–F) A 5-month old with seizures since birth and left HME. The deep central grey matter is increasedin size including the caudate nucleus (arrow) with corresponding increased T2 signal changes, an open sylvian fissure (arrowhead) andwhite matter changes in the temporal lobe. The left olfactory tract is also enlarged (arrowhead). This patient was seizure free at lastfollow-up 1-year post-hemispherectomy. (G and H) A 9-month old with seizures since birth and right HME. The enlarged frontal lobe withthickened grey matter is associated with loss of the underlying white matter and enlargement of the lateral ventricle. Again, note theupward tilt of the right frontal horn. (I) A 1-year old with a diagnosis of tuberous sclerosis complex and seizures since birth. There is leftHME with increased grey matter thickness and white matter changes.
Clinical-pathological correlations in HME Brain (2006), 129, 352–365 357
by guest on June 6, 2013http://brain.oxfordjournals.org/
Dow
nloaded from
cases (Fig. 4D, E and Table 2). By comparison, PMG was
observed in 61% and immature-appearing neurons in 70%
of cases (Figs. 4B, C, F and Table 2). In this HME cohort,
PMG, balloon cells, immature-appearing neurons and
glial/neuronal heterotopias did not correlate with MRI-
assessed total, affected or non-affected cerebral hemisphere
volumes (t-test; P > 0.11), gender (Chi-square; P > 0.25), side
resected (P > 0.37), age at surgery (P > 0.20), age at seizure
onset (P > 0.51), seizure duration (P > 0.22) or post-surgery
seizure control (P > 0.15). However, PMG on histopathology
was associated with enlarged deep grey matter MRI abnor-
malities (Fig. 1D–F; Chi-square; P = 0.035). In addition, the
presence of immature-appearing neurons in the surgical spe-
cimen correlated with a positive history of infantile spasms
(P = 0.019), and T2-weighted white matter hypointensity on
MRI scans (P = 0.047; Fig. 4F). By comparison, balloon cells in
the surgical specimen did not correlate with neuroimaging
abnormalities or clinical variables (P > 0.14).
NeuN densities, cortical thickness andcell sizeTissue blocks prospectively collected at surgery were available
from 14 (61%) HME cases, and were compared with 11 aut-
opsy cases (controls). The mean age (years 6 SD) of all 25
cases was 2.3 6 2.4, and there were no statistically significant
differences between the HME and autopsy groups (t-test;
P = 0.23). Visually, NeuN packing densities in the upper
cortical layers were variable in HME cases, some patients
showing more and others fewer cells per unit area than
aged comparable autopsy cases (Fig. 5A–C). Middle cortical
layers were not generally different in most HME compared
Fig. 2 Bar graphs (A; mean 6 SEM) showing differences in hemispheric MRI-assessed cerebral volumes and scatter plot B indicating volumechanges with age. The P-values from the ANCOVA (Table 2) are indicated for each plot. (A) Controlling for age (ANCOVA), total cerebralvolumes for both hemispheres were not statistically different between HME and non-HME cases (P = 0.271). However, for HME cases,the affected cerebral hemisphere was larger (P = 0.035), and the non-affected side was smaller (P = 0.039) compared with non-HMEcases. The differences in affected minus non-affected cerebral hemisphere volumes were greater in HME cases compared with non-HMEcases (P = 0.015). (B) For both HME and non-HME cases, total cerebral volumes logarithmically increased from birth to age 2 years(P < 0.0001). Similar data showed a logarithmic increase for affected and non-affected cerebral hemispheres (Table 1; data not shown).
358 Brain (2006), 129, 352–365 N. Salamon et al.
by guest on June 6, 2013http://brain.oxfordjournals.org/
Dow
nloaded from
with autopsy cases (Fig. 5D–F), and in the lower cortex there
were fewer neurons per unit area in most HME cases
(Fig. 5G–I).
ANCOVA found no statistically significant NeuN density
or size measurements that changed within the limited age
range of this cohort, but three variables were found that
were statistically different between the HME and autopsy
cases (Table 1, Figs 5 and 6). On the affected side, NeuN
cell counts showed increased densities in Layer 1 (molecular
layer; +244%; P = 0.04), and decreased densities for lower
cortical Levels 4 (�35%; P = 0.013) and 6 (�35%; P = 0.033;
Fig. 6A). Numerically, NeuN densities were increased in
upper cortical Levels 2 (+18%) and 3 (+56%) and decreased
in cortical Levels 1 (�9%) and 5 (�11%), but the differences
did not reach statistical significance (P > 0.32). Similarly,
NeuN densities in the superficial (+139%) and deep white
matter (+149%) were numerically increased in HME
compared with autopsy cases (Tables 1 and 3). Cortical thick-
ness was increased in HME compared with autopsy cases
(+27%), but the differences were not statistically significant
(Fig. 6A; P = 0.24). While again not statistically significant,
NeuN cell size measurements were increased for HME com-
pared with autopsy cases in Layer 1 (+42%), lower grey matter
(+11%), superficial white matter (+23%) and deep white
matter (+20%), but not upper grey matter (�1%; Table 3).
In one surgical/autopsy HME case, three paired formalin-
fixed tissue blocks from the affected HME and non-affected
apparently ‘normal’ side were available for NeuN density and
cell size measurements (Fig. 6B) (Jahan et al., 1997). Analysis
found that there were numerically decreased neuronal
densities in the upper cortex of the HME compared
with the apparently ‘normal’ side (Level 1, �31%; Level 2,
�16% and Level 3, �29%), and an increase in cortical
thickness on the HME side (+38%). In addition, NeuN-
assessed cell sizes were numerically increased on the HME
compared with ‘normal’ side for Layer 1 (+26%), upper grey
matter (+79%) and lower grey matter (+87%; data not
shown).
Several NeuN measurements correlated with MRI, histo-
pathological features or clinical variables (Table 3). In this
HME cohort, a history of infantile spasms was associated with
a statistically significant decrease in NeuN cell densities for
cortical Level 4 (�55%), Level 5 (�58%) and Level 6 (�51%),
but not Layer 1 (P = 0.95), Levels 1–3 (P > 0.076), or super-
ficial or deep white matter regions (P > 0.70). Likewise, deep
MRI grey matter abnormalities (Fig. 1D–F) correlated with
decreased NeuN cell densities in cortical Level 4 (�75%), and
Level 6 (�79%). Similarly, PMG at histopathology was asso-
ciated with lower NeuN densities in Level 6 (�56%). Finally,
patients with post-hemispherectomy seizure control were
associated with decreased Layer 1 molecular layer NeuN dens-
ities on the HME side (�68%). No statistically significant
associations were found comparing cortical thickness and
NeuN cell sizes with histopathological, MRI and clinical
variables.
DiscussionThis study of children with HME undergoing hemispherec-
tomy for medically refractory epilepsy identified several
findings unappreciated in previous clinical, neuroimaging
and pathological appraisals. By volumetric MRI, the affected
cerebral hemisphere was larger (ipsilateral HME) and the
non-affected side smaller (contralateral hemimicrencephaly)
than non-HME cases (Figs 1–3 and Table 1). The HME
hemisphere demonstrated deep grey and white matter MRI
abnormalities and/or T2-weighted hypointensity in the sub-
cortical white matter in 75% of cases, suggestive for excessive
pre-natal neurogenesis and heterotopias (Fig. 1). Balloon
cells, considered in some classification systems to be essential
histopathological characteristics of HME (Barkovich et al.,
2001; Flores-Sarnat et al., 2003; Palmini et al., 2004) were
Fig. 3 Axial T2-weighted MRI and volumetric findings frommonozygotic twins with one sibling presenting with HME andseizures. Twin A developed seizures within days of birth, and bothinfants underwent MRI within 2-weeks of each other at age 4months. (A and B) The twin with seizures showed enlargement ofthe left compared with the right cerebral hemisphere (A) whilethe twin without seizures had a normal scan without hemisphereasymmetry. (C and D) Calculated volumes for each cerebralhemisphere and twin are shown (note the difference in right/leftorientation compared with panels A and B). Total cerebralvolume for the twin with HME is 539 and 568 cm3 for the normaltwin. However, there were differences in hemisphere volumeswith the ‘normal’ side of the HME case being smaller than eitherhemisphere of the normal twin.
Clinical-pathological correlations in HME Brain (2006), 129, 352–365 359
by guest on June 6, 2013http://brain.oxfordjournals.org/
Dow
nloaded from

identified in 45% of surgical specimens. By comparison,
immature-appearing neurons were identified in 70% and
PMG in 61% of paediatric HME cases (Table 2 and Fig. 4).
Compared with autopsy cases, in HME children NeuN dens-
ities on the affected side were significantly increased in the
molecular layer (+244%), decreased in the lower cortex
(�35%) and numerically increased in upper cortical layers
(+56 to +18%) and superficial and deep white matter (+139 to
+149%; Figs 5 and 6; Table 1). The decrease in lower cortical
NeuN densities (average �20%) was similar to the increase in
cortical thickness (+27%) on the affected HME side. Deep
grey matter MRI abnormalities and/or T2-weighted white
matter hypointensity positively correlated with the presence
of immature-appearing neurons and PMG on histopathology,
Fig. 4 Histopathological features of HME. (A) Freshly cut surface from a HME surgical specimen showing thickened grey matter withindistinct grey–white matter border (upper), and subcortical heterotopia (lower). (B and C) NeuN stained region of PMG. The box in B isshown at higher magnification (C). The density of NeuN stained cells was visibly increased in the superficial cortical layers compared withthe deeper layers. (D) H and E stained section through the cortex shows cortical dyslamination with numerous dysmorphic cells includingenlarged cytomegalic neurons and balloon cells. (E) Magnified views of the grey matter showing dysmorphic cytomegalic neurons andballoon cells. Balloon cells were most often found in either upper cortical layers or white matter, and cytomegalic neurons were mostfrequently observed in the lower grey and upper white matter regions. (F) A cluster of immature-appearing cells in the middle of thegrey matter. These neuroblast-like cells are characterized by their round to oval nuclear configurations with a thin rim of cytoplasm inwhich there are typically no dysmorphic features. Immature-appearing cells were observed in the white and grey matter, and mostfrequently in the perisylvian tissue blocks. Calibration bars as indicated. Panels E and F of equal magnification.
360 Brain (2006), 129, 352–365 N. Salamon et al.
by guest on June 6, 2013http://brain.oxfordjournals.org/
Dow
nloaded from

decreased lower cortical NeuN cell densities and a history of
infantile spasms. In HME cases, seizure control post-surgery
was associated with decreased NeuN densities in the molecu-
lar layer on the affected side (Table 3). These findings indicate
the existence of bi-hemispheric abnormalities in HME cases
that may explain the suboptimal developmental outcomes
observed in these children post-hemispherectomy. Further-
more, based on an understanding of normal developmental
neurobiology, our neuroimaging and neuropathological find-
ings support the hypothesis that HME pathogenesis probably
involves somatic mosaic mutations that affect cortical
development differently for each side.
Previous clinical studies have noted worse post-surgery
seizure control along with poorer cognitive and language
outcomes in HME cases compared with other children under-
going epilepsy neurosurgery (Vigevano et al., 1996; Battaglia
et al., 1999; Carreno et al., 2001; Curtiss et al., 2001; Maehara
et al., 2002; Jonas et al., 2004). The reasons for the suboptimal
surgical outcomes in HME cases are unknown, but our data
support the concept that one reason may be because the
contralateral apparently ‘normal’ cerebral hemisphere
shows hemimicrencephaly. Consistent with this notion, in
our cohort the HME cases with the greatest pre-surgery
side-to-side cerebral asymmetries by MRI (>100 cc) were
post-surgery developmentally doing the worst, especially
for language, despite being seizure free. In our previous
quantitative MRI study of less severe paediatric cortical
dysplasia patients we reported minimal increases (+3%) in
cerebral hemisphere volumes comparing the affected with the
non-affected side (Andres et al., 2005). This contrasts with the
33% side-to-side asymmetry in HME cases in our current
report. Hence, our findings would agree with prior proposals
using qualitative MRI assessments that poorer developmental
outcomes in HME children are associated with the severity
of cerebral asymmetry (Barkovich and Chuang, 1990;
Sener, 1995).
Our neuroimaging and histopathology findings also sug-
gest that previous hypotheses involving HME pathogenesis
should be revised to consider developmental mechanisms that
affect both hemispheres differently (Barkovich and Chuang,
1990; Barkovich et al., 2001; Flores-Sarnat et al., 2003; Palmini
et al., 2004). Previous classification systems, based on
qualitative neuroimaging or histopathological findings on a
smaller number of patients have speculated that HME patho-
genesis is from a very early cortical developmental abnor-
mality on one side that alters neuronal migration and/or
neuroglial differentiation to explain the presence of dys-
morphic balloon cells on histopathology. If these hypotheses
are correct then in HME one would expect (i) a normal sized
contralateral cerebral hemisphere because the aetiological
process affects one side; (ii) decreased trans-cortical neuronal
densities and thickness because of reduced neurogenesis from
abnormal neuroblast formation and/or incomplete neuronal
migration; and (iii) balloon cells to be present in all HME
cases.
While decreased lower cortical NeuN packing densities in
our study could be envisioned as a sign of abnormal early
cortical neuron migration consistent with prior proposals,
when all the neuroimaging and neuropathological data are
collectively reviewed an alternative ontogenetic hypotheses
should be considered. The decrease in lower cortical NeuN
packing densities (average Level 4–6; �20%) was associated
with an increase in MRI cerebral volumes (+18%) and cortical
thickness (+27%). By comparison, on the affected side NeuN
cell densities were numerically increased in the upper cortex
(average Level 1–3; +22%). Thus, compensating for changes
in cortical thickness and cerebral hemisphere volume, total
neuronal numbers in the lower cortex are probably similar to
autopsy cases and increased in the upper cortex of the HME
hemisphere. Furthermore, in the majority of HME cases we
found enlarged deep grey matter MRI abnormalities in regions
normally associated with pre-natal neurogenesis suggesting
excessive neuronal production (Haydar et al., 1999; Rakic
and Zecevic, 2000; Chan et al., 2002), and T2-weighted hypo-
intensity indicative of excess heterotopic neurons in the sub-
cortical white matter. Taken together, these neuroimaging
and histopathological findings support the view that there
appears to be more neurons than expected throughout the
ipsilateral hemisphere of HME patients. Assuming that neur-
ons in the upper cortex are the latest born, the pattern
of histopathological abnormalities is most consistent
with the concept that neurons were overproduced late in
corticoneurogenesis, and there is partial failure of post-
neurogenesis programmed cell death in the remnants of
the molecular layer and subplate. These conclusions are sim-
ilar to our previous findings in less severe non-HME forms of
cortical dysplasia, and support the concept that paediatric
cortical dysplasia associated with intractable epilepsy, includ-
ing HME, may have comparable ontogenetic mechanisms
(Andres et al., 2005). In contrast, balloon cells, thought to
be products of abnormal neuroglial differentiation, were iden-
tified in less than half of our HME cases (Table 2), and their
presence in the surgical specimen did not correlate with
clinical, MRI or neuropathological variables. Such findings
support the notion that abnormal mechanisms that produce
balloon cells are not essential for HME pathogenesis (Mischel
et al., 1995; Cepeda et al., 2005a).
Table 2 Frequency of histopathological features on theaffected side of HME cases with intractable epilepsy(n = 23)
Pathologic feature None (%) Mild (%) Severe (%)
PMG 39 39 22Cortical dyslamination 0 43 57Balloon cells 65 22 13Cytomegalic neurons 4 39 57Immature-appearing cells 30 70 0Excessive white matter neurons 0 48 52Calcifications 17 74 9Glial/neuronal heterotopias 39 61 0
Clinical-pathological correlations in HME Brain (2006), 129, 352–365 361
by guest on June 6, 2013http://brain.oxfordjournals.org/
Dow
nloaded from

Of equal relevance was our observation that immature-
appearing neurons were frequent histopathological findings
in HME patients, and correlated with T2-weighted MRI white
matter hypointensity and a history of infantile spasms. Such
clinical–pathological correlations suggest that mechanisms
that over produce immature neurons in the later stages of
cortical development maybe more representative of the onto-
genetic process leading to HME and seizures (Caviness et al.,
2003; Tarui et al., 2005). In other words, molecular mechan-
isms that affect pre-neurogenesis progenitor cell cycling may
be cellular pathways to investigate as possible ‘causes’ of
non-syndromic paediatric HME and cortical dysplasia asso-
ciated with epilepsy (Cotter et al., 1999a, b). Such conclusions
support our previous hypothesis that epileptogenesis in cor-
tical dysplasia and HME is probably due to incomplete cor-
tical maturation with excessive immature-appearing neurons
and under developed synaptic circuitry (Cepeda et al., 2005a,b).
Finally, whether genetic and/or environmental in origin the
aetiology of HME seems to begin after zygote separation as
illustrated in our study of monozygotic twins (Fig. 3).
It is important to consider the potential limitations of our
human study when interpreting the results. For example, our
Fig. 5 NeuN-stained sections illustrating differences in cell densities for layer 1 and upper cortex (levels 1 and 2; A–C), lower cortex (levels3–5; D–F) and white matter (G–I) from an autopsy case (A, D and G), and two HME cases (B, C, E, F, H and I) of similar ages. Boxes inleft column indicate approximate locations for NeuN cell counts. Compared with the autopsy case, the first HME patient (middle column)shows increased NeuN densities in the upper cortex and white matter with similar densities in the lower cortex. The increased uppercortex densities were associated with infolding of the neuronal layer near the pial surface (panel B arrow). In contrast, the second HME case(right column) shows lower NeuN densities throughout the cortex with minimal distinction between the grey and white matter. Allmicrographs are at identical magnification.
362 Brain (2006), 129, 352–365 N. Salamon et al.
by guest on June 6, 2013http://brain.oxfordjournals.org/
Dow
nloaded from

findings are based on neuroimaging and histopathology
obtained from mostly non-syndromic HME patients with
epilepsy who were surgical candidates. Our results and inter-
pretations may or may not be applicable to syndromic HME
cases, non-surgical HME patients with bi-hemispheric sei-
zures and the few HME cases without intractable epilepsy.
Likewise, our MRI studies did not include a very large sample
of non-seizure normal controls because such a group was
nearly impossible to recruit. However, based on our prior
MRI study of children with milder forms of cortical dysplasia
and non-dysplasia pathologies, non-affected cerebral hemi-
sphere volumes were only minimally different, and thus
non-HME cases are a reasonable comparison group for the
HME cohort (Andres et al., 2005). Furthermore, our cohort
consisted of very young HME children (less than age 4 years).
We do not know if there could be progressive pathological
abnormalities with longer seizure histories (Mathern et al.,
2002). In addition, we measured NeuN cell densities from a
limited number of tissue blocks per patient and did not sys-
tematically sample the entire brain (Cook et al., 2004). Despite
the expected increased variability due to the limited number
of sample sites, we still found statistically significant differ-
ences between HME and autopsy patient groups supporting
the view that our methods were sufficiently sensitive for this
study. Moreover, we counted NeuN positive cells which
should accurately identify differentiated neurons and avoid
potential confusion with glia or other non-neuronal cell types.
However, we cannot discern whether the cells were excitatory
or inhibitory. Finally, our hypothesis concerning HME patho-
genesis is based on the presumption that the developmental
neurobiology of cortical development and migration are func-
tional in these morphologically abnormal brains.
Fig. 6 Bar graphs showing mean (6SEM) NeuN cell densities and cortical thickness for autopsy (control) and HME cases usingparaformaldehyde fixed 30 mm cryostat sections (upper), and affected and non-affected side of a single HME case that died during surgeryusing 10 mm formalin fixed blocks (lower). The P-values are indicated. (A) For the paraformaldehyde fixed 30 mm cryostat sections,statistically significant differences were found for Layer 1, Level 4 and Level 6 (P < 0.04). (B) For the single case that was formalin fixed,NeuN densities from three homotopic neocortical regions per side were averaged. Numerically, there were increased densities for Level 1and cortical height in the affected hemisphere compared with the non-affected ‘normal’ side. Because of the different fixation techniquesand slice thickness, NeuN density measurement cannot be directly compared between the upper and lower graphs.
Clinical-pathological correlations in HME Brain (2006), 129, 352–365 363
by guest on June 6, 2013http://brain.oxfordjournals.org/
Dow
nloaded from
ConclusionsExamining paediatric epilepsy surgery patients with HME,
this study found changes in cerebral hemisphere volumes
by MRI and NeuN cell densities that correlated with clinical
and histopathological variables that in turn provide clues to
HME pathogenesis and an explanation for poorer cognitive
and seizure control outcomes post-hemispherectomy. Based
on our results, we propose that HME pathogenesis is the
consequence of over proliferation of progenitor cells in
later cell cycles. We also propose that HME pathogenesis
involves mechanisms that interfere with late corticoneurogen-
esis with partial failure of post-neurogenesis apoptosis in the
molecular layer and subplate (Andres et al., 2005). Finally, we
propose that poorer post-surgery seizure control and cognit-
ive outcomes are due to contralateral hemimicrencephaly in
most HME patients. It should be noted that these proposed
concepts do not exclude other possible explanations, such as a
defect in neuronal migration in later cortical development,
and the mechanisms of inducing contralateral hemimicren-
cephaly with ipsilateral HME will require additional studies.
However, our data provide a conceptual framework for
proposing hypothesis-driven studies directed toward
molecular mechanisms that affect progenitor cell cycling,
migration and pre- and post-neurogenesis to explain HME
and seizures.
AcknowledgementsThis study was supported by the National Institutes of
Health grants R01 NS38992 and P05 NS02808 to G.W.M.
and FAPESP (CInAPCe-Project-05/56447-7) to J.P.L.
References
Andre VM, Flores-Hernandez J, Cepeda C, Starling AJ, Nguyen ST, Lobo MK,
et al. NMDA receptor alterations in neurons from pediatric cortical
dysplasia tissue. Cereb Cortex 2004; 14: 634–46.
Andres M, Andre VM, Nguyen S, Salamon N, Cepeda C, Levine MS, et al.
Human cortical dysplasia and epilepsy: an ontogenetic hypothesis based on
volumetric MRI and NeuN neuronal density and size measurements. Cereb
Cortex 2005; 15: 194–210.
Arai Y, Edwards V, Becker LE. A comparison of cell phenotypes in hemime-
galencephaly and tuberous sclerosis. Acta Neuropathol (Berl) 1999; 98:
407–13.
Barkovich AJ, Chuang SH. Unilateral megalencephaly: correlation of MR
imaging and pathologic characteristics. AJNR Am J Neuroradiol 1990;
11: 523–31.
Barkovich AJ, Kuzniecky RI, Jackson GD, Guerrini R, Dobyns WB.
Classification system for malformations of cortical development: update
2001. Neurology 2001; 57: 2168–78.
Battaglia D, Di Rocco C, Iuvone L, Acquafondata C, Iannelli A, Lettori D, et al.
Neuro-cognitive development and epilepsy outcome in children with
surgically treated hemimegalencephaly. Neuropediatrics 1999; 30: 307–13.
Carreno M, Wyllie E, Bingaman W, Kotagal P, Comair Y, Ruggieri P. Seizure
outcome after functional hemispherectomy for malformations of cortical
development. Neurology 2001; 57: 331–3.
Caviness VS Jr, Takahashi T, Nowakowski RS. Numbers, time and neocortical
neuronogenesis: a general developmental and evolutionary model. Trends
Neurosci 1995; 18: 379–83.
Caviness VS Jr, Goto T, Tarui T, Takahashi T, Bhide PG, Nowakowski RS. Cell
output, cell cycle duration and neuronal specification: a model of integ-
rated mechanisms of the neocortical proliferative process. Cereb Cortex
2003; 13: 592–8.
Cepeda C, Hurst RS, Flores-Hernandez J, Hernandez-Echeagaray E, Klapstein
GJ, Boylan MK, et al. Morphological and electrophysiological character-
ization of abnormal cell types in pediatric cortical dysplasia. J Neurosci Res
2003; 72: 472–86.
Cepeda C, Andre VM, Flores-Hernandez J, Nguyen OK, Wu N, Klapstein GJ,
et al. Pediatric cortical dysplasia: correlations between neuroimaging,
electrophysiology and location of cytomegalic neurons and balloon cells,
and glutamate/GABA synaptic circuits. Dev Neurosci 2005a; 27: 59–76.
Cepeda C, Andre VM, Vinters HV, Levine MS, Mathern GW. Are cytomegalic
neurons and balloon cells generators of epileptic activity in pediatric
cortical dysplasia? Epilepsia 2005b; 46 Suppl 5: 82–8.
Chan WY, Lorke DE, Tiu SC, Yew DT. Proliferation and apoptosis in the
developing human neocortex. Anat Rec 2002; 267: 261–76.
Chenn A, Walsh CA. Regulation of cerebral cortical size by control of cell cycle
exit in neural precursors. Science 2002; 297: 365–9.
Chenn A, Walsh CA. Increased neuronal production, enlarged forebrains and
cytoarchitectural distortions in beta-catenin overexpressing transgenic
mice. Cereb Cortex 2003; 13: 599–606.
Cook SW, Nguyen ST, Hu B, Yudovin S, Shields DW, Vinters H, et al.
Cerebral hemispherectomy for pediatric epilepsy patients: a comparison
of three techniques by pathologic substrate in 115 patients. J Neurosurg
2004; 100 2 Suppl Pediatrics: 125–41.
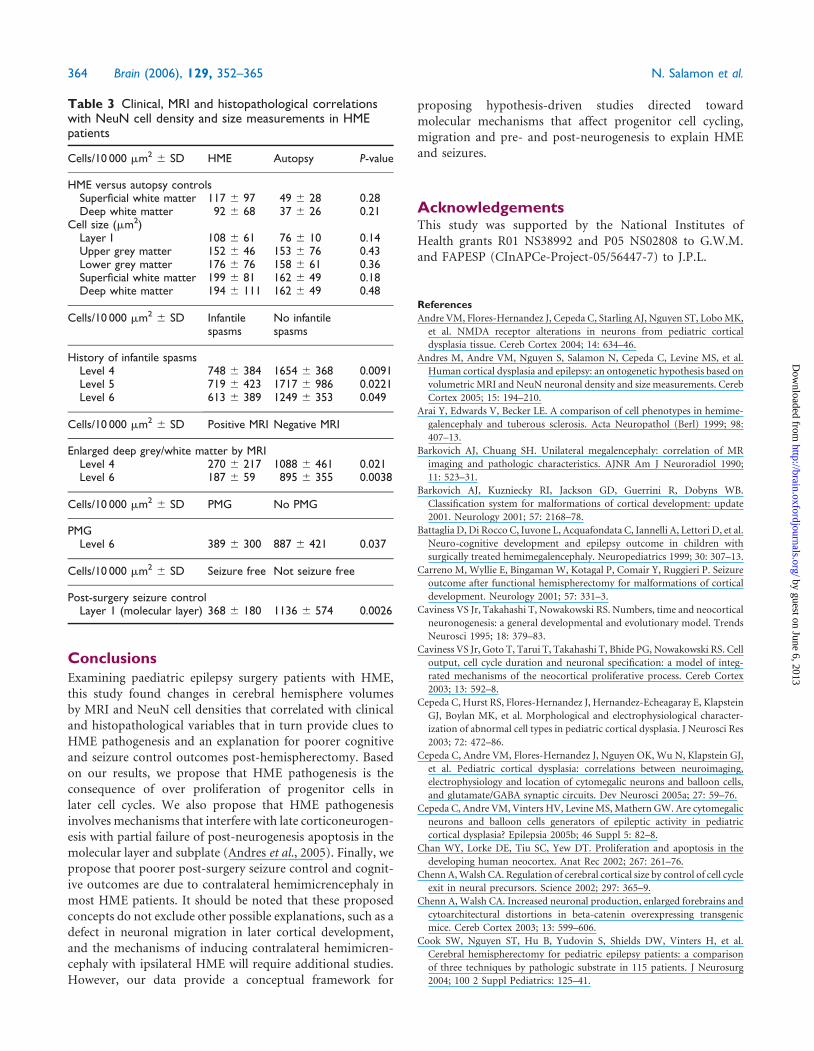
Table 3 Clinical, MRI and histopathological correlationswith NeuN cell density and size measurements in HMEpatients
Cells/10 000 mm2 6 SD HME Autopsy P-value
HME versus autopsy controlsSuperficial white matter 117 6 97 49 6 28 0.28Deep white matter 92 6 68 37 6 26 0.21
Cell size (mm2)Layer I 108 6 61 76 6 10 0.14Upper grey matter 152 6 46 153 6 76 0.43Lower grey matter 176 6 76 158 6 61 0.36Superficial white matter 199 6 81 162 6 49 0.18Deep white matter 194 6 111 162 6 49 0.48
Cells/10 000 mm2 6 SD Infantilespasms
No infantilespasms
History of infantile spasmsLevel 4 748 6 384 1654 6 368 0.0091Level 5 719 6 423 1717 6 986 0.0221Level 6 613 6 389 1249 6 353 0.049
Cells/10 000 mm2 6 SD Positive MRI Negative MRI
Enlarged deep grey/white matter by MRILevel 4 270 6 217 1088 6 461 0.021Level 6 187 6 59 895 6 355 0.0038
Cells/10 000 mm2 6 SD PMG No PMG
PMGLevel 6 389 6 300 887 6 421 0.037
Cells/10 000 mm2 6 SD Seizure free Not seizure free
Post-surgery seizure controlLayer 1 (molecular layer) 368 6 180 1136 6 574 0.0026
364 Brain (2006), 129, 352–365 N. Salamon et al.
by guest on June 6, 2013http://brain.oxfordjournals.org/
Dow
nloaded from
Cotter D, Honavar M, Lovestone S, Raymond L, Kerwin R, Anderton B, et al.
Disturbance of Notch-1 and Wnt signalling proteins in neuroglial balloon
cells and abnormal large neurons in focal cortical dysplasia in human
cortex. Acta Neuropathol (Berl) 1999a; 98: 465–72.
Cotter DR, Honavar M, Everall I. Focal cortical dysplasia: a neuropathological
and developmental perspective. Epilepsy Res 1999b; 36: 155–64.
Curtiss S, de Bode S, Mathern GW. Spoken language outcomes after
hemispherectomy: factoring in etiology. Brain Lang 2001; 79: 379–96.
De Rosa MJ, Secor DL, Barsom M, Fisher RS, Vinters HV. Neuropathologic
findings in surgically treated hemimegalencephaly: immunohistochemical,
morphometric, and ultrastructural study. Acta Neuropathol (Berl) 1992;
84: 250–60.
deAzevedo LC, Fallet C, Moura-Neto V, Daumas-Duport C, Hedin-Pereira C,
Lent R. Cortical radial glial cells in human fetuses: depth-correlated trans-
formation into astrocytes. J Neurobiol 2003; 55: 288–98.
Di Rocco C, Iannelli A. Hemimegalencephaly and intractable epilepsy:
complications of hemispherectomy and their correlations with the surgical
technique. A report on 15 cases. Pediatr Neurosurg 2000; 33: 198–207.
Flores-Sarnat L. Hemimegalencephaly: part 1. Genetic, clinical and imaging
aspects. J Child Neurol 2002; 17: 373–84; discussion 384.
Flores-Sarnat L, Sarnat HB, Davila-Gutierrez G, Alvarez A. Hemimegalen-
cephaly: part 2. Neuropathology suggests a disorder of cellular lineage.
J Child Neurol 2003; 18: 776–85.
Friede RL. Developmental neuropathology. Berlin: Springer-Verlag; 1989.
Hayakawa K, Konishi Y, Kuriyama M, Konishi K, Matsuda T. Normal brain
maturation in MRI. Eur J Radiol 1991; 12: 208–15.
Haydar TF, Kuan CY, Flavell RA, Rakic P. The role of cell death in regulating
the size and shape of the mammalian forebrain. Cereb Cortex 1999; 9:
621–6.
Hoffmann KT, Amthauer H, Liebig T, Hosten N, Etou A, Lehmann TN, et al.
MRI and 18F-fluorodeoxyglucose positron emission tomography in hemi-
megalencephaly. Neuroradiology 2000; 42: 749–52.
Jahan R, Mischel PS, Curran JG, Peacock WJ, Shields DW, Vinters HV.
Bilateral neuropathologic changes in a child with hemimegalencephaly.
Pediatr Neurol 1997; 17: 344–9.
Jonas R, Nguyen S, Hu B, Asarnow RF, LoPresti C, Curtiss S, et al. Cerebral
hemispherectomy: hospital course, seizure, developmental, language, and
motor outcomes. Neurology 2004; 62: 1712–21.
Jonas R, Asarnow RF, LoPresti C, Yudovin S, Koh S, Wu JY, et al. Surgery for
symptomatic infant-onset epileptic encephalopathy with and without
infantile spasms. Neurology 2005; 64: 746–50.
Kostovic I, Rakic P. Developmental history of the transient subplate zone in
the visual and somatosensory cortex of the macaque monkey and human
brain. J Comp Neurol 1990; 297: 441–70.
Kuan CY, Roth KA, Flavell RA, Rakic P. Mechanisms of programmed cell
death in the developing brain. Trends Neurosci 2000; 23: 291–7.
Kuzniecky RI, Barkovich AJ. Malformations of cortical development and
epilepsy. Brain Dev 2001; 23: 2–11.
Maehara T, Shimizu H, Kawai K, Shigetomo R, Tamagawa K, Yamada T, et al.
Postoperative development of children after hemispherotomy. Brain Dev
2002; 24: 155–60.
Marin-Padilla M. Developmental neuropathology and impact of perinatal
brain damage. III: gray matter lesions of the neocortex. J Neuropathol
Exp Neurol 1999; 58: 407–29.
Marin-Padilla M, Marin-Padilla TM. Origin, prenatal development and struc-
tural organization of layer I of the human cerebral (motor) cortex. A Golgi
study. Anat Embryol (Berl) 1982; 164: 161–206.
Mathern GW, Babb TL, Pretorius JK, Leite JP. Reactive synaptogenesis and
neuron densities for neuropeptide Y, somatostatin, and glutamate
decarboxylase immunoreactivity in the epileptogenic human fascia dentata.
J Neurosci 1995; 15: 3990–4004.
Mathern GW, Kuhlman PA, Mendoza D, Pretorius JK. Human fascia dentata
anatomy and hippocampal neuron densities differ depending on the
epileptic syndrome and age at first seizure. J Neuropathol Exp Neurol
1997; 56: 199–212.
Mathern GW, Giza CC, Yudovin S, Vinters HV, Peacock WJ, Shewmon DA,
et al. Postoperative seizure control and antiepileptic drug use in pediatric
epilepsy surgery patients: the UCLA experience, 1986–1997. Epilepsia 1999;
40: 1740–9.
Mathern GW, Cepeda C, Hurst RS, Flores-Hernandez J, Mendoza D, Levine
MS. Neurons recorded from pediatric epilepsy surgery patients with
cortical dysplasia. Epilepsia 2000; 41: S162–7.
Mathern GW, Adelson PD, Cahan LD, Leite JP. Hippocampal neuron damage
in human epilepsy: Meyer’s hypothesis revisited. Prog Brain Res 2002; 135:
237–51.
Mischel PS, Nguyen LP, Vinters HV. Cerebral cortical dysplasia
associated with pediatric epilepsy. Review of neuropathologic features
and proposal for a grading system. J Neuropathol Exp Neurol 1995; 54:
137–53.
Miyata H, Chute DJ, Fink J, Villablanca P, Vinters HV. Lissencephaly with
agenesis of corpus callosum and rudimentary dysplastic cerebellum: a
subtype of lissencephaly with cerebellar hypoplasia. Acta Neuropathol
(Berl) 2004; 107: 69–81.
O’Kusky JR, Akers MA, Vinters HV. Synaptogenesis in hemimegalencephaly:
the numerical density of asymmetric and symmetric synapses in the
cerebral cortex. Acta Neuropathol (Berl) 1996; 92: 156–63.
Palmini A, Najm I, Avanzini G, Babb T, Guerrini R, Foldvary-Schaefer N, et al.
Terminology and classification of the cortical dysplasias. Neurology 2004;
62: S2–8.
Prayson RA, Spreafico R, Vinters HV. Pathologic characteristics of the cortical
dysplasias. Neurosurg Clin N Am 2002; 13: 17–25, vii.
Putz U, Harwell C, Nedivi E. Soluble CPG15 expressed during early
development rescues cortical progenitors from apoptosis. Nat Neurosci
2005; 8: 322–31.
Rakic P. Defects of neuronal migration and the pathogenesis of cortical
malformations. Prog Brain Res 1988; 73: 15–37.
Rakic P. A small step for the cell, a giant leap for mankind: a hypothesis
of neocortical expansion during evolution. Trends Neurosci 1995; 18:
383–8.
Rakic P. Elusive radial glial cells: historical and evolutionary perspective. Glia
2003; 43: 19–32.
Rakic S, Zecevic N. Programmed cell death in the developing human
telencephalon. Eur J Neurosci 2000; 12: 2721–34.
Rakic S, Zecevic N. Emerging complexity of layer I in human cerebral cortex.
Cereb Cortex 2003; 13: 1072–83.
Sener RN. Hemimegalencephaly associated with contralateral hemispheral
volume loss. Pediatr Radiol 1995; 25: 387–8.
Sims J. On hypertrophy and atrophy of the brain. Med Quir Trans 1835; 19:
315–80.
Sommer L, Rao M. Neural stem cells and regulation of cell number. Prog
Neurobiol 2002; 66: 1–18.
Tarui T, Takahashi T, Nowakowski RS, Hayes NL, Bhide PG, Caviness VS.
Overexpression of p27Kip1, probability of cell cycle exit, and laminar
destination of neocortical neurons. Cereb Cortex 2005; 15: 1343–55.
Uher BF, Golden JA. Neuronal migration defects of the cerebral cortex: a
destination debacle. Clin Genet 2000; 58: 16–24.
Vigevano F, Fusco L, Granata T, Fariello G, Di Rocca C, Cusmai R.
Hemimegalencephaly: clinical and EEG characteristics. In: Guerrini R,
Canapicci R, Zifkin BG, Andermann F, Roger J, Pfanner P, editors. Dys-
plasias of cerebral cortex and epilepsy. Philadelphia: Lippincott-Raven;
1996. p. 285–94.
Vinters HV, Fisher RS, Cornford ME, Mah V, Secor DL, De Rosa MJ, et al.
Morphological substrates of infantile spasms: studies based on surgically
resected cerebral tissue. Childs Nerv Syst 1992; 8: 8–17.
Volpe JJ. Overview: normal and abnormal human brain development. Ment
Retard Dev Disabil Res Rev 2000; 6: 1–5.
Zecevic N. Specific characteristic of radial glia in the human fetal telenceph-
alon. Glia 2004; 48: 27–35.
Zecevic N, Rakic P. Development of layer I neurons in the primate cerebral
cortex. J Neurosci 2001; 21: 5607–19.
Clinical-pathological correlations in HME Brain (2006), 129, 352–365 365
by guest on June 6, 2013http://brain.oxfordjournals.org/
Dow
nloaded from
Copyright © 2022 FDOKUMEN