Continuous propagation of Kluyveromyces fragilis in cheese whey for pollution potential reduction
17
1994 by Humana Press Inc. All rights of any nature whatsoever reserved. 0273-2289/94/4701--0089504.40 Continuous Propagation of Kluyveromyces fragilis in Cheese Whey for Pollution Potential Reduction R. M. BEN-HASSAN AND A. E. GHALY* Technical University of Nova Scotia, P. O. Box 1000, Halifax, Nova Scotia, Canada B3J 2X4 Received April 8, 1993; Accepted November 2, 1993 ABSTRACT A 25-L working volume, upright cylindrical fermenter made of stainless steel was used to investigate cheese whey yeast fermentation for pollution potential reduction. The effluent total and soluble chem- ical oxygen demand, total and volatile solids, and total Kjeldahl and ammonium nitrogen concentrations were significantly affected by the hydraulic retention time, air flow rate, and mixing speed. The system removal efficiencies were 15.90-58.61%, 25.20-69.33%, 12.43-49.90%, 9.22-51.77%, 1.66-10.06%, and 54.82-72.22% for total chemical oxygen demand, soluble chemical oxygen demand, total solids, volatile solids, total Kjeldahl nitrogen, and ammonium nitrogen, respectively, depend- ing on the hydraulic retention time, air flow rate, and mixing speed used. Index Entries: Continuous fermentation; cheese whey; pollution potential; COD; solids; nitrogen. INTRODUCTION The largest pollutants in waste waters from diary food plants are whey from cheese production operations followed by wash water and pasteuri- zation water. Manufacturing of cheese from either whole or skim milk produces a greenish yellow fluid known as whey. Disposal of cheese whey is a major problem for the dairy industry. Of the 1.7 billion kg of liquid whey produced annually in Canada, 17% was dumped in sewers and 26% *Author to whom all correspondence and reprint requests should be addressed. Applied Biochemistry and Biotechnology 89 Vol. 47, 1994
-
Upload
independent -
Category
Documents
-
view
3 -
download
0
Transcript of Continuous propagation of Kluyveromyces fragilis in cheese whey for pollution potential reduction
�9 1994 by Humana Press Inc. All rights of any nature whatsoever reserved. 0273-2289/94/4701--0089504.40
Continuous Propagation of Kluyveromyces fragilis in Cheese Whey
for Pollution Potential Reduction
R. M. BEN-HASSAN AND A. E. GHALY*
Technical University of Nova Scotia, P. O. Box 1000, Halifax, Nova Scotia, Canada B3J 2X4
Received April 8, 1993; Accepted November 2, 1993
ABSTRACT
A 25-L working volume, upright cylindrical fermenter made of stainless steel was used to investigate cheese whey yeast fermentation for pollution potential reduction. The effluent total and soluble chem- ical oxygen demand, total and volatile solids, and total Kjeldahl and ammonium nitrogen concentrations were significantly affected by the hydraulic retention time, air flow rate, and mixing speed. The system removal efficiencies were 15.90-58.61%, 25.20-69.33%, 12.43-49.90%, 9.22-51.77%, 1.66-10.06%, and 54.82-72.22% for total chemical oxygen demand, soluble chemical oxygen demand, total solids, volatile solids, total Kjeldahl nitrogen, and ammonium nitrogen, respectively, depend- ing on the hydraulic retention time, air flow rate, and mixing speed used.
Index Entries: Continuous fermentation; cheese whey; pollution potential; COD; solids; nitrogen.
INTRODUCTION
The largest pollutants in waste waters from diary food plants are whey from cheese production operations followed by wash water and pasteuri- zation water. Manufacturing of cheese from either whole or skim milk produces a greenish yellow fluid known as whey. Disposal of cheese whey is a major problem for the dairy industry. Of the 1.7 billion kg of liquid whey produced annually in Canada, 17% was dumped in sewers and 26%
*Author to whom all correspondence and reprint requests should be addressed.
Applied Biochemistry and Biotechnology 89 Vol. 47, 1994

90 Ben.Hassan and Ghaly
was disposed of on land (1). Jones observed that for each kilogram of cot- tage cheese manufactured, a total of 0.2 kg of biochemical oxygen demand is either pumped into the river, waste water treatment plants, or other water bodies, or loaded on the land (2).
Because of its high biochemical oxygen demand value (40,000-60,000 ppm), whey may disrupt the biological process of sewage disposal plants (3-5). Hacking estimated that 3870 L/d of raw whey (equivalent to the output of a small creamery) discharged into the municipal sewage system can impose a load equivalent to 1800 people (6). Also, long-term land dis- posal of whey can cause environmental pollution problems as reported by several authors (1,7). The nitrogen in cheese whey is water soluble and may be subject to leaching into ground water, thus becoming a threat to human and animal health. Several authors reported that continuous land disposal of cheese whey can endanger the physical and chemical structure of the soil, decrease the crop yield, and lead to serious water pollution problems (8-10).
However, aerobic yeast fermentation of cheese whey can be used to reduce its pollution potential as well as to produce single cell protein (11,12). Mickle reported 82-92% of the reduction in the chemical oxygen demand (COD) of cottage cheese whey was removed by K. fragilis under aerobic conditions (13). Ghaly and Singh reported that aerobic fermentation of cheese whey using the yeast K. fragilis was successful in reducing the total chemical oxygen demand by 42%, the soluble chemical oxygen demand by 65%, the total solids by 53%, and the ammonium nitrogen by 90% (14). A reduction of up to 81% in chemical oxygen demand was observed by Burgess when using tower fermentation for the production of yeast pro- tein from lactose permeate (15).
OBJECTIVES
The aim of the study was to investigate the effectiveness of yeast fer- mentation for the reduction of the pollution potential of cheese whey as measured by the reductions in COD, solids, and nitrogen concentrations under various hydraulic retention times, air flow rates, and mixing speeds.
EXPERIMENTAL APPARATUS
The experimental apparatus used in the study (Fig. 1) consists of a bioreactor, an air supply system, and a whey feeding and effluent removal system.
A 25-L working volume, upright cylindrical fermenter was constructed of 6.35-mm thick stainless steel material. The fermenter was designed with a water jacket for temperature control. The ratio of the diameter to
Applied Biochemistry and Biotechnology Vol. 4 7, 1994

Pollution Reduction 91
Fig. 1. Experimental apparatus.
height chosen for the final design of the fermenter was about 1:2. The fer- menter was designed to be completely mixed and, hence, a stainless steel mixing shaft of 10-mm diameter and 700-mm length was installed through the center of the lid. Three, six-vaned flow disk impellers were used to ensure adequate mixing in the vertical direction. A heavy duty electric motor (G. K. Heller, model no. 99P46-18) with a gear head reducer was mounted on the lid of the fermenter to drive the mixing shaft and impellers. The electric motor was connected to a speed controller (Cole-Parmer, cat. no. J-004407-00). Four baffles (positioned every 90 ~ were used in the fermenter to reduce vortexing and to improve the top-to-bottom turnover.
Compressed air (Medigas Atlantic Limited cat. no. T100172) was sup- plied to the fermenter through a flowmeter with high-resolution valve using tygon tubing of 10-mm diameter. The moisture and impurities in the air were less than 10 and 2 ppm, respectively. A microfilter (Cole- Parmer, cat. no. L-29701-00) was used to reduce the risk of cross-contam- ination. The air was introduced from the bottom of the fermenter through a gas diffusion stone (Fisher Scientific, cat. no. 11-139B).
The whey feeding and effluent removal system included a cheese whey feeding tank (6-mm thickness, 298-mm diameter and 560-mm height) made from PVC material, a feeding pump and an effluent collection tank. An electric motor (Franklin Electric, model no. 6105121401) with a speed- reducing gear arrangement was mounted on the lid of the feeding tank to
Applied Biochemistry and Biotechnology Vol. 47, 1994
92 Ben-Hassan and Ghaly
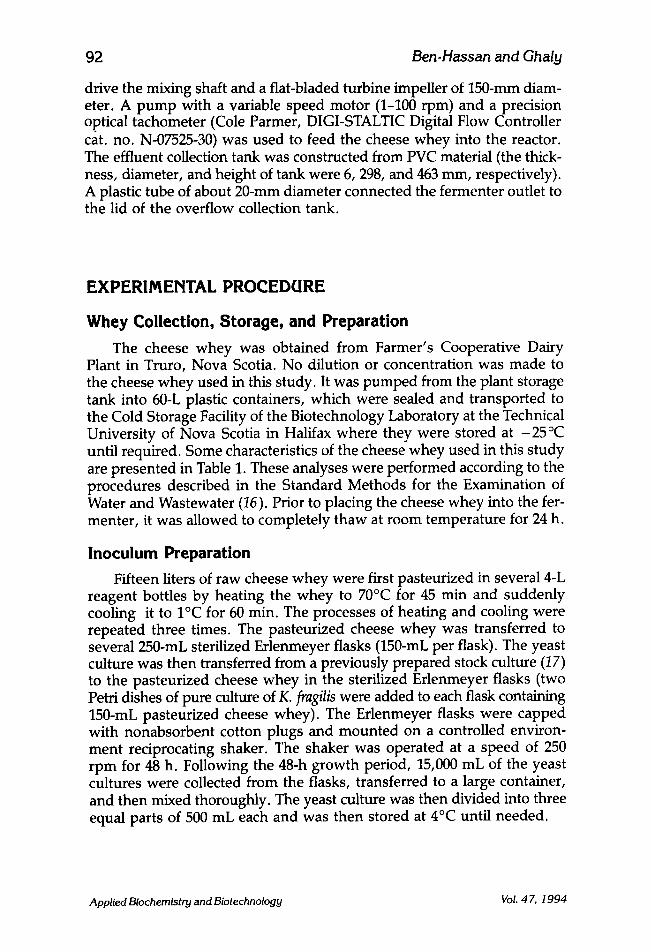
drive the mixing shaft and a flat-bladed turbine impeller of 150-ram diam- eter. A pump with a variable speed motor (1-100 rpm) and a precision optical tachometer (Cole Parmer, DIGI-STALTIC Digital Flow Controller cat. no. N-07525-30) was used to feed the cheese whey into the reactor. The effluent collection tank was constructed from PVC material (the thick- ness, diameter, and height of tank were 6, 298, and 463 mm, respectively). A plastic tube of about 20-mm diameter connected the fermenter outlet to the lid of the overflow collection tank.
EXPERIMENTAL PROCEDURE
Whey Collection, Storage, and Preparation The cheese whey was obtained from Farmer's Cooperative Dairy
Plant in Truro, Nova Scotia. No dilution or concentration was made to the cheese whey used in this study. It was pumped from the plant storage tank into 60-L plastic containers, which were sealed and transported to the Cold Storage Facility of the Biotechnology Laboratory at the Technical University of Nova Scotia in Halifax where they were stored at -25~ until required. Some characteristics of the cheese whey used in this study are presented in Table 1. These analyses were performed according to the procedures described in the Standard Methods for the Examination of Water and Wastewater (16). Prior to placing the cheese whey into the fer- menter, it was allowed to completely thaw at room temperature for 24 h.
inoculum Preparation Fifteen liters of raw cheese whey were first pasteurized in several 4-L
reagent bottles by heating the whey to 70~ for 45 min and suddenly cooling it to 1~ for 60 rain. The processes of heating and cooling were repeated three times. The pasteurized cheese whey was transferred to several 250-mL sterilized Erlenmeyer flasks (150-mL per flask). The yeast culture was then transferred from a previously prepared stock culture (17) to the pasteurized cheese whey in the sterilized Erlenmeyer flasks (two Petri dishes of pure culture of K. fragilis were added to each flask containing 150-mL pasteurized cheese whey). The Erlenmeyer flasks were capped with nonabsorbent cotton plugs and mounted on a controlled environ- ment reciprocating shaker. The shaker was operated at a speed of 250 rpm for 48 h. Following the 48-h growth period, 15,000 mL of the yeast cultures were collected from the flasks, transferred to a large container, and then mixed thoroughly. The yeast culture was then divided into three equal parts of 500 mL each and was then stored at 4~ until needed.
Applied Biochemistry and Biotechnology Vol. 4 7, 1994

Pollution Reduction
Table 1 Some Characteristics of the Raw Cheese Whey
Used in the Study
93
Characteristics Measured value
Total solids 63835 mg/L Fixed 9100 mg/L Volatile 54738 mg/L Percent volatile 85.74 % Percent fixed 14.26 %
Suspended solids 22150 mg/L Fixed 185 mg/L Volatile 21965 mg/L Percent volatile 99.16 % Percent fixed 0.84 %
Total Kjeldahl nitrogen 1690 mg/L Ammonium 270 mg/L Organic 1420 mg/L Percent organic 84.02 % Percent ammonium 15.98 %
Total chemical oxygen demand 74220 mg/L Soluble 59640 mg/L Insoluble 14580 mg/L Percent soluble 80.36 % Percent insoluble 19.64 %
Lactose 5.0 % pH 4.9
Experimental Protocol The fermenter and all accessories (mixing system, tubing, and feeding
tank) were chemically sterilized using 2% potassium meta-bisulfite solu- tion, and then washed with hot water several times before starting the experiment in order to remove any chemical traces. The fermenter was filled to two-thirds of the working volume (16.0 L) with cheese whey and then immediately inoculated using 5.0 L of inoculum.
The air flow (1 vvm), turbine drive (200 rpm), computer, and data acquisition-and-control unit were started immediately. The temperature of the fermentation medium was maintained at 33 + 2~ by circulating cooling water through the fermenter jacket using a temperature-controlled water bath. The pH was maintained at 4.5 -1- 0.2 with the aid of a com- puter-based pH measurement-and-control system (18). The dissolved
Applied Biochemistry and Biotechnology Vol. 47, 1994

94 Ben.Hassan and Ghaly
Table 2 The Experimental Factors and Their Levels
Retention time, Air flow rate, Mixing speed, h vvm rpm
12.0 1.0 200.0 400.0 600.0
3.0 200.0 400.0 600.0
18.0 1.0 200.0 400.0 600.0
3.0 200.0 400.0 600.0
24.0 1.0 200.0 400.0 600.0
3.0 200.0 400.0 600.0
oxygen concentration was continuously monitored. The remaining 9 L (to a full capacity) were made up with a continuous addition of cheese whey at a hydraulic retention time of 24 h (a flow rate of 1.04 L/h) for 2 d. When the fermenter reached the steady state condition (constant COD, solids, nitrogen, and lactose concentrations), 12 samples were collected and analy- zed every 12 h for 6 d. The hydraulic retention time, mixing speed, and air flow rate were changed according to Table 2 and the same procedure was used for samples collection and analysis during the steady state con- dition of all the hydraulic retention time, air flow rate, and mixing speed combinations.
RESULTS AND DISCUSSION
Chemical Oxygen Demand
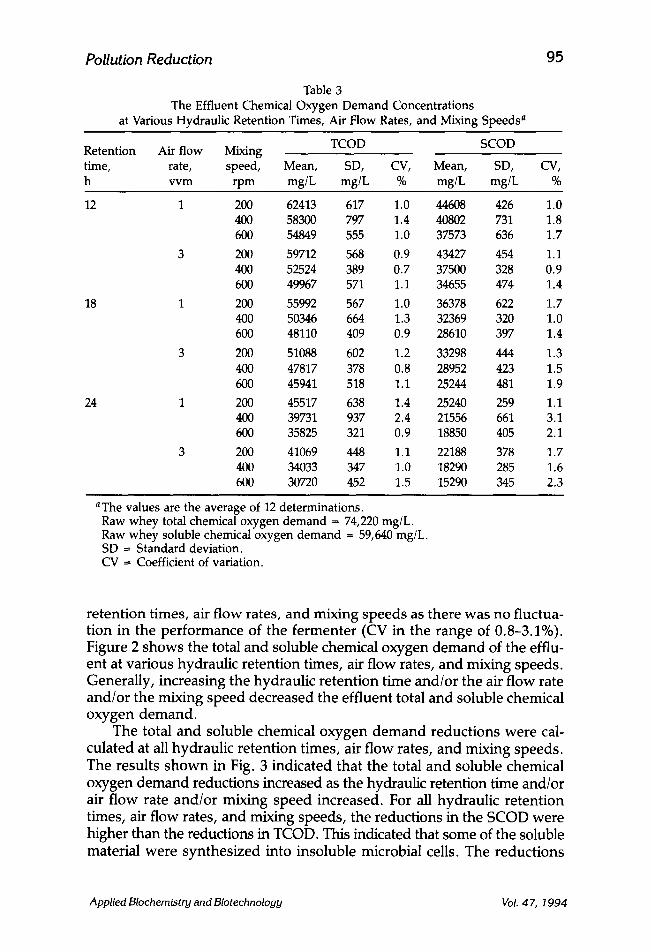
For each experimental run, the mean, standard deviation, and coeffi- cient of variation of both the total and soluble chemical oxygen demand of the effluent were calculated (Table 3). The COD data indicated that the fermenter was operating at the steady state condition for all hydraulic
Applied Biochemistry and Biotechnology Vol. 47, 1994
Pol lu t ion R e d u c t i o n
Table 3 The Effluent Chemical Oxygen Demand Concentrations
at Various Hydraulic Retention Times, Air Flow Rates, and Mixing Speeds a
95
TCOD SCOD Retention Air flow Mixing time, rate, speed, Mean, SD, CV, Mean, SD, CV, h vvm rpm mg/L mg/L % mg/L mg/L %
12 1 200 62413 617 1.0 44608 426 1.0 400 58300 797 1.4 40802 731 1.8 600 54849 555 1.0 37573 636 1.7
3 200 59712 568 0.9 43427 454 1.1 400 52524 389 0.7 37500 328 0.9 600 49967 571 1.1 34655 474 1.4
18 1 200 55992 567 1.0 36378 622 1.7 400 50346 664 1.3 32369 320 1.0 600 48110 409 0.9 28610 397 1.4
3 200 51088 602 1.2 33298 444 1.3 400 47817 378 0.8 28952 423 1.5 600 45941 518 1.1 25244 481 1.9
24 1 200 45517 638 1.4 25240 259 1.1 400 39731 937 2.4 21556 661 3.1 600 35825 321 0.9 18850 405 2.1
3 200 41069 448 1.1 22188 378 1.7 400 34033 347 1.0 18290 285 1.6 600 30720 452 1.5 15290 345 2.3
aThe values are the average of 12 determinations. Raw whey total chemical oxygen demand = 74,220 mg/L. Raw whey soluble chemical oxygen demand = 59,640 mg/L. SD = Standard deviation. CV --- Coefficient of variation.
re ten t ion t imes, air f low rates, and mixing s p e e d s as there was no fluctua- t ion in the pe r fo rmance of the f e rmente r (CV in the range of 0.8-3.1%). Figure 2 s h o w s the total and soluble chemical oxygen d e m a n d of the efflu- ent at var ious hydraulic re tent ion times, air f low rates, and mixing speeds . General ly , increasing the hydraul ic re ten t ion t ime and /o r the air f low rate and /o r the mixing s p e e d dec reased the eff luent total and soluble chemical o x y g e n d e m a n d .
The total and soluble chemical oxygen d e m a n d reduc t ions we re cal- cu la ted at all hydraul ic re tent ion t imes, air f low rates, and mixing speeds . The resul ts s h o w n in Fig. 3 indicated that the total and soluble chemical oxygen d e m a n d reductions increased as the hydraulic retention time and/or air f low rate and /o r mixing s p e e d increased. For all hydraul ic re ten t ion times, air f low rates, and mixing speeds , the reduct ions in the SCOD were higher than the reductions in TCOD. This indicated that some of the soluble material were syn thes i zed into insoluble microbial cells. The reduc t ions
Applied Biochemistry and Biotechnology Vol. 47, 1994

96 Ben.Hassan and Ghaly
80000
70000
60000 .a
5OO00
r~ 0 40000 ~J E-
3OOOO
20000
10000
1V-200 1v-400
; 1V-600 3V-200 3V-400 3V-600
12 18 24
Hydraulic Retention Time (h)
80000
70000
..a 60000
E ,.., 50000 �84 r~ �9 L) 40000"
30000-
20000-
10000 "
�9 1V-200 J. IV-400
1V-600 3V-200
J- 3V-400
3V-600
12 18 24 Hydraulic Retention Time (h)
Fig. 2. Effect of hydraulic retention time on the effluent total and soluble chemical oxygen demand at various air flow rates and mixing speeds.
in the total and soluble chemical oxygen demand varied from 15.90-53.61% and from 25.20-74.36% for the total and soluble chemcial oxygen demand, respectively. Burgess reported that increasing the air flow rate from 0.5 L/min to 3.0 L/rain increased the reduction in the TCOD from 71 to 81% (15). Vananuvat and Kinsella reported a COD reduction of 60% under a continuous culture condition (19). Ghaly and Singh reported that increas- ing the hydraulic retention time from 6 to 24 h increased the reduction in the SCOD and TCOD from 6.03 to 64.41% and from 3.83 to 42.08%, respectively (14).
Solids
For each experimental run, the mean, standard deviation, and coeffi- cient of variation of the total and fixed solids were calculated. The volatile
Applied Biochemistry and Biotechnology Vol. 47, 1994

Pollution Reduction 97
90
80
7o
.~ 60
50
3o
20
10
II IV-200 l 1V-400 �9 lV-600
3V-200 a, 3V-400
3V-600
i ! i
12 18 24 Hydraulic Retention Time (h)
e,,,., o .,..~
�9
90
80
70
60
5O
40
30
20
10-
0
8 IV-200 ]
.L IV-400 �9 IV-600
�9 ----.o---- 3V-200 J ~ l b
i i 1
12 18 24 Hydraulic Retention Time (h)
Fig. 3. Effect of hydraulic retention time on the total and soluble chemical oxygen demand reductions at various air flow rates and mixing speeds.
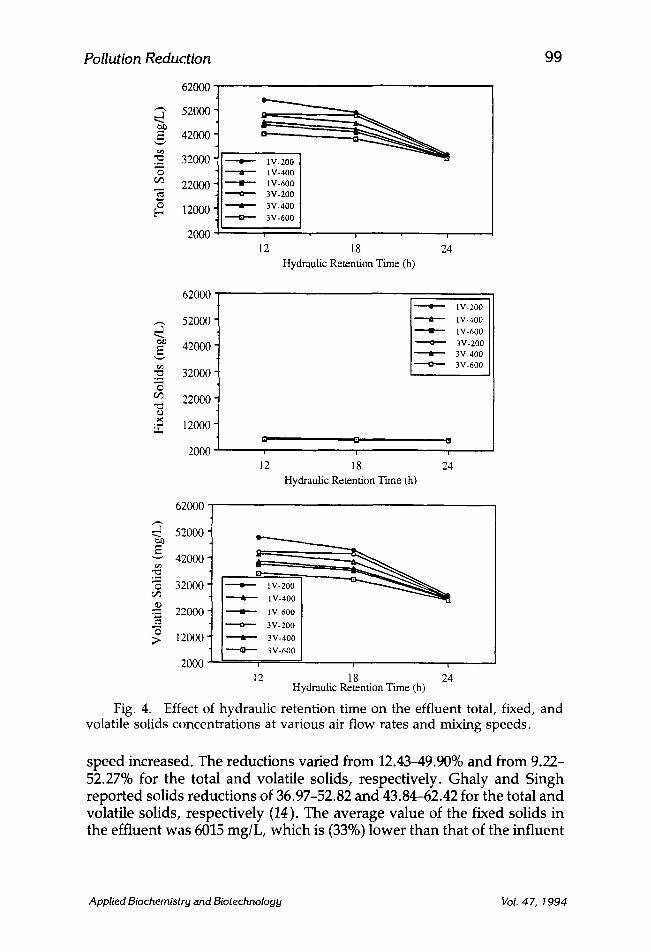
solids were calculated by subtracting the values of the fixed solids from those of the total solids. The results are shown in Table 4. The relatively low values of the coefficient of variation indicated that the fermenter was operating at the steady state condition and there was no fluctuation in the performance of the fermenter (CV in the range of 0.8-2.8%). Figure 4 shows the effluent total, fixed, and volatile solids concentrations at vari- ous hydraulic retention times, air flow rates, and mixing speeds. Generally, increasing the hydraulic retention time and/or the air flow rate and/or the mixing speed decreased the effluent solids.
The total, fixed, and volatile solids reductions were calculated at all hydraulic retention times, air flow rates, and mixing speeds. The results shown in Fig. 5 indicated that the total and volatile solids reductions in- creased as the hydraulic retention time and/or air flow rate and/or mixing
Applied Biochemistry and Biotechnology Vol. 47, 1994

0
F~
0
0
0
0
F~
0
o
Applied Biochemistry and Biotechnology Vol. 47, 1994
Pollution Reduction 99
6 2 0 0 0 -
~" 52000 -
4 2 0 0 0 -
~ 32000 -
~ 22000 -
~ 12000 -
2 0 0 0 - ~
$ I V - 2 0 0 J- 1 V -4 0 0
�9 I V -6 0 0 3 V - 2 0 0
,I. 3 V - 4 0 0
3 V - 6 0 0
12 18 24 H y d r a u l i c R e t e n t i o n Time (h)
62000
,..., 52000
E 42000
"~ 32000 O
~ 22000
12000
20OO
�9 IV-200
I V - 4 0 0
I.V-600
3 V - 2 0 0 & 3 V - 4 0 0
3 V - 6 0 0
0 Q a
n i n
12 18 24 H y d r a u l i c R e t e n t i o n Time (h)
62000
...a 52000
"~ 42000
32000
.~ 22000 �9 lv-6oo ~ 3 V - 2 0 0
~> 12000 .t 3v-4oo 3 V - 6 0 0
2000 , , , 12 18 24
H y d r a u l i c R e t e n t i o n T i m e (h)
Fig. 4. Effect of hydraulic retention time on the effluent total, fixed, and volatile solids concentrations at various air flow rates and mixing speeds.
speed increased. The reductions varied from 12.43-49.90% and from 9.22- 52.27% for the total and volatile solids, respectively. Ghaly and Singh reported solids reductions of 36.97-52.82 and 43.84-62.42 for the total and volatile solids, respectively (14). The average value of the fixed solids in the effluent was 6015 mg/L, which is (33%) lower than that of the influent
Applied Biochemistry and Biotechnology Vol. 47, 1994

1 O0 Ben.Hassan and Ghaly
0 ...~
Q
80
70
c- O 60 .,.~
"~ 50
.~ 40
~ 30
x ~ 2 0
80
70
60
50
40
30
20
10
10
�9 l V - 2 0 0
J. I V - 4 0 0
�9 I V - 6 0 0
3 V - 2 0 0
at 3 V - 4 0 0
~ T " T
12 18 24
Hydraulic Retention Time (h)
t l V - 2 0 0
at I V - 4 0 0
�9 I V - 6 0 0
-----O---- 3 V - 2 0 0
.I. 3 V - 4 0 0
3 V - 6 0 0
/ w w
i ! i
12 18 24 Hydraulic Retention Time (h)
80 �9 i V - 2 0 0
70 - ~- I V - 4 0 0
�9 I V - 6 0 0
"~ 60= ---=o=- 3v.200
50- �9 3v-400
4 0 -
30 =
20
10 , , , 12 18 24
Hydraulic Retention Time (h)
Fig. 5. Effect of hydraulic retention time on the total, fixed, and volatile solids reductions at various air flow rates and mixing speeds.
(9100 mg/L). Although, the reactor was continuously mixed, the lower value of the fixed solids in the effluent could be owing to the precipitation of some minerals into the bottom of the fermenter. Calcium and phos- phorous may have been precipitated as CaCO3 and Ca3(PO4) so that they were not presented in the samples taken from the effluent. The hydraulic retention time and mixing speed seemed to affect the amount of precipi- tants. Similar results were reported by Ghaly and Singh (14).
Applied Biochemistry and Biotechnology Vol. 4 7, 1994

Pol lut ion R e d u c t i o n
Table 5 The Effluent Nitrogen Concentrations
at Various Hydraulic Retention Times, Air How Rates, and Mixing Speeds a
101
Retention Air flow Mixing Total Kjeldahl nitrogen Ammonium nitrogen
time, rate, speed, Mean, SD, CV, Mean, SD, h vvm rpm mg/L mg/L % mg/L mg/L
CV, %
12 1 200 1620 15 0.9 110 3 2.5 400 1630 12 0.8 113 2 2.0 600 1645 13 0.8 118 2 2.9
3 200 1638 17 1.1 115 2 1.6 400 1649 11 0.7 119 4 3.5 600 1662 14 0.9 122 4 2.9
18 1 200 1578 7 0.5 94 2 1.7 400 1585 8 0.5 98 2 2.4 600 1597 13 0.8 103 1 1.3
3 200 1588 7 0.4 100 3 3.2 400 1600 14 0.9 104 1 1.4 600 1615 17 1.1 108 2 1.9
24 1 200 1520 13 0.9 75 1 1.7 400 1528 8 0.6 80 2 1.9 600 1545 10 0.7 85 2 2.8
3 200 1535 10 0.7 82 2 2.7 400 1555 8 0.5 86 2 2.3 600 1572 9 0.6 90 3 3.5
aThe values are the average of 12 determinations. Raw whey total Kjeldahl nitrogen = 1690 mg/L. Raw whey ammonium nitrogen = 270 mg/L. SD = Standard deviation. CV -- Coefficient of variation.
Nitrogen Compounds The total Kjeldahl n i t rogen as m e a s u r e d in this s t u d y inc luded bo th
the a m m o n i u m and organic nitrogen bu t did not include nitrite and nitrate. Nitrification (convers ion of NH4 to NO2 and NO3) did not take place since nitrifying bacteria were absen t f rom the sys tem. For each exper imenta l run, the mean , s t anda rd deviat ion, and coefficient of variat ion of bo th the total Kjeldahl ni t rogen and a m m o n i u m ni t rogen were calculated (Table 5). The lower coefficient of variat ion (0.5-3.5) of the n i t rogen resul ts indi- ca ted that the s y s t e m was opera t ing at the s t eady state condi t ion. Figure 6 s h o w s the eff luent total Kjeldahl and a m m o n i u m at n i t rogen var ious hydraul ic re ten t ion t imes, air f low rates, and mixing speeds . General ly , increasing the hydraul ic re ten t ion t ime and /o r decreas ing the air f low rate and /o r the mixing speed , increased bo th the eff luent total Kjeldahl n i t rogen and the a m m o n i u m ni t rogen.
Applied Biochemistry and Biotechnology Vol. 4 7, 1994

102 Ben-Hassan and Ghaly
E e-,
Z
1850
1750
1650
1550
1450
II IV-200
J- IV-400
�9 IV-600
3V-200
,,I, 3V-400
3V-600
i i t
12 18 24 Hydraulic Retention Time (It)
150 -
140 " % g 130- e-,
12o
.= 110 Z 100
"2 90 O E E 80 <
70
60
50
IV-200
1V-400
IV-600
3V-200
3 v o 3V-600
12 18 24
Hydraulic Retention Time (h)
Fig. 6. Effect of hydraulic retention time on the effluent total and ammonium nitrogen concentrations at various air flow rates and mixing speeds.
The reductions in the total Kjeldahl and ammonium nitrogen are shown in Fig. 7. The results indicated that the reductions in the total Kjeldahl and ammonium nitrogen increased as the hydraulic retention time and/or the air flow rate and/or the mixing speed were increased. Reductions of 1.66-10.66% and 54.82-72.22% for the total Kjeldahl nitrogen and ammo- nium nitrogen were achieved, respectively. For all hydraulic retention times, air flow rates, and mixing speeds, the reductions in the ammonium nitrogen were higher than the reductions in the total Kjeldahl nitrogen. This was owing to the conversion of ammonium nitrogen to organic nitro- gen in a form of microbial cells. In an aerobic treatment unit, ammonium
Applied Biochemistry and Biotechnology Vol. 47, 1994

Pollution Reduction 103
80
70 0
�9 = 60
50
40 O
�9 ~- 30 z
20 O [...
10
0
�9 IV-200
IV-400
�9 IV-600
3V-200
A 3V-400
3V-600
i t i
12 18 24
Hydraulic Retention T i m e (h)
80-
= 70" .,.~
60
"~ 5O
4o . m
z 30 E
._= = 20 E E 10 <
0 ""I " m
24
�9 I V - 2 0 0
1V-400
�9 IV-600
3V-200
A 3V-400
3V-600
~ T T
12 18 Hydraulic Retention Time(h)
Fig. 7. Effect of hydraulic retention time on the total Kjeldahl and ammo- nium nitrogen reductions at various air flow rates and mixing speeds.
is converted to microbial cells through the assimilation process. Ammo- nium reduction can also be achieved through a nonbiological process that is referred to as ammonia volatilization. In this process, ammonium ion is decomposed to ammonia gas and is released to the atmosphere at a rate dependent on the concentration of the ammonia in the medium, the pH of the medium, and the degree of agitation. About 12.82-81.08% of the ammonium reduction was utilized by microbial cells through the assim- ilation process whereas about 18.92-87.18% of the ammonium reduction was lost through the ammonia volatilization process, depending on the hydraulic retention time, air flow rate, and mixing speed used. Higher values of nitrogen assimilation were obtained at shorter hydraulic reten- tion times, higher air flow rates, and higher mixing speeds. The longer
Applied Biochemistry and Biotechnology Vol. 47, 1994

104 Ben-Hassan and Ghaly
retention time resulted in a reduction of yeast population owing to the death of some yeast cells, and as a result more nitrogen was lost from the system through ammonia volatilization.
CONCLUSIONS
The COD, solids, and nitrogen data indicated that the system was operating at the steady conditions for all hydraulic retention times, air flow rates, and mixing speeds. The effluent TCOD, SCOD, total solids, total Kjeldahl nitrogen, and ammonium nitrogen were significantly affected by the hydraulic retention times, air flow rate, and mixing speed. Increas- ing the hydraulic retention time and/or the air flow rate and/or the mixing speed decreased the effluent TCOD, SCOD, total solids, total Kjeldahl nitrogen, and ammonium nitrogen. The reductions in TCOD, SCOD, total solids, volatile solids, total Kjeldahl nitrogen, and ammonium nitrogen were dependent on the hydraulic retention time, air flow rate, and mixing speed. Reductions of 15.90-58.91%, 25.70-74.36%, 12.43-49.90%, 9.22- 52.27%, 1.66-10.06%, and 54.82-72.22% were achieved for the TCOD, SCOD, total solids, volatile solids, total Kjeldahl nitrogen, and ammonium nitrogen, respectively. The reduction in the SCOD was higher than the reduction in the TCOD for all hydraulic retention times, air flow rates, and mixing speeds owing to the conversion of soluble materials into insol- uble microbial cells.
ACKNOWLEDGMENT
The authors wish to express their sincere gratitude to John B. Pyke, Research Scientist, Agricultural Engineering Department, Technical Uni- versity of Nova Scotia and Estelene Hasan, Visiting Technologist, Institute of Applied Science and Technology, Guyana, for their assistance with the chemical and microbiological analyses.
REFERENCES
1. Ghaly, A. E., Echiegu, E., and Pyke, J. (1988), in Proceedings of the 1988 Food Processing Waste Conference, Atlanta, Georgia, pp. 730-742.
2. Jones, H. R. (1974), Pollution Technology, Review No. 7. Noyes Data Corp., Park Ridge, NJ, pp. 153-182.
3. Hobman, P. G. (1984), Diary Sc. 67, 2630-2642. 4. Marwaha, S. S. and Sethi, S. (1984), J. Agricultural Wastes 9, 111-130. 5. Sienkiewicz, T. and Riedel, C. L. (1986), Whey and Whey Utilization. Leipzig
WEB, Fachbuchverlage.
Applied Biochemistry and Biotechnology Vol. 47, 1994

Pollution Reduct ion 105
6. Hacking, A. J. (1986), Economic Aspects of Biotechnology. Cambridge University Press, Cambridge, MA.
7. Singh, R. K. and Ghaly, A. E. (1985), Feasibility of cheese whey processing for production of feed and feed supplement. CSAE paper no. 85-504. Ottawa, Ontario.
8. McAuliffe, K. W., Scotter, D. R., Macgregor, A. N., and Earl, K. W. (1982), J. Environ. Quality 11, 31-34.
9. Marshall, K. R. and Harper, W. J. (1984), Survey of Industrial Waste Water Treat- ment. Barnes, D., Foster, C. F., and Hsudey, S. E. (eds.), Pitman, London.
10. Fritzscha, B. (1986), Zeitschrift Fuer Angewandte Geologic 32, 131-134. 11. Vananuvat, P. and Kinsella, J. E. (1975), J. Food Sci. 40, 336-341, 823-825. 12. Wasserman, A. E., Hampson, J. W., and Alvare, N. F. (1961), J. Water Pollu-
tion Control Fed. 33, 1090-1094. 13. Mickle, J. B., Smith, W., Halter, D., and Knight, S. (1974), J. Milk Food Tech-
nol. 37, 481-494. 14. Ghaly, A. E. and Singh, R. K. (1989), Appl. Biochem. Biotechnol. 22, 181-203. 15. Burgess, K. J. (1977), J. Food Sci. Technol. 1, 107-115. 16. American Public Health Association. (1985), Standard Methods for the Examin-
ation of Water and Wastewater. APHA. New York. 17. Ghaly, A. E., Ben-Hassan, R. M., and Ben-Abdallah, N. (1992), Appl. Bio-
chem. Biotechnol. 36, 13-34. 18. Ben-Hassan, R. M., Ghaly, A. E., and Mansour, M. H. (1991), Appl. Bio-
chem. Biotechnol. 30, 233-245. 19. Vananuvat, P. and Kinsella, J. E. (1975), J. Food Sci. 40, 823-825.
Applied Biochemistry and Biotechnology Vol. 47, 1994