
Improved heat stability by whey protein–surfactant interaction
Upload
independentCategory
view
5download
0
De Kruif
International Journal of Food Science and Technology 1999, 34, 587-601
Some physico-chemical properties of ninecommercial or semi-commercial whey proteinconcentrates, isolates and fractions
Carl Holt1,*, Deborah McPhail', Tommy Nylander2, Jeanette Otte3, Richard H. Ipsen3,Rogert Bauer4, Lars 0gendal4, Kees Olieman5, Kees G. de Kruif, Joëlle Léonil6,Daniel Mollé6, Gwénaële Henry6, Jean Louis Maubois6, M. Dolores Pérez7, Pilar PuyoF,Miguel Calvo7, Stella M. Bury8, George Kontopidis8, lain McNae8, Lindsay Sawyer8,Laura Ragona9, Lucia Zetta9, Henriette Molinari10, Bert Klarenbeek11,Margrethe J. Jonkman12, Jacques Moulin13 & Dereck Chatterton14
1 Hannah Research Institute, Ayr, KA6 5HL, UK2 Lund University, Department of Physical Chemistry l, POB 124, S-221-00, Lund, Sweden3 Department of Dairy and Food Science, The Royal Vetermary and Agricultural University, Rohghedsvej 30,
DK-1958 Fredenksberg C, Denmark4 Department of Mathematics and Physics, The Royal Vetermary and Agricultural University, Thorvaldsensvej 40,
DK-1871 Fredenksberg C, Denmark5 NIZO Food Research, Postbus 20, 6710 BA, Ede, The Netherlands6 INRA Laboratoire de Recherches de Technologie Laitière, 65 rue de Saint Bneuc, 35042 Rennes Cedex, France7 Tecnologia y Bioquimica de los Alimentos, Facultad de Vetermana, Miguel Servet 177, 50013 Zaragoza, Spain8 University of Edmburgh, Institute of Cell and Molecular Biology, Swann Building, King's Buildings, Edinburgh
EH9 3JR, UK9 Lab NMR, Istituto dl Chimica delle Macromolecole, CNR, Via Ampère 56, 20131 Milano, Italy
10 Umversita di Verona, Dipartimento Scientifico e Tecnologico, Via Strada Ie Grazie, 37134 Verona, Italy11 Borculo Domo Ingredients, Needsweg 23, 7271 AB Borculo, PO Box 46, 7270 AA Borculo, The Netherlands12 Friesland Coberco Dairy Foods Research Centre Deventer, Harderwijkerstraat 41006. 7418 BA Deventer, PO Box 87,
7400 AB, Deventer, The Netherlands13 Armor Proteïnes S A S , Le Pont, Saint Bnce-en-Cogles 35460, France, and14 MD Foods Ingredients, DK-6920 Videbaek, Denmark
(Received 17 May 1999, Accepted m reMsed form 24 June 1999)
Summary The physico-chemical properties are reported for a group of whey protein powders pre-pared on a commercial or serm-commercial scale by three companies and chemically char-acterized as described elsewhere (Holt et al., 1999). The dependence of the apparentp-lactoglobulin % on the recovered % showed that the nine samples could be placed inthree distinct groups with p-lactoglobulin weight % of 70.9 ±1.1 (Group 1), 62.0 ± 3.4(Group 2) and 39 5 ± 4.9 (Group 3). Measurements by 'H-NMR spectroscopy, on 3 ofthe samples confirmed that the native fold still predominated in the p-lactoglobulin. p-lac-toglobulin could be crystallized from all the powders and the normal space group and celldirnensions were determined for the 8 samples that gave crystals of good enough qualityfor X-ray studies. Differential scanning microcalorimetry of samples dispersed in a phos-phate buffer showed a clear difference between Goups l and 2 with a more prominentpeak due to a-lactalbumin in the Group 2 samples. Light scattering and size exclusionchromatography showed that two types of aggregates were present to a variable extent inall the samples and after a heat treatment, the larger aggregates tended to predommate in
Correspondent Fax +44-1292-674184,e-mail holtc@hn san ac uk
© 1999 Blackwell Science Ltd

588 Properties of whey protein isolates and fractions C Holt et al
Group 2 The rheology measurements, also made m the phosphate buffer, showed a dif-ference of gel stiffness dunng heat treatment between the Group l and Group 2 sampleswith the exception of the BORCwpc+ sample Within each group, gel stiffness increasedwith the degree of lactoslylation of the p-lactoglobulin Interfacial measurements on sam-ples dispersed in water presented a more complex pattern of behaviour although surfacetension measurements at the air water interface of the Group 2 samples showed a two-step pattern of surface tension decrease with time, compared to a single step pattern inthe Group l samples
Keywords a Lactalbumin (3-lactoglobulm ellipsometry microcalorimetry NMR spectroscopy rheology wheyprotein concentrate whey protem isolate x-ray crystallography
Introduction
One of the concerns of whey processor* is to pro-duce whey protein products with consistent foodfunctionahties but the factors responsible for thevanability of the products are very poorly andincompletely understood To understancl the prob-lem more clearly we attempted to compare theproperties of a single whey protein, p-lactoglobu-hn (p-Lg) prepared at different sites and by dif-ferent methods since it was reported (Hoffmannet al, 1996) that even m biochemical samplesthere were unknown causes of vanation The con-clusion from this first survey was (Bauer et a/,1998, Holt et al, 1998) that diffusible constituentsin some of the preparations were responsible forvanable behaviour and that the vanation could bereduced by the use of a phosphate buffered medi-um and by dialysis against that medium Otherfactors, such as lactosylation and hpid content didnot appear to contribute significantly to the sam-ple vanability The present work is a contmuationof that study but with the less pure and moredamaged whey proteins produced by commercialand semi-commercial methods
A compamon paper reports the chemical char-actenzation of the same samples as were used here(Holt et al, 1999) and the conclusions of thatpaper are important for the mterpretation of thephysico-chemical measurements The mun findingwas that the nine samples appeared to have dif-ferent protein compositions as measured by stan-dard methodologies but the values were subject tomethod-dependent systematic errors due toincomplete recovery of the protein from the col-umn or capillary When allowance was made for
this, a simpler picture emerged of the chemicalcomposition since the nine samples could beplaced m one of only three groups with wt% P-Lgvalues of 709 ± l 1% (Group 1), 62 O ± 34%(Group 2) and 39 5 ± 4 9% (Group 3) The rea-son for the low and vanable recovenes achievedby the analytical methods is not estabhshed butmay be related to the presence in the samples of aheterogeneous population of aggregated, lactosy-lated and misfolded protein molecules
In this paper we apply a number of physico-chemical techmques to the samples to seewhether the variations in their properties areunderstandable m terms of composition and mol-ecular structure
Materials and methods
Whey protein samples
Samples were provided by MD Foods (MDF,Decon Laboratories, Sussex, UK), Borculo DomoIngredients (BDI Microcal Inc , MA, USA) andArmor Proteïnes (AP, Milh-Q, Bedford MA,USA) They were described by the manufactureras either whey protein isolates (wpi), whey proteinconcentrates (wpc) or fractions (alpha, bèta) Themethods of sample preparation and gross chemi-cal composition are described by Holt et al (l999)and some of the most pertinent properties aresummanzed in Table l Bovine p-Lg standardswere provided by NIZO food research (nizoA),INRA-LRTL (mraA) and the Hannah ResearchInstitute (hriA and hriB) and have been describedpreviously (Holt et al, 1998) A Sigma-Aldrichsample (sigmaAB) was also used m the NMRmeasurements
International Journal of Food Science and Technology 1999 34 587 601 > 1999 Blackwell Science Ltd

Properties of whey protein isolates and fractions C Holt et al 589
Table 1 Commercial and semi-commercial sample composition in wt%, classmcation into groups and pH afterreconstitution of the samples (Holt et al, 1999)
GroupSample Codewpi906
MoistureProteinFatLactosepHMineralsCaPLgLactosylated'SH reacted2
MDFwpi-1
50890020169380 1
27911
Group 2MDFwpi-la
896
044- 62 0 ± 3 4 - •
29818
MDFwpi-1b
901
027
29 112
APwpi906
<590<1<1
65 <7
20225
MDFbeta-1
328660 201697 20 1
7 412
Group 1MDFbeta-2
4 58700 405693002
- 70 9 ± 1 1 - -256
9
BORCwpc+
3873403
1346840
007
31 518
APbeta9615
39898<05
—
39374073
---- 395179
4
Group 3MDalpha-3
4 581 5
1 070643 407
± 4 9ndnd
'mol % of all lactosylated forms of (3 Lg found by the LRTL RP HPLC method2mol % of SH groups able to react with DTNB at room temperature
NMR spectroscopy
All NMR measurements were performed usmg a2-mM concentration of protein m a buffer solutionconsisting of 10-mM H,PO4/NaOH and 5% D2O,in the pH range l 3-3 2, at room temperature The2D 'H TOCSY spectra were acqmred on a Brukerspectrometer operatmg at 500 13 MHz, over 4Kdata points and 5001, increments m the absorptionmode, with time-proportional phase incrementa-tion for quadrature detection in the t, dimensionA mixing time of 80 ms was employed for eachTOCSY experiment A total of 128 transients werecollected for each t, increment and water ehmina-tion was achieved usmg gradients The 2D spectrawere processed using XWIN-NMR software pro-vided by Bruker (Bruher, Karlsruhe, Germany)
CrystallographyX-ray data were collected on a Marresearch imag-mg plate system Marresearch, x-Ray research,Nordestadt, Germany, on an ENRAF-NomusFR571 rotatmg anode generator producing Cu-Ka radiation from a graphite monochromatorThe cell dimensions were determined withDENZO (Otwinowski & Minor, 1997)
Microcalorimetry
Thermograms were recorded on a Microcal MCSmicrocalonmeter (Microcal Inc, MA, USA) at apowder concentration of about 3 mg mL ', asdescribed previously (Qi et al, 1995) The samples
were dissolved m buffer P (60 mM NaCl, 4 3 mMNa2HPO4, 5 7 mM Na2HPO4), which has a simi-lar ionic strength and pH to milk, since attemptsto record thermograms of powders dispersed inwater or 70 mM NaCl resulted in noisy measure-ments due to sample aggregation in the calorime-ter above a temperature of about 80 °C Thisproblem could be reduced or even eliminated bythe use of the phosphate buffer, especially if thesamples were first dialyzed agamst the samebuffer (Holt et al, 1998, McPhail & Holt, 1999)Moreover, cleaning times for the calorimeter cellbetween experiments were much reduced
Rheology
The gelation properties were monitored with aBohlm VOR rheometer (Bohhn Ltd, Cirencester,UK) using a Couette type measuring system(internal diameter 14 mm), an amplitude of 2 5%and a frequency of l Hz A volume of 2 7 mL ofa 7% solution of the whey protein sample dis-persed m buffer P was introduced into the mea-suring system, a thin layer of oil was added andthe sample was heated from 20 to 50 °C at 5°Cmm ' and from 50 to 90 °C at l °C mm ' A tem-perature of 90 °C was mamtamed for 30 mm, andthe sample was then cooled to 20 °C at 2 5 °Cmm ' The stiffness of the gel was taken as thecomplex modulus at the time when the samplereached 20 °C and the time of gelation as the timewhen the phase angle remained below 45 °C
O 1999 Blackwell Science Ltd International Journal of Food Science and Technology 1999, 34, 587-601

590 Properties of whey protein isolates and fractions C Holt et al
Size exclusion chromatography
Sample preparation
Two series of measurements were made on thenine commercial samples In the first series, thesamples were applied to a column without anypretreatment and in the second series, sampleswere given a heat treatment at 67 5 °C for 160 mmat pH 6 7, followed by quenchmg in an ice bath
In both series, buffer P was used to redispersethe powders and, with addition of O 01% azide, asthe eluent for the chromatography Dry powder(260 mg) was dissolved in 4 7 ml buffer P and dia-lyzed against l l of buffer P at 4 °C, with stirring,for 8 h and, after a change of buffer, for another16 h The samples were then dlluted to a final con-centration of 20 mg mL , within 5%, usmg bufferP, centrifuged (30 min at 6000 g) to remove anyhazmess and filtered at least once through a 200nm pore filter The protein concentration wasdetermined after filtration by UV absorbance at280 nm, using an extmction coëfficiënt of O 96 Lg ' cm ' irrespective of the presence of otherprotein
Chromatography
A SUPERDEX 200 column from PharmaciaBiotech (Pharmacia Biotech, Uppsala, Sweden)with dimensions 7 8 X 300 mm, was run at roomtemperature Samples with or without the heattreatment were applied to the column by injecting75 ui m a 50 jjil loop, at an eluent flow rate of O 5ml min ' The eluate ran first through the lightscattering instrument, and then through a refrac-tive index detector
The scattered light intensities were measured at14 angles m the q range 3 38-25 6 u.m ' using aDawn F instrument equipped with a K.2 cell fromWyatt Technology, Santa Barbara, CA Therefractive index detector was a Wyatt/Optilab 903(Wyatt Technology, Santa Barbara, CA, USA)Further details are reported elsewheie (Baueret al, 1999)
Interfacial properties
Matenals
The water used was distilled and then passedthrough a Milh-Q water punfication system
(Milh-Q, Bedford, Sussex, UK) All glassware wascleaned in a 50 50 (volume ratio) of concentrat-ed sulphuric and nitric acid and thoroughly rinsedin water Teflon tubing and connectors werecleaned in laboratory detergent (Decon 90, DeconLaboratories Ltd), boiled twice in hot water andthoroughly rinsed in water The protein stocksolution was prepared by dispersmg the sample inwater to a concentration of 10 mg mL
The olive oil used m the ellipsometry measure-ments was a highly purified triglycende sample(SS-1018 CPO Ohve oil, lot no 80702) fromLarodan Fine Chemicals, Malmo, Sweden, andwas shown to be free of monoglycende, diglyc-endes and free fatty acids by HPLC The fattyacid composition as peak area % was 106 %C16 O, 3 5% C18 O, 73 8 % C18 l, 8 l % C18 2 and0 6 % C183
Surface tension measurements
The surface tension at the air/water interface wasmeasured usmg the automated drop tensiometer(Tracker, IT-Concept, Samt-Clement-les-Places,France) based on axisymmetric drop shape analy-sis of an air bubble in a protein solution The timeresolution of the technique is typically l s or bet-ter The experiments were performed by adding4 5 mL of water to the measuring cell and the vol-ume of the air bubble was about 5 mL The sur-face tension of pure water was measured to showthat the system was clean enough and when satis-factory values of the surface tension of the waterwere obtamed, O 5 mL of the protem stock solu-tion was added with stirring The stirring wasstopped 5 mm before the surface tension mea-surement was begun and the decay of the surfacetension was followed for 1-3 h
Ellipsometry
The properties of the oil/water interface werecharacterized in situ by ellipsometry (McCrackmet al, 1963. Azzam & Bashara, 1987) usmg anOptrel Multiskop (Optrel, Berlm, Germany) Themeasurements were performed m a 30 X 30 X 30mm glass cuvet (Hellma, Mullheim. Germany)which was fitted with a Teflon lid, as described byNylander et al (1999) Data evaiuation was car-ried out by the methods described elsewhere (De
International Journal of Food Science and Technology 1999 34 587-601 ) 1999 Blackwell Science Ltd

Properties of whey protein isolates and fractions C Holt et al 591
Figure 1 'H TOCSY spectra of bovine p-Lg (2 mM) m aqueous buffer solution (10-mM H PO4/NaOH and 5% D,O) atpH 2 NH-Ha region of (a) nizoB, (b) BORCwpc + , (c) MDFbeta-2-3 and (d) MDFalpha-3 samples
Feijter et al., 1978; Cuypers et al, 1983; Nylander erence sample, since its purity was verified and a& Wahlgren, 1994; Bylaite et al., 1999; Nylander complete NMR structural Characterization waset al., 1999). performed on this sample (Ragona et al., 1997;
Fogolari et al, 1998; Ragona et al, 1999). Thefingerprint region (the region containing the NH-Ha correlations), which has been completelyResults
NMR Spectroscopy assigned, can be considered a good probe of thefold and the purity of the protein. The stability of
Figure l the nizoB sample was considered the ref- the protein was checked by lowering the pH and
ffl 1999 Blackwell Science Ltd International Journal of Food Science and Technology 1999, 34, 587-601

592 Properties of whey protein isolates and fractions C Holt et al
we found that it was still folded at pH l 3 Onincreasing the pH, the amount of aggregationincreased (Molmari et al, 1996), as demonstratedby an increase of hnewidth, which preventeddetailed analysis above pH 3 2 The mraB samplewas also very pure and lts spectrum was com-pletely superimposable on the nizoB spectrum
The sigmaB sample was also very pure Itexhibited a spectrum which did not show a broadoverlapped region centered at random coil values(4 5 ppm) visible in the nizoB and mraB samplesUsually, broad resonances are mdicative ofregions of higher conformational mobility, whichcould result, in the case of P-Lg, from theremoval of all the ligands We tentativel / proposethat the sharper signals observed for the sigmaBsample may be owing to the presence of someendogenous ligands remaining after isolation andpunfication Electrospray mass spectrometry didnot allow the identification of the ligands(Hamdam et al, 1996)
As far as the commercial samples are con-cerned, Fig l indicates that (i) BORCwpc+ andMDFbeta-2 (Fig lb,c) appear to be less aggre-gated than MDFalpha-3 (Fig ld) but theyapparently display the same fold as nizoB(Fig la), (n) MDFbeta-2 shows a clear mdica-tion of the presence of both A and B geneticvariants m fact the resonances around position118, which changes from Ala to Val on goingfrom B to A, appear split, and (m) the purity ofthe three commercial samples is quite lowcom-pared to nizoB, as expected from the composi-tion (Holt et al, 1999)
Crystallography
It was of interest to apply our standard P-Lgcrystalhzation protocol to the sample set and toobserve the results Nowadays, crystals of pro-teins are generally obtained by a vapour diffusiontechnique whereby a precipitant concentration isincreased slowly through removal of water froma droplet containing the buffered protein m a lowconcentration of precipitant (see for example,Ducruix & Giege, 1999) Our 'standard' tech-nique, involves dissolving 20 mg mL ' protein mO 2-M HEPES buffer, pH 7 5, and equihbratingthis with either 2 5-M ammomum sulphate or l 3-M sodium citrate (Brownlow et al, 1997)
Generally, a series of drops is set up varying theprecipitant concentration and the pH aroundthese values
Figure 2 shows the results obtained with thecommercial samples from which it can be seenthat crystals, albeit sometimes only small ones,were obtained with all but one of the samples,This is perhaps rather surprismg since even thesample containing mostly a-La appears to pro-duce small crystals of P-Lg, though they wereunsuitable for X-ray measurements a-La hasbeen crystalhzed from 25% polyethyleneglycol,O 2-M ammomum sulphate, pH 4 5 (Calderoneet al, 1996)
The predommant p-Lg crystal form obtainedwas the trigonal lattice Z, although other crystalforms may occasionally be produced Theobserved vanation in the cell dimensions(Table 2) is not significant One other point isthat we have found that this particular protocolmore usually gives the orthorhombic lattice Ycrystal form unless there is a hgand bound in thecentral cavity (Wu et al, 1999)
Microcalorimetry
The thermograms of the Group l and Group 2samples are shown in Fig 3(a) and Fig 3(b)respectively and the groupmg based on proteincomposition extrapolated to 100% recovery isreflected in the shape of the curves, particularly atabout 60 °C where a shoulder m Group lbecomes a peak in Group 2 A peak at about60 °C is associated with the thermal denaturationof a-La with a bound divalent ion (Paulssonet al, 1985) and hence the mam cause of the dif-ference m shape of the thermograms of the twogroups could well be the higher proportion of a-La m Group 2
Samples were measured in buffer P with andwithout dialysis but in this phosphate buffer thethermogram shape does not change very muchafter overmght dialysis Elsewhere, we have shown(McPhail & Holt, 1999) how the P-Lg thermogramis very sensitive to the presence of phosphatewhich appears able to slow down the rate of aggre-gation and allow thermograms of good signal tonoise ratio to be recorded under our conditions
Within Group l there were obvious differencesin the magnitude of a peak at about 125 °C which
International Journal of Food Science and Technology 1999 34, 587 601 © 1999 Blackwell Science Ltd

Properties of whey protein isolates and fractions C Holt et al 593
(a)
Figure 2 Crystals of B-Lg recovered from the commercial and semi-commercial preparations of whey proteins(a) APbeta 9615, (b) MDFbeta-, (c) MDFwpi-1, (d) MDFalpha-3, (e) MDFwpi-lb, (f/) MDFbeta-2, (g) mraA,(h) MDFwpi-la, (i) APwpi906, (j) BORCwpc+
© 1999 Blackwell Science Ltd International Journal of Food Science and Technology 1999, 34, 587-601

594 Properties of whey protein isolates and fractions C Holt et al
Table 2 Properties of crystals of P-Lg isolated from survey samples
Samplecode
MDFbeta-1MDFbeta-2MDFalpha-3MDFwpi-1aMDFwpi-1bAPbeta9615APwpi906BORCwpc +inraAB
Precipitant
1 2M2.5M1 4M1 3M1.2M25M1.2M1.4M1 3M
Na citrate(NH,)2SO4
Na citrateNa citrateNa citrate(NH,)2SO,Na citrateNa citrateNa citrate
pH
7 3777778
3551
7777.
3,3
Spacegroup
P3,21P3,21—P3?21P3221P3221P3,21P3221P3,21
Cell Dimensionsa, b, c (A) u, p, y
5370,54 11,—5336,5338,5393,53 62,5390,5365,
5370,54 11,
53 36,5338,5393,5362,5390,5365,
111111
111111111112112111
(* 90 °)
83,60,
29,35,20,14,00,26,
y =•
y -
y ~y -y =y -y =y =
1
120120
120120120120120120
can be clearly seen in the MDFbeta-1 sample, isjust present in the MDFbeta-2 sample and absentin all the others. The peak is clearly seen in ther-mograms of the pure, native, p-Lg-B genetic vari-ant but is much less important in the thermogramof the A genetic variant (Holt et al., 1998). Sinceall the commercial samples were found by RP-HPLC to be a more-or-less equal mixture of thetwo variants, this is not likely to be the source ofthe variation. A more likely explanation is that theloss of the main peak at about 125 °C is owing tosome thermally induced partial rearrangement ofthe conformation as indicated by a combination
of SH group reactivity and the degree of lactosy-lation (Holt et al., 1999; Table 8).
Rheology
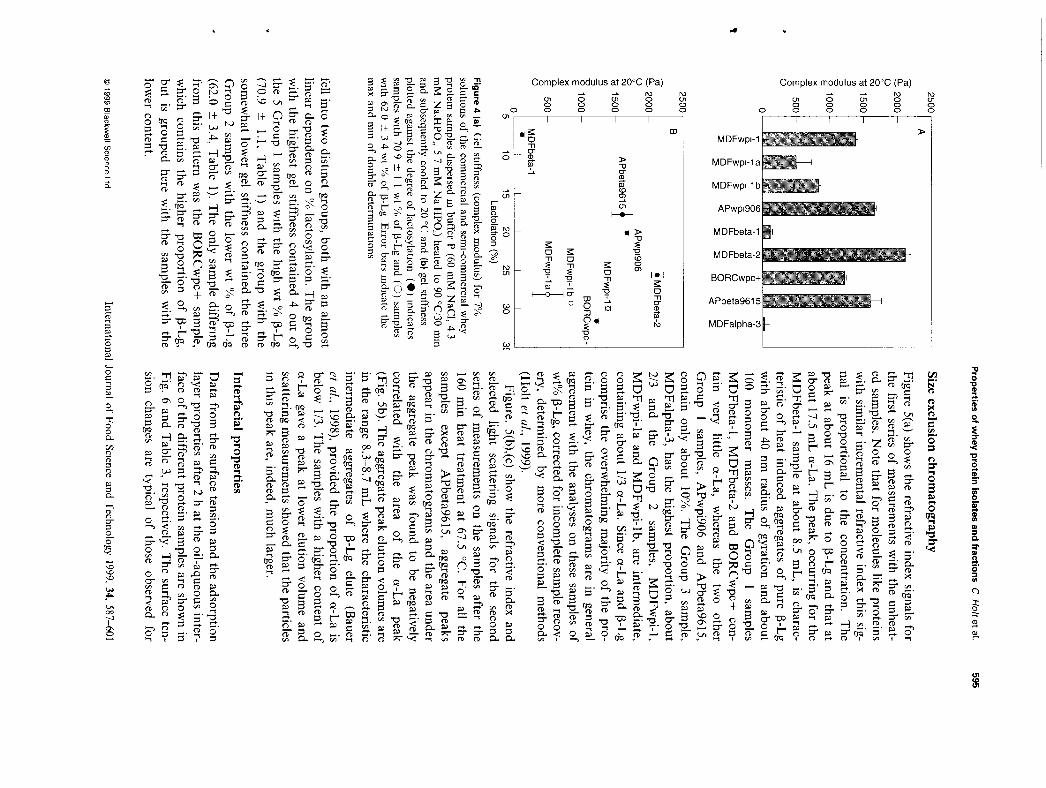
The time of gelation did not differ between thesamples. The stiffness of the gels, as measuredafter cooling, however, varied from 17 to 2113Pa (Fig. 4a), with no clear grouping of the sam-ples according to P-Lg content. However, whenplotted against the % of lactosylation (Fig. 4b)the values of the gel stiffness of the samples(excluding the a-La rich sample, MDFalpha-3)
5-
o -o
8 -5-
Q.O
-10 -
-15
MDFbetal
MDFbeta2
APwpi906
BORCwpc
20 40 60 80 100 120 140Temperature (°C)
-5-
ü -10-
MDFbeta9615 ^5O
-20
-25
MDFwpi!
MDFwpila
MDFwpilb
(b)20 40 60 80 100 120 140
Temperature ('C)
Figure 3 Thermograms of the commercial and semi-commercial whey protein samples determined by microcalorimetry ata concentration of about 3 mg ml ' and a scan rate of 60 °C h All samples were dispersed m buffer P Figure 3 (a)Group l samples, Fig. 3 (b) Group 2
International Journal of Food Science and Technology 1999, 34, 587-601 ) 1999 Blackwell Science Ltd
©10
DDQ]
CD
c/icience l
S.
£oT3»o3ps
Journal of Food Science and Technology 1999, 34, 587-601
o ' S ' ^ ^ ' S O o ^ & ^ ï p o * 3 ï £ ' § - 3 = i ' S o l 3 ! Complex modulus at 20°C (Pa)^ £ £ " . S ^ S g P ^ ^ S - £ £ 3 g o . 2 o £ - < g __ ^ w Mq B .g. S o| 1 vo^g. 5- B B f a i l i ü o 8 S S i iS o Q o g l + ^ l l + O g - g - o ~ 0 * « ë S B l o - " ————————————————————B S S E ^ S - . - o — ' S s - g i + ^ B - g ^ S S , - ,. m|| | -g>| s - ^ - i ^ S ^ S ^ l i P Ü - j f S 1 "ii— > "Q £. p M 3- " ?T* CL -* U " O CL ^ * ' — ' '^ S s S H - g S j — Ê f n B : ^ ^ s o S - ^ ^ D - o » £ - £ .
O- c/i n, p ;J. m H w 3 5 9 - S « o - J s ; O - K- *•^3£^£ |^ f |^t||H| £ 3^ ^ £ __ ^ — < T ^ f L o 2 - ^ ° - ^ £ S £ 2 £ S"(T) ^ i_- < "p ^ 3 „ ^ f D ^ ' ^ . S r ^ -* CDB - . g ^ g ^ s - o - ^ § - ? s ; ; s ? s 5 f r - " ' - 2l f f f S f f i « § g g i p | |-r^^^l| ^* ; ;S ï .2 !?8H Er^^ i^h - .>^ I S ^ l i ^ ^ I f I i ^ t B - s r ^ U § ^ tmpllüfi Hi ï l ï l t ^ - U | SS § ^ , S . H ? |25isp? H-S-nè „ ^ 1< 2, ». & o & 1 ^ ^ g" § s s l ^ o ^ ! - ^ g- D § S ?S 0 3 ' - * ) - ~ > f t S - ^ o . „ P r . 3 B " n M Q ^ ^ ~ ^ m^? 3 ?T= s.3"^ |<5 p" g - t g 8 ë - - g - o. £ï^-2-3 r 3 & r ^l g s 5 § -^ fr o y j ^ n Q r t Q n i n i C f O ^ - ö S S . 3 G> +
5-3^|"0 a 5 | ? g-^ S ' B - ^ 8 3^^ 1 5^S S. ^ ^ « ^ 2 . 8 8 2 ^ 2 8« ^ « q ^ f? ï s C ' o - ö . q g L c r a S ^ B o B . g 2 ) g ^ ^ 3 P 3 B ö w a g .s-:^| 1 !i;iC|^ii^ï-|oli^?|B-i.i;|||i-j g . ^ 1 1 1 1| I ^ l ^ l n a ^ ! '^3^^i^^i-:^I- f 8S H & l . ï ^ -| . H ^ " ^ ? g ^ £3- ^ | it§J„|8 1^ ff §• *%?>%
g - s o ^ f f ^ - o - s - s ^ p g ^ s s ^ * I r f l ^ ^ ^ e - pO|J -R | i i - i i ^ i i ^ r i i ^ , . ^ "iii i-" | .riH;!P - l i - ' l ^ l a^ l ^^1, i j g - g g i - ^ j a g -|H|°^ I^ï^f^^i;! I i ^ ih f l i 5
t iji 'Hfür i^ f tï!J ï f i !
Complex modulus at 20°
S
MDFwpi-1
MDFwpi-1a
MDFwpi-1b
APwpi906
MDFbeta-1
MDFbeta-2
BORCwpc+
APbeta9615
MDFalpha-3
Mi•1
Bi
••
-
teristic of heat induced aggregates of pure p-Lg
with about 40 nm
radius of gyration and about100
monom
er m
asses. The
Group
1 samples
MD
Fbeta-1, MD
Fbeta-2 and BO
RC
wpc+ con-
tain very
little a-L
a, w
hereas the
two
otherG
roup 1 sam
ples, APw
pi906 and A
Pbeta9615,
i••-
•
•ÜH
mMil•
MD
Fbeta-1 sample at about 8.5 m
L, is charac-
•-H
M
••m•
KIero
CïLfl3rpPHn'SP?rooo15'trao>
5~O)
_,.o8|
•
•
•BSJUH
•
•
1?&>;*rpr^-
PcrocOv
3rC/ï
CuC«
O"00
OQP
O.
S-pp
•
•
•^
•
nal is proportional
to the concentration.
The
_L
gO|
1
B
ed samples. N
ote that for molecules like proteins
with sim
ilar incremental refractive index this sig-
C(Pa)ro
Figure 5(a) shows the refractive index signals for
the first series of measurem
ents with the unheat-
r\acc
>
0Kn5N
VH
rH
Ch
S(f»
><
•o3
2.S
so3
?

596 Properties of whey protein isolates and fractions C Holt et al
Survey II samples
XiuT3_cU>
•I-H•4-JO03frH
«4-1Ug
MDFwpi-1 b
MDFwpi-1 a
APwpi90b
MDFwpi-1
MDFalpha-3
/V BORCupct
APbeta961 5
MDFbeta-2
MDFbeta-1
(a)
10 15 20 25Elution volume in ml
Survey II samplesafter 160 mm heating at 67 5°C
30 35
Refra
ctive
inde
x
1 i
/Y^
/V/v
/v
yv/v, . ,
l ' l !
-S~^^ MDFwpi-1b
-/""^^ MDFwpi-1a
V~"^ APwpiQOh
-^^^ MDFwpi-1
^^—>— ^ . MDFalpha-3
J \^ /V BORCuprt
J \ ——— APhfitaflBIR
_/^^ MnFhfita-?
/"X MDFbeta-1"• \-É l , i , l
(b)10 15 20
Elution volume in ml25 30 35
International Journal of Food Science and Technology 1999, 34, 587-601 © 1999 Blackwell Science Ltd

Properties of whey protein isolates and fractions C Holt et al. 597
Survey II samplesafter 160 min heating at 67.5°C
.cO)
MDFwpi-1 b
MDFwpi-1 a
APwpi90b
MDFwpi-1
MDFalpha-3
BORCupct
APbeta9615
MDFbeta-2
MDFbeta-1
9 10 11Elution volume m ml
12 13 14 15(c)Figure 5 (a) Refractive index chromatograms of the nine samples without heat treatment, (b) refractive indexchromatograms of the 9 samples after heat treatment at 67 5 °C for 160 min and (c) results of scattered light intensity atq values of 5 O (xm ' (dotted lines) and 18 7 |j,m ' (solid lines)
proteins, with the exception of the pattern forAPbeta9615. We will discuss this later in relationto the composition of this sample. Generally, thewhey proteins gave a bigger reduction in the sur-face tension than the more pure p-Lg samples.This might arise from the presence of other, moresurface active, components in the less purifiedsamples.
For most of the samples the ellipsometry dataon the adsorption at the oil-aqueous interfaceshow an adsorbed layer thickness of about 20 A(Table 3) and adsorbed amounts of about 1.5-2.0mg m 2, in agreement with other literature values(see Nylander et al., 1999).
Discussion
Molecular structure of P-Lg in thecommercial and semi-commercial samples
NMR spectroscopy indicated that the purity ofthe three samples BORCwpc+, MDFalpha-3 andMDFbeta-2 is quite low when compared to the
reference samples, however the fold seems to becorrect.
Large, well-diffracting crystals of a protein gen-erally do not grow if the protein preparation con-tains impurities which often, crucially, may bedegraded or aggregated forms of the protein. It istherefore something of a surprise to find crystalsgrowing so readily from solutions containingheat-damaged proteins. Crystallographic dataindicate that the conformation of P-Lg in all sam-ples is similar to that of the native, highly-puri-fied protein. However, without complete, highresolution structure refinement, changes, particu-larly in the poorly defined external loops(Brownlow et al., 1997), must remain a possibili-ty. The low degree of lactosylation of any specif-ic lysine residue has meant that no clearcut resultof the nature and extent of the modification hasbeen possible (Sawyer et al., 1999) Similarly, iden-tification of fatty acid, lipid or other moleculesbound to the central cavity will not be possiblewith any certainty.
© 1999 Blackwell Science Ltd International Journal of Food Science and Technology 1999, 34, 587-601

598 Properties of whey protein isolates and fractions C Holt et al
Ez
oC/5C(D
ltW
80
70
60
50
BORCwpc+MDFwpi-1APwpi906MDFwpi-1aMDFwpi-1b
Time (s]6000 8000
80 i
x MDFbeta-1D MDFbeta-2 -A APbeta9615o MDFalpha-3
2000 4000Time (s)
6000 8000
Figure 6 The surface tension versus time for the differentsamples dissolved m water at a concentration of l mgml The surface tension at the air/water interface wasmeasured by using an automated drop tensiometer basedon axisymmetnc drop shape analysis of an air bubble ina protein solution
It is not surpnsing that no evidence of crys-tallme a-La was obtained for any of the samplessince the conditions used were far from thosereported for this whey protein (Calderone el al,1996)
Physical properties in relation to composition
Thermal denaturation
When the samples were dispersed m a phosphate-contaming buffer such as buffer P, good qualitythermograms could be obtained even with thesedifficult samples In imidazole buffer the thermo-grams were too noisy to be used as charactensticsof the samples A clear pattern was seen in thedifference in shape of thermograms between
Table 3 Ellipsometry data for the adsorption of differentwhey protein samples at the oil/aqueous interface Therefractive index of the ohve oil n, was l 46472 at\ = 5320A The corresponding value for the aqueousphase, n was l 33494
Substance
MDFbeta 1MDFbeta 2APbeta9615APwpi906BORCwpc+MDFwpi 1MDFwpi 1aMDFwpi 1bMDFalphaS
n,1
1 47381 48771 50001 48551 47691 51401 49201 50051 4877
d,1
A
66717 515 118653510221 021 721 8
17mg m '
5 291 511 401 594321 021 862021 89
The thickness and refractive index is obtained by measuringfrom both the oil side and the water side This is necessaryas for polarized light reflected at one interface between twodielectnc media only one of the two measured parameterschanges due to adsorption'For the calculation of surface excess l the values of r and \for p Lg were respectively O 249 ml g and O 749 ml g(Nylander & Wahlgren, 1994)
Group l and Group 2 samples which most prob-ably is explained by an increased proportion of a-La in Group 2 N o other difference ofcomposition appears to be important in our dataThe absence of a defimte peak at about 125 °C mmost samples other than MDFbeta-1, however, isan indication of possible misfolding
Gel stiffness
Allowing for the P-Lg concentration in the sam-ples, the gel stiffness correlated with the mol frac-tion of lactosylated p-Lg The influence oflactosylation on the gel stiffness could stem froman associated increase in hydrophihcity (Nackaet al, 1998) or improved solubility The lactosyla-tion level could also correlate with other effects ofprocessing on the protein such as unfolding of thepolypeptide chain but SH group reactivity was notsignificantly correlated with gel stiffness (r =O 22) There were two samples (BORCwpc+ andMDFbeta-1) that gave shghtly lower gel stiffnessvalues than expected from the concentration of P-Lg and lts degree of lactosylation Both containedlittle a-La, which is a factor known to enhance thegelation of P-Lg below a weight fraction of O 3 a-La (Dalgleish et al, 1997, Gezimati et al, 1997)
International Journal of Food Science and Technology 1999 34, 587-601 © 1999 Blackwell Science Ltd

Properties of whey protein isolates and fractions C. Holt et al. 599
Mineral content can also influences the gelstiffness. The marked difference between theMDFbeta-1 and MDFbeta-2 samples in Group lcould stem from the difference in salt content(Table 1). Solutions of MDFbeta-1 (7.2% miner-als) were turbid, indicating salt-induced aggrega-tion and hence impaired gelation ability, whereassolutions of MDFbeta-2 (3% minerals) weretransparent. Likewise, the lower stiffness ofMDFwpi-la compared to MDFwpi-1 may berelated to the higher Ca content (Table 1).
Aggregation
The chromatographic method has proved effec-tive in the characterisation of oligomers and thecharacteristic structures of about 100 monomers,formed in the early stages of heat-induced aggre-gation of pure P-Lg preparations (Bauer et al.,1998). These represent an intermediate stage inthe aggregation and gelation process. However,with the commercial samples, and in buffers ofmoderate or higher ionic strength, larger aggre-gates may form and be detected in part or not atall with this system (retained on the column) asreflected in recoveries below 100%. Nevertheless,because we observe no essential difference inrecovery with or without the heat treatment, it isunlikely that the undetected material affects theformation of the characteristic aggregates. Theunheated samples also showed aggregates in thechromatograms though they cannot be seen onthe scale used for Fig. 5(a), apart from the largepeak in the MDFbeta-1 sample. Both the largeand small types of aggregates were present beforeheating but the predominant form was the small-er aggregates characteristic of p-Lg.
In general, the pattern of aggregation is corre-lated with the relative proportions of the twomain proteins, as reflected in the division of thenine samples into the three groups (Table 1).However, there are two notable exceptions: theabsence of any peak of aggregated material in theAPbeta9615 sample and the relatively smallersized aggregates formed by the MDFwpi-1 sam-ple. The APbeta9615 sample was particularlyprone to forming aggregates on heating and wasthe only sample that needed additional centrifu-gation and filtration steps to remove excess tur-bidity after the heat treatment. The absence of a
peak in this case may reflect the efficiency of thepre-column clarification procedures employed.The APbeta9615 sample also appears anomalousin the surface tension measurements, behavingmore like a surfactant than a protein solution andthis observation may be correlated in some waywith its propensity to form the larger types ofaggregates in spite of its low a-La content.
Interfacial properties
The adsorbed amount and surface layer thicknessof MDFbeta-1 is much larger than the corre-sponding value for MDFbeta-2. The surface ten-sion for the former is also somewhat larger. Infact it is the largest of the investigated samples.The main difference in measured compositionbetween the two samples is the salt content wherethe former contains 7.2 wt% mineral and the lat-ter 3 wt% (Table 1). The larger salt content mightpromote aggregation at the oil-aqueous interfaceand a thicker adsorbed layer. Size exclusion chro-matography also indicates that MDFbeta-1 con-tains a larger aggregated fraction thanMDFbeta-2 (Fig 5a and Fig. l of Holt et al.,1999). However, if aggregates are present, theyhave less affinity for the air liquid ' interface sincethe surface tension of MDFbeta-1 is higher thanthat for MDFbeta-2. The lactosylation ofMDFbeta-2 is also high, while very low lactosy-lation was observed for MDFbeta-1 (Table 1).Low lactosylation will decrease the solubility inthe oil phase and presumably give lower adsorp-tion at this interface. The other sample that givesa large thickness and adsorbed amount at theoil-aqueous interface is BORCwpc+. This samplealso gives a high final surface tension, the secondhighest after MDFbeta-1, but its mineral contentis more similar to that of MDFbeta-2 (Table 1)and like MDFbeta-2, it is highly lactosylated. Sizeexclusion chromatography of the BORCwpc+sample showed little if any protein in the aggre-gate fraction (Fig. 5a), unlike the MDFbeta-1sample. Thus, neither the salt content, nor thedegree of lactosylation nor the presence of aggre-gates appears from these results to be correlatedwith the high surface tension and thick adsorbedlayer.
The lowest surface tension (about 38 mN m ')is observed for APbeta9615. Such low values are
© 1999 Blackwell Science Ltd International Journal of Food Science and Technology 1999, 34, 587-601

600 Properties of whey protein isolates and fractions C Holt et al
normally only observed for lipids and surfactants,suggesting that the surface film contains somelipid material. At the oil-aqueous interface theadsorbed amount of this sample was also some-what lower than average. This might arise fromthe presence of fatty acids at the interface. On theother hand, it has the lowest pH of 3.9 on recon-stitution, which might also affect the surfaceactivity.
The lowest amount adsorbed at the oil-aque-ous interface was found with MDFwpi-1. Afterreaching a semi-plateau, a further decrease in sur-face tension was observed after about 3000 s untilit reached a plateau value similar to those ofMDFwpi-la and MDFwpi-lb. The latter twoprotein samples have a quite similar method ofpreparation and composition, although MDFwpi-la has the higher calcium content. The mterfacialbehaviour of all three samples at the air-aqueousand oil-water interface is therefore, as expected,somewhat similar. Further discussion of the inter-facial properties of these samples is given byNylander et al. (1999).
Conclusions
All of the samples contain some misfolded and/oraggregated and/or lactosylated forms of p-Lg.Nevertheless, the overall fold of the moleculeappears to be preserved and some of the proteinwas still able to form crystals with a normal spacegroup and cell dimensions. Consistent patterns ofaggregation, denaturation and gelation behaviourwere seen in the commercial and semi-commercialsamples when dispersed in a phosphate buffer,which could be related to the protein compositionand degree of lactosylation of the p-Lg. Theinterfacial behaviour of the samples, dispersed inwater, was more variable and less easily related toany small number of compositional factors ormeasures of protein damage during processing.
Acknowledgments
The sample survey was carried out as part of aEuropean Commission-funded concert ed actionon the Molecular Basis of the Aggregation,Denaturation, Gelation and Surface Activity ofWhey Proteins (MADGELAS), CT96- 1202. Allother members of the MADGELAS group are
thanked for their co-operation in the sample sur-vey, of which this paper forms a part. The HRIwork was supported by the Scottish OfficeAgriculture, Environment and ForestryDepartment. The work in Edinburgh and HRIwas also supported by the Biotechnology andBiological Science Research Council. The work atKVL was supported by the Dantsh Dairy Boardand the Danish Research and DevelopmentProgramme for Food Technology through theLMC Center for Advanced Food Studies. H.Molinan (University of Verona), L. Ragona andL. Zetta (CNR Milano) gratefully acknowledgethe financial support of the Itahan NationalResearch Council 'Comitato Biotecnologie', bythe European Community TM R Large ScaleFacilities project at the Frankfurt BiophysicCentre and by the "Fondazione Antonio DeMarco". E. Little (HRI) and L. G. Hansen (KVL)are thanked for skilied technical assistance.
ReferencesAzzam, R M A & Bashara. N M (1987) Ellipsometry
and Polarized Light Amsterdam, The NetherlandsNorth Holland Elsevier
Bauer, R . Hansen, S & 0gendal. L (1998) Detection ofintermediate oligomers, important for the formation ofheat aggregates of (3-lactoglobuhn Inteinatwnal DamJ out nal, 8, 105-112
Bauer, R . Rischel. C , Hansen, S & 0gendal. L (1999)Heat induced gelation of whey proteins at high pHstudied by combined light scattenng, UV spectroscopyand refractive index measurements after size exclusionand by m-sitii dynamic light scattering InternationalJ out nal of Food Science and Technolog\, 34, 557-563
Brownlow. S , Morais Cabral. J H . et al (1997) 'Bovine(3-lactoglobulm at l 8A resolution - still an enigmatichpocalm' Structuie. 5, 481^195
Bylaite, E., Nylander. T & Venskutoms, R (1999)Emulsification of caraway essential oil in water bylecithm and (3-lactoglobulm- emulsion stability andproperties of the formed oil-aqueous interfaceInteinatwnal Darr\ Joutnal (subrmtted).
Calderone. V , Gmffnda. M G , Viterbo, D , et al (1996)Ammo-acid sequence and crystal structure of buffaloa-lactalbumin FEBS Lellen. 394. 91-95
Cuypers, P A , Corsel. J W , Janssen. M P . Kop, J M M .Hermens. W T h & Hemker, H C (1983) Theadsorption of prothrombm to phosphatidylsennemultilayers quantitated by ellipsometry Journal ofBiological Chenmtn, 258, 2426-2431
Dalgleish. D G , Senaratne, V & Francois, S (1997)Interactions between a-lactalbumin and pi-lactoglobulinin the early stages of heat denaturation Journal ofAgucultiiral and Food Chemifin. 45. 3459 3464
International Journal of Food Science and Technology 1999. 34, 587-601 © 1999 Blackwell Science Ltd
Properties of whey protein isolates and fractions C Holt et al 601
De Feijter, J A , Benjamins, J & Veer, F A (1978)Ellipsometry as a tooi to study the adsorptionbehaviour of synthetic and bioploymers at theair water interface Biopolymers, 17, 1759-1772
Ducruix, A & Giege, R (1999) Crystalhsatwn of NucleicAc/ds and Proteins, 2nd edn Oxford, IRL Press
Fogolan, F , Ragona, L , Zetta, L , Romagnoli, S , deKruif, C G & Molinan, H (1998) Monomeric bovine(J-lactoglobulm adopts a (i-barrel fold at pH 2 FEBSLet Iers, 436, 149-154
Gezimati, J , Creamer, L & Smgh, H (1997)Heat induced interactions and gelation of mixtures ofB-lactoglobulin and a-lactalbumin Journal ofAgncultural and Food Chemistry, 45, 1130 1136
Hamdam, M , Curcuruto, O , Molinan, H , Zetta, L &Ragona, L (1996) Momtonng complexation betweensome proteins and naphthalene dye by electrospraymass spectroscopy Journal of Mass Spectroscopy, 31,1261 1264
Hoffmann, M A M , Roefs, S P F M , Verheul, M vanMil, J J M & de Kruif, C G (1996) Aggregation of(3-lactoglobulm studied by m situ light scatteringJournal of Dairy Research, 63, 423^40
Holt, C , McPhail, D , Nevison, l et al (1999) Apparentchemical composition of nine commercial or semi-commercial whey protein concentrates, isolates orfractions International Journal of Food Science andTechnology, 34, 543 556
Holt, C , Wamnge, R , Sellers, P et al (1998)Comparison of the effect of heating on the thermaldenaturation of 9 different B-lactoglobuhn presss ofgenetic variants A, B or A/B, as measured bymicrocalorimetry International Dairy Journal, 8,99 104
Mahanty, J & Nmham, B W (1976) Dispersion ForcesLondon, Academie Press
McCrackm, F L , Passagha, E , Stromberg, R R &Sternberg, H L (1963) Measurements of the thicknessand refractive index of very thin films and the opticalproperties of surfaces by ellipsometry Journal ofResearch of the National Bureau of Standards ~ APhysics and Chemistry, 67A, 363 377
McPhail, D & Holt, C (1999) Effect of amons on theaggregation and denaturation of B-lactoglobulin asmeasured by differential scanning microcalorimetryInternational Journal of Food Science and Technology,34, 477-481
Molinan, H , Ragona, L , Varani, L , Musco, G ,Consonm, R & Zetta, L & Monaco, H (1996)Partially folded structure of monomeric bovine B-lactoglobulm FEBS Letters, 381, 237-243
Nacka, F , Chobert, J -M , Burova, T & Léonil, J(1998) Induction of new physicochemical andfunctional properties by the glycosylation of wheyproteins Journal of Protem Chemistry, 17, 495-503
Nylander, T , Hamraoui, A & Paulsson, M (1999)Interfacial properties of whey proteins at air/water andoil/water interfaces studied by dynamic droptensiometry, ellipsometry and spreading kineticsInternational Journal of Food Science and Technology,34, 573 585
Nylander, T & Wahlgren, N M (1994) Competitive andsequential adsorption of B-casem and B-lactoglobulinon hydrophobic surfaces and the mterfacial structure ofB-casem Journal of Colloid and Interface Scienc E, 162,151 162
Otwmowski, Z & Minor, W (1997) Processing X-raydiffracüon data collected in oscillation mode Methodsm Enzymology, 276, 307 326
Paulsson, P , Hegg, P -O & Castberg, H B (1985)Thermal stability of whey proteins studied bydifferential scanning calonmetry Thermochimica Acta,95, 435-440
Qi, X L , Brownlow, S , Holt, C & Sellers, P (1995)Effect of concentration on the denaturation ofB-lactoglobulin near neutral pH Bwchimica etBiophysica Acta, 1248, 43^19
Ragona, L , Confalomeri, L , Zetta, L , de Kruif, C G ,Mammi, S , Peggion, E , Longhi, R & Molmari, H(1999) The problematic existence of a non- native <x-hehcal intermediate accumulated dunng the equilibnumunfolding of bovine fS-lactoglobulm Biopolymers, 49,441^50
Ragona, L , Pusterla, F , Zetta, L , Monaco, H &Molinan, H (1997) Conserved hydrophobic cluster inpartially folded bovine B-lactoglobulin at pH 2 Foldingand Design, 2, 281-290
Sawyer, L , Kontopidis, G & Wu, S -Y (1999) B-Lactoglobulm an X-ray structural perspectiveInternational Journal of Food Science and Technology,34, 409^18
Wu, S -Y , Perez, M D , Puyol, P & Sawyer, L (1999)B-Lactoglobulm bmds palmitate within lts centralcavity Journal of Biological Chemistry, 274, 170-174
© 1999 Blackwell Science Ltd International Journal of Food Science and Technology 1999, 34, 587 601
Copyright © 2022 FDOKUMEN