Contents Figures Tables About this book
428
User Guide Version 4.0 May 2007
-
Upload
khangminh22 -
Category
Documents
-
view
0 -
download
0
Transcript of Contents Figures Tables About this book

User Guide
Version 4.0May 2007

Copyright and trademark information
Copyright 2007 Trilog Service AG, as an unpublished work. All rights reserved.
TriTune is a trademark of Trilog Holding AG.AQM is a trademark of Trilog Holding AG and is registered internationally in various jurisdictions.APC is a trademark of Trilog Holding AG.InTune and other BMC Software product or service names are registered trademarks or trademarks of BMC Software, Inc.Analyze+ is a trademark of SOFTWARE ENGINEERING GMBH.IBM is a registered trademark of International Business Machines Corporation.DB2 is a registered trademark of International Business Machines Corporation.All other trademarks belong to their respective companies.
Trilog Service AG considers information included in this documentation to be proprietary and confidential. Your use of this information is subject to the terms and conditions of the applicable End User License Agreement for the product and the proprietary and restricted rights notices included in this documentation.
Restricted rights legend
U.S. Government Restricted Rights to Computer Software. UNPUBLISHED -- RIGHTS RESERVED UNDER THE COPYRIGHT LAWS OF THE UNITED STATES. Use, duplication, or disclosure of any data and computer software by the U.S. Government is subject to restrictions, as applicable, set forth in FAR Section 52.227-14, DFARS 252.227-7013, DFARS 252.227-7014, DFARS 252.227-7015, and DFARS 252.227-7025, as amended from time to time. Contractor/Manufacturer is AQM Solutions, Inc., 28 State Street, Suite 1100, Boston, MA 02108, USA. Any contract notices should be sent to this address.

3
Customer Support
For online technical assistance and a complete list of locations, primary service hours, and telephone numbers, contact CA Technical Support at http://ca.com/support.

4

ContentsAbout this book 21
How this book is organized . . . . . . . . . . . . . . . . . . . . . . . . . . . . . . . . . . . . . . . . . . . . . . . . 22Related documentation . . . . . . . . . . . . . . . . . . . . . . . . . . . . . . . . . . . . . . . . . . . . . . . . . . . . 23
View or download documentation . . . . . . . . . . . . . . . . . . . . . . . . . . . . . . . . . . . . . . . 23Access online Help . . . . . . . . . . . . . . . . . . . . . . . . . . . . . . . . . . . . . . . . . . . . . . . . . . . . 23
Conventions . . . . . . . . . . . . . . . . . . . . . . . . . . . . . . . . . . . . . . . . . . . . . . . . . . . . . . . . . . . . . 24
Chapter 1 Introduction to TriTune 25
What TriTune is. . . . . . . . . . . . . . . . . . . . . . . . . . . . . . . . . . . . . . . . . . . . . . . . . . . . . . . . . . . 25Using TriTune for application tuning . . . . . . . . . . . . . . . . . . . . . . . . . . . . . . . . . . . . . 26
Using the TriTune interface. . . . . . . . . . . . . . . . . . . . . . . . . . . . . . . . . . . . . . . . . . . . . . . . . 26Using the online tutorial. . . . . . . . . . . . . . . . . . . . . . . . . . . . . . . . . . . . . . . . . . . . . . . . 27
Working with TriTune . . . . . . . . . . . . . . . . . . . . . . . . . . . . . . . . . . . . . . . . . . . . . . . . . . . . . 27Describing basic tasks in TriTune. . . . . . . . . . . . . . . . . . . . . . . . . . . . . . . . . . . . . . . . . . . . 28
Creating monitor definitions . . . . . . . . . . . . . . . . . . . . . . . . . . . . . . . . . . . . . . . . . . . . 28Invoking a monitor . . . . . . . . . . . . . . . . . . . . . . . . . . . . . . . . . . . . . . . . . . . . . . . . . . . . 29Analyzing monitor data . . . . . . . . . . . . . . . . . . . . . . . . . . . . . . . . . . . . . . . . . . . . . . . . 29
Describing the Interactive Analysis menu options . . . . . . . . . . . . . . . . . . . . . . . . . . . . . 31Describing other features of TriTune . . . . . . . . . . . . . . . . . . . . . . . . . . . . . . . . . . . . . . . . . 33
Chapter 2 Working in the TriTune environment 37
Starting TriTune from a TSO session . . . . . . . . . . . . . . . . . . . . . . . . . . . . . . . . . . . . . . . . 38Starting TriTune from ISPF. . . . . . . . . . . . . . . . . . . . . . . . . . . . . . . . . . . . . . . . . . . . . . 38Setting up user options . . . . . . . . . . . . . . . . . . . . . . . . . . . . . . . . . . . . . . . . . . . . . . . . . 39
Navigating in TriTune . . . . . . . . . . . . . . . . . . . . . . . . . . . . . . . . . . . . . . . . . . . . . . . . . . . . . 40Displaying TriTune status . . . . . . . . . . . . . . . . . . . . . . . . . . . . . . . . . . . . . . . . . . . . . . . . . . 42Using online Help . . . . . . . . . . . . . . . . . . . . . . . . . . . . . . . . . . . . . . . . . . . . . . . . . . . . . . . . 42
Screen Help. . . . . . . . . . . . . . . . . . . . . . . . . . . . . . . . . . . . . . . . . . . . . . . . . . . . . . . . . . . 43Field Help . . . . . . . . . . . . . . . . . . . . . . . . . . . . . . . . . . . . . . . . . . . . . . . . . . . . . . . . . . . . 44Content-sensitive Help . . . . . . . . . . . . . . . . . . . . . . . . . . . . . . . . . . . . . . . . . . . . . . . . . 44Message Help . . . . . . . . . . . . . . . . . . . . . . . . . . . . . . . . . . . . . . . . . . . . . . . . . . . . . . . . . 44
Scrolling TriTune panels . . . . . . . . . . . . . . . . . . . . . . . . . . . . . . . . . . . . . . . . . . . . . . . . . . . 46Using PF keys . . . . . . . . . . . . . . . . . . . . . . . . . . . . . . . . . . . . . . . . . . . . . . . . . . . . . . . . . . . . 47Locating a string in a display . . . . . . . . . . . . . . . . . . . . . . . . . . . . . . . . . . . . . . . . . . . . . . . 48Sorting the display . . . . . . . . . . . . . . . . . . . . . . . . . . . . . . . . . . . . . . . . . . . . . . . . . . . . . . . . 48Using Autonavigation . . . . . . . . . . . . . . . . . . . . . . . . . . . . . . . . . . . . . . . . . . . . . . . . . . . . . 49Displaying column totals . . . . . . . . . . . . . . . . . . . . . . . . . . . . . . . . . . . . . . . . . . . . . . . . . . 51
Contents 5
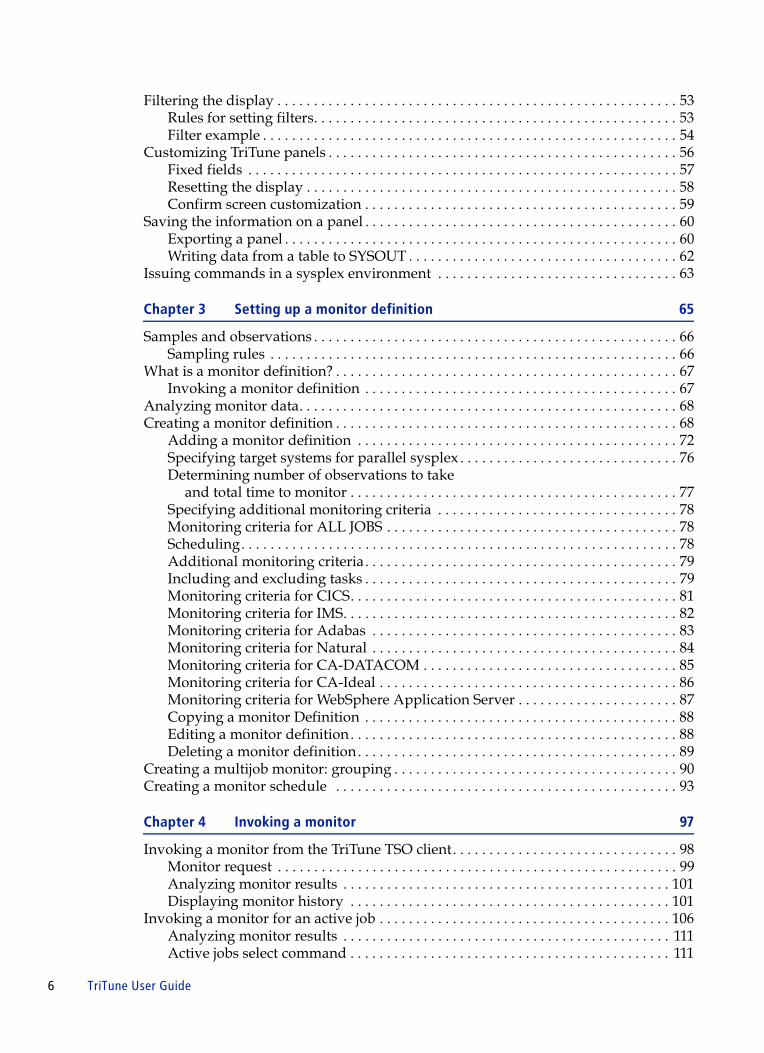
Filtering the display . . . . . . . . . . . . . . . . . . . . . . . . . . . . . . . . . . . . . . . . . . . . . . . . . . . . . . . 53Rules for setting filters. . . . . . . . . . . . . . . . . . . . . . . . . . . . . . . . . . . . . . . . . . . . . . . . . . 53Filter example . . . . . . . . . . . . . . . . . . . . . . . . . . . . . . . . . . . . . . . . . . . . . . . . . . . . . . . . . 54
Customizing TriTune panels . . . . . . . . . . . . . . . . . . . . . . . . . . . . . . . . . . . . . . . . . . . . . . . . 56Fixed fields . . . . . . . . . . . . . . . . . . . . . . . . . . . . . . . . . . . . . . . . . . . . . . . . . . . . . . . . . . . 57Resetting the display . . . . . . . . . . . . . . . . . . . . . . . . . . . . . . . . . . . . . . . . . . . . . . . . . . . 58Confirm screen customization . . . . . . . . . . . . . . . . . . . . . . . . . . . . . . . . . . . . . . . . . . . 59
Saving the information on a panel . . . . . . . . . . . . . . . . . . . . . . . . . . . . . . . . . . . . . . . . . . . 60Exporting a panel . . . . . . . . . . . . . . . . . . . . . . . . . . . . . . . . . . . . . . . . . . . . . . . . . . . . . . 60Writing data from a table to SYSOUT . . . . . . . . . . . . . . . . . . . . . . . . . . . . . . . . . . . . . 62
Issuing commands in a sysplex environment . . . . . . . . . . . . . . . . . . . . . . . . . . . . . . . . . 63
Chapter 3 Setting up a monitor definition 65
Samples and observations . . . . . . . . . . . . . . . . . . . . . . . . . . . . . . . . . . . . . . . . . . . . . . . . . . 66Sampling rules . . . . . . . . . . . . . . . . . . . . . . . . . . . . . . . . . . . . . . . . . . . . . . . . . . . . . . . . 66
What is a monitor definition? . . . . . . . . . . . . . . . . . . . . . . . . . . . . . . . . . . . . . . . . . . . . . . . 67Invoking a monitor definition . . . . . . . . . . . . . . . . . . . . . . . . . . . . . . . . . . . . . . . . . . . 67
Analyzing monitor data. . . . . . . . . . . . . . . . . . . . . . . . . . . . . . . . . . . . . . . . . . . . . . . . . . . . 68Creating a monitor definition . . . . . . . . . . . . . . . . . . . . . . . . . . . . . . . . . . . . . . . . . . . . . . . 68
Adding a monitor definition . . . . . . . . . . . . . . . . . . . . . . . . . . . . . . . . . . . . . . . . . . . . 72Specifying target systems for parallel sysplex . . . . . . . . . . . . . . . . . . . . . . . . . . . . . . 76Determining number of observations to take
and total time to monitor . . . . . . . . . . . . . . . . . . . . . . . . . . . . . . . . . . . . . . . . . . . . . 77Specifying additional monitoring criteria . . . . . . . . . . . . . . . . . . . . . . . . . . . . . . . . . 78Monitoring criteria for ALL JOBS . . . . . . . . . . . . . . . . . . . . . . . . . . . . . . . . . . . . . . . . 78Scheduling. . . . . . . . . . . . . . . . . . . . . . . . . . . . . . . . . . . . . . . . . . . . . . . . . . . . . . . . . . . . 78Additional monitoring criteria. . . . . . . . . . . . . . . . . . . . . . . . . . . . . . . . . . . . . . . . . . . 79Including and excluding tasks . . . . . . . . . . . . . . . . . . . . . . . . . . . . . . . . . . . . . . . . . . . 79Monitoring criteria for CICS. . . . . . . . . . . . . . . . . . . . . . . . . . . . . . . . . . . . . . . . . . . . . 81Monitoring criteria for IMS. . . . . . . . . . . . . . . . . . . . . . . . . . . . . . . . . . . . . . . . . . . . . . 82Monitoring criteria for Adabas . . . . . . . . . . . . . . . . . . . . . . . . . . . . . . . . . . . . . . . . . . 83Monitoring criteria for Natural . . . . . . . . . . . . . . . . . . . . . . . . . . . . . . . . . . . . . . . . . . 84Monitoring criteria for CA-DATACOM . . . . . . . . . . . . . . . . . . . . . . . . . . . . . . . . . . . 85Monitoring criteria for CA-Ideal . . . . . . . . . . . . . . . . . . . . . . . . . . . . . . . . . . . . . . . . . 86Monitoring criteria for WebSphere Application Server . . . . . . . . . . . . . . . . . . . . . . 87Copying a monitor Definition . . . . . . . . . . . . . . . . . . . . . . . . . . . . . . . . . . . . . . . . . . . 88Editing a monitor definition. . . . . . . . . . . . . . . . . . . . . . . . . . . . . . . . . . . . . . . . . . . . . 88Deleting a monitor definition. . . . . . . . . . . . . . . . . . . . . . . . . . . . . . . . . . . . . . . . . . . . 89
Creating a multijob monitor: grouping . . . . . . . . . . . . . . . . . . . . . . . . . . . . . . . . . . . . . . . 90Creating a monitor schedule . . . . . . . . . . . . . . . . . . . . . . . . . . . . . . . . . . . . . . . . . . . . . . . 93
Chapter 4 Invoking a monitor 97
Invoking a monitor from the TriTune TSO client. . . . . . . . . . . . . . . . . . . . . . . . . . . . . . . 98Monitor request . . . . . . . . . . . . . . . . . . . . . . . . . . . . . . . . . . . . . . . . . . . . . . . . . . . . . . . 99Analyzing monitor results . . . . . . . . . . . . . . . . . . . . . . . . . . . . . . . . . . . . . . . . . . . . . 101Displaying monitor history . . . . . . . . . . . . . . . . . . . . . . . . . . . . . . . . . . . . . . . . . . . . 101
Invoking a monitor for an active job . . . . . . . . . . . . . . . . . . . . . . . . . . . . . . . . . . . . . . . . 106Analyzing monitor results . . . . . . . . . . . . . . . . . . . . . . . . . . . . . . . . . . . . . . . . . . . . . 111Active jobs select command . . . . . . . . . . . . . . . . . . . . . . . . . . . . . . . . . . . . . . . . . . . . 111
6 TriTune User Guide
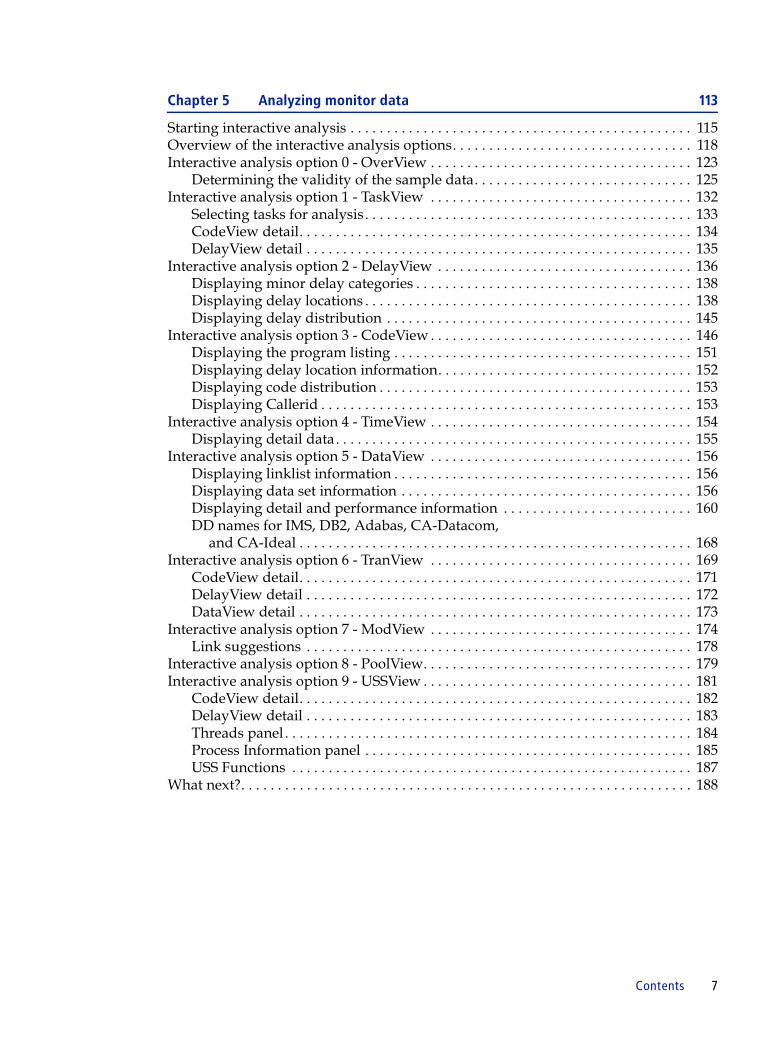
Chapter 5 Analyzing monitor data 113
Starting interactive analysis . . . . . . . . . . . . . . . . . . . . . . . . . . . . . . . . . . . . . . . . . . . . . . . 115Overview of the interactive analysis options. . . . . . . . . . . . . . . . . . . . . . . . . . . . . . . . . 118Interactive analysis option 0 - OverView . . . . . . . . . . . . . . . . . . . . . . . . . . . . . . . . . . . . 123
Determining the validity of the sample data. . . . . . . . . . . . . . . . . . . . . . . . . . . . . . 125Interactive analysis option 1 - TaskView . . . . . . . . . . . . . . . . . . . . . . . . . . . . . . . . . . . . 132
Selecting tasks for analysis . . . . . . . . . . . . . . . . . . . . . . . . . . . . . . . . . . . . . . . . . . . . . 133CodeView detail. . . . . . . . . . . . . . . . . . . . . . . . . . . . . . . . . . . . . . . . . . . . . . . . . . . . . . 134DelayView detail . . . . . . . . . . . . . . . . . . . . . . . . . . . . . . . . . . . . . . . . . . . . . . . . . . . . . 135
Interactive analysis option 2 - DelayView . . . . . . . . . . . . . . . . . . . . . . . . . . . . . . . . . . . 136Displaying minor delay categories . . . . . . . . . . . . . . . . . . . . . . . . . . . . . . . . . . . . . . 138Displaying delay locations . . . . . . . . . . . . . . . . . . . . . . . . . . . . . . . . . . . . . . . . . . . . . 138Displaying delay distribution . . . . . . . . . . . . . . . . . . . . . . . . . . . . . . . . . . . . . . . . . . 145
Interactive analysis option 3 - CodeView . . . . . . . . . . . . . . . . . . . . . . . . . . . . . . . . . . . . 146Displaying the program listing . . . . . . . . . . . . . . . . . . . . . . . . . . . . . . . . . . . . . . . . . 151Displaying delay location information. . . . . . . . . . . . . . . . . . . . . . . . . . . . . . . . . . . 152Displaying code distribution . . . . . . . . . . . . . . . . . . . . . . . . . . . . . . . . . . . . . . . . . . . 153Displaying Callerid . . . . . . . . . . . . . . . . . . . . . . . . . . . . . . . . . . . . . . . . . . . . . . . . . . . 153
Interactive analysis option 4 - TimeView . . . . . . . . . . . . . . . . . . . . . . . . . . . . . . . . . . . . 154Displaying detail data. . . . . . . . . . . . . . . . . . . . . . . . . . . . . . . . . . . . . . . . . . . . . . . . . 155
Interactive analysis option 5 - DataView . . . . . . . . . . . . . . . . . . . . . . . . . . . . . . . . . . . . 156Displaying linklist information . . . . . . . . . . . . . . . . . . . . . . . . . . . . . . . . . . . . . . . . . 156Displaying data set information . . . . . . . . . . . . . . . . . . . . . . . . . . . . . . . . . . . . . . . . 156Displaying detail and performance information . . . . . . . . . . . . . . . . . . . . . . . . . . 160DD names for IMS, DB2, Adabas, CA-Datacom,
and CA-Ideal . . . . . . . . . . . . . . . . . . . . . . . . . . . . . . . . . . . . . . . . . . . . . . . . . . . . . . 168Interactive analysis option 6 - TranView . . . . . . . . . . . . . . . . . . . . . . . . . . . . . . . . . . . . 169
CodeView detail. . . . . . . . . . . . . . . . . . . . . . . . . . . . . . . . . . . . . . . . . . . . . . . . . . . . . . 171DelayView detail . . . . . . . . . . . . . . . . . . . . . . . . . . . . . . . . . . . . . . . . . . . . . . . . . . . . . 172DataView detail . . . . . . . . . . . . . . . . . . . . . . . . . . . . . . . . . . . . . . . . . . . . . . . . . . . . . . 173
Interactive analysis option 7 - ModView . . . . . . . . . . . . . . . . . . . . . . . . . . . . . . . . . . . . 174Link suggestions . . . . . . . . . . . . . . . . . . . . . . . . . . . . . . . . . . . . . . . . . . . . . . . . . . . . . 178
Interactive analysis option 8 - PoolView. . . . . . . . . . . . . . . . . . . . . . . . . . . . . . . . . . . . . 179Interactive analysis option 9 - USSView . . . . . . . . . . . . . . . . . . . . . . . . . . . . . . . . . . . . . 181
CodeView detail. . . . . . . . . . . . . . . . . . . . . . . . . . . . . . . . . . . . . . . . . . . . . . . . . . . . . . 182DelayView detail . . . . . . . . . . . . . . . . . . . . . . . . . . . . . . . . . . . . . . . . . . . . . . . . . . . . . 183Threads panel . . . . . . . . . . . . . . . . . . . . . . . . . . . . . . . . . . . . . . . . . . . . . . . . . . . . . . . . 184Process Information panel . . . . . . . . . . . . . . . . . . . . . . . . . . . . . . . . . . . . . . . . . . . . . 185USS Functions . . . . . . . . . . . . . . . . . . . . . . . . . . . . . . . . . . . . . . . . . . . . . . . . . . . . . . . 187
What next?. . . . . . . . . . . . . . . . . . . . . . . . . . . . . . . . . . . . . . . . . . . . . . . . . . . . . . . . . . . . . . 188
Contents 7
Chapter 6 Using additional features of TriTune 189
Creating and using Global Monitors . . . . . . . . . . . . . . . . . . . . . . . . . . . . . . . . . . . . . . . . 190Using the Global Monitoring Menu . . . . . . . . . . . . . . . . . . . . . . . . . . . . . . . . . . . . . 190Changing the Global Monitor definition default criteria . . . . . . . . . . . . . . . . . . . . 191Analyzing Global Monitor data sets . . . . . . . . . . . . . . . . . . . . . . . . . . . . . . . . . . . . . 191
Analyzing monitor data sets created by other users . . . . . . . . . . . . . . . . . . . . . . . . . . . 192Including a monitor data set from an external user . . . . . . . . . . . . . . . . . . . . . . . . 194Adding a monitor data set . . . . . . . . . . . . . . . . . . . . . . . . . . . . . . . . . . . . . . . . . . . . . 196Analyzing external data sets . . . . . . . . . . . . . . . . . . . . . . . . . . . . . . . . . . . . . . . . . . . 197Removing external data sets. . . . . . . . . . . . . . . . . . . . . . . . . . . . . . . . . . . . . . . . . . . . 197
Performing administrative functions. . . . . . . . . . . . . . . . . . . . . . . . . . . . . . . . . . . . . . . . 198Using the Administration Option Menu . . . . . . . . . . . . . . . . . . . . . . . . . . . . . . . . . 198CSECT associations . . . . . . . . . . . . . . . . . . . . . . . . . . . . . . . . . . . . . . . . . . . . . . . . . . . 200Defining pseudo groups . . . . . . . . . . . . . . . . . . . . . . . . . . . . . . . . . . . . . . . . . . . . . . . 202Updating content-sensitive Help. . . . . . . . . . . . . . . . . . . . . . . . . . . . . . . . . . . . . . . . 205Updating a content-sensitive Help entry . . . . . . . . . . . . . . . . . . . . . . . . . . . . . . . . . 210Displaying TriTune and environmental information . . . . . . . . . . . . . . . . . . . . . . . 216
Registering source program listings . . . . . . . . . . . . . . . . . . . . . . . . . . . . . . . . . . . . . . . . 218Compiling the program. . . . . . . . . . . . . . . . . . . . . . . . . . . . . . . . . . . . . . . . . . . . . . . . 218Registering IBM C/C++ listings with language environment support . . . . . . . . 220Using interactive analysis with registered programs . . . . . . . . . . . . . . . . . . . . . . . 228
Chapter 7 TriTune Open Application Program Interface 231
What is the TriTune Open Application Program Interface? . . . . . . . . . . . . . . . . . . . . . 232Invoking the TUNCALL program. . . . . . . . . . . . . . . . . . . . . . . . . . . . . . . . . . . . . . . 232Using TUNCALL . . . . . . . . . . . . . . . . . . . . . . . . . . . . . . . . . . . . . . . . . . . . . . . . . . . . . 232Describing TUNCALL functions . . . . . . . . . . . . . . . . . . . . . . . . . . . . . . . . . . . . . . . . 232What global monitors are . . . . . . . . . . . . . . . . . . . . . . . . . . . . . . . . . . . . . . . . . . . . . . 233Describing the TUNCALL syntax . . . . . . . . . . . . . . . . . . . . . . . . . . . . . . . . . . . . . . . 233
TUNCALL verbs and keywords . . . . . . . . . . . . . . . . . . . . . . . . . . . . . . . . . . . . . . . . . . . 236MONITOR INVOKE . . . . . . . . . . . . . . . . . . . . . . . . . . . . . . . . . . . . . . . . . . . . . . . . . . 236MONITOR CANCEL. . . . . . . . . . . . . . . . . . . . . . . . . . . . . . . . . . . . . . . . . . . . . . . . . . 244MONITOR STATUS . . . . . . . . . . . . . . . . . . . . . . . . . . . . . . . . . . . . . . . . . . . . . . . . . . . 245Invoking a monitor from a TSO command, CLIST,
or REXX EXEC . . . . . . . . . . . . . . . . . . . . . . . . . . . . . . . . . . . . . . . . . . . . . . . . . . . . . 246Invoking TUNCALL from a batch job . . . . . . . . . . . . . . . . . . . . . . . . . . . . . . . . . . . 246Routing message output to a file . . . . . . . . . . . . . . . . . . . . . . . . . . . . . . . . . . . . . . . . 246Invoking a monitor from within a program. . . . . . . . . . . . . . . . . . . . . . . . . . . . . . . 247Return and reason codes . . . . . . . . . . . . . . . . . . . . . . . . . . . . . . . . . . . . . . . . . . . . . . . 247
Chapter 8 Generating TriTune batch reports 251
Generating batch reports automatically . . . . . . . . . . . . . . . . . . . . . . . . . . . . . . . . . . . . . 252Submitting a job to generate batch reports . . . . . . . . . . . . . . . . . . . . . . . . . . . . . . . . . . . 252Setting up a batch report definition . . . . . . . . . . . . . . . . . . . . . . . . . . . . . . . . . . . . . . . . . 253Creating TriTune spreadsheet reports . . . . . . . . . . . . . . . . . . . . . . . . . . . . . . . . . . . . . . . 262
Installing the spreadsheet converter for Microsoft Excel 2000 . . . . . . . . . . . . . . . 262Generating TriTune spreadsheet reports. . . . . . . . . . . . . . . . . . . . . . . . . . . . . . . . . . 265Maintenance and support . . . . . . . . . . . . . . . . . . . . . . . . . . . . . . . . . . . . . . . . . . . . . . 271
8 TriTune User Guide

Chapter 9 Using TriTune to tune your applications 273
Overview of delay categories . . . . . . . . . . . . . . . . . . . . . . . . . . . . . . . . . . . . . . . . . . . . . . 274Program active delays . . . . . . . . . . . . . . . . . . . . . . . . . . . . . . . . . . . . . . . . . . . . . . . . . . . . 276Voluntary wait delays . . . . . . . . . . . . . . . . . . . . . . . . . . . . . . . . . . . . . . . . . . . . . . . . . . . . 276Abend procedure delays . . . . . . . . . . . . . . . . . . . . . . . . . . . . . . . . . . . . . . . . . . . . . . . . . . 277Data delays . . . . . . . . . . . . . . . . . . . . . . . . . . . . . . . . . . . . . . . . . . . . . . . . . . . . . . . . . . . . . 277Resource conflict delays . . . . . . . . . . . . . . . . . . . . . . . . . . . . . . . . . . . . . . . . . . . . . . . . . . 279System active delays . . . . . . . . . . . . . . . . . . . . . . . . . . . . . . . . . . . . . . . . . . . . . . . . . . . . . 280File management delays . . . . . . . . . . . . . . . . . . . . . . . . . . . . . . . . . . . . . . . . . . . . . . . . . . 281Program load delays . . . . . . . . . . . . . . . . . . . . . . . . . . . . . . . . . . . . . . . . . . . . . . . . . . . . . 281DASD management delays. . . . . . . . . . . . . . . . . . . . . . . . . . . . . . . . . . . . . . . . . . . . . . . . 282Other delays . . . . . . . . . . . . . . . . . . . . . . . . . . . . . . . . . . . . . . . . . . . . . . . . . . . . . . . . . . . . 282
Chapter 10 Using TriTune in a DB2 environment 283
Analyzing DB2 data. . . . . . . . . . . . . . . . . . . . . . . . . . . . . . . . . . . . . . . . . . . . . . . . . . . . . . 284Displaying the DB2 Statements panel from the DataView panel . . . . . . . . . . . . . 284Field descriptions for the DB2 Statements panel . . . . . . . . . . . . . . . . . . . . . . . . . . 286Command descriptions for the DB2 Statements panel . . . . . . . . . . . . . . . . . . . . . 290Displaying the DB2View panel from the Interactive Analysis panel . . . . . . . . . 293Describing the differences between DB2 Statements panel and the DB2View
panel . . . . . . . . . . . . . . . . . . . . . . . . . . . . . . . . . . . . . . . . . . . . . . . . . . . . . . . . . . . . . 297Field descriptions for the DB2View panel . . . . . . . . . . . . . . . . . . . . . . . . . . . . . . . . 298Command descriptions for the DB2View panel . . . . . . . . . . . . . . . . . . . . . . . . . . . 302
Using Analyze+ to access DB2 Explain data . . . . . . . . . . . . . . . . . . . . . . . . . . . . . . . . . 304Benefits of Analyze+ . . . . . . . . . . . . . . . . . . . . . . . . . . . . . . . . . . . . . . . . . . . . . . . . . . 304Installation requirements for Analyze+ . . . . . . . . . . . . . . . . . . . . . . . . . . . . . . . . . . 306Customization requirements for Analyze+ . . . . . . . . . . . . . . . . . . . . . . . . . . . . . . . 306Analyzing SQL statements with Analyze+ . . . . . . . . . . . . . . . . . . . . . . . . . . . . . . . 307
Using the Explain function . . . . . . . . . . . . . . . . . . . . . . . . . . . . . . . . . . . . . . . . . . . . . . . . 308Explaining an SQL statement . . . . . . . . . . . . . . . . . . . . . . . . . . . . . . . . . . . . . . . . . . 309Using information on the Explain panel . . . . . . . . . . . . . . . . . . . . . . . . . . . . . . . . . 311Displaying Rule Messages . . . . . . . . . . . . . . . . . . . . . . . . . . . . . . . . . . . . . . . . . . . . . 312Displaying statement details and long names . . . . . . . . . . . . . . . . . . . . . . . . . . . . 313Displaying a DECLARE Statement. . . . . . . . . . . . . . . . . . . . . . . . . . . . . . . . . . . . . . 315
Using the DB2 Intercept facility . . . . . . . . . . . . . . . . . . . . . . . . . . . . . . . . . . . . . . . . . . . . 316How TriTune performs sampling . . . . . . . . . . . . . . . . . . . . . . . . . . . . . . . . . . . . . . . 316Specifying DB2 Intercept options . . . . . . . . . . . . . . . . . . . . . . . . . . . . . . . . . . . . . . . 317
Chapter 11 Using TriTune in a CICS environment 325
CICS transaction response times . . . . . . . . . . . . . . . . . . . . . . . . . . . . . . . . . . . . . . . . . . . 326CICS transaction classes . . . . . . . . . . . . . . . . . . . . . . . . . . . . . . . . . . . . . . . . . . . . . . . . . . 326Analyzing CICS data . . . . . . . . . . . . . . . . . . . . . . . . . . . . . . . . . . . . . . . . . . . . . . . . . . . . . 327
Using TranView for CICS . . . . . . . . . . . . . . . . . . . . . . . . . . . . . . . . . . . . . . . . . . . . . . 328Selecting transactions for analysis . . . . . . . . . . . . . . . . . . . . . . . . . . . . . . . . . . . . . . 329Using PoolView . . . . . . . . . . . . . . . . . . . . . . . . . . . . . . . . . . . . . . . . . . . . . . . . . . . . . . 329Using DelayView . . . . . . . . . . . . . . . . . . . . . . . . . . . . . . . . . . . . . . . . . . . . . . . . . . . . . 333Overview of CICS delay types. . . . . . . . . . . . . . . . . . . . . . . . . . . . . . . . . . . . . . . . . . 333
Contents 9

Chapter 12 Using TriTune in an IMS environment 339
Analyzing IMS transactions . . . . . . . . . . . . . . . . . . . . . . . . . . . . . . . . . . . . . . . . . . . . . . . 340Analyzing IMS data . . . . . . . . . . . . . . . . . . . . . . . . . . . . . . . . . . . . . . . . . . . . . . . . . . . . . . 343Analyzing IMS batch performance information . . . . . . . . . . . . . . . . . . . . . . . . . . . . . . 350IMS region types . . . . . . . . . . . . . . . . . . . . . . . . . . . . . . . . . . . . . . . . . . . . . . . . . . . . . . . . . 354
Chapter 13 Using TriTune in a Java Virtual Machine (JVM) environment 357
Analyzing JVM data. . . . . . . . . . . . . . . . . . . . . . . . . . . . . . . . . . . . . . . . . . . . . . . . . . . . . . 358Command descriptions for the JVM Applications panel . . . . . . . . . . . . . . . . . . . . 360Examples of the JVM Applications panel in other modes . . . . . . . . . . . . . . . . . . . 360
Displaying JVM detail reports . . . . . . . . . . . . . . . . . . . . . . . . . . . . . . . . . . . . . . . . . . . . . 363Displaying the JVM Methods panel . . . . . . . . . . . . . . . . . . . . . . . . . . . . . . . . . . . . . 363Displaying the JVM Methods panel . . . . . . . . . . . . . . . . . . . . . . . . . . . . . . . . . . . . . 364Displaying the JVM Thread TCBs panel. . . . . . . . . . . . . . . . . . . . . . . . . . . . . . . . . . 364
Displaying JVM Delay locations. . . . . . . . . . . . . . . . . . . . . . . . . . . . . . . . . . . . . . . . . . . . 366TranView for CICS panel. . . . . . . . . . . . . . . . . . . . . . . . . . . . . . . . . . . . . . . . . . . . . . . 366DelayView Detail panel. . . . . . . . . . . . . . . . . . . . . . . . . . . . . . . . . . . . . . . . . . . . . . . . 367Delay Locations Detail panel . . . . . . . . . . . . . . . . . . . . . . . . . . . . . . . . . . . . . . . . . . . 368DelayView panel . . . . . . . . . . . . . . . . . . . . . . . . . . . . . . . . . . . . . . . . . . . . . . . . . . . . . 369Delay locations . . . . . . . . . . . . . . . . . . . . . . . . . . . . . . . . . . . . . . . . . . . . . . . . . . . . . . . 370
Chapter 14 Using TriTune in a WebSphere Application Server environment 371
Using TriTune in a WebSphere Application Server environment . . . . . . . . . . . . . . . . 372Introduction . . . . . . . . . . . . . . . . . . . . . . . . . . . . . . . . . . . . . . . . . . . . . . . . . . . . . . . . . 372Monitoring WebSphere Application Server with TriTune . . . . . . . . . . . . . . . . . . . 373
Analyzing WebSphere Application Server transactions . . . . . . . . . . . . . . . . . . . . . . . . 377
Chapter 15 Using TriTune in a WebSphere for MQ environment 387
Analyzing WebSphere for MQ data . . . . . . . . . . . . . . . . . . . . . . . . . . . . . . . . . . . . . . . . . 388
Chapter 16 Using TriTune in an SAP environment 399
Analyzing SAP data . . . . . . . . . . . . . . . . . . . . . . . . . . . . . . . . . . . . . . . . . . . . . . . . . . . . . . 399
Chapter 17 Using TriTune with other databases 403
Using TriTune with Adabas . . . . . . . . . . . . . . . . . . . . . . . . . . . . . . . . . . . . . . . . . . . . . . . 404Using TriTune with CA-Datacom. . . . . . . . . . . . . . . . . . . . . . . . . . . . . . . . . . . . . . . . . . . 407Using TriTune with Natural . . . . . . . . . . . . . . . . . . . . . . . . . . . . . . . . . . . . . . . . . . . . . . . 408
Glossary 411
Index 419
10 TriTune User Guide

FiguresPrimary Option Menu . . . . . . . . . . . . . . . . . . . . . . . . . . . . . . . . . . . . . . . . . . . . . . . . . . . . 27Interactive Analysis Menu . . . . . . . . . . . . . . . . . . . . . . . . . . . . . . . . . . . . . . . . . . . . . . . . . 31User Information File Allocation panel . . . . . . . . . . . . . . . . . . . . . . . . . . . . . . . . . . . . . . 39Primary Option Menu . . . . . . . . . . . . . . . . . . . . . . . . . . . . . . . . . . . . . . . . . . . . . . . . . . . . 40TriTune Help pop-up panel . . . . . . . . . . . . . . . . . . . . . . . . . . . . . . . . . . . . . . . . . . . . . . . . 43Messages panel . . . . . . . . . . . . . . . . . . . . . . . . . . . . . . . . . . . . . . . . . . . . . . . . . . . . . . . . . . 45Print TriTune Messages screen . . . . . . . . . . . . . . . . . . . . . . . . . . . . . . . . . . . . . . . . . . . . . 46PF Key Definition panel . . . . . . . . . . . . . . . . . . . . . . . . . . . . . . . . . . . . . . . . . . . . . . . . . . . 47Autonavigation in the DelayView panel . . . . . . . . . . . . . . . . . . . . . . . . . . . . . . . . . . . . . 49DataView panel . . . . . . . . . . . . . . . . . . . . . . . . . . . . . . . . . . . . . . . . . . . . . . . . . . . . . . . . . . 50Data Set Details panel for UNBLOCK . . . . . . . . . . . . . . . . . . . . . . . . . . . . . . . . . . . . . . . 50TaskView panel with column totals . . . . . . . . . . . . . . . . . . . . . . . . . . . . . . . . . . . . . . . . . 51TaskView panel with column subtotals . . . . . . . . . . . . . . . . . . . . . . . . . . . . . . . . . . . . . . 52Unfiltered Active Jobs panel . . . . . . . . . . . . . . . . . . . . . . . . . . . . . . . . . . . . . . . . . . . . . . . 54Setting a filter for a field . . . . . . . . . . . . . . . . . . . . . . . . . . . . . . . . . . . . . . . . . . . . . . . . . . . 55Setting a filter for the Sysplex SysName field . . . . . . . . . . . . . . . . . . . . . . . . . . . . . . . . . 55Screen Customization panel . . . . . . . . . . . . . . . . . . . . . . . . . . . . . . . . . . . . . . . . . . . . . . . 57Confirm Screen Customization pop-up panel . . . . . . . . . . . . . . . . . . . . . . . . . . . . . . . . 59Screen Export Information panel . . . . . . . . . . . . . . . . . . . . . . . . . . . . . . . . . . . . . . . . . . . 60Screen report information panel . . . . . . . . . . . . . . . . . . . . . . . . . . . . . . . . . . . . . . . . . . . . 62Profile Parameters panel . . . . . . . . . . . . . . . . . . . . . . . . . . . . . . . . . . . . . . . . . . . . . . . . . . 68Monitor Definition panel . . . . . . . . . . . . . . . . . . . . . . . . . . . . . . . . . . . . . . . . . . . . . . . . . . 69Monitoring Criteria panel . . . . . . . . . . . . . . . . . . . . . . . . . . . . . . . . . . . . . . . . . . . . . . . . . 73Job Monitoring Criteria panel . . . . . . . . . . . . . . . . . . . . . . . . . . . . . . . . . . . . . . . . . . . . . . 78CICS Monitoring Criteria panel . . . . . . . . . . . . . . . . . . . . . . . . . . . . . . . . . . . . . . . . . . . . 81IMS Monitoring Criteria Panel . . . . . . . . . . . . . . . . . . . . . . . . . . . . . . . . . . . . . . . . . . . . . 82Adabas Monitoring Criteria panel . . . . . . . . . . . . . . . . . . . . . . . . . . . . . . . . . . . . . . . . . . 83Natural Monitoring Criteria panel . . . . . . . . . . . . . . . . . . . . . . . . . . . . . . . . . . . . . . . . . . 84CA-Datacom Monitoring Criteria panel . . . . . . . . . . . . . . . . . . . . . . . . . . . . . . . . . . . . . 85CA-Ideal Monitoring Criteria panel . . . . . . . . . . . . . . . . . . . . . . . . . . . . . . . . . . . . . . . . . 86WebSphere Application Server Monitoring Criteria panel . . . . . . . . . . . . . . . . . . . . . . 87Copy Profile pop-up panel . . . . . . . . . . . . . . . . . . . . . . . . . . . . . . . . . . . . . . . . . . . . . . . . 88Monitor Profile Groups panel . . . . . . . . . . . . . . . . . . . . . . . . . . . . . . . . . . . . . . . . . . . . . . 90Group Definition pop-up panel . . . . . . . . . . . . . . . . . . . . . . . . . . . . . . . . . . . . . . . . . . . . 91Group Monitor List panel . . . . . . . . . . . . . . . . . . . . . . . . . . . . . . . . . . . . . . . . . . . . . . . . . 92Group Monitor List panel after trigger command . . . . . . . . . . . . . . . . . . . . . . . . . . . . . 92Administration Option Menu . . . . . . . . . . . . . . . . . . . . . . . . . . . . . . . . . . . . . . . . . . . . . . 93Monitor Schedules panel . . . . . . . . . . . . . . . . . . . . . . . . . . . . . . . . . . . . . . . . . . . . . . . . . . 93Monitoring Scheduling Criteria panel . . . . . . . . . . . . . . . . . . . . . . . . . . . . . . . . . . . . . . . 94Monitoring Scheduling Criteria panel: example . . . . . . . . . . . . . . . . . . . . . . . . . . . . . . 96
Figures 11

Monitor Definition panel (invoking a monitor) . . . . . . . . . . . . . . . . . . . . . . . . . . . . . . 98Invoked Monitors panel . . . . . . . . . . . . . . . . . . . . . . . . . . . . . . . . . . . . . . . . . . . . . . . . . . 100Monitor History panel . . . . . . . . . . . . . . . . . . . . . . . . . . . . . . . . . . . . . . . . . . . . . . . . . . . 102Active Jobs panel . . . . . . . . . . . . . . . . . . . . . . . . . . . . . . . . . . . . . . . . . . . . . . . . . . . . . . . . 106Monitor Definition panel (starting interactive analysis) . . . . . . . . . . . . . . . . . . . . . . . 115Interactive Analysis menu . . . . . . . . . . . . . . . . . . . . . . . . . . . . . . . . . . . . . . . . . . . . . . . . 117Monitor OverView report (part 1 of 3) . . . . . . . . . . . . . . . . . . . . . . . . . . . . . . . . . . . . . . 123Monitor OverView report (part 2 of 3) . . . . . . . . . . . . . . . . . . . . . . . . . . . . . . . . . . . . . . 124Monitor OverView report (part 3 of 3) . . . . . . . . . . . . . . . . . . . . . . . . . . . . . . . . . . . . . . 131TaskView panel . . . . . . . . . . . . . . . . . . . . . . . . . . . . . . . . . . . . . . . . . . . . . . . . . . . . . . . . . 132CodeView Detail panel . . . . . . . . . . . . . . . . . . . . . . . . . . . . . . . . . . . . . . . . . . . . . . . . . . . 134DelayView detail panel . . . . . . . . . . . . . . . . . . . . . . . . . . . . . . . . . . . . . . . . . . . . . . . . . . . 135DelayView panel . . . . . . . . . . . . . . . . . . . . . . . . . . . . . . . . . . . . . . . . . . . . . . . . . . . . . . . . 136Delay Locations panel . . . . . . . . . . . . . . . . . . . . . . . . . . . . . . . . . . . . . . . . . . . . . . . . . . . . 138Delayed Resources panel . . . . . . . . . . . . . . . . . . . . . . . . . . . . . . . . . . . . . . . . . . . . . . . . . 140Data Set Details panel . . . . . . . . . . . . . . . . . . . . . . . . . . . . . . . . . . . . . . . . . . . . . . . . . . . . 141Delay Locations panel . . . . . . . . . . . . . . . . . . . . . . . . . . . . . . . . . . . . . . . . . . . . . . . . . . . . 142Delay Detail Data panel . . . . . . . . . . . . . . . . . . . . . . . . . . . . . . . . . . . . . . . . . . . . . . . . . . 142Callerid panel . . . . . . . . . . . . . . . . . . . . . . . . . . . . . . . . . . . . . . . . . . . . . . . . . . . . . . . . . . . 143TUNCOB01 program listing . . . . . . . . . . . . . . . . . . . . . . . . . . . . . . . . . . . . . . . . . . . . . . 144Module/CSECT Info panel . . . . . . . . . . . . . . . . . . . . . . . . . . . . . . . . . . . . . . . . . . . . . . . 145Delay distribution panel . . . . . . . . . . . . . . . . . . . . . . . . . . . . . . . . . . . . . . . . . . . . . . . . . . 145CodeView panel showing CSECTs with activity . . . . . . . . . . . . . . . . . . . . . . . . . . . . . 146Histogram panel showing TUNCOB01 CSECT
(group size 32 bytes) . . . . . . . . . . . . . . . . . . . . . . . . . . . . . . . . . . . . . . . . . . . . . . . . . . . 149Histogram panel showing TUNCOB01 CSECT (group size STMT) . . . . . . . . . . . . . 150TUNCOB01 listing . . . . . . . . . . . . . . . . . . . . . . . . . . . . . . . . . . . . . . . . . . . . . . . . . . . . . . . 151DelayView panel (TUNCOB01) . . . . . . . . . . . . . . . . . . . . . . . . . . . . . . . . . . . . . . . . . . . . 152Code Distribution panel . . . . . . . . . . . . . . . . . . . . . . . . . . . . . . . . . . . . . . . . . . . . . . . . . . 153TimeView panel . . . . . . . . . . . . . . . . . . . . . . . . . . . . . . . . . . . . . . . . . . . . . . . . . . . . . . . . . 154DataView panel . . . . . . . . . . . . . . . . . . . . . . . . . . . . . . . . . . . . . . . . . . . . . . . . . . . . . . . . . 156Data Set Details panel: non-VSAM data set . . . . . . . . . . . . . . . . . . . . . . . . . . . . . . . . . . 160Data Set Details panel: VSAM data set . . . . . . . . . . . . . . . . . . . . . . . . . . . . . . . . . . . . . . 162Data Set Details panel: volume information . . . . . . . . . . . . . . . . . . . . . . . . . . . . . . . . . 165TranView panel . . . . . . . . . . . . . . . . . . . . . . . . . . . . . . . . . . . . . . . . . . . . . . . . . . . . . . . . . 169CodeView Detail panel from TranView . . . . . . . . . . . . . . . . . . . . . . . . . . . . . . . . . . . . . 171DelayView Detail panel . . . . . . . . . . . . . . . . . . . . . . . . . . . . . . . . . . . . . . . . . . . . . . . . . . 172DataView Detail panel . . . . . . . . . . . . . . . . . . . . . . . . . . . . . . . . . . . . . . . . . . . . . . . . . . . 173ModView panel . . . . . . . . . . . . . . . . . . . . . . . . . . . . . . . . . . . . . . . . . . . . . . . . . . . . . . . . . 174Link Suggestions panel . . . . . . . . . . . . . . . . . . . . . . . . . . . . . . . . . . . . . . . . . . . . . . . . . . . 178PoolView for an IMS environment . . . . . . . . . . . . . . . . . . . . . . . . . . . . . . . . . . . . . . . . . 179USSView panel . . . . . . . . . . . . . . . . . . . . . . . . . . . . . . . . . . . . . . . . . . . . . . . . . . . . . . . . . . 181CodeView Detail panel from USSView . . . . . . . . . . . . . . . . . . . . . . . . . . . . . . . . . . . . . 182DelayView Detail panel . . . . . . . . . . . . . . . . . . . . . . . . . . . . . . . . . . . . . . . . . . . . . . . . . . 183USS Threads panel . . . . . . . . . . . . . . . . . . . . . . . . . . . . . . . . . . . . . . . . . . . . . . . . . . . . . . . 184Process Information panel . . . . . . . . . . . . . . . . . . . . . . . . . . . . . . . . . . . . . . . . . . . . . . . . 185USS Functions panel . . . . . . . . . . . . . . . . . . . . . . . . . . . . . . . . . . . . . . . . . . . . . . . . . . . . . 187Global Monitoring Menu . . . . . . . . . . . . . . . . . . . . . . . . . . . . . . . . . . . . . . . . . . . . . . . . . 190External Data Set List panel . . . . . . . . . . . . . . . . . . . . . . . . . . . . . . . . . . . . . . . . . . . . . . . 192
12 TriTune User Guide

Include Monitor Data Set panel . . . . . . . . . . . . . . . . . . . . . . . . . . . . . . . . . . . . . . . . . . . 194Monitor Profiles panel . . . . . . . . . . . . . . . . . . . . . . . . . . . . . . . . . . . . . . . . . . . . . . . . . . . 195Monitor History panel . . . . . . . . . . . . . . . . . . . . . . . . . . . . . . . . . . . . . . . . . . . . . . . . . . . 195External Data Set List panel after adding data sets . . . . . . . . . . . . . . . . . . . . . . . . . . . 196Manual Monitor Data Set Add panel . . . . . . . . . . . . . . . . . . . . . . . . . . . . . . . . . . . . . . . 196Administration Option Menu . . . . . . . . . . . . . . . . . . . . . . . . . . . . . . . . . . . . . . . . . . . . . 198Csect Associations panel . . . . . . . . . . . . . . . . . . . . . . . . . . . . . . . . . . . . . . . . . . . . . . . . . 200Csect Associations pop-up panel . . . . . . . . . . . . . . . . . . . . . . . . . . . . . . . . . . . . . . . . . . 201Pseudo Group Definitions panel . . . . . . . . . . . . . . . . . . . . . . . . . . . . . . . . . . . . . . . . . . . 202PSEUDO Group Definition panel (modifiable) . . . . . . . . . . . . . . . . . . . . . . . . . . . . . . 203CodeView panel in PSEUDO mode . . . . . . . . . . . . . . . . . . . . . . . . . . . . . . . . . . . . . . . . 204CodeView panel in MODULE mode . . . . . . . . . . . . . . . . . . . . . . . . . . . . . . . . . . . . . . . 205Content-sensitive Help panel . . . . . . . . . . . . . . . . . . . . . . . . . . . . . . . . . . . . . . . . . . . . . 206Content-sensitive Help text . . . . . . . . . . . . . . . . . . . . . . . . . . . . . . . . . . . . . . . . . . . . . . . 208Content Help Addition panel . . . . . . . . . . . . . . . . . . . . . . . . . . . . . . . . . . . . . . . . . . . . . 209Editing Help text . . . . . . . . . . . . . . . . . . . . . . . . . . . . . . . . . . . . . . . . . . . . . . . . . . . . . . . 212Content Help Addition panel . . . . . . . . . . . . . . . . . . . . . . . . . . . . . . . . . . . . . . . . . . . . . 213Using Tags to Format Help Text . . . . . . . . . . . . . . . . . . . . . . . . . . . . . . . . . . . . . . . . . . . 214Formatted Help Text . . . . . . . . . . . . . . . . . . . . . . . . . . . . . . . . . . . . . . . . . . . . . . . . . . . . . 215Content-sensitive Help panel with example . . . . . . . . . . . . . . . . . . . . . . . . . . . . . . . . . 215TriTune Environment panel . . . . . . . . . . . . . . . . . . . . . . . . . . . . . . . . . . . . . . . . . . . . . . . 216Program Listing Registration panel . . . . . . . . . . . . . . . . . . . . . . . . . . . . . . . . . . . . . . . . 221Registered COBOL Programs . . . . . . . . . . . . . . . . . . . . . . . . . . . . . . . . . . . . . . . . . . . . . 224COBOL Map Resolution in the PDS List Manager panel . . . . . . . . . . . . . . . . . . . . . . 225Member List panel . . . . . . . . . . . . . . . . . . . . . . . . . . . . . . . . . . . . . . . . . . . . . . . . . . . . . . 226COBOL Map Resolution in the DDIO List Manager panel . . . . . . . . . . . . . . . . . . . . 228Delay Locations showing statement number . . . . . . . . . . . . . . . . . . . . . . . . . . . . . . . . 228CodeView panel showing CSECTs with activity . . . . . . . . . . . . . . . . . . . . . . . . . . . . . 229Batch Report panel: top portion . . . . . . . . . . . . . . . . . . . . . . . . . . . . . . . . . . . . . . . . . . . 253Batch report panel: lower portion . . . . . . . . . . . . . . . . . . . . . . . . . . . . . . . . . . . . . . . . . . 254Analysis Summary Report . . . . . . . . . . . . . . . . . . . . . . . . . . . . . . . . . . . . . . . . . . . . . . . . 261Add Ins list . . . . . . . . . . . . . . . . . . . . . . . . . . . . . . . . . . . . . . . . . . . . . . . . . . . . . . . . . . . . . 264Excel menu with TriTune Add-In . . . . . . . . . . . . . . . . . . . . . . . . . . . . . . . . . . . . . . . . . . 264CSV Reporting Panel . . . . . . . . . . . . . . . . . . . . . . . . . . . . . . . . . . . . . . . . . . . . . . . . . . . . 266Select TriTune Report Dialog Box . . . . . . . . . . . . . . . . . . . . . . . . . . . . . . . . . . . . . . . . . . 267Conversion log . . . . . . . . . . . . . . . . . . . . . . . . . . . . . . . . . . . . . . . . . . . . . . . . . . . . . . . . . . 268Overview Report . . . . . . . . . . . . . . . . . . . . . . . . . . . . . . . . . . . . . . . . . . . . . . . . . . . . . . . . 269CodeView Report . . . . . . . . . . . . . . . . . . . . . . . . . . . . . . . . . . . . . . . . . . . . . . . . . . . . . . . 270DataView for a DB2 environment . . . . . . . . . . . . . . . . . . . . . . . . . . . . . . . . . . . . . . . . . . 284DB2 Statements panel selected from DataView panel . . . . . . . . . . . . . . . . . . . . . . . . . 285SQL Statements panel . . . . . . . . . . . . . . . . . . . . . . . . . . . . . . . . . . . . . . . . . . . . . . . . . . . . 292CodeView Detail panel for DB2 . . . . . . . . . . . . . . . . . . . . . . . . . . . . . . . . . . . . . . . . . . . 292Interactive Analysis panel: selection option 10 . . . . . . . . . . . . . . . . . . . . . . . . . . . . . . . 293DB2View panel (part 1 of 5) . . . . . . . . . . . . . . . . . . . . . . . . . . . . . . . . . . . . . . . . . . . . . . . 294DB2View panel (part 2 of 5) . . . . . . . . . . . . . . . . . . . . . . . . . . . . . . . . . . . . . . . . . . . . . . . 295DB2View panel (part 3 of 5) . . . . . . . . . . . . . . . . . . . . . . . . . . . . . . . . . . . . . . . . . . . . . . . 295DB2View panel (part 4 of 5) . . . . . . . . . . . . . . . . . . . . . . . . . . . . . . . . . . . . . . . . . . . . . . . 296DB2View panel (part 5 of 5) . . . . . . . . . . . . . . . . . . . . . . . . . . . . . . . . . . . . . . . . . . . . . . . 296Initial Explain results . . . . . . . . . . . . . . . . . . . . . . . . . . . . . . . . . . . . . . . . . . . . . . . . . . . . 307
Figures 13

Analyze+ Explain data . . . . . . . . . . . . . . . . . . . . . . . . . . . . . . . . . . . . . . . . . . . . . . . . . . . 307Sample BIND statements . . . . . . . . . . . . . . . . . . . . . . . . . . . . . . . . . . . . . . . . . . . . . . . . . 308DB2 Explain Data panel . . . . . . . . . . . . . . . . . . . . . . . . . . . . . . . . . . . . . . . . . . . . . . . . . . 310Rule Messages panel . . . . . . . . . . . . . . . . . . . . . . . . . . . . . . . . . . . . . . . . . . . . . . . . . . . . . 312DB2 Statement Detail panel . . . . . . . . . . . . . . . . . . . . . . . . . . . . . . . . . . . . . . . . . . . . . . . 313DB2 Long Name panel . . . . . . . . . . . . . . . . . . . . . . . . . . . . . . . . . . . . . . . . . . . . . . . . . . . 314DCL Statement panel . . . . . . . . . . . . . . . . . . . . . . . . . . . . . . . . . . . . . . . . . . . . . . . . . . . . 315TranView panel for CICS . . . . . . . . . . . . . . . . . . . . . . . . . . . . . . . . . . . . . . . . . . . . . . . . . 327PoolView . . . . . . . . . . . . . . . . . . . . . . . . . . . . . . . . . . . . . . . . . . . . . . . . . . . . . . . . . . . . . . . 330Shared Pools panel . . . . . . . . . . . . . . . . . . . . . . . . . . . . . . . . . . . . . . . . . . . . . . . . . . . . . . 330VSAM Pool Details panel . . . . . . . . . . . . . . . . . . . . . . . . . . . . . . . . . . . . . . . . . . . . . . . . . 331Pooled Data Sets panel . . . . . . . . . . . . . . . . . . . . . . . . . . . . . . . . . . . . . . . . . . . . . . . . . . . 332Interactive Analysis Panel: Selection Option 11 . . . . . . . . . . . . . . . . . . . . . . . . . . . . . . 340IMS TranNameView panel . . . . . . . . . . . . . . . . . . . . . . . . . . . . . . . . . . . . . . . . . . . . . . . . 341IMS Statements panel . . . . . . . . . . . . . . . . . . . . . . . . . . . . . . . . . . . . . . . . . . . . . . . . . . . . 342IMS Statements pane for ADDPART transaction . . . . . . . . . . . . . . . . . . . . . . . . . . . . . 343DataView for an IMS environment . . . . . . . . . . . . . . . . . . . . . . . . . . . . . . . . . . . . . . . . . 344Data Set Details for a VSAM data set . . . . . . . . . . . . . . . . . . . . . . . . . . . . . . . . . . . . . . . 345IMS Statements panel . . . . . . . . . . . . . . . . . . . . . . . . . . . . . . . . . . . . . . . . . . . . . . . . . . . . 347Segment Search Arguments panel . . . . . . . . . . . . . . . . . . . . . . . . . . . . . . . . . . . . . . . . . 348Hexadecimal value . . . . . . . . . . . . . . . . . . . . . . . . . . . . . . . . . . . . . . . . . . . . . . . . . . . . . . 348IMS Statements panel for DBDNAME mode . . . . . . . . . . . . . . . . . . . . . . . . . . . . . . . . 349PoolView for an IMS environment . . . . . . . . . . . . . . . . . . . . . . . . . . . . . . . . . . . . . . . . . 350Shared Pools panel (IMS) . . . . . . . . . . . . . . . . . . . . . . . . . . . . . . . . . . . . . . . . . . . . . . . . . 351VSAM Pool Details panel . . . . . . . . . . . . . . . . . . . . . . . . . . . . . . . . . . . . . . . . . . . . . . . . . 353Pooled Data Sets panel (IMS) . . . . . . . . . . . . . . . . . . . . . . . . . . . . . . . . . . . . . . . . . . . . . . 353Example of DelayView with Java Virtual Machine activity detected . . . . . . . . . . . . 358JVM Applications panel . . . . . . . . . . . . . . . . . . . . . . . . . . . . . . . . . . . . . . . . . . . . . . . . . . 359JVM Applications panel: Application mode . . . . . . . . . . . . . . . . . . . . . . . . . . . . . . . . . 361JVM Applications panel: Via mode . . . . . . . . . . . . . . . . . . . . . . . . . . . . . . . . . . . . . . . . . 361JVM Applications panel . . . . . . . . . . . . . . . . . . . . . . . . . . . . . . . . . . . . . . . . . . . . . . . . . . 362JVM Applications panel . . . . . . . . . . . . . . . . . . . . . . . . . . . . . . . . . . . . . . . . . . . . . . . . . . 363JVM Applications panel . . . . . . . . . . . . . . . . . . . . . . . . . . . . . . . . . . . . . . . . . . . . . . . . . . 364JVM Thread TCBs panel . . . . . . . . . . . . . . . . . . . . . . . . . . . . . . . . . . . . . . . . . . . . . . . . . . 365TranView panel for CICS . . . . . . . . . . . . . . . . . . . . . . . . . . . . . . . . . . . . . . . . . . . . . . . . . 366DelayView Detail panel . . . . . . . . . . . . . . . . . . . . . . . . . . . . . . . . . . . . . . . . . . . . . . . . . . 367JVM Applications panel . . . . . . . . . . . . . . . . . . . . . . . . . . . . . . . . . . . . . . . . . . . . . . . . . . 367Delay Locations Detail panel . . . . . . . . . . . . . . . . . . . . . . . . . . . . . . . . . . . . . . . . . . . . . . 368Long Name of the Java activity . . . . . . . . . . . . . . . . . . . . . . . . . . . . . . . . . . . . . . . . . . . . 368DelayView Panel . . . . . . . . . . . . . . . . . . . . . . . . . . . . . . . . . . . . . . . . . . . . . . . . . . . . . . . . 369Delay Locations Panel . . . . . . . . . . . . . . . . . . . . . . . . . . . . . . . . . . . . . . . . . . . . . . . . . . . . 370Long Name of the Java activity . . . . . . . . . . . . . . . . . . . . . . . . . . . . . . . . . . . . . . . . . . . . 370WebSphere Application Server Criteria panel without filters . . . . . . . . . . . . . . . . . . 374WebSphere Transactions panel without filtering . . . . . . . . . . . . . . . . . . . . . . . . . . . . . 374WebSphere Application Server Criteria panel with filter . . . . . . . . . . . . . . . . . . . . . . 375WebSphere Transactions panel after filtering . . . . . . . . . . . . . . . . . . . . . . . . . . . . . . . . 376Interactive Analysis panel: Option 13 . . . . . . . . . . . . . . . . . . . . . . . . . . . . . . . . . . . . . . . 377WebSphere transactions . . . . . . . . . . . . . . . . . . . . . . . . . . . . . . . . . . . . . . . . . . . . . . . . . . 378Transaction only mode . . . . . . . . . . . . . . . . . . . . . . . . . . . . . . . . . . . . . . . . . . . . . . . . . . . 379
14 TriTune User Guide

WebSphere class mode . . . . . . . . . . . . . . . . . . . . . . . . . . . . . . . . . . . . . . . . . . . . . . . . . . . 380WebSphere Classes panel . . . . . . . . . . . . . . . . . . . . . . . . . . . . . . . . . . . . . . . . . . . . . . . . . 381WebSphere Delays panel . . . . . . . . . . . . . . . . . . . . . . . . . . . . . . . . . . . . . . . . . . . . . . . . . 382WebSphere SQL Statements panel . . . . . . . . . . . . . . . . . . . . . . . . . . . . . . . . . . . . . . . . . 383All detected SQL statements . . . . . . . . . . . . . . . . . . . . . . . . . . . . . . . . . . . . . . . . . . . . . . 384WebSphere Transaction Detail panel . . . . . . . . . . . . . . . . . . . . . . . . . . . . . . . . . . . . . . . 384WebSphere environment . . . . . . . . . . . . . . . . . . . . . . . . . . . . . . . . . . . . . . . . . . . . . . . . . 385WebSphere garbage collection information . . . . . . . . . . . . . . . . . . . . . . . . . . . . . . . . . 385DelayView panel . . . . . . . . . . . . . . . . . . . . . . . . . . . . . . . . . . . . . . . . . . . . . . . . . . . . . . . . 388Queue Manager Activity panel . . . . . . . . . . . . . . . . . . . . . . . . . . . . . . . . . . . . . . . . . . . . 388Queue Manager Information panel . . . . . . . . . . . . . . . . . . . . . . . . . . . . . . . . . . . . . . . . 389CodeView Detail panel . . . . . . . . . . . . . . . . . . . . . . . . . . . . . . . . . . . . . . . . . . . . . . . . . . . 391Queue Activity panel . . . . . . . . . . . . . . . . . . . . . . . . . . . . . . . . . . . . . . . . . . . . . . . . . . . . 391Queue Information panel . . . . . . . . . . . . . . . . . . . . . . . . . . . . . . . . . . . . . . . . . . . . . . . . . 393CodeView Detail panel . . . . . . . . . . . . . . . . . . . . . . . . . . . . . . . . . . . . . . . . . . . . . . . . . . . 397Callerid Detail panel . . . . . . . . . . . . . . . . . . . . . . . . . . . . . . . . . . . . . . . . . . . . . . . . . . . . . 397DelayView panel . . . . . . . . . . . . . . . . . . . . . . . . . . . . . . . . . . . . . . . . . . . . . . . . . . . . . . . . 399SAP Activity panel . . . . . . . . . . . . . . . . . . . . . . . . . . . . . . . . . . . . . . . . . . . . . . . . . . . . . . 400SAP Information panel . . . . . . . . . . . . . . . . . . . . . . . . . . . . . . . . . . . . . . . . . . . . . . . . . . . 400ADABAS Statements panel . . . . . . . . . . . . . . . . . . . . . . . . . . . . . . . . . . . . . . . . . . . . . . . 404DATACOM Statements panel . . . . . . . . . . . . . . . . . . . . . . . . . . . . . . . . . . . . . . . . . . . . . 407CodeView panel with Natural . . . . . . . . . . . . . . . . . . . . . . . . . . . . . . . . . . . . . . . . . . . . 4094GL Histogram panel . . . . . . . . . . . . . . . . . . . . . . . . . . . . . . . . . . . . . . . . . . . . . . . . . . . . 410
Figures 15

16 TriTune User Guide
TablesInteractive Analysis menu options . . . . . . . . . . . . . . . . . . . . . . . . . . . . . . . . . . . . . . . . . . 31TriTune primary menu options . . . . . . . . . . . . . . . . . . . . . . . . . . . . . . . . . . . . . . . . . . . . . 41Screen customization capabilities . . . . . . . . . . . . . . . . . . . . . . . . . . . . . . . . . . . . . . . . . . . 58Screen export options . . . . . . . . . . . . . . . . . . . . . . . . . . . . . . . . . . . . . . . . . . . . . . . . . . . . . 61Screen report information input fields . . . . . . . . . . . . . . . . . . . . . . . . . . . . . . . . . . . . . . . 62Parameter for SETPARM command . . . . . . . . . . . . . . . . . . . . . . . . . . . . . . . . . . . . . . . . . 64Monitor definition commands . . . . . . . . . . . . . . . . . . . . . . . . . . . . . . . . . . . . . . . . . . . . . 69Monitor Definition fields . . . . . . . . . . . . . . . . . . . . . . . . . . . . . . . . . . . . . . . . . . . . . . . . . . 70Monitoring Criteria fields . . . . . . . . . . . . . . . . . . . . . . . . . . . . . . . . . . . . . . . . . . . . . . . . . 73Additional monitoring criteria fields . . . . . . . . . . . . . . . . . . . . . . . . . . . . . . . . . . . . . . . . 79CICS Monitoring Criteria fields . . . . . . . . . . . . . . . . . . . . . . . . . . . . . . . . . . . . . . . . . . . . 81IMS Monitoring Criteria fields . . . . . . . . . . . . . . . . . . . . . . . . . . . . . . . . . . . . . . . . . . . . . 82Monitor Profile Groups fields . . . . . . . . . . . . . . . . . . . . . . . . . . . . . . . . . . . . . . . . . . . . . . 90Monitor Schedules fields . . . . . . . . . . . . . . . . . . . . . . . . . . . . . . . . . . . . . . . . . . . . . . . . . . 94Monitoring Scheduling Criteria fields . . . . . . . . . . . . . . . . . . . . . . . . . . . . . . . . . . . . . . . 95Monitor History panel fields . . . . . . . . . . . . . . . . . . . . . . . . . . . . . . . . . . . . . . . . . . . . . . 102Monitor history commands . . . . . . . . . . . . . . . . . . . . . . . . . . . . . . . . . . . . . . . . . . . . . . . 105Active jobs fields . . . . . . . . . . . . . . . . . . . . . . . . . . . . . . . . . . . . . . . . . . . . . . . . . . . . . . . . 107Monitor definition line commands for data analysis . . . . . . . . . . . . . . . . . . . . . . . . . . 116Interactive analysis options . . . . . . . . . . . . . . . . . . . . . . . . . . . . . . . . . . . . . . . . . . . . . . . 118Monitor OverView fields to check . . . . . . . . . . . . . . . . . . . . . . . . . . . . . . . . . . . . . . . . . 125Monitor OverView fields . . . . . . . . . . . . . . . . . . . . . . . . . . . . . . . . . . . . . . . . . . . . . . . . . 126TaskView commands . . . . . . . . . . . . . . . . . . . . . . . . . . . . . . . . . . . . . . . . . . . . . . . . . . . . 132TaskView fields . . . . . . . . . . . . . . . . . . . . . . . . . . . . . . . . . . . . . . . . . . . . . . . . . . . . . . . . . 133DelayView commands . . . . . . . . . . . . . . . . . . . . . . . . . . . . . . . . . . . . . . . . . . . . . . . . . . . 136DelayView fields . . . . . . . . . . . . . . . . . . . . . . . . . . . . . . . . . . . . . . . . . . . . . . . . . . . . . . . . 137Delay locations commands . . . . . . . . . . . . . . . . . . . . . . . . . . . . . . . . . . . . . . . . . . . . . . . 139Delay locations fields . . . . . . . . . . . . . . . . . . . . . . . . . . . . . . . . . . . . . . . . . . . . . . . . . . . . 139Delayed Resources fields . . . . . . . . . . . . . . . . . . . . . . . . . . . . . . . . . . . . . . . . . . . . . . . . . 140CodeView commands . . . . . . . . . . . . . . . . . . . . . . . . . . . . . . . . . . . . . . . . . . . . . . . . . . . . 147CodeView fields . . . . . . . . . . . . . . . . . . . . . . . . . . . . . . . . . . . . . . . . . . . . . . . . . . . . . . . . 148TimeView commands . . . . . . . . . . . . . . . . . . . . . . . . . . . . . . . . . . . . . . . . . . . . . . . . . . . . 154TimeView fields . . . . . . . . . . . . . . . . . . . . . . . . . . . . . . . . . . . . . . . . . . . . . . . . . . . . . . . . . 155DataView fields . . . . . . . . . . . . . . . . . . . . . . . . . . . . . . . . . . . . . . . . . . . . . . . . . . . . . . . . . 157Data Set Details panel fields: non-VSAM data set . . . . . . . . . . . . . . . . . . . . . . . . . . . . 160Data set performance fields: VSAM data sets . . . . . . . . . . . . . . . . . . . . . . . . . . . . . . . . 162Data Set Details fields: volume Information . . . . . . . . . . . . . . . . . . . . . . . . . . . . . . . . . 166Application DD names . . . . . . . . . . . . . . . . . . . . . . . . . . . . . . . . . . . . . . . . . . . . . . . . . . . 168TranView commands . . . . . . . . . . . . . . . . . . . . . . . . . . . . . . . . . . . . . . . . . . . . . . . . . . . . 169TranView fields . . . . . . . . . . . . . . . . . . . . . . . . . . . . . . . . . . . . . . . . . . . . . . . . . . . . . . . . . 170
Tables 17

ModView commands . . . . . . . . . . . . . . . . . . . . . . . . . . . . . . . . . . . . . . . . . . . . . . . . . . . . 174ModView fields . . . . . . . . . . . . . . . . . . . . . . . . . . . . . . . . . . . . . . . . . . . . . . . . . . . . . . . . . 175Link suggestions fields . . . . . . . . . . . . . . . . . . . . . . . . . . . . . . . . . . . . . . . . . . . . . . . . . . . 178PoolView fields . . . . . . . . . . . . . . . . . . . . . . . . . . . . . . . . . . . . . . . . . . . . . . . . . . . . . . . . . 180USSView commands . . . . . . . . . . . . . . . . . . . . . . . . . . . . . . . . . . . . . . . . . . . . . . . . . . . . . 181USSView fields . . . . . . . . . . . . . . . . . . . . . . . . . . . . . . . . . . . . . . . . . . . . . . . . . . . . . . . . . . 182USSView Threads commands . . . . . . . . . . . . . . . . . . . . . . . . . . . . . . . . . . . . . . . . . . . . . 184USSView Threads fields . . . . . . . . . . . . . . . . . . . . . . . . . . . . . . . . . . . . . . . . . . . . . . . . . . 184Process Information commands . . . . . . . . . . . . . . . . . . . . . . . . . . . . . . . . . . . . . . . . . . . 185Process Information fields . . . . . . . . . . . . . . . . . . . . . . . . . . . . . . . . . . . . . . . . . . . . . . . . 185USS Functions commands . . . . . . . . . . . . . . . . . . . . . . . . . . . . . . . . . . . . . . . . . . . . . . . . 187USSView Functions Fields . . . . . . . . . . . . . . . . . . . . . . . . . . . . . . . . . . . . . . . . . . . . . . . . 187TriTune Global Monitoring Menu options . . . . . . . . . . . . . . . . . . . . . . . . . . . . . . . . . . . 190External Data Set List panel fields . . . . . . . . . . . . . . . . . . . . . . . . . . . . . . . . . . . . . . . . . . 193TriTune Administration Option Menu panel . . . . . . . . . . . . . . . . . . . . . . . . . . . . . . . . . 199Content-sensitive Help line commands . . . . . . . . . . . . . . . . . . . . . . . . . . . . . . . . . . . . . 206Content-sensitive Help panel fields . . . . . . . . . . . . . . . . . . . . . . . . . . . . . . . . . . . . . . . . 207Tags available for writing content-sensitive Help . . . . . . . . . . . . . . . . . . . . . . . . . . . . 212TriTune Information on the TriTune Environment panel . . . . . . . . . . . . . . . . . . . . . . . 217Compiler options required for program registration . . . . . . . . . . . . . . . . . . . . . . . . . . 219Registered Listings panel commands . . . . . . . . . . . . . . . . . . . . . . . . . . . . . . . . . . . . . . . 224Registered Listings panel fields . . . . . . . . . . . . . . . . . . . . . . . . . . . . . . . . . . . . . . . . . . . . 225Member List panel fields . . . . . . . . . . . . . . . . . . . . . . . . . . . . . . . . . . . . . . . . . . . . . . . . . 226TUNCALL syntax . . . . . . . . . . . . . . . . . . . . . . . . . . . . . . . . . . . . . . . . . . . . . . . . . . . . . . . 234Valid keywords for MONITOR INVOKE . . . . . . . . . . . . . . . . . . . . . . . . . . . . . . . . . . . 237Valid keywords for MONITOR CANCEL . . . . . . . . . . . . . . . . . . . . . . . . . . . . . . . . . . . 244Valid keywords for MONITOR STATUS . . . . . . . . . . . . . . . . . . . . . . . . . . . . . . . . . . . . 245Return codes . . . . . . . . . . . . . . . . . . . . . . . . . . . . . . . . . . . . . . . . . . . . . . . . . . . . . . . . . . . . 247Return and reason codes . . . . . . . . . . . . . . . . . . . . . . . . . . . . . . . . . . . . . . . . . . . . . . . . . . 248Report Definition fields . . . . . . . . . . . . . . . . . . . . . . . . . . . . . . . . . . . . . . . . . . . . . . . . . . 254Overview of delay categories . . . . . . . . . . . . . . . . . . . . . . . . . . . . . . . . . . . . . . . . . . . . . . 274Program active . . . . . . . . . . . . . . . . . . . . . . . . . . . . . . . . . . . . . . . . . . . . . . . . . . . . . . . . . . 276Voluntary Wait . . . . . . . . . . . . . . . . . . . . . . . . . . . . . . . . . . . . . . . . . . . . . . . . . . . . . . . . . . 276Abend procedure . . . . . . . . . . . . . . . . . . . . . . . . . . . . . . . . . . . . . . . . . . . . . . . . . . . . . . . . 277Data delay . . . . . . . . . . . . . . . . . . . . . . . . . . . . . . . . . . . . . . . . . . . . . . . . . . . . . . . . . . . . . . 277Resource conflict delays . . . . . . . . . . . . . . . . . . . . . . . . . . . . . . . . . . . . . . . . . . . . . . . . . . 279System active delays . . . . . . . . . . . . . . . . . . . . . . . . . . . . . . . . . . . . . . . . . . . . . . . . . . . . . 280File management delay . . . . . . . . . . . . . . . . . . . . . . . . . . . . . . . . . . . . . . . . . . . . . . . . . . . 281Program load delay . . . . . . . . . . . . . . . . . . . . . . . . . . . . . . . . . . . . . . . . . . . . . . . . . . . . . . 281DASD management delay . . . . . . . . . . . . . . . . . . . . . . . . . . . . . . . . . . . . . . . . . . . . . . . . 282Other delays . . . . . . . . . . . . . . . . . . . . . . . . . . . . . . . . . . . . . . . . . . . . . . . . . . . . . . . . . . . . 282DB2 Statements fields . . . . . . . . . . . . . . . . . . . . . . . . . . . . . . . . . . . . . . . . . . . . . . . . . . . . 286DB2 Statements line commands . . . . . . . . . . . . . . . . . . . . . . . . . . . . . . . . . . . . . . . . . . . 290DB2View fields . . . . . . . . . . . . . . . . . . . . . . . . . . . . . . . . . . . . . . . . . . . . . . . . . . . . . . . . . . 298DB2View commands . . . . . . . . . . . . . . . . . . . . . . . . . . . . . . . . . . . . . . . . . . . . . . . . . . . . . 302DB2 SQL problems . . . . . . . . . . . . . . . . . . . . . . . . . . . . . . . . . . . . . . . . . . . . . . . . . . . . . . 311DB2 sampling, intercept, and flag settings in TUNSSP00 . . . . . . . . . . . . . . . . . . . . . . 317TranView fields . . . . . . . . . . . . . . . . . . . . . . . . . . . . . . . . . . . . . . . . . . . . . . . . . . . . . . . . . 328Pooled Data Sets fields . . . . . . . . . . . . . . . . . . . . . . . . . . . . . . . . . . . . . . . . . . . . . . . . . . . 332
18 TriTune User Guide

Overview of CICS delay categories . . . . . . . . . . . . . . . . . . . . . . . . . . . . . . . . . . . . . . . . 333CICS System Active . . . . . . . . . . . . . . . . . . . . . . . . . . . . . . . . . . . . . . . . . . . . . . . . . . . . . 334CICS transient data . . . . . . . . . . . . . . . . . . . . . . . . . . . . . . . . . . . . . . . . . . . . . . . . . . . . . . 334CICS storage control . . . . . . . . . . . . . . . . . . . . . . . . . . . . . . . . . . . . . . . . . . . . . . . . . . . . . 335CICS file control . . . . . . . . . . . . . . . . . . . . . . . . . . . . . . . . . . . . . . . . . . . . . . . . . . . . . . . . 335CICS journal control . . . . . . . . . . . . . . . . . . . . . . . . . . . . . . . . . . . . . . . . . . . . . . . . . . . . . 336CICS temporary storage . . . . . . . . . . . . . . . . . . . . . . . . . . . . . . . . . . . . . . . . . . . . . . . . . . 337CICS Program Control . . . . . . . . . . . . . . . . . . . . . . . . . . . . . . . . . . . . . . . . . . . . . . . . . . . 337CICS terminal control . . . . . . . . . . . . . . . . . . . . . . . . . . . . . . . . . . . . . . . . . . . . . . . . . . . . 338CICS DL/I resources . . . . . . . . . . . . . . . . . . . . . . . . . . . . . . . . . . . . . . . . . . . . . . . . . . . . . 338IMS TranNameView panel fields . . . . . . . . . . . . . . . . . . . . . . . . . . . . . . . . . . . . . . . . . . 341Data Set Details fields . . . . . . . . . . . . . . . . . . . . . . . . . . . . . . . . . . . . . . . . . . . . . . . . . . . . 345IMS Statements fields . . . . . . . . . . . . . . . . . . . . . . . . . . . . . . . . . . . . . . . . . . . . . . . . . . . . 349PoolView fields . . . . . . . . . . . . . . . . . . . . . . . . . . . . . . . . . . . . . . . . . . . . . . . . . . . . . . . . . 350Shared Pools panel fields . . . . . . . . . . . . . . . . . . . . . . . . . . . . . . . . . . . . . . . . . . . . . . . . . 351TranView Pooled Data Sets fields . . . . . . . . . . . . . . . . . . . . . . . . . . . . . . . . . . . . . . . . . . 353IMS region types . . . . . . . . . . . . . . . . . . . . . . . . . . . . . . . . . . . . . . . . . . . . . . . . . . . . . . . . 354JVM Applications panel fields . . . . . . . . . . . . . . . . . . . . . . . . . . . . . . . . . . . . . . . . . . . . 359JVM Applications panel commands . . . . . . . . . . . . . . . . . . . . . . . . . . . . . . . . . . . . . . . . 360JVM Applications panel commands . . . . . . . . . . . . . . . . . . . . . . . . . . . . . . . . . . . . . . . . 362JVM Methods panel commands . . . . . . . . . . . . . . . . . . . . . . . . . . . . . . . . . . . . . . . . . . . 364JVM Thread TCBs panel commands . . . . . . . . . . . . . . . . . . . . . . . . . . . . . . . . . . . . . . . 365WebSphere Transactions panel fields . . . . . . . . . . . . . . . . . . . . . . . . . . . . . . . . . . . . . . . 378Queue Manager Activity fields . . . . . . . . . . . . . . . . . . . . . . . . . . . . . . . . . . . . . . . . . . . . 389Queue Manager Information panel fields . . . . . . . . . . . . . . . . . . . . . . . . . . . . . . . . . . . 390Queue Activity panel fields . . . . . . . . . . . . . . . . . . . . . . . . . . . . . . . . . . . . . . . . . . . . . . . 392Queue Information panel fields . . . . . . . . . . . . . . . . . . . . . . . . . . . . . . . . . . . . . . . . . . . 393SAP Activity fields . . . . . . . . . . . . . . . . . . . . . . . . . . . . . . . . . . . . . . . . . . . . . . . . . . . . . . 400SAP Information panel fields . . . . . . . . . . . . . . . . . . . . . . . . . . . . . . . . . . . . . . . . . . . . . 401Adabas Statements fields . . . . . . . . . . . . . . . . . . . . . . . . . . . . . . . . . . . . . . . . . . . . . . . . . 405CA-DATACOM Statements fields . . . . . . . . . . . . . . . . . . . . . . . . . . . . . . . . . . . . . . . . . 4084GL Histogram fields . . . . . . . . . . . . . . . . . . . . . . . . . . . . . . . . . . . . . . . . . . . . . . . . . . . . 410
Tables 19

20 TriTune User Guide

About this bookThis book contains detailed information about the TriTune product (formerly known as InTune) and is intended for application and system programmers and administrators responsible for improving or evaluating the efficiency of batch processing programs and online subsystem applications.
This comprehensive manual includes instructions for the operation of TriTune, which is used to analyze the performance of application programs.
NOTE This book assumes that you are familiar with your host operating system.
About this book 21

How this book is organized
How this book is organizedThis book is organized as follows. In addition, a glossary of terms and an index appear at the end of the book.
Chapter/Appendix Description
Chapter 1, “Introduction to TriTune” introduces you to TriTune and describes its features and capabilities
Chapter 2, “Working in the TriTune environment”
explains the TriTune ISPF interface and how to use the features of TriTune to obtain the best results
Chapter 3, “Setting up a monitor definition”
describes how to define the criteria that is used by TriTune for observing and sampling applications
Chapter 4, “Invoking a monitor” describes how to start a monitor session to collect performance data for an application, including an active job
Chapter 5, “Analyzing monitor data” describes all of the online analysis options available with TriTune
Chapter 6, “Using additional features of TriTune”
describes how to analyze monitor data sets created by other users, register program listings, define CSECT functions, define Pseudo Groups, and use content-sensitive Help
Chapter 7, “TriTune Open Application Program Interface”
describes how to define and invoke monitors from within a program or by using TSO commands and batch jobs
Chapter 8, “Generating TriTune batch reports”
describes how to define and create TriTune batch reports and Microsoft Excel spreadsheets
Chapter 9, “Using TriTune to tune your applications”
describes each delay category and explains the reasons for specific types of program delays
Chapter 10, “Using TriTune in a DB2 environment”
contains specific information about using TriTune in a DB2 environment
Chapter 11, “Using TriTune in a CICS environment”
contains specific information about using TriTune in a CICS environment
Chapter 12, “Using TriTune in an IMS environment”
contains specific information about using TriTune in an IMS environment
Chapter 13, “Using TriTune in a Java Virtual Machine (JVM) environment”
contains specific information about using TriTune in the Java Virtual Machine (JVM) environment
Chapter 15, “Using TriTune in a WebSphere for MQ environment”
contains specific information about using TriTune in an WebSphere MQ environment
Chapter 16, “Using TriTune in an SAP environment”
contains specific information about using TriTune in an SAP environment
Chapter 17, “Using TriTune with other databases”
contains specific information about using TriTune with Adabas, Natural, and CA-Datacom applications
22 TriTune User Guide

Related documentation
Related documentationWhen installing and maintaining TriTune, refer to the TriTune Installation and Customization Guide.
For information about TriTune messages, see the TriTune Messages manual.
View or download documentation
Updated guides for this product are available at http://supportconnect.ca.com. If this is the first time visiting SupportConnect, under My Login, click New User? Enroll Now.
To view or download documentation, log in to SupportConnect and then, in the left-hand column under Downloads, click Documentation.
Access online Help
The TriTune product also includes online Help. In the TriTune interface, you can access Help by pressing F1 from any ISPF panel.
About this book 23

Conventions
ConventionsThis book uses the following general conventions:
The following syntax notation is used in this manual. Do not enter the special characters.
■ Brackets, [ ], enclose optional parameters or keywords.■ Braces, { }, enclose a list of parameters; one must be chosen.■ A vertical line, |, separates alternative options; one can be chosen.■ An italicized or underlined parameter is the default.■ AN ITEM IN CAPITAL LETTERS must be entered exactly as shown.■ Items in lowercase letters are values you supply.
This book uses the following types of special text:
NOTE Notes contain important information that you should consider.
WARNING Warnings alert you to situations that could cause problems, such as loss of data, if you do not follow instructions carefully.
TIP Tips contain information that might improve product performance or that might make procedures easier to follow.
24 TriTune User Guide

C h a p t e r 1
1 Introduction to TriTuneThis chapter provides an overview of TriTune. The following topics are discussed:
What TriTune is. . . . . . . . . . . . . . . . . . . . . . . . . . . . . . . . . . . . . . . . . . . . . . . . . . . . . . . . . . . 25Using TriTune for application tuning . . . . . . . . . . . . . . . . . . . . . . . . . . . . . . . . . . . . . 26
Using the TriTune interface. . . . . . . . . . . . . . . . . . . . . . . . . . . . . . . . . . . . . . . . . . . . . . . . . 26Using the online tutorial. . . . . . . . . . . . . . . . . . . . . . . . . . . . . . . . . . . . . . . . . . . . . . . . 27
Working with TriTune . . . . . . . . . . . . . . . . . . . . . . . . . . . . . . . . . . . . . . . . . . . . . . . . . . . . . 27Describing basic tasks in TriTune. . . . . . . . . . . . . . . . . . . . . . . . . . . . . . . . . . . . . . . . . . . . 28
Creating monitor definitions . . . . . . . . . . . . . . . . . . . . . . . . . . . . . . . . . . . . . . . . . . . . 28Invoking a monitor . . . . . . . . . . . . . . . . . . . . . . . . . . . . . . . . . . . . . . . . . . . . . . . . . . . . 29Analyzing monitor data . . . . . . . . . . . . . . . . . . . . . . . . . . . . . . . . . . . . . . . . . . . . . . . . 29
Describing the Interactive Analysis menu options . . . . . . . . . . . . . . . . . . . . . . . . . . . . . 31Describing other features of TriTune . . . . . . . . . . . . . . . . . . . . . . . . . . . . . . . . . . . . . . . . . 33
What TriTune isTriTune is an AQM Solutions product that identifies application performance delays and utilization.
TriTune monitors application programs to pinpoint delays. It observes and samples program activity, showing you the application’s view of performance. TriTune presents detailed application-specific delay information, allowing you to improve the performance of your application.
From a single program–monitoring session, TriTune can answer questions for the application programmer, systems programmer, and database administrator. This ability saves time and reduces machine resources that are used in resolving program bottlenecks or delays.
Chapter 1 Introduction to TriTune 25

Using the TriTune interface
Using TriTune for application tuning
Application tuning is the process of analyzing and adjusting the performance of an application with the goal of maximizing efficiency and effectiveness. By focusing on the major causes of delay associated with an application, TriTune leads you to the best solutions for your worst problems. Consider the following reasons for tuning your applications:
■ to improve the success of a business
■ to meet increasing performance demands
■ to reduce costly, highly-visible delays due to inefficient applications
■ to evaluate applications under development and compare third-party software
■ to identify the source of batch, CICS, DB2, and IMS loops and waits
■ to plan and position for a shrinking batch timeframe
This book includes several chapters devoted to aiding the user with specific application–tuning issues.
Using the TriTune interfaceTriTune uses an easy-to-understand ISPF interface called the TriTune TSO Client. The TSO Client consists of a series of panels. Each panel is designed to link to the next logical panel, enabling you to focus on finding straightforward answers to performance questions. When TriTune is invoked, the first panel you see is the Primary Option Menu (Figure 1 on page 27).
26 TriTune User Guide

Working with TriTune
Figure 1 Primary Option Menu
Chapter 2, “Working in the TriTune environment” describes the Primary Option Menu in detail, as well as how to use other aspects of the TriTune interface.
Using the online tutorial
TriTune contains an online tutorial that guides you through the main features of TriTune, including the process of setting up a monitor and analyzing the resulting data to help solve performance problems. AQM Solutions recommends that you view this tutorial before using TriTune for the first time. Select Option T from the Primary Option Menu to begin the tutorial.
Working with TriTuneThe TriTune Server Space, a multi-address space structure, provides for noninvasive observation and sampling of the target application address space. Monitor sessions are defined and analyzed by using the TSO Client.
TriTune observes and samples the target application by using a DIE/SRB routine to determine which program is running for each task, where the program is executing, and if and why it is waiting. Samples are written to a file for later analysis, along with CSECT, STEPLIB, LINKLIB, and other information related to the job.
See the TriTune Installation and Customization Guide for a detailed description of the internal operation of TriTune.
TriTune ---------------------- Primary Option Menu -------------------------OPTION ===>
0 Parameters - Enter user-specific parameters Userid: TUNUSER Server ID: TRITUNE 1 Monitor - Create and analyze Monitor Sets Status: ACTIVE Release: 4.0.00 2 Active - Select an active job to monitor 3 Registration - Register source listings 4 Grouping - Define groups of monitors 5 External - Analyze other user's monitor files
S Status - Display and manage invoked monitors G Global - Global monitoring and listing registration A Administration - TriTune system administration M Messages - List TriTune messages T Tutorial - TriTune tutorial
Copyright 2006Enter an option or press END to exit Trilog Service AG.
TriTune is an internationally registered trademark of Trilog Holding AG.
Chapter 1 Introduction to TriTune 27

Describing basic tasks in TriTune
Describing basic tasks in TriTuneYou can perform the following tasks with TriTune:
■ creating monitor definitions■ invoking a monitor■ analyzing monitor data
Creating monitor definitions
A monitor definition is the set of information that TriTune uses when taking observations and sampling an application. A monitor definition is identified by its profile name. You create a monitor definition by specifying a set of monitoring criteria. Monitoring criteria include
■ a description of the monitor
■ whether a batch report is generated
■ the job name of the target application
■ the system on which the target is running
■ the job step, procedure step, and program name to monitor
■ the duration, number of observations, start delay, and time range of the monitor
■ the schedule for the monitor
■ multiple monitoring sessions for a single execution of a job step
■ the number of times a job step is monitored
■ the names of the multiple job steps to be monitored
■ environment-specific information involving CICS, IMS, ADABAS, DB2, Natural, CA-Ideal, and CA-Datacom
Chapter 3, “Setting up a monitor definition” describes in detail how to set up and use monitor definitions.
28 TriTune User Guide

Describing basic tasks in TriTune
Invoking a monitor
When you invoke a monitor, you use the specified criteria to start the observation and sampling of the target application. A monitor request is passed to the TriTune Server Space. The TriTune Server Space manages pending and active monitor sessions. See the TriTune Installation and Customization Guide for a detailed description of how the TriTune Server Space monitors an application.
A monitor can be invoked in one of the following ways:
■ by invoking a monitor definition for managed or scheduled monitor■ by choosing a job which is actively running for immediate results■ by invoking a monitor from outside the TSO Client for automated operations
Chapter 4, “Invoking a monitor” and Chapter 7, “TriTune Open Application Program Interface” describe how to start a monitor session.
Analyzing monitor data
After the monitor has completed, sample data that has been stored in the monitor data can be analyzed. The monitor data set is pointed to by either the User Information File (UIF) or the Global Information File (GIF). The Interactive Analysis Facility formats this data into a set of panels that displays the information in a format that you can use to solve performance problems.
Using TriTune report results
TriTune reports delay information as percentages of the total monitored period. Program activity is divided between active and wait states, where the delay related to a particular module is shown as a percentage of the monitored period when the module was actively using a CPU and when it was waiting for a CPU. The combined percentage is also reported.
Using Autonavigation
The Autonavigation feature helps you find the information you are looking for quickly and directly. By placing the cursor on an item in a display panel and pressing Enter, the next most logical panel is displayed, based on the selected content. See “Using Autonavigation” on page 49 for more information.
Chapter 1 Introduction to TriTune 29

Describing basic tasks in TriTune
Understanding different analysis types
You can choose to display monitor results in one of several ways:
■ Analyze Normal - Information that is not directly related to the target application is eliminated. Data is reported as follows:
— Samples related to delay categories such as Waiting for CPU, LPAR delay, and Swap delay are omitted from reports.
— DelayView, TimeView, DataView, and ModView show all relevant delays for the application. All relevant samples for both Active and Wait are reported.
— CodeView and related histograms report only active samples that emphasize the most CPU-intensive portions of the program code. Wait samples, which can mask this activity, are not included.
■ Analyze All - Percentages are calculated based on all samples. This data allows you to compare delays occurring when the program is executing in both active and wait states.
■ Analyze Active - Percentages are calculated based on samples where the program was actively using CPU. Samples that contain only wait information are filtered out, which allows you to make normalized CPU comparisons of program activity.
■ Analyze Wait - Percentages are calculated based on samples where the program was in a wait state. Samples that contain only active information are filtered out, which allows you to make normalized comparisons of program wait activity.
For more information about the Interactive Analysis Facility, see Chapter 5, “Analyzing monitor data.”
TriTune can produce batch reports based on this data. For more information about producing batch reports, see Chapter 8, “Generating TriTune batch reports.”
30 TriTune User Guide

Describing the Interactive Analysis menu options
Describing the Interactive Analysis menu options
After you have specified an analysis option for a monitor definition, TriTune loads the data and displays the Interactive Analysis menu (Figure 2). Each option on this menu displays the data from a different perspective.
Figure 2 Interactive Analysis Menu
Table 1 briefly describes these menu options.
TriTune --------------------- Interactive Analysis ----------------------------OPTION ===>
Enter option to analyze the monitored job: Profile: DB2LONG1 Options: NORMAL TriTune Monitor Information Subsystem Details ------------------------------------------- ------------------------------ 0 OverView - Monitor session information 10 DB2 - View all SQL 1 TaskView - Activity by task 11 IMS - IMS Transactions 2 DelayView - Program delays 12 JVM - Java Virtual Machine 3 CodeView - Program activity 13 WAS - WebSphere App Server 4 TimeView - Samples by time 5 DataView - Dataset information 6 TranView - Activity by transaction 7 ModView - Module layout 8 PoolView - Buffer pools 9 USSView - Unix System Services Press END to exit analysis
Table 1 Interactive Analysis menu options (part 1 of 3)
Option Description
OverView option 0 displays information about the monitoring process, as well as key global statistics about the monitored application
These statistics can help you determine the next most logical panel to display as you continue your analysis effort.
TaskView option 1 displays information about the performance of each z/OS task in the monitored address space
If you select a task, TriTune recomputes the values by using only samples from the selected task on all subsequent screens that you display, which enables you to focus on the performance of that task.
Chapter 1 Introduction to TriTune 31
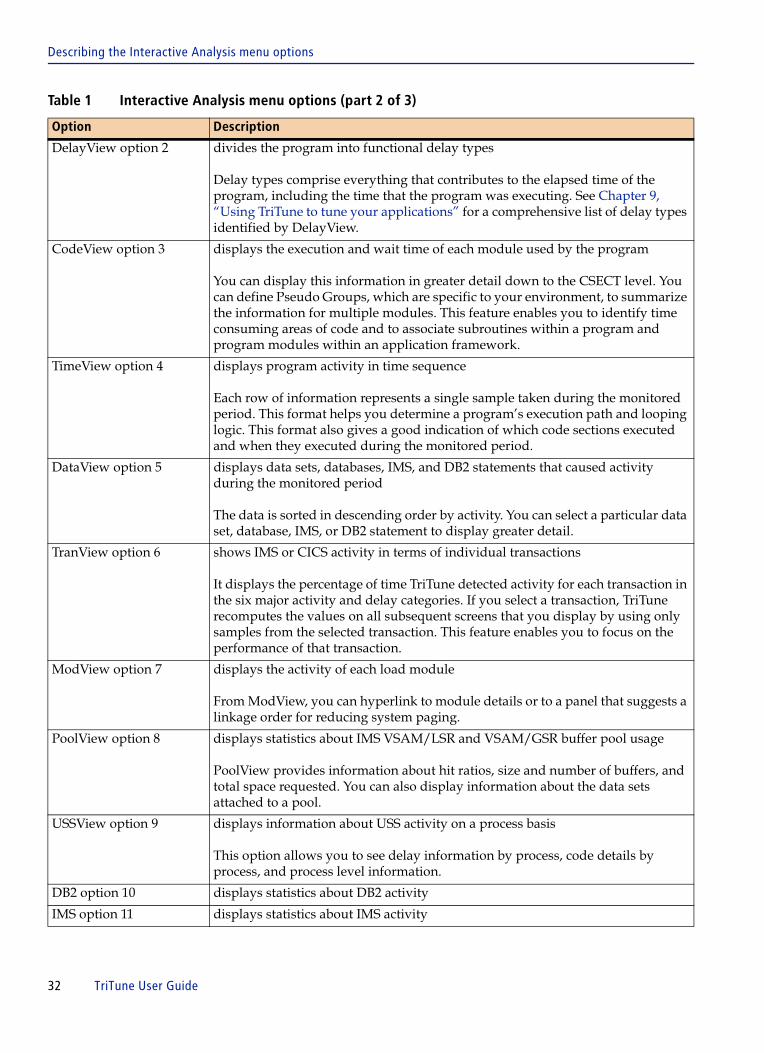
Describing the Interactive Analysis menu options
DelayView option 2 divides the program into functional delay types
Delay types comprise everything that contributes to the elapsed time of the program, including the time that the program was executing. See Chapter 9, “Using TriTune to tune your applications” for a comprehensive list of delay types identified by DelayView.
CodeView option 3 displays the execution and wait time of each module used by the program
You can display this information in greater detail down to the CSECT level. You can define Pseudo Groups, which are specific to your environment, to summarize the information for multiple modules. This feature enables you to identify time consuming areas of code and to associate subroutines within a program and program modules within an application framework.
TimeView option 4 displays program activity in time sequence
Each row of information represents a single sample taken during the monitored period. This format helps you determine a program’s execution path and looping logic. This format also gives a good indication of which code sections executed and when they executed during the monitored period.
DataView option 5 displays data sets, databases, IMS, and DB2 statements that caused activity during the monitored period
The data is sorted in descending order by activity. You can select a particular data set, database, IMS, or DB2 statement to display greater detail.
TranView option 6 shows IMS or CICS activity in terms of individual transactions
It displays the percentage of time TriTune detected activity for each transaction in the six major activity and delay categories. If you select a transaction, TriTune recomputes the values on all subsequent screens that you display by using only samples from the selected transaction. This feature enables you to focus on the performance of that transaction.
ModView option 7 displays the activity of each load module
From ModView, you can hyperlink to module details or to a panel that suggests a linkage order for reducing system paging.
PoolView option 8 displays statistics about IMS VSAM/LSR and VSAM/GSR buffer pool usage
PoolView provides information about hit ratios, size and number of buffers, and total space requested. You can also display information about the data sets attached to a pool.
USSView option 9 displays information about USS activity on a process basis
This option allows you to see delay information by process, code details by process, and process level information.
DB2 option 10 displays statistics about DB2 activity
IMS option 11 displays statistics about IMS activity
Table 1 Interactive Analysis menu options (part 2 of 3)
Option Description
32 TriTune User Guide

Describing other features of TriTune
Describing other features of TriTuneTriTune has several additional features that can assist you with tuning your applications to get the maximum benefit. These features are described in the following sections:
JVM option 12 displays statistics about Java Virtual Machine (JVM) activity
WAS option 13 displays statistics about WebSphere Application Server activity
Feature Description
Analyzing monitor data sets You can analyze data from a monitor data set that is created by someone else by adding it to your list of external monitor data sets.
For more information, see “Analyzing monitor data sets created by other users” on page 192.
Registering program listings By registering program listings, TriTune can relate program activity to actual high-level language statements, instead of to CSECT offsets only. You can register program listings in Assembler, COBOL, PL1, NATURAL, FORTRAN, IBM C/C++, and SAS C. Programs must be compiled with specific compiler options before they can be registered.
You can register a program online with the TriTune TSO Client, or offline by using the TriTune batch registration procedure hilevel.TNBATREG. When registering a program online through the TSO Client, you can choose to register the listings locally or globally. A listing that is registered locally is only available to the TriTune TSO Client that performed the program registration; a listing that is registered globally is available to all TriTune users.
For more information about registering a program listing, see “Registering source program listings” on page 218
Associating functional descriptions of CSECTs
You can define functional descriptions for CSECTs. These descriptions appear on interactive analysis panels, such as CodeView, DelayView, and ModView. During analysis, you can use these functional descriptions to identify what each CSECT does. TriTune supplies over 5000 functional descriptions for system, COBOL, PL/1, and LE routines.
For more information about defining CSECTs, see “Adding CSECT descriptions” on page 200.
Table 1 Interactive Analysis menu options (part 3 of 3)
Option Description
Chapter 1 Introduction to TriTune 33
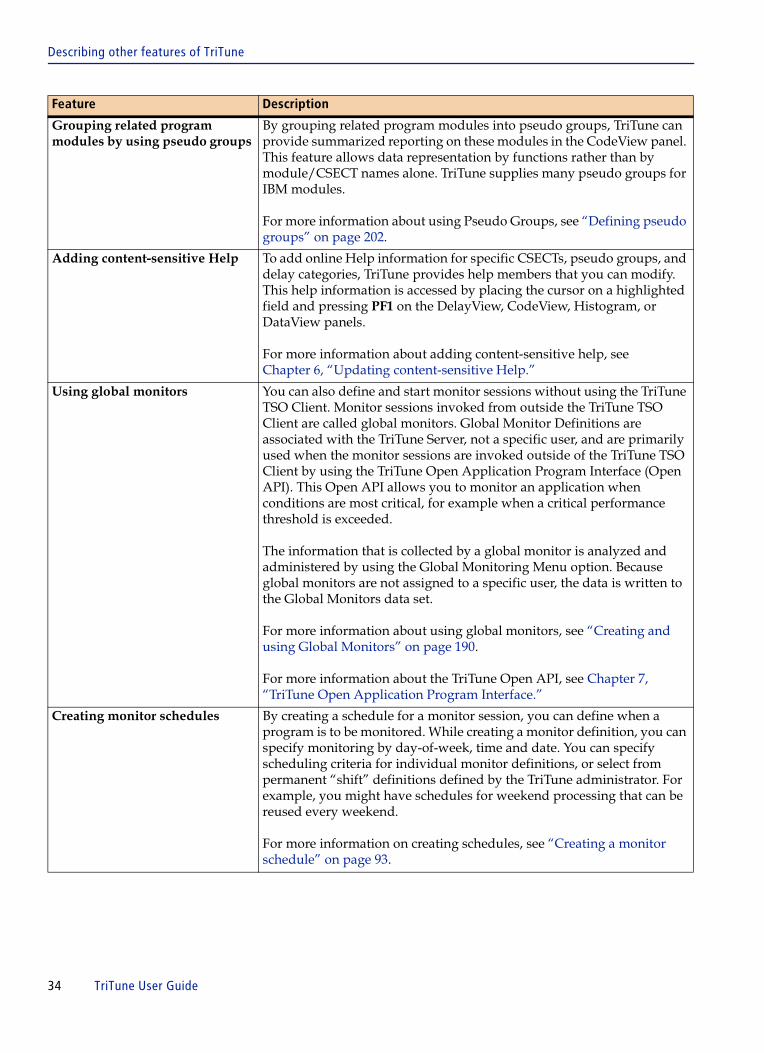
Describing other features of TriTune
Grouping related program modules by using pseudo groups
By grouping related program modules into pseudo groups, TriTune can provide summarized reporting on these modules in the CodeView panel. This feature allows data representation by functions rather than by module/CSECT names alone. TriTune supplies many pseudo groups for IBM modules.
For more information about using Pseudo Groups, see “Defining pseudo groups” on page 202.
Adding content-sensitive Help To add online Help information for specific CSECTs, pseudo groups, and delay categories, TriTune provides help members that you can modify. This help information is accessed by placing the cursor on a highlighted field and pressing PF1 on the DelayView, CodeView, Histogram, or DataView panels.
For more information about adding content-sensitive help, see Chapter 6, “Updating content-sensitive Help.”
Using global monitors You can also define and start monitor sessions without using the TriTune TSO Client. Monitor sessions invoked from outside the TriTune TSO Client are called global monitors. Global Monitor Definitions are associated with the TriTune Server, not a specific user, and are primarily used when the monitor sessions are invoked outside of the TriTune TSO Client by using the TriTune Open Application Program Interface (Open API). This Open API allows you to monitor an application when conditions are most critical, for example when a critical performance threshold is exceeded.
The information that is collected by a global monitor is analyzed and administered by using the Global Monitoring Menu option. Because global monitors are not assigned to a specific user, the data is written to the Global Monitors data set.
For more information about using global monitors, see “Creating and using Global Monitors” on page 190.
For more information about the TriTune Open API, see Chapter 7, “TriTune Open Application Program Interface.”
Creating monitor schedules By creating a schedule for a monitor session, you can define when a program is to be monitored. While creating a monitor definition, you can specify monitoring by day-of-week, time and date. You can specify scheduling criteria for individual monitor definitions, or select from permanent “shift” definitions defined by the TriTune administrator. For example, you might have schedules for weekend processing that can be reused every weekend.
For more information on creating schedules, see “Creating a monitor schedule” on page 93.
Feature Description
34 TriTune User Guide

Describing other features of TriTune
Monitoring a multistep job If you would like to create monitors for an entire region rather than just for specific job steps, you can create a group of monitor definitions (or profiles) that are activated by a trigger monitor. This monitor ensures that you have the necessary data for analysis of all job steps in a multistep process.
For more information on grouping monitor definitions, see “Creating a multijob monitor: grouping” on page 90.
Performing TriTune system administration
TriTune is typically used by a group of users. To facilitate consistency, the Administration option allows viewing only of System and User default parameters. These are the default parameters that are specified for all users in a group.
For more information about system and user default parameters, see the TriTune Installation and Customization Guide.
Displaying TriTune messages The Messages option shows all of the messages that can be issued by the TriTune Server Space during routine operation. You can select a message to display further detail.
For more information, see “Message Help” on page 44.
Using the TriTune online tutorial If you are new to TriTune, complete the online tutorial that is provided with TriTune. The tutorial introduces the features and operation of TriTune and demonstrates an example application.
Feature Description
Chapter 1 Introduction to TriTune 35

Describing other features of TriTune
36 TriTune User Guide

C h a p t e r 2
2 Working in the TriTune environmentThis chapter shows you how to use the basic features of TriTune. The following tasks are described:
Starting TriTune from a TSO session . . . . . . . . . . . . . . . . . . . . . . . . . . . . . . . . . . . . . . . . . 38Starting TriTune from ISPF. . . . . . . . . . . . . . . . . . . . . . . . . . . . . . . . . . . . . . . . . . . . . . 38Setting up user options . . . . . . . . . . . . . . . . . . . . . . . . . . . . . . . . . . . . . . . . . . . . . . . . . 39
Navigating in TriTune . . . . . . . . . . . . . . . . . . . . . . . . . . . . . . . . . . . . . . . . . . . . . . . . . . . . . 40Using online Help . . . . . . . . . . . . . . . . . . . . . . . . . . . . . . . . . . . . . . . . . . . . . . . . . . . . . . . . 42
Screen Help. . . . . . . . . . . . . . . . . . . . . . . . . . . . . . . . . . . . . . . . . . . . . . . . . . . . . . . . . . . 43Field Help . . . . . . . . . . . . . . . . . . . . . . . . . . . . . . . . . . . . . . . . . . . . . . . . . . . . . . . . . . . . 44Content-sensitive Help . . . . . . . . . . . . . . . . . . . . . . . . . . . . . . . . . . . . . . . . . . . . . . . . . 44Message Help . . . . . . . . . . . . . . . . . . . . . . . . . . . . . . . . . . . . . . . . . . . . . . . . . . . . . . . . . 44
Scrolling TriTune panels . . . . . . . . . . . . . . . . . . . . . . . . . . . . . . . . . . . . . . . . . . . . . . . . . . . 46Using PF keys . . . . . . . . . . . . . . . . . . . . . . . . . . . . . . . . . . . . . . . . . . . . . . . . . . . . . . . . . . . . 47Locating a string in a display . . . . . . . . . . . . . . . . . . . . . . . . . . . . . . . . . . . . . . . . . . . . . . . 48Sorting the display . . . . . . . . . . . . . . . . . . . . . . . . . . . . . . . . . . . . . . . . . . . . . . . . . . . . . . . . 48Using Autonavigation . . . . . . . . . . . . . . . . . . . . . . . . . . . . . . . . . . . . . . . . . . . . . . . . . . . . . 49Displaying column totals . . . . . . . . . . . . . . . . . . . . . . . . . . . . . . . . . . . . . . . . . . . . . . . . . . 51Filtering the display . . . . . . . . . . . . . . . . . . . . . . . . . . . . . . . . . . . . . . . . . . . . . . . . . . . . . . . 53
Rules for setting filters . . . . . . . . . . . . . . . . . . . . . . . . . . . . . . . . . . . . . . . . . . . . . . . . . 53Filter example. . . . . . . . . . . . . . . . . . . . . . . . . . . . . . . . . . . . . . . . . . . . . . . . . . . . . . . . . 54
Customizing TriTune panels. . . . . . . . . . . . . . . . . . . . . . . . . . . . . . . . . . . . . . . . . . . . . . . . 56Fixed fields . . . . . . . . . . . . . . . . . . . . . . . . . . . . . . . . . . . . . . . . . . . . . . . . . . . . . . . . . . . 57Resetting the display. . . . . . . . . . . . . . . . . . . . . . . . . . . . . . . . . . . . . . . . . . . . . . . . . . . 58Confirm screen customization. . . . . . . . . . . . . . . . . . . . . . . . . . . . . . . . . . . . . . . . . . . 59
Saving the information on a panel. . . . . . . . . . . . . . . . . . . . . . . . . . . . . . . . . . . . . . . . . . . 60Exporting a panel. . . . . . . . . . . . . . . . . . . . . . . . . . . . . . . . . . . . . . . . . . . . . . . . . . . . . . 60Writing data from a table to SYSOUT. . . . . . . . . . . . . . . . . . . . . . . . . . . . . . . . . . . . . 62
Issuing commands in a sysplex environment . . . . . . . . . . . . . . . . . . . . . . . . . . . . . . . . . 63
When you finish reading this section, you should be able to understand and effectively use the TriTune interface.
Chapter 2 Working in the TriTune environment 37

Starting TriTune from a TSO session
Starting TriTune from a TSO session To invoke TriTune under TSO, you must be running ISPF.
TriTune requires a TSO region size of at least 4 MB.
Starting TriTune from ISPF
Type the following TSO command on the ISPF COMMAND line:
TSO EXEC 'hilevel.TRCLIB(TRITUNE)'
where TRITUNE is the name of the TSO REXX EXEC specified during customization.
You can copy the start-up procedure from hilevel.TRCLIB to a library used by your TSO users to execute CLISTS or REXX procedures.
The first time each user invokes TriTune, the User Information File Allocation panel (Figure 3 on page 39) is displayed.
NOTE The TSO EXEC is used to execute the CLIST that was created during the customization process (see the TriTune Installation and Customization Guide). Consult your TriTune System Administrator for the correct name and location of the CLIST.
38 TriTune User Guide

Starting TriTune from a TSO session
Setting up user options
The User Information File Allocation panel (Figure 3) enables you to automatically copy your existing monitor definitions from your current tables data set to the new User Information File.
Figure 3 User Information File Allocation panel
This panel is not displayed if the system default DISPLAY_ALLOC_PANEL = NO is specified in the Global Tables Data Set (using hilevel.TRPARM member TUNSDEFS). The User Information File is allocated by using the default values. Refer to the TriTune Installation and Customization Guide for more information.
If you select YES to the question about migrating the User Information File from a previous versions, the following message is received:
TN007I Migration of User Information File in progress from release 3.3.01
If you select NO to the question about migrating the User Information File from a previous version, the following message is received:
TN0004I Please wait while User Information File is initialized (TPNnnnn).
If the data set is to be managed by SMS, you can specify an * as the volume serial ID.
TriTune --------------- User Information File Allocation ----------------------COMMAND ===> TriTune 4.0 requires a User Information File to store user-specific data. The name of this data set is: 'TRIUSER.TRI40.TABLES' This data set must be allocated before you can use TriTune. If you choose not to allocate this data set, TriTune will terminate. Do you want TriTune to allocate this data set now ? ===> YES (Yes or No) Allocate data set on volume ===> (Required for non-SMS data sets) Number of tracks to allocate ===> 90 (Required) SMS Management Class ===> (Optional for SMS data sets) SMS Storage Class ===> (Optional for SMS data sets) SMS Data Class ===> (Optional for SMS data sets) A table was found for your TSO user ID from a previous release. The name of the data set is: 'TRIUSER.TRI40.TABLES' Would you like to have the entries from the previous release's tables data setmigrated to the new release's User Information File? ===> YES (Yes or No) Press HELP for more information Enter the required input fields to start TriTune Press END to cancel data set allocation and exit without starting TriTune
Chapter 2 Working in the TriTune environment 39

Navigating in TriTune
Navigating in TriTune After invoking TriTune, the first panel displayed is the Primary Option Menu (Figure 4). You access all TriTune functions from this menu.
Figure 4 Primary Option Menu
This ISPF menu is standard. You can type either ISPF commands or TriTune options in the OPTION field.
The fields in the upper right corner of the menu display the following information:
■ your User ID
■ TriTune Server Space ID and Status, which is active or inactive
■ TriTune release level
TriTune ---------------------- Primary Option Menu ---------------------------OPTION ===>
0 Parameters - Enter user-specific parameters Userid: TRIUSER Server ID: TRITUNE 1 Monitor - Create and analyze Monitor Sets Status: ACTIVE Release: 4.0.00 2 Active - Select an active job to monitor 3 Registration - Register source listings 4 Grouping - Define groups of monitors 5 External - Analyze other user's monitor files
S Status - Display and manage invoked monitors G Global - Global monitoring and listing registration A Administration - TriTune system administration M Messages - List TriTune messages T Tutorial - TriTune tutorial
Copyright 2006Enter an option or press END to exit Trilog Service AG.
TriTune is an internationally registered trademark of Trilog Holding AG.
40 TriTune User Guide
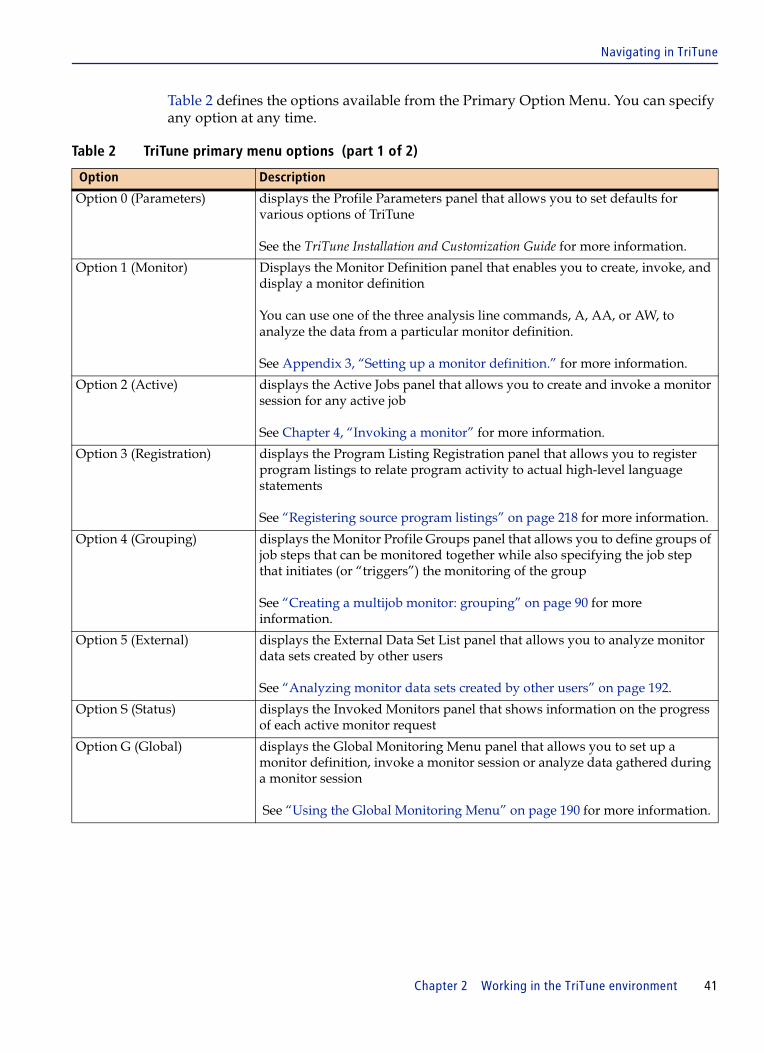
Navigating in TriTune
Table 2 defines the options available from the Primary Option Menu. You can specify any option at any time.
Table 2 TriTune primary menu options (part 1 of 2)
Option Description
Option 0 (Parameters) displays the Profile Parameters panel that allows you to set defaults for various options of TriTune
See the TriTune Installation and Customization Guide for more information.
Option 1 (Monitor) Displays the Monitor Definition panel that enables you to create, invoke, and display a monitor definition
You can use one of the three analysis line commands, A, AA, or AW, to analyze the data from a particular monitor definition.
See Appendix 3, “Setting up a monitor definition.” for more information.
Option 2 (Active) displays the Active Jobs panel that allows you to create and invoke a monitor session for any active job
See Chapter 4, “Invoking a monitor” for more information.
Option 3 (Registration) displays the Program Listing Registration panel that allows you to register program listings to relate program activity to actual high-level language statements
See “Registering source program listings” on page 218 for more information.
Option 4 (Grouping) displays the Monitor Profile Groups panel that allows you to define groups of job steps that can be monitored together while also specifying the job step that initiates (or “triggers”) the monitoring of the group
See “Creating a multijob monitor: grouping” on page 90 for more information.
Option 5 (External) displays the External Data Set List panel that allows you to analyze monitor data sets created by other users
See “Analyzing monitor data sets created by other users” on page 192.
Option S (Status) displays the Invoked Monitors panel that shows information on the progress of each active monitor request
Option G (Global) displays the Global Monitoring Menu panel that allows you to set up a monitor definition, invoke a monitor session or analyze data gathered during a monitor session
See “Using the Global Monitoring Menu” on page 190 for more information.
Chapter 2 Working in the TriTune environment 41

Displaying TriTune status
Displaying TriTune statusTo display a current list of all active and deferred monitor requests, enter the primary command STATUS from any TriTune ISPF panel.
Using online Help TriTune features an extensive online Help facility that explains all of TriTune’s panels and fields. The TriTune Help facility uses pop-up panels with hyperlinks to related topics. There are four types of Help information:
■ screen help■ field help■ content-sensitive help■ message help
Option A (Administration) displays the Administration Option Menu. From this menu, you can perform a variety of administrative functions, such as register source program listings, create CSECT associations, define pseudo groups, schedule monitor requests, and update content-sensitive help
See “Performing administrative functions” on page 198 for more information.
You can also view global system and user default values (see the TriTune Installation and Customization Guide).
Option M (Messages) displays the Messages panel that contains a list of TriTune messages and their message IDs
The message text explains the message and suggests actions that you can take. See “Message Help” on page 44 for more information.
Option T (Tutorial) launches the online tutorial that provides a guided tour through many of TriTune’s features and functions
Move forward through the tutorial by pressing Enter and backwards by pressing PF10. The tutorial takes approximately 30 minutes to complete. If you are using TriTune for the first time, it is recommended that you complete the tutorial.
Table 2 TriTune primary menu options (part 2 of 2)
Option Description
42 TriTune User Guide

Using online Help
Screen Help
Screen Help is information relating to a TriTune panel. To display Help from anywhere in TriTune, press PF1 for Help.
A Help pop-up panel overlays the TriTune panel (Figure 5).
Figure 5 TriTune Help pop-up panel
Hyperlinked fields are highlighted on the Help panel. To hyperlink to related Help text:
1 Place the cursor on the highlighted field and press Enter.
2 Press End to exit the Help facility and return to TriTune.
3 To exit the Help facility if multiple help panels are displayed, you can either press End multiple times or type QUIT on the Help panel’s COMMAND line and press Enter.
TriTune ---------------------- Primary Option Menu --------------------------- OPTION ===> ____________________________________________________ | TriTune Primary Option Menu More: + | Userid: TUNUSER | Command ===> Scroll ===> HALF | Server ID: TRITUNE | -------------------------------------------------- | Status: ACTIVE | TriTune is an ISPF-based product which enables you | Release: 4.0.0 | to find delays in applications. Before using the | | Primary Option Menu, make sure the TriTune server | | address space is running on this MVS image. | itions | | | To begin using TriTune, select Option 1 (Monitor). | | This enables you to: | | | | o Set up a monitor definition | Copyright En | o Invoke a monitor session | Service AG. 2006 | o Analyze the data gathered during a monitor | | session | | | | For information about items on this menu, place | | your cursor on a topic and press Enter. | | | | PARAMETERS Define user-specific parameters | |____________________________________________________|
Chapter 2 Working in the TriTune environment 43

Using online Help
Field Help
Field Help is information related to a specific field on a TriTune panel. To display field Help:
1 Place the cursor on the name of the field for tabular panels or in the input area of the field for data-entry panels. You may also use the Tab key to position the cursor.
2 Press PF1 for Help. Help information is displayed.
Content-sensitive Help
If the content of a field is colored red, yellow, or white, content-sensitive Help is available. When you place the cursor on one of these fields and press PF1, the Help that is displayed is specific to that content. See “Updating content-sensitive Help” on page 205 for more information.
Message Help
During operation, the TriTune Server Space might generate a message to alert you of any problems that have occurred. You can obtain additional information about the message.
1 Record the Message ID. This ID is used to link to the correct information.
2 On the Primary Option Menu, select Option M.
The Messages panel (Figure 6 on page 45) is displayed:
44 TriTune User Guide
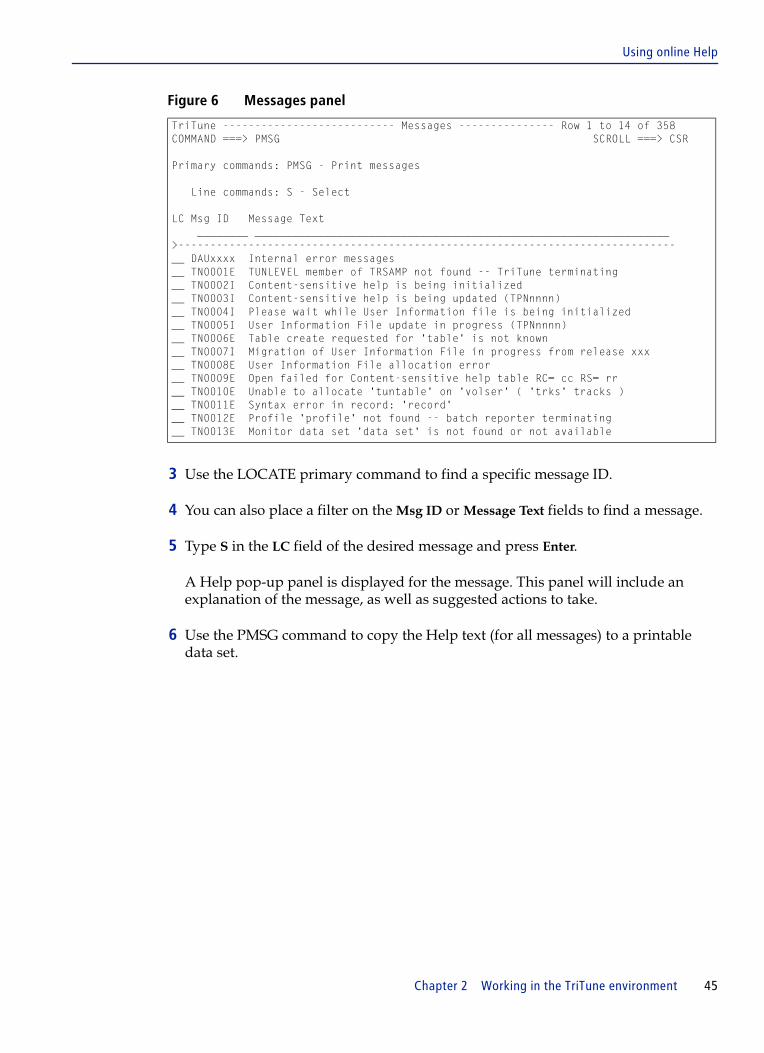
Using online Help
Figure 6 Messages panel
3 Use the LOCATE primary command to find a specific message ID.
4 You can also place a filter on the Msg ID or Message Text fields to find a message.
5 Type S in the LC field of the desired message and press Enter.
A Help pop-up panel is displayed for the message. This panel will include an explanation of the message, as well as suggested actions to take.
6 Use the PMSG command to copy the Help text (for all messages) to a printable data set.
TriTune --------------------------- Messages --------------- Row 1 to 14 of 358COMMAND ===> PMSG SCROLL ===> CSR Primary commands: PMSG - Print messages Line commands: S - Select LC Msg ID Message Text ________ _________________________________________________________________ >------------------------------------------------------------------------------__ DAUxxxx Internal error messages __ TN0001E TUNLEVEL member of TRSAMP not found -- TriTune terminating __ TN0002I Content-sensitive help is being initialized __ TN0003I Content-sensitive help is being updated (TPNnnnn) __ TN0004I Please wait while User Information file is being initialized __ TN0005I User Information File update in progress (TPNnnnn) __ TN0006E Table create requested for 'table' is not known __ TN0007I Migration of User Information File in progress from release xxx __ TN0008E User Information File allocation error __ TN0009E Open failed for Content-sensitive help table RC= cc RS= rr __ TN0010E Unable to allocate 'tuntable' on 'volser' ( 'trks' tracks ) __ TN0011E Syntax error in record: 'record' __ TN0012E Profile 'profile' not found -- batch reporter terminating __ TN0013E Monitor data set 'data set' is not found or not available
Chapter 2 Working in the TriTune environment 45

Scrolling TriTune panels
Figure 7 Print TriTune Messages screen
The information that is displayed in the Messages Help panel includes:
■ Reason - a detailed description of the message, including why the message was issued
■ System Action - an explanation of what action is taken by TriTune when the message is issued
■ User Action - the required or suggested steps to take■ Origin - the TriTune module that generated the message
7 Press End to exit the Help facility and return to TriTune.
Scrolling TriTune panelsTo scroll the contents of a TriTune panel, use the standard ISPF scroll commands: UP (PF7), DOWN (PF8), LEFT (PF10), and RIGHT (PF11). When you scroll right, TriTune’s fixed fields remain at the left margin. If more fields are available, the TriTune panel displays an arrow on the far left between the column header and the data rows. The arrow indicates which direction you can scroll to see more fields:
> indicates that more fields are available by scrolling right< indicates that more fields are available by scrolling left<> indicates that more fields are available by scrolling left or right
TriTune --------- Print TriTune Messages ----------------------------------------COMMAND ===> ISPF library: Project ===> Group ===> Type ===> Member ===> (Blank or pattern for member selection list) Other partitioned or sequential dataset: Dataset name ===> 'TRITUNE.MSGS.PRINT' Volume serial ===> dev220 (If not cataloged) Lines per page: 66 Press END to print messages or CANCEL to exit
Please wait while messages are written to:'TRITUNE.MSGS.PRINT'
46 TriTune User Guide
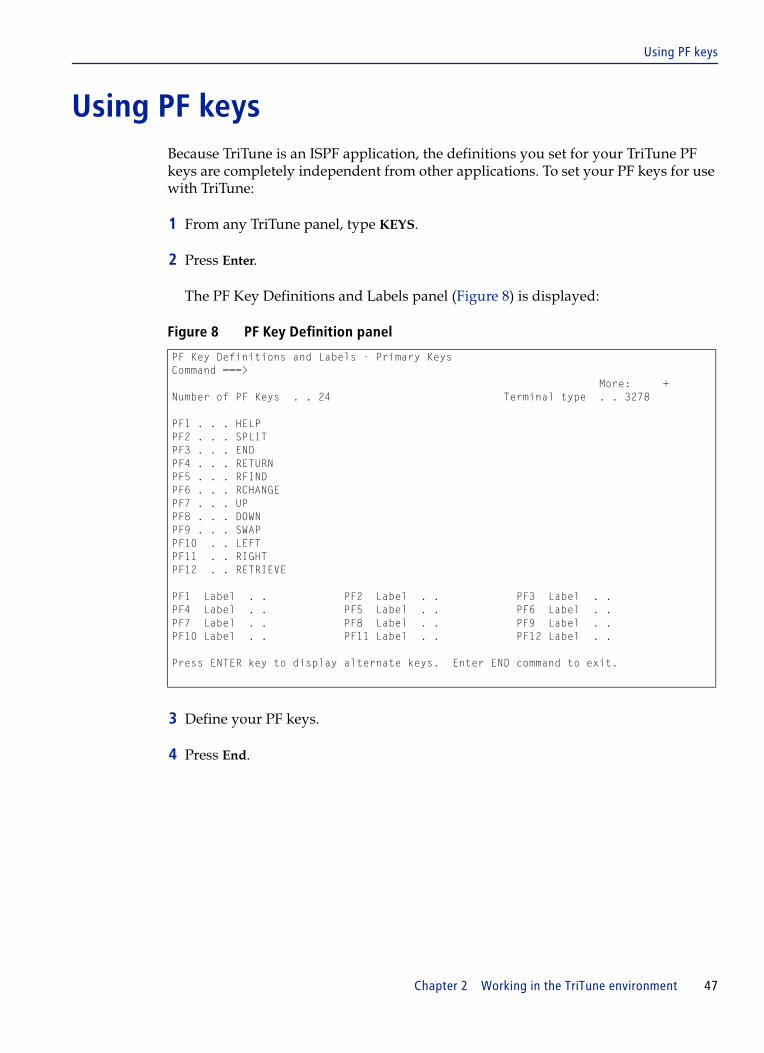
Using PF keys
Using PF keys Because TriTune is an ISPF application, the definitions you set for your TriTune PF keys are completely independent from other applications. To set your PF keys for use with TriTune:
1 From any TriTune panel, type KEYS.
2 Press Enter.
The PF Key Definitions and Labels panel (Figure 8) is displayed:
Figure 8 PF Key Definition panel
3 Define your PF keys.
4 Press End.
PF Key Definitions and Labels - Primary Keys Command ===> More: + Number of PF Keys . . 24 Terminal type . . 3278 PF1 . . . HELP PF2 . . . SPLIT PF3 . . . END PF4 . . . RETURN PF5 . . . RFIND PF6 . . . RCHANGE PF7 . . . UP PF8 . . . DOWN PF9 . . . SWAP PF10 . . LEFT PF11 . . RIGHT PF12 . . RETRIEVE PF1 Label . . PF2 Label . . PF3 Label . . PF4 Label . . PF5 Label . . PF6 Label . . PF7 Label . . PF8 Label . . PF9 Label . . PF10 Label . . PF11 Label . . PF12 Label . . Press ENTER key to display alternate keys. Enter END command to exit.
Chapter 2 Working in the TriTune environment 47

Locating a string in a display
Locating a string in a displayTo locate a particular string and move it to the top of a display, on the command line type
L target
where target is a jobname, module, or other type of information in the leftmost field.
If you change the sort value of a panel, target is the field by which the panel is sorted.
The Locate command supports wildcard characters (*, %, ?). If the target you specify does not appear, the message LOCATE ARG NOT FOUND appears in the upper right corner.
Some panels do not support the Locate command. Issuing Locate from these panels produces the message INVALID OPTION in the upper right corner.
Sorting the display You can sort the information displayed on a panel by any field using the SORT primary command. With the SORT command, you have the power to display the most over- or under-utilized resources at a glance. To sort a display:
1 On the COMMAND line, type SORT A to sort in ascending order or SORT D to sort in descending order. The default is A.
2 Place the cursor on the field that you want to sort.
3 Press Enter.
You can sort only one field per panel. If you type the SORT command for a second field, the first sort criterion is replaced.
4 To remove sort criteria from a panel, type NOSORT on the COMMAND line and press Enter. TriTune returns to its initial sort order.
You can also add or remove sort criteria using the Screen Customization panel.
48 TriTune User Guide
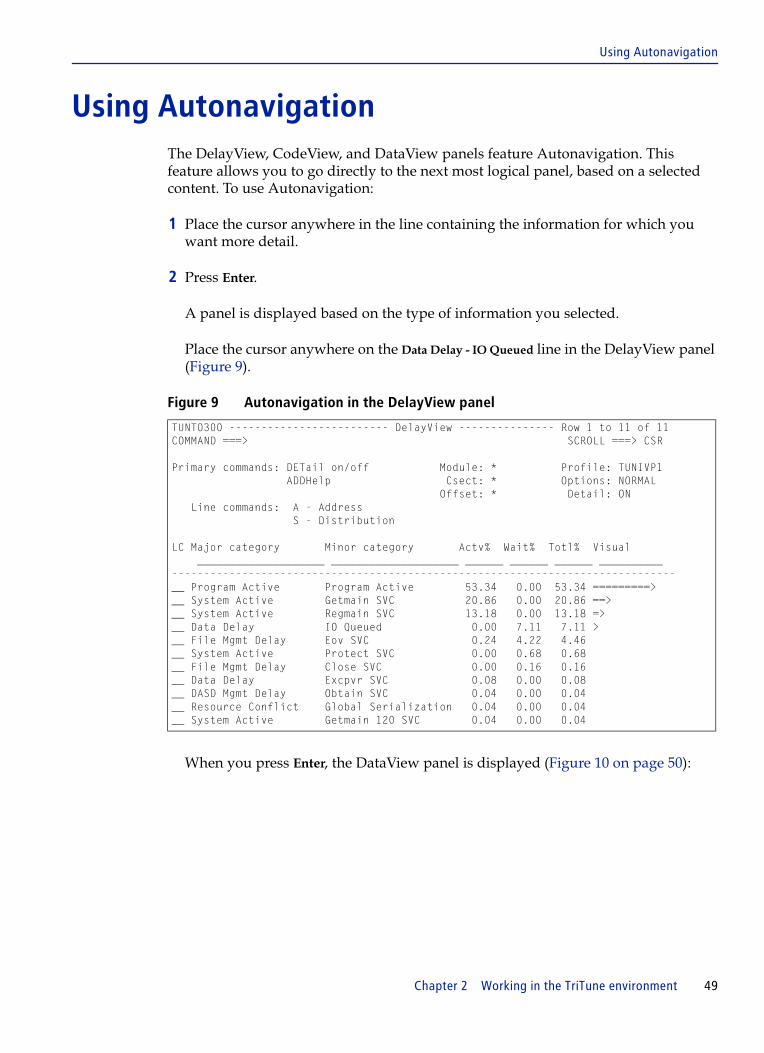
Using Autonavigation
Using AutonavigationThe DelayView, CodeView, and DataView panels feature Autonavigation. This feature allows you to go directly to the next most logical panel, based on a selected content. To use Autonavigation:
1 Place the cursor anywhere in the line containing the information for which you want more detail.
2 Press Enter.
A panel is displayed based on the type of information you selected.
Place the cursor anywhere on the Data Delay - IO Queued line in the DelayView panel (Figure 9).
Figure 9 Autonavigation in the DelayView panel
When you press Enter, the DataView panel is displayed (Figure 10 on page 50):
TUNT0300 ------------------------- DelayView --------------- Row 1 to 11 of 11COMMAND ===> SCROLL ===> CSR Primary commands: DETail on/off Module: * Profile: TUNIVP1 ADDHelp Csect: * Options: NORMAL Offset: * Detail: ON Line commands: A - Address S - Distribution LC Major category Minor category Actv% Wait% Totl% Visual ____________________ ____________________ ______ ______ ______ __________ -------------------------------------------------------------------------------__ Program Active Program Active 53.34 0.00 53.34 =========> __ System Active Getmain SVC 20.86 0.00 20.86 ==> __ System Active Regmain SVC 13.18 0.00 13.18 => __ Data Delay IO Queued 0.00 7.11 7.11 > __ File Mgmt Delay Eov SVC 0.24 4.22 4.46 __ System Active Protect SVC 0.00 0.68 0.68 __ File Mgmt Delay Close SVC 0.00 0.16 0.16 __ Data Delay Excpvr SVC 0.08 0.00 0.08 __ DASD Mgmt Delay Obtain SVC 0.04 0.00 0.04 __ Resource Conflict Global Serialization 0.04 0.00 0.04 __ System Active Getmain 120 SVC 0.04 0.00 0.04
Chapter 2 Working in the TriTune environment 49
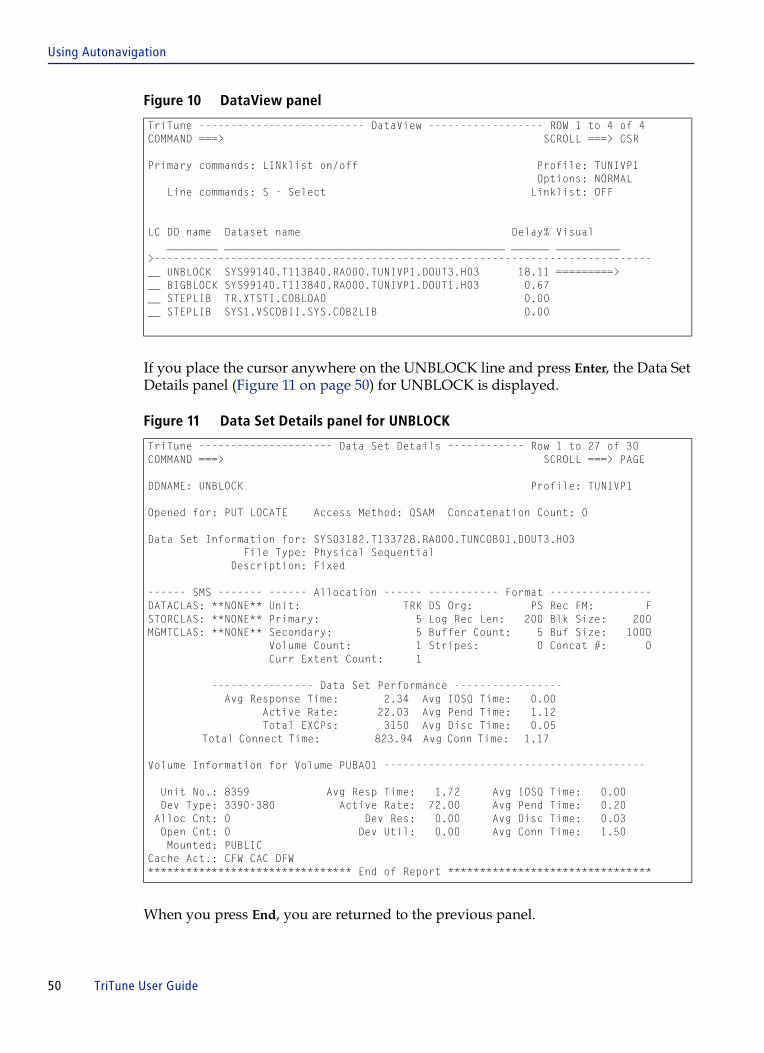
Using Autonavigation
Figure 10 DataView panel
If you place the cursor anywhere on the UNBLOCK line and press Enter, the Data Set Details panel (Figure 11 on page 50) for UNBLOCK is displayed.
Figure 11 Data Set Details panel for UNBLOCK
When you press End, you are returned to the previous panel.
TriTune -------------------------- DataView ------------------ ROW 1 to 4 of 4 COMMAND ===> SCROLL ===> CSR Primary commands: LINklist on/off Profile: TUNIVP1 Options: NORMAL Line commands: S - Select Linklist: OFF LC DD name Dataset name Delay% Visual ________ ____________________________________________ ______ __________ >------------------------------------------------------------------------------__ UNBLOCK SYS99140.T113840.RA000.TUNIVP1.DOUT3.H03 18.11 =========> __ BIGBLOCK SYS99140.T113840.RA000.TUNIVP1.DOUT1.H03 0.67 __ STEPLIB TR.XTSTI.COBLOAD 0.00 __ STEPLIB SYS1.VSCOBII.SYS.COB2LIB 0.00
TriTune --------------------- Data Set Details ------------ Row 1 to 27 of 30 COMMAND ===> SCROLL ===> PAGE DDNAME: UNBLOCK Profile: TUNIVP1 Opened for: PUT LOCATE Access Method: QSAM Concatenation Count: 0 Data Set Information for: SYS03182.T133728.RA000.TUNCOB01.DOUT3.H03 File Type: Physical Sequential Description: Fixed ------ SMS ------- ------ Allocation ------ ----------- Format ----------------DATACLAS: **NONE** Unit: TRK DS Org: PS Rec FM: FSTORCLAS: **NONE** Primary: 5 Log Rec Len: 200 Blk Size: 200MGMTCLAS: **NONE** Secondary: 5 Buffer Count: 5 Buf Size: 1000 Volume Count: 1 Stripes: 0 Concat #: 0 Curr Extent Count: 1 ---------------- Data Set Performance ----------------- Avg Response Time: 2.34 Avg IOSQ Time: 0.00 Active Rate: 22.03 Avg Pend Time: 1.12 Total EXCPs: 3150 Avg Disc Time: 0.05 Total Connect Time: 823.94 Avg Conn Time: 1.17 Volume Information for Volume PUBA01 ----------------------------------------- Unit No.: 8359 Avg Resp Time: 1.72 Avg IOSQ Time: 0.00 Dev Type: 3390-380 Active Rate: 72.00 Avg Pend Time: 0.20 Alloc Cnt: 0 Dev Res: 0.00 Avg Disc Time: 0.03 Open Cnt: 0 Dev Util: 0.00 Avg Conn Time: 1.50 Mounted: PUBLIC Cache Act.: CFW CAC DFW******************************** End of Report ********************************
50 TriTune User Guide

Displaying column totals
Displaying column totalsYou can display numeric totals and subtotals for any tabular panel. Column totals are the sum of all lines in the table, not just the lines displayed on the screen. Column subtotals are displayed when a panel is filtered. Column totals are fixed and remain on the screen when you scroll through the data.
You can display column totals by default. Refer to the TriTune Installation and Customization Guide.
To display column totals:
1 On the COMMAND line, type TOTals. The numeric totals for the panel will appear at the bottom of the panel (Figure 12).
Figure 12 TaskView panel with column totals
If you specify a filter for a field, the subtotals, which are the totals for the filtered data only, are displayed above the totals for all of the data (Figure 13 on page 52).
TriTune -------------------------- TaskView ---------- Screen CUSTOMIZ changedCOMMAND ===> SCROLL ===> CSR Primary commands: SELect, RECall, ADDHelp Profile: TUNSAMP Options: NORMAL Line commands: T - Tag C - Code Details U - Untag D - Delay Details LC Program T Actv% Data% System% VolWait% InvWait% Other% Total% ________ _ >.03_ _____ _______ ________ ________ ______ ______ -------------------------------------------------------------------------------__ DFHD2EX3 8.31 44.21 0.00 0.06 0.00 0.00 52.58 __ DFHD2EX3 0.82 13.22 0.00 0.01 0.00 0.00 14.06 __ DFHD2EX3 0.66 8.80 0.00 0.06 0.22 0.00 9.74 __ DFHKETCB 0.32 4.06 0.00 4.78 0.00 0.00 9.16 __ DFHD2EX3 0.19 3.00 0.00 0.20 0.00 0.00 3.38 __ DFHD2EX3 0.69 2.29 0.00 0.01 0.00 0.00 3.00 __ DFHD2EX3 0.13 2.64 0.00 0.04 0.00 0.00 2.81 __ DFHD2EX3 0.09 0.68 0.00 0.01 0.00 0.00 0.78 __ DFHD2EX3 0.04 0.39 0.00 0.12 0.14 0.00 0.69 __ DFHD2EX3 0.43 0.22 0.00 0.03 0.00 0.00 0.68 ---------------------------- Subtotals and Totals ----------------------------- 11.72 79.95 0.00 5.33 0.36 0.00 97.36 11.88 82.24 0.00 5.49 0.39 0.00 100.00
Chapter 2 Working in the TriTune environment 51

Displaying column totals
Figure 13 TaskView panel with column subtotals
2 To remove the totals from the display, type TOTals again.
TriTune -------------------------- TaskView ---------- Screen CUSTOMIZ changedCOMMAND ===> SCROLL ===> CSR Primary commands: SELect, RECall, ADDHelp Profile: TUNSAMP Options: NORMAL Line commands: T - Tag C - Code Details U - Untag D - Delay Details LC Program T Actv% Data% System% VolWait% InvWait% Other% Total% ________ _ >.03_ _____ _______ ________ ________ ______ ______ -------------------------------------------------------------------------------__ DFHD2EX3 8.31 44.21 0.00 0.06 0.00 0.00 52.58 __ DFHD2EX3 0.82 13.22 0.00 0.01 0.00 0.00 14.06 __ DFHD2EX3 0.66 8.80 0.00 0.06 0.22 0.00 9.74 __ DFHKETCB 0.32 4.06 0.00 4.78 0.00 0.00 9.16 __ DFHD2EX3 0.19 3.00 0.00 0.20 0.00 0.00 3.38 __ DFHD2EX3 0.69 2.29 0.00 0.01 0.00 0.00 3.00 __ DFHD2EX3 0.13 2.64 0.00 0.04 0.00 0.00 2.81 __ DFHD2EX3 0.09 0.68 0.00 0.01 0.00 0.00 0.78 __ DFHD2EX3 0.04 0.39 0.00 0.12 0.14 0.00 0.69 __ DFHD2EX3 0.43 0.22 0.00 0.03 0.00 0.00 0.68 ---------------------------- Subtotals and Totals ----------------------------- 11.72 79.95 0.00 5.33 0.36 0.00 97.36 11.88 82.24 0.00 5.49 0.39 0.00 100.00
52 TriTune User Guide
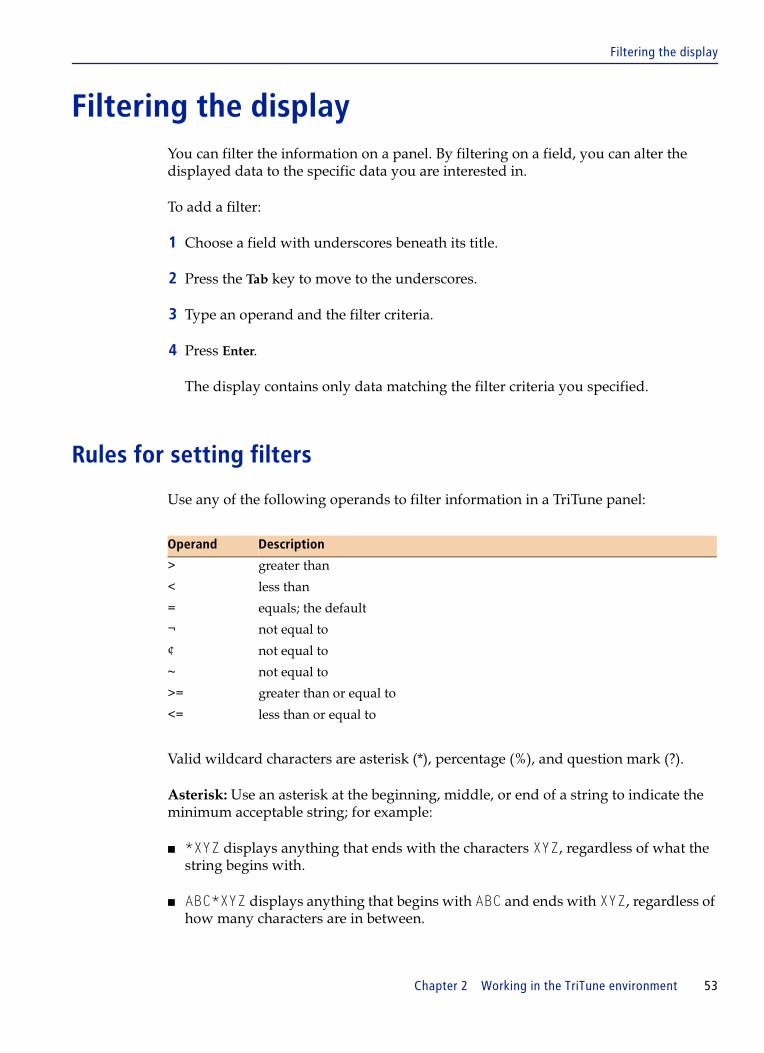
Filtering the display
Filtering the display You can filter the information on a panel. By filtering on a field, you can alter the displayed data to the specific data you are interested in.
To add a filter:
1 Choose a field with underscores beneath its title.
2 Press the Tab key to move to the underscores.
3 Type an operand and the filter criteria.
4 Press Enter.
The display contains only data matching the filter criteria you specified.
Rules for setting filters
Use any of the following operands to filter information in a TriTune panel:
Valid wildcard characters are asterisk (*), percentage (%), and question mark (?).
Asterisk: Use an asterisk at the beginning, middle, or end of a string to indicate the minimum acceptable string; for example:
■ *XYZ displays anything that ends with the characters XYZ, regardless of what the string begins with.
■ ABC*XYZ displays anything that begins with ABC and ends with XYZ, regardless of how many characters are in between.
Operand Description
> greater than
< less than
= equals; the default
¬ not equal to
¢ not equal to
~ not equal to
>= greater than or equal to
<= less than or equal to
Chapter 2 Working in the TriTune environment 53

Filtering the display
Percent: Use a % sign to indicate that the position must be occupied by a number; for example:
The filter criterion XYZ%% displays all instances of XYZ followed by two numbers. XYZ30 and XYZ42 satisfy the condition, but XYZ173 and XYZ2A do not.
Question mark: Use a question mark to indicate that a given position must be occupied by any character, regardless of its type.
The filter JOB?A% displays all jobs that have JOB in the first three positions, any character in the fourth, an A in the fifth, and a number in the last position. JOB1A6 and JOB#A7 are displayed, but JOB1Z is not.
If you use a wildcard within a numeric value, that number is treated as a character string. For example, you can use the filter ??9 to filter a field to show only three-digit numeric values that end with the number 9.
If more than one filter is established for a panel, both conditions must be satisfied for the data to appear. If you want to use a filter that is wider than a column, you must use screen customization.
Filter example
The Active Jobs panel is shown in Figure 14 without any filters in place. All jobs running on SYSI, SYSM and SYSO are shown.
Figure 14 Unfiltered Active Jobs panel
TriTune ------------------------- Active Jobs ------------- Row 1 to 11 of 774COMMAND ===> SCROLL ===> CSR Primary commands: STAtus Server ID: TRITUNE Status: ACTIVE Line commands: M - Display Monitoring Criteria Local SYSID: SYSO I - Invoke Monitor S - Display Active Select Command Sysplex A/S Cur CPU EXCP LC Jobname Stepname Procstep SysName ASID Type Pos REAL Rate Rate SMFID ________ ________ ________ ________ _____ ____ ___ ____ _____ _____ _____ >------------------------------------------------------------------------------__ *MASTER* SYSI 1 STC NS 1633 SYSI __ *MASTER* SYSM 1 STC NS 3210 SYSM __ *MASTER* SYSO 1 STC NS 5721 SYSO __ PCAUTH PCAUTH SYSI 2 STC NS 55 SYSI __ PCAUTH PCAUTH SYSM 2 STC NS 55 SYSM __ PCAUTH PCAUTH SYSO 2 STC NS 56 SYSO __ RASP RASP SYSI 3 STC NS 120 SYSI __ RASP RASP SYSM 3 STC NS 122 SYSM __ RASP RASP SYSO 3 STC NS 122 SYSO __ TRACE TRACE SYSI 4 STC NS 113 SYSI __ TRACE TRACE SYSM 4 STC NS 137 SYSM
54 TriTune User Guide

Filtering the display
By placing >2 in the CPU Rate field, the display is limited to active jobs with a CPU Rate of over 2 percent, as shown in Figure 15 on page 55.
Figure 15 Setting a filter for a field
By adding SYSO to the field for Sysplex SysName, only the jobs running on SYSO with a CPU Rate of over 2 percent are displayed, as shown in Figure 16.
Figure 16 Setting a filter for the Sysplex SysName field
The filters established for both the CPU Rate and Sysplex SysName fields remain visible, so that you can always see the filters currently in effect.
TriTune ------------------------- Active Jobs ------------- Row 1 to 11 of 774COMMAND ===> SCROLL ===> CSR Primary commands: STAtus Server ID: TRITUNE Status: ACTIVE Line commands: M - Display Monitoring Criteria Local SYSID: SYSO I - Invoke Monitor S - Display Active Select Command Sysplex A/S Cur CPU EXCP LC Jobname Stepname Procstep SysName ASID Type Pos REAL Rate Rate SMFID ________ ________ ________ ________ _____ ____ ___ ____ >2___ _____ _____ >------------------------------------------------------------------------------__ *MASTER* SYSI 1 STC NS 1633 SYSI __ *MASTER* SYSM 1 STC NS 3210 SYSM __ *MASTER* SYSO 1 STC NS 5721 SYSO __ PCAUTH PCAUTH SYSI 2 STC NS 55 SYSI
TriTune ------------------------- Active Jobs ----------------- Row 131 of 779COMMAND ===> SCROLL ===> CSR Primary commands: STAtus Server ID: TRITUNE Status: ACTIVE Line commands: M - Display Monitoring Criteria Local SYSID: SYSO I - Invoke Monitor S - Display Active Select Command Sysplex A/S Cur CPU EXCP LC Jobname Stepname Procstep SysName ASID Type Pos REAL Rate Rate SMFID ________ ________ ________ ________ _____ ____ ___ ____ >2___ _____ _____ >-----------------------------------------------------------------------------__ MMASYSO MMASYSO SSASYSPQ SYSO 49 STC NS 1364 2.06 7.05 SYSO __ MV$PASK PASO PAS SYSO 230 STC NS 28K 11.32 143.1 SYSO __ MV$CASK CASO CAS SYSO 236 STC NS 20K 9.82 7.63 SYSO
Chapter 2 Working in the TriTune environment 55
Customizing TriTune panels
Customizing TriTune panelsYou can modify the display properties for each TriTune panel using the Screen Customization panel. This panel allows you to define how information is presented when a panel is displayed.
1 On the COMMAND line of the panel, type CUST.
2 Press Enter.
The Screen Customization panel (Figure 17 on page 57) is displayed.
3 Use Table 3 on page 58 to define how you want the panel to display data.
4 Press End to return to the panel.
You will see the customized display; however, the customization has not been saved. The customization is saved when the panel is exited.
Figure 18 on page 59 shows the Screen Customization panel for the Active Jobs panel. The contents of the FIELD column are almost identical to the fields on the panel. These are the internal field names used by the SORT command.
56 TriTune User Guide

Customizing TriTune panels
Figure 17 Screen Customization panel
Fixed fields
Notice that the first two fields, LC and JOBNAME, are highlighted. This highlighting identifies those fields as fixed fields. A fixed field remains at the left margin when you scroll the panel to see additional columns so that you can relate a jobname or other type of identifying information to the data being displayed.
TriTune --------- Screen Customization for: TriTune Display Active -----------COMMAND ===> SCROLL ===> CSR Line commands: E - exclude I - include M - move A - after B - before S or SA - sort ascending SD - sort descending H - field help S FIELD SORT INCL/ FLD FILTER EXCL TYPE >------------------------------------------------------------------------------__ LC INCL CHR __ JOBNAME INCL CHR __________________________________________________ __ STEPNAME INCL CHR __________________________________________________ __ PROCSTEP INCL CHR __________________________________________________ __ SYSID INCL CHR __________________________________________________ __ ASID INCL NUM __________________________________________________ __ ASIDX EXCL HEX __________________________________________________ __ TYP INCL CHR __________________________________________________ __ POS INCL CHR __________________________________________________ __ DPPR INCL NUM __________________________________________________ __ REAL INCL NUM __________________________________________________ __ CPURATE INCL NUM __________________________________________________ __ CPUTIME EXCL NUM __________________________________________________ __ TCBTIME EXCL NUM __________________________________________________ __ SRBTIME EXCL NUM __________________________________________________ __ DCPUTIME EXCL NUM __________________________________________________ __ DTCBTIME EXCL NUM __________________________________________________ __ DSRBTIME EXCL NUM __________________________________________________ __ EXCP EXCL NUM __________________________________________________ __ DELTEXCP EXCL NUM __________________________________________________ Press ENTER and END to apply changes or CANCEL to exit with no change
Chapter 2 Working in the TriTune environment 57
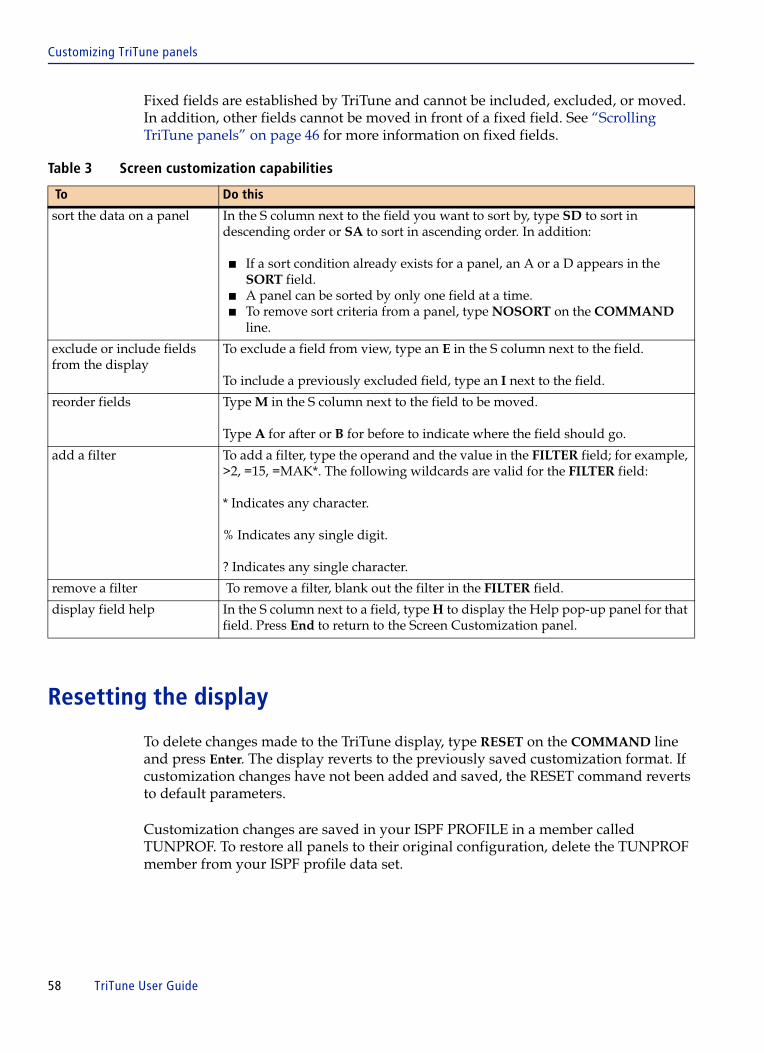
Customizing TriTune panels
Fixed fields are established by TriTune and cannot be included, excluded, or moved. In addition, other fields cannot be moved in front of a fixed field. See “Scrolling TriTune panels” on page 46 for more information on fixed fields.
Resetting the display
To delete changes made to the TriTune display, type RESET on the COMMAND line and press Enter. The display reverts to the previously saved customization format. If customization changes have not been added and saved, the RESET command reverts to default parameters.
Customization changes are saved in your ISPF PROFILE in a member called TUNPROF. To restore all panels to their original configuration, delete the TUNPROF member from your ISPF profile data set.
Table 3 Screen customization capabilities
To Do this
sort the data on a panel In the S column next to the field you want to sort by, type SD to sort in descending order or SA to sort in ascending order. In addition:
■ If a sort condition already exists for a panel, an A or a D appears in the SORT field.
■ A panel can be sorted by only one field at a time.■ To remove sort criteria from a panel, type NOSORT on the COMMAND
line.
exclude or include fields from the display
To exclude a field from view, type an E in the S column next to the field.
To include a previously excluded field, type an I next to the field.
reorder fields Type M in the S column next to the field to be moved.
Type A for after or B for before to indicate where the field should go.
add a filter To add a filter, type the operand and the value in the FILTER field; for example, >2, =15, =MAK*. The following wildcards are valid for the FILTER field:
* Indicates any character.
% Indicates any single digit.
? Indicates any single character.
remove a filter To remove a filter, blank out the filter in the FILTER field.
display field help In the S column next to a field, type H to display the Help pop-up panel for that field. Press End to return to the Screen Customization panel.
58 TriTune User Guide

Customizing TriTune panels
Confirm screen customization
Only changes made using the Screen Customization pop-up panel can be saved. Changes made by altering the filter or sort criteria directly on a panel are discarded as soon as another panel is displayed.
When you exit a panel you have customized, the Confirm Screen Customization pop-up panel (Figure 18) is displayed:
Figure 18 Confirm Screen Customization pop-up panel
■ To save your changes, press Enter
The next time you access TriTune, the customized version of the panel is displayed.
■ To discard your customized panel and restore the original version, press End.
|TriTune --------- Confirm Screen Customization ----------------|| || ||Screen TUNDACT has been customized. To save the customized || screen, press ENTER . To cancel any changes, enter END . ||_______________________________________________________________|
Chapter 2 Working in the TriTune environment 59

Saving the information on a panel
Saving the information on a panelTriTune allows you to save the data displayed on any panel for later use by exporting the information to an ISPF data set. You can then include the data in another report, download the data for use in a PC spreadsheet program, or perform many other operations.
Exporting a panel
1 Display the panel that you want to export; for example, CodeView.
2 On the COMMAND line, type EXPORT.
3 Press Enter.
The Screen Export Information panel (Figure 19) is displayed:
Figure 19 Screen Export Information panel
4 Type the name of the data set and member to which you want to export the panel in the ISPF library fields or Other partitioned or sequential data set field.
TriTune --------- Screen Export for: CodeView --------------COMMAND ===> ISPF library: Project ===> Group ===> Type ===> Member ===> (Blank or pattern for member selection list) Other partitioned or sequential dataset: Dataset name ===> Volume serial ===> (If not cataloged) Export options: Disposition ===> REPLACE (Replace or Append) Edit after export ===> NO (Yes or No) Output format ===> CSV (CSV or ASIS) Rows ===> ALL (All or Filtered) Press ENTER to export screen or END to exit with no export
60 TriTune User Guide

Saving the information on a panel
5 Specify the four parameters for Export options, as described in Table 4.
6 Press End to end the edit session and save the data or type CANCEL to quit without saving.
Table 4 Screen export options
Field name Value
Disposition Specify Replace if you want to replace an existing data set.
Specify Append to add the data at the bottom of the existing data set or member.
Edit after export ■ Specify NO to transfer the data to the specified data set and return to the TriTune panel. You may edit the data at a later time.
■ Specify YES to transfer to the data set and member in standard ISPF edit mode.
Note that for performance reasons, TriTune sets the ISPF RECOVERY parameter to OFF.
Output format Specify ASIS if you want the format to appear as it does online.
Specify CSV if you want the exported data to be in Comma Separated Value format. The CSV format is useful if you are downloading TriTune data to a spreadsheet.
Note that if you have set your ISPF decimal delimiter variable (ZDEC) to a value other than a decimal point (.), a semicolon (;) is used instead of a comma (,) to separate the values.
Rows Specify ALL if you want to ignore any filters that might be in effect and export all the data.
Specify FILTERED to export the data as displayed on the panel.
NOTE The amount of data exported is determined by the size of the data set to which you export, not by the size of your terminal display. For example, suppose you have an 80-byte terminal monitor and must scroll to the right to see all the fields on a particular panel.
When you export the panel to a 121-character data set, TriTune exports the full 121 characters worth of data, not just the 80 bytes currently visible.
If you are planning to create a data set expressly to export TriTune panels, it is recommended that the data set be allocated with a logical record length of 589 characters, which will accommodate the widest TriTune panel.
Chapter 2 Working in the TriTune environment 61

Saving the information on a panel
Writing data from a table to SYSOUT
The Report primary command enables you to write the data displayed in a TriTune panel to a SYSOUT data set.
1 On the COMMAND line on a TriTune panel, type REPORT.
2 Press Enter.
The Screen Report Information panel (Figure 20) is displayed:
Figure 20 Screen report information panel
3 Specify each of the fields as explained in Table 5.
NOTE If the Report command is not available for a particular panel, TriTune issues a message
TriTune --------- Report for: CodeView ---------------------COMMAND ===> Output Information: SYSOUT class ===> A Lines per page ===> 60 (from 10 to 99) Report width ===> 133 (from 80 to 255) Carriage control ===> ANSI (ANSI or MACHINE) Destination ID ===> (Valid JES DESTID or blank) Report form ===> (Valid JES form name or blank) Table Format Information: Include rows ===> FILTERED (ALL or FILTERED) User Data: User heading ===> Press ENTER to generate report or END to exit with no report
Table 5 Screen report information input fields (part 1 of 2)
Field name Value
SYSOUT class Specify the JES SYSOUT class for the printed report.
Lines per page Specify the number of lines, including the header, to be written to a single page before a new page is initiated.
Report width Specify the width of the report. If there are columns to the left of the panel, they are included in the report up to the width of the report.
Carriage control Specify whether ANSI or MACHINE carriage control characters are to be used.
62 TriTune User Guide
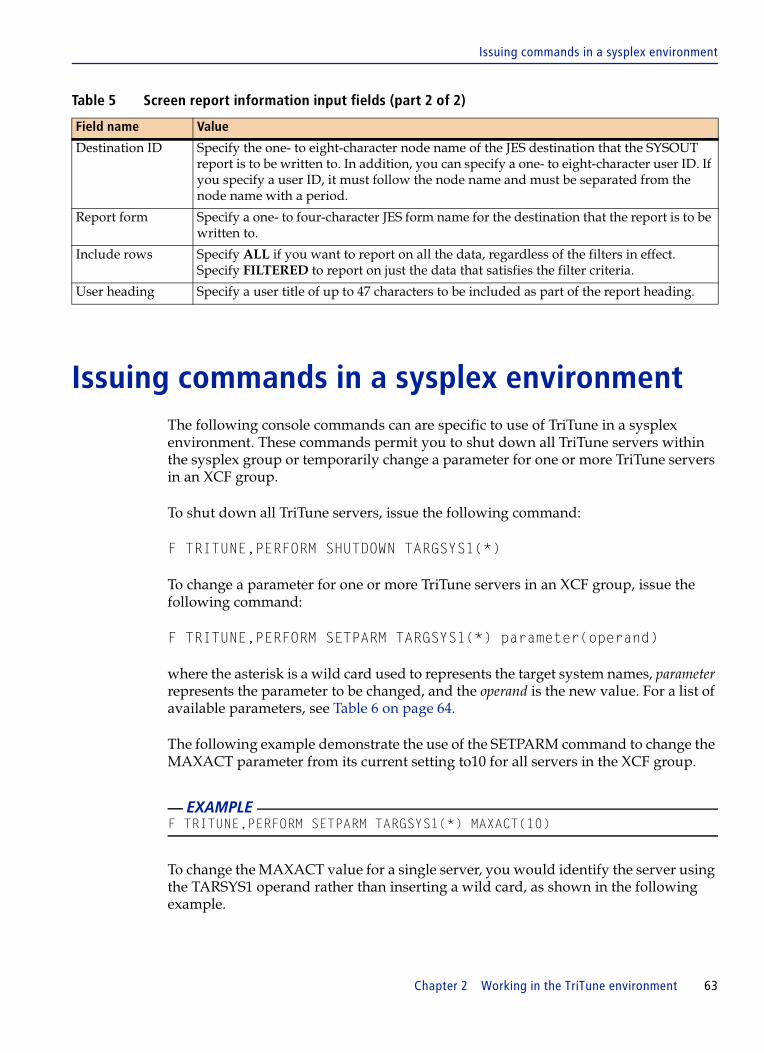
Issuing commands in a sysplex environment
Issuing commands in a sysplex environmentThe following console commands can are specific to use of TriTune in a sysplex environment. These commands permit you to shut down all TriTune servers within the sysplex group or temporarily change a parameter for one or more TriTune servers in an XCF group.
To shut down all TriTune servers, issue the following command:
F TRITUNE,PERFORM SHUTDOWN TARGSYS1(*)
To change a parameter for one or more TriTune servers in an XCF group, issue the following command:
F TRITUNE,PERFORM SETPARM TARGSYS1(*) parameter(operand)
where the asterisk is a wild card used to represents the target system names, parameter represents the parameter to be changed, and the operand is the new value. For a list of available parameters, see Table 6 on page 64.
The following example demonstrate the use of the SETPARM command to change the MAXACT parameter from its current setting to10 for all servers in the XCF group.
To change the MAXACT value for a single server, you would identify the server using the TARSYS1 operand rather than inserting a wild card, as shown in the following example.
Destination ID Specify the one- to eight-character node name of the JES destination that the SYSOUT report is to be written to. In addition, you can specify a one- to eight-character user ID. If you specify a user ID, it must follow the node name and must be separated from the node name with a period.
Report form Specify a one- to four-character JES form name for the destination that the report is to be written to.
Include rows Specify ALL if you want to report on all the data, regardless of the filters in effect. Specify FILTERED to report on just the data that satisfies the filter criteria.
User heading Specify a user title of up to 47 characters to be included as part of the report heading.
EXAMPLE F TRITUNE,PERFORM SETPARM TARGSYS1(*) MAXACT(10)
Table 5 Screen report information input fields (part 2 of 2)
Field name Value
Chapter 2 Working in the TriTune environment 63
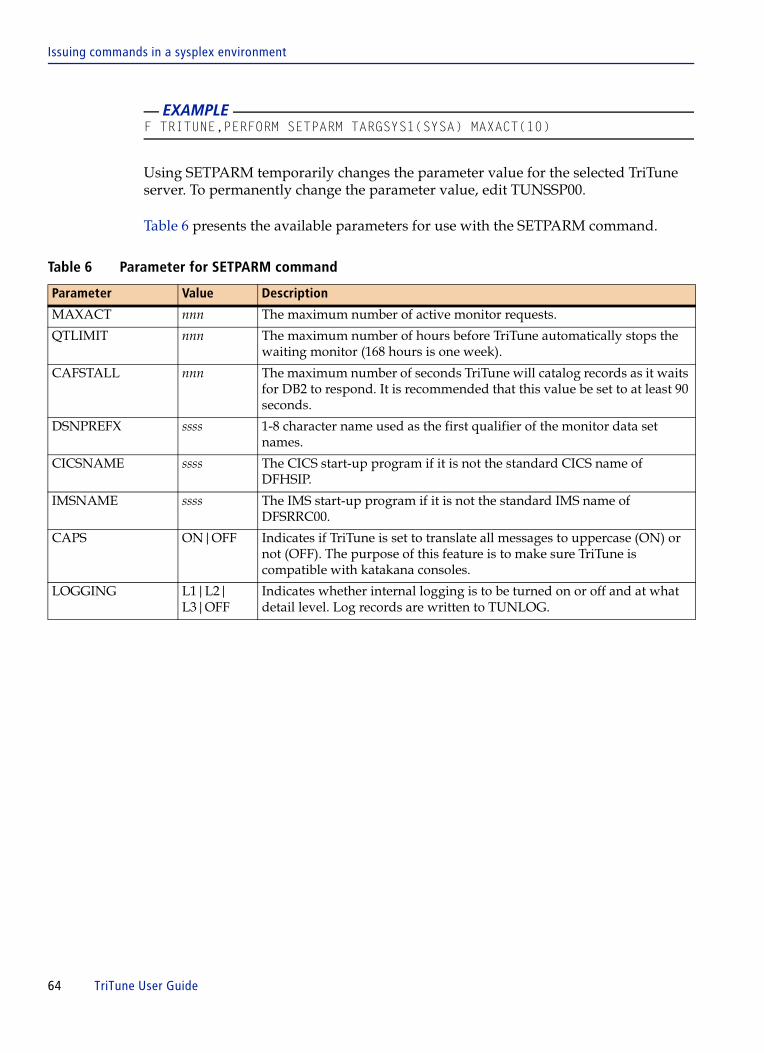
Issuing commands in a sysplex environment
Using SETPARM temporarily changes the parameter value for the selected TriTune server. To permanently change the parameter value, edit TUNSSP00.
Table 6 presents the available parameters for use with the SETPARM command.
EXAMPLE F TRITUNE,PERFORM SETPARM TARGSYS1(SYSA) MAXACT(10)
Table 6 Parameter for SETPARM command
Parameter Value Description
MAXACT nnn The maximum number of active monitor requests.
QTLIMIT nnn The maximum number of hours before TriTune automatically stops the waiting monitor (168 hours is one week).
CAFSTALL nnn The maximum number of seconds TriTune will catalog records as it waits for DB2 to respond. It is recommended that this value be set to at least 90 seconds.
DSNPREFX ssss 1-8 character name used as the first qualifier of the monitor data set names.
CICSNAME ssss The CICS start-up program if it is not the standard CICS name of DFHSIP.
IMSNAME ssss The IMS start-up program if it is not the standard IMS name of DFSRRC00.
CAPS ON|OFF Indicates if TriTune is set to translate all messages to uppercase (ON) or not (OFF). The purpose of this feature is to make sure TriTune is compatible with katakana consoles.
LOGGING L1|L2| L3|OFF
Indicates whether internal logging is to be turned on or off and at what detail level. Log records are written to TUNLOG.
64 TriTune User Guide

C h a p t e r 3
3 Setting up a monitor definitionThis chapter describes how to create and manage monitor definitions. The following topics are discussed:
Samples and observations. . . . . . . . . . . . . . . . . . . . . . . . . . . . . . . . . . . . . . . . . . . . . . . . . . 66Sampling rules . . . . . . . . . . . . . . . . . . . . . . . . . . . . . . . . . . . . . . . . . . . . . . . . . . . . . . . . 66
What is a monitor definition?. . . . . . . . . . . . . . . . . . . . . . . . . . . . . . . . . . . . . . . . . . . . . . . 67Invoking a monitor definition . . . . . . . . . . . . . . . . . . . . . . . . . . . . . . . . . . . . . . . . . . . 67
Analyzing monitor data . . . . . . . . . . . . . . . . . . . . . . . . . . . . . . . . . . . . . . . . . . . . . . . . . . . 68Creating a monitor definition. . . . . . . . . . . . . . . . . . . . . . . . . . . . . . . . . . . . . . . . . . . . . . . 68
Adding a monitor definition . . . . . . . . . . . . . . . . . . . . . . . . . . . . . . . . . . . . . . . . . . . . 72Specifying target systems for parallel sysplex . . . . . . . . . . . . . . . . . . . . . . . . . . . . . 76Determining number of observations to take and total time to monitor . . . . . . . 77Specifying additional monitoring criteria . . . . . . . . . . . . . . . . . . . . . . . . . . . . . . . . . 78Monitoring criteria for ALL JOBS . . . . . . . . . . . . . . . . . . . . . . . . . . . . . . . . . . . . . . . . 78Scheduling . . . . . . . . . . . . . . . . . . . . . . . . . . . . . . . . . . . . . . . . . . . . . . . . . . . . . . . . . . . 78Additional monitoring criteria . . . . . . . . . . . . . . . . . . . . . . . . . . . . . . . . . . . . . . . . . . 79Including and excluding tasks. . . . . . . . . . . . . . . . . . . . . . . . . . . . . . . . . . . . . . . . . . . 79Monitoring criteria for CICS . . . . . . . . . . . . . . . . . . . . . . . . . . . . . . . . . . . . . . . . . . . . 81Monitoring criteria for IMS . . . . . . . . . . . . . . . . . . . . . . . . . . . . . . . . . . . . . . . . . . . . . 82Monitoring criteria for Adabas . . . . . . . . . . . . . . . . . . . . . . . . . . . . . . . . . . . . . . . . . . 83Monitoring criteria for Natural . . . . . . . . . . . . . . . . . . . . . . . . . . . . . . . . . . . . . . . . . . 84Monitoring criteria for CA-DATACOM . . . . . . . . . . . . . . . . . . . . . . . . . . . . . . . . . . . 85Monitoring criteria for CA-Ideal . . . . . . . . . . . . . . . . . . . . . . . . . . . . . . . . . . . . . . . . . 86Monitoring criteria for WebSphere Application Server . . . . . . . . . . . . . . . . . . . . . . 87Copying a monitor Definition . . . . . . . . . . . . . . . . . . . . . . . . . . . . . . . . . . . . . . . . . . . 88Editing a monitor definition . . . . . . . . . . . . . . . . . . . . . . . . . . . . . . . . . . . . . . . . . . . . 88Deleting a monitor definition . . . . . . . . . . . . . . . . . . . . . . . . . . . . . . . . . . . . . . . . . . . 89
Creating a multijob monitor: grouping. . . . . . . . . . . . . . . . . . . . . . . . . . . . . . . . . . . . . . . 90Creating a monitor schedule . . . . . . . . . . . . . . . . . . . . . . . . . . . . . . . . . . . . . . . . . . . . . . . 93
Chapter 3 Setting up a monitor definition 65

Samples and observations
Samples and observationsStarting with release 4.0 of TriTune, there is a change in the definition of how samples are gathered.
Formerly, when you requested the number of samples to be gathered, the request was actually for the number of times TriTune observes the complete activity of the address space. That is, the request was for the number of times the address space is swapped out, nondisptachable, delayed by LPAR/disabled work, actively using CPU, and waiting. Only the last two activities (actively using CPU and waiting) actually generate samples.
Because of this situation, TriTune is introducing the concept of Observations and Samples. When you define how an address space is to be monitored (measured), you will request the number of times the address space activity is observed. Observations and observation rate are the only things you can influence, because you cannot predict beforehand the number samples that TriTune will gather.
A sample within TriTune reflects the activity of a TCB during an observation. The number of samples per observations can fluctuate tremendously from 0 to the total number of TCBs attached at the time of the observation.
So, an observation is the number and rate that TriTune will examine the activity of the address space to be measured. A sample is created to reflect the activity of a TCB during an observation. There can be many samples gathered during an observation or 0 samples gathered, depending on the activity.
Sampling rules
When samples are created to reflect the activity of a TCB, there are certain rules which determine if the sample shows any noteworthy activity. These rules are as follows:
■ If a TCB is actively using the CPU, a sample is always written for the TCB.
■ If the TCB is waiting and is not the jobstep task (subtask) and the ECB that the TCB is waiting for cannot be related to anything that TriTune reports (file activity, database activity, and so on), the sample is discarded. For instance, if a subtask is waiting for an ECB for an internal work queue that is only known to the application, the sample is discarded. If the ECB relates to file activity, the sample is considered noteworthy and is written to the monitor file.
■ If the TCB is the jobstep TCB, all waiting activity is recorded with one exception. If the ECB or an ECB within an ECB list contains the termination ECB of a subtask, the waiting sample for the jobstep TCB is discarded. It is assumed by TriTune that if a task waits for a subtask to be completed, it is performing the same functionality as a LINK but doing it with ATTACH instead.
66 TriTune User Guide

What is a monitor definition?
Because of these rules, there can be large fluctuations in % Samples Active and % Samples Waiting. Without knowledge about the application and the address space type, the numbers might appear to be invalid in a multitasking and multi-CPU environment.
What is a monitor definition?A monitor definition tells TriTune which program to monitor. It specifies details about the job step and its programs, transactions, 4GL languages, or external databases. You create a monitor definition by specifying a set of monitoring criteria. You invoke a monitor definition to collect a set of sample data for analysis.
TriTune maintains monitor definitions across TriTune sessions. This feature allows you to reuse the same monitor definition when you want to repeat a certain analysis after making changes to the program code based on a previous analysis. You can examine the impact of your changes by using this iterative approach to performance tuning. For each subsequent invocation of a monitor definition, you do not need to respecify data which ensures that TriTune uses the same monitoring criteria.
Invoking a monitor definition
A monitor definition becomes a monitor request from the time it is invoked until the observation and sampling processes are complete. The TriTune Server Space tracks the monitor requests of all TriTune users on the z/OS image on which TriTune is active. Any number of monitor requests can be active at the same time, depending on the value that is specified on the MAXACT TRPARM parameter. See the TriTune Installation and Customization Guide.
A monitor can be invoked in the following ways:
■ by invoking a monitor definition for managed or scheduled monitoring■ by choosing a job that is actively running for immediate results■ from outside the TSO Client for automated operations
Monitor requests are written to the Global Information File (GIF), which allows for persistence of the request, even if the TriTune Server Space is deactivated or if the entire system is shut down. When the Server Space is started through a batch job or during IPL, it reads the monitor request from the GIF and reinstates any waiting monitor requests.
Refer to Chapter 4, “Invoking a monitor” for more information.
Chapter 3 Setting up a monitor definition 67

Analyzing monitor data
You can invoke a monitor automatically when you exit the Monitoring Criteria panel. Specify YES or CONFIRM in the Invoke Monitor field on the Profile Parameters panel.
Figure 21 Profile Parameters panel
Analyzing monitor dataAfter the monitor request terminates, you can analyze the data you collected by using the Interactive Analysis Facility. Refer to Chapter 5, “Analyzing monitor data” for more information.
Creating a monitor definition Before TriTune begins monitoring a program, you must create a monitor definition that describes the target program and the observaton criteria. To create a monitor definition:
1 From the Primary Option Menu, select Option 1.
The Monitor Definition panel is displayed (see Figure 22 on page 69).
TriTune ---------------------- Profile Parameters -----------------------------COMMAND ===> Status: ACTIVE More: + General TriTune Server ID ===> TRITUNE Confirm deletes ===> N Invoke monitor ===> YES (when exiting Monitor Criteria panel) Batch reports ===> N (automatically generate reports)
68 TriTune User Guide
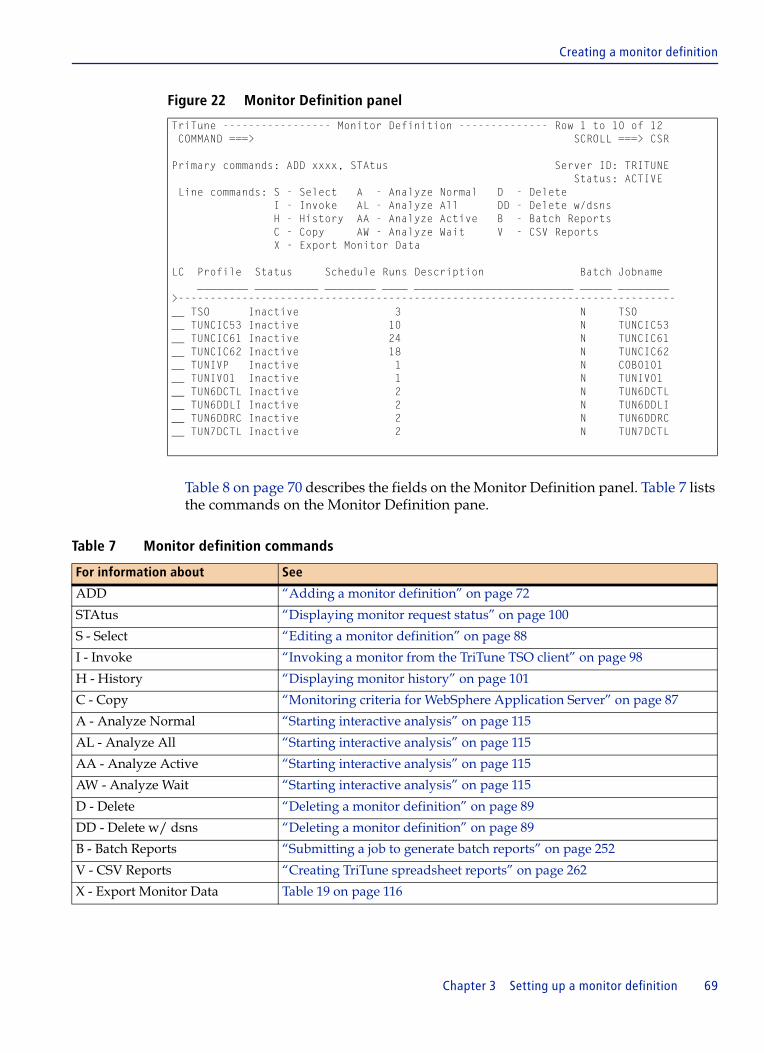
Creating a monitor definition
Figure 22 Monitor Definition panel
Table 8 on page 70 describes the fields on the Monitor Definition panel. Table 7 lists the commands on the Monitor Definition pane.
TriTune ----------------- Monitor Definition -------------- Row 1 to 10 of 12 COMMAND ===> SCROLL ===> CSR
Primary commands: ADD xxxx, STAtus Server ID: TRITUNE Status: ACTIVE Line commands: S - Select A - Analyze Normal D - Delete I - Invoke AL - Analyze All DD - Delete w/dsns H - History AA - Analyze Active B - Batch Reports C - Copy AW - Analyze Wait V - CSV Reports X - Export Monitor Data
LC Profile Status Schedule Runs Description Batch Jobname ________ __________ ________ ____ _________________________ _____ ________>------------------------------------------------------------------------------__ TSO Inactive 3 N TSO __ TUNCIC53 Inactive 10 N TUNCIC53 __ TUNCIC61 Inactive 24 N TUNCIC61 __ TUNCIC62 Inactive 18 N TUNCIC62 __ TUNIVP Inactive 1 N COB0101 __ TUNIV01 Inactive 1 N TUNIV01 __ TUN6DCTL Inactive 2 N TUN6DCTL __ TUN6DDLI Inactive 2 N TUN6DDLI __ TUN6DDRC Inactive 2 N TUN6DDRC __ TUN7DCTL Inactive 2 N TUN7DCTL
Table 7 Monitor definition commands
For information about See
ADD “Adding a monitor definition” on page 72
STAtus “Displaying monitor request status” on page 100
S - Select “Editing a monitor definition” on page 88
I - Invoke “Invoking a monitor from the TriTune TSO client” on page 98
H - History “Displaying monitor history” on page 101
C - Copy “Monitoring criteria for WebSphere Application Server” on page 87
A - Analyze Normal “Starting interactive analysis” on page 115
AL - Analyze All “Starting interactive analysis” on page 115
AA - Analyze Active “Starting interactive analysis” on page 115
AW - Analyze Wait “Starting interactive analysis” on page 115
D - Delete “Deleting a monitor definition” on page 89
DD - Delete w/ dsns “Deleting a monitor definition” on page 89
B - Batch Reports “Submitting a job to generate batch reports” on page 252
V - CSV Reports “Creating TriTune spreadsheet reports” on page 262
X - Export Monitor Data Table 19 on page 116
Chapter 3 Setting up a monitor definition 69

Creating a monitor definition
Table 8 Monitor Definition fields (part 1 of 3)
Field name Description
Profile profile name specified when you created the monitor definition
This field is also referred to as the Monitor Definition name.
Status status of the monitor request
Status is refreshed each time you press Enter. Status contains one of the following values:
■ Waiting - The request has been submitted to TriTune but the target is not active. TriTune is waiting for an opportunity to begin monitoring the target application.
■ Active - TriTune is actively monitoring the indicated target. (Observations are being taken and samples are being collected.)
■ Inactive - The monitor definition is available, but the TriTune Server Space has not been requested to begin monitoring.
■ Delete - The request is no longer tracked by the TriTune Server Space. Output data is available in the monitor data set.
■ Incomplete - The request is no longer tracked by the TriTune Server Space. The output data set is not found.
■ Unknown - Communications could not be established with the TriTune Server Space. The Server Space might need to be activated.
Schedule name of an associated schedule for the monitor to run
Runs number of monitor invocations since the definition was created
This value is the number of data sets that are available in the Monitor History panel.
Description text describing the monitor definition
Batch indicates whether a preset series of reports are created in batch mode after the monitor is complete
Jobname name of the job to be monitored
Scroll right to display the following fields:
Procstep name of the procedure step to be monitored if the job step uses a cataloged or in-stream procedure
Stepname name of the job step to be monitored
If no cataloged procedure is used, displays the step name on the EXEC statement that invoked the program. If a cataloged procedure is used, displays the name of the step that invoked the procedure.
Program name of the program on the JCL EXEC statement of the job to be monitored
Multi-Step Monitoring
indicates if the profile has multistep monitoring specified
Step Monitoring indicates if the profile specifies that the entire job step is to be monitored
Userid TSO user ID of the user who last invoked the monitor definition
70 TriTune User Guide

Creating a monitor definition
Date date of the last monitor to be analyzed
Time time of the last monitor to be analyzed
Monitor Dataset data set name of the file to monitor for each profile
This name will generally contain variables. See the TriTune Installation and Customization Guide for a complete description.
Actual Dataset data set name of the monitor data set with variables substituted
TCB incl-1to TCB incl-4
tasks identified by these names are included in the monitor
No other tasks are monitored.
TCB excl-1to TCB excl-4
tasks identified by these names are excluded from the monitor
All other tasks are monitored.
Observation Interval number of milliseconds between observations
TriTune calculates this number and adjusts it during the monitoring period.
Observations number of observations requested
Elapsed amount of time in seconds that the job step is monitored
Strt Delay delay in seconds for startup of the monitor request
You might want to specify a delay in order to skip monitoring the initialization functions within the job step.
Monitors per job step execution
number of monitoring sessions to be started for a single execution of a job step
When a monitor session reaches its target observation count, TriTune closes the monitor data set, and continues monitoring with a new monitor data set. When a monitor data set is closed, it is available for analysis. This process is known as successive monitoring.
The number is specified on the “Job Monitoring Criteria” panel (which appears from the All Jobs field of the Monitoring Criteria panel).
To specify successive monitoring, enter a value equal to or greater than 1 in the field: Run up to 0 monitors per job step execution
Number of job step runs to monitor
number of times a monitor is to be run for a job step
This field allows for multiple monitor runs for only one invocation.
The number is specified on the “Job Monitoring Criteria” panel (which appears from the All Jobs field of the Monitoring Criteria panel).
To specify recurrent monitoring, enter a value equal to or greater than 1 in the field:
Monitor this job the next 0 times it runs
Table 8 Monitor Definition fields (part 2 of 3)
Field name Description
Chapter 3 Setting up a monitor definition 71

Creating a monitor definition
Adding a monitor definition
1 On the COMMAND line, type ADD xxxx to add a new monitor definition where xxxx is a one- to eight-character unique identifier for the monitor definition.
The identifier is maintained as the profile name for the monitor you are adding. Profile names are displayed on the Monitor Definition panel and are sorted alphabetically.
2 Press Enter.
The Monitoring Criteria panel (Figure 23 on page 73) is displayed.
Strt Window start of a time range during which the monitor request is valid
If the job step to be monitored ends before the start time, the monitor will not start. If the job step is running at the start time, monitoring begins at that time.
End Window end time of a time range during which the monitor request is valid
If the job step to be monitored does not start before the end time, the monitor request is cancelled.
DB exit name of the exit routine for monitoring either Adabas or CA-Datacom
4GL exit name of the exit routine for monitoring Natural, REXX, Adabase, or CA-Ideal
Target 1- Target 4 target systems in a sysplex where a job will be monitored
Blank specifies local system only. “*” specifies all systems in the sysplex.
Trans. 1 - Trans. 4 transaction codes to be monitored for IMS and CICS jobs only
Term 1 - Term 4
terminal IDs to be monitored for IMS and CICS jobs only
User 1 - User 4
user IDs to be monitored for IMS and CICS jobs only
OLTP type of transaction processing system, if any, that was monitored for IMS and CICS jobs only
Tasklib specifies the name of an alternate DDNAME from which the monitored program loads other programs
TriTune requires the location of program load modules to obtain the information required to display CSECT offsets during analysis.
Table 8 Monitor Definition fields (part 3 of 3)
Field name Description
72 TriTune User Guide
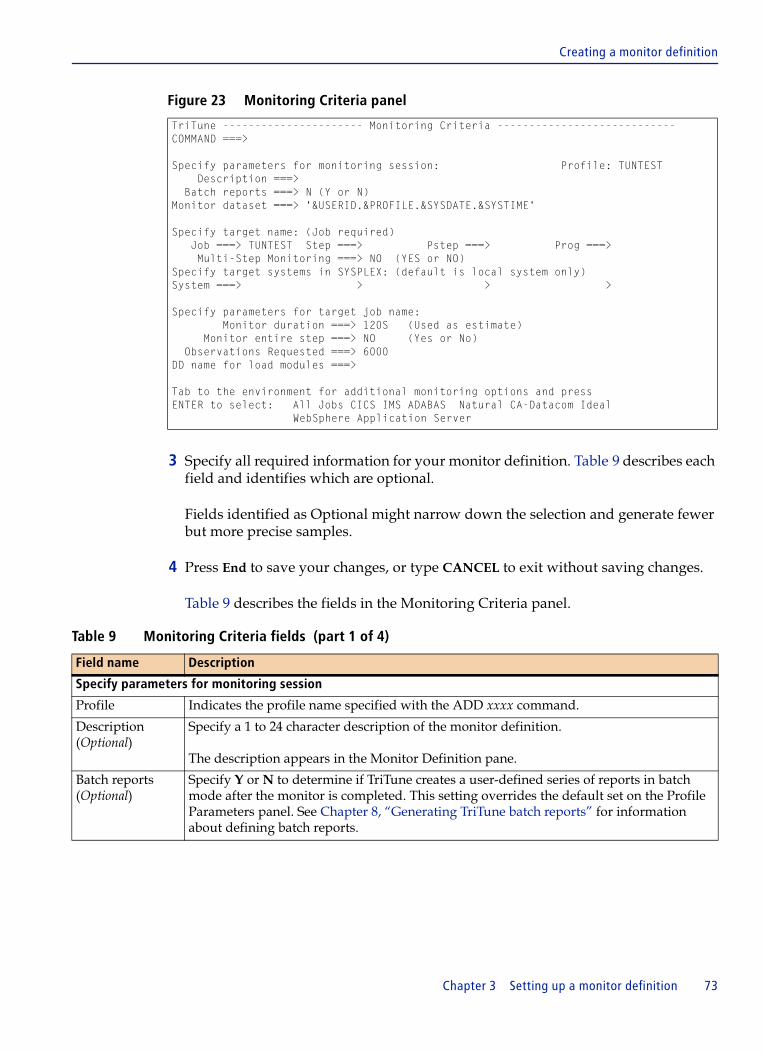
Creating a monitor definition
Figure 23 Monitoring Criteria panel
3 Specify all required information for your monitor definition. Table 9 describes each field and identifies which are optional.
Fields identified as Optional might narrow down the selection and generate fewer but more precise samples.
4 Press End to save your changes, or type CANCEL to exit without saving changes.
Table 9 describes the fields in the Monitoring Criteria panel.
TriTune ---------------------- Monitoring Criteria ----------------------------COMMAND ===> Specify parameters for monitoring session: Profile: TUNTEST Description ===> Batch reports ===> N (Y or N) Monitor dataset ===> '&USERID.&PROFILE.&SYSDATE.&SYSTIME' Specify target name: (Job required) Job ===> TUNTEST Step ===> Pstep ===> Prog ===> Multi-Step Monitoring ===> NO (YES or NO) Specify target systems in SYSPLEX: (default is local system only) System ===> > > > Specify parameters for target job name: Monitor duration ===> 120S (Used as estimate) Monitor entire step ===> NO (Yes or No) Observations Requested ===> 6000DD name for load modules ===> Tab to the environment for additional monitoring options and press ENTER to select: All Jobs CICS IMS ADABAS Natural CA-Datacom Ideal WebSphere Application Server
Table 9 Monitoring Criteria fields (part 1 of 4)
Field name Description
Specify parameters for monitoring session
Profile Indicates the profile name specified with the ADD xxxx command.
Description(Optional)
Specify a 1 to 24 character description of the monitor definition.
The description appears in the Monitor Definition pane.
Batch reports(Optional)
Specify Y or N to determine if TriTune creates a user-defined series of reports in batch mode after the monitor is completed. This setting overrides the default set on the Profile Parameters panel. See Chapter 8, “Generating TriTune batch reports” for information about defining batch reports.
Chapter 3 Setting up a monitor definition 73

Creating a monitor definition
Monitor dataset Specify the name of the data set to receive the output data from the monitor request. Each node of the monitor data set might contain either fixed text or one of the following variables:
■ &USERID - TSO ID of the user who initiated the monitor request■ &PREFIX - TSO prefix or value specified in TUNCALL PREFIX keyword■ &PGMNAME - program name obtained at ATTACH time■ &PROFILE - name of the monitor definition profile used to start the request■ &SYSTIME - time that a request was initiated, in the following format: ‘T’hhmmsst■ &SYSDATE - date that a request was initiated, in the following format: ‘D’ccyyddd■ &SYSNAME - z/OS system name■ &JOBNAME - name of the job■ &STEPNAME - name of the job step ■ &PROCSTEP - name of the procedure step■ &JOBID - JES job identification number
If the data set name is not enclosed in quotation marks, the user prefix is appended as the first node of the name. See the TriTune Installation and Customization Guide for more information.
Specify target name
Job(Required)
Type the name of the job to monitor. Use the * wildcard character to match multiple characters and the + wildcard character to match any single character.
Step(Optional)
Type the name of the step to monitor. Within a multistep job that uses cataloged procedures, you must specify a Step name and a Pstep name or a Program name to select the correct program.
If the target of the Step name is a cataloged procedure or an instream procedure, you must further define the step that you want to monitor by using Pstep name.
P-step(Optional)
Type the name of the procedure step to monitor. Use this parameter only if the job step uses a cataloged or instream procedure.
Prog(Optional)
Type the name of the program to monitor.
If you do not specify Program name, you must specify Step name, as well as Pstep name, when appropriate.
Multi-Step Monitoring
Specify YES if TriTune is to monitor every job step that matches the criteria that is specified in the Step, Pstep, and Prog fields of the Monitoring Criteria panel.
Specify NO if only the first job step that matches the criteria should be monitored.
If you specify YES, the results will be collected into multiple data sets and each data set will have to be analyzed.
Specify target systems in SYSPLEX
System Type the name of the target systems in the System fields. You can specify up to four system names. Each name can specify a single system or a generic name by using a wildcard indicator; for example, PR*. The default is blank, which specifies the local system only. “*” specifies all systems in the sysplex. See “Specifying target systems for parallel sysplex” on page 76.
Table 9 Monitoring Criteria fields (part 2 of 4)
Field name Description
74 TriTune User Guide
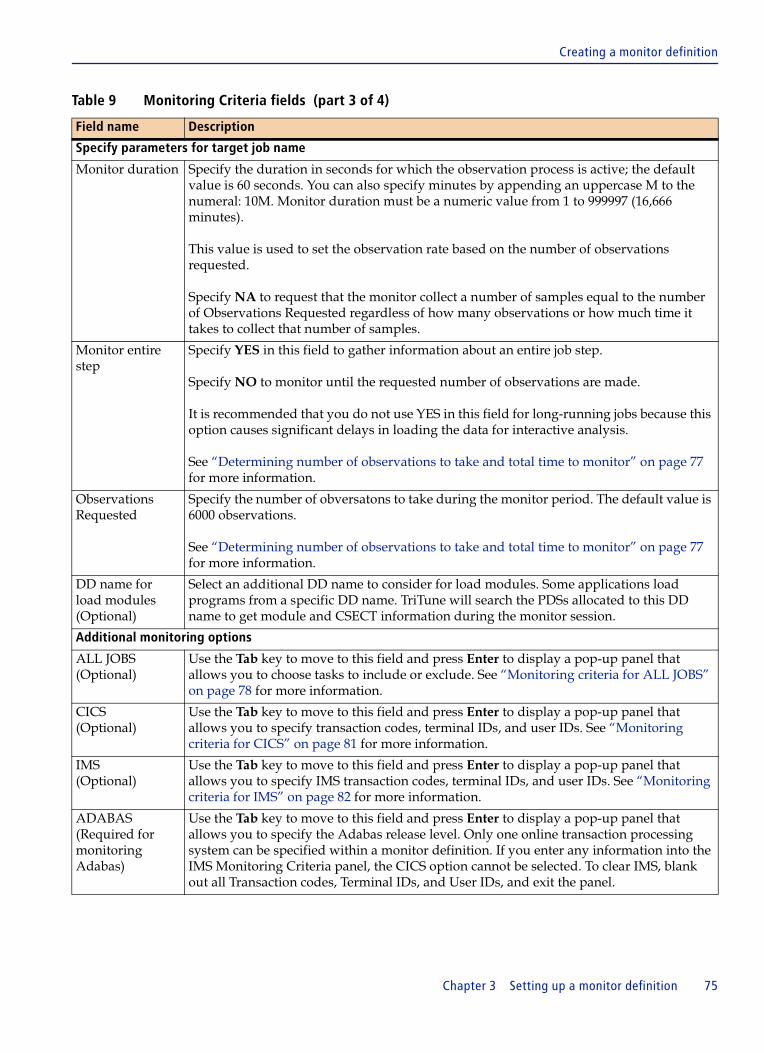
Creating a monitor definition
Specify parameters for target job name
Monitor duration Specify the duration in seconds for which the observation process is active; the default value is 60 seconds. You can also specify minutes by appending an uppercase M to the numeral: 10M. Monitor duration must be a numeric value from 1 to 999997 (16,666 minutes).
This value is used to set the observation rate based on the number of observations requested.
Specify NA to request that the monitor collect a number of samples equal to the number of Observations Requested regardless of how many observations or how much time it takes to collect that number of samples.
Monitor entire step
Specify YES in this field to gather information about an entire job step.
Specify NO to monitor until the requested number of observations are made.
It is recommended that you do not use YES in this field for long-running jobs because this option causes significant delays in loading the data for interactive analysis.
See “Determining number of observations to take and total time to monitor” on page 77 for more information.
Observations Requested
Specify the number of obversatons to take during the monitor period. The default value is 6000 observations.
See “Determining number of observations to take and total time to monitor” on page 77 for more information.
DD name for load modules(Optional)
Select an additional DD name to consider for load modules. Some applications load programs from a specific DD name. TriTune will search the PDSs allocated to this DD name to get module and CSECT information during the monitor session.
Additional monitoring options
ALL JOBS(Optional)
Use the Tab key to move to this field and press Enter to display a pop-up panel that allows you to choose tasks to include or exclude. See “Monitoring criteria for ALL JOBS” on page 78 for more information.
CICS(Optional)
Use the Tab key to move to this field and press Enter to display a pop-up panel that allows you to specify transaction codes, terminal IDs, and user IDs. See “Monitoring criteria for CICS” on page 81 for more information.
IMS(Optional)
Use the Tab key to move to this field and press Enter to display a pop-up panel that allows you to specify IMS transaction codes, terminal IDs, and user IDs. See “Monitoring criteria for IMS” on page 82 for more information.
ADABAS(Required for monitoring Adabas)
Use the Tab key to move to this field and press Enter to display a pop-up panel that allows you to specify the Adabas release level. Only one online transaction processing system can be specified within a monitor definition. If you enter any information into the IMS Monitoring Criteria panel, the CICS option cannot be selected. To clear IMS, blank out all Transaction codes, Terminal IDs, and User IDs, and exit the panel.
Table 9 Monitoring Criteria fields (part 3 of 4)
Field name Description
Chapter 3 Setting up a monitor definition 75
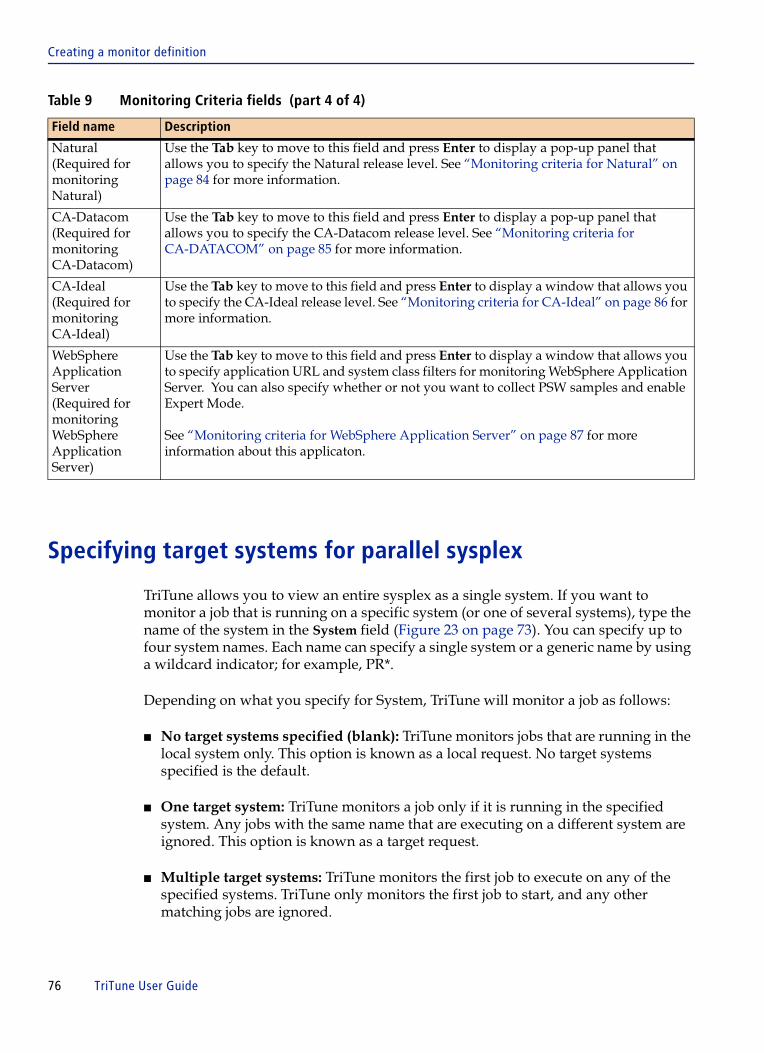
Creating a monitor definition
Specifying target systems for parallel sysplex
TriTune allows you to view an entire sysplex as a single system. If you want to monitor a job that is running on a specific system (or one of several systems), type the name of the system in the System field (Figure 23 on page 73). You can specify up to four system names. Each name can specify a single system or a generic name by using a wildcard indicator; for example, PR*.
Depending on what you specify for System, TriTune will monitor a job as follows:
■ No target systems specified (blank): TriTune monitors jobs that are running in the local system only. This option is known as a local request. No target systems specified is the default.
■ One target system: TriTune monitors a job only if it is running in the specified system. Any jobs with the same name that are executing on a different system are ignored. This option is known as a target request.
■ Multiple target systems: TriTune monitors the first job to execute on any of the specified systems. TriTune only monitors the first job to start, and any other matching jobs are ignored.
Natural(Required for monitoring Natural)
Use the Tab key to move to this field and press Enter to display a pop-up panel that allows you to specify the Natural release level. See “Monitoring criteria for Natural” on page 84 for more information.
CA-Datacom(Required for monitoring CA-Datacom)
Use the Tab key to move to this field and press Enter to display a pop-up panel that allows you to specify the CA-Datacom release level. See “Monitoring criteria for CA-DATACOM” on page 85 for more information.
CA-Ideal(Required for monitoring CA-Ideal)
Use the Tab key to move to this field and press Enter to display a window that allows you to specify the CA-Ideal release level. See “Monitoring criteria for CA-Ideal” on page 86 for more information.
WebSphere Application Server(Required for monitoring WebSphere Application Server)
Use the Tab key to move to this field and press Enter to display a window that allows you to specify application URL and system class filters for monitoring WebSphere Application Server. You can also specify whether or not you want to collect PSW samples and enable Expert Mode.
See “Monitoring criteria for WebSphere Application Server” on page 87 for more information about this applicaton.
Table 9 Monitoring Criteria fields (part 4 of 4)
Field name Description
76 TriTune User Guide
Creating a monitor definition
■ All systems: (*) TriTune monitors jobs that are running on all systems in the sysplex. TriTune only monitors the first job to start, and any other matching jobs are ignored.
Data is sent back to the local system for recording because allocation of a data set on the target system might be precluded by shared DASD restrictions, security, or SMS DASD policies. If the local system is not available, recording takes place on the target system.
Determining number of observations to take and total time to monitor
The accuracy of analysis by TriTune is determined primarily by the number of observations taken over a specified period. The number of observations made, and subsequently the number of samples taken, are determined by the values that you supply in the Monitor duration and the Observations Requested fields on the Monitor Criteria panel. The observation rate, which is how often an observation is taken, is calculated internally by TriTune.
For example, if you specify 6000 observations to be taken in 60 seconds, TriTune automatically calculates the observation rate as follows:
60 seconds ÷ 6000 observations = .01 seconds
For this situation, TriTune makes one observation every 10 milliseconds in the address space (if only one task is found).
As a minimum, TriTune takes the requested number of observations over a variable time frame. The actual number of observations taken might exceed the requested number of observations, but the number of observations considered for the reports is between the number of observations requested and no more than a maximum of 2 times the number of observations requested minus 1. This result assumes that the job step ran long enough to allow TriTune to capture the requested number of observations at the highest TriTune observation rate.
Under certain circumstances, you might need to take significantly more observations. However, taking more observations requires more analysis time. It is recommended that you take between 3000 and 10000 observations for an effective balance of accuracy and performance.
NOTE If you want to monitor the entire duration of a job step, specify YES in the Monitor entire step field.
Chapter 3 Setting up a monitor definition 77

Creating a monitor definition
Specifying additional monitoring criteria
The Monitoring Criteria panel contains fields that enable you to specify information specific to a particular environment. Navigate to the environment that you plan to monitor and press Enter to display a pop-up panel. Use the fields in the pop-up panel to specify the monitoring conditions to TriTune.
Monitoring criteria for ALL JOBS
Regardless of the type of job you are monitoring, you can select ALL JOBS to display the Job Monitoring Criteria panel (Figure 24).
Figure 24 Job Monitoring Criteria panel
Scheduling
You can limit the period where TriTune attempts to schedule a monitor session by either associating the request with a specific Schedule or specifying scheduling criteria that is specific to this monitor definition only. To use an existing schedule, either enter the name of the schedule, or enter a slash ( / ) to see a list of exiting Schedules. To specify unique scheduling criteria for this monitor definition, enter a plus sign ( + ).
For more information about schedules, refer to “Creating a monitor schedule” on page 93.
TriTune ---------------- Job Monitoring Criteria ---------------------- COMMAND ===> Scheduling: Current schedule ===> (enter a / for a list of schedules) Additional monitoring criteria: Run up to 0 monitors per jobstep execution Monitor this job the next 0 times it runs Delay monitoring 0 seconds after step start Call user written 4GL exit program for this monitor Call user written Data Base exit program for this monitor For all jobs: Tasks to include ===> > > > Tasks to exclude ===> > > > Press END to save and return to Monitor Criteria or CANCEL to discard changes.
78 TriTune User Guide

Creating a monitor definition
Additional monitoring criteria
With these fields, you can specify whether the profile has successive or recurrent monitoring associated with it. Refer to Table 10.
Including and excluding tasks
A subtask is a uniquely dispatchable unit of work within z/OS. Some jobs might have active serial subtasks to perform various work for the application.
Use the Tasks to include field to restrict monitoring to specific subtasks within the address space. Specify up to four tasks to be sampled in a multitasking environment.
Table 10 Additional monitoring criteria fields
Field name Description
Run up to Specify the number of monitoring sessions to be started for a single execution of a job step. When a monitor session reaches its target observation count, TriTune closes the monitor data set, and continues to monitor with a new monitor data set. The range is 1 to 9999.
When a monitor data set is closed, it is available for analysis.
Monitor this job Specify the number of times this job step will be monitored. The range is 1 to 9999. The default is 1. Specifying a larger value causes TriTune to monitor each recurrent execution of this job step until the specified limit is reached. This monitoring is especially useful for jobs that execute in response to some external event or job steps that you want to monitor every time they run. Specifying a value greater than 1 removes the need for reinvoking the monitor after the job has run the first time.
Delay monitoring Specify the delay (specified in seconds) for the startup of the monitor session. You might want to specify a delay in order to skip monitoring the initialization functions within the job step. The range is 1 to 9999.
Call user written 4GL Specify the name of a 4GL program to be called by TriTune during the monitor session.
4GL Exits allow TriTune to relate activity to the user-written Fourth-Generation Language statements that caused the activity, instead of the default of identifying only the service routines of the 4GL Language being used.
Call user written Data Base Specify the name of a database exit to be called by TriTune during the monitor session.
Database Exits allow TriTune to relate the database activity to the application components responsible for the activity, such as SQL statements of database calls invoked by application programs.
Chapter 3 Setting up a monitor definition 79
Creating a monitor definition
Use the Tasks to exclude field to omit up to four tasks from sampling in a multitasking environment. You might not want to monitor all subtasks within the address space if their functions have nothing to do with your application.
Use the * wildcard character to match multiple characters and the + wildcard character to match any single character.
After sampling is complete and you begin your analysis, use TaskView to display a list of the tasks that are monitored by TriTune. See “Interactive analysis option 1 - TaskView” on page 132 for more information.
NOTE If the Tasks to include field on the Job Monitoring Criteria panel contains an entry for DSNECP10, only one sample can be collected per observation taken into the region.
80 TriTune User Guide

Creating a monitor definition
Monitoring criteria for CICS
If you are monitoring a CICS job, select the CICS field to display the CICS Monitoring Criteria panel (Figure 25).
Figure 25 CICS Monitoring Criteria panel
Table 11 describes the fields in the CICS Monitoring Criteria panel.
Only one online transaction processing system can be specified within a monitor definition. If you enter any information into the CICS Monitoring Criteria panel, the IMS option cannot be selected. To cancel CICS, blank out all Transaction codes, Terminal IDs, and User IDs, and exit the panel.
TriTune ---------------- CICS Monitoring Criteria ------------------- COMMAND ===> For CICS transactions: Transaction codes ===> > > > Terminal IDs ===> > > > User IDs ===> > > > Specify values. Press END to return to Monitoring Criteria
Table 11 CICS Monitoring Criteria fields
Field name Description
Transaction codes Specify up to four CICS transaction codes to monitor. If you specify multiple transaction codes, they are ORed together.
Use the * wildcard character to match multiple characters and the + wildcard character to match any single character.
Terminal IDs Specify up to four CICS terminal IDs to monitor. If you specify multiple terminal IDs, they are ORed together.
Use the * wildcard character to match multiple characters and the + wildcard character to match any single character.
User IDs Specify up to four CICS user IDs to monitor. If you specify multiple user IDs, they are ORed together.
Use the * wildcard character to match multiple characters and the + wildcard character to match any single character.
If you specify a combination of transaction codes, terminal IDs, and user IDs, all criteria must be met.
Chapter 3 Setting up a monitor definition 81

Creating a monitor definition
Monitoring criteria for IMS
If you are monitoring an IMS job, you can select the IMS field to display the IMS Monitoring Criteria panel (Figure 26).
Figure 26 IMS Monitoring Criteria Panel
Table 12 describes the fields in the IMS Monitoring Criteria panel.
Only one online transaction processing system can be specified within a monitor definition. If you enter any information into the IMS Monitoring Criteria panel, the CICS option cannot be selected. To cancel IMS, blank out all Transaction codes, Terminal IDs, and User IDs, and exit the panel.
TriTune ----------------- IMS Monitoring Criteria ----------------- COMMAND ===> For IMS transactions: Transaction codes ===> > > > Terminal IDs ===> > > > User IDs ===> > > > Specify values. Press END to return to Monitoring Criteria
Table 12 IMS Monitoring Criteria fields
Field name Description
Transaction codes Specify up to four IMS transaction codes to monitor.
Use the * wildcard character to match multiple characters and the + wildcard character to match any single character.
Terminal IDs Specify up to four IMS terminal IDs to monitor.
Use the * wildcard character to match multiple characters and the + wildcard character to match any single character.
User IDs Specify up to four IMS user IDs to monitor.
Use the * wildcard character to match multiple characters and the + wildcard character to match any single character.
82 TriTune User Guide

Creating a monitor definition
Monitoring criteria for Adabas
Select the ADABAS field to display the Adabas Monitoring Criteria panel (Figure 27).
Figure 27 Adabas Monitoring Criteria panel
To use this panel, navigate to the release of Adabas that is running on your system and press Enter. If you are not running Adabas or do not want to use it for a particular monitor definition, navigate to NONE and press Enter. After you have selected the correct release, press End to exit the panel.
TriTune ------ ADABAS Monitoring Criteria ------------COMMAND ===>
For ADABAS applications:
Tab to the release of ADABAS you wish to monitor and press ENTER
6.1 6.2 7.1 7.4 NONE
Press END to return to Monitoring Criteria
NOTE Only one application type can be specified within a monitor definition. If you enter any information into the Adabas Monitoring Criteria panel, the CA-Datacom option cannot be selected. To cancel Adabas, select NONE and exit the panel.
Chapter 3 Setting up a monitor definition 83
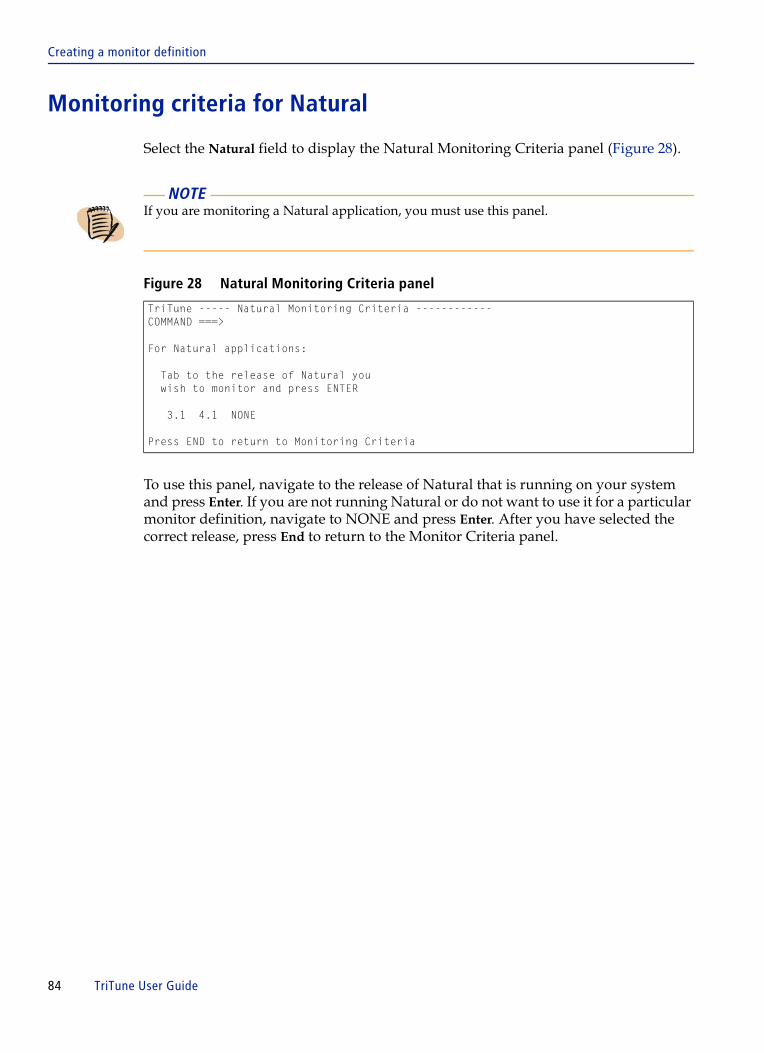
Creating a monitor definition
Monitoring criteria for Natural
Select the Natural field to display the Natural Monitoring Criteria panel (Figure 28).
Figure 28 Natural Monitoring Criteria panel
To use this panel, navigate to the release of Natural that is running on your system and press Enter. If you are not running Natural or do not want to use it for a particular monitor definition, navigate to NONE and press Enter. After you have selected the correct release, press End to return to the Monitor Criteria panel.
NOTE If you are monitoring a Natural application, you must use this panel.
TriTune ----- Natural Monitoring Criteria ------------COMMAND ===>
For Natural applications:
Tab to the release of Natural you wish to monitor and press ENTER
3.1 4.1 NONE
Press END to return to Monitoring Criteria
84 TriTune User Guide
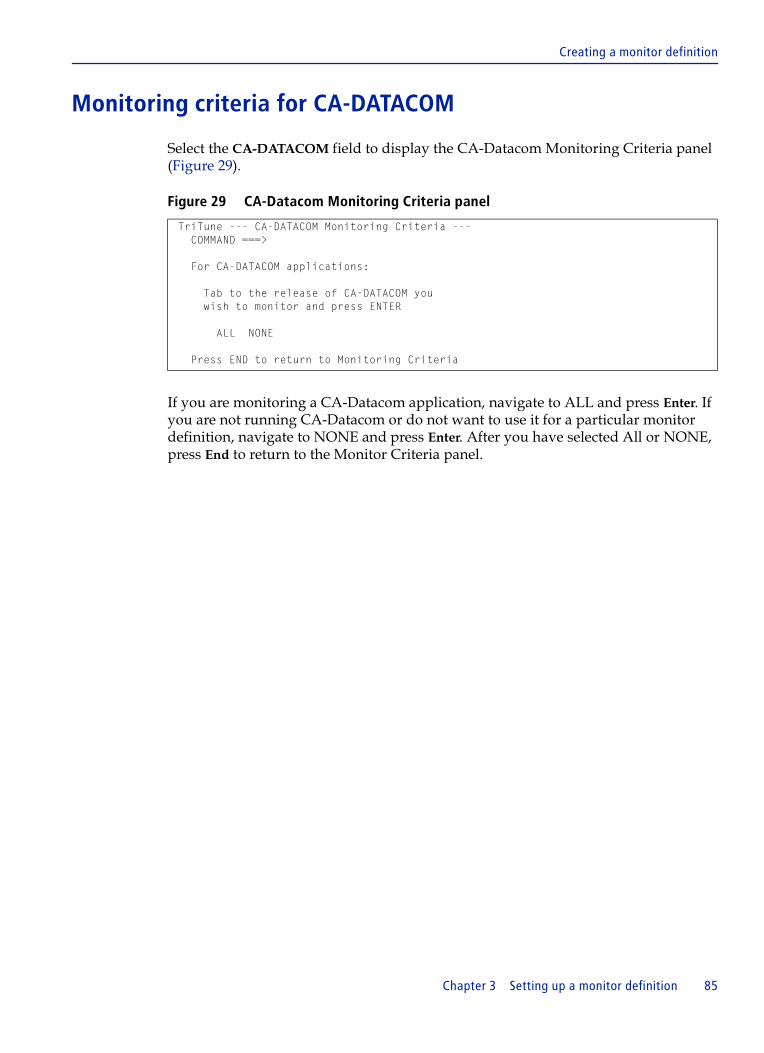
Creating a monitor definition
Monitoring criteria for CA-DATACOM
Select the CA-DATACOM field to display the CA-Datacom Monitoring Criteria panel (Figure 29).
Figure 29 CA-Datacom Monitoring Criteria panel
If you are monitoring a CA-Datacom application, navigate to ALL and press Enter. If you are not running CA-Datacom or do not want to use it for a particular monitor definition, navigate to NONE and press Enter. After you have selected All or NONE, press End to return to the Monitor Criteria panel.
TriTune --- CA-DATACOM Monitoring Criteria --- COMMAND ===> For CA-DATACOM applications: Tab to the release of CA-DATACOM you wish to monitor and press ENTER ALL NONE Press END to return to Monitoring Criteria
Chapter 3 Setting up a monitor definition 85

Creating a monitor definition
Monitoring criteria for CA-Ideal
Select the CA-Ideal field to display the CA-Ideal Monitoring Criteria panel (Figure 30 on page 86).
Figure 30 CA-Ideal Monitoring Criteria panel
To use this panel, navigate to the release of CA-Ideal that is running on your system and press Enter. If you are not running CA-Ideal or do not want to use it for a particular monitor definition, navigate to NONE and press Enter. After you have selected the correct release, press End to return to the Monitor Criteria panel.
NOTE Only one application type can be specified within a monitor definition. If you enter any information into the CA-Datacom Monitoring Criteria panel, the Adabas option cannot be selected.
NOTE If you are monitoring a CA-Ideal application, you must use this panel.
TriTune ------ Ideal Monitoring Criteria -----------COMMAND ===> For Ideal applications: Tab to the release of Ideal you wish to monitor and press ENTER 2.2 NONE Press END to return to Monitoring Criteria
86 TriTune User Guide
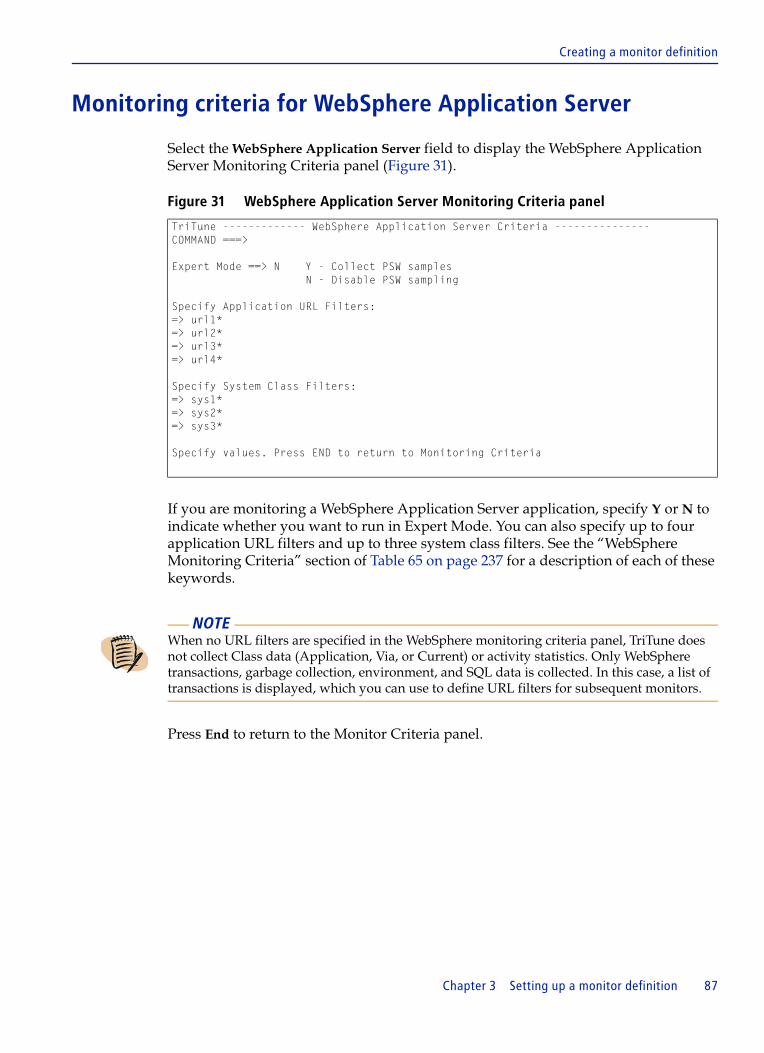
Creating a monitor definition
Monitoring criteria for WebSphere Application Server
Select the WebSphere Application Server field to display the WebSphere Application Server Monitoring Criteria panel (Figure 31).
Figure 31 WebSphere Application Server Monitoring Criteria panel
If you are monitoring a WebSphere Application Server application, specify Y or N to indicate whether you want to run in Expert Mode. You can also specify up to four application URL filters and up to three system class filters. See the “WebSphere Monitoring Criteria” section of Table 65 on page 237 for a description of each of these keywords.
Press End to return to the Monitor Criteria panel.
TriTune ------------- WebSphere Application Server Criteria ---------------COMMAND ===>
Expert Mode ==> N Y - Collect PSW samples N - Disable PSW sampling
Specify Application URL Filters:=> url1*=> url2*=> url3*=> url4*
Specify System Class Filters:=> sys1*=> sys2*=> sys3*
Specify values. Press END to return to Monitoring Criteria
NOTE When no URL filters are specified in the WebSphere monitoring criteria panel, TriTune does not collect Class data (Application, Via, or Current) or activity statistics. Only WebSphere transactions, garbage collection, environment, and SQL data is collected. In this case, a list of transactions is displayed, which you can use to define URL filters for subsequent monitors.
Chapter 3 Setting up a monitor definition 87

Creating a monitor definition
Copying a monitor Definition
The C line command is useful if you want to create multiple versions of the same monitor definition without having to retype all the monitoring criteria. For example, if you wanted to monitor individual steps of the same job, you could create one monitor definition for the first step that you want to monitor, copy each of the original steps, and change only the step names.
To copy a monitor definition:
1 In the LC field next to the profile that you want to copy, type C and press Enter.
The Copy Profile pop-up panel (Figure 32) is displayed.
Figure 32 Copy Profile pop-up panel
2 In the Profile Name field, specify the name of the profile that you want to use.
3 Press Enter to return to the Monitor Definition panel, which displays the new profile.
Editing a monitor definition
To edit an existing monitor definition:
1 Select the corresponding profile name on the Monitor Definition panel by using the Select line command.
The Monitoring Criteria panel (Figure 23 on page 73) is displayed with the current parameters listed for the selected monitor definition.
TriTune ----------------- Monitor Definition ---------- Row 61 to 70 of 860 COMMAND ===> SCROLL ===> CSR Primary commands: ADD xxxx, STAtus Server ID: TRITUNE Status: ACTIVE Line command COMMAND ===> - Delete D - Delete w/dsns Profile name ===> - Batch Reports - CSV Reports LC Profile Status Schedule Runs Description Jobname ________ __________ ________ ____ _________________________ ________ >------------------------------------------------------------------------------ C_ CL08 Inactive 6 TUNCIC52 __ CL09 Inactive 6 TUNCIC52 __ CL10 Inactive 6 TUNCIC52 __ CL11 Inactive 6 TUNCIC52
88 TriTune User Guide

Creating a monitor definition
2 Type over the existing data in the fields that you want to change
3 Press End.
Your changes are saved when you press End to return to the Monitor Definition panel.
Deleting a monitor definition
When you no longer need a particular monitor definition, you can remove it by using the delete request. There are two forms of the delete request.
■ The Delete line command (D) removes the monitor definition and the monitor’s history but does not delete the associated monitor data sets.
■ The Delete w/dsns line command (DD) deletes the data sets that were created by monitoring sessions under that definition and then deletes the monitor definition.
The following shows how to remove only the monitor definition while keeping the monitor data sets that existed for that definition.
1 Type D on the Monitor Definition panel for the definition that you want to delete.
Depending on your profile settings, a panel might appear prompting you to confirm your delete request before actually executing the operation.
2 Confirm the delete request by typing YES or cancel the request by typing NO.
To delete the monitor definition, as well as all of its associated monitor data sets, perform the procedure described above by using the DD line command.
You can reuse the same data set as many times as you want. However, TriTune overwrites the data set anytime you invoke a monitor definition that points to this data set.
NOTE Type CANCEL to return to the Monitor Definition panel without saving any changes.
Chapter 3 Setting up a monitor definition 89
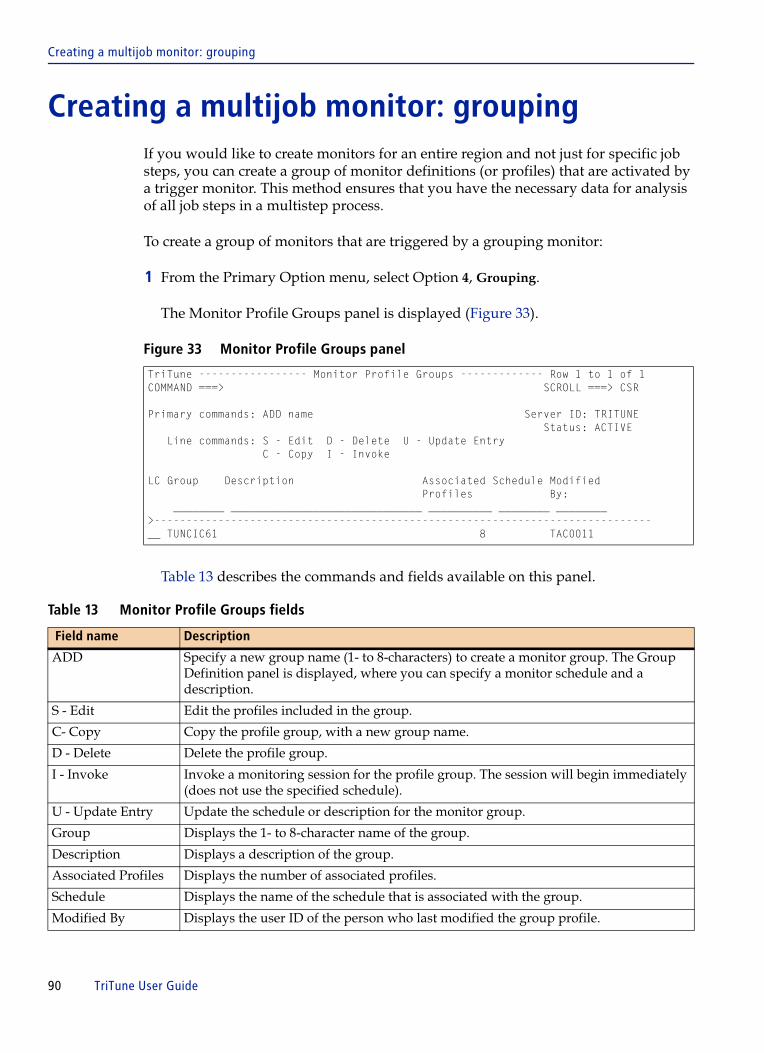
Creating a multijob monitor: grouping
Creating a multijob monitor: groupingIf you would like to create monitors for an entire region and not just for specific job steps, you can create a group of monitor definitions (or profiles) that are activated by a trigger monitor. This method ensures that you have the necessary data for analysis of all job steps in a multistep process.
To create a group of monitors that are triggered by a grouping monitor:
1 From the Primary Option menu, select Option 4, Grouping.
The Monitor Profile Groups panel is displayed (Figure 33).
Figure 33 Monitor Profile Groups panel
Table 13 describes the commands and fields available on this panel.
TriTune ----------------- Monitor Profile Groups ------------- Row 1 to 1 of 1COMMAND ===> SCROLL ===> CSR Primary commands: ADD name Server ID: TRITUNE Status: ACTIVE Line commands: S - Edit D - Delete U - Update Entry C - Copy I - Invoke LC Group Description Associated Schedule Modified Profiles By: ________ ______________________________ __________ ________ ________ >------------------------------------------------------------------------------__ TUNCIC61 8 TAC0011
Table 13 Monitor Profile Groups fields
Field name Description
ADD Specify a new group name (1- to 8-characters) to create a monitor group. The Group Definition panel is displayed, where you can specify a monitor schedule and a description.
S - Edit Edit the profiles included in the group.
C- Copy Copy the profile group, with a new group name.
D - Delete Delete the profile group.
I - Invoke Invoke a monitoring session for the profile group. The session will begin immediately (does not use the specified schedule).
U - Update Entry Update the schedule or description for the monitor group.
Group Displays the 1- to 8-character name of the group.
Description Displays a description of the group.
Associated Profiles Displays the number of associated profiles.
Schedule Displays the name of the schedule that is associated with the group.
Modified By Displays the user ID of the person who last modified the group profile.
90 TriTune User Guide
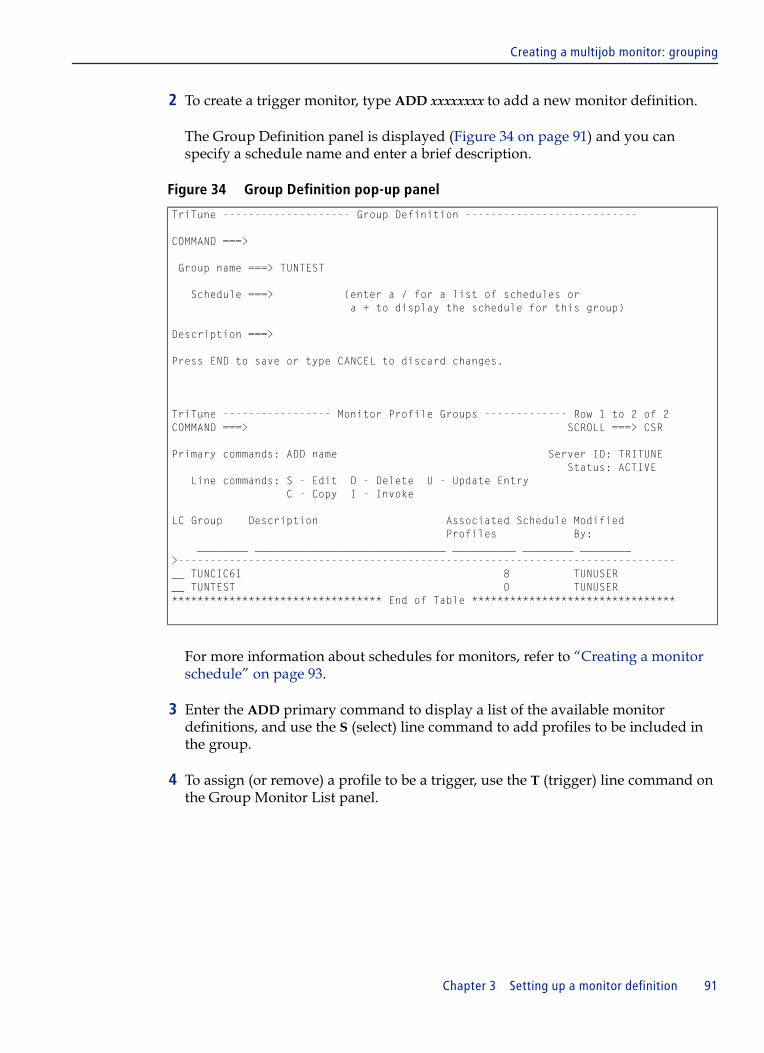
Creating a multijob monitor: grouping
2 To create a trigger monitor, type ADD xxxxxxxx to add a new monitor definition.
The Group Definition panel is displayed (Figure 34 on page 91) and you can specify a schedule name and enter a brief description.
Figure 34 Group Definition pop-up panel
For more information about schedules for monitors, refer to “Creating a monitor schedule” on page 93.
3 Enter the ADD primary command to display a list of the available monitor definitions, and use the S (select) line command to add profiles to be included in the group.
4 To assign (or remove) a profile to be a trigger, use the T (trigger) line command on the Group Monitor List panel.
TriTune -------------------- Group Definition --------------------------- COMMAND ===> Group name ===> TUNTEST Schedule ===> (enter a / for a list of schedules or a + to display the schedule for this group) Description ===> Press END to save or type CANCEL to discard changes.
TriTune ----------------- Monitor Profile Groups ------------- Row 1 to 2 of 2COMMAND ===> SCROLL ===> CSR Primary commands: ADD name Server ID: TRITUNE Status: ACTIVE Line commands: S - Edit D - Delete U - Update Entry C - Copy I - Invoke LC Group Description Associated Schedule Modified Profiles By: ________ ______________________________ __________ ________ ________ >------------------------------------------------------------------------------__ TUNCIC61 8 TUNUSER __ TUNTEST 0 TUNUSER ********************************* End of Table ********************************
Chapter 3 Setting up a monitor definition 91
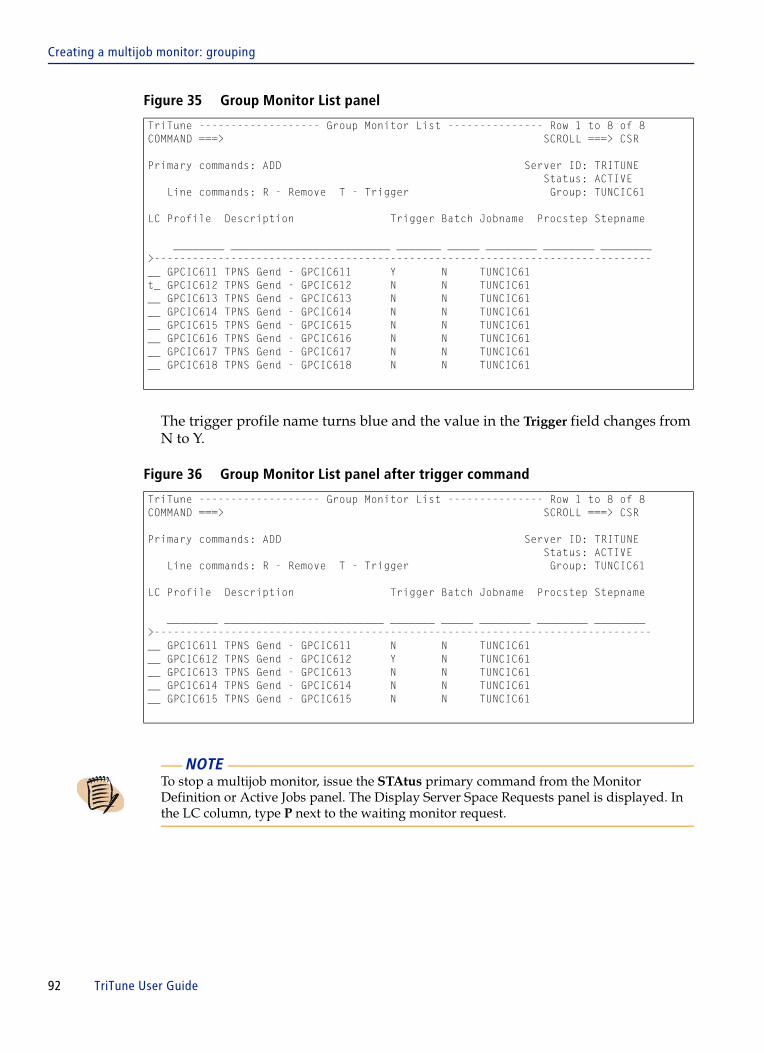
Creating a multijob monitor: grouping
Figure 35 Group Monitor List panel
The trigger profile name turns blue and the value in the Trigger field changes from N to Y.
Figure 36 Group Monitor List panel after trigger command
TriTune ------------------- Group Monitor List --------------- Row 1 to 8 of 8COMMAND ===> SCROLL ===> CSR Primary commands: ADD Server ID: TRITUNE Status: ACTIVE Line commands: R - Remove T - Trigger Group: TUNCIC61 LC Profile Description Trigger Batch Jobname Procstep Stepname ________ _________________________ _______ _____ ________ ________ ________>------------------------------------------------------------------------------__ GPCIC611 TPNS Gend - GPCIC611 Y N TUNCIC61 t_ GPCIC612 TPNS Gend - GPCIC612 N N TUNCIC61 __ GPCIC613 TPNS Gend - GPCIC613 N N TUNCIC61 __ GPCIC614 TPNS Gend - GPCIC614 N N TUNCIC61 __ GPCIC615 TPNS Gend - GPCIC615 N N TUNCIC61 __ GPCIC616 TPNS Gend - GPCIC616 N N TUNCIC61 __ GPCIC617 TPNS Gend - GPCIC617 N N TUNCIC61 __ GPCIC618 TPNS Gend - GPCIC618 N N TUNCIC61
TriTune ------------------- Group Monitor List --------------- Row 1 to 8 of 8COMMAND ===> SCROLL ===> CSR Primary commands: ADD Server ID: TRITUNE Status: ACTIVE Line commands: R - Remove T - Trigger Group: TUNCIC61 LC Profile Description Trigger Batch Jobname Procstep Stepname ________ _________________________ _______ _____ ________ ________ ________>------------------------------------------------------------------------------__ GPCIC611 TPNS Gend - GPCIC611 N N TUNCIC61 __ GPCIC612 TPNS Gend - GPCIC612 Y N TUNCIC61 __ GPCIC613 TPNS Gend - GPCIC613 N N TUNCIC61 __ GPCIC614 TPNS Gend - GPCIC614 N N TUNCIC61 __ GPCIC615 TPNS Gend - GPCIC615 N N TUNCIC61
NOTE To stop a multijob monitor, issue the STAtus primary command from the Monitor Definition or Active Jobs panel. The Display Server Space Requests panel is displayed. In the LC column, type P next to the waiting monitor request.
92 TriTune User Guide
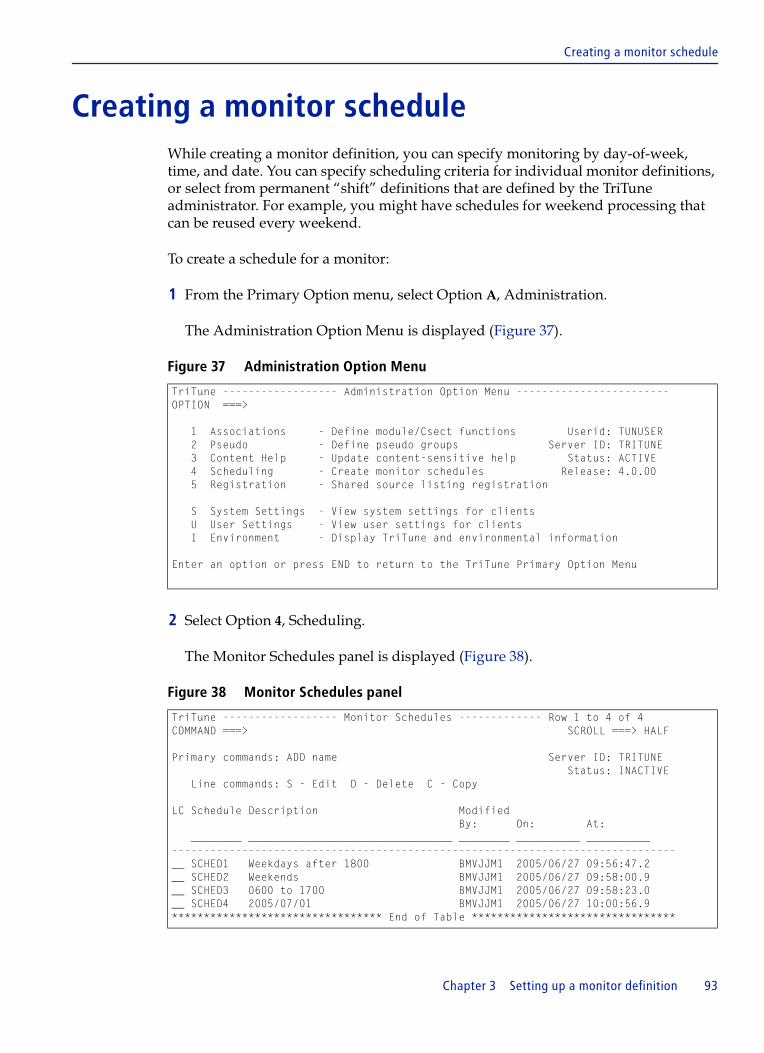
Creating a monitor schedule
Creating a monitor schedule While creating a monitor definition, you can specify monitoring by day-of-week, time, and date. You can specify scheduling criteria for individual monitor definitions, or select from permanent “shift” definitions that are defined by the TriTune administrator. For example, you might have schedules for weekend processing that can be reused every weekend.
To create a schedule for a monitor:
1 From the Primary Option menu, select Option A, Administration.
The Administration Option Menu is displayed (Figure 37).
Figure 37 Administration Option Menu
2 Select Option 4, Scheduling.
The Monitor Schedules panel is displayed (Figure 38).
Figure 38 Monitor Schedules panel
TriTune ------------------ Administration Option Menu ------------------------OPTION ===> 1 Associations - Define module/Csect functions Userid: TUNUSER 2 Pseudo - Define pseudo groups Server ID: TRITUNE 3 Content Help - Update content-sensitive help Status: ACTIVE 4 Scheduling - Create monitor schedules Release: 4.0.00 5 Registration - Shared source listing registration S System Settings - View system settings for clients U User Settings - View user settings for clients I Environment - Display TriTune and environmental information Enter an option or press END to return to the TriTune Primary Option Menu
TriTune ------------------ Monitor Schedules ------------- Row 1 to 4 of 4 COMMAND ===> SCROLL ===> HALF Primary commands: ADD name Server ID: TRITUNE Status: INACTIVE Line commands: S - Edit D - Delete C - Copy LC Schedule Description Modified By: On: At: ________ ________________________________ ________ __________ __________ -------------------------------------------------------------------------------__ SCHED1 Weekdays after 1800 BMVJJM1 2005/06/27 09:56:47.2 __ SCHED2 Weekends BMVJJM1 2005/06/27 09:58:00.9 __ SCHED3 0600 to 1700 BMVJJM1 2005/06/27 09:58:23.0 __ SCHED4 2005/07/01 BMVJJM1 2005/06/27 10:00:56.9 ********************************* End of Table ********************************
Chapter 3 Setting up a monitor definition 93

Creating a monitor schedule
Table 14 describes the commands and fields that are available on this panel.
3 To create a new schedule, use the ADD xxxxxxxx primary command where xxxxxxxx is a user-specified one- to eight-character name of a schedule.
The Monitoring Scheduling Criteria panel is displayed (Figure 39).
Figure 39 Monitoring Scheduling Criteria panel
Table 14 Monitor Schedules fields
Field name Description
ADD name This field is used to specify a new schedule name (1- to 8-characters). The Monitor Scheduling Criteria panel is displayed, where you can specify the days and times for a monitor to run.
S - Edit This field is used to edit an already existing schedule.
D - Delete This field is used to delete the schedule.
C- Copy This field is used to copy the schedule.
Schedule This field displays the 1- to 8-character name of a schedule.
Description This field displays the up-to 25-character optional description of the schedule (up to 25 characters).
Modified By This field displays the user ID of the last user who edited or created the schedule.
On This field displays the date the schedule was created or last edited.
At This field displays the time the schedule was created or last edited.
TriTune ---------------- Monitoring Scheduling Criteria -----------------------COMMAND ===> Schedule: SCHDA01 Description ===> Monday Date range: Valid dates Starting ===> &MONDAY Ending ===> &MONDAY (YYYY/MM/DD) Monitor request valid for ===> (days) Day of week settings: Day of week Weekdays / Monday Thursday Sunday selection criteria Weekends or Tuesday Friday / Specific days . . Wednesday Saturday Generic time ranges: Monitor valid 1 ===> ===> (hhmm 24 hour clock) during time 2 ===> ===> ranges of 3 ===> ===> 4 ===> ===> Enter END to save parameters or CANCEL to exit without change.Trilog Service AG., Confidential and Proprietary Information
94 TriTune User Guide
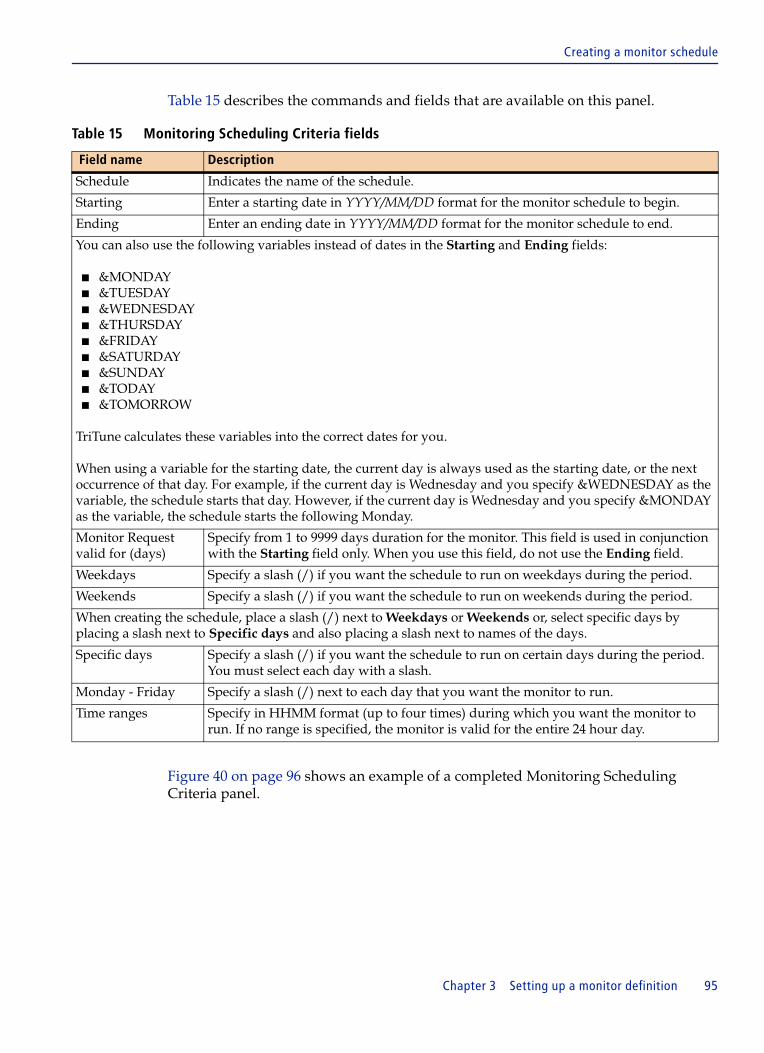
Creating a monitor schedule
Table 15 describes the commands and fields that are available on this panel.
Figure 40 on page 96 shows an example of a completed Monitoring Scheduling Criteria panel.
Table 15 Monitoring Scheduling Criteria fields
Field name Description
Schedule Indicates the name of the schedule.
Starting Enter a starting date in YYYY/MM/DD format for the monitor schedule to begin.
Ending Enter an ending date in YYYY/MM/DD format for the monitor schedule to end.
You can also use the following variables instead of dates in the Starting and Ending fields:
■ &MONDAY■ &TUESDAY■ &WEDNESDAY■ &THURSDAY■ &FRIDAY■ &SATURDAY■ &SUNDAY■ &TODAY■ &TOMORROW
TriTune calculates these variables into the correct dates for you.
When using a variable for the starting date, the current day is always used as the starting date, or the next occurrence of that day. For example, if the current day is Wednesday and you specify &WEDNESDAY as the variable, the schedule starts that day. However, if the current day is Wednesday and you specify &MONDAY as the variable, the schedule starts the following Monday.
Monitor Request valid for (days)
Specify from 1 to 9999 days duration for the monitor. This field is used in conjunction with the Starting field only. When you use this field, do not use the Ending field.
Weekdays Specify a slash (/) if you want the schedule to run on weekdays during the period.
Weekends Specify a slash (/) if you want the schedule to run on weekends during the period.
When creating the schedule, place a slash (/) next to Weekdays or Weekends or, select specific days by placing a slash next to Specific days and also placing a slash next to names of the days.
Specific days Specify a slash (/) if you want the schedule to run on certain days during the period. You must select each day with a slash.
Monday - Friday Specify a slash (/) next to each day that you want the monitor to run.
Time ranges Specify in HHMM format (up to four times) during which you want the monitor to run. If no range is specified, the monitor is valid for the entire 24 hour day.
Chapter 3 Setting up a monitor definition 95

Creating a monitor schedule
Figure 40 Monitoring Scheduling Criteria panel: example
When you invoke a monitor with a schedule, the monitor remains invoked until the end of the schedule. However, the monitor only starts if the target job is executed during the specified time range of the schedule. After the end of the schedule is reached, the monitor is stopped automatically.
TriTune ---------------- Monitoring Scheduling Criteria -----------------------COMMAND ===> Schedule: SCHONE Description ===> Date range: Valid dates Starting ===> 2006/06/16 Ending ===> (YYYY/MM/DD) Monitor request valid for ===> 20 (days) Day of week settings: Day of week Weekdays Monday Thursday Sunday selection criteria Weekends or Tuesday / Friday / Specific days . . Wednesday / Saturday Generic time ranges: Monitor valid 1 ===> 1200 ===> 1300 (hhmm 24 hour clock) during time 2 ===> ===> ranges of 3 ===> ===> 4 ===> ===>
NOTE To exit this panel without specifying a schedule, press Cancel. Pressing End associates a schedule with the monitor request.
96 TriTune User Guide
C h a p t e r 4
4 Invoking a monitorAfter you create the monitor definition, you can start making observations and collecting sample data about your target program. You start the observation and sampling process by invoking a monitor definition. You might also define and invoke monitors offline by using the TriTune Open Application Interface. Refer to Chapter 7, “TriTune Open Application Program Interface” for more information.
For a description of the internal operation of TriTune, including what happens when a monitor is invoked, see the TriTune Installation and Customization Guide.
This chapter describes the following tasks:
Invoking a monitor from the TriTune TSO client . . . . . . . . . . . . . . . . . . . . . . . . . . . . . . 98Monitor request . . . . . . . . . . . . . . . . . . . . . . . . . . . . . . . . . . . . . . . . . . . . . . . . . . . . . . . 99Analyzing monitor results . . . . . . . . . . . . . . . . . . . . . . . . . . . . . . . . . . . . . . . . . . . . . 101Displaying monitor history . . . . . . . . . . . . . . . . . . . . . . . . . . . . . . . . . . . . . . . . . . . . 101
Invoking a monitor for an active job . . . . . . . . . . . . . . . . . . . . . . . . . . . . . . . . . . . . . . . . 106Analyzing monitor results . . . . . . . . . . . . . . . . . . . . . . . . . . . . . . . . . . . . . . . . . . . . . 111Active jobs select command . . . . . . . . . . . . . . . . . . . . . . . . . . . . . . . . . . . . . . . . . . . . 111
Chapter 4 Invoking a monitor 97

Invoking a monitor from the TriTune TSO client
Invoking a monitor from the TriTune TSO client1 From the Primary Option Menu, select Option 1.
The Monitor Definition panel (Figure 41) is displayed.
Figure 41 Monitor Definition panel (invoking a monitor)
2 To start a monitor by using the existing monitoring criteria, type I next to the profile name of the monitor definition that you want to monitor and press Enter.
3 To view or change the monitoring criteria, type S next to the profile name of the monitor definition.
The Monitoring Criteria panel is displayed. Change the criteria as required.
4 Press End to return to the Monitor Definition panel.
If a Started Task that you are monitoring has a jobname that is the same as another active job, you must invoke the monitor from the Active Jobs panel to ensure that the correct address space is monitored. See “Invoking a monitor for an active job” on page 106 for instructions.
TriTune ----------------- Monitor Definition ---------- Row 51 to 60 of 860 COMMAND ===> SCROLL ===> CSR Primary commands: ADD xxxx, STAtus Server ID: TRITUNE Status: ACTIVE Line commands: S - Select A - Analyze Normal D - Delete I - Invoke AL - Analyze All DD - Delete w/dsns H - History AA - Analyze Active B - Batch Reports C - Copy AW - Analyze Wait V - CSV Reports X - Export Monitor Data LC Profile Status Schedule Runs Description Jobname ________ __________ ________ ____ _________________________ ________ >----------------------------------------------------------------------------__ CALLERID Inactive 50 CALLERID __ CATALOG Inactive 5 CATALOG __ CEE0002 Inactive 3 CEE0002 __ CL01 Inactive 140 TUNCIC52 __ CL02 Inactive 12 TUNCIC52 __ CL03 Inactive 8 TUNCIC52 __ CL04 Inactive 7 TUNCIC52 __ CL05 Inactive 6 TUNCIC52 __ CL06 Inactive 6 TUNCIC52 __ CL07 Inactive 6 TUNCIC52
NOTE This panel is the same panel where you set up monitor definitions. Table 8 on page 70 describes this panel’s fields.
98 TriTune User Guide

Invoking a monitor from the TriTune TSO client
Invoking a monitor automatically
You can invoke a monitor automatically when you exit the Monitoring Criteria panel. Specify YES or CONFIRM on the Profile Parameters panel.
Monitor request
When you invoke a monitor definition, it is called a monitor request. A monitor request is active from the time you invoke the monitor definition until one of the following situations occurs:
■ Observations and sampling are complete.■ The monitor request is canceled.■ The schedule expires.
If the target is active, TriTune starts making observations and collecting sample data immediately. If TriTune cannot find the target at the time you invoke the monitor definition, it sends a message back to your TSO session that your request was deferred, and the monitor request status on the Monitor Definition panel is shown as Waiting.
TriTune continuously monitors the job step initiation activity on the z/OS system on which it is running. When TriTune detects that the requested target is available, it activates the observation and sampling process automatically. The monitor starts immediately, unless you specified a delay after step start. When TriTune begins monitoring a target address space, the status of the request on the Monitor Definition panel switches from Waiting to Active.
After you invoke a monitor request, you no longer need to be connected to TriTune or even logged on to TSO. However, if you remain connected to TSO/ISPF, TriTune notifies you when the monitoring terminates.
Refer to the TriTune Installation and Customization Guide for more information.
Monitor persistence
Monitor requests are written to the Global Information File (GIF), which allows for persistence of the request, even if the TriTune Server Space is deactivated or if the entire system is shut down. When the Server Space is started through a batch job or during IPL, it reads the GIF and reinstates any active monitor requests.
Chapter 4 Invoking a monitor 99
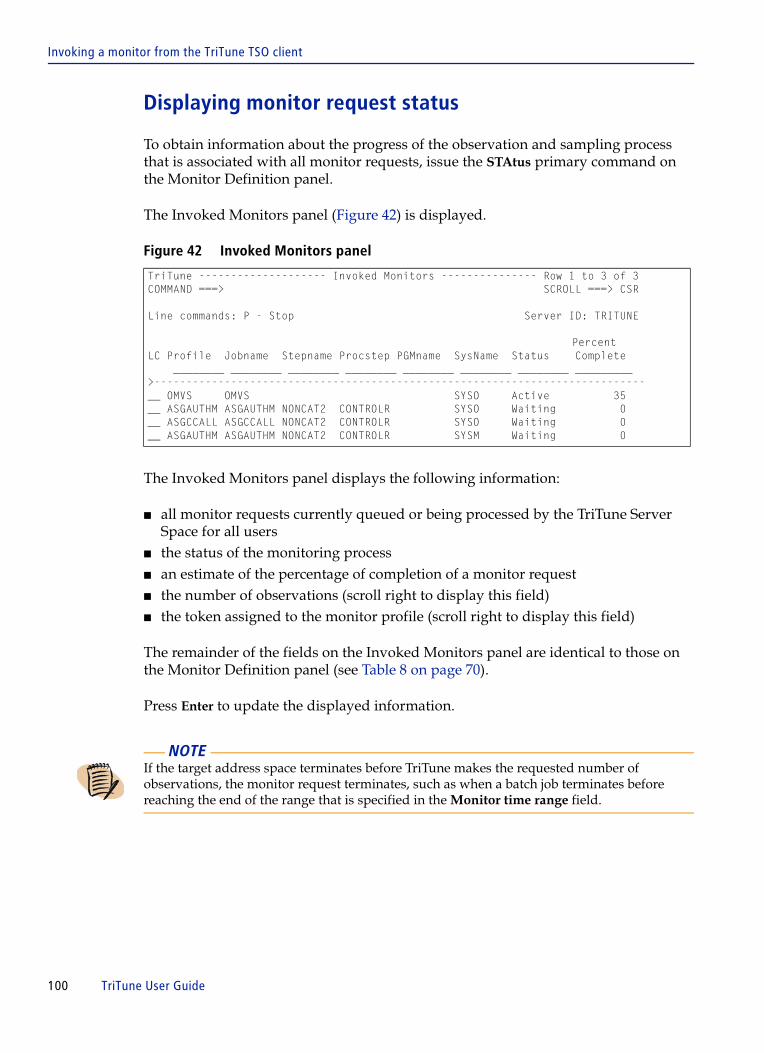
Invoking a monitor from the TriTune TSO client
Displaying monitor request status
To obtain information about the progress of the observation and sampling process that is associated with all monitor requests, issue the STAtus primary command on the Monitor Definition panel.
The Invoked Monitors panel (Figure 42) is displayed.
Figure 42 Invoked Monitors panel
The Invoked Monitors panel displays the following information:
■ all monitor requests currently queued or being processed by the TriTune Server Space for all users
■ the status of the monitoring process■ an estimate of the percentage of completion of a monitor request■ the number of observations (scroll right to display this field)■ the token assigned to the monitor profile (scroll right to display this field)
The remainder of the fields on the Invoked Monitors panel are identical to those on the Monitor Definition panel (see Table 8 on page 70).
Press Enter to update the displayed information.
TriTune -------------------- Invoked Monitors --------------- Row 1 to 3 of 3 COMMAND ===> SCROLL ===> CSR Line commands: P - Stop Server ID: TRITUNE Percent LC Profile Jobname Stepname Procstep PGMname SysName Status Complete ________ ________ ________ ________ ________ ________ ________ _________ >-----------------------------------------------------------------------------__ OMVS OMVS SYSO Active 35 __ ASGAUTHM ASGAUTHM NONCAT2 CONTROLR SYSO Waiting 0 __ ASGCCALL ASGCCALL NONCAT2 CONTROLR SYSO Waiting 0 __ ASGAUTHM ASGAUTHM NONCAT2 CONTROLR SYSM Waiting 0
NOTE If the target address space terminates before TriTune makes the requested number of observations, the monitor request terminates, such as when a batch job terminates before reaching the end of the range that is specified in the Monitor time range field.
100 TriTune User Guide

Invoking a monitor from the TriTune TSO client
Stopping a monitor request
1 From the Monitor Definition or Active Jobs panel, issue the STAtus primary command.
The Display Server Space Requests panel (Figure 42 on page 100) is displayed.
2 Type P next to the monitor request that you want to stop. The job status can be either active or waiting.
A message will be displayed indicating that the monitor has been stopped. The monitor request is removed from the display. Any data that has already been gathered is retained and is available for analysis.
Analyzing monitor results
To analyze the monitoring results, use one of the analysis line commands (A, AL, AA, or AW) to display the Interactive Analysis menu. Chapter 5, “Analyzing monitor data” describes how to analyze the data that you collected.
Displaying monitor history
The monitor history is a record of all the instances that you invoked for a particular monitor profile. To see the history of a monitor profile from the Monitor Definition panel, enter line command H (History) next to the profile and press Enter.
The Monitor History panel (Figure 43 on page 102) is displayed. This panel lists all data sets for the selected monitor profile.
See “Samples and observations” and “Sampling rules” on page 66 for more information about the collected data.
NOTE You can only stop a monitor request that you invoked and has your User ID.
Chapter 4 Invoking a monitor 101

Invoking a monitor from the TriTune TSO client
Figure 43 Monitor History panel
Press PF11 to scroll right and see more fields.
Table 16 lists the fields on the Monitor History panel:
TriTune ----------------------- Monitor History -------------- Row 1 to 7 of 7COMMAND ===> SCROLL ===> CSR Line commands: A - Analyze Normal D - Delete Profile: CICS64 AA - Analyze Active B - Batch Reports AL - Analyze All V - CSV Reports AW - Analyze Wait X - Export Monitor Data Measured Run Start CPU EXCP SIO Percent Percent Percent LC Job Date Time Count Rate Active Wait NonDisp ________ ____ __________ __________ _____ ______ _______ _______ _______ >------------------------------------------------------------------------------__ TUNCIC64 1 2006/05/06 00:02:13.8 477K 6363.6 1.93 98.06 0.00 __ TUNCIC64 1 2006/05/06 00:02:00.0 456K 6796.2 1.63 98.36 0.00 __ TUNCIC64 1 2006/05/06 00:01:11.5 294K 4530.4 0.90 99.09 0.00 __ TUNCIC64 1 2006/05/06 00:01:06.3 280K 4325.1 0.88 99.11 0.00 __ TUNCIC61 1 2006/05/05 00:00:13.0 4082 64.62 0.40 99.59 0.00 __ TUNCIC61 1 2006/05/05 00:00:11.2 3527 56.14 0.33 99.66 0.00 __ TUNCIC64 1 2006/05/05 00:16:37.5 1.3M 19703 0.26 99.73 0.00 ********************************* End of Table********************************
Table 16 Monitor History panel fields (part 1 of 3)
Field name Description
Measured Job name of the job being measured by TriTune
Run number of active runs for this profile
Start Date date this monitor instance was run
CPU Time length of time this monitor session ran in HH:MM:SS format
EXCP Count number of input/output operations for the job step during the monitored period
This number includes I/O counts that are not reflected in the I/O counts at the DD name level.
SIO Rate number of start I/O operations per second for the job during the monitored period
Percent Active percentage of the monitored period during which one or more CPUs were in use by application tasks within the address space
This number is the ratio of samples with CPU active to the total number of samples.
Percent Wait percentage of the monitored period during which application tasks within the address space were not using CPU
This number is the ratio of samples with CPU not active to the total number of samples.
Percent NonDisp percentage of samples where TriTune detected the address space to be dispatchable but not dispatched
This number is the ratio of samples in which the address space was dispatchable but not dispatched to the total number of samples.
102 TriTune User Guide

Invoking a monitor from the TriTune TSO client
Percent ProcDelay percentage of the monitored period when TriTune detected the address space was unable to be dispatched because a processor could not be made available
While this situation is occurring, the application is unable to execute.
Percent Swapped sample SWAPPED percentage
This number is the ratio of samples when the job was swapped out to the total number of samples.
Observation Rate final observation rate, which is the number of observations per millisecond, calculated by TriTune
TriTune might have adjusted this rate during the monitor.
Samples Collected number of samples collected during the monitored period
A significant difference between samples collected and samples used might be noted during step-level monitoring.
For information about monitoring the entire duration of a job step, see the note on page 77.
Samples Used number of samples used in the last analysis request
Elapsed Time length of time the monitor session ran in HH:MM:SS format
Measured Job ID JES job identifier of the job that was monitored
This field is valid for jobs that were initiated under a job entry subsystem.
Measured Step name of the job step that was monitored
Measured ProcStep
name of the job step within a cataloged procedure that was monitored
Measured Program
name of the program on the EXEC statement of the JCL of the job that was monitored
Measured ASID address space identifier of the job that was monitored
System name of system where job was monitored
SMF ID one- to four-character name assigned with the system
The SMFID is written as a field in any SMF record created by this system.
Table 16 Monitor History panel fields (part 2 of 3)
Field name Description
Chapter 4 Invoking a monitor 103

Invoking a monitor from the TriTune TSO client
Exists indicator of data set availability
The following values can be displayed in this field:
■ YES - The data set containing the sample data for the monitor instance is available and has not been migrated.
■ NO - The data set is not found.
■ ML1 - The data set containing the sample data for the monitor instance exists but is migrated to the DFSMShsm ML1 migration pool. ML1 migration generally goes to disk.
■ ML2 - The data set containing the sample data for the monitor instance exists but is migrated to the DFSMShsm ML2 migration pool. ML2 migration generally goes to tape.
■ INV - The data set name is invalid. If this value is displayed, check the entry to make sure the data set name is valid before continuing.
■ PER - A program error occurred. This value can indicate a catalog error other than the data set not being found. See your technical support staff for more information.
Dataset name data set name of the monitor data set
Invocation Time date this sample monitor was invoked
Invocation Date time this sample monitor was invoked
Requested Observations
number of observations requested in the monitor definition
Error samples number of samples that contain errors
The samples are not included in the monitor data set.
Storage Above high-water amount of virtual storage above the 16MB line that is used by the job
Storage Below high-water amount of virtual storage below the 16MB line that is used by the job
Page in Count number of page-in operations for the job
A high value in this field can indicate job delays.
z/OS level release level of the operating system where the target job was executed
CPU type CPU type of the system on which this monitor instance executed
CPU Mdl CPU model number of the system on which this monitor instance executed
CPU Serial CPU serial number of the system on which this monitor instance executed
Table 16 Monitor History panel fields (part 3 of 3)
Field name Description
104 TriTune User Guide

Invoking a monitor from the TriTune TSO client
Table 17 lists the Monitor History panel line commands and describes where to find more information about each command.
If the monitor request has not been completed, or has been abnormally terminated, these fields might appear as BLANK, ZERO, or NA. The fields will be populated the first time you analyze the monitor.
Table 17 Monitor history commands
For information about See
A - Analyze Normal “Starting interactive analysis” on page 115
AA - Analyze Active “Starting interactive analysis” on page 115
AL - Analyze All “Starting interactive analysis” on page 115
AW - Analyze Wait “Starting interactive analysis” on page 115
D - Delete “Deleting a monitor definition” on page 89
B - Batch Reports “Submitting a job to generate batch reports” on page 252
V - CSV Reports accesses the CSV_Reporting panel that allows you to submit a TriTune batch job to create comma-separated value output of TriTune analysis reports for the selected profile
These reports can be imported for use with the TriTune Spreadsheet Converter. For more information, refer to “Creating TriTune spreadsheet reports” on page 262.
X - Export Monitor Data
Table 19 on page 116
Chapter 4 Invoking a monitor 105
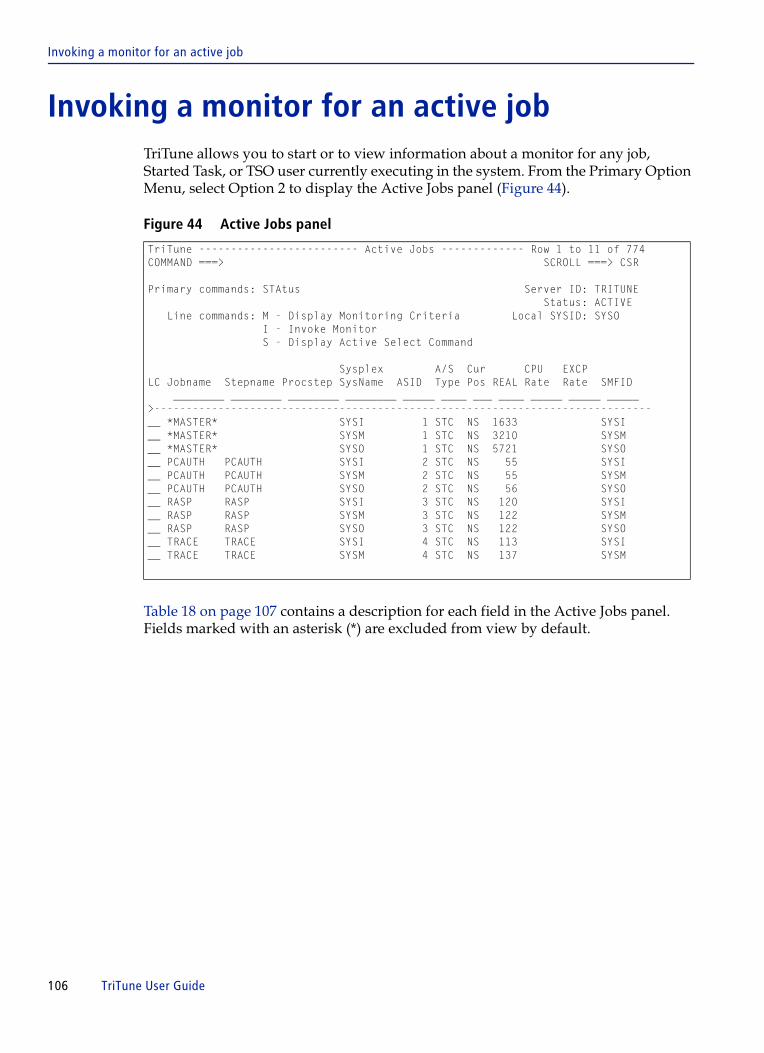
Invoking a monitor for an active job
Invoking a monitor for an active jobTriTune allows you to start or to view information about a monitor for any job, Started Task, or TSO user currently executing in the system. From the Primary Option Menu, select Option 2 to display the Active Jobs panel (Figure 44).
Figure 44 Active Jobs panel
Table 18 on page 107 contains a description for each field in the Active Jobs panel. Fields marked with an asterisk (*) are excluded from view by default.
TriTune ------------------------- Active Jobs ------------- Row 1 to 11 of 774COMMAND ===> SCROLL ===> CSR Primary commands: STAtus Server ID: TRITUNE Status: ACTIVE Line commands: M - Display Monitoring Criteria Local SYSID: SYSO I - Invoke Monitor S - Display Active Select Command Sysplex A/S Cur CPU EXCP LC Jobname Stepname Procstep SysName ASID Type Pos REAL Rate Rate SMFID ________ ________ ________ ________ _____ ____ ___ ____ _____ _____ _____ >------------------------------------------------------------------------------__ *MASTER* SYSI 1 STC NS 1633 SYSI __ *MASTER* SYSM 1 STC NS 3210 SYSM __ *MASTER* SYSO 1 STC NS 5721 SYSO __ PCAUTH PCAUTH SYSI 2 STC NS 55 SYSI __ PCAUTH PCAUTH SYSM 2 STC NS 55 SYSM __ PCAUTH PCAUTH SYSO 2 STC NS 56 SYSO __ RASP RASP SYSI 3 STC NS 120 SYSI __ RASP RASP SYSM 3 STC NS 122 SYSM __ RASP RASP SYSO 3 STC NS 122 SYSO __ TRACE TRACE SYSI 4 STC NS 113 SYSI __ TRACE TRACE SYSM 4 STC NS 137 SYSM
106 TriTune User Guide

Invoking a monitor for an active job
To display these fields, you must use the CUST primary command.
To monitor a job by using default monitoring criteria:
1 Type I in the LC field next to the profile name of the job that you want to monitor.
2 Press Enter.
To monitor a job by using criteria other than the defaults:
1 Type M in the LC field next to the profile name of the monitor definition that you want to invoke.
2 Press Enter.
The Monitoring Criteria panel is displayed. The profile name will be the same as the job name.
3 Change the monitoring criteria as needed.
4 Press End to save your changes, or type CANCEL on the COMMAND line and press Enter to return to the Active Jobs panel without starting a monitor.
5 Type I in the LC field next to the profile name of the job
6 Press Enter.
After a monitor has been invoked for an active job, you can display its progress or cancel the request by using the STAtus primary command (see “Displaying monitor request status” on page 100).
NOTE If multiple active address spaces have the same job name, you must invoke the monitor from the Active Jobs panel to ensure that the correct address space is monitored.
Table 18 Active jobs fields (part 1 of 4)
Field name Value
Jobname job name of the address space
Stepname job step name or TSO procedure name for TSO users
Procstep procedure step name or terminal name for TSO users
Sysplex SysName one- to eight-character name that is associated with the currently running system within the sysplex
ASID numeric identifier, between 1 and 32766, of the address space
Chapter 4 Invoking a monitor 107
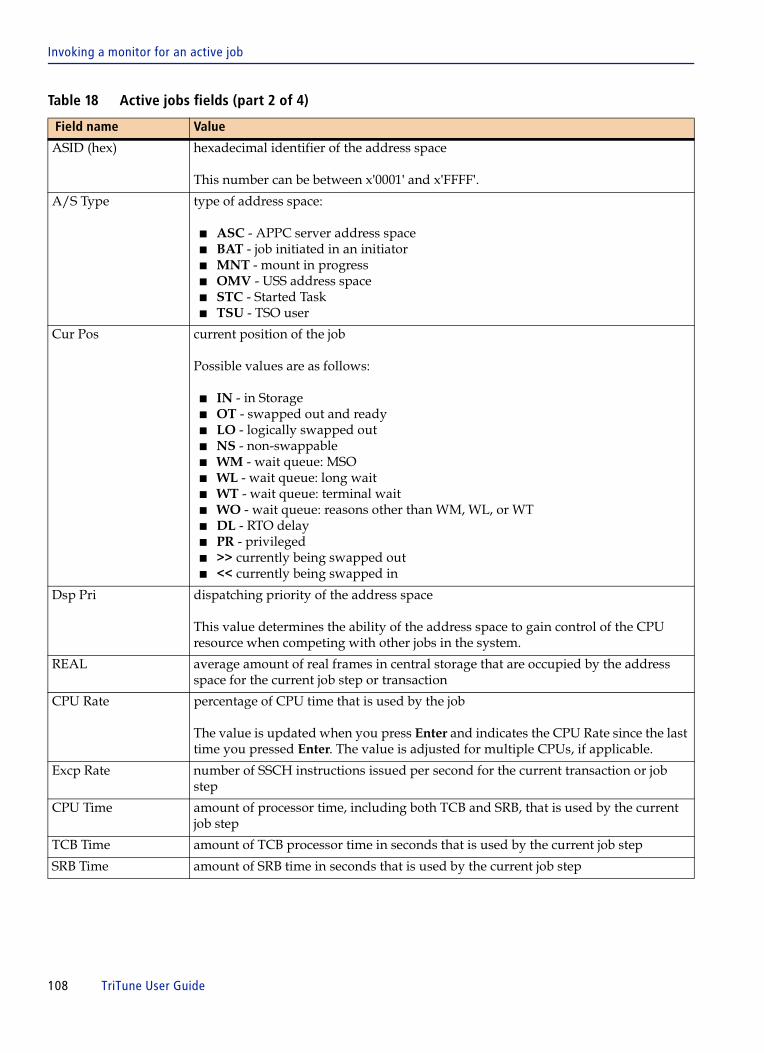
Invoking a monitor for an active job
ASID (hex) hexadecimal identifier of the address space
This number can be between x'0001' and x'FFFF'.
A/S Type type of address space:
■ ASC - APPC server address space■ BAT - job initiated in an initiator■ MNT - mount in progress■ OMV - USS address space■ STC - Started Task■ TSU - TSO user
Cur Pos current position of the job
Possible values are as follows:
■ IN - in Storage■ OT - swapped out and ready■ LO - logically swapped out■ NS - non-swappable■ WM - wait queue: MSO■ WL - wait queue: long wait■ WT - wait queue: terminal wait■ WO - wait queue: reasons other than WM, WL, or WT■ DL - RTO delay■ PR - privileged■ >> currently being swapped out ■ << currently being swapped in
Dsp Pri dispatching priority of the address space
This value determines the ability of the address space to gain control of the CPU resource when competing with other jobs in the system.
REAL average amount of real frames in central storage that are occupied by the address space for the current job step or transaction
CPU Rate percentage of CPU time that is used by the job
The value is updated when you press Enter and indicates the CPU Rate since the last time you pressed Enter. The value is adjusted for multiple CPUs, if applicable.
Excp Rate number of SSCH instructions issued per second for the current transaction or job step
CPU Time amount of processor time, including both TCB and SRB, that is used by the current job step
TCB Time amount of TCB processor time in seconds that is used by the current job step
SRB Time amount of SRB time in seconds that is used by the current job step
Table 18 Active jobs fields (part 2 of 4)
Field name Value
108 TriTune User Guide

Invoking a monitor for an active job
Delta CPU Time number of CPU seconds that is used by the job
The value is updated when you press Enter and indicates the number of CPU seconds that were used since the last time you pressed Enter. The value is adjusted for multiple CPUs, if applicable.
Delta TCB Time number of TCB seconds that were used by the job
The value is updated when you press Enter and indicates the number of TCB seconds that were used since the last time you pressed Enter.
Delta SRB Time number of SRB seconds that were used by the job
The value is updated when you press Enter and indicates the number of SRB seconds that were used since the last time you pressed Enter.
EXCP Count total number of EXCPs that were issued by the current job step
Delta EXCP number of SSCH instructions that were issued by the job
The value is updated when you press Enter and indicates the number of SSCH instructions that were issued since the last time you pressed Enter.
Scroll right to display the following fields:
SMFID one- to four- character name assigned with the currently running system
The SMFID is written as a field in any SMF record that is created by this system.
FF Bel number of fixed-storage frames below 16 megabytes that are held by the job
If the data gathered for this value is not valid, this field is blank. Fixed storage refers to frames in central storage that cannot be paged-out. Fixed storage is used by programs that cannot tolerate a page fault.
X M cross memory address space
This field contains an X for address spaces considered to be 'cross memory address spaces'. An X implies that the address space provides services that are used by other address spaces, and that the address space is accessed in cross memory mode. If the address space is not a cross memory address space, this field is blank.
Priv FF number of private fixed-storage frames that are held by the job
If the data gathered for this value is not valid, this field is blank.
Prf Grp one-to-four digit number of the performance group that is associated with the address space
Performance groups are used to assign specific service objectives and execution priority to a group of address spaces.
Dmn one-to-three digit number of the domain
A domain is a collection of performance groups that is defined by a system administrator.
Table 18 Active jobs fields (part 3 of 4)
Field name Value
Chapter 4 Invoking a monitor 109

Invoking a monitor for an active job
Lst Swp last swap out that is associated with the job
If the current position of the job is NS, IN, or PR, this field is blank. Possible values are as follows:
■ TI - terminal wait■ TO - terminal output wait■ LW - long wait■ XS - auxiliary storage shortage■ RS - central storage shortage■ DW - detected wait■ RQ - requested swap■ NQ - enqueue exchange■ EX - exchange swap based on recommendation value ■ US - unilateral■ TS - transition swap■ IC - improve central storage usage■ IP - improve system paging rate■ MR - make room to swap in a user that has been swapped out too long■ AW - APPC wait■ IW - USS input wait■ OW - USS output wait
Service Class one-to-eight character name of the service class
A service class is a group of work within a workload with similar performance goals and characteristics; for example, average response time. You can further divide a service class into performance periods. Periods assign different service objectives and execution priorities to a transaction within a service class, based on the transaction's resource consumption.
Service Period performance period of a service class
Possible values range from 1 to 8, which specify varying performance goals and characteristics of transactions of a service class. While executing and consuming resources, transactions can move to a higher period.
Workload one-to-eight character name of the workload that is assigned to the address space
A workload is a group of work to be monitored, managed, and reported. It consists of one or more service classes.
Resource Group one-to-eight character name of the resource group
Assigning a service class to a resource group effectively guarantees a minimum capacity and sets a maximum capacity for the transactions belonging to the service class.
Table 18 Active jobs fields (part 4 of 4)
Field name Value
110 TriTune User Guide

Invoking a monitor for an active job
Analyzing monitor results
You cannot display the results of your analysis directly from the Active Jobs panel. However, when you invoke a monitor from Active Jobs, TriTune adds the profile to the Monitor Definition panel automatically.
To analyze the monitoring results, return to the Primary Option Menu and select Option 1. Look for the profile with the name of the job or address space that you monitored. Use one of the analysis line commands (A, AA, AL or AW) to display the Interactive Analysis menu.
Chapter 5, “Analyzing monitor data” describes how to analyze the data that you collected.
Active jobs select command
Type S next to a Jobname and press Enter to invoke the Display Active Select command that is specified in your user profile (see the TriTune Installation and Customization Guide). The command will be issued on the local system, even if the selected job is running on a different system in the sysplex.
Split screen mode might not be available when you invoke the Display Active Command.
Chapter 4 Invoking a monitor 111

Invoking a monitor for an active job
112 TriTune User Guide

C h a p t e r 5
5 Analyzing monitor dataThis chapter describes how to use the Interactive Analysis Facility to analyze the data that is collected during a monitor session. The following topics are discussed:
Starting interactive analysis . . . . . . . . . . . . . . . . . . . . . . . . . . . . . . . . . . . . . . . . . . . . . . . 115Overview of the interactive analysis options. . . . . . . . . . . . . . . . . . . . . . . . . . . . . . . . . 118Interactive analysis option 0 - OverView . . . . . . . . . . . . . . . . . . . . . . . . . . . . . . . . . . . . 123
Determining the validity of the sample data. . . . . . . . . . . . . . . . . . . . . . . . . . . . . . 125Interactive analysis option 1 - TaskView . . . . . . . . . . . . . . . . . . . . . . . . . . . . . . . . . . . . 132
Selecting tasks for analysis . . . . . . . . . . . . . . . . . . . . . . . . . . . . . . . . . . . . . . . . . . . . . 133CodeView detail. . . . . . . . . . . . . . . . . . . . . . . . . . . . . . . . . . . . . . . . . . . . . . . . . . . . . . 134DelayView detail . . . . . . . . . . . . . . . . . . . . . . . . . . . . . . . . . . . . . . . . . . . . . . . . . . . . . 135
Interactive analysis option 2 - DelayView . . . . . . . . . . . . . . . . . . . . . . . . . . . . . . . . . . . 136Displaying minor delay categories . . . . . . . . . . . . . . . . . . . . . . . . . . . . . . . . . . . . . . 138Displaying delay locations . . . . . . . . . . . . . . . . . . . . . . . . . . . . . . . . . . . . . . . . . . . . . 138Displaying delay distribution . . . . . . . . . . . . . . . . . . . . . . . . . . . . . . . . . . . . . . . . . . 145
Interactive analysis option 3 - CodeView . . . . . . . . . . . . . . . . . . . . . . . . . . . . . . . . . . . . 146Displaying the program listing . . . . . . . . . . . . . . . . . . . . . . . . . . . . . . . . . . . . . . . . . 151Displaying delay location information. . . . . . . . . . . . . . . . . . . . . . . . . . . . . . . . . . . 152Displaying code distribution . . . . . . . . . . . . . . . . . . . . . . . . . . . . . . . . . . . . . . . . . . . 153Displaying Callerid . . . . . . . . . . . . . . . . . . . . . . . . . . . . . . . . . . . . . . . . . . . . . . . . . . . 153
Interactive analysis option 4 - TimeView . . . . . . . . . . . . . . . . . . . . . . . . . . . . . . . . . . . . 154Displaying detail data. . . . . . . . . . . . . . . . . . . . . . . . . . . . . . . . . . . . . . . . . . . . . . . . . 155
Interactive analysis option 5 - DataView . . . . . . . . . . . . . . . . . . . . . . . . . . . . . . . . . . . . 156Displaying linklist information . . . . . . . . . . . . . . . . . . . . . . . . . . . . . . . . . . . . . . . . . 156Displaying data set information . . . . . . . . . . . . . . . . . . . . . . . . . . . . . . . . . . . . . . . . 156Displaying detail and performance information . . . . . . . . . . . . . . . . . . . . . . . . . . 160DD names for IMS, DB2, Adabas, CA-Datacom, and CA-Ideal . . . . . . . . . . . . . . 168
Interactive analysis option 6 - TranView . . . . . . . . . . . . . . . . . . . . . . . . . . . . . . . . . . . . 169CodeView detail. . . . . . . . . . . . . . . . . . . . . . . . . . . . . . . . . . . . . . . . . . . . . . . . . . . . . . 171DelayView detail . . . . . . . . . . . . . . . . . . . . . . . . . . . . . . . . . . . . . . . . . . . . . . . . . . . . . 172DataView detail . . . . . . . . . . . . . . . . . . . . . . . . . . . . . . . . . . . . . . . . . . . . . . . . . . . . . . 173
Interactive analysis option 7 - ModView . . . . . . . . . . . . . . . . . . . . . . . . . . . . . . . . . . . . 174Link suggestions . . . . . . . . . . . . . . . . . . . . . . . . . . . . . . . . . . . . . . . . . . . . . . . . . . . . . 178
Interactive analysis option 8 - PoolView. . . . . . . . . . . . . . . . . . . . . . . . . . . . . . . . . . . . . 179
Chapter 5 Analyzing monitor data 113

Interactive analysis option 9 - USSView . . . . . . . . . . . . . . . . . . . . . . . . . . . . . . . . . . . . . 181CodeView detail . . . . . . . . . . . . . . . . . . . . . . . . . . . . . . . . . . . . . . . . . . . . . . . . . . . . . . 182DelayView detail . . . . . . . . . . . . . . . . . . . . . . . . . . . . . . . . . . . . . . . . . . . . . . . . . . . . . 183Threads panel . . . . . . . . . . . . . . . . . . . . . . . . . . . . . . . . . . . . . . . . . . . . . . . . . . . . . . . . 184Process Information panel . . . . . . . . . . . . . . . . . . . . . . . . . . . . . . . . . . . . . . . . . . . . . 185USS Functions. . . . . . . . . . . . . . . . . . . . . . . . . . . . . . . . . . . . . . . . . . . . . . . . . . . . . . . . 187
What next? . . . . . . . . . . . . . . . . . . . . . . . . . . . . . . . . . . . . . . . . . . . . . . . . . . . . . . . . . . . . . . 188
114 TriTune User Guide

Starting interactive analysis
Starting interactive analysis1 From the Primary Option Menu, select Option 1.
The Monitor Definition panel (Figure 45) is displayed:
Figure 45 Monitor Definition panel (starting interactive analysis)
TriTune ----------------- Monitor Definition -------------- Row 22 to 32 of 58 COMMAND ===> SCROLL ===> HALF Primary commands: ADD xxxx, STAtus Server ID: TRITUNE Status: ACTIVELine commands: S - Select A - Analyze Normal D - Delete I - Invoke AL - Analyze All DD - Delete w/dsns H - History AA - Analyze Active B - Batch Reports C - Copy AW - Analyze Wait V - CSV Reports X - Export Monitor Data LC Profile Status Schedule Runs Description Jobname ________ __________ ________ ____ _________________________ ________ >------------------------------------------------------------------------------__ TUNCIC53 Inactive 10 TUNCIC53 __ TUNCIC61 Inactive 24 TUNCIC61 __ TUNCIC62 Inactive 18 TUNCIC62 a_ TUNIVP Inactive 1 COB0101 _ TUNIV01 Inactive 1 TUNIV01 __ TUN6DCTL Inactive 2 TUN6DCTL __ TUN6DDLI Inactive 2 TUN6DDLI __ TUN6DDRC Inactive 2 TUN6DDRC __ TUN7DCTL Inactive 2 TUN7DCTL __ TUN7DDLI Inactive 2 TUN7DDLI
Chapter 5 Analyzing monitor data 115

Starting interactive analysis
2 Type one of the following line commands in the LC field next to the profile that you want to analyze.
3 Press Enter.
The Interactive Analysis menu (Figure 46 on page 117) is displayed:
Table 19 Monitor definition line commands for data analysis
Line command Description
H History - This command displays the Monitor History panel, which lists information about each monitor session invoked for the monitor profile selected. From here, you might analyze the data that is gathered during any monitor session.
Refer to “Displaying monitor history” on page 101 for more information.
A Analyze Normal - Information that is not directly related to the target application is eliminated. Data is reported as follows:
■ The following samples are eliminated from analysis: Non-dispatched (.NONDISP), No CPU available (.DISPWT), Processor Delay (.PROCDLY), Page wait (.PAGEWT), Swapped (.SWAPWT), and No activity (.OTHERWT). These samples are considered for the overall OverView activity percentages and runtimes.
■ CodeView and related histograms are sorted based on Active percentages, not total percentages. The Visual field reflects the Active percent only. Wait samples are included. Percentages are calculated on total samples; all activity values have equal weight.
AL Analyze All - Percentages are calculated based on all samples. This command allows you to compare delays occurring when the program is executing in both active and wait states.
AA Analyze Active - Percentages are calculated based on samples where the program was actively using CPU. Samples that contain only wait information are filtered out, which allows you to make normalized CPU comparisons of program activity.
AW Analyze Wait - Percentages are calculated based on samples where the program was in a wait state. Samples that contain only active information are filtered out which allows you to make normalized comparisons of program wait activity.
X Export Monitor Data - This command creates an export file of the monitor data set suitable for electronic transmission. Use this command when sending monitor data to Customer Support.
116 TriTune User Guide

Starting interactive analysis
Figure 46 Interactive Analysis menu
Options pop-up panel
To display current analysis information, place the cursor on the Options field and press Enter. A pop-up panel is displayed that shows the analysis type and any tasks or transactions selected.
4 To select an analysis option, type the number of the option and press Enter. Each option is described in the following sections.
TriTune --------------------- Interactive Analysis ----------------------------OPTION ===>
Enter option to analyze the monitored job: Profile: TUNIVP1 Options: NORMAL TriTune Monitor Information Subsystem Details ------------------------------------------- ------------------------------ 0 OverView - Monitor session information 10 DB2 - View all SQL 1 TaskView - Activity by task 11 IMS - IMS Transactions 2 DelayView - Program delays 12 JVM - Java Virtual Machine 3 CodeView - Program activity 13 WAS - WebSphere App Server 4 TimeView - Samples by time 5 DataView - Dataset information 6 TranView - Activity by transaction 7 ModView - Module layout 8 PoolView - Buffer pools 9 USSView - Unix System Services Press END to exit analysis
Chapter 5 Analyzing monitor data 117

Overview of the interactive analysis options
Overview of the interactive analysis optionsTable 20 describes each interactive analysis option, including the available line commands and subsequent displays with page number in parenthesis. The line commands (LC) are listed for each panel, followed by the panel or pop-up panel that is displayed when you press Enter. If more than one panel is listed for a single line command, the panel that is displayed depends on the type of information selected.
Table 20 Interactive analysis options (part 1 of 5)
Analysis option LC Displays LC Displays LC Displays
0 - OverView (page 123)
–– Monitor OverView panel (page 123)
1 - TaskView (page 132)
T TaskView for selected tasks only
U TaskView for selected tasks only (minus cleared tasks)
C Code Details for selected task
A CSECT Associations panel (page 200)
C Caller ID panel (page 143)
L ISPF program listing (page 151)
D Delayed Resources panel (page 140)
I Module/CSECT Info panel (page 145)
L ISPF program listing (page 151)
S Delay Distribution panel (page 145)
H, NH
Histogram (page 149)
D DelayView panel (page 136)
L ISPF program listing (page 151)
D DelayView Details for selected task
A Note: See the line command A description for Option 2 - DelayView, on page 119.
118 TriTune User Guide
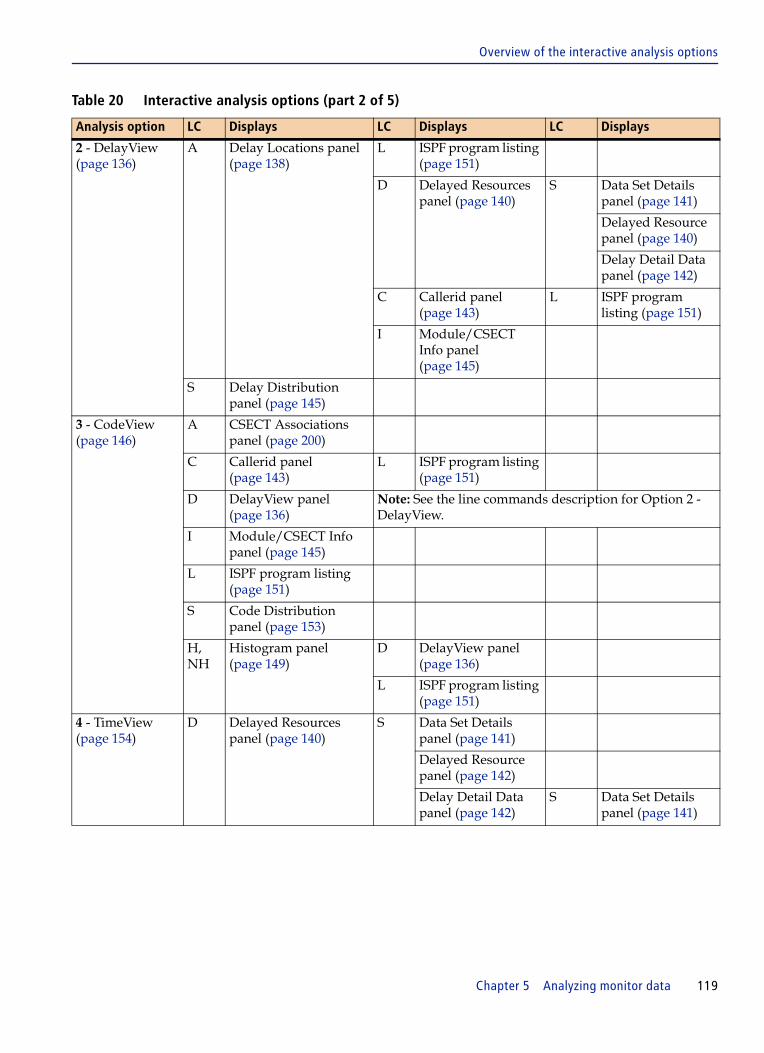
Overview of the interactive analysis options
2 - DelayView (page 136)
A Delay Locations panel (page 138)
L ISPF program listing (page 151)
D Delayed Resources panel (page 140)
S Data Set Details panel (page 141)
Delayed Resource panel (page 140)
Delay Detail Data panel (page 142)
C Callerid panel (page 143)
L ISPF program listing (page 151)
I Module/CSECT Info panel (page 145)
S Delay Distribution panel (page 145)
3 - CodeView (page 146)
A CSECT Associations panel (page 200)
C Callerid panel (page 143)
L ISPF program listing (page 151)
D DelayView panel (page 136)
Note: See the line commands description for Option 2 - DelayView.
I Module/CSECT Info panel (page 145)
L ISPF program listing (page 151)
S Code Distribution panel (page 153)
H, NH
Histogram panel (page 149)
D DelayView panel (page 136)
L ISPF program listing (page 151)
4 - TimeView (page 154)
D Delayed Resources panel (page 140)
S Data Set Details panel (page 141)
Delayed Resource panel (page 142)
Delay Detail Data panel (page 142)
S Data Set Details panel (page 141)
Table 20 Interactive analysis options (part 2 of 5)
Analysis option LC Displays LC Displays LC Displays
Chapter 5 Analyzing monitor data 119

Overview of the interactive analysis options
5 - DataView (page 156, page 284)
S Data Set Details panel (page 141)
DB2 Statements panel (page 285)
S SQL Statements panel (page 292)
E Explain panel (page 310)
SD DCL Statement panel (page 315)
E Explain panel (page 310)
C Code Details Note: See the line commands description for Option 3 - CodeView on page 119.
IMS Statements panel (page 342)
S Segment Search Arguments panel (page 348)
Adabas Statements panel (page 404)
CA-Datacom Statements panel (page 407)
Table 20 Interactive analysis options (part 3 of 5)
Analysis option LC Displays LC Displays LC Displays
120 TriTune User Guide

Overview of the interactive analysis options
6 - TranView (page 169, page 328)
T TranView for selected transactions only
U TranView for selected transactions only (minus cleared transactions)
C Code Details for selected task
A CSECT Associations panel (page 200)
C Callerid panel (page 143)
L ISPF program listing (page 151)
D Delayed Resources panel (page 140)
I Module/CSECT Info panel (page 145)
L ISPF program listing (page 151)
S Delay Distribution panel (page 145)
H, NH
Histogram (page 149)
D DelayView panel (page 136)
L ISPF program listing (page 151)
D DelayView Detail for selected task
A Note: See line command A for Option 2 - DelayView on page 119.
N Data details for selected task
N
7 - ModView (page 174)
S Module/CSECT Info panel (page 145)
U Link Suggestions panel (page 178)
8 - PoolView (page 179 and page 329)
S Shared Pools panel (page 330)
S Pool Details panel (page 353)
D Pooled Data Sets panel (page 353)
S Data Set Details panel (page 345)
Table 20 Interactive analysis options (part 4 of 5)
Analysis option LC Displays LC Displays LC Displays
Chapter 5 Analyzing monitor data 121

Overview of the interactive analysis options
9 - USSView C Code Details for selected task
A CSECT Associations panel (page 200)
C Callerid panel (page 143)
L ISPF program listing (page 151)
D Delayed Resources panel (page 140)
I Module/CSECT Info panel (page 145)
L ISPF program listing (page 151)
S Delay Distribution panel (page 145)
H,NH
Histogram (page 149)
D DelayView panel (page 136)
L ISPF program listing (page 151)
D DelayView Detail for selected task
A Note: See line command A for Option 2 - DelayView on page 119.
T USS Threads panel C Code Details Note: See the line commands description for Option 3 - CodeView on page 119.
D DelayView Detail Note: See line command A for Option 2 - DelayView on page 119.
F USS Functions panel Code Details
Note: See the line commands description for Option 3 - CodeView on page 119.
S Process Information N/A
F Function information C Code Details Note: See the line commands description for Option 3 - CodeView on page 119.
Refer to following chapters for more information about
■ Option 10 - DB2: see Chapter 10, “Using TriTune in a DB2 environment.”■ Option 11 - IMS: see Chapter 12, “Using TriTune in an IMS environment.”■ Option 12 - JVM: see Chapter 13, “Using TriTune in a Java Virtual Machine (JVM) environment.”
Table 20 Interactive analysis options (part 5 of 5)
Analysis option LC Displays LC Displays LC Displays
122 TriTune User Guide
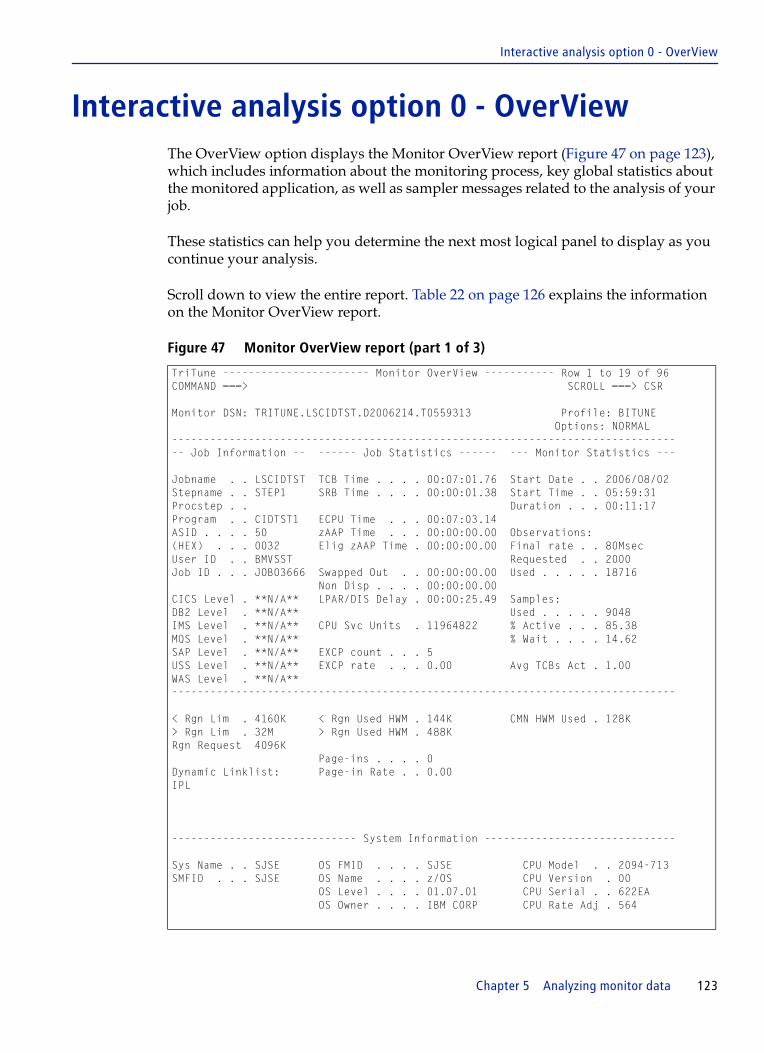
Interactive analysis option 0 - OverView
Interactive analysis option 0 - OverView The OverView option displays the Monitor OverView report (Figure 47 on page 123), which includes information about the monitoring process, key global statistics about the monitored application, as well as sampler messages related to the analysis of your job.
These statistics can help you determine the next most logical panel to display as you continue your analysis.
Scroll down to view the entire report. Table 22 on page 126 explains the information on the Monitor OverView report.
Figure 47 Monitor OverView report (part 1 of 3)
TriTune ----------------------- Monitor OverView ----------- Row 1 to 19 of 96COMMAND ===> SCROLL ===> CSR
Monitor DSN: TRITUNE.LSCIDTST.D2006214.T0559313 Profile: BITUNE Options: NORMAL ------------------------------------------------------------------------------- -- Job Information -- ------ Job Statistics ------ --- Monitor Statistics --- Jobname . . LSCIDTST TCB Time . . . . 00:07:01.76 Start Date . . 2006/08/02 Stepname . . STEP1 SRB Time . . . . 00:00:01.38 Start Time . . 05:59:31 Procstep . . Duration . . . 00:11:17 Program . . CIDTST1 ECPU Time . . . 00:07:03.14 ASID . . . . 50 zAAP Time . . . 00:00:00.00 Observations: (HEX) . . . 0032 Elig zAAP Time . 00:00:00.00 Final rate . . 80Msec User ID . . BMVSST Requested . . 2000 Job ID . . . JOB03666 Swapped Out . . 00:00:00.00 Used . . . . . 18716 Non Disp . . . . 00:00:00.00 CICS Level . **N/A** LPAR/DIS Delay . 00:00:25.49 Samples: DB2 Level . **N/A** Used . . . . . 9048 IMS Level . **N/A** CPU Svc Units . 11964822 % Active . . . 85.38 MQS Level . **N/A** % Wait . . . . 14.62 SAP Level . **N/A** EXCP count . . . 5 USS Level . **N/A** EXCP rate . . . 0.00 Avg TCBs Act . 1.00 WAS Level . **N/A** ------------------------------------------------------------------------------- < Rgn Lim . 4160K < Rgn Used HWM . 144K CMN HWM Used . 128K > Rgn Lim . 32M > Rgn Used HWM . 488K Rgn Request 4096K Page-ins . . . . 0 Dynamic Linklist: Page-in Rate . . 0.00 IPL ----------------------------- System Information ------------------------------ Sys Name . . SJSE OS FMID . . . . SJSE CPU Model . . 2094-713 SMFID . . . SJSE OS Name . . . . z/OS CPU Version . 00 OS Level . . . . 01.07.01 CPU Serial . . 622EA OS Owner . . . . IBM CORP CPU Rate Adj . 564
Chapter 5 Analyzing monitor data 123

Interactive analysis option 0 - OverView
Figure 48 Monitor OverView report (part 2 of 3)
--------------------------- Working Set Size Chart ---------------------------- Min = 410 Max = 410 Frames per Row = 0 Avg. Frame Count ---------1---------2---------3---------4---------5 410 ++++++++++++++++++++++++++++++++++++++++++++++++++ 410 410 410 410 410 410 410 410 410 ----------------------------------------------------------------------------------------------------------- Resource Demand Chart ---------------------------- Resource Type ----1----2----3----4----5----6----7----8----9----0 CIDTST1 CPU 7895477899999999999999999988999998999+999998999799 ------------------------------ Monitor Messages ------------------------------- TN0495I Profile: LSCIDTST TriTune ECSA packet initialized at 15A8C000 TN0101I Profile: LSCIDTST now monitoring JOB: LSCIDTST PGM: CIDTST1 TN0102I Profile: LSCIDTST USERID: BMVSST Data set: BMVSST.LSCIDTST.D2006214.T0559313 TN0104I Profile: LSCIDTST Initial Observation rate: 0010, Observations: 002000, Elapsed: STEP TN0103I Profile: LSCIDTST Observation rate changed: 0020 Msec TN0103I Profile: LSCIDTST Observation rate changed: 0040 Msec TN0103I Profile: LSCIDTST Observation rate changed: 0080 Msec TN8090I Profile: LSCIDTST Monitoring completed for JOB: LSCIDTST TN8091I Profile: LSCIDTST Monitor counters: 018717/018719/000000 TN0106I Profile: LSCIDTST Final Observation rate: 0080, Observations: 002000, Elapsed: 00020 TN0108I Profile: LSCIDTST ECSA Used: 131408 (bytes); SRB CPU time: 00:00:01.064 ----------------------- Monitor Options from Profile ------------------------ Jobname . . . LSCIDTST Incl Task1 . Excl Task1 . Step Name . . Incl Task2 . Excl Task2 . Procstep . . . Incl Task3 . Excl Task3 . Program Name . Incl Task4 . Excl Task4 . Incl Tran 1 . User ID 1 . Term ID 1 . Incl Tran 2 . User ID 2 . Term ID 2 . Incl Tran 3 . User ID 3 . Term ID 3 . Incl Tran 4 . User ID 4 . Term ID 4 . ------------------------------------------------------------------------------- Batch Reports . . . . . . . . Batch Report EXEC . . Total Time to Monitor . . . . 20 Observations Requested . . . . 2000 DD name for load modules . . . Delay after step start . . . . 0 Monitor valid range . . from 0000 to 0000 *************************** End of OverView Report ****************************
124 TriTune User Guide

Interactive analysis option 0 - OverView
Determining the validity of the sample data
The Monitor OverView report presents a high-level view of the application you are monitoring, gives you a preliminary indication of job performance, and helps you determine if the sample is valid for the unit of work you have targeted. See “Samples and observations” and “Sampling rules” on page 66 for more information about the collected data.
Check the following fields to determine if the monitor is valid.
NOTE See page 131 for part 3 of 3.
Table 21 Monitor OverView fields to check
For the field Ensure
Samples Used number of samples should be enough to ensure accurate data
The number should be greater than 1000. A number closer to 10000 is preferred.
Program name of the program that you intended to monitor is displayed
Sampler Messages number of recoverable errors is less than one percent of the total number of samples
Message TN8091I indicates the number of times the TriTune DIE routine executed, the number of times the TriTune SRB executed, and the number of times the TriTune SRB had a recoverable error.
Chapter 5 Analyzing monitor data 125
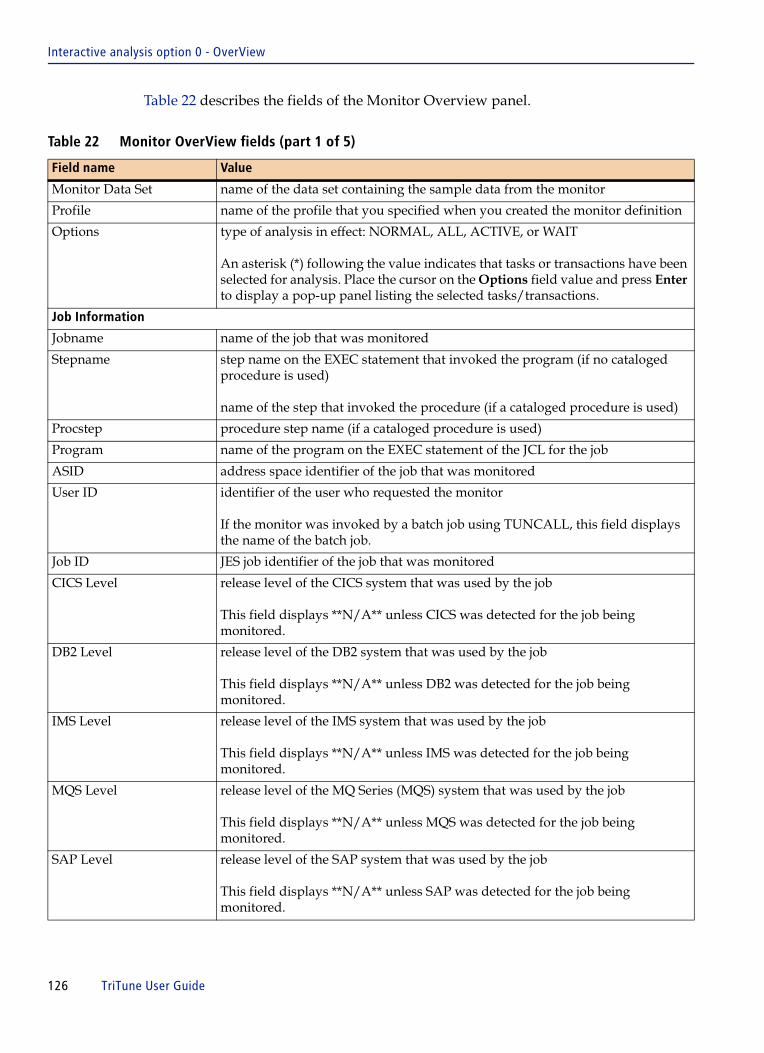
Interactive analysis option 0 - OverView
Table 22 describes the fields of the Monitor Overview panel.
Table 22 Monitor OverView fields (part 1 of 5)
Field name Value
Monitor Data Set name of the data set containing the sample data from the monitor
Profile name of the profile that you specified when you created the monitor definition
Options type of analysis in effect: NORMAL, ALL, ACTIVE, or WAIT
An asterisk (*) following the value indicates that tasks or transactions have been selected for analysis. Place the cursor on the Options field value and press Enter to display a pop-up panel listing the selected tasks/transactions.
Job Information
Jobname name of the job that was monitored
Stepname step name on the EXEC statement that invoked the program (if no cataloged procedure is used)
name of the step that invoked the procedure (if a cataloged procedure is used)
Procstep procedure step name (if a cataloged procedure is used)
Program name of the program on the EXEC statement of the JCL for the job
ASID address space identifier of the job that was monitored
User ID identifier of the user who requested the monitor
If the monitor was invoked by a batch job using TUNCALL, this field displays the name of the batch job.
Job ID JES job identifier of the job that was monitored
CICS Level release level of the CICS system that was used by the job
This field displays **N/A** unless CICS was detected for the job being monitored.
DB2 Level release level of the DB2 system that was used by the job
This field displays **N/A** unless DB2 was detected for the job being monitored.
IMS Level release level of the IMS system that was used by the job
This field displays **N/A** unless IMS was detected for the job being monitored.
MQS Level release level of the MQ Series (MQS) system that was used by the job
This field displays **N/A** unless MQS was detected for the job being monitored.
SAP Level release level of the SAP system that was used by the job
This field displays **N/A** unless SAP was detected for the job being monitored.
126 TriTune User Guide

Interactive analysis option 0 - OverView
USS Level release level of the UNIX System Services (USS) system that was used by the job
This field displays **N/A** unless USS was detected for the job being monitored.
WAS Level release level of the WebSphere Application Server (WAS) system that was used by the job
This field displays **N/A** unless WAS was detected for the job being monitored.
< Rgn Lim requested region size for the step being measured below the 16 MB line
> Rgn Lim requested region size for the step being measured above the 16 MB line
Rgn Request amount of storage requested by the job being monitored
Dynamic Linklist user-specified dynamic linklist, if using a linklist other than that specified during IPL
Job Statistics
TCB Time amount of CPU time that was used by execution of code in task mode during the monitored period
This value is obtained from the ASCB.
SRB Time amount of SRB time used by this address space during the time it was being measured
The SRB time used by TriTune is not reflected in this value.
ECPU Time amount of CPU time used within this address space in HH:MM:SS.TH format
zAAP Time amount of CPU time used by this address space in a zSeries Application Assist Processor (zAAP) in HH:MM:SS.TH format
Elig zAAP Time total time that there was Java work eligible to run on a zSeries Application Assist Processor (zAAP)
Within a particular application, some work might be Java and the JVM has designated the work as zAAP-eligible, while other work might be non-Java, or might be Java work that was not marked zAAP-eligible by the JVM. The zAAP-eligible work can be switched to a zAAP for processing, and when the work that is not zAAP-eligible is ready to execute, this work would execute on a standard CP. A Switch Service is in place to work with the z/OS Dispatcher, managing the dispatching of zAAP-eligible work between the standard CPs and the zAAP Engines.
This field can help identify opportunities where a zAAP processor would benefit processing as well as identify issues with available zAAP processors not being fully utliized. New zAAP users should refer to the JVM Startup Options for zAAPs such as -Xifa: as well as new parameters in the IEAOPTxx of SYS1.PARMLIB such as IFACrossover.
Swapped Out amount of time the address space was observed to be swapped out during the measurement in HH:MM:SS.TH format
Table 22 Monitor OverView fields (part 2 of 5)
Field name Value
Chapter 5 Analyzing monitor data 127

Interactive analysis option 0 - OverView
Non Disp amount of time the address space was observed to be nondispatchable (the ASCB nondispatchability flags were on) during the measurement in HH:MM:SS.TH format
LPAR/DIS Delay amount of time the address space was observed to be delayed because of either LPAR delay or other disabled work on the processor during the time of the measurement in HH:MM:SS.TH format
CPU Svcs Units CPU Service units, which are an interval of CPU time normalized by a CPU processor specific adjustment rate
EXCP count number of EXCPs or I/Os issued by the address space during the duration of the measurement
EXCP Rate number of EXCPs or I/Os per second being issued by the address space during the duration of the measurement
< Rgn Used HWM high-water-mark value for the used region size below the 16 MB line
This value might actually be larger than the requested size if modified by other products or SMF exits.
>Rgn Used HWM high-water-mark value for the used region size above the 16 MB line
This value might actually be larger than the requested size if modified by other products or SMF exits.
Page-ins number of page-in operations for the job
A high value in this field can indicate job delays.
Page-in Rate number of page-in operations per second
A high rate can indicate job delay due to storage constraints.
When reference is made to a page of virtual storage that does not appear in central storage, the page is brought in from DASD or expanded storage to replace a page in central storage. The newly referenced page is said to have been paged in. It is the page-in (not page-out) rate that is of primary concern because page-in activity occurs synchronously (for example, the task stops until the page fault is resolved).
Monitor Statistics
Start Date date the monitor started
Start Time time the monitor started
Duration duration of time the address space was measured by TriTune for this monitor in HH:MM:SS format
Observatons: Final Rate final rate at which TriTune observed the activity of the address space
Note: This value was formerly known as the sampling rate. See “Specifying additional monitoring criteria” on page 78 for more information.
Observatons: Requested number of requested observations in the monitor profile as requested by the user
Table 22 Monitor OverView fields (part 3 of 5)
Field name Value
128 TriTune User Guide

Interactive analysis option 0 - OverView
Observatons: Used actual number of observations made by TriTune
Samples: Used number of samples used from the measurement
See “Specifying additional monitoring criteria” on page 78 for more information.
Samples: % Active percentage of samples used that were recorded when the application was actively using CPU
Samples: % Wait percentage of samples used that were recorded when the application was not using CPU and was waiting on a resource
Avg TCBs Act average number of TCBs that were actively using the CPU during an observation
This value can be from 0 up to the number of online CPUs.
CMN HWM Used high-water-mark amount of common (ECSA) storage used by TriTune to measure the job
This value can be used for planning purposes on setting the maximum active number of monitors allowed.
System Information
System Name eight-character system name identifier for the z/OS image on which the monitor was executed
SMFID four-character System Management Facility identifier for the z/OS image on which the monitor was executed
OS FMID release level of the MVS system where the target job executed
OS Name name of the operating system
OS Level release level of the operating system
OS Owner name of the operating system owner
CPU Model CPU model number of the system on which the monitor was executed
CPU Version CPU version of the system on which the monitor was executed
CPU Serial serial number of the processor on which the monitor was executed
CPU Rate Adj processor-specific adjustment rate used in the calculation of CPU service units
This value is based on the number of instructions per CPU second for a given processor.
Working Set Size Chart
The Working Set Size Chart displays the average frame count usage over time. The total monitor period is divided into 50 equal intervals. Each + on the chart represents the average frame count for an interval.
The chart contains ten rows whose range is determined by the minimum and maximum average frame count used for the monitored period. The number of frames per row is calculated as
(Max Avg. Frame Count - Min Avg. Frame Count)/9
Table 22 Monitor OverView fields (part 4 of 5)
Field name Value
Chapter 5 Analyzing monitor data 129

Interactive analysis option 0 - OverView
Resource Demand Chart
Approximate percentage of time the application spent either running on a CPU or being delayed for data over the life of the monitor run. The total monitor run is split into 50 equal periods, each period being 2% of the total run. The activity is summarized into each slot by resource type. In this way, you see an overview of the resource demands during the monitor run.
Resource task name, file name, or database ID that uniquely identifies the resource being reported
Type type of resource, which can be one of the following types:
■ CPU—application active on processor for a task resource ■ I/O—application delayed for I/O on a DD name resource ■ DB2—application delayed for a DB2 statement on a DBRM resource ■ MQS—application delayed for MQSeries resources■ SAP—application delayed for SAP resources■ ADA—application delayed for an Adabas statement■ DCM—application delayed for a Datacom statement■ IMS—application delayed for an IMS segment on a PSB resource■ OTHR—application delayed for an unidentifiable resource
Chart fifty columns of numbers that depict the time spent by the program executing on a CPU or delayed for data for each period
The percentages shown represent from 0% to 100% of the total resource demand. When the percentage is 5% or less, a period (.) is displayed. When the percentage is between 5% and 95%, a single digit from 0 to 9 is displayed. When the percentage is 95% or greater, a plus sign (+) is displayed.
Monitor Messages
Messages that are issued by the TriTune Server Space during the monitored period are displayed here. These messages provide additional information about TriTune execution and completion.
Monitor Options from Profile
Monitor options that you specified in the Monitor Criteria panel are displayed here. See Table 9 on page 73 for information about these fields.
DB2 Monitoring, Intercept, and Flag settings (shown in Figure 49 on page 131)Monitoring parameters specifying DB2 data collection information are displayed here. The values are defined in UTRPARM member TUNSSP00 (refer to the TriTune Installation and Customization Guide for more information about parameters in TUNSSP00).
Table 22 Monitor OverView fields (part 5 of 5)
Field name Value
130 TriTune User Guide

Interactive analysis option 0 - OverView
Figure 49 Monitor OverView report (part 3 of 3)
DB2 monitoring, Intercept, and Flag settings-------------------------------------------------------------------------------DB2 monitoring .... DB2EXPL = YES Call DB2 Explain for all applicable SQL. DB2IEXPL = YES Call DB2 Explain for all intercepted SQL. DB2NOCAT = NO Obtain SQL from the DB2 catalog. DB2ICONL = NO Normal processing.
DB2 monitoring and Intercept data granularity control .... DB2ICCOR = NO Do not add Correlation ID to the summarization key. DB2ICIID = NO Do not add OPER ID to the summarization key. DB2ICTHD = NO Do not add Thread address to the summarization key. DB2NOCUR = NO Collect the CURSOR name. DB2NORTN = NO Collect the Function name.
DB2 Intercept .... DB2ICEPT = YES The DB2 Intercept is Active. DB2ICJLS = NO Create comprehensive data records. DB2ICNST = NO Create statistics data as requested. DB2ICEST = YES Create statistics data records only at termination.
DB2 Intercept summarization control .... DB2ICSUM = 50 DB2 Intercept data summarization is Active.
DB2 Intercept Restart/ABEND control .... DB2ICMAX = 0 DB2 Intercept equal call check is not active. DB2ICMXA = 0 DB2 Intercept ABENDs are unlimited. DB2ICMXM = 100 DB2 Intercept ABEND messages will stop after 100 messages.
DB2 data UNICODE control .... DB2FCSID = 1208 From Coded Character Set IDentifier (CCSID). DB2TCSID = -1 To Coded Character Set IDentifier (CCSID).
DB2 Intercept data collection control .... DB2ICSQL = NO Do not collect SQL from the intercept. DB2ICDYN = NO Collect SQL per DBICISQL setting. DB2ICTIM = NO Do not collect wait time data from the intercept. DB2ICLBF = NO Do not collect local buffer pool data from the intercept. DB2ICGBF = NO Do not collect global buffer pool data from the intercept. DB2ICLCK = NO Do not collect lock data from the intercept. DB2ICSQS = NO Do not collect SQL statistics data from the intercept.
Chapter 5 Analyzing monitor data 131

Interactive analysis option 1 - TaskView
Interactive analysis option 1 - TaskView TaskView provides information about the components of the monitored address space. When first invoked, the TaskView panel (Figure 50) displays all of the monitored tasks. You might select specific tasks to focus your analysis
Figure 50 TaskView panel
TaskView displays one line for each unique task that is detected during the monitored period. From this perspective, you see which tasks are delayed and the reasons for the delay. TriTune reports on all tasks in the address space except the initiator and dump services.
Table 23 describes the available commands for TaskView.
TriTune -------------------------- TaskView ------------------ Row 1 to 5 of 5COMMAND ===> SCROLL ===> CSR Primary commands: SELect, RECall, ADDHelp Profile: DB2SAMP Options: NORMAL Line commands: T - Tag C - Code Details U - Untag D - Delay Details LC Program T Actv% Data% System% VolWait% InvWait% Other% Total% ________ _ _____ _____ _______ ________ ________ ______ ______ -------------------------------------------------------------------------------__ DFHKETCB 13.47 38.37 0.00 33.88 0.00 0.00 85.71 __ DFHD2EX3 3.67 0.00 0.00 3.27 0.00 0.00 6.94 __ DFHD2EX3 1.63 0.00 0.00 2.45 0.00 0.00 4.08 __ DFSPAT00 0.41 2.45 0.00 0.00 0.00 0.00 2.86 __ **N/A** 0.41 0.00 0.00 0.00 0.00 0.00 0.41
Table 23 TaskView commands
Command Description
SELect selects only the tagged tasks for analysis
RECall displays all tasks for analysis
ADDHelp invokes the content-sensitive Help application to update or create a help entry for the selected content
T tag line command that is used to select up to five tasks for analysis
U untag line command that is used to clear a selected task
C CodeView Detail line command that is used to display the CodeView Detail panel showing activity detected by TriTune
The CodeView Detail panel is described on page 134.
D DelayView Detail line command that is used to display the DelayView Detail panel showing the types of delays encountered by TriTune
The DelayView Detail panel is described on page 135.
132 TriTune User Guide

Interactive analysis option 1 - TaskView
Table 24 describes the delay information that is displayed on the TaskView panel.
Selecting tasks for analysis
1. Type T next to the tasks that you want to select for analysis.
2. Press Enter.
An X will be displayed in the T column indicating which tasks are selected.
To clear a task, type U next to it and press Enter.
Table 24 TaskView fields
Field name Value
Profile name of the profile that you specified when you created the monitor definition
Options type of analysis in effect: NORMAL, ALL, ACTIVE, or WAIT
An asterisk (*) following the value indicates that tasks or transactions have been selected for analysis
Place the cursor on the Options field value and press Enter to display a pop-up panel listing the selected tasks/transactions.
Program program name associated with the task
If a program name cannot be identified, the value **n/a** is substituted.
T “X” indicates that the task has been tagged for analysis
Actv% percentage of the monitored period that the CPU was actively processing the monitored application
Data% percentage of the monitored period that the application was delayed because of an I/O request
System% percentage of the monitored period that the application used system services
Examples of these services are storage management and security checking.
VolWait% percentage of the monitored period that the application voluntarily waited for an event
InvWait% percentage of the monitored period that the application waited because one of the following situations occurred:
■ The address space was swapped out and unable to run.■ The address space was swapped in, but was not given control of the CPU.
Other% percentage of the monitored period that was not attributable to any of the categories known to TriTune
Total% sum of the other six categories of delay
Visual graphical representation of the Total% field
Chapter 5 Analyzing monitor data 133
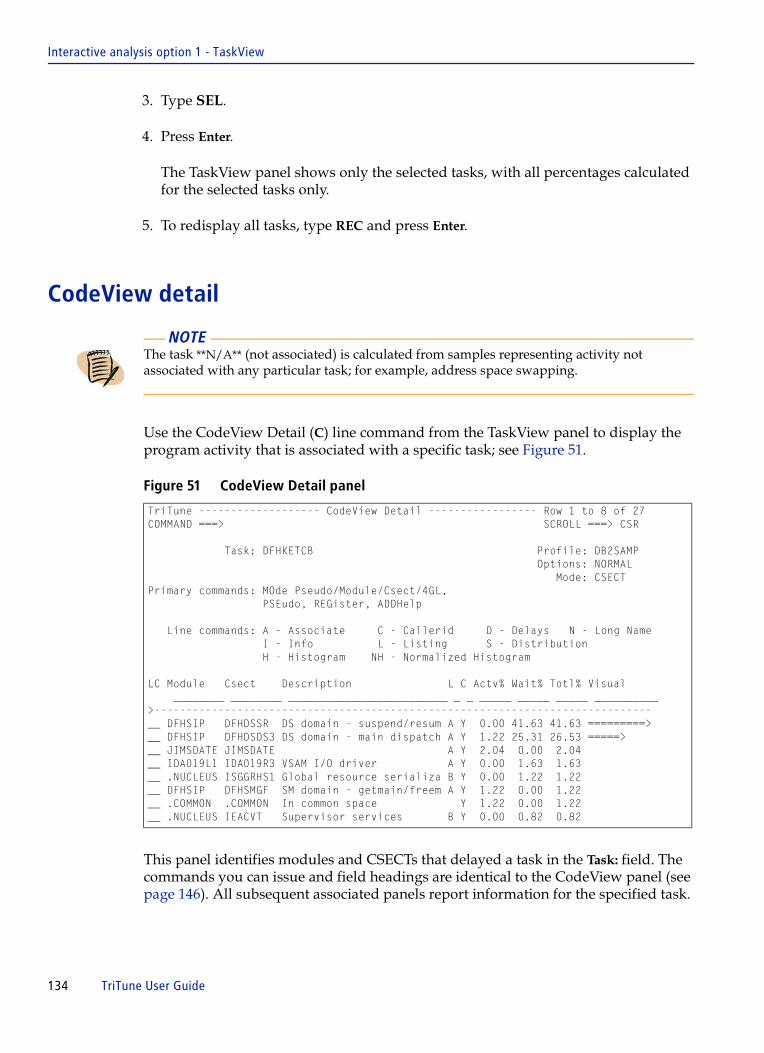
Interactive analysis option 1 - TaskView
3. Type SEL.
4. Press Enter.
The TaskView panel shows only the selected tasks, with all percentages calculated for the selected tasks only.
5. To redisplay all tasks, type REC and press Enter.
CodeView detail
Use the CodeView Detail (C) line command from the TaskView panel to display the program activity that is associated with a specific task; see Figure 51.
Figure 51 CodeView Detail panel
This panel identifies modules and CSECTs that delayed a task in the Task: field. The commands you can issue and field headings are identical to the CodeView panel (see page 146). All subsequent associated panels report information for the specified task.
NOTE The task **N/A** (not associated) is calculated from samples representing activity not associated with any particular task; for example, address space swapping.
TriTune ------------------- CodeView Detail ----------------- Row 1 to 8 of 27COMMAND ===> SCROLL ===> CSR Task: DFHKETCB Profile: DB2SAMP Options: NORMAL Mode: CSECT Primary commands: MOde Pseudo/Module/Csect/4GL, PSEudo, REGister, ADDHelp Line commands: A - Associate C - Callerid D - Delays N - Long Name I - Info L - Listing S - Distribution H - Histogram NH - Normalized Histogram
LC Module Csect Description L C Actv% Wait% Totl% Visual ________ ________ _________________________ _ _ _____ _____ _____ __________>------------------------------------------------------------------------------__ DFHSIP DFHDSSR DS domain - suspend/resum A Y 0.00 41.63 41.63 =========>__ DFHSIP DFHDSDS3 DS domain - main dispatch A Y 1.22 25.31 26.53 =====> __ JIMSDATE JIMSDATE A Y 2.04 0.00 2.04 __ IDA019L1 IDA019R3 VSAM I/O driver A Y 0.00 1.63 1.63 __ .NUCLEUS ISGGRHS1 Global resource serializa B Y 0.00 1.22 1.22 __ DFHSIP DFHSMGF SM domain - getmain/freem A Y 1.22 0.00 1.22 __ .COMMON .COMMON In common space Y 1.22 0.00 1.22 __ .NUCLEUS IEACVT Supervisor services B Y 0.00 0.82 0.82
134 TriTune User Guide

Interactive analysis option 1 - TaskView
DelayView detail
Use the DelayView Detail (D) line command to display the delay categories that are associated with a specific task and detected by TriTune (Figure 52).
Figure 52 DelayView detail panel
This panel displays information about what caused a task to be delayed in its execution. The commands you can issue and field headings are identical to the DelayView panel (see page 136). All subsequent associated panels report information for the specified task.
NOTE The CodeView Detail panel reports both Active and Wait activity percentages for Analyze Normal mode, which accounts for all activity reported in TaskView.
TriTune -------------------------- DelayView --------------- Row 1 to 11 of 11COMMAND ===> SCROLL ===> CSR Primary commands: DETail on/off Module: * Profile: DB2SAMP ADDHelp Csect: * Options: NORMAL Offset: * Detail: ON Line commands: A - Address S - Distribution LC Major category Minor category Actv% Wait% Totl% Visual ____________________ ____________________ ______ ______ ______ __________ -------------------------------------------------------------------------------__ Voluntary Wait Wait/Waitr SVC 0.00 39.59 39.59 =========> __ CICS File Ctl Delay VSAM I/O Wait 0.00 37.96 37.96 ========> __ Program Active Program Active 15.92 0.00 15.92 ===> __ Data Delay IMS Statement 0.00 2.45 2.45 __ Data Delay DB2 Statement 1.22 0.00 1.22 __ System Active Post SVC 0.82 0.00 0.82 __ CICS File Ctl Delay VSAM String Wait 0.00 0.41 0.41 __ Data Delay Tpio SVC 0.41 0.00 0.41 __ System Active Getmain 120 SVC 0.41 0.00 0.41 __ System Active PC-Time service 0.41 0.00 0.41 __ System Active Extended XCF service 0.41 0.00 0.41
NOTE The DelayView detail panel does not support the S (Distribution) line command.
Chapter 5 Analyzing monitor data 135
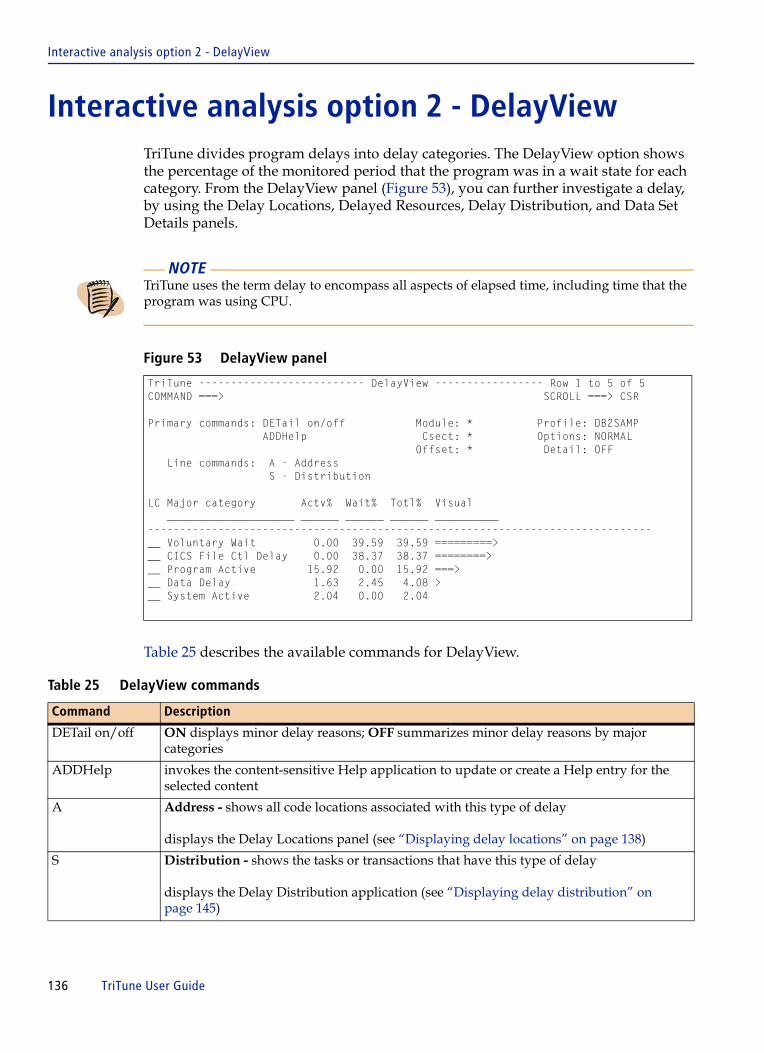
Interactive analysis option 2 - DelayView
Interactive analysis option 2 - DelayView TriTune divides program delays into delay categories. The DelayView option shows the percentage of the monitored period that the program was in a wait state for each category. From the DelayView panel (Figure 53), you can further investigate a delay, by using the Delay Locations, Delayed Resources, Delay Distribution, and Data Set Details panels.
Figure 53 DelayView panel
Table 25 describes the available commands for DelayView.
NOTE TriTune uses the term delay to encompass all aspects of elapsed time, including time that the program was using CPU.
TriTune -------------------------- DelayView ----------------- Row 1 to 5 of 5COMMAND ===> SCROLL ===> CSR Primary commands: DETail on/off Module: * Profile: DB2SAMP ADDHelp Csect: * Options: NORMAL Offset: * Detail: OFF Line commands: A - Address S - Distribution LC Major category Actv% Wait% Totl% Visual ____________________ ______ ______ ______ __________ -------------------------------------------------------------------------------__ Voluntary Wait 0.00 39.59 39.59 =========> __ CICS File Ctl Delay 0.00 38.37 38.37 ========> __ Program Active 15.92 0.00 15.92 ===> __ Data Delay 1.63 2.45 4.08 > __ System Active 2.04 0.00 2.04
Table 25 DelayView commands
Command Description
DETail on/off ON displays minor delay reasons; OFF summarizes minor delay reasons by major categories
ADDHelp invokes the content-sensitive Help application to update or create a Help entry for the selected content
A Address - shows all code locations associated with this type of delay
displays the Delay Locations panel (see “Displaying delay locations” on page 138)
S Distribution - shows the tasks or transactions that have this type of delay
displays the Delay Distribution application (see “Displaying delay distribution” on page 145)
136 TriTune User Guide

Interactive analysis option 2 - DelayView
Table 26 explains the information that is displayed on the DelayView panel.
Table 26 DelayView fields
Field name Value
Module asterisk (*) means all modules in the sample set were considered
For more information about displaying information about a particular module, see “Displaying delay locations” on page 138.
CSECT asterisk (*) means all the CSECTs in the sample set were considered
For more information about displaying information about a particular CSECT, see “Displaying delay locations” on page 138.
Offset asterisk (*) means all the offsets in the sample set were considered
For more information about displaying information about a particular offset, see “Displaying delay locations” on page 138.
Profile name of the profile that you specified when you created the monitor definition
Options indicates the type of analysis in effect: NORMAL, ALL, ACTIVE, or WAIT
An asterisk (*) following the value indicates that tasks or transactions have been selected for analysis. Place the cursor on the Options field value and press Enter to display a pop-up panel listing the selected tasks/transactions.
Detail indicates the display mode of ON or OFF for delay details
Major category six major categories of delays are shown here:
■ Program Active - The application or a called support routine is using CPU.■ Data Delay - The application is accessing a file.■ Voluntary Wait - The application is voluntarily waiting for resources. ■ File Mgmt Delay - The application is preparing a file for processing.■ System Active - The application is using operating system functions such as storage
administration or system security.■ Other Delays - The application is delayed by a category unknown to TriTune.
See Chapter 9, “Using TriTune to tune your applications” for a complete list of categories.
Minor category more detailed delay category classification
This field is blank if DETAIL OFF is specified. To view the minor delay categories, use the primary command DETAIL ON.
Actv% percentage of the monitored period that TriTune detected CPU usage for this category of delay
Wait% percentage of the monitored period that TriTune detected that the program was in a wait state for this category of delay
Totl% summation of the Actv% and Wait% fields
Visual graphical representation of the Totl% field
Chapter 5 Analyzing monitor data 137

Interactive analysis option 2 - DelayView
Displaying minor delay categories
DelayView divides each major delay category into minor categories. Minor delay categories are only displayed if Detail: ON is specified for the panel. The default display value is specified on the Profile Parameters panel. You can change the display by using the DETail on/off primary command.
Both major and minor delay categories are shown in Figure 53 on page 136, as indicated by Detail: ON on the right side of the screen. To see only major delay categories, use the primary command DETail OFF.
Displaying delay locations
To find the location of a specific delay, type A next to a delay category and press Enter. For example, type A next to the Data Delay line on the DelayView panel and press Enter.
The Delay Locations panel (Figure 54) is displayed.
Figure 54 Delay Locations panel
The Delay Locations panel displays a list of CSECT module names, CSECTs, and offsets where the delays were detected. If TriTune finds more than one location where a data delay took place, the data is listed in order of decreasing significance.
TriTune ----------------------- Delay Locations ------------ Row 1 to 11 of 42COMMAND ===> SCROLL ===> CSR Delay type: IO Queued Profile: DB2SAMP Primary commands: REGister, ADDHelp Line commands: L - Listing D - Details A - Associate C - Callerid I - Info LC Module Csect Offset Csect Description Stmt D C Pct Visual ________ ________ ________ ______________________ _____ _ _ _____ __________>------------------------------------------------------------------------------__ IGG019AR IGG019AR 00000084 QSAM put next buffer Y Y 47.64 =========>__ IGG019AQ IGG019AQ 0000008E QSAM get next buffer Y Y 40.00 =======> __ IGG0193B IGG019TV 0000064A QSAM EOB I/O DASD Y Y 0.25 __ NFW660 NFW660 000046D0 Y Y 0.10 __ IGG019AR IGG019AR 00000092 QSAM put next buffer Y Y 0.05 __ NFW660 NFW660 00004A8A Y Y 0.05 __ NFW660 NFW660 00006EA0 Y Y 0.05 __ DSN DSNECP00 00000672 TA-DSN START-UP CSECT Y 0.02 __ IGZEQBL IGZEQBL 000021BE Coblib QSAM initializa Y Y 0.02 __ IGZEQBL IGZEQBL 000021C6 Coblib QSAM initializa Y Y 0.02 __ IKJEFT01 IKJEFTSC 00000BE4 TSO routine Y 0.02
138 TriTune User Guide
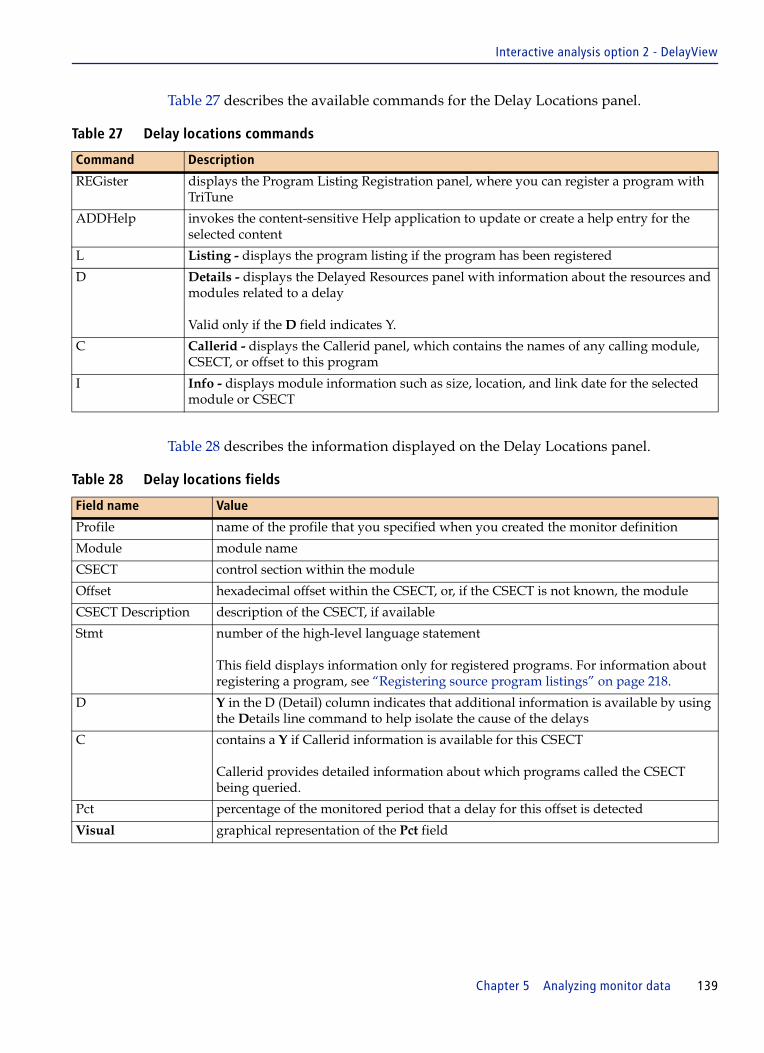
Interactive analysis option 2 - DelayView
Table 27 describes the available commands for the Delay Locations panel.
Table 28 describes the information displayed on the Delay Locations panel.
Table 27 Delay locations commands
Command Description
REGister displays the Program Listing Registration panel, where you can register a program with TriTune
ADDHelp invokes the content-sensitive Help application to update or create a help entry for the selected content
L Listing - displays the program listing if the program has been registered
D Details - displays the Delayed Resources panel with information about the resources and modules related to a delay
Valid only if the D field indicates Y.
C Callerid - displays the Callerid panel, which contains the names of any calling module, CSECT, or offset to this program
I Info - displays module information such as size, location, and link date for the selected module or CSECT
Table 28 Delay locations fields
Field name Value
Profile name of the profile that you specified when you created the monitor definition
Module module name
CSECT control section within the module
Offset hexadecimal offset within the CSECT, or, if the CSECT is not known, the module
CSECT Description description of the CSECT, if available
Stmt number of the high-level language statement
This field displays information only for registered programs. For information about registering a program, see “Registering source program listings” on page 218.
D Y in the D (Detail) column indicates that additional information is available by using the Details line command to help isolate the cause of the delays
C contains a Y if Callerid information is available for this CSECT
Callerid provides detailed information about which programs called the CSECT being queried.
Pct percentage of the monitored period that a delay for this offset is detected
Visual graphical representation of the Pct field
Chapter 5 Analyzing monitor data 139

Interactive analysis option 2 - DelayView
Displaying delayed resources
If a Y appears in the D column on the Delay Locations panel, you can view another level of information. Type D and press Enter.
The Delayed Resources panel (Figure 55) is displayed.
Figure 55 Delayed Resources panel
The Delayed Resources panel shows resources and components that are related to a delay. Based on the type of delay, the Resource field contains different types of information. Use the Select line command to display more information about the selected resource.
Table 29 describes the information displayed on the Delayed Resources panel.
TriTune ---------------------- Delayed Resources ------------- Row 1 to 4 of 4COMMAND ===> SCROLL ===> CSR Delay type: IO Queued Profile: DB2SAMP Module: IGG019ARLine commands: S - Select Csect: IGG019AR Offset: 00000084LC Resource Component Pct Visual ____________________ ___________________________________ _____ __________ >------------------------------------------------------------------------------__ SKWAO FILE LIST 40.74 =========> __ SIWA3O FILE LIST 6.82 > __ SKWAI FILE LIST 0.05 __ ITRANS FILE LIST 0.02
Table 29 Delayed Resources fields
Field name Value
Delay type category of delay from the DelayView panel for which details are now displayed
Profile name of the profile that you specified when you created the monitor definition
Module module name
CSECT control section within the module
Offset hexadecimal offset within the CSECT, or, if the CSECT is not available, within the module
Resource resources delaying the program
Resources vary depending on the delay category. For more information about the types of resources that can cause delays, see Chapter 9, “Using TriTune to tune your applications.”
Component component of the resource delaying the program. Components vary based on the resource
Pct percentage of time during the monitored period that this resource delayed the application
Visual graphical representation of the Pct field
140 TriTune User Guide
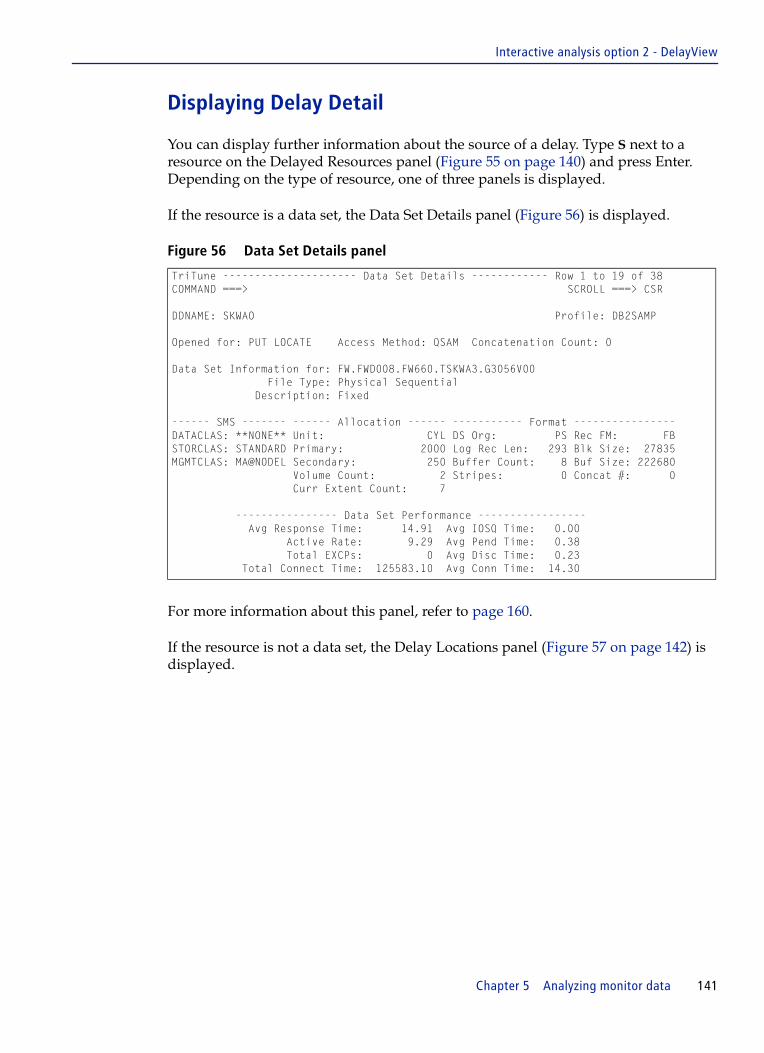
Interactive analysis option 2 - DelayView
Displaying Delay Detail
You can display further information about the source of a delay. Type S next to a resource on the Delayed Resources panel (Figure 55 on page 140) and press Enter. Depending on the type of resource, one of three panels is displayed.
If the resource is a data set, the Data Set Details panel (Figure 56) is displayed.
Figure 56 Data Set Details panel
For more information about this panel, refer to page 160.
If the resource is not a data set, the Delay Locations panel (Figure 57 on page 142) is displayed.
TriTune --------------------- Data Set Details ------------ Row 1 to 19 of 38 COMMAND ===> SCROLL ===> CSR DDNAME: SKWAO Profile: DB2SAMP Opened for: PUT LOCATE Access Method: QSAM Concatenation Count: 0 Data Set Information for: FW.FWD008.FW660.TSKWA3.G3056V00 File Type: Physical Sequential Description: Fixed ------ SMS ------- ------ Allocation ------ ----------- Format ----------------DATACLAS: **NONE** Unit: CYL DS Org: PS Rec FM: FBSTORCLAS: STANDARD Primary: 2000 Log Rec Len: 293 Blk Size: 27835MGMTCLAS: MA@NODEL Secondary: 250 Buffer Count: 8 Buf Size: 222680 Volume Count: 2 Stripes: 0 Concat #: 0 Curr Extent Count: 7 ---------------- Data Set Performance ----------------- Avg Response Time: 14.91 Avg IOSQ Time: 0.00 Active Rate: 9.29 Avg Pend Time: 0.38 Total EXCPs: 0 Avg Disc Time: 0.23 Total Connect Time: 125583.10 Avg Conn Time: 14.30
Chapter 5 Analyzing monitor data 141

Interactive analysis option 2 - DelayView
Figure 57 Delay Locations panel
If the resource includes multiple data sets, the Delay Detail Data panel (Figure 58) is displayed. From this panel, you can use the Select line command to display the Data Set Detail panel (Figure 56 on page 141).
Figure 58 Delay Detail Data panel
TriTune ----------------------- Delay Locations ------------ Row 4 to 11 of 11COMMAND ===> SCROLL ===> CSR Delay type: VSAM I/O Wait Profile: DB2SAMP Primary commands: REGister, ADDHelp Line commands: L - Listing D - Details A - Associate C - Callerid I - Info LC Module Csect Offset Csect Description Stmt D C Pct Visual ________ ________ ________ ______________________ _____ _ _ _____ __________>------------------------------------------------------------------------------d_ IDA019L1 IDA019R3 000000EC VSAM I/O driver Y Y 1.63 _ .NUCLEUS ISGGRHS1 00000694 Global resource serial Y Y 1.22 __ .NUCLEUS IEACVT 00000050 Supervisor services Y Y 0.82 __ DFHFCFR DFHFCFR 00003TRC File control file requ Y Y 0.41 __ DFHSIP DFHDSDS3 0000170E DS domain - main dispa Y Y 0.41 __ DFHTMP TMP01 000022E8 Table manager program Y Y 0.41 __ IDA019L1 IDA019R1 000007C0 VSAM decode and valida Y Y 0.41 __ IDA019L1 IDA019R2 00000EB0 VSAM buffer mgt Y Y 0.41
TriTune ---------------------- Delayed Resources ------------- Row 1 to 4 of 4COMMAND ===> SCROLL ===> CSR Delay type: VSAM I/O Wait Profile: DB2SAMP Module: IDA019L1Line commands: S - Select Csect: IDA019R3 Offset: 000000ECLC Resource Component Pct Visual ____________________ ___________________________________ _____ __________ >------------------------------------------------------------------------------S_ MDYU1000 0.41 =========> __ MDY2000 0.41 =========> __ MDYU3000 0.41 =========> __ MDY3000 0.41 =========>
142 TriTune User Guide
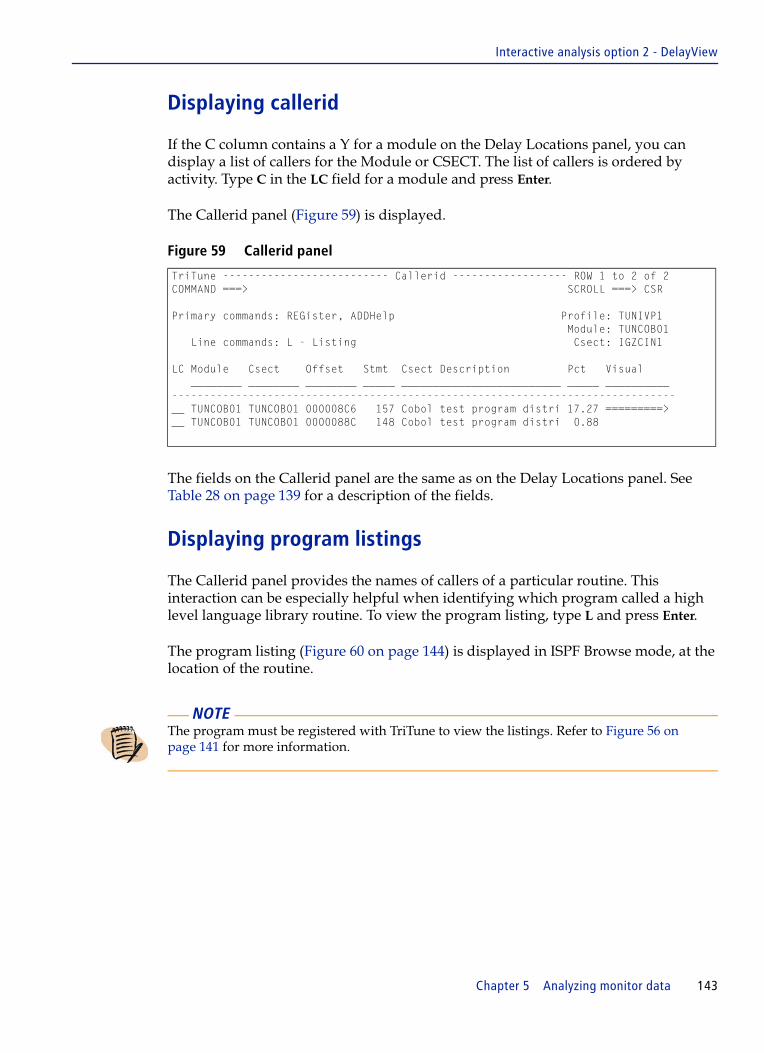
Interactive analysis option 2 - DelayView
Displaying callerid
If the C column contains a Y for a module on the Delay Locations panel, you can display a list of callers for the Module or CSECT. The list of callers is ordered by activity. Type C in the LC field for a module and press Enter.
The Callerid panel (Figure 59) is displayed.
Figure 59 Callerid panel
The fields on the Callerid panel are the same as on the Delay Locations panel. See Table 28 on page 139 for a description of the fields.
Displaying program listings
The Callerid panel provides the names of callers of a particular routine. This interaction can be especially helpful when identifying which program called a high level language library routine. To view the program listing, type L and press Enter.
The program listing (Figure 60 on page 144) is displayed in ISPF Browse mode, at the location of the routine.
TriTune -------------------------- Callerid ------------------ ROW 1 to 2 of 2 COMMAND ===> SCROLL ===> CSR Primary commands: REGister, ADDHelp Profile: TUNIVP1 Module: TUNCOB01 Line commands: L - Listing Csect: IGZCIN1 LC Module Csect Offset Stmt Csect Description Pct Visual ________ ________ ________ _____ _________________________ _____ __________ -------------------------------------------------------------------------------__ TUNCOB01 TUNCOB01 000008C6 157 Cobol test program distri 17.27 =========> __ TUNCOB01 TUNCOB01 0000088C 148 Cobol test program distri 0.88
NOTE The program must be registered with TriTune to view the listings. Refer to Figure 56 on page 141 for more information.
Chapter 5 Analyzing monitor data 143

Interactive analysis option 2 - DelayView
Figure 60 TUNCOB01 program listing
********************************* Top of Data**********************************PP 5655-G53 IBM Enterprise COBOL for z/OS and OS/390 3.2.0 Date 11Invocation parameters: OBJECT,LIST,SOURCE Options in effect: NOADATA ADV QUOTE ARITH(COMPAT) NOAWO BUFSIZE(4096) NOCICS CODEPAGE(1140) NOCOMPILE(S) NOCURRENCY LineID PL SL ----+-*A-1-B--+----2----+----3----+----4----+----5----+----6---000001 000100 IDENTIFICATION DIVISION. 000002 000200 PROGRAM-ID. TUNCOB01. 000003 000300*--------------------------------------------------------000004 000400* 000005 000500* THIS TEST PROGRAM IS USED TO VERIFY THE INSTALLATION O000006 000600* TRITUNE AND TO DEMONSTRATE ITS CAPABILITIES. 000007 000700* 000008 000800* IN THIS PROGRAM WE WILL EXPLORE TWO AREAS AND 000009 000900* THEIR EFFECT ON PROGRAM PERFORMANCE. 000010 001000* 000011 001100* 1. FILE I/O AND BLOCKING OF SEQUENTIAL FILES 000012 001200* WRITE A RECORD TO TWO FILES 3000 TIMES 000013 001300* 2. CODING TECHNIQUES 000014 001400* A. USE OF INSPECT VERB 000015 001410* B. SUBSCRIPTING 000016 001500* C. INDEXING 000017 001600* D. INLINE CODING
144 TriTune User Guide
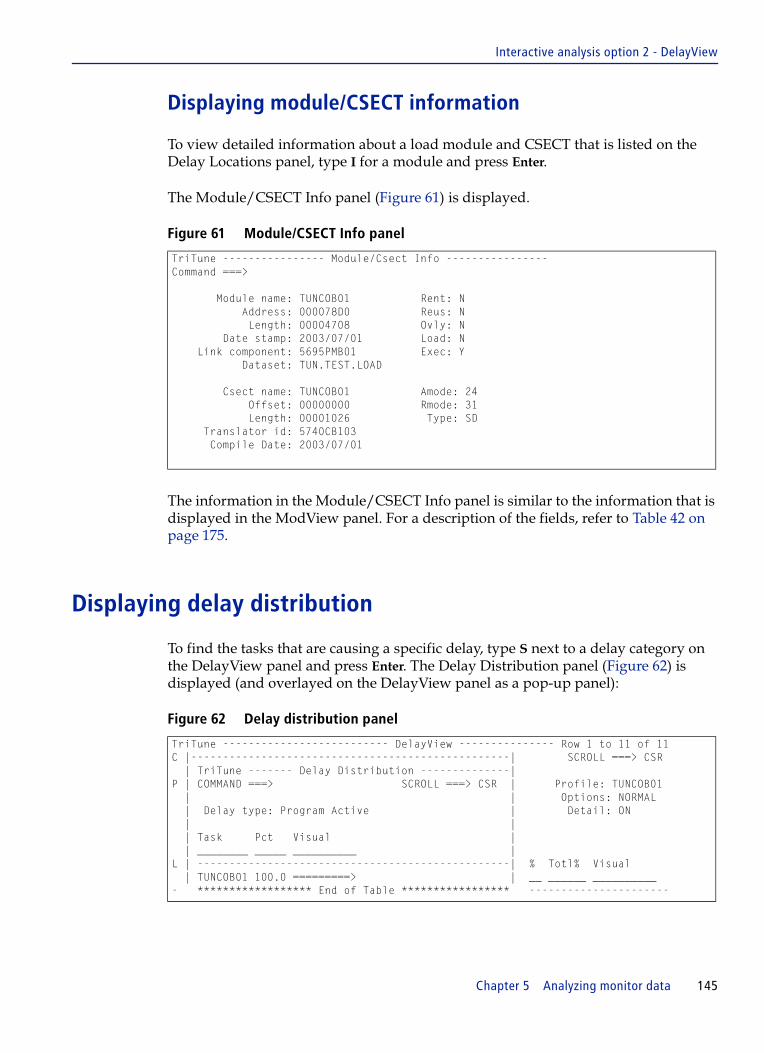
Interactive analysis option 2 - DelayView
Displaying module/CSECT information
To view detailed information about a load module and CSECT that is listed on the Delay Locations panel, type I for a module and press Enter.
The Module/CSECT Info panel (Figure 61) is displayed.
Figure 61 Module/CSECT Info panel
The information in the Module/CSECT Info panel is similar to the information that is displayed in the ModView panel. For a description of the fields, refer to Table 42 on page 175.
Displaying delay distribution
To find the tasks that are causing a specific delay, type S next to a delay category on the DelayView panel and press Enter. The Delay Distribution panel (Figure 62) is displayed (and overlayed on the DelayView panel as a pop-up panel):
Figure 62 Delay distribution panel
TriTune ---------------- Module/Csect Info ----------------Command ===> Module name: TUNCOB01 Rent: N Address: 000078D0 Reus: N Length: 00004708 Ovly: N Date stamp: 2003/07/01 Load: N Link component: 5695PMB01 Exec: Y Dataset: TUN.TEST.LOAD Csect name: TUNCOB01 Amode: 24 Offset: 00000000 Rmode: 31 Length: 00001026 Type: SD Translator id: 5740CB103 Compile Date: 2003/07/01
TriTune -------------------------- DelayView --------------- Row 1 to 11 of 11C |--------------------------------------------------| SCROLL ===> CSR | TriTune ------- Delay Distribution --------------| P | COMMAND ===> SCROLL ===> CSR | Profile: TUNCOB01 | | Options: NORMAL | Delay type: Program Active | Detail: ON | | | Task Pct Visual | | ________ _____ __________ | L | -------------------------------------------------| % Totl% Visual | TUNCOB01 100.0 =========> | __ ______ __________ - ****************** End of Table ***************** ----------------------
Chapter 5 Analyzing monitor data 145

Interactive analysis option 3 - CodeView
The Delay Distribution panel displays the distribution of samples that were attributed to a specific task during the monitored period. The percentage of the number of samples that relate to each task is displayed.
Interactive analysis option 3 - CodeViewCodeView displays the execution and wait time of each module that is used by the program. You can display this information in greater detail. You can define Pseudo Groups specific to your environment to summarize the information for multiple modules. This summarization enables you to identify time-consuming areas of code and to associate subroutines within a program and program modules within an application framework.
The CodeView panel (Figure 63) displays information from the perspective of the monitored program.
Figure 63 CodeView panel showing CSECTs with activity
NOTE For IMS or CICS, the display shows the distribution of samples for the specific transactions run by the transaction manager and not for the tasks in the address space.
TriTune ------------------------- CodeView ------------------------ Row 1 to 13 of 14COMMAND ===> SCROLL ===> CSR
Primary commands: MOde Pseudo/Module/Csect/4GL, Profile: TUNIVP1 PSEudo, REGister, ADDHelp Options: NORMAL Mode: CSECTLine commands: A - Associate C - Callerid D - Delays N - Long Name I - Info L - Listing S - Distribution H - Histogram NH - Normalized Histogram OverLC Module Csect Description L C Actv% Wait% Totl% Visual Lap% ________ ________ ___________________ _ _ _____ _____ _____ __________ _____-------------------------------------------------------------------------------__ TUNCOB01 ILBOCMM Cobol B 41.64 32.58 74.21 =========> 0.00__ TUNCOB01 ILBOINS Cobol B 0.48 9.96 10.45 0.00__ TUNCOB01 ILBOBUG Cobol B 0.24 4.20 4.44 0.00__ TUNCOB01 ILBOCVB Cobol B 0.18 1.24 1.42 0.00__ TUNCOB01 ILBODSP Cobol B 0.18 3.65 3.83 0.00__ TUNCOB01 ILBOCHN Cobol B 0.12 2.63 2.75 0.00
146 TriTune User Guide

Interactive analysis option 3 - CodeView
Table 30 describes the primary and line commands that are available for CodeView.
Table 30 CodeView commands
Command Description
MOde specifies the way module/CSECT information is displayed
Type one of the following commands and press Enter:
MODE PSE - to display a summarization of module activity by pseudo group. The CSECT field will not be displayed.
MODE MOD - to display the activity of each module detected by TriTune during the monitored period. The CSECT field will not be displayed.
MODE CSE - to display the activity of each CSECT detected by TriTune during the monitored period. This setting is the default.
MODE 4GL - to display the activity of Adabas, Natural, and CA-Datacom routines. Refer to Chapter 17, “Using TriTune with other databases” for more information.
PSEudo displays the Pseudo Group Definitions panel, where you can group Modules into functional groups
Refer to “Defining pseudo groups” on page 202.
REGister displays the Program Listing Registration panel, where you can register a program with TriTune
ADDHelp invokes the content-sensitive Help application to update or create a help entry for the selected content
A Associate - accesses the CSECT Associations application
I Info - retrieves information such as size, location, and link date for the selected load module
H Histogram - creates an address execution map of the program
Shows where the application was executing or waiting for data or service.
C Callerid - identifies the callers of this module/CSECT by name and offset
L Listing - displays the program listing
Valid only if the listing is registered with TriTune.
NH Normalized Histogram - creates an address execution map of the program that shows where the application was executing or waiting for data or service
This command is the same as the H line command except the percentages shown are normalized for the selected CSECT.
D Delays - provides detailed location information about delays within this delay type
S Distribution - shows the proportion of time a specific module or module/CSECT that are executed under a task or transaction
Chapter 5 Analyzing monitor data 147

Interactive analysis option 3 - CodeView
Table 31 describes the fields that are displayed on the CodeView panel.
Table 31 CodeView fields
Field name Value
Profile name of the profile that you specified when you created the monitor definition
Options type of analysis in effect: NORMAL, ALL, ACTIVE, or WAIT
An asterisk (*) following the value indicates that tasks or transactions have been selected for analysis. Place the cursor on the Options field value and press Enter to display a pop-up panel listing the selected tasks/transactions.
Mode current display mode: PSUEDO, MODULE, CSECT, or 4GL
Group pseudo group name defined for the module
Refer to “Defining pseudo groups” on page 202
Module module name
CSECT Control Section within the module
CSECT Description
description of CSECTs, if available
Scroll right to display the extended description.
L if the program was loaded above the 16MB line in extended virtual memory, this field contains the “greater than” symbol (>)
If the program was loaded below the 16MB line, this field contains the symbol <. If TriTune cannot detect where the program was loaded, this field is blank.
C if Callerid information is available, this field contains a Y; otherwise, this field is blank
Actv% percentage of the monitored period when a CPU was in use
TriTune calculates this value as the ratio of samples in which it detected CPU activity to the total number of samples.
Visual graphical representation of the Totl% field
Overlap% percentage of the monitored period when both the CPU was active and file access was occurring
Scroll right to display this information.
Wait% percentage of the monitored period when the CSECT was not using CPU
TriTune calculates this value as the ratio of samples in which it detected no activity to the total number of samples. This field is not displayed for Analyze Normal mode.
Totl% summation of the Actv% and Wait% fields
148 TriTune User Guide

Interactive analysis option 3 - CodeView
Displaying CSECT activity locations
The Histogram panel shows the activity that is associated with a CSECT. A CSECT is divided into segments of a specified size in bytes, and the activity detected in each segment is displayed. To view activity locations:
1. Use either the Histogram or the Normalized Histogram line command.
■ If you use the H line command, the values displayed in Histogram add up to the value of the selected CSECT (from the Totl% field).
■ If you use the NH line command, the values displayed in Histogram add up to 100 percent.
2. Press Enter.
The Histogram panel (Figure 64) is displayed:
Figure 64 Histogram panel showing TUNCOB01 CSECT (group size 32 bytes)
TriTune -------------------------- Histogram --------------- Row 1 to 13 of 15 COMMAND ===> SCROLL ===> CSR Group ===> 32 (Group size in bytes or STMT) Profile: TUNIVP1 Normalized: NO Primary commands: REGister, ADDHelp Module name: TUNCOB01 Line commands: D - Delays L - Listing LC Csect Offset Length Actv% Wait% Totl% Visual ________ ________ ______ _____ _____ _____ __________ -------------------------------------------------------------------------------__ TUNCOB01 00000000 1696 0.00 0.00 0.00 __ 000006A0 32 0.08 0.00 0.08 __ 000006C0 64 0.00 0.00 0.00 __ 00000700 32 0.15 0.23 0.38 __ 00000720 128 0.00 0.00 0.00 __ 000007A0 32 0.15 0.00 0.15 __ 000007C0 64 0.00 0.00 0.00 __ 00000800 32 2.86 1.58 4.44 => __ 00000820 32 10.08 3.61 13.68 =====> __ 00000840 32 7.14 14.51 21.65 =========>
Chapter 5 Analyzing monitor data 149

Interactive analysis option 3 - CodeView
Specifying histogram group size
The group size defines the resolution of the histogram. The initial size is set by using the Instruction group field of the Profile Parameters panel (see the TriTune Installation and Customization Guide). The default value is 32 bytes.
1. To change the value of the group size, type over the existing value and press Enter. The minimum size accepted is 2 bytes.
Specify 2 in the GROUP field to analyze execution at the lowest possible level.
2. If the source code for the program is registered with TriTune, specify STMT in the Group field to display the verb that is associated with the statement, as shown in Figure 65.
Figure 65 Histogram panel showing TUNCOB01 CSECT (group size STMT)
TriTune -------------------------- Histogram --------------- Row 1 to 11 of 11 COMMAND ===> SCROLL ===> CSR Group ===> STMT (Group size in bytes or STMT) Profile: TUNIVP1 Normalized: NO Primary commands: REGister, ADDHelp Module name: TUNCOB01 Line commands: D - Delays L - Listing LC Csect Stmt Verb Actv% Wait% Totl% Visual ________ ______ ____________ _____ _____ _____ __________ ------------------------------------------------------------------------------- __ TUNCOB01 100 PERFORM 0.08 0.00 0.08 __ 102 PERFORM 0.15 0.23 0.38 __ 131 MOVE 0.15 0.00 0.15 __ 134 GO 0.15 0.00 0.15 __ 135 GO 0.00 0.08 0.08 __ 142 ADD 20.38 19.70 40.08 =========> __ 143 ADD 0.30 0.45 0.75 __ 144 IF 0.15 0.00 0.15 __ 145 MOVE 0.08 0.00 0.08 __ 152 MOVE 1.20 0.38 1.58 __ 153 INSPECT 0.15 0.00 0.15 ********************************* End of Table ********************************
150 TriTune User Guide

Interactive analysis option 3 - CodeView
Displaying the program listing
If the program you are analyzing has been registered with TriTune, you can display the program listing at the module/CSECT. To view the program listing, type L and press Enter. The program listing (as shown in Figure 66) is displayed in ISPF Browse mode.
NOTE The program must be registered with TriTune to view the listings. Refer to Figure 61 on page 145 for more information.
Figure 66 TUNCOB01 listing
000155 011600*--------------------------------------------------------000156 011700* INSPECT AGAIN 000157 011800*--------------------------------------------------------000158 011900 000159 011910 INSPECT1-100. 000160 012000 MOVE "EVEN MORE DATA FOR THE INSPECT TO DO" TO DA000161 012100 INSPECT DATA-CONST2 TALLYING COUNT-03 FOR CHARACTERS000162 012200 AFTER INITIAL "E" REPLACING ALL "O" BY "Z". 000163 014910 000164 015100 STOP-100. 000165 015200 CLOSE BIGBLOCK. 000166 015300 CLOSE UNBLOCK. 000167 015400 STOP RUN.
Chapter 5 Analyzing monitor data 151

Interactive analysis option 3 - CodeView
Displaying delay location information
From the CodeView panel, you can link to the DelayView panel to display the locations and categories for a module/CSECT. Type D next to a module and press Enter. The DelayView panel (Figure 67) is displayed.
Figure 67 DelayView panel (TUNCOB01)
For complete information about using DelayView, refer to “Interactive analysis option 2 - DelayView” on page 136.
TriTune -------------------------- DelayView --------------- Row 1 to 10 of 10 COMMAND ===> SCROLL ===> CSR Primary commands: DETail on/off Module: * Profile: TUNIVP1 ADDHelp Csect: * Options: NORMAL Offset: * Detail: ON Line commands: A - Address (AutoNav enabled) S - Distribution LC Major Category Minor Category Actv% Wait% Totl% Visual ____________________ ____________________ ______ ______ ______ __________ -------------------------------------------------------------------------------__ Other Delays Waiting for CPU 0.00 56.31 56.31 =========> __ Program Active Program Active 24.18 0.00 24.18 ====> __ System Active Getmain SVC 12.47 0.00 12.47 ==> __ System Active Regmain SVC 6.28 0.00 6.28 => __ File Mgmt Delay Eov SVC 0.00 0.33 0.33 __ PC routine delay PC Call 0.09 0.06 0.15 __ Data Delay IO Queued 0.00 0.12 0.12 __ File Mgmt Delay Close SVC 0.00 0.09 0.09 __ DASD Mgmt Delay Obtain SVC 0.03 0.00 0.03 __ System Active Protect SVC 0.00 0.03 0.03 ********************************* End of Table ********************************
152 TriTune User Guide

Interactive analysis option 3 - CodeView
Displaying code distribution
To display the Code Distribution panel (Figure 68), use the S (Distribution) line command for a specific module or CSECT. This panel displays the selected module and CSECT name, along with all associated tasks or transactions. TriTune attributes each sample to one of these tasks or transactions and displays the percentage of samples that are associated with each.
Figure 68 Code Distribution panel
Displaying Callerid
From CodeView, you can use Callerid to determine which programs called various subroutines that are causing delays. Callerid information is available if a Y appears in the C column on the CodeView panel.
Callerid is also available from the Delay Locations panel. Refer to “Displaying callerid” on page 143 for a complete description.
TriTune -------- Code Distribution --------------COMMAND ===> SCROLL ===> CSR Module: DB2SMPGM Csect: DB2SAMP Trancode Pct Visual ________ _____ __________ -------------------------------------------------DTED 100.0 =========>
NOTE For IMS or CICS, the display shows the distribution of samples for the specific transactions run by the transaction manager, not for the tasks in the address space.
Chapter 5 Analyzing monitor data 153

Interactive analysis option 4 - TimeView
Interactive analysis option 4 - TimeViewTimeView displays program activity in time sequence. Each row of information on the TimeView panel (Figure 69) represents a single sample taken during the monitored period. This format helps you determine a program’s execution path and looping logic. This format also gives a good indication of which code sections executed and when they executed during the monitored period.
Figure 69 TimeView panel
Table 32 describes the primary and line commands available for TimeView.
TriTune -------------------------- TimeView -------------- Row 1 to 13 of 2488COMMAND ===> SCROLL ===> CSR Primary commands: ADDHelp Profile: TUNCOB01 Options: NORMAL Line commands: D - Details LC Sequence Module CSECT Offset Det Calling Calling Caller Task Id Number Module CSECT Offset ________ ________ ________ ________ ___ ________ ________ ________ ________>------------------------------------------------------------------------------__ 1 TUNCOB01 ILBOCMM 0000006E TUNCOB01__ 2 TUNCOB01 ILBOCHN 000000A6 TUNCOB01__ 3 TUNCOB01 ILBOCVB 0000000E TUNCOB01__ 4 TUNCOB01 ILBOCMM 0000006E TUNCOB01__ 5 TUNCOB01 ILBOCMM 0000006E TUNCOB01__ 6 TUNCOB01 ILBOCVB 000000CC TUNCOB01__ 7 TUNCOB01 ILBOINS 000003F0 TUNCOB01__ 8 TUNCOB01 ILBOCMM 0000006E TUNCOB01__ 9 TUNCOB01 ILBOCMM 0000006E TUNCOB01__ 10 TUNCOB01 ILBOCMM 0000006E TUNCOB01
Table 32 TimeView commands
Command Description
ADDHelp invokes the content-sensitive Help application to update or create a help entry for the selected content
D Details - provides detail data for the sample
Detail data is available if the Det column displays YES.
154 TriTune User Guide

Interactive analysis option 4 - TimeView
Table 33 explains the data that is displayed on the TimeView panel.
Displaying detail data
If the DET field contains YES, you can display additional detail information about the data set or resource. Use the Details line command to display the Delayed Resources panel, as described in “Displaying delayed resources” on page 140.
Table 33 TimeView fields
Field name Value
Profile name of the profile that you specified when you created the monitor definition
Options type of analysis in effect: NORMAL, ALL, ACTIVE, or WAIT
An asterisk (*) following the value indicates that tasks or transactions have been selected for analysis. Place the cursor on the Options field value and press Enter to display a pop-up panel listing the selected tasks/transactions.
Sequence Number sample sequence numbers, listed consecutively, from one to the number of samples that you requested
Module name of the load module related to the collected sample
CSECT name of the control section that was in control for the sample
Offset offset where the interrupt occurred for the sample
The offset begins from the start of the control section shown in the CSECT field. Offset is displayed in hexadecimal notation.
Det YES in the Det column indicates that additional information is available by using the Details line command to isolate the cause of delays
Calling Module name of the module that issued a call for the module in control during the sample
Calling CSECT name of the control section that called the routine that was in control during the sample
Caller Offset offset from the start of the control section shown in the Calling CSECT field where the call to the current module was made
Caller Offset is displayed in hexadecimal notation.
Task ID name of the program that is associated with the task in control when the sample was taken
Scroll right to display the following field:
Transact Code transaction code from either an IMS/TM or a CICS environment
Chapter 5 Analyzing monitor data 155

Interactive analysis option 5 - DataView
Interactive analysis option 5 - DataView DataView displays data sets, databases (IMS, Adabas, and CA-Datacom), and DB2 statements that caused activity during the monitored period. The data on the DataView panel (Figure 70) is sorted in descending order by activity. You can select a data set, database, or DB2 statement to display greater detail.
Figure 70 DataView panel
Displaying linklist information
To display information about LINKLIST and LPALIST data sets, use the primary command LINKlist ON. To hide the information after it is displayed, use the primary command LINKlist OFF.
Displaying data set information
To display relevant information about a data set, use the Select line command to display the Data Set Details panel. If the data set is a VSAM data set, you might see an enhanced Data Set Details panel.
Table 34 describes the fields in the DataView panel.
TriTune -------------------------- DataView ---------------- Row 1 to 10 of 10COMMAND ===> SCROLL ===> CSR Primary commands: LINklist on/off Profile: TUNCOB01 Options: NORMAL Line commands: S - Select Linklist: OFF LC DD name Dataset name Delay% Visual ________ ____________________________________________ ______ __________ >------------------------------------------------------------------------------__ UNBLOCK SYS03182.T133728.RA000.TUNCOB01.DOUT3.H03 10.09 =========> __ BIGBLOCK SYS03182.T133728.RA000.TUNCOB01.DOUT1.H03 1.53 > __ STEPLIB CEE.SCEERUN 0.00
NOTE Data set statistics might not be available for very short measurements, or for data sets that are allocated and unallocated for brief intervals (less than two seconds).
156 TriTune User Guide
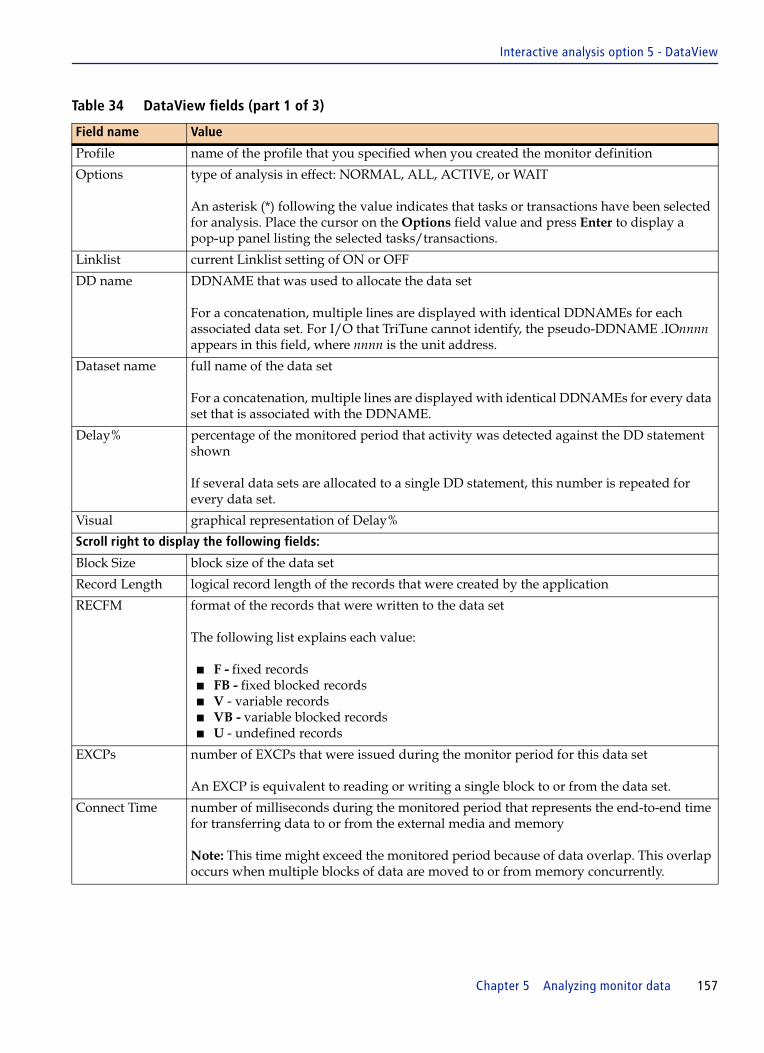
Interactive analysis option 5 - DataView
Table 34 DataView fields (part 1 of 3)
Field name Value
Profile name of the profile that you specified when you created the monitor definition
Options type of analysis in effect: NORMAL, ALL, ACTIVE, or WAIT
An asterisk (*) following the value indicates that tasks or transactions have been selected for analysis. Place the cursor on the Options field value and press Enter to display a pop-up panel listing the selected tasks/transactions.
Linklist current Linklist setting of ON or OFF
DD name DDNAME that was used to allocate the data set
For a concatenation, multiple lines are displayed with identical DDNAMEs for each associated data set. For I/O that TriTune cannot identify, the pseudo-DDNAME .IOnnnn appears in this field, where nnnn is the unit address.
Dataset name full name of the data set
For a concatenation, multiple lines are displayed with identical DDNAMEs for every data set that is associated with the DDNAME.
Delay% percentage of the monitored period that activity was detected against the DD statement shown
If several data sets are allocated to a single DD statement, this number is repeated for every data set.
Visual graphical representation of Delay%
Scroll right to display the following fields:
Block Size block size of the data set
Record Length logical record length of the records that were created by the application
RECFM format of the records that were written to the data set
The following list explains each value:
■ F - fixed records■ FB - fixed blocked records■ V - variable records■ VB - variable blocked records■ U - undefined records
EXCPs number of EXCPs that were issued during the monitor period for this data set
An EXCP is equivalent to reading or writing a single block to or from the data set.
Connect Time number of milliseconds during the monitored period that represents the end-to-end time for transferring data to or from the external media and memory
Note: This time might exceed the monitored period because of data overlap. This overlap occurs when multiple blocks of data are moved to or from memory concurrently.
Chapter 5 Analyzing monitor data 157

Interactive analysis option 5 - DataView
Open Intent if the DDNAME is for a data set, this field displays the intention of the program in opening the data set
If the DDNAME is for a database, this field displays the type of database. For data sets, this field contains one of the following values: DIRECT, GET MOVE, GET LOCATE, PUT MOVE, PUT LOCATE, READ, WRITE, MEMBER READ, MEMBER WRITE, PROGRAM LOADING, UNDETERMINED. For databases, this field contains one of the following values: ADA, DB2, DCM, IMS
DSORG organization of the data set
The following list explains the possible values:
■ DA - direct access■ PS - physical sequential■ IS - indexed sequential■ VSAM - virtual sequential access method■ PO - partitioned organization
Access Method access method that was used to read from or write to the data set
Possible values are
■ BPAM - basic partitioned access method■ BTAM - basic telecommunications access method■ EXCP - execute channel program■ GRPH - graphics access method■ DA - direct access method■ ISAM - indexed sequential access method■ SAM - sequential access method■ SUBS - JES subsystem access■ TAP - TCAM application access method■ TCAM - telecommunications access method■ VSAM - Virtual Sequential Access Method■ VTAM - Virtual Telecommunications Access Method
Buffer Size buffer size for the data set
This size is generally the same as the Block Size.
Buffer Number number of buffers that are allocated for the data set
Number Extents number of physical extents that are allocated to the data set
For non-VSAM data sets, this number might be in the range of 1 to 16. VSAM allows up to 128 extents for a data set.
Table 34 DataView fields (part 2 of 3)
Field name Value
158 TriTune User Guide

Interactive analysis option 5 - DataView
Alloc Unit allocation unit for the data set
This field contains one of the following values:
■ BLK - Space is allocated in blocks.■ CYL - Space is allocated in cylinders.■ TRK - Space is allocated in tracks.■ DSN - The DDNAME indicates a database rather than a data set.■ (blank) - TriTune did not detect the unit of allocation.
PRI Size Primary Unit - the initial allocation of cylinders, tracks, or blocks for a data set on direct access
Depending on the allocation unit, this field contains the following value:
■ For CYL, the number of cylinders allocated.■ For TRK, the number of tracks allocated.■ For BLK, the number of blocks allocated.
SEC Size Secondary Unit - The secondary allocation of cylinders, tracks, or blocks for a data set on direct access
Depending on the allocation unit, this field contains the following value:
■ For CYL, the number of cylinders allocated.■ For TRK, the number of tracks allocated.■ For BLK, the number of blocks allocated.
Seq Nr. TriTune sequence number of the record
This sequence number is incremented by TriTune for each scheduling of the sampler into the target address space.
UCB Addr Unit Control Block number for this data set
The UCB is the logical device number, expressed in hexadecimal, on which this data set resides.
VOLSER(s) first six volume serial numbers on which this data set resides
The volume serial numbers are not separated by commas.
Table 34 DataView fields (part 3 of 3)
Field name Value
Chapter 5 Analyzing monitor data 159

Interactive analysis option 5 - DataView
Displaying detail and performance information
The following describes detail and performance data returned for non-VSAM and VSAM data sets.
Figure 71 shows an example of the Data Set Details panel containing data for a non-VSAM data set.
Figure 71 Data Set Details panel: non-VSAM data set
For field related information for the Allocation and Format sections, refer to Table 34 on page 157. Table 35 contains field descriptions for the Data Set Performance fields section for non-VSAM data set.
TriTune --------------------- Data Set Details ------------ Row 1 to 19 of 64 COMMAND ===> SCROLL ===> CSR DDNAME: MDYU3000 Profile: DB2SAMP Access Method: VSAM Cluster: TRITUNE.TUNCIC61.MDYUDATA.CC3000 Opened for: DIRECT Data: TRITUNE.TUNCIC61.MDYUDATA.CC3000.DATA Share Options: 2 3 Index: TRITUNE.TUNCIC61.MDYUDATA.CC3000.INDEX Organization: KSDS Data Component Information for: TRITUNE.TUNCIC61.MDYUDATA.CC3000.DATA ------ SMS ------- ------ Allocation ------- ----------- Format ---------------DATACLAS: **NONE** Unit: CYL Rec Len: 43 CI Size: 4096STORCLAS: **NONE** Primary: 5 # CIs per CA: 180 Strings: 0MGMTCLAS: **NONE** Secondary: 2 CA Freespace: 0 Buffers: 2 Volume Count: 1 CI Freespace: 0 Total Extent Count: 1 Stripes: 0 ---- VSAM Statistics ----------------------------------------------------------Number of records: 0 Records Read: 0 Records Updated: 0 CA Splits: 0 Records Added: 0 Records Deleted: 0 CI Splits: 0
Table 35 Data Set Details panel fields: non-VSAM data set (part 1 of 2)
Field name Description
SMS Fields
DATACLAS for Systems Managed data sets, this class is a named collection of data set and space attributes
STORCLAS for Systems Managed data sets, this class is a named collection of performance and device availability attributes
MGMTCLAS for Systems Managed data sets, this class is a named collection of migration, backup, and expiration attributes
Data Set Performance Fields
Avg Resp Time average data set response time during the monitoring interval
Active Rate average number of I/Os per second being performed against the file during the monitoring interval
160 TriTune User Guide

Interactive analysis option 5 - DataView
Total EXCPs total number of EXCPs (I/Os) performed against the file during the monitoring period
Total Conn Time total data set connect time during the monitoring interval
This value is expressed in 128 milliseconds units and includes data transfer time, connect search time, protocol, and reconnect time.
Avg IOSQ Time average IOS Queue Time experienced by the data set during the monitoring interval expressed in ms units. IOSQ TIME is computed by using the formula:
(QC / S)Average IOS = ----------queue time R
where
■ QC is the total number of requests found on the IOS queue■ S is the total number of samples taken■ R is the active rate
Avg Pend Time average number of milliseconds that an I/O request remains queued to the channel
This value reflects the amount of time that elapses between when the SSCH (Start SubChannel) function is accepted by the subchannel and when the first command that is associated with the SSCH function is accepted at the device.
Pending time accrues when the request is waiting for an available channel path or control unit, as well as when shared DASD contention occurs.
Avg Disc Time average number of milliseconds that the device had an active I/O request but was disconnected from the channel path
Disconnect time includes
■ time waiting to be reconnected after a SET SECTOR, this time is called rotational position sensing (RPS) delay
■ head Movement time (SEEK TIME) between cylinders
■ latency or search time
Avg Conn Time average number of milliseconds the device was connected to a channel path and actively transferring data between the device and central storage
This value is calculated as follows:
Average Connect time = Total connect time / Measurement Even count
Table 35 Data Set Details panel fields: non-VSAM data set (part 2 of 2)
Field name Description
Chapter 5 Analyzing monitor data 161

Interactive analysis option 5 - DataView
Figure 72 shows an example of the Data Set Details panel containing data for a VSAM data set.
Figure 72 Data Set Details panel: VSAM data set
Table 36 contains field descriptions for the Data Set Performance fields section for VSAM data set
TriTune --------------------- Data Set Details ------------ Row 1 to 19 of 35 COMMAND ===> SCROLL ===> CSR DDNAME: NSUSSN3 Profile: TUNSAMP Access Method: VSAM Cluster: TAC.H159NPS.SESS.MGR.SESSN3.CLUS Opened for: DIRECT Data: TAC.H159NPS.SESS.MGR.SESSN3.DATA Share Options: 2 3 Index: N/A Organization: ESDS Data Component Information for: TAC.H159NPS.SESS.MGR.SESSN3.DATA ------ SMS ------- ------ Allocation ------- ----------- Format ---------------DATACLAS: STANDARD Unit: CYL Rec Len: 32752 CI Size: 32768STORCLAS: FAST Primary: 800 # CIs per CA: 22 Strings: 0MGMTCLAS: MA@NODEL Secondary: 20 CA Freespace: 0 Buffers: 16 Volume Count: 1 CI Freespace: 0 Total Extent Count: 29 Stripes: 0 ---- VSAM Statistics ----------------------------------------------------------Number of records: 28776 Records Read: 1895 Records Updated: 835 CA Splits: 0 Records Added: 0 Records Deleted: 0 CI Splits: 0 ---- Data Set Performance --------------------- Avg Resp Time: 4.39 Avg IOSQ Time: 0.00 Active Rate: 0.68 Avg Pend Time: 0.29 Total EXCPs: 2727 Avg Disc Time: 1.51 Total Conn Time: 7062.53 Avg Conn Time: 2.59
Table 36 Data set performance fields: VSAM data sets (part 1 of 4)
Field name Description
Access Method identifies the access method used to read from or write to the data set
Opened For intention of the program when performing I/Os for this data set
Valid values are
■ READ■ WRITE■ DIRECT
162 TriTune User Guide
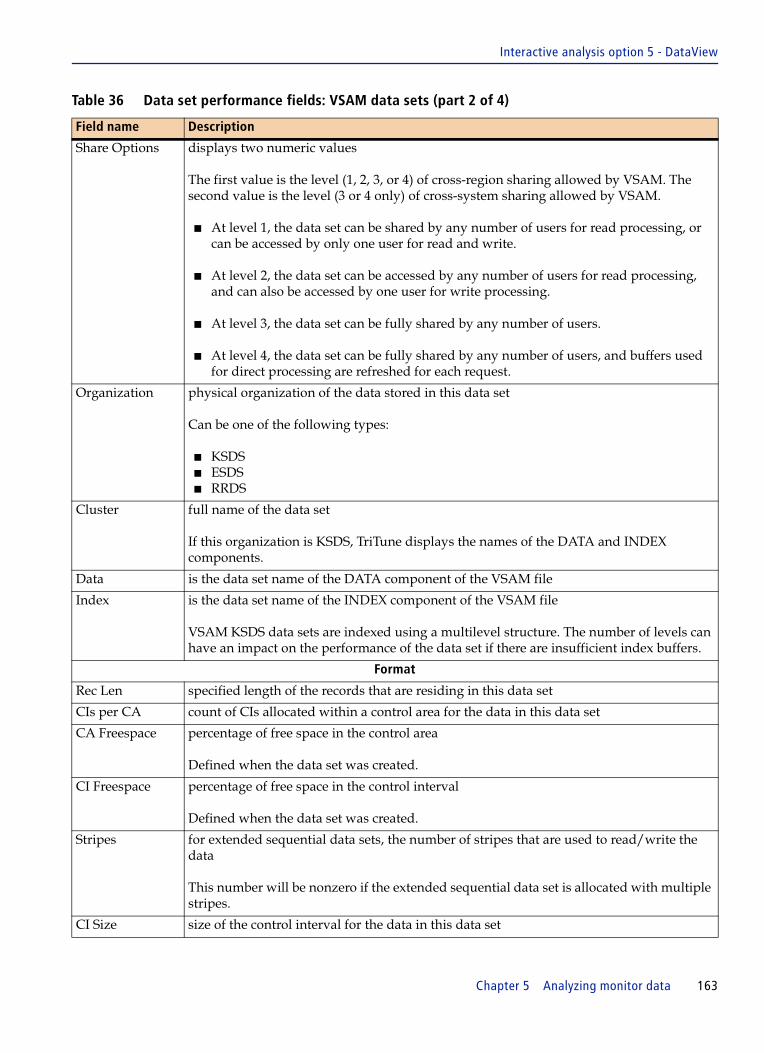
Interactive analysis option 5 - DataView
Share Options displays two numeric values
The first value is the level (1, 2, 3, or 4) of cross-region sharing allowed by VSAM. The second value is the level (3 or 4 only) of cross-system sharing allowed by VSAM.
■ At level 1, the data set can be shared by any number of users for read processing, or can be accessed by only one user for read and write.
■ At level 2, the data set can be accessed by any number of users for read processing, and can also be accessed by one user for write processing.
■ At level 3, the data set can be fully shared by any number of users.
■ At level 4, the data set can be fully shared by any number of users, and buffers used for direct processing are refreshed for each request.
Organization physical organization of the data stored in this data set
Can be one of the following types:
■ KSDS■ ESDS■ RRDS
Cluster full name of the data set
If this organization is KSDS, TriTune displays the names of the DATA and INDEX components.
Data is the data set name of the DATA component of the VSAM file
Index is the data set name of the INDEX component of the VSAM file
VSAM KSDS data sets are indexed using a multilevel structure. The number of levels can have an impact on the performance of the data set if there are insufficient index buffers.
Format
Rec Len specified length of the records that are residing in this data set
CIs per CA count of CIs allocated within a control area for the data in this data set
CA Freespace percentage of free space in the control area
Defined when the data set was created.
CI Freespace percentage of free space in the control interval
Defined when the data set was created.
Stripes for extended sequential data sets, the number of stripes that are used to read/write the data
This number will be nonzero if the extended sequential data set is allocated with multiple stripes.
CI Size size of the control interval for the data in this data set
Table 36 Data set performance fields: VSAM data sets (part 2 of 4)
Field name Description
Chapter 5 Analyzing monitor data 163
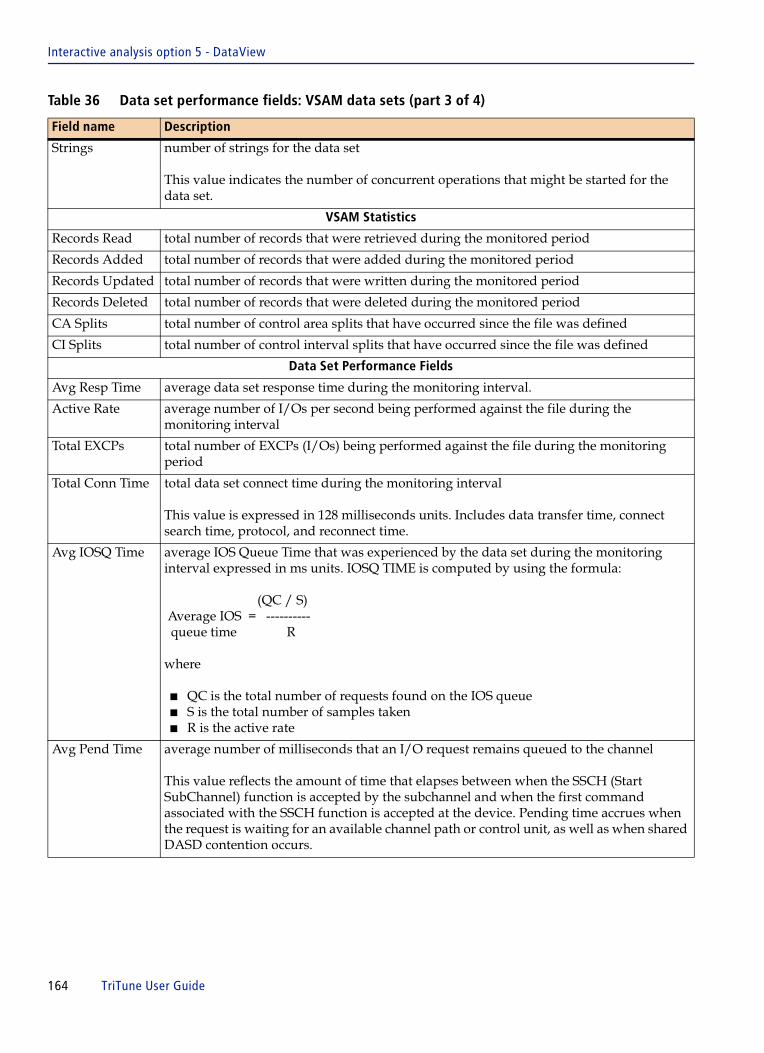
Interactive analysis option 5 - DataView
Strings number of strings for the data set
This value indicates the number of concurrent operations that might be started for the data set.
VSAM Statistics
Records Read total number of records that were retrieved during the monitored period
Records Added total number of records that were added during the monitored period
Records Updated total number of records that were written during the monitored period
Records Deleted total number of records that were deleted during the monitored period
CA Splits total number of control area splits that have occurred since the file was defined
CI Splits total number of control interval splits that have occurred since the file was defined
Data Set Performance Fields
Avg Resp Time average data set response time during the monitoring interval.
Active Rate average number of I/Os per second being performed against the file during the monitoring interval
Total EXCPs total number of EXCPs (I/Os) being performed against the file during the monitoring period
Total Conn Time total data set connect time during the monitoring interval
This value is expressed in 128 milliseconds units. Includes data transfer time, connect search time, protocol, and reconnect time.
Avg IOSQ Time average IOS Queue Time that was experienced by the data set during the monitoring interval expressed in ms units. IOSQ TIME is computed by using the formula:
(QC / S) Average IOS = ---------- queue time R
where
■ QC is the total number of requests found on the IOS queue■ S is the total number of samples taken■ R is the active rate
Avg Pend Time average number of milliseconds that an I/O request remains queued to the channel
This value reflects the amount of time that elapses between when the SSCH (Start SubChannel) function is accepted by the subchannel and when the first command associated with the SSCH function is accepted at the device. Pending time accrues when the request is waiting for an available channel path or control unit, as well as when shared DASD contention occurs.
Table 36 Data set performance fields: VSAM data sets (part 3 of 4)
Field name Description
164 TriTune User Guide
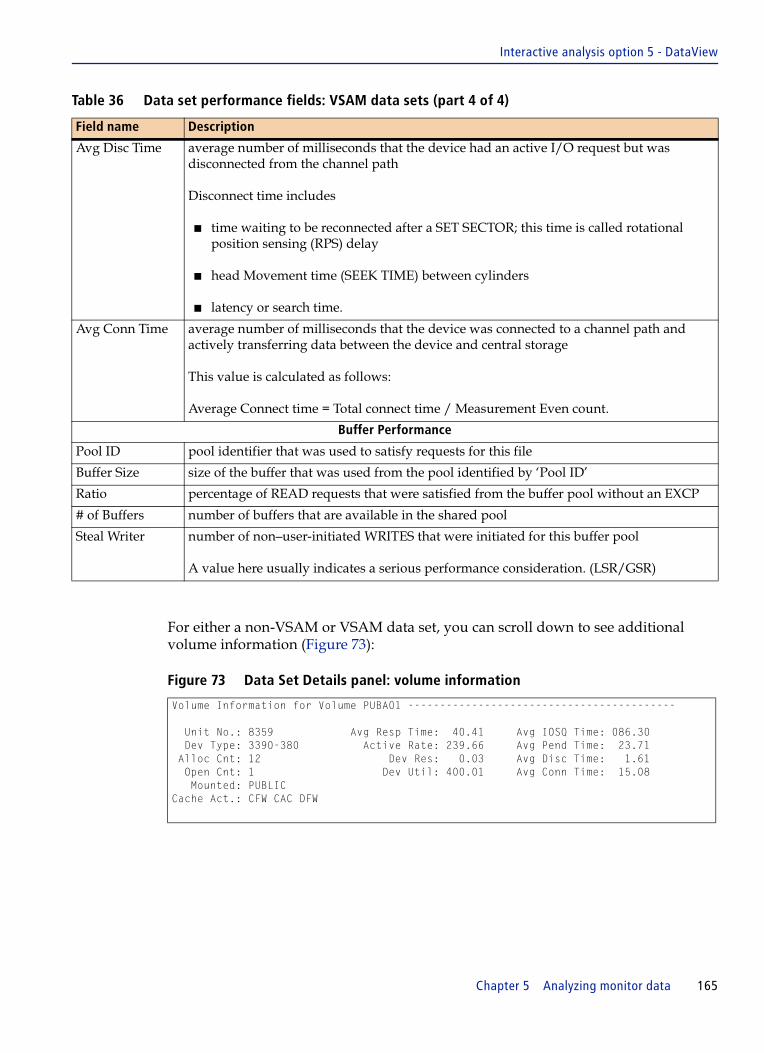
Interactive analysis option 5 - DataView
For either a non-VSAM or VSAM data set, you can scroll down to see additional volume information (Figure 73):
Figure 73 Data Set Details panel: volume information
Avg Disc Time average number of milliseconds that the device had an active I/O request but was disconnected from the channel path
Disconnect time includes
■ time waiting to be reconnected after a SET SECTOR; this time is called rotational position sensing (RPS) delay
■ head Movement time (SEEK TIME) between cylinders
■ latency or search time.
Avg Conn Time average number of milliseconds that the device was connected to a channel path and actively transferring data between the device and central storage
This value is calculated as follows:
Average Connect time = Total connect time / Measurement Even count.
Buffer Performance
Pool ID pool identifier that was used to satisfy requests for this file
Buffer Size size of the buffer that was used from the pool identified by ‘Pool ID’
Ratio percentage of READ requests that were satisfied from the buffer pool without an EXCP
# of Buffers number of buffers that are available in the shared pool
Steal Writer number of non–user-initiated WRITES that were initiated for this buffer pool
A value here usually indicates a serious performance consideration. (LSR/GSR)
Volume Information for Volume PUBA01 ------------------------------------------ Unit No.: 8359 Avg Resp Time: 40.41 Avg IOSQ Time: 086.30 Dev Type: 3390-380 Active Rate: 239.66 Avg Pend Time: 23.71 Alloc Cnt: 12 Dev Res: 0.03 Avg Disc Time: 1.61 Open Cnt: 1 Dev Util: 400.01 Avg Conn Time: 15.08 Mounted: PUBLIC Cache Act.: CFW CAC DFW
Table 36 Data set performance fields: VSAM data sets (part 4 of 4)
Field name Description
Chapter 5 Analyzing monitor data 165
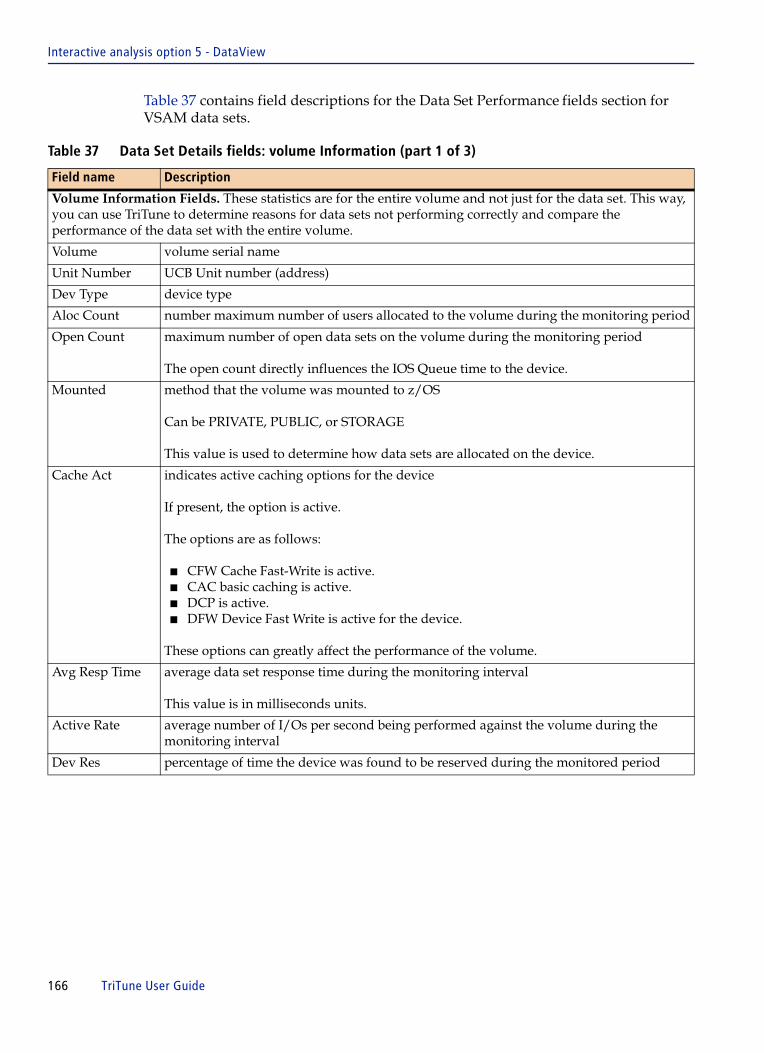
Interactive analysis option 5 - DataView
Table 37 contains field descriptions for the Data Set Performance fields section for VSAM data sets.
Table 37 Data Set Details fields: volume Information (part 1 of 3)
Field name Description
Volume Information Fields. These statistics are for the entire volume and not just for the data set. This way, you can use TriTune to determine reasons for data sets not performing correctly and compare the performance of the data set with the entire volume.
Volume volume serial name
Unit Number UCB Unit number (address)
Dev Type device type
Aloc Count number maximum number of users allocated to the volume during the monitoring period
Open Count maximum number of open data sets on the volume during the monitoring period
The open count directly influences the IOS Queue time to the device.
Mounted method that the volume was mounted to z/OS
Can be PRIVATE, PUBLIC, or STORAGE
This value is used to determine how data sets are allocated on the device.
Cache Act indicates active caching options for the device
If present, the option is active.
The options are as follows:
■ CFW Cache Fast-Write is active.■ CAC basic caching is active.■ DCP is active.■ DFW Device Fast Write is active for the device.
These options can greatly affect the performance of the volume.
Avg Resp Time average data set response time during the monitoring interval
This value is in milliseconds units.
Active Rate average number of I/Os per second being performed against the volume during the monitoring interval
Dev Res percentage of time the device was found to be reserved during the monitored period
166 TriTune User Guide

Interactive analysis option 5 - DataView
Dev Util percentage the device was in use during the monitoring period
This value includes both the time the device was performing I/O operations and the time that the device was reserved, but not necessarily active. The calculation is
Device Utilization Percentage = 100 * [(DCT +TDT / T) + (RS / S)]
where
■ DCT is the device connect time■ TDT is the device disconnect time■ T is the length of the monitoring session■ RS is the number of times the devices was reserved but not busy■ S is the total number of samples
Avg IOSQ Time average IOS Queue Time experienced by the data set during the monitoring interval expressed in ms units. IOSQ TIME is computed by using the formula:
(QC / S)Average IOS = ----------queue time R
where
■ QC is the total number of requests found on the IOS queue■ S is the total number of samples taken■ R is the active rate
Avg Pend Time average number of milliseconds that an I/O request remains queued to the channel
This value reflects the amount of time that elapses between when the SSCH (Start SubChannel) function is accepted by the subchannel and when the first command that was associated with the SSCH function is accepted at the device. Pending time accrues when the request is waiting for an available channel path or control unit, as well as when shared DASD contention occurs.
Table 37 Data Set Details fields: volume Information (part 2 of 3)
Field name Description
Chapter 5 Analyzing monitor data 167
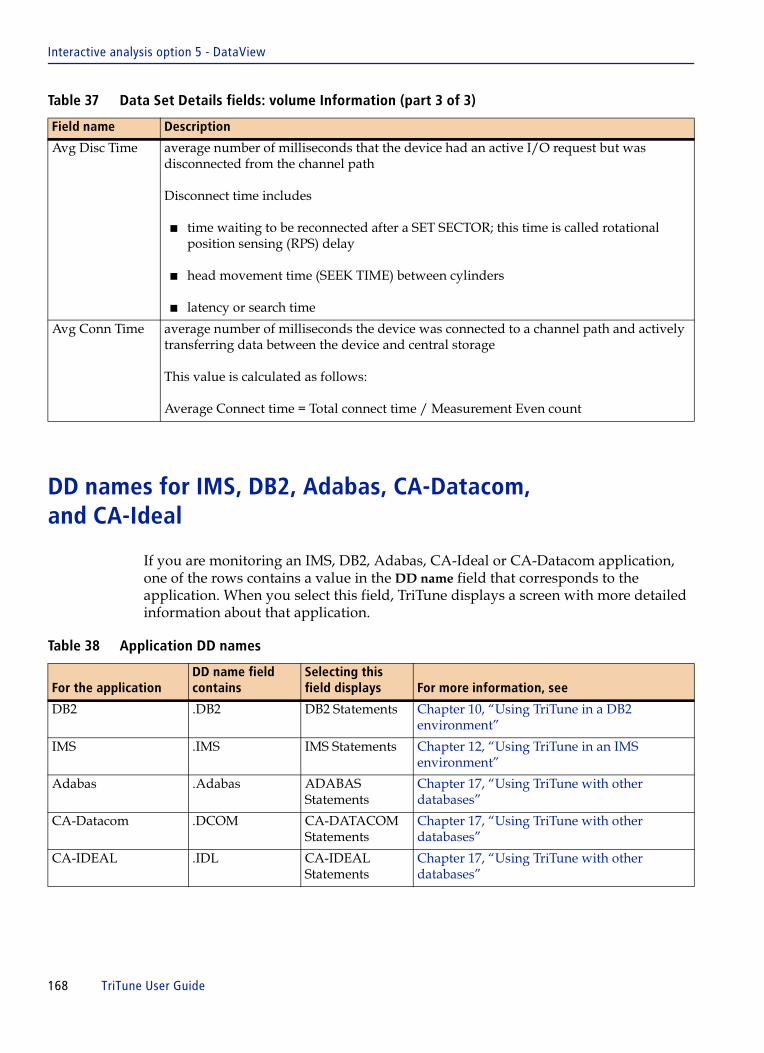
Interactive analysis option 5 - DataView
DD names for IMS, DB2, Adabas, CA-Datacom, and CA-Ideal
If you are monitoring an IMS, DB2, Adabas, CA-Ideal or CA-Datacom application, one of the rows contains a value in the DD name field that corresponds to the application. When you select this field, TriTune displays a screen with more detailed information about that application.
Avg Disc Time average number of milliseconds that the device had an active I/O request but was disconnected from the channel path
Disconnect time includes
■ time waiting to be reconnected after a SET SECTOR; this time is called rotational position sensing (RPS) delay
■ head movement time (SEEK TIME) between cylinders
■ latency or search time
Avg Conn Time average number of milliseconds the device was connected to a channel path and actively transferring data between the device and central storage
This value is calculated as follows:
Average Connect time = Total connect time / Measurement Even count
Table 38 Application DD names
For the applicationDD name field contains
Selecting this field displays For more information, see
DB2 .DB2 DB2 Statements Chapter 10, “Using TriTune in a DB2 environment”
IMS .IMS IMS Statements Chapter 12, “Using TriTune in an IMS environment”
Adabas .Adabas ADABAS Statements
Chapter 17, “Using TriTune with other databases”
CA-Datacom .DCOM CA-DATACOM Statements
Chapter 17, “Using TriTune with other databases”
CA-IDEAL .IDL CA-IDEAL Statements
Chapter 17, “Using TriTune with other databases”
Table 37 Data Set Details fields: volume Information (part 3 of 3)
Field name Description
168 TriTune User Guide

Interactive analysis option 6 - TranView
Interactive analysis option 6 - TranView TranView shows IMS or CICS activity in terms of individual transactions. It displays the percentage of time that TriTune detected activity for each transaction in the six major activity and delay categories. If you select a transaction, TriTune recomputes the values by using only samples from the selected transaction on all subsequent screens that you display. Using TranView enables you to focus on the performance of that transaction.
For information about using the TranView display with CICS, see “Using TranView for CICS” on page 328.
Figure 74 TranView panel
Table 39 describes the available commands for TranView.
TriTune ----------------------------- TranView ---------------------- Row 1 to 3 of 3COMMAND ===> SCROLL ===> CSR
Primary commands: SELect, RECall, ADDHelp Profile: TUNCIC62 Options: NORMAL Line commands: T - Tag C - Code Details U - Untag D - Delay Details (Auto-Navigation) N - Data Details
LC TRAN T D #Trans Avg RESP Tot CPU Avg CPU Actv% Data% Other% Total% Visual ________ _ _ ______ ________ ________ ________ ______ ______ ______ ______ _______-------------------------------------------------------------------------------------__ JTU4 Y 3 42.46321 48.33688 16.11229 98.55 1.01 0.00 99.56 ======>__ CFQS 0 0.00000 0.00000 0.00000 0.00 0.00 0.42 0.42__ CSTP 0 0.00000 0.00000 0.00000 0.02 0.00 0.00 0.02************************************* End of Table **********************************
Table 39 TranView commands (part 1 of 2)
Command Description
SELect selects only the tagged transactions for analysis
RECall reverses the effect of the SELect line command
This command recalls any excluded transactions.
ADDHelp invokes the content-sensitive Help application to update or create a help entry for the selected content
T (tag line command) selects up to five tasks for analysis
U (untag line command) clears a selected task
C (CodeView Detail line command) displays the CodeView Detail panel showing activity detected by TriTune
The CodeView Detail panel is described on page 171.
Chapter 5 Analyzing monitor data 169

Interactive analysis option 6 - TranView
Table 40 provides a description for each field in TranView.
D (DelayView Detail line command) displays the DelayView Detail panel showing the types of delays encountered by TriTune
The DelayView Detail panel is described on page 172.
N (DataView Detail line command) displays the DataView panel
Table 40 TranView fields (part 1 of 2)
Field name Description
Profile name of the profile that you specified when you created the monitor definition
Options type of analysis in effect: NORMAL, ALL, ACTIVE, or WAIT
An asterisk (*) following the value indicates that tasks or transactions have been selected for analysis. Place the cursor on the Options field value and press Enter to display a pop-up panel listing the selected tasks/transactions.
Tran name of a transaction that was detected by TriTune during the monitoring of an IMS or CICS region
If a transaction name cannot be identified, the value **n/a** is substituted.
T “X” indicates the transaction has been tagged for analysis
#Trans number of times the transaction completed processing during the monitored period
Avg RESP average time (in seconds) for this transaction during the monitored period
Tot CPU cumulative CPU seconds for this transaction during the monitored period
AVG CPU average CPU time required for this transaction during the monitored period
Actv% percentage of time during the monitored period that the CPU was actively processing the monitored transaction
Data% percentage of time during the monitored period that the transaction was delayed because of an I/O request
Other% percentage of time during the monitored period that was not attributable to any of the categories known to TriTune
Totl% summation of the categories of delay
Visual graphical representation of the total delay that was associated with the transaction
Table 39 TranView commands (part 2 of 2)
Command Description
170 TriTune User Guide

Interactive analysis option 6 - TranView
CodeView detail
Use the CodeView Detail (C) line command from the TranView panel to display the program activity that is associated with a specific transaction; see Figure 75.
Figure 75 CodeView Detail panel from TranView
This panel displays the modules and CSECTs that delayed a task which is identified in the Transaction field. The commands you can issue and field headings are identical to the CodeView panel (see page 146). All subsequent associated panels report information for the specified task.
Total SUs total amount of CPU time in service units used by this transaction
TriTune calculates this amount by using the following formula:
(Tot CPU * 16000000) / CPU Adjustment Rate
The CPU Adjustment Rate can be seen on the OverView report.
Average SUs average number of CPU Service Units required to process a transaction
TriTune calculates this amount by using the following formula:
(Avg CPU * 16000000) / CPU Adjustment Rate
The CPU Adjustment Rate can be seen on the OverView report.
TriTune ------------------- CodeView Detail ----------------- Row 1 to 8 of 16COMMAND ===> SCROLL ===> CSR Transaction: D8PT Profile: DB2SAMP Options: NORMAL Mode: CSECT Primary commands: MOde Pseudo/Module/Csect/4GL, PSEudo, REGister, ADDHelp Line commands: A - Associate C - Callerid D - Delays N - Long Name I - Info L - Listing S - Distribution H - Histogram NH - Normalized Histogram
LC Module Csect Description L C Actv% Wait% Totl% Visual ________ ________ _________________________ _ _ _____ _____ _____ __________>------------------------------------------------------------------------------__ DSNVSR DSNVSR ASM-SUSPEND/RESUME/CANCEL A Y 0.41 2.86 3.27 =========>__ DFHD2EX1 D2EX1 CICS-DB2 Task Related Use A Y 0.82 0.00 0.82 => __ DFHD2EX3 DFHD2EX3 CICS-DB2 subtask program A Y 0.82 0.00 0.82 => __ .NUCLEUS IXLRQLCK Cross-system extended ser B Y 0.41 0.00 0.41 >
Table 40 TranView fields (part 2 of 2)
Field name Description
Chapter 5 Analyzing monitor data 171

Interactive analysis option 6 - TranView
DelayView detail
Use the DelayView Detail (D) line command to display the delay categories that were detected by TriTune and associated with a specific task; see Figure 76.
Figure 76 DelayView Detail panel
This panel displays what caused a task to be delayed in its execution. The commands you can issue and field headings are identical to the DelayView panel (see page 136). All subsequent associated panels report information for the specified task.
NOTE The CodeView Detail panel reports both Active and Wait activity percentages for Analyze Normal mode, which accounts for all activity reported in TaskView.
TriTune ------------------ DelayView Detail ------------------ Row 1 to 5 of 5COMMAND ===> SCROLL ===> CSR Transaction: D8PT Profile: DB2SAMP Detail: ON Primary commands: DETail on/off, Module: * ADDHelp Csect: * Offset: * Line commands: A - Address LC Major category Minor category Actv% Wait% Totl% Visual ____________________ ____________________ _____ _____ _____ __________ -------------------------------------------------------------------------------__ Program Active Program Active 5.71 0.00 5.71 =========> __ Voluntary Wait Wait/Waitr SVC 0.00 2.86 2.86 ====> __ Data Delay DB2 Statement 0.82 0.00 0.82 > __ System Active Post SVC 0.41 0.00 0.41
NOTE The Delay Detail panel does not support the S (Distribution) line command.
172 TriTune User Guide

Interactive analysis option 6 - TranView
DataView detail
Use the DataView Detail (N) line command to display the DataView Detail panel that shows TriTune has collected data set information for a specific transaction. If a Y appears in the D column on the TranView panel (Figure 74 on page 169), data set information exists for that transaction, as shown in Figure 77.
Figure 77 DataView Detail panel
TriTune ------------------- DataView Detail ---------------- Row 1 to 10 of 10COMMAND ===> SCROLL ===> CSR Primary commands: LINklist on/off Profile: DB2SAMP Options: NORMAL Line commands: S - Select Linklist: OFF Transaction: DTEU LC DD name Dataset name Delay% Visual ________ ____________________________________________ ______ __________ >------------------------------------------------------------------------------__ MDYU3000 TRITUNE.TUNCIC61.MDYUDATA.CC3000 5.31 =====> __ JULU3000 TRITUNE.TUNCIC61.JULUDATA.CC3000 4.49 ====> __ MDYU1000 TRITUNE.TUNCIC61.MDYUDATA.CC1000 2.86 ==> __ JULU1000 TRITUNE.TUNCIC61.JULUDATA.CC1000 2.45 => __ JUL1000 TRITUNE.TUNCIC61.JULDATA.CC1000 1.63 > __ MDYU2000 TRITUNE.TUNCIC61.MDYUDATA.CC2000 1.63 > __ JULU2000 TRITUNE.TUNCIC61.JULUDATA.CC2000 1.22 > __ MDY3000 TRITUNE.TUNCIC61.MDYDATA.CC3000 0.82 __ JUL3000 TRITUNE.TUNCIC61.JULDATA.CC3000 0.41
Chapter 5 Analyzing monitor data 173

Interactive analysis option 7 - ModView
Interactive analysis option 7 - ModViewModView displays the linkage editor map for all load modules that are located in the target address space. Only load module entries and those CSECTs with detected activity are listed. From ModView, you can hyperlink to module details or to a panel that suggests a linkage order for reducing system paging.
Figure 78 ModView panel
Table 41 describes the primary and line commands that are available for ModView.
TriTune --------------------------- ModView --------------- Row 24 to 36 of 60COMMAND ===> SCROLL ===> CSR Primary commands: USAge, SEQ, ADDHelp Profile: DB2SAMP Options: NORMAL Line commands: S - Select U - Suggest Sort: SEQ A - Associate LC Module Csect Offset Length Csect Description L Pct Visual ________ ________ ________ ______ _______________________ _ _____ __________>------------------------------------------------------------------------------__ DFHSIP DFHDSSR 0000E168 001D60 DS domain - suspend/res 41.63 =========>__ DFHSIP DFHDSDS3 00010FA0 002128 DS domain - main dispat 26.53 =====> __ DSNVSR DSNVSR 00000100 001C20 ASM-SUSPEND/RESUME/CANC 6.53 > __ TUNDATE TUNDATE 00000020 00106A 2.04 __ DFSREP00 DFSREP00 00000000 002FF8 IMS dispatcher internal 1.63 __ IDA019L1 IDA019R3 00007330 0006C8 VSAM I/O driver 1.63 __ .NUCLEUS ISGGRHS1 0000726C 000694 Global resource seriali 1.22 __ DFHSIP DFHSMGF 000230F8 002960 SM domain - getmain/fre 1.22 __ .NUCLEUS IEACVT 00009D38 0005E4 Supervisor services 0.82
Table 41 ModView commands
Command Description
USAge sorts the display by activity within a load module in descending order
CSECTs that executed most within a load module are shown first.
SEQ sorts the display by CSECT location within a load module in ascending order
ADDHelp invokes the content-sensitive Help application to update or create a help entry for the selected content
S Select - provides detailed information about the selected load module, such as the library from which it was loaded, the module load address, length, date of link edit, component identifier of linkage editor, and the data set of origin
U Suggest - suggests an improved link order for the selected load module based upon the frequency of execution of its CSECTs during the monitored period
174 TriTune User Guide
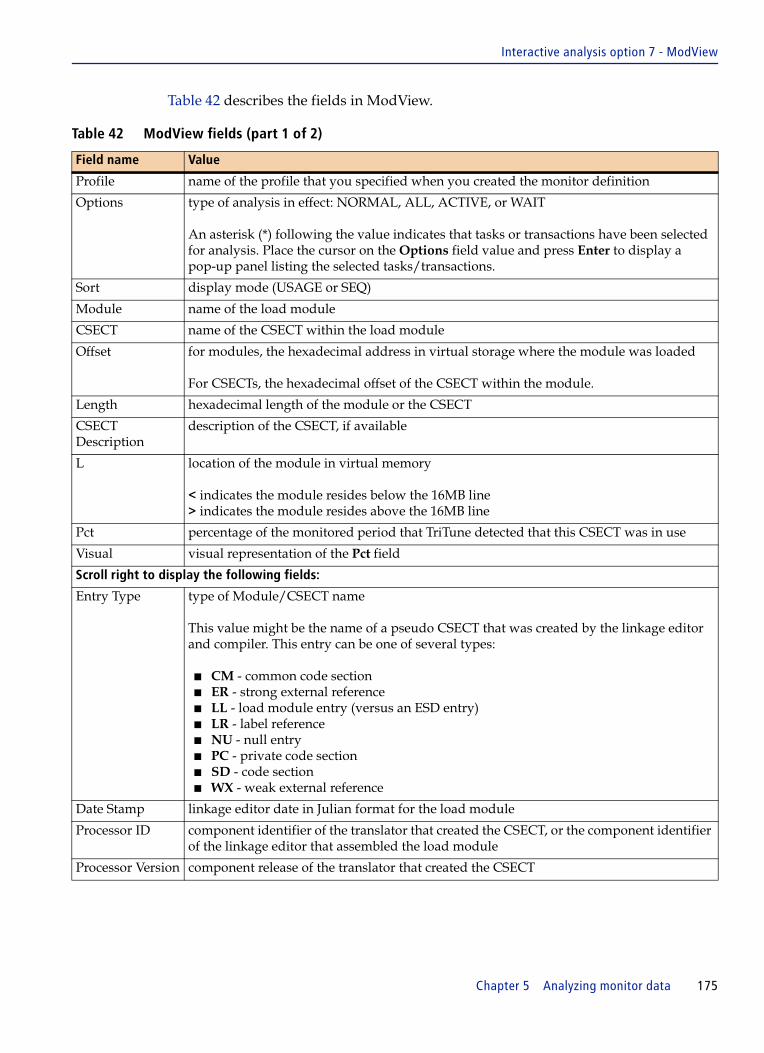
Interactive analysis option 7 - ModView
Table 42 describes the fields in ModView.
Table 42 ModView fields (part 1 of 2)
Field name Value
Profile name of the profile that you specified when you created the monitor definition
Options type of analysis in effect: NORMAL, ALL, ACTIVE, or WAIT
An asterisk (*) following the value indicates that tasks or transactions have been selected for analysis. Place the cursor on the Options field value and press Enter to display a pop-up panel listing the selected tasks/transactions.
Sort display mode (USAGE or SEQ)
Module name of the load module
CSECT name of the CSECT within the load module
Offset for modules, the hexadecimal address in virtual storage where the module was loaded
For CSECTs, the hexadecimal offset of the CSECT within the module.
Length hexadecimal length of the module or the CSECT
CSECT Description
description of the CSECT, if available
L location of the module in virtual memory
< indicates the module resides below the 16MB line> indicates the module resides above the 16MB line
Pct percentage of the monitored period that TriTune detected that this CSECT was in use
Visual visual representation of the Pct field
Scroll right to display the following fields:
Entry Type type of Module/CSECT name
This value might be the name of a pseudo CSECT that was created by the linkage editor and compiler. This entry can be one of several types:
■ CM - common code section■ ER - strong external reference■ LL - load module entry (versus an ESD entry)■ LR - label reference■ NU - null entry■ PC - private code section■ SD - code section■ WX - weak external reference
Date Stamp linkage editor date in Julian format for the load module
Processor ID component identifier of the translator that created the CSECT, or the component identifier of the linkage editor that assembled the load module
Processor Version component release of the translator that created the CSECT
Chapter 5 Analyzing monitor data 175

Interactive analysis option 7 - ModView
AMODE addressing mode specifies the address length a program is prepared to handle upon entry
Valid addressing modes are
■ 24 - 24-bit addressing■ 31 - 31-bit addressing■ ANY - Either 24-bit or 31-bit addressing
RMODE residence mode
Specifies where the module is to be loaded in virtual storage:
■ 24 - Indicates the module must be loaded within 24-bit addressable virtual storage below the 16-megabyte virtual storage line.
■ Any - Indicates the module might be loaded anywhere in virtual storage either above or below the 16-megabyte virtual storage line.
RN reentrant option
Displays Y if the module is link-edited with the reentrant option. Displays N if the module is not reentrant.
RU reusable option
Displays Y if the module is link-edited with the reusable option. Displays N if the module is not reusable.
OV overlay
Displays Y if the module is link-edited in the overlay format. Displays N if the module is not in the overlay format.
LD loadable
Displays Y if the module is loadable. Displays N if the module is not loadable.
EX executable
Displays Y if the module is executable. Displays N if the module is not executable.
Dataset data set from which the module was loaded
Table 42 ModView fields (part 2 of 2)
Field name Value
176 TriTune User Guide

Interactive analysis option 7 - ModView
Determining addressing mode (AMODE):
The loader determines the addressing mode for the entry point as follows:
■ The default AMODE of 24 is assumed.
■ If the AMODE is specified in the ESD data for the entry point as an assembler statement, that specification replaces the default. The loader assigns the AMODE value from the control section or private code that contributes to the loaded module, ignoring identically named control sections and private code, which are replaced.
■ If AMODE is specified as a parameter in the PARM field of the EXEC statement, that specification replaces the previously determined value.
Determining residence mode (RMODE):
The loader determines the residence mode for the loaded program as follows:
■ The default RMODE of 24 is assumed.
■ If the RMODE is specified in the ESD data for the first control section or private code that contributes to the loaded module as an assembler statement, that specification replaces the default.
■ If the RMODE is specified as a parameter in the PARM field of the EXEC statement, that specification replaces the previously determined RMODE.
■ If the ESD data for any subsequent control section or private code that contributes to the loaded module specifies an RMODE of 24, the RMODE for the entire module is reset to 24. If loading begins above the 16-megabyte virtual storage line on the basis of an early determination of RMODE=ANY, and the RMODE is later reset to 24, an error message is issued and loading is restarted below the 16-megabyte virtual storage line.
Chapter 5 Analyzing monitor data 177
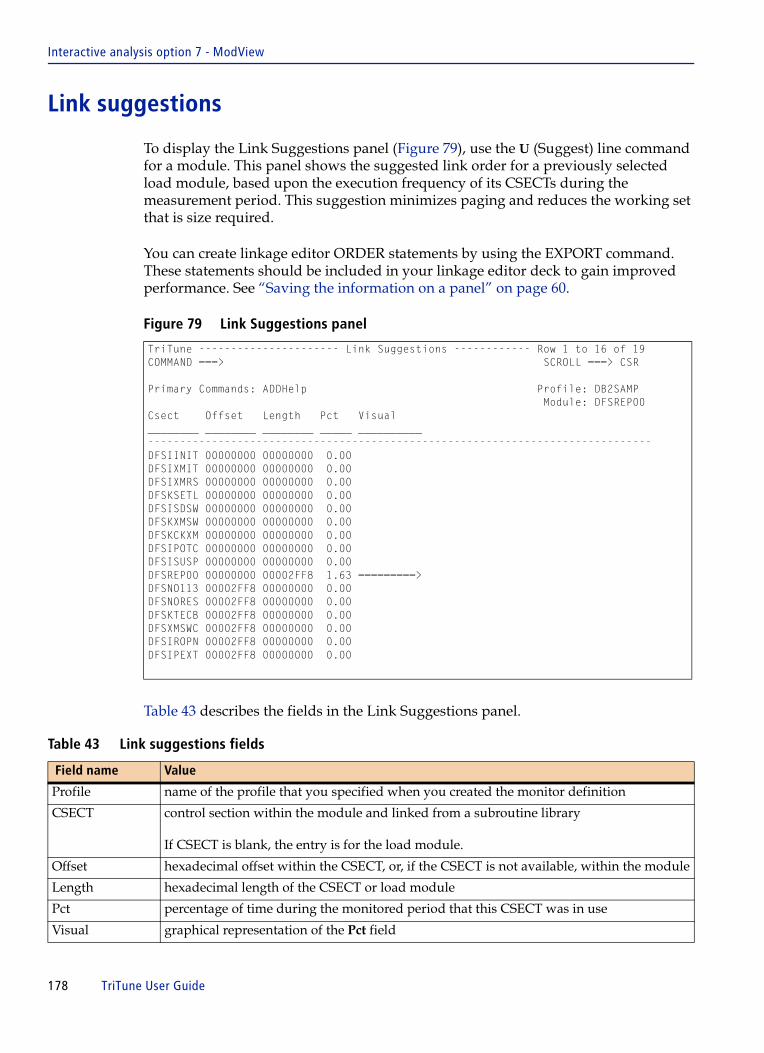
Interactive analysis option 7 - ModView
Link suggestions
To display the Link Suggestions panel (Figure 79), use the U (Suggest) line command for a module. This panel shows the suggested link order for a previously selected load module, based upon the execution frequency of its CSECTs during the measurement period. This suggestion minimizes paging and reduces the working set that is size required.
You can create linkage editor ORDER statements by using the EXPORT command. These statements should be included in your linkage editor deck to gain improved performance. See “Saving the information on a panel” on page 60.
Figure 79 Link Suggestions panel
Table 43 describes the fields in the Link Suggestions panel.
TriTune ---------------------- Link Suggestions ------------ Row 1 to 16 of 19COMMAND ===> SCROLL ===> CSR Primary Commands: ADDHelp Profile: DB2SAMP Module: DFSREP00Csect Offset Length Pct Visual ________ ________ ________ _____ __________ -------------------------------------------------------------------------------DFSIINIT 00000000 00000000 0.00 DFSIXMIT 00000000 00000000 0.00 DFSIXMRS 00000000 00000000 0.00 DFSKSETL 00000000 00000000 0.00 DFSISDSW 00000000 00000000 0.00 DFSKXMSW 00000000 00000000 0.00 DFSKCKXM 00000000 00000000 0.00 DFSIPOTC 00000000 00000000 0.00 DFSISUSP 00000000 00000000 0.00 DFSREP00 00000000 00002FF8 1.63 =========> DFSNO113 00002FF8 00000000 0.00 DFSNORES 00002FF8 00000000 0.00 DFSKTECB 00002FF8 00000000 0.00 DFSXMSWC 00002FF8 00000000 0.00 DFSIROPN 00002FF8 00000000 0.00 DFSIPEXT 00002FF8 00000000 0.00
Table 43 Link suggestions fields
Field name Value
Profile name of the profile that you specified when you created the monitor definition
CSECT control section within the module and linked from a subroutine library
If CSECT is blank, the entry is for the load module.
Offset hexadecimal offset within the CSECT, or, if the CSECT is not available, within the module
Length hexadecimal length of the CSECT or load module
Pct percentage of time during the monitored period that this CSECT was in use
Visual graphical representation of the Pct field
178 TriTune User Guide

Interactive analysis option 8 - PoolView
Interactive analysis option 8 - PoolView PoolView displays statistics about VSAM/LSR and VSAM/GSR buffer pool usage. The PoolView panel (Figure 80) provides information about hit ratios, size and number of buffers, and total space requested. You can also display information about the data sets attached to a pool.
Figure 80 PoolView for an IMS environment
For information about using PoolView with CICS, see “Using PoolView” on page 329. For information about using PoolView with IMS, see “Analyzing IMS batch performance information” on page 350.
NOTE If no pool data is in the monitor data set, the PoolView option is not available.
TriTune -------------------------- PoolView ------------------ Row 1 to 1 of 1COMMAND ===> SCROLL ===> CSR Line commands: S - Select Profile: IMSDLI81 Options: NORMAL LC Type Group Category ____ _____ _____________________________________ -------------------------------------------------------------------------------s_ VSAM LSR VSAM Local Shared Resource pool TriTune ------------------------ Shared Pools ---------------- Row 1 to 6 of 6COMMAND ===> SCROLL ===> CSR Pool type: LOCAL Profile: IMSDLI81 Total pool size: 134348 Options: NORMAL Hit ratio for all subpools: 0 % Line commands: S - Select, D - Datasets Pool No. of Buffer Buffer No. Requests Requests Hit LC Type Group SP Type Buffers size fixed Str w/read wo/read Ratio ____ _____ ___ _____ _______ ______ ______ ___ _________ _________ _____ >------------------------------------------------------------------------------__ VSAM LSR 0 BOTH 64 512 NO 3 0 0 *N/A* __ VSAM LSR 0 BOTH 64 1,024 NO 3 0 0 *N/A* __ VSAM LSR 0 BOTH 64 2,048 NO 3 0 0 *N/A* __ VSAM LSR 0 BOTH 64 4,096 NO 3 161 0 0 % __ VSAM LSR 0 BOTH 64 8,192 NO 3 0 0 *N/A* __ VSAM LSR 0 BOTH 10 32,768 NO 3 0 0 *N/A*
Chapter 5 Analyzing monitor data 179

Interactive analysis option 8 - PoolView
Table 44 describes each field in PoolView.
Table 44 PoolView fields
Field name Description
Profile name of the profile that you specified when you created the monitor definition
Options type of analysis in effect: NORMAL, ALL, ACTIVE, or WAIT
An asterisk (*) following the value indicates that tasks or transactions have been selected for analysis. Place the cursor on the Options field value and press Enter to display a pop-up panel listing the selected tasks/transactions.
Type type of pool, either IMS or VSAM
Group defines the group as LSR or GSR
LSR refers to VSAM Local Shared Resources where the buffer pool is maintained in the user's storage (PRIVATE). GSR refers to VSAM Global Shared Resources where the buffer pool is maintained in z/OS common storage (ECSA).
Category literal name of the pool
180 TriTune User Guide

Interactive analysis option 9 - USSView
Interactive analysis option 9 - USSView The USSView option displays information about USS activity on a process basis (which is very similar to having a TaskView for USS display).
The USSView panel (Figure 81) provides information about delay information by process, code details by process, and process level information. The DelayView and Delay Locations displays include information for all processes. Process level delays would look similar.
Figure 81 USSView panel
Table 45 describes the available commands for USSView.
NOTE If no USS data is in the monitor data set, the USSView option is not available.
TriTune -------------------------- USSView ------------------ Row 1 to 2 of 2COMMAND ===> SCROLL ===> CSR
Primary commands: ADDHelp Profile: USS Options: NORMALLine commands: C - Code Details T - Threads D - Delay Details S - Process Info F - Functions
LC Process ID Initial Command Actv% Wait% Total% Visual __________ ______________________________ _____ _____ ______ __________-------------------------------------------------------------------------------_t 33685520 0.00 10.00 10.00 ====>__ 131092 0.00 10.00 10.00 ===>********************************* End of Table ********************************
Table 45 USSView commands (part 1 of 2)
Command Description
ADDHelp invokes the content-sensitive Help application to update or create a help entry for the selected content
C (CodeView Detail line command) displays the CodeView Detail panel showing activity detected by TriTune
The CodeView Detail panel is described on page 171.
D (DelayView Detail line command) displays the DelayView Detail panel showing the types of delays encountered by TriTune
The DelayView Detail panel is described on page 172.
T displays the Thread IDs associated with the selected Process ID
Chapter 5 Analyzing monitor data 181
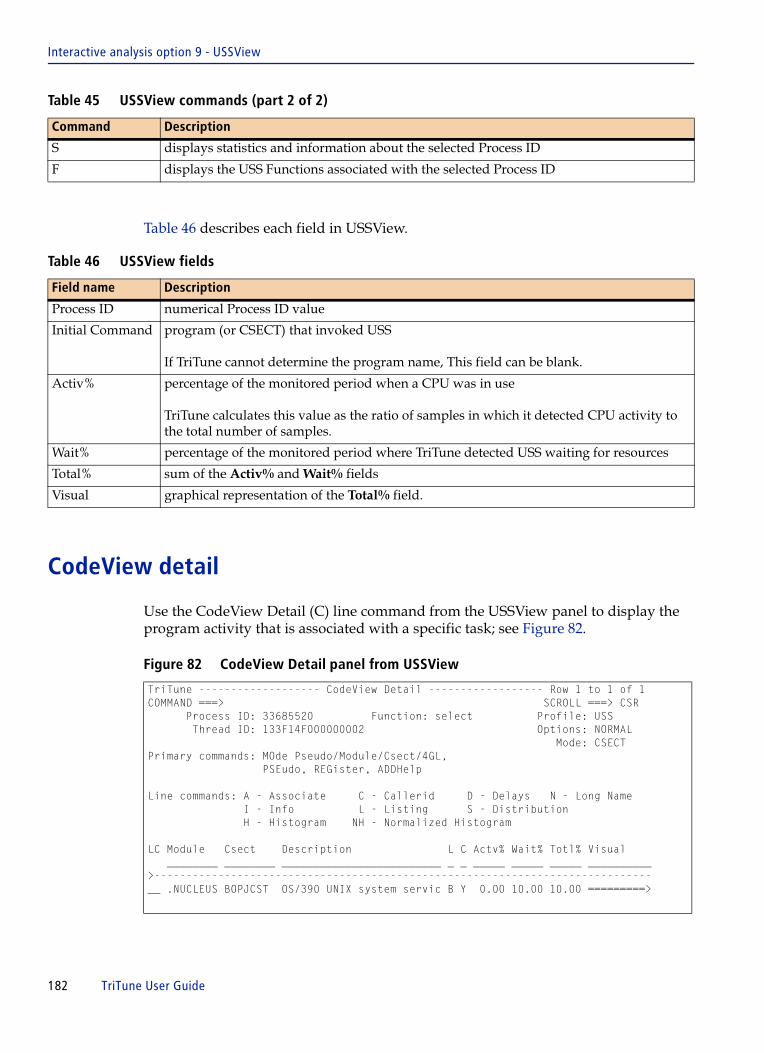
Interactive analysis option 9 - USSView
Table 46 describes each field in USSView.
CodeView detail
Use the CodeView Detail (C) line command from the USSView panel to display the program activity that is associated with a specific task; see Figure 82.
Figure 82 CodeView Detail panel from USSView
S displays statistics and information about the selected Process ID
F displays the USS Functions associated with the selected Process ID
Table 46 USSView fields
Field name Description
Process ID numerical Process ID value
Initial Command program (or CSECT) that invoked USS
If TriTune cannot determine the program name, This field can be blank.
Activ% percentage of the monitored period when a CPU was in use
TriTune calculates this value as the ratio of samples in which it detected CPU activity to the total number of samples.
Wait% percentage of the monitored period where TriTune detected USS waiting for resources
Total% sum of the Activ% and Wait% fields
Visual graphical representation of the Total% field.
TriTune ------------------- CodeView Detail ------------------ Row 1 to 1 of 1COMMAND ===> SCROLL ===> CSR Process ID: 33685520 Function: select Profile: USS Thread ID: 133F14F000000002 Options: NORMAL Mode: CSECTPrimary commands: MOde Pseudo/Module/Csect/4GL, PSEudo, REGister, ADDHelp
Line commands: A - Associate C - Callerid D - Delays N - Long Name I - Info L - Listing S - Distribution H - Histogram NH - Normalized Histogram
LC Module Csect Description L C Actv% Wait% Totl% Visual ________ ________ _________________________ _ _ _____ _____ _____ __________>------------------------------------------------------------------------------__ .NUCLEUS BOPJCST OS/390 UNIX system servic B Y 0.00 10.00 10.00 =========>
Table 45 USSView commands (part 2 of 2)
Command Description
182 TriTune User Guide

Interactive analysis option 9 - USSView
This panel displays the modules and CSECTs that delayed a task which is identified in the Process ID: field. The commands you can issue and field headings are identical to the CodeView panel (see page 146). All subsequent associated panels report information for the specified task.
DelayView detail
Use the DelayView Detail (D) line command to display the delay categories that are associated with a specific task and detected by TriTune (Figure 83).
Figure 83 DelayView Detail panel
This panel displays information about what caused a task to be delayed in its execution. The commands you can issue and field headings are identical to the DelayView panel (see page 136). All subsequent associated panels report information for the specified task.
NOTE The CodeView Detail panel reports both Active and Wait activity percentages for Analyze Normal mode, which accounts for all activity reported in USSView.
TriTune ------------------ DelayView Detail ------------------ Row 1 to 3 of 3 COMMAND ===> SCROLL ===> CSR Process ID: 50331728 Profile: USS Detail: ON Primary commands: DETail on/off, Module: * ADDHelp Csect: * Offset: * Line commands: A - Address LC Major category Minor category Actv% Wait% Totl% Visual ____________________ ____________________ _____ _____ _____ __________ ------------------------------------------------------------------------------- __ Unix System Services pfsctl (BPX1PCT) 0.01 0.54 0.54 =========> __ Unix System Services Unix System Services 0.00 0.01 0.01 __ Unix System Services w_getpsent (BPX1GPS) 0.01 0.00 0.01 ********************************* End of Table ********************************
Chapter 5 Analyzing monitor data 183

Interactive analysis option 9 - USSView
Threads panel
Issuing the Threads line command displays the USS Thread panel where the IDs that are associated with the selected Process ID (see Figure 84) are shown.
Figure 84 USS Threads panel
Table 47 describes the available commands for USS Threads.
Table 48 describes each field in USSView.
TriTune ---------------------- USS Threads ------------------ Row 1 to 1 of 1COMMAND ===> SCROLL ===> CSR
Primary Commands: PROcess Info Profile: USS Options: NORMAL Line Commands: C - Code Detail Process ID: 33685520 D - Delay Detail F - Functions
LC Thread ID Actv% Wait% Total% Visual ________________ _____ _____ ______ __________-------------------------------------------------------------------------------f__ 133F14F000000002 0.00 10.00 10.00 =========>
Table 47 USSView Threads commands
Command Description
PRO displays Process statistics and information about the selected Thread ID
C (CodeView Detail line command) displays the CodeView Detail panel showing activity detected by TriTune
The CodeView Detail panel is described on page 171.
D (DelayView Detail line command) displays the DelayView Detail panel showing the types of delays encountered by TriTune. The DelayView Detail panel is described on page 172.
F displays the USS Functions associated with the selected Process ID.
Table 48 USSView Threads fields
Field name Description
Thread ID numerical Thread ID value
Activ% percentage of the monitored period when a CPU was in use
TriTune calculates this value as the ratio of samples in which it detected CPU activity to the total number of samples.
Wait% percentage of the monitored period where TriTune detected USS waiting for resources
Total% sum of the Activ% and Wait% fields
Visual graphical representation of the Total% field
184 TriTune User Guide

Interactive analysis option 9 - USSView
Process Information panel
Issuing the S - Process Info line command displays the Process Information panel where the IDs that are associated with the selected Process ID (see Figure 85) are shown.
Figure 85 Process Information panel
Table 49 describes the available command for USS Threads.
Table 50 describes each field in the Process Information panel.
TriTune ------------ Process Information ------------ Row 1 to 18 of 18 COMMAND ===> SCROLL ===> CSR Primary Commands: THReads Profile: USS Options: NORMAL Process ID . . . . . . 50331728 USS Real User ID . . . . . 0 Process Group Number . 50331728 USS Real Group ID . . . . . 0 Parent Process ID . . . 1 Session ID . . . . . . . . 50331728 Kernal CPU Time . . 00:00:00.018 Callable Services Count . . 1513 I/O Block Counts Path Name Counts ----------------------------------- --------------------------------------- DIR Read . . . . . . . 472 Logical look-up Calls . . . 0 Standard Read . . . . . 262 Physical look-up Calls . . 0 Standard Write . . . . 0 Logical Generation Calls . 48 Char Special Read . . . 0 Physical Generation Calls . 118 Char Special Write . . 0 Pipe Read . . . . . . . 0 Message Send Bytes . . . . 0 Pipe Write . . . . . . 0 Message Receive Bytes . . . 0 Remote Socket Read . . 0 Sync() Calls . . . . . . . 0 Remote Socket Write . . 0
Table 49 Process Information commands
Command Description
THR displays the USS Threads panel
Table 50 Process Information fields (part 1 of 2)
Field name Description
Process ID OpenMVS process ID number
Process Group Number OpenMVS process group ID number
Parent Process ID OpenMVS parent process ID number
USS Real User ID OpenMVS real user ID number
USS Real Group ID OpenMVS real group ID number
Session ID OpenMVS session ID number
Kernel CPU Time total CPU time spent in OpenMVS kernel
Chapter 5 Analyzing monitor data 185
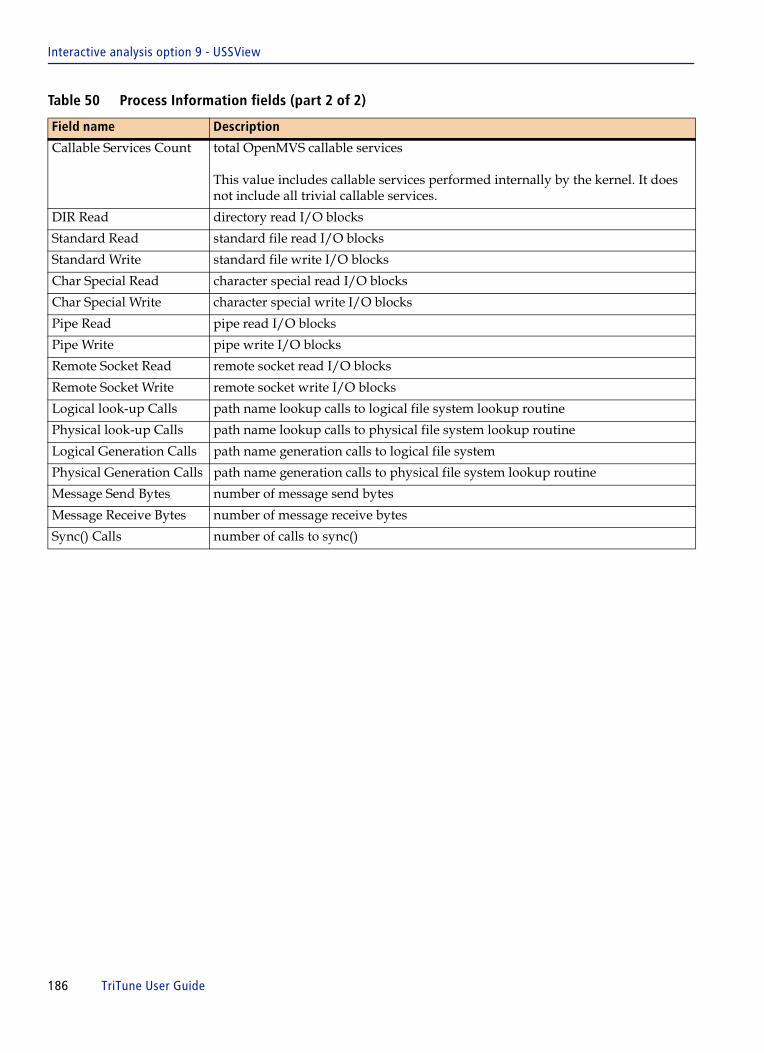
Interactive analysis option 9 - USSView
Callable Services Count total OpenMVS callable services
This value includes callable services performed internally by the kernel. It does not include all trivial callable services.
DIR Read directory read I/O blocks
Standard Read standard file read I/O blocks
Standard Write standard file write I/O blocks
Char Special Read character special read I/O blocks
Char Special Write character special write I/O blocks
Pipe Read pipe read I/O blocks
Pipe Write pipe write I/O blocks
Remote Socket Read remote socket read I/O blocks
Remote Socket Write remote socket write I/O blocks
Logical look-up Calls path name lookup calls to logical file system lookup routine
Physical look-up Calls path name lookup calls to physical file system lookup routine
Logical Generation Calls path name generation calls to logical file system
Physical Generation Calls path name generation calls to physical file system lookup routine
Message Send Bytes number of message send bytes
Message Receive Bytes number of message receive bytes
Sync() Calls number of calls to sync()
Table 50 Process Information fields (part 2 of 2)
Field name Description
186 TriTune User Guide

Interactive analysis option 9 - USSView
USS Functions
Issuing the F - Functions line command displays the USS Functions panel where the functions that are associated with the selected Process ID (see Figure 86) are shown.
Figure 86 USS Functions panel
Table 51 describes the available commands for USS Functions.
Table 52 describes each field in USSView.
TriTune --------------------- USS Functions ----------------- Row 1 to 3 of 3 COMMAND ===> SCROLL ===> CSR Primary Commands: PROcess Info Profile: USS Options: NORMAL Line Commands: C - Code Detail Process ID: 50331728 MVS LC Function Program Actv% Wait% Total% Visual ________________ ________ _____ _____ ______ __________ -------------------------------------------------------------------------------__ pfsctl BPX1PCT 0.01 0.54 0.54 =========> __ Unix System 0.00 0.01 0.01 __ w_getpsent BPX1GPS 0.01 0.00 0.01 ********************************* End of Table ********************************
Table 51 USS Functions commands
Command Description
PRO displays Process statistics and information about the selected Thread ID.
C (CodeView Detail line command) displays the CodeView Detail panel showing activity detected by TriTune
The CodeView Detail panel is described on page 171.
Table 52 USSView Functions Fields
Field name Description
Function function name
MVS Program MVS programs name for the USS function
Activ% percentage of the monitored period when a CPU was in use
TriTune calculates this value as the ratio of samples in which it detected CPU activity to the total number of samples.
Wait% percentage of the monitored period where TriTune detected USS waiting for resources
Total% sum of the Activ% and Wait% fields
Visual graphical representation of the Total% field.
Chapter 5 Analyzing monitor data 187

What next?
What next?Now that you have used some of the TriTune Interactive Analysis panels, you can find specific information about other TriTune features in the chapters listed in the following table.
Task Reference
Learn how to get the most out of TriTune. Chapter 6, “Using additional features of TriTune”
Invoke monitors from outside the TriTune TSO Client.
Chapter 7, “TriTune Open Application Program Interface”
Create a set of batch reports. Chapter 8, “Generating TriTune batch reports”
Look up delay categories and determine reasons for specific types of delays.
Chapter 9, “Using TriTune to tune your applications”
Use TriTune with DB2. Chapter 10, “Using TriTune in a DB2 environment”
Use TriTune with CICS. Chapter 11, “Using TriTune in a CICS environment”
Use TriTune with IMS. Chapter 12, “Using TriTune in an IMS environment”
Use TriTune with Adabas, Natural, CA-Ideal or CA-Datacom.
Chapter 17, “Using TriTune with other databases”
188 TriTune User Guide

C h a p t e r 6
6 Using additional features of TriTuneIn addition to the basic TriTune tasks of defining, invoking, and analyzing monitors, several features are available that can assist you with tuning your applications. This section provides information about these features, which are accessed from the TriTune Primary Option Menu. The following tasks are described:
Creating and using Global Monitors. . . . . . . . . . . . . . . . . . . . . . . . . . . . . . . . . . . . . . . . 190Using the Global Monitoring Menu . . . . . . . . . . . . . . . . . . . . . . . . . . . . . . . . . . . . . 190Changing the Global Monitor definition default criteria . . . . . . . . . . . . . . . . . . . 191Analyzing Global Monitor data sets. . . . . . . . . . . . . . . . . . . . . . . . . . . . . . . . . . . . . 191
Analyzing monitor data sets created by other users. . . . . . . . . . . . . . . . . . . . . . . . . . . 192Including a monitor data set from an external user . . . . . . . . . . . . . . . . . . . . . . . . 194Adding a monitor data set . . . . . . . . . . . . . . . . . . . . . . . . . . . . . . . . . . . . . . . . . . . . . 196Analyzing external data sets . . . . . . . . . . . . . . . . . . . . . . . . . . . . . . . . . . . . . . . . . . . 197Removing external data sets . . . . . . . . . . . . . . . . . . . . . . . . . . . . . . . . . . . . . . . . . . . 197
Performing administrative functions . . . . . . . . . . . . . . . . . . . . . . . . . . . . . . . . . . . . . . . 198Using the Administration Option Menu . . . . . . . . . . . . . . . . . . . . . . . . . . . . . . . . . 198CSECT associations . . . . . . . . . . . . . . . . . . . . . . . . . . . . . . . . . . . . . . . . . . . . . . . . . . . 200Defining pseudo groups . . . . . . . . . . . . . . . . . . . . . . . . . . . . . . . . . . . . . . . . . . . . . . . 202Updating content-sensitive Help . . . . . . . . . . . . . . . . . . . . . . . . . . . . . . . . . . . . . . . 205Updating a content-sensitive Help entry . . . . . . . . . . . . . . . . . . . . . . . . . . . . . . . . . 210Displaying TriTune and environmental information . . . . . . . . . . . . . . . . . . . . . . . 216
Registering source program listings . . . . . . . . . . . . . . . . . . . . . . . . . . . . . . . . . . . . . . . . 218Compiling the program . . . . . . . . . . . . . . . . . . . . . . . . . . . . . . . . . . . . . . . . . . . . . . . 218Registering IBM C/C++ listings with language environment support . . . . . . . 220Using interactive analysis with registered programs. . . . . . . . . . . . . . . . . . . . . . . 228
Chapter 6 Using additional features of TriTune 189

Creating and using Global Monitors
Creating and using Global MonitorsGlobal Monitoring Definitions are associated with the TriTune Server and not a specific user. Use the Global Monitoring Menu to manage monitor information that is located in the Global Information File (GIF). This information includes monitors invoked by using the TriTune Open API.
Using the Global Monitoring Menu
The Global Monitoring Menu is used to set up a new monitor definition; to modify or delete existing definitions; to invoke a monitor, and to check the status of data collection for monitor definitions. After data collection is complete, use the External option to analyze the results.
Select Option G to display the Global Monitoring Menu (Figure 87).
Figure 87 Global Monitoring Menu
Table 53 describes the options available on the Global Monitoring Menu.
TriTune --------------------- Global Monitoring Menu -------------------------- OPTION ===>
0 Parameters - Enter global monitor parameters Userid: TUNUSER Server ID: TRITUNE 1 Monitor - Create and analyze Monitor Sets Status: ACTIVE Release: 4.0.0 2 Active - Select an active job to monitor 3 Registration - Shared listing registration 4 Grouping - Define groups of monitors
Enter an option or press END to return to the TriTune Primary Option Menu
Table 53 TriTune Global Monitoring Menu options (part 1 of 2)
Option Description
Option 0 (Parameters) displays the Profile Parameters panel where you can modify the TriTune default display settings
These global parameters are identical to the user profile parameters. See the TriTune Installation and Customization Guide for complete information.
Option 1 (Monitor) displays the Monitor Definition panel where you can set up a new monitor definition, modify or delete an existing definition, and view the status of data collection
Option 2 (Active) displays the Active Jobs panel, which allows you to create and invoke a monitor session for any active job
Refer to Chapter 4, “Invoking a monitor” for more information.
190 TriTune User Guide

Creating and using Global Monitors
Changing the Global Monitor definition default criteria
When you invoke a monitor using TUNCALL, default monitoring criteria are used unless otherwise specified. The default values are contained in the Global Profile Parameters table. To change the default values:
1 From the Global Monitoring Menu, select Option 0.
2 Press Enter.
The Profile Parameters panel is displayed.
3 Change the criteria as required.
Refer to the TriTune Installation and Customization Guide for more information.
4 Press End to exit the panel and save the default values.
Analyzing Global Monitor data sets
Global monitor data sets are analyzed the same way as normal monitors. You can display the Interactive Analysis menu by using the A, AL, AA, or AW line commands for the data set name. These line commands work the same way as they do for the Monitor Definition panel, as described in “Starting interactive analysis” on page 115.
Option 3 (Registration) displays the Program Listing Registration panel where you can specify program listings for Assembler and high-level languages with TriTune
This option allows TriTune to correlate program activity to the high-level language statements instead of to only offsets with modules or CSECTs.
Option 4 (Grouping) displays the Monitor Profile Groups panel that allows you to define groups of job steps that can be monitored together while also specifying the job step that initiates (or “triggers”) the monitoring of the group
Refer to “Creating a multijob monitor: grouping” on page 90 for more information.
Table 53 TriTune Global Monitoring Menu options (part 2 of 2)
Option Description
Chapter 6 Using additional features of TriTune 191
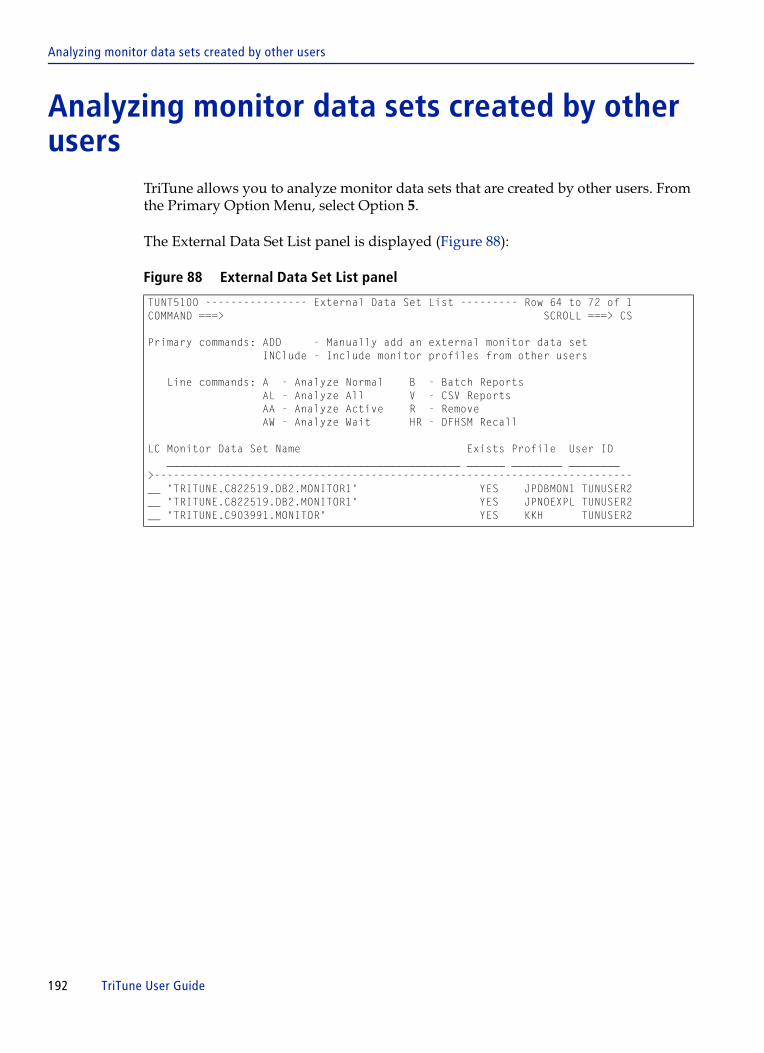
Analyzing monitor data sets created by other users
Analyzing monitor data sets created by other users
TriTune allows you to analyze monitor data sets that are created by other users. From the Primary Option Menu, select Option 5.
The External Data Set List panel is displayed (Figure 88):
Figure 88 External Data Set List panel
TUNT5100 ---------------- External Data Set List --------- Row 64 to 72 of 1COMMAND ===> SCROLL ===> CS Primary commands: ADD - Manually add an external monitor data set INClude - Include monitor profiles from other users Line commands: A - Analyze Normal B - Batch Reports AL - Analyze All V - CSV Reports AA - Analyze Active R - Remove AW - Analyze Wait HR - DFHSM Recall LC Monitor Data Set Name Exists Profile User ID ______________________________________________ ______ ________ ________ >---------------------------------------------------------------------------__ 'TRITUNE.C822519.DB2.MONITOR1' YES JPDBMON1 TUNUSER2 __ 'TRITUNE.C822519.DB2.MONITOR1' YES JPNOEXPL TUNUSER2 __ 'TRITUNE.C903991.MONITOR' YES KKH TUNUSER2
192 TriTune User Guide

Analyzing monitor data sets created by other users
Table 54 describes the fields in the External Data Set List panel.
Table 54 External Data Set List panel fields
Field Description
Monitor Data Set Name
data set name of the monitor data set
Exists indicates data set availability
The following values can be displayed in this field:
■ YES: the data set containing the sample data for the monitor instance is available and has not been migrated
■ NO: the data set is not found
■ ML1: the data set containing the sample data for the monitor instance exists but is migrated to the DFSMShsm ML1 migration pool
ML1 migration generally goes to disk.
■ ML2: the data set containing the sample data for the monitor instance exists but is migrated to the DFSMShsm ML2 migration pool
ML2 migration generally goes to tape.
■ INV: the data set name is invalid. If this value is displayed, check the entry to make sure the data set name is valid before continuing
■ PER: a program error occurred
This value can indicate a catalog error other than the data set not being found. See your technical support staff for more information.
Profile displays the unique identifier that designates a particular monitor definition
This identifier can be one to eight alphanumeric characters.
User ID displays the identifier of the person (or batch job) who last invoked the monitor definition
The identifier might be one of the following types:
■ a TSO user ID if the request was submitted from the Monitor Definition panel or the Display Active panel
■ a batch job name if the request was submitted from TUNCALL in a batch job
User Prefix displays the TSO data set prefix
This prefix is a one-to-seven character alphanumeric value saved as part of the user's TSO profile.
Date displays the date on which the monitor was started
Time displays the time when the monitor was started
Description displays the user-specified description of the monitor definition
Chapter 6 Using additional features of TriTune 193

Analyzing monitor data sets created by other users
Including a monitor data set from an external user
When you first display the External Data Set List panel, it does not contain any monitor data set names. You must add the names of the data sets that you want to include. Monitor data sets are listed in the User Information File for each user. You can access another user’s User Information File by using the INCLude primary command:
1 On the COMMAND line, type INCL.
2 Press Enter.
The Include Monitor Data Set panel (Figure 89) is displayed:
Figure 89 Include Monitor Data Set panel
3 Specify the data set name of the monitor data sets that you want included.
By default, a user’s tables’ data set name is prefix.userid.USER.TRI40.TABLES. If your site uses the default tables data set names, access a user’s data set by specifying the user’s TSO user ID and prefix in the User Identification fields. If your site does not use the default tables data set names, you must specify the correct value in the Data set name field.
To add Global monitor data sets, specify GLOBAL. See Chapter 7, “TriTune Open Application Program Interface” for more information.
4 Press Enter to display the Monitor Profiles panel (Figure 90 on page 195).
This panel displays the profiles that are available within the specified User Information File.
TriTune ----------------- External Data Set List ------------- ROW 0 to 0 of 0 .----------------------------------------------------------------------------. | TriTune ----------------- Include Monitor Data Set ----------------------- | COMMAND ===> | | | | User Identification: | | User ID ===> TRIUSER | | Prefix ===> TRIUSER | | | | User Information File | | Data set name ===> | | Type GLOBAL for Global Monitor Definitions | | | | Note: If a User Information File name is not provided, the name is | | constructed from the User ID and Prefix fields. | | | | Press ENTER to continue or END to cancel. | '----------------------------------------------------------------------------'
194 TriTune User Guide

Analyzing monitor data sets created by other users
Figure 90 Monitor Profiles panel
5 To select the most recent monitor data set for a profile, type S next to the appropriate profile name and press Enter.
6 To display a list of all monitor data sets that are associated with a profile, type H next to the appropriate profile name and press Enter.
The Monitor History panel (Figure 91) is displayed:
Figure 91 Monitor History panel
7 Type S next to the appropriate data sets and press Enter.
8 Press End to return to the External Data Set List panel.
The monitor data sets for the selected profile have been added to the External Data Set List (Figure 92 on page 196).
TriTune ---------------------- Monitor Profiles ------------ Row 1 to 13 of 78COMMAND ===> SCROLL ===> CSR Primary commands: INClude User ID: TUNUSER Prefix: TUNUSER Line commands: S - Select H - History LC Profile Userid Prefix Description Status Jobname ________ ________ ________ _________________________ __________ ________ >------------------------------------------------------------------------------__ #ABM TUNUSER2 Inactive #ABM* __ A TUNUSER2 Inactive A __ ABMAF12T TUNUSER2 Inactive ABMAF12T __ ABMFAA2T TUNUSER2 Inactive ABMFAA2T __ ABMGBA2D TUNUSER2 Inactive ABMGBA2D __ TUNCIC53 TUNUSER2 Inactive TUNCIC53 __ TUNCIC61 TUNUSER2 Inactive TUNCIC61 _H TUNCIC62 TUNUSER2 Inactive TUNCIC62 __ TUNIVP01 TUNUSER2 Inactive TUNIVP01
TriTune ----------------------- Monitor History -------------- Row 1 to 2 of 2 COMMAND ===> SCROLL ===> CSR Profile: LSCIDTST Line commands: S - Select monitor data set User ID: BMV* Prefix: LC Date Time Dataset name Exists ___________ ________ ______________________________________________ ______ -------------------------------------------------------------------------------__ 2006/08/02 05:59:31 'BMVSST.LSCIDTST.D2006214.T0559313' YES __ 2006/08/02 05:58:15 'BMVSST.LSCIDTST.D2006214.T0558201' YES ********************************* End of Table ********************************
Chapter 6 Using additional features of TriTune 195

Analyzing monitor data sets created by other users
Figure 92 External Data Set List panel after adding data sets
Adding a monitor data set
You can also manually enter a specific data set name of a monitor data set to analyze monitor data that is not associated with a particular User or Global Information File. To add a monitor data set manually:
1 On the COMMAND line, type ADD.
2 Press Enter.
The Manual Monitor Data Set Add panel (Figure 93) is displayed.
Figure 93 Manual Monitor Data Set Add panel
3 Enter the profile name and the monitor data set name.
4 (Optional) Enter a description for the profile.
5 Press End to return to the External Data Set List panel.
TriTune ----------------- External Data Set List ---------- Row 11 to 20 of 24 COMMAND ===> SCROLL ===> CSR Primary commands: ADD - Manually add an external monitor data set INClude - Include monitor profiles from other users Line commands: A - Analyze Normal B - Batch Reports AL - Analyze All V - CSV Reports AA - Analyze Active R - Remove AW - Analyze Wait HR - DFHSM Recall User LC Profile Description User ID Prefix Date Time ________ _________________________ ________ ________ __________ ________ >------------------------------------------------------------------------------__ LSCIDTST BMVSST 2006/08/02 05:59:31
TriTune --------------- Manual Monitor Data Set Add ---------------------- COMMAND ===> Profile Name ===> Monitor Data Set ===> Description ===>
196 TriTune User Guide

Analyzing monitor data sets created by other users
Analyzing external data sets
Now that the External Data Set List contains monitor data sets, you can display the Interactive Analysis menu by using the A, AL, AA, or AW line commands for the data set name. These line commands work the same way as they do for the Monitor Definition panel, as described in “Starting interactive analysis” on page 115.
To recall in the background a data set that has been migrated, type HR next to the appropriate profile name and press Enter.
Removing external data sets
To remove an external data set from your list, type R next to it and press Enter. The original data set will not be deleted.
Chapter 6 Using additional features of TriTune 197

Performing administrative functions
Performing administrative functionsThe following sections describe these functions:
■ “Using the Administration Option Menu”■ “Registering source program listings” on page 218■ “Defining pseudo groups” on page 202■ “Updating content-sensitive Help” on page 205■ “Displaying TriTune and environmental information” on page 216
Using the Administration Option Menu
If you are a TriTune administrator, use the Administration Option Menu panel to register program listings for Assembler and high-level languages with TriTune. Registration allows TriTune to relate program activity to the high-level language statements instead of to offsets within modules and CSECTs.
Figure 94 Administration Option Menu
TriTune ------------------- Administration Option Menu ------------------------OPTION ===>
1 Associations - Define module/Csect functions Userid: TUNUSER 2 Pseudo - Define pseudo groups Server ID: TRITUNE 3 Content Help - Update content-sensitive help Status: ACTIVE 4 Scheduling - Create monitor schedules Release: 4.0.00 5 Registration - Shared source listing registration
S System Settings - View system settings for clients U User Settings - View user settings for clients I Environment - Display TriTune and environmental information
Enter an option or press END to return to the TriTune Primary Option Menu
198 TriTune User Guide

Performing administrative functions
Table 55 describes the options available on the Administration Option Menu panel.
Table 55 TriTune Administration Option Menu panel
Option Description
Option 1 (Associations) displays the CSECT Associations panel, which allows you to assign functional descriptions to CSECTs
These functional descriptions appear on TriTune analysis panels, such as CodeView, DelayView, and ModView. Refer to “Adding CSECT descriptions” on page 200 for more information.
Option 2 (Pseudo) displays the Pseudo Group Definitions panel, which allows you to group related program modules into pseudo groups
Pseudo groups enable TriTune to provide simplified reporting on these modules. Refer to “Defining pseudo groups” on page 202 for more information.
Option 3 (Content Help) displays the Content-sensitive Help panel, which allows you to add content-sensitive online Help
By updating Help, you can provide specific information about delay causes, pseudo groups, and CSECTs. For more information about content-sensitive Help, see “Updating content-sensitive Help” on page 205.
Option 4 (Scheduling) displays the Schedule Definitions panel where you can create shifts/schedules for monitoring activity
For information, refer to “Creating a monitor schedule” on page 93.
Option 5 (Registration) displays the Program Listing Registration panel, which allows you to register program listings to relate program activity to actual high-level language statements
Refer to “Registering source program listings” on page 218 for more information.
Option S (System Settings) displays the default parameter values set for a TriTune system
These values are set with the TUNSDEFS batch procedure (they cannot be changed from this panel). Refer to the TriTune Installation and Customization Guide.
Option U (User Settings) displays the default parameter values set for new TriTune users
These values are set with the TUNUDEFS batch procedure (they cannot be changed from this panel). Refer to the TriTune Installation and Customization Guide.
Option I (Environment) displays TriTune and environmental information that should be examined with the assistance of Customer Support personnel
This option contains information such as the maintenance level, storage blocks, and the z/OS environments in which the server and client are running. Refer to “Displaying TriTune and environmental information” on page 216.
Chapter 6 Using additional features of TriTune 199
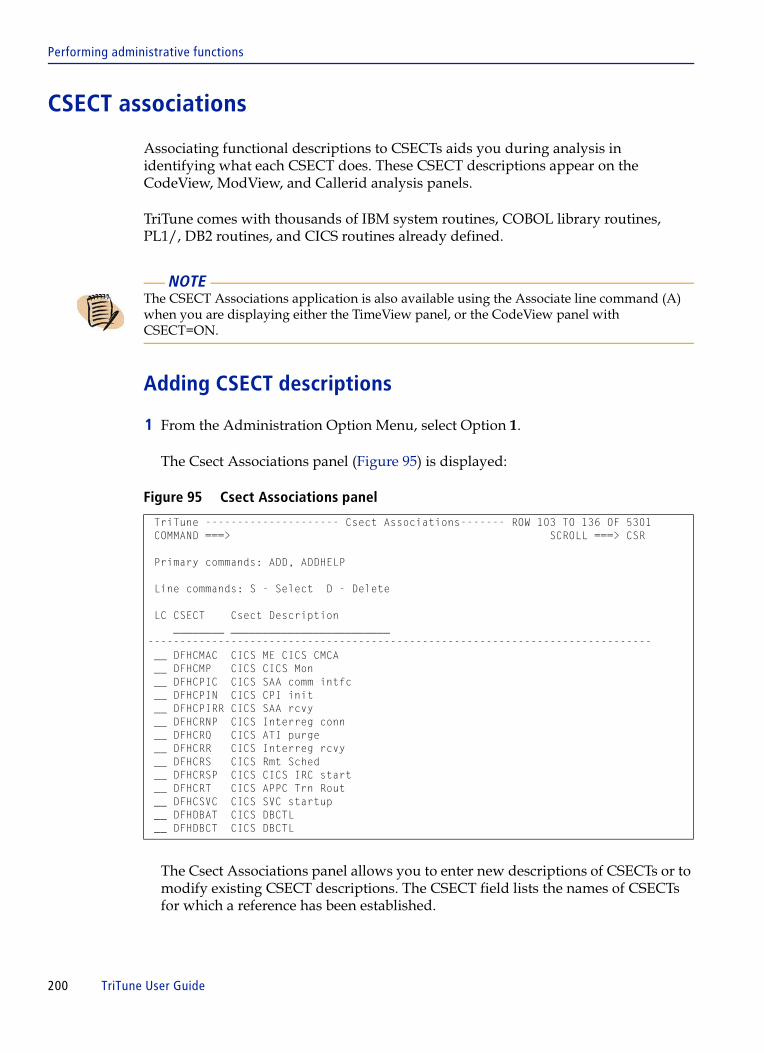
Performing administrative functions
CSECT associations
Associating functional descriptions to CSECTs aids you during analysis in identifying what each CSECT does. These CSECT descriptions appear on the CodeView, ModView, and Callerid analysis panels.
TriTune comes with thousands of IBM system routines, COBOL library routines, PL1/, DB2 routines, and CICS routines already defined.
Adding CSECT descriptions
1 From the Administration Option Menu, select Option 1.
The Csect Associations panel (Figure 95) is displayed:
Figure 95 Csect Associations panel
The Csect Associations panel allows you to enter new descriptions of CSECTs or to modify existing CSECT descriptions. The CSECT field lists the names of CSECTs for which a reference has been established.
NOTE The CSECT Associations application is also available using the Associate line command (A) when you are displaying either the TimeView panel, or the CodeView panel with CSECT=ON.
TriTune --------------------- Csect Associations------- ROW 103 TO 136 OF 5301 COMMAND ===> SCROLL ===> CSR
Primary commands: ADD, ADDHELP
Line commands: S - Select D - Delete
LC CSECT Csect Description ________ _________________________------------------------------------------------------------------------------- __ DFHCMAC CICS ME CICS CMCA __ DFHCMP CICS CICS Mon __ DFHCPIC CICS SAA comm intfc __ DFHCPIN CICS CPI init __ DFHCPIRR CICS SAA rcvy __ DFHCRNP CICS Interreg conn __ DFHCRQ CICS ATI purge __ DFHCRR CICS Interreg rcvy __ DFHCRS CICS Rmt Sched __ DFHCRSP CICS CICS IRC start __ DFHCRT CICS APPC Trn Rout __ DFHCSVC CICS SVC startup __ DFHDBAT CICS DBCTL __ DFHDBCT CICS DBCTL
200 TriTune User Guide
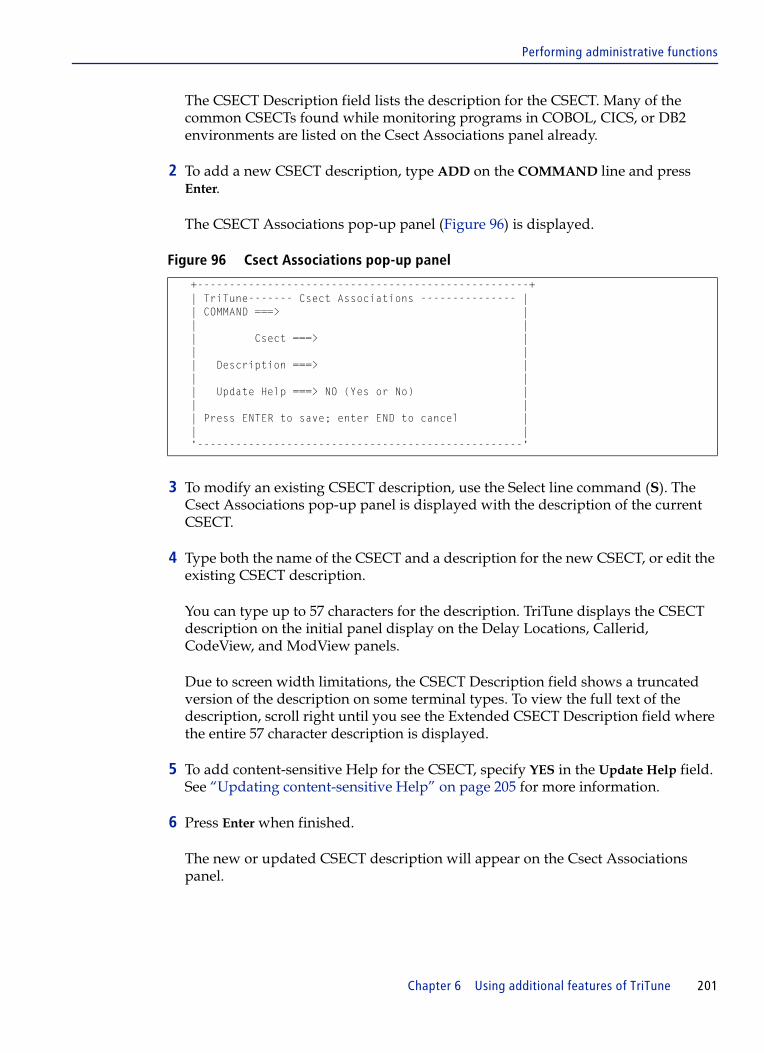
Performing administrative functions
The CSECT Description field lists the description for the CSECT. Many of the common CSECTs found while monitoring programs in COBOL, CICS, or DB2 environments are listed on the Csect Associations panel already.
2 To add a new CSECT description, type ADD on the COMMAND line and press Enter.
The CSECT Associations pop-up panel (Figure 96) is displayed.
Figure 96 Csect Associations pop-up panel
3 To modify an existing CSECT description, use the Select line command (S). The Csect Associations pop-up panel is displayed with the description of the current CSECT.
4 Type both the name of the CSECT and a description for the new CSECT, or edit the existing CSECT description.
You can type up to 57 characters for the description. TriTune displays the CSECT description on the initial panel display on the Delay Locations, Callerid, CodeView, and ModView panels.
Due to screen width limitations, the CSECT Description field shows a truncated version of the description on some terminal types. To view the full text of the description, scroll right until you see the Extended CSECT Description field where the entire 57 character description is displayed.
5 To add content-sensitive Help for the CSECT, specify YES in the Update Help field. See “Updating content-sensitive Help” on page 205 for more information.
6 Press Enter when finished.
The new or updated CSECT description will appear on the Csect Associations panel.
+----------------------------------------------------+ | TriTune------- Csect Associations --------------- | | COMMAND ===> | | | | Csect ===> | | | | Description ===> | | | | Update Help ===> NO (Yes or No) | | | | Press ENTER to save; enter END to cancel | | | '---------------------------------------------------'
Chapter 6 Using additional features of TriTune 201

Performing administrative functions
Defining pseudo groups
TriTune uses the concept of pseudo groups to treat related modules as a single group in the CodeView application. Elapsed time in all modules within a pseudo group is reported by using the pseudo group name.
A pseudo group contains modules with names that start with the prefix or prefixes that are assigned to the pseudo group. You can include any number of prefixes in a single pseudo group, but the same prefix should not be a part of multiple pseudo groups.
Associating modules with pseudo groups
1 From the Administration Option Menu. select Option 2.
The Pseudo Group Definitions panel (Figure 97) is displayed.
Figure 97 Pseudo Group Definitions panel
NOTE You can also access the Pseudo Group Definitions panel directly from CodeView by using the PSEudo primary command. Refer to “Interactive analysis option 3 - CodeView” on page 146
TriTune --------------- Pseudo Group Definitions ---------- Row 1 to 14 of 151COMMAND ===> SCROLL ===> HALF
Primary commands: ADD, ADDHELP
Line commands: S - Select D - Delete
LC Module Pseudo Description ________ ________ _________________________-------------------------------------------------------------------------------__ ACF .CA-ACF2 CA-ACF2__ ADF .TSO TSO/E__ ADR .DSS DF/DSS__ ADY .DAE DAE__ AHL .GTF Generalized Trace Fac__ AKJ .LNKLDGO Link/Edit/Go__ AMA .SPZAP Superzap__ AMB .AMBLIST AMBLIST__ AMD .SADUMP Stand-Alone Dump__ AMS .RMFSAM RMF__ ANT .SDM SDM__ AOM .AOM AOM__ ARC .HSM DFSMShsm__ ASA .REUSE REUS
202 TriTune User Guide

Performing administrative functions
The Module column contains the module prefix for a module or group of modules beginning with this prefix that are to be included in the pseudo group.
The Pseudo column contains the name of the pseudo group to which you have assigned the module.
2 To add a new module to a pseudo group, type the ADD primary command.
3 To change an existing entry, type S next to the module that you want to modify.
4 Press Enter.
The PSEUDO Group Definition panel (Figure 98) is displayed.
Figure 98 PSEUDO Group Definition panel (modifiable)
5 In the Module pattern field, type one to eight characters of the module name to be associated with an existing or new pseudo group. For IBM modules, this name is usually three characters; for example, TSO modules begin with IKJ.
6 In the PSEUDO group field, type the name of the pseudo group to which the module is to be associated. The name entered in this field can be either a new pseudo group name or the name of an existing pseudo group.
7 (Optional) In the Description field, you can include a description of the pseudo group (25 character maximum). This description is displayed in CodeView - Pseudo Mode.
TriTune ----- PSEUDO Group Definition -----------COMMAND ===>
Module pattern ===>
PSEUDO group ===>
Description ===>
Press ENTER to save; enter END to cancel
NOTE The name for the pseudo group must not be longer than seven characters. A pseudo group name is always prefixed by a period (.). Do not type the period in this field; it is added automatically.
Chapter 6 Using additional features of TriTune 203

Performing administrative functions
Adding Help information for pseudo groups
You can add content-specific Help for a pseudo group by using the ADDHelp primary command. See “Updating content-sensitive Help” on page 205 for more information. When using the CodeView application with MODULE: OFF, the module’s activity is displayed with its specified pseudo group.
Displaying pseudo groups
Pseudo groups are displayed in the CodeView interactive analysis panel, based on the display mode selected.
Figure 99 CodeView panel in PSEUDO mode
Mode name Description
PSEUDO mode: Activity is displayed by pseudo group (Figure 99)
Use the MOde PSEudo primary command. Pseudo descriptions are displayed.
MODULE mode: Activity is displayed by module, with pseudo group information included (Figure 100 on page 205)
Module descriptions are displayed.
CSECT mode: Pseudo group information is not displayed
4GL mode: Pseudo group information is not displayed
TriTune --------------------------- CodeView ----------------- Row 1 to 6 of 6 COMMAND ===> SCROLL ===> CSR Primary commands: MOde Pseudo/Module/Csect/4GL, Profile: TUNIVP1 PSEudo, REGister, ADDHelp Options: NORMAL Mode: PSEUDO Over Group Description Actv% Wait% Totl% Visual Lap% ________ _________________________ _____ _____ _____ __________ _____ >------------------------------------------------------------------------------ .COBOL COBOL Routine 45.67 7.00 52.67 =========> 0.00 .TriTune TriTune services 32.23 5.34 37.57 ======> 0.00 .EUSER In extended user space 1.29 0.37 1.66 0.00 .DATAMGT Data Management 0.18 1.10 1.29 0.00 .LE Language Environment 0.00 6.45 6.45 0.00 .APPL Application address space 0.00 0.37 0.37 0.00 ********************************* End of Table ********************************
204 TriTune User Guide

Performing administrative functions
Figure 100 CodeView panel in MODULE mode
Updating content-sensitive Help
TriTune features content-sensitive, online Help information for CSECTs, pseudo groups, and delay categories. To display this information, place the cursor on a highlighted field and press PF1. You can add to the Help topics provided by TriTune by writing your own help for any topic to customize the information to your site.
There are two components for content-sensitive Help information:
TriTune --------------------------- CodeView ----------------- Row 1 to 7 of 7 COMMAND ===> SCROLL ===> CSR Primary commands: MOde Pseudo/Module/Csect/4GL, Profile: TUNIVP1 PSEudo, REGister, ADDHelp Options: NORMAL Mode: MODULE Line commands: A - Associate D - Delays S - Distribution N - Long Name I - Info LC Group Module Description Actv% Wait% Totl% Visual ________ ________ _________________________ _____ _____ _____ __________ >------------------------------------------------------------------------------__ .COBOL IGZCPAC Cobol 45.67 6.81 52.49 =========> __ .TriTune TUNCOB01 Cobol test program distri 32.23 5.34 37.57 ======> __ .EUSER .EUSER In extended user space 1.29 0.37 1.66 __ .DATAMGT IGG019AR QSAM put next buffer 0.18 1.10 1.29 __ .APPL BCSMSSM0 Application address space 0.00 0.37 0.37 __ .COBOL IGZEQOC Cobol 0.00 0.18 0.18 __ .LE CEEBINIT Batch initialization/term 0.00 6.45 6.45 ********************************* End of Table ********************************
Component Description
Entry identifies the Help information by Content, Content Type, Help Member, Help Topic, and Info Level
This information is displayed in the Content Sensitive Help panel.
Text is the actual Help information displayed when content-sensitive Help is requested.
Help text is located in a Help member. Each Help member can contain several Help topics. Help members are located in the hilevel.STRHELP data set for your site.
Chapter 6 Using additional features of TriTune 205

Performing administrative functions
To display content-sensitive Help, select Option 3 from the Administration Option Menu. The Content-sensitive Help panel (Figure 101) is displayed:
Figure 101 Content-sensitive Help panel
Table 56 describes the available line commands.
TriTune ----------------- Content-sensitive Help ---------- Row 1 to 12 of 298COMMAND ===> SCROLL ===> CSR Primary commands: ADD Line commands: CE - Copy entry DE - Delete entry UE - Update entry BT - Browse help text ET - Edit help text LC Field Specific Contents Type Help Help I S LAST Member Topic L L USER ________________________________ ________ ________ ________ _ _ ________ >------------------------------------------------------------------------------__ ACCEPT COBVERB TUCCBLNG ACCEPT 3 D TRITUNE __ ADD COBVERB TUCCBLNG ADD 3 D TRITUNE __ ALTER COBVERB TUCCBLNG ALTER 3 D TRITUNE __ CALL COBVERB TUCCBLNG CALL 3 D TRITUNE __ CANCEL COBVERB TUCCBLNG CANCEL 3 D TRITUNE __ CLOSE COBVERB TUCCBLNG CLOSE 3 D TRITUNE __ COMPUTE COBVERB TUCCBLNG COMPUTE 3 D TRITUNE __ CONTINUE COBVERB TUCCBLNG CONTINUE 3 D TRITUNE __ DELETE COBVERB TUCCBLNG DELETE 3 D TRITUNE __ DISPLAY COBVERB TUCCBLNG DISPLAY 3 D TRITUNE __ DIVIDE COBVERB TUCCBLNG DIVIDE 3 D TRITUNE __ ENTRY COBVERB TUCCBLNG ENTRY 3 D TRITUNE
Table 56 Content-sensitive Help line commands
Command Description
CE - Copy entry displays the Content Help Copy panel, which allows you to copy the selected table entry and Help text
DE - Delete entry removes a user-created Help topic
This line command is not valid if the SL field contains the value D.
UE - Update entry displays the Content Help Update panel
Use this panel to change information for an existing entry. You can change the information level, the Help member, or the Help topic, and edit the Help text. This line command is not valid if the SL field contains the value D.
BT - Browse help text
displays a pop-up panel with the Help text for the topic
Use this panel to verify that the Help text is formatted correctly.
ET - Edit help text displays the Help member in edit mode
See “Writing content-sensitive Help text” on page 211 for information about typing Help text. This line command is not valid if the SL field contains the value D.
206 TriTune User Guide

Performing administrative functions
Table 57 describes each field in the Content-sensitive Help panel.
In Figure 102 on page 208, the Help text is shown for the Attach SVC minor delay category. The text is located in hilevel.STRHELP member TUCMALOD under the topic ATTACHSV. The type of Help is MINDELAY.
Table 57 Content-sensitive Help panel fields
Field Description
Field Specific Contents
contents of the field for which the Help topic was written
Type category for the Help information; valid types are
■ CSECT: load module CSECTs■ DB2PLAN: DB2 plan names■ DB2TYPE: DB2 calls■ MAJDELAY: major delay descriptions■ MINDELAY: minor delay descriptions■ MODULE: load module names■ TRANCODE: CICS/IMS transaction names
Help Member member name of the hilevel.STRHELP data set in which the text for the topic is found
Help Topic one- to eight-character identifier for the Help information
The Help Topic is a subtopic of the Help Member.
I L information level of the Help information
This value indicates the importance or severity of the information and defines the highlight color of the field content:
■ Info level 1 (red) indicates a known cause of problems■ Info level 2 (yellow) indicates a potential cause of problems■ Info level 3 (white) indicates informational content.
S L source level of the available Help:
■ U indicates user-written Help information that is provided by your site■ D indicates distributed Help information that is provided by AQM Solutions
Last User user ID of the last person to update the Help topic
For distributed Help information, the user ID is TRITUNE.
Date date that the Help was last updated
Time time that the Help was last updated
Chapter 6 Using additional features of TriTune 207

Performing administrative functions
Figure 102 Content-sensitive Help text
TriTune Attach SVC More: +Command ===> Scroll ===> PAGE------------------------------------------------- Create a new unit of work in the system and start that unit of work. The Attach SVC will perform thefollowing functions: o Create the task management control blocks o Determine if the module is in memory o Locate the module in the specified library o Allocate storage for the module o Read the module into storage and relocate addresses o Build and update control blocks to track the module o Place the new unit of work on the MVS/ESA dispatcher queues. TriTune TIP: Use the A - Address line command to determine which programs were waiting for the Attach SVC. If Detail data is available, you can view the names of the modules that were attached that caused the delay.
208 TriTune User Guide

Performing administrative functions
Adding content-sensitive Help
You can add Help information for a specific content either from the Content-sensitive Help panel (Figure 101 on page 206) or from the DelayView, CodeView, Histogram, or DataView interactive analysis panels (see Chapter 5, “Analyzing monitor data”).
1 On the COMMAND line, type ADD.
The Content Help Addition panel is displayed (Figure 103).
Figure 103 Content Help Addition panel
2 Specify the following values in the fields:
3 When the panel is completed, press Enter.
.--------------------------------------------------------. | TriTune ------- Content Help Addition --------------- | | COMMAND ===> | | | | Content ===> | | Content Type ===> | | Help Member ===> | | Help Topic ===> | | Info Level ===> 3 (1, 2, or 3) | | | | Edit after Add ===> YES (Yes or No) | | | | Press ENTER to add; press PF3 or enter | | CANCEL to exit without adding. | '--------------------------------------------------------'
Field name Description
Content Specify the content for which the Help topic is to be written; for example, if you are writing Help for the IGZXCDI CSECT, type IGZXCDI in this field
Content Type Specify the type of content; for example, if you are providing Help for Data Delay (a major category), type MAJDELAY in this field
Help Member Specify the eight-character name of the hilevel.STRHELP member into which this Help topic will be written
You can have several Help topics in one Help member.
Help Topic Specify the eight-character name of the subtopic in the Help member
Typically, this name is the same or similar to the name of the content.
Info Level Specify 1 (red), 2 (yellow), or 3 (white)
Edit after Add Specify YES to display an edit session for the Help topic; specify NO to create the new Help topic without adding Help text at this time
Chapter 6 Using additional features of TriTune 209

Performing administrative functions
4 If you specified YES in the Edit after Add field, type the information that you want displayed when a user is seeking information about the specific content.
You can use text only, or you can use a set of control characters to format the text. See “Writing content-sensitive Help text” on page 211 for more information.
5 When you have completed writing the Help text, press End to return to the Content-sensitive Help panel.
Copying a content-sensitive Help entry
To change a distributed Help entry and text, you must first make a copy of the information. You cannot edit distributed Help topics directly.
1 Type CE next to the Help topic that you want to copy and press Enter.
The Content Help Addition panel is displayed with the current information for the topic.
2 Change Help Member to a new name.
The new name must be a valid PDS or PDSE name, and cannot begin with the letters TUC.
3 In the Edit after Add field, specify YES if you want to edit the Help topic text.
Refer to “Editing content-sensitive Help text” on page 211.
4 When you have finished, press End to return to the Content-sensitive Help panel.
The edited Help topic will appear on the Content-sensitive Help panel with the Source Level field set to U. The original entry remains unchanged. When you display content-sensitive Help information, the user-level text is displayed.
Updating a content-sensitive Help entry
1 Type UE next to the Help topic that you want to update and press Enter.
The Content Help Addition panel is displayed with the current information for the topic.
2 Change the information as required. Specify YES in the Edit after Add field to edit the Help text.
3 When you have finished, press End to return to the Content-sensitive Help panel.
210 TriTune User Guide

Performing administrative functions
Editing content-sensitive Help text
1 Type ET next to the existing topic on the Content-sensitive Help panel and press Enter.
The member is displayed in ISPF edit mode.
2 Using ISPF edit, edit the text as required.
You can use text only, or you can use a set of control characters to format the text.
3 When you have finished editing the Help text, press End to return to the Content-sensitive Help panel.
Writing content-sensitive Help text
Before you begin writing Help, you need to understand the following features of the Help processor:
■ An :H1 tag is added automatically to the selected member of hilevel.STRHELP. This tag has an associated ID= attribute. The ID= attribute contains the Help topic member and the name of the content. You must not change this ID= attribute or TriTune will not be able to locate the Help text.
■ A :p. tag is added automatically to the line after the :H1 tag. This tag acts as a separator between the header and the Help text.
■ Type your Help text below the :p. tag. See Table 58 on page 212 for information about using markup tags to format your text.
■ When you are finished writing the Help for the topic, press End to return to the Content-sensitive Help panel.
NOTE TriTune automatically adds one space between each continuous word or character string, regardless of the actual number of spaces or line breaks. If you need to display text exactly as typed, use the example tag, :xmp.
Chapter 6 Using additional features of TriTune 211

Performing administrative functions
Figure 104 Editing Help text
Table 58 lists the tags that are available for writing content-sensitive Help.
Command ===> Scroll ===>****** ***************************** Top of Data *******************=NOTE= **********************************************************=NOTE= * Please do not change the :H1 tag line. It is required=NOTE= * for proper help processing.=NOTE= **********************************************************000001 :H1 id=ABCDE.ABCDE000002 :p.
''''''''''''
Table 58 Tags available for writing content-sensitive Help
Tag Description
:H1 creates a heading and is followed by an ID= attribute, which is automatically filled in with the same value that is specified in the Topic field of the Content-sensitive Help panel
Do not change this value. TriTune relies on this value to find the correct Help text.
This value is followed by a period, followed by the title that is to appear in the Help panel. The value that you specify in the Content field of the Content-sensitive Help panel is used automatically as the title. To change the title, overtype this value.
:p. creates a blank line between paragraphs
:dl. creates a definition list and must also be used with the :dt. (topic) and :dd. (description) tags and followed with the :edl. (end definition list) tag
:ul. creates a bulleted list and must also be used with :li. (list item) tags and must be followed by the :eul. (end unordered list) tag
:hp1. highlights text following the tag and must be followed with the :ehp1. tag after the text that you want highlighted
:xmp. creates text that shows an example and must be followed by the :exmp. tag following the example text
Text is displayed exactly as typed, including spaces.
:note. creates a note and must be followed by the :enote. tag.
:suggest. creates a suggestion and the text within is highlighted in yellow
The suggestion text must be followed by the :esuggest. tag.
:hottip. creates a tip where the TriTune Tip heading is highlighted in yellow, the text is highlighted in white and must be followed with a :ehottip. tag.
:warning. creates a warning where the text is highlighted in red and the warning text must be followed by the :ewarning. tag
212 TriTune User Guide
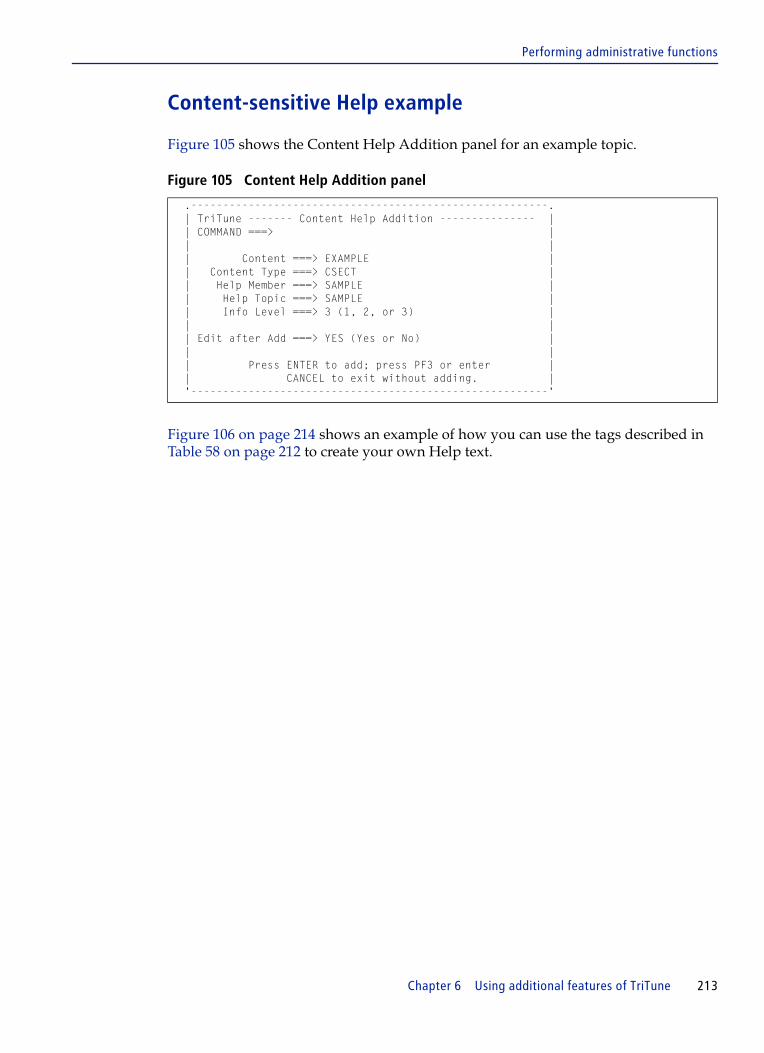
Performing administrative functions
Content-sensitive Help example
Figure 105 shows the Content Help Addition panel for an example topic.
Figure 105 Content Help Addition panel
Figure 106 on page 214 shows an example of how you can use the tags described in Table 58 on page 212 to create your own Help text.
.--------------------------------------------------------. | TriTune ------- Content Help Addition --------------- | | COMMAND ===> | | | | Content ===> EXAMPLE | | Content Type ===> CSECT | | Help Member ===> SAMPLE | | Help Topic ===> SAMPLE | | Info Level ===> 3 (1, 2, or 3) | | | | Edit after Add ===> YES (Yes or No) | | | | Press ENTER to add; press PF3 or enter | | CANCEL to exit without adding. | '--------------------------------------------------------'
Chapter 6 Using additional features of TriTune 213

Performing administrative functions
Figure 106 Using Tags to Format Help Text
Figure 107 on page 215 shows the Help text as it is displayed on the screen.
:H1 id=SAMPLE.EXAMPLE:p.Here is an example of how you use the tags to write help text.We'll start with a definition list::p.:dl.:dt.Term1:dd.Explanation1:dt.Term2:dd.Explanation2:edl.:p.Next we'll create a bulleted list::ul.:li.Item1:li.Item2:eul.:p.:xmp. This is an example. It appears e x actly as typed.:exmp.:p.:note.Here is an example of a note. The word :hp1.note:ehp1. ishighlighted.:enote.:p.:suggest.This is a suggestion. It is displayed in yellow.:esuggest.:p.:hottip.This is a tip. It includes useful information.:ehottip.:p.:warning.This is a warning. It is displayed in red.:ewarning.
214 TriTune User Guide
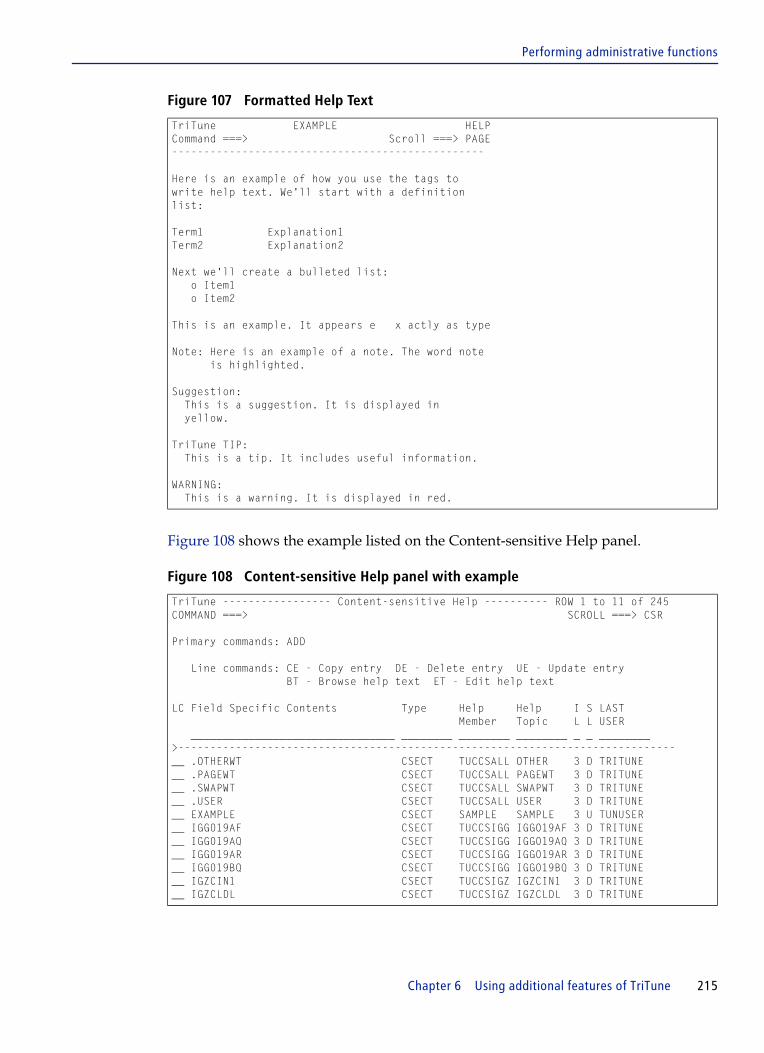
Performing administrative functions
Figure 107 Formatted Help Text
Figure 108 shows the example listed on the Content-sensitive Help panel.
Figure 108 Content-sensitive Help panel with example
TriTune EXAMPLE HELPCommand ===> Scroll ===> PAGE------------------------------------------------- Here is an example of how you use the tags to write help text. We'll start with a definition list: Term1 Explanation1 Term2 Explanation2 Next we'll create a bulleted list: o Item1 o Item2 This is an example. It appears e x actly as type Note: Here is an example of a note. The word note is highlighted. Suggestion: This is a suggestion. It is displayed in yellow. TriTune TIP: This is a tip. It includes useful information. WARNING: This is a warning. It is displayed in red.
TriTune ----------------- Content-sensitive Help ---------- ROW 1 to 11 of 245 COMMAND ===> SCROLL ===> CSR Primary commands: ADD Line commands: CE - Copy entry DE - Delete entry UE - Update entry BT - Browse help text ET - Edit help text LC Field Specific Contents Type Help Help I S LAST Member Topic L L USER ________________________________ ________ ________ ________ _ _ ________ >------------------------------------------------------------------------------__ .OTHERWT CSECT TUCCSALL OTHER 3 D TRITUNE __ .PAGEWT CSECT TUCCSALL PAGEWT 3 D TRITUNE __ .SWAPWT CSECT TUCCSALL SWAPWT 3 D TRITUNE __ .USER CSECT TUCCSALL USER 3 D TRITUNE __ EXAMPLE CSECT SAMPLE SAMPLE 3 U TUNUSER __ IGG019AF CSECT TUCCSIGG IGG019AF 3 D TRITUNE __ IGG019AQ CSECT TUCCSIGG IGG019AQ 3 D TRITUNE __ IGG019AR CSECT TUCCSIGG IGG019AR 3 D TRITUNE __ IGG019BQ CSECT TUCCSIGG IGG019BQ 3 D TRITUNE __ IGZCIN1 CSECT TUCCSIGZ IGZCIN1 3 D TRITUNE __ IGZCLDL CSECT TUCCSIGZ IGZCLDL 3 D TRITUNE
Chapter 6 Using additional features of TriTune 215

Performing administrative functions
Displaying TriTune and environmental information
The TriTune Environment panel displays TriTune and environmental information that should be examined with the assistance of Customer Support personnel. It contains information such as the maintenance level, storage blocks, and the z/OS environments in which the server and client are running. Figure 109 shows an example of the panel.
To display the TriTune Environment panel, select Option I from the Administration Options Menu.
Figure 109 TriTune Environment panel
TriTune --------------------- TriTune Environment ----------------------------COMMAND ===> More: +TriTune InformationServer ID : SPTRITUN Job Name : SPTRITUNStatus : ACTIVE JES Job ID : STC04339Server Release : 4.4.00 ASID : 189 (00BClient PTF Level : BASE40Server GIF nane : TRITUNE.V40.GIFClient GIF name : TRITUNE.V40.GIF
MVS InformationMVS system name . . . : SJSESMFID . . . . . . . . : SJSEMVS . . . . . . . . . : SP7.0.7MVS FMID . . . . . . . : HBB7720OS/390 release . . . . : Z/OS 01.07.00CPU . . . . . . . . . : 2094-00CPU serial number . . : 1622EA
TSO and ISPF InformationTSOE . . . . . . . . . : 3.06.0ISPF (internal number) : 5.7OS/390 ISPF component : ISPF FOR Z/OS 01.07.00
Misc. Component InformationRACF . . . . . . . . . : 7.72.0DFHSM. . . . . . . . . : 0.3..0Primary JES ID . . . . : JES2Primary JES Release . : Z/OS 1.7
SMS InformationDFSMS . . . . . . . . . 1.7.0Subsystem ID . . . . . : SMS
TriTune Internal InformationPSX Address : 04B6F140 SVC 42 ICB : 00F92D80PSD Address : 00020000 SVC 42 ICB STATUS : -ACTIVE-OMB Address : 7E770000 SVC 42 Owning Server : SPTRITUNMon DS Prefix : SVC 42 ICB Intercept : 84BDF190ASCB Address : 00F90100 SVC 42 Old Address : 84DD78A0 SVC 42 Jobsteps : 125 SVC 42 Matches : 1
216 TriTune User Guide

Performing administrative functions
Table 59 lists the TriTune specific information on this panel.
Table 59 TriTune Information on the TriTune Environment panel
Field Description
Server ID alphanumeric identifier for the TriTune Server Space
Status status of the TriTune Server Space; possible values are
■ Active■ Inactive
Server Release release level of the TriTune Server Space
Server GIF name data set name of the Global Information File for the TriTune Server Space
Client GIF name data set name of the Global Information File for the TriTune TSO Client
Job Name z/OS job name of the TriTune Server Space
JES Job ID job number assigned by the Job Entry Subsystem (JES)
ASID number for the address space that is associated with the job
Client PTF level latest PTF level of the TriTune TSO Client
Chapter 6 Using additional features of TriTune 217

Registering source program listings
Registering source program listings By registering source program listings, you allow TriTune to relate program activity to high-level language statements, instead of only CSECT offsets. When you register a program, you are requesting a TriTune routine to read the listing of the compiled program and create a table, which is used during interactive analysis.
You can register a program online with the TriTune TSO Client, or offline by using the sample TriTune batch registration procedure hilevel.TNBATREG. You set up the batch registration procedure during installation by using the product customization facility.
When registering a program online through the TSO Client, you can choose to register the listings locally or globally. A listing that is registered locally is available only to the TriTune TSO Client that performed the program registration; a listing that is registered globally is available to all TriTune users. If a listing is registered both locally and globally, TriTune selects one, based on the following rules:
■ If the monitor you are analyzing is a global monitor, TriTune looks for a global registration. If one is not found, TriTune issues a message.
■ If the monitor you are analyzing is local to the TSO Client, TriTune looks for a local registration. If a local registration is not found, TriTune looks for a global registration for that program. If no registration is found, TriTune issues a message.
You can register program listings for Assembler, COBOL, PL/1, NATURAL, Fortran, IBM C/C++, and SAS C. There are two steps for registering program listings:
■ compiling the program■ registering the listings
Compiling the program
Compile the program with specific options, as shown in Table 60 on page 219. If you make changes to the program, you must recompile and reregister the program to maintain accuracy.
NOTE The compilation step that produces the input to the registration routine must be the same as the compilation step that produces the object code seen by the TriTune measurement routines. If the compilation steps are not the same, the statement numbers that are identified by the TriTune analysis routines could be incorrect.
218 TriTune User Guide

Registering source program listings
Listing managers
TriTune supports listings stored in
■ IBM PDS and PDS/Es ■ DDIO by Compuware■ Computer Associates Librarian ■ Panvalet files■ Serena ChangeMan■ CA-Endevor
Table 60 Compiler options required for program registration
Compiler Levels supported Required options
Assembler VS, F, G, H LISTESD
PRINT GEN
AD/Cycle 1.2 and later LIST
COBOL VS, ANSI versions 2, 3, 4 SOURCEPMAPVERB
COBOL VS COBOL IICOBOL for z/OS and VM
SOURCE SOURCENOLIST OR LISTOFFSET NOOFFSETNONUMBER
CA-OPT 5.3CA-OPTII 1.1
SOURCENOCLISTPMAP
PL/1 Enterprise 3.2.0Visual Age 2.3.0
OBJECT OBJECTLIST OR LISTSOURCE SOURCENOSTMT STMT MACRO OPTIONS
Fortran 2.2.0 and later XREFLISTMAP
IBM C/C++ MVS/ESA: 3.2 and later
OS/390: 1.1 and later
LIST
SAS C 5.0 and later OMD
NATURAL 3.1 and later n/a
Chapter 6 Using additional features of TriTune 219

Registering source program listings
If your listings are stored in DDIO format, you must use the DDIO Enhanced Listing format for registration and list the program with the following DDIO options:
Registering IBM C/C++ listings with language environment support
IBM C/C++ support is implemented in a similar manner to the other compilers. One notable exception is the need to enter the name of the load module that reflects the IBM C/C++ listing. Unlike non-Language Environment compiler support where a listing is related to a CSECT, Language Environment (LE) support relates a listing to a load module, not a CSECT. Depending on your site's data set naming standards, the load module name might not match the listing member name. During registration, a small pop-up panel appears, asking you to specify the load module name.
When analyzing an IBM C/C++ program with LE, TriTune automatically detects that the listing is registered to the load module, instead of the CSECT, and makes the proper adjustments to the analysis reports. During analysis, no intervention is required on your part.
Registering the listing
1 Select one of the following menu options:
■ Option 3 from the Primary Option Menu■ Option 5 from the Administration Option Menu (for global registrations)■ Option 3 from the Global Monitoring Menu (for global registrations)
COBOL (OUTPUT(PRINT))COBOL (OUTPUT (NODDIO))PROCESSOR (OUTPUT(DDIO))PROCESSOR (TEXT(ALL))DDIO (OU(NOLI, NOPM, NOOF, NOCL, NOXR, NODM, FIND, CO))
TIP If you recompile a program, you must reregister it with TriTune to maintain accurate statement information.
NOTE When you register a listing from the Histogram panel, the pop-up panel does not appear because TriTune automatically assigns the load module name from the Histogram report to the listing for you.
220 TriTune User Guide

Registering source program listings
The Program Listing Registration panel (Figure 110) is displayed.
Figure 110 Program Listing Registration panel
Registering the module
The output listing from the final link-edit of the load module needs to be registered in order to successfully register CSECT listings. The MAP option must be used to obtain a map of generated CSECT names.
1 Select the Registration option.
2 Select option C1 - IBM/C from the Program Listing Registration menu.
The Registered Listings: IBM/C panel is displayed.
3 Issue the MODule primary command.
The Registered Listings: Modules panel is displayed.
4 Issue the ADD primary command.
5 Specify the data set information for the Link-edit output listing.
6 If the module listing is in a PDS, a list of members is displayed from which you can select the correct member.
7 Press Enter to register the listing.
TriTune ----------------- Program Listing Registration --------------------OPTION ===> A ASM - Assembler listings C COBOL - ANS and COBOL II listings F Fortran - VS Fortran listings N Natural - Software AG Natural listings P PL/I - IBM optimizing PL/I listings C1 IBM C/C++ - IBM C/C++ with Language Environment C2 SAS C/C++ - SAS C/C++ listings C3 AD/Cycle - AD/Cycle C listings Listing manager ===> PDS (PDs, DDio, ENdevor, PAnvalet, LIbrarian or CHangeman) Enter an option or press END to exit
NOTE Generated CSECT names are linked to the actual CSECT listing based on the CSECT length. If more than one CSECT has the same length, the incorrect CSECT listing might be used.
Chapter 6 Using additional features of TriTune 221

Registering source program listings
8 A message indicates whether the module has been registered successfully and you can return to the Registered Listings: IBM/C panel to register the CSECT listings that are included in the registered module normally. There are a few considerations:
■ If a CSECT cannot be found in the load module listing, the Completion field indicates this situation, and the CSECT is not registered. Verify that the correct CSECT or Module listings are being used.
■ If a data set contains multiple CSECT listings, or if multiple listing members are processed (using the 'REGister All' command), each listing is registered by using the same module.
■ A new command has been added to the 'Member List' panel. Use the REGister all command to register all members that are displayed on the panel.
■ For Language Environment C++ listings, all CSECTs will be registered by using the same module. You will only need to specify the module name.
9 To select the language of the program that you want to register, type the code in the Option field.
10 To select the listing manager that you want to register, type the first two letters of the manager. The listing manager indicates where the listings reside.
■ PDs - Listings are stored in PDSs or PDSEs.
■ DDio - Program listings are stored in the Compuware Common Services DDIO file. You must know the name of the listing and the DDIO file in which it resides before you can register the program.
■ ENdevor - Program listings are stored and managed by CA-Endevor. You must know which member and library the program listing is in before it can be registered.
■ PAnvalet - Program listings are stored and managed by CA-Panvalet. You must know which member and library the program listing is in before it can be registered.
■ LIbrarian - Program listings are stored and managed by CA-Librarian. You must know which member and library the program listing is in before it can be registered.
NOTE Only COBOL listings can be registered from DDIO files.
222 TriTune User Guide

Registering source program listings
■ CHangeman - Program Listings are stored and managed by Serena Changeman. You must know the Changeman Link Library where the SERCOPY program is located (default: 'serena.CHGMAN.LINKLIB', where serena is the high-level qualifier), the listing data sets, and member name where the program listings are stored.
Depending on the language you select and the listing manager, a panel showing all COBOL, Assembler, PL/1, Fortran, IBM C/C++, NATURAL, or SAS C programs that are currently registered with TriTune is displayed. From this panel, you can either add new listings or delete old listings. If you add a listing that already exists, the new listing replaces the existing listing.
11 Press Enter to register the listings. A message indicates when the registration is complete.
Chapter 6 Using additional features of TriTune 223
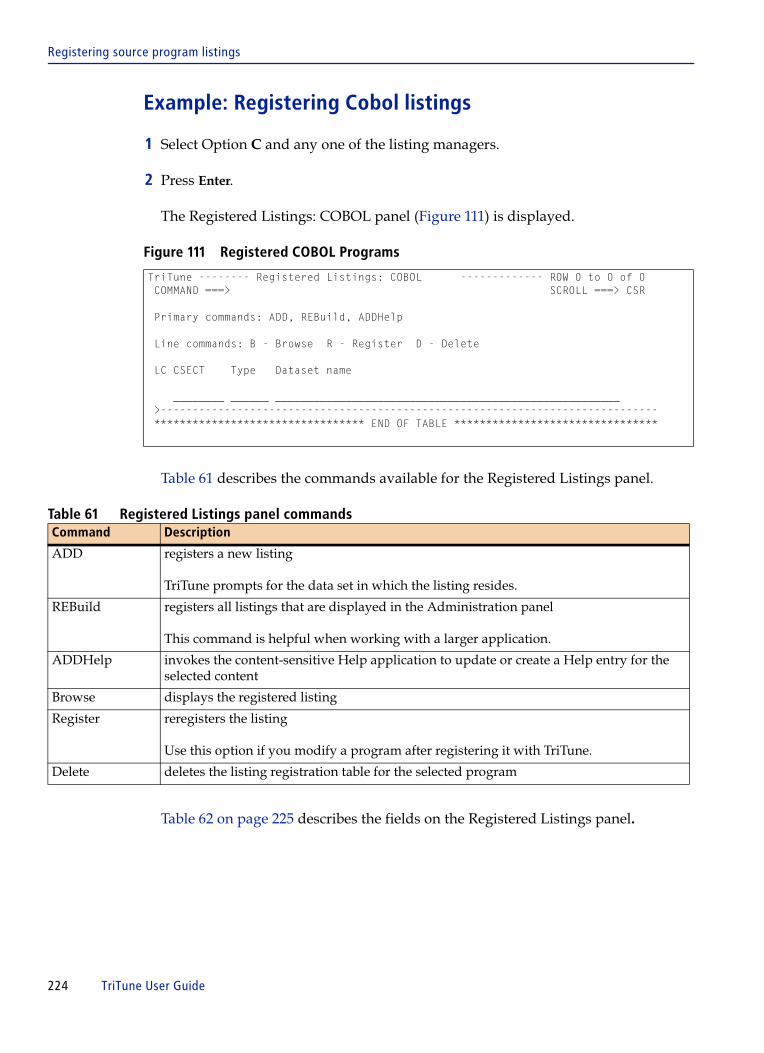
Registering source program listings
Example: Registering Cobol listings
1 Select Option C and any one of the listing managers.
2 Press Enter.
The Registered Listings: COBOL panel (Figure 111) is displayed.
Figure 111 Registered COBOL Programs
Table 61 describes the commands available for the Registered Listings panel.
Table 61 Registered Listings panel commands
Table 62 on page 225 describes the fields on the Registered Listings panel.
TriTune -------- Registered Listings: COBOL ------------- ROW 0 to 0 of 0 COMMAND ===> SCROLL ===> CSR
Primary commands: ADD, REBuild, ADDHelp
Line commands: B - Browse R - Register D - Delete
LC CSECT Type Dataset name
________ ______ ______________________________________________________ >------------------------------------------------------------------------------ ********************************* END OF TABLE ********************************
Command Description
ADD registers a new listing
TriTune prompts for the data set in which the listing resides.
REBuild registers all listings that are displayed in the Administration panel
This command is helpful when working with a larger application.
ADDHelp invokes the content-sensitive Help application to update or create a Help entry for the selected content
Browse displays the registered listing
Register reregisters the listing
Use this option if you modify a program after registering it with TriTune.
Delete deletes the listing registration table for the selected program
224 TriTune User Guide
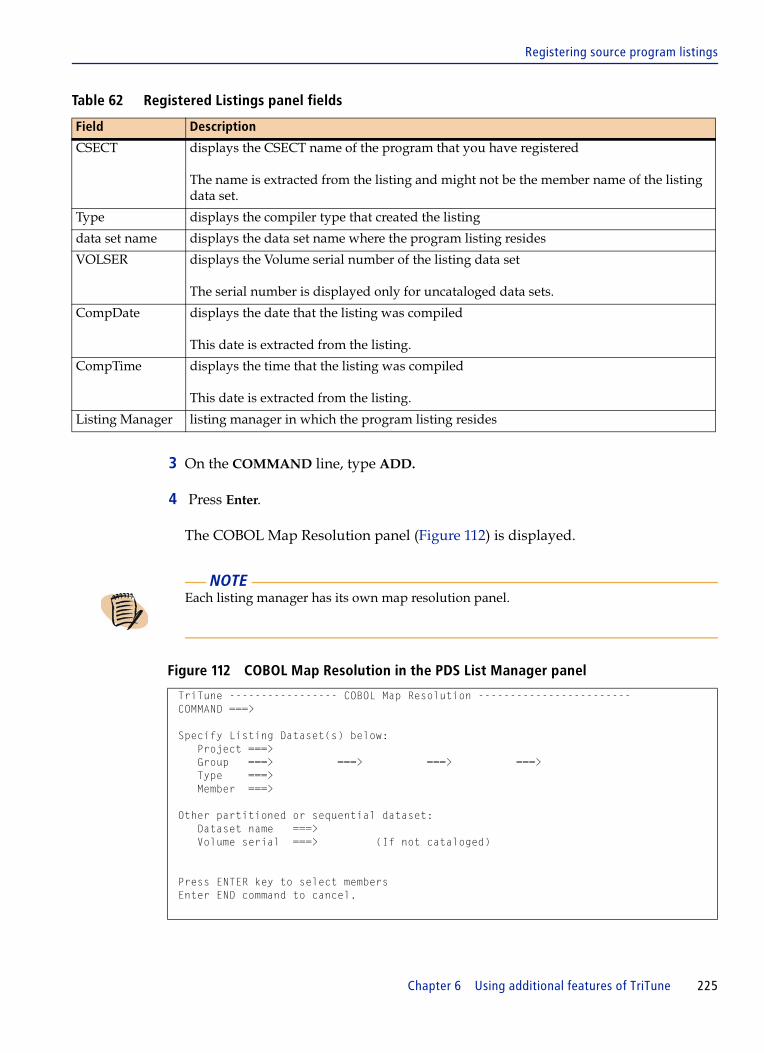
Registering source program listings
Table 62 Registered Listings panel fields
3 On the COMMAND line, type ADD.
4 Press Enter.
The COBOL Map Resolution panel (Figure 112) is displayed.
Figure 112 COBOL Map Resolution in the PDS List Manager panel
Field Description
CSECT displays the CSECT name of the program that you have registered
The name is extracted from the listing and might not be the member name of the listing data set.
Type displays the compiler type that created the listing
data set name displays the data set name where the program listing resides
VOLSER displays the Volume serial number of the listing data set
The serial number is displayed only for uncataloged data sets.
CompDate displays the date that the listing was compiled
This date is extracted from the listing.
CompTime displays the time that the listing was compiled
This date is extracted from the listing.
Listing Manager listing manager in which the program listing resides
NOTE Each listing manager has its own map resolution panel.
TriTune ----------------- COBOL Map Resolution ------------------------ COMMAND ===>
Specify Listing Dataset(s) below: Project ===> Group ===> ===> ===> ===> Type ===> Member ===>
Other partitioned or sequential dataset: Dataset name ===> Volume serial ===> (If not cataloged)
Press ENTER key to select members Enter END command to cancel.
Chapter 6 Using additional features of TriTune 225
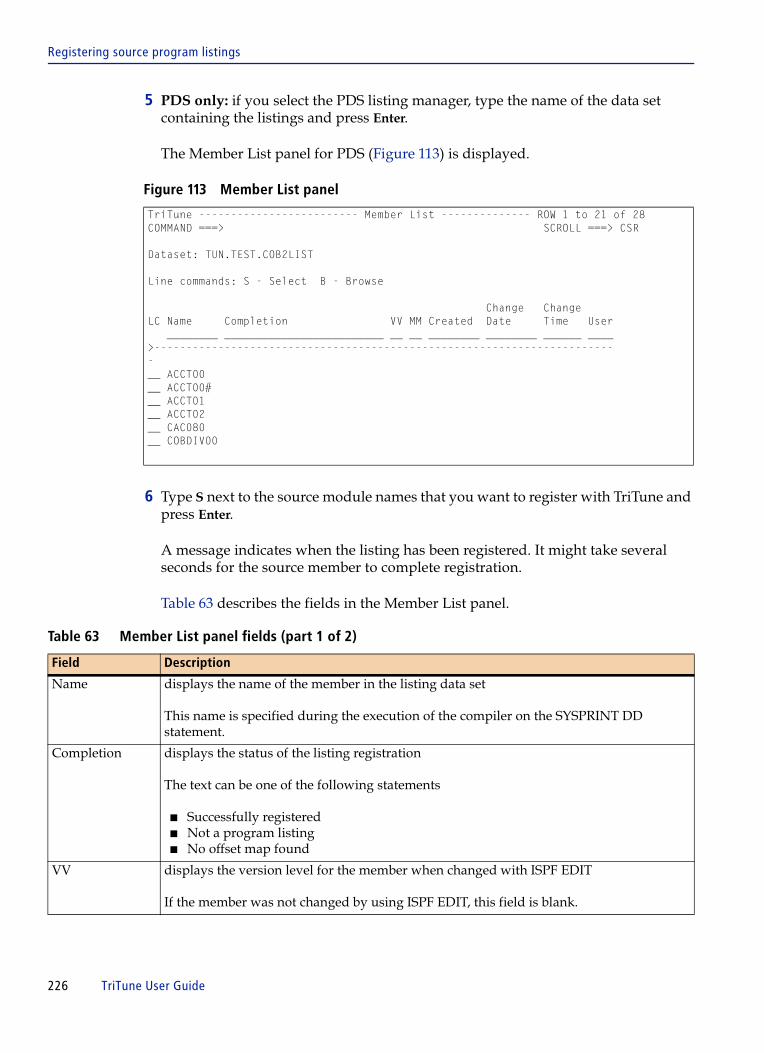
Registering source program listings
5 PDS only: if you select the PDS listing manager, type the name of the data set containing the listings and press Enter.
The Member List panel for PDS (Figure 113) is displayed.
Figure 113 Member List panel
6 Type S next to the source module names that you want to register with TriTune and press Enter.
A message indicates when the listing has been registered. It might take several seconds for the source member to complete registration.
Table 63 describes the fields in the Member List panel.
TriTune ------------------------- Member List -------------- ROW 1 to 21 of 28COMMAND ===> SCROLL ===> CSR
Dataset: TUN.TEST.COB2LIST
Line commands: S - Select B - Browse
Change ChangeLC Name Completion VV MM Created Date Time User ________ _________________________ __ __ ________ ________ ______ ____>-------------------------------------------------------------------------__ ACCT00__ ACCT00#__ ACCT01__ ACCT02__ CAC080__ COBDIV00
Table 63 Member List panel fields (part 1 of 2)
Field Description
Name displays the name of the member in the listing data set
This name is specified during the execution of the compiler on the SYSPRINT DD statement.
Completion displays the status of the listing registration
The text can be one of the following statements
■ Successfully registered■ Not a program listing■ No offset map found
VV displays the version level for the member when changed with ISPF EDIT
If the member was not changed by using ISPF EDIT, this field is blank.
226 TriTune User Guide

Registering source program listings
7 DDIO, Panvalet, Librarian, CA-Endevor, or ChangeMan: If you select Option C and the DDIO, Panvalet, Endevor, Librarian or ChangeMan listing manager, a COBOL Map Resolution panel similar to the following example (Figure 114 on page 228) is displayed. Specify the data set that contains the program listing and press Enter. It might take several seconds for the source member to complete registration.
MM displays the modification level for the member when changed with ISPF EDIT
If the member was not changed by using ISPF EDIT, this field is blank.
Created displays the time this member was created by using ISPF EDIT
If the member was not created by using ISPF, this field is blank.
Change Date displays the date the member was last modified or created by using ISPF EDIT
If the member was not created or modified by using ISPF EDIT, this field is blank.
Change Time displays the time the member was last modified or created by using ISPF EDIT
If the member was not created or modified by using ISPF EDIT, this field is blank.
User displays the TSO user ID of the user that created or last modified this member by using ISPF EDIT
If the member was not created or modified by using ISPF EDIT, the field is blank.
Size displays the number of lines that the member currently contains
If the member was not changed by using ISPF EDIT, this field is blank.
Init displays the initial size of the member when it was created by using ISPF EDIT
If the member was not created by using ISPF EDIT, this field is blank.
Mod displays the number of lines that are marked as modified when using ISPF EDIT
If the member was not changed by using ISPF EDIT, this field is blank.
Table 63 Member List panel fields (part 2 of 2)
Field Description
Chapter 6 Using additional features of TriTune 227

Registering source program listings
Figure 114 COBOL Map Resolution in the DDIO List Manager panel
Using interactive analysis with registered programs
After you have registered a program, you can view a CSECT’s source code directly by using the Listing line command (L) on the Delay Locations, Histogram, and CodeView interactive analysis panels. TriTune also provides statement references in the Stmt field on the Delay Locations and Histogram panels. Refer to Chapter 5, “Analyzing monitor data” for more information. Several examples follow.
Figure 115 shows the statement information on the Delay Locations panel, which is displayed when you issue the Address line command (A) for a specific delay category on the DelayView panel.
Figure 115 Delay Locations showing statement number
TriTune ------------------- COBOL Map Resolution ------------------------- COMMAND ===> Specify DDIO listing data set and member below: Listing data set choice ===> (1 through 8) Member name ===> Listing data sets 1 ===> 2 ===> 3 ===> 4 ===> 5 ===> 6 ===> 7 ===> 8 ===> Press ENTER to register listing Enter END to cancel
TriTune ----------------------- Delay Locations -------------- Row 1 to 4 of 4COMMAND ===> SCROLL ===> CSR
Delay type: IO Queued Profile: TUNIVP1
Primary commands: REGister, ADDHelp
Line commands: L - Listing D - Details C - Callerid I - Info LC Module Csect Offset Csect Description Stmt D C Pct Visual ________ ________ ________ ______________________ _____ _ _ _____ __________>------------------------------------------------------------------------------__ IGG019AR IGG019AR 00000086 QSAM SYNCH PUT 162 Y 4.42 =========>
228 TriTune User Guide

Registering source program listings
Figure 116 shows the CodeView panel. Issue the Listing line command (L) to display the source code listing.
Figure 116 CodeView panel showing CSECTs with activity
Registering listings during interactive analysis
When measuring the performance of programs in online subsystems consisting of many different load modules with each module possibly containing several CSECTs, you seldom need to register every CSECT. If you find that you need CSECT information on a specific module, you can register the module by using the following Interactive Analysis panels:
■ Delay Locations (Figure 54 on page 138)■ CodeView (Figure 63 on page 146)■ Histogram (Figure 64 on page 149)■ Callerid (Figure 59 on page 143)
TriTune --------------------------- CodeView ----------------- Row 1 to 8 of 8 COMMAND ===> SCROLL ===> CSR Primary commands: MOde Pseudo/Module/Csect/4GL, Profile: TUNIVP1 PSEudo, REGister, ADDHelp Options: NORMAL Mode: CSECT Line commands: A - Associate C - Callerid D - Delays N - Long Name I - Info L - Listing S - Distribution H - Histogram NH - Normalized Histogram LC Module Csect Description L C Actv% Wait% Totl% Visual ________ ________ _________________________ _ _ _____ _____ _____ __________>------------------------------------------------------------------------------__ IGZCPAC IGZCIN1 Cobol A Y 45.67 6.81 52.49 =========>__ TUNCOB01 TUNCOB01 Cobol test program distri A Y 32.23 4.97 37.20 ======> __ .EUSER .EUSER In extended user space Y 1.29 0.37 1.66 __ IGG019AR IGG019AR QSAM put next buffer B Y 0.18 1.10 1.29 __ BCSMSSM0 BCSMSSM0 A 0.00 0.37 0.37 __ TUNCOB01 IGZEBST Cobol A 0.00 0.37 0.37 __ IGZEQOC IGZEQOC Cobol B 0.00 0.18 0.18 __ CEEBINIT CEEPMLOD Loader for OS/390 B 0.00 6.45 6.45 ********************************* End of Table ********************************
Chapter 6 Using additional features of TriTune 229

Registering source program listings
Comparing dates, sizes and compiler types
TriTune compares the dates, CSECT sizes, and compiler types of registered listings to the monitored program when the Histogram line command is entered from the CodeView panel.
If a mismatch is detected, a warning message, such as the one below, is issued:
Press PF1 to get additional information; for example:
NOTE Registered listing dates are stored in the following format: yyyy/mm/dd
Dates do not match
Dates do not match - The date of the running program, 2006/06/12, and the registered listing, 2006/06/07, do not match. This might cause misleading or inaccurate information to be displayed.
NOTE TriTune does not attempt to validate CSECT sizes for COBOL VS, CA-OPTIMIZER 5, or CA-OPTIMIZER/II.
230 TriTune User Guide

C h a p t e r 7
7 TriTune Open Application Program InterfaceThis chapter discusses the following topics:
What is the TriTune Open Application Program Interface? . . . . . . . . . . . . . . . . . . . . 232Invoking the TUNCALL program . . . . . . . . . . . . . . . . . . . . . . . . . . . . . . . . . . . . . . 232Using TUNCALL. . . . . . . . . . . . . . . . . . . . . . . . . . . . . . . . . . . . . . . . . . . . . . . . . . . . . 232Describing TUNCALL functions. . . . . . . . . . . . . . . . . . . . . . . . . . . . . . . . . . . . . . . . 232What global monitors are . . . . . . . . . . . . . . . . . . . . . . . . . . . . . . . . . . . . . . . . . . . . . . 233Describing the TUNCALL syntax . . . . . . . . . . . . . . . . . . . . . . . . . . . . . . . . . . . . . . . 233
TUNCALL verbs and keywords . . . . . . . . . . . . . . . . . . . . . . . . . . . . . . . . . . . . . . . . . . . 236MONITOR INVOKE . . . . . . . . . . . . . . . . . . . . . . . . . . . . . . . . . . . . . . . . . . . . . . . . . . 236MONITOR CANCEL . . . . . . . . . . . . . . . . . . . . . . . . . . . . . . . . . . . . . . . . . . . . . . . . . 244MONITOR STATUS. . . . . . . . . . . . . . . . . . . . . . . . . . . . . . . . . . . . . . . . . . . . . . . . . . . 245Invoking a monitor from a TSO command, CLIST, or REXX EXEC . . . . . . . . . . 246Invoking TUNCALL from a batch job . . . . . . . . . . . . . . . . . . . . . . . . . . . . . . . . . . . 246Routing message output to a file. . . . . . . . . . . . . . . . . . . . . . . . . . . . . . . . . . . . . . . . 246Invoking a monitor from within a program . . . . . . . . . . . . . . . . . . . . . . . . . . . . . . 247Return and reason codes . . . . . . . . . . . . . . . . . . . . . . . . . . . . . . . . . . . . . . . . . . . . . . 247
Chapter 7 TriTune Open Application Program Interface 231

What is the TriTune Open Application Program Interface?
What is the TriTune Open Application Program Interface?
In addition to defining and invoking monitor sessions online with the TriTune TSO Client, you can start a session by using the TriTune Open Application Program Interface (Open API). This feature allows you to monitor an application when conditions are most critical, including
■ when a critical performance threshold is exceeded■ when a program is executed under specific conditions■ if you are using a console automation tool■ if you are using a program change control system
Invoking the TUNCALL program
The TUNCALL program is used to define and start a monitoring session and you can invoke it different ways:
■ as a TSO command (from either REXX or CLIST EXECs)■ as a batch job■ as a called program
Using TUNCALL
The TUNCALL program is a single load module with several aliases that resides in hilevel.TRLINK. You can copy TUNCALL into your Link Pack Area (LPA) for convenient access, but remember to also copy the alias definitions as well.
Describing TUNCALL functions
TUNCALL supports several types of requests:
■ invoking new monitors (measurement sessions)■ obtaining the status of a pending or active monitor session■ canceling a pending or active monitor
232 TriTune User Guide

What is the TriTune Open Application Program Interface?
What global monitors are
When you use TUNCALL, all monitor-related actions are associated with global monitors. Just as each user has his or her own set of monitor definitions that are stored in the UIF (User Information File), monitors that are managed by TUNCALL are collected together in a GIF (Global Information File).
Because TUNCALL users might not be defined TriTune users with UIFs, TUNCALL-managed monitors are considered to be global and do not belong to any specific user. You can view the global monitors from the TriTune Primary Menu under Global Monitors.
Global Monitors are the exact same as local or user (level) monitors with two exceptions:
■ Definitions are stored in the GIF (Global Information File), not in a UIF.
■ All users have access to global monitor definitions (provided proper security access has been granted).
When using TUNCALL, remember to use the Global Monitor option from the TriTune Primary Menu to view the results of the monitor session.
Describing the TUNCALL syntax
TUNCALL syntax is similar to z/OS utilities such as IDCAMS. The basic syntax for each TUNCALL statement is as follows:
serverid, verb keyword(operand1, operand2, operand3, ...) keyword(operand1, operand2, operand3,...) keyword keyword
Chapter 7 TriTune Open Application Program Interface 233

What is the TriTune Open Application Program Interface?
Table 64 describes the TUNCALL syntax.
In addition, character strings can be specified by enclosing the string with either single (') or double quotation marks ("); however, the quotation marks must be paired. The string does not need to be quoted if it contains only alphanumeric characters. In the latter case, the string is translated automatically to uppercase characters as well.
If you provide commands to TUNCALL with the TUNIN DD-statement, the commands can be continued to the next statement with a dash (-) as the last character on the line.
Blank lines are ignored, and comment lines can begin with an asterisk (*) or be embedded with paired slashes and asterisks (/*, */).
The following example is a valid monitor request:
Table 64 TUNCALL syntax
Term Definition
serverid name of the TriTune server that is locally running on the same system where TUNCALL is executing
verb type of request
MONITOR is the only supported verb.
MONITOR: Specifies how to manage monitor requests
You must put a comma between the serverid keyword and the verb keyword. The serverid and the verb keywords are positional and the serverid must be the first word followed by the verb with a comma between the two.
Spaces are supported.
additional keywords after the verb, enter the keywords with the associated operands
Each keyword must be separated by at least one space and the operands must be enclosed in parentheses. you must separate multiple operands with a comma.
Any number of spaces can be included with the comma.
//SMON JOB 1,'TUNCALL IT',MSGCLASS=A, CLASS=A//*//TUNCALL EXEC PGM=TUNCALL//STEPLIB DD DISP=SHR,DSN=TRITUNE.V40.TRLINK//*//TUNPRINT DD SYSOUT=*//TUNIN DD * * This is a comment line /* This is another comment */TRITUNE, - MONITOR - INVOKE - JOBNAME(PROD01) /* Another comment */
234 TriTune User Guide
What is the TriTune Open Application Program Interface?
Wildcard characters
Certain keywords permit wildcard characters. These characters areas follow:
■ asterisk (*) indicates the generic end or start of a string
For example, if you select an item with ABC* all items starting with the character string ABC will match the wildcard character string. Specifying *ABC will match all items ending with ABC. Two other cases are also possible: *ABC* will match any string with the characters ABC anywhere in the string and A*C will match any string starting with A and ending with C.
■ pound (#) indicates a numeric/nonblank must reside in the position
For example, ABC### will match ABC123 but not ABC12 or ABCA12.
■ question mark (?) indicates a nonblank must reside in the position
This placeholder ensures a specific length. For example, ???? will match ABCD, as well as AB12, but will not match ABC. The content of the character position does not matter as long as it is a nonblank character.
Chapter 7 TriTune Open Application Program Interface 235

TUNCALL verbs and keywords
TUNCALL verbs and keywordsThe following sections describe keywords that can be used with the TUNCALL verb MONITOR.
MONITOR INVOKE
The INVOKE keyword specifies that a monitor request is queued to measure one or more jobs. The parameters indicate the jobs and how they will be measured.
When invoking a monitor you must specify a profile name, an address space ID, or a job name. If you specify a job name or an address space ID, a profile is created by using the address space name. If the profile already exists, it will be updated.
If you specify a profile name, the jobs to be measured are taken from that profile. Similar to invoking a monitor with the ISPF client, if no matching job is found, the monitor is queued and waits until the start of a matching job step is detected.
When invoking monitors other options help refine the job or jobs to be measured, the number of jobs to be measured, the job steps, and the duration of the measurement.
With TriTune, the address spaces can be selected on one of five different keywords:
Because some of these options can contain wildcard characters, it is possible that multiple jobs might match the criteria at the same time. If this situation occurs, TriTune will select the job with the lowest address space ID (ASID). If JOBNAME, STEPNAME, PROCSTEP, or PROGRAM are blank, none of those steps are considered when locating a matching job to measure.
Keyword Definition Notes
ASID address space ID ■ When this option is used, the other four are ignored.
■ ASID is a length of 4. for example, 0473,
JOBNAME name of the address space ■ This field can contain wildcard characters.■ Max length is 8.
STEPNAME step currently executing ■ This field can contain wildcard characters.■ Max length is 8.
PROCSTEP if there are JCL procedures involved, the current procedure step
■ This field can contain wildcard characters.■ Max length is 8.
PROGRAM name of the program at job step start
■ Normally this keyword is on the EXEC PGM=name JCL statement.
■ Max length is 8.
236 TriTune User Guide

TUNCALL verbs and keywords
Schedules can also be associated with the monitor as well but the schedule is not stored with the monitor profile. It exists only for the life of the measurement request.
Table 65 shows the list of valid keywords for MONITOR INVOKE.
Table 65 Valid keywords for MONITOR INVOKE (part 1 of 6)
Keyword Default Notes
PROFILE none ■ name of the monitor profile to be used■ if no monitor profile exists with this name, one will be created■ field cannot contain wildcard characters■ 1-8 characters in length
JOBNAME none ■ name of the address space to be measured■ if the ASID keyword is used, this keyword is ignored■ can contain wildcard characters■ 1-8 Characters in length
STEPNAME none ■ name of the job step to be measured■ if the ASID keyword is used, this keyword is ignored■ can contain wildcard characters■ 1-8 Characters in length
PROCSTEP none ■ name of the procedure-step to be measured■ if the ASID keyword is used, this keyword is ignored■ can contain wildcard characters■ 1-8 Characters in length
PROGRAM none ■ name of the program at step-initiation time to be measured■ if the ASID keyword is used, this keyword is ignored■ can contain wildcard characters■ 1-8 Characters in length
ASID none ■ absolute ASID of the job to be measured■ 4 characters in length
FROMUSER none ■ TSO User ID that will receive any messages issued on behalf of the monitor request
■ 1-8 characters in length
ELAPSTIME 60 ■ monitor duration in seconds for which the observation process is active■ normal duration is 60 seconds
Specify the duration in seconds for which the observation process is active; the default value is 60 seconds. You can also specify minutes by appending an uppercase M to the numeral: 10M. Monitor duration must be a numeric value from 1 to 999997 (16,666 minutes).
This value is used to set the observation rate based on the number of observations requested.
Specify NA to request that the monitor collect a number of samples equal to the number of Observations Requested regardless of how many observations or how much time it takes to collect that number of samples.
Chapter 7 TriTune Open Application Program Interface 237

TUNCALL verbs and keywords
SAMPLECNT 6000 ■ number of observations requested■ use this keyword with ELAPSTIME to set an initial observation rate■ defaults will cause TriTune to observe the address space every 10 minutes ■ range is 10-999999
Note: SAMPLECNT is being retained as a parameter for compatibility with other products.
DUMP no operands
■ does not require any operands■ directs TriTune to take an SVC dump when the measurement session ends■ for diagnostic purposes only
RECCNT 1 ■ number of job steps to measure■ you can start multiple measurement sessions with a single command by
specifying RECCNT greater than 1, and by using wildcard characters on one of the job selection fields
■ range is 1-9999
SUCCNT 1 ■ number of times the same job step is successively measured ■ when a measurement session ends, another starts immediately if the same
job step is executing and the SUCCNT count has not been reached■ range is 1-9999
DESCRIPTION none ■ 24-character description that can be associated with the monitor profile■ if the profile already exists, this field updates its contents
SCHEDULE none ■ name of the schedule■ 1- to 8-character field ■ for TUNCALL requests, this keyword is for documentation purposes only,
and indicates the scheduling fields are to be used and validated■ if the scheduling fields are nonblank and SCHEDULE is blank, the
scheduling fields are ignored
MSTEP NO ■ indicates that four job selection keywords (JOBNAME, STEPNAME, PROCSTEP, and PROGRAM) are to be used to select all steps within the job to be measured
■ specify YES to monitor all steps in the job that match any Step/Procstep/Program criteria specified
SMON NO ■ entire job step is to be measured■ if YES, ELAPSTIME is used as an estimate of the job step execution time to
set the initialing observation rate only
SAMPDELAY 0 ■ number of seconds TriTune delays measuring the job after the job step starts
■ this feature helps bypass measuring one-time events like housekeeping routes
■ range is 0-999
INCTASK1-4 none ■ 1 to 4 different tasks are measured within the job step■ tasks are identified by the program name provided as part of the ATTACH
macro ■ fields can contain wildcard characters■ 1 to 8 characters in length
Table 65 Valid keywords for MONITOR INVOKE (part 2 of 6)
Keyword Default Notes
238 TriTune User Guide

TUNCALL verbs and keywords
EXCTASK1-4 none ■ 1 to 4 different task names are excluded from sampling■ tasks are identified by the program name provided as part of the ATTACH
macro ■ this feature helps eliminate unwanted wait-time or active time that is not
pertinent to the measurement■ fields can contain wildcard characters■ 1 to 8 characters in length
TRAN1-4 none ■ specific CICS or IMS transactions measured ■ if the transaction is not running, no sample is taken■ fields can contain wildcard characters■ 1 to 8 characters in length
TERM1-4 none ■ specific CICS or IMS terminal measured■ if there is no activity on the specified terminal, no sample is taken■ fields can contain wildcard characters■ 1 to 8 characters in length
USERID1-4 none ■ specific CICS or IMS user IDs measured■ if the listed user IDs have no activity, no sample is taken■ 1 to 8 characters in length
TASKLIB none ■ DD statement in the measured address space from where programs are loaded
■ the libraries included in this DD statement are used to assist in CSECT-level resolution of program activity and wait time
■ 1 to 8 characters in length
MONDSN user default
■ name of the monitor data set or a monitor data set name pattern used to create a new monitor data set when the measurement starts
■ certain data set name node variables can be used to keep the name dynamic, such as &SYSTEM, &SYSDATE, or &SYSTIME
■ see Monitor Data Set Name in the TriTune Installation and Customization Guide for additional information
USEREXIT1-2 none ■ name of a user exit that TriTune calls during the measurement session■ this exit is loaded into common storage and is called for each matching TCB
in the address space for each observation made of the target job
JOBCARD1-4 none ■ if BATCHREPORTS is also indicated, these are the job cards used when TriTune submits the batch jobs to generate the batch reports at the end of a measurement session
■ 1 to 8 characters in length
MONDSTRKS 20 tracks ■ number of tracks TriTune allocates as the monitor data set's primary space allocation
MONDSSEC 20 tracks ■ number of tracks TriTune allocates as the monitor data set's secondary space allocation
MONDSGEN SYSDA ■ device generic name where the data set is allocated
MONDSVOL none ■ optional volume-serial name where the data set resides
MONDCLAS none ■ name of an SMS Data construct for the monitor data set
MONMCLAS none ■ name of an SMS Management construct for the monitor data set
MONSCLAS none ■ name of an SMS Storage construct for the monitor data set
Table 65 Valid keywords for MONITOR INVOKE (part 3 of 6)
Keyword Default Notes
Chapter 7 TriTune Open Application Program Interface 239

TUNCALL verbs and keywords
TARGSYS1-4 none ■ 1 to 4 names of matching sysplex images where the monitor request is sent ■ these fields can contain wildcard characters■ if blank, the request is sent only to the local system
BATCHREPORTS
none ■ sets TriTune to submit a batch job to generate TriTune batch reports at the end of a measurement session
REPDSN none ■ specify a data set name to receive the generated batch report ■ leave this field blank to write the report to SYSOUT■ specify.MONDSN to use the data set name of the monitor file ■ a .BAT node will be appended to the monitor file name to create the file
name■ some truncation may occur if the resulting name is longer than 44
characters■ if the data set is not found, it will be created
REPPTRKS 20 tracks ■ number of tracks TriTune allocates as the report data set's primary space allocation
REPSTRKS 20 tracks ■ number of tracks TriTune allocates as the report data set's secondary space allocation
REPUNIT SYSDA
none ■ device generic name where the report data set is to be allocated
REPVOL none ■ optional volume-serial name where the report data set resides
REPDATA none ■ name of an SMS Data construct for the report data set
REPMGMT none ■ name of an SMS Management construct for the report data set
REPSTOR none ■ name of an SMS Storage construct name for the report data set
Scheduling Fields
STARTDATE none ■ starting date for the schedule■ must be in CCYY/MM/DD format
ENDDATE none ■ ending date of the schedule■ must be in the format of CCYY/MM/DD■ mutually exclusive with DAYS
DAYS 1 ■ number of days the schedule is active■ if the monitor session is still waiting at the end of the schedule, it is
automatically terminated■ range 1-999
WEEKDAYS no operands permitted
■ schedule checks only for days that are part of weekdays■ mutually exclusive with SPECIFICDAYS
WEEKENDS no operands permitted
■ schedule checks only for days that are part of weekends■ mutually exclusive with SPECIFICDAYS
SPECIFICDAYS no operands permitted
■ schedule is to be active only on specific dates■ one of the following days must be specified if SPECIFICDAYS is used:
MONDAY, TUESDAY, WEDNESDAY, THURSDAY, FRIDAY, SATURDAY, or SUNDAY
Table 65 Valid keywords for MONITOR INVOKE (part 4 of 6)
Keyword Default Notes
240 TriTune User Guide

TUNCALL verbs and keywords
MONDAY, TUESDAY, WEDNESDAY, THURSDAY, FRIDAY, SATURDAY, SUNDAY
no operands permitted
■ specific days of the week where the request is active (looking for a matching job)
■ if one or more of these are listed, SPECIFICDAYS must also have been specified
STARTTIME1-4 and ENDTIME1-4
0000 - 2359
■ up to 4 different panels within a day where the schedule panel is open for matching jobs
GROUP none ■ 1-8 character name assigned to the profile group
TRIGGER NO ■ YES indicates that the profile is a trigger for the group■ Y means that monitor sessions is started for all profiles in the group when
the trigger profile is started
WebSphere Monitoring Criteria
WASEXPRT N ■ WebSphere Expert Mode■ specify Y to collect normal PSW sample data when a WebSphere
application is monitored ■ specify N to disable PSW sampling (TriTune will only collect WebSphere
samples)
URLFILT1 none ■ transaction URL filter pattern 1■ specify filters for the application-level transaction URL names that you
want to monitor (up to 72 bytes) ■ use * as a wildcard■ you can specify several filters and separate each pattern with a comma■ each URL filter field (1 through 4) will be concatenated together■ any transaction not matching a filter pattern will not be monitored
URLFILT2 none ■ transaction URL filter pattern 2■ specify filters for the application-level transaction URL names that you
want to monitor (up to 72 bytes) ■ use * as a wildcard■ you can specify several filters and separate each pattern with a comma■ each URL filter field (1 through 4) will be concatenated together■ any transaction not matching a filter pattern will not be monitored
URLFILT3 none ■ transaction URL filter pattern 3■ specify filters for the application-level transaction URL names that you
want to monitor (up to 72 bytes) ■ use * as a wildcard■ you can specify several filters and separate each pattern with a comma■ each URL filter field (1 through 4) will be concatenated together■ any transaction not matching a filter pattern will not be monitored
Table 65 Valid keywords for MONITOR INVOKE (part 5 of 6)
Keyword Default Notes
Chapter 7 TriTune Open Application Program Interface 241

TUNCALL verbs and keywords
URLFILT4 none ■ transaction URL filter pattern 4■ specify filters for the application-level transaction URL names that you
want to monitor (up to 72 bytes) ■ use * as a wildcard■ you can specify several filters and separate each pattern with a comma■ each URL filter field (1 through 4) will be concatenated together■ any transaction not matching a filter pattern will not be monitored
SYSFILT1 none ■ system class filter pattern 1■ specify filters for any system class names that you do not want to monitor
(up to 72 bytes)■ use * as a wildcard ■ you can specify several filters and separate each pattern with a comma ■ any system class URL matching a filter will not be sampled ■ these filters are used in conjunction with the Global system class filters that
are defined in TRPARM member TUNWSC00
SYSFILT2 none ■ system class filter pattern 2■ specify filters for any system class names that you do not want to monitor
(up to 72 bytes)■ use * as a wildcard ■ you can specify several filters and separate each pattern with a comma ■ any system class URL matching a filter will not be sampled ■ these filters are used in conjunction with the Global system class filters that
are defined in TRPARM member TUNWSC00
SYSFILT3 none ■ system class filter pattern 3■ specify filters for any system class names that you do not want to monitor
(up to 72 bytes)■ use * as a wildcard ■ you can specify several filters and separate each pattern with a comma ■ any system class URL matching a filter will not be sampled ■ these filters are used in conjunction with the Global system class filters that
are defined in TRPARM member TUNWSC00
Table 65 Valid keywords for MONITOR INVOKE (part 6 of 6)
Keyword Default Notes
242 TriTune User Guide
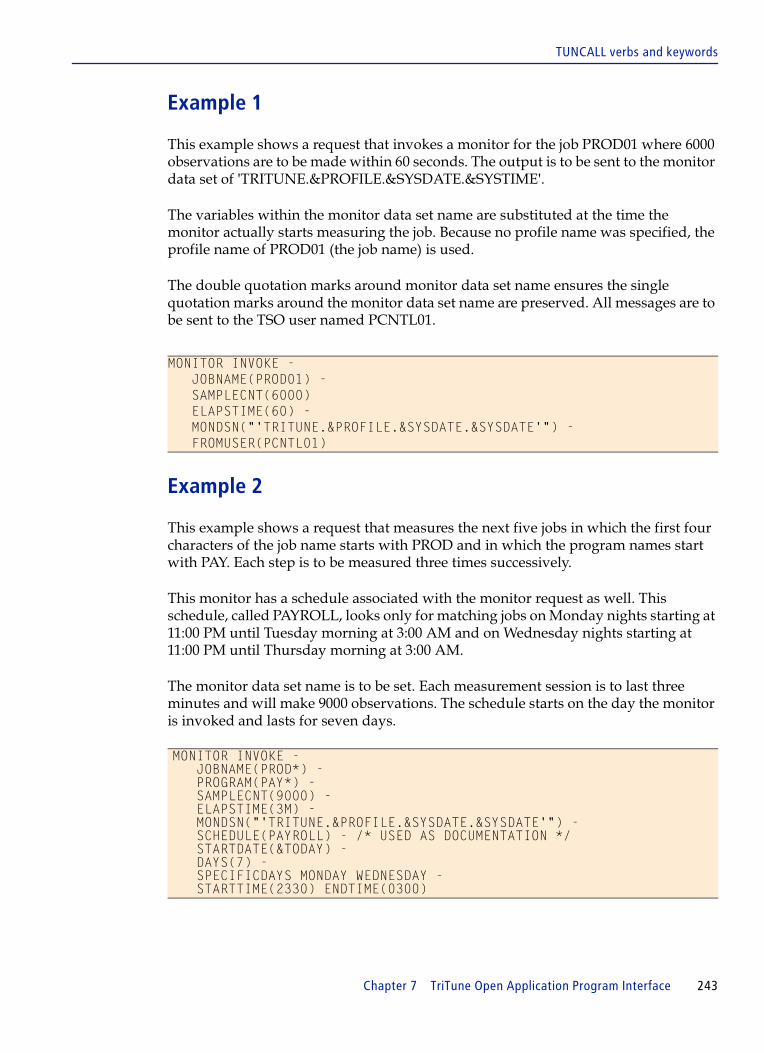
TUNCALL verbs and keywords
Example 1
This example shows a request that invokes a monitor for the job PROD01 where 6000 observations are to be made within 60 seconds. The output is to be sent to the monitor data set of 'TRITUNE.&PROFILE.&SYSDATE.&SYSTIME'.
The variables within the monitor data set name are substituted at the time the monitor actually starts measuring the job. Because no profile name was specified, the profile name of PROD01 (the job name) is used.
The double quotation marks around monitor data set name ensures the single quotation marks around the monitor data set name are preserved. All messages are to be sent to the TSO user named PCNTL01.
Example 2
This example shows a request that measures the next five jobs in which the first four characters of the job name starts with PROD and in which the program names start with PAY. Each step is to be measured three times successively.
This monitor has a schedule associated with the monitor request as well. This schedule, called PAYROLL, looks only for matching jobs on Monday nights starting at 11:00 PM until Tuesday morning at 3:00 AM and on Wednesday nights starting at 11:00 PM until Thursday morning at 3:00 AM.
The monitor data set name is to be set. Each measurement session is to last three minutes and will make 9000 observations. The schedule starts on the day the monitor is invoked and lasts for seven days.
MONITOR INVOKE - JOBNAME(PROD01) - SAMPLECNT(6000) ELAPSTIME(60) - MONDSN("'TRITUNE.&PROFILE.&SYSDATE.&SYSDATE'") - FROMUSER(PCNTL01)
MONITOR INVOKE - JOBNAME(PROD*) - PROGRAM(PAY*) - SAMPLECNT(9000) - ELAPSTIME(3M) - MONDSN("'TRITUNE.&PROFILE.&SYSDATE.&SYSDATE'") - SCHEDULE(PAYROLL) - /* USED AS DOCUMENTATION */ STARTDATE(&TODAY) - DAYS(7) - SPECIFICDAYS MONDAY WEDNESDAY - STARTTIME(2330) ENDTIME(0300)
Chapter 7 TriTune Open Application Program Interface 243

TUNCALL verbs and keywords
MONITOR CANCEL
If you want to cancel a monitor that is currently measuring an address space or a monitor that is pending, you can do so with TUNCALL. When TriTune queues up an invoked monitor request, a unique token number is assigned to the request. You can see the token number on the Monitor Status screen. TOKEN is the only required field.
Table 66 shows a list of valid keywords for MONITOR CANCEL.
Table 66 Valid keywords for MONITOR CANCEL
Keyword Default Description
TOKEN none ■ TriTune assigned request number for the pending or active monitor request
■ required field
PROFILE none ■ additional field to verify that the request pending or active monitor is the one to be stopped
MONDSN none ■ additional field to verify that the request pending or active monitor to be stopped is the desired one
TARGSYS1-4 none ■ the system where the request is to be stopped■ if a single monitor request is scheduled for multiple systems,
they will all contain the same TOKEN number■ this keyword will permit you to cancel a monitor on a specific
system within the sysplex■ if blank, the request is sent only to the local system
244 TriTune User Guide

TUNCALL verbs and keywords
MONITOR STATUS
You can use TUNCALL to determine the status of a specific monitor. When TriTune queues up an invoked monitor request, a unique token number is assigned to the request. You can see the token number on the Monitor Status screen. TOKEN is the only required field.
Table 67 shows a list of valid keywords for MONITOR STATUS.
Upon return from the MONITOR STATUS command, the return code field (see “Return and reason codes” on page 247 for more detail) will contain one of the following return codes:
Table 67 Valid keywords for MONITOR STATUS
Keyword Default Notes
TOKEN none ■ TriTune assigned request number for the pending or active monitor request (required field)
PROFILE none ■ additional field to verify that the request pending or active monitor is the one to be stopped
MONDSN none ■ additional field to verify that the request pending or active monitor to be stopped is the desired one
TARGSYS1-4 none ■ system the status is to be returned from■ if blank, the status is returned only from the local system
Return code passed in parameter list Status
00 waiting
04 active
08 inactive
12 canceled
16 completed
>16 unknown
Chapter 7 TriTune Open Application Program Interface 245

TUNCALL verbs and keywords
Invoking a monitor from a TSO command, CLIST, or REXX EXEC
TUNCALL requests can also be made as normal TSO commands. The following example shows TUNCALL being executed as a TSO command from a REXX EXEC:
Invoking TUNCALL from a batch job
You can execute TUNCALL from a batch job as shown in the following example:
This example writes the messages to the console and can process only a single request.
Routing message output to a file
To route the output of the log to a file instead of the console and to specify more than a single TUNCALL request, use syntax shown in the following example:
This example processes multiple requests and sends all messages and results to the TUNPRINT DD statement.
/* Rexx */address TSO "TUNCALL TRITUNE, MONITOR INVOKE PROFILE(PAYPROD1)"if rc /= 0 then do say 'TUNCALLED FAILED' exit rcend
//JOBNAME JOB (ACCT),'CALL TRITUNE',CLASS=A,MSGCLASS=A//*//TUNCALL EXEC PGM=TUNCALL,// PARM='TRITUNE,MONITOR INVOKE PROFILE(PAYPROD1)'
//JOBNAME JOB (ACCT),'CALL TRITUNE',CLASS=A,MSGCLASS=A//*//TUNCALL EXEC PGM=TUNCALL,//TUNPRINT DD SYSOUT=*//TUNIN DD* /* Monitor the next payroll job */ TRITUNE,MONITOR INVOKE PROFILE(PAYPROD1) TRITUNE,MONITOR INVOKE PROFILE(ABC*) - FROMUSER(TEST1) - ELAPSTIME(90) SAMPLECNT (9000)
246 TriTune User Guide

TUNCALL verbs and keywords
Invoking a monitor from within a program
When invoking TriTune as a called program, you must pass it the following parameter list:
Return and reason codes
All requests sent to TriTune that use TUNCALL have two levels of responses. The first level is from TUNCALL and this return code represents any errors that occurred when sending the request to the server. Table 68 lists the return codes.
Parameter Value Notes
Parameter 1 (+0) ■ Value must point to a fullword with an integer of 1.■ Value indicates the TUNCALL parameter list format.
Parameter 2 (+4) ■ This value is a pointer to the start of the command being processed.■ The command being sent to TUNCALL in this manner is a single
buffer.■ No comments or continuation cards are allowed.■ Buffer can be up to 32K in size.
Parameter 3 (+8) ■ This value is the address of an integer fullword containing the length of the command buffer specified in parameter 2.
Parameter 4 (+12) ■ This value is the address of a 16 byte area where the token is to be returned for MONITOR INVOKE.
■ currently, only the first 4 bytes of the area is actually used.
Parameter 5 (+16) ■ This value is the address of 2 consecutive 112 byte fields that contain messages upon return from TUNCALL.
Parameter 6 (+20) ■ This value is the address of a fullword of storage that contains the return code passed back by the TriTune server as a response to the request.
■ If TUNCALL ends with a return code of 16, this field should be examined further.
Parameter 7 (+24) ■ This value is the address of a fullword of storage to contain the reason code passed back by the TriTune server as a response to the request.
■ If TUNCALL ends with a return code of 16, this field should be examined further.
Table 68 Return codes (part 1 of 2)
R15 Description
4 Server was found but was inactive.
8 Server was not found or has never been started.
12 TNUCALL release did not match that of the server.
16 Request ended with a nonzero return code.
24 User is not authorized to access the requested server.
Chapter 7 TriTune Open Application Program Interface 247

TUNCALL verbs and keywords
If the request has been successfully sent to the server, and the request was completed with a nonzero return code, TUNCALL ends with a return code of 16 in register 15. This response indicates that the return code field provided in the parameter list was not zero. If TUNCALL returns anything other than a 16 in R15, you do not need to examine the two return and reason code fields that are provided in the parameter list.
If TUNCALL ends with register 15 containing 16, the return code and reason code fields provided in the parameter list indicate the reason for the failure (refer to Table 69).
28 Insufficient storage available to queue request to server.
32 Internal error occurred.
Error code in R0 indicates the type of error. Please provide this number when contacting Customer Support.
36 An abend occurred while processing request within the TriTune server.
40 Request was sent to the TriTune Server, but has timed out.
Table 69 Return and reason codes (part 1 of 2)
Request typeReturn code
Reason code Description
MONITOR INVOKE 16 4 Duplicate monitor already exists.
MONITOR CANCEL 16 8 Matching monitor was not found.
MONITOR INVOKE 16 12 Maximum number of queued or active monitor requests have been reached.
This value is set in the TUNSSPxx member with the MAXREQ keyword.
All 16 16 The user's UIF (User Information File) could not be allocated or opened by the TriTune Server.
A message with additional information is sent to the user by way of TPUT if this condition is raised.
All 16 32 Syntax error was detected.
The message areas pointed to by the parameter list contain detailed information on the nature of the syntax error.
All 16 Not listed above
A general failure of TUNCALL occurred.
Review the messages returned in the message areas that are provided for detailed information regarding the failure.
All 24 NA The user is not permitted access to the function requested.
All 28 NA The TriTune server did not have enough storage to process request.
Table 68 Return codes (part 2 of 2)
R15 Description
248 TriTune User Guide

TUNCALL verbs and keywords
All 32 NA An internal error occurred.
Review messages that are provided in the areas passed in the parameter list for more information.
All 36 NA An abend occurred while processing a request.
A small indicative dump is provided by TriTune. This indicative dump is written out to SYSLOG.
All 52 NA When sending the request to a specific system within the sysplex, no matching systems were found.
All 56 NA The request was queued when the system was being shut down and the request is not honored.
Table 69 Return and reason codes (part 2 of 2)
Request typeReturn code
Reason code Description
Chapter 7 TriTune Open Application Program Interface 249
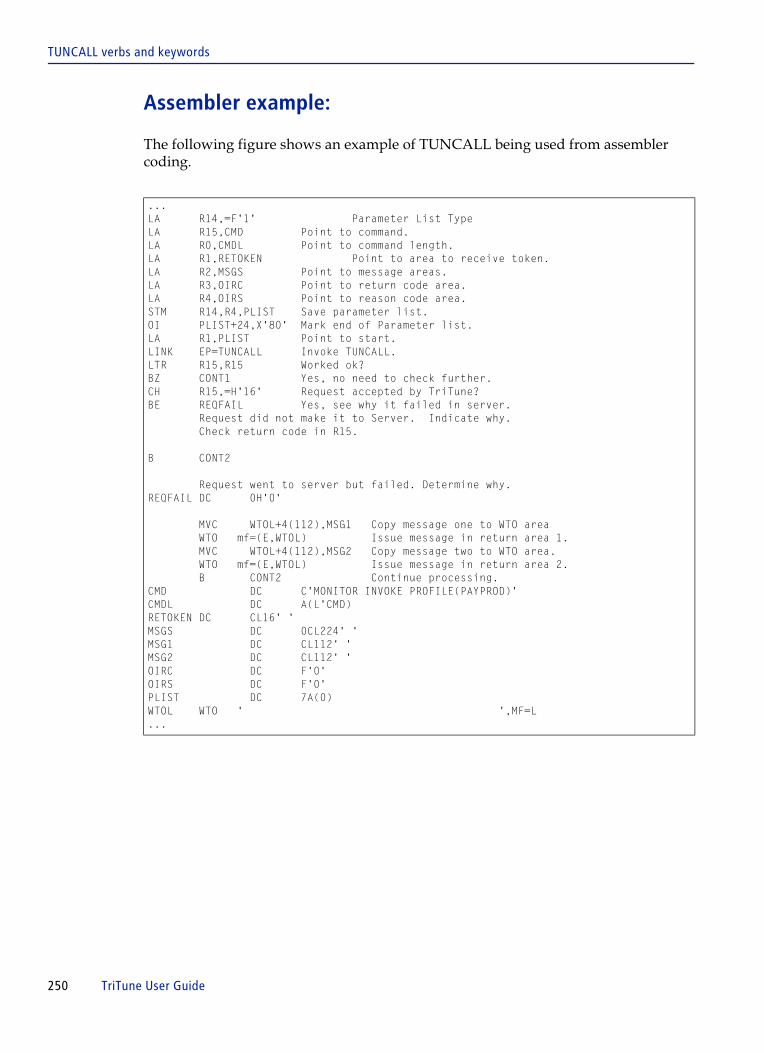
TUNCALL verbs and keywords
Assembler example:
The following figure shows an example of TUNCALL being used from assembler coding.
...LA R14,=F'1' Parameter List TypeLA R15,CMD Point to command.LA R0,CMDL Point to command length.LA R1,RETOKEN Point to area to receive token.LA R2,MSGS Point to message areas.LA R3,OIRC Point to return code area.LA R4,OIRS Point to reason code area.STM R14,R4,PLIST Save parameter list.OI PLIST+24,X'80' Mark end of Parameter list.LA R1,PLIST Point to start.LINK EP=TUNCALL Invoke TUNCALL.LTR R15,R15 Worked ok?BZ CONT1 Yes, no need to check further.CH R15,=H'16' Request accepted by TriTune?BE REQFAIL Yes, see why it failed in server. Request did not make it to Server. Indicate why. Check return code in R15.
B CONT2
Request went to server but failed. Determine why.REQFAIL DC 0H'0'
MVC WTOL+4(112),MSG1 Copy message one to WTO area WTO mf=(E,WTOL) Issue message in return area 1. MVC WTOL+4(112),MSG2 Copy message two to WTO area. WTO mf=(E,WTOL) Issue message in return area 2. B CONT2 Continue processing.CMD DC C'MONITOR INVOKE PROFILE(PAYPROD)'CMDL DC A(L'CMD)RETOKEN DC CL16' 'MSGS DC 0CL224' 'MSG1 DC CL112' 'MSG2 DC CL112' 'OIRC DC F'0'OIRS DC F'0'PLIST DC 7A(0)WTOL WTO ' ',MF=L...
250 TriTune User Guide

C h a p t e r 8
8 Generating TriTune batch reportsThis chapter explains how to set up and generate TriTune batch reports. These reports contain information similar to that in the TriTune Interactive Analysis panels. You can generate batch reports automatically each time you invoke a monitor, or anytime after a monitor has collected data.
This chapter also contains information about how to use the TriTune Spreadsheet Converter.
This chapter discusses the following topics:
Generating batch reports automatically . . . . . . . . . . . . . . . . . . . . . . . . . . . . . . . . . . . . . 252Submitting a job to generate batch reports. . . . . . . . . . . . . . . . . . . . . . . . . . . . . . . . . . . 252Setting up a batch report definition. . . . . . . . . . . . . . . . . . . . . . . . . . . . . . . . . . . . . . . . . 253Creating TriTune spreadsheet reports . . . . . . . . . . . . . . . . . . . . . . . . . . . . . . . . . . . . . . . 262
Installing the spreadsheet converter for Microsoft Excel 2000 . . . . . . . . . . . . . . . 262Generating TriTune spreadsheet reports . . . . . . . . . . . . . . . . . . . . . . . . . . . . . . . . . 265Maintenance and support . . . . . . . . . . . . . . . . . . . . . . . . . . . . . . . . . . . . . . . . . . . . . 271
Chapter 8 Generating TriTune batch reports 251

Generating batch reports automatically
Generating batch reports automatically You can generate batch reports automatically each time you invoke a monitor definition.
1 In the Profile Parameters panel, specify Y in the Batch Reports field.
2 Set up a batch report definition for the job, as described in “Setting up a batch report definition” on page 253.
You can override the batch reports setting for a specific monitor definition by specifying YES or NO on the Monitor Criteria panel (see Figure 23 on page 73).
If you issue the Stop line command against a monitor request, the batch reports are not generated.
Submitting a job to generate batch reports You can generate batch reports any time after you invoke the monitor and data collection has been completed.
1 From the Monitor Definition panel, type B in the LC field next to the profile for the job.
2 Press Enter.
The Batch Report panel is displayed.
3 Set up a batch report definition for the job, as described in “Setting up a batch report definition” on page 253.
4 On the COMMAND line, type SUBmit.
A message appears indicating that the job has been submitted.
5 Press End to return to the Monitor Definition panel.
252 TriTune User Guide

Setting up a batch report definition
Setting up a batch report definition You can use the Batch Report panel for a job at any time. The default values for batch reports can be set globally (see the TriTune Installation and Customization Guide). Global defaults can be changed for each user through the Profile Parameters panel.
1 From the Monitor Definition panel, type B next to the profile name of the job for which you want to generate batch reports.
2 Press Enter.
The Batch Report panel (Figure 117) is displayed.
Figure 117 Batch Report panel: top portion
TriTune ------------------------ Batch Report ----------------------------- Profile: TUNCIC More: Output Data Set Options (scroll down for allocation parameters) Report Dataset Name ===> (Blank for SYSOUT, Dataset name, or .MONDSN) CSV Dataset Name ===> 'TRIUSER.TUNCIC.CSV' (Blank for default, .TEMP or .MONDSN) Job Cards (scroll down for JES Parameters) ==> //JOBNAME JOB (ACCT),'TUNBATCH',CLASS=Q, ==> // MSGLEVEL=1,MSGCLASS=X ==> //* ==> //*TUNJCL JCLLIB ORDER=TRITUNE.V40.UTRSAMP Report Title ===> Report Thresholds (Minimum percentages for Summary and detail reports) Active Threshold ===> 5 (CPU activity for Summary and Delay Details) Wait Threshold ===> 10 (Wait activity for Summary and Delay Details) Detail Threshold ===> 1 (Total activity for Summary and Detail reports) Transact Threshold ===> 10 (Transaction activity for Summary report) Reporting options Analysis Mode ===> NORMAL Analysis Summary ===> Y Monitor History ===> Y DelayView ===> Y CodeView ===> Y DataView ===> Y TaskView ===> Y TranView ===> Y ModView ===> Y PoolView ===> Y USSView ===> Y Subsystem Details DB2View ===> Y IMS Transactions ===> Y JVM Information ===> Y WebSphere ===> Y Options for DelayView Delay details ===> ON
Chapter 8 Generating TriTune batch reports 253

Setting up a batch report definition
Figure 118 Batch report panel: lower portion
3 Specify the report title, report format, output destination, and the reports that you want to include.
Table 70 describes the fields in the Report Definition panel.
Options for CodeView Threshold ===> 1 CodeView mode All or top 5 ===> Y Csect ===> Y Histogram Csect 1 ===> Module ===> N Histogram Csect 2 ===> Pseudo ===> N Histogram Csect 3 ===> 4GL ===> Y Histogram Csect 4 ===>
Options for DataView Linklist ===> N DB2 Code Detail ===> Y
Options for TranView Code Detail ===> Y Delay Detail ===> N Data Detail ===> ALL Transaction 1 ===> * Transaction 2 ===> Transaction 3 ===> Transaction 4 ===>
Options for TaskView Task 1 ===> * Task 2 ===> Task 3 ===> Task 4 ===>
Report Scope Report Detail ===> Y (Y for full report, N to omit detail reports) Field Detail ===> Y (Y for full report, N to omit trivial fields)
JES Parameters Lines per page ===> 66 Sysout class ===> * Column width ===> 132 Sysout form ===> JES writer-name ===> Destination ===>
Scroll UP or DOWN for more options. Enter SUBmit to submit a batch job,press END to exit and save changes, or enter CANCEL to exit without saving. Dataset Allocation Parameters (for report datasets and CSV files) Tracks: Primary ===> 15 Secondary ===> 15 Volume Serial ===> or Storage Class ===> Unit ===> SYSALLDA Data Class ===> Management Class ===>
Table 70 Report Definition fields (part 1 of 7)
Field name Description
Output Data Set Options
Save the output file for the Batch Reports in CSV format.
Job Cards Modify the default ISPF job card as needed.
Note that you can use the JCL ORDER statement to specify the library from which the batch programs are fetched, as shown in Figure 117 on page 253.
Report Title Specify a unique title to appear at the top of each page of the report
254 TriTune User Guide

Setting up a batch report definition
Report Dataset Name Specify a data set name to receive the generated batch report.
Leave this field blank to write the report to SYSOUT.
Specify .MONDSN to use the data set name of the monitor file. A .BAT node will be appended to the monitor file name to create the file name. Some truncation may occur if the resulting name is longer than 44 characters. If the data set is not found, it will be created.
Reporting Thresholds
Active Threshold Specify the minimum percentage of CPU activity for Summary and Detail reports (default is 5).
Wait Threshold Specify the minimum percentage of wait activity for Summary and Detail reports (default is 10).
Detail Threshold Specify the minimum percentage of combined CPU and wait activity for Summary and Detail reports (default is 1).
Transact Threshold Specify the minimum percentage of transaction activity for Summary reports (default is 10).
Reporting Options
Analysis Mode Specify one of the following values:
■ NORMAL: Information that is not directly related to the target application is eliminated; data is reported as follows:
— Samples related to delay categories such as Waiting for CPU, LPAR delay, and Swap delay are omitted from reports.
— DelayView, TimeView, DataView, and ModView show all relevant delays for the application. All relevant samples, both active and wait, are reported.
— CodeView and related histograms report only active samples to emphasize the most CPU-intensive portions of the program code. Wait samples, which can mask this activity, are not included.
■ ALL: The results of the analysis reflect all samples that were obtained during the monitor period.
■ ACTIVE: The results of the analysis reflect only those samples in which the program was actively using CPU.
■ WAIT: The results of the analysis reflect only those samples in which the program was in a wait state.
Analysis Summary Specify Y (default) to include the Analysis Summary report in the Batch Reports.
This report shows the highest delay causes, and therefore the programs and resources that might best benefit from tuning, in one report.
Monitor History ■ Specify Y (default) to generate the batch history report.■ Specify N for no report.
Table 70 Report Definition fields (part 2 of 7)
Field name Description
Chapter 8 Generating TriTune batch reports 255

Setting up a batch report definition
DelayView ■ Specify Y (default) to generate a DelayView report.■ Specify N for no DelayView report.
CodeView ■ Specify Y (default) to generate a CodeView report.■ Specify N for no CodeView report.
DataView ■ Specify Y (default) to generate a DataView report.■ Specify N for no DataView report.
TaskView ■ Specify Y (default) to generate a TaskView report.■ Specify N for no TaskView report.
TranView ■ Specify Y to generate a TranView report.■ Specify N (default) for no TranView report.
ModView ■ Specify Y (default) to generate a ModView report.■ Specify N for no ModView report.
PoolView ■ Specify Y to generate a PoolView report.■ Specify N (default) for no PoolView report.
USSView ■ Specify Y to generate a USSView report.■ Specify N (default) for no USSView report.
Subsystem Details
DB2View ■ Specify Y to generate a DB2 Subsystem report.■ Specify N for no DB2 Subsystem report.
IMS Transactions ■ specify Y to generate a IMS Subsystem report.■ specify N for no IMS Subsystem report.
JVM Information ■ Specify Y to generate a JVM Subsystem report.■ Specify N for no JVM Subsystem report.
WebSphere ■ Specify Y to generate a WebSphere Application Server report.■ Specify N for no WebSphere Application Server report.
Options for DelayView
Detail ■ Specify ON if you want the DelayView report to contain detailed information about the delay causes.
■ Specify OFF if you want the DelayView report to contain only high-level information about delay causes (default is ON).
Options for CodeView
Threshold Specify the threshold value (0 to100) for CodeView.
Modules or CSECTs that have a total activity percentage below this value are not included in the batch CodeView report (CSECT and Module modes only). The sum total of all activity below the threshold is included as Module/CSECT **N/A**. Specify a threshold of 0 (zero) to include all modules or CSECTs. The default is 1 (1%).
Table 70 Report Definition fields (part 3 of 7)
Field name Description
256 TriTune User Guide

Setting up a batch report definition
All-User-Top 5 You can specify one of the following choices:
■ Specify the threshold value (0 to100) for CodeView.
Modules or CSECTs that have a total activity percentage below this value are not included in the batch CodeView report (CSECT and Module modes only). The sum total of all activity below the threshold is included as Module/CSECTs **N/A**. Specify a threshold of 0 (zero) to include all modules or CSECTs. The default is 1 (1%).
■ Specify Y to create histograms for the five CSECTs showing the greatest activity or delay in CodeView.
CSECTs with total activity below the CodeView Detail Threshold are omitted.
■ Specify A to create histograms for all CSECTs reported by CodeView.
■ Specify U to create histograms for User CSECTs only (only those CSECTs which do NOT have an associated base-level CSECT description).
■ Specify N to suppress generation of histograms.
CSECT histograms are produced in order of descending activity. Histograms are not produced for CSECT that show no activity.
CodeView mode Specify the mode for CodeView batch reports.
Possible modes are CSECT, MODULE, PSEUDO, or 4GL. The default is CSECT. See “Interactive analysis option 3 - CodeView” on page 146 for more information.
Table 70 Report Definition fields (part 4 of 7)
Field name Description
Chapter 8 Generating TriTune batch reports 257

Setting up a batch report definition
Histogram CSECT 1- Histogram CSECT 4
Specify up to four CSECT names for which you want to create histograms.
To suppress the generation of histograms for certain classes of CSECTs, you can specify the leading characters of the CSECTs to exclude. In the Options for CodeView section, the four Histogram CSECT fields have been updated to allow the user to exclude CSECTs, as follows:
1. Enter the NOT character '' (SHIFT+6), followed by the initial characters of the Csect names that you want to exclude.
As an example, IBM will exclude any CSECTs that begin with IBM (such as IBMRBGK1).
2. If the 'TOP 5' option is selected, excluded CSECTs will not be counted as part of the five CSECTs.
3. Do not use any wildcard characters ('*','#). You can use as many characters as needed.
4. Excluded CSECTS can be specified in the Profile Parameters panel (Option 0), to be used for all new batch reports (existing profiles will need to be updated separately).
Options for DataView
Linklist ■ Specify Y to include the names of the LINKLIST libraries for your installation as part of the DataView report
■ Specify N (default) for no LINKLIST information
DB2 Code Detail ■ Specify Y (default) to generate the DB2 Code Detail report■ Specify N for no report
Options for TranView
Code Detail ■ Specify Y to generate the batch report■ Specify N (default) for no report
Delay Detail ■ Specify Y to generate the batch report■ Specify N (default) for no report
Data Detail Specify the transactions on the TranView panel that will have a link to the DataView Detail panel, if data set information is available for that transaction
Specify Y (yes) for the top five transactions, N for none, or ALL for all transactions that have data set information.
Table 70 Report Definition fields (part 5 of 7)
Field name Description
258 TriTune User Guide

Setting up a batch report definition
Transaction 1 – Transaction 4
Select up to four specific transactions to appear in the following reports:
■ CodeView (including histograms)■ DelayView■ TaskView■ TranView
This field supports the use of the * wildcard character to match multiple characters and the + wildcard character to match any single character. If you want all transactions to appear, specify an asterisk (*) in this field. Asterisk is the default.
Options for TaskView
Task 1 – Task 4 Select up to four specific tasks to appear in the following reports:
■ CodeView (including histograms)■ DelayView■ TaskView■ TranView
This field supports the use of the * wildcard character to match multiple characters and the + wildcard character to match any single character. If you want all tasks to appear, specify an asterisk (*) in this field. Asterisk is the default.
Options for Report Scope
Report Detail Specify the overall level of detail that is included in the Batch Report
Specify Y to include all reports. To omit the Delay Distribution, Delay Detail, and Code Detail reports, specify N. The default is Y.
Field Detail Specify the field-level of detail that is included in the DataView and ModView reports
Specify Y to include all fields. To omit the noncritical fields, specify N. The default is Y.
JES Parameters
Lines per page Specify the number of lines on each page of the batch report (the default is 66)
Sysout class Specify an output destination for the batch reports (default is an asterisk (*))
The asterisk (*) ensures that TriTune generated reports use the same SYSOUT class as the job card.
Column width Specify the width of the batch reports
The default is to 132.
Sysout form Specify a one- to four-character form name for the destination to which the report is written
Table 70 Report Definition fields (part 6 of 7)
Field name Description
Chapter 8 Generating TriTune batch reports 259

Setting up a batch report definition
Figure 119 on page 261 shows the Analysis Summary Report that is created by TriTune when you specify Y on the Batch Report panel.
JES writer-name Specify a program name as part of the SYSOUT definition that JES uses to process the data set
Some SYSOUT management products use the writer-name as routing information instead of it being an actual program name.
Destination Specify the one- to eight-character node name of the JES destination
In addition, you can specify a one- to eight-character user ID to which the SYSOUT report is written. If you specify a user ID, it must follow the node name and must be separated from the node name with a period.
Table 70 Report Definition fields (part 7 of 7)
Field name Description
260 TriTune User Guide

Setting up a batch report definition
Figure 119 Analysis Summary Report
*--------------------------------> SUMMARY <---------------------------------*TRANSACTION INFORMATION ******************************************************* (TRANSACTIONS ACCOUNTING FOR OVER 10.00% OF ACTIVITY)
TRANSACTION #TRANS TOT CPU AVG CPU ACTV% WAIT% TOTL% VISUAL ----------- ------ -------- -------- ----- ----- ----- ---------- Q904 4361 33.60984 0.00771 37.06 30.06 67.12 =====> M710 544 8.92706 0.01641 2.71 14.58 17.30 >
DB2 DELAYS ******************************************************************** (REPRESENTING 59.33% OF TOTAL DELAYS)
COLLECTION PACKAGE STMT TYPE ACTV% WAIT% TOTL% VISUAL ---------- -------- ------ -------- ------ ------ ------ ---------- BWOQACO QX2CBWI1 5731 SELECT 16.43 0.60 17.02 > BWOBGCO BG2C7060 4928 FETCH 3.21 0.03 3.25 BWOBGCO BG2CB401 2909 SELECT 0.03 3.19 3.22 BWOBGCO BG2CB401 3322 SELECT 0.00 3.21 3.21 BWOMCCO MC7C8500 15688 SELECT 0.00 3.05 3.05 BWOBGCO BG7C5730 20305 INSERT 0.04 2.28 2.32 BWOMCCO MC7C8000 10789 UPDATE 0.00 1.80 1.80 BWOBGCO BG7C5730 21287 INSERT 0.01 1.11 1.12 BWOBGCO BG2CB401 3047 SELECT 0.00 1.11 1.11
PROGRAM ACTIVE DELAYS ********************************************************* (REPRESENTING 23.10% OF TOTAL DELAYS)
MODULE CSECT OFFSET STMT TOTAL% CSECT DESCRIPTION -------- -------- -------- ------ ------- ----------------- DFHD2EX3 DFHD2EX3 000003B8 11.37 CICS-DB2 SUBTASK PROGRAM DFHSIP DFHDSDS3 00000940 8.95 DS DOMAIN - MAIN DISPATCH LOOP
IO WAIT DELAYS **************************************************************** (REPRESENTING 0.74% OF TOTAL DELAYS)
MODULE CSECT OFFSET STMT TOTAL% CSECT DESCRIPTION -------- -------- -------- ------ ------- ----------------- DFHSIP DFHDSDS3 000010F6 1.26 DS DOMAIN - MAIN DISPATCH LOOP**************************** END OF SUMMARY REPORT ****************************
Chapter 8 Generating TriTune batch reports 261

Creating TriTune spreadsheet reports
Creating TriTune spreadsheet reportsThis section describes how to use the TriTune Spreadsheet Converter (for Microsoft Excel 2000) to export data from the TriTune Interactive Analysis panels into Microsoft Excel spreadsheets.
After you have converted the data to Microsoft Excel spreadsheets, you can use the functions within Microsoft Excel to create reports, graphs, and otherwise manipulate your data. For information about using Microsoft Excel, refer to your Microsoft Excel documentation.
The TriTune Spreadsheet Converter for Microsoft Excel supports different number formats, as defined by the Windows Regional Settings control panel. The numbers displayed will conform to the regional setting (example - use comma as the decimal point).
This following sections are included:
■ Installing the spreadsheet converter for Microsoft Excel 2000
■ Generating TriTune spreadsheet reports
■ Maintenance and support
Installing the spreadsheet converter for Microsoft Excel 2000
To use the TriTune Spreadsheet Converter, you must first download and install the TriTune Spreadsheet Converter Add-In. Once installed, you can use simple menu commands to import the TriTune monitor data into Microsoft Excel spreadsheets.
This section describes how to install the TriTune Spreadsheet Converter Add-In and how to remove it:
■ Download the TriTune Spreadsheet converter for Microsoft Excel 2000
■ Install the TriTune Spreadsheet Converter Add-In
■ Removing the TriTune Add-In
262 TriTune User Guide

Creating TriTune spreadsheet reports
Download the TriTune Spreadsheet converter for Microsoft Excel 2000
The TriTune Spreadsheet Converter Add-In is delivered with TriTune as a member (TUNSSC) in hilevel.TRSAMP. You need to download the TriTune Excel Add-In to your PC.
1 Create a folder on your PC to be used for storing the spreadsheet converter and the converted reports.
2 Transfer the TUNSCC member of data set hilevel.TRSAMP to your PC by using a file transfer program such as IND$FILE.
To ensure Microsoft Excel will be able to read the file you must first transfer the file in BINARY format with NO CRLF codes and then use the XLA file extension when naming the new file.
3 Name the new file on your PC:
TUNSSC.XLA
Install the TriTune Spreadsheet Converter Add-In
After the TriTune Spreadsheet Converter Add-In is downloaded to your PC, it must be installed. Refer to your Microsoft Excel documentation for information if necessary.
1 Open Microsoft Excel (Office2000 or later).
2 Choose Tools => Add-Ins.
3 On the Add-Ins window, click the Browse button.
4 Navigate to the directory where you installed the Spreadsheet Converter Add-In and select TUNSSC.XLA.
5 Click OK.
The TriTune Spreadsheet Converter is included in the list of Add-Ins (see Figure 120 on page 264).
Chapter 8 Generating TriTune batch reports 263
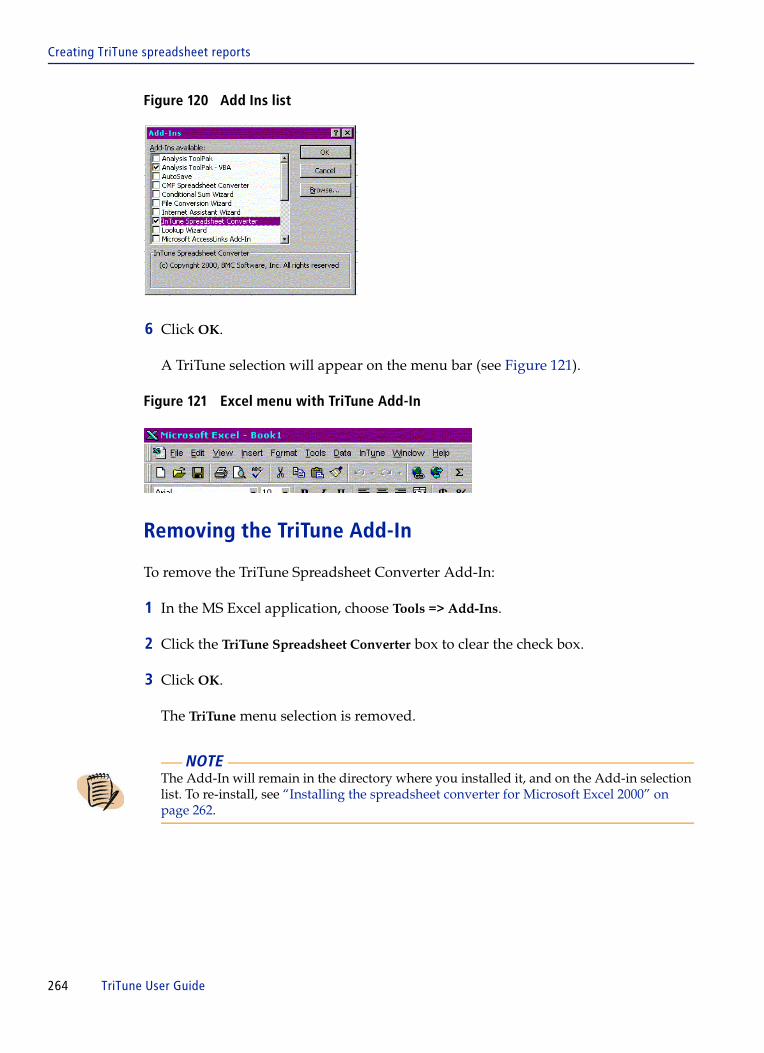
Creating TriTune spreadsheet reports
Figure 120 Add Ins list
6 Click OK.
A TriTune selection will appear on the menu bar (see Figure 121).
Figure 121 Excel menu with TriTune Add-In
Removing the TriTune Add-In
To remove the TriTune Spreadsheet Converter Add-In:
1 In the MS Excel application, choose Tools => Add-Ins.
2 Click the TriTune Spreadsheet Converter box to clear the check box.
3 Click OK.
The TriTune menu selection is removed.
NOTE The Add-In will remain in the directory where you installed it, and on the Add-in selection list. To re-install, see “Installing the spreadsheet converter for Microsoft Excel 2000” on page 262.
264 TriTune User Guide
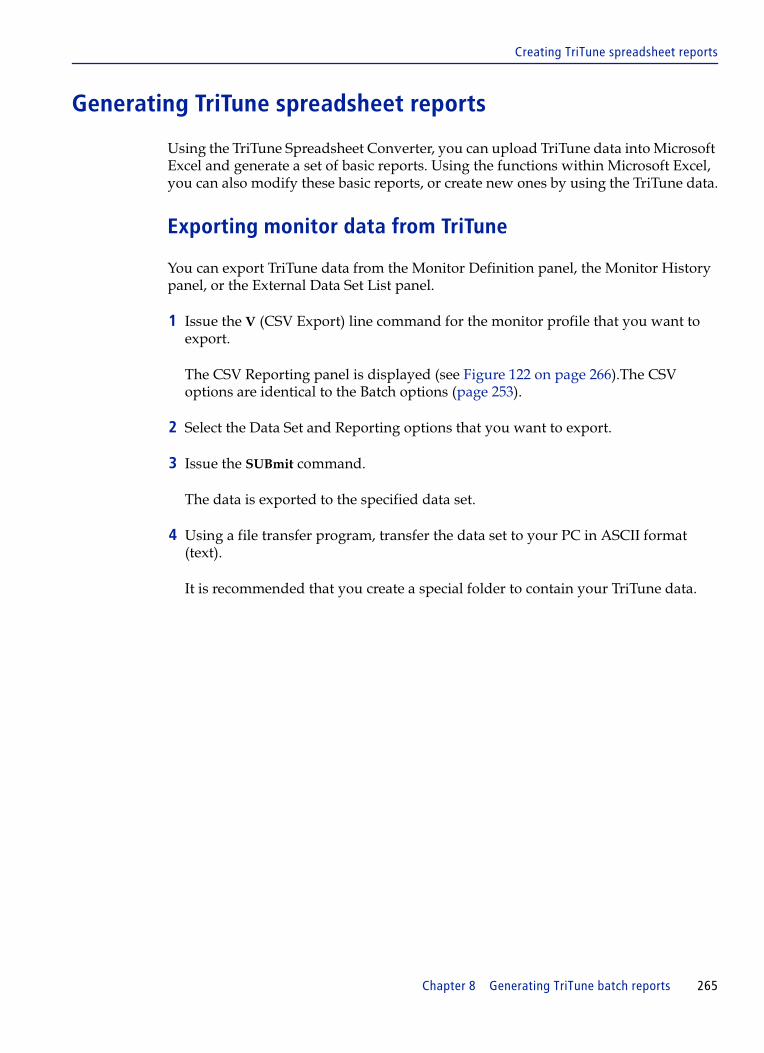
Creating TriTune spreadsheet reports
Generating TriTune spreadsheet reports
Using the TriTune Spreadsheet Converter, you can upload TriTune data into Microsoft Excel and generate a set of basic reports. Using the functions within Microsoft Excel, you can also modify these basic reports, or create new ones by using the TriTune data.
Exporting monitor data from TriTune
You can export TriTune data from the Monitor Definition panel, the Monitor History panel, or the External Data Set List panel.
1 Issue the V (CSV Export) line command for the monitor profile that you want to export.
The CSV Reporting panel is displayed (see Figure 122 on page 266).The CSV options are identical to the Batch options (page 253).
2 Select the Data Set and Reporting options that you want to export.
3 Issue the SUBmit command.
The data is exported to the specified data set.
4 Using a file transfer program, transfer the data set to your PC in ASCII format (text).
It is recommended that you create a special folder to contain your TriTune data.
Chapter 8 Generating TriTune batch reports 265

Creating TriTune spreadsheet reports
Figure 122 CSV Reporting Panel
TriTune ------------------------ CSV Reporting -------------------------------COMMAND ===> Profile: AAAAA More: + Output Data Set Options Data set name ===> 'BMVJJM.BMVJJM4.AAAAA.CSV' (Blank for default, or .MONDSN) Tracks Primary ===> 15 Secondary ===> 15
Volume Serial ===> or Storage Class ===> Unit ===> SYSALLDA Data Class ===> Management Class ===> Job Cards ==> //JOBNAME JOB (ACCT),'TRITUNE BATCH REPORT', ==> // CLASS=A,MSGCLASS=A,NOTIFY=&SYSUID ==> //* ==> //*TUNJCL JCLLIB ORDER=TRITUNE.JCL.LIBRARY
Report Title ===> TRITUNE ANALYSIS
Report Thresholds (Minimum percentages for Summary and detail reports) Active Threshold ==> 5.00 (CPU activity for Summary and Delay Details) Wait Threshold ==> 10.00 (Wait activity for Summary and Delay Details) Detail Threshold ==> 1.00 (Total activity for Summary and Detail reports) Transact Threshold ==> 10.00 (Transaction activity for Summary report)
Reporting options Analysis Mode ===> NORMAL Analysis Summary ===> Y Monitor History ===> Y DelayView ===> Y CodeView ===> Y DataView ===> Y TaskView ===> Y TranView ===> Y ModView ===> Y PoolView ===> Y USSView ===> Y
Subsystem Details DB2View ===> Y IMS Transactions ===> Y JVM Information ===> Y WebSphere ===> Y
Options for DelayView Delay details ===> ON
Options for CodeView Threshold ===> 1.0 CodeView mode All-User-Top5 ===> Y Csect ===> Y Histogram Csect 1 ===> Module ===> N Histogram Csect 2 ===> Pseudo ===> N Histogram Csect 3 ===> 4GL ===> Y Histogram Csect 4 ===>
Options for DataView Linklist ===> Y DB2 Code Detail ===> Y
Options for TranView Code Detail ===> N Delay Detail ===> N Data Detail ===> N Transaction 1 ===> * Transaction 2 ===> Transaction 3 ===> Transaction 4 ===>
Options for TaskView Task 1 ===> * Task 2 ===> Task 3 ===> Task 4 ===>
266 TriTune User Guide

Creating TriTune spreadsheet reports
Opening the TriTune Monitor data set
1 Select the downloaded file from the folder that you created.
2 From the TriTune menu, choose Convert TriTune Reports.
The Select TriTune Report File dialog box is displayed (see Figure 123).
Figure 123 Select TriTune Report Dialog Box
3 Navigate to the folder where you downloaded the monitor data set.
4 Open the file by one of the following methods:
■ double-clicking the file name■ selecting the file and then clicking OK
The data is loaded, and you see the Conversion Log, which lists the reports generated, and any errors encountered.
Chapter 8 Generating TriTune batch reports 267
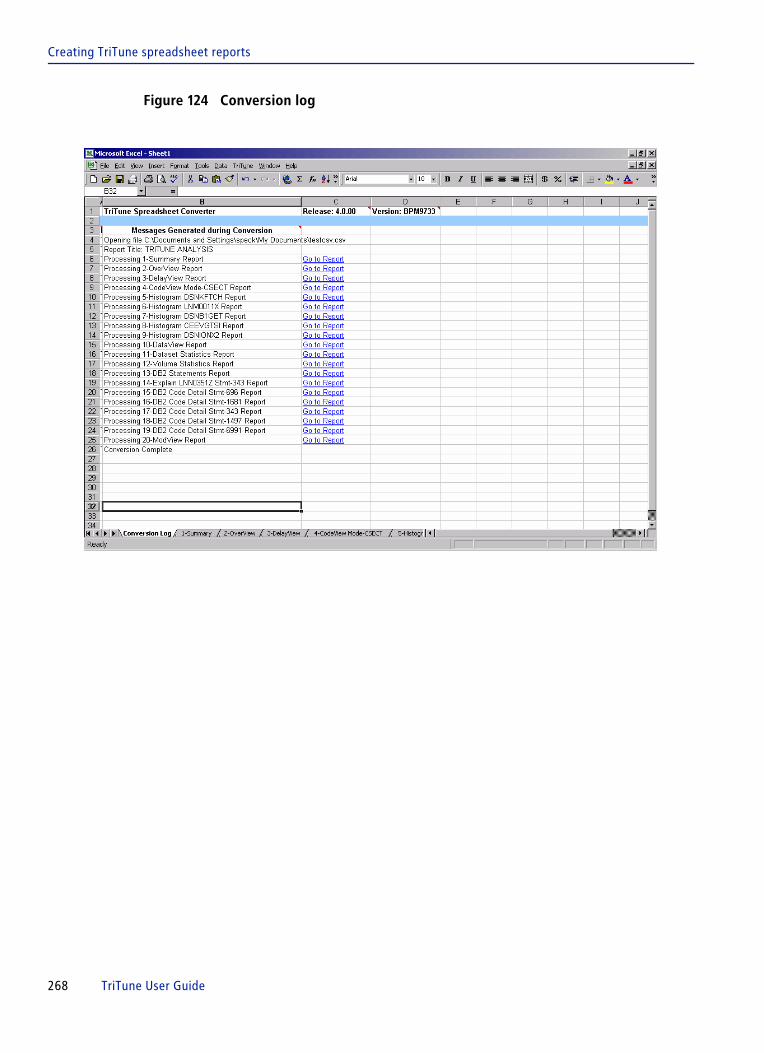
Creating TriTune spreadsheet reports
Figure 124 Conversion log
268 TriTune User Guide

Creating TriTune spreadsheet reports
Viewing the generated reports
Each report is located on a separate worksheet. To view a report, click the appropriate worksheet tab (or click the hyperlink on the Conversion Log).
Viewing report graphs
Some reports include predefined graphical reports. Click the appropriate button at the top of a report sheet to generate the graph.
Report examples
The following figures show some examples of different reports that are available.
Figure 125 Overview Report
Chapter 8 Generating TriTune batch reports 269

Creating TriTune spreadsheet reports
Figure 126 CodeView Report
Modifying and creating reports
The reports generated by the TriTune Spreadsheet Converter contain the exported data in basic tabular and graphic format. If you require specific reports, you can create your own reports and graphs by using the TriTune data. Refer to your Microsoft Excel documentation for information about how to create reports by using Microsoft Excel.
270 TriTune User Guide

Creating TriTune spreadsheet reports
Maintenance and support
Because the TriTune Spreadsheet converter is distributed as a mainframe file, it is maintained by using standard SMP/E tools.
Maintenance
Updates to the spreadsheet converter are distributed by way of PTF maintenance. Whenever a spreadsheet converter PTF is received, the HOLDDATA file will alert you that an updated version needs to be downloaded. Use the same procedures for downloading as described in “Installing the spreadsheet converter for Microsoft Excel 2000” on page 262.
Customer Support
For incidents with the spreadsheet converter, Customer Support personnel need a copy of the reports. Because the report and spreadsheet files reside on your PC, you should be able to send them as an attachment to an email message, or place them on the FTP server.
Chapter 8 Generating TriTune batch reports 271

Creating TriTune spreadsheet reports
272 TriTune User Guide

C h a p t e r 9
9 Using TriTune to tune your applicationsTriTune measures delays incurred by an application program, both from outside sources and within the program’s own code. TriTune panels provide information about a variety of delay types. The best place to start looking for delays is with DelayView. With DelayView, you can see which types of operations were executed and how much elapsed time was spent in each operation type.
This chapter discusses the following topics:
Overview of delay categories . . . . . . . . . . . . . . . . . . . . . . . . . . . . . . . . . . . . . . . . . . . . . . 274Program active delays . . . . . . . . . . . . . . . . . . . . . . . . . . . . . . . . . . . . . . . . . . . . . . . . . . . . 276Voluntary wait delays . . . . . . . . . . . . . . . . . . . . . . . . . . . . . . . . . . . . . . . . . . . . . . . . . . . . 276Abend procedure delays . . . . . . . . . . . . . . . . . . . . . . . . . . . . . . . . . . . . . . . . . . . . . . . . . . 277Data delays . . . . . . . . . . . . . . . . . . . . . . . . . . . . . . . . . . . . . . . . . . . . . . . . . . . . . . . . . . . . . 277Resource conflict delays . . . . . . . . . . . . . . . . . . . . . . . . . . . . . . . . . . . . . . . . . . . . . . . . . . 279System active delays . . . . . . . . . . . . . . . . . . . . . . . . . . . . . . . . . . . . . . . . . . . . . . . . . . . . . 280File management delays . . . . . . . . . . . . . . . . . . . . . . . . . . . . . . . . . . . . . . . . . . . . . . . . . . 281Program load delays . . . . . . . . . . . . . . . . . . . . . . . . . . . . . . . . . . . . . . . . . . . . . . . . . . . . . 281DASD management delays. . . . . . . . . . . . . . . . . . . . . . . . . . . . . . . . . . . . . . . . . . . . . . . . 282Other delays . . . . . . . . . . . . . . . . . . . . . . . . . . . . . . . . . . . . . . . . . . . . . . . . . . . . . . . . . . . . 282
Chapter 9 Using TriTune to tune your applications 273
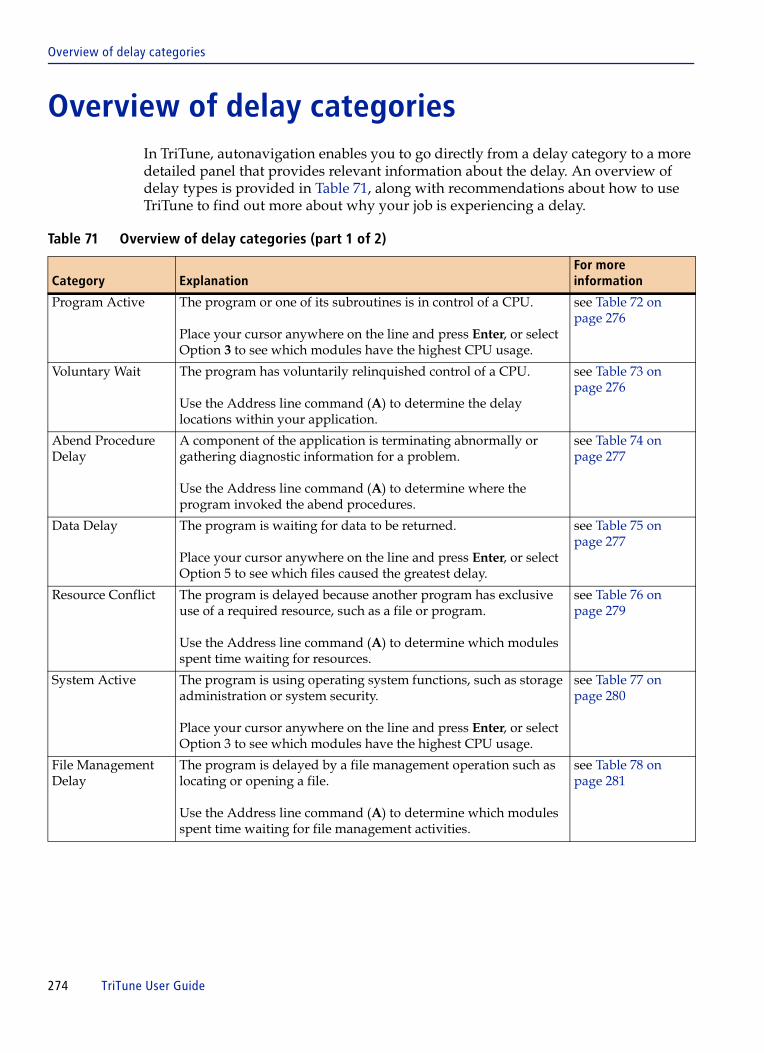
Overview of delay categories
Overview of delay categoriesIn TriTune, autonavigation enables you to go directly from a delay category to a more detailed panel that provides relevant information about the delay. An overview of delay types is provided in Table 71, along with recommendations about how to use TriTune to find out more about why your job is experiencing a delay.
Table 71 Overview of delay categories (part 1 of 2)
Category ExplanationFor more information
Program Active The program or one of its subroutines is in control of a CPU.
Place your cursor anywhere on the line and press Enter, or select Option 3 to see which modules have the highest CPU usage.
see Table 72 on page 276
Voluntary Wait The program has voluntarily relinquished control of a CPU.
Use the Address line command (A) to determine the delay locations within your application.
see Table 73 on page 276
Abend Procedure Delay
A component of the application is terminating abnormally or gathering diagnostic information for a problem.
Use the Address line command (A) to determine where the program invoked the abend procedures.
see Table 74 on page 277
Data Delay The program is waiting for data to be returned.
Place your cursor anywhere on the line and press Enter, or select Option 5 to see which files caused the greatest delay.
see Table 75 on page 277
Resource Conflict The program is delayed because another program has exclusive use of a required resource, such as a file or program.
Use the Address line command (A) to determine which modules spent time waiting for resources.
see Table 76 on page 279
System Active The program is using operating system functions, such as storage administration or system security.
Place your cursor anywhere on the line and press Enter, or select Option 3 to see which modules have the highest CPU usage.
see Table 77 on page 280
File Management Delay
The program is delayed by a file management operation such as locating or opening a file.
Use the Address line command (A) to determine which modules spent time waiting for file management activities.
see Table 78 on page 281
274 TriTune User Guide
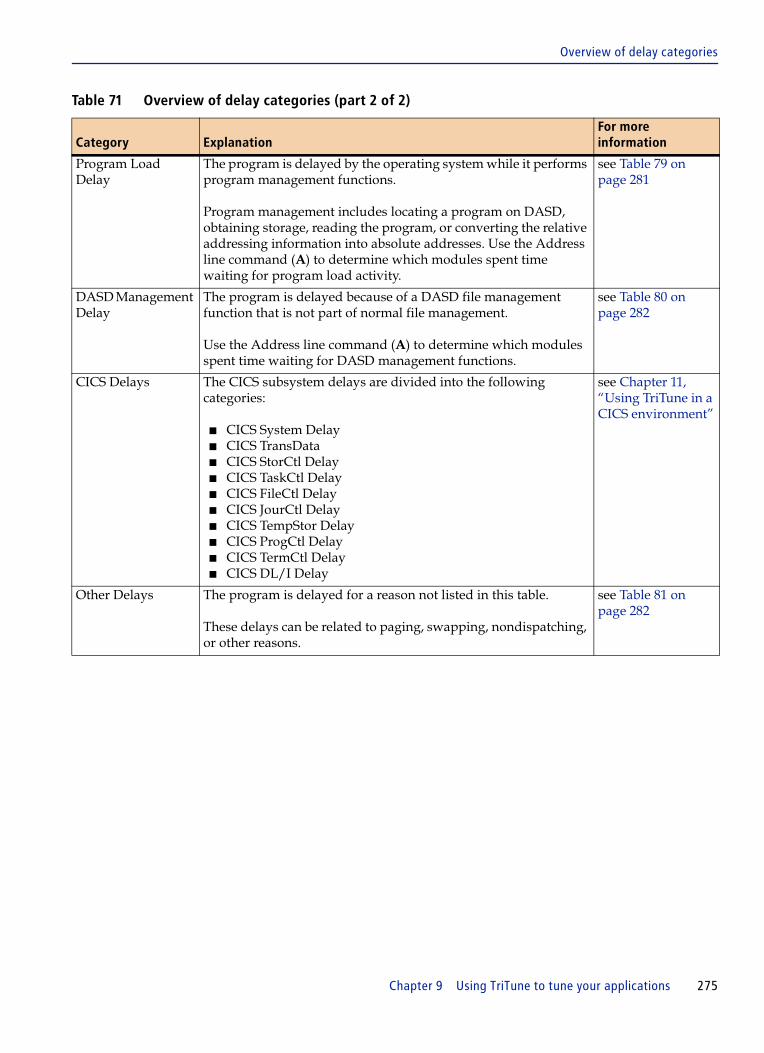
Overview of delay categories
Program Load Delay
The program is delayed by the operating system while it performs program management functions.
Program management includes locating a program on DASD, obtaining storage, reading the program, or converting the relative addressing information into absolute addresses. Use the Address line command (A) to determine which modules spent time waiting for program load activity.
see Table 79 on page 281
DASD Management Delay
The program is delayed because of a DASD file management function that is not part of normal file management.
Use the Address line command (A) to determine which modules spent time waiting for DASD management functions.
see Table 80 on page 282
CICS Delays The CICS subsystem delays are divided into the following categories:
■ CICS System Delay■ CICS TransData■ CICS StorCtl Delay■ CICS TaskCtl Delay■ CICS FileCtl Delay■ CICS JourCtl Delay■ CICS TempStor Delay■ CICS ProgCtl Delay■ CICS TermCtl Delay■ CICS DL/I Delay
see Chapter 11, “Using TriTune in a CICS environment”
Other Delays The program is delayed for a reason not listed in this table.
These delays can be related to paging, swapping, nondispatching, or other reasons.
see Table 81 on page 282
Table 71 Overview of delay categories (part 2 of 2)
Category ExplanationFor more information
Chapter 9 Using TriTune to tune your applications 275
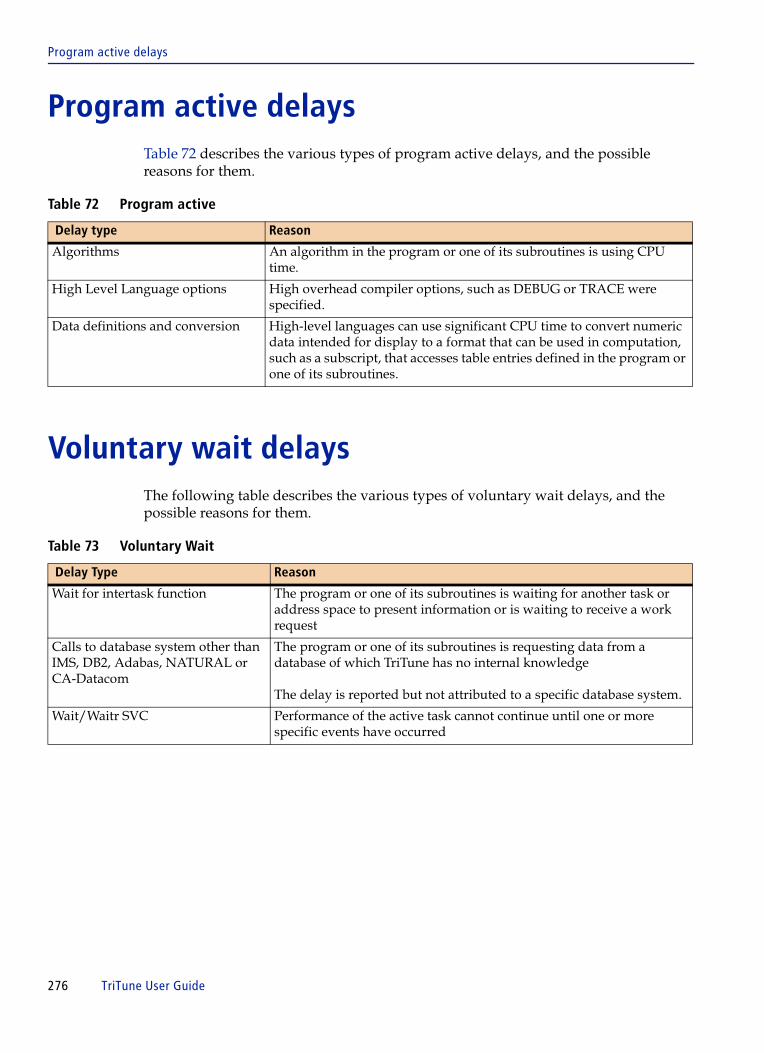
Program active delays
Program active delaysTable 72 describes the various types of program active delays, and the possible reasons for them.
Voluntary wait delaysThe following table describes the various types of voluntary wait delays, and the possible reasons for them.
Table 72 Program active
Delay type Reason
Algorithms An algorithm in the program or one of its subroutines is using CPU time.
High Level Language options High overhead compiler options, such as DEBUG or TRACE were specified.
Data definitions and conversion High-level languages can use significant CPU time to convert numeric data intended for display to a format that can be used in computation, such as a subscript, that accesses table entries defined in the program or one of its subroutines.
Table 73 Voluntary Wait
Delay Type Reason
Wait for intertask function The program or one of its subroutines is waiting for another task or address space to present information or is waiting to receive a work request
Calls to database system other than IMS, DB2, Adabas, NATURAL or CA-Datacom
The program or one of its subroutines is requesting data from a database of which TriTune has no internal knowledge
The delay is reported but not attributed to a specific database system.
Wait/Waitr SVC Performance of the active task cannot continue until one or more specific events have occurred
276 TriTune User Guide
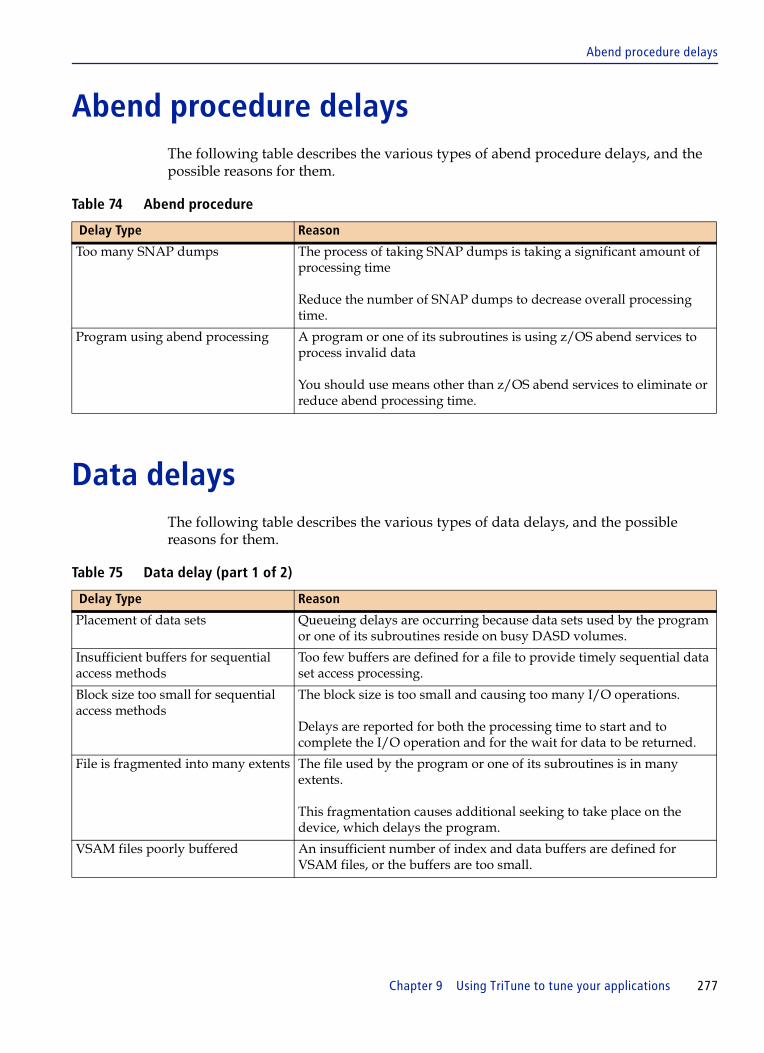
Abend procedure delays
Abend procedure delaysThe following table describes the various types of abend procedure delays, and the possible reasons for them.
Data delaysThe following table describes the various types of data delays, and the possible reasons for them.
Table 74 Abend procedure
Delay Type Reason
Too many SNAP dumps The process of taking SNAP dumps is taking a significant amount of processing time
Reduce the number of SNAP dumps to decrease overall processing time.
Program using abend processing A program or one of its subroutines is using z/OS abend services to process invalid data
You should use means other than z/OS abend services to eliminate or reduce abend processing time.
Table 75 Data delay (part 1 of 2)
Delay Type Reason
Placement of data sets Queueing delays are occurring because data sets used by the program or one of its subroutines reside on busy DASD volumes.
Insufficient buffers for sequential access methods
Too few buffers are defined for a file to provide timely sequential data set access processing.
Block size too small for sequential access methods
The block size is too small and causing too many I/O operations.
Delays are reported for both the processing time to start and to complete the I/O operation and for the wait for data to be returned.
File is fragmented into many extents The file used by the program or one of its subroutines is in many extents.
This fragmentation causes additional seeking to take place on the device, which delays the program.
VSAM files poorly buffered An insufficient number of index and data buffers are defined for VSAM files, or the buffers are too small.
Chapter 9 Using TriTune to tune your applications 277

Data delays
VSAM files use share options (4,4) When VSAM data sets must be open in more than one address space for updating, each application must use share options that preserve the integrity of the data
When these share options are used, each read requires an I/O operation to refresh the data because another address space might have updated the data.
Insufficient buffers for VSAM files that use local or global shared resources
If a program uses VSAM shared resources for multiple files to better utilize virtual memory, not having enough buffers of a required size causes delays waiting for buffers to become available
This situation is especially important for read operations because the intent is to find the data in the memory buffer as often as possible.
Reduce data delays by tuning the buffers to the workload that uses the buffer pool.
DB2 SQL process time An application might spend an inordinate amount of time waiting for data to be returned for an SQL statement
This problem can be caused by excessive page scans if an INDEX is not available to speed the data retrieval. For more information about SQL delays, see Chapter 10, “Using TriTune in a DB2 environment.”
IMS database process time An application might spend inordinate amounts of time waiting for data from an IMS database to be returned
For more information about IMS delays, see Chapter 12, “Using TriTune in an IMS environment.”
Table 75 Data delay (part 2 of 2)
Delay Type Reason
278 TriTune User Guide

Resource conflict delays
Resource conflict delaysThe following table describes the various types of resource conflict delays, and the possible reasons for them.
Table 76 Resource conflict delays
Delay Type Reason
Data set in use by another application
When jobs are executed concurrently, z/OS provides data integrity by using system-wide enqueues.
If a job allocates a data set by using DISP=SHR, it has concurrent access, but each program must ensure data integrity. If a job allocates a data set by using DISP=OLD, the z/OS operating system provides data integrity and requires all other programs to wait until the data set is free.
Reduce resource conflicts by ensuring that jobs use the same resources in a serial manner.
Logical resources in use by another application
z/OS provides the ENQUEUE/DEQUEUE facility to ensure that logical resources are protected when multiple jobs or tasks require serialization.
For example, when the program uses the ENQUEUE facility to provide a queueing function for a server task, the requesting tasks waiting in ENQUEUE are delayed.
Reduce resource conflicts, caused when queueing is emulated with the ENQ/DEQ services, by using another queueing algorithm.
Chapter 9 Using TriTune to tune your applications 279

System active delays
System active delaysThe following table describes the various types of system active delays, and the possible reasons for them.
Table 77 System active delays
Delay Type Reason
Repeated calling of DATE/TIME services
A program or one of its subroutines repeatedly calls the date/time operating system services.
Reduce this type of delay by obtaining the date once and use it for the entire program execution.
Excessive storage management activity
A program or one of its subroutines is allocating and freeing areas of virtual memory excessively.
Storage management is an expensive function that causes application delays if not properly utilized.
You can reduce delays resulting from excessive storage management by designing the program to allocate and free storage less frequently.
Excessive use of timer services
A program or one of its subroutines uses the timers provided by z/OS or an application enabler such as CICS, to control a time-dependent feature of the application.
Timer services should be used sparingly since their use can cause system delays.
Extensive security calls A security system protects all physical and logical system resources, and calls to the protection routines are causing excessive CPU use.
Excessive security implementation in an online environment can account for up to 10 percent of processor usage.
280 TriTune User Guide
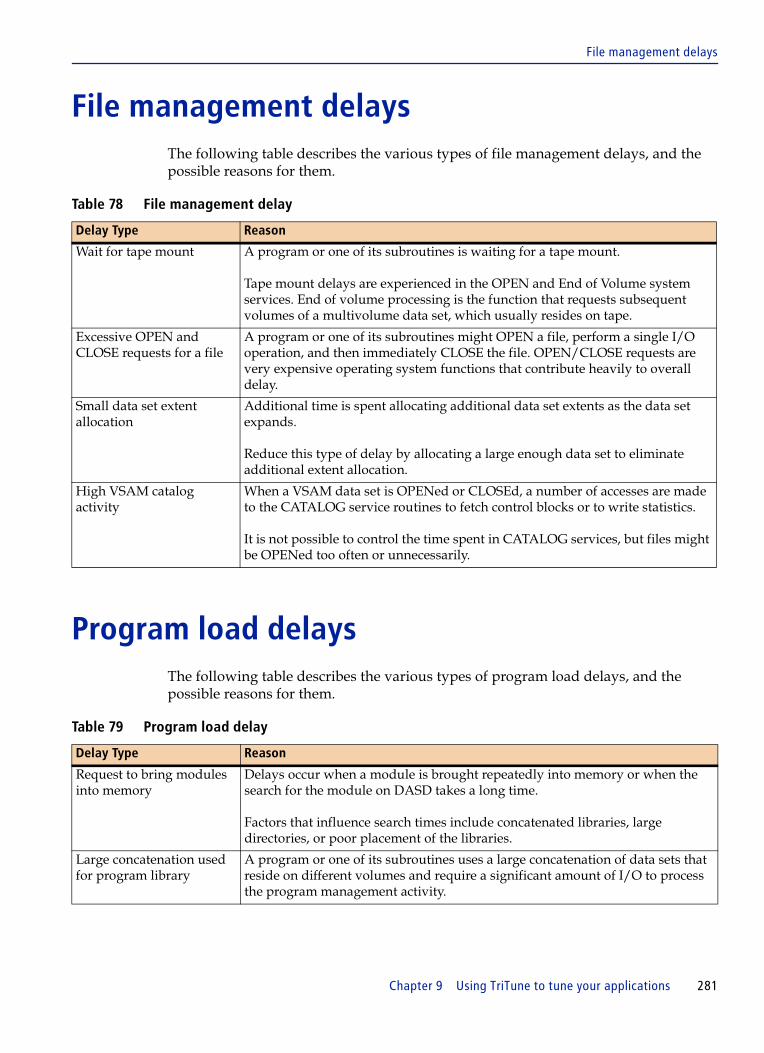
File management delays
File management delaysThe following table describes the various types of file management delays, and the possible reasons for them.
Program load delaysThe following table describes the various types of program load delays, and the possible reasons for them.
Table 78 File management delay
Delay Type Reason
Wait for tape mount A program or one of its subroutines is waiting for a tape mount.
Tape mount delays are experienced in the OPEN and End of Volume system services. End of volume processing is the function that requests subsequent volumes of a multivolume data set, which usually resides on tape.
Excessive OPEN and CLOSE requests for a file
A program or one of its subroutines might OPEN a file, perform a single I/O operation, and then immediately CLOSE the file. OPEN/CLOSE requests are very expensive operating system functions that contribute heavily to overall delay.
Small data set extent allocation
Additional time is spent allocating additional data set extents as the data set expands.
Reduce this type of delay by allocating a large enough data set to eliminate additional extent allocation.
High VSAM catalog activity
When a VSAM data set is OPENed or CLOSEd, a number of accesses are made to the CATALOG service routines to fetch control blocks or to write statistics.
It is not possible to control the time spent in CATALOG services, but files might be OPENed too often or unnecessarily.
Table 79 Program load delay
Delay Type Reason
Request to bring modules into memory
Delays occur when a module is brought repeatedly into memory or when the search for the module on DASD takes a long time.
Factors that influence search times include concatenated libraries, large directories, or poor placement of the libraries.
Large concatenation used for program library
A program or one of its subroutines uses a large concatenation of data sets that reside on different volumes and require a significant amount of I/O to process the program management activity.
Chapter 9 Using TriTune to tune your applications 281

DASD management delays
DASD management delaysThe following table describes the various types of DASD management delays, and the possible reasons for them.
Other delaysThe following table describes the various other types of delays, and the possible reasons for them.
Table 80 DASD management delay
Delay Type Reason
Insufficient space allocated initially for the data set
If the job JCL allocates too little space for a data set, z/OS allocates secondary extents as necessary to hold all the data.
The data set allocated should be large enough to hold all of the data initially, preventing unnecessary allocations from taking place.
Table 81 Other delays
Delay Type Reason
Demand paging One or more of the following situations might be present in the program or in one of the subroutines it calls:
■ a program is link-edited inefficiently■ data arrays are used incorrectly■ too many data buffers are specified
VIO paging VIO data sets are simulated files that can significantly reduce I/O delays.
They are essentially paging files that are managed by z/OS. The only drawback is that, if the application requests a record that is not in the VIO panel, a page fault will occur that will not be processed concurrently with the application program and the application will experience delay.
Swapping This delay is caused when
■ the program or one of its subroutines is requesting system resources that are unavailable
■ the site’s tuning parameters are improperly set
282 TriTune User Guide

C h a p t e r 10
10 Using TriTune in a DB2 environmentTriTune is compatible with DB2 versions 5.1 or later.
This chapter describes the following topics:
Analyzing DB2 data. . . . . . . . . . . . . . . . . . . . . . . . . . . . . . . . . . . . . . . . . . . . . . . . . . . . . . 284Displaying the DB2 Statements panel from the DataView panel . . . . . . . . . . . . . 284Field descriptions for the DB2 Statements panel . . . . . . . . . . . . . . . . . . . . . . . . . . 286Command descriptions for the DB2 Statements panel . . . . . . . . . . . . . . . . . . . . . 290Displaying the DB2View panel from the Interactive Analysis panel . . . . . . . . . 293Describing the differences between DB2 Statements panel and the DB2View
panel . . . . . . . . . . . . . . . . . . . . . . . . . . . . . . . . . . . . . . . . . . . . . . . . . . . . . . . . . . . . . 297Field descriptions for the DB2View panel . . . . . . . . . . . . . . . . . . . . . . . . . . . . . . . . 298Command descriptions for the DB2View panel . . . . . . . . . . . . . . . . . . . . . . . . . . . 302
Using Analyze+ to access DB2 Explain data . . . . . . . . . . . . . . . . . . . . . . . . . . . . . . . . . 304Benefits of Analyze+ . . . . . . . . . . . . . . . . . . . . . . . . . . . . . . . . . . . . . . . . . . . . . . . . . . 304Installation requirements for Analyze+ . . . . . . . . . . . . . . . . . . . . . . . . . . . . . . . . . . 306Customization requirements for Analyze+ . . . . . . . . . . . . . . . . . . . . . . . . . . . . . . . 306Analyzing SQL statements with Analyze+ . . . . . . . . . . . . . . . . . . . . . . . . . . . . . . . 307
Using the Explain function . . . . . . . . . . . . . . . . . . . . . . . . . . . . . . . . . . . . . . . . . . . . . . . . 308Explaining an SQL statement . . . . . . . . . . . . . . . . . . . . . . . . . . . . . . . . . . . . . . . . . . 309Using information on the Explain panel . . . . . . . . . . . . . . . . . . . . . . . . . . . . . . . . . 311Displaying Rule Messages . . . . . . . . . . . . . . . . . . . . . . . . . . . . . . . . . . . . . . . . . . . . . 312Displaying statement details and long names . . . . . . . . . . . . . . . . . . . . . . . . . . . . 313Displaying a DECLARE Statement. . . . . . . . . . . . . . . . . . . . . . . . . . . . . . . . . . . . . . 315
Using the DB2 Intercept facility . . . . . . . . . . . . . . . . . . . . . . . . . . . . . . . . . . . . . . . . . . . . 316How TriTune performs sampling . . . . . . . . . . . . . . . . . . . . . . . . . . . . . . . . . . . . . . . 316Specifying DB2 Intercept options . . . . . . . . . . . . . . . . . . . . . . . . . . . . . . . . . . . . . . . 317
NOTE After you have monitored your application, you can begin analysis.
You must specify DB2 system information prior to monitoring either automatically using product customization, or manually (see the TriTune Installation and Customization Guide).
Chapter 10 Using TriTune in a DB2 environment 283

Analyzing DB2 data
Analyzing DB2 data Delays in processing SQL statements are usually caused by improperly designed applications and databases, inadequate indexing, and programming errors. TriTune can help identify application problems that occur when performing the following activities:
■ designing the application program■ determining when an application should be rebound■ determining the access path chosen for a query■ designing the database
TriTune enables you to analyze DB2 data to the SQL statement level.
Displaying the DB2 Statements panel from the DataView panel
Displaying the DB2 Statements panel from the DataView panel shows the monitored activity of DB2 and which SQL statements were consuming CPU during the monitoring period. The display shows measurements collected from only sampled SQL. To view DB2 Intercept data on the DB2 Statements panel, you can use the S (Select SQL) line command.
Use the following steps to see the SQL statements for a DB2 job:
1 Select Option 5 from the Interactive Analysis menu to display the DataView panel (Figure 127).
Figure 127 DataView for a DB2 environment
TriTune -------------------------- DataView ------------------ ROW 1 to 9 of 9 COMMAND ===> SCROLL ===> CSR Primary commands: LINklist on/off Profile: D281COB Line commands: S - Select Options: NORMAL Linklist: OFF LC DD name Dataset name Delay% Visual ________ ____________________________________________ ______ __________ >------------------------------------------------------------------------------__ .DB2 DB2 Statement Delay 6.85 =========> __ JOBLIB DB2.RUNLIB.LOAD 2.07 ==> __ CARDIN ABCDEF4.D241COB.JOB00405.D0000103.? 0.00 __ JOBLIB DSN810.SDSNEXIT 0.00 __ JOBLIB DSN810.SDSNLOAD 0.00 __ JOBLIB SYS1.VSCOBII.SYS.COB2LIB 0.00 __ REPORT ABCDEF4.D241COB.JOB00405.D0000108.? 0.00 __ SYSTSIN ABCDEF4.D241COB.JOB00405.D0000102.? 0.00 __ SYSTSPRT ABCDEF4.D241COB.JOB00405.D0000104.? 0.00
284 TriTune User Guide

Analyzing DB2 data
2 Type S next to.DB2 in the DD name field.
3 Press Enter.
The DB2 Statements panel (Figure 128) is displayed:
Figure 128 DB2 Statements panel selected from DataView panel
The DB2 Statements panel is sorted by the Totl% field. Statements with the highest overall delay appear at the top. After you identify the statement that caused an excessive delay, use the Explain function to perform further analysis of how DB2 is processing the SQL statement. For information, see “Using Analyze+ to access DB2 Explain data” on page 304.
TriTune ---------------------- DB2 Statements ------------- Row 1 to 15 of 28COMMAND ===> SCROLL ===> HALF
Primary Commands: ADDHelp, SQL all/sampled, SEQ (sort) Profile: SEG2 Options: NORMAL Line commands: S - Select SQL E - Explain SQL SQL: Sampled SD - Show Declare R - Rule Messages Sort: Activity C - Code Details D - Statement Detail A - Analyze+
DBRM or D DeclareLC Package S Stmt Num Type Stmt Actv% Wait% Totl% Visual Length ________ _ ________ ________ _______ _____ _____ _____ __________ ______>------------------------------------------------------------------------------__ STPROC81 S 315 FETCH NA 0.00 37.84 37.84 =========> 145__ G81PROG S 350 FETCH NA 22.79 4.36 27.15 ======> 145__ STPROC81 S 189 OPEN NA 0.00 4.63 4.63 > 317__ STPROC81 S 197 FETCH NA 0.00 4.53 4.53 > 317__ STPROC81 S 267 OPEN NA 0.00 4.32 4.32 > 317__ G81PROG S 302 OPEN NA 2.58 0.76 3.35 317__ G81PROG S 224 OPEN NA 2.59 0.56 3.15 317__ G81PROG S 232 FETCH NA 2.20 0.28 2.48 317__ STPROC81 S 228 OPEN NA 0.00 1.47 1.47 317__ G81PROG S 44 OPEN NA 0.58 0.55 1.13 315__ G81PROG S 263 OPEN NA 0.56 0.24 0.79 317__ STPROC81 S 27 OPEN NA 0.00 0.79 0.79 315__ STPROC81 S 128 SELECT NA 0.00 0.74 0.74 208__ STPROC81 S 97 SELECT NA 0.00 0.73 0.73 209__ STPROC81 S 67 SELECT NA 0.00 0.71 0.71 203
Chapter 10 Using TriTune in a DB2 environment 285

Analyzing DB2 data
Field descriptions for the DB2 Statements panel
The fields that are displayed on the DB2 Statements panel are described in Table 82.
Table 82 DB2 Statements fields (part 1 of 5)
Field Description
DBRM or Package displays the name of a package (DBRM) which describes the SQL statement
D S indicates the type of SQL being executed
This value can be either D for Dynamic or S for Static SQL.
Stmt Num displays the number of the unique SQL statement that is contained in a Package or Plan
Type indicates the type of operation that is being performed with the statement
Declare Stmt displays the statement number of the DECLARE that is associated with the statement or NA if no DECLARE is associated with the statement
Actv% shows the percentage of the monitored period that TriTune detected CPU utilization attributed to the processing of the SQL statement
Wait% indicates the percentage of the monitored period that TriTune detected a wait state attributed to the processing of the SQL statement
Totl% indicates the sum of the Actv% and Wait% fields
Visual shows a visual representation of the Totl% field for the SQL statement
Length displays the length of the SQL statement
The statement has had all extra spaces removed.
Unique Samples displays the number of times during the monitoring session that TriTune detected this SQL statement executing while taking the first sample of an occurrence of this SQL statement
Total Samps displays the count of all samples when TriTune detected any occurrence of this SQL statement
MaxConc Samps displays the maximum number of times a single instance of an SQL statement was sampled
This value is an estimate of the longest running SQL statement encountered during sampling.
Total Count displays the number of times during the monitoring session that TriTune detected this SQL statement executing
A zero in this field indicates that this statement was not intercepted and the data being presented was obtained by the observation and sampling process.
Total CPU displays the amount of CPU time in seconds needed by DB2 to process all DB2 calls for this SQL statement by using sampling data collected during the measurement
CPU-P-Call displays the amount of CPU time in seconds needed by DB2 to process each DB2 call for this SQL statement by using sampling data collected during the measurement
Total Resp Time displays the total time (in seconds) for the SQL statement to be completed
Average Resp Time displays the average response time for the SQL statement to be completed
286 TriTune User Guide
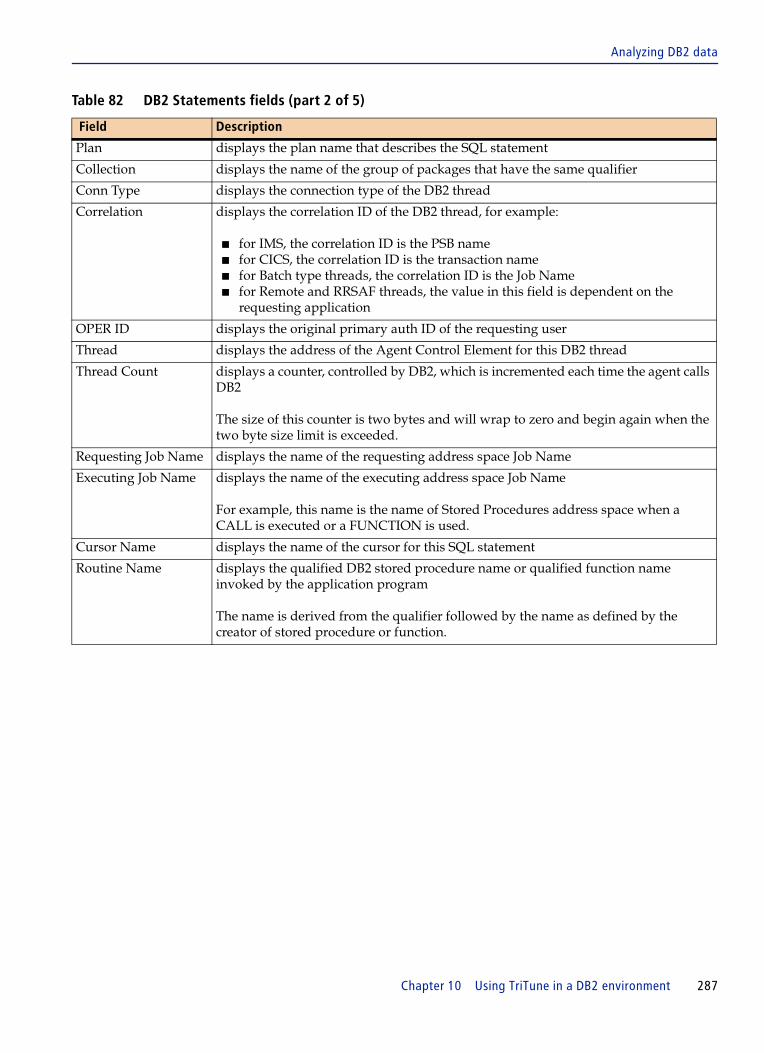
Analyzing DB2 data
Plan displays the plan name that describes the SQL statement
Collection displays the name of the group of packages that have the same qualifier
Conn Type displays the connection type of the DB2 thread
Correlation displays the correlation ID of the DB2 thread, for example:
■ for IMS, the correlation ID is the PSB name■ for CICS, the correlation ID is the transaction name■ for Batch type threads, the correlation ID is the Job Name■ for Remote and RRSAF threads, the value in this field is dependent on the
requesting application
OPER ID displays the original primary auth ID of the requesting user
Thread displays the address of the Agent Control Element for this DB2 thread
Thread Count displays a counter, controlled by DB2, which is incremented each time the agent calls DB2
The size of this counter is two bytes and will wrap to zero and begin again when the two byte size limit is exceeded.
Requesting Job Name displays the name of the requesting address space Job Name
Executing Job Name displays the name of the executing address space Job Name
For example, this name is the name of Stored Procedures address space when a CALL is executed or a FUNCTION is used.
Cursor Name displays the name of the cursor for this SQL statement
Routine Name displays the qualified DB2 stored procedure name or qualified function name invoked by the application program
The name is derived from the qualifier followed by the name as defined by the creator of stored procedure or function.
Table 82 DB2 Statements fields (part 2 of 5)
Field Description
Chapter 10 Using TriTune in a DB2 environment 287

Analyzing DB2 data
Get Pages displays the number of sequential and nonsequential GETPAGE requests issued for this SQL statement
This field addresses selectivity of the SQL statement and might indicate clustering problems.
When a GETPAGE request is made, the Buffer Manager checks if the page is already available in the pool. A high value can indicate a low selectivity of the SQL statement (database design) or a clustering problem.
Having a lot of GETPAGEs per SQL statement indicates that indexing of additional columns might improve performance. Every time a GETPAGE results in a hit (page being located in the pool), the application can begin processing the data immediately. Reducing this number improves performance.
In some cases, using compressed data results in an increase in the number of GETPAGEs, lock requests, and synchronous read I/Os. Sometimes, updated compressed rows cannot fit in the home page, and they must be stored in the overflow page. This condition can cause additional GETPAGE and lock requests.
If a page contains compressed fixed-length rows with no free space, an updated row probably has to be stored in the overflow page. To avoid the potential problem of more GETPAGE and lock requests, add more free space within the page. Start with 10% additional free space and adjust further, as needed. If, for example, 10% free space was used without compression, start with 20% free space with compression for most cases. This recommendation is especially important for data that is heavily updated.
Index Get Pages displays the number of Index GETPAGE requests issued for this SQL statement
Synch Read I/O displays the number of synchronous read pages issued for this SQL statement
Synchronous read I/Os are one type of physical DB2 I/O. They address the effectiveness of the DB2 buffer pools.
This value is the number of synchronous I/O operations. When a logical read operation results in a buffer pool miss, a synchronous read occurs.
Tuning Tip: Unnecessary read I/Os are one of the principal culprits in poorly tuned applications. While random I/O cannot be avoided, critical re-referenced indexes and tables can be kept in memory. At other times, the strategy is to get the data into memory before the application needs it, typically when processing the data pages sequentially. This procedure is done with prefetch and possibly with parallel processing.
Table 82 DB2 Statements fields (part 3 of 5)
Field Description
288 TriTune User Guide

Analyzing DB2 data
Asynch Pages Read displays the number of asynchronous pages read by prefetch operations that were issued for this SQL statement
Tuning Tip: Generally, unless the application is totally random, the higher the prefetch number, the more likely it is that the data will be in memory when needed. The more successful that read-ahead buffering is, the faster the application should perform.
Seq Prefetch displays the number of sequential prefetch requests that were issued for this SQL statement
Sequential prefetch is performed concurrently with other operations of the originating application program. It brings pages into the buffer pool before they are required and reads several pages with a single I/O operation. Sequential prefetch can be used to read data pages, by table space scans or index scans with clustered data reference. It can also be used to read index pages in an index scan. Sequential prefetch allows CP and I/O operations to be overlapped.
Tuning Tip: A buffer pool must be at least 1000 pages to get the full benefit of sequential prefetch. In addition, a sufficient number of sequential pages must be allowed in the buffer pool assigned to the accessed table (VPSEQT parameter). Otherwise, the prefetch quantity might be reduced, or prefetch disabled.
List Prefetch displays the number of list prefetch requests that were issued for this SQL statement
List prefetch reads a set of data pages determined by a list of RIDs (ROW IDs) taken from an index. The data pages need not be contiguous. The maximum number of pages that can be retrieved in a single list prefetch is 32 (64 for utilities). List prefetch can be used in conjunction with either single or multiple index access. List prefetch is used
■ usually with a single index that has a cluster ratio lower than 80%
■ sometimes on indexes with a high cluster ratio, if the estimated amount of data to be accessed is too small to make sequential prefetch efficient, but large enough to require more than one regular read
■ always to access data by multiple index access
■ always to access data from the inner table during a hybrid join
■ usually for updatable cursors when the index contains columns that might be updated
Table 82 DB2 Statements fields (part 4 of 5)
Field Description
Chapter 10 Using TriTune in a DB2 environment 289

Analyzing DB2 data
Command descriptions for the DB2 Statements panel
The line commands available on the DB2 Statements panel are described in Table 83.
Dynamic Prefetch displays the number of dynamic prefetch requests issued for this SQL statement
Dynamic prefetch can reduce paging and improve performance over sequential prefetch for some data access that involves data that is not on consecutive pages.
At runtime, dynamic prefetch might or might not actually be used. Dynamic prefetch is used in prefetch situations when the pages that DB2 will access are distributed in a nonconsecutive manner. If the pages are distributed in a sufficiently consecutive manner, sequential prefetch will be used instead.
Tuning Tip: Normally dynamic prefetch assists programs by providing read-ahead buffering for processing; GETPAGEs that would have to wait for synchronous I/O now find the page in the buffer pool. This number should be monitored because the more dynamic prefetch requests activated, the more buffer pool resources can be strained. It might be necessary to alter the buffer pool size or sequential steal threshold to manage increased demands of dynamic prefetch.
LOB Get Pages displays the number of GETPAGE requests issued to satisfy a Large OBject column SQL request
Table 83 DB2 Statements line commands (part 1 of 2)
Command Description
ADDHelp invokes the content-sensitive Help application to update or create a help entry for the selected content
SQL all/sampled switches between sample-based statements (which TriTune measured) or intercept-based data (all statements which executed) and the display is indicated by SQL: field
SEQuence switches between how the data is sorted (by measured activity of sequence of execution) as indicated by Sort: field
Select (S) is the SQL Statements panel (Figure 129 on page 292), which shows the full text of the selected SQL statement
Show Declare (SD) displays the DCL Statement panel (Figure 144 on page 315) which shows the DECLARE statement coded by the application programmer for this DB2 verb
This line command is valid for the OPEN, CLOSE, INSERT, DELETE, and FETCH verbs. Customization for the TriTune Explain function must be completed.
Explain (E) interacts with the Explain panel (Figure 140 on page 310) for the SQL statement
Customization for the TriTune Explain function must be completed.
Table 82 DB2 Statements fields (part 5 of 5)
Field Description
290 TriTune User Guide
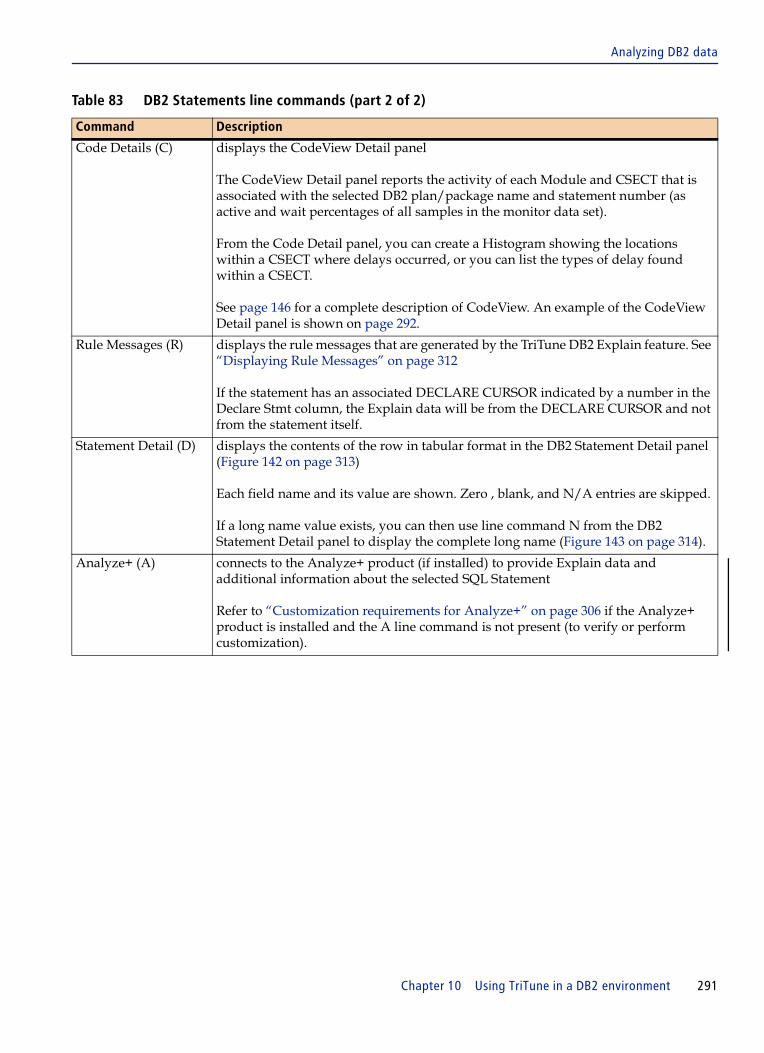
Analyzing DB2 data
Code Details (C) displays the CodeView Detail panel
The CodeView Detail panel reports the activity of each Module and CSECT that is associated with the selected DB2 plan/package name and statement number (as active and wait percentages of all samples in the monitor data set).
From the Code Detail panel, you can create a Histogram showing the locations within a CSECT where delays occurred, or you can list the types of delay found within a CSECT.
See page 146 for a complete description of CodeView. An example of the CodeView Detail panel is shown on page 292.
Rule Messages (R) displays the rule messages that are generated by the TriTune DB2 Explain feature. See “Displaying Rule Messages” on page 312
If the statement has an associated DECLARE CURSOR indicated by a number in the Declare Stmt column, the Explain data will be from the DECLARE CURSOR and not from the statement itself.
Statement Detail (D) displays the contents of the row in tabular format in the DB2 Statement Detail panel (Figure 142 on page 313)
Each field name and its value are shown. Zero , blank, and N/A entries are skipped.
If a long name value exists, you can then use line command N from the DB2 Statement Detail panel to display the complete long name (Figure 143 on page 314).
Analyze+ (A) connects to the Analyze+ product (if installed) to provide Explain data and additional information about the selected SQL Statement
Refer to “Customization requirements for Analyze+” on page 306 if the Analyze+ product is installed and the A line command is not present (to verify or perform customization).
Table 83 DB2 Statements line commands (part 2 of 2)
Command Description
Chapter 10 Using TriTune in a DB2 environment 291

Analyzing DB2 data
To select a DB2 statement, type S next to it. In this example (Figure 129), the SQL Statements panel is displayed after the first statement, number 315, is selected from Figure 128 on page 285.
Figure 129 SQL Statements panel
This panel displays the SQL text for the statement. Extra spaces have been removed from the statement text. TriTune obtains this SQL statement from DB2 space block (SPA).
Figure 130 CodeView Detail panel for DB2
TriTune ---------------------- SQL Statements ------------- Row 1 to 3 of 3COMMAND ===> SCROLL ===> HALF
DBRM name: G81PROG Profile: SEG2 Statement: 84 Stmt type: SELECT Timestamp: 07.075 19:14:55
Line commands: E - Explain R - Explain Rule Messages A - Analyze+
LC SQL Text ____________________________________________________________________________-------------------------------------------------------------------------------__ SELECT HEXROW , PACKROW , PRINTROW , NEGROW , CHARROW1 , CHARROW2 , CHARROW3 , CHARROW4 , CHARROW5 , CHARROW6 INTO : H , : H , : H , : H , : H , : H , : H , : H , : H , : H FROM DB2DATA WHERE HEXROW = 1********************************* End of Table ********************************
NOTE On some occasions DB2 does not load the current space block. In this event, the previously executed SQL statement is displayed instead of the current one. For more information, see the section titled “Analyzing SVC Dumps -- Finding the SQL Statement” in the DB2 manual Diagnosis Guide and Reference.
TriTune ------------------- CodeView Detail ---------------------- Row 1 of 14COMMAND ===> SCROLL ===> CSR Package/DBRM: TACIFL Statement Number: 2669 Profile: DB2SAMP Options: NORMAL Mode: CSECTPrimary commands: MOde Pseudo/Module/Csect/4GL, PSEudo, REGister, ADDHelp
Line commands: A - Associate C - Callerid D - Delays N - Long Name I - Info L - Listing S - Distribution H - Histogram NH - Normalized Histogram LC Module Csect Description L C Actv% Wait% Totl% Visual ________ ________ _________________________ _ _ _____ _____ _____ __________>------------------------------------------------------------------------------__ DSNIDM DSNISFS DM-TABLE SCAN TO EVALUATE A 2.02 0.00 2.02 __ DSNIDM DSNIDALC DM-DEALLOC THE DM SECTION A 0.01 0.00 0.01 __ DSNIDM DSNIRIDL DM-LOOP TO ENTER RID IN R A 0.01 0.00 0.01
292 TriTune User Guide

Analyzing DB2 data
Displaying the DB2View panel from the Interactive Analysis panel
You can also display the DB2View panel directly from the Interactive Analysis panel by selecting Option 10.
1 Select Option 10 from the Interactive Analysis menu (Figure 131) to display the DB2 View panel (Figure 132 on page 294).
Figure 131 Interactive Analysis panel: selection option 10
The DB2View panel is displayed (Figure 132 on page 294).
TriTune -------------------- Interactive Analysis ----------------------------OPTION ===>
Enter option to analyze the monitored job: Profile: DB2LONG1 Options: NORMAL TriTune Monitor Information Subsystem Details ------------------------------------------- ------------------------------ 0 OverView - Monitor session information 10 DB2 - View all SQL 1 TaskView - Activity by task 11 IMS - IMS Transactions 2 DelayView - Program delays 12 JVM - Java Virtual Machine 3 CodeView - Program activity 13 WAS - WebSphere App Server 4 TimeView - Samples by time 5 DataView - Dataset information 6 TranView - Activity by transaction 7 ModView - Module layout 8 PoolView - Buffer pools 9 USSView - Unix System Services Press END to exit analysis
Chapter 10 Using TriTune in a DB2 environment 293

Analyzing DB2 data
Figure 132 DB2View panel (part 1 of 5)
2 Scroll to the right to see additional data, as shown in the following figures:
■ Figure 133 on page 295■ Figure 134 on page 295■ Figure 135 on page 296■ Figure 136 on page 296
TriTune -------------------- DB2View ---------------------- Row 1 to 15 of 28COMMAND ===> SCROLL ===> HALF
Primary Commands: ADDHelp, SQL all/sampled, SEQ (sort) Profile: SEG2 Options: NORMAL Line commands: S - Select SQL E - Explain SQL SQL: All SD - Show Declare R - Rule Messages Sort: Sequence C - Code Details D - Statement Detail A - Analyze+
DBRM or D Total DeclareLC Package S Stmt Num Type Count Stmt Length Plan ________ _ ________ ________ _________ _______ ______ ________>------------------------------------------------------------------------------__ G81PROG S 782 CALL 0 NA 41 G81PRG06__ STPROC81 S 27 OPEN 0 NA 315 G81PRG06__ STPROC81 S 67 SELECT 0 NA 203 G81PRG06__ STPROC81 S 97 SELECT 0 NA 209 G81PRG06__ STPROC81 S 128 SELECT 0 NA 208 G81PRG06__ STPROC81 S 159 SELECT 0 NA 208 G81PRG06__ STPROC81 S 189 OPEN 0 NA 317 G81PRG06__ STPROC81 S 197 FETCH 0 NA 317 G81PRG06__ STPROC81 S 228 OPEN 0 NA 317 G81PRG06__ STPROC81 S 267 OPEN 0 NA 317 G81PRG06__ STPROC81 S 275 FETCH 0 NA 317 G81PRG06__ STPROC81 S 307 OPEN 0 NA 317 G81PRG06__ STPROC81 S 315 FETCH 0 NA 145 G81PRG06__ STPROC81 S 338 CLOSE 0 NA 145 G81PRG06__ G81PROG S 44 OPEN 0 NA 315 G81PRG06
NOTE In order to see this additional data, you must have the following settings defined in UTRPARM member, TUNSSP00:
■ DB2ICJLS=NO■ DB2ICNST=NO
294 TriTune User Guide

Analyzing DB2 data
Figure 133 DB2View panel (part 2 of 5)
Figure 134 DB2View panel (part 3 of 5)
TriTune ------------------------ DB2View ------------------- Row 12 to 20 of 2COMMAND ===> SCROLL ===> CSR
Primary Commands: ADDHelp, SQL all/sampled, SEQ (sort) Profile: Y81PROGB Options: ALL Line commands: S - Select SQL E - Explain SQL SQL: All SD - Show Declare R - Rule Messages Sort: Sequence C - Code Details D - Statement Detail A - Analyze+
DBRM or D Average Index SyncLC Package S Stmt Num Type Resp Time Get Pages Get Pages Read I/O ________ _ ________ ________ __________ __________ __________ __________<>-----------------------------------------------------------------------------__ Y81PROG S 271 CLOSE 0.000251 0 0 0__ Y81PROG S 279 OPEN 4.784306 15186 33 1__ Y81PROG S 287 FETCH 0.000251 0 0 0__ Y81PROG S 310 CLOSE 0.000250 0 0 0__ Y81PROG S 318 OPEN 8.068552 16231 33 11__ Y81PROG S 326 FETCH 1.593410 1015 0 1__ Y81PROG S 349 CLOSE 0.000310 0 0 0__ Y81PROG S 358 OPEN 0.090053 10 10 3__ Y81PROG S 366 FETCH 0.000158 4644 0 1********************************* End of Table ********************************
TriTune ------------------------ DB2View ------------------- Row 12 to 20 of 2COMMAND ===> SCROLL ===> CSR
Primary Commands: ADDHelp, SQL all/sampled, SEQ (sort) Profile: Y81PROGB Options: ALL Line commands: S - Select SQL E - Explain SQL SQL: All SD - Show Declare R - Rule Messages Sort: Sequence C - Code Details D - Statement Detail A - Analyze+
DBRM or D Async Seq List DynamicLC Package S Stmt Num Type Pages Read Pre Fetch Pre Fetch Pre Fetch ________ _ ________ ________ __________ __________ __________ __________<>-----------------------------------------------------------------------------__ Y81PROG S 271 CLOSE 0 0 0 0__ Y81PROG S 279 OPEN 15152 475 0 0__ Y81PROG S 287 FETCH 0 0 0 0__ Y81PROG S 310 CLOSE 0 0 0 0__ Y81PROG S 318 OPEN 15730 495 0 0__ Y81PROG S 326 FETCH 594 128 0 0__ Y81PROG S 349 CLOSE 0 0 0 0__ Y81PROG S 358 OPEN 0 0 0 0__ Y81PROG S 366 FETCH 4701 147 0 0********************************* End of Table ********************************
Chapter 10 Using TriTune in a DB2 environment 295

Analyzing DB2 data
Figure 135 DB2View panel (part 4 of 5)
Figure 136 DB2View panel (part 5 of 5)
TriTune ------------------------ DB2View ------------------- Row 12 to 20 of 2COMMAND ===> SCROLL ===> CSR
Primary Commands: ADDHelp, SQL all/sampled, SEQ (sort) Profile: Y81PROGB Options: ALL Line commands: S - Select SQL E - Explain SQL SQL: All SD - Show Declare R - Rule Messages Sort: Sequence C - Code Details D - Statement Detail A - Analyze+
DBRM or D LOB DeclareLC Package S Stmt Num Type Get Pages Stmt Length Plan ________ _ ________ ________ __________ _______ ______ ________<>-----------------------------------------------------------------------------__ Y81PROG S 271 CLOSE 0 485 9 Y81PRG00__ Y81PROG S 279 OPEN 0 467 8 Y81PRG00__ Y81PROG S 287 FETCH 0 467 77 Y81PRG00__ Y81PROG S 310 CLOSE 0 467 9 Y81PRG00__ Y81PROG S 318 OPEN 0 521 8 Y81PRG00__ Y81PROG S 326 FETCH 0 521 77 Y81PRG00__ Y81PROG S 349 CLOSE 0 521 9 Y81PRG00__ Y81PROG S 358 OPEN 0 539 8 Y81PRG00__ Y81PROG S 366 FETCH 0 539 77 Y81PRG00********************************* End of Table ********************************
TriTune ------------------------ DB2View ------------------- Row 12 to 20 of 2COMMAND ===> SCROLL ===> CSR
Primary Commands: ADDHelp, SQL all/sampled, SEQ (sort) Profile: Y81PROGB Options: ALL Line commands: S - Select SQL E - Explain SQL SQL: All SD - Show Declare R - Rule Messages Sort: Sequence C - Code Details D - Statement Detail A - Analyze+
DBRM or DLC Package S Stmt Num Type Collection Cursor Name ________ _ ________ ________ __________________ ____________________________<------------------------------------------------------------------------------__ Y81PROG S 271 CLOSE Y81PROGZ BT__ Y81PROG S 279 OPEN Y81PROGZ CT__ Y81PROG S 287 FETCH Y81PROGZ CT__ Y81PROG S 310 CLOSE Y81PROGZ CT__ Y81PROG S 318 OPEN Y81PROGZ DT__ Y81PROG S 326 FETCH Y81PROGZ DT__ Y81PROG S 349 CLOSE Y81PROGZ DT__ Y81PROG S 358 OPEN Y81PROGZ ET__ Y81PROG S 366 FETCH Y81PROGZ ET********************************* End of Table ********************************
296 TriTune User Guide
Analyzing DB2 data
Describing the differences between DB2 Statements panel and the DB2View panel
When you access the DB2 Statements panel from Option 5 (by way of the DataView panel), the DB2 statements are listed according to activity and represent only sampled data that you specified. The following fields are displayed for each activity:
■ Actv%■ Wait%■ Totl%
When you access the DB2View panel from Option 10 of the Interactive Analysis panel, the DB2 statements are listed in order of occurrence and reflect intercept data To view DB2 sampling data on the DB2 Statements panel, you can use the S (Select SQL) line command.
The following fields are not displayed automatically for each activity:
■ Actv%■ Wait%■ Totl%
You can use the CUST primary command to include these columns or other DB2 activity columns.
Chapter 10 Using TriTune in a DB2 environment 297
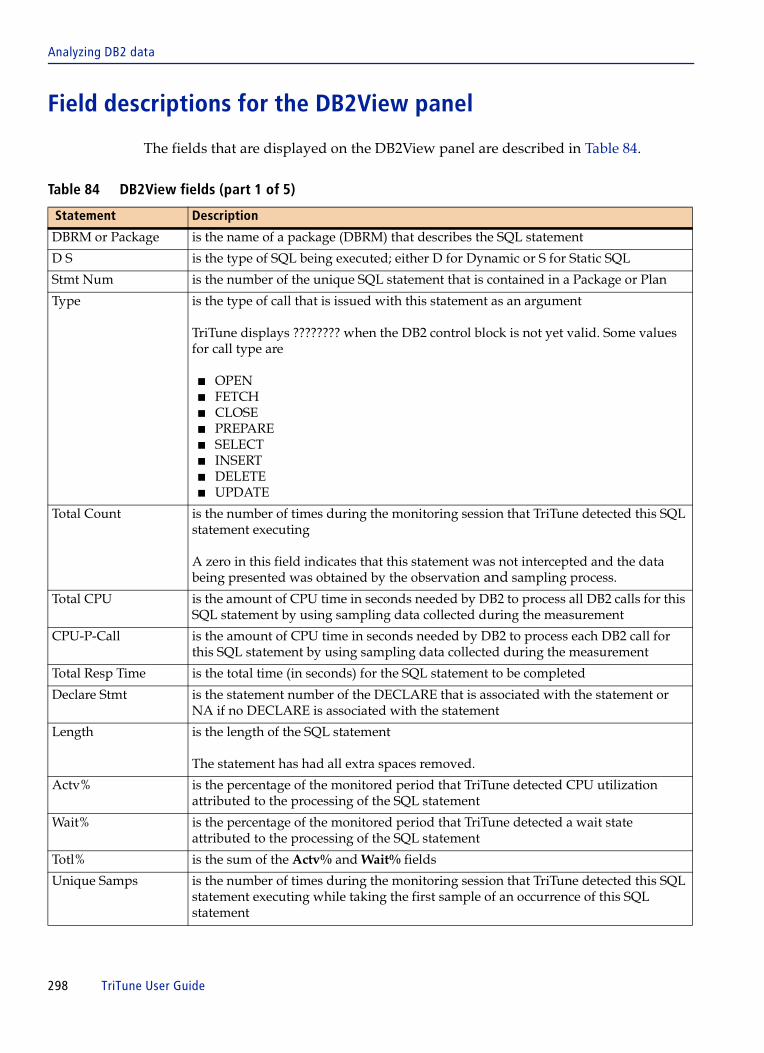
Analyzing DB2 data
Field descriptions for the DB2View panel
The fields that are displayed on the DB2View panel are described in Table 84.
Table 84 DB2View fields (part 1 of 5)
Statement Description
DBRM or Package is the name of a package (DBRM) that describes the SQL statement
D S is the type of SQL being executed; either D for Dynamic or S for Static SQL
Stmt Num is the number of the unique SQL statement that is contained in a Package or Plan
Type is the type of call that is issued with this statement as an argument
TriTune displays ???????? when the DB2 control block is not yet valid. Some values for call type are
■ OPEN ■ FETCH ■ CLOSE ■ PREPARE ■ SELECT ■ INSERT ■ DELETE ■ UPDATE
Total Count is the number of times during the monitoring session that TriTune detected this SQL statement executing
A zero in this field indicates that this statement was not intercepted and the data being presented was obtained by the observation and sampling process.
Total CPU is the amount of CPU time in seconds needed by DB2 to process all DB2 calls for this SQL statement by using sampling data collected during the measurement
CPU-P-Call is the amount of CPU time in seconds needed by DB2 to process each DB2 call for this SQL statement by using sampling data collected during the measurement
Total Resp Time is the total time (in seconds) for the SQL statement to be completed
Declare Stmt is the statement number of the DECLARE that is associated with the statement or NA if no DECLARE is associated with the statement
Length is the length of the SQL statement
The statement has had all extra spaces removed.
Actv% is the percentage of the monitored period that TriTune detected CPU utilization attributed to the processing of the SQL statement
Wait% is the percentage of the monitored period that TriTune detected a wait state attributed to the processing of the SQL statement
Totl% is the sum of the Actv% and Wait% fields
Unique Samps is the number of times during the monitoring session that TriTune detected this SQL statement executing while taking the first sample of an occurrence of this SQL statement
298 TriTune User Guide

Analyzing DB2 data
Total Samps is the count of all samples when TriTune detected any occurrence of this SQL statement
MaxConc Samps is the maximum number of times a single instance of an SQL statement was sampled
This value is an estimate of the longest running SQL statement encountered during sampling.
Average Resp Time is the average response time for the SQL statement to be completed
Plan is the plan name that describes the SQL statement
Collection is the name of the group of packages that have the same qualifier
Conn Type is the connection type of the DB2 thread
Correlation displays the correlation ID of the DB2 thread, for example:
■ for IMS, the correlation ID is the PSB name■ for CICS, the correlation ID is the transaction name■ for Batch type threads, the correlation ID is the Job Name■ for Remote and RRSAF threads, the value in this field is dependent on the
requesting application
OPER ID is the original primary auth ID of the requesting user
Thread is the address of the Agent Control Element for this DB2 thread
Thread Count is the counter, controlled by DB2, which is incremented each time the Agent calls DB2
The size of this counter is two bytes and will wrap to zero and begin again when the two byte size limit is exceeded.
Requesting Job Name is the name of the requesting address space Job Name
Executing Job Name is the name of the executing address space Job Name
For example, this value is the name of the Stored Procedures address space when a CALL is executed or a FUNCTION is used.
Cursor Name is the name of the cursor for this SQL statement
Routine Name is the qualified DB2 stored procedure name or qualified function name invoked by the application program
The name is derived from the qualifier followed by the name as defined by the creator of the stored procedure or function.
Table 84 DB2View fields (part 2 of 5)
Statement Description
Chapter 10 Using TriTune in a DB2 environment 299
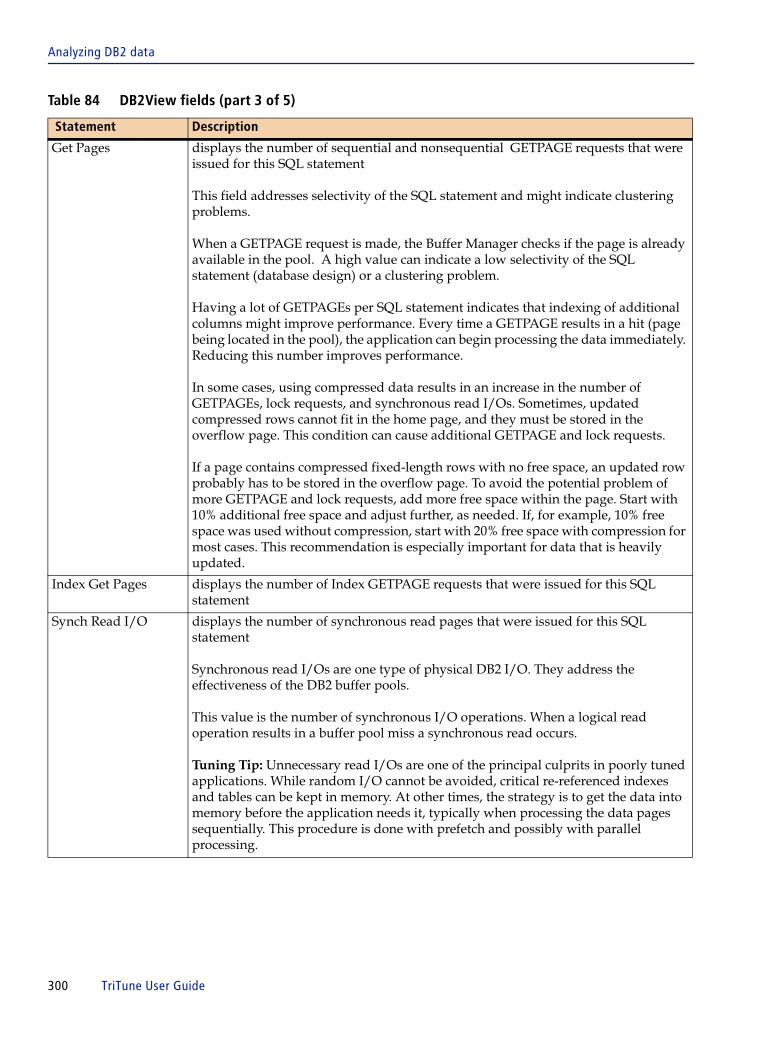
Analyzing DB2 data
Get Pages displays the number of sequential and nonsequential GETPAGE requests that were issued for this SQL statement
This field addresses selectivity of the SQL statement and might indicate clustering problems.
When a GETPAGE request is made, the Buffer Manager checks if the page is already available in the pool. A high value can indicate a low selectivity of the SQL statement (database design) or a clustering problem.
Having a lot of GETPAGEs per SQL statement indicates that indexing of additional columns might improve performance. Every time a GETPAGE results in a hit (page being located in the pool), the application can begin processing the data immediately. Reducing this number improves performance.
In some cases, using compressed data results in an increase in the number of GETPAGEs, lock requests, and synchronous read I/Os. Sometimes, updated compressed rows cannot fit in the home page, and they must be stored in the overflow page. This condition can cause additional GETPAGE and lock requests.
If a page contains compressed fixed-length rows with no free space, an updated row probably has to be stored in the overflow page. To avoid the potential problem of more GETPAGE and lock requests, add more free space within the page. Start with 10% additional free space and adjust further, as needed. If, for example, 10% free space was used without compression, start with 20% free space with compression for most cases. This recommendation is especially important for data that is heavily updated.
Index Get Pages displays the number of Index GETPAGE requests that were issued for this SQL statement
Synch Read I/O displays the number of synchronous read pages that were issued for this SQL statement
Synchronous read I/Os are one type of physical DB2 I/O. They address the effectiveness of the DB2 buffer pools.
This value is the number of synchronous I/O operations. When a logical read operation results in a buffer pool miss a synchronous read occurs.
Tuning Tip: Unnecessary read I/Os are one of the principal culprits in poorly tuned applications. While random I/O cannot be avoided, critical re-referenced indexes and tables can be kept in memory. At other times, the strategy is to get the data into memory before the application needs it, typically when processing the data pages sequentially. This procedure is done with prefetch and possibly with parallel processing.
Table 84 DB2View fields (part 3 of 5)
Statement Description
300 TriTune User Guide

Analyzing DB2 data
Asynch Pages Read displays the number of asynchronous pages read by prefetch operations that were issued for this SQL statement
Tuning Tip: Generally, unless the application is totally random, the higher the prefetch number, the more likely it is that the data will be in memory when needed. The more successful that read-ahead buffering is, the faster the application should perform.
Seq Prefetch displays the number of sequential prefetch requests that were issued for this SQL statement
Sequential prefetch is performed concurrently with other operations of the originating application program. It brings pages into the buffer pool before they are required and reads several pages with a single I/O operation. Sequential prefetch can be used to read data pages, by table space scans or index scans with clustered data reference. It can also be used to read index pages in an index scan. Sequential prefetch allows CP and I/O operations to be overlapped.
Tuning Tip: A buffer pool must be at least 1000 pages to get the full benefit of sequential prefetch. In addition, a sufficient number of sequential pages must be allowed in the buffer pool assigned to the accessed table (VPSEQT parameter). Otherwise, the prefetch quantity might be reduced, or prefetch disabled.
List Prefetch displays the number of list prefetch requests that were issued for this SQL statement
List prefetch reads a set of data pages determined by a list of RIDs (ROW IDs) taken from an index. The data pages need not be contiguous. The maximum number of pages that can be retrieved in a single list prefetch is 32 (64 for utilities). List prefetch can be used in conjunction with either single or multiple index access. List prefetch is used
■ usually with a single index that has a cluster ratio lower than 80%
■ sometimes on indexes with a high cluster ratio, if the estimated amount of data to be accessed is too small to make sequential prefetch efficient, but large enough to require more than one regular read
■ always to access data by multiple index access
■ always to access data from the inner table during a hybrid join
■ usually for updatable cursors when the index contains columns that might be updated
Table 84 DB2View fields (part 4 of 5)
Statement Description
Chapter 10 Using TriTune in a DB2 environment 301

Analyzing DB2 data
Command descriptions for the DB2View panel
The commands available on the DB2View panel are described in Table 85.
Dynamic Prefetch displays the number of dynamic prefetch requests issued for this SQL statement
Dynamic prefetch can reduce paging and improve performance over sequential prefetch for some data access that involves data that is not on consecutive pages.
At runtime, dynamic prefetch might or might not actually be used. Dynamic prefetch is used in prefetch situations when the pages that DB2 will access are distributed in a nonconsecutive manner. If the pages are distributed in a sufficiently consecutive manner, sequential prefetch will be used instead.
Tuning Tip: Normally dynamic prefetch assists programs by providing read-ahead buffering for processing; GETPAGEs that would have to wait for synchronous I/O now find the page in the buffer pool. This number should be monitored because the more dynamic prefetch requests activated, the more buffer pool resources can be strained. It might be necessary to alter the buffer pool size or sequential steal threshold to manage increased demands of dynamic prefetch.
LOB Get Pages displays the number of GETPAGE requests issued to satisfy a Large OBject column SQL request
Note: some fields might not be displayed automatically when data for those fields has not been collected.
Table 85 DB2View commands
Command Description
ADDHelp invokes the content-sensitive Help application to update or create a help entry for the selected content
SQL all/sampled switches between sample-based statements (which TriTune measured), or intercept-based data (all statements that executed)
The current display mode is indicated by SQL: field
SEQuence switches between how the data is sorted (by measured activity of sequence of execution) and is shown in the Sort: field
Select (S) is the SQL Statements panel (Figure 129 on page 292), which shows the full text of the selected SQL statement
Show Declare (SD) is the DCL Statement panel (Figure 144 on page 315), which show the DECLARE statement coded by the application programmer for this DB2 verb
This line command is valid for the OPEN, CLOSE, INSERT, DELETE, and FETCH verbs. Customization for the TriTune Explain function must have been completed.
Table 84 DB2View fields (part 5 of 5)
Statement Description
302 TriTune User Guide

Analyzing DB2 data
Explain (E) interacts with the Explain panel (Figure 140 on page 310) for the SQL statement.
Customization for the TriTune Explain function must have been completed.
Code Details (C) displays the CodeView Detail panel
The CodeView Detail panel reports the activity of each Module and CSECT that is associated with the selected DB2 plan/package name and statement number (as active and wait percentages of all samples in the monitor data set).
From the Code Detail panel, you can create a Histogram showing the locations within a CSECT where delays occurred, or you can list the types of delay found within a CSECT.
See page 146 for a complete description of CodeView.
An example of the CodeView Detail panel is shown on page 292.
Rule Messages (R) displays the rule messages that are generated by the TriTune DB2 Explain feature; see “Displaying Rule Messages” on page 312
If the statement has an associated DECLARE CURSOR indicated by a number in the Declare Stmt column, the Explain data will be from the DECLARE CURSOR and not from the statement itself.
Statement Detail (D) displays the contents of the row in tabular format in the DB2 Statement Detail panel (Figure 142 on page 313)
Each field name and its value are shown. Zero , blank, and N/A entries are skipped.
If a long name value exists, you can then use line command N from the DB2 Statement Detail panel to display the complete long name (Figure 143 on page 314).
Analyze+ (A) connects to the Analyze+ product (if installed) to provide Explain data and additional information about the selected SQL Statement
Refer to “Customization requirements for Analyze+” on page 306 if the Analyze+ product is installed and the A line command is not present (to verify or perform customization).
Table 85 DB2View commands
Command Description
Chapter 10 Using TriTune in a DB2 environment 303

Using Analyze+ to access DB2 Explain data
Using Analyze+ to access DB2 Explain dataYou can access the Analyze+ for DB2 z/OS product (if installed) to analyze SQL statements by using the A line command from each of the following TriTune panels:
■ DB2View■ DB2 Statements■ DB2 Statements—Transaction Detail■ SQL Statements
Benefits of Analyze+
Access to this Explain analysis tool provides many benefits. Analyze+ can
■ check SQL access paths and violations against predefined rules before programs are transferred into production
■ provide higher accuracy by using automated analysis of SQL, including DML and DDL
■ provide hints and recommendations with predefined rule sets for SQL analysis to improve the performance of the analyzed SQL statements
■ allow you to build site-specific rules with an easy-to-use online dialog
■ process both static and dynamic SQL and allow a mass analysis of DBRMs, packages, collections, and plans in either batch or online
■ provide the creation and maintenance of multiple shadow catalogs so that SQL analysis can be based on either the DB2 system catalog or one of the available shadow catalogs
■ capture and prepare both static and dynamic SQL (such as SQL executed by PeopleSoft, SAS, or SAP R/3) for further analysis using a low cost IFCID trace functionality, including statements and usage information in the dynamic statement cache
■ allow concentration on the most critical SQL through reports that list the SQL by the DB2 cost factor and violated rules
If the trace functionality is used, a lot of additional information (such as buffer activity or elapsed time) is reported and can also serve as selection criteria.
304 TriTune User Guide
Using Analyze+ to access DB2 Explain data
■ provide comprehensive information in addition to the EXPLAIN information from the PLAN_TABLE and DSN_STATEMNT_TABLE
Analyze+ reporting tools contain the complete SQL statement text, corresponding VIEW texts and encapsulations, the estimated costs from the DB2 optimizer, DB2 catalog statistics, hints and recommendations, and EXPLAIN information.
■ investigate predicates on the statement level and all VIEW levels for indexability and improve interpretation of EXPLAIN results by integrating the relevant catalog and runtime information into the Analyze+ exception report
■ provide information about the hidden access paths that are used when resolving referential integrity, such as referential constraints that are not fully supported by an index
■ provide certainty as to whether existing indexes are still used and how good they are
■ allow developers to easily analyze their SQL by using an edit macro before it gets checked during a compile procedure or is put into production
■ provide hints and tips on how to improve SQL statements without the need to involve a DBA
Chapter 10 Using TriTune in a DB2 environment 305

Using Analyze+ to access DB2 Explain data
Installation requirements for Analyze+
Access to this Explain analysis tool requires that you have the following software products installed:
■ Analyze+ for DB2 z/OS■ DB2 version 8
Customization requirements for Analyze+
After installation of the Analyze+ product, you must also perform the following customization steps in order to access this Explain analysis tool:
1 Copy member ADB2EXTN from the Analyze+ CNTL library to hilevel.UTRPARM.
ADB2EXTN is generated during the installation of Analyze+. ADB2EXTN identifies Analyze+ product libraries, allowing TriTune to interface with the product.
2 Start the TriTune client.
A check will be made for the ADB2EXTN parameter member.
If the parameter member is present, an A line command will be available on the DB2 Statements, DB2View, and SQL Statement panels. This command will allow you to invoke the Analyze+ product to analyze SQL statements.
306 TriTune User Guide
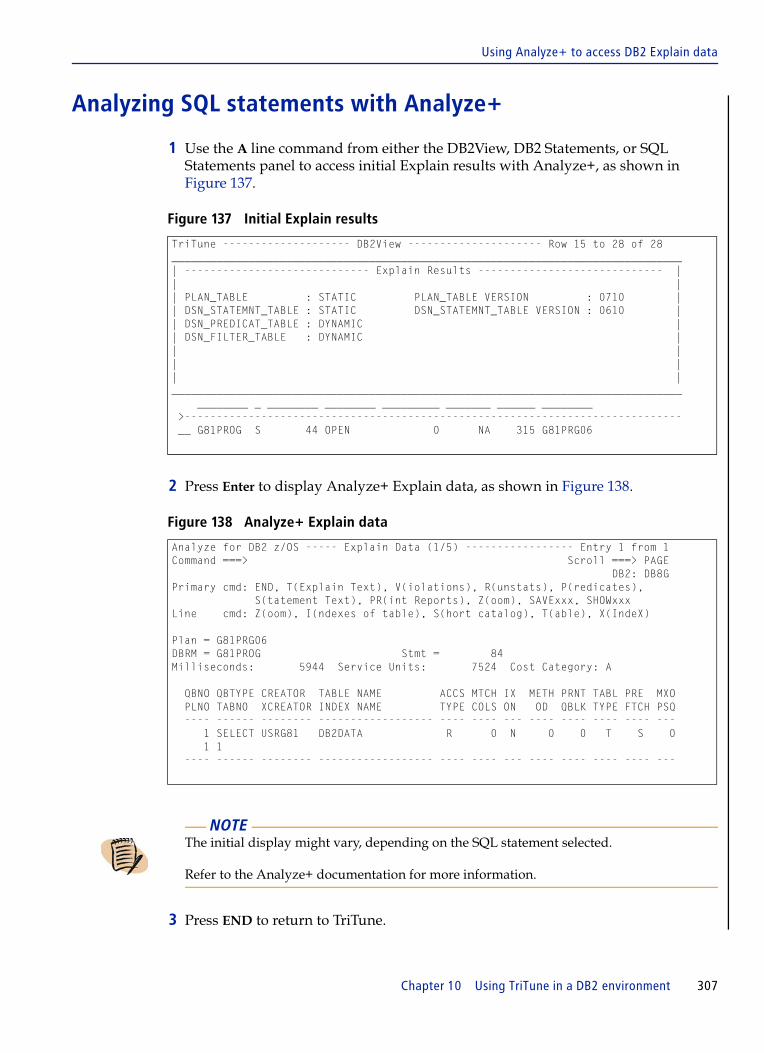
Using Analyze+ to access DB2 Explain data
Analyzing SQL statements with Analyze+
1 Use the A line command from either the DB2View, DB2 Statements, or SQL Statements panel to access initial Explain results with Analyze+, as shown in Figure 137.
Figure 137 Initial Explain results
2 Press Enter to display Analyze+ Explain data, as shown in Figure 138.
Figure 138 Analyze+ Explain data
3 Press END to return to TriTune.
TriTune -------------------- DB2View --------------------- Row 15 to 28 of 28________________________________________________________________________________| ----------------------------- Explain Results ----------------------------- || || PLAN_TABLE : STATIC PLAN_TABLE VERSION : 0710 || DSN_STATEMNT_TABLE : STATIC DSN_STATEMNT_TABLE VERSION : 0610 || DSN_PREDICAT_TABLE : DYNAMIC || DSN_FILTER_TABLE : DYNAMIC || || || |________________________________________________________________________________ ________ _ ________ ________ _________ _______ ______ ________ >------------------------------------------------------------------------------ __ G81PROG S 44 OPEN 0 NA 315 G81PRG06
Analyze for DB2 z/OS ----- Explain Data (1/5) ----------------- Entry 1 from 1Command ===> Scroll ===> PAGE DB2: DB8GPrimary cmd: END, T(Explain Text), V(iolations), R(unstats), P(redicates), S(tatement Text), PR(int Reports), Z(oom), SAVExxx, SHOWxxxLine cmd: Z(oom), I(ndexes of table), S(hort catalog), T(able), X(IndeX)
Plan = G81PRG06DBRM = G81PROG Stmt = 84Milliseconds: 5944 Service Units: 7524 Cost Category: A
QBNO QBTYPE CREATOR TABLE NAME ACCS MTCH IX METH PRNT TABL PRE MXO PLNO TABNO XCREATOR INDEX NAME TYPE COLS ON OD QBLK TYPE FTCH PSQ ---- ------ -------- ------------------ ---- ---- --- ---- ---- ---- ---- --- 1 SELECT USRG81 DB2DATA R 0 N 0 0 T S 0 1 1 ---- ------ -------- ------------------ ---- ---- --- ---- ---- ---- ---- ---
NOTE The initial display might vary, depending on the SQL statement selected.
Refer to the Analyze+ documentation for more information.
Chapter 10 Using TriTune in a DB2 environment 307

Using the Explain function
Using the Explain functionTo complement workload analysis, TriTune includes an integrated Explain function. This Explain function allows you to dynamically Explain either dynamic or static SQL statements.
You can display additional key information about the SQL statement using the Explain line command (E) on either the DB2 statements or the SQL Statements panels including
■ statistical and textual information about the access path ■ suggestions about how to improve SQL statement performance
Refer to Figure 140 on page 310 to see an example of the output from the Explain line command.
TriTune product customization or DB2 creates a small database of rules that TriTune uses to provide recommendations that you can use in an attempt to improve DB2 performance by using the output from the DB2 Explains. The TriTune DB2 plan must be bound to include the required four packages that are needed for the CAF and Explain interfaces.
The Explain function that is used by TriTune is also used by other BMC Software DB2 products. TriTune returns a return code of 04 when you perform a BIND of the TriTune DB2 Plan because the DB2 SQL Explorer product uses some tables that are not used in the TriTune Explain API. This situation results in SQL error -204 which you can ignore when it occurs for the following tables:
■ BMCPSS_BASE ■ BMCPSS_STATS ■ BMCPSS_SQLTXT
In addition, if you receive an SQL error -805 when you are requesting Explain data, this SQL error indicates that you must rebind the TriTune plan to ensure that the Explain packages are included.
The sample BIND statements in Figure 139 show the package names that are required to be bound in the TriTune DB2 plan. The BIND for the TriTune DB2 Plan is distributed in TRSAMP member TNCEBND. A return code of 04 from the BIND process is normal.
Figure 139 Sample BIND statements (part 1 of 2)
DSN SYSTEM(DECE) BIND PACKAGE(TRI40) MEMBER(TNMADB2M) + QUALIFIER(TRI40DB2) + ACTION(REP) ISOLATION(CS) + RELEASE(COMMIT) +
308 TriTune User Guide
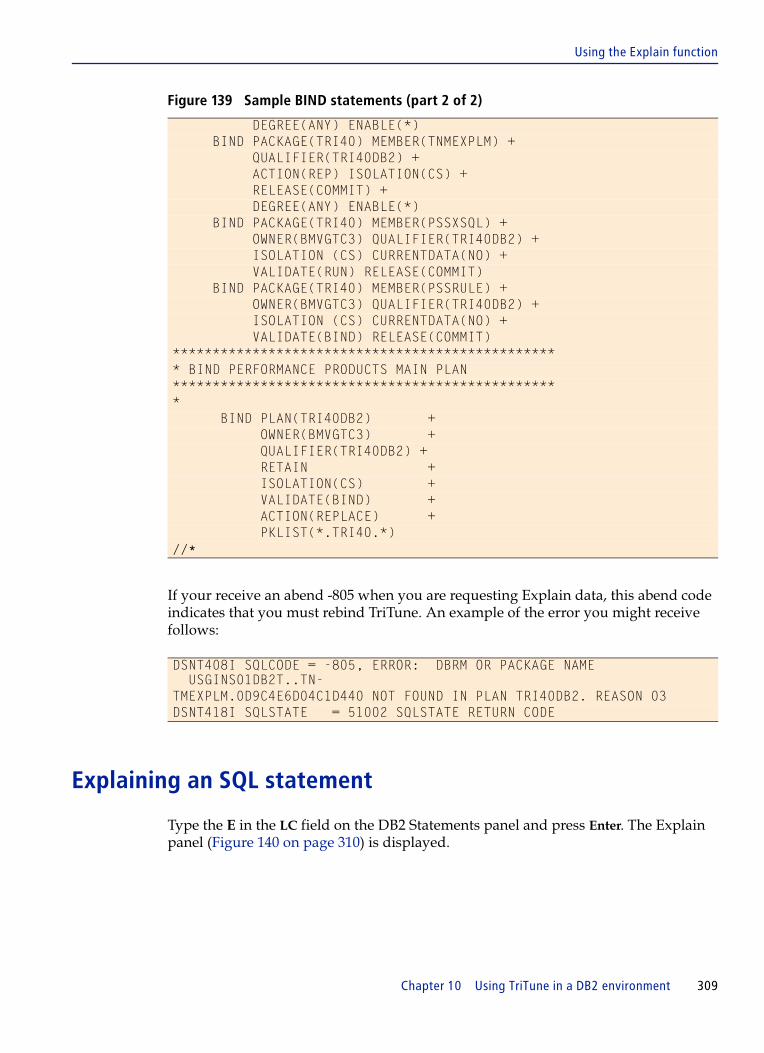
Using the Explain function
If your receive an abend -805 when you are requesting Explain data, this abend code indicates that you must rebind TriTune. An example of the error you might receive follows:
Explaining an SQL statement
Type the E in the LC field on the DB2 Statements panel and press Enter. The Explain panel (Figure 140 on page 310) is displayed.
DEGREE(ANY) ENABLE(*) BIND PACKAGE(TRI40) MEMBER(TNMEXPLM) + QUALIFIER(TRI40DB2) + ACTION(REP) ISOLATION(CS) + RELEASE(COMMIT) + DEGREE(ANY) ENABLE(*) BIND PACKAGE(TRI40) MEMBER(PSSXSQL) + OWNER(BMVGTC3) QUALIFIER(TRI40DB2) + ISOLATION (CS) CURRENTDATA(NO) + VALIDATE(RUN) RELEASE(COMMIT) BIND PACKAGE(TRI40) MEMBER(PSSRULE) + OWNER(BMVGTC3) QUALIFIER(TRI40DB2) + ISOLATION (CS) CURRENTDATA(NO) + VALIDATE(BIND) RELEASE(COMMIT) ************************************************ * BIND PERFORMANCE PRODUCTS MAIN PLAN ************************************************ * BIND PLAN(TRI40DB2) + OWNER(BMVGTC3) + QUALIFIER(TRI40DB2) + RETAIN + ISOLATION(CS) + VALIDATE(BIND) + ACTION(REPLACE) + PKLIST(*.TRI40.*) //*
DSNT408I SQLCODE = -805, ERROR: DBRM OR PACKAGE NAME USGINS01DB2T..TN-TMEXPLM.0D9C4E6D04C1D440 NOT FOUND IN PLAN TRI40DB2. REASON 03DSNT418I SQLSTATE = 51002 SQLSTATE RETURN CODE
Figure 139 Sample BIND statements (part 2 of 2)
Chapter 10 Using TriTune in a DB2 environment 309
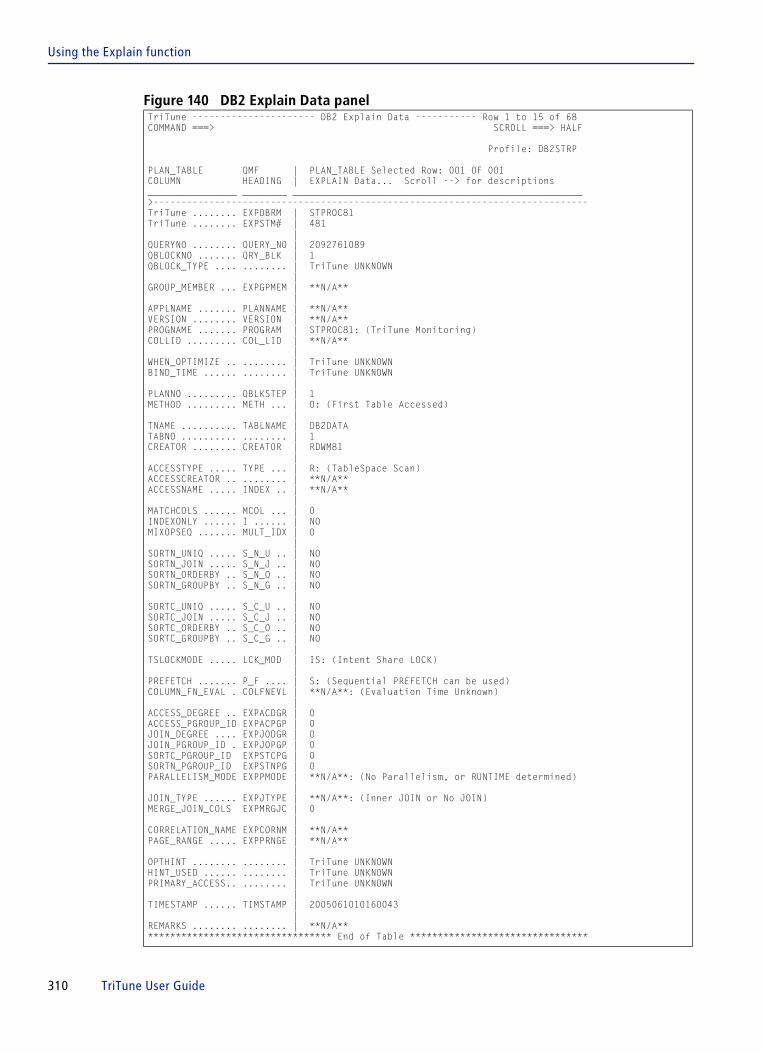
Using the Explain function
Figure 140 DB2 Explain Data panelTriTune ---------------------- DB2 Explain Data ----------- Row 1 to 15 of 68COMMAND ===> SCROLL ===> HALF
Profile: DB2STRP
PLAN_TABLE QMF | PLAN_TABLE Selected Row: 001 OF 001COLUMN HEADING | EXPLAIN Data... Scroll --> for descriptions________________ ________ ____________________________________________________>------------------------------------------------------------------------------TriTune ........ EXPDBRM | STPROC81TriTune ........ EXPSTM# | 481 |QUERYNO ........ QUERY_NO | 2092761089QBLOCKNO ....... QRY_BLK | 1QBLOCK_TYPE .... ........ | TriTune UNKNOWN |GROUP_MEMBER ... EXPGPMEM | **N/A** |APPLNAME ....... PLANNAME | **N/A**VERSION ........ VERSION | **N/A**PROGNAME ....... PROGRAM | STPROC81: (TriTune Monitoring)COLLID ......... COL_LID | **N/A** |WHEN_OPTIMIZE .. ........ | TriTune UNKNOWNBIND_TIME ...... ........ | TriTune UNKNOWN |PLANNO ......... QBLKSTEP | 1METHOD ......... METH ... | 0: (First Table Accessed) |TNAME .......... TABLNAME | DB2DATATABNO .......... ........ | 1CREATOR ........ CREATOR | RDWM81 |ACCESSTYPE ..... TYPE ... | R: (TableSpace Scan)ACCESSCREATOR .. ........ | **N/A**ACCESSNAME ..... INDEX .. | **N/A** |MATCHCOLS ...... MCOL ... | 0INDEXONLY ...... I ...... | NOMIXOPSEQ ....... MULT_IDX | 0 |SORTN_UNIQ ..... S_N_U .. | NOSORTN_JOIN ..... S_N_J .. | NOSORTN_ORDERBY .. S_N_O .. | NOSORTN_GROUPBY .. S_N_G .. | NO |SORTC_UNIQ ..... S_C_U .. | NOSORTC_JOIN ..... S_C_J .. | NOSORTC_ORDERBY .. S_C_O .. | NOSORTC_GROUPBY .. S_C_G .. | NO |TSLOCKMODE ..... LCK_MOD | IS: (Intent Share LOCK) |PREFETCH ....... P_F .... | S: (Sequential PREFETCH can be used)COLUMN_FN_EVAL . COLFNEVL | **N/A**: (Evaluation Time Unknown) |ACCESS_DEGREE .. EXPACDGR | 0ACCESS_PGROUP_ID EXPACPGP | 0JOIN_DEGREE .... EXPJODGR | 0JOIN_PGROUP_ID . EXPJOPGP | 0SORTC_PGROUP_ID EXPSTCPG | 0SORTN_PGROUP_ID EXPSTNPG | 0PARALLELISM_MODE EXPPMODE | **N/A**: (No Parallelism, or RUNTIME determined) |JOIN_TYPE ...... EXPJTYPE | **N/A**: (Inner JOIN or No JOIN)MERGE_JOIN_COLS EXPMRGJC | 0 |CORRELATION_NAME EXPCORNM | **N/A**PAGE_RANGE ..... EXPPRNGE | **N/A** |OPTHINT ........ ........ | TriTune UNKNOWNHINT_USED ...... ........ | TriTune UNKNOWNPRIMARY_ACCESS.. ........ | TriTune UNKNOWN |TIMESTAMP ...... TIMSTAMP | 2005061010160043 |REMARKS ........ ........ | **N/A*********************************** End of Table ********************************
310 TriTune User Guide

Using the Explain function
Using information on the Explain panel
You can find out additional information about Explain and how its output can help you make performance evaluations of a particular SQL statement in the IBM manual, DB2 Application Programming and SQL Guide. Table 86 provides a partial list of the key issues you should attempt to resolve for long-running or often-used SQL.
Table 86 DB2 SQL problems
Problem description Solution
Index matching did not work An index was available for the table that was accessed, but no matching columns were found.
This situation is often a result of a difference in the length of the data item in the program and the length of the column in the DB2 table.
Not using Sequential Prefetch Sequential Prefetch reads multiple pages of a table into the buffer pool with a single I/O operation
This situation significantly reduces delays for SQL access when large amounts of data are accessed.
Not using List Prefetch List Prefetch is a way of accessing data pages efficiently
List Prefetch can be used in conjunction with either single or multiple index access.
Not specifying parallel operations Parallel operations specify that pages of a partitioned table might be prefetched by using multiple I/O streams
This solution improves access significantly.
Chapter 10 Using TriTune in a DB2 environment 311

Using the Explain function
Displaying Rule Messages
Type R in the LC field on the DB2 Statements panel and press Enter.
The Rule Messages panel (Figure 141) is displayed.
Figure 141 Rule Messages panel
The Rule Messages panel displays the rule messages that are generated by the TriTune DB2 Explain feature.
TriTune ------------------------ Rule Messages ------------- Row 1 to 12 of 15COMMAND ===> SCROLL ===> HALF
DBRM name: STPROC81 Profile: DB2STRP Statement: 481 Stmt type: DECLARE
Line commands: H - Display Rule Message Help Text
LC Rule Text ____________________________________________________________________________-------------------------------------------------------------------------------__ BMC184382W-Step No: 1 is accessing: RDWM81.DB2DATA using no index.__ BMC184384I-This table is the first table accessed in the query: RDWM81.DB2DATA.__ BMC184402W-The table will be accessed using a tablespace scan. Every page in the tablespace will be scanned by DB2 to provide an answer.__ BMC184403W-Tip: Unless this statement is retrieving most of the rows in this table, consider adding an index on the most restrictive columns in the predicate. Examine the columns in the indexes on this table and add them to the predicate if possible.__ BMC184428W-The table data pages will be accessed to satisfy this portion of the query. This requires additional overhead.__ BMC184456W-The LOCK mode for this access is Intent SHARE.__ BMC184468W-The data will be retrieved using Sequential Prefetch.__ BMC184476W-Column function evaluation is not used OR column function evaluation will be determined at execution time.********************************* End of Table ********************************
NOTE If the statement has an associated DECLARE CURSOR indicated by a number in the Declare Stmt column, the Explain data will be from the DECLARE CURSOR and not from the statement itself.
312 TriTune User Guide
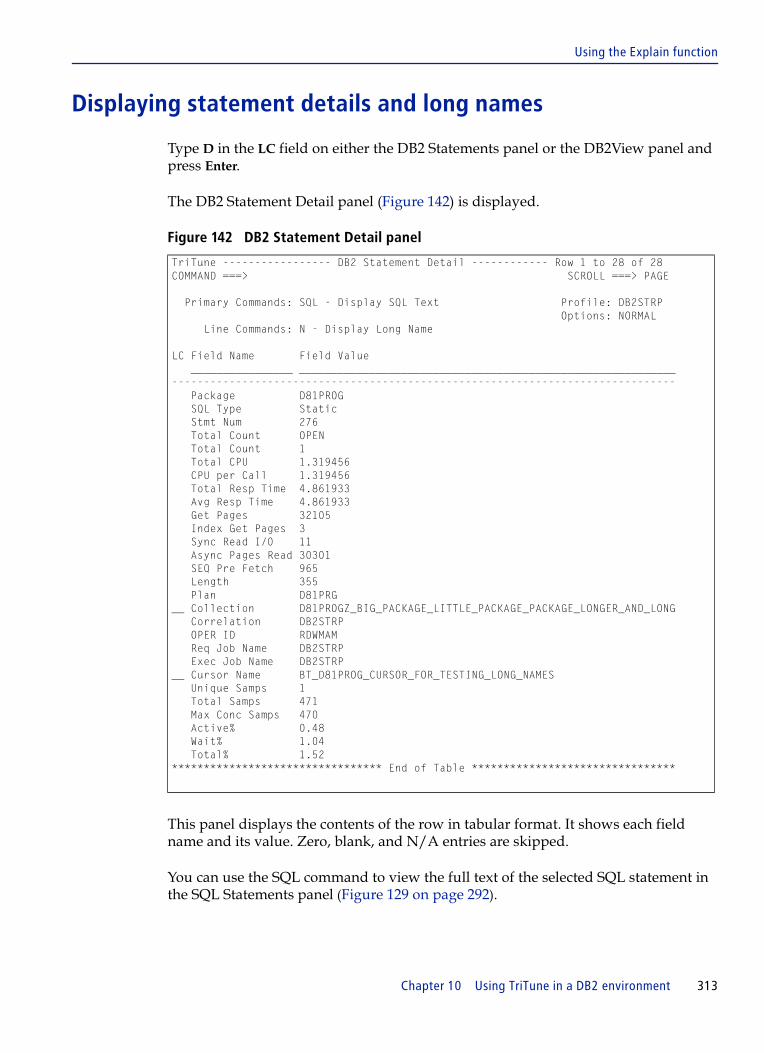
Using the Explain function
Displaying statement details and long names
Type D in the LC field on either the DB2 Statements panel or the DB2View panel and press Enter.
The DB2 Statement Detail panel (Figure 142) is displayed.
Figure 142 DB2 Statement Detail panel
This panel displays the contents of the row in tabular format. It shows each field name and its value. Zero, blank, and N/A entries are skipped.
You can use the SQL command to view the full text of the selected SQL statement in the SQL Statements panel (Figure 129 on page 292).
TriTune ----------------- DB2 Statement Detail ------------ Row 1 to 28 of 28COMMAND ===> SCROLL ===> PAGE
Primary Commands: SQL - Display SQL Text Profile: DB2STRP Options: NORMAL Line Commands: N - Display Long Name
LC Field Name Field Value ________________ ___________________________________________________________------------------------------------------------------------------------------- Package D81PROG SQL Type Static Stmt Num 276 Total Count OPEN Total Count 1 Total CPU 1.319456 CPU per Call 1.319456 Total Resp Time 4.861933 Avg Resp Time 4.861933 Get Pages 32105 Index Get Pages 3 Sync Read I/0 11 Async Pages Read 30301 SEQ Pre Fetch 965 Length 355 Plan D81PRG__ Collection D81PROGZ_BIG_PACKAGE_LITTLE_PACKAGE_PACKAGE_LONGER_AND_LONG Correlation DB2STRP OPER ID RDWMAM Req Job Name DB2STRP Exec Job Name DB2STRP__ Cursor Name BT_D81PROG_CURSOR_FOR_TESTING_LONG_NAMES Unique Samps 1 Total Samps 471 Max Conc Samps 470 Active% 0.48 Wait% 1.04 Total% 1.52********************************* End of Table ********************************
Chapter 10 Using TriTune in a DB2 environment 313
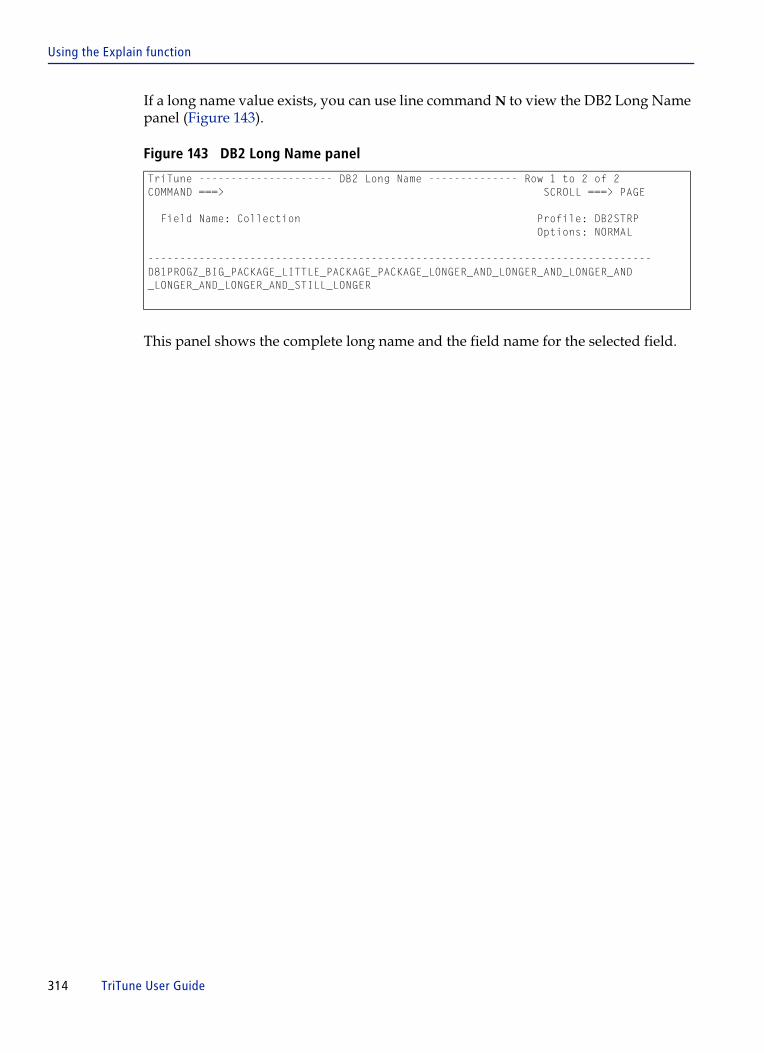
Using the Explain function
If a long name value exists, you can use line command N to view the DB2 Long Name panel (Figure 143).
Figure 143 DB2 Long Name panel
This panel shows the complete long name and the field name for the selected field.
TriTune --------------------- DB2 Long Name -------------- Row 1 to 2 of 2COMMAND ===> SCROLL ===> PAGE
Field Name: Collection Profile: DB2STRP Options: NORMAL
-------------------------------------------------------------------------------D81PROGZ_BIG_PACKAGE_LITTLE_PACKAGE_PACKAGE_LONGER_AND_LONGER_AND_LONGER_AND_LONGER_AND_LONGER_AND_STILL_LONGER
314 TriTune User Guide

Using the Explain function
Displaying a DECLARE Statement
Type SD in the LC field on the DB2 Statements panel and press Enter.
The DCL Statement panel (Figure 144) is displayed.
Figure 144 DCL Statement panel
This panel shows the DECLARE statement that is coded by the application programmer for this DB2 verb.
NOTE The SD line command is valid for the OPEN, CLOSE, INSERT, DELETE, PREPARE and FETCH verbs. Customization for the TriTune Explain function must have been completed.
TriTune ----------------------- DCL Statement --------------- Row 1 to 3 of 3COMMAND ===> SCROLL ===> HALF
DBRM name: STPROC81 Profile: DB2STRP Statement: 481 Timestamp: 05.123 16:32:44
SQL Text____________________________________________________________________________-------------------------------------------------------------------------------DECLARE ET CURSOR FOR SELECT HEXROW , PACKROW , PRINTROW , NEGROW ,CHARROW1 , CHARROW2 , CHARROW3 , CHARROW4 , CHARROW5 , CHARROW6 FROMDB2DATA********************************* End of Table ********************************
Chapter 10 Using TriTune in a DB2 environment 315
Using the DB2 Intercept facility
Using the DB2 Intercept facilityTriTune can gather and display data from SQL statements. The gathered data provides valuable information about performance and resource use of DB2 applications. With TriTune, you do not require expensive DB2 SQL traces to gather data. The TriTune DB2 Intercept facility uses the DB2 Assist facility to collect all relevant performance measurements in real time for every SQL statement that are executed in a DB2 subsystem.
The collected data is then summarized and stored for TriTune analysis. This method of collecting data provides detailed information about the performance and resource usage of DB2 applications while avoiding the costly overhead and large volumes of data that is associated with other DB2 performance aids.
The DB2 Assist facility provides user access to performance data. With it, you can control the types of data collected and make modifications by issuing TriTune DB2 Intercept commands to the TriTune task. The TriTune data collection method eliminates the need for expensive SQL traces by retrieving data directly from DB2 control blocks and trace data sets to satisfy requests from users.
This collection method creates records of summarized accounting statistics, SQL text, and SQL error data and writes them to TriTune monitor data sets. In addition, TriTune lays the foundation for even more reporting on DB2 performance data such as
■ local and Group Buffer Pool■ timing data■ lock Statistics ■ SQL statistics
How TriTune performs sampling
You can choose to collect only a sample (or subset) of data to reduce the volume of data that is collected. When sampling is active, data is collected at regular intervals through normal TriTune DB2 sampling. This process reduces the amount of data that is collected while still providing a representative sample of data for evaluation. Ensure that the TUNSSPnn member parameter DB2ICEPT is set to DB2ICEPT=NO to disable the DB2 Intercept. When DB2ICEPT=NO is specified, TriTune still collects DB2 data but will not collect extended data.
316 TriTune User Guide

Using the DB2 Intercept facility
Specifying DB2 Intercept options
Commands to dynamically set many of these options are described in detail in the TUNSSP00 member, however, it is recommended that the Default values be used. Table 87 provides a list of the recommended settings.
Table 87 DB2 sampling, intercept, and flag settings in TUNSSP00 (part 1 of 8)
Parameter Description
DB2 Sampling
DB2EXPL provides information regarding DB2 access path selection for DB2 statements
The call for Explain data is made while the address space is being measured. Specifying DB2EXPL=YES indicates that Explain data will be collected for each SQL statement for all types of address spaces being measured. DB2EXPL=NO indicates no DB2 explain data is to be gathered. BATCH indicates DB2 explain data is collected only for batch jobs and not for online systems such as CICS.
DB2IEXPL provides information regarding DB2 access path selection for DB2 statements
The call for Explain data is made while the address space is being measured.
Specifying YES indicates that Explain data will be collected for each SQL statement that is intercepted by the DB2 intercept facility.
Specifying NO indicates no DB2 Explain data is to be gathered for intercepted SQL.
This statement is only valid when DB2ICSQL=YES or DB2ICDYN=YES.
The default is DB2IEXPL=YES
DB2NOCAT prevents TriTune from obtaining SQL from the DB2 catalog
The sampling process might produce erroneous SQL statements and TriTune accesses the DB2 catalog for the plan or package statements if Explain data is requested
This process might produce more data than is required.
Specifying YES indicates that the SQL data will be collected for each plan or package sampled or intercepted by the DB2 intercept facility.
Specifying NO indicates do not access the DB2 catalog for SQL statements.
Specifying DB2NOCAT=YES and DB2ICSQL=YES might provide sufficient information if the SQL statements are less than 4000 bytes in length.
The default is DB2NOCAT=NO
DB2ICONL reserved for an enhancement in a future release and is not currently used
The default is DB2ICONL=NO
Chapter 10 Using TriTune in a DB2 environment 317

Using the DB2 Intercept facility
DB2 sampling and Intercept data granularity control
DB2ICCOR adds the DB2 correlation ID to the DB2 data being collected by the intercept and the sampling process
This option adds a higher level of granularity to the DB2 data being collected and causes TriTune to display the correlation ID of the DB2 thread. In addition
■ for IMS, the correlation ID is the PSB name■ for CICS, the correlation ID is the transaction name■ for Batch type threads, the correlation ID is the Job Name. ■ for Remote and RRSAF threads, the value in this field is dependent on the requesting
application.
This option is automatically set when monitoring a DB2 Stored procedure and will show the name of the Stored procedure address space when a call occurs.The function is used or the remote user (DDF).
Collect operator ID
DB2ICIID adds the DB2 primary Oper ID to the DB2 data that is being collected by the intercept and the sampling process
Using this option adds a higher level of granularity to the DB2 data being collected. For example, when the connection type is distributed the Oper ID is set automatically when monitoring a DB2DIST (DDF) address space. The Operator ID and Correlation ID may identify the sending remote user.
The default is DB2ICIID=NO.
Collect DB2 threads
DB2ICTHD adds the DB2 Thread Agent Control Element address to the data being collected by the intercept and sampling process
This information is of value if the DB2 data needs to be associated with the thread that it ran on in a multithread environment.
The default is DB2ICTHD=NO
DB2NOCUR collects the CURSOR name
The default is DB2NOCUR=NO,
DB2NORTN collects the function name
The default is DB2NORTN=NO,
Table 87 DB2 sampling, intercept, and flag settings in TUNSSP00 (part 2 of 8)
Parameter Description
318 TriTune User Guide

Using the DB2 Intercept facility
DB2 Intercept
DB2ICEPT causes the DB2 Intercept facility in TriTune to generate information from each call to DB2
DB2ICEPT activates the DB2 Intercept facility and allows TriTune to gather data by using the DB2 Assist facility
When the DB2 intercepts are in place, absolute DB2 counts, CPU time, and elapsed times are gathered. Specifying DB2ICEPT=NO prevents TriTune from using the DB2 Assist facility to gather CPU time, and elapsed times for DB2 statements.
The default is DB2ICEPT=NO.
DB2ICJLS determines the amount of data that is produced
When YES is specified, only the minimum data is produced
When NO is specified a large amount of data for each call might be produced, especially when monitoring transactions driven systems or programs with many calls.
Specifying DB2ICJLS=YES is designed specifically for ONLY those customers who are using the APC for TriTune product.
The default is DB2ICJLS=NO.
Collect address space statistics
DB2ICNST writes data records with statistics for the address space being monitored
Specifying YES suppresses the writing of all statistics records.
Specifying NO allows statistics records to be written based on the switch settings above.
The default is DB2ICNST=NO.
DB2ICEST DB2 statistics data are written for each SQL call if the specific statistics flag is set to YES and DB2ICNST=NO. Since the data collected is cumulative, it may be possible to obtain all the performance information from the last set of data records
To write out the requested statistics records at the end of the monitor run instead of after each call to DB2, code DB2ICEST=YES. Producing statistics at the end of the monitoring session for multithread environments such as CICS or IMS may have little or no value because the data produced will be for the last transaction processed on the thread.
Table 87 DB2 sampling, intercept, and flag settings in TUNSSP00 (part 3 of 8)
Parameter Description
Chapter 10 Using TriTune in a DB2 environment 319

Using the DB2 Intercept facility
DB2 Intercept summarization control
DB2ICSUM allows for the construction of an internal table that will be used to summarize the IINF (Intercept Information record).
In addition to the records mentioned in this table, an information record is generated for each call intercepted
These records cannot be suppressed if interception is active.
The number specified is the number of slots to be reserved for summarizing the information records. A large number of slots may reduce performance because the table is searched sequentially. The number of slots is an arbitrary value that should be derived by an estimation of the looping process within a DB2 program. If the largest program executes 25 calls to DB2 before looping back to execute the 25 calls again, a value of DB2ICSUM=25 would insure that the calls were all summarized before being written. Part of the summarization key is the SQL statement itself, so that uniquely dynamic calls will not benefit from summarization.
When SQL records are requested along with summarization, the SQL value is checked to reduce the number of SQL records written.
The default is DB2ICSUM=50.
DB2 Intercept Restart/ABEND control
DB2ICMAX specifies the number of samples that must occur before TriTune sends the START command for the intercept
If the TriTune DB2 Intercept is stopped for any reason during sampling, TriTune attempts to restart the intercept
If, after the specified number of samples (as specified by the DB2ICMAX parameter) have been taken and the intercepted call count has not been incremented, TriTune issues the MODIFY INTERCEPT START FORCE command to try restart the intercept.
Each Call to DB2 might span multiple samples so it is necessary to tell TriTune how many equal occurrences may pass before a START command is issued.
Specifying DB2ICMAX=1000 means that TriTune waits for 1000 samples to occur before sending the START command for the intercept. Specifying a value of 0 suppresses this process.
The default is DB2ICMAX=0.
Table 87 DB2 sampling, intercept, and flag settings in TUNSSP00 (part 4 of 8)
Parameter Description
320 TriTune User Guide

Using the DB2 Intercept facility
DB2ICMXA writes diagnostic information to logrec if the DB2 Intercept program abends
The following message is displayed on the TriTune server JES log:
TN3438W Intercept Abend cccccccc aaaaaaaa dddddddd tttttttt ssssssss pppppppp jjjjjjjj
TN3439I Intercept processing continues. pppppppp jjjjjjjj
where
■ cccccccc: is the abend code.■ aaaaaaaa: is the next instruction address.■ dddddddd: is displacement of instruction.■ ttttttt: is the count of abends.■ ssssssss: is the intercept sequence number. ■ pppppppp: is the TriTune profile name. ■ jjjjjjjj: is the job name being monitored.
Intercept processing continues until the max abend count is (DB2ICMXA) is exceeded. At this time, the following message is displayed:
TN3440W Max Intercept ABEND count has been exceeded. Intercept processing ended for pppppppp jjjjjjjj
where
■ pppppppp: is the TriTune profile name. ■ jjjjjjjj: is the job name being monitored.
When the value specified for max abend count reaches the abend counter, the intercept will stop collecting data. If DB2ICMXA is zero then no limit is recognized.
The default is DB2ICMXA=0.
Table 87 DB2 sampling, intercept, and flag settings in TUNSSP00 (part 5 of 8)
Parameter Description
Chapter 10 Using TriTune in a DB2 environment 321

Using the DB2 Intercept facility
DB2ICMXM specifies that if the DB2 Intercept program abends, diagnostic information is written to LOGREC and a message is displayed on the TriTune server JES log
To limit the number of messages displayed in the JES log and LOGREC, use DB2ICMXM to stop the display of Intercept abend messages.
When the message count exceeds DB2ICMXM the following message is displayed:
TN3441W Max Intercept ABEND message count exceeded for pppppppp jjjjjjjj.
where
■ pppppppp:is the TriTune profile name■ jjjjjjjj: is the job name being monitored
The default is DB2ICMXM=100
DB2 data UNICODE control
DB2FCSID allows you to specify the code page from which you want these names converted
(DB2 Version 8.1 introduced the conversion of many names to UNICODE before they are stored in the DB2 Catalog)
With this version of DB2, the only valid value is the default of DB2TFSID=1208.
DB2TCSID DB2 Version 8.1 introduced the conversion of many names to UNICODE before they are stored in the DB2 Catalog
This parameter allows you to specify the code page to use for translation. The default is code page 37. If the code page is invalid or an error occurs during the call to CUNLCNV, then an internal representation of code page 37 is used for translation. If the error occurs during catalogue processing for SQL statements, the UNICODE Error information is written to the TUNLOG with the return code and reason code displayed as field 1 offset 0000. The default is DB2TCSID=37.
DB2 Intercept data collection control
DB2ICSQL specifies that a data record is written with the SQL found in internal DB2 control blocks for the address space being monitored
Specifying YES produces the SQL data record each time a call to DB2 is intercepted.
Specifying NO suppresses the SQL record.
The default is DB2ICSQL=NO.
Table 87 DB2 sampling, intercept, and flag settings in TUNSSP00 (part 6 of 8)
Parameter Description
322 TriTune User Guide
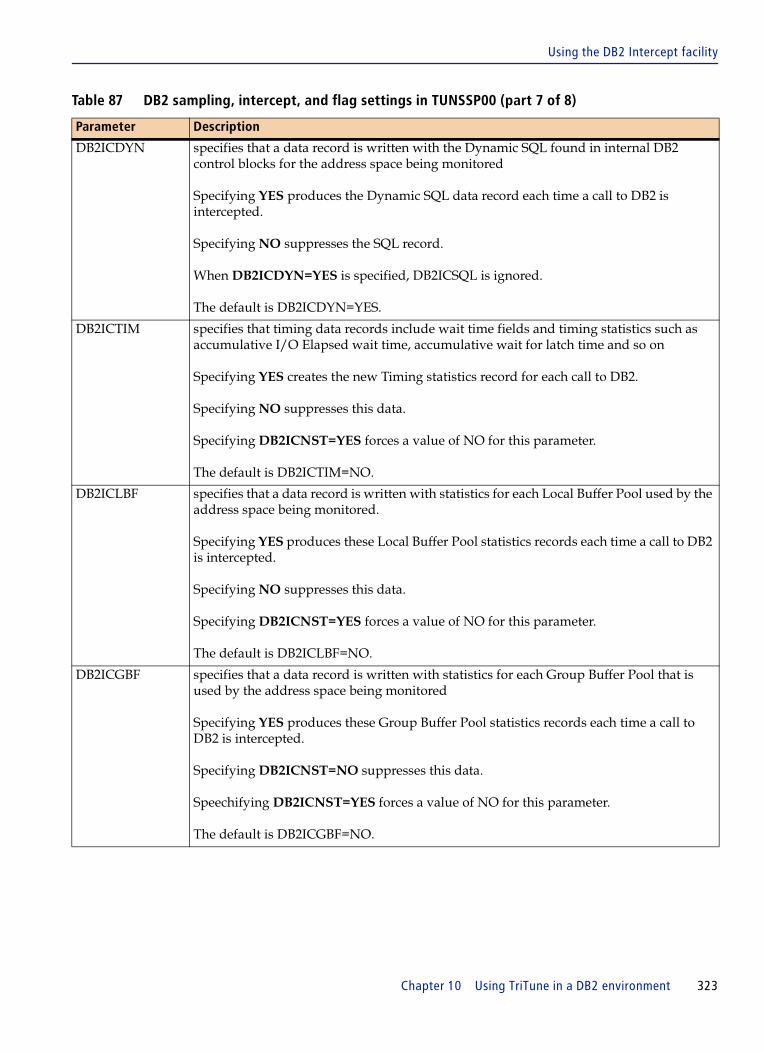
Using the DB2 Intercept facility
DB2ICDYN specifies that a data record is written with the Dynamic SQL found in internal DB2 control blocks for the address space being monitored
Specifying YES produces the Dynamic SQL data record each time a call to DB2 is intercepted.
Specifying NO suppresses the SQL record.
When DB2ICDYN=YES is specified, DB2ICSQL is ignored.
The default is DB2ICDYN=YES.
DB2ICTIM specifies that timing data records include wait time fields and timing statistics such as accumulative I/O Elapsed wait time, accumulative wait for latch time and so on
Specifying YES creates the new Timing statistics record for each call to DB2.
Specifying NO suppresses this data.
Specifying DB2ICNST=YES forces a value of NO for this parameter.
The default is DB2ICTIM=NO.
DB2ICLBF specifies that a data record is written with statistics for each Local Buffer Pool used by the address space being monitored.
Specifying YES produces these Local Buffer Pool statistics records each time a call to DB2 is intercepted.
Specifying NO suppresses this data.
Specifying DB2ICNST=YES forces a value of NO for this parameter.
The default is DB2ICLBF=NO.
DB2ICGBF specifies that a data record is written with statistics for each Group Buffer Pool that is used by the address space being monitored
Specifying YES produces these Group Buffer Pool statistics records each time a call to DB2 is intercepted.
Specifying DB2ICNST=NO suppresses this data.
Speechifying DB2ICNST=YES forces a value of NO for this parameter.
The default is DB2ICGBF=NO.
Table 87 DB2 sampling, intercept, and flag settings in TUNSSP00 (part 7 of 8)
Parameter Description
Chapter 10 Using TriTune in a DB2 environment 323

Using the DB2 Intercept facility
DB2ICLCK specifies that a data record is written with Lock statistics for the address space being monitored
Specifying YES produces the Lock statistics record each time a call to DB2 is intercepted.
Specifying DB2ICNST=NO suppresses this data.
Specifying DB2ICNST=YES forces a value of NO for this parameter.
The default is DB2ICLCK=NO.
DB2ICSQS specifies that a data record is written with SQL statistics for the address space that is being monitored
Specifying YES produces the SQL statistics record each time a call to DB2 is intercepted.
Specifying NO suppresses the gathering of this data.
This data is similar to the QXST data section of the DB2 SMF 101 subtype 3 account record. Specifying DB2ICNST=YES forces a value of NO for this parameter.
The default DB2ICSQS=NO.
Installation options
DB2ICLIB specify the name of the library containing the TriTune load modules (usually, this name is the name of the TRLINK data set)
This name must match the data set name that is specified on the DASLIB DD statement in the TriTune Started Task. This data set must be APF authorized.
DB2ICSTR specifies that the TriTune DB2 intercept is implemented when a call to DB2 is detected during the sampling process
This parameter could lead to the first call to DB2 not being recorded for the monitor. Use the DB2ICSTR command to implement the intercept when the TriTune server is started. Up to 12 DB2 subsystems may be listed on the line. Only one command is processed. If more than one command exists in the file, only the last occurrence of the command is processed. The default is DB2ICSTR=NONE.
Table 87 DB2 sampling, intercept, and flag settings in TUNSSP00 (part 8 of 8)
Parameter Description
324 TriTune User Guide
C h a p t e r 11
11 Using TriTune in a CICS environmentThis chapter describes the types of delays that are specific to CICS. Use this chapter along with the tables in Chapter 9, “Using TriTune to tune your applications” to analyze the types of delays that are specific to a CICS environment. TriTune is compatible with CICS versions 4.1and later.
TriTune recognizes the delays incurred by transactions and CICS tasks in this environment. The terms transactions and tasks define units of work within CICS. A transaction might comprise a single task or several tasks.
CICS is a transaction processing system that shares the resources of the region among many concurrently executing tasks. CICS management routines control the transaction’s access to all external and internal resources, such as files, databases, storage, programs, and special CICS facilities.
This chapter describes the following topics:
CICS transaction response times . . . . . . . . . . . . . . . . . . . . . . . . . . . . . . . . . . . . . . . . . . . 326CICS transaction classes . . . . . . . . . . . . . . . . . . . . . . . . . . . . . . . . . . . . . . . . . . . . . . . . . . 326Analyzing CICS data . . . . . . . . . . . . . . . . . . . . . . . . . . . . . . . . . . . . . . . . . . . . . . . . . . . . . 327
Using TranView for CICS . . . . . . . . . . . . . . . . . . . . . . . . . . . . . . . . . . . . . . . . . . . . . . 328Selecting transactions for analysis . . . . . . . . . . . . . . . . . . . . . . . . . . . . . . . . . . . . . . 329Using PoolView . . . . . . . . . . . . . . . . . . . . . . . . . . . . . . . . . . . . . . . . . . . . . . . . . . . . . . 329Using DelayView . . . . . . . . . . . . . . . . . . . . . . . . . . . . . . . . . . . . . . . . . . . . . . . . . . . . . 333Overview of CICS delay types. . . . . . . . . . . . . . . . . . . . . . . . . . . . . . . . . . . . . . . . . . 333
Chapter 11 Using TriTune in a CICS environment 325

CICS transaction response times
CICS transaction response timesCICS transaction response times are affected by these major factors:
■ system response time - depends on the implementation of the code and the speed of the processor
■ DASD response time - generally responsible for most of the internal processing of a transaction
■ network response time - can be in seconds or the internal time can be a fraction of a second
If the network is overloaded, you will never get good response time
■ existing workload - might affect the performance because of contention for hardware resources or logical resources.
CICS transaction classesCICS has the following classes of transactions:
■ non-conversational - a single transaction/task pair that has one input from a terminal user and returns a single output
■ conversational - a single transaction and corresponding task that can interact with the terminal user by using several input and output operations
This type of work has the potential of wasting CICS resources because the task virtually does not end and holds certain CICS resources until the task ends.
■ pseudo conversational - a single transaction that might span several tasks
This type of work benefits a system when your response time is relatively slow because CICS resources are returned to the system during think times.
NOTE TriTune helps you monitor the internal processing time of a transaction but cannot identify problems with your network
326 TriTune User Guide

Analyzing CICS data
Analyzing CICS dataTo analyze CICS data to the SQL statement level, use the following steps to display the SQL statements for a CICS job:
1 Set up your monitoring criteria so that the Observations Requested field contains a number in the range of 3000 to 10000.
See Chapter 3, “Setting up a monitor definition” for more information about specifying monitoring criteria.
2 Invoke the monitor using the Invoke line command (I).
3 Analyze the data by using one of the analysis line commands (A, AL, AA, or AW).
4 From the Interactive Analysis menu, select Option 6.
The TranView panel (Figure 145) is displayed.
Figure 145 TranView panel for CICS
TriTune ----------------------------- TranView ---------------------- Row 1 to 3 of 3COMMAND ===> SCROLL ===> CSR
Primary commands: SELect, RECall, ADDHelp Profile: TUNCIC62 Options: NORMAL Line commands: T - Tag C - Code Details U - Untag D - Delay Details (Auto-Navigation) N - Data Details
LC TRAN T D #Trans Avg RESP Tot CPU Avg CPU Actv% Data% Other% Total% Visual ________ _ _ ______ ________ ________ ________ ______ ______ ______ ______ _______------------------------------------------------------------------------------------__ JTU4 Y 3 42.46321 48.33688 16.11229 98.55 1.01 0.00 99.56 ======>__ CFQS 0 0.00000 0.00000 0.00000 0.00 0.00 0.42 0.42__ CSTP 0 0.00000 0.00000 0.00000 0.02 0.00 0.00 0.02************************************* End of Table **********************************
Chapter 11 Using TriTune in a CICS environment 327

Analyzing CICS data
Using TranView for CICS
TranView displays activity in terms of the individual transactions detected. It divides the activity of these transactions into six major groups and displays the percentage of time each transaction spends in one of these groups. Table 88 provides a description for each field in TranView.
TriTune gives you flexibility when monitoring a job; you can specify user IDs, terminal IDs, and transaction codes, or use generic transaction codes on the CICS Monitoring Criteria panel to focus the monitoring on specific units of work. The data displayed in TranView represents the selected transaction only. Refer to “Additional monitoring criteria” on page 79 to see how to specify transaction code information.
Table 88 TranView fields
Field Description
Tran name of a transaction detected by TriTune during the monitoring of an IMS or CICS region
T “X” indicates the transaction has been tagged for analysis
#Trans number of times the transaction completed processing during the monitored period
Avg RESP average time (in seconds) for this transaction during the monitored period
Tot CPU cumulative CPU seconds for this transaction during the monitored period
AVG CPU average CPU time required for this transaction during the monitored period
Actv% percentage of time during the monitored period that the CPU was actively processing the monitored transaction
Data% percentage of time during the monitored period that the transaction was delayed because of an I/O request
Other% percentage of time during the monitored period that was not attributable to any of the categories known to TriTune
Totl% summation of the categories of delay
Visual graphical representation of the total delay associated with the transaction
Total SUs total amount of CPU time in service units used by this transaction
TriTune calculates this amount by using the following formula:
(Tot CPU * 16000000) / CPU Adjustment Rate
The CPU Adjustment Rate can be seen on the OverView report.
Average SUs average number of CPU Service Units required to process a transaction
TriTune calculates this amount by using the following formula:
(Avg CPU * 16000000) / CPU Adjustment Rate
The CPU Adjustment Rate can be seen on the OverView report.
328 TriTune User Guide

Analyzing CICS data
Selecting transactions for analysis
TranView helps you identify the transactions on which you want to focus. If you select a transaction from TranView, TriTune recalculates the values to reflect only the selected transactions. When you display DelayView, CodeView, and TimeView, you can see the recalculated values.
1 Type T next to the transactions that you want to select for analysis. You can select up to five transactions.
2 Press Enter.
An X will be displayed in the T column indicating which transactions are selected.
3 To clear a transaction, type U next to it and press Enter.
4 Type the SELect primary command and press Enter.
The TranView panel will only show the selected transactions, with all percentages calculated for the selected transactions only.
5 To redisplay all transactions, type RECall and press Enter.
Using PoolView
CICS file accesses are usually the cause of most of the internal processing delays. CICS transactions can access any type of file but usually retrieve their data from VSAM files or a database management system such as IMS/DB or DB2.
The VSAM response time is especially sensitive to several key definitions, including
■ number of index buffers■ number of data buffers■ number of strings■ CI size■ CI and CA splits
TriTune provides statistics on these critical parameters that can help improve the performance of a transaction.
NOTE The transaction **N/A** is calculated from samples representing activity not associated with any particular transaction.
Chapter 11 Using TriTune in a CICS environment 329

Analyzing CICS data
You can access CICS VSAM files by using a facility called Local Shared Resources (LSR). This feature creates a buffer pool in the monitored program’s region that can be shared by a number of VSAM files. The number of buffers and strings that you define for the pools can critically affect a transaction’s performance. TriTune allows you to look into your LSR pool with PoolView, which lists each group of buffers and their usage statistics.
1 From the Interactive Analysis menu, select Option 8.
The PoolView panel (Figure 146) is displayed:
Figure 146 PoolView
Table 103 on page 350 describes the fields on the PoolView panel.
2 Type S.
3 Press Enter.
The Shared Pools panel (Figure 147) is displayed.
Figure 147 Shared Pools panel
TriTune -------------------------- PoolView ------------------ ROW 1 to 1 of 1 COMMAND ===> SCROLL ===> CSR Line commands: S - Select Profile: CICSMIX Options: NORMAL LC Type Group Category ____ _____ _____________________________________ -------------------------------------------------------------------------------__ VSAM LSR VSAM Local Shared Resource pool
TriTune ------------------------ Shared Pools ---------------- ROW 1 to 4 of 4 COMMAND ===> SCROLL ===> CSR Pool type: LOCAL Profile: CICSMIX Total pool size: 81408 Options: NORMAL Hit ratio for all subpools: 67.0% Line commands: S - Select, D - Datasets Pool No. of Buffer Buffer No. Requests Requests Hit LC Type Group SP Type Buffers size fixed Str w/read wo/read Ratio ____ _____ ___ _____ _______ ______ ______ ___ _________ _________ _____ >------------------------------------------------------------------------------__ VSAM LSR 1 BOTH 3 512 NO 1 843 1,717 67.0% __ VSAM LSR 1 BOTH 3 2,048 NO 1 0 0 *N/A* __ VSAM LSR 1 BOTH 3 4,096 NO 1 0 0 *N/A* __ VSAM LSR 1 BOTH 3 20,480 NO 1 0 0 *N/A*
330 TriTune User Guide

Analyzing CICS data
Table 104 on page 351 describes the fields on the Shared Pools panel.
High hit ratios indicate that a significant portion of the read requests are satisfied from buffers rather than from DASD. You can relate VSAM files to a buffer pool by using the data and index CI sizes from the DataView detail panels. If a file indicates large delays, you can alter the number of buffers that are allocated for the CI size that the file uses.
4 To look at more detailed information about a VSAM pool, type S and press Enter.
The VSAM Pool Details panel (Figure 148) is displayed. VSAM Pool Details displays the same information as shown in Shared Pools, but in a detail format.
Figure 148 VSAM Pool Details panel
TriTune -------------------------- VSAM Pool Details --------------------------COMMAND ===> Pool type: VSAM Profile: CICSMIX Pool group: LSR Pool ID: 1 Number of buffers: 3 Buffer size: 512 Number of strings: 1 Placeholders in chain: 0 Hit Ratio: 67.0% Requests requiring a read: 843 Requests satisfied from pool: 1717 User initiated writes: 0 Non-user initiated writes: 0 Retrieves by RBA: 0 ESDS inserts: 0 Retrieves by key: 0 KSDS inserts: 0 Buffer alters: 0 VSAM GETS: 0 Buffer searches: 0 Error buffers in pool: 0 Maximum error buffers: 0
Chapter 11 Using TriTune in a CICS environment 331

Analyzing CICS data
5 To view a list of VSAM data sets that are opened by using the specified pool, type D and press Enter.
The Pooled Data Sets panel (Figure 149) is displayed. Each of the data sets uses the buffers provided by this pool for its I/O.
Figure 149 Pooled Data Sets panel
Table 89 describes the fields on the Pooled Data Sets panel.
6 Type S next to one of the DD statements and press Enter to display an enhanced version of the Data Set Details panel.
TriTune ------------------ Pooled Data Sets ----------------- ROW 1 to 2 of 2 COMMAND ===> SCROLL ===> CSR Subpool: 1 BufferSize: 512 Profile: CICSMIX Line commands: S - Select LC DDname Data Set Name Type Comp CISize ________ ____________________________________________ ____ ________ ______ -------------------------------------------------------------------------------__ ACCTIX TUN.CICSTEST.INDEX.ACIXFILE KSDS INDEX 512 __ ACCTIX TUN.CICSTEST.DATA.ACIXFILE KSDS DATA 512
Table 89 Pooled Data Sets fields
Field Description
Subpool identification number of the VSAM subpool
Buffer size size in bytes of each buffer in the subpool
DDname DDNAME used to allocate the data set
Data Set Name full name of the data set
Type one of the following VSAM data set types:
■ KSDS - a key sequenced data set that always accompanied by an INDEX component; the index component does not have to use the same subpool
■ ESDS - an entry sequenced data set.
Comp one of the following types:
■ DATA - contains real customer data■ INDEX - contains indexing information
CISize Control Interval Size
This field shows the unit of transfer for VSAM data to and from storage. It is always a multiple of 512 bytes.
332 TriTune User Guide
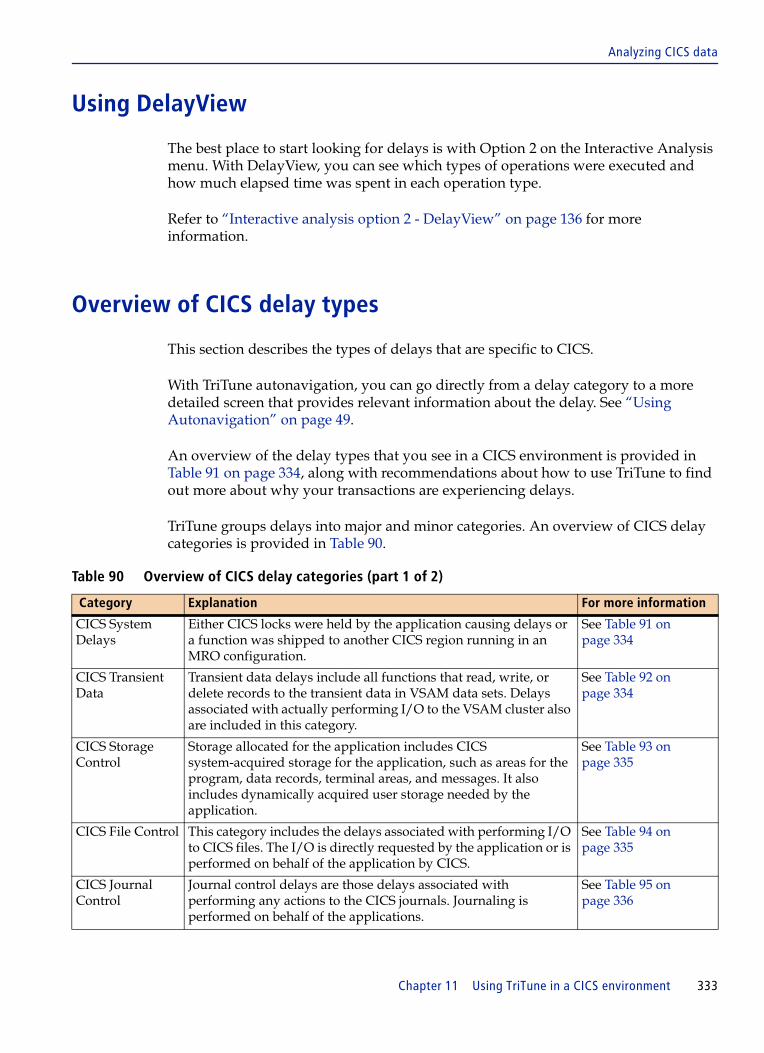
Analyzing CICS data
Using DelayView
The best place to start looking for delays is with Option 2 on the Interactive Analysis menu. With DelayView, you can see which types of operations were executed and how much elapsed time was spent in each operation type.
Refer to “Interactive analysis option 2 - DelayView” on page 136 for more information.
Overview of CICS delay types
This section describes the types of delays that are specific to CICS.
With TriTune autonavigation, you can go directly from a delay category to a more detailed screen that provides relevant information about the delay. See “Using Autonavigation” on page 49.
An overview of the delay types that you see in a CICS environment is provided in Table 91 on page 334, along with recommendations about how to use TriTune to find out more about why your transactions are experiencing delays.
TriTune groups delays into major and minor categories. An overview of CICS delay categories is provided in Table 90.
Table 90 Overview of CICS delay categories (part 1 of 2)
Category Explanation For more information
CICS System Delays
Either CICS locks were held by the application causing delays or a function was shipped to another CICS region running in an MRO configuration.
See Table 91 on page 334
CICS Transient Data
Transient data delays include all functions that read, write, or delete records to the transient data in VSAM data sets. Delays associated with actually performing I/O to the VSAM cluster also are included in this category.
See Table 92 on page 334
CICS Storage Control
Storage allocated for the application includes CICS system-acquired storage for the application, such as areas for the program, data records, terminal areas, and messages. It also includes dynamically acquired user storage needed by the application.
See Table 93 on page 335
CICS File Control This category includes the delays associated with performing I/O to CICS files. The I/O is directly requested by the application or is performed on behalf of the application by CICS.
See Table 94 on page 335
CICS Journal Control
Journal control delays are those delays associated with performing any actions to the CICS journals. Journaling is performed on behalf of the applications.
See Table 95 on page 336
Chapter 11 Using TriTune in a CICS environment 333

Analyzing CICS data
Table 91 describes the various types of CICS system delays, and the possible reasons for them.
The following table describes the various types of CICS transient data delays, and the possible reasons for them.
CICS Temporary Storage
Temporary storage delays are those delays that are incurred because of read/write activity to the Temporary Storage facility of CICS.
See Table 96 on page 337
CICS Program Control
This category includes delays incurred by the application when programs are loaded by CICS.
See Table 97 on page 337
CICS Terminal Control
This category includes all delays incurred when reading or writing data to a terminal, all VTAM related delays, and delays caused when an application is waiting for input from the terminal user.
See Table 98 on page 338
CICS DL/I Resources
This category includes delays related to application requests to local DL/I resources and to DBCTL regions.
See Table 99 on page 338
Table 91 CICS System Active
Delay type Reason
Lock delays CICS obtains locks on behalf of the application for a variety of reasons. These locks normally exist for a short period of time. A significant delay can indicate a system definition problem.
MRO Inter-region delays If your application uses the multiregion option of CICS, it might be delayed because you are unable to establish a session with the remote system. This delay indicates that too few sessions are available on the remote system, or, if the connection has been made, the other system is responding slowly and your request is delayed. TriTune attempts to identify the name of the other CICS in its detail data.
Table 92 CICS transient data (part 1 of 2)
Delay type Reason
Extrapartition Queue locked
Application can wait when making a request to an extrapartition transient data queue because some other task is using that destination.
TD Queue locked Transient data queues defined in the DCT as logically recoverable can cause delays because a subsequent task that is making a request to the same queue is forced to wait until the first application terminates or issues a synchpoint command.
Buffer wait This delay occurs when all of the buffers for the transient data are in use. The application waits until a buffer becomes available.
VSAM string wait This delay occurs when all of the VSAM strings for the transient data queue are in use. The application waits until a VSAM string becomes available.
Table 90 Overview of CICS delay categories (part 2 of 2)
Category Explanation For more information
334 TriTune User Guide
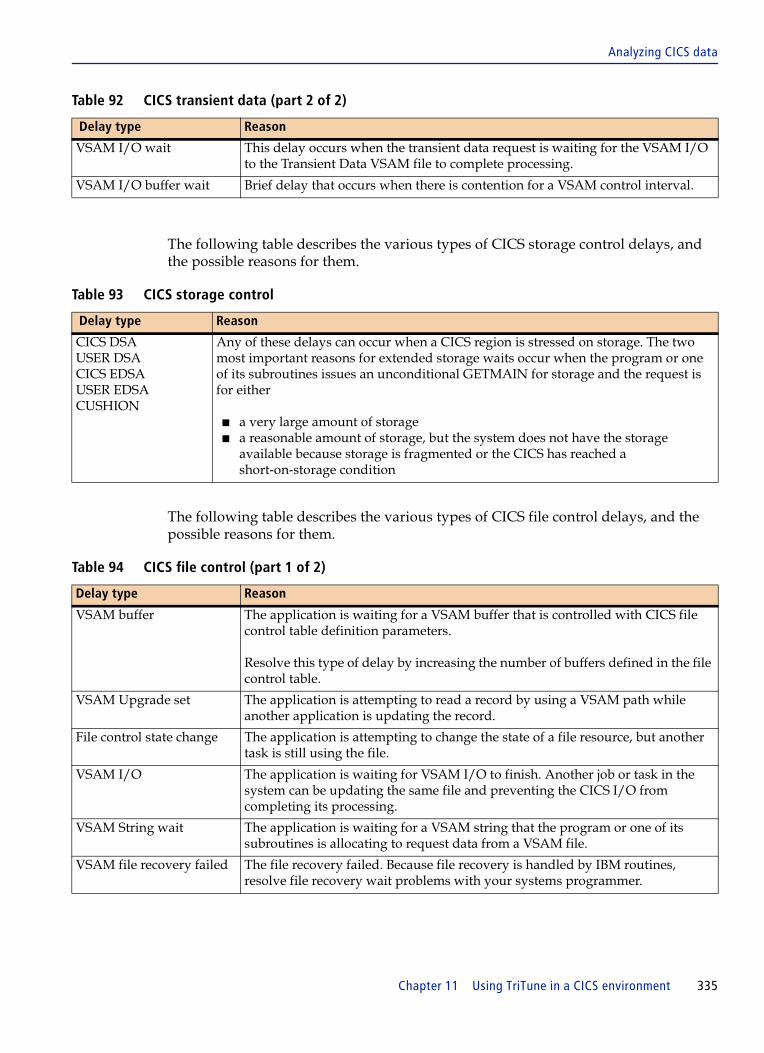
Analyzing CICS data
The following table describes the various types of CICS storage control delays, and the possible reasons for them.
The following table describes the various types of CICS file control delays, and the possible reasons for them.
VSAM I/O wait This delay occurs when the transient data request is waiting for the VSAM I/O to the Transient Data VSAM file to complete processing.
VSAM I/O buffer wait Brief delay that occurs when there is contention for a VSAM control interval.
Table 93 CICS storage control
Delay type Reason
CICS DSAUSER DSACICS EDSAUSER EDSACUSHION
Any of these delays can occur when a CICS region is stressed on storage. The two most important reasons for extended storage waits occur when the program or one of its subroutines issues an unconditional GETMAIN for storage and the request is for either
■ a very large amount of storage■ a reasonable amount of storage, but the system does not have the storage
available because storage is fragmented or the CICS has reached a short-on-storage condition
Table 94 CICS file control (part 1 of 2)
Delay type Reason
VSAM buffer The application is waiting for a VSAM buffer that is controlled with CICS file control table definition parameters.
Resolve this type of delay by increasing the number of buffers defined in the file control table.
VSAM Upgrade set The application is attempting to read a record by using a VSAM path while another application is updating the record.
File control state change The application is attempting to change the state of a file resource, but another task is still using the file.
VSAM I/O The application is waiting for VSAM I/O to finish. Another job or task in the system can be updating the same file and preventing the CICS I/O from completing its processing.
VSAM String wait The application is waiting for a VSAM string that the program or one of its subroutines is allocating to request data from a VSAM file.
VSAM file recovery failed The file recovery failed. Because file recovery is handled by IBM routines, resolve file recovery wait problems with your systems programmer.
Table 92 CICS transient data (part 2 of 2)
Delay type Reason
Chapter 11 Using TriTune in a CICS environment 335
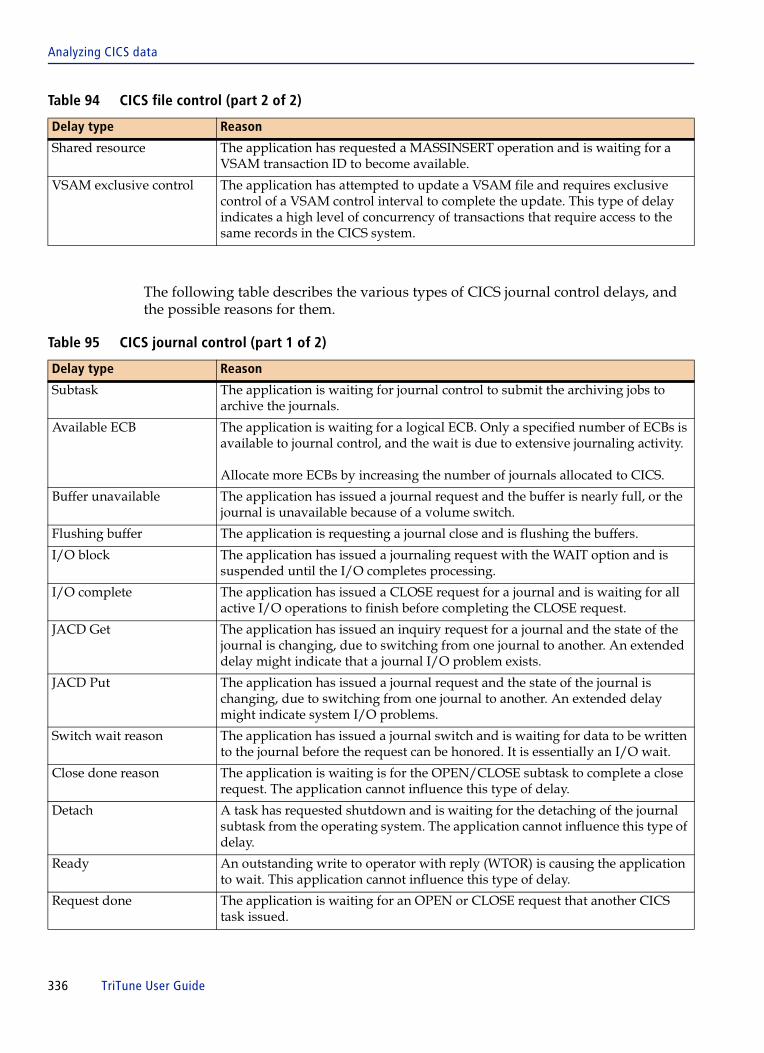
Analyzing CICS data
The following table describes the various types of CICS journal control delays, and the possible reasons for them.
Shared resource The application has requested a MASSINSERT operation and is waiting for a VSAM transaction ID to become available.
VSAM exclusive control The application has attempted to update a VSAM file and requires exclusive control of a VSAM control interval to complete the update. This type of delay indicates a high level of concurrency of transactions that require access to the same records in the CICS system.
Table 95 CICS journal control (part 1 of 2)
Delay type Reason
Subtask The application is waiting for journal control to submit the archiving jobs to archive the journals.
Available ECB The application is waiting for a logical ECB. Only a specified number of ECBs is available to journal control, and the wait is due to extensive journaling activity.
Allocate more ECBs by increasing the number of journals allocated to CICS.
Buffer unavailable The application has issued a journal request and the buffer is nearly full, or the journal is unavailable because of a volume switch.
Flushing buffer The application is requesting a journal close and is flushing the buffers.
I/O block The application has issued a journaling request with the WAIT option and is suspended until the I/O completes processing.
I/O complete The application has issued a CLOSE request for a journal and is waiting for all active I/O operations to finish before completing the CLOSE request.
JACD Get The application has issued an inquiry request for a journal and the state of the journal is changing, due to switching from one journal to another. An extended delay might indicate that a journal I/O problem exists.
JACD Put The application has issued a journal request and the state of the journal is changing, due to switching from one journal to another. An extended delay might indicate system I/O problems.
Switch wait reason The application has issued a journal switch and is waiting for data to be written to the journal before the request can be honored. It is essentially an I/O wait.
Close done reason The application is waiting is for the OPEN/CLOSE subtask to complete a close request. The application cannot influence this type of delay.
Detach A task has requested shutdown and is waiting for the detaching of the journal subtask from the operating system. The application cannot influence this type of delay.
Ready An outstanding write to operator with reply (WTOR) is causing the application to wait. This application cannot influence this type of delay.
Request done The application is waiting for an OPEN or CLOSE request that another CICS task issued.
Table 94 CICS file control (part 2 of 2)
Delay type Reason
336 TriTune User Guide
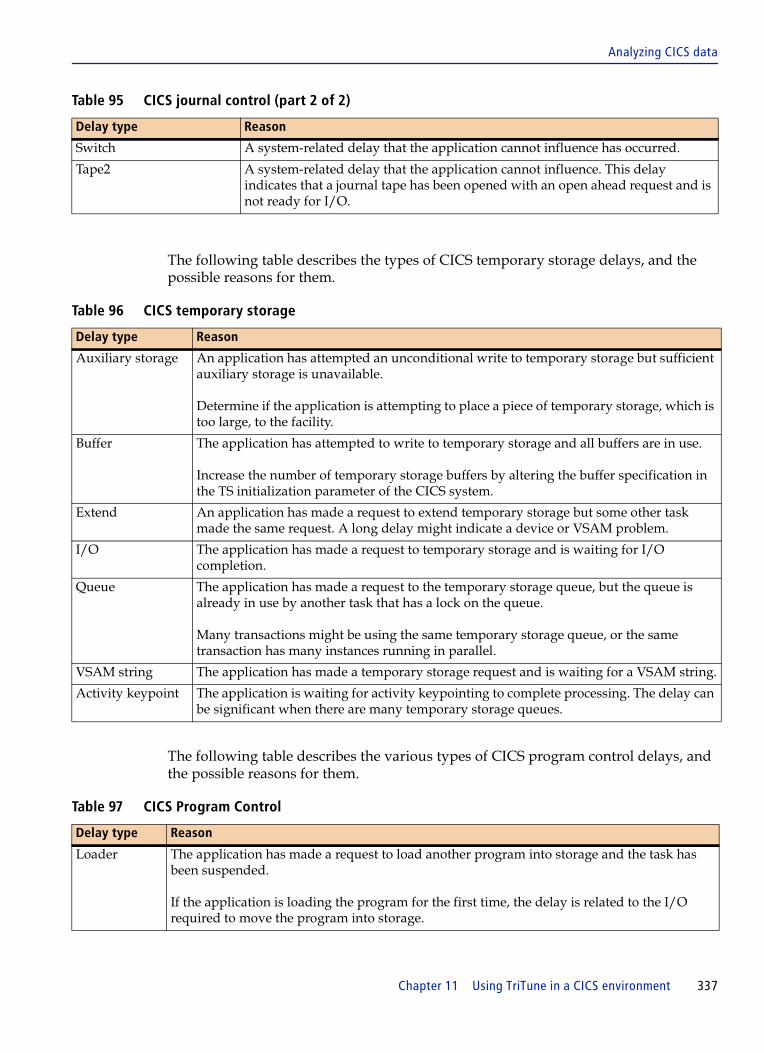
Analyzing CICS data
The following table describes the types of CICS temporary storage delays, and the possible reasons for them.
The following table describes the various types of CICS program control delays, and the possible reasons for them.
Switch A system-related delay that the application cannot influence has occurred.
Tape2 A system-related delay that the application cannot influence. This delay indicates that a journal tape has been opened with an open ahead request and is not ready for I/O.
Table 96 CICS temporary storage
Delay type Reason
Auxiliary storage An application has attempted an unconditional write to temporary storage but sufficient auxiliary storage is unavailable.
Determine if the application is attempting to place a piece of temporary storage, which is too large, to the facility.
Buffer The application has attempted to write to temporary storage and all buffers are in use.
Increase the number of temporary storage buffers by altering the buffer specification in the TS initialization parameter of the CICS system.
Extend An application has made a request to extend temporary storage but some other task made the same request. A long delay might indicate a device or VSAM problem.
I/O The application has made a request to temporary storage and is waiting for I/O completion.
Queue The application has made a request to the temporary storage queue, but the queue is already in use by another task that has a lock on the queue.
Many transactions might be using the same temporary storage queue, or the same transaction has many instances running in parallel.
VSAM string The application has made a temporary storage request and is waiting for a VSAM string.
Activity keypoint The application is waiting for activity keypointing to complete processing. The delay can be significant when there are many temporary storage queues.
Table 97 CICS Program Control
Delay type Reason
Loader The application has made a request to load another program into storage and the task has been suspended.
If the application is loading the program for the first time, the delay is related to the I/O required to move the program into storage.
Table 95 CICS journal control (part 2 of 2)
Delay type Reason
Chapter 11 Using TriTune in a CICS environment 337
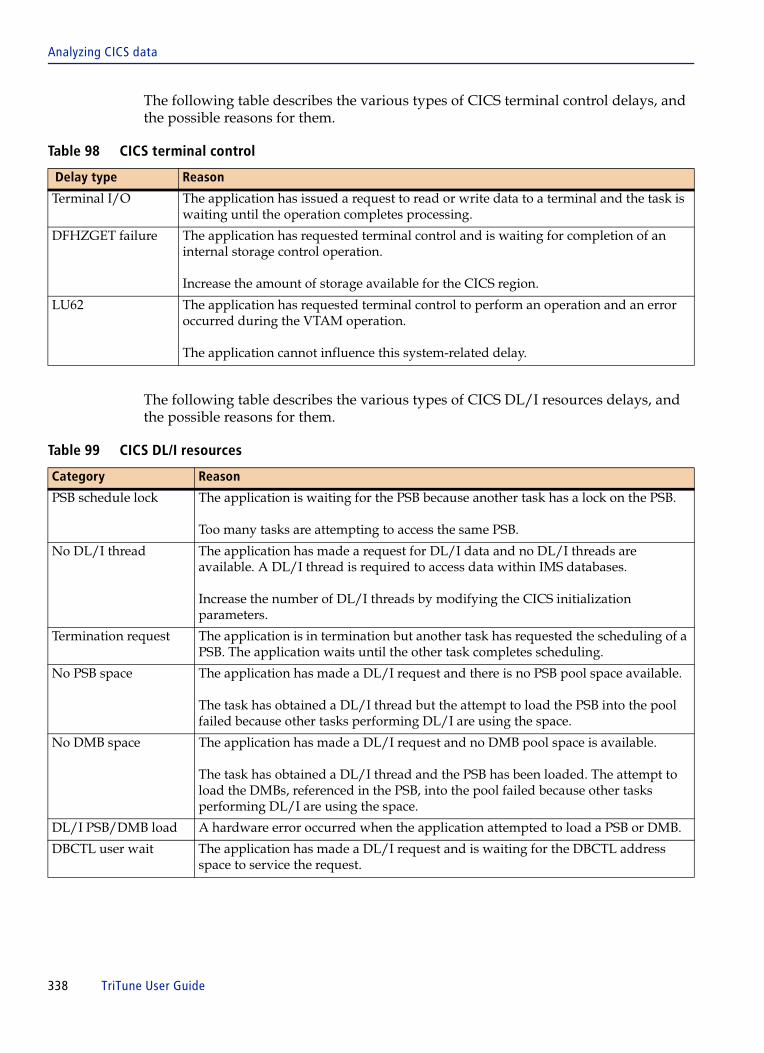
Analyzing CICS data
The following table describes the various types of CICS terminal control delays, and the possible reasons for them.
The following table describes the various types of CICS DL/I resources delays, and the possible reasons for them.
Table 98 CICS terminal control
Delay type Reason
Terminal I/O The application has issued a request to read or write data to a terminal and the task is waiting until the operation completes processing.
DFHZGET failure The application has requested terminal control and is waiting for completion of an internal storage control operation.
Increase the amount of storage available for the CICS region.
LU62 The application has requested terminal control to perform an operation and an error occurred during the VTAM operation.
The application cannot influence this system-related delay.
Table 99 CICS DL/I resources
Category Reason
PSB schedule lock The application is waiting for the PSB because another task has a lock on the PSB.
Too many tasks are attempting to access the same PSB.
No DL/I thread The application has made a request for DL/I data and no DL/I threads are available. A DL/I thread is required to access data within IMS databases.
Increase the number of DL/I threads by modifying the CICS initialization parameters.
Termination request The application is in termination but another task has requested the scheduling of a PSB. The application waits until the other task completes scheduling.
No PSB space The application has made a DL/I request and there is no PSB pool space available.
The task has obtained a DL/I thread but the attempt to load the PSB into the pool failed because other tasks performing DL/I are using the space.
No DMB space The application has made a DL/I request and no DMB pool space is available.
The task has obtained a DL/I thread and the PSB has been loaded. The attempt to load the DMBs, referenced in the PSB, into the pool failed because other tasks performing DL/I are using the space.
DL/I PSB/DMB load A hardware error occurred when the application attempted to load a PSB or DMB.
DBCTL user wait The application has made a DL/I request and is waiting for the DBCTL address space to service the request.
338 TriTune User Guide

C h a p t e r 12
12 Using TriTune in an IMS environmentDelays processing IMS calls are usually caused by improperly designed applications and databases, inadequate database indexing, and programming errors. TriTune can help identify the programs and IMS databases, segments, and calls that require attention. TriTune is compatible with IMS versions 6.1 and later.
This chapter discusses the following topics:
Analyzing IMS transactions . . . . . . . . . . . . . . . . . . . . . . . . . . . . . . . . . . . . . . . . . . . . . . . 340Analyzing IMS data . . . . . . . . . . . . . . . . . . . . . . . . . . . . . . . . . . . . . . . . . . . . . . . . . . . . . . 343Analyzing IMS batch performance information . . . . . . . . . . . . . . . . . . . . . . . . . . . . . . 350IMS region types. . . . . . . . . . . . . . . . . . . . . . . . . . . . . . . . . . . . . . . . . . . . . . . . . . . . . . . . . 354
Chapter 12 Using TriTune in an IMS environment 339

Analyzing IMS transactions
Analyzing IMS transactionsTriTune enables you to analyze IMS data to the IMS transaction level. Use the following steps to see the IMS statements for an IMS job:
1 From the Interactive Analysis menu, select Option 11 (Figure 150).
Figure 150 Interactive Analysis Panel: Selection Option 11
The IMS TranNameView panel is displayed (Figure 151 on page 341).
TriTune --------------------- Interactive Analysis ----------------------------OPTION ===>
Enter option to analyze the monitored job: Profile: IMS1 Options: NORMAL TriTune Monitor Information Subsystem Details ------------------------------------------- ------------------------------ 0 OverView - Monitor session information 10 DB2 - View all SQL 1 TaskView - Activity by task 11 IMS - IMS Transactions 2 DelayView - Program delays 12 JVM - Java Virtual Machine 3 CodeView - Program activity 13 WAS - WebSphere App Server 4 TimeView - Samples by time 5 DataView - Dataset information 6 TranView - Activity by transaction 7 ModView - Module layout 8 PoolView - Buffer pools 9 USSView - Unix System Services Press END to exit analysis
340 TriTune User Guide
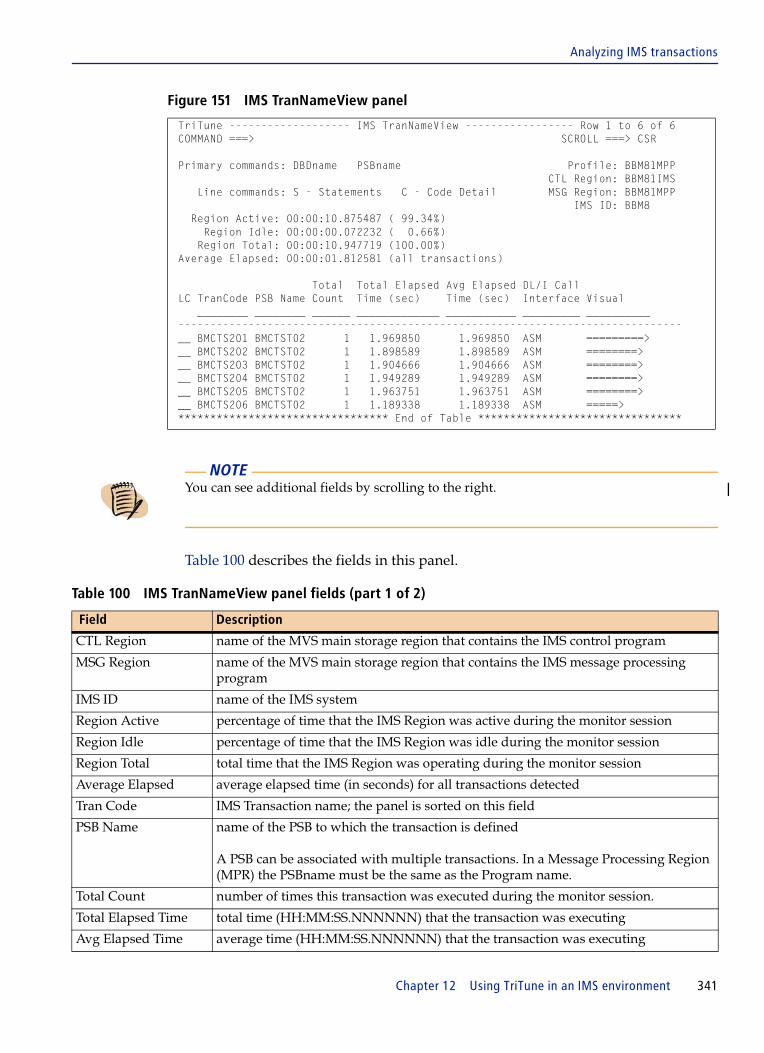
Analyzing IMS transactions
Figure 151 IMS TranNameView panel
Table 100 describes the fields in this panel.
TriTune ------------------- IMS TranNameView ----------------- Row 1 to 6 of 6 COMMAND ===> SCROLL ===> CSR
Primary commands: DBDname PSBname Profile: BBM81MPP CTL Region: BBM81IMS Line commands: S - Statements C - Code Detail MSG Region: BBM81MPP IMS ID: BBM8 Region Active: 00:00:10.875487 ( 99.34%) Region Idle: 00:00:00.072232 ( 0.66%) Region Total: 00:00:10.947719 (100.00%) Average Elapsed: 00:00:01.812581 (all transactions)
Total Total Elapsed Avg Elapsed DL/I Call LC TranCode PSB Name Count Time (sec) Time (sec) Interface Visual ________ ________ ______ _____________ ___________ _________ __________ ------------------------------------------------------------------------------- __ BMCTS201 BMCTST02 1 1.969850 1.969850 ASM =========> __ BMCTS202 BMCTST02 1 1.898589 1.898589 ASM ========> __ BMCTS203 BMCTST02 1 1.904666 1.904666 ASM ========> __ BMCTS204 BMCTST02 1 1.949289 1.949289 ASM ========> __ BMCTS205 BMCTST02 1 1.963751 1.963751 ASM ========> __ BMCTS206 BMCTST02 1 1.189338 1.189338 ASM =====> ********************************* End of Table ********************************
NOTE You can see additional fields by scrolling to the right.
Table 100 IMS TranNameView panel fields (part 1 of 2)
Field Description
CTL Region name of the MVS main storage region that contains the IMS control program
MSG Region name of the MVS main storage region that contains the IMS message processing program
IMS ID name of the IMS system
Region Active percentage of time that the IMS Region was active during the monitor session
Region Idle percentage of time that the IMS Region was idle during the monitor session
Region Total total time that the IMS Region was operating during the monitor session
Average Elapsed average elapsed time (in seconds) for all transactions detected
Tran Code IMS Transaction name; the panel is sorted on this field
PSB Name name of the PSB to which the transaction is defined
A PSB can be associated with multiple transactions. In a Message Processing Region (MPR) the PSBname must be the same as the Program name.
Total Count number of times this transaction was executed during the monitor session.
Total Elapsed Time total time (HH:MM:SS.NNNNNN) that the transaction was executing
Avg Elapsed Time average time (HH:MM:SS.NNNNNN) that the transaction was executing
Chapter 12 Using TriTune in an IMS environment 341

Analyzing IMS transactions
2 Enter the PSBname primary command on the COMMAND line and press Enter to see the activity and delays for all the detected IMS calls by PSBNAME, PCB #, call type, and segment.
The IMS Statements panel is displayed (Figure 152).
Figure 152 IMS Statements panel
Refer to page 348 for more information about the IMS Statements panel.
3 Summarize the activity and delays for all the detected IMS calls from the transactions by database by entering the DBDname primary command on the COMMAND line of the IMSView panel and pressing Enter. See Figure 159 on page 349.
4 Display the IMS Statements panel for a specific transaction by entering the Statements line command (S) next to a transaction from the IMSView panel. The IMS Statements panel is displayed for that transaction.
DL/I Call Interface IMS data manipulation language, which is a common high-level interface between a user application and IMS.
Visual depicts the elapsed time of the transaction compared to all transactions
CPU Time (CPU sec) total amount of CPU time required to process all occurrences of the transaction (in CPU seconds)
You need to scroll to the right to see this field.
CPU Avg. (CPU sec) average amount of CPU time required to process a single occurence of the transaction (in CPU seconds)
You need to scroll to the right to see this field.
TriTune ----------------------- IMS Statements --------------- Row 1 to 4 of 4COMMAND ===> SCROLL ===> HALF Primary commands: DBDname, PSBname, TRAnsactions Profile: IMS4 Mode: PSBNAME Line commands: S - SSA LC PSB Name PCB# DBD Name Segment Call P-Opts Actv% Wait% Totl% Visual ________ ____ ________ ________ ____ ______ _____ _____ _____ __________ >------------------------------------------------------------------------------__ DFSSAM04 2 DI21PART PARTROOT GU A 0.02 27.95 27.97 => __ DFSSAM04 2 DI21PART PARTROOT ISRT A 0.02 25.51 25.53 => __ DFSSAM07 2 DI21PART PARTROOT ISRT A 0.00 11.60 11.60 > __ DFSSAM03 2 DI21PART PARTROOT ISRT A 0.00 5.88 5.88 ********************************* End of Table ******************************** ----------------------------------- Totals -----------------------------------
Table 100 IMS TranNameView panel fields (part 2 of 2)
Field Description
342 TriTune User Guide
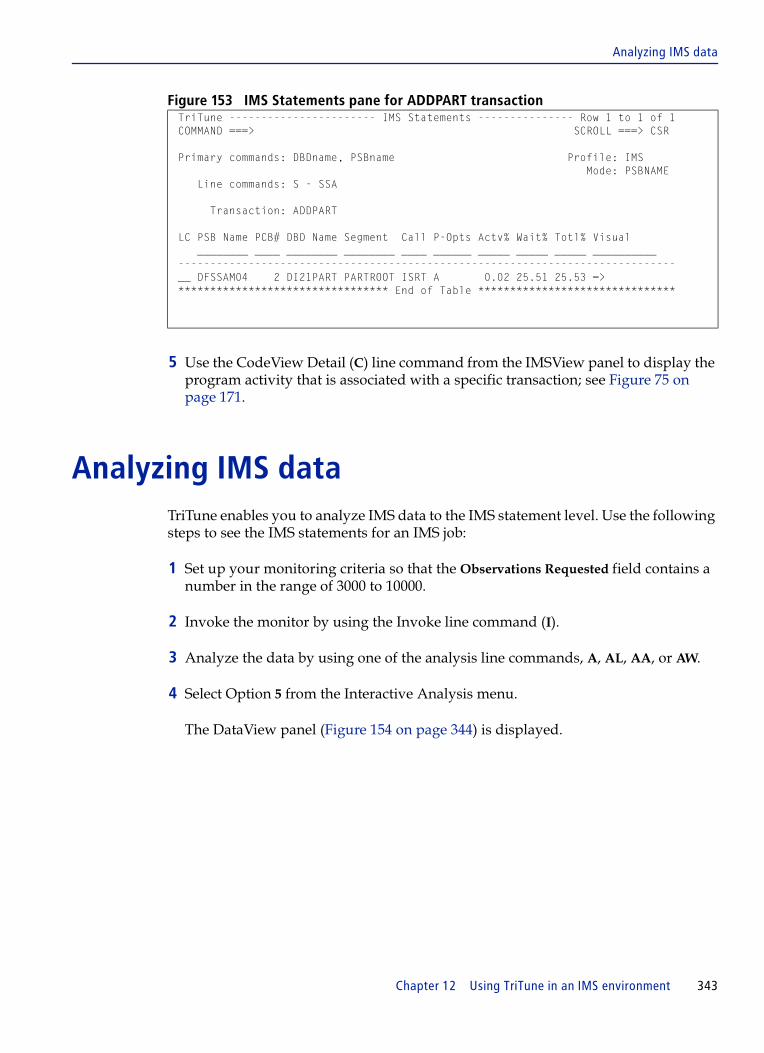
Analyzing IMS data
Figure 153 IMS Statements pane for ADDPART transaction
5 Use the CodeView Detail (C) line command from the IMSView panel to display the program activity that is associated with a specific transaction; see Figure 75 on page 171.
Analyzing IMS dataTriTune enables you to analyze IMS data to the IMS statement level. Use the following steps to see the IMS statements for an IMS job:
1 Set up your monitoring criteria so that the Observations Requested field contains a number in the range of 3000 to 10000.
2 Invoke the monitor by using the Invoke line command (I).
3 Analyze the data by using one of the analysis line commands, A, AL, AA, or AW.
4 Select Option 5 from the Interactive Analysis menu.
The DataView panel (Figure 154 on page 344) is displayed.
TriTune ----------------------- IMS Statements --------------- Row 1 to 1 of 1 COMMAND ===> SCROLL ===> CSR Primary commands: DBDname, PSBname Profile: IMS Mode: PSBNAME Line commands: S - SSA Transaction: ADDPART LC PSB Name PCB# DBD Name Segment Call P-Opts Actv% Wait% Totl% Visual ________ ____ ________ ________ ____ ______ _____ _____ _____ __________ ------------------------------------------------------------------------------ __ DFSSAM04 2 DI21PART PARTROOT ISRT A 0.02 25.51 25.53 => ********************************* End of Table *******************************
Chapter 12 Using TriTune in an IMS environment 343

Analyzing IMS data
Figure 154 DataView for an IMS environment
5 Type S next to one of the DD statements and press Enter.
An enhanced version of the Data Set Details panel (Figure 155 on page 345) is displayed. In this example, the INVDATA DD statement was selected.
TriTune -------------------------- DataView ------------------ ROW 1 to 4 of 4 COMMAND ===> SCROLL ===> CSR Primary commands: LINklist on/off Profile: IMS Options: NORMAL Line commands: S - Select Linklist: ON LC DD name Dataset name Delay% Visual ________ ____________________________________________ ______ __________ >------------------------------------------------------------------------------__ .IMS IMS Statement Delay 23.88 =========> S_ INVDATA TRITUNE.TEST.INVDATA 1.45 __ INVINDX TRITUNE.TEST.INVINDX 1.11 __ INVTRAN TRITUNE.TEST.INVTRAN 0.55 __ DFSRESLB IMS.V7100.RESLIB 0.00 __ IEFRDER IMSLOG 0.00 __ IMS IMS.V7100.PSBLIB 0.00 __ IMS IMS.V7100.DBDLIB 0.00 __ LINKLST SYS1.LINKLIB 0.00 __ LINKLST SYS1.MIGLIB 0.00
344 TriTune User Guide

Analyzing IMS data
Figure 155 Data Set Details for a VSAM data set
Table 101 describes the fields in this panel.
TriTune --------------------- Data Set Details ------------ Row 1 to 26 of 32 COMMAND ===> SCROLL ===> HALF DDNAME: INVDATA Profile: IMS Access Method: VSAM Cluster: TRITUNE.TEST.INVDATA Opened for: DIRECT Data: TRITUNE.TEST.INVDATA.DATAShare Options: 3 3 Index: TRITUNE.TEST.INVDATA.INDX Organization: KSDS Alt Index: N/A Data Component Information for: TRITUNE.TEST.INVDATA.DATA ------ SMS ------- ------ Allocation ------- ----------- Format ---------------DATACLAS: Unit: Rec Len: 200 CI Size: 20STORCLAS: Primary: 0 # CIs per CA: 315 Strings: 0MGMTCLAS: Secondary: 0 CA Freespace: 25 Volume Count: n/a CI Freespace: 25 Total Extent Count: 0 Stripes: 0 ---- VSAM Statistics --------------------------------------------------------- Records Read: 0 Records Updated: 0 CA Splits: 19 Records Added: 0 Records Deleted: 0 CI Splits: 559 Index Component Information for: TRITUNE.TEST.INVDATA.INDX ------ SMS ------- ------ Allocation ------- ----------- Format ---------------DATACLAS: Unit: Rec Len: 3065 CI Size: 30STORCLAS: Primary: 0 # CIs per CA: 15 Strings: 0MGMTCLAS: Secondary: 0 CA Freespace: 0 Volume Count: n/a CI Freespace: 0 Total Extent Count: 0 Stripes: 0
Table 101 Data Set Details fields (part 1 of 3)
Field Description
DD Name DDNAME used to allocate the data set
Organization physical organization of the data stored in this data set
Possible values are KSDS, ESDS, or RRDS
Dataset name full name of the data set
If the data set organization is KSDS, TriTune displays the names of the DATA and INDEX components.
Volser first volume serial of the data set
Unit first device address of the data set
Opened for intention of the program when performing I/Os for this data set
Possible values are READ, WRITE, and DIRECT.
Logical record length specified length of the records that reside in this data set
Chapter 12 Using TriTune in an IMS environment 345

Analyzing IMS data
Share Options displays how an alternate index’s data or index component is shared among users
You can select one of the following numbers:
■ The data set can be shared by any number of users for read processing, or the data set can be accessed by only one user for read and write
■ The data set can be accessed by any number of users for read processing and it can also be accessed by one user for write processing
■ The data set can be fully shared by any number of users
■ The data set can be fully shared by any number of users, and buffers used for direct processing are refreshed for each request
Data CI size size of the Control Interval for the data in this data set
Number of CIs per CA count of CIs allocated within a control area for the data in this data set
Index levels number of index levels
VSAM KSDS data sets are indexed using a multilevel structure. The number of levels can have an impact on the performance of the data set if there are insufficient index buffers.
RPL strings number of strings for the data set
This field indicates the number of concurrent operations that might be started for the data set.
Index buffers number of buffers used to perform I/O for the index component
Data buffers number of buffers used to perform I/O for the data component
Index EXCPs number of EXCPs for the INDEX component during the monitored period
Data EXCPs number of EXCPs for the DATA component during the monitored period
Records retrieved total number of records retrieved during the monitored period
Records written number of records written to the data set during the monitored period
CI splits number of times that the control interval was split due to lack of space
CA splits number of times that the control area was split due to lack of space
CI freespace percentage of free space in the control interval
Defined when the data set was created.
CA freespace percentage of free space in the control area
Defined when the data set was created.
File uses Shared Resources
the file uses VSAM local and global shared resources (LSR/GSR) and some values are invalid in the main display
When the message File uses Shared Resources appears, values described below replace those marked n/a.
Table 101 Data Set Details fields (part 2 of 3)
Field Description
346 TriTune User Guide

Analyzing IMS data
6 Press End to return to the DataView panel.
7 To select the .IMS DD statement, type S in the LC column and press Enter.
The IMS Statements panel (Figure 156) is displayed:
Figure 156 IMS Statements panel
IMS Statements panel
The IMS Statements panel has two modes. The information that is displayed depends on the mode you select. Select a mode by issuing either the PSBNAME or the DBDNAME primary commands.
Pool ID pool identifier used to satisfy requests for this file (LSR/GSR)
Buffer Size size of the buffer used from the pool identified by Pool ID (LSR/GSR)
Num Buffers number of buffers available in the shared pool (LSR/GSR)
Hit Ratio percentage of READ requests that were satisfied from the buffer pool without an EXCP (LSR/GSR)
Steal Writes number of nonuser-initiated WRITES that were initiated for this buffer pool
A value of greater than 0 in this field can indicate a serious performance problem (LSR/GSR).
TriTune ----------------------- IMS Statements --------------- ROW 1 to 7 of 7 COMMAND ===> SCROLL: CSR Primary commands: DBDname, PSBname Profile: IMS Mode: PSBNAME Line commands: S - SSA LC PSB Name PCB# DBD Name Segment Call P-Opts Actv% Wait% Totl% Visual ________ ____ ________ ________ ____ ______ _____ _____ _____ __________ -------------------------------------------------------------------------------__ INV2200 2 INVDBD INVENSEG ISRT A 1.78 17.07 18.86 ========> __ INV2200 2 INVDBD INVENSEG GHU A 2.79 0.11 2.90 > __ INV2200 2 INVDBD INVENSEG REPL A 0.78 0.00 0.78 __ INV2200 2 INVDBD INVENSEG DLET A 0.55 0.00 0.55 __ INV2200 2 INVDBD INLOCSEG GHU A 0.44 0.00 0.44 __ INV2200 2 INVDBD INLOCSEG REPL A 0.22 0.00 0.22 __ INV2200 2 INVDBD INLOCSEG DLET A 0.11 0.00 0.11 ********************************* END OF TABLE ********************************
Table 101 Data Set Details fields (part 3 of 3)
Field Description
Chapter 12 Using TriTune in an IMS environment 347
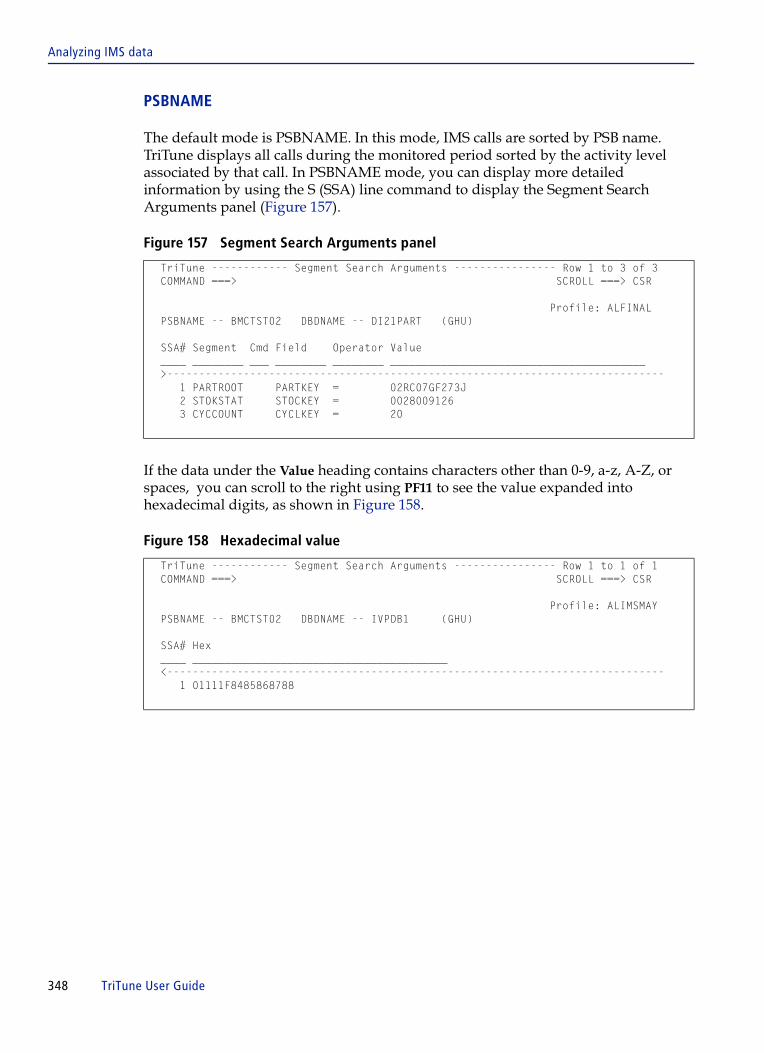
Analyzing IMS data
PSBNAME
The default mode is PSBNAME. In this mode, IMS calls are sorted by PSB name. TriTune displays all calls during the monitored period sorted by the activity level associated by that call. In PSBNAME mode, you can display more detailed information by using the S (SSA) line command to display the Segment Search Arguments panel (Figure 157).
Figure 157 Segment Search Arguments panel
If the data under the Value heading contains characters other than 0-9, a-z, A-Z, or spaces, you can scroll to the right using PF11 to see the value expanded into hexadecimal digits, as shown in Figure 158.
Figure 158 Hexadecimal value
TriTune ------------ Segment Search Arguments ---------------- Row 1 to 3 of 3 COMMAND ===> SCROLL ===> CSR
Profile: ALFINAL PSBNAME -- BMCTST02 DBDNAME -- DI21PART (GHU)
SSA# Segment Cmd Field Operator Value ____ ________ ___ ________ ________ ________________________________________ >------------------------------------------------------------------------------ 1 PARTROOT PARTKEY = 02RC07GF273J 2 STOKSTAT STOCKEY = 0028009126 3 CYCCOUNT CYCLKEY = 20
TriTune ------------ Segment Search Arguments ---------------- Row 1 to 1 of 1 COMMAND ===> SCROLL ===> CSR
Profile: ALIMSMAY PSBNAME -- BMCTST02 DBDNAME -- IVPDB1 (GHU)
SSA# Hex ____ ________________________________________ <------------------------------------------------------------------------------ 1 01111F8485868788
348 TriTune User Guide
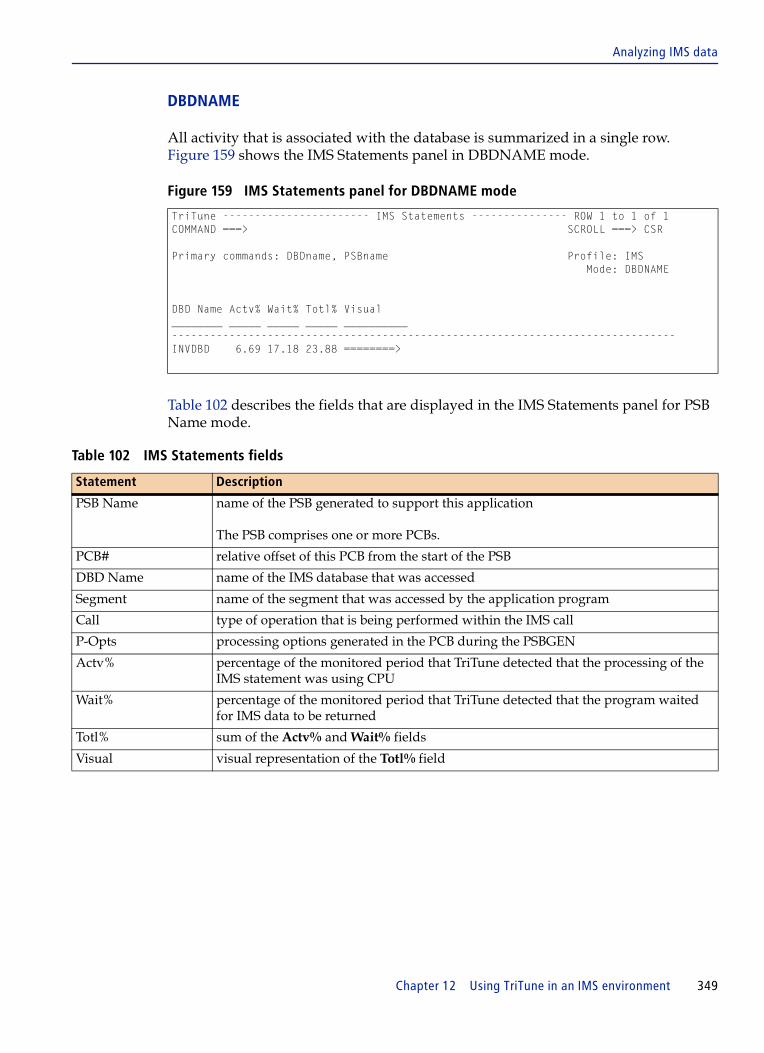
Analyzing IMS data
DBDNAME
All activity that is associated with the database is summarized in a single row. Figure 159 shows the IMS Statements panel in DBDNAME mode.
Figure 159 IMS Statements panel for DBDNAME mode
Table 102 describes the fields that are displayed in the IMS Statements panel for PSB Name mode.
TriTune ----------------------- IMS Statements --------------- ROW 1 to 1 of 1 COMMAND ===> SCROLL ===> CSR Primary commands: DBDname, PSBname Profile: IMS Mode: DBDNAME DBD Name Actv% Wait% Totl% Visual ________ _____ _____ _____ __________ -------------------------------------------------------------------------------INVDBD 6.69 17.18 23.88 ========>
Table 102 IMS Statements fields
Statement Description
PSB Name name of the PSB generated to support this application
The PSB comprises one or more PCBs.
PCB# relative offset of this PCB from the start of the PSB
DBD Name name of the IMS database that was accessed
Segment name of the segment that was accessed by the application program
Call type of operation that is being performed within the IMS call
P-Opts processing options generated in the PCB during the PSBGEN
Actv% percentage of the monitored period that TriTune detected that the processing of the IMS statement was using CPU
Wait% percentage of the monitored period that TriTune detected that the program waited for IMS data to be returned
Totl% sum of the Actv% and Wait% fields
Visual visual representation of the Totl% field
Chapter 12 Using TriTune in an IMS environment 349

Analyzing IMS batch performance information
Analyzing IMS batch performance information TriTune provides additional information for IMS batch programs. IMS batch operates entirely in a single address space. Database operations are controlled by IMS routines using a VSAM local shared resource pool. Use the following steps to access TriTune statistics on the use of this pool.
1 From the Interactive Analysis menu, select Option 8.
The PoolView panel (Figure 160) is displayed:
Figure 160 PoolView for an IMS environment
PoolView lists the shared pools that are used in the batch job.
Table 103 describes the fields in PoolView.
2 Use the Select line command (S) to link to the Shared Pools panel (Figure 161 on page 351). This panel displays all of the unique buffer pools that are defined to the overall pool.
TriTune ------------------- PoolView ------------------- ROW 1 TO 1 OF 1 COMMAND ===> SCROLL ===> CSR Line Commands: S - Select Profile: IMS Options: NORMAL LC Type Group Category ____ _____ _____________________________________ -------------------------------------------------------------------------------__ IMS LSR IMS VSAM local pools
Table 103 PoolView fields
Statement Description
Type type of pool, either IMS or VSAM
Group defines the group as LSR, or GSR
LSR refers to VSAM Local Shared Resources where the buffer pool is maintained in the user's storage (PRIVATE). GSR refers to VSAM Global Shared Resources where the buffer pool is maintained in common storage (ECSA).
Category literal name of the pool
350 TriTune User Guide

Analyzing IMS batch performance information
Figure 161 Shared Pools panel (IMS)
Table 104 describes the fields on the Shared Pools panel.
TriTune ------------------------ Shared Pools ---------------- ROW 1 to 4 of 4 COMMAND ===> SCROLL ===> CSR Pool type: LOCAL Profile: IMS Total pool size: 59392 Options: NORMAL Hit ratio for all subpools: 88.1% Line commands: S - Select, D - Datasets No. of Buffer Buffer Requests Requests Hit Non-user LC Type Group SP Buffers size fixed w/read wo/read Ratio writes ____ _____ ___ _______ ______ ______ _________ _________ _____ _________ >------------------------------------------------------------------------------__ IMS LSR 0 4 512 NO 0 158 100 % 0 __ IMS LSR 0 4 2,048 NO 69 225 76.5% 34 __ IMS LSR 0 4 4,096 NO 0 0 N/A 0 __ IMS LSR 0 4 8,192 NO 4 158 97.5% 0
Table 104 Shared Pools panel fields (part 1 of 2)
Statement Description
Pool type LOCAL or GLOBAL
Local pools are used exclusively for IMS batch jobs and are located in the batch region. GLOBAL pools are located in CSA.
Total pool size total size of all the allocated buffers for all the buffer pools for this shared pool
Hit ratio for all subpools measure of buffer pool performance
A high hit ratio means that a high percentage of reads were satisfied from the buffer pools without having to access external media. The hit ratio is calculated as follows:
100 x (Retrieves wo/read / (retrieves w/read + retrieves wo/read))
Type type of pool, VSAM or IMS
Group location of the subpool
LSR is in the user region; GSR is in CSA.
SP identifier of the subpool
No. of Buffers number of virtual buffers for this subpool
Buffer size size in bytes of each buffer residing in this subpool
Buffer fixed indicates whether the buffers are fixed in storage for this buffer pool
Requests w/read number of retrieves that were satisfied with an access to external media
Requests wo/read number of retrieves that were satisfied from within the buffers in the pool
No I/O was necessary.
Hit Ratio percentage of the monitored period that READ requests were satisfied without a physical I/O
Chapter 12 Using TriTune in an IMS environment 351

Analyzing IMS batch performance information
From the Shared Pools panel, you can display further detail by using one of the line commands:
■ The Select line command (S) displays the VSAM Pool Details panel (Figure 162).
■ The Data Sets line command (D) displays the Pooled Data Sets panel (Figure 163 on page 353).
VSAM Pool Details displays the same information as shown in Shared Pools, but in a detail format.
Non-user writes writes initiated by VSAM to make free space in this pool
These types of writes are very expensive and indicate that the pool might be too small. They are also called VSAM steal writes.
Scroll right to display the following fields:
User init. writes writes by VSAM initiated by the user for synchronization processing
Retrieves by RBA number of retrieves by relative byte address (RBA)
ESDS inserts number of inserts to the Entry Sequenced Data Set (ESDS)
Retrieves by KEY number of retrieves by key to a Key Sequenced Data Set (KSDS)
KSDS inserts number of inserts to a Key Sequenced Data Set (KSDS)
Buffer alters number of times a buffer was altered by VSAM
VSAM gets number of VSAM GET requests
Buffer searches number of VSAM search buffer requests
No. PLH in chain number of Placeholders (PLH) in lock chain
Error buffs in pool current number of error buffers in pool
Max error buffs largest number of error buffers ever in the pool since the pool was created
Table 104 Shared Pools panel fields (part 2 of 2)
Statement Description
352 TriTune User Guide

Analyzing IMS batch performance information
Figure 162 VSAM Pool Details panel
3 Press END to return to Shared Pools.
4 Type D to display the Pooled Data Sets panel (Figure 163). Pooled Data Sets displays information about any VSAM data set using the specified pool.
Figure 163 Pooled Data Sets panel (IMS)
Table 105 describes the fields on the Pooled Data Sets panel.
TriTune -------------------------- VSAM Pool Details --------------------- COMMAND ===> Pool type: IMS Profile: IMS Pool group: LSR Pool ID: 0 Number of buffers: 4 Buffer size: 512 Placeholders in chain: 0 Hit Ratio: 100 % Requests requiring a read: 0 Requests satisfied from pool: 158 User initiated writes: 0 Non-user initiated writes: 0 Retrieves by RBA: 0 ESDS inserts: 0 Retrieves by key: 0 KSDS inserts: 0 Buffer alters: 0 VSAM GETS: 0 Buffer searches: 0 Error buffers in pool: 0 Maximum error buffers: 0
TriTune ------------------ Pooled Data Sets ----------------- ROW 1 to 1 of 1 COMMAND ===> SCROLL ===> CSR Subpool: 0 BufferSize: 512 Profile: IMS Line commands: S - Select LC DDname Data Set Name Type Comp CISize ________ ____________________________________________ ____ ________ ______ -------------------------------------------------------------------------------__ INVINDX TRITUNE.TEST.INVINDX.DATA KSDS DATA 512
Table 105 TranView Pooled Data Sets fields (part 1 of 2)
Field Description
Subpool identification number of the VSAM subpool
BufferSize size in bytes of each buffer in the subpool
DDname DDNAME used to allocate the data set
Data Set Name full name of the data set
Chapter 12 Using TriTune in an IMS environment 353
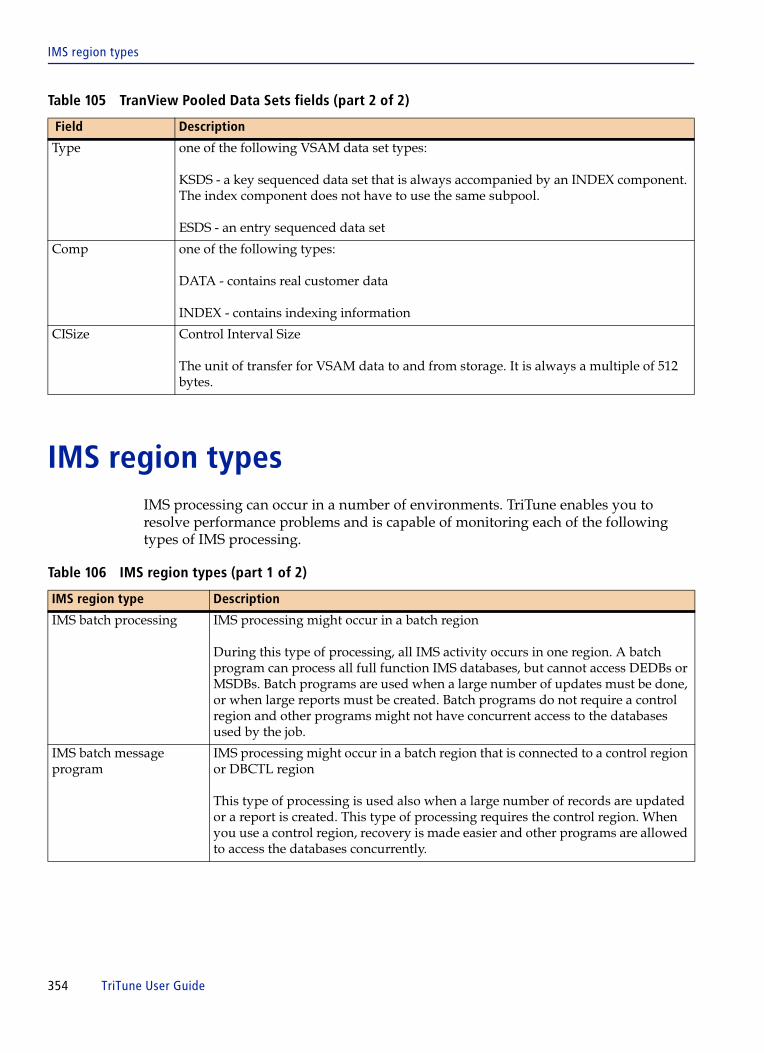
IMS region types
IMS region types IMS processing can occur in a number of environments. TriTune enables you to resolve performance problems and is capable of monitoring each of the following types of IMS processing.
Type one of the following VSAM data set types:
KSDS - a key sequenced data set that is always accompanied by an INDEX component. The index component does not have to use the same subpool.
ESDS - an entry sequenced data set
Comp one of the following types:
DATA - contains real customer data
INDEX - contains indexing information
CISize Control Interval Size
The unit of transfer for VSAM data to and from storage. It is always a multiple of 512 bytes.
Table 106 IMS region types (part 1 of 2)
IMS region type Description
IMS batch processing IMS processing might occur in a batch region
During this type of processing, all IMS activity occurs in one region. A batch program can process all full function IMS databases, but cannot access DEDBs or MSDBs. Batch programs are used when a large number of updates must be done, or when large reports must be created. Batch programs do not require a control region and other programs might not have concurrent access to the databases used by the job.
IMS batch message program
IMS processing might occur in a batch region that is connected to a control region or DBCTL region
This type of processing is used also when a large number of records are updated or a report is created. This type of processing requires the control region. When you use a control region, recovery is made easier and other programs are allowed to access the databases concurrently.
Table 105 TranView Pooled Data Sets fields (part 2 of 2)
Field Description
354 TriTune User Guide

IMS region types
IMS message processing program
IMS processing might occur in a region called a message processing region or MPR
The MPR processes transactions that are created in an online environment, which means that a user can be sitting at a terminal entering interactive work and the IMS control region is scheduling work in the MPR. Normally the output message produced by this kind of IMS processing is destined for a terminal user. This type of processing requires a control region to control the terminal I/O and a DBCTL region to control the access to the databases. Other programs can access the databases while messages are being processed.
IMS fast path program IMS processing might occur in a special region called a Fast Path region
These regions are usually devoted to processing online transactions that require very fast response times. Programs running in this environment normally access Fast Path databases such as Data Entry Databases (DEDBs) or Main Storage Databases (MSDBs), but might also access full function IMS databases. They have similar requirements to MPR processing.
CICS transaction access IMS processing might occur on behalf of a transaction that is executed in a CICS environment
In this environment, the IMS data is either attached locally or attached by using a DBCTL region. The CICS transaction processing is similar to IMS. You enter a query or update and the IMS connection reads or alters the database. If the database is accessed by using a DBCTL, other programs might access the data concurrently. If the database is locally attached, only CICS shared database processing can occur concurrently.
CICS shared database processing
IMS processing might occur in a CICS environment that uses a batch job
You can run a shared database program only in a local DL/I environment. The batch job runs in its own region, but the CICS region synchronizes the updates to the IMS databases by using “mirror” transactions to process each request of the batch job. Shared database programs can use full function IMS databases.
Table 106 IMS region types (part 2 of 2)
IMS region type Description
Chapter 12 Using TriTune in an IMS environment 355

IMS region types
356 TriTune User Guide
C h a p t e r 13
13 Using TriTune in a Java Virtual Machine (JVM) environmentThis chapter discusses the following topics:
Analyzing JVM data . . . . . . . . . . . . . . . . . . . . . . . . . . . . . . . . . . . . . . . . . . . . . . . . . . . . . 358Command descriptions for the JVM Applications panel . . . . . . . . . . . . . . . . . . . 360Examples of the JVM Applications panel in other modes. . . . . . . . . . . . . . . . . . . 360
Displaying JVM detail reports . . . . . . . . . . . . . . . . . . . . . . . . . . . . . . . . . . . . . . . . . . . . . 363Displaying the JVM Methods panel . . . . . . . . . . . . . . . . . . . . . . . . . . . . . . . . . . . . . 363Displaying the JVM Methods panel . . . . . . . . . . . . . . . . . . . . . . . . . . . . . . . . . . . . . 364Displaying the JVM Thread TCBs panel . . . . . . . . . . . . . . . . . . . . . . . . . . . . . . . . . 364
Displaying JVM Delay locations . . . . . . . . . . . . . . . . . . . . . . . . . . . . . . . . . . . . . . . . . . . 366TranView for CICS panel . . . . . . . . . . . . . . . . . . . . . . . . . . . . . . . . . . . . . . . . . . . . . . 366DelayView Detail panel . . . . . . . . . . . . . . . . . . . . . . . . . . . . . . . . . . . . . . . . . . . . . . . 367Delay Locations Detail panel . . . . . . . . . . . . . . . . . . . . . . . . . . . . . . . . . . . . . . . . . . . 368DelayView panel . . . . . . . . . . . . . . . . . . . . . . . . . . . . . . . . . . . . . . . . . . . . . . . . . . . . . 369Delay locations. . . . . . . . . . . . . . . . . . . . . . . . . . . . . . . . . . . . . . . . . . . . . . . . . . . . . . . 370
Chapter 13 Using TriTune in a Java Virtual Machine (JVM) environment 357

Analyzing JVM data
Analyzing JVM dataWhen TriTune detects Java Virtual Machine (JVM) activity, the major category (Java Virtual Machine) and minor delay category (JVMPI Trace Activity) are assigned.
To see the JVM statements for an JVM activity:
1 Set up your monitoring criteria.
2 Invoke the monitor by using the I (Invoke) line command.
3 Analyze the data by using one of the analysis line commands, A, AL, AA, or AW.
4 From the Interactive Analysis menu, select Option 2.
The DelayView panel (Figure 164) is displayed:
It is important to note that the activity percentage values indicate the activity for all detected JVM activity and do not correspond with sample-based activity percentages that are displayed elsewhere by TriTune.
Figure 164 Example of DelayView with Java Virtual Machine activity detected
TriTune -------------------------- DelayView ----------------- Row 1 to 9 of 9COMMAND ===> SCROLL ===> HALF Primary commands: DETail on/off Module: * Profile: JVM1 ADDHelp Csect: * Options: NORMAL Offset: * Detail: ON Line commands: A - Address (AutoNav enabled) S - Distribution LC Major category Minor category Actv% Wait% Totl% Visual ____________________ ____________________ ______ ______ ______ _____________ -------------------------------------------------------------------------------__ Java Virtual Machine JVMPI Trace Activity 58.27 0.00 58.27 =========> __ Voluntary Wait Wait/Waitr SVC 1.27 19.38 20.65 ==> __ Program Active Program Active 12.02 0.00 12.02 => __ CICS Program Ctl Del Loader Delay 0.00 8.35 8.35 > __ ESR SVC 122 (TYPE2) Unknown function 0.14 0.00 0.14 __ Program Load Delay LOAD SVC 122-9 0.14 0.00 0.14 __ Resource Conflict Global Serialization 0.14 0.00 0.14 __ System Active Restore SVC 0.14 0.00 0.14 __ Unix System Services loadhfs (BPX1LOD) 0.14 0.00 0.14 ********************************* End of Table ********************************
358 TriTune User Guide

Analyzing JVM data
5 Position the cursor and press Enter to autonavigate from the DelayView panel to display the JVM Applications panel (Figure 165).
You can also select Option 12 - JVM - Java Virtual Machine from the Interactive Analysis menu to display the JVM Applications panel.
Table 107 describes the fields that are displayed on this panel.
NOTE If you autonavigate from the TranView Delay Detail panel, only the JVM activity that is associated with the selected transaction is reported.
Figure 165 JVM Applications panel
TriTune ------------------ JVM Applications ----------------- Row 1 to 3 of 3 COMMAND ===> SCROLL ===> HALF Primary commands: MOde Process/Application/Via/Current Profile: JVM1 Options: NORMAL Line commands: A - Application Methods T - Threads Mode: Process V - Via Methods NI - JVM Info Tran: * C - Current Methods JVM JVM LC Process ID Release Information Pct% Visual __________ _______ ________________________________________ _____ __________-------------------------------------------------------------------------------__ 33555438 1.4.2 J2RE 1.4.2 IBM z/OS Persistent Reusable 50.00 =========>__ 16778231 1.4.2 J2RE 1.4.2 IBM z/OS Persistent Reusable 42.48 =======> __ 33555444 1.4.2 J2RE 1.4.2 IBM z/OS Persistent Reusable 7.52 > ********************************* End of Table ********************************
Table 107 JVM Applications panel fields
Field Description
Process ID displays the identification numbers or the processes that are monitored by using a Java Virtual Machine
JVM release displays the release level of the Java Virtual Machine (obtained from java.vm.version)
JVM Info displays the Java Virtual Machine System Properties (obtained from java.vm.info)
Pct% displays the percentage of all JVM activity measured where TriTune detected program code to be executing
This value is calculated based on the total of JVM activity, not the total number of TriTune samples. First volume serial of the data set.
Visual displays a visual depiction of the Pct% value
Chapter 13 Using TriTune in a Java Virtual Machine (JVM) environment 359
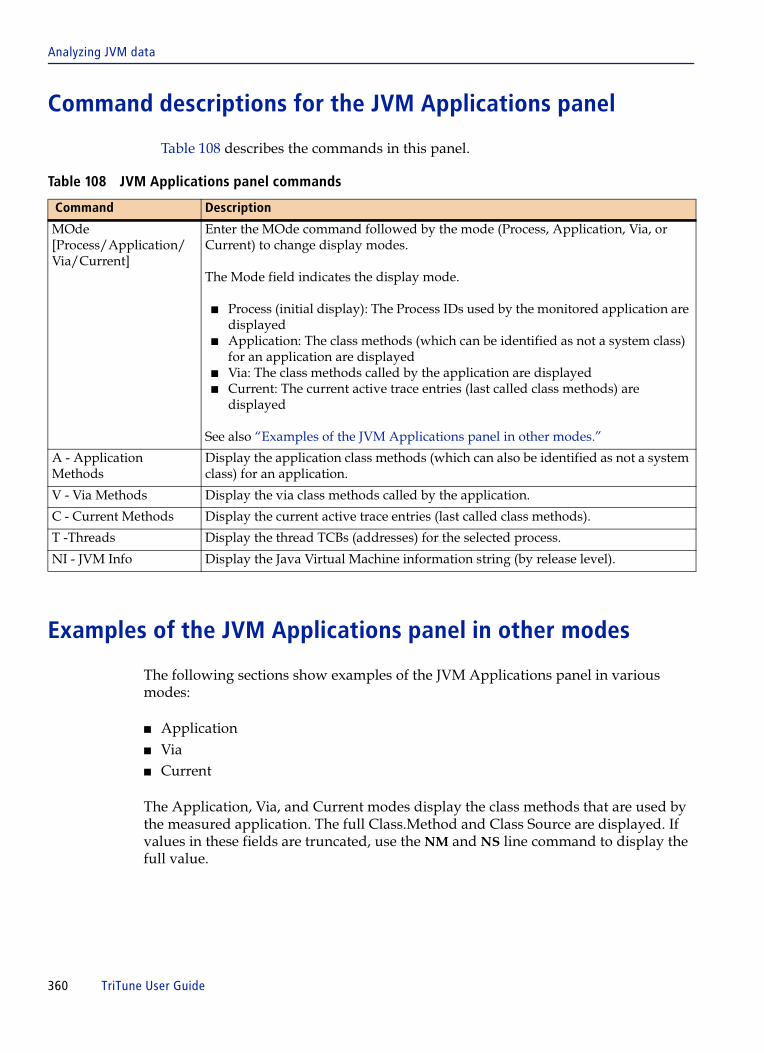
Analyzing JVM data
Command descriptions for the JVM Applications panel
Table 108 describes the commands in this panel.
Examples of the JVM Applications panel in other modes
The following sections show examples of the JVM Applications panel in various modes:
■ Application■ Via■ Current
The Application, Via, and Current modes display the class methods that are used by the measured application. The full Class.Method and Class Source are displayed. If values in these fields are truncated, use the NM and NS line command to display the full value.
Table 108 JVM Applications panel commands
Command Description
MOde [Process/Application/Via/Current]
Enter the MOde command followed by the mode (Process, Application, Via, or Current) to change display modes.
The Mode field indicates the display mode.
■ Process (initial display): The Process IDs used by the monitored application are displayed
■ Application: The class methods (which can be identified as not a system class) for an application are displayed
■ Via: The class methods called by the application are displayed■ Current: The current active trace entries (last called class methods) are
displayed
See also “Examples of the JVM Applications panel in other modes.”
A - Application Methods
Display the application class methods (which can also be identified as not a system class) for an application.
V - Via Methods Display the via class methods called by the application.
C - Current Methods Display the current active trace entries (last called class methods).
T -Threads Display the thread TCBs (addresses) for the selected process.
NI - JVM Info Display the Java Virtual Machine information string (by release level).
360 TriTune User Guide

Analyzing JVM data
Application mode
Figure 166 shows the JVM Applications panel in Application mode.
Via mode
Figure 167 shows the JVM Applications panel in Via mode.
Figure 166 JVM Applications panel: Application mode
TriTune ------------------ JVM Applications --------------- Row 1 to 10 of 10 COMMAND ===> SCROLL ===> HALF Primary commands: MOde Process/Application/Via/Current Profile: JVM1 Options: NORMAL Line commands: A - Application Methods P - Processes Mode: Appl. V - Via Methods NM - Method Name Tran: * C - Current Methods NS - Source Name D - Method Details LC Class.Method Class Source Pct% Visual ___________________________________ _______________________ _____ __________-------------------------------------------------------------------------------__ WaitTest.main WaitTest.java 74.51 =========>__ c/Launcher$AppClassLoader.loadClass Launcher.java 6.07 __ java/lang/ClassLoader.loadClass ClassLoader.java 5.10 __ com/ibm/cics/server/Wrapper.main Wrapper.java 4.61 __ om/ibm/cics/server/Wrapper.<clinit> Wrapper.java 4.37 __ /net/URLClassLoader$ClassFinder.run URLClassLoader.java 2.67 __ java/lang/ClassLoader.defineClass0 ClassLoader.java 0.97 __ rity/AccessController.doPrivileged1 AccessController.java 0.73 __ java/lang/ClassLoader.defineClass ClassLoader.java 0.49 __ java/net/URLClassLoader.defineClass URLClassLoader.java 0.49 ********************************* End of Table ********************************
Figure 167 JVM Applications panel: Via mode
TriTune ------------------ JVM Applications --------------- Row 1 to 11 of 15 COMMAND ===> SCROLL ===> HALF Primary commands: MOde Process/Application/Via/Current Profile: JVM1 Options: NORMAL Line commands: A - Application Methods P - Processes Mode: Via V - Via Methods NM - Method Name Tran: * C - Current Methods NS - Source Name D - Method Details LC Class.Method Class Source Pct% Visual ___________________________________ _______________________ _____ __________-------------------------------------------------------------------------------__ java/math/BigInteger.divide BigInteger.java 64.56 =========>__ ** No Calls ** 7.52 > __ java/lang/ClassLoader.loadClass ClassLoader.java 7.04 > __ c/Launcher$AppClassLoader.loadClass Launcher.java 5.10 __ cics/server/Wrapper.collectingTrace Wrapper.java 4.13 __ m/cics/server/Wrapper.callUserClass Wrapper.java 3.88 __ java/net/URLClassLoader.access$500 URLClassLoader.java 2.67 __ java/math/BigInteger.multiply BigInteger.java 2.18 __ /net/URLClassLoader$ClassFinder.run URLClassLoader.java 0.73 __ urity/SecureClassLoader.defineClass SecureClassLoader.java 0.49 __ ibm/cics/server/Wrapper.driveReInit Wrapper.java 0.49
Chapter 13 Using TriTune in a Java Virtual Machine (JVM) environment 361

Analyzing JVM data
Current mode
Figure 168 shows the JVM Applications panel in Current mode.
Table 109 describes the various commands that are available on these panels.
Figure 168 JVM Applications panel
TriTune ------------------ JVM Applications --------------- Row 1 to 11 of 31 COMMAND ===> SCROLL ===> HALF Primary commands: MOde Process/Application/Via/Current Profile: JVM1 Options: NORMAL Line commands: A - Application Methods P - Processes Mode: Current V - Via Methods NM - Method Name Tran: * C - Current Methods NS - Source Name D - Method Details LC Class.Method Class Source Pct% Visual ___________________________________ _______________________ _____ __________-------------------------------------------------------------------------------__ ath/MutableBigInteger.divideOneWord MutableBigInteger.java 62.38 =========>__ java/util/zip/ZipFile.open ZipFile.java 4.37 __ java/util/zip/ZipFile.getEntry ZipFile.java 4.37 __ WaitTest.main WaitTest.java 3.40 __ java/math/BigInteger.divide BigInteger.java 2.91 __ java/net/URL.openConnection URL.java 2.67 __ nixFileSystem.getBooleanAttributes0 UnixFileSystem.java 2.18 __ java/math/BigInteger.multiplyToLen BigInteger.java 2.18 __ java/lang/String.replace String.java 1.94 __ l/jar/JarFile.hasClassPathAttribute JarFile.java 1.70 __ java/math/MutableBigInteger.divide MutableBigInteger.java 1.70
Table 109 JVM Applications panel commands (part 1 of 2)
Command Description
MOde [Process/Application/Via/Current]
Enter the MOde command followed by the mode (Process, Application, Via, or Current) to change display modes.
The Mode field indicates the display mode.
■ Process (initial display): the Process IDs used by the monitored application are displayed
■ Application: the class methods (which can be identified as not a system class) for an application are displayed
■ Via: the class methods called by the application are displayed■ Current: the current active trace entries (last called class methods) are
displayed
A - Application Methods
Display the application class methods associated with a Class.Method.
V - Via Methods Display the via class methods associated with a Class.Method.
C - Current Methods Display the current active trace entries associated with a Class.Method.
D - Method Details Display the source line numbers within the selected method where activity was detected.
P - Processes Display the process ID's associated with the selected class.
362 TriTune User Guide

Displaying JVM detail reports
Displaying JVM detail reportsThe following sections describe the different JVM detail reports that are available. The level of detail that is displayed depends on from where the detail report was called, and is indicated by the Method, Source, Process, and ThrdTCB fields.
Displaying the JVM Methods panel
The JVM Methods panel (Figure 169) displays the Class.Methods and Class Source information. From here, you can use the D (Method Details) line command to display the line numbers in the class source where the activity was detected and the P (Processes) line command to see the associated Process IDs.
NM - Method Name Display the full name of the selected method (which might have been truncated on the panel display).
NS - Source Name Display the full name of the source file of the selected method (which might have been truncated on the panel display).
Figure 169 JVM Applications panel
TriTune ----------------------- JVM Methods ----------------- Row 1 to 8 of 8 COMMAND ===> SCROLL ===> HALF Primary commands: JVM Information Profile: JVM1 Options: NORMAL Line commands: D - Method Details NM - Method Name Methods: Appl. P - Processes NS - Source Name Tran: * Method: * Source: * Process: 33555438 ThrdTCB: * LC Class.Method Class Source Pct% Visual ___________________________________ _______________________ _____ __________-------------------------------------------------------------------------------__ WaitTest.main WaitTest.java 41.50 =========>__ com/ibm/cics/server/Wrapper.main Wrapper.java 2.67 __ om/ibm/cics/server/Wrapper.<clinit> Wrapper.java 1.94 __ c/Launcher$AppClassLoader.loadClass Launcher.java 1.94 __ java/lang/ClassLoader.loadClass ClassLoader.java 0.97 __ rity/AccessController.doPrivileged1 AccessController.java 0.49 __ /net/URLClassLoader$ClassFinder.run URLClassLoader.java 0.24 __ java/lang/ClassLoader.defineClass0 ClassLoader.java 0.24
Table 109 JVM Applications panel commands (part 2 of 2)
Command Description
Chapter 13 Using TriTune in a Java Virtual Machine (JVM) environment 363

Displaying JVM detail reports
Table 110 describes the commands that are available on the JVM Methods panel.
Displaying the JVM Methods panel
Enter the D line command on the JVM Methods panel to display the JVM Method Detail panel (Figure 170). The JVM Method Detail panel displays the line numbers in the class source where activity was detected.
Displaying the JVM Thread TCBs panel
Enter the T line command on the JVM Applications panel to display the JVM Thread TCBs panel (Figure 171 on page 365). The JVM Thread TCBs panel displays the Thread TCB (hexadecimal address) and UNIX Thread ID (16-byte hexadecimal value) that is associated with the selected process ID. The Application, Via, or Current methods that is associated with a thread can be displayed.
Table 110 JVM Methods panel commands
Command Description
D - Method Details Display the source line numbers within the selected method where activity was detected.
P - Processes Display the process IDs that are associated with the selected class.
NM - Method Name Display the full name of the selected method (which might have been truncated on the panel display).
NS - Source Name Display the full name of the source file of the selected method (which might have been truncated on the panel display).
Figure 170 JVM Applications panel
TriTune ----------------- JVM Method Detail ----------------- Row 1 to 2 of 2 COMMAND ===> SCROLL ===> HALF Method: com/ibm/cics/server/Wrapper.main Profile: JVM1 Source: Wrapper.java Options: NORMAL Process: 33555438 Methods: Appl. ThrdTCB: * Tran: * Line Number Pct% Visual ________________ _____ __________ ------------------------------------------------------------------------------- 1277 2.43 =========> 1101 0.24 > ********************************* End of Table ********************************
364 TriTune User Guide

Displaying JVM detail reports
Table 111 describes the various commands that are available on the JVM Thread TCBs panels.
Figure 171 JVM Thread TCBs panel
TriTune ------------------- JVM Thread TCBs ----------------- Row 1 to 1 of 1 COMMAND ===> SCROLL ===> HALF Line commands: A - Application Methods I - JVM Info Profile: JVM1 V - Via Methods Options: NORMAL C - Current Methods Methods: Appl. Tran: * Method: * Source: * Process: 33555438 ThrdTCB: * LC Thread TCB UNIX Thread ID Pct% Visual __________ ________________ _____ __________ -------------------------------------------------------------------------------__ 006B3200 187CE80000000000 50.00 =========> ********************************* End of Table ********************************
Table 111 JVM Thread TCBs panel commands
Command Description
A - Application Methods
Display the application class methods associated with a Class.Method.
V - Via Methods Display the via class methods associated with a Class.Method.
C - Current Methods Display the current active trace entries associated with a Class.Method.
I - JVM Info Display the JVM Information panel where you can issue the VI line command to see the full Java name of the selected method or source.
Chapter 13 Using TriTune in a Java Virtual Machine (JVM) environment 365

Displaying JVM Delay locations
Displaying JVM Delay locationsThe following sections describe how to display JVM Delay locations from various panels within TriTune.
TranView for CICS panel
Figure 172 shows an example of the TranView for CICS activity panel. From this panel, the D (Delay Details) line command (LC) displays the DelayView Detail panel where you can view JVM activity when a Java application program is running for the transaction.
Figure 172 TranView panel for CICSTriTune -------------------------- TranView ------------------ Row 1 to 4 of 4COMMAND ===> SCROLL ===> CSR Primary commands: SELect, RECall, ADDHelp Profile: JVMCIC62 Options: NORMAL Line commands: T - Tag C - Code Details U - Untag D - Delay Details (Auto-Navigation) N - Data Details LC TRAN T D #Trans Avg RESP Tot CPU Avg CPU Actv% Data% Other% Total% ________ _ _ ______ ________ ________ ________ ______ ______ ______ ______ >------------------------------------------------------------------------------__ CKTI 0 0.00000 0.00000 0.00000 0.00 0.00 54.50 54.50 d_ JTU2 0 7.95610 0.00000 0.00000 42.75 0.88 0.00 43.63 __ JHE2 1 7.95610 0.59597 0.59597 0.59 0.00 0.60 1.19 __ JHE1 1 3.20388 0.54693 0.54693 0.60 0.08 0.00 0.68
366 TriTune User Guide

Displaying JVM Delay locations
DelayView Detail panel
Figure 173 shows the DelayView Detail panel with an example when Java activity is present. The Java Virtual Machine entry under the Major category column shows JVMPI Trace activity under the Minor category. Use autonavigation by placing the cursor on the line and pressing Enter displays additional JVM application data.
Place the cursor on the line for JVMPI Trace activity and press Enter to view the JVM Applications panel (Figure 174).
Figure 173 DelayView Detail panelTriTune ------------------ DelayView Detail ---------------- Row 1 to 10 of 19COMMAND ===> SCROLL ===> CSR Transaction: JTU2 Profile: JVMCIC62 Detail: ON Primary commands: DETail on/off, Module: * ADDHelp Csect: * Offset: * Line commands: A - Address LC Major category Minor category Actv% Wait% Totl% Visual ____________________ ____________________ _____ _____ _____ __________ -------------------------------------------------------------------------------__ Java Virtual Machine JVMPI Trace Activity 36.80 0.00 36.80 =========> __ Java Virtual Machine ExecuteJava 2.01 0.00 2.01 __ System Active Getmain SVC 1.96 0.00 1.96 __ Program Active Program Active 1.22 0.00 1.22 __ CICS Program Ctl Del Loader Delay 0.00 0.88 0.88 __ System Active Restore SVC 0.22 0.00 0.22 __ Voluntary Wait Wait/Waitr SVC 0.20 0.00 0.20 __ System Active Purge SVC 0.14 0.00 0.14 __ Unix System Services sigsuspend (BPX1SSU) 0.09 0.00 0.09 __ System Active Exit SVC 0.03 0.00 0.03
Figure 174 JVM Applications panel TriTune ------------------ JVM Applications ----------------- Row 1 to 2 of 2 COMMAND ===> SCROLL ===> CSR Primary commands: MOde Process/Application/Via/Current Profile: JVMCIC62 Options: NORMAL Line commands: A - Application Methods T - Threads Mode: Process V - Via Methods NI - JVM Info Tran: JTU2 C - Current Methods JVM JVM LC Process ID Release Information Pct% Visual __________ _______ ________________________________________ _____ __________-------------------------------------------------------------------------------__ 16778261 1.3.1 J2RE 1.3.1 IBM OS/390 Persistent Reusabl 52.58 =========>__ 16778264 1.3.1 J2RE 1.3.1 IBM OS/390 Persistent Reusabl 45.58 =======> ********************************* End of Table ********************************
Chapter 13 Using TriTune in a Java Virtual Machine (JVM) environment 367

Displaying JVM Delay locations
Delay Locations Detail panel
On the Delay Locations Detail panel (Figure 175) the Module column contains the JVM short name of the Java activity. The Csect Description column shows only a part of the long name of the Java activity.
To view the entire long name, enter the N (Long Name) line command; a new panel (Figure 176) is displayed with the full long name.
Figure 175 Delay Locations Detail panel TriTune --------------- Delay Locations Detail ------------ Row 1 to 8 of 294 COMMAND ===> SCROLL ===> CSR Delay type: ExecuteJava Profile: JVM Transaction: JTU2 Primary commands: REGister, ADDHelp, DETail on/off Line commands: L - Listing D - Details A - Associate C - Callerid I - Info N - Long Name LC Module Csect Offset Csect Description Stmt D C Pct Visual ________ ________ ________ _____________________ ______ _ _ _____ __________>------------------------------------------------------------------------------N_ BJITC-01 00000000 w/J1.4/bin/libjitc.so Y 24.87 =========>__ IBJVM-01 00000000 bin/classic/libjvm.so Y 5.15 => __ .EUSER .EUSER 3FE26A0E In extended user spac 1.24 __ .EUSER .EUSER 3FE30DB2 In extended user spac 0.76 __ .EUSER .EUSER 3FE26A38 In extended user spac 0.62 __ .EUSER .EUSER 3FE26A08 In extended user spac 0.59 __ .EUSER .EUSER 3FE30DD8 In extended user spac 0.55 __ .EUSER .EUSER 3FE30D9A In extended user spac 0.45
Figure 176 Long Name of the Java activity TriTune -------------------- Long Name -------------- Row 1 to 1 of 1 COMMAND ===> SCROLL ===> CSR Short Name: BJITC-01 Profile: JVM Options: NORMAL -------------------------------------------------------------------------------/SJSE/var/mtw/J1.4/bin/libjitc.so
368 TriTune User Guide

Displaying JVM Delay locations
DelayView panel
Figure 177 shows an example of the DelayView panel when Java activity is detected. The Major category column shows Java Virtual Machine and the Minor category column shows ExecuteJava.
Enter the A (Address) line command next to Java Virtual Machine to view the Delay Locations panel (see “Delay locations”).
Figure 177 DelayView PanelTriTune -------------------------- DelayView --------------- Row 1 to 12 of 21COMMAND ===> SCROLL ===> CSR
Primary commands: DETail on/off Module: * Profile: JVM ADDHelp Csect: * Options: NORMAL Offset: * Detail: ON Line commands: A - Address(AutoNav enabled) S - Distribution
LC Major category Minor category Actv% Wait% Totl% Visual ____________________ ____________________ ______ ______ ______ __________------------------------------------------------------------------------------__ Program Active Program Active 63.83 0.00 63.83 =========>a_ Java Virtual Machine ExecuteJava 22.04 0.00 22.04 ==>__ Voluntary Wait Wait/Waitr SVC 0.55 7.12 7.67 >__ CICS Program Ctl Del Loader Delay 0.00 2.69 2.69__ Unix System Services read (BPX1RED) 1.93 0.00 1.93__ Unix System Services realpath (BPX1RPH) 0.48 0.00 0.48__ Unix System Services lstat (BPX1LST) 0.28 0.00 0.28__ Unix System Services lseek (BPX1LSK) 0.28 0.00 0.28__ Unix System Services open (BPX1OPN) 0.17 0.00 0.17__ PC Call PC Call 0.14 0.00 0.14__ Unix System Services Unix System Services 0.07 0.00 0.07__ Unix System Services loadhfs (BPX1LOD) 0.07 0.00 0.07
Chapter 13 Using TriTune in a Java Virtual Machine (JVM) environment 369

Displaying JVM Delay locations
Delay locations
On the Delay Locations Detail panel (Figure 178) the Module column contains the JVM short name of the Java activity. The Csect Description column shows only a part of the long name of the Java activity.
To view the entire long name, enter the N (Long Name) line command; Figure 179 is displayed with the full long name.
Figure 178 Delay Locations PanelTriTune ----------------------- Delay Locations ----------- Row 1 to 11 of 200COMMAND ===> SCROLL ===> CSR
Delay type: ExecuteJava Profile: JVM
Primary commands: REGister, ADDHelp, LONgname
Line commands: L - Listing D - Details A - Associate C - Callerid I - Info N - Long Name
LC Module Csect Offset Csect Description Stmt D C Pct Visual ________ ________ ________ _____________________ ______ _ _ _____ __________>------------------------------------------------------------------------------_n BJITC-01 00000000 w/J1.4/bin/libjitc.so Y 7.50 =========>__ IBJVM-01 00000000 bin/classic/libjvm.so Y 2.21 =>__ .EUSER .EUSER 3FE26A0E In extended user spac 0.35__ .EUSER .EUSER 3FE30DB2 In extended user spac 0.28__ .EUSER .EUSER 3FE26A6C In extended user spac 0.24__ .EUSER .EUSER 3FE26A18 In extended user spac 0.21__ .EUSER .EUSER 3FE477A8 In extended user spac 0.17__ .EUSER .EUSER 3FE26944 In extended user spac 0.17__ .EUSER .EUSER 3FE26954 In extended user spac 0.17__ .EUSER .EUSER 3FE26A08 In extended user spac 0.17__ .EUSER .EUSER 3FE26A3C In extended user spac 0.17
Figure 179 Long Name of the Java activityTriTune -------------------- Long Name -------------- Row 1 to 1 of 1COMMAND ===> SCROLL ===> CSR
Short Name: BJITC-01 Profile: JVM Options: NORMAL
-------------------------------------------------------------------------------/SJSE/var/mtw/J1.4/bin/libjitc.so
370 TriTune User Guide
C h a p t e r 14
14 Using TriTune in a WebSphere Application Server environmentThis chapter discusses the following topics:
Using TriTune in a WebSphere Application Server environment . . . . . . . . . . . . . . . . 372Introduction . . . . . . . . . . . . . . . . . . . . . . . . . . . . . . . . . . . . . . . . . . . . . . . . . . . . . . . . . 372Monitoring WebSphere Application Server with TriTune. . . . . . . . . . . . . . . . . . . 373
Analyzing WebSphere Application Server transactions . . . . . . . . . . . . . . . . . . . . . . . 377
Chapter 14 Using TriTune in a WebSphere Application Server environment 371

Using TriTune in a WebSphere Application Server environment
Using TriTune in a WebSphere Application Server environment
TriTune is compatible with WebSphere Application Server for z/OS 5.1.
Introduction
The IBM product, WebSphere, includes two foundation products and several foundation extensions. The two products that represent the heart of the product set are WebSphere MQ and WebSphere Application Server (WAS). WAS is what most people think about today when you say WebSphere. WebSphere Application Server is a Java2 Enterprise Edition (J2EE) compliant application server, which means WAS supports the J2EE specification and builds on the J2EE specification.
WAS for z/OS has a Server side and a Client side. A Server comprises a Control Region and one or more corresponding Server Regions. The Control Region is a system address space. No application code runs there. The Control Region manages communications into and out of the server, authenticates all client requests, keeps track of the client transactions, and interfaces with Workload Manager (WLM) to schedule the work.
372 TriTune User Guide

Using TriTune in a WebSphere Application Server environment
A Servant Region is an application address space where an application and its objects run. Between the Control and Servant Regions is a work queue that is administered by Workload Manager. WLM prioritizes the requests and dispatches them to a Servant Region to meet performance targets that the user has defined.
When an application is deployed, the user specifies the WAS server in which the application will execute.
Monitoring WebSphere Application Server with TriTune
The primary targets for the TriTune WebSphere Application Server feature are the Servant Regions of the WAS Server. This situation is unlike a batch application and can be more easily compared to measuring an IMS Message Processing Region, a DB2 Stored Procedures Address Space, or other Service Address Space where several disparate pieces of work might be processing in the same address space.
When you deploy your application, you must also provide the target WAS Server. A given WAS Server can have 1 to n Servant Regions that should be measured. TriTune assumes that you are, in all cases, aware of the name of the affected WAS Server.
Scenario 1—general tuning
This scenario assumes that you are not aware of specific problems areas but suspect or have been made aware of performance degradation.
In this scenario, you run TriTune in non-targeted mode without WAS transaction filters. No detailed reports are produced.
Chapter 14 Using TriTune in a WebSphere Application Server environment 373

Using TriTune in a WebSphere Application Server environment
1 Submit a monitor for each occurrence of the associated J2EE Servant Regions (not the Control Region), unless you already know the Servant Region.
When specifying monitoring criteria for WebSphere, leave the Application URL Filters fields blank, as shown in Figure 180.
Figure 180 WebSphere Application Server Criteria panel without filters
There can be 1 to n occurrences of this Servant address space per WAS Server.
2 Analyze the monitor data sets to view the results.
Select the WebSphere Transactions option to view the transactions detected by TriTune, as shown in Figure 181.
Figure 181 WebSphere Transactions panel without filtering
TriTune ------------- WebSphere Application Server Criteria ---------------COMMAND ===>
Expert Mode ==> N Y - Collect PSW samples N - Disable PSW sampling
Specify Application URL Filters:=> => => =>
Specify System Class Filters:=> => =>
Specify values. Press END to return to Monitoring Criteria
TriTune ------------ WebSphere Transactions ----------------- Row 1 to 9 of 9 COMMAND ===> SCROLL ===> HALF Primary commands: GARbage, WAS (Environment info), SQL Profile: PLANTS1 Mode: URL Line commands: N - URL Name Total Avg Max Min LC Transaction URL Count Resp Resp Resp ________________________________ ______ ________ ________ ________ -------------------------------------------------------------------------------__ /burn/goReflect 5 80658.00 86386.00 76104.00 __ /burn/goWait 8 14607.25 28045.00 943.00 __ /burn/go 5 8141.00 11519.00 5632.00 __ /PlantsByWebSphere/servlet/Shopp 17 2967.65 16547.00 83.00 __ /burn/goCache 5 1584.60 2825.00 679.00 __ /burn/goVector 5 512.80 1415.00 3.00 __ /PlantsByWebSphere/servlet/Image 56 284.36 2157.00 24.00 __ /burn/gogobble 8 27.63 74.00 5.00 __ /PlantsByWebSphere/shopping.jsp 1 8.00 8.00 8.00
374 TriTune User Guide

Using TriTune in a WebSphere Application Server environment
3 Follow up with a subsequent targeted monitor based on the data reported (see “Scenario 2—user suspects a specific problem”).
Scenario 2—user suspects a specific problem
This scenario assumes that you are aware of suspected problem areas or have already monitored the suspect transactions in nontargeted mode.
In this scenario, you target specific transactions with the use of transaction filters and generate detailed reports.
1 Request additional WAS targeting data by providing specific transaction filters.
In the example shown in Figure 182, the filter value *plants* will cause only those transactions containing the value plants to be reported.
Figure 182 WebSphere Application Server Criteria panel with filter
You can specify several filter patterns in each input field, separated by a comma (*plants*,*admin*,/burn*).
2 Submit a monitor for each occurrence of the associated J2EE Servant Regions, unless you already know the Servant Region.
There can be 1 to n occurrences of this Servant address space.
TriTune ------------- WebSphere Application Server Criteria ---------------COMMAND ===>
Expert Mode ==> N Y - Collect PSW samples N - Disable PSW sampling
Specify Application URL Filters:=> *plants*=> => =>
Specify System Class Filters:=> => =>
Specify values. Press END to return to Monitoring Criteria
Chapter 14 Using TriTune in a WebSphere Application Server environment 375

Using TriTune in a WebSphere Application Server environment
3 Analyze the monitor data sets to identify specific causes of application performance issues.
The WebSphere Transactions report will only contain transactions whose URL names match the filter criteria, as shown in Figure 183.
Figure 183 WebSphere Transactions panel after filtering
TriTune ------------ WebSphere Transactions ----------------- Row 1 to 2 of 2 COMMAND ===> SCROLL ===> HALF Primary commands: MOde URL/Application/Via/Current, Profile: PLANTS2 GARbage, WAS (Environment info), SQL Mode: URL Line commands: A - Application Classes S - SQL V - Via Classes D - Delays C - Current Classes N - URL Name LC Transaction URL Active% InvWait% VolWait% Total% Visual ________________________________ _______ ________ ________ ______ __________>------------------------------------------------------------------------------__ /PlantsByWebSphere/servlet/Shopp 83.11 0.00 0.00 83.11 =========>__ /PlantsByWebSphere/servlet/Image 16.89 0.00 0.00 16.89 => ********************************* End of Table ********************************
376 TriTune User Guide

Analyzing WebSphere Application Server transactions
Analyzing WebSphere Application Server transactions
TriTune enables you to analyze WebSphere Application Server data at the WebSphere transaction level.
Use the following steps to analyze WebSphere transactions:
1 From the Interactive Analysis menu, select Option 13 (Figure 184).
Figure 184 Interactive Analysis panel: Option 13
TriTune --------------------- Interactive Analysis ----------------------------OPTION ===>
Enter option to analyze the monitored job: Profile: WAS5 Options: NORMAL TriTune Monitor Information Subsystem Details ------------------------------------------- ------------------------------ 0 OverView - Monitor session information 10 DB2 - View all SQL 1 TaskView - Activity by task 11 IMS - IMS Transactions 2 DelayView - Program delays 12 JVM - Java Virtual Machine 3 CodeView - Program activity 13 WAS - WebSphere App Server 4 TimeView - Samples by time 5 DataView - Dataset information 6 TranView - Activity by transaction 7 ModView - Module layout 8 PoolView - Buffer pools 9 USSView - Unix System Services Press END to exit analysis
Chapter 14 Using TriTune in a WebSphere Application Server environment 377

Analyzing WebSphere Application Server transactions
The WebSphere Transactions panel is displayed (Figure 185).
Figure 185 WebSphere transactions
The WebSphere Transactions panel presents activity and perfomance information for the transaction URLs that are monitored by TriTune.
Table 112 describes the fields in this panel.
TriTune ------------ WebSphere Transactions ----------------- Row 1 to 6 of 6COMMAND ===> SCROLL ===> CSR
Primary commands: MOde URL/Application/Via/Current, Profile: WAS7 GARbage, WAS (Environment info), SQL Mode: URL
Line commands: A - Application Classes S - SQL V - Via Classes D - Delays C - Current Classes N - URL Name
LC Transaction URL Active% InvWait% VolWait% Total% Visual ________________________________ _______ ________ ________ ______ __________>------------------------------------------------------------------------------__ common/GoWait 53.82 0.00 0.00 53.82 =========>__ common/GoDB2MF 28.45 0.00 0.00 28.45 ====>__ common/GoReflect 13.49 0.00 0.00 13.49 =>__ /burn/go 4.13 0.00 0.00 4.13__ common/GoGobble 0.10 0.00 0.00 0.10__ common/GoCache 0.02 0.00 0.00 0.02********************************* End of Table ********************************
Table 112 WebSphere Transactions panel fields
Field Description
Transaction URL name of the sampled transaction URL
Active% percentage of all WebSphere transactions measured where TriTune detected program code to be executing
InvWait% percentage of all WebSphere transactions measured where TriTune detected program code to be in an involuntary wait
VolWait% percentage of all WebSphere transactions measured where TriTune detected program code to be in a voluntary wait
Total% sum of active, voluntary, and involuntary waits
Visual visual representation of the Total% value Total Count total number of URL instances detected
Avg Resp average response time for the transaction in milliseconds
Max Resp maximum response time for the transaction in milliseconds
Min Resp minimum response time for the transaction in milliseconds
378 TriTune User Guide

Analyzing WebSphere Application Server transactions
When no URL filters are specified in the WebSphere monitoring criteria panel (see “Monitoring criteria for WebSphere Application Server” on page 87), TriTune does not collect Class data (Application, Via, or Current) or activity statistics. Only WebSphere transactions, garbage collection, environment, and SQL data is collected. In this case, a list of transactions is displayed (Figure 186), which you can use to define URL filters for subsequent monitors.
Figure 186 Transaction only modeTriTune ------------ WebSphere Transactions ----------------- Row 1 to 7 of 7COMMAND ===> SCROLL ===> CSR
Primary commands: GARbage, WAS (Environment info), SQL Profile: WAS4 Mode: URL Line commands: N - URL Name
Total Avg Max MinLC Transaction URL Count Resp Resp Resp ________________________________ ______ ________ ________ ________-------------------------------------------------------------------------------__ /burn/goReflect 1 13293.00 13293.00 13293.00__ /burn/goDB2MF 1 10073.00 10073.00 10073.00__ /burn/go 1 2808.00 2808.00 2808.00__ /burn/gogobble 1 39.00 39.00 39.00__ /burn/goCache 1 24.00 24.00 24.00__ /burn/goVector 1 2.00 2.00 2.00__ /burn/goWait 1 0.00 0.00 0.00********************************* End of Table ********************************
Transaction only mode
Chapter 14 Using TriTune in a WebSphere Application Server environment 379

Analyzing WebSphere Application Server transactions
2 From the WebSphere Transactions panel (Figure 185 on page 378), enter the MOde primary command on the COMMAND line and press Enter to see all classes of the selected type (Application/Via/Current). For example:
■ Type MO A to see all the Application classes.■ Type MO V to see all the Via classes.■ Type MO C to see all the Current classes.
The WebSphere Classes panel is displayed (Figure 187).
Figure 187 WebSphere class mode
This panel shows a high-level display of classes for the selected mode.
TriTune ----------------- WebSphere Classes ----------------- Row 1 to 4 of 4COMMAND ===> SCROLL ===> CSR
Primary commands: MOde URL/Application/Via/Current Profile: WAS5 GARbage, WAS (Environment info), SQL Mode: Appl.
Line commands: D - Delays NC - Class Name S - SQL NM - Method Name
LC Class Name Method Name Line # Active% InvWait% ________________________ ________________________ ________ _______ ________>------------------------------------------------------------------------------__ common/IoPerform read Compiled 48.03 0.00__ common/CpuPerform exercise Compiled 47.35 0.00__ common/GoHeader processRequest 41 4.19 0.00__ common/GoHeader processRequest 42 0.43 0.00********************************* End of Table ********************************
380 TriTune User Guide
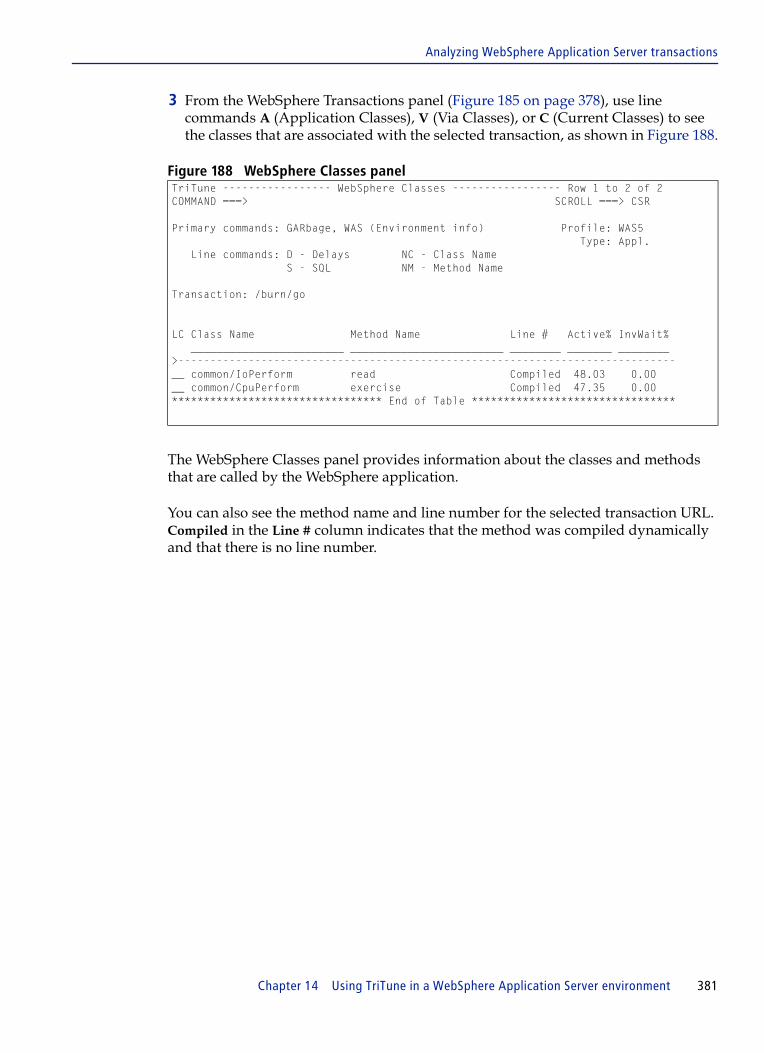
Analyzing WebSphere Application Server transactions
3 From the WebSphere Transactions panel (Figure 185 on page 378), use line commands A (Application Classes), V (Via Classes), or C (Current Classes) to see the classes that are associated with the selected transaction, as shown in Figure 188.
Figure 188 WebSphere Classes panel
The WebSphere Classes panel provides information about the classes and methods that are called by the WebSphere application.
You can also see the method name and line number for the selected transaction URL. Compiled in the Line # column indicates that the method was compiled dynamically and that there is no line number.
TriTune ----------------- WebSphere Classes ----------------- Row 1 to 2 of 2COMMAND ===> SCROLL ===> CSR
Primary commands: GARbage, WAS (Environment info) Profile: WAS5 Type: Appl. Line commands: D - Delays NC - Class Name S - SQL NM - Method Name
Transaction: /burn/go
LC Class Name Method Name Line # Active% InvWait% ________________________ ________________________ ________ _______ ________>------------------------------------------------------------------------------__ common/IoPerform read Compiled 48.03 0.00__ common/CpuPerform exercise Compiled 47.35 0.00********************************* End of Table ********************************
Chapter 14 Using TriTune in a WebSphere Application Server environment 381

Analyzing WebSphere Application Server transactions
4 From the WebSphere Transactions panel (Figure 185 on page 378), use line command D (Delays) to see the delay category for the selected transaction, as shown in Figure 189.
Possible delay categories are
■ IO delay■ network delay■ SQL delay■ JMS delay■ other delay
Figure 189 WebSphere Delays panel
The WebSphere Delays panel reports the delays that are attributed to the selected transaction or class.
TriTune ------------------ WebSphere Delays ----------------- Row 1 to 1 of 1COMMAND ===> SCROLL ===> CSR
Primary commands: GARbage, WAS (Environment info) Profile: WAS5 Type: URLTransaction: /burn/go Class Name: *Method Name: *Line Number: *
Delay Active% InvWait% VolWait% Total% Visual_______________ _______ ________ ________ ______ __________-------------------------------------------------------------------------------Other Delay 95.38 0.00 0.00 95.38 ========>********************************* End of Table ********************************
382 TriTune User Guide

Analyzing WebSphere Application Server transactions
5 From the WebSphere Transactions panel (Figure 185 on page 378), use line command S (SQL) to see the SQL statement information for the selected transaction, as shown in Figure 190.
Figure 190 WebSphere SQL Statements panel
The WebSphere SQL Statements panel reports the SQL statement information that is associated with the selected transaction or class.
If a statement has been truncated on this panel, you can use line command S again to see the full text of the selected SQL statement.
Or, you can use the SQL primary command to see all detected SQL statements in the following step.
TriTune ---------- WebSphere SQL Statements ----------------- Row 1 to 3 of 3COMMAND ===> SCROLL ===> CSR
Primary commands: GARbage, WAS (Environment info) Profile: WAS5 Type: URL Line commands: S - Display SQL
Transaction: /burn/go Class Name: *Method Name: *Line Number: *
Total Avg Resp Max Resp Min RespLC SQL Statement Count Time (ms) Time (ms) Time (ms) ________________________________ _________ _________ _________ _________-------------------------------------------------------------------------------__ update COT_School set COT_School 0 0.00 0.00 0.00__ select ordertype as ordertype, c 0 0.00 0.00 0.00__ select count(*) as kount, state 0 0.00 0.00 0.00********************************* End of Table ********************************
Chapter 14 Using TriTune in a WebSphere Application Server environment 383

Analyzing WebSphere Application Server transactions
6 From the WebSphere Transactions panel (Figure 185 on page 378 or Figure 186 on page 379), enter the SQL primary command on the COMMAND line and press Enter to see all detected SQL statements, as shown in Figure 191.
Figure 191 All detected SQL statements
7 From the WebSphere SQL Statements panel (Figure 191), use line command T (Transactions) to see the transactions that are associated with the selected SQL statement, as shown in Figure 192.
Figure 192 WebSphere Transaction Detail panel
If the SQL statement text is truncated on this panel, you can use the STMT command to see the full text of the SQL statement.
TriTune ---------- WebSphere SQL Statements --------------- Row 1 to 6 of 102COMMAND ===> SCROLL ===> CSR
Primary commands: GARbage, WAS (Environment info) Profile: WAS7 Type: ALL Line commands: S - Display SQL T - Transactions
Transaction: * Class Name: *Method Name: *Line Number: *
Total Avg Resp Max Resp Min RespLC SQL Statement Count Time (ms) Time (ms) Time (ms) ________________________________ _________ _________ _________ _________-------------------------------------------------------------------------------__ select count(TEXT8), 50 112.00 219.00 77.00__ insert into btsrfr.TR 2 96.00 174.00 18.00__ update btsrfr.TRI40TB 1 68.00 68.00 68.00__ update btsrfr.TRI40TB 1 62.00 62.00 62.00__ update btsrfr.TRI40TB 1 62.00 62.00 62.00__ update btsrfr.TRI40TB 1 61.00 61.00 61.00
TriTune ----------- WebSphere Transaction Detail ----------------- Row 1 to 1 COMMAND ===> SCROLL ===> PAGE Primary commands: GARbage, WAS (Environment info), STMT Profile: WASAZB1 Type: ALL Line commands: A - Application Classes V - Via Classes C - Current Classes N - URL Name SQL Stmt: select count(TEXT8), TEXT8 from btsrfr.TRI40TB group by TEXT8 order LC Transaction URL Active% InvWait% VolWait% Total% Visual ________________________________ _______ ________ ________ ______ __________>------------------------------------------------------------------------------__ /burn/goDB2MF 7.16 0.00 0.00 7.16 =========>********************************* End of Table ********************************
384 TriTune User Guide
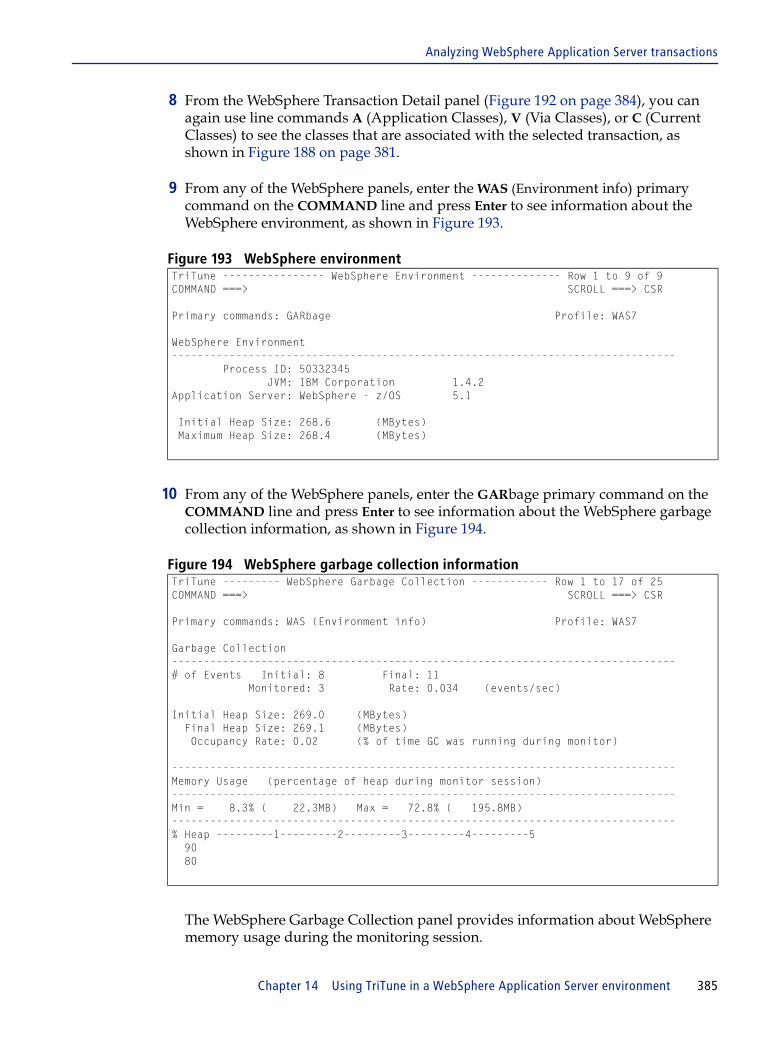
Analyzing WebSphere Application Server transactions
8 From the WebSphere Transaction Detail panel (Figure 192 on page 384), you can again use line commands A (Application Classes), V (Via Classes), or C (Current Classes) to see the classes that are associated with the selected transaction, as shown in Figure 188 on page 381.
9 From any of the WebSphere panels, enter the WAS (Environment info) primary command on the COMMAND line and press Enter to see information about the WebSphere environment, as shown in Figure 193.
Figure 193 WebSphere environment
10 From any of the WebSphere panels, enter the GARbage primary command on the COMMAND line and press Enter to see information about the WebSphere garbage collection information, as shown in Figure 194.
Figure 194 WebSphere garbage collection information
The WebSphere Garbage Collection panel provides information about WebSphere memory usage during the monitoring session.
TriTune ---------------- WebSphere Environment -------------- Row 1 to 9 of 9COMMAND ===> SCROLL ===> CSR
Primary commands: GARbage Profile: WAS7
WebSphere Environment------------------------------------------------------------------------------- Process ID: 50332345 JVM: IBM Corporation 1.4.2Application Server: WebSphere - z/OS 5.1
Initial Heap Size: 268.6 (MBytes) Maximum Heap Size: 268.4 (MBytes)
TriTune --------- WebSphere Garbage Collection ------------ Row 1 to 17 of 25COMMAND ===> SCROLL ===> CSR
Primary commands: WAS (Environment info) Profile: WAS7
Garbage Collection-------------------------------------------------------------------------------# of Events Initial: 8 Final: 11 Monitored: 3 Rate: 0.034 (events/sec)
Initial Heap Size: 269.0 (MBytes) Final Heap Size: 269.1 (MBytes) Occupancy Rate: 0.02 (% of time GC was running during monitor)
-------------------------------------------------------------------------------Memory Usage (percentage of heap during monitor session)-------------------------------------------------------------------------------Min = 8.3% ( 22.3MB) Max = 72.8% ( 195.8MB)-------------------------------------------------------------------------------% Heap ---------1---------2---------3---------4---------5 90 80
Chapter 14 Using TriTune in a WebSphere Application Server environment 385

Analyzing WebSphere Application Server transactions
386 TriTune User Guide

C h a p t e r 15
15 Using TriTune in a WebSphere for MQ environmentThis chapter describes how you can use TriTune to identify and locate delays in your WebSphere for MQ environment.
TriTune also recognizes delays incurred by Queue Managers in this environment.
This chapter describes the following topic:
Analyzing WebSphere for MQ data . . . . . . . . . . . . . . . . . . . . . . . . . . . . . . . . . . . . . . . . 388
Chapter 15 Using TriTune in a WebSphere for MQ environment 387

Analyzing WebSphere for MQ data
Analyzing WebSphere for MQ dataTo analyze WebSphere for MQ data, no setup is required. If WebSphere for MQ is running, TriTune will discover it and begin collecting statistical data. Begin your monitoring session from the DelayView or DataView panel.
Figure 195 DelayView panel
1 Select MQSeries Delay and press Enter.
The Queue Manager Activity panel (Figure 196) is displayed.
Figure 196 Queue Manager Activity panel
TriTune -------------------------- DelayView --------------- Row 5 to 17 of 17 COMMAND ===> SCROLL ===> HALF Primary commands: DETail on/off Module: * Profile: ASFDFD ADDHelp Csect: * Options: NORMAL Offset: * Detail: ON Line commands: A - Address S - Distribution LC Major category Minor category Actv% Wait% Totl% Visual ____________________ ____________________ ______ ______ ______ __________ -------------------------------------------------------------------------------__ MQSeries Delay MQSeries Delay 0.00 5.50 5.50 > __ Other Delays Unknown wait type 0.00 2.12 2.12 __ Voluntary Wait Stimer SVC 1.41 0.00 1.41 __ Program Load Delay Load SVC 0.00 1.14 1.14 __ System Active Storage management 0.96 0.00 0.96 __ System Active Regmain SVC 0.73 0.00 0.73 __ System Active Getmain 120 SVC 0.73 0.00 0.73 __ System Active PC-Time service 0.35 0.00 0.35 __ Resource Conflict Enq SVC 0.23 0.00 0.23 __ Abend Proc Delays Sdump SVC 0.08 0.00 0.08 __ Resource Conflict Global Serialization 0.08 0.00 0.08 __ System Active System trace 0.08 0.00 0.08 __ System Active Stae SVC 0.03 0.00 0.03
TriTune ------------- Queue Manager Activity ----------------- Row 1 to 1 of 1 COMMAND ===> SCROLL ===> HALF Line commands: S - Queue Activity C - Code Detail Profile: ASFDFD I - Queue Manager Information Options: NORMAL Queue Queue LC Manager Description Actv% Wait% Totl% Visual _______ ________________________________ ______ ______ ______ __________ >------------------------------------------------------------------------------__ CSQ8 CSQ8, IBM WebSphere MQ for z/OS 0.00 5.50 5.50 =========> ********************************* End of Table ********************************
388 TriTune User Guide

Analyzing WebSphere for MQ data
The Queue Manager Activity panel displays information about WebSphere for MQ calls that are detected by TriTune. Each row indicates the active and wait time for a specific Queue Manager. Table 113 provides a description for each field in the Queue Manager Activity panel.
2 To display additional information about a specific Queue Manager, enter the I line command beside the Queue Manager’s name.
The Queue Manager Information panel (Figure 197) is displayed.
Figure 197 Queue Manager Information panel
The Queue Manager Information panel provides information about the selected Queue Manager. Table 114 on page 390 provides a description for each field in the Queue Manager Information panel.
Table 113 Queue Manager Activity fields
Field Description
Queue Manager four-character subsystem name of the Queue Manager
Queue Description text description of the function or purpose of the Queue Manager
if the description is truncated, scroll the panel to the right to display the full description
TriTune ------------ Queue Manager Information ------------ Row 1 to 18 of 18 COMMAND ===> SCROLL ===> HALF Queue Manager . . . . . . CSQ8 Profile: ASFDFD Options: NORMAL Queue Manager Identifier . CSQ8.B909215A58FB9560 Description . . . . . . . CSQ8, IBM WebSphere MQ for z/OS - V5.3 Command Level . . . . . . 5.3.0 Platform Type . . MQPL_MVS Expiry Interval . . . . . OFF Platform Name . . SJSE Trigger Interval . . . . . 999999999 User ID . . . . . Queue Sharing Group . . . QSH3 Syncpoint . . . . MQSP_AVAILABLE Maximum Handles . . . . . 256 Max Priority . . 9 Maximum Message Length . . 104857600 Max Uncommitted . 10000 Queue Names ------------------------------------------------------------------- Command Input . . . . . . SYSTEM.COMMAND.INPUT Dead Letter . . . . . . . CSQ8.DEAD.QUEUE Default XMIT . . . . . . . CSQ8.DEFXMIT.QUEUE Repository . . . . . . . . Repository Namelist . . .
Chapter 15 Using TriTune in a WebSphere for MQ environment 389

Analyzing WebSphere for MQ data
3 On the COMMAND line, type C.
The CodeView Detail panel (Figure 198 on page 391) is displayed.
Table 114 Queue Manager Information panel fields
Field Description
Queue Manager four-character subsystem name of the Queue Manager
Queue Manager Identifier unique internally-generated identifier of the Queue Manager
Description Queue Manager description
Command Level level of system control commands supported by the Queue Manager
Expiry Interval interval between scans for expired messages
This value can be either a time interval in seconds (1 to 99,999,999) or OFF
Trigger Interval time interval (in milliseconds) that is used to restrict the number of trigger messages
Queue Sharing Group name of the queue-sharing group to which the Queue Manager belongs
Platform Type operating system on which the Queue Manager is running
Platform Name name of the operating system
User ID user identification of the intra-group queuing agent
Syncpoint indicates whether the Queue Manager supports units of work and syncpointing with the MQGET, MQPUT, and MQPUT1 calls
Maximum Handles maximum number of open handles that any one task can use concurrently
Maximum Message Length maximum message length in bytes
Maximum Priority maximum message priority supported by the Queue Manager
Maximum Uncommitted Messages
maximum number of uncommitted messages that can exist within a unit of work
Command Input name of the command input queue defined on the Queue Manager
Users can send commands to this queue
Dead Letter name of a queue defined on the Queue Manager
Messages are sent to this queue if they cannot be routed to their correct destination
Default XMIT name of the transmission queue that transmits messages to remote Queue Managers if no other transmission queue is identified
Repository name of a cluster for which this Queue Manager provides a repository-manager service
If the Queue Manager provides this service for more than one cluster, Repository Namelist specifies the name of a namelist object that identifies the clusters.
Repository Namelist name of a namelist object that contains the names of clusters for which this Queue Manager provides a repository-manager service
390 TriTune User Guide

Analyzing WebSphere for MQ data
Figure 198 CodeView Detail panel
4 Go back to the Queue Manager Activity panel and use the S line command to display the Queue Activity panel (Figure 199).
Figure 199 Queue Activity panel
The Queue Activity panel shows the detected activity of each queue within a Queue Manager. Each row shows wait and CPU activity for each queue that is used by the application within the selected Queue Manager. Table 115 on page 392 provides a description for each field in the Queue Manager Information panel.
TriTune ------------------- CodeView Detail ------------------ Row 1 to 1 of 1 COMMAND ===> SCROLL ===> HALF Queue Manager: CSQ8 Request Type: N/A Profile: ASFDFD Queue Name: N/A Options: NORMAL Mode: CSECT Primary commands: MOde Pseudo/Module/Csect/4GL, PSEudo, REGister, ADDHelp Line commands: A - Associate C - Callerid D - Delays N - Long Name I - Info L - Listing S - Distribution H - Histogram NH - Normalized Histogram
LC Module Csect Description L C Actv% Wait% Totl% Visual ________ ________ _________________________ _ _ _____ _____ _____ __________>------------------------------------------------------------------------------__ CSQBSRV CSQAPRH MQSeries A Y 0.00 5.50 5.50 =========>
TriTune --------------------- Queue Activity ----------------- Row 1 to 3 of 3 COMMAND ===> SCROLL ===> HALF Queue Manager: CSQ8 Profile: ASFDFD Options: NORMAL Line commands: I - Queue Information C - Code Detail Queue LC Queue Name Request Actv% Wait% Totl% Visual ________________________________ ________ ______ ______ ______ __________ >------------------------------------------------------------------------------__ TRITUNE.JRF.QUEUE1 MQGET 0.00 3.13 3.13 ====> __ TRITUNE.JRF.QUEUE1 MQPUT 0.00 2.35 2.35 ===>
Chapter 15 Using TriTune in a WebSphere for MQ environment 391
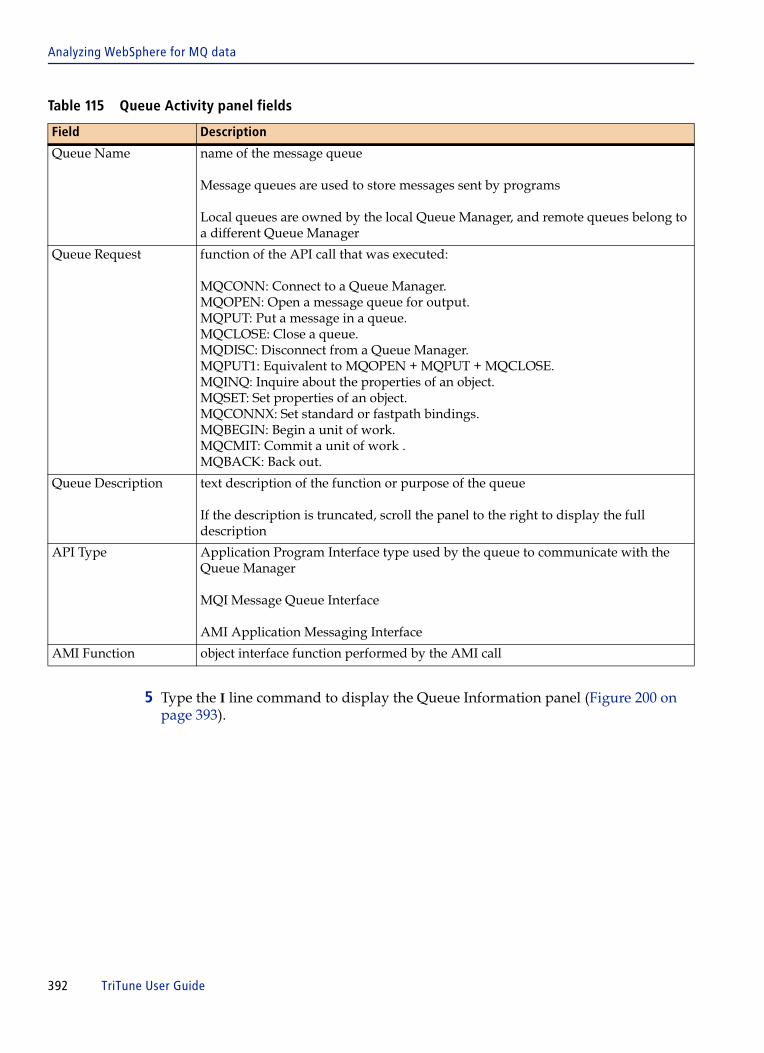
Analyzing WebSphere for MQ data
5 Type the I line command to display the Queue Information panel (Figure 200 on page 393).
Table 115 Queue Activity panel fields
Field Description
Queue Name name of the message queue
Message queues are used to store messages sent by programs
Local queues are owned by the local Queue Manager, and remote queues belong to a different Queue Manager
Queue Request function of the API call that was executed:
MQCONN: Connect to a Queue Manager.MQOPEN: Open a message queue for output.MQPUT: Put a message in a queue.MQCLOSE: Close a queue.MQDISC: Disconnect from a Queue Manager.MQPUT1: Equivalent to MQOPEN + MQPUT + MQCLOSE. MQINQ: Inquire about the properties of an object.MQSET: Set properties of an object.MQCONNX: Set standard or fastpath bindings.MQBEGIN: Begin a unit of work.MQCMIT: Commit a unit of work .MQBACK: Back out.
Queue Description text description of the function or purpose of the queue
If the description is truncated, scroll the panel to the right to display the full description
API Type Application Program Interface type used by the queue to communicate with the Queue Manager
MQI Message Queue Interface
AMI Application Messaging Interface
AMI Function object interface function performed by the AMI call
392 TriTune User Guide

Analyzing WebSphere for MQ data
Figure 200 Queue Information panel
The Queue Information panel displays information about the selected message queue. Message queues are used to store messages that are sent by programs. Local queues are owned by the local Queue Manager, and remote queues belong to a different Queue Manager. Table 116 provides a description for each field in the Queue Information panel.
TriTune -------------------- Queue Information ------------ Row 1 to 21 of 21 COMMAND ===> SCROLL ===> HALF Queue Name . TRITUNE.JRF.QUEUE1 Profile: ASFDFD Description . TRITUNE TESTING Options: NORMAL Queue Manager . . . . . CSQ8 MQ Release . . . . . 5.3.0 Request Type . . . . . MQGET Buffer Length . . . 4096 API Type . . . . . . . MQI Max Message Length . 32768 Environment . . . . . . Max Queue Depth . . 9999 Language . . . . . . . Queue Parameters --------------------------------------------------------------Queue Type . . . . . . MQQT_LOCAL Object Type . . . . . . MQOT_Q Queue Definition Type . MQQDT_PREDEFINED Message Persistence . . MQPER_NOT_PERSISTENT Inhibit Gets . . . . . MQQA_GET_INHIBITED Inhibit Puts . . . . . MQQA_PUT_INHIBITED Options . . . . . . . . MQGMO_SYNCPOINT MQGMO_NO_WAIT MQGMO_ACCEPT_TRUNCATED_MSG Trigger Information -----------------------------------------------------------Trigger Control . . . . MQTC_OFF Trigger Depth . . . 1 Trigger Type . . . . . MQTT_FIRST Trigger Data . . . . .
Table 116 Queue Information panel fields (part 1 of 4)
Field Description
Queue Name name of local or remote Queue Manager
Description description associated with the message queue
Queue Manager run-time program that manages queues and messages for applications provides the Message Queuing Interface (MQI) for communication with applications application programs invoke functions of the Queue Manager by issuing API calls
Chapter 15 Using TriTune in a WebSphere for MQ environment 393

Analyzing WebSphere for MQ data
Request Type function of the API call which was executed:
■ MQCONN: Connect to a Queue Manager.■ MQOPEN: Open a message queue for output.■ MQPUT: Put a message in a queue.■ MQCLOSE: Close a queue. ■ MQDISC: Disconnect from a Queue Manager.■ MQPUT1: Equivalent to MQOPEN + MQPUT + MQCLOSE. ■ MQINQ: Inquire properties of an object.■ MQSET: Set properties of an object. ■ MQCONNX: Set standard or fastpath bindings.■ MQBEGIN: Begin a unit of work. ■ MQCMIT: Commit a unit of work.■ MQBACK: Back out.
API Type Application Program Interface type that is used by the queue to communicate with the Queue Manager:
■ MQI Message Queue Interface ■ AMI Application Messaging Interface
Environment environment in which WebSphere for MQ is running
Language specific language
MQ Release release level of WebSphere for MQ
Buffer Length length of the message buffer in bytes
Max Message Length
length of the longest physical message that can be handled by the Queue Manager
Max Queue Depth maximum number of messages allowed in the queue
Queue Type specific purpose of the queue:
■ MQQT_LOCAL is a queue owned by the Queue Manager to which the application program is connected. It is used to store messages for programs that use the same Queue Manager.
■ MQQT_REMOTE is queue owned by a different Queue Manager (the local definition of a remote queue). A remote queue is not a real queue - it is a structure that contains some of the characteristics of a queue that is hosted by a different Queue Manager.
■ MQQT_ALIAS are alias queues that are not real queues but definitions. They are used to assign different names to the same physical queue. These aliases allow multiple programs to work with the same queue, accessing it under different names and attributes.
■ MQQT_CLUSTER is a local queue that is known throughout a cluster of Queue Managers. Any Queue Manager that belongs to the cluster can send messages to it without the need of a remote definition, or having to define channels to the Queue Manager that owns it.
■ MQQT_MODEL is not a real queue. A model queue is a collection of attributes that are used when a dynamic queue is created.
Table 116 Queue Information panel fields (part 2 of 4)
Field Description
394 TriTune User Guide
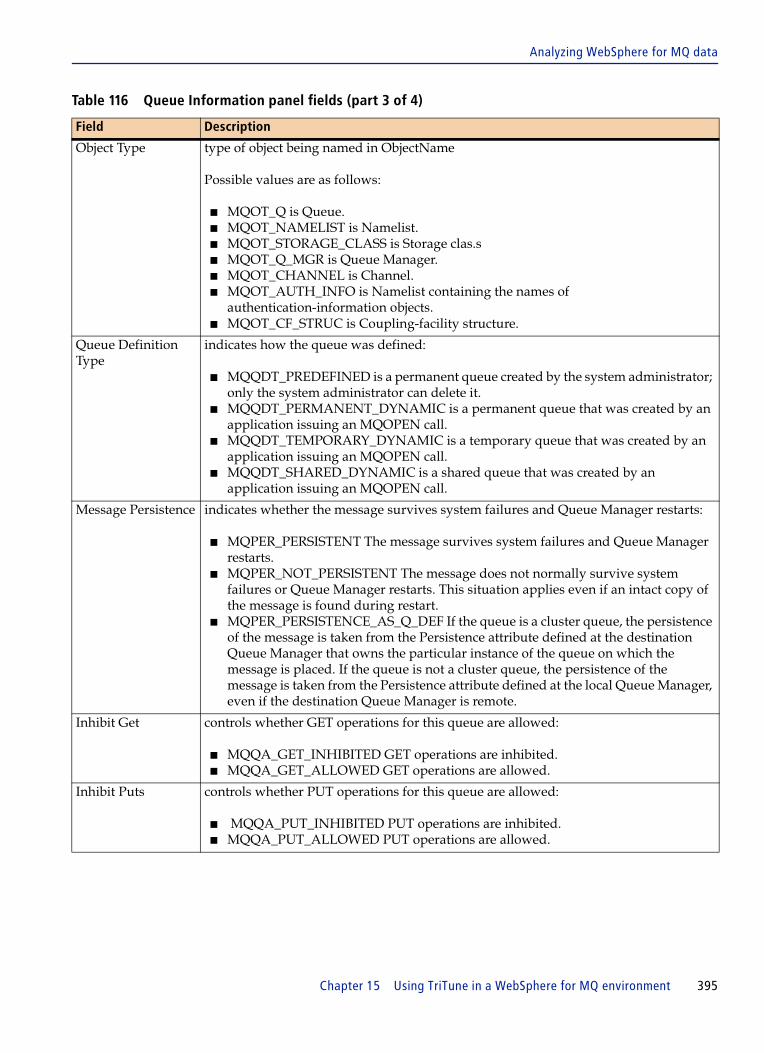
Analyzing WebSphere for MQ data
Object Type type of object being named in ObjectName
Possible values are as follows:
■ MQOT_Q is Queue. ■ MQOT_NAMELIST is Namelist. ■ MQOT_STORAGE_CLASS is Storage clas.s ■ MQOT_Q_MGR is Queue Manager. ■ MQOT_CHANNEL is Channel. ■ MQOT_AUTH_INFO is Namelist containing the names of
authentication-information objects. ■ MQOT_CF_STRUC is Coupling-facility structure.
Queue Definition Type
indicates how the queue was defined:
■ MQQDT_PREDEFINED is a permanent queue created by the system administrator; only the system administrator can delete it.
■ MQQDT_PERMANENT_DYNAMIC is a permanent queue that was created by an application issuing an MQOPEN call.
■ MQQDT_TEMPORARY_DYNAMIC is a temporary queue that was created by an application issuing an MQOPEN call.
■ MQQDT_SHARED_DYNAMIC is a shared queue that was created by an application issuing an MQOPEN call.
Message Persistence indicates whether the message survives system failures and Queue Manager restarts:
■ MQPER_PERSISTENT The message survives system failures and Queue Manager restarts.
■ MQPER_NOT_PERSISTENT The message does not normally survive system failures or Queue Manager restarts. This situation applies even if an intact copy of the message is found during restart.
■ MQPER_PERSISTENCE_AS_Q_DEF If the queue is a cluster queue, the persistence of the message is taken from the Persistence attribute defined at the destination Queue Manager that owns the particular instance of the queue on which the message is placed. If the queue is not a cluster queue, the persistence of the message is taken from the Persistence attribute defined at the local Queue Manager, even if the destination Queue Manager is remote.
Inhibit Get controls whether GET operations for this queue are allowed:
■ MQQA_GET_INHIBITED GET operations are inhibited.■ MQQA_GET_ALLOWED GET operations are allowed.
Inhibit Puts controls whether PUT operations for this queue are allowed:
■ MQQA_PUT_INHIBITED PUT operations are inhibited. ■ MQQA_PUT_ALLOWED PUT operations are allowed.
Table 116 Queue Information panel fields (part 3 of 4)
Field Description
Chapter 15 Using TriTune in a WebSphere for MQ environment 395

Analyzing WebSphere for MQ data
6 Type C to display the CodeView Detail panel for the selected queue.
Trigger Control controls whether trigger messages are written to an initiation queue, in order to cause an application to be started to service the queue:
■ MQTC_OFF - Trigger messages are not required. No trigger messages are to be written for this queue.
■ MQTC_ON - Trigger messages are to be written for this queue when the appropriate trigger events occur.
Trigger Type controls the conditions under which trigger messages are written as a result of messages arriving on this queue:
■ MQTT_NONE - No trigger messages are written as a result of messages on this queue.
■ MQTT_FIRST - A trigger message is written whenever the number of messages of trigger priority or greater on the queue changes from 0 to 1.
■ MQTT_EVERY - A trigger message is written for every message. ■ MQTT_DEPTH - A trigger message is written whenever the number of messages of
trigger priority or greater on the queue equals or exceeds the defined trigger depth.
Trigger Data free-format data that the Queue Manager inserts into the trigger message when a message arriving on this queue causes a trigger message to be written to the initiation queue
Trigger Depth number of messages of trigger priority or greater that must be on the queue before a trigger message is written
AMI Application application which initiated the AMI call
AMI Function object interface function performed by the AMI call
AMI Policy Name name of the AMI policy in use
Policy controls how AMI functions operate.
AMI Service Name name of the pre-defined Service, which defines numerous default AMI parameters
Table 116 Queue Information panel fields (part 4 of 4)
Field Description
396 TriTune User Guide

Analyzing WebSphere for MQ data
Figure 201 CodeView Detail panel
7 Type C again to display the Callerid Detail panel (Figure 202).
Figure 202 Callerid Detail panel
TriTune ------------------- CodeView Detail ------------------ Row 1 to 1 of 1 COMMAND ===> SCROLL ===> HALF Queue Manager: CSQ8 Request Type: MQGET Profile: ASFDFD Queue Name: TRITUNE.JRF.QUEUE1 Options: NORMAL Mode: CSECT Primary commands: MOde Pseudo/Module/Csect/4GL, PSEudo, REGister, ADDHelp Line commands: A - Associate C - Callerid D - Delays N - Long Name I - Info L - Listing S - Distribution H - Histogram NH - Normalized Histogram
LC Module Csect Description L C Actv% Wait% Totl% Visual ________ ________ _________________________ _ _ _____ _____ _____ __________>------------------------------------------------------------------------------__ CSQBSRV CSQAPRH MQSeries A Y 0.00 3.13 3.13 =========>
TriTune ------------------- Callerid Detail ------------------ Row 1 to 1 of 1 COMMAND ===> SCROLL ===> HALF Queue Manager: CSQ8 Request Type: MQGET Profile: ASFDFD Queue Name: TRITUNE.JRF.QUEUE1 Module: CSQBSRV Csect: CSQAPRH Primary commands: REGister, ADDHelp Line commands: L - Listing A - Associate I - Module/Csect Information LC Module Csect Offset Stmt Csect Description Pct Visual ________ ________ ________ _____ _________________________ _____ __________ >------------------------------------------------------------------------------__ CSQ4BAP1 CSQ4BAP1 00000810 2245 MQSeries 3.13 =========>
Chapter 15 Using TriTune in a WebSphere for MQ environment 397

Analyzing WebSphere for MQ data
398 TriTune User Guide
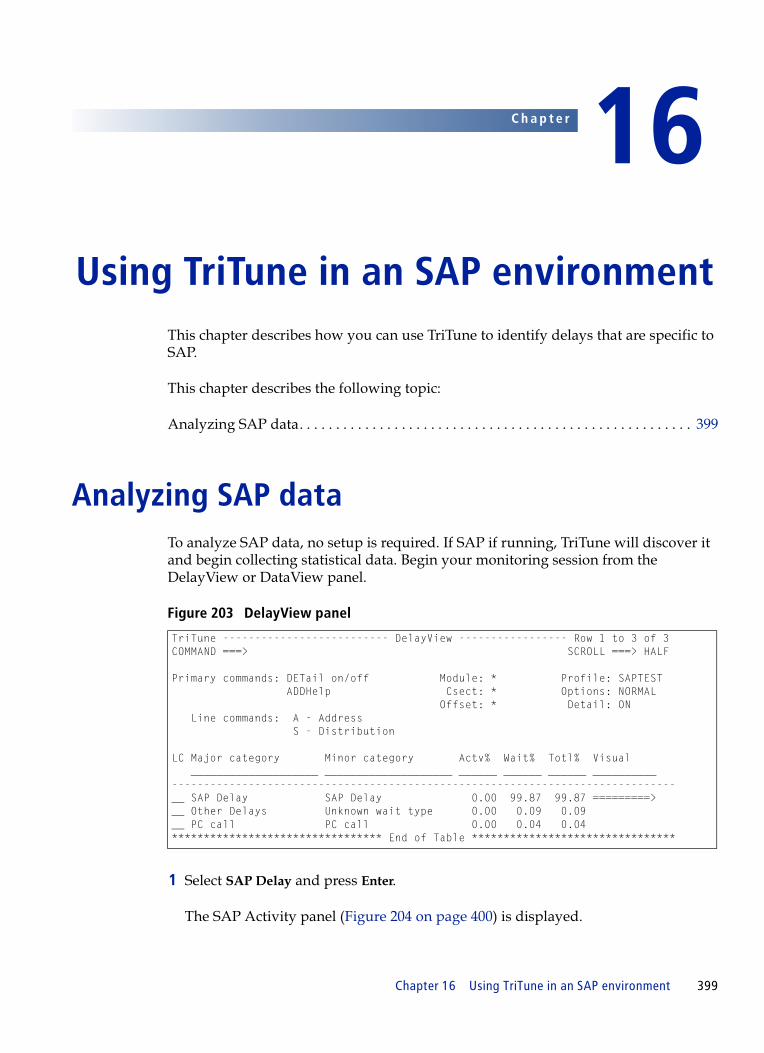
C h a p t e r 16
16 Using TriTune in an SAP environmentThis chapter describes how you can use TriTune to identify delays that are specific to SAP.
This chapter describes the following topic:
Analyzing SAP data. . . . . . . . . . . . . . . . . . . . . . . . . . . . . . . . . . . . . . . . . . . . . . . . . . . . . . 399
Analyzing SAP dataTo analyze SAP data, no setup is required. If SAP if running, TriTune will discover it and begin collecting statistical data. Begin your monitoring session from the DelayView or DataView panel.
Figure 203 DelayView panel
1 Select SAP Delay and press Enter.
The SAP Activity panel (Figure 204 on page 400) is displayed.
TriTune -------------------------- DelayView ----------------- Row 1 to 3 of 3COMMAND ===> SCROLL ===> HALF Primary commands: DETail on/off Module: * Profile: SAPTEST ADDHelp Csect: * Options: NORMAL Offset: * Detail: ON Line commands: A - Address S - Distribution LC Major category Minor category Actv% Wait% Totl% Visual ____________________ ____________________ ______ ______ ______ __________ -------------------------------------------------------------------------------__ SAP Delay SAP Delay 0.00 99.87 99.87 =========> __ Other Delays Unknown wait type 0.00 0.09 0.09 __ PC call PC call 0.00 0.04 0.04 ********************************* End of Table ********************************
Chapter 16 Using TriTune in an SAP environment 399

Analyzing SAP data
Figure 204 SAP Activity panel
The SAP Activity panel displays information about SAP activity that is detected by TriTune. Each row indicates the active and wait time for a specific function. Table 117 provides a description of each field in the SAP Activity panel.
2 To display additional information on a specific RFC function, enter I in the LC column.
The SAP Information panel (Figure 205) is displayed.
Figure 205 SAP Information panel
TriTune ------------------------ SAP Activity----------------------------------------- Row 1 to 1 of 1COMMAND ===> SCROLL ===> HALF Line commands: I - Information Profile: SAPTEST C - Code Detail Options: NORMAL RFC Invoking RFC LC Function Program Destination Actv% Wait% Totl% Visual _________________________ __________ ________________________________ ______ ______ ______ __________ --------------------------------------------------------------------------------------------------------__ Function_Name @ST00001 RFC_Destinaton 0.00 99.87 99.87 =========> *********************************************************** End of Table *******************************
Table 117 SAP Activity fields
Field Definition
RFC Function function of the SAP call
Invoking Program name of the program which originated the SAP call
RFC Destination intended destination of the SAP call
TriTune ------------------ SAP Information------------------- Row 1 to 13 of 13COMMAND ===> SCROLL ===> HALF Profile: SAPTEST Options: NORMAL RFC Function . . . . . . . FUNCTION_NAME Invoking Program . . . . . @ST00001 RFC Destination . . . . . RFC_Destinaton Conversation ID . . . . . 33333333 R/3 ID . . . . . . . . . . 61 R/3 Name . . . . . . . . . P61 Userid . . . . . . . . . . TRITUNE Trace . . . . . . . . . . OFF Language . . . . . . . . . E RFC Role . . . . . . . . . Client RFC Type . . . . . . . . . R/3 RFC Release . . . . . . . 46C Total Time (millisec) . . 900000
400 TriTune User Guide
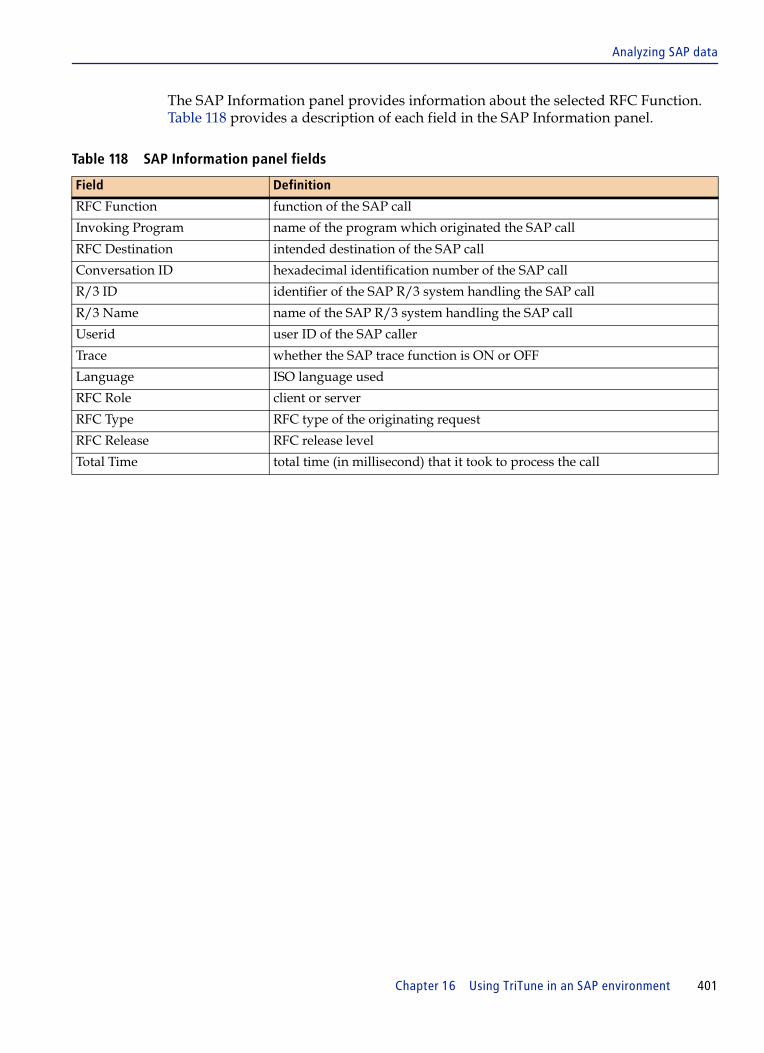
Analyzing SAP data
The SAP Information panel provides information about the selected RFC Function. Table 118 provides a description of each field in the SAP Information panel.
Table 118 SAP Information panel fields
Field Definition
RFC Function function of the SAP call
Invoking Program name of the program which originated the SAP call
RFC Destination intended destination of the SAP call
Conversation ID hexadecimal identification number of the SAP call
R/3 ID identifier of the SAP R/3 system handling the SAP call
R/3 Name name of the SAP R/3 system handling the SAP call
Userid user ID of the SAP caller
Trace whether the SAP trace function is ON or OFF
Language ISO language used
RFC Role client or server
RFC Type RFC type of the originating request
RFC Release RFC release level
Total Time total time (in millisecond) that it took to process the call
Chapter 16 Using TriTune in an SAP environment 401

Analyzing SAP data
402 TriTune User Guide

C h a p t e r 17
17 Using TriTune with other databasesThis chapter describes how to best use TriTune with the following databases that are distributed from companies other than IBM:
■ Adabas■ CA-Datacom■ Natural
This chapter discusses the following topics:
Using TriTune with Adabas . . . . . . . . . . . . . . . . . . . . . . . . . . . . . . . . . . . . . . . . . . . . . . . 404Using TriTune with CA-Datacom . . . . . . . . . . . . . . . . . . . . . . . . . . . . . . . . . . . . . . . . . . 407Using TriTune with Natural . . . . . . . . . . . . . . . . . . . . . . . . . . . . . . . . . . . . . . . . . . . . . . . 408
Chapter 17 Using TriTune with other databases 403
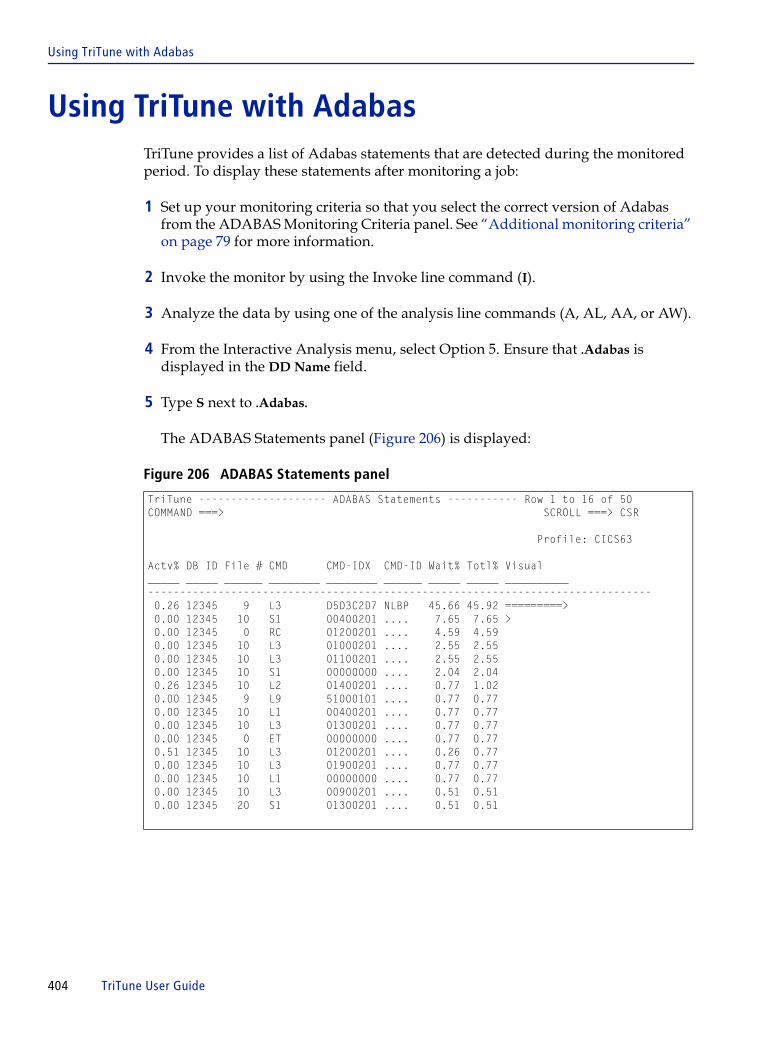
Using TriTune with Adabas
Using TriTune with AdabasTriTune provides a list of Adabas statements that are detected during the monitored period. To display these statements after monitoring a job:
1 Set up your monitoring criteria so that you select the correct version of Adabas from the ADABAS Monitoring Criteria panel. See “Additional monitoring criteria” on page 79 for more information.
2 Invoke the monitor by using the Invoke line command (I).
3 Analyze the data by using one of the analysis line commands (A, AL, AA, or AW).
4 From the Interactive Analysis menu, select Option 5. Ensure that .Adabas is displayed in the DD Name field.
5 Type S next to .Adabas.
The ADABAS Statements panel (Figure 206) is displayed:
Figure 206 ADABAS Statements panel
TriTune -------------------- ADABAS Statements ----------- Row 1 to 16 of 50 COMMAND ===> SCROLL ===> CSR Profile: CICS63 Actv% DB ID File # CMD CMD-IDX CMD-ID Wait% Totl% Visual _____ _____ ______ ________ ________ ______ _____ _____ __________ ------------------------------------------------------------------------------- 0.26 12345 9 L3 D5D3C2D7 NLBP 45.66 45.92 =========> 0.00 12345 10 S1 00400201 .... 7.65 7.65 > 0.00 12345 0 RC 01200201 .... 4.59 4.59 0.00 12345 10 L3 01000201 .... 2.55 2.55 0.00 12345 10 L3 01100201 .... 2.55 2.55 0.00 12345 10 S1 00000000 .... 2.04 2.04 0.26 12345 10 L2 01400201 .... 0.77 1.02 0.00 12345 9 L9 51000101 .... 0.77 0.77 0.00 12345 10 L1 00400201 .... 0.77 0.77 0.00 12345 10 L3 01300201 .... 0.77 0.77 0.00 12345 0 ET 00000000 .... 0.77 0.77 0.51 12345 10 L3 01200201 .... 0.26 0.77 0.00 12345 10 L3 01900201 .... 0.77 0.77 0.00 12345 10 L1 00000000 .... 0.77 0.77 0.00 12345 10 L3 00900201 .... 0.51 0.51 0.00 12345 20 S1 01300201 .... 0.51 0.51
404 TriTune User Guide

Using TriTune with Adabas
Table 119 describes the fields in the ADABAS Statements panel.
Table 119 Adabas Statements fields (part 1 of 2)
Field name Description
Actv% percentage of the monitored period that the processing of the Adabas statement used CPU
DB ID decimal representation of the Adabas database ID containing the file to be accessed
This number can be in the range of 1 to 65535.
File # decimal representation of the Adabas file number to be accessed
This number can be in the range of 1 to 5000.
CMD one of the Adabas commands used to access Adabas databases
This field displays the database access command. Possible values in this field, and the descriptions of these values, are as follows:
A1 - update records (hold option)BT - remove database updates for ET logic usersC1 - write Command ID, PLOG, RABN checkpoint, buffer flush optionC3 - write SYNX-03 checkpoint for exclusive control update users; option to store user dataC5 - write user data on SIBA/PLOGCL - end/ET session and update databaseE1 - delete record (hold option) or Refresh fileET - end and save current transactionHI - prevent record update by other usersL1 - read record of specified ISNL4 - read and hold, wait for held record/issue return code optionL2 - read records in physical orderL5 - read in physical order and hold, wait/issue return code optionL3 - read records in descriptor value orderL6 - read in descriptor value order with wait/issue return code optionL9 - read ISNs of specified descriptorLF - read characteristics of all fields in fileN1 - add new database record with Adabas-assigned ISNN2 - add new database record with user-assigned ISNOP - open user sessionRC - release one or more command IDs or a global format ID for the issuing userRE - read ET data for this user, another user, or all usersRI - release held record and ISNS1/S4 - return count and ISNs of records meeting the search criteriaS2 - return count of records and ISNs in user-specified orderS5 - return or save a list of coupled ISNs for the specified fileS8 - combine two ISN lists from the same file with AND, OR, or NOT operationS9 - sort ISN list in ascending ISN or descriptor-specified sequence
CMD-IDX same value as the CMD-ID field in hexadecimal format
Chapter 17 Using TriTune with other databases 405

Using TriTune with Adabas
CMD-ID identifies users, their transactions, and decoded formats for reuse by subsequent instructions
The command ID is either user-specified or system-generated. It can be either local or global to specify either internal or globally accessible decoded formats.
Wait% percentage of the monitored period that the program waited for Adabas data to be returned
Totl% sum of the Actv% and Wait% fields
This value represents the total percentage of the Adabas delay time used by this Adabas statement.
Visual graphical representation of the sum of the Actv% and Wait% categories for the Adabas statement
The Visual field provides a graphical representation of the data in the column that immediately precedes it. A graph’s color is determined by its value, as follows:
■ Green represents a value between 0 and 20.■ Yellow represents a value between 20 and 50.■ Red represents a value between 50 and 100.
The size of the graph is either relative or absolute, depending on the value (Y/N) selected for AutoScale in the Profile Parameters panel.
■ Relative scale
Graphs are sized relative to the highest value. The graph for the highest value extends the maximum length of the field, with all other graphs proportional to it.
For example, if the maximum value on a screen is 10, its graph extends the maximum length of the field. If the next highest value is 5, its graph extends half of the maximum length of the field.
■ Absolute scale
The graph displays an absolute representation of the value. For example, if the maximum value on the screen is 10, the graph extends 1/10 the length of the field.
Table 119 Adabas Statements fields (part 2 of 2)
Field name Description
406 TriTune User Guide

Using TriTune with CA-Datacom
Using TriTune with CA-DatacomTriTune provides a list of CA-Datacom statements that are detected during the monitored period. To display these statements after monitoring a job:
1 Set up your monitoring criteria so that you select the correct version of CA-Datacom from the CA-DATACOM Monitoring Criteria panel. See Chapter 3, “Setting up a monitor definition” for more information.
2 Invoke the monitor by using the Invoke line command (I).
3 Analyze the data by using one of the analysis line commands (A, AL, AA, or AW).
4 From the Interactive Analysis menu, select Option 5. Ensure that .DCOM is displayed in the DD Name field.
5 Type S next to .DCOM.
The DATACOM Statements panel (Figure 207) is displayed:
Figure 207 DATACOM Statements panell
TriTune --------------------- DATACOM Statements ------------ ROW 1 to 1 of 1 COMMAND ===> Scroll==> CSR Profile: TUNIVP1 File Key DBID Table Name Command Actv% Wait% Totl% Visual ____ _____ ______ _______ _____ _____ _____ __________ ------------------------------------------------------------------------------0193 111 KEY00 REDNX 0.00 22.65 22.65 ========>
Chapter 17 Using TriTune with other databases 407

Using TriTune with Natural
Table 120 describes the fields in the CA-DATACOM Statements panel.
Using TriTune with NaturalTriTune allows you to select how to display the information collected when a Natural program is monitored. You can view either the Natural executor programs (by which Natural supervises the execution of Natural 4GL routines), or the Natural routines themselves.
1 Set up your monitoring criteria so that you select the correct version of Natural from the Natural Monitoring Criteria panel. See Chapter 3, “Setting up a monitor definition” for more information.
2 Invoke the monitor by using the Invoke line command (I).
3 Analyze the data by using one of the analysis line commands (A, AL, AA, or AW).
4 From the Interactive Analysis menu, select Option 2 to display the CodeView panel (Figure 208 on page 409).
5 Issue the MODE 4GL primary command to display the activity that is associated with Natural routines.
Table 120 CA-DATACOM Statements fields
Field name Description
DBID three- or four-digit numeric identifier of the CA-Datacom database
File Table three-character name of the CA-Datacom table, identifying the logical table being accessed
Key Name five-character alphanumeric name of the search key being used to locate a record in the CA-Datacom database
Command five-character CA-Datacom command used to access Datacom databases
TriTune detected the commands that are displayed in this field during the monitored period.
Actv% percentage of the monitored period that the processing of the CA-Datacom statement used CPU
Wait% percentage of the monitored period that the program waited for CA-Datacom data to be returned
Totl% summation of the Actv% and Wait% fields
Visual graphical representation of the Totl% field
408 TriTune User Guide

Using TriTune with Natural
Figure 208 CodeView panel with Natural
CodeView normally displays the activity of the Modules and CSECTs that are supervising the running of the Natural program.
6 On the COMMAND line, type MO 4GL.
7 Press Enter.
The Natural Programs panel is displayed. This panel displays the activity of Natural routines that were executing at the time that the monitor was run. These routines exist in ADABAS databases.
The Language, Library, and Routine Name fields are displayed, along with a description of the routine, if available. This information is important when multiple copies of a routine are maintained.
8 Type H or NH.
9 Press Enter.
The 4GL Histogram panel (Figure 209 on page 410) shows the activity of each statement in the routine:
TriTune -------------------------- CodeView ----------------- Row 1 to 8 of 81COMMAND ===> SCROLL ===> CSR Primary commands: MOde Pseudo/Module/Csect/4GL, Profile: NATURAL PSEudo, REGister, ADDHelp Options: NORMAL Mode: 4GL Line commands: A - Associate I - Info H - Histogram NH - Normalized Histogram LC Language Library Routine Actv% Wait% Totl% Visual ________ ________ ________ _____ _____ _____ __________ >-----------------------------------------------------------------------------__ NATURAL BMCAPPS BMCFETCH 2.83 18.26 21.08 ========> __ NATURAL BMCAPPS ACCEPX01 0.24 3.65 3.89 > __ NATURAL BMCAPPS MAINMENU 0.12 1.77 1.88 __ NATURAL SYSTEM LOGON 0.12 1.41 1.53 __ NATURAL BMCAPPS ETREX1S 0.00 1.06 1.06 __ NATURAL BMCAPPS LOGON 0.00 0.94 0.94 __ NATURAL BMCAPPS ACCEPX02 0.12 0.82 0.94 __ NATURAL BMCAPPS ATBREX03 0.00 0.94 0.94
NOTE The 4GL Histogram panel can also be displayed from the DelayView panel.
Chapter 17 Using TriTune with other databases 409

Using TriTune with Natural
Figure 209 4GL Histogram panel
Table 121 describes the fields in the 4GL Histogram panel.
TriTune ---------------------- 4GL Histogram ----------------- Row 1 to 4 of 4COMMAND ===> SCROLL ===> CSR Language --- NATURAL Profile: NATURAL Library --- BMCAPPS Normalized: NO Routine --- BMCFETCH Stmt Actv% Visual _____ _____ __________ ------------------------------------------------------------------------------- 0 0.00 60 0.12 150 2.59 =========> 170 0.12 ********************************* End of Table ********************************
Table 121 4GL Histogram fields
Field name Description
Library 1-8 alphanumeric name of the Natural library from which routine was executed
This library resides in the Adabas database on the Natural System or User file.
Routine name of the 4GL routine, obtained from the 4GL language processor exit
Stmt statement number of the currently executed statement of the 4GL routine
This statement is obtained from the 4GL language processor exit.
Actv% percentage of the monitored period that TriTune detected a 4GL statement in control
The statement may or may not have been consuming CPU at the time.
Visual graphical representation of the Pct field.
410 TriTune User Guide

A B C D E F G H I J K L M N O P Q R S T U V W X Y Z
GlossaryThis glossary defines AQM Solutions terminology. Other companies in the computer industry, such as IBM, publish dictionaries and glossaries that may be used in conjunction with this glossary.
Since this glossary pertains to all TriTune-related products, some of the terms defined here might not appear in this book but might appear in other books documenting those products.
Aaddress space
An executing batch job, system task, or TSO user. Same as job.
application tuningThe process of analyzing and adjusting the performance of an application with the goal of maximizing efficiency and effectiveness.
Bbroadcast request
A TriTune monitor request that is sent to any system in a sysplex.
CCodeView
Interactive analysis option 3. This panel displays the execution and wait time of each module that is used by the target program.
connect timeThe number of milliseconds during a monitored period that represent the end-to-end time needed for transferring data to and from external media and memory. Connect time is displayed on the DataView and Data Set Details panels. Connect time might exceed the monitored period because of data overlap caused when multiple blocks of data are moved to and from memory.
contentionA situation that occurs when there are more requests for a service than there are servers available. For single servers such as drives, control units, and paths, contention occurs when two or more requests for service arrive simultaneously.
Glossary 411

A B C D E F G H I J K L M N O P Q R S T U V W X Y Z
content-sensitive helpThe online Help information for specific CSECTs, pseudo groups, and major and minor delay categories.
CSECTAn individually linkable component of a program, which may be included in one or more load modules.
CSECT AssociationsTriTune allows a functional description to be associated with individual CSECTs that will be shown on various analysis panels. The user can build a database of functions of CSECTs, which can substantially simplify the later understanding of the presented results.
Ddata set fragmentation
Under z/OS, data sets are allocated in the form of extents, which represent allocation areas on the physical device. A data set might originally be allocated to occupy from one to five extents and might subsequently grow into up to 16 of these allocation groups. The more scattering that occurs, the more a data set is considered to be fragmented. Because data retrieval time increases with fragmentation, this characteristic is considered undesirable.
DataViewInteractive analysis option 5. This panel displays data sets, databases (IMS, Adabas, Natural, CA-IDEAL and CA-DATACOM), and DB2 statements that caused activity during the monitored period.
DelayViewInteractive analysis option 2. This panel displays the target program’s performance in terms of the activities that made up the program execution time.
delaysTriTune considers all samples that do not indicate the actual code of the target application program to be processing as some form of delay. This term should not be confused with actual waits and is only a functional indicator from the perspective of the operating system as to what operations are performed at the time of the sample. Delays can cause the task to be in a wait state, executing in RB (application program) or SVRB (operating system) mode.
disconnect timeThe time in an I/O cycle that a device is not actually transferring or searching for data.
Eexternal data set
The monitor data created by another TriTune user.
412 TriTune User Guide
A B C D E F G H I J K L M N O P Q R S T U V W X Y Z
Ffast path
A predefined link between one screen and another. Executed by placing the cursor on a single value in a field and pressing Enter. The resulting screen displays more detailed information about the selected value.
field(1) A column of data on a TriTune screen. (2) A group of character positions within a screen that are used to enter or display specific information.
field HelpThe online information that describes the purpose or contents of a field on a panel. Displayed by placing the cursor anywhere in the field and pressing PF1 (HELP).
filterThe selection criteria established for a column of data. Data that does not meet the selection criteria is not displayed. A filter consists of a character string.
filtered analysisWhen requesting TriTune to analyze the gathered data, the user may indicate that the output data should be filtered before making it available. This process temporarily discards all data pertaining to involuntary waits, which, in most cases, are not under the control of the monitored program but quite often represent a considerable amount of data that slow down the interactive analysis. This method is preferred to the basic (unfiltered) analysis.
fixed fieldThe fields that are located on the far left side of a TriTune screen that you display by scrolling right with PF11 (RIGHT). The presence of fixed fields is indicated by an arrow on the left side of a screen, just below the column headers.
FTSTARTThe REXX EXEC that is used to invoke TriTune.
histogramTriTune uses the term histogram to refer to a process where the activity of an individual load module or CSECT is statistically broken up into segments of equal size and their activity comparably demonstrated.
IInstallation Verification Procedure (IVP)
A procedure that is performed after installation that determines if TriTune is functioning properly.
Glossary 413
A B C D E F G H I J K L M N O P Q R S T U V W X Y Z
interactive analysisThe analysis of data that is processed from a user’s terminal. This form of analysis is preferable because it allows selective presentation of output and reduces the amount of user data. Several report display options are provided.
invoking a monitorThe process of starting the observation and subsequent sampling of a target application as defined by the monitor definition.
involuntary waitTriTune considers all nondispatch states that are not directly caused by the target address to be involuntary, including such states as the address spaces being swapped out or not being dispatched due to higher priority work already being in the system.
Jjob
A batch job, Started Task, or TSO session executing in an z/OS address space. Same as address space.
Lload module
Almost all code executed under z/OS is stored and fetched by the operating system in the form of load modules. Load modules comprise individual CSECTs and information about how these CSECTs are to be loaded into memory and resolved.
local requestA TriTune monitor request that is only sent to the local system of the TSO user.
Mmodule load time
The amount of time the operating system spends retrieving and resolving the instruction image of a load module stored on DASD.
ModViewInteractive analysis option 7. This panel displays the activity of each load module for the target application.
monitor administrationThe management of monitor information, including monitor definitions, invocations, analysis, history, and status.
monitor data setThe partitioned data set (PDS) that contains the results of a TriTune monitoring session.
414 TriTune User Guide
A B C D E F G H I J K L M N O P Q R S T U V W X Y Z
monitor definitionThe specification a user provides to TriTune as to what to monitor and in which manner. A user may maintain any number of monitor definitions at any given point in time.
monitor historyThe cumulative collection of data sets for a monitor definition.
monitor requestA monitor definition that has been activated by using the Invoke line command (I) in the Monitor Request Overview panel.
multitaskingThe simultaneous or quasi-simultaneous processing of several units of work (tasks) within the same address space. Each of these tasks operates on independent processes, which might or might not preempt each other.
OObservation
The beginning of the sample process. An observation occurs at regular intervals based on monitoring criteria that is defined in the monitor profile. It represents an initial assessment of whether a sample can be taken and if it can, TriTine sampling logic is executed.
Open Application Program Interface (Open API)The method TriTune uses to define and invoke monitors from outside of the TriTune TSO Client (through TSO commands, batch jobs, or from within a program).
OverviewInteractive analysis option 0. This panel displays information about the monitoring process, as well as key global statistics about the monitored application.
Ppending time
The time between the successful completion of an SSCH and before the execution of the first channel command. Pending time and IOS queue is the total queue time (XA only).
PoolViewInteractive analysis option 8. Displays statistics about VSAM/LSR and VSAM/GSR buffer pool usage.
Primary Option MenuThe panel that is displayed when TriTune is first invoked. Provides access to all TriTune basic features.
Glossary 415

A B C D E F G H I J K L M N O P Q R S T U V W X Y Z
product customizationAn online facility for customizing the installation of products. Product customization provides an ISPF panel interface that both presents customization steps in sequence and provides current status information about the progress of installation.
profile nameThe name that is specified for a monitor definition. Identifies monitor data sets and analysis panels.
profile parametersA set of parameters that specify default conditions for each TriTune user.
pseudo groupsA feature that enables you to assign unique identifiers to related program modules that cause TriTune to treat them as a single group during a monitor session. Modules are associated with pseudo groups by using Option 4, Pseudo, on the Primary Option Menu.
Rregistration
The process of providing TriTune with the location of compiled program listings. Used to relate program activity to actual high-level language statements during analysis.
Ssamples
The collective information gathered by all snapshots during one TriTune recording interval. This information consists of snapshots for all active and monitored TCBs in the target address space.
STRHELPThe data set that contains TriTune online Help and content-sensitive help information.
screenA collection of rows and columns of data that is displayed through the TriTune online facility.
screen HelpThe online information panels that describe the purpose of a screen. Display screen Help by placing the cursor anywhere on the screen, except on a field, and pressing PF1 (HELP).
snapshotThe capture of the state of one task in the target address space with any related information. This state includes, but is not limited to, the PSW, the wait state bit, the module active at the time, and some of the information pointed to by the current and stored registers.
status(1) The percentage of completion of a monitor request. (2) The status (Active, Inactive, Waiting) of a monitor request in the TriTune Server Space.
416 TriTune User Guide
A B C D E F G H I J K L M N O P Q R S T U V W X Y Z
Ttarget request
A TriTune monitor request that is sent to a specified system (or systems) in a sysplex.
tasklibA DD statement other than STEPLIB or JOBLIB from which a program explicitly initiates the fetch of load modules. The name of the DD statement is at the discretion of the program and varies widely. Examples are DFHRPL for CICS and ISPLLIB for ISPF.
TaskViewInteractive analysis option 1. This panel displays information about the performance of each z/OS task in the monitored address space.
TimeViewInteractive analysis option 4. This panel displays program activity in time sequence. Each row of information represents a single sample taken during the monitored period.
TranViewInteractive analysis option 6.This panel shows IMS or CICS activity in terms of individual transactions.
TriTune reportsTriTune generates printable reports from most of its panels. These reports generally represent the complete information normally obtainable by scrolling through the current display but may add additional secondary information. These reports are sent to a DD statement and are class-defined in the user’s profile.
TriTune Server SpaceThe server for all monitor requests issued by TriTune users on a system.
TriTune TSO ClientThe online TriTune interface, used to define, invoke, and analyze monitors.
TRITUNESSThe procedure for starting the TriTune Server Space.
TRLINKThe AQM Solutions load library.
TRSAMPThe TriTune data set that contains sample members that are used for the installation and operation of TriTune.
TSO ClientSee TriTune TSO Client.
Glossary 417

A B C D E F G H I J K L M N O P Q R S T U V W X Y Z
TUNAVSAMThe procedure that is used to create the TriTune Global Tables data set.
TUNBATCHThe procedure that is used by TriTune for generating batch reports.
TUNCALLThe program that is used to invoke TriTune monitors from outside of the TSO Client.
TUNCOB01The COBOL program provided with TriTune that is used to verify operation and generate sample monitor data.
TUNSDEFSUTRPARM member that is used to define system default parameters.
TUNSSP00UTRPARM member that is used to define TriTune operational parameters and for password authorization.
TUNUDEFSUTRPARM member that is used to define user default parameters.
UUTRPARM
A data set that is created during product customization into which samples are copied from the AQM Solutions TRPARM or PARMLIB data sets. Users can then modify their own copies without corrupting the original models.
VVOLSER
The volume serial number.
volumeA named collection of data sets dealt with as an entity by the I/O supervisor. For tape subsystems, it is a cartridge. For DASD, it is a drive, a logical drive (dual-density), or an actuator (3390 class).
418 TriTune User Guide

A B C D E F G H I J K L M N O P Q R S T U V W X Y Z
Index
Symbols.IOnnnn, pseudo DDNAME 157
Aactive jobs
analyzing results 111panel 106Primary Menu option 41, 190
Adabasmonitor criteria 83using TriTune with 404
ADB2EXTN parameter member 306ADD
CSECT Association 201data set command 194profile command 72program listing 225pseudo group 203
additional featuresadding Help 205administrative functions 198–201defining pseudo groups 202–205registering source program listings 218–230using global monitors 189–191
address space display 132addressing mode, determining 177administration, Primary Menu option 42All Jobs, specifying criteria for 78AMODE, determining addressing mode 177analysis options 116Analyze+
accessing DB2 Explain data 304analyzing SQL statements 307benefits 304customization requirements 306installation requirements 306line command 291, 303
analyzingCICS data 327, 399DB2 data 284
analyzing (continued)demonstration 113displaying results 101external data sets 192global monitors 191IMS batch performance information 350IMS data 343monitor data 29WebSphere MQ data 388
application tuning, description 26Assembler, compiler options 219associations option
assign CSECT functional description 200description 199
asynchronous pages read 289, 301autonavigation 49
Bbatch reports
automatically generating 252Batch line command 252fields 254generating 251, 252setting up definition 253submitting a JCL job 252
CCA-Datacom
monitor criteria 85using TriTune with 407
CA-Idealmonitoring criteria 86
Callerid 153CICS
analyzing data 327, 399delay types 333DL/I resources 338file control 335
Index 419

A B C D E F G H I J K L M N O P Q R S T U V W X Y Z
CICS (continued)journal control 336monitoring criteria 81multiregion option 334program control 337shared database processing (IMS) 355storage control 335system active 334temporary storage 337terminal control 338terminal IDs 81transaction access 355transaction classes 326transaction response times 326transient data 334TranView 327, 390user IDs 81using TranView 328using TriTune with 325using with PoolView 329
client, TriTune TSO 26COBOL, compiler options 219CodeView
description 32using 146
column totals, displaying 51compiler options 218content Help option, writing your own 209content-sensitive Help
accessing 42adding 205description 34editing 211panel 206Primary Menu option 199updating 210writing 211
copying, monitor definition 88creating a monitor schedule 93creating a multijob monitor 90CSECT
activity 146associations 200defining functions 33, 200functional description 199grouping related 199
CUST command 56customer support 3customizing TriTune screens 56
420 TriTune User Guide
Ddata entry databases (DEDBs) 355data set
adding to list 194analyzing external 192
Data Set Details panel 141database
DEDB 355MSDB 355other than IBM 403
DataViewdescription 32panel 156
DB2analyzing data 284DataView 293DataView panel 284DB2 Statements panel 286DECLARE statements 315Explain 291, 303, 304, 308Explain line command 285, 291, 303, 304Intercept facility 316long names 313SQL problems 311SQL statements 292, 309statement details 313statements panel 285using TriTune with 283view description 32
DD name, application table 168DDIO, listing manager 222default reports 254Delay Locations, panel 138delayed resources 140Delayed Resources panel 140delays
categories and explanations 274CICS subsystem 275DASD management 275display addresses 138file management 274locations 138looking at 136other reasons 275program management functions 275types and reasons 274
DelayViewoption 32panel 136
Delete w/datasets command 89Details line command 140

A B C D E F G H I J K L M N O P Q R S T U V W X Y Z
Display Server Space Requests 100
display/screen commandscolumn totals 51CUST 56EXPORT 60NOSORT 48REPORT 62scrolling indicator 46SORT 48
displayingCallerid 153column totals 51delay addresses 138delay details 138delay distribution 145delayed resources 140
dynamic prefetch requests 290, 302
Eexclude fields, on screens 58Explain function 291, 303, 304, 308Explain line command 285, 291, 303, 304Export function 60external data sets
analyzing 192description 33panel 192Primary Menu option 41
Ffast path, region in IMS 355fields
fixed 57getting Help for 44reorder in screen customization 58
file delays 274filters
example of use 54screen customization 58setting 53wildcard characters 53
first-time users, online tutorial 42fixed fields 57Fortran, compiler options 219
GGETPAGE requests 288, 300grouping monitor requests 90grouping related modules 199, 202
HHelp
accessing 42content-sensitive 34for fields 44for messages 44for screens 42menu 45
histogram panel 149History line command 101
IIBM C/C++, compiler options 219IMS
analyzing data 343analyzing transactions 340batch message program 354batch processing 354environment 339fast path program 355message processing program 355PoolView panel 179, 350region types 354shared database processing (CICS) 355Statements panel 347terminal IDs 82TranNameView panel 341transaction codes 82user IDs 82view description 32
index GETPAGE requests 288, 300interactive analysis
description of options 31OverView function 123panel 116table of options 118
invoking a monitordescription 29for an active job 106from outside of TSO Client 231
Index 421

A B C D E F G H I J K L M N O P Q R S T U V W X Y Z
ISPFPF keys 47starting TriTune from 38
JJCL for submitting batch reports 252JVM
analyzing data 358delay locations 366detail reports 363different modes 360environment 357JVM Applications panel 359Methods panel 363Thread TCBs panel 364view description 33
Kkeys ISPF command 47
Llearning TriTune, online tutorial 42Librarian listing manager 222link suggestions 178list prefetch requests 289, 301listing manager
DDIO 222DDIO requirements 220Librarian 222Panvalet 222PDS/PDSE 222
LOB GETPAGE requests 290, 302locating strings 48long names 313
Mmain storage databases (MSDBs) 355Member List panel 226menus
Display Server Space Requests 100help 45Messages panel 44messages screen help 45Primary Option 40, 43
422 TriTune User Guide
messagesgetting Help for 44menu 44panel 45Primary Menu option 42
Module field on CodeView panel 146ModView
description 32panel 174
monitorAdabas criteria 83CA-Datacom criteria 85CICS criteria 81determining total time 77displaying history 101displaying status 42grouping requests 90IMS criteria 82invoking (description) 29invoking from outside of TSO Client 231Natural criteria 84number of samples 77Primary Menu option 41, 190request status 100scheduling 93setting up definition 65specifying criteria 78stopping 101WebSphere Application Server criteria 87
monitor definitioncommands 69, 79copying 88creating 68deleting 89description 28, 67displaying history 101editing 88fields 70panel 68setting up 65
Monitor History panel 101, 195Monitor Overview
fields 126panel 123
monitoring criteriadetermining number of samples/total time 77fields 73for CICS 81IMS 82
A B C D E F G H I J K L M N O P Q R S T U V W X Y Z
NNatural monitor criteria 84navigating TriTune 40new users, online tutorial 42NOSORT command 48
Oobservations 66online documentation 23online tutorial 42Open TriTune API 231option field 40OverView
description 31fields 126function 123
Ppanels
Active Jobs 106Add Monitor Data Set 194Callerid 143Content-sensitive Help 206Data Details 141Data Set Details 160, 162, 165DataView 156DB2 Statements 285Delay Distribution 145, 178Delayed Resources 140DelayView 136exporting 60External Data Set List 192Histogram 149, 150IMS Statements 347Interactive Analysis 116, 117link suggestions 178Member List 226Messages 44, 45ModView 174Monitor Definition 68, 98, 115Monitor History 101, 102, 195Monitor Overview 123Monitoring Criteria 73
panels (continued)PoolView 179PoolView(IMS) 179, 350Report Definition 253Screen Customization 57SQL Statement 292TaskView 132, 134, 135, 171, 172TimeView 154USS Process Information 185, 187USS Threads 184USSView 181
Panvalet listing manager 222PDS/PDSE listing manager 222PF keys 47PL/I compiler options 219PoolView
description 32for an IMS environment 179, 350panel 179using with CICS 329
Primary Option Menutable of options 41using 189
product support 3Profile Parameters - Primary Menu option 41, 190profile specifications 41, 190program listings, registering 33, 218Pseudo group
defining 202description 34Primary Menu option 199
Rregistering program listings
compiler options 218description 33Primary Menu option 41, 191, 199
related documentation 23REPORT primary command 62reports
batch 253defaults 254Definition panel 253generating 251
RESET primary command 58residence mode, determining 177RMODE, determining residence mode 177
Index 423
A B C D E F G H I J K L M N O P Q R S T U V W X Y Z
Ssamples
determining number of 77how they are gathered 66on monitoring criteria 77view in time sequence 154
sampling rate 77sampling rules 66SAP
analyzing data 399environment 399SAP Activity screen 399SAP Information panel 401
SAS C, compiler options 219scheduling monitor requests 93screen commands
CUST 56EXPORT 60REPORT 62RESET 58scrolling indicator 46SORT 48
screen Help, accessing 42sequential prefetch requests 289, 301Server Space, displaying requests 100SETPARM parameters 64SORT command 48source programs, registering 218specifying the detail level 140SQL
in CICS 327, 399in DB2 284Select line command 292Statement panel 292
startinga monitor 97TriTune from TSO/ISPF 38
STAtus primary command 100Stmt 228Stop line command 101SUBmit command 252subtasks 79support, customer 3synchronous read I/Os 288, 300
424 TriTune User Guide
Ttables data set, migrating from previous release 39Tag line command 133, 329tags, for content-sensitive Help 212TaskView
description 31panel 132Tag/Untag line commands 133, 329
TCBs 79technical support 3terminal IDs
CICS 81IMS 82
TimeViewdescription 32panel 154using 154
totals, displaying column 51TranView
description 32, 169using 327using with CICS 328
TriTuneadditional features 33basic tasks 28batch reports 251CICS environment 325DB2 environment 283description of interface 26environment 37IMS environment 339introduction 25invoke from within program 247JVM environment 357moving around in 40Open TriTune API 231SAP environment 399starting from a TSO session 38TSO Client 26tuning an application 273using interface 37using with Adabas 404using with CA-Datacom 407using with non-IBM database 403WebSphere Application Server environment 371WebSphere MQ environment 387

A B C D E F G H I J K L M N O P Q R S T U V W X Y Z
TSOstarting TriTune from 38TriTune Client 26
TUNCALLfunctions 232global monitors 233invoke from batch job 246invoke monitor 245keywords 236monitor cancel 244monitor status 245output to file 246program 232return and reason codes 247syntax 233using 232verbs 236
tutorialdescription 27Primary Menu option 42
UUntag line command 133, 329UserID
for CICS 81for IMS 82
USSViewdescription 32monitor data set 181panel 181
Vviewing samples in time sequence 154VSAM Shared Pool panel 350
WWAS view description 33WebSphere Application Server
analyzing transactions 377environment 371monitor criteria 87
WebSphere MQanalyzing data 388CodeView Detail panel 390environment 387Queue Activity panel 391Queue Information panel 393Queue Manager Activity panel 389Queue Manager Information panel 389Queue manager panel 389
wildcard character% 53? 53with Locate command 48
writing online Help 209
Index 425

A B C D E F G H I J K L M N O P Q R S T U V W X Y Z
426 TriTune User Guide

Notes

*R000011E **R000011E **R000011E **R000011E *
*R000011E *