Construction of Dynamical Model Equations for Nonautonomous Systems from Time Series (Peculiarities...
29
Construction of Dynamical Model Equations for Nonautonomous Systems from Time Series (Peculiarities and Special Techniques) Boris Bezruchko, 1,2 Dmitry Smirnov, 2 Taras Dikanev, 1 and Ilya Sysoev 1 1 Department of Nonlinear Processes, Saratov State University, 83, Astrakhanskaya Street, Saratov, 410026, Russia 2 Saratov Department, Institute of RadioEngineering and Electronics of Russian Academy of Sciences, 38, Zelyonaya Street, Saratov, 410019, Russia E-mail addresses: [email protected]; [email protected]; [email protected]; [email protected] Abstract Problems, arising during global reconstruction of dynamical models from time series, and prospects of the further development of empiric modeling methods are discussed. We present a specialized approach aimed at modeling the systems being under arbitrary regular driving. Original “technical tricks” are also described: a technique for dynamical variables selection and a model structure optimization routine. All the approaches are illustrated with examples of reconstructing etalon equations and modeling real-world (radiophysical) objects. 1. Introduction 1.1. To obtain a mathematical model from “the first principles” in practice is often impossible. In more typical situations, numerous vague phenomena of different physical nature affect the process under investigation or the first principles for the field of interest, similar to Newton’s laws in mechanics, are not yet discovered. In such a case, experimental data become the main source of information about an investigated system (an object of modeling) and the problem of an empiric model construction arises. Since observations of real-world processes are presented, as a rule, in the form of time series – sequences of observable values measured at discrete time instants, the problem is called “modeling from time series”. It is actual in physics, meteorology, seismography, medicine and physiology, etc.
Transcript of Construction of Dynamical Model Equations for Nonautonomous Systems from Time Series (Peculiarities...

Construction of Dynamical Model Equations for
Nonautonomous Systems from Time Series
(Peculiarities and Special Techniques)
Boris Bezruchko,1,2
Dmitry Smirnov,2
Taras Dikanev,1 and Ilya Sysoev
1
1Department of Nonlinear Processes, Saratov State University, 83, Astrakhanskaya
Street, Saratov, 410026, Russia2Saratov Department, Institute of RadioEngineering and Electronics of Russian Academy
of Sciences, 38, Zelyonaya Street, Saratov, 410019, Russia
E-mail addresses: [email protected]; [email protected]; [email protected];
Abstract
Problems, arising during global reconstruction of dynamical models from time series, and
prospects of the further development of empiric modeling methods are discussed. We
present a specialized approach aimed at modeling the systems being under arbitrary
regular driving. Original “technical tricks” are also described: a technique for dynamical
variables selection and a model structure optimization routine. All the approaches are
illustrated with examples of reconstructing etalon equations and modeling real-world
(radiophysical) objects.
1. Introduction
1.1. To obtain a mathematical model from “the first principles” in practice is often
impossible. In more typical situations, numerous vague phenomena of different physical
nature affect the process under investigation or the first principles for the field of interest,
similar to Newton’s laws in mechanics, are not yet discovered. In such a case, experimental
data become the main source of information about an investigated system (an object of
modeling) and the problem of an empiric model construction arises. Since observations of
real-world processes are presented, as a rule, in the form of time series – sequences of
observable values measured at discrete time instants, the problem is called “modeling from
time series”. It is actual in physics, meteorology, seismography, medicine and physiology,
etc.

Boris Bezruchko, Dmitry Smirnov, Taras Dikanev, and Ilya Sysoev216
216
Modeling of complicated (irregular) behavior is addressed here, as well as in other
contributions to this book. Earlier, this problem was treated from a statistical point of view [1]
since complicated behavior was associated only with enormous numbers of degrees of
freedom. In 1960-70s, it became clear that complicated behavior can be exhibited even by
simple (low-dimensional) nonlinear dynamical systems [2,3]. It gave rise to appearance of
methods for constructing empiric deterministic low-dimensional models in the form of
difference equations (maps) [4-6] and ordinary differential equations (ODEs) [4,7]1.
1.2. In general, the problem of empiric modeling can be formulated as follows.
There is a system of our interest (we will call it just “an object”).
One picks out some quantities k,...,1 , which characterize the processes occurring
in the system and which can be measured experimentally (they are called
observables).
An obtained time series of these quantities (i.e. the finite sequence 1
( )N
i it ,
where )(),...,(),()( 21 ikiii tttt , titi , t is a sampling interval) is a
main source of quantitative information about the system under investigation.
It is known that the object possesses a set of properties MPP ,...,1 that are relevant
for our consideration. E.g. power spectrum of its time realizations exhibits a certain
structure, their correlation dimension estimates take on certain typical values, its
dynamics undergoes certain bifurcations under certain conditions.
It is necessary to construct a dynamical model capable of reproducing as many of the
properties MPP ,...,1 as possible using the time series. According to quite a general
approach, a model takes the form2
djttht
tdtd
jjj ...,,1),())(x()(
),c),(x(Fx (1)
where 1( ,..., ) D
Dx x Rx is a state vector of the model, F is a smooth vector field,
PRc is a parameter vector, )(tj are random “measurement errors”, jh are smooth
functions defining relations between dynamical variables and observables (they are often
called “measurement functions”)3. One should find the values of parameters c, for which a
1 Methods for construction of infinite-dimensional nonlinear models (delay differential equations [8,9] and
partial differential equations [10]) are also being actively developed. But they are beyond of our scope here.2 Even though the formulation (1) is given for ODEs, the further treatment would be similar for other model
types as well.3 Measurement functions are important components of the model. They may also involve some parameters.
In the simplest case, which is yet important and widely spread in practice, observables are suggested to
coincide with dynamical variables (that is accurate to j ), i.e. ( ( )) ( )j jh t x tx . Throughout this
paper, we often consider scalar time series and such a simple relation 1( ) ( ) ( )t x t t .

Construction of Dynamical Model Equations for Nonautonomous Systems … 217
217
model (1) more or less accurately reproduces the time series and possesses at least some of
the properties 1,..., MP P .
If the function F in (1) is expressed analytically in terms of elementary functions (in a
closed form) and the expression holds in the entire phase space, then the model (1) is called
global. Further we consider only global models.
1.3. The success of modeling depends on several factors. First of all, it is important to
select a model structure, which is adequate to the object, that involves:
the number D of dynamical variables kx (as a rule, one has to use more variables
than the number of observables d),
the forms of the measurement functions jh , which describe supposed relations
between dynamical variables kx and observables j ,
and the form of the function F.
In general, not all of the quantities, which enter a model as dynamical variables, can be
measured directly or even computed from the observable values. Thus, if dD then at
least dD of the necessary variables are not observed. Unobserved variables are often
called hidden. During modeling, time series of all model variables (including hidden ones)
need to be reconstructed somehow from the available data.
The choice of either way of hidden variables reconstruction is a particular case of the
important problem of model dynamical variables selection. If there are too many observables
then one should specify a subset of them to be used as model variables. If the observables are
not sufficient for model construction or they cannot be used directly, then different
combination of available data are employed. Very popular methods are sequential derivatives
and time delays (see, e.g., [11] and [7], respectively) both of which rest upon the celebrated
Takens’ results and their generalizations [12]. However, different ways of obtaining hidden
variables, which are based on a priori information about the system under investigation or
some peculiarities of its dynamics [13], may prove to be more appropriate for modeling.
Mixed situations, when one selects subset of observables and reconstructs hidden variables
from their time series, are also possible.
We note that the selection of variables may affect the form of model equations. Thus,
under the use of sequential derivatives [11,14-17] for modeling from a scalar time series
( )it , a model takes the form
),,...,,(
...,
,
,
21
32
21
cDD xxxFdtdx
xdtdx
xdtdx
(2)

Boris Bezruchko, Dmitry Smirnov, Taras Dikanev, and Ilya Sysoev218
218
where the observable is supposed to be one of the model variables (possibly, contaminated
with measurements errors) )()()( 1 iii ttxt . Notice that only a single scalar-valued
function F enters Eqs. (2) as opposed to the general equations (1) involving a vector-valued
function F. After the form of F, or F, is chosen from either considerations, i.e. the model
structure is completely specified, it remains only to estimate parameters c from a time series.
A least-squares method is often exploited for this purpose 4, e.g., one minimizes the quantity
0 22
10
1( ) ( ),
N
D i i
i
dx t dt F tN
x c to estimate parameters of the model (2). 5
1.4. Depending on considerations determining model structure selection, one can
distinguish between several typical situations arising during modeling from time series.
Below, they are arranged in the order of decreasing complexity.
1) There is no a priori information. This situation is often referred to as the black box
problem. Here, the process of modeling may be called, indeed, the reconstruction of
equations from an observable time series. The structure of equations should be selected by
guess or in a universal form. An example of a universal (in a sense, standard) model structure
is Eqs. (2) with a polynomial on the right-hand side
1 2
1 2
1 2 , ,...,
, ,..., 0 1
( , ,..., ) ,j
D
D
K Dl
D l l l j
l l l j
F x x x c x1
.D
j
j
l K (3)
From a theoretical point of view, Eqs. (2) and (3) must serve well for approximation of any
system (1). But many researchers, relying on experience of their practical applications,
believe that polynomials are not appropriate for construction of high-dimensional models.
More promising methods exploit ideas of strong approximation, in particular, neural networks
and radial basis functions [19-23].
2) The structure of equations is known, to a significant extent, from physical
considerations. Only some nonlinear functions involved in a model remain unclear. Here, the
function F has not any longer to give a universal-form approximation of a dependence in the
D-dimensional space as in the black box situation. It may now involve just a few simpler
standard functions, e.g., univariate polynomials. Therefore, the modeling problem is
simplified considerably provided that the model structure is adequate to the object under
investigation. This situation may be called reconstruction of nonlinear characteristics.6
3) The complete structure of model equations is written down relying on physical
considerations. Only parameters values are unknown. This case seems the most simple (again,
provided that the model structure is adequate to the object). The modeling problem reduces
4 Sometimes, a general maximum likelihood principle and its modifications are applied [18]. But they are
advisable only at high noise levels and small number of model parameters to be estimated.5
0N is the length of time series of model state vectors obtained from the observable one. This time series is
used for parameters estimation and, therefore, is often called training time series.6 Note, that impossibility of obtaining a “good” model is the evidence for inadequacy of physical
considerations underlying the selected model structure. So, the modeling procedure can serve to compare
and validate different hypotheses concerning the mechanisms of the object functioning.

Construction of Dynamical Model Equations for Nonautonomous Systems … 219
219
just to estimation of parameters from a time series. But even in this case essential technical
difficulties can arise due to the large number of free model parameters and the presence of
hidden variables.
1.5. A peak of interest to the problem of global reconstruction from time series fell on
1990s (see [19-21,24-34], to mention a few works) after that the first reviews appeared (e.g.,
[35,36] and the book [37]). Black box techniques were mostly considered and choice of
variables and approximating functions was oriented to construction of models in a general
form. Thus, often employed model ODEs (2),(3) were called standard [11]. This term could
be referred also to other cases where model structure contains no information about any
specific features of an object. Pretentions of standards models to be always appropriate are
theoretically justified. As a rule, the justifications rely on Takens’ and Stone – Weierstrass’
theorems.
However, practical shortcomings of the developed methods (conditioned, to a significant
extent, by the use of universal structures) soon became apparent. All successes of real-world
objects modeling we are aware of (e.g., [11,14,15]) seem to be exclusions rather than typical
cases. Blunders at any stage of the modeling scheme can become obstacles: selected variables
may turn out inappropriate, but even the variables suitable for dynamical modeling do not
help if the forms of approximating functions do not correspond to them. Thus, the standard
structure (2),(3) cannot be the best choice for the entire variety of real-world systems. It often
leads to very bulky equations exhibiting divergent solutions.
In the recent papers addressing global reconstruction, rise of attention to the problems of
model structure selection (both dynamical variables and function forms) is noticed. A part of
the investigations is devoted to the development of approaches based on using a priori
information on the object [38-42]. Another important direction of research involves the
papers aimed at refining universal techniques [43-49].
1.6. In our opinion, main prospects of the further development of global reconstruction
techniques relate to the refusal of completely general (universal) model structures and
creation of specialized approaches oriented to certain classes of objects. It is reasonable to
consider sufficiently important classes which specific features are known a priori. On the
other hand, development of novel procedures for model refinement applicable both to
universal and special structures is also of significance.
We try to justify these theses in the presented paper where the development of special
techniques for global modeling of regularly driven systems is in the center of attention
(Section 3). They represent right one of the above mentioned important classes of objects.
Besides, we propose certain technological tricks appropriate for arbitrary situations, namely
a dynamical variables selection technique based on testing a time series for single-
valuedness and continuity of certain dependencies (Section 2),
a model structure optimization technique based on using transient processes
properties and allowing to exclude spurious model terms (Section 4).
In conclusion we present some general considerations on the problem of global modeling
from time series.

Boris Bezruchko, Dmitry Smirnov, Taras Dikanev, and Ilya Sysoev220
220
2. Dynamical Variables Selection
As it has been already mentioned, to construct model equations in the form
))(()( tt xFy from a time series )(itç , one forms, first of all, the series of state
vectors )(itx . Coordinates jx of a state vector x (dynamical variables) can be obtained as
sequential derivatives, time delays, etc. Then, the time series of quantities to enter the left-
hand side of model equations )(ity is obtained from the time series )(itx according to
the chosen model type:
via numerical differentiation of )(itx for ODEs, since dttdt )()( xy ;
via the shift of )(itx along the time axis for discrete maps, since
)()( 1ii tt xy .
Finally, the form of the function F is specified and its parameters are estimated.
Voluntary dynamical variables selection can make approximation of the dependencies
)(xjy with a smooth function extremely problematic [48,49] or even make these
dependencies many-valued. Here, we describe the method for assessing suitability and
convenience of the selected variables Dxx,...1 for constructing a global dynamical model.
It is based on testing the time series )(ity and )(itx for single-valuedness and
continuity of each dependency )(xjy in the entire region of an observed motion. It is
crucial here that we use local characteristics rather than the averaged ones as in [34,50].
2.1. Description of Technique
If a dependency y(x) is single-valued and continuous in a domain V, then the difference
)()( 0xx yy tends to zero when 00xx for each V0x . In practice,
violation of this condition may be viewed as a sign of many-valuedness or discontinuity of
the dependency y(x). Since the length of an observable time series is finite, the above-
mentioned limit cannot, strictly speaking, be found. However, it is possible to trace a
tendency in variations of the quantity )()( ji tyty when the vectors )(itx and )( jtx
are made closer and closer, down to a certain finite distance. Given sufficiently large amount
of data N, high accuracy of measurements, and low noise level, the distance
( ) ( )i jt tx x can be made sufficiently small for each local region of observed motion.
The technique of testing consists in the following (Fig.1,a). The domain V containing the
set of vectors 0
1( )
N
i itx is partitioned into identical hypercubic boxes of the size . All

Construction of Dynamical Model Equations for Nonautonomous Systems … 221
221
boxes containing at least two vectors are selected. Let us denote them Msss ,..., 21 . The
difference between the largest and the smallest values of y inside a box ks is called local
variation )(min)(max xxxx
yykk ss
k . The largest local variation kMk1
max max
and its graph )(max are used as the main characteristics of the investigated dependency.
Suitability of the considered quantities x and y for global modeling is assessed using the
following considerations [44].
1. If a dependency y(x) is single-valued and continuous, max is sufficiently small for
small and tends to zero for 0 (Fig.1,b, filled circles). It is not hard to show
that the plot )(max is a straight line for sufficiently small .
2. If a single-valued and continuous dependency has a region of very steep slope (a
“jump”), then max remains rather big for sufficiently small since that region is
situated typically within one box. However, further decrease in leads to decrease in
max because the region of the jump becomes divided into several boxes. The graph
)(max exhibits a “kink” at the value of roughly equal to the size of the steep
slope region (e.g., Fig.1,b, white circles). In such a case, the dependency y(x) is also
difficult to approximate with a smooth function.
3. 3) If max remains large and does not diminish for 0 (Fig.1,b, filled squares)
then the considered variables are not appropriate for global modeling. Such a
situation may be related both to non-uniqueness of the dependency and high noise
level.
4. To summarize, dynamical variables should be selected so that the graph )(max
tend to the origin without kinks and with slight slope (Fig.1b, filled circles). The
most important feature distinguishing the proposed approach and providing its
usefulness for global modeling is the employment of local (rather than averaged)
characteristics.7 Let us illustrate this thesis by modeling a real-world nonlinear
nonautonomous system.
7 It may be easily shown that the averaged over all boxes local variation does not allow detecting small
regions of non-uniqueness. Certainly, the use of only the largest value max makes the technique too
sensitive to outliers. To apply the technique successfully in such a situation, it is possible to exclude
“atypical” data points from the time series before testing. One can also exclude small fraction of data points
giving the largest local variation even during the testing. We do not discuss this point in more detail, but
note that the presence of outliers in real-world data is not compulsory.

Boris Bezruchko, Dmitry Smirnov, Taras Dikanev, and Ilya Sysoev222
222
Fig.1. (a) Illustration for a technique of testing a dependency y(x) for single-valuedness
and continuity in the case D = 2. (b) Possible appearance of plots )(max for different
variants of dynamical variables.
2.2. Experimental Example
The scheme of a nonlinear electric circuit, harmonically driven RLC-circuit with switched
capacitors [51,52], is shown in Fig.2,a. The element K is an electronic key that connects and
disconnects the capacitor 2C at a certain threshold value of the capacitor 1C voltage. As a
result, the system in nonlinear and exhibits complex dynamics (in particular, chaotic
oscillations) at large driving amplitudes [41,44].
We employ a chaotic time realization of the current I through the resistor R (see Section
3, Fig.6, ) as an observable time series )(it . The data are recorded with the aid of a 12-
bit ADC, the sampling interval is t = 4 sec, the driving period is T = 84 t, the length of the
series is 43 10N . Six examples are considered below, three variants of the model
structure for two different observables. The results of the proposed method application
(Fig.2,b,c) and of the model construction are presented. The plots in Fig.2 are numbered
according to the numbers of the examples.
1. We try a popular model structure
1 1 1 2 3
2 2 1 2 3
3 3 1 2 3
( , , ),
( , , ),
( , , ),
dx dt F x x x
dx dt F x x x
dx dt F x x x
(4)
where )2()(),()(),()( 321 iiiiii ttxttxttx are time delay
coordinates, t21 is the first zero of the autocorrelation function. A smoothing

Construction of Dynamical Model Equations for Nonautonomous Systems … 223
223
polynomial is constructed for numerical differentiation. Three dependencies
),,( 321 xxxdt
dx j, 3,2,1j , are analyzed. The value of max does not tend to zero
when decreases for all j. All plots )(max look alike; one of them (for j = 3) is
presented in Fig.2,b with white squares. It indicates impossibility of constructing an
efficient global model. The conclusion is confirmed in practice completely.
2. We try the standard structure (2) with )()(1 ii ttx . The dependency
31 2 3( , , )
dxx x x
dt is tested. )(max decreases for diminishing (Fig.2,b, white
circles) that points out to possible single-valuedness. The result of modeling is that
an efficient model (2),(3) cannot be obtained. Most probably, a polynomial (3) is
inappropriate to fit the investigated dependency. Another form of the approximating
function F is necessary. Its choice is a separate problem which is not addressed in
this section.
3. Following the recommendations on nonautonomous systems reconstruction [32,33]
(see also Section 3 of this paper), we try a model structure
1 2
2 1 2
,
( , , ),
dx dt x
dx dt F x x (5)
where )()(1 ii ttx and is a driving phase. The dependency
21 2( , , )
dxx x
dt is tested. The time series of the phase is obtained as
)2(mod)( ii tt , the angular frequency is assumed to be known. The
plot )(max (Fig.2,b, filled circles) shows that the dependency is, possibly, single-
valued. However, an efficient model (5) with bivariate polynomial and additive
harmonic driving (Section 3) cannot be obtained. Again, one needs to select a special
form of the function F.
4. We try the standard structure (2) with
it
ti dtttx
1
)()(1 . This variable makes
physical sense, it is the summed charge on the capacitors 1C and 2C . The time
series )(1 itx is obtained via numerical integration of the measured time series.
The value of )(max for the dependency 3
1 2 3( , , )dx
x x xdt
does not decrease
when decreases (Fig.2,c, white circles). An efficient model cannot be constructed.

Boris Bezruchko, Dmitry Smirnov, Taras Dikanev, and Ilya Sysoev224
224
5. We try the structure (4) with
it
ti dtttx
1
)()(1 and delayed coordinates
)()( 12 ii txtx and )2()( 13 ii txtx , where is again the first
zero of the ACF. The dependencies ),,( 321 xxxdt
dxj, 3,2,1j , are tested. The
plots )(max do not go through the origin in all three cases. One of them is
shown in Fig.2,c with white squares (for k = 1). An efficient model cannot be
constructed.
6. We try the structure (5) with
it
ti dtttx
1
)()(1 . The plot )(max shows that
the dependency 2
1 2( , , )dx
x xdt
is single-valued and, moreover, varies
“gradually” (Fig.2,c, filled circles). A reconstructed model (5) with additive
harmonic driving and bivariate polynomial of the 11th order demonstrates a chaotic
attractor qualitatively similar to the experimental one (see also section 3, Fig.6) and
provides a forecast 5T ahead with relative error less than 5 %.
Fig.2. (a) The scheme for the circuit with switched capacitors. Here, ,1.01 FC
,4.42 FC ,03.0 HL ,10R ,2.0 VUthr V,344.20U driving
frequency is 2.98 kHz, sampling frequency is 250 kHz. (b) The plots )(max for
different dynamical variables when the variable Ix1 . The typical for all the
examples plot )( is shown with the dashed line. (c) The plots )(max for different
dynamical variables when the variable 1x is an integral of the current I.
It is significant that an optimistic assessment according to the criterion )(max and
successful results of the global reconstruction are achieved only in the last (the sixth) case.
Yet, plots of the mean local variation )( are practically identical for all above-mentioned
Construction of Dynamical Model Equations for Nonautonomous Systems … 225
225
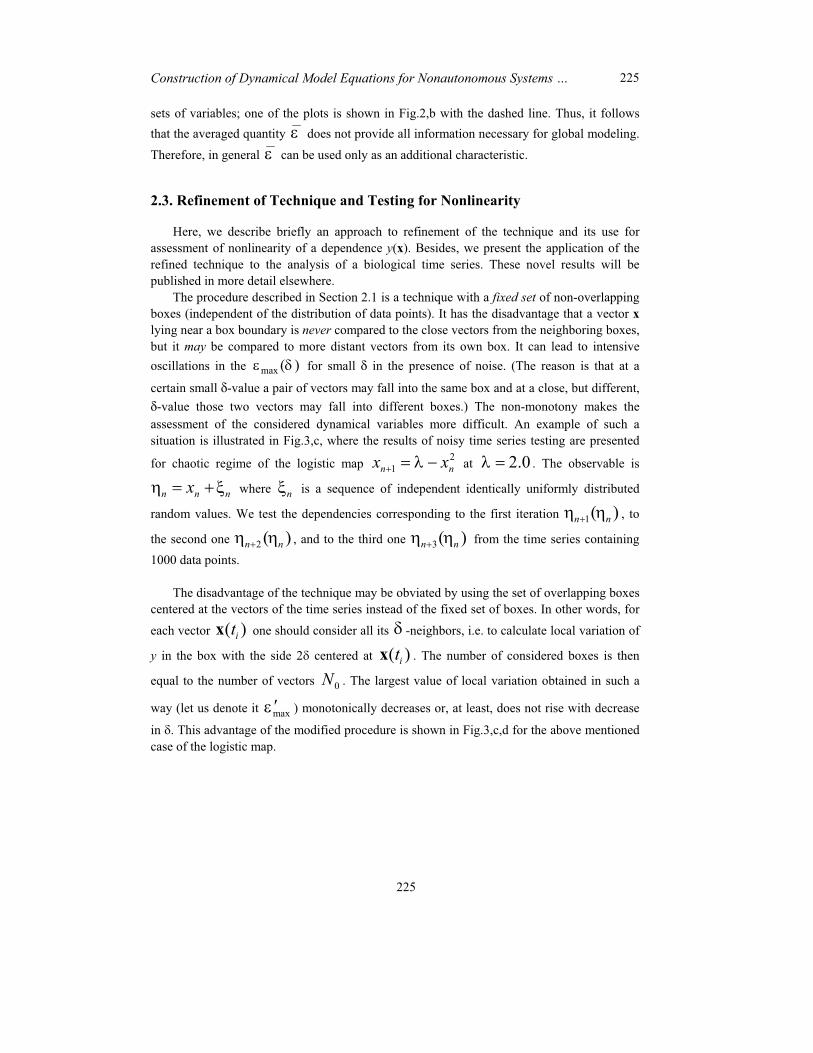
sets of variables; one of the plots is shown in Fig.2,b with the dashed line. Thus, it follows
that the averaged quantity does not provide all information necessary for global modeling.
Therefore, in general can be used only as an additional characteristic.
2.3. Refinement of Technique and Testing for Nonlinearity
Here, we describe briefly an approach to refinement of the technique and its use for
assessment of nonlinearity of a dependence y(x). Besides, we present the application of the
refined technique to the analysis of a biological time series. These novel results will be
published in more detail elsewhere.
The procedure described in Section 2.1 is a technique with a fixed set of non-overlapping
boxes (independent of the distribution of data points). It has the disadvantage that a vector x
lying near a box boundary is never compared to the close vectors from the neighboring boxes,
but it may be compared to more distant vectors from its own box. It can lead to intensive
oscillations in the )(max for small in the presence of noise. (The reason is that at a
certain small -value a pair of vectors may fall into the same box and at a close, but different,
-value those two vectors may fall into different boxes.) The non-monotony makes the
assessment of the considered dynamical variables more difficult. An example of such a
situation is illustrated in Fig.3,c, where the results of noisy time series testing are presented
for chaotic regime of the logistic map 2
1n nx x at 2.0 . The observable is
n n nx where n is a sequence of independent identically uniformly distributed
random values. We test the dependencies corresponding to the first iteration 1( )n n , to
the second one 2 ( )n n , and to the third one 3( )n n from the time series containing
1000 data points.
The disadvantage of the technique may be obviated by using the set of overlapping boxes
centered at the vectors of the time series instead of the fixed set of boxes. In other words, for
each vector ( )itx one should consider all its -neighbors, i.e. to calculate local variation of
y in the box with the side 2 centered at ( )itx . The number of considered boxes is then
equal to the number of vectors 0N . The largest value of local variation obtained in such a
way (let us denote it max ) monotonically decreases or, at least, does not rise with decrease
in . This advantage of the modified procedure is shown in Fig.3,c,d for the above mentioned
case of the logistic map.

Boris Bezruchko, Dmitry Smirnov, Taras Dikanev, and Ilya Sysoev226
226
Fig.3. Comparison of testing techniques in a numerical experiment. (a) The first, the
second, and the third iterations of the chaotic logistic map. (b),(c) Results of testing with
the fixed-set-of-boxes technique from noise-free and noisy data, respectively. (d) Results
of testing with the modified technique from noisy data.
Due to this advantage, the plot max ( ) is more reliable and informative. In particular,
the slope of the straight line passing through the origin and a point 0 max 0( , ( )) is the
estimate of the maximal “effective slope” of the investigated dependence for the chosen scale
0 . In the limit 0 0 , this slope equals to the maximum of the norm of the gradient of
y(x) over the investigated domain. Even more important, the plot max ( ) is a straight line
if the system under investigation is linear. So, the plot max ( ) can serve as a test for
linearity. Its concavity indicates nonlinearity of the system under investigation. Thus, the
above results for different iterations of the logistic map show that nonlinearity is more
pronounced for the third iteration.
As an example of the proposed techniques application to a complex real-world system, let
us briefly consider testing an acoustic time series. The time series is a digitized recording of
the human voice (in fact, air pressure variations), which was done when a man was
pronouncing the sound [a:]. Sampling frequency was equal to 44.1 kHz. The recording length
was410 data points. A dependence 2 2 4( , , )i i i i was tested. We present the plot
)(max in Fig.4,a; it does not indicate single-valuedness. Other conclusions can hardly be
drawn from the figure because of the above-mentioned disadvantages of the fixed-set-of-

Construction of Dynamical Model Equations for Nonautonomous Systems … 227
227
boxes technique. The modified technique leads to the monotone plot max ( ) (Fig.4,b). It is
easily seen that the dependence max ( ) is significantly concave that allow drawing a
conclusion about nonlinearity of the system under investigation. We do not go further into
details here.
Fig.4. Testing vocal time series described in the Section 2.3. (a) The fixed-set-of-boxes
technique indicates many-valuedness. (b) The modified techniques indicates also
nonlinearity.
3. Structure Selection (Modeling Nonautonomous Systems)
As it was already mentioned in the Introduction, standard models (2),(3) often prove
cumbersome and have divergent trajectories. This is practically inevitable payment for the
generality of basic conception, for the saving of time and efforts on the choice of the most
suitable mathematical construction. Probability to guess an adequate model form without
using a priori information or special preliminary investigation of the object is, in general, very
low. The technique described in the previous section provides a possibility to decide between
different sets of dynamical variables. But they do not guarantee the success of modeling
because one needs also to select an adequate form of functions entering model equations.
Here, we show the expediency of selection of functions based on the use of a priori
information with the example of nonautonomous systems being under arbitrary regular
(periodic or quasiperiodic) driving. The main idea is that explicit functions of time are
incorporated into the model equations to describe an external driving efficiently.
3.1. Additive Harmonic Driving
A modification of the standard structure in application to nonautonomous systems was
proposed in [32,33] for the simplest case of harmonic additive driving. Even though systems
of this kind are widely spread in practice, it is more important for the current consideration
that they represent an example illustrating possibility of efficient modification of the standard
structure via incorporating certain specific features of the object into the model. We

Boris Bezruchko, Dmitry Smirnov, Taras Dikanev, and Ilya Sysoev228
228
reproduce briefly the main points of the approach by following [33]. It is suggested to
construct a model in the form
1 2
2 3
1 2
,
,
...
( , ,..., , ),D D
dx dt x
dx dt x
dx dt G x x x t
(6)
,2
sin2
cos),...,,(),,...,,( 2121 tbtaxxxFtxxxG DD (7)
where F is an algebraic polynomial. For D = 2, these are general equations of harmonically
driven oscillator.
One should have certain prerequisites to build a model in the form (6),(7). A priori
information or a discrete peak in the power spectrum of an observed time series may be such
prerequisites. Location of the peak may be viewed also as a rough estimate of the driving
period. Given the value of T, parameters a and b and polynomial coefficients are estimated
via the linear least-squares routine. To estimate is not so simple since it enters the equation
(7) nonlinearly. An error in its estimation 0TTT (where 0T is an unknown “true”
value) inevitably leads to a significant “phase shift” between the true driving and the
corresponding model terms if the training time series is quite long. It is shown in [32,33] that
the relative error of driving approximation T depends only on the ratios 0T/T and 0/TTN
via
0 0
~ NT
T T
T T, (8)
where NT is the duration of the training time series. It follows that the driving period should
be estimated more accurately for longer training time series, otherwise incorporation of
explicit time dependence is useless. From this point of view, a too long time realization
becomes an obstacle for constructing a model (6),(7).
To estimate accurately the driving period T, two preliminary steps are included into the
reconstruction procedure. Firstly, a good starting guess for the period should be made. A peak
value *T of the power spectrum can be taken as such a guess since power spectrum with the
shape shown in Fig.5, is often exhibited by periodically driven systems. Secondly, model
dimension D and reasonably large value of K are fixed and trial value of T is varied in the
vicinity of the starting guess *T . Equations (6),(7) are fitted to time series data for each trial
T. The presence of a profound minimum on the plot versus T is a sign of adequacy of the

Construction of Dynamical Model Equations for Nonautonomous Systems … 229
229
structure (6),(7). The minimum point of this plot coincides with true period value to a great
accuracy (typical form of the plot )(lg T is shown in Fig.5, b).
Fig.5. (a) Typical appearance of the power spectrum for harmonically driven chaotic
systems. There is a pronounced peak. (b) lg versus a trial value of driving period T for
a model (6),(7).
This approach is shown to be efficient, in particular, for modeling nonlinear radiophysical
systems. Some of the results of its application8 are presented in Fig.6. This is the example of
modeling driven RLC-circuit with switched capacitors (see the scheme in Fig.2,a) from the
integrated chaotic time series of current I, that is for the dynamical variables selected as the
best ones in Section 2. An obtained model (6),(7) with D = 2 and K = 9 9 behaves like the
original system and provides a forecast with relative error less than 5 % quite far ahead
(namely, on the interval 5T that is big for the considered chaotic regime).
Note that the main cause of efficiency of the structure (6),(7) is that it allows obtaining a
model of lower dimensionality than it would be necessary under the standard approach.
Modeling harmonically driven oscillators with the aid of the standard structure (2),(3) was
considered in [47]. In particular, in the absence of noise an adequate 4-dimensional model
was obtained for a 3-dimensional original system that required numerical estimation of the
time derivatives up to the fourth order. Seemingly, the standard approach could hardly be
efficient already for low noise levels since sufficiently accurate calculation of high-order
derivatives would be impossible. Besides, it is more probable for the standard polynomial
approximation to be efficient when a model phase space is low-dimensional.
8 Various approaches have been developed to validate empiric models. They include comparison of invariant
measures, topological indices, etc, see the section “Model validation” in the review by G.Gouesbet et al in
this book. We use only two simple techniques: prediction time and visual inspections of phase orbits
projections. They are sufficient for the purposes of illustration of the approaches developed here.

Boris Bezruchko, Dmitry Smirnov, Taras Dikanev, and Ilya Sysoev230
230
Fig.6. (a) A projection of an experimental orbit for the circuit with switched capacitors
onto the plane charge – current. (b) A corresponding projection for the best reconstructed
model (6),(7) with D = 2 and K = 9.
Harmonic force represents an important but sufficiently narrow class of possible ways of
driving. Here, we present extensions of the approach to more complex and realistic situations.
Besides, we somewhat modify the technique for driving period estimation to make it more
efficient. We will treat in turn two cases:
1. arbitrary form of regular (i.e. periodic or quasiperiodic) additive driving;
2. arbitrary way of entry of harmonic driving.
3.2. Arbitrary Additive Regular Driving
In this case we propose to use the model structure (6) with explicit time dependence but
not necessarily harmonic. That is, we employ
)(),...,,(),,...,,( 2121 tgxxxFtxxxG DD , (9)
where F is an algebraic polynomial, and function )(tg describes the driving and also
involves free parameters. Two approaches to the specification of )(tg are possible. The first
one is to guess a special formula on the basis of a priori information. The second variant is
much more general and can be used in the absence of detailed knowledge of the driving form.
It consists in exploiting trigonometric polynomials
9 Exclusion of spurious terms from the model structure was also performed with the aid of a procedure
similar to the one described in Section 4.

Construction of Dynamical Model Equations for Nonautonomous Systems … 231
231
0 , ,
1 1
2 2( ) cos cos
lkm
l j l j
l j l l
jt jtg t a a b
T T, (10)
where m = 1 for a periodic case, and quasiperiodic driving is described by the sum of m > 1
trigonometric polynomials with different periods lT and orders lk . The technique for
parameter estimation of the model (6),(9) relies on the least-squares routine (LSR). But, since
several free parameters can enter nonlinearly the expression for g (this is, at least, the driving
period in the case of periodic driving), it is reasonable to use one of iterative techniques to
solve a nonlinear least-squares problem. We have used the modified Levenberg – Marquardt
routine implemented in the IMSL library.
Note, that considering the driving period as a free parameter for nonlinear least-squares
problem alters the above conclusion (Section 2.1) that a long time series is an obstacle for
modeling driven systems. That conclusion is true only under the condition that the driving
period is preliminary determined and is not adjusted any more with LSR. But if it is estimated
along with all the model parameters via LSR, then the accuracy of its estimation just depends
on the time series length. This is again because the “phase shift” between the true driving and
model terms is large for inaccurate determination of the period. So, long time series allow,
and even force, more accurate determination of the period value. But a good starting guess
for the driving period is still important to apply nonlinear LSR and power spectrum analysis
remains useful for that (Fig.5,a). If power spectrum gives a bad starting guess that may occur
in special cases, then the approach of [32,33] (Fig.5,b) can help, but a trial value of T should
be varied over a wide range rather than near a good starting guess.
We examine efficiency of the approach in numerical experiments by reconstruction of
equations from chaotic time series of the x-coordinate of Toda oscillator
2 2 1 ( )xd x dt r dx dt e t (11)
for different forms of driving )(t . Namely, for impulse periodic, periodic with
subharmonics, and quasiperiodic driving. Here, we present just one of the examples when
)(t is a sequence of Gaussian impulses of alternating polarity (Fig.7):
22)2/(
exp)(
exp)(Ttt
At ;2
mod)( 0
TTtt , (12),
where T is a driving period, A is a driving “amplitude”, 0t is an initial phase, is an
impulse width. Time series is obtained here (and in all numerical examples below) by
numerical integration of the original equations with the Runge-Kutta routine (step size and
sampling interval are equal to 0.01, the time series length is 5000).

Boris Bezruchko, Dmitry Smirnov, Taras Dikanev, and Ilya Sysoev232
232
Fig.7. Periodic sequence of Gaussian pulses (12), 6.3T , 20A , 00t ,
2.0 .
We compared different approaches to structure selection that include standard structure
(2),(3), nonautonomous models (6),(9) with a special formula, and nonautonomous models
with trigonometric polynomials (6),(9),(10). The results of their application are illustrated in
Fig.8 where model and original phase orbits are shown. The standard approach gives bad
results: for the best model an approximation error is large %9.86 , prediction time is
small Tpred 08.0 , and phase orbit does not resemble the original one, see Fig.8,b. As it
is expected, a model (6),(9) with 8,2 KD and special formula (12) for description of
driving (in effect, only the parameters T , A , 0t , are estimated from time series)
demonstrates practically ideal coincidence with the object: %003.0 , Tpred 21 and
chaotic attractor is indistinguishable from the original one. Results for models (6),(9),(10)
with 8,2 KD , m = 1 depend on the number of harmonics 1k . Qualitative similarity of
model and original phase orbits is achieved already at 81k , but quantitative characteristics
are not yet the best: %3.4 , Tpred 26.2 . Model quality rises with the number of
harmonics, see Fig.9. The best results are obtained at 151k : %1.0 , prediction time is
quite big10 Tpred 24.19 , the attractor is shown in Fig.8c.
10 The horizon of predictability for the given largest Lyapunov exponent and noise level (truncation and
round-off errors) is 60hor T . Prediction time pred is of the same order of magnitude as hor . Their
distinction is explained by the imperfection of the model class: an algebraic polynomial is used to
approximate an exponential function.

Construction of Dynamical Model Equations for Nonautonomous Systems … 233
233
Fig.8. (a) A projection of phase orbit of an object (11),(12); (b) a projection of phase orbit
of the best standard model (2),(3) with D = 2, K = 9; (c) a projection of phase orbit of the
best model (6),(9),(10) with D = 2, K = 8, m = 1, 1 15k .
Fig.9. Relative root-mean-squared approximation error and prediction time (in the units
of the driving period) versus the number of harmonics for models (6),(9),(10).
Similar results are obtained for regular driving of different kinds and for noisy time series
with noise levels up to 1%. They will be reported elsewhere. It is important to note that
efficient models (6),(9),(10) can be obtained even with trigonometric polynomials of very
high orders, which are necessary to describe non-smooth driving. This is an essential
advantage of the approach since instability of models (2),(3) with high-order algebraic
polynomials seems the main cause of the standard approach failures. To overcome this
difficulty, one should exclude “superfluous” (spurious) terms from the model structure, e.g.,
the papers [46,23] and section 4 of this paper deal with that problem. Under the use of
trigonometric polynomials for driving approximation, the necessity to exclude spurious terms
from them does not arise.

Boris Bezruchko, Dmitry Smirnov, Taras Dikanev, and Ilya Sysoev234
234
3.3. Arbitrary Way of Regular Driving Entry
Let us consider only the case of harmonic driving here, generalizations to an arbitrary
form of periodic and quasiperiodic driving will be straightforward. The degree of generality
significantly higher than for a model (6),(7) can be achieved by using the structure (6) and a
polynomial with alternating coefficients [41]
D
jj
K
Dlll
D
j
jl
jDlllDlllDlllD
Kl
xtbtactxxxG
1
0,...,2,1 1,...,2,1,...,2,1,...,2,121
.
,sincos),,...,,(
(13)
To estimate parameters of the model (6),(13), one can employ the above mentioned LSR.
To illustrate efficiency and advantages of the structure (6),(13), we present a numerical
example of modeling from a chaotic time series of the 1u -coordinate of Toda oscillator when
driving is not just additive. The original equations read
1
1 2
2 2
,
0.45 (5 4cos )( 1) 7sin .u
du dt u
du dt u t e t (14)
The best model (6),(13) is achieved at D = 2, K = 9. It exhibits chaotic attractor practically
identical to the original one (Fig.10,a,b). Such results cannot be achieved with models (6),(7)
(Fig.10,c). Standard models (2),(3) demonstrate, as a rule, globally unstable orbits (Fig.10d).
Prediction times for the best models (6),(13), (6),(7), and (2),(3) are equal to 7T, 1.5T and
0.15T, respectively. See [41] for more details.
Fig.10. (a) A projection of attractor of Toda oscillator (14). (b-d) Projections of phase
orbits for a model (6),(13) with D = 2, K = 9, a model (6),(7) with D = 2, K = 10, and a
standard model (2),(3) with D = 4, K = 6, respectively.
The considered stages (dynamical variables and model structure selection) are the key
ones for modeling. However, efficient specialized techniques for model refinement are also
useful. Thus, model structures (6),(9),(10) and (6),(13) allow obtaining more parsimonious
models since they contain less variables, than it would be needed under the standard
approach, due to incorporation of explicit time dependence. Big model size conditioned by a

Construction of Dynamical Model Equations for Nonautonomous Systems … 235
235
high-order trigonometric polynomial (10) does not lead to difficulties as it has been shown
above. But nonautonomous models involve also algebraic polynomials describing
nonlinearity of the object and, hence, a large number of terms in those polynomials can lead
to difficulties. Many of their terms can reduce the model quality drastically. So, to construct
nonautonomous models involving algebraic polynomials as well as the standard models, it is
important to exclude spurious model terms. A feasible special procedure for that is presented
in the following section.
4. Model Structure Optimization
Usually, global models are constructed from time realizations of established motions
corresponding to attractors in phase space of an object. Such an approach seems reasonable
when only the dynamics on the attractor is of interest. However, for modeling object
dynamics in a wide domain of the phase space, success is more probable when one uses time
realizations of transient processes, i.e. when a phase orbit has not yet settled down onto an
attractor. As it was shown in [43], the use of transients can be sometimes useful to refine a
model by optimizing its structure. As we hypothesize, this is because they explore a wider
domain of the phase space. In this section we briefly describe the main results concerning
detection of the time series segment which is optimal for modeling. Then, a model structure
optimization procedure will be explained.
To detect a segment optimal for modeling, we compare performance of global models
obtained from different segments of the time series, some of them involve a transient while
the others do not. For the sake of convenience, it is reasonable to illustrate the idea by using
sufficiently simple autonomous system. We choose Van der Pol – Toda oscillator which
equations read as
1 2
2
2 1 2 1
,
(1 ) 1 exp( ).
dx dt x
dx dt x x x (15)
Reconstruction is performed from a scalar time series of the 1x -coordinate involving a
transient. The corresponding phase orbit is shown in Fig.11, a. Models of the form (2) with D
= 2 are constructed in two variants differing from each other by the form of the function
),( 21 xxF . In the first case, a standard bivariate algebraic polynomial is employed:
.,),(0,
2121 KjixxcxxFK
ji
jiij (16)
In the second case, F is given by
)()(),( 122121 xfxxxxF K , (17)

Boris Bezruchko, Dmitry Smirnov, Taras Dikanev, and Ilya Sysoev236
236
where )( 1xfK is a univariate algebraic polynomial of the order K which should approximate
the exponential function. To assess a model quality, right-hand side reconstruction error is
calculated. This quantity compares functions entering right-hand sides of an object and a
model ( 0F and F , respectively):
SdxdxxxFxxF 21
221021 ),(),( , (18)
where S is an integration domain containing the phase orbit and, hence, much larger than the
domain of an attractor. The lower is , the better is a model.
Fig.11. (a) A phase orbit of the system (15). (b) Model error versus the location m of a
reconstruction window for models (2),(16) (the curve 1) and models (2),(17) (the curve 2)
with polynomials of the 7th order.
Searching for a segment of the time series (a reconstruction window), which is optimal
for modeling, is performed as follows. A certain length of a reconstruction window (M data
points) is specified. We denote a reconstruction window as 1
)(Mm
miit , where m is the
number of its starting point. The initial point of the original time series coincides with the
starting point of a reconstruction window for m = 1. When m increases, a reconstruction
window moves along a time series into the domain of an attractor. Models are constructed for
different values of m. Optimal location of the reconstruction window corresponds to a
minimum on the plot versus m.
Plots (m) in Fig.11, b show that the best results for a model (2),(16) are obtained with
the use of the transient, see the curve 1, small m. For a model (2),(17) the overall results are
better by an order of magnitude, see the curve 2, but they are almost independent on the
location of the reconstruction window. It can be explained as follows. The structure (2),(16)
includes variety of superfluous (spurious) terms, e.g., the terms 21xx ,221xx ,
22
21 xx , etc,

Construction of Dynamical Model Equations for Nonautonomous Systems … 237
237
which are not relevant for the original equation (15). Theoretically, model coefficients
corresponding to superfluous terms should vanish. But in practice their estimated values
differ from 0 due to round-off and truncation errors and impossibility of accurate
approximation of exponential function by an algebraic polynomial. Superfluous terms can
become significant outside of a reconstruction window and lead to essential discrepancies
between an object and a model. For a model (2),(16) involving spurious terms, depends on
m essentially (Fig.11,b) that is induced by essential dependence of “spurious coefficients” on
m (Fig.12,a). For a model (2),(17), the use of a transient does not have advantages because its
good performance is due to the absence of spurious terms rather than the extension of the
explored region in the phase space.
Let us look again at Fig.12,a where the plots for coefficients corresponding to necessary
terms are grouped on the left and for superfluous terms – on the right. The superfluous
coefficients are obviously less stable than the necessary ones, the instability appearing close
to the beginning of the time series, i.e. in a transient period. Relying on these considerations,
we propose a procedure for model structure optimization based on sequential exclusion of the
terms corresponding to the less stable coefficients. The stability (reliability) of some
coefficient a can be evaluated as the ratio of its mean value to its standard deviation
21
aa
am , where angle brackets designate average over the ensemble of values of
a obtained at different m.
Thus, to optimize a model structure, the less stable coefficient (with smallest 1m ) is
found and the corresponding term is excluded from the model.11
Reconstruction procedure is
repeated for the simplified structure. The next less stable coefficient is detected and the next
term is eliminated, and so on until exclusion of a new term leads to model deterioration. In
Fig.12,b we present the error versus the number of excluded terms as obtained during
reconstruction from the time series of the system (15) starting from the model structure
(2),(16). It can be seen that the proposed procedure allows essential reduction of the error
(after exclusion of 20 terms) and, hence, enhancement of the model quality.
Despite the above-mentioned successful results, we should make several remarks. Firstly,
we cannot guarantee that the use of transients will generically help. Secondly, reconstruction
from different segments of a realization representing dynamics on an attractor, in principle,
can also lead to similar refinement of the model structure. Thus, reconstruction with standard
functions from unstable periodic orbits or from laminar phases of an intermittent signal can be
successful [54]. But, in our opinion, the use of transients should often be more useful. This is
a hypothesis but it relies on an empiric basis. For example, one can see in Fig.12 that
coefficients corresponding to spurious terms oscillate quite intensively only in the region of a
transient. So, inspection of a transient part of the time series is essentially preferable for their
detection in this case.
11 A similar procedure was considered in [53] where it was called “zeroing and refitting” rather than “model
structure optimization”. In the current context we prefer the latter term.

Boris Bezruchko, Dmitry Smirnov, Taras Dikanev, and Ilya Sysoev238
238
Fig.12. Results of modeling the system (15) from a scalar time series. (a) Coefficients of
a model (2),(16) corresponding to polynomial terms presented near the panels versus the
location m of a reconstruction window. (b) The error versus the number of excluded
terms. Optimization is performed starting from the model structure (2),(16).

Construction of Dynamical Model Equations for Nonautonomous Systems … 239
239
5. Conclusions
Analysis of publications shows that to date significant efforts have been made to solve
the modeling problems of the kind that we refer to as the highest level of complexity in
Section 1.4 (reconstruction of equations in the case of absence of a priori knowledge about an
object under investigation). However, examples of successful modeling in such a situation are
quite rare and determined by the possibilities of obtaining additional information on the
possible model structure.
In the most preferable situation when the model structure is completely known, e.g., from
the first principles, the results of modeling depend mainly on the amount and precision of
experimental data. Estimation of parameters performed in such a situation can, nevertheless,
be a very useful tool for many applications. Very interesting researches of this kind are
presented in [38,55].
To our best knowledge, there are almost no works addressing the second level of
complexity; to a certain extent, the paper [39] can be related to them. However, in our
opinion, it is this statement of the problem that is the most promising for obtaining useful
results in many fields, since it represents a combination of empiric modeling and modeling
from the first principles.
In this paper, we address only the most difficult situation – a reconstruction problem. To
advance further in the field of global reconstruction from time series, one needs both the
development of novel technical procedures and creation of methods oriented to sufficiently
narrow classes of objects. The latter approach is, in a sense, close to the second situation from
the systematization given in Section 1.4. And it might be, probably, the most important
direction of research. A special preliminary analysis of time series and the use of a priori
information are needed for this approach. In our works, prospects and necessity of such a
“specialization” are shown and technical procedures are presented. The main results are as
follows:
1. the proposed technique for preliminary testing of times series of dynamical variables
(section 2) provides the variants which are the most suitable for modeling;
2. the proposed modifications of the standard model structure (section 3) allow
obtaining efficient models of nonautonomous systems for arbitrary periodic and
quasiperiodic driving, both for additive and parametric character of driving;
3. the proposed procedure of model structure optimization (Section 4) allows
elimination of spurious terms from the model structure using properties of transient
processes, whereby performance of an empiric model can be significantly refined.
Acknowledgements
We acknowledge Dr. Ye.P. Seleznev for providing us with the data of physical
experiments. We are grateful also to one of the editors of this book, Prof. G. Gouesbet, for
careful inspection of our contribution and useful remarks and recommendations.
Our work is carried out under the financial support of the Russian Foundation for Basic
Research (Grants Nos. 02-02-17578, 02-02-06502, 02-02-06503), Russian Academy of

Boris Bezruchko, Dmitry Smirnov, Taras Dikanev, and Ilya Sysoev240
240
Sciences (Grant for young scientists No. 23), and American Civilian Research and
Development Foundation (Award No. REC-006).
References
[1] Box G. and Jenkins G. Time series analysis: Forecasting and Control, revised ed.,
Holden-Day, San Francisco, 1976.
[2] Lorenz E.N. Deterministic nonperiodic flow, J. of the Atmospheric Sciences, 1963, V.
20. P. 130-141.
[3] Ruelle D. and Takens F. On the nature of turbulence, Commun. Math. Phys., 1971, V.
20. P. 167-192.
[4] Crutchfield J.P. and McNamara B.S. Equations of motion from a data series, Complex
Systems, 1987, V. 1. P. 417-452.
[5] Farmer J.D. and Sidorowich J.J. Predicting chaotic time series, Phys. Rev. Lett., 1987, V.
59. P. 845-848.
[6] Casdagli M. Nonlinear prediction of chaotic time series, Physica D, 1989, V. 35. P. 335-
356.
[7] Cremers J. and Hubler A. Construction of differential equations from experimental data,
Z. Naturforschung A, 1987, V. 42. P. 797-802.
[8] Bünner M.J., Popp M., Meyer Th., Kittel A., Rau U., and Parisi J. Recovery of scalar
time-delay systems from time series, Phys. Lett. A, 1996, V. 211. P. 345-349.
[9] Voss H. and Kurths J. Reconstruction of non-linear time delay models from data by the
use of optimal transformations, Phys. Lett. A, 1997, V. 234. P. 336-344.
[10] Bär M., Hegger R., and Kantz H. Fitting partial differential equations to space-time
dynamics, Phys. Rev. E, 1999, V. 59. No. 1. P. 337-343.
[11] Gouesbet G., Letellier C. Global vector-field approximation by using a multivariate
polynomial 2L approximation on nets, Phys.Rev. E, 1994, V. 49, P. 4955-4972.
[12] Takens F. Detecting strange attractors in turbulence, in Dynamical Systems and
Turbulence, Warwick, 1980, eds. D.Rang and L.S.Young, Lecture Notes in
Mathematics, 1981, V. 898. P. 366-381. Sauer T., Yorke J.A., and Casdagli M.
Embedology, J. Stat. Phys., 1991, V. 65, No. 3-4. P. 579-616.
[13] Janson N.B., Pavlov A.N., and Anishchenko V.S. One method for restoring
inhomogeneous attractors, Int. J. of Bifurcations and Chaos, 1998, V. 8, No. 4, P. 825-
833.
[14] Letellier C., Le Sceller L., Dutertre P., Gouesbet G., Fei Z., and Hudson J.L.
Topological characterization and global vector field reconstruction of an experimental
electrochemical system, J. Phys. Chem., 1995, V. 99. P. 7016-7027.
[15] Letellier C., Le Sceller L., Gouesbet G., Lusseyran F., Kemoun A., and Izrar B.
Recovering deterministic behavior from experimental time series in mixing reactor,
AIChE Journal, 1997, V. 43, No. 9. P. 2194-2202.
[16] Letellier C., Maquet J., Labro H., Le Sceller L., Gouesbet G., Argoul F., and Arneodo A.
Analyzing chaotic behavior in a Belousov-Zhabotinskyi reaction by using a global
vector field reconstruction, J. Phys. Chem., 1998, V. 102. P. 10265-10273.

Construction of Dynamical Model Equations for Nonautonomous Systems … 241
241
[17] Gribkov D.A., Gribkova V.V., Kravtsov Yu.A., Kuznetsov Yu.I., and Rzhanov A.G.
“Reconstruction of dynamical system structure from time series,” Radiotekh. i electron.,
1994. V. 39, No. 2. P. 269-277.
[18] McSharry P.E. and Smith L.A. Better Nonlinear Models from Noisy Data: Attractors
with Maximum Likelihood, Phys. Rev. Lett., 1999, V. 83, No. 21. P. 4285-4288.
[19] Judd K., Mees A.I. On selecting models for nonlinear time series, Physica D, 1995, V.
82. P. 426-444.
[20] Small M. and Judd K. “Comparison of new nonlinear modeling techniques with
application to infant respiration,” Physica D, 1998, vol. 117, p. 283-298.
[21] Judd K., Mees A.I. Embedding as a modeling problem, Physica D, 1998, V. 120. P. 273-
286.
[22] K. Judd and M. Small “Towards long-term prediction,” Physica D, 2000, V. 136, P. 31-
44.
[23] M. Small, K. Judd and A. Mees “Modeling continuous processes from data,” Phys. Rev.
E, 2001, V. 65, 046704.
[24] Breeden J.L. and Hubler A. Reconstructing equations of motion from experimental data
with unobserved variables, Phys. Rev. A, 1990, V. 42, No. 10. P. 5817-5826.
[25] Baake E., Baake M., Bock H.J., and Briggs K.M. Fitting ordinary differential equations
to chaotic data, Phys. Rev. A, 1992, V. 45, No. 8, P. 5524-5529.
[26] Brown R., Rulkov N.F., and Tracy E.R. Modeling and synchronizing chaotic systems
from time-series data, Phys. Rev. E, 1994, V. 49, No. 5. P. 3784-3800.
[27] Timmer J. Modeling noisy time series: physiological tremor, Chaos, 1998, V. 8, No. 7.
P. 1505-1516.
[28] Kadtke J., Kremliovsky M. Estimating statistics for detecting determinism using global
dynamical models, Phys.Lett. A, 1997, V. 229. P. 97-106.
[29] Anosov O.L., Butkovskii O.Ya., and Kravtsov Yu.A. Nonlinear chaotic systems
identification from observed time series, Math.Models and Methods in Appl. Sciences.
1997. V. 7, No. 1. P. 49.
[30] Anishchenko V.S. and Pavlov A.N. Global reconstruction in application to multichannel
communication, Phys.Rev. E, 1998, V. 57, No. 2, P. 2455-2457.
[31] Anishchenko V.S., Pavlov A.N., and Janson N.B. Global reconstruction in the presence
of a priori information, Chaos, Solitons & Fractals, 1998, V. 8, P. 1267-1278.
[32] Hegger R., Kantz H., Schmuser F., Diestelhorst M., Kapsch R.-P., and Beige H.
Dynamical properties of a ferroelectric capacitors observed through nonlinear time series
analysis, Chaos, 1998, V. 8, 3. P. 727-754.
[33] Bezruchko B.P., Seleznev Ye.P., and Smirnov D.A. “Reconstruction of equations of
nonautonomous nonlinear oscillator from a time series: models, experiment,” Izv. Vyssh.
Uchebn. Zaved. Priklad. Nelin. Dinam., 1999, V. 7, No. 1, P. 49-67.
[34] Bünner M.J., Meyer Th., Kittel A., and Parisi J. Recovery of the time-evolution equation
of time-delay systems from time series, Phys. Rev. E, 1997, V. 56, P. 5083-5089.
[35] Pavlov A.N., Janson N.B., and Anishchenko V.S. “Reconstruction of dynamical
systems,” Radiotekh. i electron., 1999. V. 44, No. 9. P. 1075-1092.
[36] Anosov O.L., Butkovskii O.Ya., and Kravtsov Yu.A. “Reconstruction of dynamical
systems from chaotic time series (brief review),” Izv. Vyssh. Uchebn. Zaved. Priklad.
Nelin. Dinam., 2000. V. 8, No. 1. P. 29-51.

Boris Bezruchko, Dmitry Smirnov, Taras Dikanev, and Ilya Sysoev242
242
[37] Kantz H. and Schreiber T., Nonlinear Time Series Analysis, Cambridge University
Press, Cambridge, 1997.
[38] Horbelt W., Timmer J., Bunner M.J., Meucci R., and Ciofini M. Identifying physical
properties of a CO2-laser by dynamical modeling of measured time series, Phys. Rev. E,
2001, V. 64. 016222.
[39] Timmer J., Rust H., Horbelt W., and Voss H.U. Parametric, nonparametric and
parametric modelling of a chaotic circuit time series, Phys. Lett. A, 2000, V. 274. P. 123-
134.
[40] Horbelt W., Timmer J., and Voss H. Parameter estimation in nonlinear delayed feedback
systems from noisy data, Phys. Lett. A, 2002, V. 299. P. 513-521.
[41] Bezruchko B. and Smirnov D. Constructing nonautonomous differential equations from
a time series, Physical Review E, 2001, V. 63, 016207.
[42] Bezruchko B., Karavaev A., Ponomarenko V., and Prokhorov M. Reconstruction of
time-delay systems from chaotic time series, Phys. Rev. E, 2001, V. 64, 056216.
[43] Bezruchko B., Dikanev T., and Smirnov D. Role of transient processes for
reconstruction of model equations from time series, Physical Review E, 2001, V. 64,
036210.
[44] Smirnov D., Bezruchko B. and Seleznev Ye. Choice of dynamical variables for global
reconstruction of model equations from time series, Physical Review E, 2002, V. 65,
026205.
[45] Le Sceller L., Letellier C., and Gouesbet G. Structure selection for global vector field
reconstruction by using the identification of fixed points, Phys. Rev. E, 1999, V. 60, No.
2. P. 1600-1606.
[46] Aguirre L.A., Freitas U.S., Letellier C., Maquet J. Structure-selection techniques applied
to continuous-time nonlinear models, Physica D, 2001, V. 158. P. 1–18.
[47] Menard O., Letellier C., Maquet J., Le Sceller L.,and Gouesbet G. Analysis of a
nonsynchronized sinusoidally driven dynamical system, Int. J. Bifurcations and Chaos,
2000, V. 10, No. 7. P. 1759-1772.
[48] Letellier C., Maquet J., Le Sceller L., Gouesbet G., and Aguirre L.A. On the non-
equivalence of observables in phase space reconstructions from recorded time series, J.
Phys. A: Math. Gen., 1998, V. 31. P. 7913-7927.
[49] Letellier C., Aguirre L.A., Investigating nonlinear dynamics from time series: The
influence of symmetries and the choice of observables, Chaos, 2002, V. 12, No. 3. P.
549-558.
[50] Kaplan D.T. Exceptional events as evidence for determinism, Physica D, 1994, V. 73. P.
738-748.
[51] Hasler M. “Electric circuits with chaotic behavior,” Proc. IEEE, 1987, Vol. 75, No. 8. P.
40-55.
[52] Bezruchko B.P. and Seleznev Ye.P. “Complex dynamics of driven oscillator with
piecewise-linear characteristics,” Pis’ma v Zh. Tekh. Fiz., 1994, V. 20, No. 19. P. 75-79.
[53] Gouesbet G. “Reconstruction of the vector fields of continuous dynamical systems from
numerical scalar time series,” Physical Review A, 1991, V. 43, No. 10, P. 5321-5331.
[54] Letellier C., Ringuet E., Maquet J., Maheu B., Gouesbet G. “Global vector field
reconstruction of chaotic attractors from one unstable periodic orbit,” Entropie, 1997,
No. 202/203, P. 147-153.

Construction of Dynamical Model Equations for Nonautonomous Systems … 243
243
[55] Tokuda I., Parlitz U., Illing L., Kennel M., and Abarbanel H., “Parameter estimation for
neuron models”, to appear in “Experimental Chaos,” Proceedings of the 7th
Experimental Chaos Conference, San Diego, USA, 2002.