Constraints and Opportunities for SMEs Investment ... - IssueLab
67
This research was supported by a grant from the Investment Climate and Business Environment (ICBE) Research Fund, a collaborative initiative of TrustAfrica and IDRC. It’s a working paper circulated for discussion and comments. The findings and recommendations are those of the author(s), and do not necessarily reflect the views of the ICBE-RF Secretariat, TrustAfrica or IDRC Constraints and Opportunities for SMEs Investment in Uganda’s Oil and Gas Sector By Rebecca Nalumu Wamono 1 *, Prosie Kikabi*, and Johnny Mugisha** ICBE-RF Research Report No. 34/12 Investment Climate and Business Environment Research Fund (ICBE-RF) www.trustafrica.org/icbe Dakar, July 2012 * Uganda Investment Authority, Kampala, Uganda ** Makerere University, Kampala, Uganda 1 Contact: [email protected]
-
Upload
khangminh22 -
Category
Documents
-
view
3 -
download
0
Transcript of Constraints and Opportunities for SMEs Investment ... - IssueLab

This research was supported by a grant from the Investment Climate and Business Environment (ICBE) Research
Fund, a collaborative initiative of TrustAfrica and IDRC. It’s a working paper circulated for discussion and
comments. The findings and recommendations are those of the author(s), and do not necessarily reflect the views of
the ICBE-RF Secretariat, TrustAfrica or IDRC
Constraints and Opportunities for SMEs Investment in Uganda’s
Oil and Gas Sector
By
Rebecca Nalumu Wamono1*, Prosie Kikabi*, and Johnny
Mugisha**
ICBE-RF Research Report No. 34/12
Investment Climate and Business Environment Research Fund
(ICBE-RF)
www.trustafrica.org/icbe
Dakar, July 2012
* Uganda Investment Authority, Kampala, Uganda
** Makerere University, Kampala, Uganda
1 Contact: [email protected]

ii
Abstract
Uganda’s Oil Industry has attracted huge foreign investment, but participation by SMEs has
remained poor despite their importance in income generation, employment and poverty
eradication. Although the Oil industry is highly specialised, it provides indirect investment
opportunities for SMEs who make up 80 percent of Uganda’s private sector. The opportunities
available however have not been sufficiently usurped by SMEs due to the information gap on
how to create business partnerships, requirements of the industry and actors in the industry. The
study therefore investigated key actors in the Oil and Gas value chain, potential business
linkages between the existing large oil prospecting companies and SMEs and; factors that
influenced SME decisions and willingness to invest in the Oil and Gas value chain. A total of
220 registered SMEs were purposively selected from a cross section of sectors. Using the Logit
model, ten variables were regressed against the dependent variable “willingness to invest.” The
dependent variable was treated as a dichotomous variable taking on values 1= willingness to
invest and 0 = none willingness. The results of the study revealed that the main actors in the Oil
and Gas value chain were Trans-National Oil Companies, large foreign and domestic direct and
indirect service providers with minimal involvement of SMEs. Business linkages for SMEs and
TNCs existed at the vertical and horizontal levels but they were rather poor. Only 10 percent of
SMEs had permanent contractual terms to supply Oil companies. Mainstream activities at the
current infantry stage of the oil value chain such as exploration, surveying and drilling required
huge capital investments and were highly specialized which affected SME investment. SME
investment in the sector remains a challenge since most enterprises are fragmented, sole
proprietors, lacked capital and are unable to supply in bulk. SMEs lack the desired international
standards and certifications implying that they were not prequalified in the main stream
procurement criteria required by the oil companies. In addition is lack of information on
procedures for entering into contract agreements with the Oil companies, insufficient information
on oil developments, prospects and existing business opportunities. According to the Logit
model the strongest predictors of SME willingness to Invest (WTI) were having investment
capital, access to credit, information and owning fixed assets.
Key Words: SMEs, Oil and Gas, Value Chain

iii
Acknowledgements
The research team extends their appreciation to Trust Africa and International Development
Research Centre for the grant which facilitated the entire research study. We thank the UIA team
for providing technical advice, Government of Uganda for approving the study and the business
community for provided information during data collection and dissemination of the study
findings.

iv
Table of Contents
Abstract ......................................................................................................................................................... ii
Acknowledgements ...................................................................................................................................... iii
Table of Contents ......................................................................................................................................... iv
List of Acronyms ......................................................................................................................................... vi
List of Figures ............................................................................................................................................. vii
List of Tables .............................................................................................................................................. vii
1. Introduction ........................................................................................................................................... 8
1.1 Background ................................................................................................................................... 8
1.2 History of Uganda’s oil and prospects for investment growth in Uganda .................................... 9
1.3 Problem Statement ...................................................................................................................... 13
1.4 General Objective ....................................................................................................................... 13
1.4.1 Specific Objectives ................................................................................................................. 13
1.4.2 Research Questions ................................................................................................................. 14
1.5 Study Justification ....................................................................................................................... 14
2. Literature review ................................................................................................................................. 15
2.1 Introduction ................................................................................................................................. 15
2.2 SMEs Definitions ........................................................................................................................ 15
2.3 The Value Chain concept ............................................................................................................ 19
2.3.1 Applicability of value chain analysis to sector growth and industrial development ............... 22
2.3.2 The Oil and Gas Value chain, Actors and Opportunities ........................................................ 24
2.3.3 Current status of various segments of the Oil and Gas Value Chain in Uganda ..................... 27
2.4 SME Willingness to Invest in the Oil and Gas value chain ........................................................ 27
2.4.1 The concept Willingness to Invest (WTI) ............................................................................... 27
2.4.2 Factors likely to affect SME willingness to invest in development projects .......................... 28
2.5 Business Partnerships that would be created between SMEs, Transnational Corporations and
other actors in the Oil and Gas sector ..................................................................................................... 33
3. Methodology ....................................................................................................................................... 34
3.1 Introduction ................................................................................................................................. 34
3.2 Study Design and Scope ............................................................................................................. 34
3.3 Data collection, Processing and Analysis ................................................................................... 36
3.3.1 Sample Selection ..................................................................................................................... 36
3.3.2 Sample size ............................................................................................................................. 37
3.3.3 Methods of Data collection ..................................................................................................... 38
3.3.4 Data Processing and Analysis ................................................................................................. 38
v
3.3.5 Reliability and Validity measure ............................................................................................. 38
3.4 Study Limitations ........................................................................................................................ 41
4. Presentation and discussion of findings .............................................................................................. 42
4.1 Introduction ................................................................................................................................. 42
4.2 Actors in the Oil and Gas sector Value Chain ............................................................................ 42
4.2.1 Role of Government ................................................................................................................ 42
4.2.2 Private Sector .......................................................................................................................... 43
4.2.3 Role played by Other Actors ................................................................................................... 45
4.3 Factors that affect SMEs decisions and willingness to invest in oil and gas value chain ........... 47
4.3.1 SMEs Distribution and Economic Profiles ............................................................................. 47
4.3.2 Economic Profiles of the Studied SMEs ................................................................................. 49
4.3.3 Factors that determine SMEs willingness to invest ................................................................ 51
4.4 Current Partnerships between SMEs and TNCs ......................................................................... 57
4.4.1 Business Partnership Areas ..................................................................................................... 57
4.4.2 Potential investment opportunities for SMEs in the Oil and Gas Value Chain ...................... 58
4.5 Perceived expected benefits from Oil Trade in the studied districts ........................................... 59
5. Conclusions and recommendations ..................................................................................................... 60
5.1 Conclusions ................................................................................................................................. 60
5.2 Recommendations ....................................................................................................................... 61
5.2.1 Short term Recommendations ................................................................................................. 61
5.2.2 Medium Term Recommendations ........................................................................................... 63
5.2.3 Long Term Recommendation ................................................................................................. 63
References ................................................................................................................................................... 64
vi
List of Acronyms
BDS Business Development Services
BoU Bank of Uganda
ESCAP Economic and Social Commission for Asia and the Pacific
EU European Union
FGD Focus Group Discussion
GDP Gross Domestic Product
MDI Microfinance Deposit-Taking Institution
MEMD Ministry of Energy and Mineral Development
MFPED Ministry of Finance, Planning and Economic Development
NAADS National Agricultural Advisory Services
NDA National Drug Authority
NEMA National Environment Management Authority
OECD Organisation for Economic Co-Operation and Development
PPDA Public Procurement and Disposal of Public Assets Authority
PSFU Private Sector Foundation Uganda
SACCOS Savings and Credit Cooperative Organizations
SMEs Small and Medium Sized Enterprises
TNCs Transnational Corporations
UBOS Uganda Bureau of Statistics
UIA Uganda Investment Authority
UMA Uganda Manufacturers Association
UNBS Uganda National Bureau of Standards
UNCMP Uganda National Chamber of Mines and Petroleum
UNCTAD United Nations Conference on Trade and Development
UNIDO United Nations Industrial Development Organization
URA Uganda Revenue Authority
USAID United States Agency for International Development
USSIA Uganda Small Scale Industry Association
UWA Uganda Wildlife Authority
UWEAL Uganda Women Entrepreneurs ‘association Limited

vii
List of Figures
Figure 1: Petroleum Value Chain................................................................................................................ 25
Figure 2: Conceptualisation of SMEs’ willingness to invest in oil and gas sector in Uganda .................... 32
Figure 3: Map of the Albertine Graben ....................................................................................................... 35
Figure 4: Current actors in the Uganda oil and gas value chain and their interlinked relationships ........... 45
Figure 5: Services demanded in the Upstream Petroleum activities. Source: Tullow Oil Ltd, 2009.......... 58
List of Tables
Table 1: Definitions of SMEs in the East African Community (EAC) ....................................................... 17
Table 2: Distribution of the selected SME respondents by sector and district ........................................... 37
Table 3: Description of the variables and proxies used to measure willingness to invest in logit model ... 40
Table 4: Enterprise distribution per District ............................................................................................... 47
Table 5: Distribution of SMEs by Industry ................................................................................................. 48
Table 6: Profiles of the sampled SMEs ....................................................................................................... 50
Table 7: Association between Willingness to Invest and hypothesized internal and external factors Sector
(n=193) ........................................................................................................................................................ 52
Table 8: Estimation of determinants of SME willingness to invest in Oil and Gas sector in Uganda ........ 54
Table 9: SME responses on perceived investment hindering factors.......................................................... 56
Table 10: SME responses on willingness to partners with Oil Companies ................................................ 57
Table 11: Proposed SME Partnership Area by Industry ............................................................................. 58
Table 12: Local People’s Perceived Benefits from oil discovery and trade ............................................... 60
8
1. Introduction
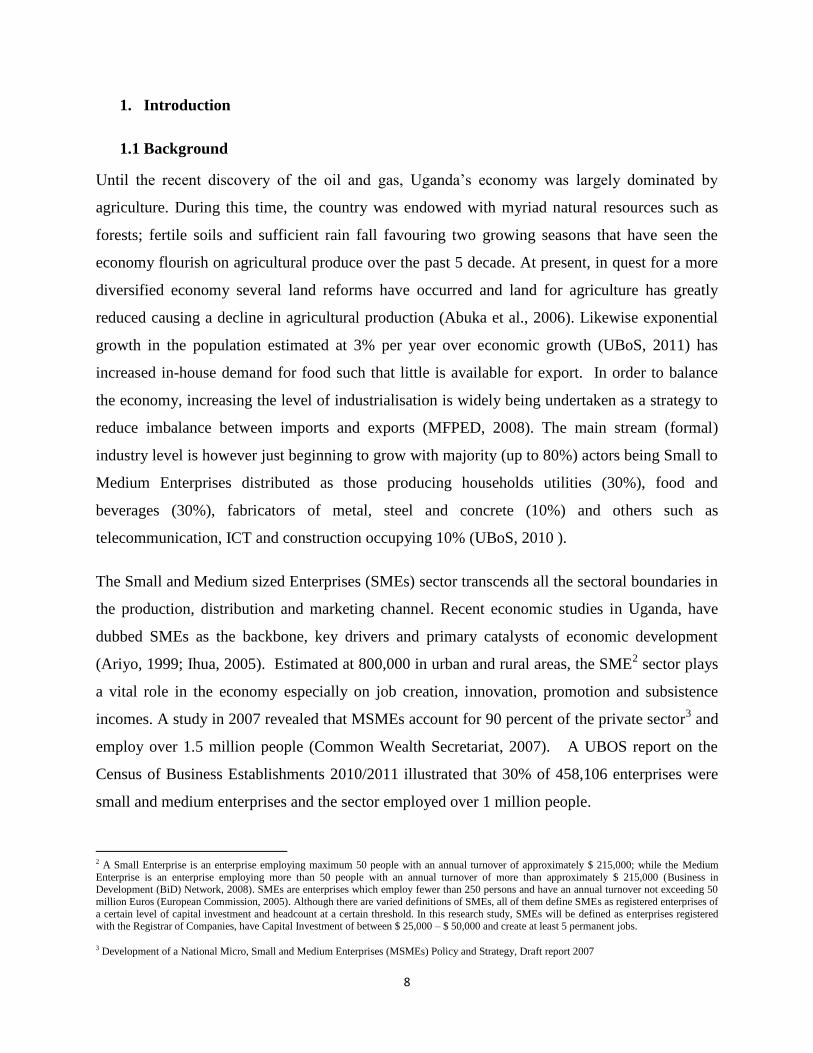
1.1 Background
Until the recent discovery of the oil and gas, Uganda’s economy was largely dominated by
agriculture. During this time, the country was endowed with myriad natural resources such as
forests; fertile soils and sufficient rain fall favouring two growing seasons that have seen the
economy flourish on agricultural produce over the past 5 decade. At present, in quest for a more
diversified economy several land reforms have occurred and land for agriculture has greatly
reduced causing a decline in agricultural production (Abuka et al., 2006). Likewise exponential
growth in the population estimated at 3% per year over economic growth (UBoS, 2011) has
increased in-house demand for food such that little is available for export. In order to balance
the economy, increasing the level of industrialisation is widely being undertaken as a strategy to
reduce imbalance between imports and exports (MFPED, 2008). The main stream (formal)
industry level is however just beginning to grow with majority (up to 80%) actors being Small to
Medium Enterprises distributed as those producing households utilities (30%), food and
beverages (30%), fabricators of metal, steel and concrete (10%) and others such as
telecommunication, ICT and construction occupying 10% (UBoS, 2010 ).
The Small and Medium sized Enterprises (SMEs) sector transcends all the sectoral boundaries in
the production, distribution and marketing channel. Recent economic studies in Uganda, have
dubbed SMEs as the backbone, key drivers and primary catalysts of economic development
(Ariyo, 1999; Ihua, 2005). Estimated at 800,000 in urban and rural areas, the SME2 sector plays
a vital role in the economy especially on job creation, innovation, promotion and subsistence
incomes. A study in 2007 revealed that MSMEs account for 90 percent of the private sector3 and
employ over 1.5 million people (Common Wealth Secretariat, 2007). A UBOS report on the
Census of Business Establishments 2010/2011 illustrated that 30% of 458,106 enterprises were
small and medium enterprises and the sector employed over 1 million people.
2 A Small Enterprise is an enterprise employing maximum 50 people with an annual turnover of approximately $ 215,000; while the Medium
Enterprise is an enterprise employing more than 50 people with an annual turnover of more than approximately $ 215,000 (Business in Development (BiD) Network, 2008). SMEs are enterprises which employ fewer than 250 persons and have an annual turnover not exceeding 50
million Euros (European Commission, 2005). Although there are varied definitions of SMEs, all of them define SMEs as registered enterprises of
a certain level of capital investment and headcount at a certain threshold. In this research study, SMEs will be defined as enterprises registered
with the Registrar of Companies, have Capital Investment of between $ 25,000 – $ 50,000 and create at least 5 permanent jobs.
3 Development of a National Micro, Small and Medium Enterprises (MSMEs) Policy and Strategy, Draft report 2007
9
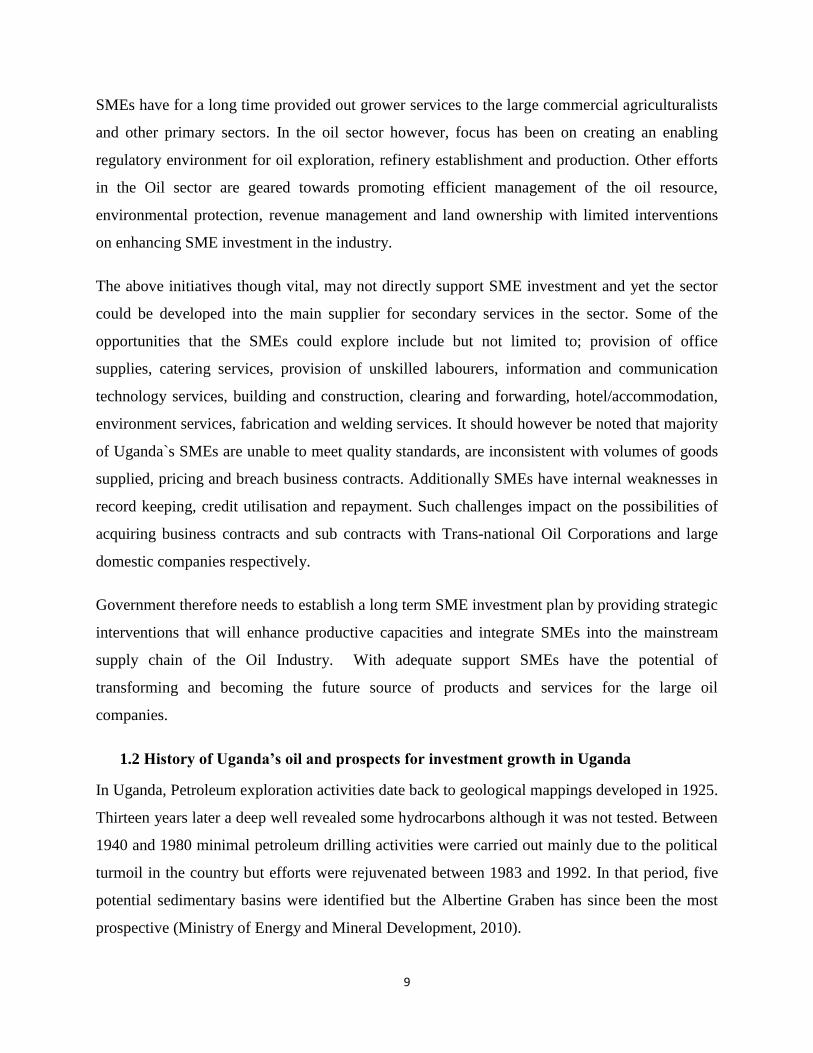
SMEs have for a long time provided out grower services to the large commercial agriculturalists
and other primary sectors. In the oil sector however, focus has been on creating an enabling
regulatory environment for oil exploration, refinery establishment and production. Other efforts
in the Oil sector are geared towards promoting efficient management of the oil resource,
environmental protection, revenue management and land ownership with limited interventions
on enhancing SME investment in the industry.
The above initiatives though vital, may not directly support SME investment and yet the sector
could be developed into the main supplier for secondary services in the sector. Some of the
opportunities that the SMEs could explore include but not limited to; provision of office
supplies, catering services, provision of unskilled labourers, information and communication
technology services, building and construction, clearing and forwarding, hotel/accommodation,
environment services, fabrication and welding services. It should however be noted that majority
of Uganda`s SMEs are unable to meet quality standards, are inconsistent with volumes of goods
supplied, pricing and breach business contracts. Additionally SMEs have internal weaknesses in
record keeping, credit utilisation and repayment. Such challenges impact on the possibilities of
acquiring business contracts and sub contracts with Trans-national Oil Corporations and large
domestic companies respectively.
Government therefore needs to establish a long term SME investment plan by providing strategic
interventions that will enhance productive capacities and integrate SMEs into the mainstream
supply chain of the Oil Industry. With adequate support SMEs have the potential of
transforming and becoming the future source of products and services for the large oil
companies.
1.2 History of Uganda’s oil and prospects for investment growth in Uganda
In Uganda, Petroleum exploration activities date back to geological mappings developed in 1925.
Thirteen years later a deep well revealed some hydrocarbons although it was not tested. Between
1940 and 1980 minimal petroleum drilling activities were carried out mainly due to the political
turmoil in the country but efforts were rejuvenated between 1983 and 1992. In that period, five
potential sedimentary basins were identified but the Albertine Graben has since been the most
prospective (Ministry of Energy and Mineral Development, 2010).
10
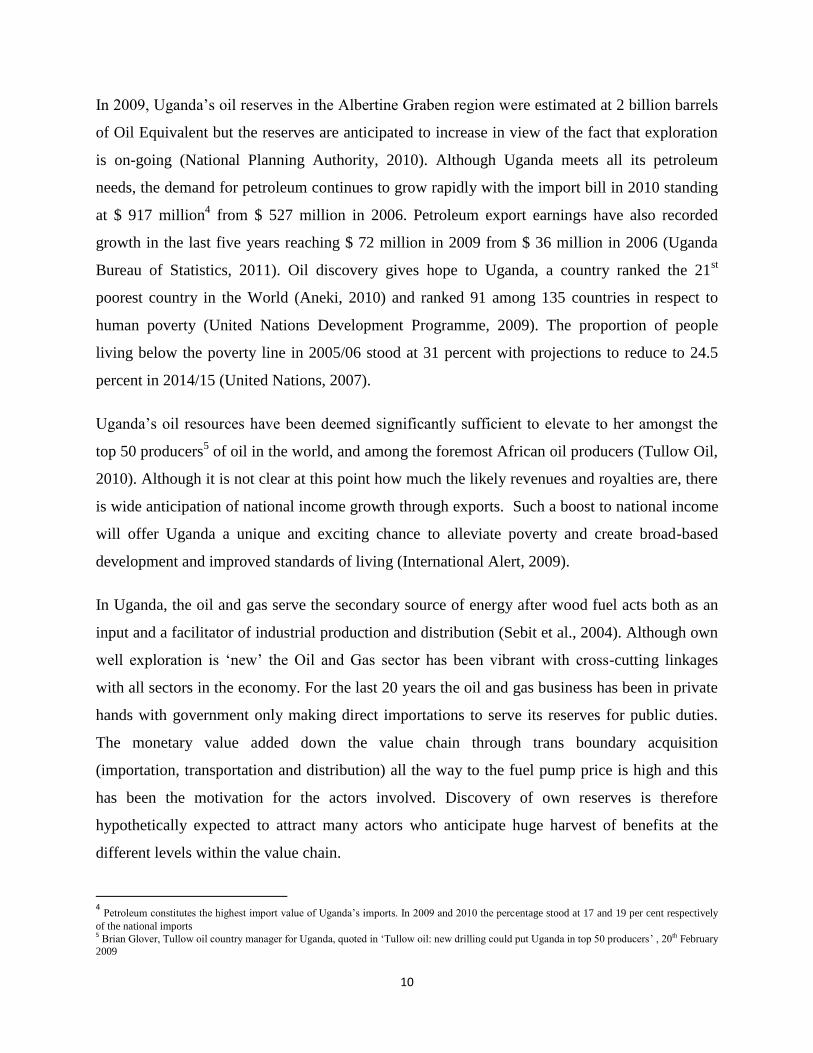
In 2009, Uganda’s oil reserves in the Albertine Graben region were estimated at 2 billion barrels
of Oil Equivalent but the reserves are anticipated to increase in view of the fact that exploration
is on-going (National Planning Authority, 2010). Although Uganda meets all its petroleum
needs, the demand for petroleum continues to grow rapidly with the import bill in 2010 standing
at $ 917 million4 from $ 527 million in 2006. Petroleum export earnings have also recorded
growth in the last five years reaching $ 72 million in 2009 from $ 36 million in 2006 (Uganda
Bureau of Statistics, 2011). Oil discovery gives hope to Uganda, a country ranked the 21st
poorest country in the World (Aneki, 2010) and ranked 91 among 135 countries in respect to
human poverty (United Nations Development Programme, 2009). The proportion of people
living below the poverty line in 2005/06 stood at 31 percent with projections to reduce to 24.5
percent in 2014/15 (United Nations, 2007).
Uganda’s oil resources have been deemed significantly sufficient to elevate to her amongst the
top 50 producers5 of oil in the world, and among the foremost African oil producers (Tullow Oil,
2010). Although it is not clear at this point how much the likely revenues and royalties are, there
is wide anticipation of national income growth through exports. Such a boost to national income
will offer Uganda a unique and exciting chance to alleviate poverty and create broad-based
development and improved standards of living (International Alert, 2009).
In Uganda, the oil and gas serve the secondary source of energy after wood fuel acts both as an
input and a facilitator of industrial production and distribution (Sebit et al., 2004). Although own
well exploration is ‘new’ the Oil and Gas sector has been vibrant with cross-cutting linkages
with all sectors in the economy. For the last 20 years the oil and gas business has been in private
hands with government only making direct importations to serve its reserves for public duties.
The monetary value added down the value chain through trans boundary acquisition
(importation, transportation and distribution) all the way to the fuel pump price is high and this
has been the motivation for the actors involved. Discovery of own reserves is therefore
hypothetically expected to attract many actors who anticipate huge harvest of benefits at the
different levels within the value chain.
4 Petroleum constitutes the highest import value of Uganda’s imports. In 2009 and 2010 the percentage stood at 17 and 19 per cent respectively
of the national imports 5 Brian Glover, Tullow oil country manager for Uganda, quoted in ‘Tullow oil: new drilling could put Uganda in top 50 producers’ , 20th February
2009

11
The concept of value chain and value chain analysis in marketing literature was first coined by
(Porter, 1985). Porter postulates that a value chain is an interconnection of activities that create
value for a firm operating in a specific industry. He further elaborates that value is added through
every activity at each stage a product passes through right from idea conception to distribution to
the final consumer. The value chain analysis then becomes a framework to track value through
the different activities, identifying opportunities for more value creation and constraints involved
(Porter, 1980, 1985). According to World Bank (2007; 2009), the oil industry has three levels:
upstream, midstream, and downstream and these also encompass the main segments in the
supply chain. The upstream level includes the exploration, drilling, and production of crude oil
and this is usually occupied by strategic managers of the value chain. The midstream level
includes the refining, transportation and trading of crude oil to refineries. The downstream level
includes the storage of crude oil, refining of crude oil into finished product, distribution and
marketing of oil to wholesalers and retailers (World Bank, 2007).
The value chain approach is a must start point to offer a meaningful alternative to valuate private
or public companies when there is a lack of publically known data from direct competition or
where the subject company is compared with, for example, a known downstream industry to
have a good feel of its value by building useful correlations with its downstream companies
which is a typical case for new producers (Humphrey and Schmitz, 2002). For Uganda’s case,
ongoing petroleum operations is opening up various business opportunities in the upstream and
mid-stream these are expected to expand as the oil and gas sector grows. The huge business
potential in the sector has consequently begun attracting substantial Foreign Direct Investments
from about $ 46 million in 2006 to $ 436 million in 2009. In 2011 for instance investments in
seismic and drilling subsectors alone were over $ 900 million (Byaruhanga et al., 2011).
At a local scale, the sector presents numerous investment prospects especially as more and more
wells are discovered implying that the value chain is expected to grow to all three functioning
levels. From literature cases in older oil producing economies such as Niger, Angola, Nigeria,
Libya and Sudan some of the outstanding opportunities are expect to stem from; "primary
activities" which include: inbound logistics such as, exploration activities, initial civil and well
constructions, test production, research and development. Outbound logistics such as
transportation of oil, gas and petrochemicals, marketing and sales (demand creation), and

12
demanded services such as engineering works, maintenance and repairs. Support activities are
yet another avenue for investment which includes: administration, infrastructure management,
human resource management, technology (R&D), and procurement (Byaruhanga et al., 2011).
Given that oil and gas industry is still at the infancy level in Uganda, two big questions arise (i)
who takes what amid heavy competition to supply and (ii) what does it require to competitively
join the value chain? Several literature sources affirm the fact that oil and gas is a capital
intensive venture therefore “supreme value achievable” in value chain tends to accrue to firms
with the ability to invest in the upstream and mid-stream (Warner, 2007; Gereffi, 2003;
Humphrey and Schmitz, 2002). World over, the oil and gas sector is dominated by large
integrated companies. In most cases where the large enterprises are local they are either publicly
or nationally owned for this is the only way they can square up to the fierce competition that
defines the industry. For example the largest oil company in the world, Saudi Aramco, is
nationally owned and is Saudi Arabia’s primary source of income (UNCTAD, 2001). There are
six major publicly owned integrated public companies: ExxonMobil, Royal Dutch Shell, BP,
Chevron, Total S.A., and ConocoPhillips that are referred to as the “super majors” which
monopolize the market (UNCTAD, 2001).
The recent trend in the industry is for companies to merge to expand their upstream levels
instead of their downstream levels. Increasingly for well-developed value chains, there is less
emphasis on increasing refinery capacity, and Multi-National Companies (MNCs) are now
focused more on the exploration and production segments of the value chain (UNIDO, 2004).
Due to over dominance of MNCs in the value chain, there is growing advocacy that a big portion
of oil income should accrue to the producer country (World Bank, 2007). In many African oil
producing states a few local firms have fully competitive capacity to dominate the value chain. A
recent study in Nigeria by Ugwushi (2010) reveals that although the Oil and Gas industry has
served as the main stay for over 50 years, a very little proportion of the accruable profit is
available to indigenous oil firms especially SMEs. The imbalance according to Aneke (2002) and
Ariweriokuma (2009) is explained by internal constraints such as lack of requisite skills,
technical expertise and high value investment capacity. In a similar study, Heum et al. (2003)
summarized the constraints of local SMEs to competitively participate in the oil and gas value
chain as having low technological capacity, lack of funding from financial institutions,

13
inadequate and incoherent policies/legislation; inadequate infrastructure; unfavorable business
climate; and lack of partnerships between indigenous contractors and technically competent
foreign companies. The same can be feared for Ugandan local players especially the SMEs. This
is because the oil and gas sector is new to majority of them and their potential needs to be
ascertained for strategic positioning as potential beneficiaries to the available opportunities.
1.3 Problem Statement
Ever since oil exploration was commissioned to start in Uganda, Government has undertaken
several initiatives to create an enabling investment environment in the sector. Some of the
commendable efforts include improvement of transport infrastructure connecting to exploration
sites, developing the National Oil and Gas Policy, development of local content document,
Refinery Bill and the Petroleum Bill. What is lacking however, is how exactly to encourage local
SME firms that form the main business arm of the economy to competitively strategise and
participate in the oil and gas value chain. In particular a gap exists on practically available
opportunities for SMEs to participate in the value chain with an advantage over foreign
competition, the constraints and challenges that may deter or lessen their competitive advantage
and better still how these constraints and challenges can be identified and converted into
opportunities to realise both the local content and Oil and Gas policy objectives. In light of the
above, this study sought to find out the current activities and main actors in within the oil and gas
sector, emerging potential opportunities for SMEs, SME decisions and willingness to invest in
the opportunities areas and likely constraints and challenges that may deter them from venturing
into the value chain.
1.4 General Objective
The general purpose of the study was to identify opportunities in the oil and gas value chain to
enhance increased SME investment in the sector.
1.4.1 Specific Objectives
To find out present actors in the Oil and Gas sector value chain;
To determine factors likely to influence SME decisions and willingness to invest in the Oil
and Gas value chain;

14
To find out business partnerships that would be created between SMEs, Trans National
Corporations and other actors in the Oil and Gas sector;
To propose actions to address the constraints hindering SMEs from exploiting the identified
opportunities in the Oil and Gas Sector.
1.4.2 Research Questions
The research questions that guided this study were to determine:
The potential actors in the upstream, mid-stream and downstream stages of the oil and gas
value chain.
The factors that would influence SME decisions and willingness to invest in the oil and gas
sector.
The likely business partnerships with Trans National Corporations and Government in the
Oil and Gas sector.
The policy and non-policy actions to address the challenges in the sector.
1.5 Study Justification
In as much as a lot has been written about SMEs economic significance in Uganda, there have
been few attempts to actually quantify their investment potential, competitive advantage,
opportunities and prevailing constraints and barriers to invest in high capital value chains such as
the oil and gas. Our opinion of this is that in pursuit of a winning strategy of realizing
specifications of the local content for Uganda, it is worth starting with an understanding of the
role that SMEs play in the local economy. The fact that government policies and actions have
been consistent with the overall objective of establishing the private sector as the provider of
employment, it is important to fully understand the determinants of private sector investment. It
is further important to analyze the institutional and regulatory frameworks as well as the firm-
level factors that have an impact on investment in greater detail and to relate them to firm
decisions on investment, growth and expansion. This study is intended to fill a gap about the
SMEs potential and willingness to invest in the oil and gas sector, highlighting opportunities
were competitive advantage can be built including the outstanding constraints to participation
and investment in the oil and gas value chain.

15
2. Literature review
2.1 Introduction
This section presents a review of literature focusing on the concept of value chain, definition and
characteristics of SMEs, conceptualization of Willingness To Invest (WTI), factors that affect
firms’ willingness to invest in heavy capital and high risk development projects. Further analysis
was done to understand the oil and gas value chain, SME participation in the oil and gas value
chain, reported constraints for SME investment. Finally the review extends to revealing potential
partnerships between TNCs and SMEs that can catalyze SMEs participation in the Oil and Gas
value chain.
2.2 SMEs Definitions
On a global scale small and medium-sized enterprises (SMEs) are a very heterogeneous group.
SMEs cut across several sectors and activities, ranging from the single artisan producing
agricultural implements for the village market, the coffee shop at the corner, the internet café in a
small town to a small sophisticated engineering or software firm selling in overseas markets and
a medium-sized automotive parts manufacturer selling to multinational automakers in the
domestic and foreign markets. The owners may or may not be poor; the firms operate in very
different markets (urban, rural, local, national, regional and international); embody different
levels of skills, capital, sophistication and growth orientation, and may be in the formal or the
informal economy (UNIDO, 2004).
Statistical definitions of what constitutes an SME vary quite widely from country to country and
even within single countries, depending on the business sector concerned (OECD, 1997). Thus,
there is no universal determinant or criteria of defining an SME. Much depends on the character
of the relevant host country, and the profile of its own particular corporate sector, from which a
relative measure of an SME is then typically made, sometimes on a rather arbitrary basis. Some
countries just use the number of employees as the sole criteria for determining whether a
business is an SME or not. Other countries use this same criterion, plus an additional criterion
based on either the value of the firm’s assets or the size of revenues, typically denominated in the
local currency. For instance considering the European Union (EU) and the Organisation for
Economic Co-operation and Development (OECD), transition and developing countries set the
16
upper limit of number of employees in the SMEs between 200-250, with a few exceptions such
as Japan (300 employees) and the USA (500 employees) ( OECD, 2004). Another classifying
variable has been level of investments measurable in monetary terms. Using both head staff
count and level of capital investment, the EU classifies SMEs as enterprises which employ fewer
than 250 persons and which have an annual turnover not exceeding 50 million euro, and/or an
annual balance sheet total not exceeding 43 million euro (EU commission, 2003).
The diverse definitions criteria can sometimes be conflicting and confusing due to the overlap in
what they should differently define. For instance on the basis of employment many enterprises
especially in Asia and Africa due to cheap labour may employ over 200 persons whereas
operating below 10million euro. In such a case a regional definition can be more helpful than a
universal one because what qualifies in one region or country such as Nepal and India may be
different from what an SME is in the United Kingdom, United States of America or Germany
because of differences in market economies.
Divisions in SMEs definitions are still evident even with smaller groups of neighboring
economies like the recently formed East African community countries. Table 1 shows SME
definitions across members of the EAC based on number of employees and level of investment.
Since this is about SMEs in Uganda, we restricted ourselves to the recent definition by Ministry
of Finance, Planning and Economic Development, Ministry of Trade, Industry and Cooperatives
and Uganda Investment Authority. The three bodies responsible for investment and trade in
Uganda unanimously define a “Small Enterprise” as an enterprise employing maximum 50
people; with annual turnover of a maximum Ugandan Shillings 360 million and total assets of
maximum Ugandan Shillings 360 million. A Medium Enterprise is defined as an enterprise
employing more than 50 people; annual sales/revenue turnover of more than Ugandan Shillings
360 million and total assets of more than Ugandan Shillings 360 million.

17
Table 1: Definitions of SMEs in the East African Community (EAC)
Criteria Category Kenya Tanzania Uganda Rwanda
No. of
employees
Small 11 - 50 5 - 49 Max. of 50 3 - 30
Medium 51 - 100 50 - 99 Over 50 30 - 100
Capital
Investment
Small - 5million - 200
million shillings
Maximum of
360 million
shillings.
500,000 - 15
million Francs
Medium - 200 -800 million
shillings
Over 360
million
Over 15 million to
75 million Francs
Source: Uganda Investment Authority, 2011
Economic significance, Characteristics and challenges of SMEs in Uganda
According to the National Micro, Small and Medium Enterprises (MSME) Policy and Strategy
of Uganda (MFPED, 2007), the MSME sector contributes 20 percent of the national GDP,
provides employment to approximately 1.5 million people at an employment growth of 20
percent per annum in the sector. In comparison with developed economies such as Germany,
SMES generate 70 percent of employment and 57 percent of corporate value added, in China,
SMEs generate 73 percent of employment and contribute 60 percent of industrial Gross Product
United Nations Conference on Trade and Development, (2003). In Uganda, majority SMEs are
informal, small and highly concentrated in urban and peri-urban centers (Kasekende and
Opondo, 2003).
Given their size and informality, these entities face multi-dimensional challenges. In the past 10-
15 years, SMEs have remained informal due to several barriers to trade such as formal
registration, high technical standards qualifications, high taxes; poor transport bottlenecks
especially the rural based, poor communication infrastructure and limited energy supply. This
has bred a number of constraints, which include the difficulty in employing competent people
with techniques in financial management because of the salaries such people would demand,
financial problems arising from late payments by debtors, and inability to raise own finance and
access financial services from formal sources. This category of enterprises usually looks to the
banking sector and other financial intermediaries for instruments to finance working capital and
to provide credit for short-term liquidity management. They, however, often fail to access the
financial resources in the required amounts because banks evaluate them on the basis of a strict

18
checklist which includes high value of collateral, audited books of accounts, articles of business
registration and insurance bonds.
The challenges continue to mount as trade barriers for foreign medium and large-scale firms melt
away and both transport and communication costs fall. To remain viable, SMEs are required to
add more value to their products to stay ahead and compete with lower cost rivals. Consumer
demand is also changing rapidly as incomes rise and choices increase when imported products
become easily available in domestic markets. Likewise as Foreign Direct Investment (FDI)
increases, technological advances are creating new products and transforming almost every stage
of business from production to marketing, sourcing and logistics. New rules of business are
being introduced through the multilateral trade system and increasingly foreign buyers require
SMEs to comply with higher technical (such as International Organization for Standardization),
environmental and labor standards in domestic and export markets. With a now more liberalized
economy, many SMEs especially those that have failed to re-orient themselves to match the high
quality standards required by fast growing will be eroded. Perhaps this explains the short life
span of many SMEs (Reinikka and Svensson, 2001; Hatega, 2006).
The other major challenge that cuts across a broad spectrum of SMEs in Uganda is the
inadequate innovation and product differentiation to match or better still avoid foreign
competition. According to Darku (2001), 60% of the SMEs do not invest in human resource
development, but rather employ semi-skilled labour with a wish to cut the wage bill. Because of
this, businesses remain fragmented and stunted due to lack of innovativeness which according to
Manu (1998) is the main driver of enterprise growth and a genesis of new products and
specialized market niches. Lack of substantial innovativeness coupled in individualist approach
to business and operating informally has broken down lines of communication and cooperation
undermining their capability to attract financing (Kasekende and Opondo, 2003).
From this background most SMEs are characterized by; use of family and unpaid labor,
flexibility, allowing people to enter and exit economic activities in response to market demand;
Simple and sometimes precarious facilities; ability to improvise products from scrap materials; a
willingness to operate businesses at times and locations convenient to customers and a tendency
19
to locate smaller markets, out of the reach of the larger enterprises (Uganda Investment
Authority, 2011).
2.3 The Value Chain concept
Value chain as defined by Porter (1980, 1985), is the sequential set of primary and support
activities that an enterprise performs to turn inputs into value-added outputs for its external
customers According to Porter, value chains connect organizations, resources, and knowledge
streams to create and deliver value to end customers. It can also be conceptualized as an
aggregation of value systems (Kula et al., 2006; Simchi et al 2003). Value systems integrate
supply chain activities, from determination of customer needs through product/service
development, production/operations and distribution, including first, second and third-tier
suppliers.
Over the last two decades value chain studies have been popular both in economics and strategic
management fields. The proponents argue that value chain management provides competitive
advance over competitors because its power to ensure value (Kula et al., 2006). The secret of
value chain management lies in separation, harnessing and optimization of the primary and
support services. The primary activities include; inbound logistics, operations, out bound
logistics, marketing and sales. Inbound logistics refers to goods being obtained from the
organization’s suppliers ready to be used for producing the end product. Operations depict
securing the raw materials and goods and converting them into final products. Value is added to
the product at this stage as it moves through the production line. Outbound logistics refers to the
mobility of products from source distributed to distribution centers, wholesalers, retailers or
customers. Marketing and Sales provides a means that the product is delivered to correct
customer group. The marketing mix is used to establish an effective strategy; any competitive
advantage is clearly communicated to the target group by the use of the promotional mix (Porter,
1985, 1990).
The support activities on other hand assist the primary activities in helping the organization
achieve its competitive advantage. They include; procurement, technology development and
human resource management. According to Badrinath et al., (1997), efficient procurement
ensures the department or firm gets the best source raw materials for the organization and obtains
20
the best price for doing so. The nature of technology acquired is key to obtaining a competitive
advantage within the organization. This is very important in today’s technological driven
environment. Technology can be used in production to reduce cost thus add value, or in research
and development to develop new products, or via the use of the internet so customers have
access to online facilities (USAID, 2006; 2009). On the other hand, the organization will have to
recruit, train and develop the correct people for the organization if they are to succeed in their
objectives.
In large value chains such as the oil, gas and petrochemical chain, Porter (1985) further
postulates that active participation can only be quantifiable in terms of firm ability within the
giant industry to supply its buyers with a product or service that meets all the buyer’s
requirements. Gereffi, (2003) then suggests that this largely depends on the ability of the value
chain to deliver information, skills, resources and benefits to all participants in the chain. From
his argument, an implication is derived that where the value chain entails a big product portfolio
as it is the case for oil and gas a single firm may not be to supply everything. In support (Kula et
al.,2006) suggests smaller firms such as SMEs to be integrated in large global value chains they
need to link up vertically or horizontally, and they all must cooperate to get a product from
inception to the final consumer.
According to Kula et al., (2006) buying and selling relationships link firms vertically, and
through these links firms engage in market and non-market interactions while performing
different functions (i.e., operating at different levels) in the value chain. In addition to buying
and selling, vertical linkages allow firms to exchange knowledge, information and technical,
financial and business services. These non-financial transactions are important elements of
buyer-seller relationships and are central to sustained value chain competitiveness (Simchi et al.,
2003). In Uganda, Micro, Small and Medium Enterprises (MSMEs) are vertically linked to a
varied range of market actors including wholesalers, retailers, exporters, traders, middlemen,
input dealers, suppliers, service providers and others.
The nature of vertical linkages including the volume and quality of information and services
disseminated often defines and determines the benefit distribution along the chain and creates
incentives, or constraints, for firm-level upgrading, defined as innovation to increase value added

21
Moreover, the efficiency of the transactions between vertically linked firms in a value chain
affects the competitiveness of the entire industry (Hatega, 2006). For the case of Ugandan
SMEs, their integration into the oil gas and gas value chain raises several questions such as;
what are the opportunities (accruing value) for them in the chain?, what are the potential
constraints for their participation? And what needs to be done to convert constraints to favour
environment that permits maximization of opportunities?
Value Chain Analysis (VCA) is a working model that kind of audits value chains. It facilitates a
process for understanding the systemic factors and conditions under which a value chain and its
firms can achieve higher levels of performance (Gereffi, 2003; Humphrey and Schmitz, 2002).
Using the USAID model “using value chains as a means for fostering sector growth and
reducing poverty” which we assume is the case for Uganda, the analysis should focus on
identifying ways to contribute to; i) improving the competitiveness of value chains with large
numbers of small firms, and ii) expanding the depth and breadth of benefits generated, iii)
understanding all the major constraints to improved performance or competitiveness. USAID
further recommends a strategic approach that focuses on understanding end-market opportunities
and the constraints to these opportunities such an approach obviates the need to understand all
constraints and narrows the scope of the analysis to "constraints to opportunities’’ which also
forms a basis for our study. The results of the analysis offer industry stakeholders a vision for
value chain competitiveness and form the basis for a competitiveness strategy—a plan for
eliminating constraints to end market opportunities and advancing sustainable competitiveness
(USAID, 2010).
There is currently a big argument as whether the small firms have a significant place in the
global value chains (OECD, 2004; UNIDO, 2006; World Bank 2004). This is because in many
value chains, powerful actors have the resources and influence, to define and impose the
parameters of commercial transactions in their supply chain these actors are known as lead firms.
They set product and process standards across the value chain and act as coordinators and/or
integrators of the value chain. The control that lead firms wield may be based on ownership of
well-established brand names, proprietary technology, monopolistic or oligopolistic power, or
exclusive information about different product markets (Humphrey and Schmitz, 2002).
Furthermore, lead firms can exert substantial influence and, more often than not, drive the

22
upgrading decisions and create incentives and punitive systems for firms lower in the value
chain. They also take lead in catalyzing changes in a value chain by ensuring that knowledge and
information move down the chain (Gereffi, 2003).
2.3.1 Applicability of value chain analysis to sector growth and industrial
development
The value chain provides an important construct that facilitates the understanding of the
distribution of returns from the different activities of the chain (Kaplinsky and Morris, 2001). By
breaking a chain into its constituent parts of design, supply, production, and distribution, one can
better understand its structure and functioning and perhaps more importantly, assess its scope for
systemic competitiveness (Porter, 1985). Value chain analysis, therefore, is an effective means of
conceptualizing the forms that functional integration takes in the production process, because it
shifts the focus from production alone to the varied set of activities that make up the chain.
Value chain analysis is an important tool for strategic management and when competition is
intense, companies must manage activities and costs strategically, or they will lose their
competitive advantage. Value chain analysis can be used for determining at what point costs can
be reduced or value added in the organization's value chain. Value chain analysis also highlights
the issues of chain coordination or governance. The pattern of direct and indirect control in a
value chain is called its governance (McCormick and Schmitz, 2001). Chains vary in the degree
of overall control that is exerted, in the location of control within the chain, and in how much of
it is concentrated on a single firm (Gereffi et al, 2001).
According to Kula et al., (2006) overall control can be almost non-existent, with interactions
being mainly driven by market forces, or a chain can be strongly or weakly directed by one or
more of its actors. The concept of governance is most meaningful in the latter case. In these
cases some firms directly or indirectly influence the organization of the chain’s production,
logistics, and marketing systems. Through the governance structures that they create, these firms
can take decisions that have consequences for others’ access to markets and the range of
activities that they are able to undertake. The influence can extend from defining the products to
specifying the processes and standards to be used in production.

23
Governance is sometimes exercised directly through the control of key resources and decisions
about entry and exit and monitoring of suppliers (Kula et al., 2006). Governance may also be
exercised in more subtle ways, such as providing technical support to enable producers to
achieve the required performance. The parameters defining what is to be done at any time are
product definition, how it is to be produced (production process), when it is to be produced and
how much is to be produced (Humphrey and Schmitz, 2001). The way a chain is governed may
determine such competitive factors as market access, fast track to acquisition of production
capabilities, distribution of gains and to funnel technology assistance.
Gereffi (1994, 2001) is credited with identifying two main types of value chains: buyer-driven
and producer-driven. In the buyer-driven value chains, the buyer at the apex of the chain plays
the critical governing role. Labour-intensive industries common in least industrialized countries
are often buyer-driven. Examples include garments, processed fruits, and horticultural products
(Gereffi et al., 2001, Dolan and Tewari, 2001). In the producer-driven chains, producers with
critical technology play the main role of coordinating the various links and take the responsibility
of checking the efficiency of their suppliers and customers. Producer driven chains often have
significant foreign direct investment, and are more often capital and technology intensive
industries (Gereffi, 2001).
Value chain analysis incorporates both vertical and horizontal relations between different sectors,
underlining the necessity to approach the concept of competitiveness not solely on the basis of a
single economic sector, but more broadly focusing on whole set of relations this sector has with
other economic domains (Fries et al., 2004). These interrelations determine the position and
competitiveness of an entire cluster. The idea of a value chain becomes useful for analytical and
policy purposes, once we include three further features:
First, the activities are often carried out in different parts of the world, hence the global value
chain;
Second, some activities add more value and more lucrative than others (the policymakers’
concern is to help local enterprises to move into the lucrative activities);
Third, some actors in the chain have power over the others.

24
On the other hand, Systems are characterized by networks of production of strongly
interdependent firms linked to each other in a value adding production chain. The interactions
between different units depart more and more from the vertical structure, with horizontal
relations gaining ever-increasing importance. Thus, the approach can complement the value
chain analysis by:
Analyzing economic competitiveness as its scope is not limited to isolated intra oil and gas
industry relations alone, but also pays attention to relations with other sectors.
Analyzing innovation possibilities, as innovation is typically generated in a system of
comprehensive networks. Frequently, these networks have far-reaching access to a number of
actors across different sectors. Systems approach, by identifying the support connections
helps to establish sources for action without identifying priorities.
2.3.2 The Oil and Gas Value chain, Actors and Opportunities
In this subsection, we re-examine the status of different components of the oil and gas value
chain activities, the players/actors and nature of opportunities that SMEs can usurp through
active partnership with TNCs.
The analysis of the oil and gas industries illustrates that there are several players who work
collectively to transform the resource into useable form. According to the Petro Strategies
Incorporation, the oil and gas industry chain is composed of fully-integrated oil and gas
companies, independent oil and gas producers, refiners and marketers, pipeline operators, service
companies, trade associations and government agencies. (Petro Strategies. Inc., 2011).
Similar to the definition above, the World Bank (see Figure 1) suggests that the petroleum
industry is made up of several processes which collectively lead to the transformation of the
resource into the useable end-products. These processes according to the World Bank (2007;
2009) are linked with each other conceptually, contractually and/or physically, and these
linkages sometimes occur within or across individual firms, and within or across national
boundaries. The upstream level includes Research and Development (R&D), Strategic Planning
and Procurements for oil reserve exploration and development. The middle stream activities
largely include; Oil and Gas production, processing and refining into Petrochemicals, Natural
gas, including packaging and storage. The downstream activities are mainly dominated with

25
products (Oil, Gas and Petrochemicals) transportation, temporary storage, marketing and
distribution to the middle and final consumers.
Figure 1: Petroleum Value Chain
Source: World Bank, 2009
The Oil Value Chain in Uganda, opportunities and potential actors using the Work Bank Model,
have been summarized as below;
1. Upstream: There are quite a number of auxiliary services demanded at this level which
include; seismic surveys, well drilling, equipment supply and engineering works (World
Bank, 2009; Tullow Oil Ltd- Local Content Report, 2009)
2. Opportunity: Supply of services such as contracting engineering projects, consultancy
services and provision of key equipment.
3. Potential players: National engineering/construction and consultancy firms, individuals
who are petroleum experts and skilled professionals.
4. Nature of the opportunity: High quality is demanded, high professional skills and high
capital (finance) requirements.

26
5. Middle stream: Auxiliary activities include; transportation infrastructure e.g. bulk
haulage and storage of crude oil, oil pipe line networks, including the links between
production and processing facilities, oil refining, gas and petrochemical processing.
6. Potential opportunities: oil refining6, gas and petrochemical processing, transportation
and storage services.
7. Nature of the opportunity: In many Oil and Gas producing nations, refining has been
highly developed into a clinical business in which profitability is sensitive to marginal
changes in product quality and quantity supplied. To this end, oil refining has become
globally competitive implying high initial upfront investments in machinery and
technology. The high cost in R&D, plant and machinery, legal requirements and quality
certification present a huge barrier to entry for the small actors.
8. Potential players: Given its complexity, many local players may not have the potential,
however with strategic partnership with TNCs and Government support especially on
infrastructural development some companies may participate. But by far we expect this
stage to be dominated by bilateral trade TNCs.
9. Down Stream: It is at this value chain level that we envisage more local involvement by
the domestic firms and capable business individuals particularly SMEs. The wide range
of activities include; transportation, marketing and distribution to wholesalers, retailers
and directly to industrial, institutional and individual final consumers.
10. Potential opportunities are enormous – Transportation of fuel oil, kerosene and
petrochemicals, direct trade in form of wholesale and retail of fuel oil, gas and
petrochemicals, direction and marketing as distributers, bulk suppliers and brokering of
fuel oil, kerosene, LPG, fuel gas, gasoline and many other petrochemicals.
11. Potential players: Majority SMEs such as local companies involved in marketing, fuel
retailers (local fuel and stations), automobile companies, general traders and suppliers.
We note that as one goes down the value chain, massive participation is encouraged due to
lessening of the initial capital investment and other entry barriers.
6 Oil refining is defined as the process of separating the hydrocarbons molecules present in the crude oil and their
conversion into more valuable finished petroleum products major; product categories being fuel oil, gas oil,
jet/kerosene, gasoline, and naphtha and Liquefied Petroleum Gas (LPG).
27
2.3.3 Current status of various segments of the Oil and Gas Value Chain in Uganda
Notwithstanding the potential (prospective) opportunities presented in (2.2.2), above, apparently,
the oil value chain in Uganda is still at the infantry stage, that is, Oil Reserve Development and
Exploration Phase. At this stage, major business taking place is between the large oil companies
such as Tullow Oil, Neptune and Dominion as well as Government through its functional arms
such as Uganda Revenue Authority, Ministry of Finance, Planning and Economic Development,
Ministry of Energy and Mineral Development, Uganda Investment Authority, Uganda National
Bureau of Standards, National Environment Management Authority, Ministry of Trade, Industry
and Cooperatives and Ministry of Tourism and Wildlife. There is limited involvement of the
private sector that is largely dominated by large foreign and domestic service providers/suppliers
and logistics corporations. Also informally, some local SMEs located in the studied districts
excluding Kampala are indirectly (not under permanent contracts) involved in supplying a wide
range of boundary services from causal labour to food stuffs and utility merchandise. Most
services were mainly provided by the medium sized enterprises located in Kampala.
Conclusion: Whether the value chain will develop to the level depicted by the World Bank will
depend on factors such as;
1. The quantity and quality of the resource;
2. Commitment of government (custodian), mainly in terms of putting in place favorable
investment climate, and other stakeholders to invest and develop the oil and gas industry.
2.4 SME Willingness to Invest in the Oil and Gas value chain
2.4.1 The concept Willingness to Invest (WTI)
With the market economies largely becoming integrated globally, research is hatching several
advances in technology, redefining business environment and business decisions. Willingness to
Invest (WTI) has been a central concept in macroeconomics literature over the last two decades
(Abuka et al., 2006; Nzomoi, 2007; Babu et al., 2009; IFPRI, 2009; Jaakko, 2012). Willingness
to Invest (WTI) has been largely defined as an individual or firm /industry’s willingness to
accept high business risk in the hopes the investments will increase in value (Sureth et al., 2005;
Abuka et al., 2006; Mburu et al., 2007). Several studies have been carried out on similar
28
concepts of “willing to pay” (WTP), “willingness to adopt” (WTA) in service and information
technology sectors (Banga et al., 2011; Verbic et al., 2005; Fujita et al., 2005). The willingness
to pay (WTP) is the maximum amount a person would be willing to pay, sacrifice or exchange in
order to receive a good, service or to avoid something undesired such as pollution (Verbic et al.,
2007). This term stands in contrast to willingness to accept payment (WTA), which is the
minimum amount an individual is willing to receive to give up a good or to accept something
undesirable. Several methods have been developed to measure consumer willingness to pay or
accept. These methods can be differentiated by whether they measure consumers' hypothetical or
actual willingness to pay or accept and whether they measure consumer willingness to pay or
accept directly or indirectly.
Contingent valuation models have been most popular in surveys where a firm, individual or
group is asked directly to state how they would be willing to pay or accept on a specific actual or
hypothetical scenario (Verbic et al., 2007). The WTI model distinguishes itself with an extra
ability to incorporate both WTP and measurement risk and probing further into factors that may
affect willingness (Jaakko, 2012; Graham and Tu, 2003). The model establishes the relationship
between internal and external factors that influence SME willingness to invest. It further explains
how SMEs with a certain level of willingness to invest (WTI) decide whether to invest or not to
do so (IFPRI, 2009). The model has been successfully used by Castlepines Corporation, an
International investment Company dealing in a broad range of infrastructure assets and in India
to study the carbon credits for energy self-sufficiency in rural India (Babu et al., 2009).
2.4.2 Factors likely to affect SME willingness to invest in development projects
Several barriers have been advanced as limiting for SME growth, expansion and willingness to
adopt and take investment decisions in different business environments. In more general terms,
the factors have been broadly categorized as; internal and external constraints (Antonio and
(Rodolfo, 2005). The internal constraint are firm based factors such as size, age, investment
capital, formal registration, tax payments ability, sales volumes, access to markets, access to
credit finance (Abuka etal., 2006; Reinikka and Svensson, 2001). External factors can either
compound or modulate the effect of firm specific factors. These include; macroeconomic
stability (inflation and other monetary controls, cost of production and borrowing),
macroeconomic policies and regulations such as tax policies, business registration procedures,

29
pricing on inputs mechanisms, trade agreements, presence of enabling infrastructure such as
reliable energy sources, water sources, roads, communication networks and services (Reinikka
and Svensson (2001).
External factors usually affect predictability of the business environment. Business environment
predictability is a crucial factor determining business decisions (Aldaba, 2008). Non
predictability increases perceived risk and given the phenomena of long time capital
accumulation in Africa, not only SMEs, but also large firms, including foreign invested ones,
depend on the ability of government to implement sound and consistent macroeconomic policies
(Bigsten et al (1999). According to World Bank-World Invest Report(2004), issues like low
budget deficits, low inflation, and a stable and transparent currency regime, yielding competitive
exchange rates in an economy, help secure the minimum stability that businesses needs to make
sound business decisions. Shiffer and Weder (2001) confirmed through a worldwide survey10
that inflation affected SME growth more than larger enterprises and that exchange rates also
affected SMEs more, due to lower hedging opportunities available to smaller firms.
Several other studies have highlighted internal constraints that may affect SMEs decisions to
invest in any sector. For instance Antonio and Rodolfo (2005) highlights (i) high cost of labor
and power; (ii) lack of ICT applications; (iii) lack of locally sourced quality raw materials and
dependency on imported raw materials which leads to longer lead times; and (iv) lack of design
capabilities and minimal linkages between local designers and manufacturers. A study by
Fukumoto, (2004) revealed; lack of skilled labor, limited market access, lack of information on
market opportunities and insufficient technical training as major internal factors affect SMEs
growth and willingness to investment in higher value chains in Philippines. In Vietnam,
Singapore, Indonesia, India, and Eastern Europe SME studies have continued to highlight the
same major constraints that affect SME development such as access to finance, technology, and
skills along with information gaps and difficulties with product quality and marketing (FINEX
and ACERD, 2006; Tecson, 2004; Fukumoto, 2005). What comes out more clearly all these
studies is that the lack of access to financing is the most difficult constraint to SME growth and a
top determinant of their willingness to investment.
30
2.4.2.1 Factors anticipated to affect WTI for Ugandan SMEs
Bigsten et al (1999) argue that size may constrain investment with a smaller impact on large
firms. Reinikka and Svensson (2001) and Abuka et., (2006) confirm the effect of size on
investment in Uganda in addition to determining the effects of other factors such as age, location
and sector. In another recent study by Hatega, (2006) it is revealed that, SMEs in Uganda are
confronted by lack of adequate investment capital which compounds problems of supply chain
management from the sourcing of their raw materials to problems in processing, packaging, and
distribution. Kasekende and Opondo, (2003) in their study about SME financing in Uganda
highlight inadequate financing as the major aspect constraining SMEs growth and willingness to
invest. Their study findings point to issues such as inadequate working capital, insufficient
equity, difficulties of credit finding and expensive credit cost.
Preliminary reconnaissance during our study especially FGDs and personal interviews held with
district officials revealed high perceived risks to lack of information, erratic power supply, poor
work ethics, poor roads, land wrangles and political transparency. From entrepreneurialism point
of view to be vibrant in an economy, a willingness by individuals to take (calculated) business
risks must also be present. If the social stigma associated with business failure is perceived to be
too great, or the practical repercussions of business closure are too onerous (for example, if the
difficulty or cost of registering a company specifically to trade in oil and gas is too great), then
entrepreneurialism will not flourish easily. In addition, the right kinds of economic incentives
need to be in place to prompt potential entrepreneurs to take a leap into the unknown. If the
prospect of relatively substantial financial gain is a dim one, then the motivation to venture will
no doubt be constrained. We assume that perceived risk is sometime an information gap
problem. To this end we assessed the level of awareness of policy, regulation and rights of SMEs
in the Oil and Gas sector. In addition, we assessed awareness of possible business cooperation
and prospects for SMEs in the Oil and Gas sector.
The other over pronounced aspects from the preliminary FGDs and key informant interviewers
were perceived technical requirements such as formal registration and special fixed assets
ownership were perceived as potential barriers to SME willingness to invest in oil and gas sector
given the high quality of inter-linkages desired. We also incorporated the aspect investment
capital in our conceptual frame because it cannot be over emphasized than it is in literature
31
reviewed (e.g., Kasenkende and Opondo, 2003; Abuka et al., 2006). The country’s
underdeveloped financial markets represent a formidable barrier not just to the entry of new
enterprises but also to the growth prospects of small and medium sized firms. The absence of a
liquid and deep peso financial market contributes to the high cost of investment and makes it
more difficult for enterprises to expand. In the oil and gas business investment capital exerts
significant influence on the investment decision of intending to invest enterprises.
In this study we highly anticipated that predictability will much depend on micro and
macroeconomic stability and flow of macroeconomic information downstream to the potential
SMEs. We therefore set out to investigate flow of information about oil and gas investment
prospects form the TNCs to the potential SMEs and whether having (not) this information affects
willing to invest. We integrate possession, access and handling as important variables that affect
investment capital and in proxy SME willingness to invest. The details of the factors are
presented in Figure 2 below.

32
Figure 2: Conceptualisation of SMEs’ willingness to invest in oil and gas sector in Uganda
Source: Researchers
Key
H1, 2 & 3 = Hypothesis directions
From the figure above, we make three propositions;
H1.... that SME willingness to invest will depend on the firms characteristics such as size, capital,
years of operation (age of capital accumulation, sales volume, annual turnover and access to
credit)
H2 ....that SME willingness to invest is affected by the external factors such as cost and access to
Capital, Quality standards, Physical infrastructure, Reliability/access to Power, Availability of
information , competition from Transnational corporations in Oil Prospecting and Exploration
activities and Large Oil Importers and Distributors.
H2 H1
H3
SME internal factors
Capital base
Volumes purchased sales trends
Price trends
Current size of customers/customer base
Potential size of customers
Business Stability
SME external factors Cost and access to Capital
Quality standards
Physical infrastructure
Reliability/access to Power
Availability of information
Transnational corporations in Oil Prospecting and Exploration activities
Large Oil Importers and Distributors
Intervening variables:
Oil and Gas policy framework and petroleum legislations
Taxation policies and tax incentive regime on Oil operations
Inflation
Exchange rate
Procurement Regulations
Willingness of SMEs to invest in the Oil and
Gas sector
33
H3 ......that that SME willingness to invest is affected by other factors that define the investment
environment such as macroeconomic policies (inflation, exchange rates, petroleum legislation
etc) infrastructure.
2.5 Business Partnerships that would be created between SMEs, Transnational
Corporations and other actors in the Oil and Gas sector
Several studies have proven that it is particularly important to forge horizontal and vertical
linkages between SMEs and their larger counterparts as these hold the key for SMEs to benefit
Economic and Social Commission of Asian and the Pacific, (2009). For large firms,
globalization has generated both new markets and new competitive forces. Constant pressure to
reduce costs, shorten lead times, and focus on core competencies has driven firms to change their
supply chain management strategies. Most large manufacturing companies now buy significant
percentages of their inputs of both goods and services from other firms, with some spending as
much as half of their revenues this way (UNCTAD, 2001). Managing the supply chain for an
optimal mix of cost, quality, flexibility, and strategic advantage (such as access to innovation) is
becoming an increasingly important source of competitive advantage (Jenkins et al., 2007).
Experience from literature by World Bank, USAID, UNIDO and OECD publications on MNC-
SME linkages shows that countries that have facilitated the development of sustainable linkages
have upgraded their local productive capacities and enhanced their industrial performance. In
this way they are also integrating their enterprises into global supply chains of large foreign
firms and thus fostering sustainable development of local firms (UNCTAD 2010). African
Development Bank (2010) adds that it is the small, agile, growth-oriented indigenous and
independent firms that are pioneering new discoveries because they are willing to take on more
risk than TNCs.
In developing countries, business linkages with small and medium enterprises (SMEs) can occur
in various forms such as backward linkages by sale of parts, components, materials and services
as well as forward linkages with customers (UNCTAD 2010(2)). Other spillover effects include;
demonstration effects and human capital spillovers. These relationships can allow large firms to
reduce input costs while increasing specialization and flexibility. They can also increase local
integration and “rooting,” providing access to local knowledge and, by spurring growth and
34
development in the local SME sector, bringing about positive social and economic impacts in the
wider community (UIA 2008). There are thus both competitiveness and corporate social
responsibility arguments in favor of business linkages. Currently, most of Uganda’s SMEs are
generally unable to meet business standards required to deal with TNCs on such crucial
production issues as price, quality, as well as consistency in volumes. In addition, the majority of
the SMEs have weaknesses in record-keeping, credit utilization and repayment and; respect for
business contracts. On the other hand, TNCs were ready to establish formal vertical (buyer to
seller) business relationships with SMEs, provided SMEs committed themselves to remedy the
existing shortcomings in their business systems, attitude and skills (UIA 2008). There is
therefore need to revise the necessary legislations to handle such a mismatch.
3. Methodology
3.1 Introduction
The study’s ultimate objective was to identify the different key actors in the upstream, mid-
stream and downstream stages of the oil and gas value chain, underpinning the role and current
positioning of SMEs investing in the oil value chain. The study investigated the factors that
influenced SME decisions and willingness to invest whilst identifying policy and non policy
actions to address the challenges. The study was also intended to strengthen the existing oil
policy/legislations to enhance SME investment. This section therefore summarises the study
design, studied areas, sampling procedure, data collection and analysis as well as limitations to
the study.
3.2 Study Design and Scope
To achieve the study objectives a Cross-Sectional Survey Design was used. In a survey, data is
collected at one point in time from a sample selected to represent a larger population. The cases
used were SMEs such as those in Agriculture, Hotel and Catering Services, Real Estate and
Construction, General merchandise trade, Petroleum products trade, Fabrication and Service
Provision within the 5 districts of the study. The chosen study design was appropriate to
accommodate diversity and provide enriched and refined data. Participatory Appraisal methods
were used to collect data for the study. Participatory approaches conferred an added advantage of

35
rapid but enriched data collection saving on time and monetary resources that would have been
enormous otherwise.
The research study was carried out in selected districts within Bunyoro and Acholi sub-regions
of the Albertine Graben (Figure 3). The districts covered were Gulu, Hoima, Masindi, Buliisa
and Kampala District. Gulu is located in the Acholi region while Buliisa, Hoima and Masindi
districts are located in Bunyoro region. Amuru7 and Buliisa are new Districts and did not have
substantial number of SMEs that fit into the SME definition of the study.
Figure 3: Map of the Albertine Graben
The selection of the Albertine as a study site was based on the fact that out of Uganda’s six
sedimentary basins, the Albertine Graben is the most prospective site where exploration
7 Although Amuru District was initially targeted in this study, on visiting the district most enterprises were micro
and very few were found to fit into the definition of the study. SMES of the district therefore were excluded in the
sample.

36
activities by the large oil companies namely Tullow Oil, Dominion Petroleum and Neptune
Petroleum are ongoing (Ministry of Energy and Mineral Resources, 2009).
Kampala District was added because it is the commercial hub of the country where most (over 70
percent) of the business enterprises including SMEs do their business (Uganda Investment
Authority, 2010). The study analyzed potential opportunities arising out of the emerging oil
discovery, including potential areas of partnership with the TNCs and the factors likely to impact
on the willingness of the SME to invest. Emphasis was put on understanding the internal and
external factors that may hinder and/or favour SME investment with the view to propose actions
that may overcome the hindering factors. The research was conducted in phases including a
diagnostic phase, data collection, data analysis, results reporting and dissemination.
3.3 Data collection, Processing and Analysis
3.3.1 Sample Selection
The sampling frame included all existing SMEs in various sectors in the study areas, private
sector associations, ministries and public agencies. The major assumption considered was that all
the SMEs in the area have equal chances to be attracted to invest into the oil and gas sector in the
region should opportunities emerge. For Objective 1; concerning identification of key actors in
value chain, the entire population was considered while for the other objectives stratified random
sampling was used. Stratified random sampling was considered over the non-probabilistic
methods because of its sampling error reducing power. Using this method, the entire diverse
SMEs population was reduced to clusters (strata) making sampling more representative and
simpler. The different sectors with direct and indirect relationship to the petroleum value chain
formed the basis for stratification. These sectors included Agriculture, Hotel and Catering
Services, Real Estate and construction, Manufacturing and Fabrication were the strata. The
research team first identified the relevant strata and their actual representation in the population
after which random sampling was used to select a representative number of subjects from each
stratum. From the selected government agencies and ministries, private sector associations and
existing TNCs investing in the Oil and Gas sector, data on general opportunities that have
emerged with the oil discovery and potential areas for business partnership with Government and
TNCs were collected to address objectives 3 and 4 of the study.

37
3.3.2 Sample size
A total of 270 enterprises were identified for participation in the study using SMEs data from
UIA triangulated with registration lists at municipal registration centres. Out of the 270 SMEs
identified, only 220 were actually interviewed representing 81% response rate. The rest of the
sample units were excluded due to non-qualification. The criteria used for screening was based
on total capital investment (assets and working capital) which ranged from 100 million to 1
billion Uganda shillings, existence of a permanent address for the enterprise and formal
registration with municipal authorities in the region or district. The sample was deemed
representative based on available data about enterprise registration in the sampled regions giving
N
n= 0.23, where n = sample population and N = total enterprise population in the region studied.
Table 2 shows the distribution of the sub-samples by sector and location (district) and the total
sample size.
Table 2: Distribution of the selected SME respondents by sector and district
Sector No. of Respondents – SMEs per District
Kampala Masindi Hoima Buliisa Gulu
Freight Forwarding 5 0 0 0 0
Transport (passenger) 3 2 3 1 3
Catering/ restaurants 8 9 7 1 8
Consultancy services 4 1 2 0 2
Real Estate and Accommodation 6 8 10 2 9
Micro financing and Foreign Exchange
Bureaus
7 3 5 2 3
Agricultural produce
Processed
Fresh (Food supply, beef, milk, poultry
and fish)
0 5 6 4 6
Health services 8 5 7 1 8
Vocational training 6 3 4 2
Metal Fabrication/Artisans 7 4 4 1 3
Trading (supply of hardware merchandise and
equipment)
3 2 3 0 2
Maintenance (plumbers, electricians and
mechanics)
10 2 3 0 3
Road construction 16 4 8 3 9
Total number of respondents 96 45 61 11 57
38
3.3.3 Methods of Data collection
In collecting primary data, the study employed two data collection methods namely; personal
interviews and Focus Group Discussions (FGDs). Interview guides and questionnaires were
used as the major data collection tools for the interviews, whereas thematic checklists were used
for the FGDs. Primary data collection mainly targeted information about key and active actors in
the Oil and Gas sector, factors that influence SMEs` decisions and willingness to invest, business
opportunities/business partnerships that have emerged in the oil sector and policy/non policy
actions that can address constraints that will hinder SMEs from investing in the Oil sector. Table
3.3 presents a summary of the key variables collected from the different respondents/SMEs.
Secondary data was collected mainly for triangulation with the primary data and these mainly
targeted potential actors in the oil and Gas value chain, anticipated benefits of oil and gas
discovery, related policies and legislation.
3.3.4 Data Processing and Analysis
The collected data was cleaned to ensure that only complete interviews are considered for
analysis. After cleaning, the open responses were coded and entered into appropriate software for
analysis. Both qualitative and quantitative methods of data analysis were used to generate
descriptive statistics and econometric results. Qualitative data was analysed using N-VIVO
software, while quantitative data was analysed using Statistical Package for Social Scientists
(SPSS) to obtain the descriptive statistics and econometric estimation of the Logit model.
3.3.5 Reliability and Validity measure
The validity and reliability of the constructs are tested to ensure that the measurement was
accurate. Validity refers to how accurately the construct reflects what it intends to measure, and
reliability refers to the consistency of the results obtained. According to Ghauri et al. (2002),
several criteria can be used to judge construct validity: face validity, convergent validity and
divergent validity. In our study face validity was ensured by consulting experts in the field and
pilot testing of the questionnaires with 40 SMEs’ owners/mangers before carrying out the main
study. This ensured correcting any ambiguities in measurements as well as capturing correctly
the concepts used in this study. Moreover, construct validity is ensured by taking into account
the usage principle (Babbie 2007). The operational measures used in this study were taken from
previous work in the field that was published in reputable academic journals. Reliability of the
39
construct was assessed using Cronbach (Rousson et al., 2002). The items that scored below 0.7
(only 14% of the total) were excluded based on the list wise deletion criteria (Nunnally, 1978 ;).
Reliability was also ensured using face-to-face interviews where interviewer ensures that each
respondent is answering the same questions.
To identify the potential actors in the value chain, value chain analysis was used. There are two
choices available for the SMEs to make concerning investment in the oil sector: - to invest or not
to invest. The decision to invest or not to invest by the SMEs is the major question to be
addressed (the dependent variable) and this depends on several factors (independent/exogenous
factors). Since to invest or not is dichotomous, discrete choice econometric models are best
suited for this analysis (Guerre and Moon, 2005). The Logit and Probit models particularly cater
for dichotomous and categorical variables (Payne et al., 2003). The models focus on association
of categorical or grouped data, looking at all levels of positive interaction effects (Goodwin and
Schroeder, 1994). Generally results from both models are similar unless the samples are very
large and many observations fall in the tails (Nzomoi et al., 2007).
The Logit model is however preferred because it does not assume equal variance–covariance
matrices across groups and multivariate normality of the variables (Hair et al. 1998). Moreover,
the output from the analysis is very similar to regression and is therefore easier to draw
inferences. Logit uses a binomial probability function for the dichotomous dependent variable
and estimates whether it is one way or the other using an odds ratio. Unlike regression, where we
try to minimize the squared deviations, in logit we maximize the likelihood of a firm’s
willingness to invest (Judge et al., 1980). The Logit is as well suited for observational data
whereas the Probit is well suited for experimental data (Mburu et al., 2007). The Logit model
was therefore used in this research study. In this case, the study focused on SMEs/actors that
were doing business in other sectors but would be willing to invest in the oil sector because of
the emerging investment opportunities.
A reduced form of a Logit model can be expressed as:
Y = α +βiXi +ε
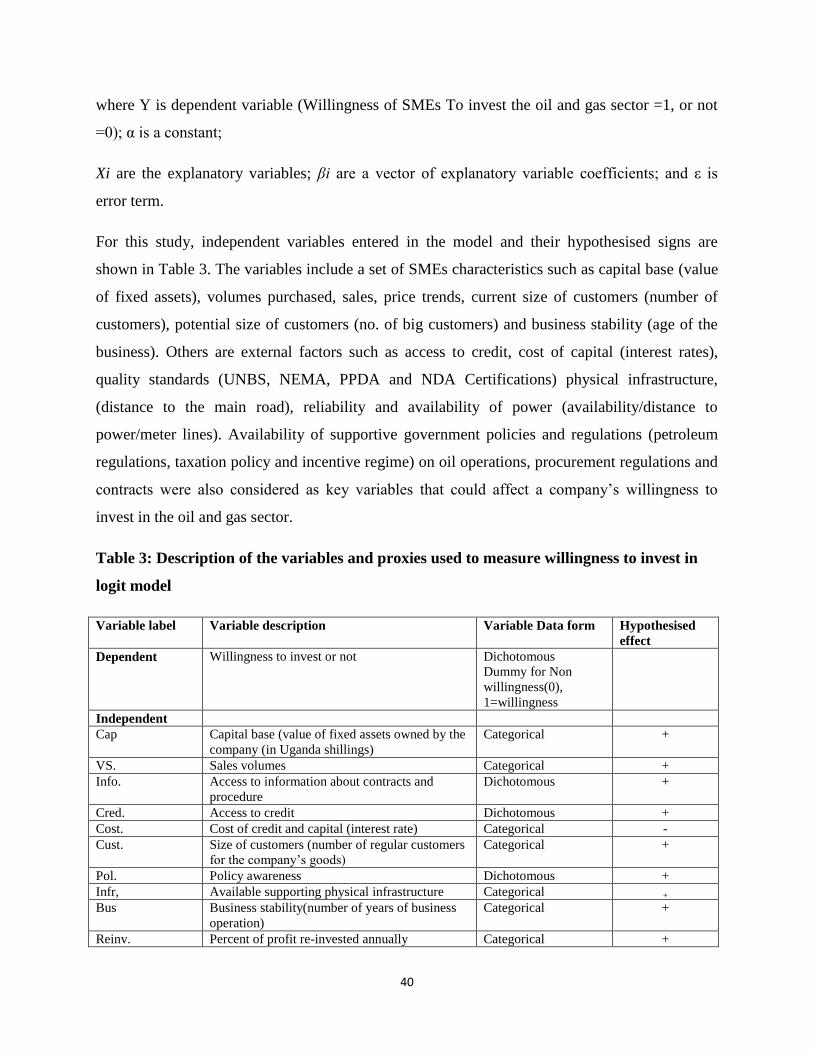
40
where Y is dependent variable (Willingness of SMEs To invest the oil and gas sector =1, or not
=0); α is a constant;
Xi are the explanatory variables; βi are a vector of explanatory variable coefficients; and ε is
error term.
For this study, independent variables entered in the model and their hypothesised signs are
shown in Table 3. The variables include a set of SMEs characteristics such as capital base (value
of fixed assets), volumes purchased, sales, price trends, current size of customers (number of
customers), potential size of customers (no. of big customers) and business stability (age of the
business). Others are external factors such as access to credit, cost of capital (interest rates),
quality standards (UNBS, NEMA, PPDA and NDA Certifications) physical infrastructure,
(distance to the main road), reliability and availability of power (availability/distance to
power/meter lines). Availability of supportive government policies and regulations (petroleum
regulations, taxation policy and incentive regime) on oil operations, procurement regulations and
contracts were also considered as key variables that could affect a company’s willingness to
invest in the oil and gas sector.
Table 3: Description of the variables and proxies used to measure willingness to invest in
logit model
Variable label Variable description Variable Data form Hypothesised
effect
Dependent Willingness to invest or not Dichotomous
Dummy for Non
willingness(0),
1=willingness
Independent
Cap Capital base (value of fixed assets owned by the
company (in Uganda shillings)
Categorical +
VS. Sales volumes Categorical +
Info. Access to information about contracts and
procedure
Dichotomous +
Cred. Access to credit Dichotomous +
Cost. Cost of credit and capital (interest rate) Categorical -
Cust. Size of customers (number of regular customers
for the company’s goods)
Categorical +
Pol. Policy awareness Dichotomous +
Infr, Available supporting physical infrastructure Categorical +
Bus Business stability(number of years of business
operation)
Categorical +
Reinv. Percent of profit re-invested annually Categorical +
41
The coefficients in the logistic regression were estimated using the maximum likelihood
estimation method (Judge et al., 1980) using SPSS. The estimated coefficients (βs) do not
directly indicate the effect of change in the corresponding explanatory variables on probability of
the outcome occurring but they reflect the effect of individual explanatory variables on its Log of
odds. To this end, a positive coefficient means that the log of odds increases as the corresponding
independent variable increases. It is also right to say that bigger the coefficient regardless of
whether its positive or negative, the bigger the effect of the independent variable on the
dependent.
Prior to running a logit model, a Chi-square test was carried out to examine factors (internal and
external) that were associated to SME willingness to invest in the Oil and Gas value chain which
in this case was treated as the dependent variable. The chi-square test results were then used for
the first level testing of our hypothesis that SME willingness to invest would depend on some of
these factors. Furthermore, the X2 associations helped in selecting the explanatory variables that
were not correlated to enter into the Logit model. For confirmation of significant association
between the covariate factors and the dependent variable, the Cramer’s V static and p<0.05 level
of confidence was used.
3.4 Study Limitations
The generalisation of the study findings are restricted by a number of limitations in the design,
methods used and geographical coverage. In this study we chose the survey design which is a
one-point kind of measurement meaning it did not consider the time line changes in preferences
and perceptions. Probably longitudinal approaches would have been more covering especially
considering that this study has been carried out prior to full participation by the enterprises.
Secondly, the study was restricted to only enterprises in the Albertine Graben and Kampala
District therefore due to enterprise diversity elsewhere in Uganda; the findings are only
interpretable with generalisation valid for only the sample areas.

42
4. Presentation and discussion of findings
4.1 Introduction
In this section we report findings of the study based on the collected data through interviews,
focus group discussions and field observations. The presentation of the report is based on the
objectives and major study themes or research questions laid out in the report namely: to find out
present actors in the Oil and Gas sector value chain; to determine factors likely to influence SME
decisions and willingness to invest in the Oil and Gas value chain; to find out business
partnerships that would be created between SMEs, Trans National Oil Corporations and other
actors in the Oil and Gas sector; and to propose actions to address the constraints hindering
SMEs from exploiting the identified opportunities in the Oil and Gas Sector.
4.2 Actors in the Oil and Gas sector Value Chain
The first objective of the study was to identify the current actors in the oil and gas sector. The
findings of the study revealed that several actors played a key role at different levels of the value
chain. Some of the actors include Government Ministries, departments, agencies, district local
authorities, political and administrative leadership, media and the private sectors as illustrated in
Figure 4 below.
4.2.1 Role of Government
The Government of Uganda is the major player whose role is to provide the required regulatory
and institutional framework that promotes and facilitates exploration, refinement, transportation,
storage and investment in the sector. Government has through the respective arms drafted
legislations and policies such as the National Oil and Gas Policy, the Petroleum (Exploration,
Development, Production and Value Addition) Bill, Refinery Bill and the Revenue Management
Bill to facilitate proper Oil and Gas exploration activities. Other roles played by the Government
include strategic planning and management for the oil and Gas Sector, licensing of oil
exploration and prospecting companies, infrastructure development, provision of security,
revenue collection and management, managing local content aspects and environmental
management.
43
The Government actors include Parliament, Cabinet, Ministries such as the Ministry of Energy
and Mineral Development, Ministry of Finance, Planning and Economic Development, Ministry
of Works and Transport, Ministry of Lands, Housing and Urban Development, Ministry of
Justice and Constitutional Affairs, Ministry for Local Governments, Ministry of Water and
Environment, Ministry of Trade, Industry and Cooperatives, Ministry of Tourism and Wildlife,
Ministry of Gender, Labor and Social Development, Ministry of Education and Sports, Ministry
of Foreign Affairs, Ministry of Security, Ministry of Information and Communication
Technology, Ministry of Foreign Affairs and Ministry of the East African Affairs. Government
agencies include Bank of Uganda, Uganda Revenue Authority, National Planning Authority,
Uganda Investment Authority, National Environment Management Authority, Uganda Wildlife
Authority and Auditor General.
4.2.2 Private Sector
The private sector is another important player in the Oil and Gas value chain whose major
function is to explore, develop and produce Uganda’s oil and gas resource (Ministry of Energy
and Mineral Development, 2008). The private sector includes Trans-national Oil Companies,
large scale enterprises as well as the Small and Medium Sized Enterprises.
4.2.2.1 Trans-national Oil Companies
The private sector is dominated by the Transnational Oil Corporations (TNCs) such as Neptune
Petroleum Uganda, Tullow Oil, Dominion, Total E and P and; China North Offshore Oil
Company. These companies are directly involved in the provision of specialized activities
namely oil appraisals, exploration, seismic surveys and well drilling.
4.2.2.2 Large scale Enterprises
Within the private sector are large scale domestic and foreign enterprises such as Transami,
Eagle Air, MBW consulting, Pearl Engineering, Kasese Nile and Wood, Air Water and Earth,
Bemuga Clearing and Forwarding, Kamu Kamu drilling experts and DHL among others
providing direct services such as equipment supplies, civil and engineering works, environment
services, professional consulting services, international freight services as well as clearing and
forwarding services.

44
4.2.2.3 Small and Medium Sized Enterprises
The SMEs are also important actors within the private sector and although majority (90%) did
not have formal contracts with Oil companies and their subcontractors, the 10% involved in the
sector were supplying indirect services such as agricultural produce, lodging and conference
facilities, plumbing, vehicle spare parts, fuel, event management services, medical services,
transportation of guests to oil exploration and camping sites, supplying building materials,
electrical services, furniture, construction materials, training local personnel and casual labor.
These among others included MSL Logistics, QMS Events, Riviera Hotel, Nyankidwa
Restaurant, Masindi Junior Transporters, Kisembo Electronic Engineers and Kasangaki
enterprises. Several reasons were established as to why there was limited involvement of SMEs
in the value chain. These include;
1. The current oil and gas value chain for Uganda (upstream) is not open to offer many
opportunities given that actual production is yet to start. Additionally main activities such
as exploration, construction, surveying, and preliminary drilling etcetera are knowledge
based and capacity was lacking for professional service and skill provision among the
local SME firms.
2. General lack of awareness and information about oil developments, how to usurp
investment opportunities, how to get into contract agreements and the required
legislation. We note, however, that some efforts had been made by TNCs such as Tullow
Oil and Neptune as well as district authorities to create awareness through radio programs
and media prints but still a wide audience was uninformed.
3. SMEs still appear fragmented majority being sole proprietorships and thus lack ability to
supply in bulk quantity, and the desired quality based on international standards. Many
SMEs do not qualify in the main stream procurement criteria and were therefore not
prequalified suppliers or service providers.
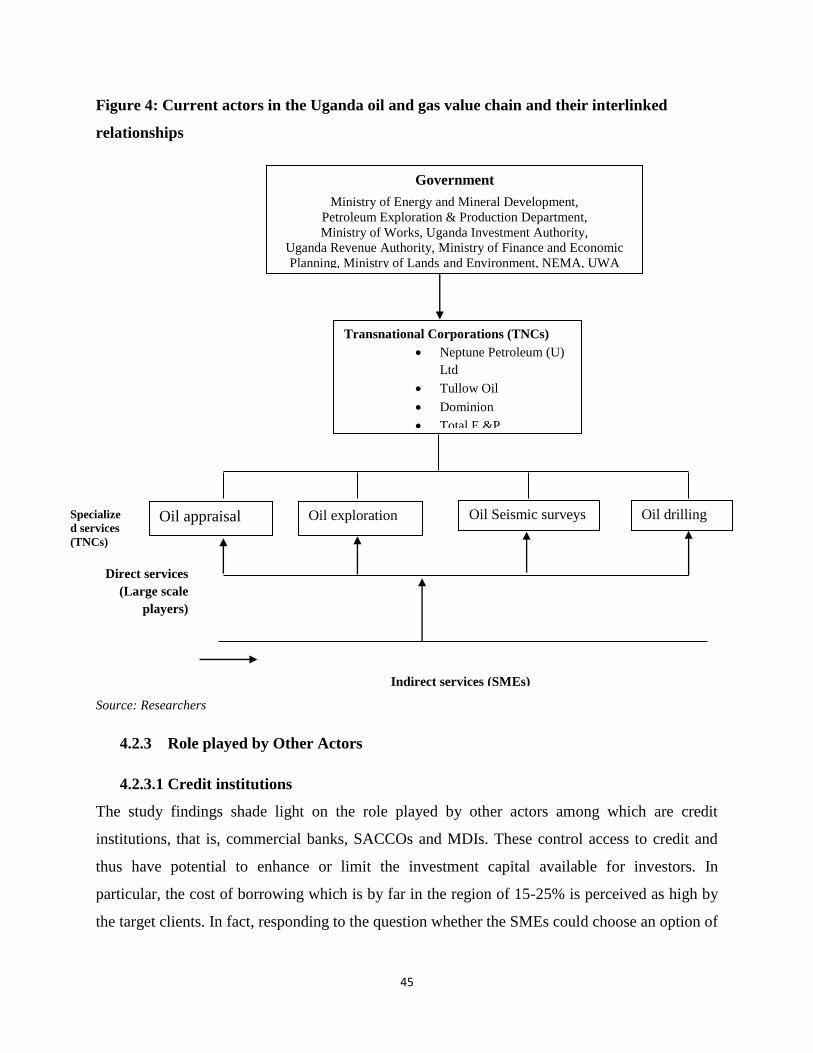
45
Figure 4: Current actors in the Uganda oil and gas value chain and their interlinked
relationships
Source: Researchers
4.2.3 Role played by Other Actors
4.2.3.1 Credit institutions
The study findings shade light on the role played by other actors among which are credit
institutions, that is, commercial banks, SACCOs and MDIs. These control access to credit and
thus have potential to enhance or limit the investment capital available for investors. In
particular, the cost of borrowing which is by far in the region of 15-25% is perceived as high by
the target clients. In fact, responding to the question whether the SMEs could choose an option of
Indirect services (SMEs)
Direct services
(Large scale
players)
Government
Ministry of Energy and Mineral Development,
Petroleum Exploration & Production Department,
Ministry of Works, Uganda Investment Authority,
Uganda Revenue Authority, Ministry of Finance and Economic
Planning, Ministry of Lands and Environment, NEMA, UWA
Transnational Corporations (TNCs)
Neptune Petroleum (U)
Ltd
Tullow Oil
Dominion
Total E &P
Oil appraisal Oil exploration Oil drilling Oil Seismic surveys Specialize
d services
(TNCs)
46
acquiring a loan to boost their investment capital, the majority SMEs reported high interest rates
as a deterring factor. In the same way the high collateral qualification that is reported to be over
150% of the amount accessible as a loan was also another deterring factor from borrowing. There
was need to make credit access more affordable. This could be through long term leasing and
bonds issuance such that SMEs willing to invest over long periods can be helped.
4.2.3.2 Local media houses
By local media houses we mean local air waves radios and municipal public address systems. In
some areas these are missing and where they exist, a lot still has to be done to improve audience
coverage and awareness creation. The findings highlight lack of information about the existing
opportunities and benefits as one of the major factors that has slowed SMEs participation in the
value chain. The study results revealed however that the media was the most effective source of
Oil and Gas information estimated at 66.8 percent compared with the business associates (4.1
percent), District Authorities (1 percent) and Ministry of Energy and Mineral Development (0.5
percent)
4.2.3.3 Administrative and Political institutions
Usually, the administration and political institutions of the area are expected to be at the centre of
awareness creation. However, the study findings revealed that these units have not yet done
enough to create awareness through education and spreading information to the communities.
This probably can also explain the lagging behind of many entrepreneurs. Likewise, the Local
Government of the regions were pointed out as not proactive enough in lobbying for government
funding to support infrastructure development with Buliisa district being in the worst situation
where a lot of basic infrastructure is missing, an aspect that is hindering settlement of many
entrepreneurs in the area.
4.2.3.4 Civil Society Organisations (CSOs)
The CSOs are indirect actors in the value chain whose role is to dialogue and sensitise the local
communities about the ongoing oil resource and its impact on their livelihoods. The CSOs are
currently sensitising the local communities about environment issues, land management and
promoting peace, and social development in the oil rich areas.
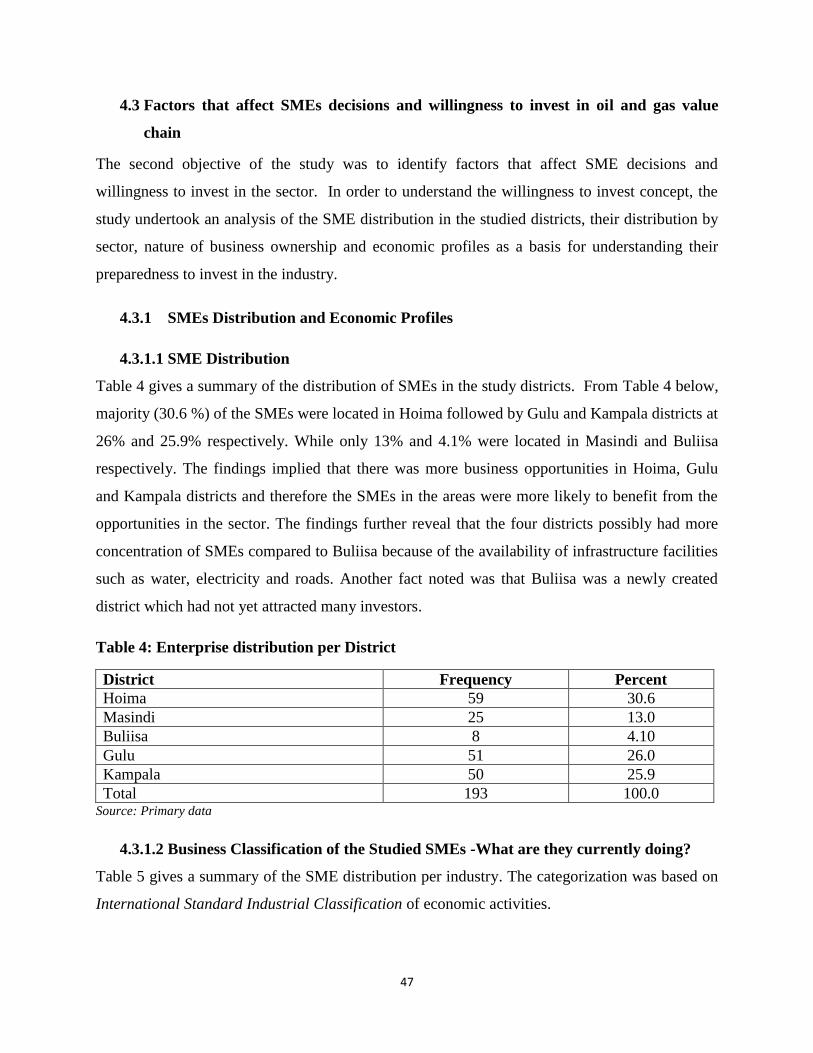
47
4.3 Factors that affect SMEs decisions and willingness to invest in oil and gas value
chain
The second objective of the study was to identify factors that affect SME decisions and
willingness to invest in the sector. In order to understand the willingness to invest concept, the
study undertook an analysis of the SME distribution in the studied districts, their distribution by
sector, nature of business ownership and economic profiles as a basis for understanding their
preparedness to invest in the industry.
4.3.1 SMEs Distribution and Economic Profiles
4.3.1.1 SME Distribution
Table 4 gives a summary of the distribution of SMEs in the study districts. From Table 4 below,
majority (30.6 %) of the SMEs were located in Hoima followed by Gulu and Kampala districts at
26% and 25.9% respectively. While only 13% and 4.1% were located in Masindi and Buliisa
respectively. The findings implied that there was more business opportunities in Hoima, Gulu
and Kampala districts and therefore the SMEs in the areas were more likely to benefit from the
opportunities in the sector. The findings further reveal that the four districts possibly had more
concentration of SMEs compared to Buliisa because of the availability of infrastructure facilities
such as water, electricity and roads. Another fact noted was that Buliisa was a newly created
district which had not yet attracted many investors.
Table 4: Enterprise distribution per District
District Frequency Percent
Hoima 59 30.6
Masindi 25 13.0
Buliisa 8 4.10
Gulu 51 26.0
Kampala 50 25.9
Total 193 100.0 Source: Primary data
4.3.1.2 Business Classification of the Studied SMEs -What are they currently doing?
Table 5 gives a summary of the SME distribution per industry. The categorization was based on
International Standard Industrial Classification of economic activities.
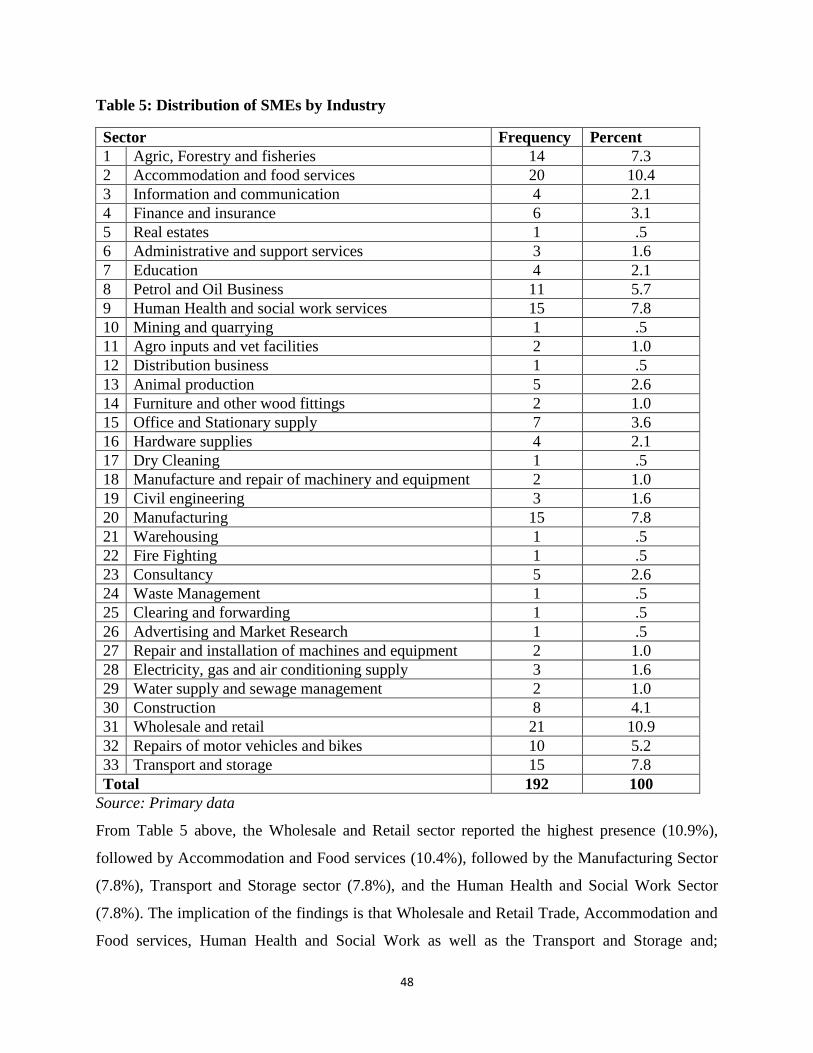
48
Table 5: Distribution of SMEs by Industry
Sector Frequency Percent
1 Agric, Forestry and fisheries 14 7.3
2 Accommodation and food services 20 10.4
3 Information and communication 4 2.1
4 Finance and insurance 6 3.1
5 Real estates 1 .5
6 Administrative and support services 3 1.6
7 Education 4 2.1
8 Petrol and Oil Business 11 5.7
9 Human Health and social work services 15 7.8
10 Mining and quarrying 1 .5
11 Agro inputs and vet facilities 2 1.0
12 Distribution business 1 .5
13 Animal production 5 2.6
14 Furniture and other wood fittings 2 1.0
15 Office and Stationary supply 7 3.6
16 Hardware supplies 4 2.1
17 Dry Cleaning 1 .5
18 Manufacture and repair of machinery and equipment 2 1.0
19 Civil engineering 3 1.6
20 Manufacturing 15 7.8
21 Warehousing 1 .5
22 Fire Fighting 1 .5
23 Consultancy 5 2.6
24 Waste Management 1 .5
25 Clearing and forwarding 1 .5
26 Advertising and Market Research 1 .5
27 Repair and installation of machines and equipment 2 1.0
28 Electricity, gas and air conditioning supply 3 1.6
29 Water supply and sewage management 2 1.0
30 Construction 8 4.1
31 Wholesale and retail 21 10.9
32 Repairs of motor vehicles and bikes 10 5.2
33 Transport and storage 15 7.8
Total 192 100
Source: Primary data
From Table 5 above, the Wholesale and Retail sector reported the highest presence (10.9%),
followed by Accommodation and Food services (10.4%), followed by the Manufacturing Sector
(7.8%), Transport and Storage sector (7.8%), and the Human Health and Social Work Sector
(7.8%). The implication of the findings is that Wholesale and Retail Trade, Accommodation and
Food services, Human Health and Social Work as well as the Transport and Storage and;

49
Manufacturing sectors are among the promising avenues through which the SMEs can partner
with the TNCs/Large Oil companies. However, the agricultural sector though a primary sector of
Uganda is not well represented (7.3%) because majority of the enterprises were found to be
operating on a micro scale. This finding is similar to the UBOS Census of Business Enterprises
(2010/2011) which out of 458,106 establishments indicated that 61 percent of the businesses
were in the Trade Sector, followed by Accommodation Services (14 percent) while businesses in
Agriculture only accounted for 2 percent.
4.3.2 Economic Profiles of the Studied SMEs
We operationally8 defined SMEs as any legally registered business entity that has a permanent
physical address, owning fixed assets at least worth 50 million Uganda shillings (UGX) and total
capital investment (fixed assets and liquidity) worth UGX 100 million to 1billion. A summary of
the profile is presented in Table 6.
8 The Uganda Investment Authority criteria for defining SMEs states that a Small Scale Enterprise is one that
employs a maximum of 50 people, with maximum annual sales turnover of UGX 360 million and Maximum value
in Total Assets of UGX 360 Million where as a Medium scale Enterprise is one that employs a more than 50 people,
with minimum annual sales turnover of UGX 360 million and Minimum value in Total Assets of UGX 360 Million.
On reaching the field, the qualification with this criteria caused mixed results with some entities qualifying on the
number of employees, but not fixed assets, while some that qualified on fixed assets and sales turn over did not
employ up to 50 persons. To sort the case, the research team resolved to adopt an operational definition such that
many entities would qualify. The most affected places were Hoima, Gulu, Masindi and Buliisa.

50
Table 6: Profiles of the sampled SMEs
Variable Frequency Percent (n=193)
Business registration Status
Registered 193 100.0
Unregistered 0 0
Business ownership
Partnership 66 34.2
Sole Proprietorship 112 58.0
Limited Company 10 5.2
Communal ownership 1 0.5
Owned by the church diocese 3 1.6
Business age*
1-10 years 96 49.7
>10-20 years 58 30.0
> 20 years 39 20.2
Value of Fixed Assetsb (UGX)
None 136 70.5
<10 million 7 3.6
10-100 million 20 10.4
>100-500 million 22 11.4
>500-1000,000,000 million 4 2.1
> 1000,000,000 million 4 2.1
Investment Capitalc (UGX)
<100 million 43 22.5
100-200 million 66 34.6
>200-300 million 13 6.8
>300-600million 31 16.2
>600-1000,000,000 21 11
> 1000,000,000 million 17 8.9
Source: Primary data
*Business age refers to the period of business survival from first registration
bValue of fixed refers to summated value of owned land, buildings, machinery, vehicles and
furniture
cInvestment capital refers to Total fixed assets + liquidity
Table 6 illustrates that all of the studied SMEs were legally registered with permanent (or semi-
permanent) physical addresses. However, the majority (70.5%) had no fixed assets, which could
be a sign of economic instability of the enterprise. Majority (34.6 percent) investment capital
51
between 100 to 200 million Uganda shillings, 22.5 percent: had Investment capital less than 100
million UGX; and only 8.9 percent Investment Capital of more than Uganda shillings 1 billion.
This is an indication that investment capital is a major challenge for SMEs which affects their
ability and willingness to invest in the Oil sector.
Fifty eight percent of the SMEs were managed as sole proprietorships while 34.2% were
partnerships and only 5.2% were private limited companies. The findings are also consistent with
the 2010/2011 census of business enterprises where majority (94%) of businesses were sole
proprietorships. This is therefore a common characteristic of SMEs in Uganda, and it explains
the meagre worth of their fixed assets, investment capital, limited expansion into regional
markets and ages in business. This ultimately explains the limited capacity for SMEs to invest in
large ventures and highly capitalised sectors.
4.3.3 Factors that determine SMEs willingness to invest
Results from the Chi-square test (Table 7) show a number of factors that were positively
associated with SME willingness to invest in the oil and gas sector in Uganda. From Table 3.5, it
is shown that the size of investment capital, owning fixed assets, having knowledge of the oil
business; time spent in business and receiving information are strongly associated (or affect) the
willingness of SMEs to invest in the oil and gas sector. Other factors strongly associated were
access to power, access to other infrastructure such as roads, water and financial institutions,
access to credit and cost of capital (interest charge for credit acquisition). The direction of
association and contribution of each to the dependent variable were measured by the logit model.

52
Table 7: Association between Willingness to Invest and hypothesized internal and external
factors Sector (n=193)
Factor Chi square(X
2) value Df P value
Investment Capital 19.57 6 0.003*
Fixed Assets 14.50 5 0.013*
Age of the business 12.27 2 0.043*
Knowledge of oil business 28.17 4 0.000*
Information Flow 15.18 1 0.000*
Access to Power 6.56 2 0.038*
Access to other Infrastructure 8.801 6 0.0185*
Policy awareness 4.78 1 0.779
Cost of Capital 10.856 5 0.054**
Access to credit 7.122 1 0.009*
Quality standards 9.953 8 0.268
Price trends 4.59 2 0.101
Volume of sales 8.87 5 0.114
Number of customers 4.80 4 0.308
Source: Primary data based on Pearson test for association
*significant at 95% (p=0.05) **significant at 90 %(
p=0.1)
4.3.3.1 The Logistic Regression Model results
The data used was collected from 220 SMEs with “willingness to invest (trade) in oil and gas as
the dependent variable. This was regressed against 10 variables shown in Table 3. The
dependent variable was treated as a dichotomous variable taking on values 1= willingness to
invest and 0 = none willingness. The explanatory variables were mostly categorical. The
backward stepwise elimination method was used to enter candidate variable into the model and
iterations run at a specified <ENTER> value first of < 0.05 and removal 0.01. This criterion
qualified just four variables namely; Investment capital, Access to credit, Information flow and
owning fixed assets. To add to the list of qualifying candidates model adjustments (selection
strictness) was made whereby the <ENTER> criteria was changed to >0.05 and removal at 0.1.
This modification meant that the significance level for variable qualification was lowered to
90%. The modifications qualified two more candidates, that is, knowledge of oil business (0.06)
and age of business enterprise (0.054). The rest of the variables never qualified. The ability to
screen and partition variations in the dependent variables among the covariates make logit
models different from other regression analysis models. The advantage is clarity on what
variables contribute more to the observed variation in the dependent variable. The disadvantage,

53
however, is that the best explanatory variables are retained. This causes a bias in interpretation of
model results because usually non model variables or parameters are considered less useful
which may not be necessarily true in every case (Judge et al., 1980). For this every reason,
especially when mixed methods are used like in our case, some non-qualifying variables could
still have good implications; that is why we chose to retain them in the results table.
The explanatory model was specified in the form:
Logit (л) = β0 + β1x1 + β2x2 + β3x3 ……. β nxn + .........Eqn. (i).
Where; л – is the probability that the dependent variable (SME willing to invest in Oil and Gas)
will be predicted by the selected (hypothesized) variables; Β1.....βn are the coefficients for each
variable entered in the model; x1 .... xn are the selected predictor (independent) variables and is
the error term.
The final estimated model is;
WTI = 10.7 + 0.42 Fixed Assets + 0.383 Investment capital + 0.33 Information Flow+ 0.274 Knowledge of oil business +
0.271 Access to credit....................................................................................................................Eqn.(ii)
From the equation (ii) above, the coefficients mark the contribution of each predictor variable in
explaining the probability (log odds) of its occurrence. The significance of the regression
coefficients is validated by the Wald Statistic. Details are given in Table 8.
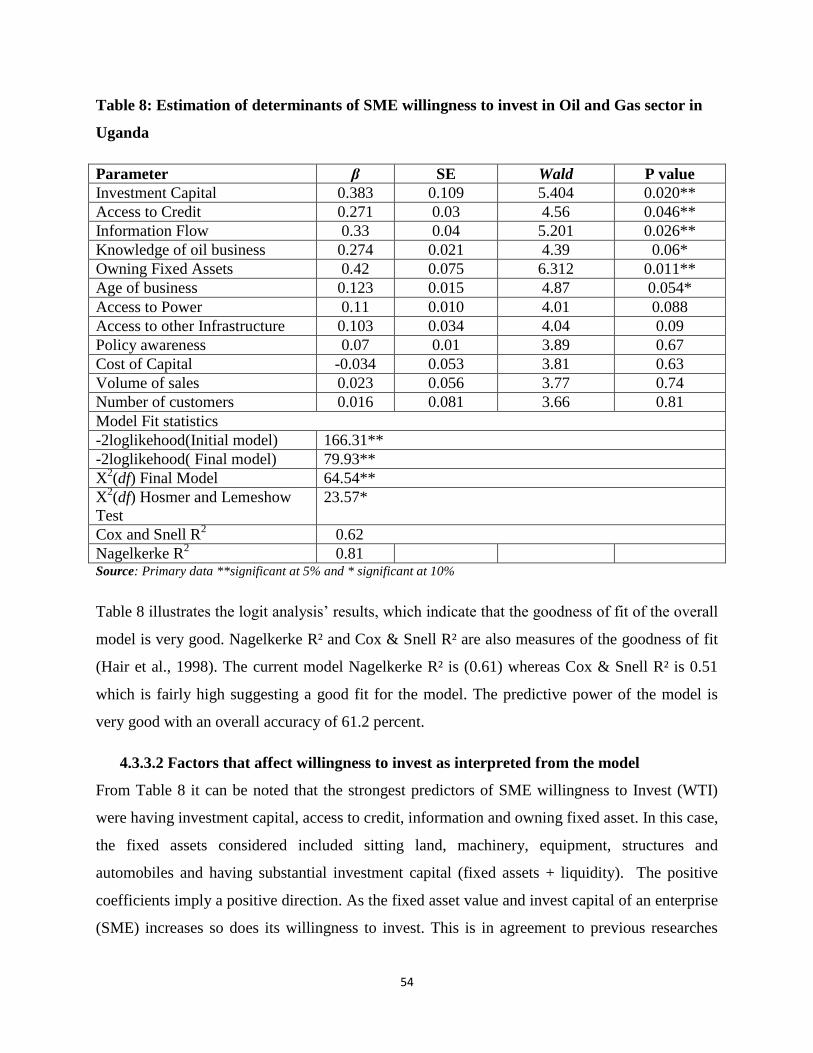
54
Table 8: Estimation of determinants of SME willingness to invest in Oil and Gas sector in
Uganda
Parameter β SE Wald P value
Investment Capital 0.383 0.109 5.404 0.020**
Access to Credit 0.271 0.03 4.56 0.046**
Information Flow 0.33 0.04 5.201 0.026**
Knowledge of oil business 0.274 0.021 4.39 0.06*
Owning Fixed Assets 0.42 0.075 6.312 0.011**
Age of business 0.123 0.015 4.87 0.054*
Access to Power 0.11 0.010 4.01 0.088
Access to other Infrastructure 0.103 0.034 4.04 0.09
Policy awareness 0.07 0.01 3.89 0.67
Cost of Capital -0.034 0.053 3.81 0.63
Volume of sales 0.023 0.056 3.77 0.74
Number of customers 0.016 0.081 3.66 0.81
Model Fit statistics
-2loglikehood(Initial model) 166.31**
-2loglikehood( Final model) 79.93**
X2(df) Final Model 64.54**
X2(df) Hosmer and Lemeshow
Test
23.57*
Cox and Snell R2 0.62
Nagelkerke R2 0.81
Source: Primary data **significant at 5% and * significant at 10%
Table 8 illustrates the logit analysis’ results, which indicate that the goodness of fit of the overall
model is very good. Nagelkerke R² and Cox & Snell R² are also measures of the goodness of fit
(Hair et al., 1998). The current model Nagelkerke R² is (0.61) whereas Cox & Snell R² is 0.51
which is fairly high suggesting a good fit for the model. The predictive power of the model is
very good with an overall accuracy of 61.2 percent.
4.3.3.2 Factors that affect willingness to invest as interpreted from the model
From Table 8 it can be noted that the strongest predictors of SME willingness to Invest (WTI)
were having investment capital, access to credit, information and owning fixed asset. In this case,
the fixed assets considered included sitting land, machinery, equipment, structures and
automobiles and having substantial investment capital (fixed assets + liquidity). The positive
coefficients imply a positive direction. As the fixed asset value and invest capital of an enterprise
(SME) increases so does its willingness to invest. This is in agreement to previous researches
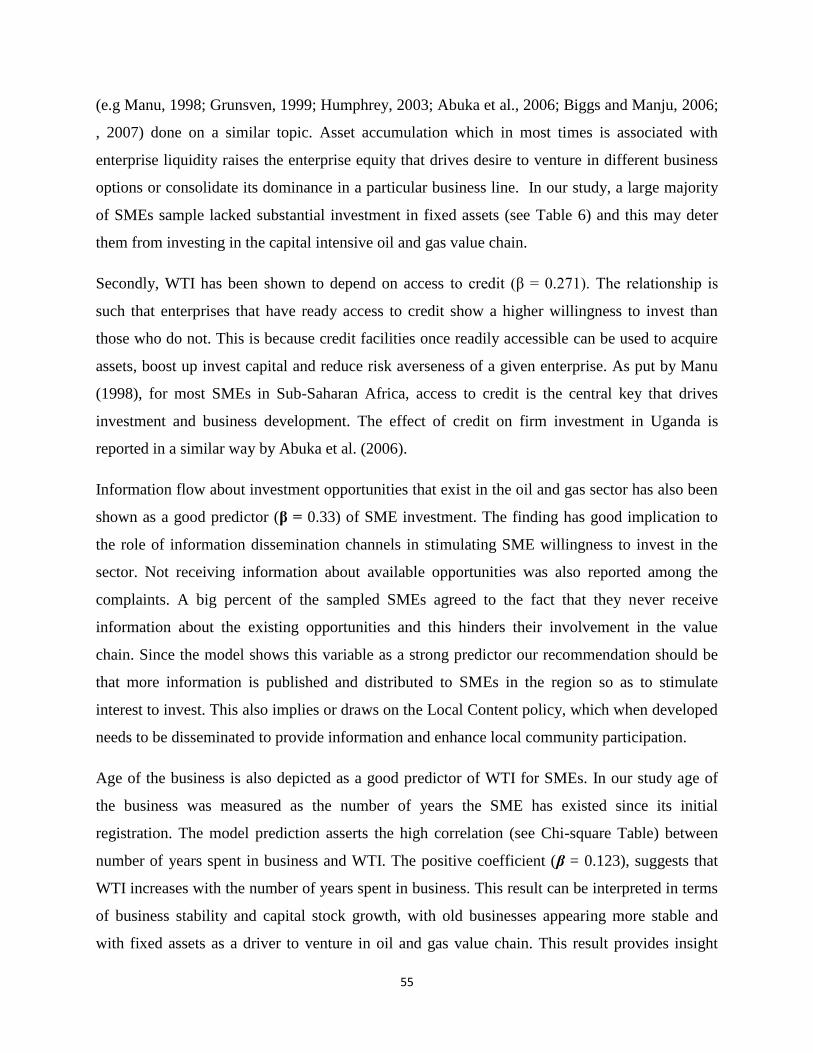
55
(e.g Manu, 1998; Grunsven, 1999; Humphrey, 2003; Abuka et al., 2006; Biggs and Manju, 2006;
, 2007) done on a similar topic. Asset accumulation which in most times is associated with
enterprise liquidity raises the enterprise equity that drives desire to venture in different business
options or consolidate its dominance in a particular business line. In our study, a large majority
of SMEs sample lacked substantial investment in fixed assets (see Table 6) and this may deter
them from investing in the capital intensive oil and gas value chain.
Secondly, WTI has been shown to depend on access to credit (β = 0.271). The relationship is
such that enterprises that have ready access to credit show a higher willingness to invest than
those who do not. This is because credit facilities once readily accessible can be used to acquire
assets, boost up invest capital and reduce risk averseness of a given enterprise. As put by Manu
(1998), for most SMEs in Sub-Saharan Africa, access to credit is the central key that drives
investment and business development. The effect of credit on firm investment in Uganda is
reported in a similar way by Abuka et al. (2006).
Information flow about investment opportunities that exist in the oil and gas sector has also been
shown as a good predictor (β = 0.33) of SME investment. The finding has good implication to
the role of information dissemination channels in stimulating SME willingness to invest in the
sector. Not receiving information about available opportunities was also reported among the
complaints. A big percent of the sampled SMEs agreed to the fact that they never receive
information about the existing opportunities and this hinders their involvement in the value
chain. Since the model shows this variable as a strong predictor our recommendation should be
that more information is published and distributed to SMEs in the region so as to stimulate
interest to invest. This also implies or draws on the Local Content policy, which when developed
needs to be disseminated to provide information and enhance local community participation.
Age of the business is also depicted as a good predictor of WTI for SMEs. In our study age of
the business was measured as the number of years the SME has existed since its initial
registration. The model prediction asserts the high correlation (see Chi-square Table) between
number of years spent in business and WTI. The positive coefficient (β = 0.123), suggests that
WTI increases with the number of years spent in business. This result can be interpreted in terms
of business stability and capital stock growth, with old businesses appearing more stable and
with fixed assets as a driver to venture in oil and gas value chain. This result provides insight
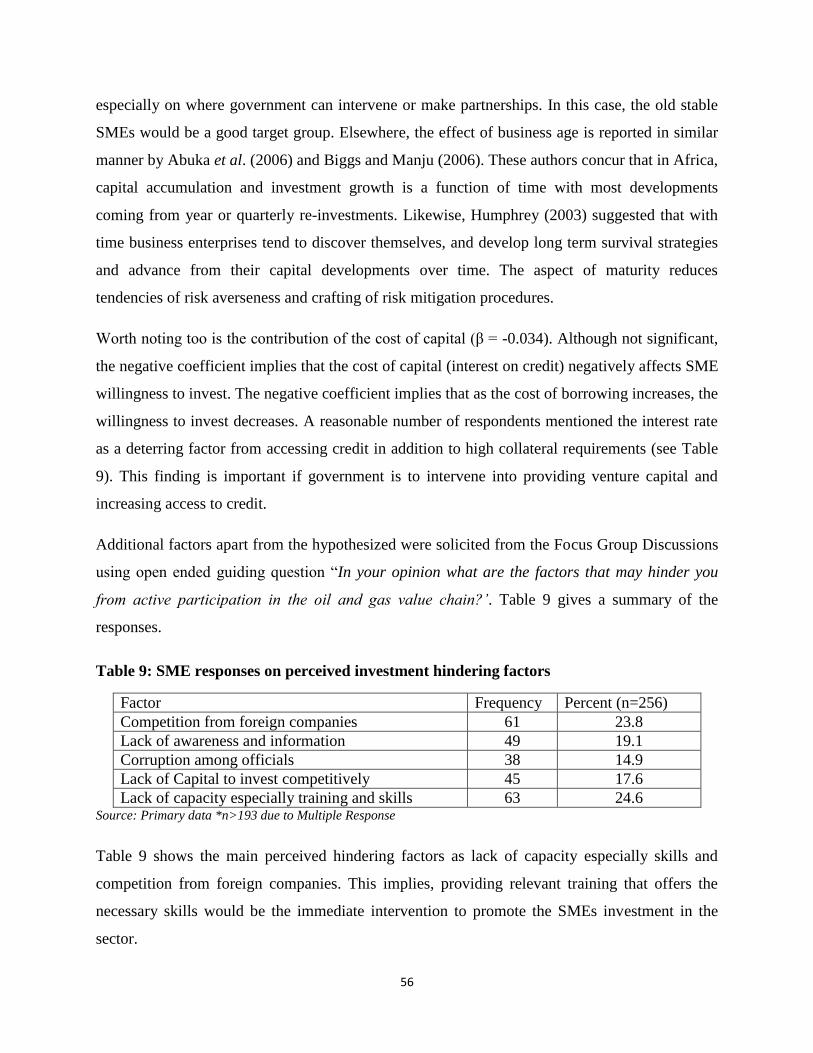
56
especially on where government can intervene or make partnerships. In this case, the old stable
SMEs would be a good target group. Elsewhere, the effect of business age is reported in similar
manner by Abuka et al. (2006) and Biggs and Manju (2006). These authors concur that in Africa,
capital accumulation and investment growth is a function of time with most developments
coming from year or quarterly re-investments. Likewise, Humphrey (2003) suggested that with
time business enterprises tend to discover themselves, and develop long term survival strategies
and advance from their capital developments over time. The aspect of maturity reduces
tendencies of risk averseness and crafting of risk mitigation procedures.
Worth noting too is the contribution of the cost of capital (β = -0.034). Although not significant,
the negative coefficient implies that the cost of capital (interest on credit) negatively affects SME
willingness to invest. The negative coefficient implies that as the cost of borrowing increases, the
willingness to invest decreases. A reasonable number of respondents mentioned the interest rate
as a deterring factor from accessing credit in addition to high collateral requirements (see Table
9). This finding is important if government is to intervene into providing venture capital and
increasing access to credit.
Additional factors apart from the hypothesized were solicited from the Focus Group Discussions
using open ended guiding question “In your opinion what are the factors that may hinder you
from active participation in the oil and gas value chain?’. Table 9 gives a summary of the
responses.
Table 9: SME responses on perceived investment hindering factors
Factor Frequency Percent (n=256)
Competition from foreign companies 61 23.8
Lack of awareness and information 49 19.1
Corruption among officials 38 14.9
Lack of Capital to invest competitively 45 17.6
Lack of capacity especially training and skills 63 24.6 Source: Primary data *n>193 due to Multiple Response
Table 9 shows the main perceived hindering factors as lack of capacity especially skills and
competition from foreign companies. This implies, providing relevant training that offers the
necessary skills would be the immediate intervention to promote the SMEs investment in the
sector.
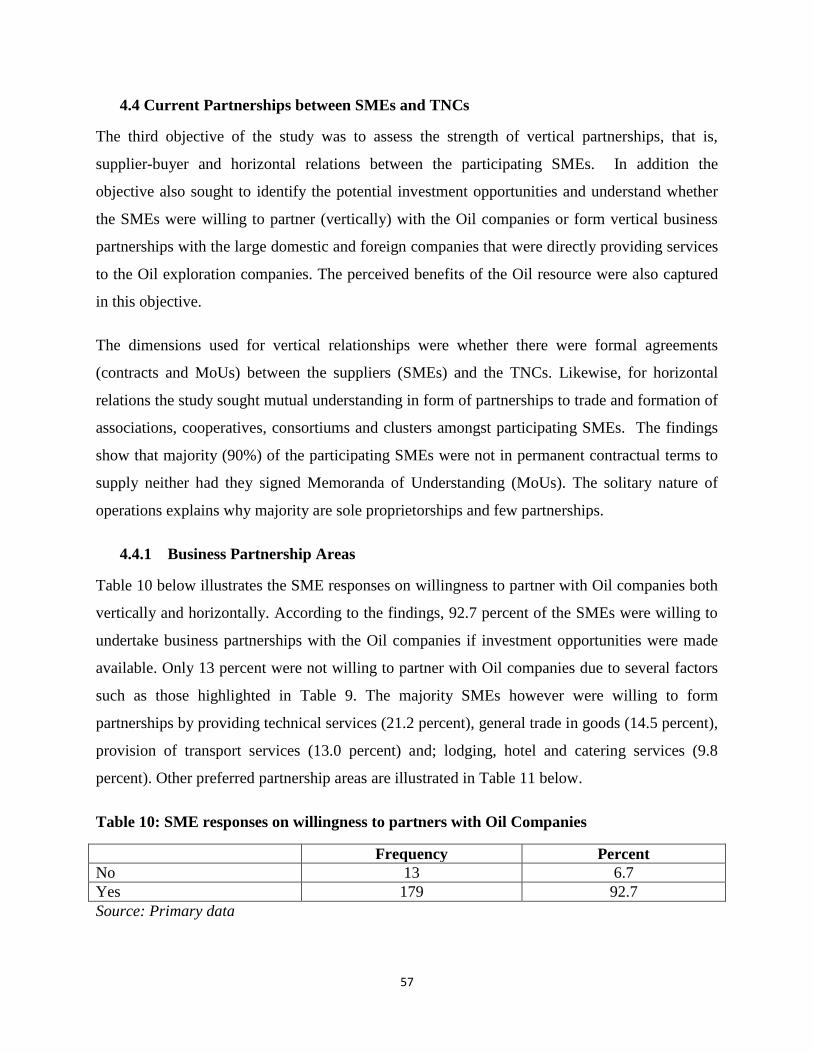
57
4.4 Current Partnerships between SMEs and TNCs
The third objective of the study was to assess the strength of vertical partnerships, that is,
supplier-buyer and horizontal relations between the participating SMEs. In addition the
objective also sought to identify the potential investment opportunities and understand whether
the SMEs were willing to partner (vertically) with the Oil companies or form vertical business
partnerships with the large domestic and foreign companies that were directly providing services
to the Oil exploration companies. The perceived benefits of the Oil resource were also captured
in this objective.
The dimensions used for vertical relationships were whether there were formal agreements
(contracts and MoUs) between the suppliers (SMEs) and the TNCs. Likewise, for horizontal
relations the study sought mutual understanding in form of partnerships to trade and formation of
associations, cooperatives, consortiums and clusters amongst participating SMEs. The findings
show that majority (90%) of the participating SMEs were not in permanent contractual terms to
supply neither had they signed Memoranda of Understanding (MoUs). The solitary nature of
operations explains why majority are sole proprietorships and few partnerships.
4.4.1 Business Partnership Areas
Table 10 below illustrates the SME responses on willingness to partner with Oil companies both
vertically and horizontally. According to the findings, 92.7 percent of the SMEs were willing to
undertake business partnerships with the Oil companies if investment opportunities were made
available. Only 13 percent were not willing to partner with Oil companies due to several factors
such as those highlighted in Table 9. The majority SMEs however were willing to form
partnerships by providing technical services (21.2 percent), general trade in goods (14.5 percent),
provision of transport services (13.0 percent) and; lodging, hotel and catering services (9.8
percent). Other preferred partnership areas are illustrated in Table 11 below.
Table 10: SME responses on willingness to partners with Oil Companies
Frequency Percent
No 13 6.7
Yes 179 92.7
Source: Primary data

58
Table 11: Proposed SME Partnership Area by Industry
Sector Frequency Percent
Technical services 41 21.2
Trade in Goods 28 14.5
Transport Services 25 13
Lodging, Hotel and Catering Services 19 9.8
Logistics Services 17 8.8
None 13 6.7
Community and Social Services 11 5.7
Office supplies 10 5.2
Consultancy Services 6 3.1
Labor contracting 4 2.1
Microfinance 4 2.1
Supply Food stuff 3 1.6
Security 2 1
Warehousing and Facilities management 2 1
Supply of spare parts and mechanics 2 1
Waste Management 2 1
Fuel Supply 1 0.5
Source: Primary data
4.4.2 Potential investment opportunities for SMEs in the Oil and Gas Value Chain
Figure 5: Services demanded in the Upstream Petroleum activities. Source: Tullow Oil Ltd,
2009

59
From the findings shown in 4.4.1 the study further used the literature compiled by Tullow Oil
Limited which is one of the most engaged TNC in the oil exploration activities in Uganda.
Figure 4 is an illustration of various activities and services which at the same time present
investment and business opportunities demanded in the Oil industry. These services are broadly
classified into three namely; specialized/ core/ professional services, direct services and indirect
services. The specialized services occupying the innermost circle include Seismic surveys and
well drilling. These require sophisticated technology and are therefore high knowledge based
skills most of which are currently provided by large international oil companies. These
specialized services are complemented by direct services which are also relatively specialized
such as infield services, inspections, international freight services, civil, electrical and
mechanical engineering, environmental services, infield transport and specialist trades. The
specialized and direct services are further supported by a wider range of indirect services which
include catering, human resource, custom clearance, training, hotel/accommodation, emergency
services, information and communication technology services, medical services, security, crane
hire, waste management, office supplies and freight forwarding. Since Uganda is still in the
exploration stage where the demand for core and specialized services is intense, it possibly
explains the minimal involvement of SMEs who lack the technology, skilled manpower and
required level of finance to provide the relevant services. The sector, however, provides more
indirect and less specialized opportunities especially during field development and oil production
stages implying that Uganda whose Oil was discovered about 5 years ago needs to develop a
targeted and comprehensive policy approach to ensure that the SMEs are prepared to usurp these
opportunities.
4.5 Perceived expected benefits from Oil Trade in the studied districts
The findings of the study indicate that the respondents generally thought that the oil discovery would
bring in benefits to their communities and the country as a whole (Table 12). The majority (26.1%)
thought that employment opportunities would be generated, while, 22.8% and 20.1%, respectively,
expected improvement in the infrastructure and service/utility extensions services to the local
population.
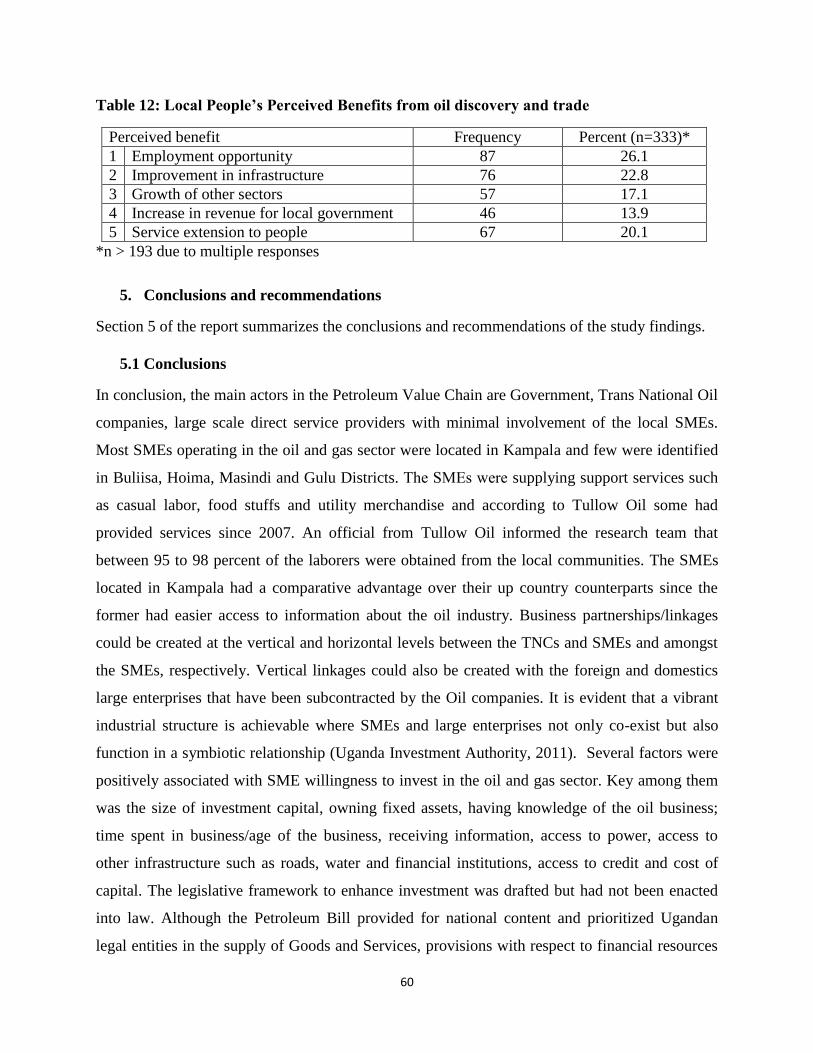
60
Table 12: Local People’s Perceived Benefits from oil discovery and trade
Perceived benefit Frequency Percent (n=333)*
1 Employment opportunity 87 26.1
2 Improvement in infrastructure 76 22.8
3 Growth of other sectors 57 17.1
4 Increase in revenue for local government 46 13.9
5 Service extension to people 67 20.1
*n > 193 due to multiple responses
5. Conclusions and recommendations
Section 5 of the report summarizes the conclusions and recommendations of the study findings.
5.1 Conclusions
In conclusion, the main actors in the Petroleum Value Chain are Government, Trans National Oil
companies, large scale direct service providers with minimal involvement of the local SMEs.
Most SMEs operating in the oil and gas sector were located in Kampala and few were identified
in Buliisa, Hoima, Masindi and Gulu Districts. The SMEs were supplying support services such
as casual labor, food stuffs and utility merchandise and according to Tullow Oil some had
provided services since 2007. An official from Tullow Oil informed the research team that
between 95 to 98 percent of the laborers were obtained from the local communities. The SMEs
located in Kampala had a comparative advantage over their up country counterparts since the
former had easier access to information about the oil industry. Business partnerships/linkages
could be created at the vertical and horizontal levels between the TNCs and SMEs and amongst
the SMEs, respectively. Vertical linkages could also be created with the foreign and domestics
large enterprises that have been subcontracted by the Oil companies. It is evident that a vibrant
industrial structure is achievable where SMEs and large enterprises not only co-exist but also
function in a symbiotic relationship (Uganda Investment Authority, 2011). Several factors were
positively associated with SME willingness to invest in the oil and gas sector. Key among them
was the size of investment capital, owning fixed assets, having knowledge of the oil business;
time spent in business/age of the business, receiving information, access to power, access to
other infrastructure such as roads, water and financial institutions, access to credit and cost of
capital. The legislative framework to enhance investment was drafted but had not been enacted
into law. Although the Petroleum Bill provided for national content and prioritized Ugandan
legal entities in the supply of Goods and Services, provisions with respect to financial resources

61
and investment incentives to SMEs should be considered and a further study in this aspect was
recommended. SMEs remain challenged by lack of substantial operating and fixed capital to
engage in several business activities on a large scale and yet they are considered a major source
of employment in many developing countries. The lack of finance impacts on their ability to
advance their technology and employ skilled manpower. Procurement of services required by oil
companies in certain sectors such as Transport and Logistics were deemed complex. SMEs lack
international quality certifications and some are not aware of them and yet they are required by
the Oil Companies. For instance in the transport sector, drivers of trucks require specific
qualifications and certifications. The aviation sector also requires fulfillment of specific
standards and certification some of which could not be met by the SMEs in the aviation industry.
Other internal factors such as high costs of production affect SMEs and impact on their ability to
supply in bulk quantity and as a result some have lost business to more competitive large
companies.
5.2 Recommendations
From the findings and conclusions of the study the following actions are recommended for
implementation by relevant government institutions in partnership with the private sector and
development partners. These recommendations could be implemented in the short term, medium
term and long term.
5.2.1 Short term Recommendations
a) With the help of the existing Communication Strategy, awareness and sensitization
programmes for SMEs should be undertaken using the existing district systems/structures
and through private associations such as Enterprise Uganda, Uganda Small Scale Industry
Association, private associations at the Districts and Uganda Women Entrepreneurs
Association. Such programmes should clearly provide information on developments, future
plans and business opportunities.
b) Government in collaboration with Oil companies should document procedures, policies and
certifications demanded by oil companies to enable SMEs understand their contract
needs/requirements. This will facilitate SME investment and reduce the lead time spent in
preparing tender documents for various services such as transport, medical, air services,
insurance, logistics, environment, etc. Such guidelines should be published on websites of
62
institutions such as Uganda Investment Authority, Uganda National Chamber of Mines and
Petroleum and other private sector associations to ensure that such information is provided
on demand.
c) In line with (c) above, a training programme for SMEs on contract management and
tendering should be created with the Oil companies. This will assist SMEs to understand the
demands of the oil companies and enable oil companies understand the local SME sector and
the environment in which they operate.
d) SMEs operating in similar sectors such as agriculture, metal fabrication and those within the
same localities should be assisted and encouraged to form strategic partnerships such as
cooperatives, clusters, consortiums and joint ventures with large contractors to improve their
ability to supply quality products, improve their skills, technology and ease access to
financial services. In addition SMEs should be encouraged to obtain membership in private
sector associations and chambers of commerce so as to improve their access to information,
e) Uganda Investment Authority in close collaboration with Transnational Corporations in Oil
and Gas should develop a comprehensive Business Linkage Programme to consolidate the
TNCs business relations with SMEs. A database/business register profiling potential SME
service providers in various industries should be developed. The profile should indicate the
internal and external capacity of the existing SMEs in terms of skills /technology, cash flow,
growth patterns, age of business and access to capital.
f) Government should undertake a study that identifies and profiles specific services for SME
investment. These should be incorporated in the Local Content Policy and Act.
g) Provide Investment incentives to the following:
SMEs willing to invest upcountry or in rural areas to redistribute wealth and
development in upcountry districts that are challenged with lack of infrastructure
(Transport, Energy, ICT, Water, etc).
Large domestic companies that are already doing business with Oil companies to
encourage them to sub contract SMEs in the provision and supply of goods and
services – especially those that are not directly linked with their current business
operations.

63
5.2.2 Medium Term Recommendations
a) Oil companies should review their pre-qualification requirements and systems for contracts
that can be supplied by SMEs.
b) A study on preparedness of SMEs to usurp opportunities in the sector, reviewing the current
legislative and policy framework in the industry and how it affects SME investment as well
as a study guiding Government on priority sectors for SME investment should be considered.
5.2.3 Long Term Recommendation
a) Develop an SME Investment Plan for the Oil Industry to guide government in the
development of strategic interventions and policies that will enhance future SME investment
in the Oil sector.
b) Ministry of Finance, Planning and Economic Development together with Development
partners establish an SME fund or credit facility that will provide long term venture capital
and trade finance at competitive interest rates as low as 5% to create financial confidentiality
and ease access to finance.
c) Expedite the development of the Local Content Policy and Act to provide the enabling legal
and institutional framework for investment. The Policy needs to provide for SME
participation in the sector, for instance 10 percent of products sourced locally should be
supplied by SMEs. Such services can include welding and fabrication services, laundry
services, supply of casual labour, transport and vehicle hire, supply of agricultural produce,
accommodation/lodging services and logistics. Private sector associations catering for the
needs of SMEs should be involved in the development of the policy.
64
References
Abuka C.A., K.A Egesa, I. Atai M. Obwona (2006). Firm Level Investment: Trends,
determinants and Constraints: Research Series No.47, Economic Policy Research Centre
(EPRC), Makerere University, Kampala.
African Development Bank and the African Union (2009). “Oil and Gas in Africa.”
Aneke, P. (2002). The role of major operators in the development of local content in the Nigerian
oil and gas industry. A paper delivered during the national seminar on the dynamics of
equipment leasing and contract financing for local contractors in the Oil and Gas sector, Port
Harcourt, Nigeria.
Aneki, 2010 “Poorest countries in the World.” http://www.aneki.com/index.html
Antonio, Emilio Jr. and Rodolfo, Ma. Cherry Lyn (2006) “Assessment of Competitiveness and
APEC-In the case of the Philippines.” APEC Study Center Institute of Developing
Ariweriokuma, S. (2009). The Political Economy of Oil and Gas in Africa: The Case of Nigeria.
New York: Routledge
Ayyagari, Meghana., Thorsten Beck, Asli Demirgüc-Kunt (2003), “Small and Medium
Enterprises Across the Globe”, World Bank Policy Research Working Paper 3127, August,
Washington D.C.
Babbie, E. (2007). The Practice of Social Research. 11th ed. Belmont, CA:
Wadsworth/Thomson.
Babu, B.V., Humbad, A. and Kumar, S. 2009. Carbon credits for energy self sufficiency in rural
India. A case study. Energy Education, science and Technology part A: Energy, Science and
Research.
Badrinath et al., (1997), “The SME and the Global Market Place: An Analysis of
Competitiveness Constraints”, UNCTAD/ WTO International Trade Center, Geneva.
Biggs, T A, and Manju Kedia Shaha (2006) African SMEs, networks, and manufacturing
performance, Journal of Banking & Finance, Volume 30, Issue 11, November 2006, Pages
3043-3066
Banga M, Razack B. Lokina and Adolf F. Mkenda (2011). Households' Willingness to Pay for
Improved Solid Waste Collection Services in Kampala City, Uganda. The Journal of
Environment Development 2011 20: 428
Business in Development Network, 2008, “Investing in Small and Medium Sized Enterprises in Uganda”
Byaruhanga H., P., Mwakali,J., Ekern, O.F (2011) “Enhancing Local Content in the Oil and Gas
Industry in Uganda.”
Darku, A. B (2001). Private Investment, Uncertainty, and Irreversibility in Uganda, African
Finance Journal 3:1-25.
ECSCAP (2009). “Globalization of Production and the Competitiveness of Small and Medium
Sized Enterprises in the Asian and Pacific Region.”
Energy Intelligence, (2008). “Uganda: Testing threshold.” European Commission, 2005, “The
new SME definition – User guide and Model declaration, Enterprise and Industry publications.
Fries, B., and Banu Akin, 2004. Value Chains and Their Significance for Addressing the Rural
Financial Challenge. USAID. AMAP MicroReport # 20.
Fujita, Y., Fujii, A., Furukawa, S., & Ogawa, T. (2005). Estimation of willingness-to pay (WTP)
for water and sanitation services through contingent valuation method (CVM)—A case study in
Iquitos City, The Republic of Peru. Retrieved from http://www.jbic.go.jp/en/
research/report/jbic-review/pdf/report10_2.pdf

65
Ghauri, P. and Grønhaug, K. (2002). Research Methods in Business Studies: A Practical Guide.
2nd
ed. London: Prentice-Hall.
Gereffi G and Olga M (2003). “The Global Apparel Value Chain: What Prospects for Upgrading
by Developing countries? UNIDO, Vienna.
Goodwin, B. and Schroeder, T. (1994). Human capital, producer education programs, and the
adoption of forward- pricing methods. American Journal of Agricultural Economics 76: 936-
947.
Graham Hall & Ciwen Tu ( 2003). Venture capitalists and the decision to invest overseas.
Venture Capital: An International Journal of Entrepreneurial Finance Volume 5, Issue 2, 2003.
DOI: 10.1080/1369106032000097058
Grunsven, L. (1999). "Development of local SMEs through supply linkages with MNC
transplants: Opportunities for and barriers to entry - An empirical study in Johore Bahru
District, Johor, Malaysia", paper presented at the International Conference on SMEs at
NewCrossroads, Centre for Policy Research, 28-30 September, University Sains Malaysia,
Penang.
Guerre, E. and Moon, H. R. (2005). “A study of a Semi parametric Binary choice model with
integrated covariates.” IEPR Working Paper No. 05-.37
Heum, P., Quale, C., karlsen, J.E., Kragha, M. and Osahon G., (2003). Enhancement of Local
Content in the Upstream Oil and gas Industry in Nigeria: A comprehensive and viable policy
approach; joint study by SNF-Institute for Research in Economics and Business
Administration, Bergen, Norway SNF Report No. 25/03 (August)
Humphrey, J. (2003). "Opportunities for SMEs in developing countries to upgrade in the global
economy", International Labour Organization SEED Working Paper 43, Geneva, ILO.
Humphrey, J., and Schmitz, H. (2002): Developing Country Firms in the World Economy:
Governance and Upgrading in Global Value Chains. INEF Report 61, Duisburg.
International Alert, 2009, “Harnessing Oil for Peace and development in Uganda,”
Internal Food Policy Research Institute (IFPRI)(2009). “Transaction costs and investment in
irrigation pumps: evidence from Nigeria.”
Jaakko I. Aspara (2012). The Influence of Product Design Evaluations on Investors’ Willingness
to Invest in Companies: Theory and Experiment with Finnish Individual Investors. Design
Management Journal Volume 6, Issue 1, pages 79–93, October 2011
Jenkins, Beth, Anna Akhalkatsi, Brad Roberts, and Amanda Gardiner (2007). Business Linkages:
Lessons, Opportunities, and Challenges. IFC, International Business Leaders Forum, and the
Kennedy School of Government, Harvard University
Judge, G., Griffiths, W. and Hill, R. C. (1980). “The theory and practice of econometrics”. John
Wiley and Co, New York
Kaplinsky, R., Morris, M. (2001): A Handbook for Value Chain Research, paper prepared for the
IDRC, http://www.ids.ac.uk/ids/global/pdfs/VchNov01.pdf.
Kasekende L. and H. Opondo (2003). Financing Small and Medium-scale Enterprises (SMEs):
Uganda’s Experience. BOU Working Paper, WP/03/01
Kula, O., Downing, J., Field, M (2006). Globalization and the Small Firm: A Value Chain
Approach to Economic Growth and Poverty Reduction,; Micro Report No. 42, USAID.
Manu, G., (1998) Enterprise development in Africa - strategies for impact and growth, Small
Enterprise Development, Volume 9, Number 4, December 1998 , pp. 4-13(10)

66
Mburu, L. M., Wakhungu, J. W. and Gitu, K. W. (2007). “Determinants of small holder dairy
farmers’ adoption of various milk marketing channels in Kenya highlands”. Livestock
Research for Rural Development. 19: 34.
McCormick and Schmitz (2001): Manual for value chain research on home workers in the
garment industry, Institute for Development Studies, University of Sussex, UK
Ministry of Energy and Mineral Development (2008). “National Oil and Gas Policy for
Uganda.”
Ministry of Energy and Mineral Development (2010). Paper presented at the United
Kingdom/Uganda Investment Forum, London, September 2010.
National Planning Authority (2010). “Uganda’s National Development Plan 2010/11 – 2014/15.”
Ministry of Finance, Planning and Economic Development (2007). Development of a National
Micro, Small and Medium Enterprises (MSMEs) Policy and Strategy, Draft report 2007
Nwosu, H.U., I. Nwacu., T Ogaji and S.D. Probert (2006). “Local Involvement in Harnessing
Crude Oil and Natural Gas in Nigeria.”
Nunnally, J. (1978). Psychometric Theory. New York: McGraw-Hill.
Nzomoi, J.N., Byaruhanga, J. K.and Maritin, H. K. (2007). ”Determinants of technology
adoption in the production of horticultural export produce in Kenya”. African Journal of
Business Management 1: 129-135.
Ogiemwonyi, C.O. (2001). “Alliancing as a tool to increase Local Content in the Nigerian Oil
industry.” Paper Presented at the Offshore Petroleum conference, Houston. April/may, pp1-6.
Oladele, O.R. (2001). “Opportunities for Indigenous Participation.” Paper presented at the NNPC
workshop on Improvement of Local Content.
Olurunfemi, M. A. (2001). “The Role of Financial Institutions in promoting Local Content and
Indigenous participation in the Oil industry.” Paper presented at the NNPC national Workshop
on Local Content. August 2 – 3, pp. 1 – 10
Organization for Economic Co-operation and Development (OECD) (1997), Globalization and
Small and Medium Enterprises, V. 1: Synthesis Report, Paris
Organization for Economic Co-operation and Development (OECD). (2000). “Small and
medium sized Enterprises: Local strength, global reach, OECD Policy Review.”
Organization for Economic Co-operation and Development (OECD) (2004). Promoting
Entrepreneurship and Innovative SMEs In a Global Economy: Towards a More Responsible
and Inclusive Globalisation. 2nd OECD Conference Of Ministers responsible for Small
and Medium-sized Enterprises (SMEs) Istanbul, Turkey 3-5 June 2004
Payne, J., Fernandez- Cornejo, J. and Daberkow, S. (2003). “Factors affecting the likelihood of
corn rootworm Bt seed adoption.” AgBioForum, 6: 79-86. Available on the World Wide Web:
http://www.agbioforum.org/
Porter, M. 1980. Competitive Strategy: Techniques for Analyzing Industries and Competitors.
New York, NY: Free Press.
Porter, M. 1985. Competitive Advantage. New York, NY: Free Press.
Porter, M. 1990. The Competitive Advantage of Nations. New York, NY: Free Press.
Reinikka R and Svensson, J., (2001). Confronting Competition: Investment, Profit, and Risk: In
R. Reinikka and P. Collier (eds.), Uganda’s Recovery: The Role of Farms, Firms and
Government, Washington DC. The World Bank.
Simchi, Levi, D.,Kaminsky,P.,Simchi Levi,E.(2003). Designing and managing the supply chain:
the Development Challenges”. Chapter 8 in ERIA Research Project Report 2007 No. 5. In
Asian SMEs and Globalization, ed. Lim, H.

67
Uganda Bureau of Statistics (2011). “Census of Business Establishments 2010/2011.”
Uganda Bureau of Statistics (2011). “Statistical Abstract.”
Uganda Investment Authority (2008). Outline of Business Linkages and other Investment
Opportunities in Uganda, Kampala
Uganda Investment Authority (2010) “National Investment Database.”
Ugwushi Bellema Ihua (2010). “Local Content Policy and SMEs Sector Promotion: The
Nigerian Oil Industry Experience.”
UNCTAD (2001).World Investment Report 2001: Promoting linkages. New York and Geneva:
United Nations.
UNCTAD (2003). “Improving the Competitiveness of SMEs through enhancing productive
capacity.”
UNIDO, Deloitte, The Global Compact, UNDP (2004). Partnerships for Small Enterprise
Development. London and Washington. Accessed online.
http://www.unido.org/index.php?id=o44527
United Nations Conference Trade And Development (2010(1). Integrating Developing
Countries` SME`s into Global Value Chains, Geneva.
United Nations Conference Trade And Development (2010(2).Creating Business Linkages: A
Policy Perspective, Geneva.
United Nations, (2007). “Millennium Development Goals: Uganda’s Progress Report 2007.”
United Nations, (2009). “Human Development Index Report”, Secretariat of the. United Nations,
New York and Geneva
USAID (2006). Indonesian Cocoa Bean Value Chain Case Study. MicroReport No.65. US>
Agency for International Development Washington DC.
USAID (2008). The gas to power value chain for Africa: Making ends meet. USAID Africa
Infrastructure Program. Washington DC. Oct 7 2008.
Verbic Miroslav, and Slabe Erker, Renata (2007). An Econometric Analysis of Willingness to
Pay for Sustainable Development: A Case Study of the Volcji Potok Landscape Area. ENEPRI
Working Paper, No. 53, 3 May 2007. [Working Paper]
White, S and J. Chacaltana (2002), “Enabling Small Enterprise through a Better Business
Environment: Donor Experiences in Supporting Reforms in the Business Environment”,
Committee of Donor Agencies for Small Enterprise Development, Working Group on Enabling
Environment, version 2, November, Washington D.C.
World Bank (2001), “Business Development Services for Small Enterprises: Guiding Principles
for Donor Intervention”, Committee of Donor Agencies for Small Enterprise Development,
2001 Edition, February, Washington D.C.
World Bank (2007), “Oil and Gas: A Blessing or A Curse?”
World Bank, (2009). “Study on National Oil Companies and Value Creation.” The World Bank
Oil, Gas and Mining Policy Division.