In Any Language - IssueLab
32
Speaking Together The George Washington University Medical Center School of Public Health and Health Services Department of Health Policy Speaking Together National Language Services Network Lessons Learned by In Any Language Improving the quality and availability of language services in hospitals
-
Upload
khangminh22 -
Category
Documents
-
view
4 -
download
0
Transcript of In Any Language - IssueLab
Speaking TogetherThe George Washington University Medical Center
School of Public Health and Health Services
Department of Health Policy
Speaking TogetherNational Language Services Network
Lessons Learned by
In Any LanguageImproving the quality and availability of language services in hospitals
AcknowledgmentsThe authors are grateful to The Robert Wood Johnson Foundation for its
leadership and support, and to Pam Dickson, M.B.A., Debra Perez, Ph.D.,
M.P.A., M.A., Minna Jung, J.D., John Lumpkin, M.D., M.P.H. and Jenne
Johns, M.P.H., of the Foundation for their guidance throughout this project.
The authors would like to thank the Speaking Together hospitals for
their dedication to improving health care for all Americans.
The authors also acknowledge Patrick McCabe, Becky Watt Knight,
and Nicolas Ferreyros from GYMR who provided communications
expertise throughout the project.
For more information about Speaking Together, please visit our website www.speakingtogether.org.
To request copies of this report, please contact Speaking Together at [email protected].
Speaking TogetherThe George Washington University Medical Center
School of Public Health and Health Services
Department of Health Policy
MAY 2008
by
Marsha Regenstein, Ph.D, M.C.P.
Jennifer Trott, M.P.H.
Catherine West, M.S., R.N.
Jennifer Huang, M.S.
In Any LanguageImproving the quality and availability of language services in hospitals
Speaking TogeTher program STaFF
Jennifer Huang, M.S.Research Scientist
Ji ImResearch Assistant
Holly Mead, Ph.D.Assistant Research Professor
Marsha Regenstein, Ph.D., M.C.P.Director
Melissa Stegun, M.A.Deputy Director
Jennifer Trott, M.P.H.Research Associate
Catherine West, M.S., R.N.Quality Improvement Specialist
Speaking TogeTher naTional adviSory CommiTTee
LaRay Brown, ChairSenior Vice-PresidentNew York City Health and Hospitals Corporation
Oscar ArochaDirector of Interpreter Services Department and Guest Support ServicesBoston Medical Center
Shelby DunsterResearch DirectorDivision of Standards and Survey MethodsJoint Commission on Accreditation of Healthcare Organizations
Joe Gallegos, M.B.A.Vice-President for Operations – Western U.S.National Association of Community Health Centers
Tawara Goode, M.A.Director, National Center for Cultural CompetenceGeorgetown University Center for Child and Human Development
Winston F. Wong, M.D.Clinical Director, Community BenefitKaiser Permanente, Care Management Institute
Mara Youdelman, J.D., L.L.M.Staff AttorneyNational Health Law Program
Speaking TogeTher adviSorS
Bruce Siegel, M.D., M.P.H.Director of Expecting Success and Urgent Matters The George Washington University Medical CenterSchool of Public Health and Health Services
Richard A. Wright, M.D., M.P.H., F.A.C.P.E. Management ConsultantWright Consulting
adviSorS To The naTional adviSory CommiTTee
Guadalupe Pacheco, M.S.W.Special Assistant to the DirectorOPHS/OS/USDHHS, Office of Minority Health
Yolanda Partida, M.S.W., D.P.A.Director, National Program OfficeHablamos Juntos
Speaking TogeTher hoSpiTalS
Bellevue Hospital CenterNew York, New YorkProject Director: William Bateman, M.D.
Cambridge Health AllianceCambridge, MassachusettsProject Director: Loretta Saint-Louis, Ph.D.
Children’s Hospital and Regional Medical CenterSeattle, WashingtonProject Director: Beth Ebel, M.D., M.P.H.
Hennepin County Medical CenterMinneapolis, MinnesotaProject Director: Joanne Hall, B.S.N., M.P.H.
Phoenix Children’s HospitalPhoenix, ArizonaProject Director: Irma Bustamante
Regions HospitalSt. Paul, MinnesotaProject Director: Sidney Van Dyke, M.A.
UMass Memorial Health CareWorcester, MassachusettsProject Director: Warren Ferguson, M.D.
UC Davis Health SystemSacramento, CaliforniaProject Director: Sergio Aguilar-Gaxiola, M.D., Ph.D.
University of Michigan Health SystemAnn Arbor, MichiganProject Director: Michelle Harris, M.B.A.
University of Rochester Medical CenterRochester, New YorkProject Director: Kathy Miraglia, M.S.
Measuring quality in language services delivery83
Lessons Learned
Introduction
261111121316
Performance improvement and language services
Factors for success
Setting the stage for change
Strategies for improvement
Findings of the Speaking Together Learning Network
Table of Contents
I n A n y L a n g u a g e
3
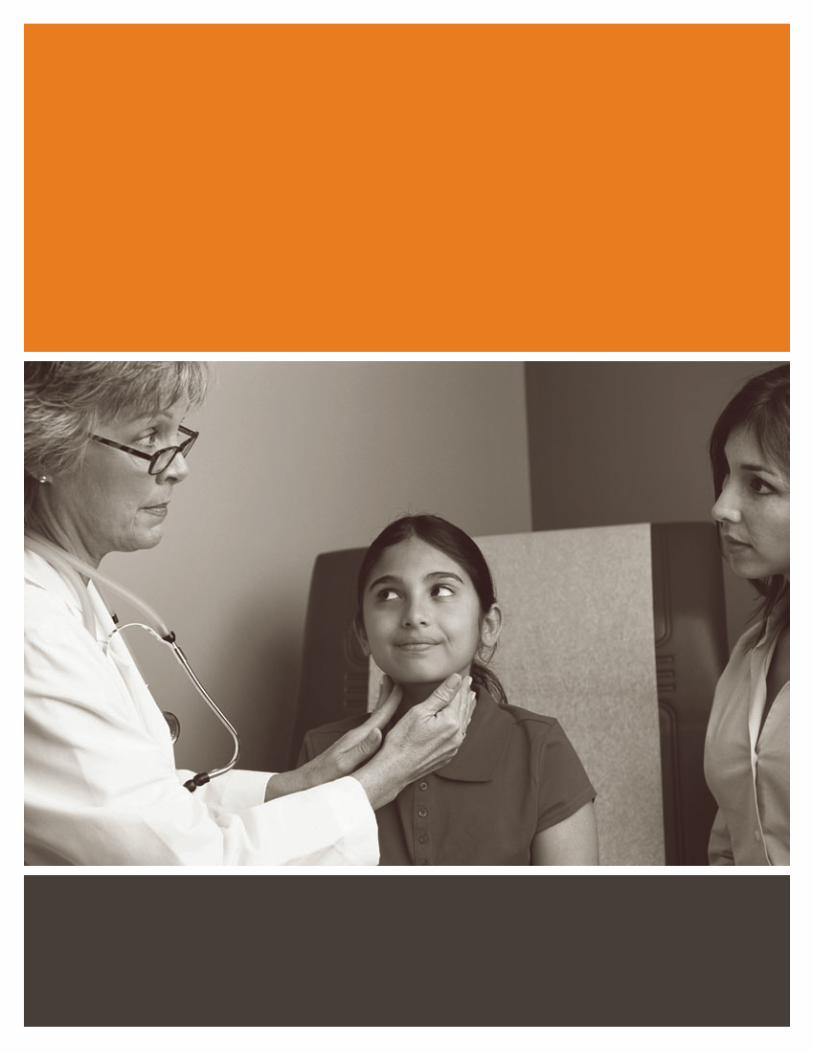
Communication is fundamental to receiving and providing
high-quality health care, yet every day, in communities all
across America, people are placed in exactly this frightening
and dangerous situation. A growing body of evidence
indicates that persons with limited English proficiency
(LEP) are getting the short end of the stick when it comes
to accessing high-quality health care. They have greater
difficulty obtaining care, get less primary care,1 receive
fewer preventive services,2 and—not surprisingly—are less
satisfied with their care.3
Imagine a different scenario—where people with LEP get
sick, contact the doctor’s office or enter an emergency
department—and are met with signage indicating the
availability of language services to ensure effective
communication for all patients in need of care. Imagine
them being joined by a trained interpreter—in person
or over a telephone, speakerphone, headphones, or
via video—as they describe symptoms to health care
providers; get clarifications to ensure full comprehension
between doctors and patients; ask questions about
medications or other instructions; be able to relay fears or
expectations and discuss these with the health care team.
Imagine each of these patients leaving the hospital feeling
as though they were active partners in their own care.
This latter scenario is playing out in many hospitals and other
health care organizations across the country. Pioneers in
language services delivery have spent the last few decades
building and nurturing programs to respond to the needs of
patients who would otherwise be at risk of receiving poor
quality care and experiencing higher rates of medical errors.4,5
IntroductionIt is hard for most people to imagine getting sick, going to a doctor’s office, entering an emergency department, or being admitted to a hospital, and not being able to speak the same language as the doctors, nurses, or staff. Yet for millions of people in America, this is a daily occurrence. They feel frustration and fear as they try to tell care providers what is wrong or what they are feeling. Sometimes, they have loved ones who can become their voice during the health care experience. All too often, however, they cannot be sure that what they are feeling is conveyed accurately, or what they are being told is all that the doctor said.
Introduction
Sprinkled across the country are hospitals that are
actively engaged in delivering health care for diverse
and rapidly changing patient populations. Anecdotally,
whether large or small, experienced or novice, hospitals
report that they are overwhelmed by the language needs
of patients and uncertain about how best to address
these growing demands.
This report showcases the work of some of these very
pioneers—hospitals that have thrown commitment,
resources, passion and energy behind one overarching goal:
to provide the best care possible for patients who cannot
rely on their English language skills to interact effectively with
the health care system. Some of these hospitals have been
operating language services programs for years; others
are veritable new kids on the block. All face challenges in
meeting the language needs of their patients in resource-
stressed, highly complex, and busy environments.
Some of these hospitals have come together as part of a
Robert Wood Johnson Foundation program designed to
improve the quality and availability of language services in
hospitals across the country. Speaking Together: National
Language Services Network, an initiative housed at the
George Washington University School of Public Health and
Health Services, brings tried and true quality improvement
tools to the field of language services. Until Speaking
Together, few hospitals actively involved language services
in quality improvement efforts.
Speaking Together was launched in November 2006,
following a competitive grant application process that
resulted in the selection of 10 participating hospitals.
To be eligible, hospitals had to have a substantial number
of LEP patients (in inpatient and outpatient settings) to
make quality improvement efforts meaningful, an established
language services department, and at least some on-site
interpreters who were employees of the hospital.
The hospitals selected to participate in Speaking Together
each received a $60,000 grant plus intensive technical
assistance throughout an 18-month learning network.
Table 1 includes information describing the participating
hospitals and the language services that they provide.
This report highlights the experiences of the Speaking
Together hospitals and showcases just some of the
initiatives and interventions that been implemented in these
health care organizations.6 It begins with a discussion of
a set of performance measures that were developed to
provide a common platform for working toward quality
improvement in language services. The next sections of the
report highlight the progress that the hospitals have made
in achieving their goals around improved language services
delivery. To this end, graphic illustrations are provided
describing performance on the language services measures
throughout the Learning Network. Also described are the
structural, organization and procedural changes that took
place in the hospitals to support and sustain change on
behalf of patients with language needs. The final section
provides some lessons born from experiences in Speaking
Together. The hope is that these experiences will help other
hospitals across the country tackle the tough challenge of
advancing language services within their organizations.
Introduction4
I n A n y L a n g u a g e
5
1 Weinick RM, Krauss NA. Racial and ethnic differences in children’s access to care. Am J Public Health 2000 Nov;90(11):1771-4.2 Woloshin S, Schwartz LM, Katz SJ, et al. Is language a barrier to the use of preventive services? J Gen Intern Med 1997 Aug;12(8):472-7.3 Andrulis D, Goodman N, Pryor C. What a difference an interpreter can make: Health care experiences of uninsured with limited English proficiency.
The Access Project, 2003 Apr. Boston (MA).4 Cohen AL, Rivara F, Marcuse EK, et al. Are language barriers associated with serious medical events in hospitalized pediatric patients?
Pediatrics 2005 Sep;116(3):575-9.5 Divi C, Koss RG, Schmaltz SP, et al. Language proficiency and adverse events in U.S. hospitals: a pilot study. Int J Qual Health Care 2007
Apr;19(2):60-7. Epub 2007 Feb 2. 6 Hospitals participating in Speaking Together each worked on two clinical measures that could demonstrate a link between language services delivery
and quality of patient care. Lessons and findings pertaining to these measures will be featured in subsequent reports.
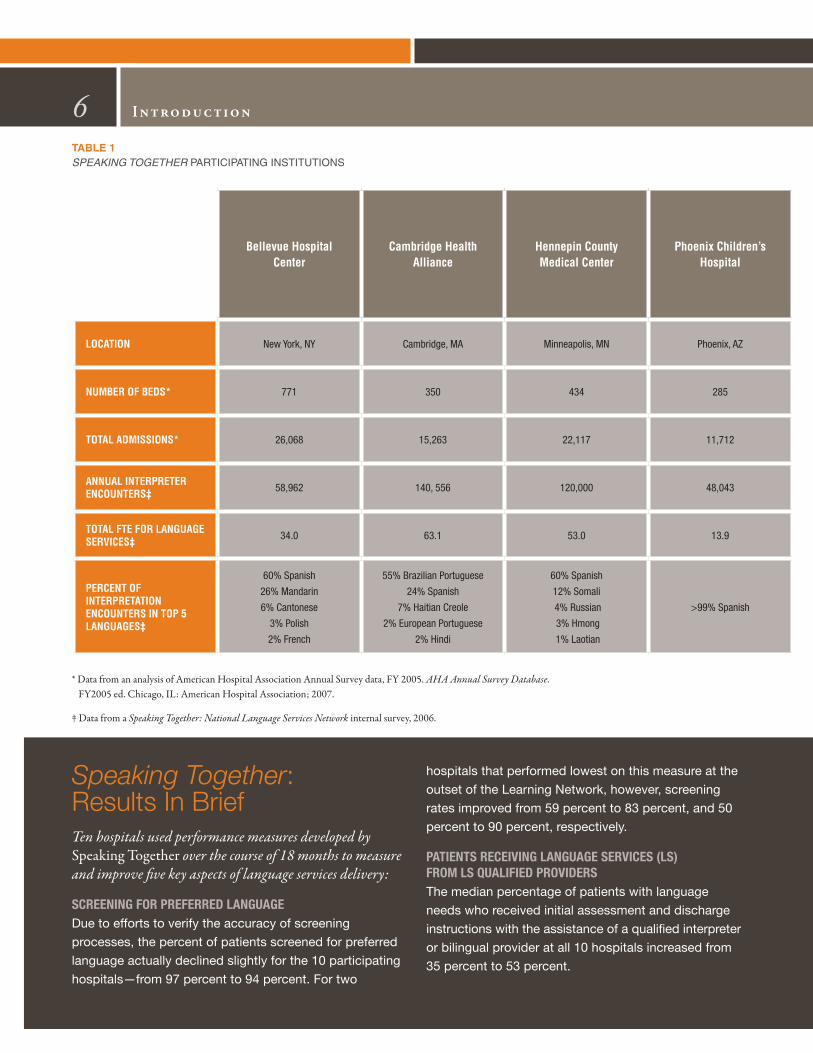
Introduction6Table 1 Speaking TogeTher ParticiPating institutions
Bellevue Hospital Center
Cambridge Health Alliance
Hennepin County Medical Center
Phoenix Children’s Hospital
LoCAtion New York, NY Cambridge, MA Minneapolis, MN Phoenix, AZ
nuMBer of Beds* 771 350 434 285
totAL AdMissions* 26,068 15,263 22,117 11,712
AnnuAL interPreter enCounters‡ 58,962 140, 556 120,000 48,043
totAL fte for LAnguAge serviCes‡ 34.0 63.1 53.0 13.9
PerCent of interPretAtion enCounters in toP 5 LAnguAges‡
60% Spanish
26% Mandarin
6% Cantonese
3% Polish
2% French
55% Brazilian Portuguese
24% Spanish
7% Haitian Creole
2% European Portuguese
2% Hindi
60% Spanish
12% Somali
4% Russian
3% Hmong
1% Laotian
>99% Spanish
* Data from an analysis of American Hospital Association Annual Survey data, FY 2005. AHA Annual Survey Database. FY2005 ed. Chicago, IL: American Hospital Association; 2007.
‡ Data from a Speaking Together: National Language Services Network internal survey, 2006.
Speaking Together: Results In BriefTen hospitals used performance measures developed by Speaking Together over the course of 18 months to measure and improve five key aspects of language services delivery:
SCREENING foR pREfERREd laNGuaGE Due to efforts to verify the accuracy of screening
processes, the percent of patients screened for preferred
language actually declined slightly for the 10 participating
hospitals—from 97 percent to 94 percent. For two
hospitals that performed lowest on this measure at the
outset of the Learning Network, however, screening
rates improved from 59 percent to 83 percent, and 50
percent to 90 percent, respectively.
patIENtS RECEIvING laNGuaGE SERvICES (lS) fRom lS qualIfIEd pRovIdERSThe median percentage of patients with language
needs who received initial assessment and discharge
instructions with the assistance of a qualified interpreter
or bilingual provider at all 10 hospitals increased from
35 percent to 53 percent.
I n A n y L a n g u a g e
7
regions Hospitaluniversity of
Michigan Health system
university of rochester (strong
Memorial Hospital)
Children’s Hospital and Medical Center
university of California davis Medical Center
university of Massachusetts
Memorial Health Care
St. Paul, MN Ann Arbor, Michigan Rochester, NY Seattle, WA Sacramento, CA Worcester, MA
399 802 973 250 526 731
22,82742,811
36,321 11,608 27,946 44,231
28,887 21,503 14,885 40,690 65,000 59,134
12.1 16.0 10.4 7.9 22.8 28.5
50% Spanish
12% Hmong
10% Somali
9% Vietnamese
4% ASL
22% Spanish
18% Chinese
14% Japanese
12% Arabic
10% Russian
46% Spanish
35% ASL
3% Vietnamese
2% Russian
2% Arabic
55% Spanish
7% Vietnamese
4% Somali
4% Russian
2% Cantonese
58% Spanish
20% Russian
8% Mien
5% Hmong
5% Cantonese/Mandarin
62% Spanish
13% Portuguese
7% Vietnamese
5% Albanian
3% ASL
patIENt waIt tImEFor the 10 participating hospitals, the median percentage
of patients who waited 15 minutes or less for an interpreter
held steady at about 94 percent. At one hospital, the
percent of patients waiting 15 minutes or less for an
interpreter increased from 66 percent to 93 percent.
tImE SpENt INtERpREtINGFor the 10 participating hospitals, the median time spent
interpreting increased from 39 percent to 43 percent.
Interpreter productivity increased on the whole, with a
10 percent relative increase among participating hospitals.
INtERpREtER dElay tImEFor the 10 participating hospitals, the median percentage
of encounters in which interpreters waited less than
10 minutes for a provider or patient improved from
83 percent to 89 percent. One hospital increased the
percent of encounters in which interpreters wait less
than 10 minutes for the provider or patient from
79 percent to 93 percent.
Quality improvement cannot take place without a clear
understanding of what constitutes high-quality care. Thus,
before a learning network could be assembled around the
delivery of language services in a hospital setting, a set of
common measures that would clearly stand for high-quality
service delivery had to be identified. Prior to Speaking
Together, these measures did not exist.
What did exist was a substantial amount of research,
information, and technical specifications about qualifications
of interpreters, the “architecture” of the interpreted health
care encounter,7 and training programs to support the
field of medical interpretation. Much of this wisdom was
incorporated into the program.
Even with this prior work, however, the field of language
services lacked measures that could be used by health care
organizations to assess how well they were meeting the
language needs of their patients. For this reason, Speaking
Together developed a multi-staged process to identify a core
set of measures that could ultimately be used by hospitals
interested in doing quality improvement in this area.8
Measuring Qual it y in Language Serv ices Del ivery8
What is Quality Improvement? Quality improvement uses measures to assess
whether processes are performing the way
they are intended. Data is collected to identify
areas for improvement and to develop and test
changes in processes so that the overall system
functions the way that it should. The emphasis is
on processes and the system rather than on the
individual or employee.
7 Much of the literature addresses how an encounter assisted by a medical interpreter should be conducted. For example, the positioning of the interpreter, how the interpreter interacts and conveys the message to the patient, and the role of the interpreter in the encounter (e.g., as a cultural broker of information versus strictly an interpreter) are all issues frequently dealt with in the literature.
8 Regenstein MJ, Huang JC, West C, et al. “Hospital Language Services: Quality Improvement and Performance Measures,” Advances in Patient Safety: New Directions and Alternative Approaches, AHRQ (to be released Spring 2008).
Measuring Quality in Language Services DeliveryMany hospitals across the country recognize that quality communication is critical to quality care, but without the tools to measure and strategically improve language services delivery they cannot ensure that their patients’ language needs are being met. This project began with the premise that high-quality language services can be measured and achieved by moving them into the mainstream of service delivery and quality improvement activities.
Several overarching principles guided the development
of the measures:
• health care organizations must know who among
their patients could benefit from language services.
In practice, this means that all patients should be asked
about their language preference. It also means that a
patient-centered approach must be taken to ensure
quality care.
• health care organizations must know whether
patients who need language services actually
receive them. Just knowing how many interpreted
encounters were provided in any given year does
not get to the more pressing issue of whether
the patient got the service when he or she needed it.
•health care organizations must develop a
supply of high-quality language services.
Whether through on-site staff or contract employees,
telephonic interpreting, video or remote simultaneous
interpretation, or via bilingual clinicians and staff,
health care organizations must be equipped to
effectively communicate with all of their patients.
• health care organizations must provide language
services in a timely manner. We learned from
countless discussions with doctors, nurses and hospital
administrators that if language services aren’t easily
accessible, they won’t be used.
In addition to these guiding principles, the measures were
driven by the idea that the same framework used to guide
quality in other aspects of patient care can be used to guide
quality in language services delivery. Table 2 describes the
domains of quality, as articulated by the Institute of Medicine,
adapted by Speaking Together for language services.
I n A n y L a n g u a g e
9Table 2institute of Medicine doMains of Quality adaPted for language services
doMAin PrinCiPLe
sAfe Avoiding injuries to patients from the language services that are intended to help them.
effeCtiveProviding language services based on scientific knowledge that contribute to all who could benefit, and refraining from providing
services to those not likely to benefit.
PAtient-CenteredProviding services that are respectful of and responsive to individual patient preferences, needs, culture and values, and ensuring
that patient values guide all clinical decisions.
tiMeLy Reducing waits and sometimes harmful delays for both those who receive and those who give care.
effiCient Avoiding waste, including waste of equipment, supplies, ideas and energy.
equitABLe Providing language services that do not vary in quality because of personal characteristics such as language preference, gender,
ethnicity, geographic location, and socioeconomic status.
Modified from: Institute of Medicine, Committee on Quality of Health Care in America. Crossing the Quality Chasm: a New Health System for the 21st Century. Washington (DC): National Academies Press; 2001.
What emerged from this process were five measures
that have been used throughout the Speaking Together
Learning Network to gauge progress in the 10 participating
hospitals. The Speaking Together (ST) measures are:
• ST1:ScreeningforPreferredLanguage
The percent of patients who have been screened for
their preferred spoken language.
• ST2:Patientsreceivinglanguageservices(LS)
from qualified lS providers
The percent of patients with language needs who
receive initial assessment and discharge instructions
from assessed and trained interpreters or from
assessed bilingual providers.9
• ST3:Patientwaittime
The percent of encounters where the patient wait
time for an interpreter is 15 minutes or less.
• ST4:TimeSpentInterpreting
The percent of time interpreters spent providing medical
interpretation in clinical encounters with patients.
• ST5:Interpreterdelaytime
The percent of encounters interpreters wait less
than 10 minutes to provide interpreter services
to clinician and patient.
10 Measuring Qual it y in Language Serv ices Del ivery
9 For the purposes of this measure, we identified two instances in a patient’s interaction with his or her provider during which adequate communication is absolutely necessary: during initial assessment and when receiving discharge instructions. Although there are other points in care in which language services may be necessary, we selected these two points as processes common to most patients in a hospital setting.
faCtoRS foR SuCCESS
• Using measurement to track language services
performance. Data are absolutely necessary to gauge
how well patients’ language needs are being met in the
organization. Collecting data is key to driving change,
engaging providers and directing improvement in the
organization. Hospitals must adopt core measures for
language services, such as the measures in this report, to
track their performance.
• Starting small before spreading to the rest of the
organization. Depending on the size of the hospital, its
experience with language services and the distribution
of patients across sites of care, hospitals can choose
to focus more or less narrowly to begin their quality
improvement work. However, all hospitals should test
one or more of these measures to assess current
performance and set targets for improvement before
deciding to spread to the rest of the organization. Starting
small allows for change and adjustment along the way,
and can save valuable resources.
• placing clinical providers at the forefront of
improvement efforts. The language services
department should work to make its services accessible
and up to quality standards, but providers are ultimately
responsible for ensuring that their patients’ language
needs are met. Without clinical involvement, an
organization cannot get language services to patients
who need them when they need them.
• Working with the quality improvement department
to develop and oversee strategies for change.
Language services must be linked with quality
improvement in the organization in order to effectively
embed language services into the organization and
prioritize areas for improvement.
• engaging senior and executive leadership in
achieving high-quality language services in the
organization. Meaningful change in the delivery of
language services cannot occur without the strong support
of leadership. A commitment to safe, effective, efficient,
equitable, timely and patient-centered communication
in the organization must come from above.
I n A n y L a n g u a g e
11Per formance Improvement in Language Serv ices
Performance Improvement in Language ServicesThe experiences of the Speaking Together hospitals demonstrate that with commitment, the right team and a solid foundation for success, health care organizations can measure and improve the performance of language services delivery.
• developing a relationship with registration and
scheduling departments as the first point of patient
contact. Accurate identification of a patient’s language
needs generally falls on registration and scheduling
staff. An effective language screening process creates
efficiencies in language services delivery and helps
ensure that patients needing services receive them.
• Seeking support from information technology
to link systems. Recording and tracking performance
information can be burdensome without the right
systems to support these processes. Language services
departments should work with information technology
and quality improvement to identify ways to link with
other key departments and systems in the organization,
such as registration and scheduling.
SEttING thE StaGE foR ChaNGE
Performance improvement in language services requires
more than commitment and a good foundation for success.
Hospitals need tools to assess performance and implement
change. In the Speaking Together Learning Network, the
following tools, collaborative learning and mechanisms of
support proved integral to improvement.
Per formance Improvement in Language Serv ices12
learning neTwork
MeeTingS
qualiTyiMproveMenT
planS and reporTS
conferencecallS
languageServiceSprograM
aSSeSSMenT
perforManceMeaSureMenTS
web-baSedreporTing and ToolS
Speaking Together Learning Network Activities
Data Collection and Reporting
Beginning in November 2006, the 10 Speaking Together
hospitals tracked progress in the delivery of language
services using the five ST measures. This was a challenging
undertaking for all hospitals involved, despite being chosen
in part because of their ability to participate successfully in a
quality improvement project.
The ST measures required the collection of new data
elements and, in many cases, new data collection
processes. Some hospitals developed relationships with
their information technology departments to facilitate data
collection efforts. Others created manual data collection
processes to capture information about patients’ receipt of
language services during initial assessment and discharge.
Several created working groups with registration staff to
make certain that the language screening process made
sense to staff and worked well for patients.
The Speaking Together project directors submitted monthly
data reports on the five measures plus progress reports
detailing challenges or successes from the previous month.
Technical Assistance
Hospitals received technical assistance from the Speaking
Together quality improvement specialist, a nurse with
substantial expertise in quality improvement, and other
program staff. This assistance included two on-site team
meetings with the QI specialist, as well as numerous
targeted discussions to make certain that each hospital
team understood the data collection requirements and
progressed according to its own particular goals. A
language services program assessment was conducted at
the start of the Learning Network to gain an understanding
of program structure and operations at each hospital.
Tools and RCC
Participants received training in rapid cycle change
(RCC)—a quality improvement technique that uses a “plan-
do-study-act” model. RCC allows organizations to test and
measure changes on a small scale before spreading to the
rest of the organization. In addition to training, ST hospitals
also received data collection and improvement tools to
measure performance and document strategies.
Speaking Together developed a collection of sample
strategies for change based on the experiences of the
ST hospitals in their first months as Learning Network
participants. The document, entitled “Tools for Improving
Language Services Delivery” was provided to hospitals in
later months of the project to spread tested strategies for
change among the hospitals.
Collaborative Learning and Sharing
Teams from all of the hospitals met as a group four
times during the course of the 18-month project—first
to learn about the processes and science behind quality
improvement, and later to share strategies and progress
through peer-to-peer learning. They also participated in
monthly conference calls that featured topical presentations
and updates from each hospital. The meetings and
conference calls were designed to foster both collaboration
and friendly competition among the hospitals. In addition to
web-based reporting of data, participants shared progress,
success stories, strategies, and tools via a private Learning
Network website.
StRatEGIES foR ImpRovEmENt
The Speaking Together hospitals used a variety of
strategies to improve the quality and availability of language
services in their organizations. Collectively, hospitals in
the Learning Network tested over 200 strategies using
quality improvement techniques (a small sample is shown
in Table 3). The strategies implemented by a given hospital
were largely dependent on available resources, needs of
the organization and the particular challenges facing that
language services program.
I n A n y L a n g u a g e
13
14 Per formance Improvement in Language Serv ices
Table 3saMPle strategies
MeAsure strAtegy
sCreening for Preferred LAnguAge
• Developscriptsforregistrationandschedulingstafftousewhenaskingaboutlanguagepreference
• Createandrevisealistthatregistrationandschedulingstaffcaneasilyuse
to select and record the preferred language of the patient
• Designateaplaceinthepatientrecordforrecordinglanguageneeds
PAtients reCeiving LAnguAge serviCes (Ls) froM quALified Ls Providers
• Includelanguageservicesinplannedcaremodelsandworkflows
• Programelectronicsystemstoautomaticallynotifylanguageserviceswhenappointments
requiring an interpreter are scheduled
• Assessbilingualprovidersforlanguageproficiency
• Placelanguagenexttopatient’snameofinpatientunitwhiteboards
PAtient WAit tiMe • Notifyclinicsinadvancewhichvisitswillbeassistedwithanin-personinterpreter
and which will be with phone or other remote methods
• Mapoutinterpreterschedulesbasedonpeakservicetimes,bylanguage
• Increaseaccesstoremoteinterpretingmethodsforinfrequentlanguages,
nights and weekends
tiMe sPent interPreting • Use data related to the encounter type and location of encounter to determine
how much time is needed to schedule the interpreter
• Revise interpreter assignments to decrease travel time
• Provide permanent interpreter assignments in high volume languages at high
volume locations
interPreter deLAy tiMe • BlockscheduleinterpretersinclinicswithahighvolumeofLEPpatients
speaking a particular language
• Conductdailymorninghuddleswithclinicalmanagerstoreviewtheday’s
schedule and interpreter needs
• Placeappointmentremindercallsthedaybefore
I n A n y L a n g u a g e
15
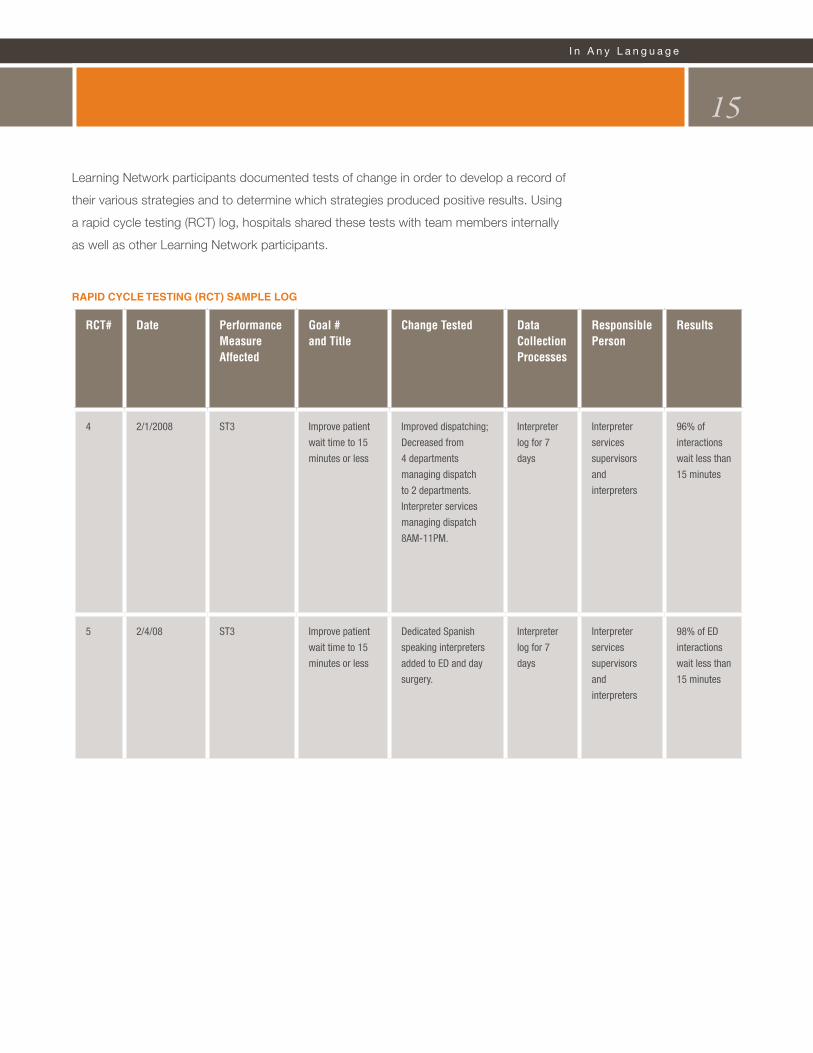
rapid cycle TeSTing (rcT) SaMple log
rCt# date Performance Measure Affected
goal # and title
Change tested data Collection Processes
responsible Person
results
4 2/1/2008 ST3 Improvepatient
wait time to 15
minutes or less
Improveddispatching;
Decreasedfrom
4 departments
managing dispatch
to 2 departments.
Interpreterservices
managing dispatch
8AM-11PM.
Interpreter
log for 7
days
Interpreter
services
supervisors
and
interpreters
96% of
interactions
wait less than
15 minutes
5 2/4/08 ST3 Improvepatient
wait time to 15
minutes or less
DedicatedSpanish
speaking interpreters
addedtoEDandday
surgery.
Interpreter
log for 7
days
Interpreter
services
supervisors
and
interpreters
98%ofED
interactions
wait less than
15 minutes
Learning Network participants documented tests of change in order to develop a record of
their various strategies and to determine which strategies produced positive results. Using
a rapid cycle testing (RCT) log, hospitals shared these tests with team members internally
as well as other Learning Network participants.
16
PE
RC
EN
T
YEAR–QUARTER
0%
20%
40%
60%
80%
100%
2006Q4 2007Q1 2007Q2 2007Q3 2007Q4 2008Q1
ST1
ST2
ST3
ST4
ST5
FIGURE 1SPEAKING TOGETHER PERFORMANCE MEASURES2006Q4 through 2008Q1 (median of all sites shown)
Per formance Improvement in Language Serv ices
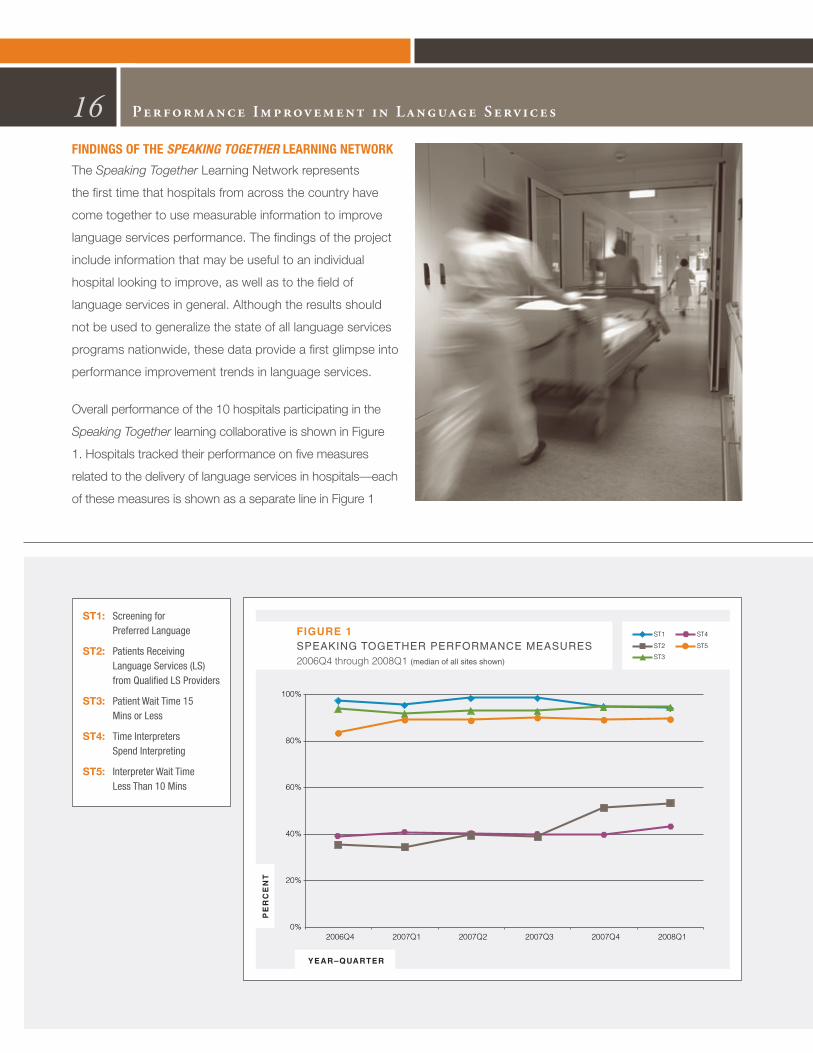
fINdINGS of thE Speaking TogeTher lEaRNING NEtwoRK
The Speaking Together Learning Network represents
the first time that hospitals from across the country have
come together to use measurable information to improve
language services performance. The findings of the project
include information that may be useful to an individual
hospital looking to improve, as well as to the field of
language services in general. Although the results should
not be used to generalize the state of all language services
programs nationwide, these data provide a first glimpse into
performance improvement trends in language services.
Overall performance of the 10 hospitals participating in the
Speaking Together learning collaborative is shown in Figure
1. Hospitals tracked their performance on five measures
related to the delivery of language services in hospitals—each
of these measures is shown as a separate line in Figure 1
ST1: Screening for Preferred Language
ST2: Patients Receiving Language Services (LS) from Qualified LS Providers
ST3: Patient Wait Time 15 Mins or Less
ST4: TimeInterpreters SpendInterpreting
ST5: InterpreterWaitTime Less Than 10 Mins
(illustrated by a separate color) over a 16-month period.
Each line corresponds to the median value of all 10 hospitals.
As Figure 1 graphically illustrates, performance is quite
high for three of the measures and much lower for two
others. Each measure is discussed separately below.
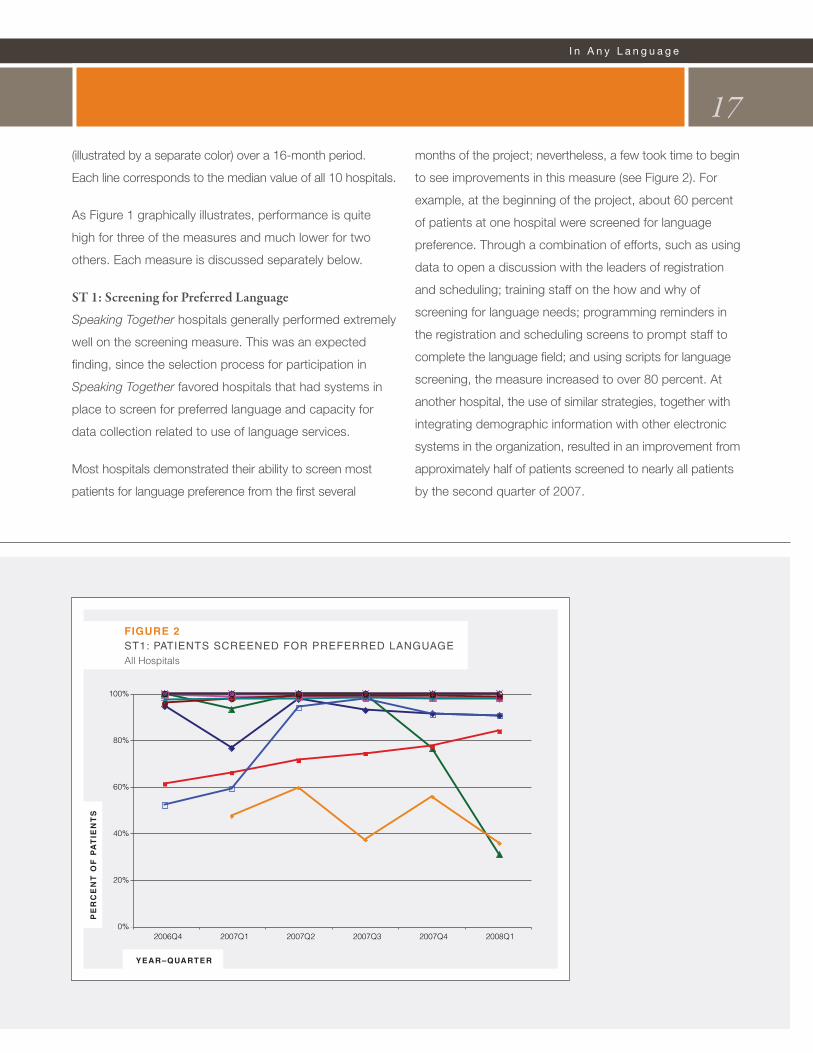
ST 1: Screening for Preferred Language
Speaking Together hospitals generally performed extremely
well on the screening measure. This was an expected
finding, since the selection process for participation in
Speaking Together favored hospitals that had systems in
place to screen for preferred language and capacity for
data collection related to use of language services.
Most hospitals demonstrated their ability to screen most
patients for language preference from the first several
months of the project; nevertheless, a few took time to begin
to see improvements in this measure (see Figure 2). For
example, at the beginning of the project, about 60 percent
of patients at one hospital were screened for language
preference. Through a combination of efforts, such as using
data to open a discussion with the leaders of registration
and scheduling; training staff on the how and why of
screening for language needs; programming reminders in
the registration and scheduling screens to prompt staff to
complete the language field; and using scripts for language
screening, the measure increased to over 80 percent. At
another hospital, the use of similar strategies, together with
integrating demographic information with other electronic
systems in the organization, resulted in an improvement from
approximately half of patients screened to nearly all patients
by the second quarter of 2007.
I n A n y L a n g u a g e
17P
ER
CE
NT
OF
PA
TIE
NT
S
YEAR–QUARTER
0%
20%
40%
60%
80%
100%
2006Q4 2007Q1 2007Q2 2007Q3 2007Q4 2008Q1
FIGURE 2ST1: PATIENTS SCREENED FOR PREFERRED LANGUAGEAll Hospitals
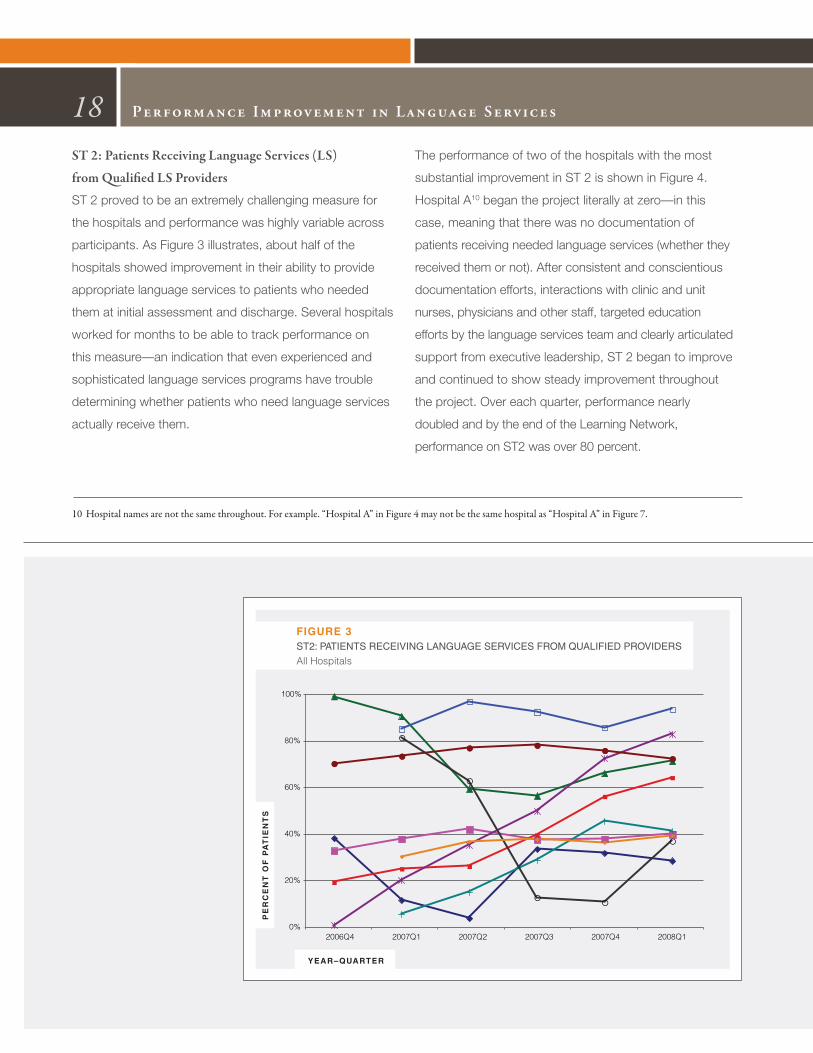
ST 2: Patients Receiving Language Services (LS)
from Qualified LS Providers
ST 2 proved to be an extremely challenging measure for
the hospitals and performance was highly variable across
participants. As Figure 3 illustrates, about half of the
hospitals showed improvement in their ability to provide
appropriate language services to patients who needed
them at initial assessment and discharge. Several hospitals
worked for months to be able to track performance on
this measure—an indication that even experienced and
sophisticated language services programs have trouble
determining whether patients who need language services
actually receive them.
The performance of two of the hospitals with the most
substantial improvement in ST 2 is shown in Figure 4.
Hospital A10 began the project literally at zero—in this
case, meaning that there was no documentation of
patients receiving needed language services (whether they
received them or not). After consistent and conscientious
documentation efforts, interactions with clinic and unit
nurses, physicians and other staff, targeted education
efforts by the language services team and clearly articulated
support from executive leadership, ST 2 began to improve
and continued to show steady improvement throughout
the project. Over each quarter, performance nearly
doubled and by the end of the Learning Network,
performance on ST2 was over 80 percent.
18
PE
RC
EN
T O
F P
AT
IEN
TS
YEAR–QUARTER
0%
20%
40%
60%
80%
100%
2006Q4 2007Q1 2007Q2 2007Q3 2007Q4 2008Q1
FIGURE 3ST2: PATIENTS RECEIVING LANGUAGE SERVICES FROM QUALIFIED PROVIDERS
All Hospitals
10 Hospital names are not the same throughout. For example. “Hospital A” in Figure 4 may not be the same hospital as “Hospital A” in Figure 7.
Per formance Improvement in Language Serv ices
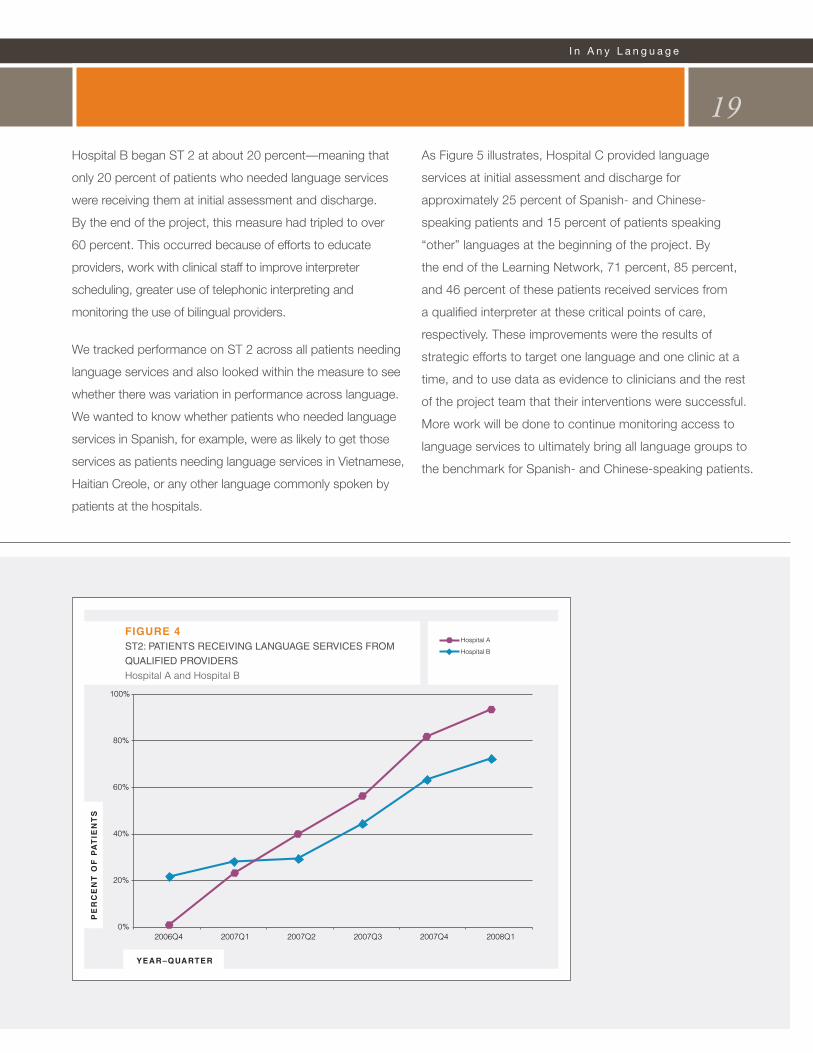
Hospital B began ST 2 at about 20 percent—meaning that
only 20 percent of patients who needed language services
were receiving them at initial assessment and discharge.
By the end of the project, this measure had tripled to over
60 percent. This occurred because of efforts to educate
providers, work with clinical staff to improve interpreter
scheduling, greater use of telephonic interpreting and
monitoring the use of bilingual providers.
We tracked performance on ST 2 across all patients needing
language services and also looked within the measure to see
whether there was variation in performance across language.
We wanted to know whether patients who needed language
services in Spanish, for example, were as likely to get those
services as patients needing language services in Vietnamese,
Haitian Creole, or any other language commonly spoken by
patients at the hospitals.
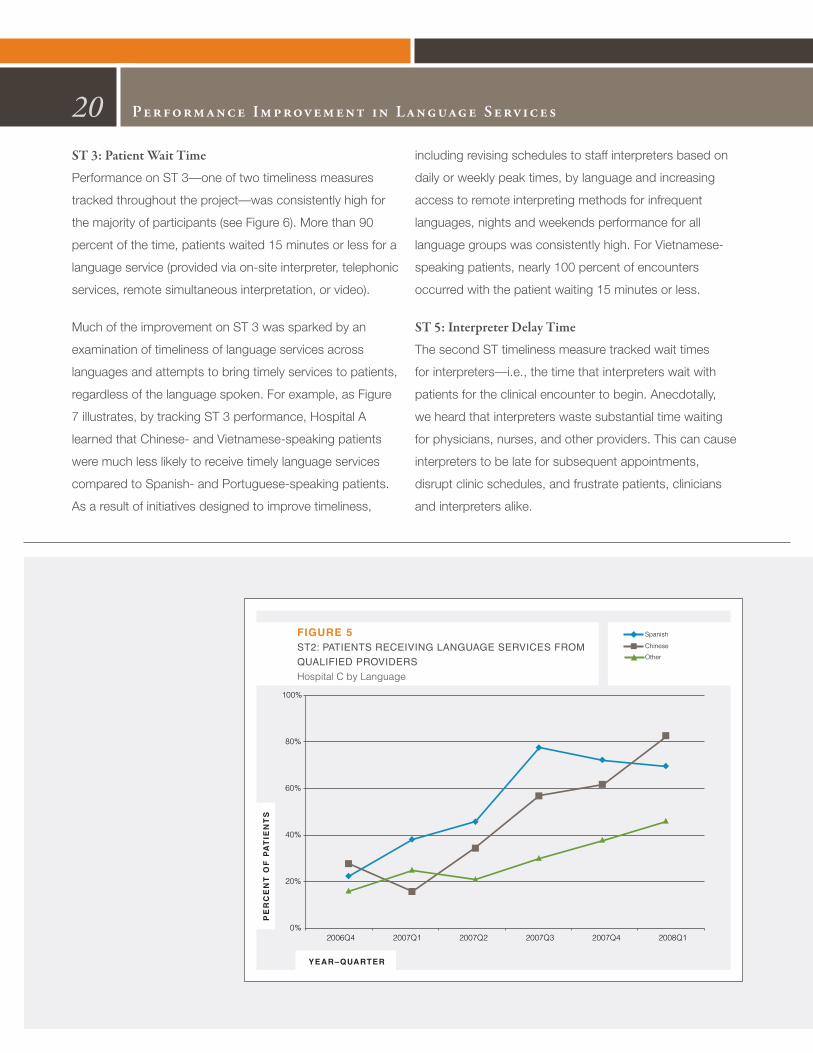
As Figure 5 illustrates, Hospital C provided language
services at initial assessment and discharge for
approximately 25 percent of Spanish- and Chinese-
speaking patients and 15 percent of patients speaking
“other” languages at the beginning of the project. By
the end of the Learning Network, 71 percent, 85 percent,
and 46 percent of these patients received services from
a qualified interpreter at these critical points of care,
respectively. These improvements were the results of
strategic efforts to target one language and one clinic at a
time, and to use data as evidence to clinicians and the rest
of the project team that their interventions were successful.
More work will be done to continue monitoring access to
language services to ultimately bring all language groups to
the benchmark for Spanish- and Chinese-speaking patients.
I n A n y L a n g u a g e
19P
ER
CE
NT
OF
PA
TIE
NT
S
YEAR–QUARTER
0%
20%
40%
60%
80%
100%
2006Q4 2007Q1 2007Q2 2007Q3 2007Q4 2008Q1
Hospital A
Hospital B
FIGURE 4ST2: PATIENTS RECEIVING LANGUAGE SERVICES FROM
QUALIFIED PROVIDERS
Hospital A and Hospital B
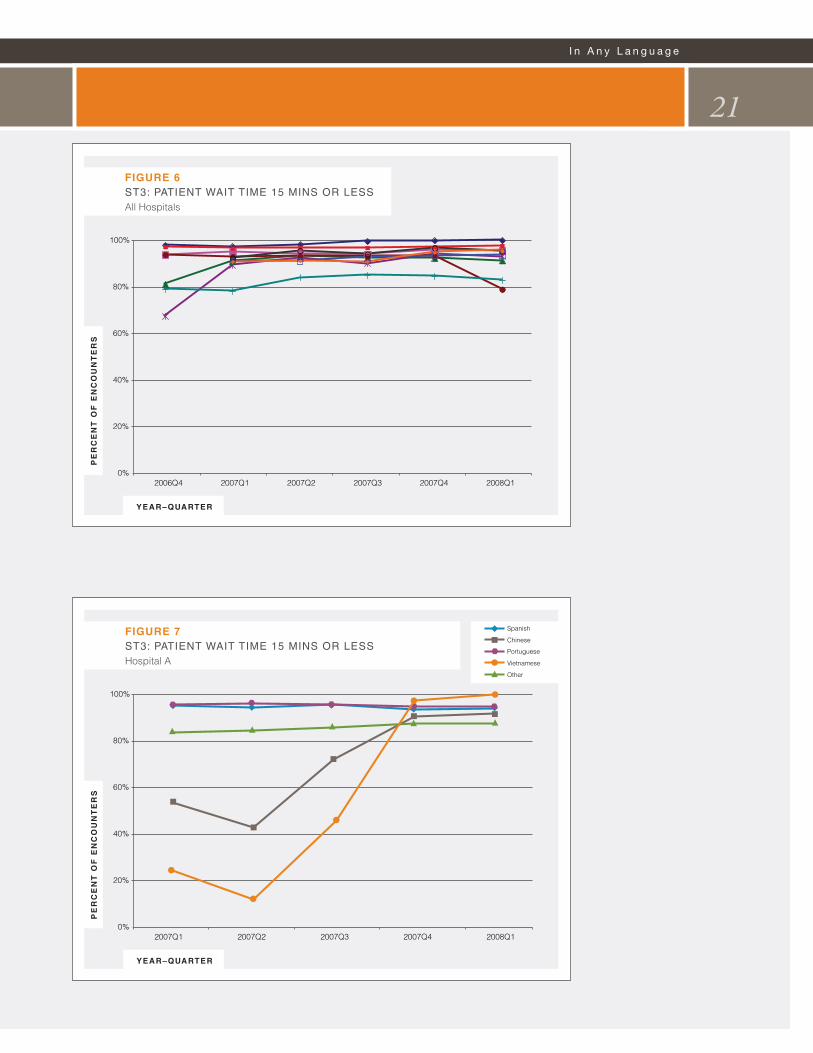
ST 3: Patient Wait Time
Performance on ST 3—one of two timeliness measures
tracked throughout the project—was consistently high for
the majority of participants (see Figure 6). More than 90
percent of the time, patients waited 15 minutes or less for a
language service (provided via on-site interpreter, telephonic
services, remote simultaneous interpretation, or video).
Much of the improvement on ST 3 was sparked by an
examination of timeliness of language services across
languages and attempts to bring timely services to patients,
regardless of the language spoken. For example, as Figure
7 illustrates, by tracking ST 3 performance, Hospital A
learned that Chinese- and Vietnamese-speaking patients
were much less likely to receive timely language services
compared to Spanish- and Portuguese-speaking patients.
As a result of initiatives designed to improve timeliness,
including revising schedules to staff interpreters based on
daily or weekly peak times, by language and increasing
access to remote interpreting methods for infrequent
languages, nights and weekends performance for all
language groups was consistently high. For Vietnamese-
speaking patients, nearly 100 percent of encounters
occurred with the patient waiting 15 minutes or less.
ST 5: Interpreter Delay Time
The second ST timeliness measure tracked wait times
for interpreters—i.e., the time that interpreters wait with
patients for the clinical encounter to begin. Anecdotally,
we heard that interpreters waste substantial time waiting
for physicians, nurses, and other providers. This can cause
interpreters to be late for subsequent appointments,
disrupt clinic schedules, and frustrate patients, clinicians
and interpreters alike.
20 Per formance Improvement in Language Serv ices
PE
RC
EN
T O
F P
AT
IEN
TS
YEAR–QUARTER
0%
20%
40%
60%
80%
100%
2006Q4 2007Q1 2007Q2 2007Q3 2007Q4 2008Q1
FIGURE 5ST2: PATIENTS RECEIVING LANGUAGE SERVICES FROM
QUALIFIED PROVIDERS
Hospital C by Language
Spanish
Chinese
Other
I n A n y L a n g u a g e
21P
ER
CE
NT
OF
EN
CO
UN
TE
RS
YEAR–QUARTER
0%
20%
40%
60%
80%
100%
2006Q4 2007Q1 2007Q2 2007Q3 2007Q4 2008Q1
FIGURE 6ST3: PATIENT WAIT TIME 15 MINS OR LESS All Hospitals
PE
RC
EN
T O
F E
NC
OU
NT
ER
S
YEAR–QUARTER
0%
20%
40%
60%
80%
100%
2007Q1 2007Q2 2007Q3 2007Q4 2008Q1
FIGURE 7ST3: PATIENT WAIT TIME 15 MINS OR LESS Hospital A
Spanish
Chinese
Other
Portuguese
Vietnamese
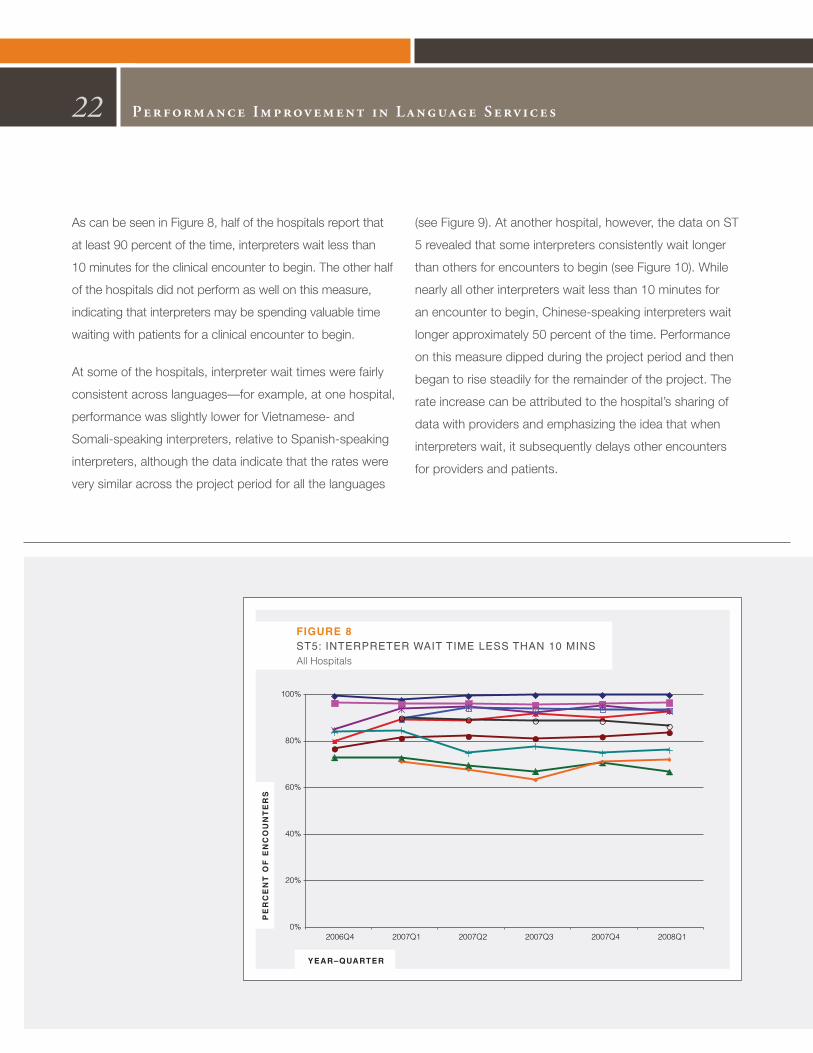
As can be seen in Figure 8, half of the hospitals report that
at least 90 percent of the time, interpreters wait less than
10 minutes for the clinical encounter to begin. The other half
of the hospitals did not perform as well on this measure,
indicating that interpreters may be spending valuable time
waiting with patients for a clinical encounter to begin.
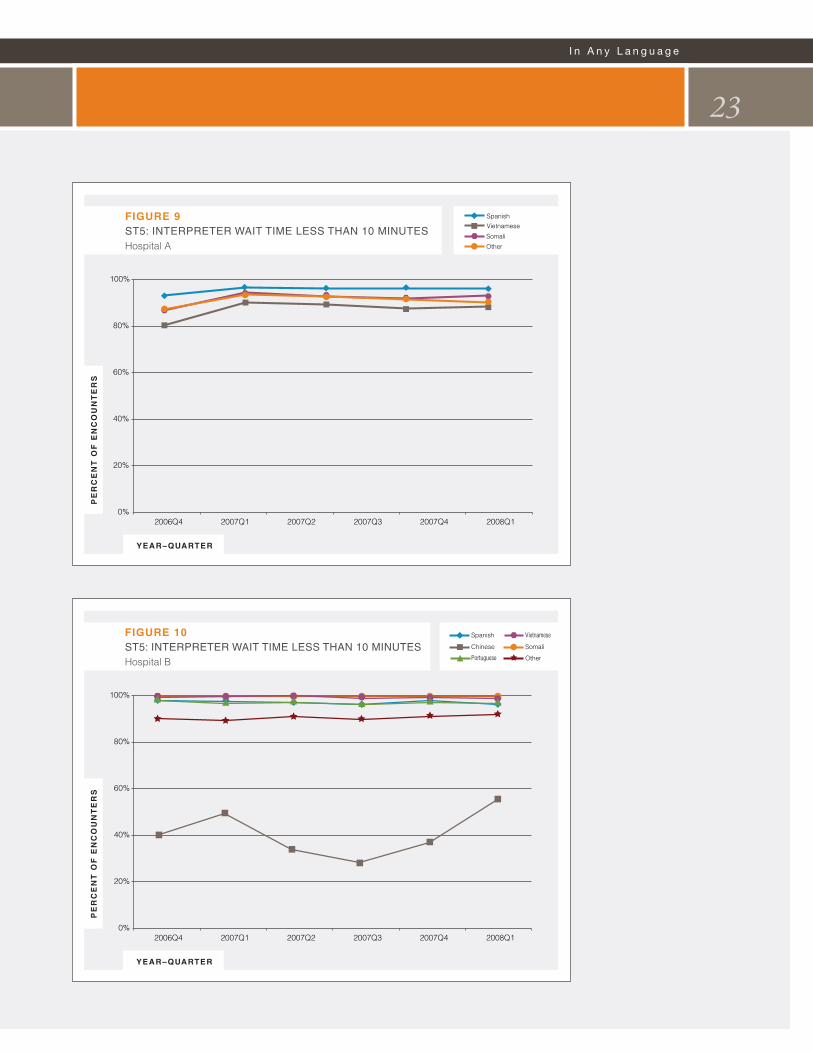
At some of the hospitals, interpreter wait times were fairly
consistent across languages—for example, at one hospital,
performance was slightly lower for Vietnamese- and
Somali-speaking interpreters, relative to Spanish-speaking
interpreters, although the data indicate that the rates were
very similar across the project period for all the languages
(see Figure 9). At another hospital, however, the data on ST
5 revealed that some interpreters consistently wait longer
than others for encounters to begin (see Figure 10). While
nearly all other interpreters wait less than 10 minutes for
an encounter to begin, Chinese-speaking interpreters wait
longer approximately 50 percent of the time. Performance
on this measure dipped during the project period and then
began to rise steadily for the remainder of the project. The
rate increase can be attributed to the hospital’s sharing of
data with providers and emphasizing the idea that when
interpreters wait, it subsequently delays other encounters
for providers and patients.
22 Per formance Improvement in Language Serv ices
PE
RC
EN
T O
F E
NC
OU
NT
ER
S
YEAR–QUARTER
0%
20%
40%
60%
80%
100%
2006Q4 2007Q1 2007Q2 2007Q3 2007Q4 2008Q1
FIGURE 8ST5: INTERPRETER WAIT TIME LESS THAN 10 MINSAll Hospitals
I n A n y L a n g u a g e
23P
ER
CE
NT
OF
EN
CO
UN
TE
RS
YEAR–QUARTER
0%
20%
40%
60%
80%
100%
2006Q4 2007Q1 2007Q2 2007Q3 2007Q4 2008Q1
Spanish
Chinese
Portuguese
Vietnamese
Somali
Other
FIGURE 10ST5: INTERPRETER WAIT TIME LESS THAN 10 MINUTESHospital B
PE
RC
EN
T O
F E
NC
OU
NT
ER
S
YEAR–QUARTER
0%
20%
40%
60%
80%
100%
2006Q4 2007Q1 2007Q2 2007Q3 2007Q4 2008Q1
Spanish
Vietnamese
Somali
Other
FIGURE 9ST5: INTERPRETER WAIT TIME LESS THAN 10 MINUTES Hospital A
ST 4: Time Spent Interpreting
As hospitals began to measure performance—and especially
as they began to track the extent to which they provided
language services to patients at critical points during their
inpatient stay or outpatient visit—the question of whether
there were sufficient resources to meet patient needs was
bound to surface. Before hospitals can determine whether
they are able to meet patient demand with current staffing,
it is important to make certain that current resources are
being deployed in the most efficient way.
Each of the Speaking Together hospitals was asked to
track the percent of time interpreters spend in medical
interpreting to gather more information about whether
capacity exists within current staffing to stretch interpreter
activities to meet the needs of patients. Discussions with
hospitals in Speaking Together and with many others
across the country revealed that interpreters often take on
responsibilities in addition to medical interpretation. Some
interpreters serve as patient navigators; others contact
patients to remind them of appointments or assist with
financial counseling and other non-medical interpreting
encounters. The discussions also showed that interpreters
often spend large chunks of their day walking to and from
encounters with patients, filling out necessary paperwork,
or helping with scheduling or other language services
department duties. Still others have unfilled “downtime”
between appointments or encounters.
Figure 11 illustrates performance on ST 4 and provides
information on the percent of time in an interpreter’s work
shift or work day that is spent in medical interpretation. As
can be seen from the graph, performance on ST 4 is also
highly variable and remained variable throughout the project
period. In the first quarter of 2007 (when all hospitals were
reporting on this measure), performance ranged from a
high of 73 percent to a low of 10 percent—a 63 percentage
point gap. By the end of the project, that gap was still
extremely wide, at 60 percentage points.
24 Per formance Improvement in Language Serv ices
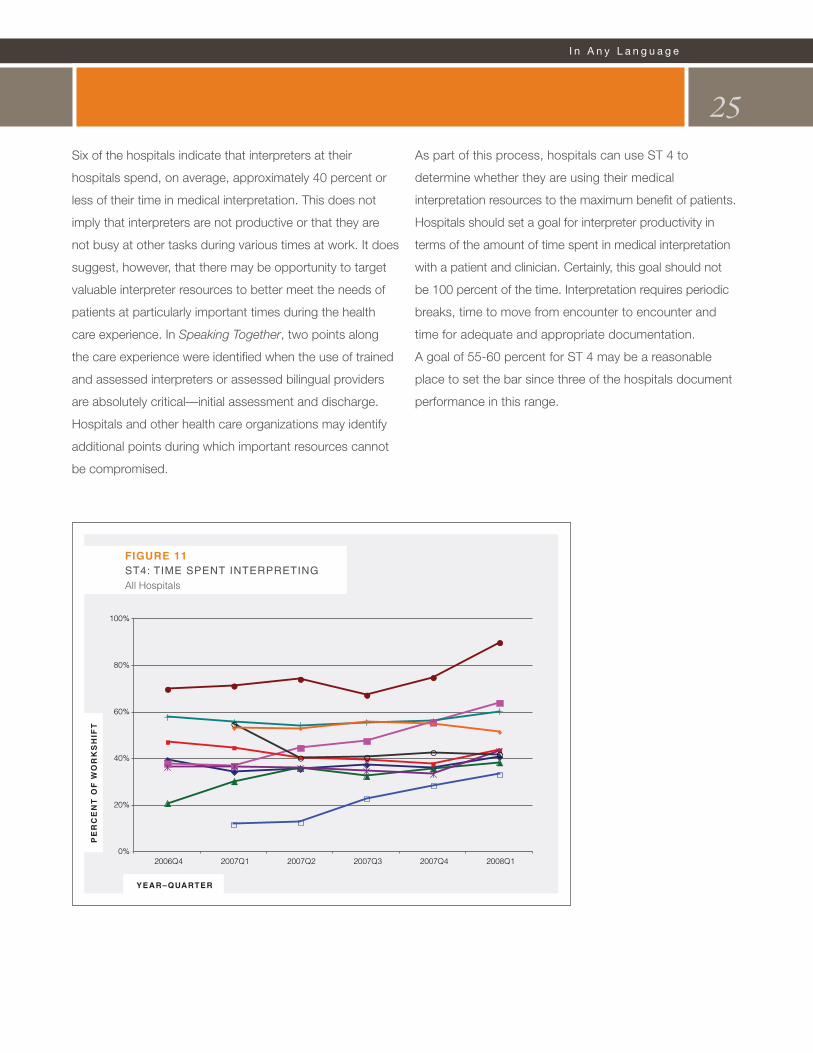
Six of the hospitals indicate that interpreters at their
hospitals spend, on average, approximately 40 percent or
less of their time in medical interpretation. This does not
imply that interpreters are not productive or that they are
not busy at other tasks during various times at work. It does
suggest, however, that there may be opportunity to target
valuable interpreter resources to better meet the needs of
patients at particularly important times during the health
care experience. In Speaking Together, two points along
the care experience were identified when the use of trained
and assessed interpreters or assessed bilingual providers
are absolutely critical—initial assessment and discharge.
Hospitals and other health care organizations may identify
additional points during which important resources cannot
be compromised.
As part of this process, hospitals can use ST 4 to
determine whether they are using their medical
interpretation resources to the maximum benefit of patients.
Hospitals should set a goal for interpreter productivity in
terms of the amount of time spent in medical interpretation
with a patient and clinician. Certainly, this goal should not
be 100 percent of the time. Interpretation requires periodic
breaks, time to move from encounter to encounter and
time for adequate and appropriate documentation.
A goal of 55-60 percent for ST 4 may be a reasonable
place to set the bar since three of the hospitals document
performance in this range.
I n A n y L a n g u a g e
25P
ER
CE
NT
OF
WO
RK
SH
IFT
YEAR–QUARTER
0%
20%
40%
60%
80%
100%
2006Q4 2007Q1 2007Q2 2007Q3 2007Q4 2008Q1
FIGURE 11ST4: TIME SPENT INTERPRETINGAll Hospitals
Lessons Learned26
• language services deserves a voice in every
discussion about improving quality—Communication
is essential to quality. Language services need to
be included in improvement efforts in the organization.
• meaningful improvement is possible—
The Speaking Together hospitals demonstrated that
quality improvement techniques can be applied to
language services for the purposes of measuring
and improving performance.
• The power is in the data—Hospitals can report data
on language services performance and use this data to
engage clinicians and leadership in making change
in the organization.
• Clinician involvement is key—Clinicians are ultimately
responsible for making sure that the language needs
of their patients are met. Without clinician involvement,
an organization cannot ensure that all patients are
receiving quality care.
• language services cannot “go it alone”—
The language services department can work to improve
the quality and accessibility of services, but it takes a
multidisciplinary team to measure and improve the
quality of language services delivery— including,
but not limited to clinicians, frontline staff, registration
and scheduling staff, quality improvement departments
and senior leadership.
• investment is necessary to achieve quality—
Like many services in health care, some investment
of time and financial resources is necessary to improve
the quality of language services. Individuals responsible
for allocating resources in an organization need to make
a commitment to language services in order to improve
overall quality of care.
Advances in quality improvement do not come easily.
The accomplishments of the Speaking Together hospitals
show that with commitment, tried and true strategies
and the right foundation for success, organizations can
support high-quality language services delivery.
Lessons LearnedLanguage services are absolutely critical for health care organizations with diverse patient populations and a desire to deliver safe, quality care. The work of Speaking Together has shown that hospitals can achieve high-quality by embedding language services into the fabric of clinical care. Among the many lessons learned:

Speaking TogetherThe George Washington University Medical Center
School of Public Health and Health Services
Department of Health Policy