The Neolithic avifauna of Hungary within the context of the Carpathian Basin
CONSIDERATIONS ON TEMPERATURE INVERSIONS IN THE
LOWER TROPOSPHERE IN THE 2001-2002 COLD SEASON,
SOUTH OF THE CARPATHIAN MOUNTAINS.
Bărcăcianu Florentina
1, Apostol Liviu
1
Key words: troposphere, radiosounding, negative gradients, standardized
temperature, termoisanomale, kriging, interpolation.
Abstract. Temperature inversions are characterized by negative vertical thermal
gradients (Donciu, 1953, Țâștea, 1965, Bogdan, 1971, Neacșa, Frimescu, 1981,).
The most frequent manifestation is in the depression areas because in addition to
radiative cooling and better possibility to store cold air invasion, it also takes
place the accumulation and of air flow of cold air due to gravity. The area south
of the Carpathians, shows depression features, gaining titles like: carpathian-
balkanic bucket (Bălescu, 1962), carpathian-balkanic sink (Ion-Bordei, N. 1988).
In this space the inversions occupy the entire area, proof being the values from
low altitude stations similar to those from mountain peaks, while the middle part
of the slope remains wormer.
INTRODUCTION
Normally, the atmosphere is characterized by a decrease in temperature of the
air proportional to the elevation, there are few cases where the temperature tends to
rise in altitude, which is characterized by vertical thermal gradients that are
negative or null (Apăvăloaei, et. al. 1994). The extra-Carpathian area shows
climatic differences between north and south, set by latitude ( Mihăilă D., 2006,
Machidon O. et al., 2012), and the higher areas, take the characteristics of the
upper atmosphere, cooled by the increasing distance from the thermal source and
increased effective radiation. Bellow the average altitude of the Carpathians, air
circulation is strongly influenced by them , so blocking the eastern circulation
results in outlining a negative thermal anomaly (Apostol L., 1990, 2004)
determining a stable vertical distribution of air with a thickness of 600-800m
(Clima României, 2008 ).
The contribution of specific synoptic structures specific in the formation of
these phenomena manifest themselves as some cold reservoirs in the winter season
(Apostol L., 2004, Ștefan S., 2004, Rao A.D. et al., 2010), less intese than those in
the Romanian Plain due to the heat generated by friction with the slopes. In any
sinoptic situation, the carpathian chain restructures the baric field from the surface
in the way that it favors cold air from northern Europe, from Moldova towards
central Romanian Plain, where it takes place the ”circulations interference”
(Bordei-Ion, N, Bordei-Ion, Ecaterina, 1981, 1984), and the amplification is due to
relief and also due to the Coanda effect.
2. Methodology and data base
The data base used was made of data from radio sounding, complemented
by temperatures recorded at 28 meteorological stations south of the romanian
Carpathians. The termic values were recorded at 00 UTC and 12 UTC at București-
Băneasa aerological station and 100
and 1300
for the rest of the meteorological
stations.
Tab. 1: Meteorological stations located in the southern Carpathians Meteorological
stations Altitude Latitude
Bisoca 833 45,55
Campulung Muscel 679 45,28
Polovragi 532 45,18
Curtea de Arges 449 45,16
Pitesti 315 44,85
Targoviste 297 44,93
Patarlagele 289 45,31
Dragasani 282 44,67
Tg Jiu 206 45,03
Craiova 195 44,31
Ploiesti 178 44,95
Titu 160 44,65
Videle 109 44,28
Caracal 107 44,1
Rosiorii de Vede 103 44,1
Buzau 97 45,13
Drobeta T S 79 44,63
Alexandria 76 43,98
Calafat 63 43,98
Fetesti 61 44,37
Slobozia 52 44,55
Bechet 40 43,78
Zimnicea 34 43,66
Turnu Magurele 31 43,75
Oltenita 16 44,07

Only 23 stations are included in the studied area, the rest being used for
better results of the interpolation method, and also for a detailed calculation of the
mean termal gradient of the 2001-2002 cold season.
Quantification of the reversed atmospheric stratification was done by
analyzing temperatures, thermal gradients and standardized temperature, that
suffered altitude and latitude corrections. Therefore, it was sought changes in
temperature and negative gradients vertically over Bucharest. The increased
diversity of radion sounding data, forced us to mediate the successive data recorded
and to establish thermal values corresponding for each 100 m, up until 3000 m,
above which the underlying active surface influence is insignificant.
The city, through its specific topoclimate, favors the registration of higher
values in the lower layers than in free atmosphere, these conditions being favorable
for the manifestations of local thermal inversions, so it was analyzed the horizontal
thermal inversions in the area south of the Carpathians. The variables that prevent
thermal value comparison and analysis, as well the researched phenomenon is
represented by latitude and altitude, which were eliminated by reporting to the
difference of 0,86°C/1 degree northern latitude (Apăvăloae et al, 1988, Apostol,
1990) and bringing thermal values to sea level, respectively 0 m, by applying
horizontal thermal gradient of the 2001-2002 cold season.
Fig. 1: The values of gradients featurea for cold season 2001-2002 over aerological
station București-Băneasa
The thermal gradient was calculated from values recorded at weather
stations analyzed and altitude differences between them, respectively 0,39°C(see
fig. 1). By applying the method of spatial interpolation of standardized values
were obtained distribution maps of termoisonomals of the cold season
characteristic of each month, for the two time periods studied, 000
and 100
and also
1200
and 1300
.
3. Results and discussion
The air stratification model south-east of Curvature Carpathians during
winter (Apostol, 1986), with some modifications, can be generally applied to the
entire area studied in this paper, for the winter season. A model on the distribution
with altitude in the atmosphere for all Romania and in detail for the area south of
Southern Carpathians was elaborated by Bâzâc Gh. in 1983. Observations relevant
to the ground temperature distribution in the cold season were presented by
Bacinschi et al, 1990; Bogdan Octavia, 1969, 1980, 2007; Bogdan, Iliescu, 1971,
Clima României, 2008, with numerous references and studies on the thermal
inversions phenomenon, analyzed on data from the meteorological stations from
ground level south of the Southern Carpathians. The major role of the Southern
Carpathians and the Curvature Carpathians in shaping the thermal characteristics of
the regions south and south east, has been studied by Bordei-Ion, N. şi Bordei-Ion,
Ecaterina, 1988.
3.1. Analysis of temperatures in the lower troposphere above
București-Băneasa
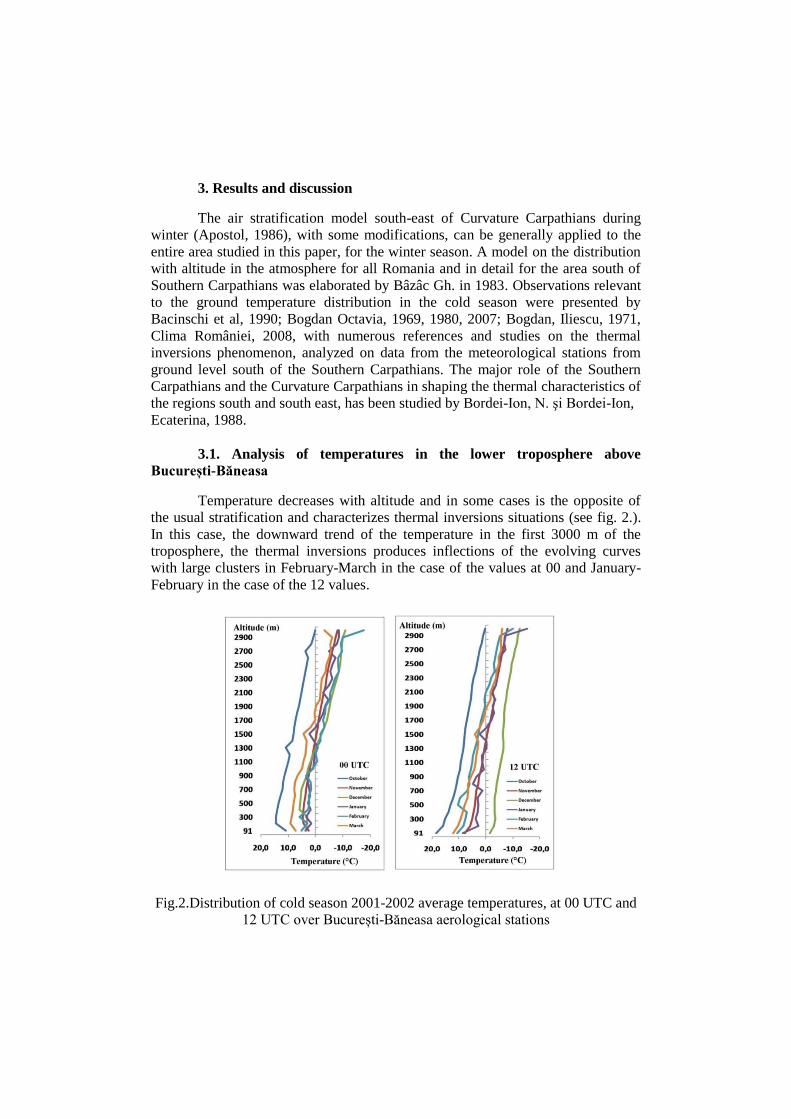
Temperature decreases with altitude and in some cases is the opposite of
the usual stratification and characterizes thermal inversions situations (see fig. 2.).
In this case, the downward trend of the temperature in the first 3000 m of the
troposphere, the thermal inversions produces inflections of the evolving curves
with large clusters in February-March in the case of the values at 00 and January-
February in the case of the 12 values.
Fig.2.Distribution of cold season 2001-2002 average temperatures, at 00 UTC and
12 UTC over București-Băneasa aerological stations
The high variability of the thermal regime in altitude does not reflect or
confirm the presence of thermal inversions, these are more clear by analyzing
statistical and mathematical the negative thermal gradients.In case of the values
registered during night, those characteristic for the altitudinal interval of 200 – 800
m exceed the temperature at ground level (91 m). The downward trend is
interrupted by the values characteristics for intervals 2000-2200 m and 2600 and
2800 m. Values at noon (12 UTC) shows a maximum at ground level, due to solar
radiation and the variations are much lower than the nocturnal, the isotherm of 0°C
placing it in both observation cases around the altitude of 1600 m.
3.2. Analysis of negative gradients in the lower troposphere above
București-Băneasa
Concentration of thermal inversions respectively the negative gradients is
achieved mainly by the end of the cold season in case of data from 00 hour, with a
gap towards mid-season for those at noon.
The maximum frequency occurred for values at 00 below 200 m altitude, a
main interval with high frequency ranges between 91 and 600 m and the secondary
between 1100 and 1600. In the case of the noon records, the maximum frequency is
recorded in the 300-600 m interval and intervals with high frequency but with
small thickness occur at 1200-1600, 1900-2100 and 2400 m, the increased
variability being associated to diurnal values (see tab.2).
In 2001-2002 cold season maximum frequency of over 70 % occur bellow
400 m in all six months analyzed and in the interval 300-500 m for those at 12. At
night occurs temperature inversions at ground level and by day through strong
insolation at ground level these remain only in upper levels.
3.4. Correlation between inversions recorded in the free atmosphere
with those at ground level, south of the Carpathians
Applying the Pearson correlations between monthly mean values recorded
at same heights as those of the meteorological stations, led to the making of some
hypotheses, according to which we can state there is a similar trend between the
free atmosphere and temperatures from the station level. Very high correlation
characterizes the 150-300 m level and above 400 m the correlation is weak, except
for altitudes above 2500 m where the correlation increases, reflecting the
uniformity of weather and climatic conditions of the Carpathian Mountains.
For the correlation between temperature values recorded at noon, theese
are very high of more than 0,86°C, with the mention that under 100 m the
coefficient has the lowest values due to the differential heating of the underlying
active surface and also in the interval between 300 and 700 m, where it still persist
the inverse thermal stratification. Above this altitude the correlation coefficient
values are high
.

Tab.2. Relative frequency of thermal inversions in cold season 2001-2002
above the upper-air station București-Băneasa
00 UTC X XI XII I II III 12 UTC X XI XII I II III
altitude (m) relative frequency (%) altitude (m) relative frequency (%)
91 81 53 35 55 62 73 91 6 3 3 16 17 13
200 71 47 35 68 72 60 200 0 0 6 26 3 3
300 45 37 35 55 52 40 300 0 3 16 39 7 0
400 10 27 42 48 34 17 400 0 13 35 61 21 7
500 16 17 39 45 28 3 500 0 20 35 42 41 10
600 3 13 19 35 21 7 600 3 30 29 32 24 3
700 10 17 3 32 28 7 700 6 27 19 23 17 3
800 13 7 6 13 10 7 800 10 3 16 23 10 17
900 0 17 3 13 3 7 900 3 10 16 10 14 13
1000 3 10 6 10 7 0 1000 6 7 13 16 10 10
1100 6 7 0 16 3 3 1100 10 13 10 23 14 0
1200 19 10 0 13 3 3 1200 13 10 3 19 7 3
1300 6 10 3 32 3 0 1300 13 13 6 23 3 10
1400 6 7 6 26 10 3 1400 16 10 13 16 10 10
1500 6 7 26 16 10 0 1500 10 10 29 13 17 7
1600 23 17 13 6 7 3 1600 13 10 19 10 3 17
1700 19 20 13 6 10 10 1700 10 3 29 10 7 17
1800 0 20 10 0 10 7 1800 6 3 23 10 7 3
1900 13 10 16 6 7 0 1900 6 3 16 13 3 10
2000 10 10 16 6 7 3 2000 10 13 13 23 0 10
2100 6 3 13 3 7 3 2100 10 17 16 19 7 7
2200 6 7 16 6 7 3 2200 10 17 6 13 3 0
2300 6 13 3 3 3 13 2300 10 10 6 19 3 13
2400 3 10 6 6 10 7 2400 0 7 13 19 3 10
2500 6 3 3 16 10 7 2500 10 13 6 16 14 10
2600 10 7 6 6 14 7 2600 10 7 0 10 3 3
2700 10 3 10 6 7 7 2700 6 10 3 6 0 3
2800 6 0 10 6 3 3 2800 0 7 0 0 3 3
2900 6 3 6 16 7 7 2900 0 7 6 0 3 7
3000 3 3 10 10 0 0 3000 6 7 6 0 7 10
3.5. Standardized temperatures - applying latitude and altitude
corrections
To develop a clear picture of thermal inversions manifested in the space
south of the Carpathians it were eliminated the differences caused by latitude and
altitude, namely modifying temperature values and level them to the corresponding
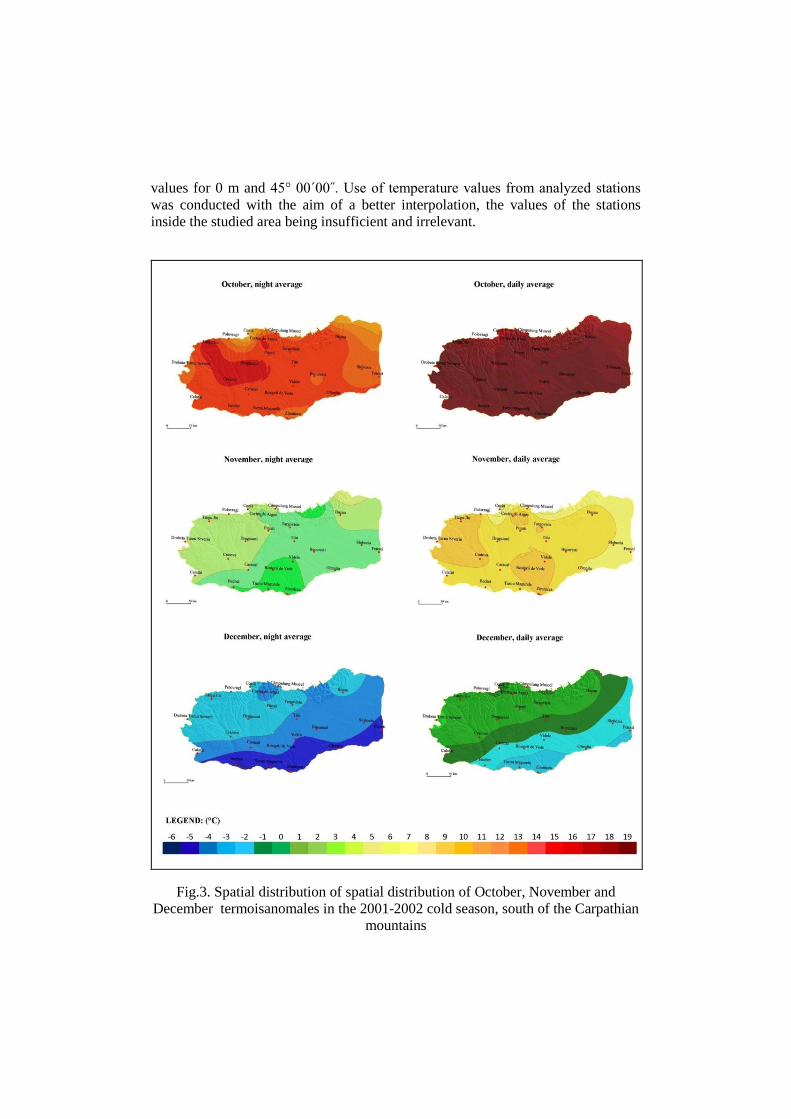
values for 0 m and 45° 00´00˝. Use of temperature values from analyzed stations
was conducted with the aim of a better interpolation, the values of the stations
inside the studied area being insufficient and irrelevant.
Fig.3. Spatial distribution of spatial distribution of October, November and
December termoisanomales in the 2001-2002 cold season, south of the Carpathian
mountains
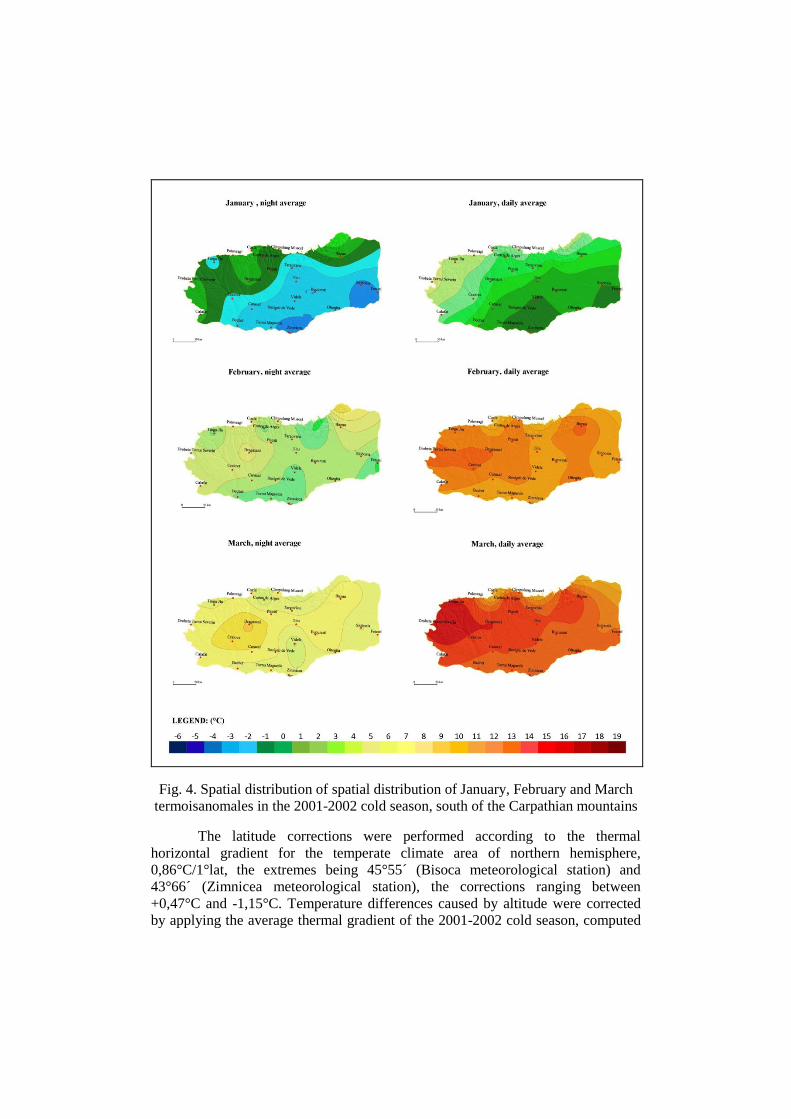
Fig. 4. Spatial distribution of spatial distribution of January, February and March
termoisanomales in the 2001-2002 cold season, south of the Carpathian mountains
The latitude corrections were performed according to the thermal
horizontal gradient for the temperate climate area of northern hemisphere,
0,86°C/1°lat, the extremes being 45°55´ (Bisoca meteorological station) and
43°66´ (Zimnicea meteorological station), the corrections ranging between
+0,47°C and -1,15°C. Temperature differences caused by altitude were corrected
by applying the average thermal gradient of the 2001-2002 cold season, computed
between all stations in the study area, respectively 0,39°C. Corrections were
between the values of + 8.8 ° C for the meteorological station at Omu Peak and
0.52°C for the Braila.
The results obtained by applying the latitude and altitude corrections were
used to perform spatial interpolation (ordinary kriging), resulting in 12 maps( see
fig. 3 and 4 ), classified by applying spatial simulation languages with the spatial
distribution of thermoisonomals characteristic for each month of the 2001-2002
cold season for the observation intervals 00 and 1 and also for 12 and 13.
Conclusions
This study is useful in that it underlies many results obtained from ground
data and gives some explanationson on the characteristics of thermal inversions in
this area and their genesis.
Considerations regarding thermal statifications in altitude are of a real use in
analyzing the air pollution phenomena (Haagen, 1959; Apostol, Pîrvulescu, 1988;
Apăvăloae, Apostol, 1995), analysis required for the entire lower atmosphere, as in
the studied area are many cities, among them Bucharest, industrial platforms,
intense car traffic, and air pollution is a current issue.
References
.
Apăvăloae M., Apostol L., (1994), Rolul inversiunilor termice în dinamica poluanților
atmosferei din arealul municipiului Piatra Neamț, Lucr. seminarului ’’Principii și
tehnologii moderne pentru reducerea poluării aerului’’, Ag. de Protecție a
Mediului, Neamţ, Stațiunea de Cercetări “Stejaru”, Piatra Neamț.
Apostol L. (1986), Distribuţia temperaturilor medii ale lunii ianuarie intre Munţii Vrancei
şi Balta Brăilei, Lucr. Sem. geogr. ,,D. Cantemir”, 6/1985, Iaşi, pg. 109-118.
Apostol L., Pîrvulescu I. (1988), Rolul factorilor climatici în dinamica poluării stratelor
inferioare ale atmosferei. Interpretare dupa un profil altitudinal pe un
versant montan, Lucr. celei de a III-a Conf. Naţ. de Ecologie, 1986, Arad, pg.
493-495.
Apostol L. (1990), Anomalii ale temperaturii aerului pe teritoriul Moldovei, Lucr. Sem.
geogr. ,,D. Cantemir”, nr. 9, 1988, Fac. Geogr.-Geol., Univ. ,,Al. I. Cuza”,
Iaşi, pg. 101-109.
Apostol L., (1990), Anomalii ale temperaturii aerului pe teritoriul României, SCGGG, ser
geogra, t. XXXVII, Edit. Academiei, București.
Apostol L.,( 2004) , Clima Subcarpaților Moldovei, Editura Universității Suceava, 439 p.

Bălescu O. et al., (1962), Studiul condițiilor meteo-sinoptice ale intervalelor caracteristice
care favorizează înghețul și dezghețul principalelor râuri din Republica Socialistă România,
Culegerea de lucrări a Institutului Meteorologic
Bogdan Octavia (1969), Inversions de témperatures dans la région située entre les
carpathes et les Balkans, Rev. Roum. Géol. Géophys. Géogr., Sér. Géogr., 13, 1,
Edit. Academiei, Bucureşti.
Bordei-Ion N., Bordei-Ion Ecaterina (1988), Fenomene meteoclimatice induse de
configurația Carpaților în Câmpia Română, Editura Academiei, București.
Machidon, O., Apostol, L., Machidon, Dana, Buruiană, D. (2012), Study of the evolution of
the air temperature in Moldavia region (Romania) over the last 76 years, Annals of
DAAAM for 2012 & Proceedings of the 23rd International DAAAM Symposium,
Volume 23, No.1, Published by DAAAM International, Vienna, Austria.
Mihăilă D., (2006), Câmpia Moldovei-studiu climatic, Editura Universității Suceava, 465 p.
Neacșa, Frimescu, (1981), Influența landșaftului urban asupra unor parametri ai
temperaturii aerului din orașul București Culegerea de lucrări a Institutului
Meteorologic
Rao, a. D., Babu, S. V., Murty, P. L. N., & Pandey, S. (2010). Impact of stratification on
internal waves and differential wearing of thermal inversions on the east coast of
India. Natural Hazards, 57(3), 577–595.
Ștefan Sabina, (2004), Fizica atmosferei, vremea și clima, Edit. Academiei, Bucureşti.
Țâștea, 1965, Câteva caracteristici comparative ale regimului temperaturii aerului solului
din zonele de nisipuri și cernozionmuri din Câmpia Română, Culegerea de lucrări a
Institutului Meteorologic
* * * (2008), Clima României, Edit. Academiei Române, Bucureşti.
Copyright © 2022 FDOKUMEN