In situ vertical profiles of aerosol extinction, mass, and ...
Upload
independentCategory
view
1download
0
This article was downloaded by: [Ingenta Content Distribution (Publishing Technology)]On: 07 October 2014, At: 15:56Publisher: Taylor & FrancisInforma Ltd Registered in England and Wales Registered Number: 1072954 Registered office: Mortimer House,37-41 Mortimer Street, London W1T 3JH, UK
Aerosol Science and TechnologyPublication details, including instructions for authors and subscription information:http://www.tandfonline.com/loi/uast20
Retrieval of Aerosol Extinction in the LowerTroposphere Based on UV MAX-DOAS MeasurementsHanlim Lee a , H. Irie b , Young J. Kim a , Youngmin Noh a , Chulkyu Lee c , Yeosook Kim a &Kee J. Chun da Advanced Environmental Monitoring Research Center (ADEMRC), Department ofEnvironmental Science and Engineering , Gwangju Institute of Science and Technology(GIST) , Gwangju , Buk-gu , Republic of Koreab Frontier Research Center for Global Change , Japan Agency for Marine-Earth Science andTechnology , Yokohama , Kanagawa , Japanc Department of Physics and Atmospheric Science , Dalhousie University , Halifax , NovaScotia , Canadad Korea Research Institute of Standards and Science , Yusung-ku , Taejon , KoreaPublished online: 27 Feb 2009.
To cite this article: Hanlim Lee , H. Irie , Young J. Kim , Youngmin Noh , Chulkyu Lee , Yeosook Kim & Kee J. Chun (2009)Retrieval of Aerosol Extinction in the Lower Troposphere Based on UV MAX-DOAS Measurements, Aerosol Science andTechnology, 43:5, 502-509, DOI: 10.1080/02786820902769691
To link to this article: http://dx.doi.org/10.1080/02786820902769691
PLEASE SCROLL DOWN FOR ARTICLE
Taylor & Francis makes every effort to ensure the accuracy of all the information (the “Content”) containedin the publications on our platform. However, Taylor & Francis, our agents, and our licensors make norepresentations or warranties whatsoever as to the accuracy, completeness, or suitability for any purpose of theContent. Any opinions and views expressed in this publication are the opinions and views of the authors, andare not the views of or endorsed by Taylor & Francis. The accuracy of the Content should not be relied upon andshould be independently verified with primary sources of information. Taylor and Francis shall not be liable forany losses, actions, claims, proceedings, demands, costs, expenses, damages, and other liabilities whatsoeveror howsoever caused arising directly or indirectly in connection with, in relation to or arising out of the use ofthe Content.
This article may be used for research, teaching, and private study purposes. Any substantial or systematicreproduction, redistribution, reselling, loan, sub-licensing, systematic supply, or distribution in anyform to anyone is expressly forbidden. Terms & Conditions of access and use can be found at http://www.tandfonline.com/page/terms-and-conditions

Aerosol Science and Technology, 43:502–509, 2009Copyright © American Association for Aerosol ResearchISSN: 0278-6826 print / 1521-7388 onlineDOI: 10.1080/02786820902769691
Retrieval of Aerosol Extinction in the Lower TroposphereBased on UV MAX-DOAS Measurements
Hanlim Lee,1 H. Irie,2 Young J. Kim,1 Youngmin Noh,1 Chulkyu Lee,3
Yeosook Kim,1 and Kee J. Chun4
1Advanced Environmental Monitoring Research Center (ADEMRC), Department of EnvironmentalScience and Engineering, Gwangju Institute of Science and Technology (GIST), Gwangju, Buk-gu,Republic of Korea2Frontier Research Center for Global Change, Japan Agency for Marine-Earth Science and Technology,Yokohama, Kanagawa, Japan3Department of Physics and Atmospheric Science, Dalhousie University, Halifax, Nova Scotia, Canada4Korea Research Institute of Standards and Science, Yusung-ku, Taejon, Korea
Multi Axis Differential Optical Absorption Spectroscopy(MAX-DOAS) has been utilized in recent years as a means of de-riving vertical profiles of aerosol and trace gases; however, thisnew technique requires further validation because few studieshave investigated its capability. In this study, vertical distributionsof aerosol extinction coefficients (AECs) in the lower tropospherewere retrieved by applying a recently developed aerosol-retrievalalgorithm to O4 slant column densities (SCDs) measured at a UVwavelength (356 nm) using the MAX-DOAS technique. The MAX-DOAS measurements were conducted at the Korea Global Atmo-sphere Watch Observatory (KGAWO) located off the west coast ofKorea during a period of seven cloudless days in May and June2005. The AECs measured by UV MAX-DOAS varied from 0.05to 0.73 km–1 in the 0–1 km layer and from 0.01 to 0.20 km–1 inthe 1–2 km layer. The AECs for the 1–2 km layer from UV MAX-DOAS are in agreement with lidar data within about 60%. Ourresults demonstrate the ability of MAX-DOAS as a remote sensingtechnique for surface aerosol measurements.
Received 23 October 2008; accepted 15 January 2009.This work was supported by the Korea Meteorological Administra-
tion Research and Development Program under Grant CATER 2007-4108. The software package WinDOAS used to evaluate MAX-DOASspectra was provided by the Belgium Institute for Space Aeronomy,Belgium. The DOASIS software for MAX-DOAS operation was pro-vided by the Institute of Environmental Physics, University of Hei-delberg, Germany. This work was also supported by the Global Envi-ronment Research Fund (B-051) of the Ministry of the Environment,Japan; the Ministry of Education, Culture, Sports, Science and Technol-ogy (MEXT), Japan; and the Japan EOS (Earth Observation System)Promotion Program of the Ministry of Education, Culture, Sports, Sci-ence and Technology (MEXT).
Address correspondence to Young J. Kim, Advanced EnvironmentalMonitoring Research Center (ADEMRC), Department of Environmen-tal Science and Engineering, Gwangju Institute of Science and Tech-nology (GIST), 1 Oryong-dong, Buk-gu, Gwangju 500–712, Republicof Korea. E-mail: [email protected]
INTRODUCTIONThe passive Differential Optical Absorption Spectroscopy
(DOAS) remote sensing technique has been used for measure-ments of ambient trace gases (e.g., NO2, SO2, HCHO, glyoxal,and halogen compounds) at various sites (Noxon 1975 (NO2);Solomon et al. 1987 (OClO); Sanders et al. 1993 (OClO); Arpaqet al. 1994 (BrO); Miller et al. 1997 (BrO and OClO); Richteret al. 1999 (BrO); Heckel et al. 2005 (HCHO); Lee et al. 2005(SO2 and ClO); Sinreich et al. 2007 (C2H2O2); Lee H. et al.2008 and 2009 (NO2)).
The Multi-Axis DOAS (MAX-DOAS) technique (Honningeret al. 2004) has been also employed in recent studies of aerosolinformation retrieval (Wagner et al. 2004; Sinreich et al.2005; Frieß et al. 2006; Irie et al. 2008) as shown in Table1. Wagner et al. (2004) investigated the effects of aerosolscattering on measurements of oxygen dimers (O4) using theMAX-DOAS technique, revealing high sensitivity of O4 slantcolumn densities (SCDs) to surface aerosol. For an atmospherewithout the presence of aerosol, the direct sunlight penetratesdeeply towards the ground surface and the light path lengthon telescope’s line of sight is long. If aerosol scattering takesplace, the light path length on the direct line of sight of thetelescope decreases. Since the majority of the atmospheric O4
is distributed uniformly near the ground surface, the observedO4 absorption is then also significantly decreased. The authorssuggested that O4 observations using MAX-DOAS are sensitiveenough to detect aerosol extinction below 0.001 km–1.
Sinreich et al. (2005) introduced an algorithm to determinethe vertical distribution of aerosol extinction utilizing O4 SCDdata measured at different elevation angles (ELs). The authorsused the proportionality of the concentration of the oxygendimer, O4, to the square of the O2 concentration in determiningO4 vertical column density (VCD). It was then possible to cal-culate the O4 air mass factor (AMF) by dividing the measured
502
Dow
nloa
ded
by [
Inge
nta
Con
tent
Dis
trib
utio
n (P
ublis
hing
Tec
hnol
ogy)
] at
15:
56 0
7 O
ctob
er 2
014
RETRIEVAL OF AEROSOL EXTINCTION 503
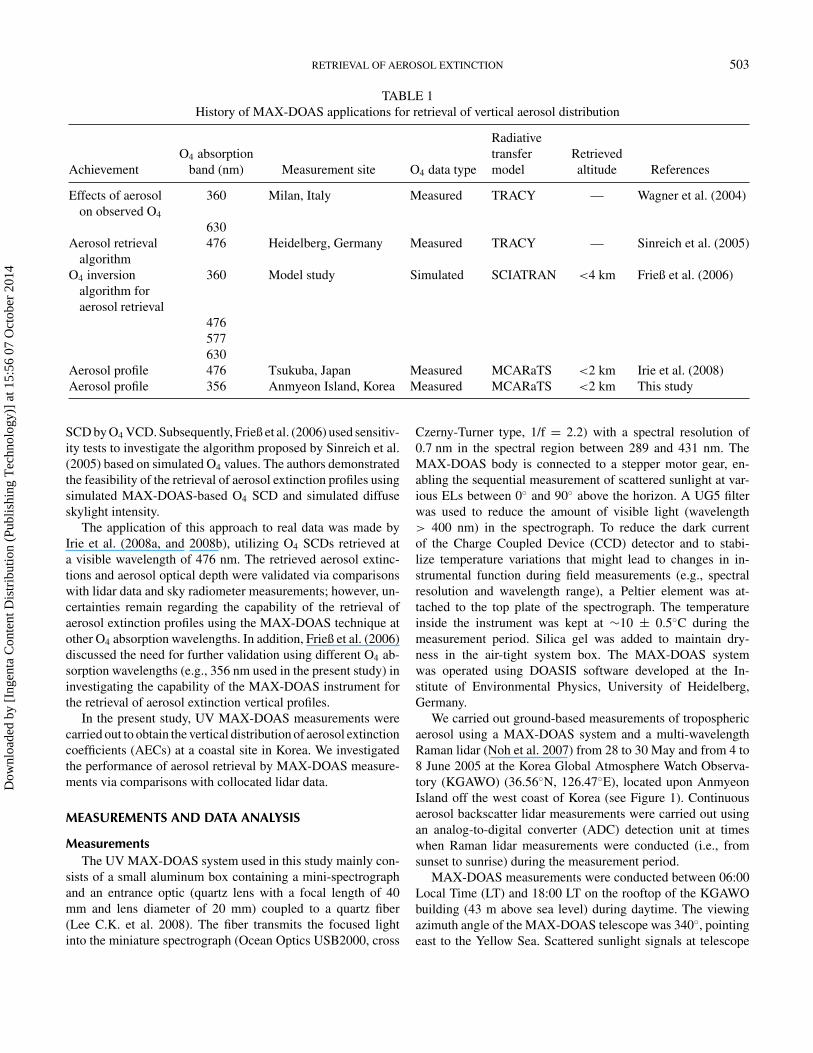
TABLE 1History of MAX-DOAS applications for retrieval of vertical aerosol distribution
RadiativeO4 absorption transfer Retrieved
Achievement band (nm) Measurement site O4 data type model altitude References
Effects of aerosolon observed O4
360 Milan, Italy Measured TRACY — Wagner et al. (2004)
630Aerosol retrieval
algorithm476 Heidelberg, Germany Measured TRACY — Sinreich et al. (2005)
O4 inversionalgorithm foraerosol retrieval
360 Model study Simulated SCIATRAN <4 km Frieß et al. (2006)
476577630
Aerosol profile 476 Tsukuba, Japan Measured MCARaTS <2 km Irie et al. (2008)Aerosol profile 356 Anmyeon Island, Korea Measured MCARaTS <2 km This study
SCD by O4 VCD. Subsequently, Frieß et al. (2006) used sensitiv-ity tests to investigate the algorithm proposed by Sinreich et al.(2005) based on simulated O4 values. The authors demonstratedthe feasibility of the retrieval of aerosol extinction profiles usingsimulated MAX-DOAS-based O4 SCD and simulated diffuseskylight intensity.
The application of this approach to real data was made byIrie et al. (2008a, and 2008b), utilizing O4 SCDs retrieved ata visible wavelength of 476 nm. The retrieved aerosol extinc-tions and aerosol optical depth were validated via comparisonswith lidar data and sky radiometer measurements; however, un-certainties remain regarding the capability of the retrieval ofaerosol extinction profiles using the MAX-DOAS technique atother O4 absorption wavelengths. In addition, Frieß et al. (2006)discussed the need for further validation using different O4 ab-sorption wavelengths (e.g., 356 nm used in the present study) ininvestigating the capability of the MAX-DOAS instrument forthe retrieval of aerosol extinction vertical profiles.
In the present study, UV MAX-DOAS measurements werecarried out to obtain the vertical distribution of aerosol extinctioncoefficients (AECs) at a coastal site in Korea. We investigatedthe performance of aerosol retrieval by MAX-DOAS measure-ments via comparisons with collocated lidar data.
MEASUREMENTS AND DATA ANALYSIS
MeasurementsThe UV MAX-DOAS system used in this study mainly con-
sists of a small aluminum box containing a mini-spectrographand an entrance optic (quartz lens with a focal length of 40mm and lens diameter of 20 mm) coupled to a quartz fiber(Lee C.K. et al. 2008). The fiber transmits the focused lightinto the miniature spectrograph (Ocean Optics USB2000, cross
Czerny-Turner type, 1/f = 2.2) with a spectral resolution of0.7 nm in the spectral region between 289 and 431 nm. TheMAX-DOAS body is connected to a stepper motor gear, en-abling the sequential measurement of scattered sunlight at var-ious ELs between 0◦ and 90◦ above the horizon. A UG5 filterwas used to reduce the amount of visible light (wavelength> 400 nm) in the spectrograph. To reduce the dark currentof the Charge Coupled Device (CCD) detector and to stabi-lize temperature variations that might lead to changes in in-strumental function during field measurements (e.g., spectralresolution and wavelength range), a Peltier element was at-tached to the top plate of the spectrograph. The temperatureinside the instrument was kept at ∼10 ± 0.5◦C during themeasurement period. Silica gel was added to maintain dry-ness in the air-tight system box. The MAX-DOAS systemwas operated using DOASIS software developed at the In-stitute of Environmental Physics, University of Heidelberg,Germany.
We carried out ground-based measurements of troposphericaerosol using a MAX-DOAS system and a multi-wavelengthRaman lidar (Noh et al. 2007) from 28 to 30 May and from 4 to8 June 2005 at the Korea Global Atmosphere Watch Observa-tory (KGAWO) (36.56◦N, 126.47◦E), located upon AnmyeonIsland off the west coast of Korea (see Figure 1). Continuousaerosol backscatter lidar measurements were carried out usingan analog-to-digital converter (ADC) detection unit at timeswhen Raman lidar measurements were conducted (i.e., fromsunset to sunrise) during the measurement period.
MAX-DOAS measurements were conducted between 06:00Local Time (LT) and 18:00 LT on the rooftop of the KGAWObuilding (43 m above sea level) during daytime. The viewingazimuth angle of the MAX-DOAS telescope was 340◦, pointingeast to the Yellow Sea. Scattered sunlight signals at telescope
Dow
nloa
ded
by [
Inge
nta
Con
tent
Dis
trib
utio
n (P
ublis
hing
Tec
hnol
ogy)
] at
15:
56 0
7 O
ctob
er 2
014

504 LEE ET AL.
FIG. 1. Location map of measurement site on Anmyeon Island. MAX-DOAS measurement direction is indicated by dashed arrow.
ELs of 3◦, 6◦, 10◦, 20◦, and 90◦ were recorded sequentiallyduring the measurement period. Each measurement loop, scan-ning five ELs, took 10–20 min. Measured MAX-DOAS spectrawere then analyzed to identify and quantify O4 SCD using thespecific structured absorption features in the ultraviolet region(Greenblatt et al. 1990).
The GIST multi-wavelength Raman lidar system was usedto evaluate the performance of MAX-DOAS aerosol measure-ments. The lidar system utilizes a Nd:YAG laser as a light source,which emits pulses at wavelengths of 355, 532, and 1064 nm.The Lidar receiver part consists of a 14 inch Cassegrain tele-scope and photomultiplier (PMT) detectors. The detailed spec-ifications of the GIST Raman Lidar system are provided byNoh et al. (2007). The AEC profile was obtained using the Klettmethod (Klett 1981) from the elastically backscattered lidar datacollected by an ADC detection system.
In determining aerosol extinction profiles from lidar data,it is common practice to assume the extinction-to-backscatterratio (S; the so-called “lidar ratio”), which depends on severalfactors, including aerosol size, shape, refractive index, and rela-tive humidity (RH). Therefore, the assumption of an appropriatelidar ratio in calculations employing the Klett method is impor-tant for the accurate retrieval of AEC profiles. In calculatingAEC profiles, we used the lidar ratios directly measured by theRaman lidar system rather than the values of 40–60 sr typicallyassumed for aerosol particles in northeast Asia. Higher lidar ra-tios (60–97 sr) were measured at 532 nm for the aerosol particlesobserved in this study, resulting in improved determination ofaerosol extinction profiles specific to the measurement condi-tions. AECs at 532 nm were calculated using the Klett methodwith a temporal resolution of 20 min (24,000 laser pulse shots).The AECs at 532 nm were then converted to AECs at 356 nmusing an Angstrom exponent determined based on the spectraldependence of AEC at 355 nm and 532 nm, as determined inturn by Raman lidar measurements.
MAX-DOAS Data AnalysisInformation on O4 SCDs at several different ELs can be used
to determine the atmospheric aerosol extinction within the lowertroposphere (Wagner et al. 2004; Sinreich et al. 2005; Frieß et al.2006; Irie et al. 2008). O4 SCDs were retrieved using the eval-uation software WinDOAS V2.10 (van Roozendael and Fayt2001). The spectra collected by the MAX-DOAS system werepre-calibrated using mercury lamp signals from which dark cur-rent and offset signals were subtracted. The pre-calibrated spec-tra were calibrated again by fitting them to a solar referencespectrum (Kurucz et al. 1984). A 5th-order polynomial fit wasused to remove broadband structures and the effects of Rayleighand Mie scattering. The O4 SCDs were determined in the spec-tral range from 338 to 367 nm, where two UV O4 absorptionbands are present, centered at 343.4 and 356.0 nm. The spec-trum taken at around noon on 30 May was used as a Fraunhoferreference spectrum (FRS). O4, NO2, O3, HCHO, FRS, and theRing spectrum were simultaneously fitted to the measurementspectra using the nonlinear least squares method (Platt 1994;Stutz and Platt 1996). All reference absorption cross-sectionspectra were convoluted with the instrumental function to adaptthe spectral resolution of the MAX-DOAS system used in thisstudy. Ring spectra (Fish et al. 1995) accounting for rotationalRaman scattering effects were calculated from FRS. NO2 andO3 spectra were Io-corrected using WinDOAS software. Theresulting O4 SCDs measured by MAX-DOAS at various ELsare plotted in Figure 2, which includes both tropospheric andstratospheric O4 contributions. The U-shape is caused by thestratospheric contribution and the change in the solar zenith an-gle. On 28 May 2005, hardly any difference in the O4 SCDs forthe different elevations can be made out. This already indicates ahigh scattering probability and therefore a high aerosol contentwhile on the following days the O4 SCDs are clearly separated.
As evident in lidar (lidar MAX-DOAS) data describedbelow, non-negligible amounts of aerosols were in the lower
Dow
nloa
ded
by [
Inge
nta
Con
tent
Dis
trib
utio
n (P
ublis
hing
Tec
hnol
ogy)
] at
15:
56 0
7 O
ctob
er 2
014

RETRIEVAL OF AEROSOL EXTINCTION 505
FIG. 2. Temporal variations in O4 SCD values obtained at EL = 3◦, 6◦, 10◦,15◦, and 20◦ during measurement period (28–30 May and 4–8 June 2005).
troposphere on 30 May, influencing the relation between O4
SCDs and the aerosol profile at the time of measurementsmade at lower ELs (EL < 90◦). To minimize this influence,the measured spectra at lower ELs were evaluated with thezenith spectrum (α = 90◦) in the same measurement loop, n.Differential slant column density (DSCD) is defined as
DSCD (n, α) = SCD (n, α) − SCD (n, 90◦) [1]
where SCD (n, α) denotes the slant column density at EL α inthe same measurement loop, n.
Figure 3 shows temporal variations in O4 DSCDs measuredby MAX-DOAS. The O4 DSCDs measured on 28 May and4 June are lower than those measured on other days. The O4
FIG. 3. Time series of observed and simulated O4 DSCD values obtained atEL = 3◦, 6◦, 10◦, 15◦, and 20◦ during measurement period (28–30 May and4–8 June 2005).
DSCDs ranged from 5.1 × 1042 to 1.6 × 1043 molec2 cm–5 on 28May, and from 6.1 × 1042 to 2.0 × 1043 molec2 cm–5on 4 June.
Figure 3 compares observed O4 DSCDs with those deter-mined by a simulation based on the nonlinear inversion of theoptimal estimation method (Rodgers 2000; Irie et al. 2008). Inthis study, seven variables were used to simulate O4 DSCDs us-ing the Monte Carlo Atmospheric Radiative Transfer Simulator(MCARaTS), described in detail by Iwabuchi (2006). The sevenvariables are aerosol optical depth (τ ), the shape parameters ofthe vertical profile (F1, F2, and F3), solar zenith angle (SZA),relative azimuth angle (RAA), and EL. RAA denotes the az-imuth angle between the telescope and the Sun. F values, theshape parameters of the profile ranging from 0 to 1, were usedas τF1 and τ (1–F1)F2 for mean aerosol extinctions for the 0–1and 1–2 km layers, respectively. We employed the following apriori values (±error): τ = 0.21 (±1.0), F1 = 0.70 (±0.05),F2 = 0.60 (±0.05), and F3 = 0.60 (±0.05) (Irie et al. 2008).
We used a lookup table (LUT) containing more than 300,000vertical profiles obtained using MCARaTS for different setsof seven variables. Each vertical profile consists of 72 layersup to 100 km, and each layer below 5 km consists of 100 mvertical increments. For simulations using a radiative transfermodel (RTM), we used single-scattering albedo (s = 0.95), theasymmetry parameter (g = 0.65) from the Henyey–Greensteinapproximation (Henyey and Greenstein 1941), and the surfacealbedo (a = 0.1). The employed retrieval algorithm is describedin detail by Irie et al. (2008). Figure 3 shows temporal variationsin the observed and modeled O4 DSCDs at all ELs. The totalretrieval errors can be attributed to RTM input parameters suchas asymmetry parameter and a priori values. The errors of theretrieved state vector are calculated by the retrieval covariancematrix:
∧S = (
KT S−1ε K + S−1
a
)[2]
where K , Sε, and Sa denote the weighting function matrix, themeasurement error covariance matrix, and the a priori covari-ance matrix, respectively. The measurement error covariancematrix, Sε, was larger than O4 DSCD errors (∼1 × 1041 molec2
cm–5). For all retrievals, the median errors were estimated fromthe sensitivity tests and the retrieval covariance matrix. Theoverall errors, calculated as the root-sum-squares of these er-rors, were 0.03 (12%), 0.02 km–1 (18%), and 0.01 km–1 (44%)for optical depth (τ ) and aerosol extinction coefficients in the0–1 and 1–2 km layers, respectively (see Irie et al. 2008). Theresulting degrees of freedom for signal (Rodgers 2000) werefound to range from 1.0 to 2.7 for the measurement period.
RESULTS AND DISCUSSIONFigure 4 shows temporal variations in surface PM10 concen-
trations (Noh et al. 2007) at the measurement site, revealinga maximum PM10 concentration of 108 µg m–3 on 28 May,and concentrations between 25.3 and 66.2 µg m–3 during other
Dow
nloa
ded
by [
Inge
nta
Con
tent
Dis
trib
utio
n (P
ublis
hing
Tec
hnol
ogy)
] at
15:
56 0
7 O
ctob
er 2
014

506 LEE ET AL.
FIG. 4. Retrieved aerosol extinction coefficient (AEC) at 0–1 km height, aerosol optical depth (AOD), and surface PM10 concentration for measurement period(28–30 May and 4–8 June 2005).
periods. The aerosol extinction coefficient at 356 nm was re-trieved based on MAX-DOAS data using the retrieval algorithmfor the 0–1 and 1–2 km layers.
Figure 5 shows temporal variations in the extinction coeffi-cient and the lidar-based extinction coefficient measured duringthe intensive measurement periods (28–30 May and 4–8 June2005). Values of AEC for the 0–1 km layer observed by MAX-DOAS and lidar were 0.05–0.73 and 0.1–0.61 km–1, respec-tively; values for the 1–2 km layer were 0.01–0.20 and 0.01–0.19 km–1, respectively. Relatively enhanced aerosol extinctioncoefficients were observed on 28 May and 4 June. Based onMAX-DOAS (lidar) measurements, the coefficients for the 0–1km layer ranged from 0.30 to 0.73 km–1 (0.23 to 0.61 km–1) on28 May and from 0.21 to 0.59 km–1 (0.20 to 0.56 km–1) on 4June.
Although the retrieved extinction values might be subject tofurther validation, in most cases they are comparable to thoseobtained from lidar measurements. As discussed in Irie et al.(2007), the intrinsic uncertainties involved in MAX-DOAS are
FIG. 5. Time series of hourly average aerosol extinction coefficient at 356 nmmeasured by MAX-DOAS and lidar for layers of and (a) 1–2 km and (b) 0–1 km.
associated with several factors, such as a priori values (τ , F1, F2,and F3), fixed single-scattering albedo, and fixed surface albedo.The lidar data have an uncertainty of about 15% with the use ofa measured lidar ratio, S (Noh et al. 2007), which represents lessuncertainly than that involved using a fixed lidar ratio. An addi-tional uncertainty is related to the use of different measurementgeometries (e.g., multi axis versus zenith sky only).
Figure 6 shows correlations between aerosol extinction co-efficients (AECs) obtained from MAX-DOAS and lidar mea-surements, revealing linear correlation coefficients (R2) of 0.70and 0.35 (356 nm) for the 0–1 and 1–2 km layers, respectively.These values are slightly lower than those of 0.85 and 0.41 ob-tained by Irie et al. (2008) based on MAX-DOAS O4 DSCDmeasurements at 476 nm. The maximum differences in AECbetween MAX-DOAS and lidar were about 50% and 60% forthe 0–1 and 1–2 km layers, respectively. These differences canbe regarded as the uncertainties inherent in MAX-DOAS, whichoriginate from the ±15% uncertainty involved in lidar measure-ments (Noh et al. 2007) and other factors such as observationgeometry, uncertainties in RTM calculations, and acquisitiontime of spectra data. The decreasing sensitivity of MAX-DOASmeasurements with increasing altitude meant that less agree-ment was found in the 1–2 km layer than in the 0–1 km layer.
Figure 7 compares the MAX-DOAS-based AECs (0–1 km)with surface PM10 concentrations, revealing a relatively goodcorrelation. The degree of discrepancy between the two datasetsincreases under the following conditions: (1) non-uniform dis-tribution of aerosol concentrations near the surface and (2) thepresence of clouds at lower altitudes (<2 km), which leadsto overestimates of MAX-DOAS-based AECs due to multiple-scattering effects.
In the present study, atmospheric aerosol near the surfacewas measured using an in situ instrument (beta gauge), lidar,and MAX-DOAS instruments. Although the in situ instrumentis designated the reference PM measurement method, it pro-vides only point measurements with limited spatial coverage.Although lidar measurements provide high vertical resolution,relatively high uncertainties occur at lower altitudes because ofthe limitation regarding overlap height. MAX-DOAS operationis limited to daytime use because it utilizes scattered sunlight;however, it has high sensitivity at low altitudes, as reported in
Dow
nloa
ded
by [
Inge
nta
Con
tent
Dis
trib
utio
n (P
ublis
hing
Tec
hnol
ogy)
] at
15:
56 0
7 O
ctob
er 2
014

RETRIEVAL OF AEROSOL EXTINCTION 507
FIG. 6. Correlations between aerosol extinction coefficients (AECs) (km–1) from MAX-DOAS and lidar for measurement period (28–30 May and 4–8 June2005) for layers of (a) 0–1 km and (b) 1–2 km. Error bars represent errors estimated from retrieval covariance matrix.
this study and elsewhere (Frieß et al. 2006; Irie et al. 2008).Utilizing both lidar and MAX-DOAS instruments can be highlyeffective in accurately characterizing the spatial distribution ofatmospheric aerosol, especially at lower altitudes where mostpollution particles occur.
Figure 8 shows the backward trajectories of the air mass thatarrived at the measurement site at 03:00 UTC (12:00 LT) on28 May, as obtained using the NOAA/ARL HYSPLIT-4 model(Draxler 2004). The 5 day (120 h) backward trajectories witha 6 h time interval are plotted in Figure 8 for heights of 500,1500, 2500, and 3500 m (above ground level). The Final Run(FNL) meteorological data, which consisted of 6 hourly archivedata from the Global Data Assimilation System (GDAS) ofthe National Centers for Environmental Prediction, were used
FIG. 7. Correlations between aerosol extinction coefficients (AECs) (km–1)and AOD from MAX-DOAS and surface PM10 concentration (µg m–3). Errorbars represent errors estimated from retrieval covariance matrix.
FIG. 8. HYSPLIT 5-day backward air mass trajectories at Anmyeon Islandmeasurement site on 28 May 2005. Black stars indicate start point of backwardtrajectories; other symbols along trajectories are spaced at 6 hours apart. Lowerfigure shows height (above ground level; AGL) as a function of time (in hours)before start of trajectory.
Dow
nloa
ded
by [
Inge
nta
Con
tent
Dis
trib
utio
n (P
ublis
hing
Tec
hnol
ogy)
] at
15:
56 0
7 O
ctob
er 2
014

508 LEE ET AL.
for the trajectory calculation. Figure 8 shows that the air massfor each altitude remained over Northeast China for about 4days, passing over industrial areas (36–44◦N and 114–124◦E)and highly populated areas such as Beijing before arriving atAnmyeon Island. The air masses originated from northeast andeast Korea and north Japan when lower AEC were observed.
Lidar data indicate that aerosols were largely restricted tobelow 2 km height, except on May 28 when they attained 3 kmin height. The results of backward trajectory analysis (Figure 8)indicate that the enhanced aerosol load observed on 28 Maylargely resulted from long-range transport in the elevated aerosollayer.
The air mass backward trajectories shown in Figure 8 revealthat the enhanced aerosols observed on 28 May arose becauseof the transport of atmospheric pollutants from the Asian con-tinent to the Korean Peninsula. Aerosol extinction coefficientsfor the 1–2 km layer, as measured by MAX-DOAS (lidar), were0.08–0.19 km–1 (0.04–0.31 km–1) on 28 May and 0.05–0.16km–1 (0.06–0.13 km–1) on 4 June. The temporal variations inaerosol extinction within the 1–2 km layer show similar pat-terns to those for the 0–1 km layer, although with reducedmagnitude. These similar patterns occur when different opti-cal depth (τ ) values but similar shape parameters (F1 and F2)are obtained from iterations in nonlinear inversion. They aredue to a decrease in the sensitivity of MAX-DOAS O4 measure-ments with increasing altitude in the troposphere (Frieß et al.2006).
CONCLUSIONSTo retrieve lower-tropospheric aerosol extinction coeffi-
cients, we applied an aerosol retrieval algorithm based on O4
SCD at a UV wavelength (356 nm), obtained from several MAX-DOAS elevation angles. The retrieved quantities were validatedby comparison with collocated lidar data and measured surfacePM10 concentrations. AECs obtained for the 1–2 km layer fromMAX-DOAS are in agreement with lidar data within about 60%.We obtained a linear correlation coefficient (R2) of 0.35 betweenthe two data sets for the 1–2 km layer at a UV wavelength (356nm), slightly lower than a value of 0.41 obtained previously at avisible wavelength (476 nm; Irie et al. 2008). This discrepancycan be attributed to several uncertainties, including the utiliza-tion of O4 absorption spectra in different wavelength regions,differences in lidar systems, and different atmospheric environ-ment conditions during the measurement periods. Our resultsdemonstrate the ability of MAX-DOAS as a remote sensingtechnique for surface aerosol measurements. The developmentof MAX-DOAS that covers both UV and visible wavelengthranges would be desirable as this would improve high-altitudesensitivities. In addition, the capability of aerosol retrieval basedon MAX-DOAS measurements needs to be further improvedto determine aerosol profile information with finer verticalresolution.
REFERENCESArpaq, K. H., Johnston, P. V., Miller, H. L., Sanders, R. W., and Solomon, S.
(1994). Observation of the Stratospheric BrO Column over Colorado, 40◦N,J. Geophys. Res. 99:8175–8181.
Draxler, R. R., and Hess, G. D. (2004). Description of the Hysplit 4 ModelingSystem, NOAA Tech Memo ERL ARL-234.
Fish, D. J., and Jones, R. L. (1995). Rotational Raman Scattering and the RingEffect in Zenith-Sky Spectra, Geophys. Res. Lett. 22:811–814.
Frieß, U., Monks, P. S., Remedios, J. J., Rozanov, A., Sinreich, R., Wagner,T., and Platt, U. (2006). MAX-DOAS O4 Measurements: A New Techniqueto Derive Information on Atmospheric Aerosols: 2. Modeling Studies, J.Geophys. Res. 111:D14203, doi:10.1029/2005JD006618.
Greenblatt, G. D., Orlando, J. J., Burkholder, J. B., and Ravishankara, A. R.(1990). Absorption Measurements of Oxygen between 330 and 1140 nm, J.Geophys. Res. 95:18,577–18,582.
Heckel, A., Richter, A., Tarsu, T., Wittrock, F., Hak, C., Pundt, I., Junkermann,W., and Burrows, J. P. (2005). MAX-DOAS Measurements of Formaldehydein the Po-Valley, Atmos. Chem. Phys. 5:909–918.
Henyey, L., and Greenstein, J. (1941). Diffuse Radiation in the Galaxy, Astro-phys. J. 93:70–83.
Honninger, G., von Friedeburg, C., and Platt, U. (2004). Multi Axis DifferentialOptical Absorption Spectroscopy (MAX-DOAS), Atmos. Chem. Phys. 4:231–254.
Irie, H., Kanaya, Y., Akimoto, H., Iwabuchi, H., Shimizu, A., and Aoki, K.(2008a). First Retrieval of Tropospheric Aerosol Profiles Using MAX-DOASand Comparison with Lidar and Sky Radiometer Measurements, Atmos.Chem. Phys. 8:341–350.
Irie, H., Kanaya, Y., Akimoto, H., Iwabuchi, H., Shimizu, A., and Aoki, K.(2008b). Dual-Wavelength Aerosol Vertical Profile Measurements by MAX-DOAS at Tsukuba, Japan. Atmos. Chem. Phys. Discuss. 8:19357–19375.
Iwabuchi, H. (2006). Efficient Monte Carlo Methods for Radiative TransferModeling, J. Atmos. Sci. 63:2324–2339.
Kurucz, R. L., Furenlid, I., Brault, J., and Testerman, L. (1984). Solar FluxAtlas from 296 nm to 1300 nm. National Solar Observatory Atlas No. 1.NSO, Sunspot, New Mexico, 240.
Lee, C. K., Kim, Y. J., Tanimoto, H., Bobrowski, N., Platt, U., Mori, T.,Yamamoto, K., and Hong, C. S. (2005). High ClO and Ozone DepletionObserved in the Plume of Sakurajima Volcano, Japan. Geophys. Res. Lett. 32L21809, doi:10.1029.2005GL023785.
Lee, C. K., Richter, A., Lee, H. L., Kim, Y. J., Burrows, J. P., Lee, Y. G., andChoi, B. C. (2008). Impact of Transport of Sulfur Dioxide from the AsianContinent on the Air Quality over Korea During May 2005, Atmos. Environ.42:1461–1475.
Lee, H., Kim, Y. J., and Lee, C. (2008). Estimation of the Rate of Increase inNitrogen Dioxide Concentrations from Power Plant Stacks Using an Imaging-DOAS, Environ. Monit. Assess. DOI 10.1007/s10661-008-0296-4.
Lee, H., Kim, Y. J., Jung, J., Lee, C., Heue, K. P., Platt, U., Hu, M., and Zhu, T.(2009). Spatial and Temporal Variations in NO2 Distributions over Beijing,China Measured by Imaging Differential Optical Absorption Spectroscopy,J. Environ. Manage. DOI 10.1016/j.jenvman.2008.11.025
Miller, H. L., Weaver, A., and Sanders, R. W., Aqpag, K., and Solomon, S.(1997). Measurements of Artic Sunrise Surface Ozone Depletion Events atKangerlussuaq, Greenland (67◦N, 51◦W), Tellus 49B:496–509.
Noh, Y. M., Kim, Y. J., Choi, B. C., and Murayama, T. (2007). Aerosol LidarRatio Characteristics Measured by a Multi-Wavelength Raman Lidar Systemat Anmyeon Island, Korea. Atmos. Res. 86:76–87.
Noxon, J. F. (1975). Nitrogen Dioxide in the Stratosphere and TroposphereMeasured by Ground-Based Absorption Spectroscopy, Science 189:547–549.
Platt, U. (1994). Differential Optical Absorption Spectroscopy (DOAS) in AirMonitoring by Spectroscopic Techniques, in: M. W. Sigrist, ed., ChemicalAnalysis, vol. 127, Wiley, New York, 27–83.
Richter, A., Eisinger, M., Ladstatter, Weiβenmayer, A., Wittrock, F., and Bur-rows, J. P. (1999). DOAS Zenith-Sky Observations: 2. Seasonal Variations ofBrO over Bremen (53◦N) 1994–1995, J. Atmos. Chem. 32:83–99.
Dow
nloa
ded
by [
Inge
nta
Con
tent
Dis
trib
utio
n (P
ublis
hing
Tec
hnol
ogy)
] at
15:
56 0
7 O
ctob
er 2
014

RETRIEVAL OF AEROSOL EXTINCTION 509
Rodgers, C. D. (2000). Inverse Methods for Atmospheric Sounding: Theory andPractice, in: Taylor F. W. (Ed.), Series on Atmospheric and Oceanic PlanetaryPhysics 2, World Scientific, Hackensack, N.J.
Sanders, R. W., Solomon, S., Smith, J. P., Perliski, L., Miller, H. L., Mount,G. H., Keys J. G., and Schmeltekopf, A. L. (1993). Visible and Near-Ultraviolet Spectroscopy at McMurdo Station, Antarctica 9. Observationsof OClO from April to October 1991, J. Geophys. Res. 98:7219–7228.
Sinreich, R., Frieß, U., Wagner, T., and Platt, U. (2005). Multi Axis Differ-ential Optical Absorption Spectroscopy (MAX-DOAS) of Gas and AerosolDistributions, Faraday Discussion 130:153–164.
Sinreich, R., Volkmer, R., Filsinger, F., Frieß, U., Kern, C., and Platt, U. (2007).Sebastian O., Wagner T. 2007. MAX-DOAS Detection of Glyoxal DuringICARTT 2004, Atmos. Chem. Phys. 7:1293–1303.
Solomon, S., Mount, H. G., Sanders, R. W., and Schmeltekopf, A. L. (1987).Visible Spectroscopy at McMurdo Station, Antarctica 2. Observations ofOClO, J. Geophys. Res. 92:8329–8338.
Stutz, J., and Platt, U. (1996). Numerical Analysis and Estimation ofthe Statistical Error of Differential Optical Absorption SpectroscopyMeasurements with Least-Squares Methods, Applied Optics 35:6041–6053.
van Roozendael, M., and Fayt, C. (2001). WinDOAS 2.1 Software User Manual.Inst. d’Aeron, Spatiale de Belg./Belg., Inst. voor Ruimte-Aeron., Uccle.
Wagner, T., Dix, B., von Friedeburg, C., Frieß, U., Sanghavi, S., Sinreich, R.,and Platt, U. (2004). MAX-DOAS O4 Measurements: A New Technique toDerive Information on Atmospheric Aerosols—Principles and InformationContent, J. Geophys. Res. 109:D22205, doi:10.1029/2004JD004904.
Dow
nloa
ded
by [
Inge
nta
Con
tent
Dis
trib
utio
n (P
ublis
hing
Tec
hnol
ogy)
] at
15:
56 0
7 O
ctob
er 2
014
Copyright © 2022 FDOKUMEN