In situ vertical profiles of aerosol extinction, mass, and ...
18
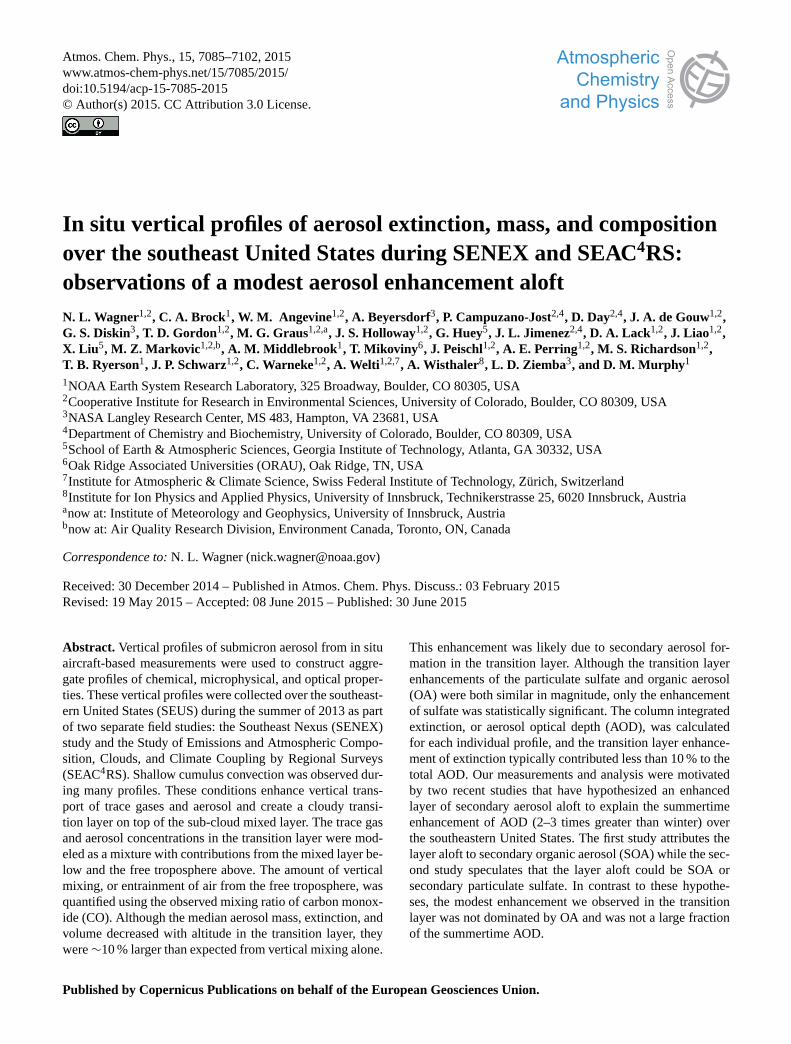
Atmos. Chem. Phys., 15, 7085–7102, 2015 www.atmos-chem-phys.net/15/7085/2015/ doi:10.5194/acp-15-7085-2015 © Author(s) 2015. CC Attribution 3.0 License. In situ vertical profiles of aerosol extinction, mass, and composition over the southeast United States during SENEX and SEAC 4 RS: observations of a modest aerosol enhancement aloft N. L. Wagner 1,2 , C. A. Brock 1 , W. M. Angevine 1,2 , A. Beyersdorf 3 , P. Campuzano-Jost 2,4 , D. Day 2,4 , J. A. de Gouw 1,2 , G. S. Diskin 3 , T. D. Gordon 1,2 , M. G. Graus 1,2,a , J. S. Holloway 1,2 , G. Huey 5 , J. L. Jimenez 2,4 , D. A. Lack 1,2 , J. Liao 1,2 , X. Liu 5 , M. Z. Markovic 1,2,b , A. M. Middlebrook 1 , T. Mikoviny 6 , J. Peischl 1,2 , A. E. Perring 1,2 , M. S. Richardson 1,2 , T. B. Ryerson 1 , J. P. Schwarz 1,2 , C. Warneke 1,2 , A. Welti 1,2,7 , A. Wisthaler 8 , L. D. Ziemba 3 , and D. M. Murphy 1 1 NOAA Earth System Research Laboratory, 325 Broadway, Boulder, CO 80305, USA 2 Cooperative Institute for Research in Environmental Sciences, University of Colorado, Boulder, CO 80309, USA 3 NASA Langley Research Center, MS 483, Hampton, VA 23681, USA 4 Department of Chemistry and Biochemistry, University of Colorado, Boulder, CO 80309, USA 5 School of Earth & Atmospheric Sciences, Georgia Institute of Technology, Atlanta, GA 30332, USA 6 Oak Ridge Associated Universities (ORAU), Oak Ridge, TN, USA 7 Institute for Atmospheric & Climate Science, Swiss Federal Institute of Technology, Zürich, Switzerland 8 Institute for Ion Physics and Applied Physics, University of Innsbruck, Technikerstrasse 25, 6020 Innsbruck, Austria a now at: Institute of Meteorology and Geophysics, University of Innsbruck, Austria b now at: Air Quality Research Division, Environment Canada, Toronto, ON, Canada Correspondence to: N. L. Wagner ([email protected]) Received: 30 December 2014 – Published in Atmos. Chem. Phys. Discuss.: 03 February 2015 Revised: 19 May 2015 – Accepted: 08 June 2015 – Published: 30 June 2015 Abstract. Vertical profiles of submicron aerosol from in situ aircraft-based measurements were used to construct aggre- gate profiles of chemical, microphysical, and optical proper- ties. These vertical profiles were collected over the southeast- ern United States (SEUS) during the summer of 2013 as part of two separate field studies: the Southeast Nexus (SENEX) study and the Study of Emissions and Atmospheric Compo- sition, Clouds, and Climate Coupling by Regional Surveys (SEAC 4 RS). Shallow cumulus convection was observed dur- ing many profiles. These conditions enhance vertical trans- port of trace gases and aerosol and create a cloudy transi- tion layer on top of the sub-cloud mixed layer. The trace gas and aerosol concentrations in the transition layer were mod- eled as a mixture with contributions from the mixed layer be- low and the free troposphere above. The amount of vertical mixing, or entrainment of air from the free troposphere, was quantified using the observed mixing ratio of carbon monox- ide (CO). Although the median aerosol mass, extinction, and volume decreased with altitude in the transition layer, they were ∼10 % larger than expected from vertical mixing alone. This enhancement was likely due to secondary aerosol for- mation in the transition layer. Although the transition layer enhancements of the particulate sulfate and organic aerosol (OA) were both similar in magnitude, only the enhancement of sulfate was statistically significant. The column integrated extinction, or aerosol optical depth (AOD), was calculated for each individual profile, and the transition layer enhance- ment of extinction typically contributed less than 10 % to the total AOD. Our measurements and analysis were motivated by two recent studies that have hypothesized an enhanced layer of secondary aerosol aloft to explain the summertime enhancement of AOD (2–3 times greater than winter) over the southeastern United States. The first study attributes the layer aloft to secondary organic aerosol (SOA) while the sec- ond study speculates that the layer aloft could be SOA or secondary particulate sulfate. In contrast to these hypothe- ses, the modest enhancement we observed in the transition layer was not dominated by OA and was not a large fraction of the summertime AOD. Published by Copernicus Publications on behalf of the European Geosciences Union.
-
Upload
khangminh22 -
Category
Documents
-
view
5 -
download
0
Transcript of In situ vertical profiles of aerosol extinction, mass, and ...
Atmos. Chem. Phys., 15, 7085–7102, 2015www.atmos-chem-phys.net/15/7085/2015/doi:10.5194/acp-15-7085-2015© Author(s) 2015. CC Attribution 3.0 License.
In situ vertical profiles of aerosol extinction, mass, and compositionover the southeast United States during SENEX and SEAC4RS:observations of a modest aerosol enhancement aloftN. L. Wagner1,2, C. A. Brock1, W. M. Angevine1,2, A. Beyersdorf3, P. Campuzano-Jost2,4, D. Day2,4, J. A. de Gouw1,2,G. S. Diskin3, T. D. Gordon1,2, M. G. Graus1,2,a, J. S. Holloway1,2, G. Huey5, J. L. Jimenez2,4, D. A. Lack1,2, J. Liao1,2,X. Liu 5, M. Z. Markovic 1,2,b, A. M. Middlebrook 1, T. Mikoviny 6, J. Peischl1,2, A. E. Perring1,2, M. S. Richardson1,2,T. B. Ryerson1, J. P. Schwarz1,2, C. Warneke1,2, A. Welti1,2,7, A. Wisthaler8, L. D. Ziemba3, and D. M. Murphy 1
1NOAA Earth System Research Laboratory, 325 Broadway, Boulder, CO 80305, USA2Cooperative Institute for Research in Environmental Sciences, University of Colorado, Boulder, CO 80309, USA3NASA Langley Research Center, MS 483, Hampton, VA 23681, USA4Department of Chemistry and Biochemistry, University of Colorado, Boulder, CO 80309, USA5School of Earth & Atmospheric Sciences, Georgia Institute of Technology, Atlanta, GA 30332, USA6Oak Ridge Associated Universities (ORAU), Oak Ridge, TN, USA7Institute for Atmospheric & Climate Science, Swiss Federal Institute of Technology, Zürich, Switzerland8Institute for Ion Physics and Applied Physics, University of Innsbruck, Technikerstrasse 25, 6020 Innsbruck, Austriaanow at: Institute of Meteorology and Geophysics, University of Innsbruck, Austriabnow at: Air Quality Research Division, Environment Canada, Toronto, ON, Canada
Correspondence to:N. L. Wagner ([email protected])
Received: 30 December 2014 – Published in Atmos. Chem. Phys. Discuss.: 03 February 2015Revised: 19 May 2015 – Accepted: 08 June 2015 – Published: 30 June 2015
Abstract. Vertical profiles of submicron aerosol from in situaircraft-based measurements were used to construct aggre-gate profiles of chemical, microphysical, and optical proper-ties. These vertical profiles were collected over the southeast-ern United States (SEUS) during the summer of 2013 as partof two separate field studies: the Southeast Nexus (SENEX)study and the Study of Emissions and Atmospheric Compo-sition, Clouds, and Climate Coupling by Regional Surveys(SEAC4RS). Shallow cumulus convection was observed dur-ing many profiles. These conditions enhance vertical trans-port of trace gases and aerosol and create a cloudy transi-tion layer on top of the sub-cloud mixed layer. The trace gasand aerosol concentrations in the transition layer were mod-eled as a mixture with contributions from the mixed layer be-low and the free troposphere above. The amount of verticalmixing, or entrainment of air from the free troposphere, wasquantified using the observed mixing ratio of carbon monox-ide (CO). Although the median aerosol mass, extinction, andvolume decreased with altitude in the transition layer, theywere∼10 % larger than expected from vertical mixing alone.
This enhancement was likely due to secondary aerosol for-mation in the transition layer. Although the transition layerenhancements of the particulate sulfate and organic aerosol(OA) were both similar in magnitude, only the enhancementof sulfate was statistically significant. The column integratedextinction, or aerosol optical depth (AOD), was calculatedfor each individual profile, and the transition layer enhance-ment of extinction typically contributed less than 10 % to thetotal AOD. Our measurements and analysis were motivatedby two recent studies that have hypothesized an enhancedlayer of secondary aerosol aloft to explain the summertimeenhancement of AOD (2–3 times greater than winter) overthe southeastern United States. The first study attributes thelayer aloft to secondary organic aerosol (SOA) while the sec-ond study speculates that the layer aloft could be SOA orsecondary particulate sulfate. In contrast to these hypothe-ses, the modest enhancement we observed in the transitionlayer was not dominated by OA and was not a large fractionof the summertime AOD.
Published by Copernicus Publications on behalf of the European Geosciences Union.
7086 N. L. Wagner et al.: Vertical profile of aerosol over the SEUS
1 Introduction
Shallow cumulus convection is common over the southeast-ern United States (SEUS) during the summer. It enhancesthe vertical transport of trace gases and aerosol and creates atransition layer between the mixed layer and free troposphere(Siebesma, 1998). Due to the presence of clouds and entrain-ment in the transition layer, it has also been referred to as thecloud layer and the entrainment zone. The transition layer isintermittently mixed by thermal plumes that originate in themixed layer and form cumulus clouds that release latent heatwithin the layer. There have been several observations of ver-tical transport and redistribution of trace gases by shallow cu-mulus convection (Angevine, 2005; Ching and Alkezweeny,1986; Ching et al., 1988; Greenhut, 1986), and a few studieshave investigated the vertical transport and aerosol formationduring cumulus convection (Ching et al., 1988; Sorooshian etal., 2006, 2007; Wonaschuetz et al., 2012).
Based on the seasonality of the surface-aerosol–aerosol-optical-depth (AOD) relationship in the SEUS and the spatialsimilarity of biogenic emissions and enhanced AOD, Gold-stein et al. (2009) and Ford and Heald (2013) have hypothe-sized the existence of a layer of enhanced secondary aerosolaloft in the summer which contributes to AOD but not to sur-face measurements of aerosol mass. Goldstein et al. (2009)hypothesize that the aerosol layer is primarily secondary or-ganic aerosol (SOA), while Ford and Heald speculate thatthe layer aloft could be either SOA or particulate sulfate. Al-though neither study speculates about meteorological mech-anisms that would lead to the formation of this layer, aerosolproduction in the transition layer of shallow cumulus con-vection is a plausible mechanism that could produce the hy-pothesized layer. More generally, the vertical distribution ofaerosol and aerosol formation are integral to understandingthe relationship between aerosol mass (PM2.5) at the surfaceand AOD (Hoff and Christopher, 2009).
Submicrometer aerosol particles, which dominate aerosolmass, are largely secondary and composed of organic aerosol(OA) and sulfates during the summer in the SEUS (Edger-ton et al., 2005; Weber et al., 2007). While the formationmechanisms of secondary particulate sulfate are well under-stood (e.g., Seinfeld and Pandis, 1998), the formation of SOAis more complex and uncertain. Both biogenic and anthro-pogenic precursor emissions are thought to be important (deGouw and Jimenez, 2009). The relative importance of the ho-mogenous and aqueous oxidation pathways for both sulfateand OA is also uncertain (Carlton and Turpin, 2013; Carltonet al., 2008; Eatough et al., 1994; Ervens et al., 2011; Luriaand Sievering, 1991; McKeen et al., 2007). Based on theabundance of aerosol water and cumulus convection, aque-ous processing is expected to be an important aerosol forma-tion pathway in the SEUS (He et al., 2013), and processing incloud droplets would occur primarily in the transition layer.
In this analysis, aircraft-based in situ measurements ofaerosol chemical, physical, and optical properties are used
to examine the vertical structure of aerosol in the SEUSduring shallow cumulus convection and to quantify aerosolenhancements in the transition layer and its contribution tosummertime AOD. We use measurements made aboard theNational Oceanic and Atmospheric Administration (NOAA)WP-3D aircraft during the Southeast Nexus (SENEX) studyin June and July of 2013 and the National Aeronauticand Space Administration (NASA) DC-8 aircraft duringSEAC4RS in August and September of 2013 to construct ag-gregate vertical profiles of aerosol extinction, mass, and com-position as a function of altitude over the SEUS. The transi-tion layer aerosol and trace gas concentrations are modeledas a mixture with contributions from the free troposphere andmixed layer. The in situ measurements of the extinction co-efficient are used to calculate the AOD and contributions tothe AOD from aerosol water, from the mixed layer, and fromthe transition layer.
2 Methods and measurements
In this analysis we combine data collected during two aircraftfield studies that were partially conducted over the SEUS inthe spring and summer of 2013. Although the SENEX studycollected measurements in late spring and early summerwhile SEAC4RS collected measurements in the late summer,both studies encountered shallow cumulus convection. Ad-ditionally, both aircraft hosted a similar set of in situ instru-ments, which was conducive to a combined analysis.
2.1 SENEX
The SENEX study was part of the larger Southeast Atmo-sphere Study in the SEUS during June and July of 2013. TheNOAA WP-3D aircraft flew 18 research flights based out ofSmyrna, Tennessee, during June and July 2013 for SENEXwith a payload of instruments measuring atmospheric tracegases, aerosol properties, and meteorological parameters.This analysis uses measurements of carbon monoxide (CO),carbon dioxide (CO2), methane (CH4), sulfur dioxide (SO2),isoprene, aerosol composition, and aerosol optical properties(Table 1). The aerosol was sampled downstream of a low tur-bulence inlet (Wilson et al., 2004) and an impactor with a1 µm aerodynamic diameter size cut. Before impaction, thesampled aerosol was initially dried by ram heating whensampling into the aircraft. The sampled aerosol was thendried further in each instrument.
The non-refractory aerosol composition was measured bya compact time-of-flight aerosol mass spectrometer (AMS)downstream of a pressure controlled inlet (Bahreini et al.,2008) and most (97 %) of the submicron volume measuredby the aerosol sizing instruments was transmitted into theAMS during SENEX. The collection efficiency for the AMSwas determined by the composition for each data point usingthe algorithm described by Middlebrook et al. (2012). When
Atmos. Chem. Phys., 15, 7085–7102, 2015 www.atmos-chem-phys.net/15/7085/2015/
N. L. Wagner et al.: Vertical profile of aerosol over the SEUS 7087
comparing the volume derived from composition (AMS plusblack carbon mass) to the volume measured by the aerosolsizing instruments in the manner outlined by Bahreini etal. (2009), 87 % of the aerosol composition and sizing datafrom the entire SENEX study is within the combined uncer-tainties.
2.2 SEAC4RS
SEAC4RS consisted of measurements aboard three aircraftbased in Houston, Texas, during August and September of2013. In this analysis, we focus on in situ measurementsfrom the NASA DC-8 aircraft, which conducted 19 researchflights. The measurements that were collected onboard theDC-8 and used in this analysis are summarized in Table 2.Unlike the SENEX study, there was no continuous mea-surement of methane during SEAC4RS. The aerosol extinc-tion and black carbon instruments flown on the DC-8 dur-ing SEAC4RS were the same instruments used onboard theNOAA WP-3D aircraft during SENEX. Measurements ofaerosol extinction, volume, and black carbon mass sampledaerosol through a shrouded diffuser inlet described by Mc-Naughton et al. (2007). The aerosol extinction was measureddownstream of 1 µm impactor.
The non-refractory aerosol composition was measured bya high resolution time-of-flight AMS similar to the compacttime-of-flight AMS used during the SENEX study. The twoinstruments differed in the resolution of the mass spectrom-eter. The higher resolution AMS used during SEAC4RS wasoperated with a 1 s sample interval. This AMS was operatedsimilar to Dunlea et al. (2009) and also used a pressure-controlled inlet (Bahreini et al., 2008). The composition-dependent formulation of Middlebrook et al. (2012) wasused to estimate the collection efficiency. The AMS sampledaerosol downstream of a HIMIL inlet (http://www.eol.ucar.edu/homes/dcrogers/Instruments/Inlets/). In both the HIMILinlet and the shrouded diffuser inlet, the sampled aerosol wasinitially dried by ram heating and then further dried in eachinstrument.
2.3 Surface measurements
The Southeastern Aerosol Research and Characterization(SEARCH) Network consists of eight continuous monitor-ing ground sites in Georgia and Alabama hosting severalgas-phase and aerosol measurements (Edgerton et al., 2005,2006; Hansen et al., 2003). During SENEX the NOAA WP-3D flew over four of these sites a total of 15 times, and ex-tinction near the surface is calculated using measurementsof aerosol scattering (Radiance Research Model M903 neph-elometer, Tempe, Arizona, USA) and absorption (MageeScientific Model AE-16 Aethalometer, Berkeley, California,USA) at each SEARCH site to compare with the extinctionmeasured onboard the NOAA WP-3D aircraft in the mixedlayer.
2.4 Aerosol water
The enhancement of extinction due to condensation of wateronto the aerosol is modeled using an empirical parameteriza-tion (shown in Eq. 1), hereafter referred to as the kappa pa-rameterization (Brock et al., 2015). The hygroscopic growthof particle diameter is described by kappa-Koehler theory(Petters and Kreidenweis, 2007). A particle size distribu-tion and a Mie scattering calculation would be necessaryto rigorously extend the kappa-Koehler theory to the hygro-scopic enhancement of optical properties. However, Brock etal. (2015) shows that when atmospheric accumulation modesize distributions typical of the SEUS are used, the functionalform of kappa-Koehler theory can be applied directly to theoptical extinction (Eq. 1).
σext(RH) = σext(dry) ×
(1+ κopt×
(RH
100− RH
)). (1)
The humidified extinction coefficientσext(RH) is a functionof the dry extinctionσext(dry) and the hygroscopicity param-eterκopt. We note thatκopt is based on the measurement ofhumidified extinction rather than the direct measurement ofthe diameter growth factor or activation fraction, i.e., humid-ified tandem differential mobility analyzers and cloud con-densation nuclei counters. The aerosol extinction is measuredin three separate constant RH channels: in dry conditions(RH less than 30 %), medium (RH typically 70 %), and high(RH greater than 80 %). The hygroscopicity parameter (κopt)is determined by fitting the three measurements of extinc-tion to Eq. (1). The resultingκopt andσext(dry) are then usedto estimate the extinction at ambient RH. Lower values ofaerosol hygroscopicity generally correspond to mineral dust,aerosol with high soot fraction, or primary OA such as freshbiomass burning emissions or automotive emissions (Mas-soli et al., 2009; Quinn et al., 2005). High hygroscopicityusually corresponds to an oxidized, aged aerosol, large sul-fate mass fractions, and/or sea salt aerosol.
The calculated ambient extinction will differ from the ac-tual ambient extinction in three cases. First, if the hygro-scopic growth exhibits hysteresis and the ambient RH is be-low the deliquesce RH, ambient particles may be on the deli-quescing (lower) or efflorescing (upper) branch of the hys-teresis curve (Santarpia et al., 2004). Our extinction mea-surements cannot distinguish between these two states, be-cause the sample aerosol is first dried. Then the aerosol ishumidified to RH greater than 90 % in a cooled Nafion hu-midifier. The temperature of the humidifier (10–15 K belowinstrument temperature for 70 % RH and 1–3 K below for90 % RH) is varied to control amount of water vapor addedto the sample and maintain a constant RH in the samplecell. Finally the sample aerosol is reheated to the instrumenttemperature and measured in the sample cell. (The sampleaerosol is exposed to elevated RH for a duration of 4 s be-fore measurement.) Hence, the measured extinction at highRH and the subsequently calculated hygroscopicity parame-
www.atmos-chem-phys.net/15/7085/2015/ Atmos. Chem. Phys., 15, 7085–7102, 2015
7088 N. L. Wagner et al.: Vertical profile of aerosol over the SEUS
Table 1.Measurements aboard the NOAA WP-3D used in this analysis. The sample interval corresponds to the rate at which data are reportedand is the integration time for the lower limit of detection.
Measurement Technique Sample interval Lower limit of detection Accuracy Reference
Dry sub-micrometer aerosol Cavity ring-down spectrometer 1 s 0.1 Mm−1 5 % (RH < 30 %) Langridge et al. (2011)extinction (532 nm)Humidified sub-micrometer Cavity ring-down spectrometer 1 s 0.1 Mm−1 11 % (RH= 90 %) Langridge et al. (2011)aerosol extinction (532 nm)Sub-micrometer aerosol Compact time-of-flight 10 s OA < 0.4 µg m−3 38 % OA Drewnick et al. (2005);composition aerosol mass spectrometer SO4 < 0.05 µg m−3 34 % Inorg. Canagaratna et al. (2007)Sub-micrometer Optical particle counter 1 s 0.03 µm3 cm−3
+26 %,−12 % Cai et al. (2008)aerosol volumeCO Vacuum ultraviolet 1 s 0.5 ppbv 5 % Holloway et al. (2000)
fluorescenceIsoprene Proton transfer reaction 14 s < 32 pptv 20 % de Gouw and
mass spectrometer Warneke (2007)Dew point (RH) Chilled mirror hygrometer 1 s – 0.2◦C –Black carbon mass Single particle soot photometer 1 s 12 ng m−3 30 % Schwarz et al. (2008)SO2 Pulsed ultraviolet fluorescence 1 s 250 pptv 20 % Ryerson et al. (1998)CH4 Cavity ring-down spectrometer 1 s – 1.2 ppbv Peischl et al. (2012)CO2 Cavity ring-down spectrometer 1 s − 0.15 ppmv Peischl et al. (2012)
Table 2.Measurements aboard the NASA DC-8 used in this analysis. The sample interval corresponds to the rate at which data are reportedand is the integration time for the lower limit of detection.
Measurement Technique Sample interval Lower limit of detection Accuracy Reference
Dry sub-micrometer Cavity ring-down spectrometer 1 s 0.1 Mm−1 5 % (RH < 30 %) Langridge et al. (2011)aerosol extinction (532 nm)Humidified sub-micrometer Cavity ring-down spectrometer 1 s 0.1 Mm−1 11 % (RH= 90 %) Langridge et al. (2011)aerosol extinction (532 nm)Sub-micrometer High resolution time-of-flight 1 s 0.6 µg m−3 OA 38 % OA Canagaratna et al. (2007)aerosol composition aerosol mass spectrometer 0.06 µg m−3 SO4 34 % Inorg.
0.06 µg m−3 NO30.01 µg m−3 NH4
Sub-micrometer aerosol volume Optical particle counter 1 s 0.03 um3 cm−3+26,−12 % Cai et al. (2008)
CO Infrared absorption 1 s 0.5 ppbv 5 % Sachse et al. (1987)Isoprene Proton transfer reaction 14 s 25 pptv 10 % de Gouw and Warneke (2007)
mass spectrometerDew point (RH) Chilled mirror hygrometer 1 s – 0.2◦C –Black carbon mass Single particle soot photometer 1 s 12 ng m−3 30 % Schwarz et al. (2008)SO2 Chemical ionization 1 s 9 pptv 15 % Kim et al. (2007)
mass spectrometerCO2 Infrared absorption 1 s – 0.2 ppm Vay et al. (2011)
ter κopt represent the hygroscopic growth of an efflorescingaerosol on the upper branch. If the aerosol undergoes hys-teresis, we expected most aerosol in the summertime SEUSto be on the upper branch because the aerosol regularly passthrough clouds and are exposed to high RH conditions. Theaerosol also rarely experiences dry conditions (RH less than30 %). Second, because the kappa parameterization producesan ambient extinction that asymptotically approaches infin-ity as RH approaches 100 %, we used ambient RH to cal-culate the ambient extinction only when RH was less than95 % and assumed a constant RH of 95 % when ambient RHis greater than or equal to 95 %. Therefore, the calculatedambient extinction is a lower limit of the ambient extinctionwhen RH was greater than 95 %. Third, in the case that super-micrometer particles (which are not sampled by instrumentsused in this analysis) make a significant contribution, the am-bient extinction is underestimated. This is typically the case
during dust events and during in-cloud sampling, which wereeither not observed or excluded from this analysis, respec-tively.
2.5 Aggregation of vertical profiles
Individual profiles are affected by horizontal advectionwhich couples spatially inhomogeneous emissions to the ver-tical profiles. Because of vertical wind shear and spatial vari-ability during slant profiles, the vertical layers in an individ-ual profile are not always directly comparable. The aggrega-tion of the individual profiles is used to reduce the influenceof this variability and resolve the typical vertical structureand mixing over the SEUS. Individual vertical profiles wereselected from the research flights by inspection of the altitudetime series and are generally included for all ascents and de-scents with an altitude difference greater than 1 km. Measure-ments during level flight legs were not used in this analysis.
Atmos. Chem. Phys., 15, 7085–7102, 2015 www.atmos-chem-phys.net/15/7085/2015/
N. L. Wagner et al.: Vertical profile of aerosol over the SEUS 7089
Although cloud penetration was mostly avoided, aerosol datasampled during cloud penetration events were excluded dueto the effects of particle shattering in the inlets. Cloud pene-tration events were identified using the video from the noseof the aircraft and cloud particle imaging probes mountednear the wing tips. Transects of biomass burning plumeswere identified using tracers such as the acetonitrile mixingratio, were typically during level flight legs, and were notfound during any of the profiles used in this analysis. Exten-sive aerosol parameters (mass, extinction, volume) have beencorrected to standard temperature (273.15 K) and pressure(1013 hPa). All calculated quantities such as ambient extinc-tion and transition layer enhancements were determined be-fore aggregation and then were aggregated in the same man-ner as the observations.
For the SENEX campaign, the vertical profiles (whichwere located primarily over northern Georgia and Alabama)were generally included in the flight plans for three purposes:to characterize the background boundary layer structure be-fore and after urban and power plant plume intercepts, tocharacterize the vertical structure over surface measurementsites, and as enroute ascents and descents into and out ofthe region of interest. The SEAC4RS profiles that we usewere distributed through Mississippi and Alabama and wereconducted to characterize inflow and outflow near convec-tive systems, to examine boundary layer chemistry over theSEUS, and as enroute ascents and descents. The individualvertical profiles used here include both spiral and slant as-cents and descents and were typically between 5 and 15 minin duration.
In this analysis we construct two types of aggregate pro-files. The first includes all of the afternoon vertical profilesover the SEUS and is binned according to altitude aboveground level (“altitude-binned” aggregate profiles). The sec-ond type of aggregate includes only the subset of profilesduring which shallow cumulus convection was present andis binned according to a normalized altitude described inSect. 3.2 (“normalized” aggregate profiles). The profiles notincluded in the normalized aggregates were either collectedduring deeper convection and/or had a more complicatedstructure.
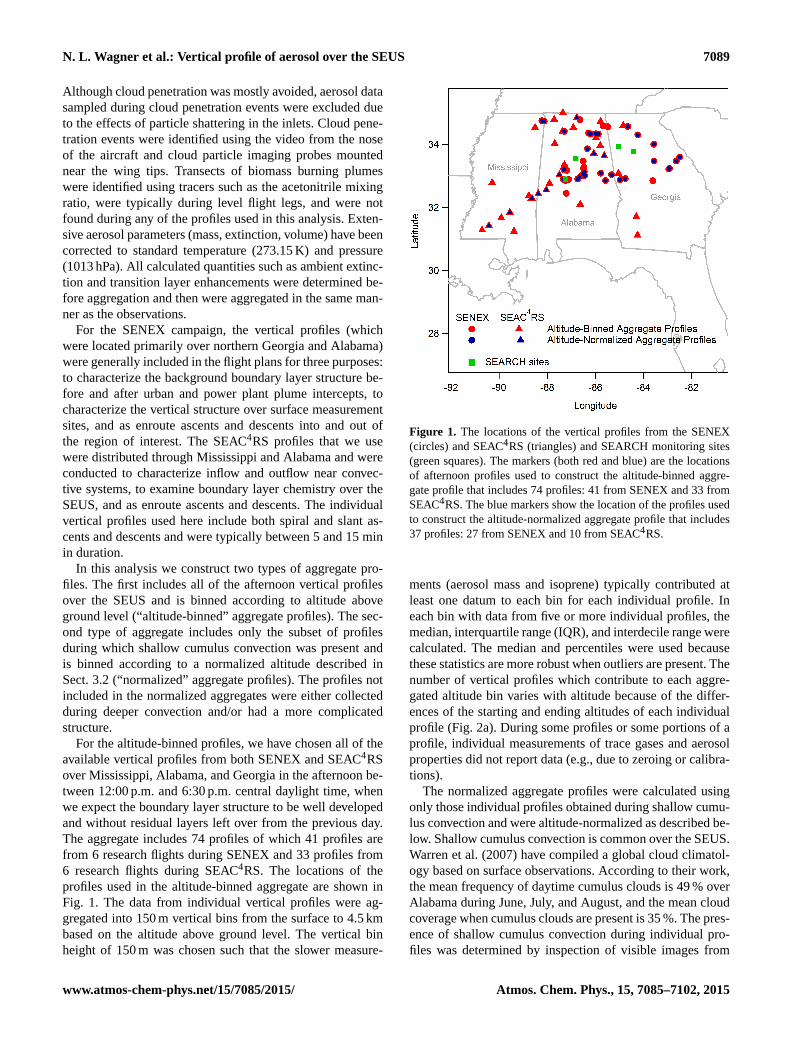
For the altitude-binned profiles, we have chosen all of theavailable vertical profiles from both SENEX and SEAC4RSover Mississippi, Alabama, and Georgia in the afternoon be-tween 12:00 p.m. and 6:30 p.m. central daylight time, whenwe expect the boundary layer structure to be well developedand without residual layers left over from the previous day.The aggregate includes 74 profiles of which 41 profiles arefrom 6 research flights during SENEX and 33 profiles from6 research flights during SEAC4RS. The locations of theprofiles used in the altitude-binned aggregate are shown inFig. 1. The data from individual vertical profiles were ag-gregated into 150 m vertical bins from the surface to 4.5 kmbased on the altitude above ground level. The vertical binheight of 150 m was chosen such that the slower measure-
Figure 1. The locations of the vertical profiles from the SENEX(circles) and SEAC4RS (triangles) and SEARCH monitoring sites(green squares). The markers (both red and blue) are the locationsof afternoon profiles used to construct the altitude-binned aggre-gate profile that includes 74 profiles: 41 from SENEX and 33 fromSEAC4RS. The blue markers show the location of the profiles usedto construct the altitude-normalized aggregate profile that includes37 profiles: 27 from SENEX and 10 from SEAC4RS.
ments (aerosol mass and isoprene) typically contributed atleast one datum to each bin for each individual profile. Ineach bin with data from five or more individual profiles, themedian, interquartile range (IQR), and interdecile range werecalculated. The median and percentiles were used becausethese statistics are more robust when outliers are present. Thenumber of vertical profiles which contribute to each aggre-gated altitude bin varies with altitude because of the differ-ences of the starting and ending altitudes of each individualprofile (Fig. 2a). During some profiles or some portions of aprofile, individual measurements of trace gases and aerosolproperties did not report data (e.g., due to zeroing or calibra-tions).
The normalized aggregate profiles were calculated usingonly those individual profiles obtained during shallow cumu-lus convection and were altitude-normalized as described be-low. Shallow cumulus convection is common over the SEUS.Warren et al. (2007) have compiled a global cloud climatol-ogy based on surface observations. According to their work,the mean frequency of daytime cumulus clouds is 49 % overAlabama during June, July, and August, and the mean cloudcoverage when cumulus clouds are present is 35 %. The pres-ence of shallow cumulus convection during individual pro-files was determined by inspection of visible images from
www.atmos-chem-phys.net/15/7085/2015/ Atmos. Chem. Phys., 15, 7085–7102, 2015
7090 N. L. Wagner et al.: Vertical profile of aerosol over the SEUS
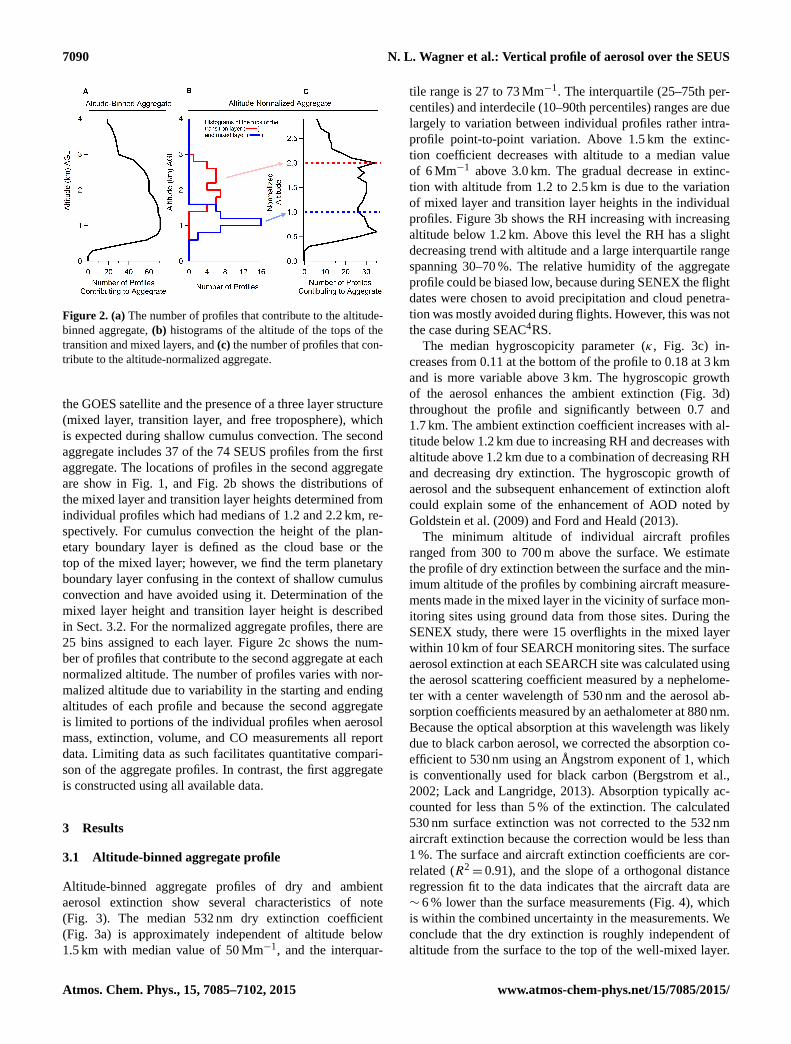
Figure 2. (a)The number of profiles that contribute to the altitude-binned aggregate,(b) histograms of the altitude of the tops of thetransition and mixed layers, and(c) the number of profiles that con-tribute to the altitude-normalized aggregate.
the GOES satellite and the presence of a three layer structure(mixed layer, transition layer, and free troposphere), whichis expected during shallow cumulus convection. The secondaggregate includes 37 of the 74 SEUS profiles from the firstaggregate. The locations of profiles in the second aggregateare show in Fig. 1, and Fig. 2b shows the distributions ofthe mixed layer and transition layer heights determined fromindividual profiles which had medians of 1.2 and 2.2 km, re-spectively. For cumulus convection the height of the plan-etary boundary layer is defined as the cloud base or thetop of the mixed layer; however, we find the term planetaryboundary layer confusing in the context of shallow cumulusconvection and have avoided using it. Determination of themixed layer height and transition layer height is describedin Sect. 3.2. For the normalized aggregate profiles, there are25 bins assigned to each layer. Figure 2c shows the num-ber of profiles that contribute to the second aggregate at eachnormalized altitude. The number of profiles varies with nor-malized altitude due to variability in the starting and endingaltitudes of each profile and because the second aggregateis limited to portions of the individual profiles when aerosolmass, extinction, volume, and CO measurements all reportdata. Limiting data as such facilitates quantitative compari-son of the aggregate profiles. In contrast, the first aggregateis constructed using all available data.
3 Results
3.1 Altitude-binned aggregate profile
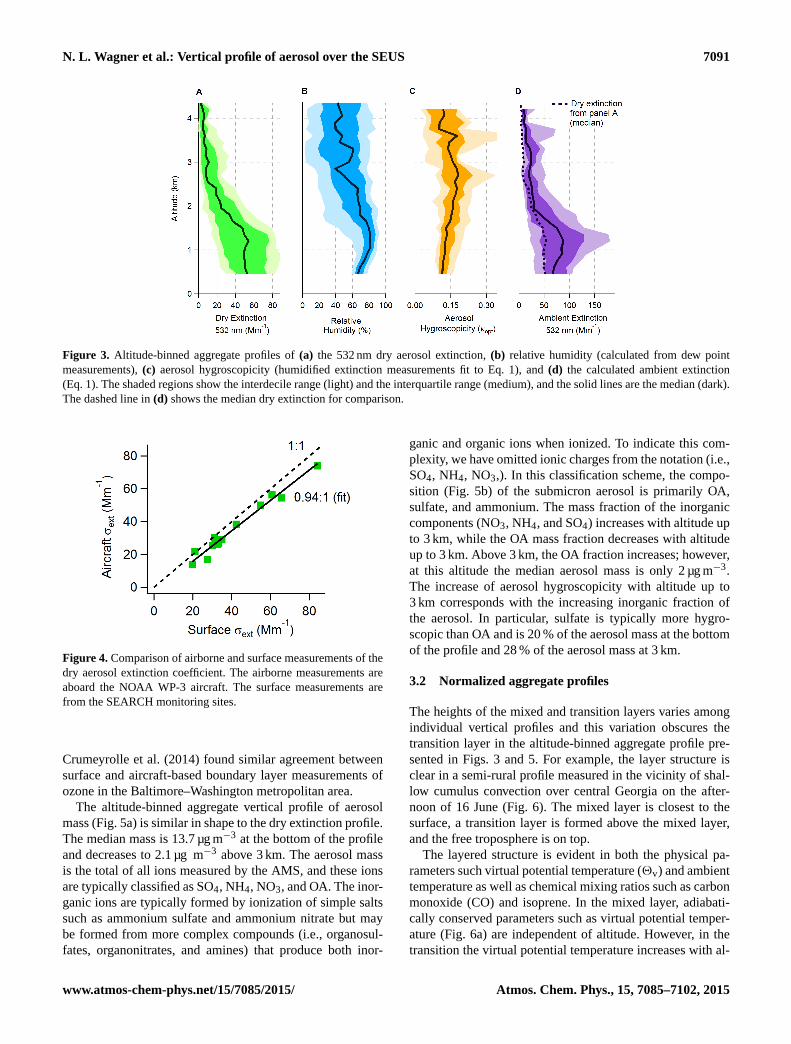
Altitude-binned aggregate profiles of dry and ambientaerosol extinction show several characteristics of note(Fig. 3). The median 532 nm dry extinction coefficient(Fig. 3a) is approximately independent of altitude below1.5 km with median value of 50 Mm−1, and the interquar-
tile range is 27 to 73 Mm−1. The interquartile (25–75th per-centiles) and interdecile (10–90th percentiles) ranges are duelargely to variation between individual profiles rather intra-profile point-to-point variation. Above 1.5 km the extinc-tion coefficient decreases with altitude to a median valueof 6 Mm−1 above 3.0 km. The gradual decrease in extinc-tion with altitude from 1.2 to 2.5 km is due to the variationof mixed layer and transition layer heights in the individualprofiles. Figure 3b shows the RH increasing with increasingaltitude below 1.2 km. Above this level the RH has a slightdecreasing trend with altitude and a large interquartile rangespanning 30–70 %. The relative humidity of the aggregateprofile could be biased low, because during SENEX the flightdates were chosen to avoid precipitation and cloud penetra-tion was mostly avoided during flights. However, this was notthe case during SEAC4RS.
The median hygroscopicity parameter (κ, Fig. 3c) in-creases from 0.11 at the bottom of the profile to 0.18 at 3 kmand is more variable above 3 km. The hygroscopic growthof the aerosol enhances the ambient extinction (Fig. 3d)throughout the profile and significantly between 0.7 and1.7 km. The ambient extinction coefficient increases with al-titude below 1.2 km due to increasing RH and decreases withaltitude above 1.2 km due to a combination of decreasing RHand decreasing dry extinction. The hygroscopic growth ofaerosol and the subsequent enhancement of extinction aloftcould explain some of the enhancement of AOD noted byGoldstein et al. (2009) and Ford and Heald (2013).
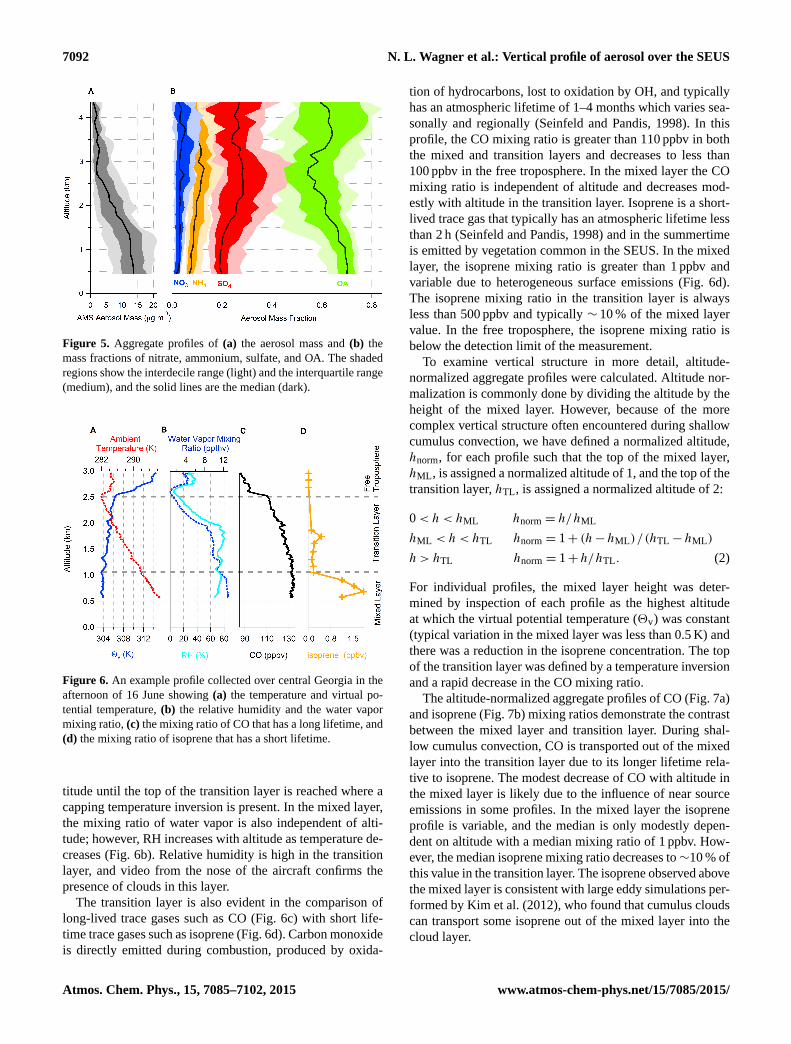
The minimum altitude of individual aircraft profilesranged from 300 to 700 m above the surface. We estimatethe profile of dry extinction between the surface and the min-imum altitude of the profiles by combining aircraft measure-ments made in the mixed layer in the vicinity of surface mon-itoring sites using ground data from those sites. During theSENEX study, there were 15 overflights in the mixed layerwithin 10 km of four SEARCH monitoring sites. The surfaceaerosol extinction at each SEARCH site was calculated usingthe aerosol scattering coefficient measured by a nephelome-ter with a center wavelength of 530 nm and the aerosol ab-sorption coefficients measured by an aethalometer at 880 nm.Because the optical absorption at this wavelength was likelydue to black carbon aerosol, we corrected the absorption co-efficient to 530 nm using an Ångstrom exponent of 1, whichis conventionally used for black carbon (Bergstrom et al.,2002; Lack and Langridge, 2013). Absorption typically ac-counted for less than 5 % of the extinction. The calculated530 nm surface extinction was not corrected to the 532 nmaircraft extinction because the correction would be less than1 %. The surface and aircraft extinction coefficients are cor-related (R2
= 0.91), and the slope of a orthogonal distanceregression fit to the data indicates that the aircraft data are∼ 6 % lower than the surface measurements (Fig. 4), whichis within the combined uncertainty in the measurements. Weconclude that the dry extinction is roughly independent ofaltitude from the surface to the top of the well-mixed layer.
Atmos. Chem. Phys., 15, 7085–7102, 2015 www.atmos-chem-phys.net/15/7085/2015/
N. L. Wagner et al.: Vertical profile of aerosol over the SEUS 7091
Figure 3. Altitude-binned aggregate profiles of(a) the 532 nm dry aerosol extinction,(b) relative humidity (calculated from dew pointmeasurements),(c) aerosol hygroscopicity (humidified extinction measurements fit to Eq. 1), and(d) the calculated ambient extinction(Eq. 1). The shaded regions show the interdecile range (light) and the interquartile range (medium), and the solid lines are the median (dark).The dashed line in(d) shows the median dry extinction for comparison.
Figure 4. Comparison of airborne and surface measurements of thedry aerosol extinction coefficient. The airborne measurements areaboard the NOAA WP-3 aircraft. The surface measurements arefrom the SEARCH monitoring sites.
Crumeyrolle et al. (2014) found similar agreement betweensurface and aircraft-based boundary layer measurements ofozone in the Baltimore–Washington metropolitan area.
The altitude-binned aggregate vertical profile of aerosolmass (Fig. 5a) is similar in shape to the dry extinction profile.The median mass is 13.7 µg m−3 at the bottom of the profileand decreases to 2.1 µg m−3 above 3 km. The aerosol massis the total of all ions measured by the AMS, and these ionsare typically classified as SO4, NH4, NO3, and OA. The inor-ganic ions are typically formed by ionization of simple saltssuch as ammonium sulfate and ammonium nitrate but maybe formed from more complex compounds (i.e., organosul-fates, organonitrates, and amines) that produce both inor-
ganic and organic ions when ionized. To indicate this com-plexity, we have omitted ionic charges from the notation (i.e.,SO4, NH4, NO3,). In this classification scheme, the compo-sition (Fig. 5b) of the submicron aerosol is primarily OA,sulfate, and ammonium. The mass fraction of the inorganiccomponents (NO3, NH4, and SO4) increases with altitude upto 3 km, while the OA mass fraction decreases with altitudeup to 3 km. Above 3 km, the OA fraction increases; however,at this altitude the median aerosol mass is only 2 µg m−3.The increase of aerosol hygroscopicity with altitude up to3 km corresponds with the increasing inorganic fraction ofthe aerosol. In particular, sulfate is typically more hygro-scopic than OA and is 20 % of the aerosol mass at the bottomof the profile and 28 % of the aerosol mass at 3 km.
3.2 Normalized aggregate profiles
The heights of the mixed and transition layers varies amongindividual vertical profiles and this variation obscures thetransition layer in the altitude-binned aggregate profile pre-sented in Figs. 3 and 5. For example, the layer structure isclear in a semi-rural profile measured in the vicinity of shal-low cumulus convection over central Georgia on the after-noon of 16 June (Fig. 6). The mixed layer is closest to thesurface, a transition layer is formed above the mixed layer,and the free troposphere is on top.
The layered structure is evident in both the physical pa-rameters such virtual potential temperature (2v) and ambienttemperature as well as chemical mixing ratios such as carbonmonoxide (CO) and isoprene. In the mixed layer, adiabati-cally conserved parameters such as virtual potential temper-ature (Fig. 6a) are independent of altitude. However, in thetransition the virtual potential temperature increases with al-
www.atmos-chem-phys.net/15/7085/2015/ Atmos. Chem. Phys., 15, 7085–7102, 2015
7092 N. L. Wagner et al.: Vertical profile of aerosol over the SEUS
Figure 5. Aggregate profiles of(a) the aerosol mass and(b) themass fractions of nitrate, ammonium, sulfate, and OA. The shadedregions show the interdecile range (light) and the interquartile range(medium), and the solid lines are the median (dark).
Figure 6. An example profile collected over central Georgia in theafternoon of 16 June showing(a) the temperature and virtual po-tential temperature,(b) the relative humidity and the water vapormixing ratio,(c) the mixing ratio of CO that has a long lifetime, and(d) the mixing ratio of isoprene that has a short lifetime.
titude until the top of the transition layer is reached where acapping temperature inversion is present. In the mixed layer,the mixing ratio of water vapor is also independent of alti-tude; however, RH increases with altitude as temperature de-creases (Fig. 6b). Relative humidity is high in the transitionlayer, and video from the nose of the aircraft confirms thepresence of clouds in this layer.
The transition layer is also evident in the comparison oflong-lived trace gases such as CO (Fig. 6c) with short life-time trace gases such as isoprene (Fig. 6d). Carbon monoxideis directly emitted during combustion, produced by oxida-
tion of hydrocarbons, lost to oxidation by OH, and typicallyhas an atmospheric lifetime of 1–4 months which varies sea-sonally and regionally (Seinfeld and Pandis, 1998). In thisprofile, the CO mixing ratio is greater than 110 ppbv in boththe mixed and transition layers and decreases to less than100 ppbv in the free troposphere. In the mixed layer the COmixing ratio is independent of altitude and decreases mod-estly with altitude in the transition layer. Isoprene is a short-lived trace gas that typically has an atmospheric lifetime lessthan 2 h (Seinfeld and Pandis, 1998) and in the summertimeis emitted by vegetation common in the SEUS. In the mixedlayer, the isoprene mixing ratio is greater than 1 ppbv andvariable due to heterogeneous surface emissions (Fig. 6d).The isoprene mixing ratio in the transition layer is alwaysless than 500 ppbv and typically∼ 10 % of the mixed layervalue. In the free troposphere, the isoprene mixing ratio isbelow the detection limit of the measurement.
To examine vertical structure in more detail, altitude-normalized aggregate profiles were calculated. Altitude nor-malization is commonly done by dividing the altitude by theheight of the mixed layer. However, because of the morecomplex vertical structure often encountered during shallowcumulus convection, we have defined a normalized altitude,hnorm, for each profile such that the top of the mixed layer,hML , is assigned a normalized altitude of 1, and the top of thetransition layer,hTL , is assigned a normalized altitude of 2:
0 < h < hML hnorm = h/hML
hML < h < hTL hnorm = 1+ (h − hML )/(hTL − hML )
h > hTL hnorm = 1+ h/hTL . (2)
For individual profiles, the mixed layer height was deter-mined by inspection of each profile as the highest altitudeat which the virtual potential temperature (2v) was constant(typical variation in the mixed layer was less than 0.5 K) andthere was a reduction in the isoprene concentration. The topof the transition layer was defined by a temperature inversionand a rapid decrease in the CO mixing ratio.
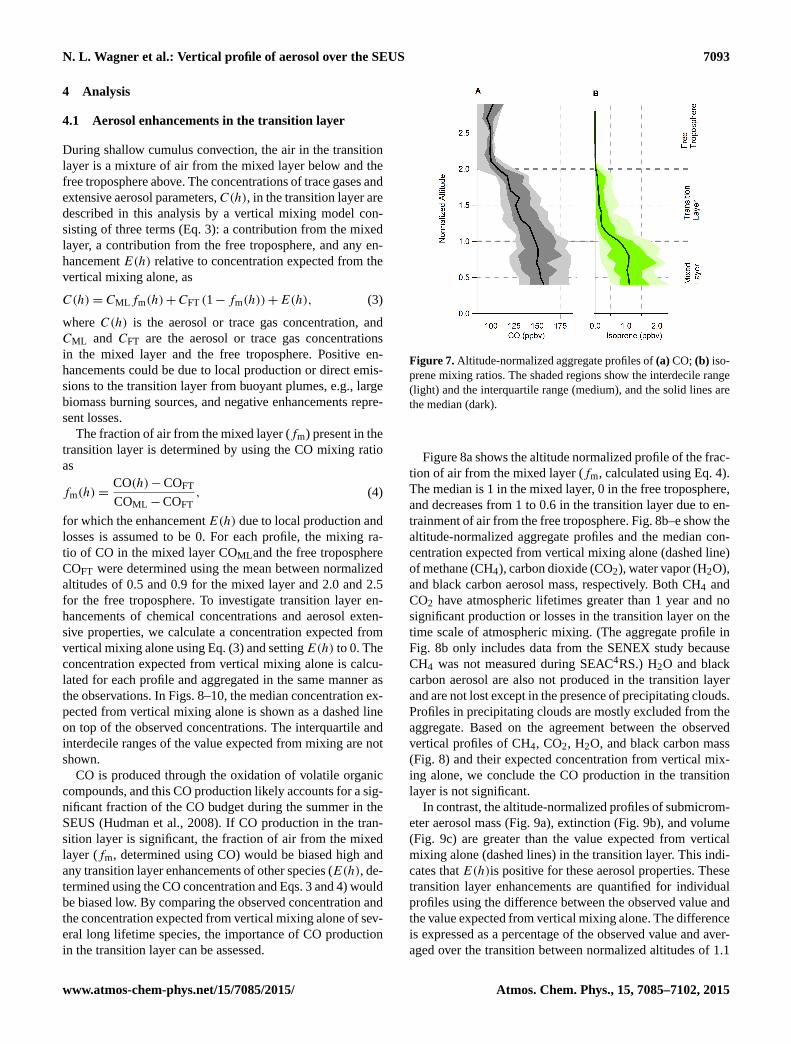
The altitude-normalized aggregate profiles of CO (Fig. 7a)and isoprene (Fig. 7b) mixing ratios demonstrate the contrastbetween the mixed layer and transition layer. During shal-low cumulus convection, CO is transported out of the mixedlayer into the transition layer due to its longer lifetime rela-tive to isoprene. The modest decrease of CO with altitude inthe mixed layer is likely due to the influence of near sourceemissions in some profiles. In the mixed layer the isopreneprofile is variable, and the median is only modestly depen-dent on altitude with a median mixing ratio of 1 ppbv. How-ever, the median isoprene mixing ratio decreases to∼10 % ofthis value in the transition layer. The isoprene observed abovethe mixed layer is consistent with large eddy simulations per-formed by Kim et al. (2012), who found that cumulus cloudscan transport some isoprene out of the mixed layer into thecloud layer.
Atmos. Chem. Phys., 15, 7085–7102, 2015 www.atmos-chem-phys.net/15/7085/2015/
N. L. Wagner et al.: Vertical profile of aerosol over the SEUS 7093
4 Analysis
4.1 Aerosol enhancements in the transition layer
During shallow cumulus convection, the air in the transitionlayer is a mixture of air from the mixed layer below and thefree troposphere above. The concentrations of trace gases andextensive aerosol parameters,C(h), in the transition layer aredescribed in this analysis by a vertical mixing model con-sisting of three terms (Eq. 3): a contribution from the mixedlayer, a contribution from the free troposphere, and any en-hancementE(h) relative to concentration expected from thevertical mixing alone, as
C(h) = CMLfm(h) + CFT (1− fm(h)) + E(h), (3)
whereC(h) is the aerosol or trace gas concentration, andCML and CFT are the aerosol or trace gas concentrationsin the mixed layer and the free troposphere. Positive en-hancements could be due to local production or direct emis-sions to the transition layer from buoyant plumes, e.g., largebiomass burning sources, and negative enhancements repre-sent losses.
The fraction of air from the mixed layer (fm) present in thetransition layer is determined by using the CO mixing ratioas
fm(h) =CO(h) − COFT
COML − COFT, (4)
for which the enhancementE(h) due to local production andlosses is assumed to be 0. For each profile, the mixing ra-tio of CO in the mixed layer COML and the free troposphereCOFT were determined using the mean between normalizedaltitudes of 0.5 and 0.9 for the mixed layer and 2.0 and 2.5for the free troposphere. To investigate transition layer en-hancements of chemical concentrations and aerosol exten-sive properties, we calculate a concentration expected fromvertical mixing alone using Eq. (3) and settingE(h) to 0. Theconcentration expected from vertical mixing alone is calcu-lated for each profile and aggregated in the same manner asthe observations. In Figs. 8–10, the median concentration ex-pected from vertical mixing alone is shown as a dashed lineon top of the observed concentrations. The interquartile andinterdecile ranges of the value expected from mixing are notshown.
CO is produced through the oxidation of volatile organiccompounds, and this CO production likely accounts for a sig-nificant fraction of the CO budget during the summer in theSEUS (Hudman et al., 2008). If CO production in the tran-sition layer is significant, the fraction of air from the mixedlayer (fm, determined using CO) would be biased high andany transition layer enhancements of other species (E(h), de-termined using the CO concentration and Eqs. 3 and 4) wouldbe biased low. By comparing the observed concentration andthe concentration expected from vertical mixing alone of sev-eral long lifetime species, the importance of CO productionin the transition layer can be assessed.
Figure 7.Altitude-normalized aggregate profiles of(a) CO; (b) iso-prene mixing ratios. The shaded regions show the interdecile range(light) and the interquartile range (medium), and the solid lines arethe median (dark).
Figure 8a shows the altitude normalized profile of the frac-tion of air from the mixed layer (fm, calculated using Eq. 4).The median is 1 in the mixed layer, 0 in the free troposphere,and decreases from 1 to 0.6 in the transition layer due to en-trainment of air from the free troposphere. Fig. 8b–e show thealtitude-normalized aggregate profiles and the median con-centration expected from vertical mixing alone (dashed line)of methane (CH4), carbon dioxide (CO2), water vapor (H2O),and black carbon aerosol mass, respectively. Both CH4 andCO2 have atmospheric lifetimes greater than 1 year and nosignificant production or losses in the transition layer on thetime scale of atmospheric mixing. (The aggregate profile inFig. 8b only includes data from the SENEX study becauseCH4 was not measured during SEAC4RS.) H2O and blackcarbon aerosol are also not produced in the transition layerand are not lost except in the presence of precipitating clouds.Profiles in precipitating clouds are mostly excluded from theaggregate. Based on the agreement between the observedvertical profiles of CH4, CO2, H2O, and black carbon mass(Fig. 8) and their expected concentration from vertical mix-ing alone, we conclude the CO production in the transitionlayer is not significant.
In contrast, the altitude-normalized profiles of submicrom-eter aerosol mass (Fig. 9a), extinction (Fig. 9b), and volume(Fig. 9c) are greater than the value expected from verticalmixing alone (dashed lines) in the transition layer. This indi-cates thatE(h)is positive for these aerosol properties. Thesetransition layer enhancements are quantified for individualprofiles using the difference between the observed value andthe value expected from vertical mixing alone. The differenceis expressed as a percentage of the observed value and aver-aged over the transition between normalized altitudes of 1.1
www.atmos-chem-phys.net/15/7085/2015/ Atmos. Chem. Phys., 15, 7085–7102, 2015
7094 N. L. Wagner et al.: Vertical profile of aerosol over the SEUS
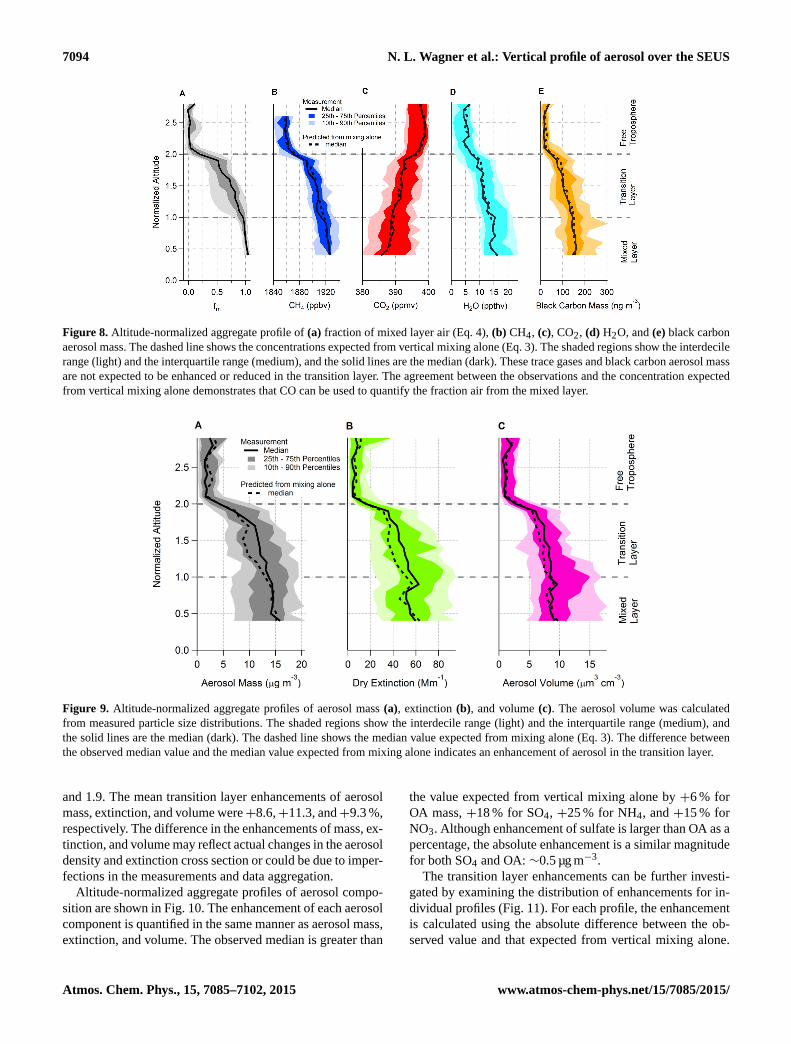
Figure 8. Altitude-normalized aggregate profile of(a) fraction of mixed layer air (Eq. 4),(b) CH4, (c), CO2, (d) H2O, and(e) black carbonaerosol mass. The dashed line shows the concentrations expected from vertical mixing alone (Eq. 3). The shaded regions show the interdecilerange (light) and the interquartile range (medium), and the solid lines are the median (dark). These trace gases and black carbon aerosol massare not expected to be enhanced or reduced in the transition layer. The agreement between the observations and the concentration expectedfrom vertical mixing alone demonstrates that CO can be used to quantify the fraction air from the mixed layer.
Figure 9. Altitude-normalized aggregate profiles of aerosol mass(a), extinction(b), and volume(c). The aerosol volume was calculatedfrom measured particle size distributions. The shaded regions show the interdecile range (light) and the interquartile range (medium), andthe solid lines are the median (dark). The dashed line shows the median value expected from mixing alone (Eq. 3). The difference betweenthe observed median value and the median value expected from mixing alone indicates an enhancement of aerosol in the transition layer.
and 1.9. The mean transition layer enhancements of aerosolmass, extinction, and volume were+8.6,+11.3, and+9.3 %,respectively. The difference in the enhancements of mass, ex-tinction, and volume may reflect actual changes in the aerosoldensity and extinction cross section or could be due to imper-fections in the measurements and data aggregation.
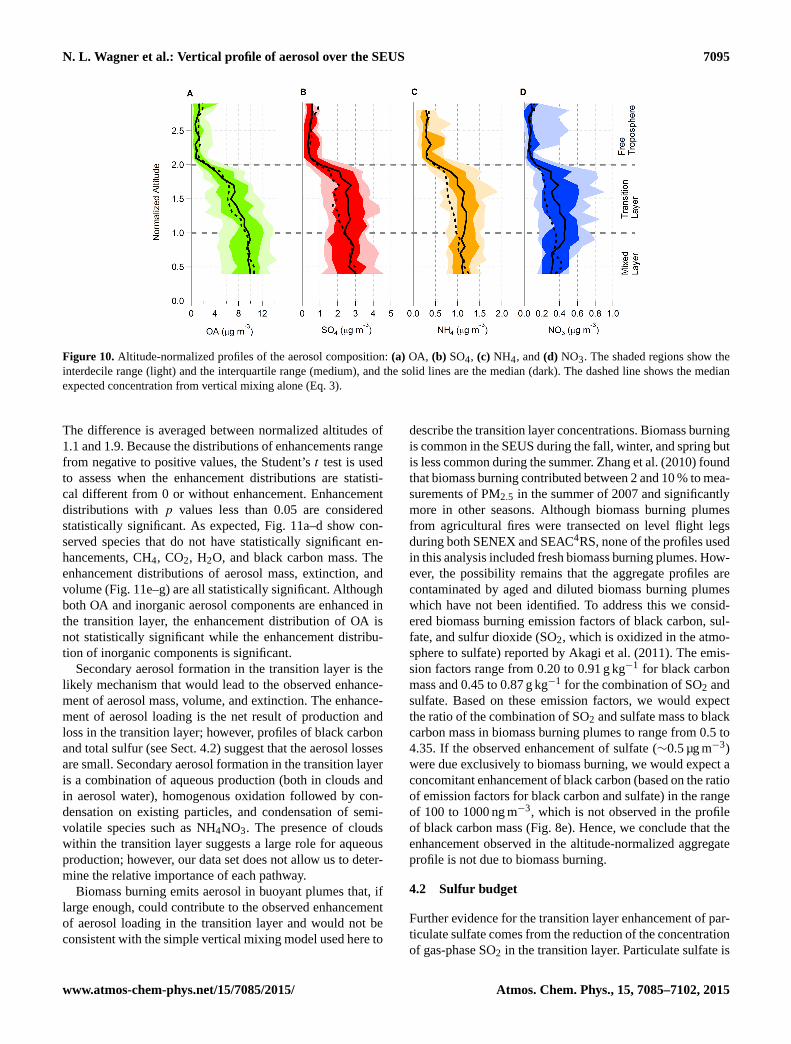
Altitude-normalized aggregate profiles of aerosol compo-sition are shown in Fig. 10. The enhancement of each aerosolcomponent is quantified in the same manner as aerosol mass,extinction, and volume. The observed median is greater than
the value expected from vertical mixing alone by+6 % forOA mass,+18 % for SO4, +25 % for NH4, and+15 % forNO3. Although enhancement of sulfate is larger than OA as apercentage, the absolute enhancement is a similar magnitudefor both SO4 and OA:∼0.5 µg m−3.
The transition layer enhancements can be further investi-gated by examining the distribution of enhancements for in-dividual profiles (Fig. 11). For each profile, the enhancementis calculated using the absolute difference between the ob-served value and that expected from vertical mixing alone.
Atmos. Chem. Phys., 15, 7085–7102, 2015 www.atmos-chem-phys.net/15/7085/2015/
N. L. Wagner et al.: Vertical profile of aerosol over the SEUS 7095
Figure 10.Altitude-normalized profiles of the aerosol composition:(a) OA, (b) SO4, (c) NH4, and(d) NO3. The shaded regions show theinterdecile range (light) and the interquartile range (medium), and the solid lines are the median (dark). The dashed line shows the medianexpected concentration from vertical mixing alone (Eq. 3).
The difference is averaged between normalized altitudes of1.1 and 1.9. Because the distributions of enhancements rangefrom negative to positive values, the Student’st test is usedto assess when the enhancement distributions are statisti-cal different from 0 or without enhancement. Enhancementdistributions withp values less than 0.05 are consideredstatistically significant. As expected, Fig. 11a–d show con-served species that do not have statistically significant en-hancements, CH4, CO2, H2O, and black carbon mass. Theenhancement distributions of aerosol mass, extinction, andvolume (Fig. 11e–g) are all statistically significant. Althoughboth OA and inorganic aerosol components are enhanced inthe transition layer, the enhancement distribution of OA isnot statistically significant while the enhancement distribu-tion of inorganic components is significant.
Secondary aerosol formation in the transition layer is thelikely mechanism that would lead to the observed enhance-ment of aerosol mass, volume, and extinction. The enhance-ment of aerosol loading is the net result of production andloss in the transition layer; however, profiles of black carbonand total sulfur (see Sect. 4.2) suggest that the aerosol lossesare small. Secondary aerosol formation in the transition layeris a combination of aqueous production (both in clouds andin aerosol water), homogenous oxidation followed by con-densation on existing particles, and condensation of semi-volatile species such as NH4NO3. The presence of cloudswithin the transition layer suggests a large role for aqueousproduction; however, our data set does not allow us to deter-mine the relative importance of each pathway.
Biomass burning emits aerosol in buoyant plumes that, iflarge enough, could contribute to the observed enhancementof aerosol loading in the transition layer and would not beconsistent with the simple vertical mixing model used here to
describe the transition layer concentrations. Biomass burningis common in the SEUS during the fall, winter, and spring butis less common during the summer. Zhang et al. (2010) foundthat biomass burning contributed between 2 and 10 % to mea-surements of PM2.5 in the summer of 2007 and significantlymore in other seasons. Although biomass burning plumesfrom agricultural fires were transected on level flight legsduring both SENEX and SEAC4RS, none of the profiles usedin this analysis included fresh biomass burning plumes. How-ever, the possibility remains that the aggregate profiles arecontaminated by aged and diluted biomass burning plumeswhich have not been identified. To address this we consid-ered biomass burning emission factors of black carbon, sul-fate, and sulfur dioxide (SO2, which is oxidized in the atmo-sphere to sulfate) reported by Akagi et al. (2011). The emis-sion factors range from 0.20 to 0.91 g kg−1 for black carbonmass and 0.45 to 0.87 g kg−1 for the combination of SO2 andsulfate. Based on these emission factors, we would expectthe ratio of the combination of SO2 and sulfate mass to blackcarbon mass in biomass burning plumes to range from 0.5 to4.35. If the observed enhancement of sulfate (∼0.5 µg m−3)were due exclusively to biomass burning, we would expect aconcomitant enhancement of black carbon (based on the ratioof emission factors for black carbon and sulfate) in the rangeof 100 to 1000 ng m−3, which is not observed in the profileof black carbon mass (Fig. 8e). Hence, we conclude that theenhancement observed in the altitude-normalized aggregateprofile is not due to biomass burning.
4.2 Sulfur budget
Further evidence for the transition layer enhancement of par-ticulate sulfate comes from the reduction of the concentrationof gas-phase SO2 in the transition layer. Particulate sulfate is
www.atmos-chem-phys.net/15/7085/2015/ Atmos. Chem. Phys., 15, 7085–7102, 2015
7096 N. L. Wagner et al.: Vertical profile of aerosol over the SEUS
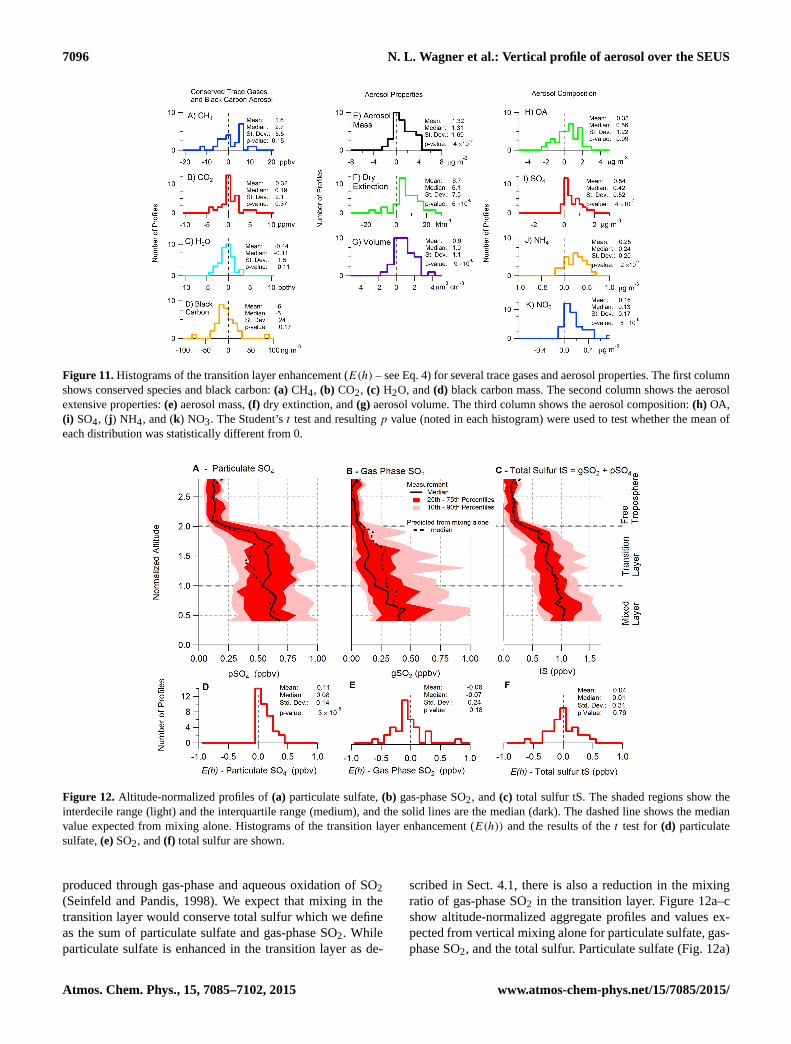
Figure 11.Histograms of the transition layer enhancement (E(h) – see Eq. 4) for several trace gases and aerosol properties. The first columnshows conserved species and black carbon:(a) CH4, (b) CO2, (c) H2O, and(d) black carbon mass. The second column shows the aerosolextensive properties:(e) aerosol mass,(f) dry extinction, and(g) aerosol volume. The third column shows the aerosol composition:(h) OA,(i) SO4, (j ) NH4, and (k) NO3. The Student’st test and resultingp value (noted in each histogram) were used to test whether the mean ofeach distribution was statistically different from 0.
Figure 12. Altitude-normalized profiles of(a) particulate sulfate,(b) gas-phase SO2, and(c) total sulfur tS. The shaded regions show theinterdecile range (light) and the interquartile range (medium), and the solid lines are the median (dark). The dashed line shows the medianvalue expected from mixing alone. Histograms of the transition layer enhancement (E(h)) and the results of thet test for (d) particulatesulfate,(e)SO2, and(f) total sulfur are shown.
produced through gas-phase and aqueous oxidation of SO2(Seinfeld and Pandis, 1998). We expect that mixing in thetransition layer would conserve total sulfur which we defineas the sum of particulate sulfate and gas-phase SO2. Whileparticulate sulfate is enhanced in the transition layer as de-
scribed in Sect. 4.1, there is also a reduction in the mixingratio of gas-phase SO2 in the transition layer. Figure 12a–cshow altitude-normalized aggregate profiles and values ex-pected from vertical mixing alone for particulate sulfate, gas-phase SO2, and the total sulfur. Particulate sulfate (Fig. 12a)
Atmos. Chem. Phys., 15, 7085–7102, 2015 www.atmos-chem-phys.net/15/7085/2015/
N. L. Wagner et al.: Vertical profile of aerosol over the SEUS 7097
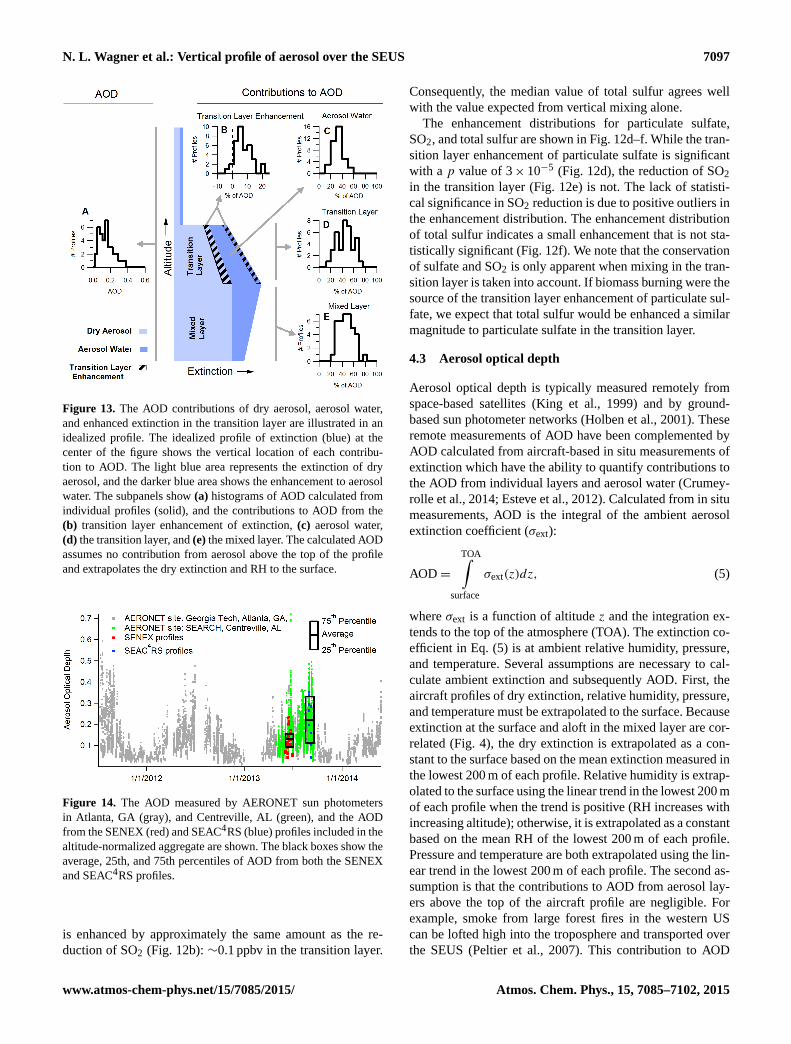
Figure 13. The AOD contributions of dry aerosol, aerosol water,and enhanced extinction in the transition layer are illustrated in anidealized profile. The idealized profile of extinction (blue) at thecenter of the figure shows the vertical location of each contribu-tion to AOD. The light blue area represents the extinction of dryaerosol, and the darker blue area shows the enhancement to aerosolwater. The subpanels show(a) histograms of AOD calculated fromindividual profiles (solid), and the contributions to AOD from the(b) transition layer enhancement of extinction,(c) aerosol water,(d) the transition layer, and(e) the mixed layer. The calculated AODassumes no contribution from aerosol above the top of the profileand extrapolates the dry extinction and RH to the surface.
Figure 14. The AOD measured by AERONET sun photometersin Atlanta, GA (gray), and Centreville, AL (green), and the AODfrom the SENEX (red) and SEAC4RS (blue) profiles included in thealtitude-normalized aggregate are shown. The black boxes show theaverage, 25th, and 75th percentiles of AOD from both the SENEXand SEAC4RS profiles.
is enhanced by approximately the same amount as the re-duction of SO2 (Fig. 12b):∼0.1 ppbv in the transition layer.
Consequently, the median value of total sulfur agrees wellwith the value expected from vertical mixing alone.
The enhancement distributions for particulate sulfate,SO2, and total sulfur are shown in Fig. 12d–f. While the tran-sition layer enhancement of particulate sulfate is significantwith a p value of 3× 10⁻⁵ (Fig. 12d), the reduction of SO2in the transition layer (Fig. 12e) is not. The lack of statisti-cal significance in SO2 reduction is due to positive outliers inthe enhancement distribution. The enhancement distributionof total sulfur indicates a small enhancement that is not sta-tistically significant (Fig. 12f). We note that the conservationof sulfate and SO2 is only apparent when mixing in the tran-sition layer is taken into account. If biomass burning were thesource of the transition layer enhancement of particulate sul-fate, we expect that total sulfur would be enhanced a similarmagnitude to particulate sulfate in the transition layer.
4.3 Aerosol optical depth
Aerosol optical depth is typically measured remotely fromspace-based satellites (King et al., 1999) and by ground-based sun photometer networks (Holben et al., 2001). Theseremote measurements of AOD have been complemented byAOD calculated from aircraft-based in situ measurements ofextinction which have the ability to quantify contributions tothe AOD from individual layers and aerosol water (Crumey-rolle et al., 2014; Esteve et al., 2012). Calculated from in situmeasurements, AOD is the integral of the ambient aerosolextinction coefficient (σext):
AOD =
TOA∫surface
σext(z)dz, (5)
whereσext is a function of altitudez and the integration ex-tends to the top of the atmosphere (TOA). The extinction co-efficient in Eq. (5) is at ambient relative humidity, pressure,and temperature. Several assumptions are necessary to cal-culate ambient extinction and subsequently AOD. First, theaircraft profiles of dry extinction, relative humidity, pressure,and temperature must be extrapolated to the surface. Becauseextinction at the surface and aloft in the mixed layer are cor-related (Fig. 4), the dry extinction is extrapolated as a con-stant to the surface based on the mean extinction measured inthe lowest 200 m of each profile. Relative humidity is extrap-olated to the surface using the linear trend in the lowest 200 mof each profile when the trend is positive (RH increases withincreasing altitude); otherwise, it is extrapolated as a constantbased on the mean RH of the lowest 200 m of each profile.Pressure and temperature are both extrapolated using the lin-ear trend in the lowest 200 m of each profile. The second as-sumption is that the contributions to AOD from aerosol lay-ers above the top of the aircraft profile are negligible. Forexample, smoke from large forest fires in the western UScan be lofted high into the troposphere and transported overthe SEUS (Peltier et al., 2007). This contribution to AOD
www.atmos-chem-phys.net/15/7085/2015/ Atmos. Chem. Phys., 15, 7085–7102, 2015
7098 N. L. Wagner et al.: Vertical profile of aerosol over the SEUS
could not be included if the smoke layer were above the max-imum altitude of the profile. In this case the AOD calculatedfrom the in situ profiles is a lower limit. Third, we neglectthe contribution to the AOD from supermicrometer particles,which we estimate to be less than 10 % of the sub-micrometerAOD based on coarse particle size distribution measurementsmade during both SENEX and SEAC4RS. Fourth, becausewe have restricted calculated aerosol hygroscopic growth toRH values less than 95 %, the AOD calculated here is only alower limit.
In addition to the AOD for each profile in the altitude-normalized aggregate, we have also calculated the contri-butions to AOD from the mixed layer, the transition layer,aerosol water, and the enhancement of aerosol extinction inthe transition layer. The median calculated AOD was 0.14and the IQR spanned 0.10 to 0.20 (Fig. 13a). An idealizedprofile of extinction during shallow cumulus convection isused to show the contributions to AOD from the transitionlayer enhancement of extinction (Fig. 13b), aerosol water(Fig. 13c), the transition layer (Fig. 13d), and the mixed layer(Fig. 13e). The contribution of the transition layer enhance-ment of ambient extinction (median: 7 %, IQR: 4–10 %) issplit between the enhancement of dry extinction and theaerosol water associated with the additional aerosol loading.The contribution of aerosol water to the whole profile (me-dian: 33 %, IQR: 24–38 %) is sensitive to the aerosol hygro-scopicity parameter and ambient RH encountered. The tran-sition layer contribution (median: 45 %, IQR: 33–55 %) wasslightly smaller than the mixed layer contribution (median:48 %, IQR: 38–57 %). The mixed layer’s slightly greatervertical extent and higher average dry extinction favor alarger contribution to AOD; however, the transition layer alsoprovides a substantial contribution to AOD because of theaerosol water associated with the higher mean RH in the tran-sition layer. The contributions to AOD presented in Fig. 13have substantial overlap (i.e., aerosol water also contributesto mixed and transition layer AOD); hence, the contributionsdo not add to unity.
The altitude-normalized aggregate profiles used in thisanalysis are drawn from 37 vertical profiles; however, theyrepresent only eight afternoons during the summer of 2013.For comparison and context, Fig. 14 shows an extended timeseries of 532 nm AOD (level 2 data) measured by AERONETsun photometers (Holben et al., 2001) at the CentrevilleSEARCH site and at the Georgia Tech site in Atlanta, Geor-gia. The Georgia Tech site is in an urban area and is per-haps biased toward larger AOD from urban emissions, whilethe Centreville site is rural. The sun photometers only reportdata during cloud-free conditions. Plotted on top of these datafrom the sun photometers are the AOD from the profiles usedin the altitude-normalized aggregate. These data are groupedinto the profiles from the SENEX and SEAC4RS studies. Air-craft profiles during the SENEX study did not sample AODgreater than 0.3 while the maximum of AOD observed bythe sun photometers was greater than 0.4. Profiles during the
SEAC4RS study, although limited in number, cover a rangeof AOD similar to the sun photometers. Because the major-ity of the profiles in the altitude-normalized aggregate arefrom the SENEX study, the aggregate may be biased towardcleaner conditions. The range of AOD observed during sum-mers of 2011–2013 at the Georgia Tech site indicate that thesummer of 2013 is not an outlier with AOD higher or lowerthan typical summers. This is consistent with the analysis ofKim et al. (2015), who has compared satellite measurementsof AOD during the summers 2006–2013.
Several SEUS studies have noted decreases in anthro-pogenic emissions (sulfur, nitrogen oxides, and volatile or-ganic compounds) in the first decade of the 21st century (Al-ston et al., 2012; Attwood et al., 2014; Hand et al., 2012,2013). Concurrently, particulate sulfate, OA, and AOD havealso decreased. Alston et al. (2012) have shown that the sum-mertime mean AOD over Georgia reported by the MISR in-strument on the Terra spacecraft decreased from∼0.3 in thesummer of 2000 to less than 0.2 in the summer of 2009,which is in the range of AOD calculated in this work for thesummer 2013.
5 Conclusions
Several preceding studies have observed vertical transport oftrace gases and aerosol from the mixed layer into the cloud-influenced transition layer during shallow cumulus convec-tion (Angevine, 2005; Ching and Alkezweeny, 1986; Green-hut, 1986; Langford et al., 2010). Our observations are con-sistent with this earlier work. In addition to vertical trans-port and redistribution of aerosol, we observed a modest en-hancement of aerosol loading in the transition layer and con-clude that secondary aerosol formation in the transition layeris the likely source of the enhancement. Although we can-not distinguish between condensational and aqueous aerosolformation pathways, the presence of clouds and elevated rel-ative humidity in the transition layer suggests a potential rolefor aqueous reactions. Using measurements of particulateoxalate as a tracer for aqueous processing, Wonaschuetz etal. (2012) and Sorooshian et al. (2007) have also observed ev-idence for secondary aerosol formation in the transition layerduring cumulus convection over Texas and near the coast ofCalifornia. Wonaschuetz et al. (2012) show no trends in theOA and particulate sulfate mass fractions with altitude in themixed and transition layers, which could occur if the produc-tion were sufficiently small or if the additional aerosol massin the transition layer were produced with the same ratio ofOA and particulate sulfate that was originally present in themixed layer. In contrast, our measurements show a distinctdifference in composition between the mixed and transitionlayers and imply a similar magnitude of secondary sulfateand OA production in the transition layer, although the pro-duction of OA was not statistically significant.
Atmos. Chem. Phys., 15, 7085–7102, 2015 www.atmos-chem-phys.net/15/7085/2015/
N. L. Wagner et al.: Vertical profile of aerosol over the SEUS 7099
Goldstein et al. (2009) and Ford and Heald (2013) hypoth-esized a layer of aerosol that would be sufficient to explaina significant fraction of the observed summertime enhance-ment of AOD (2–3 times greater than winter) and that doesnot contribute to aerosol mass at the surface. The hypothesisis partially supported by the spatial similarity of summertimebiogenic emission and summertime AOD over the SEUS.However, Alston et al. (2012) found that the spatial similaritydepended on the spatial resolution AOD of the data used inthe analysis, and their analysis of AOD and surface aerosolmass over Georgia did not fully support the hypothesis. Kimet al. (2015) found that the increase of the planetary bound-ary layer height during the summer could bring the season-ality of the AOD and surface aerosol mass into agreementwithout the need for an enhanced aerosol layer aloft.
Here, we have examined in situ vertical profiles of aerosoland found the dry aerosol to be well mixed in the lowestlayer. Above the lowest layer, the aerosol mass and extinctiondecreased with increasing altitude above that layer (Figs. 3–5). The hygroscopic growth of aerosol at high RH resulted ina layer of enhanced extinction near the top of the mixed layer.The aerosol water accounted for approximately a third of theAOD which would explain a portion of the summertime AODenhancement. The hypothesized, large enhancement of sec-ondary aerosol aloft was not apparent in these aggregate pro-files. However, after normalizing the altitude to the verticalstructure and using the CO concentration to quantify the ver-tical mixing (Figs. 7–10), we were able to resolve a modestenhancement of aerosol in the transition layer. This layer wasnot consistent with the hypothesized layer in magnitude, andthe observed composition was not consistent with the SOAdominated layer hypothesized by Goldstein et al. (2009). Weobserved enhancements that were less than 10 % of AOD,and sulfate and OA were enhanced by similar magnitude al-though the OA enhancement was not statistically significant.The seasonality of the enhancement of surface aerosol mass(less than 1.6 times greater in summer than winter) comparedto the AOD enhancement (2–3 times) was the primary evi-dence for the hypothesized layer. Given the absence of sucha layer, our observations suggest that other factors such asmeteorology and transport may influence the seasonality ofthe relationship of AOD to surface aerosol mass and warrantfurther investigation.
Acknowledgements.We thank the NOAA WP-3D and NASA DC-8scientists, flight crews, and support staff for their outstanding ef-forts in the field. In particular we would like to thank M. K. Trainerfor flight planning during SENEX. Isoprene measurements duringSEAC4RS were supported by BMVIT/FFG-ALR in the frame ofthe Austrian Space Application Program (ASAP 8, project 833451).PCJ, DAD, and JLJ measured aerosol mass and composition duringSEAC4RS and were supported by NASA NNX12AC03G andNSF AGS-1243354. Additionally, the SEARCH aerosol networkprovided surface measurement used in overflight comparisons,and we thank Brent Holben and Brad Gingrey and their staff for
establishing and maintaining the Centreville AERONET sites usedin this investigation. This analysis is funded by the NOAA’s Healthof the Atmosphere Program and Atmospheric Chemistry, CarbonCycles, and Climate Program and by NASA’s Radiation SciencesProgram under Award NNH12AT31I.
Edited by: A. Petzold
References
Akagi, S. K., Yokelson, R. J., Wiedinmyer, C., Alvarado, M. J.,Reid, J. S., Karl, T., Crounse, J. D., and Wennberg, P. O.: Emis-sion factors for open and domestic biomass burning for usein atmospheric models, Atmos. Chem. Phys., 11, 4039–4072,doi:10.5194/acp-11-4039-2011, 2011.
Alston, E. J., Sokolik, I. N., and Kalashnikova, O. V.: Charac-terization of atmospheric aerosol in the US Southeast fromground- and space-based measurements over the past decade, At-mos. Meas. Tech., 5, 1667–1682, doi:10.5194/amt-5-1667-2012,2012.
Angevine, W. M.: An integrated turbulence scheme for boundarylayers with shallow cumulus applied to pollutant transport, J.Appl. Meteorol., 44, 1436, doi:10.1175/jam2284.1, 2005.
Attwood, A. R., Washenfelder, R. A., Brock, C. A., Hu, W., Bau-mann, K., Campuzano-Jost, P., Day, D. A., Edgerton, E. S., Mur-phy, D. M., Palm, B. B., McComiskey, A., Wagner, N. L., de Sá,S. S., Ortega, A., Martin, S. T., Jimenez, J. L., and Brown, S. S.:Trends in sulfate and organic aerosol mass in the Southeast U.S.:Impact on aerosol optical depth and radiative forcing, Geophys.Res. Lett., 41, 7701, doi:10.1002/2014GL061669, 2014.
Bahreini, R., Dunlea, E. J., Matthew, B. M., Simons, C., Docherty,K. S., DeCarlo, P. F., Jimenez, J. L., Brock, C. A., and Middle-brook, A. M.: Design and operation of a pressure-controlled inletfor airborne sampling with an aerodynamic aerosol lens, AerosolSci. Tech., 42, 465, doi:10.1080/02786820802178514, 2008.
Bahreini, R., Ervens, B., Middlebrook, A. M., Warneke, C., deGouw, J. A., DeCarlo, P. F., Jimenez, J. L., Brock, C. A., Neu-man, J. A., Ryerson, T. B., Stark, H., Atlas, E., Brioude, J.,Fried, A., Holloway, J. S., Peischl, J., Richter, D., Walega, J.,Weibring, P., Wollny, A. G., and Fehsenfeld, F. C.: Organicaerosol formation in urban and industrial plumes near Hous-ton and Dallas, Texas, J. Geophys. Res.-Atmos., 114, D00F16,doi:10.1029/2008jd011493, 2009.
Bergstrom, R. W., Russell, P. B., and Hignett, P.: Wavelength de-pendence of the absorption of black carbon particles: Predictionsand results from the TARFOX experiment and implications forthe aerosol single scattering albedo, J. Atmos. Sci., 59, 567,doi:10.1175/1520-0469(2002)059<0567:wdotao>2.0.CO;2,2002.
Brock, C. A., Wagner, N. L., Anderson, B. E., Beyersdorf, A.,Campuzano-Jost, P., Carlton, A. G., Day, D. A., Diskin, G. S.,Gordon, T. D., Jimenez, J. L., Lack, D. A., Liao, J., Markovic, M.Z., Middlebrook, A. M., Perring, A., Richardson, M. S., Schwarz,J. P., Washenfelder, R. A., Welti, A., Ziemba, L., and Murphy, D.M.: Aerosol Optical Properties in the Southeastern United Statesin Summer – Part 1: Hygroscopic Growth, in preparation, 2015.
Cai, Y., Montague, D. C., Mooiweer-Bryan, W., and Desh-ler, T.: Performance characteristics of the ultra high sen-
www.atmos-chem-phys.net/15/7085/2015/ Atmos. Chem. Phys., 15, 7085–7102, 2015
7100 N. L. Wagner et al.: Vertical profile of aerosol over the SEUS
sitivity aerosol spectrometer for particles between 55 and800 nm: Laboratory and field studies, J. Aerosol Sci., 39, 759,doi:10.1016/j.jaerosci.2008.04.007, 2008.
Canagaratna, M. R., Jayne, J. T., Jimenez, J. L., Allan, J. D., Al-farra, M. R., Zhang, Q., Onasch, T. B., Drewnick, F., Coe, H.,Middlebrook, A., Delia, A., Williams, L. R., Trimborn, A. M.,Northway, M. J., DeCarlo, P. F., Kolb, C. E., Davidovits, P., andWorsnop, D. R.: Chemical and microphysical characterization ofambient aerosols with the aerodyne aerosol mass spectrometer,Mass Spectrom. Rev., 26, 185, doi:10.1002/mas.20115, 2007.
Carlton, A. G. and Turpin, B. J.: Particle partitioning potential oforganic compounds is highest in the Eastern US and driven byanthropogenic water, Atmos. Chem. Phys., 13, 10203–10214,doi:10.5194/acp-13-10203-2013, 2013.
Carlton, A. G., Turpin, B. J., Altieri, K. E., Seitzinger, S. P.,Mathur, R., Roselle, S. J., and Weber, R. J.: CMAQ ModelPerformance Enhanced When In-Cloud Secondary OrganicAerosol is Included: Comparisons of Organic Carbon Pre-dictions with Measurements, Environ. Sci. Tech., 42, 8798,doi:10.1021/es801192n, 2008.
Ching, J. K. S. and Alkezweeny, A. J.: Tracer Study of Vertical Ex-change by Cumulus Clouds, J. Clim. Appl. Meteorol., 25, 1702,doi:10.1175/1520-0450(1986)025<1702:tsoveb>2.0.co;2, 1986.
Ching, J. K. S., Shipley, S. T., and Browell, E. V.: Evidence forCloud Venting of Mixed Layer Ozone and Aerosols, Atmos. En-viron., 22, 225, doi:10.1016/0004-6981(88)90030-3, 1988.
Crumeyrolle, S., Chen, G., Ziemba, L., Beyersdorf, A., Thornhill,L., Winstead, E., Moore, R. H., Shook, M. A., Hudgins, C., andAnderson, B. E.: Factors that influence surface PM2.5 values in-ferred from satellite observations: perspective gained for the USBaltimore-Washington metropolitan area during DISCOVER-AQ, Atmos. Chem. Phys., 14, 2139–2153, doi:10.5194/acp-14-2139-2014, 2014.
de Gouw, J. A. and Warneke, C.: Measurements of volatile or-ganic compounds in the earths atmosphere using proton-transfer-reaction mass spectrometry, Mass Spectrom. Rev., 26, 223,doi:10.1002/mas.20119, 2007.
de Gouw, J. A. and Jimenez, J. L.: Organic Aerosols inthe Earth’s Atmosphere, Environ. Sci. Tech., 43, 7614,doi:10.1021/es9006004, 2009.
Drewnick, F., Hings, S. S., DeCarlo, P., Jayne, J. T., Gonin,M., Fuhrer, K., Weimer, S., Jimenez, J. L., Demerjian, K.L., Borrmann, S., and Worsnop, D. R.: A new time-of-flightaerosol mass spectrometer (TOF-AMS) – Instrument descrip-tion and first field deployment, Aerosol Sci. Tech., 39, 637,doi:10.1080/02786820500182040, 2005.
Dunlea, E. J., DeCarlo, P. F., Aiken, A. C., Kimmel, J. R., Peltier,R. E., Weber, R. J., Tomlinson, J., Collins, D. R., Shinozuka, Y.,McNaughton, C. S., Howell, S. G., Clarke, A. D., Emmons, L.K., Apel, E. C., Pfister, G. G., van Donkelaar, A., Martin, R.V., Millet, D. B., Heald, C. L., and Jimenez, J. L.: Evolutionof Asian aerosols during transpacific transport in INTEX-B, At-mos. Chem. Phys., 9, 7257–7287, doi:10.5194/acp-9-7257-2009,2009.
Eatough, D. J., Caka, F. M., and Farber, R. J.: The Conversionof SO2 to Sulfate in the Atmosphere, Isr. J. Chem., 34, 301,doi:10.1002/ijch.199400034, 1994.
Edgerton, E. S., Hartsell, B. E., Saylor, R. D., Jansen, J.J., Hansen, D. A., and Hidy, G. M.: The Southeastern
Aerosol Research and Characterization Study: Part II. Filter-based Measurements of Fine and Coarse Particulate MatterMass and Composition, J. Air Waste Manage., 55, 1527,doi:10.1080/10473289.2005.10464744, 2005.
Edgerton, E. S., Hartsell, B. E., Saylor, R. D., Jansen,J. J., Hansen, D. A., and Hidy, G. M.: The South-eastern Aerosol Research and Characterization Study, Part3: Continuous Measurements of Fine Particulate MatterMass and Composition, J. Air Waste Manage., 56, 1325,doi:10.1080/10473289.2006.10464585, 2006.
Ervens, B., Turpin, B. J., and Weber, R. J.: Secondary or-ganic aerosol formation in cloud droplets and aqueous parti-cles (aqSOA): a review of laboratory, field and model stud-ies, Atmos. Chem. Phys., 11, 11069–11102, doi:10.5194/acp-11-11069-2011, 2011.
Esteve, A. R., Ogren, J. A., Sheridan, P. J., Andrews, E., Holben, B.N., and Utrillas, M. P.: Sources of discrepancy between aerosoloptical depth obtained from AERONET and in-situ aircraft pro-files, Atmos. Chem. Phys., 12, 2987–3003, doi:10.5194/acp-12-2987-2012, 2012.
Ford, B. and Heald, C. L.: Aerosol loading in the SoutheasternUnited States: reconciling surface and satellite observations, At-mos. Chem. Phys., 13, 9269–9283, doi:10.5194/acp-13-9269-2013, 2013.
Goldstein, A. H., Koven, C. D., Heald, C. L., and Fung, I. Y.: Bio-genic carbon and anthropogenic pollutants combine to form acooling haze over the southeastern United States, P. Natl. Acad.Sci. USA, 106, 8835, doi:10.1073/pnas.0904128106, 2009.
Greenhut, G. K.: Transport of Ozone Between Booundary-Layerand Cloud Layer by Cumulus Clouds, J. Geophys. Res.-Atmos.,91, 8613, doi:10.1029/JD091iD08p08613, 1986.
Hand, J. L., Schichtel, B. A., Malm, W. C., and Pitchford, M.L.: Particulate sulfate ion concentration and SO2 emissiontrends in the United States from the early 1990s through 2010,Atmos. Chem. Phys., 12, 10353–10365, doi:10.5194/acp-12-10353-2012, 2012.
Hand, J. L., Schichtel, B. A., Malm, W. C., and Frank, N. H.:Spatial and Temporal Trends in PM2.5 Organic and Elemen-tal Carbon across the United States, Adv. Meteorol., 367674,doi:10.1155/2013/367674, 2013.
Hansen, D. A., Edgerton, E. S., Hartsell, B. E., Jansen,J. J., Kandasamy, N., Hidy, G. M., and Blanchard, C.L.: The Southeastern Aerosol Research and CharacterizationStudy: Part 1-Overview, J. Air Waste Manage., 53, 1460,doi:10.1080/10473289.2003.10466318, 2003.
He, C., Liu, J., Carlton, A. G., Fan, S., Horowitz, L. W., Levy, H.,II, and Tao, S.: Evaluation of factors controlling global secondaryorganic aerosol production from cloud processes, Atmos. Chem.Phys., 13, 1913–1926, doi:10.5194/acp-13-1913-2013, 2013.
Hoff, R. M. and Christopher, S. A.: Remote Sensing of ParticulatePollution from Space: Have We Reached the Promised Land?, J.Air Waste Manage., 59, 645, doi:10.3155/1047-3289.59.6.645,2009.
Holben, B. N., Tanre, D., Smirnov, A., Eck, T. F., Slutsker, I.,Abuhassan, N., Newcomb, W. W., Schafer, J. S., Chatenet, B.,Lavenu, F., Kaufman, Y. J., Castle, J. V., Setzer, A., Markham,B., Clark, D., Frouin, R., Halthore, R., Karneli, A., O’Neill,N. T., Pietras, C., Pinker, R. T., Voss, K., and Zibordi, G.:An emerging ground-based aerosol climatology: Aerosol optical
Atmos. Chem. Phys., 15, 7085–7102, 2015 www.atmos-chem-phys.net/15/7085/2015/
N. L. Wagner et al.: Vertical profile of aerosol over the SEUS 7101
depth from AERONET, J. Geophys. Res.-Atmos., 106, 12067,doi:10.1029/2001jd900014, 2001.
Holloway, J. S., Jakoubek, R. O., Parrish, D. D., Gerbig, C., Volz-Thomas, A., Schmitgen, S., Fried, A., Wert, B., Henry, B.,and Drummond, J. R.: Airborne intercomparison of vacuum ul-traviolet fluorescence and tunable diode laser absorption mea-surements of tropospheric carbon monoxide, J. Geophys. Res.-Atmos., 105, 24251, doi:10.1029/2000jd900237, 2000.
Hudman, R. C., Murray, L. T., Jacob, D. J., Millet, D. B., Tur-quety, S., Wu, S., Blake, D. R., Goldstein, A. H., Holloway,J., and Sachse, G. W.: Biogenic versus anthropogenic sourcesof CO in the United States, Geophys. Res. Lett., 35, L04801,doi:10.1029/2007gl032393, 2008.
Kim, P. S., Jacob, D. J., Fisher, J. A., Travis, K., Yu, K., Zhu, L.,Yantosca, R. M., Sulprizio, M. P., Jimenez, J. L., Campuzano-Jost, P., Froyd, K. D., Liao, J., Hair, J. W., Fenn, M. A., Butler,C. F., Wagner, N. L., Brock, C. A., Gordon, T. D., Welti, A., O.,W. P., Crounse, J. D., St. Clair, J. M., Teng, A. P., Millet , D. B.,Schwarz, J. P., Markovic, M. Z., and Perring, A. E.: Sources, sea-sonality, and trends of Southeast US aerosol: an integrated analy-sis of surface, aircraft, and satellite observations with the GEOS-Chem chemical transport model, Atmos. Chem. Phys. Discuss.,submitted, 2015.
Kim, S., Huey, L. G., Stickel, R. E., Tanner, D. J., Crawford,J. H., Olson, J. R., Chen, G., Brune, W. H., Ren, X., Lesher,R., Wooldridge, P. J., Bertram, T. H., Perring, A., Cohen, R.C., Lefer, B. L., Shetter, R. E., Avery, M., Diskin, G., andSokolik, I.: Measurement of HO2NO2 in the free troposphereduring the intercontinental chemical transport experiment –North America 2004, J. Geophys. Res.-Atmos., 112, D12S01,doi:10.1029/2006jd007676, 2007.
Kim, S. W., Barth, M. C., and Trainer, M.: Influence of fair-weathercumulus clouds on isoprene chemistry, J. Geophys. Res.-Atmos.,117, D10302, doi:10.1029/2011jd017099, 2012.
King, M. D., Kaufman, Y. J., Tanre, D., and Nakajima, T.: Re-mote sensing of tropospheric aerosols from space: Past, present,and future, B. Am. Meteorol. Soc., 80, 2229, doi:10.1175/1520-0477(1999)080<2229:rsotaf>2.0.co;2, 1999.
Lack, D. A. and Langridge, J. M.: On the attribution of blackand brown carbon light absorption using the Angstrom expo-nent, Atmos. Chem. Phys., 13, 10535–10543, doi:10.5194/acp-13-10535-2013, 2013.
Langford, A. O., Tucker, S. C., Senff, C. J., Banta, R. M., Brewer,W. A., Alvarez, R. J., Hardesty, R. M., Lerner, B. M., andWilliams, E. J.: Convective venting and surface ozone in Houstonduring TexAQS 2006, J. Geophys. Res.-Atmos., 115, D16305,doi:10.1029/2009jd013301, 2010.
Langridge, J. M., Richardson, M. S., Lack, D., Law, D., and Mur-phy, D. M.: Aircraft Instrument for Comprehensive Characteriza-tion of Aerosol Optical Properties, Part I: Wavelength-DependentOptical Extinction and Its Relative Humidity Dependence Mea-sured Using Cavity Ringdown Spectroscopy, Aerosol Sci. Tech.,45, 1305, doi:10.1080/02786826.2011.592745, 2011.
Luria, M. and Sievering, H.: Heterogeneous and Homogeneous Ox-idation of SO2 in the Marine Atmosphere, Atmos. Environ., 25,1489, doi:10.1016/0960-1686(91)90008-u, 1991.
Massoli, P., Bates, T. S., Quinn, P. K., Lack, D. A., Baynard,T., Lerner, B. M., Tucker, S. C., Brioude, J., Stohl, A., andWilliams, E. J.: Aerosol optical and hygroscopic properties dur-
ing TexAQS-GoMACCS 2006 and their impact on aerosol di-rect radiative forcing, J. Geophys. Res.-Atmos., 114, D00F07,doi:10.1029/2008jd011604, 2009.
McKeen, S., Chung, S. H., Wilczak, J., Grell, G., Djalalova, I.,Peckham, S., Gong, W., Bouchet, V., Moffet, R., Tang, Y.,Carmichael, G. R., Mathur, R., and Yu, S.: Evaluation of sev-eral PM2.5 forecast models using data collected during theICARTT/NEAQS 2004 field study, J. Geophys. Res.-Atmos.,112, D10S20, doi:10.1029/2006jd007608, 2007.
McNaughton, C. S., Clarke, A. D., Howell, S. G., Pinkerton, M.,Anderson, B., Thornhill, L., Hudgins, C., Winstead, E., Dibb,J. E., Scheuer, E., and Maring, H.: Results from the DC-8 In-let Characterization Experiment (DICE): Airborne versus sur-face sampling of mineral dust and sea salt aerosols, Aerosol Sci.Tech., 41, 136, doi:10.1080/02786820601118406, 2007.
Middlebrook, A. M., Bahreini, R., Jimenez, J. L., and Cana-garatna, M. R.: Evaluation of Composition-Dependent Col-lection Efficiencies for the Aerodyne Aerosol Mass Spec-trometer using Field Data, Aerosol Sci. Tech., 46, 258,doi:10.1080/02786826.2011.620041, 2012.
Peischl, J., Ryerson, T. B., Holloway, J. S., Trainer, M., Andrews,A. E., Atlas, E. L., Blake, D. R., Daube, B. C., Dlugokencky, E.J., Fischer, M. L., Goldstein, A. H., Guha, A., Karl, T., Kofler, J.,Kosciuch, E., Misztal, P. K., Perring, A. E., Pollack, I. B., San-toni, G. W., Schwarz, J. P., Spackman, J. R., Wofsy, S. C., andParrish, D. D.: Airborne observations of methane emissions fromrice cultivation in the Sacramento Valley of California, J. Geo-phys. Res.-Atmos., 117, D00V25, doi:10.1029/2012jd017994,2012.
Peltier, R. E., Sullivan, A. P., Weber, R. J., Brock, C. A., Wollny,A. G., Holloway, J. S., de Gouw, J. A., and Warneke, C.: Fineaerosol bulk composition measured on WP-3D research aircraftin vicinity of the Northeastern United States – results fromNEAQS, Atmos. Chem. Phys., 7, 3231–3247, doi:10.5194/acp-7-3231-2007, 2007.
Petters, M. D. and Kreidenweis, S. M.: A single parameter repre-sentation of hygroscopic growth and cloud condensation nucleusactivity, Atmos. Chem. Phys., 7, 1961–1971, doi:10.5194/acp-7-1961-2007, 2007.
Quinn, P. K., Bates, T. S., Baynard, T., Clarke, A. D., Onasch, T.B., Wang, W., Rood, M. J., Andrews, E., Allan, J., Carrico, C.M., Coffman, D., and Worsnop, D.: Impact of particulate organicmatter on the relative humidity dependence of light scattering:A simplified parameterization, Geophys. Res. Lett., 32, L22809,doi:10.1029/2005gl024322, 2005.
Ryerson, T. B., Buhr, M. P., Frost, G. J., Goldan, P. D., Holloway, J.S., Hubler, G., Jobson, B. T., Kuster, W. C., McKeen, S. A., Par-rish, D. D., Roberts, J. M., Sueper, D. T., Trainer, M., Williams,J., and Fehsenfeld, F. C.: Emissions lifetimes and ozone for-mation in power plant plumes, J. Geophys. Res.-Atmos., 103,22569, doi:10.1029/98jd01620, 1998.
Sachse, G. W., Hill, G. F., Wade, L. O., and Perry, M. G.: FastResponse, High Precision Carbon Monoxide Sensor Using aTunable Diode-Laser Absorption Technique, J. Geophys. Res.-Atmos., 92, 2071, doi:10.1029/JD092iD02p02071, 1987.
Santarpia, J. L., Li, R. J., and Collins, D. R.: Direct measurement ofthe hydration state of ambient aerosol populations, J. Geophys.Res.-Atmos., 109, D18209, doi:10.1029/2004jd004653, 2004.
www.atmos-chem-phys.net/15/7085/2015/ Atmos. Chem. Phys., 15, 7085–7102, 2015
7102 N. L. Wagner et al.: Vertical profile of aerosol over the SEUS
Schwarz, J. P., Gao, R. S., Spackman, J. R., Watts, L. A., Thomson,D. S., Fahey, D. W., Ryerson, T. B., Peischl, J., Holloway, J. S.,Trainer, M., Frost, G. J., Baynard, T., Lack, D. A., de Gouw, J. A.,Warneke, C., and Del Negro, L. A.: Measurement of the mixingstate, mass, and optical size of individual black carbon particlesin urban and biomass burning emissions, Geophys. Res. Lett., 35,L13810, doi:10.1029/2008gl033968, 2008.
Seinfeld, J. H. and Pandis, S. N.: Atmospheric Chemistry andPhysics, John Wiley & Sons, New York, 817–821, 1998.
Siebesma, A. P.: Shallow Cumulus Convection, in: Buoyant Con-vection in Geophysical Flows, edited by: Plate, E. J., Fedorovich,E. E., Viegas, D. X., and Wyngaard, J. C., Kluwer Academic Pub-lishers, Dordrecht, 441–486, 1998.
Sorooshian, A., Varutbangkul, V., Brechtel, F. J., Ervens, B., Fein-gold, G., Bahreini, R., Murphy, S. M., Holloway, J. S., Atlas,E. L., Buzorius, G., Jonsson, H., Flagan, R. C., and Seinfeld,J. H.: Oxalic acid in clear and cloudy atmospheres: Analysis ofdata from International Consortium for Atmospheric Researchon Transport and Transformation 2004, J. Geophys. Res.-Atmos.,111, D23S45, doi:10.1029/2005jd006880, 2006.
Sorooshian, A., Lu, M.-L., Brechtel, F. J., Jonsson, H., Feingold,G., Flagan, R. C., and Seinfeld, J. H.: On the source of organicacid aerosol layers above clouds, Environ. Sci. Tech., 41, 4647,doi:10.1021/es0630442, 2007.
Vay, S. A., Choi, Y., Vadrevu, K. P., Blake, D. R., Tyler, S. C.,Wisthaler, A., Hecobian, A., Kondo, Y., Diskin, G. S., Sachse, G.W., Woo, J. H., Weinheimer, A. J., Burkhart, J. F., Stohl, A., andWennberg, P. O.: Patterns of CO2 and radiocarbon across highnorthern latitudes during International Polar Year 2008, J. Geo-phys. Res.-Atmos., 116, D14301, doi:10.1029/2011jd015643,2011.
Warren, S. G., Eastman, R. M., and Hahn, C. J.: A survey of changesin cloud cover and cloud types over land from surface obser-vations, 1971–96, J. Climate, 20, 717, doi:10.1175/jcli4031.1,2007.
Weber, R. J., Sullivan, A. P., Peltier, R. E., Russell, A., Yan, B.,Zheng, M., de Gouw, J., Warneke, C., Brock, C., Holloway, J.S., Atlas, E. L., and Edgerton, E.: A study of secondary or-ganic aerosol formation in the anthropogenic-influenced south-eastern United States, J. Geophys. Res.-Atmos., 112, D13302,doi:10.1029/2007jd008408, 2007.
Wilson, J. C., Lafleur, B. G., Hilbert, H., Seebaugh, W. R., Fox,J., Gesler, D. W., Brock, C. A., Huebert, B. J., and Mullen, J.:Function and performance of a low turbulence inlet for samplingsupermicron particles from aircraft platforms, Aerosol Sci. Tech.,38, 790, doi:10.1080/027868290500841, 2004.
Wonaschuetz, A., Sorooshian, A., Ervens, B., Chuang, P. Y., Fein-gold, G., Murphy, S. M., de Gouw, J., Warneke, C., and Jons-son, H. H.: Aerosol and gas re-distribution by shallow cumulusclouds: An investigation using airborne measurements, J. Geo-phys. Res.-Atmos., 117, D17202, doi:10.1029/2012jd018089,2012.
Zhang, X., Hecobian, A., Zheng, M., Frank, N. H., and Weber, R.J.: Biomass burning impact on PM2.5 over the southeastern USduring 2007: integrating chemically speciated FRM filter mea-surements, MODIS fire counts and PMF analysis, Atmos. Chem.Phys., 10, 6839–6853, doi:10.5194/acp-10-6839-2010, 2010.
Atmos. Chem. Phys., 15, 7085–7102, 2015 www.atmos-chem-phys.net/15/7085/2015/