
Aerosol dynamics upon Terni basin (Central Italy): results of integrated vertical profile...
12
1 23 Rendiconti Lincei SCIENZE FISICHE E NATURALI ISSN 2037-4631 Rend. Fis. Acc. Lincei DOI 10.1007/s12210-013-0230-8 Aerosol dynamics upon Terni basin (Central Italy): results of integrated vertical profile measurements and electron microscopy analyses Beatrice Moroni, Luca Ferrero, Stefano Crocchianti, Maria Grazia Perrone, Giorgia Sangiorgi, Ezio Bolzacchini & David Cappelletti
-
Upload
vegajournal -
Category
Documents
-
view
5 -
download
0
Transcript of Aerosol dynamics upon Terni basin (Central Italy): results of integrated vertical profile...
1 23
Rendiconti LinceiSCIENZE FISICHE E NATURALI ISSN 2037-4631 Rend. Fis. Acc. LinceiDOI 10.1007/s12210-013-0230-8
Aerosol dynamics upon Terni basin(Central Italy): results of integratedvertical profile measurements and electronmicroscopy analyses
Beatrice Moroni, Luca Ferrero, StefanoCrocchianti, Maria Grazia Perrone,Giorgia Sangiorgi, Ezio Bolzacchini &David Cappelletti
1 23
Your article is protected by copyright and
all rights are held exclusively by Accademia
Nazionale dei Lincei. This e-offprint is for
personal use only and shall not be self-
archived in electronic repositories. If you wish
to self-archive your article, please use the
accepted manuscript version for posting on
your own website. You may further deposit
the accepted manuscript version in any
repository, provided it is only made publicly
available 12 months after official publication
or later and provided acknowledgement is
given to the original source of publication
and a link is inserted to the published article
on Springer's website. The link must be
accompanied by the following text: "The final
publication is available at link.springer.com”.
Aerosol dynamics upon Terni basin (Central Italy): resultsof integrated vertical profile measurements and electronmicroscopy analyses
Beatrice Moroni • Luca Ferrero • Stefano Crocchianti •
Maria Grazia Perrone • Giorgia Sangiorgi •
Ezio Bolzacchini • David Cappelletti
Received: 20 February 2013 / Accepted: 11 March 2013
� Accademia Nazionale dei Lincei 2013
Abstract In this work, aerosol size distribution mea-
surements along with individual particle analyses were
performed along the vertical profile in the atmosphere, to
shed some light on the dynamics of evolution of aerosol
properties upon a basin valley. The case study is the Terni
basin, one of the most polluted urban and industrial sites in
central Italy. Aerosol vertical profile measurements were
performed using a helium-filled tethered balloon equipped
with an optical particle counter (OPC), a miniaturized
cascade impactor with particle collection filter, and a por-
table meteorological station. Combined OPC number size
measurements and single particle analyses by scanning
electron microscopy were employed to reconstruct the
pattern and evolution of aerosol properties over the basin.
Moreover, the CHIMERE chemistry-transport model was
applied over a selected computing domain to obtain a
general overview of the driving forces of the aerosol
dynamics. Scanning electron microscopy methods along
with chemical transport modeling revealed distinct distri-
butions of number, size and geochemical properties of
different particles classes in the aerosols. These reflect
distinct behaviours and spatial/temporal evolution of the
constituent particles, along with the common occurrence of
dust inputs from regional to long range sources (e.g.,
Saharan dust inputs). All these features have to be taken
into consideration when approaching the modeling of
atmospheric processes, particularly in basin valleys located
in Central and Southern Italy where the influence of Sah-
aran dust outbreaks is more pronounced.
Keywords Size distribution � Particle morphochemistry �Optical particle counter � Scanning electron microscopy �CHIMERE chemistry-transport model
1 Introduction
Basin valleys are elective sites for human settlement and
industrial activities. Here, however, the peculiar environ-
mental conditions due to topography and meteo-climatic
variables along with the environmental impact of human
activities may affect atmospheric aerosol and its properties.
Therefore, studies on the origin, concentration, composi-
tion, distribution and dispersion of atmospheric pollutants
upon these sites (see for instance Seibert et al. 2000; Henne
et al. 2004) are necessary tools for environmental sus-
tainability and public health policies (ICSU 2011).
A variety of basin valleys of different size, location and
level of anthropogenic pressure are present in Italy. The Po
valley, in Northern Italy, is the largest and best known
among them. Owing to the significant pollutants emission
Electronic supplementary material The online version of thisarticle (doi:10.1007/s12210-013-0230-8) contains supplementarymaterial, which is available to authorized users.
B. Moroni (&)
Dipartimento di Ingegneria Civile ed Ambientale,
Universita di Perugia, Via G. Duranti 93, 06125 Perugia, Italy
e-mail: [email protected]
B. Moroni � D. Cappelletti
Centro di Eccellenza SMAArt, Universita di Perugia,
Via Elce di Sotto 8, 06123 Perugia, Italy
L. Ferrero � M. G. Perrone � G. Sangiorgi � E. Bolzacchini
Dipartimento di Scienze Ambientali, Centro Ricerca POLARIS,
Universita di Milano-Bicocca, Piazza della Scienza 1,
20126 Milan, Italy
S. Crocchianti � D. Cappelletti
Dipartimento di Chimica, Biologia e Biotecnologie,
Universita di Perugia, Via Elce di Sotto 8, 06123 Perugia, Italy
123
Rend. Fis. Acc. Lincei
DOI 10.1007/s12210-013-0230-8
Author's personal copy
rates and the high density of population, it has become in
the last years a hotspot in environmental research (see for
instance, Perrone et al. 2012). In Central Italy, the Tiber
valley and satellite basins, though very interesting both for
model complexity and also for the remarkable similarities
with continental basins in Eastern and Southern Europe
(Rodriguez et al. 2007), have received so far much less
attention.
The Terni basin is a small satellite basin of the Tiber
valley, Central Italy. The name is from the town of Terni
which is the main settlement in the plane. Terni is the
second chief town in Umbria region (approx. 110,000
inhabitants), and one of the largest stainless steel produc-
tion sites in Europe. Product range includes ferritic,
austenitic and special stainless steels (Cr–Mn–Ni grades).
This town has a long tradition of iron and steel activity
since the nineteenth century. A substantial overlap of urban
and industrial settlements occurs in the Terni area and this
fact along with local topography and meteorology issues
make particulate matter (PM) a main pollutant affecting the
air quality in both the town and the surrounding valley. The
aerosol chemistry at ground level in the Terni area has been
investigated in detail (Moroni et al. 2012), including an
apportionment of the local and long range sources of par-
ticulate pollutants.
Aerosol properties and effects depend on a number of
variables the most important of which are number size
distribution, structure and chemical composition of the
constituent particles. Possible synergistic effect of different
chemical substances and phases on the particle toxicology
is a key point (Moroni et al. 2013) and require an integrated
characterization of the bulk chemical composition and also
of the geochemical and morphological features at a single
particle level, as that proposed in the present paper.
Recently (Ferrero et al. 2012) we combined number size
measurements and individual particle analyses along ver-
tical profiles, inside and above the mixing layer, to study
the dynamics and evolution of aerosol properties over basin
valleys, including a comparison between the Po valley and
the Terni basin. Herein, we focus the attention on the Terni
basin by means of systematic comparison between aerosol
size distributions and single particle properties. In both
cases, samplings and measurements involved tethered
balloon soundings along the vertical profiles.
Distinct scenarios were evidenced in the period of
interest depending on atmospheric conditions. The results
for the urban area of Terni were compared with those
obtained at the regional scale by means of chemistry-
transport modeling in order to distinguish the origin (nat-
ural from anthropogenic), sources (local from long range),
and dynamics of dispersion and transformation of different
PM components in the atmosphere. A model is proposed
which takes into consideration the contribution of natural
and different anthropogenic sources to evaluate the effec-
tiveness of policies of local abatement strategies and
emission control.
2 Experimental
2.1 Balloon soundings
Vertical aerosol profile measurements were carried out by
means of a helium-filled tethered balloon equipped with an
optical particle counter (1.108 ‘‘Dustcheck’’ GRIMM, 15
size classes between 0.3 and 20 lm, 6 s time resolution), a
portable meteorological station (BABUCABC LSI-Lastem;
pressure, temperature and relative humidity measured, 6 s
time resolution), and a miniaturized cascade impactor
(Sioutas SKC, polycarbonate filters, Ø = 37 mm). Details
on the experimental set-up are reported in Ferrero et al.
(2012) and Moroni et al. (2012).
The balloon’s ascent and descent rates have been set at
30.0 ± 0.1 m min-1, resulting in a 3.0 m vertical resolu-
tion for OPC measurements, and the maximum height of
launching was 600 m AGL. Only vertical profiles carried
out at RH \65 % were taken into consideration, to avoid
the effects of aerosol hygroscopic growth on particle size
distribution measurements.
The balloon campaign took place from 12 to 25 of
January 2009. The balloon took off from Piazza Tacito
which is the main square in the town and shows typical
urban atmospheric conditions. Six to eight consecutive
launches were performed each day from the early morning
to the mid afternoon. The synoptic meteorological condi-
tions changed during the sampling campaign. Jan 16 and
Jan 17 were characterized by low winds, high daily tem-
perature excursions and a marked atmospheric stability
(Fig. ESM1, Online Resource 1). The following days reg-
istered a significant increase of wind speeds and tempera-
tures, a decrease of atmospheric pressure and a consequent
reduction in the PM values. A Saharan dust intrusion was
registered on Jan 20–21, and rains followed on Jan 21. Jan
22 and Jan 23 were clear sky days.
2.2 Particle size distribution and volume concentration
along vertical profiles
Optical particle counters (OPCs) provide real time direct
measurements of particle number concentration and size
distribution in the atmosphere based on the principle of
light scattering from particles.
Particle number measurements and size distributions
have been employed to calculate the volume size distri-
bution, dV/dlogDp (lm3 cm-3), of particles along the
vertical profile. In this case, particles are assumed to be
Rend. Fis. Acc. Lincei
123
Author's personal copy
spheres, whose diameter, D, is the mean value of the
extremes of the corresponding size interval. In a second
step data from the volume size distribution have been
conveniently re-arranged to obtain the pattern of the vol-
ume concentration of particles (lm3 cm-3) in the fine
(Dp \ 1.6 lm; VFF) and the coarse (Dp [ 1.6 lm; VCF)
fraction along the vertical profile:
MPVFF;CC ¼P
i NiViPi Ni
ð1Þ
where Ni is the number concentration of particles for the ith
aerosol size fraction of the OPC, and Vi is the mean volume
of the particles in the same size fraction. In the final step,
the mean particle volume (MPV) for the fine (FF) and the
coarse (CF) fraction have been calculated from the
following equation:
VFF;CC ¼X
i
NiVi ð2Þ
The MPV values can be used to visualize the time
evolution of the volume size distribution along the vertical
profiles.
Vertical aerosol profiles allow the determination of the
mixing height (MH), i.e., the height to which the lower
atmosphere will undergo mechanical or turbulent mixing,
producing a nearly homogeneous air mass. The same pro-
files also enable us in exploring changes in aerosol size
distribution as a function of height. In particular, the MPV
values can be used to visualize the time evolution of the
volume size distribution along the vertical profiles.
2.3 Scanning electron microscopy
Scanning electron microscopy (SEM) determinations were
performed at the Department of Chemistry and Industrial
Chemistry, University of Genoa, using a ZEISS SUPRA 40
VP field emission device equipped with an X-ray energy
dispersive spectrometer (Oxford link with Pentafet Si–Li,
coupled with INCA-Feature software for data treatment).
Single portions of the polycarbonate filters about
10 9 10 mm in size were cut from the central part of the
membranes and mounted on to SEM aluminium stubs using
double-sided carbon tape. Samples were then coated with a
100–150 A carbon film to provide electrical conductivity
and to prevent charge build-up during the exposure to the
electron beam.
Analyses were performed in automated mode on selec-
ted representative fields of the filter after evaluation of
sample uniformity, adequate greyscale calibration and
proper definition of the working parameters (Capannelli
et al. 2011). Magnification was chosen depending on par-
ticle size: 5,0009 was a sufficient magnification for par-
ticles [1 lm, while the use of high magnifying factors
(50,0009) was requested for nanoparticle identification. A
total number of about 700–1,500 particles in 20–300 fields
of view were counted for each sample.
The software scans fields one at a time, detecting the
single particles and recording morphology (digitalized
image) and chemical composition (spectrum) data. It can
measure several morphological parameters, e.g. length,
area, Feret diameter, aspect ratio, perimeter, etc. EDS
spectra (voltage 30 kV, focal distance 8.5 mm) were col-
lected for 30 s live time and the elemental composition
obtained after standardless matrix correction. Values lower
than 0.1 wt% (SEM detection limit) were omitted.
According to Kandler et al. (2007) approach, the elemental
atomic ratios were calculated and then compared with
those of pure minerals and phases to obtain distinct particle
classes.
2.4 Chemistry-transport modeling
The last available version (chimere2011a?) of the CHI-
MERE chemical and transport model (http://www.lmd.poly
technique.fr/chimere/chimere.php) was implemented on a
6?1 2 GHz quad-core Intel Xeon multicomputer with
4 GB/node main memory located at the Department of
Chemistry, Biology and Biotechnologies of the University
of Perugia. The computing domain extended approximately
from 9.50E, 41.08N to 15.75E, 44.43N (the domain
boundaries are not squared in latitude-longitude coordi-
nates since a WGS84-UTM32 coordinates system was
used). Horizontal resolution of the domain was 5 9 5 km,
dividing the domain in 8,000 cells for each of its eight
vertical levels (the vertical coordinate is of hybrid sigma P
type). The model was run with an hourly resolution starting
from 01/14/2009 0000 hours and ending to 01/25/2009
2400 hours. The run required 4.94 h, distributed on 25
processes (included the master one).
Meteorological input data provided by the local agency
for environmental protection (ARPA Umbria) were trans-
formed from their original GRIB format to the diagmet
CHIMERE preprocessor compatible netcdf format using
the grib_to_netcdf interface built to this end. The same
code provided also to interpolate the rotated latitude/lon-
gitude grid fields to make the projection onto the CHI-
MERE computing domain and also to derive the diagmet
needed variables from the meteorological model ones.
Biogenic emissions were calculated by the MEGAN
model, part of the CHIMERE package. Boundary and
initial conditions, courtesy of ARPA Umbria, were given
on a 0.5� 9 0.5� domain ranging from 8E,32.5N to
17E,46N and were produced by a coarser domain CHI-
MERE run. Anthropogenic emissions, estimated on the
same computing domain, were distributed on two vertical
levels (0–94 and 94–184 m). On the Umbria fields, detailed
Rend. Fis. Acc. Lincei
123
Author's personal copy
regional emissions, courtesy of ARPA Umbria, were used.
Outside the region, national emissions available from
ISPRA (Istituto Superiore per la Protezione e la Ricerca
Ambientale) database. Point emissions were not allowed in
this work to be treated directly by the CHIMERE prepemis
preprocessor.
Global dust underestimation of the input boundary
conditions of the model is a general lack of the process.
This leads to an overestimation of the other PM constitu-
ents, and to unexpected time dependence. In addition,
height of the vertical levels changes with pressure as they
are of hybrid sigma-p type (Jacobson 1999). To overcome
these problems, dust and PM10 concentrations at different
levels (1–7) in the atmosphere were normalized to the
corresponding values near ground (level 0). In the mean-
while, the height of levels was (reasonably) assumed to be
constant in the period of measurements.
3 Results and discussion
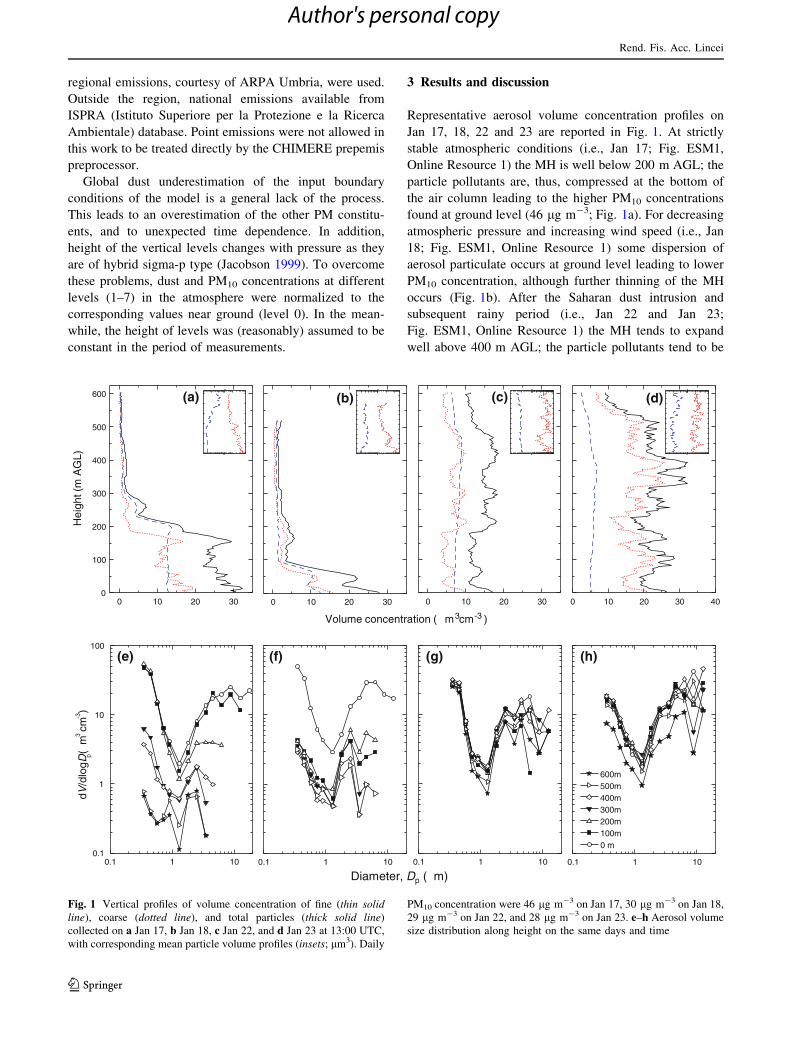
Representative aerosol volume concentration profiles on
Jan 17, 18, 22 and 23 are reported in Fig. 1. At strictly
stable atmospheric conditions (i.e., Jan 17; Fig. ESM1,
Online Resource 1) the MH is well below 200 m AGL; the
particle pollutants are, thus, compressed at the bottom of
the air column leading to the higher PM10 concentrations
found at ground level (46 lg m-3; Fig. 1a). For decreasing
atmospheric pressure and increasing wind speed (i.e., Jan
18; Fig. ESM1, Online Resource 1) some dispersion of
aerosol particulate occurs at ground level leading to lower
PM10 concentration, although further thinning of the MH
occurs (Fig. 1b). After the Saharan dust intrusion and
subsequent rainy period (i.e., Jan 22 and Jan 23;
Fig. ESM1, Online Resource 1) the MH tends to expand
well above 400 m AGL; the particle pollutants tend to be
0 m100m200m300m400m500m600m
0.1
1
10
100
dV/d
logD
p(µ
m3 cm
-3)
0.1 1 10 0.1 1 10 0.1 1 10 0.1 1 10
Diameter, Dp (µm)
(e) (f) (g) (h)
Volume concentration (µm3cm-3 )
0 10 20 300
100
200
300
400
500
600
Hei
ght (
m A
GL)
(a)
0 10 20 30
(b)
0 10 20 30
(c) (d)
0 10 20 30 40
Fig. 1 Vertical profiles of volume concentration of fine (thin solidline), coarse (dotted line), and total particles (thick solid line)
collected on a Jan 17, b Jan 18, c Jan 22, and d Jan 23 at 13:00 UTC,
with corresponding mean particle volume profiles (insets; lm3). Daily
PM10 concentration were 46 lg m-3 on Jan 17, 30 lg m-3 on Jan 18,
29 lg m-3 on Jan 22, and 28 lg m-3 on Jan 23. e–h Aerosol volume
size distribution along height on the same days and time
Rend. Fis. Acc. Lincei
123
Author's personal copy
dispersed in the air column leading to a decrease of PM10
concentration at ground level. Ground level coarse particle
concentrations increase from Jan 22 to Jan 23, while fine
particle concentrations do, actually, decrease. This is
probably the consequence of decreasing wind speed
(Fig. ESM1, Online Resource 1), and also the reason for
the similar PM10 concentrations found on these days
(Fig. 1). Results of CHIMERE modeling of the vertical
profiles confirm the oscillating structure of dust/PM dis-
tribution along height at qualitative and, in some instance,
even quantitative level (Fig. ESM2, Online Resource 2).
However, unexpected time dependence clearly results
when comparing calculated and experimental PM10 ratios.
In this case the patterns show less structures and worse
agreement with experimental measurements.
Abrupt changes of volume concentration along height
are present in the profiles, typically ascribed to particle
pollutants stratification. Stratification mainly affects the
coarse particle (CF; particle diameter Dp [ 1.6 lm), while
it is nearly absent in the fine fraction (FF; Dp \ 1.6 lm).
This is particularly evident on Jan 23, less pronounced on
Jan 17 and 22, and almost absent on Jan 18 probably due to
different wind speed and turbulence of the air mass. The
corresponding MPV profiles (insets in Fig. 1a–d) reveal a
progressive increment of the FF volume size and a decre-
ment of the CF volume size along height on Jan 17 and 18,
and no significant change on Jan 22 and 23. In a previous
paper (Ferrero et al. 2012) stratification and MPV variation
along height have been attributed to coarse particle sedi-
mentation and fine particle ageing. These facts point at the
great influence of atmospheric conditions on the mode and
extent of mixing of atmospheric aerosols.
Particle volume size distributions at different height in
the atmosphere (Fig. 1e–h) reveal two main modes at the
extreme ends of the distribution at ground level. Pro-
gressive narrowing of the modes for increasing height is
evidenced on Jan 17 and 18. In particular, on Jan 17 two
marked narrow modes at *1 and *2 lm develop above
the MH following the great decrease of particle volume
concentration. On the other hand, particle volume size
distribution and concentration are very stable along
height on Jan 22 and 23. All these features suggest some
additional influence of the origin and composition of
distinct particle types on the mode and dynamics of
aerosol formation and evolution within and above the
mixing layer.
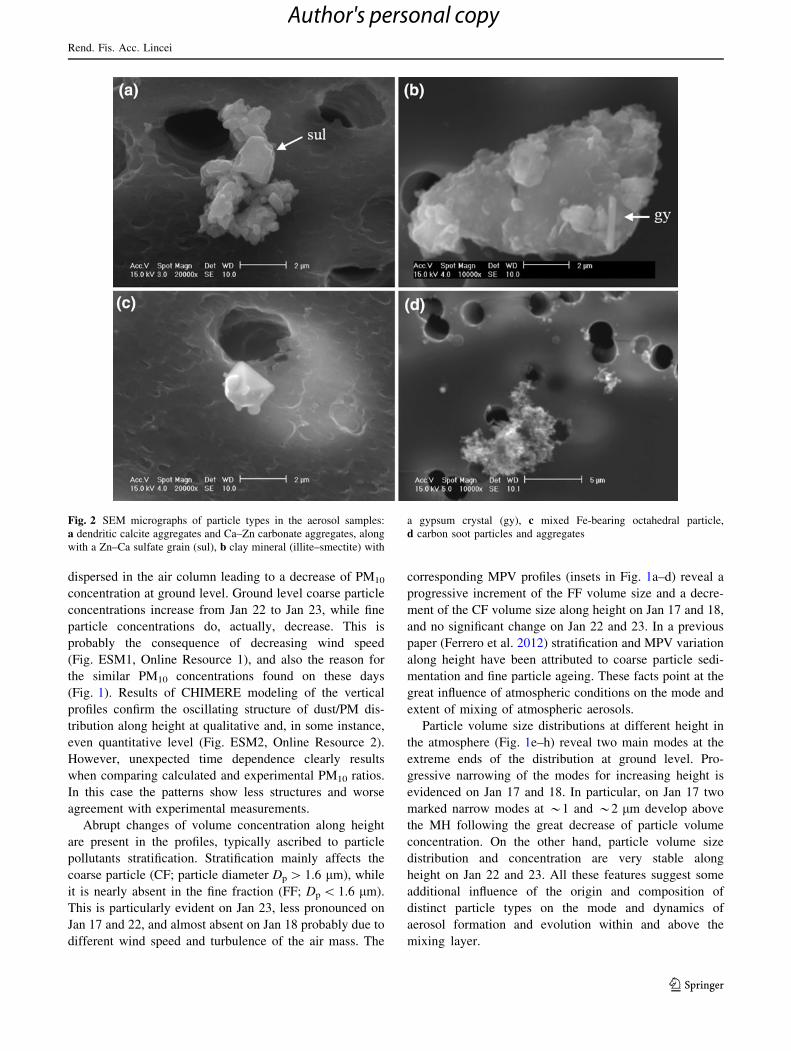
Fig. 2 SEM micrographs of particle types in the aerosol samples:
a dendritic calcite aggregates and Ca–Zn carbonate aggregates, along
with a Zn–Ca sulfate grain (sul), b clay mineral (illite–smectite) with
a gypsum crystal (gy), c mixed Fe-bearing octahedral particle,
d carbon soot particles and aggregates
Rend. Fis. Acc. Lincei
123
Author's personal copy
Individual particle aerosol characterization revealed five
different main particle classes; namely, carbonates, sili-
cates, sulfates, metal oxides, and carbonaceous particles.
Minor phases are chlorides, phosphates and distinguished
(Al-bearing, Cu, and Sb) metal particles. The carbonates
consist of calcite grains of variable size and shape, the
smallest of which are represented by well-sorted grains
arranged in dendritic aggregates; small amounts of simi-
larly shaped Ca–Zn carbonates and sulfates are also present
in this latter case (Fig. 2a). These features point at a
common origin for these particles from industrial processes
(e.g., slagging) of the local steel production. The silicates
consist of quartz, feldspar (alkali-feldspar and subordinate
plagioclase), and clay minerals (illite, smectite) of variable
Jan 17 Jan 23
GySulfateQz
SilicateMixedOther
CarbonaceousCalciteCa-Zn
FeMetalTi
(a) (b)
(c) (d)
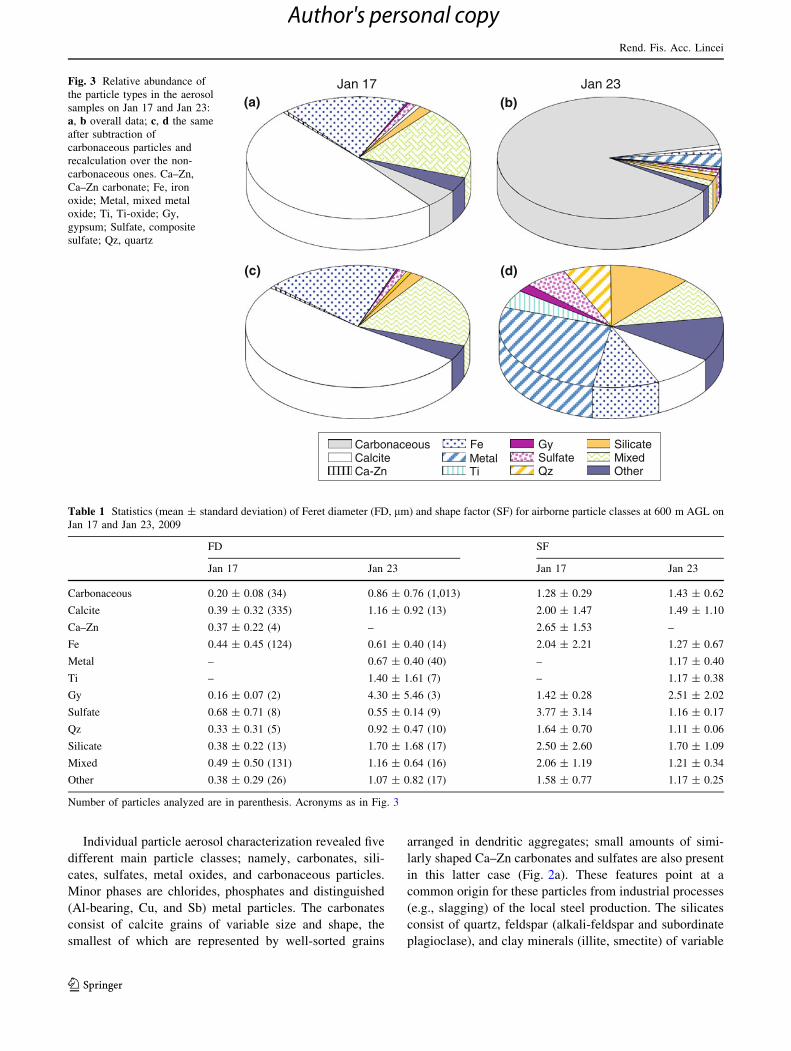
Fig. 3 Relative abundance of
the particle types in the aerosol
samples on Jan 17 and Jan 23:
a, b overall data; c, d the same
after subtraction of
carbonaceous particles and
recalculation over the non-
carbonaceous ones. Ca–Zn,
Ca–Zn carbonate; Fe, iron
oxide; Metal, mixed metal
oxide; Ti, Ti-oxide; Gy,
gypsum; Sulfate, composite
sulfate; Qz, quartz
Table 1 Statistics (mean ± standard deviation) of Feret diameter (FD, lm) and shape factor (SF) for airborne particle classes at 600 m AGL on
Jan 17 and Jan 23, 2009
FD SF
Jan 17 Jan 23 Jan 17 Jan 23
Carbonaceous 0.20 ± 0.08 (34) 0.86 ± 0.76 (1,013) 1.28 ± 0.29 1.43 ± 0.62
Calcite 0.39 ± 0.32 (335) 1.16 ± 0.92 (13) 2.00 ± 1.47 1.49 ± 1.10
Ca–Zn 0.37 ± 0.22 (4) – 2.65 ± 1.53 –
Fe 0.44 ± 0.45 (124) 0.61 ± 0.40 (14) 2.04 ± 2.21 1.27 ± 0.67
Metal – 0.67 ± 0.40 (40) – 1.17 ± 0.40
Ti – 1.40 ± 1.61 (7) – 1.17 ± 0.38
Gy 0.16 ± 0.07 (2) 4.30 ± 5.46 (3) 1.42 ± 0.28 2.51 ± 2.02
Sulfate 0.68 ± 0.71 (8) 0.55 ± 0.14 (9) 3.77 ± 3.14 1.16 ± 0.17
Qz 0.33 ± 0.31 (5) 0.92 ± 0.47 (10) 1.64 ± 0.70 1.11 ± 0.06
Silicate 0.38 ± 0.22 (13) 1.70 ± 1.68 (17) 2.50 ± 2.60 1.70 ± 1.09
Mixed 0.49 ± 0.50 (131) 1.16 ± 0.64 (16) 2.06 ± 1.19 1.21 ± 0.34
Other 0.38 ± 0.29 (26) 1.07 ± 0.82 (17) 1.58 ± 0.77 1.17 ± 0.25
Number of particles analyzed are in parenthesis. Acronyms as in Fig. 3
Rend. Fis. Acc. Lincei
123
Author's personal copy
size and shape. Coarse grained clay minerals, in particular,
are often sites for deposition/crystallization of different
phases such as gypsum (Fig. 2b). Gypsum and the com-
posite sulfates exhibit distinct morphological features, the
former being represented by fine grained idiomorphic
crystals (Fig. 2b), and the latter by fine to coarse grained
hypidiomorphic platy grains (Fig. 2a). According to Sinha
et al. (2008), secondary origin from in-cloud processes
involving airborne carbonate and metal particles of natural/
anthropogenic sources can be postulated for both particle
types. Metal oxides include iron particles, mixtures of iron
and different metals (mainly Cr, Mn, Ni, Zn), and titanium
particles. The Fe-bearing particles are spherical to irregular
shaped. Typically idiomorphic octahedral fine grained
crystals were also found in a very few cases (Fig. 2c). The
morphology and/or the mixed chemical composition of
spherical and octahedral particles suggest that they are
spinel-like oxides resulting from high temperature pro-
cesses such as those related to the steel plant activities
(Moroni and Viti 2009), while irregular shaped grains are
likely from soil erosion. Carbonaceous particles mostly
consist of carbon soot particles and aggregates (Fig. 2d).
Isolated particles represent the freshly emitted combustion
residue, while compact large aggregates represent the aged
material. A few spherical shaped smooth to porous fine
grains were also found in some of the samples, typically
the result of coal and oil combustion (e.g., Casuccio et al.
2002). Different particle types (mainly calcite and/or
silicates and/or quartz) may cluster around a single
grain giving rise to larger aggregates of intermediate
composition.
Relative abundance of the particle classes along the
vertical profiles is prone to significant changes over time
(Moroni et al. 2012). In particular, when considering the
composition of the atmosphere above the MH (600 m
AGL), calcite turns out to be the main constituent phase on
Jan 17, while carbonaceous particles prevail on Jan 23
(Fig. 3a, b). After subtraction of the carbonaceous phase
(Fig. 3c, d), remarkable increase of quartz and silicates
0.0 0.4 0.8 1.2 1.6 2.00
10
20
30
Rel
ativ
e ab
unda
nce
(% n
umbe
r)
0.0 0.4 0.8 1.2 1.6 2.00
10
20
30
Feret Diameter (µm)
Rel
ativ
e ab
unda
nce
(% n
umbe
r)
(a)
(b)
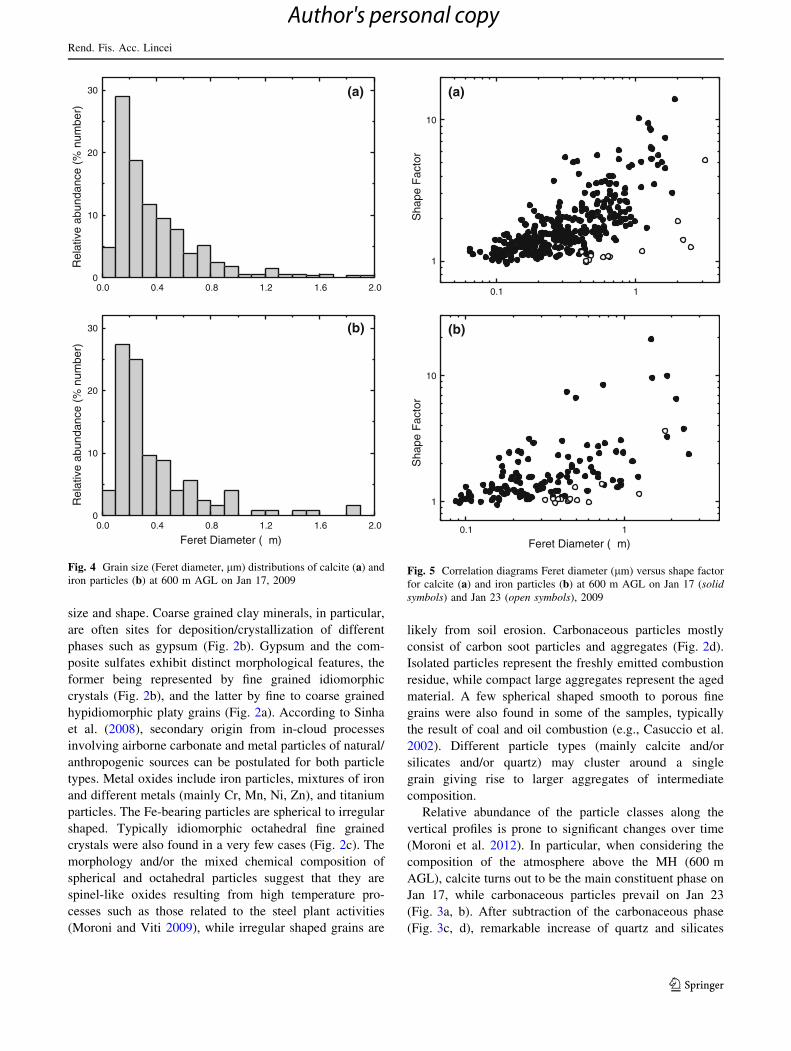
Fig. 4 Grain size (Feret diameter, lm) distributions of calcite (a) and
iron particles (b) at 600 m AGL on Jan 17, 2009
0.1 1
1
10
Sha
pe F
acto
r
(a)
0.1 1
1
10
Sha
pe F
acto
r
Feret Diameter (µm)
(b)
Fig. 5 Correlation diagrams Feret diameter (lm) versus shape factor
for calcite (a) and iron particles (b) at 600 m AGL on Jan 17 (solidsymbols) and Jan 23 (open symbols), 2009
Rend. Fis. Acc. Lincei
123
Author's personal copy
along with occurrence of mixed metal and Ti particles, are
evidenced on Jan 23. Minor phases amount also increase on
Jan 23, while the relative abundance of the mixed particles
tends to decrease. All these features provide evidence of
the renewal and the general remix of the lower troposphere
induced by the Saharan dust outbreak and consequent rainy
period.
Grain size (e.g., Feret diameter, FD) and shape (e.g.,
shape factor, SF) of the particle types above the MH are
reported in Table 1. Particle mean value of FD is well
below the micron size on Jan 17, and above this value on
Jan 23. Ranges of variation of the grain size are generally
quite large; largest values are registered on Jan 17 and
belong to calcite, iron particles and sulfates. Grain size
distributions shown in Fig. 4 for calcite and iron particles,
on turn, reveal a main mode at *0.2 lm, and minor modes
in the range 0.7–1.0 lm. These latter fit well the mode of
the aerosol volume size distribution resulting from OPC
measurements (Fig. 1e). Therefore, not all the particle
types, but only calcite, iron particles and, in some instance,
the sulfates are involved in coagulation/aggregation pro-
cesses of ageing above the mixing height at stable atmo-
spheric conditions. The positive correlation between FD
and SF in the calcite and iron particles (Fig. 5) supports
particle aggregation, while SEM observations (Fig. 2a)
confirm calcite and sulfate particle aggregation above the
MH. All these features suggest the local steel plant emis-
sions be the common source for all these particle types
above Terni basin.
Abrupt increase in the grain size of carbonaceous, cal-
cite, gypsum, quartz and silicate particles occurs on Jan 23,
while the iron and sulfate particles have quite similar grain
size ranges (Table 1). Mixed iron and pure iron particles
exhibit the same grain size ranges; Ti oxides are much
larger, and similar in size to the silicates. Carbonaceous
and gypsum particles show increasing morphological
complexity (i.e., SF), while calcite, sulfates, quartz and the
silicates show decreasing SF values (Table 1). The mor-
phological features are clear evidences of turbulent re-
mixing in the lower troposphere induced by atmospheric
instability (i.e., the rainy period; Fig. ESM1, Online
Resource 1). In particular, the size and shape of carbona-
ceous and gypsum particles reveal some occurrence of
condensation/coagulation ageing processes at some height
in the troposphere prior to re-mixing. Further evidence of
ageing is the compaction of particles in the carbon soot
aggregates (Fig. 2d). On the other hand, increasing FD for
decreasing SF values of calcite, quartz and silicates show
that turbulent re-mixing affected the particles as soon as
they entered the air column. Calcite (and, in some instance,
sulfate) morphology shows the regular input from the local
steel plants. Quartz and silicates, on turn, reveal a common
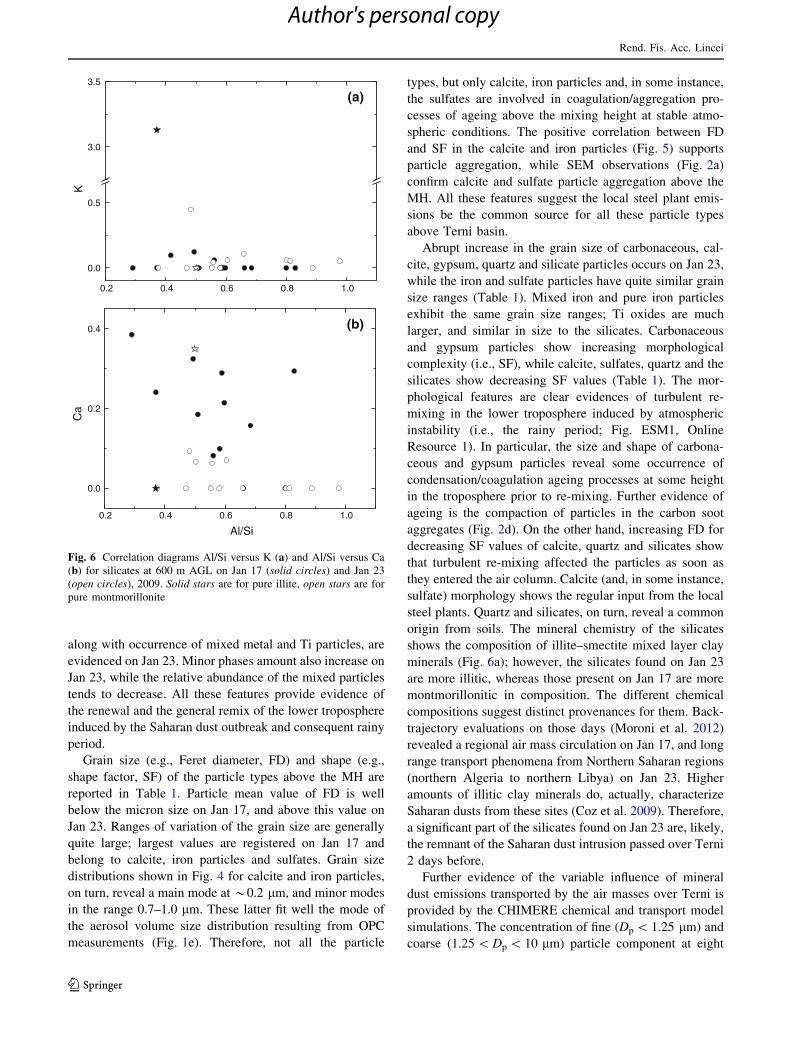
origin from soils. The mineral chemistry of the silicates
shows the composition of illite–smectite mixed layer clay
minerals (Fig. 6a); however, the silicates found on Jan 23
are more illitic, whereas those present on Jan 17 are more
montmorillonitic in composition. The different chemical
compositions suggest distinct provenances for them. Back-
trajectory evaluations on those days (Moroni et al. 2012)
revealed a regional air mass circulation on Jan 17, and long
range transport phenomena from Northern Saharan regions
(northern Algeria to northern Libya) on Jan 23. Higher
amounts of illitic clay minerals do, actually, characterize
Saharan dusts from these sites (Coz et al. 2009). Therefore,
a significant part of the silicates found on Jan 23 are, likely,
the remnant of the Saharan dust intrusion passed over Terni
2 days before.
Further evidence of the variable influence of mineral
dust emissions transported by the air masses over Terni is
provided by the CHIMERE chemical and transport model
simulations. The concentration of fine (Dp \ 1.25 lm) and
coarse (1.25 \ Dp \ 10 lm) particle component at eight
(a)
0.2 0.4 0.6 0.8 1.0
0.0
0.5
3.0
3.5 K
(b)
0.2 0.4 0.6 0.8 1.0
0.0
0.2
0.4
Ca
Al/Si
Fig. 6 Correlation diagrams Al/Si versus K (a) and Al/Si versus Ca
(b) for silicates at 600 m AGL on Jan 17 (solid circles) and Jan 23
(open circles), 2009. Solid stars are for pure illite, open stars are for
pure montmorillonite
Rend. Fis. Acc. Lincei
123
Author's personal copy
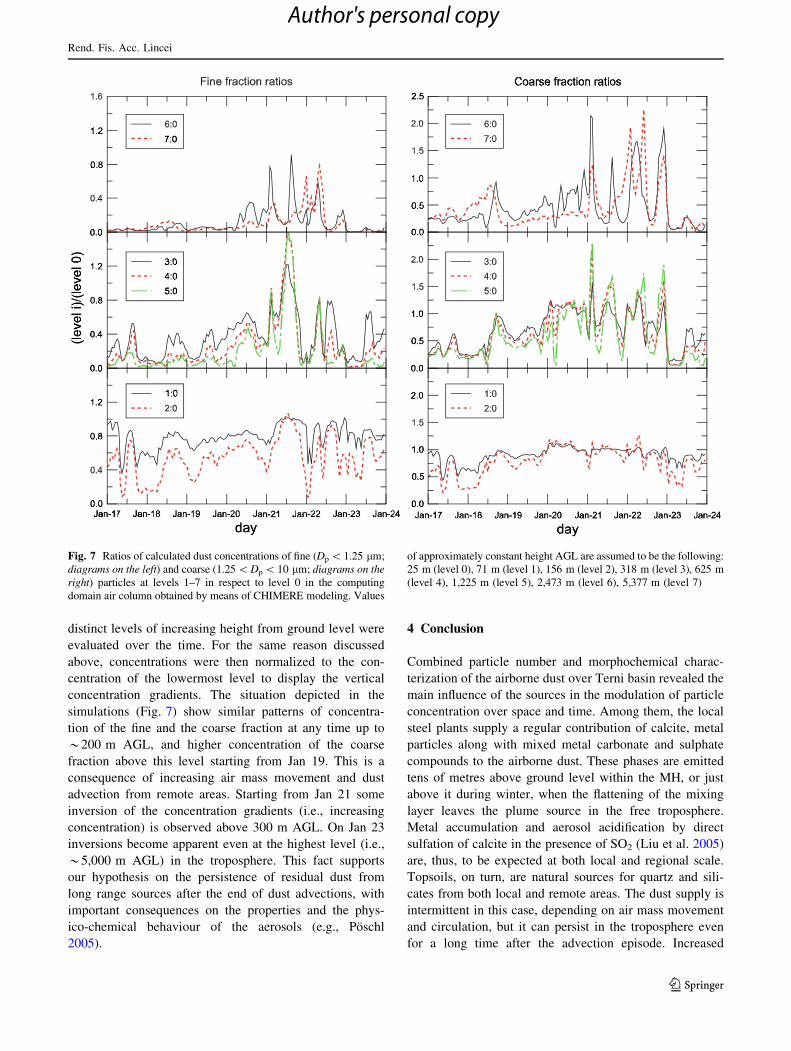
distinct levels of increasing height from ground level were
evaluated over the time. For the same reason discussed
above, concentrations were then normalized to the con-
centration of the lowermost level to display the vertical
concentration gradients. The situation depicted in the
simulations (Fig. 7) show similar patterns of concentra-
tion of the fine and the coarse fraction at any time up to
*200 m AGL, and higher concentration of the coarse
fraction above this level starting from Jan 19. This is a
consequence of increasing air mass movement and dust
advection from remote areas. Starting from Jan 21 some
inversion of the concentration gradients (i.e., increasing
concentration) is observed above 300 m AGL. On Jan 23
inversions become apparent even at the highest level (i.e.,
*5,000 m AGL) in the troposphere. This fact supports
our hypothesis on the persistence of residual dust from
long range sources after the end of dust advections, with
important consequences on the properties and the phys-
ico-chemical behaviour of the aerosols (e.g., Poschl
2005).
4 Conclusion
Combined particle number and morphochemical charac-
terization of the airborne dust over Terni basin revealed the
main influence of the sources in the modulation of particle
concentration over space and time. Among them, the local
steel plants supply a regular contribution of calcite, metal
particles along with mixed metal carbonate and sulphate
compounds to the airborne dust. These phases are emitted
tens of metres above ground level within the MH, or just
above it during winter, when the flattening of the mixing
layer leaves the plume source in the free troposphere.
Metal accumulation and aerosol acidification by direct
sulfation of calcite in the presence of SO2 (Liu et al. 2005)
are, thus, to be expected at both local and regional scale.
Topsoils, on turn, are natural sources for quartz and sili-
cates from both local and remote areas. The dust supply is
intermittent in this case, depending on air mass movement
and circulation, but it can persist in the troposphere even
for a long time after the advection episode. Increased
Fig. 7 Ratios of calculated dust concentrations of fine (Dp \ 1.25 lm;
diagrams on the left) and coarse (1.25 \ Dp \ 10 lm; diagrams on theright) particles at levels 1–7 in respect to level 0 in the computing
domain air column obtained by means of CHIMERE modeling. Values
of approximately constant height AGL are assumed to be the following:
25 m (level 0), 71 m (level 1), 156 m (level 2), 318 m (level 3), 625 m
(level 4), 1,225 m (level 5), 2,473 m (level 6), 5,377 m (level 7)
Rend. Fis. Acc. Lincei
123
Author's personal copy
particle nucleation and adsorption upon these phases (e.g.,
Seinfeld and Pandis 1996; Archuleta et al. 2005) are
driving processes in the modulation of the aerosol prop-
erties and physico-chemical behaviour. In the light of these
points, more stringent local abatement strategies for the
industrial emissions, and better definition of the contribu-
tion of the soil sources in terms of the constituent phases
and minerals, are to be set up to overcome the problems.
From a general point of view, the results from this study
suggest that the total mass of particulate matter (e.g., PM10)
cannot provide by itself the exact picture of the aerosol
properties without a comprehensive individual particle
morpho-chemical characterization. In this respect, SEM
methods provide simple, powerful tools to unravel the
questions concerning the nature, the properties and the
behaviour of aerosol particles.
Acknowledgments Prof. Giorgio Liuti died during the preparation
of the manuscript. This work and our future endeavours are dedicated
to him, whose intellectual honesty and genuine love of chemistry
continue to inform our scientific life. We thank Fondazione CARIT di
Terni e Narni for financial support to this research. We also thank
ARPA Umbria for providing detailed regional emission data.
References
Archuleta CM, DeMott PJ, Kreidenweis SM (2005) Ice nucleation by
surrogates for atmospheric mineral dust and mineral dust/sulfate
particles at cirrus temperatures. Atmos Chem Phys Discuss
5:3391–3436
Capannelli G, Castello E, Comite A, Costa A, Mamolini G (2011)
Electron microscopy characterization of airborne micro- and
nanoparticulate matter. J Electron Microsc 60(2):117–131
Casuccio GS, Lersch TL, Schlaegle SF, Martello DV (2002) Charac-
terization of ambient carbonaceous particles using electron
microscopy techniques. Fuel Chem Div Preprints 47(2):624–626
Coz E, Gomez-Moreno FJ, Pujadas M, Casuccio GS, Lersch TL,
Begona Artinano (2009) Individual particle characteristics of
North African dust under different long-range transport scenar-
ios. Atmos Environ 43:1850–1863
Ferrero L, Cappelletti D, Moroni B, Sangiorgi G, Perrone MG,
Crocchianti S, Bolzacchini E (2012) Wintertime aerosol dynam-
ics and chemical composition across the mixing layer over basin
valleys. Atmos Environ 56:143–153
Henne S, Furger M, Nyeki S, Steinbacher M, Neininger B, de Wekker
SFJ, Dommen J, Spichtinger N, Stohl A, Prevot ASH (2004)
Quantification of topographic venting of boundary layer air to
the free troposphere. Atmos Chem Phys 4:497–509
ICSU (2011) Report of the ICSU Planning Group on Health and
Wellbeing in the Changing Urban Environment: a systems
analysis approach. International Council for Science, Paris
Jacobson MZ (1999) Fundamentals of atmospheric modelling.
Cambridge University Press, Cambridge
Kandler K, Benker N, Bundke U, Cuevas E, Ebert M, Knippertz P
et al (2007) Chemical composition and complex refractive index
of Saharan mineral dust at Izana, Tenerife (Spain) derived by
electron microscopy. Atmos Environ 41:8058–8074
Liu X, Zhu J, Van Espen P, Adams F, Xiao R, Dong S, Li Y (2005)
Single particle characterization of spring and summer aerosols in
Beijing: formation of composite sulphate of calcium and
potassium. Atmos Environ 39:6909–6918
Moroni B, Viti C (2009) Grain size, chemistry, and structure of fine
and ultrafine particles in stainless steel welding fumes. J Aerosol
Sci 40:938–949
Moroni B, Cappelletti D, Marmottini F, Scardazza F, Ferrero L,
Bolzacchini E (2012) Integrated single particle-bulk chemical
approach for the characterization of local and long range sources
of particulate pollutants. Atmos Environ 50:267–277
Moroni B, Viti C, Cappelletti D (2013) Exposure vs toxicity levels of
airborne quartz, metal and carbon particles in cast iron foundries.
J Expo Sci Environ Epidemiol. doi:10.1038/jes.2013.3
Perrone MG, Larsen B, Ferrero L, Sangiorgi G, De Gennaro G, Udisti
R, Zangrando R, Gambaro A, Bolzacchini E (2012) Sources of
high PM2.5 concentrations in Milan, Northern Italy: molecular
marker data and CMB modeling. Sci Total Environ 414:343–355
Poschl U (2005) Atmospheric aerosol: composition, transformation,
climate and health effects. Angew Chem Int Ed 44:7520–7540
Rodriguez S, Van Dingenen R, Putaud JP, Dell’Acqua A, Pey J,
Querol X et al (2007) A study of the relationship between mass
concentrations, chemistry and number size distribution of urban
fine aerosol in Milan, Barcelona and London. Atmos Chem Phys
7:2217–2232
Seibert P, Beyrich F, Gryning S-E, Joffre S, Rasmussen A, Tercier Ph
(2000) Review and intercomparison of operational methods for
the determination of the mixing height. Atmos Environ
34:1001–1027
Seinfeld JH, Pandis SN (1996) Atmospheric chemistry and physics:
from air pollution to climate change. Wiley, New York,
pp 812–823
Sinha BW, Hoppe P, Huth J, Foley S, Andreae MO (2008) Sulfur
isotope analyses of individual aerosol particles in the urban
aerosol at a central European site (Mainz, Germany). Atmos
Chem Phys 8:7217–7238
Rend. Fis. Acc. Lincei
123
Author's personal copy