Laminar Film Condensation From Moist Air In Vertical Tubes ...
Upload
independentCategory
view
1download
0
Biological Conservation 55 (1991) 199-213
Tropical Moist Forests: Destruction and Species Extinction
J. A. Sayer
International Union for Conservation of Nature, Gland CHl196, Switzerland
&
T. C. Whitmore
Geography Department, Cambridge University, Downing Place, Cambridge CB2 3EN, UK
(Received 15 March 1990; revised version received 26 June 1990; accepted 30 June 1990)
ABSTRACT
Tropical moist forests are currently being altered or destroyed at a rapid rate. A 1980 assessment by the Food and Agricultural Organisation (FA O)for all tropical countries has now been superseded for some by new assessments based largely on more recent satellite imagery. Comparison of different estimates are complex because of different definitions of'forest', 'alteration', 'degradation'and 'destruction'. Making allowance for these problems, the new estimates show that rate of deforestation has, in general, increased.
A recent assessment by Myers for 1989 is more pessimistic than earlier surveys, estimating that remaining forest areas are less and rates of destruction higher, but Myers includes logging as forest destruction and excludes degraded forest from his measurements.
The total number of species in tropical moist forests are poorly known. The pattern of likely species extinctions depends on the proportion of forest
altered and destroyed, and its spatial pattern, and can be used to help set priorities for conservation.
I N T R O D U C T I O N
Mankind has been destroying forests for millenia, ever since he discovered agriculture (Williams, 1989). The assault on the t emperate forests of Nor th
199 Biol. Conserv. 0006-3207/90/$03-50 © 1990 Elsevier Science Publishers Ltd, England. Printed in Great Britain

200 J. A. Sayer, T. C. Whitmore
and South America and Australasia of the 17th to 19th centuries, which followed on European expansion, has been replaced today by an assault on tropical rain forests, one of the last great global frontiers.
When tropical lands are deforested costs are incurred both locally and globally. Locally, climates may become more extreme, soils may suffer physical and chemical deterioration, and hydrological balances may be perturbed. Globally, weather patterns may be modified, and there is particular concern at the possible contribution to atmospheric warming by the addition of carbon dioxide into the atmosphere which results from the burning or decomposition of the biomass. In addition the loss of species of plants and animals, and of the genetic variation that they contain, is of both local and global concern.
Many of both the local and the global environmental services of tropical forests can be provided by modified vegetation cover. Timber plantations and tree crops can store substantial quantities of carbon. They can also, as can plantation crops and carefully managed agricultural systems, moderate climate and regulate water supply in a manner similar to natural forests. Even the lengthy fallow phase of traditional forms of shifting agriculture carries few long-term environmental risks.
The rate of tropical forest loss is so rapid, and the concentration of the world's species in these ecosystems so great (Wolf, 1987), that the view has been expressed (Ehrlich & Ehrlich, 1981; Simberloff, 1986) that a significant proportion of all species of plants and animals are likely to become extinct in the next few decades, perhaps as many as 25-30% by AD 2000 (Myers, 1983). Other authors (Simon, 1986; Lugo, 1988) have contended that there is little documented evidence of species extinction, and that the risks inherent in tropical deforestation have been exaggerated.
Whatever the amount of extinction may be, there is no doubt that any disturbance of natural forests, whether man-made or natural, is likely to alter the relative frequency of species of animals and plants.
In response to world-wide concern at the prospect of large numbers of species extinctions, the funds available for the conservation of biological diversity in the tropics are increasing rapidly. It is clearly important that these resources be optimally deployed. This requires a clear understanding of the whole issue, which in its turn is dependent on good data on the extent of remaining forest, the rates and places where clearance is taking place, and the significance of forest clearance for biological conservation. These matters are all currently under intense debate. Interested parties include biologists, FAO, IUCN, WWF and aid agencies.
Species extinction is in our view the most serious consequence of tropical forest clearance because, although the hydrological and climatic functions

Tropical moist forest destruction 201
performed by the original forest can be recreated in man-made vegetation, once it has been lost a species has gone for ever.
The significance of forest loss for biological conservation will differ from place to place because tracts of forest do not all have the same species composition or richness.
RATES OF TROPICAL MOIST FOREST DESTRUCTION
Various problems are encountered in any attempt to quantify forest cover and its change over time. First, it is necessary to define what is meant by forest, and which particular types of forest are to be considered. Second, forests change either due to complete destruction (which reduces their area), or because of various forms of disturbance that are very hard to quantify (which change their species composition, biomass and structure). It is necessary to specify whether destruction, disturbance or both have occurred. Third, until the recent advent of satellite remote sensing technology, it was impossible to achieve an extensive objective record of forest cover at a single moment in time.
Differences between published figures on tropical deforestation arise largely because these problems are ignored or are tackled in different ways. The first, and still the most complete, survey which addressed these issues and dealt with all countries consistently was published in 1981 by FAO to a 1980 dateline (FAO, 1981). This was updated by FAO (1988), which corrected errors and extended the cover to some small countries previously omitted, but still to the 1980 dateline. The later report did not substantially alter the conclusions. Lanly (1990) has provided a commentary.
A distinction was made by FAO between closed forests and open forests (or woodlands). The latter are ' . . .forest/grassland formations with a continuous grass layer in which the tree synusia covers more than 10 percent of the ground', crown cover percent varies and 'in some woodlands the trees may cover the ground completely, like in closed forests'. The distinction is 'more of an ecological than physiognomic type' (FAO, 1988: p. 15). Closed and open forests can be separated on aerial photographs and satellite images.
Since the last century it has been common to recognise three major kinds of closed tropical forests--rain forests, monsoon (or seasonal) forests and thorn forests (Schimper, 1903), whose occurrence is largely controlled by climate. The FAO closed forest survey covered all three types though thorn forest, which occurs in very dry and strongly seasonal tropical climates, has only very limited extent compared to the other two kinds.

202 J. A. Sayer, T. C. Whitmore
The different closed forest formations are seldom distinguished in national statistics and are difficult to tell apart by remote sensing, especially in the wet season when seasonal forest trees are in leaf. The convenient term tropical moist forests has been coined to include both tropical rain and seasonal forests (Sommer, 1976).
Deforestation is the removal of forest and the conversion of the land to some other use, generally agriculture. Alternatively, and often, primary forests are logged and left to recover, or they are felled and the land farmed for a few years and then allowed to redevelop into forest. These various alterations, sometimes called 'degradation' o f the forest, are less drastic than complete deforestation, because the land returns to a continuous tree cover and ecological functions more or less recover, although biodiversity (viz. species richness), ecosystem structural complexity and species' inter- dependencies are disrupted and may take several centuries to recover.
Forest alteration was included with deforestation in the narrow sense in a major survey by the US National Academy of Science (Myers, 1980) and its recent sequel commissioned by Friends of the Earth (Myers, 1989).
Forest and non-forest are relatively easy to distinguish on remote-sensing images but it is difficult to monitor the various kinds of disturbance because of the problem of distinguishing between primary (virgin), logged and secondary regrowth forest.
T A B L E 1 FAO Survey on Tropical Forest Clearance and Logging
Area Annual (102 km2/year) reduction (%)
(A) Estimate for 1981-85 Closed forest clearance (a) 750 Undisturbed closed forests logged but not cleared
(b) c. 440 Therefore, total 'altered' tropical closed forest
(c = a + b) l 190 Open tree formations (especially cerrado, chaco, of
neotropics, savanna woodlands, etc. of Africa) clearance (d) 380
Total clearance closed plus open forest (e = a + d) 1 130 Total 'alteration' closed plus open forest (= c + d) 1 570
(B) Guess for 1980-2000 (if linear extrapolation is justified)
Closed forest cleared 1980-2000 (a x 20) 15000
0'62
0'52 0'58
Data from Lanly (1982) for 76 countries which total 97% of all the tropical land area.

Tropical moist forest destruction 203
The FAO survey was based on an evaluation of data compiled from existing maps of vegetation and land use, forest inventories, satellite images and reports on colonisation schemes and shifting agriculture, not (as has sometimes been stated) on figures provided by national forestry institutions (Lanly, 1990). For some countries (e.g. Burma, Laos: R. Persson, pers. comm.) the data were scanty. Table 1 summarises the final results. For closed forests, clearance (a) was distinguished from forests logged but not cleared (b). An allowance was made in (b) for illegal entry of farmers into those forests which should have been left to regrow. In open woodlands the progressive removal of trees, usually for fuel or fodder, cannot readily be monitored, and therefore the only category FAO recognised was total clearance (d). Various totals in Table 1 have come to be widely quoted, namely clearance of closed forests at 750 × 102 km2/year cleared (a), and clearance of closed + open forests at 1130 × 102 km2/year (e). The figure (c) for total 'alteration' (cleared + logged) of closed forests of 1190 x 10- 2 km2/year is most closely comparable to the figures of Myers (1980, 1989) but an area of forest logged one year may be relogged or cleared later on, and so counted twice (or more times) if annual totals are summed. Linear extrapolation of the annual rate of closed forest clearance from 1980 to 2000 gives a figure of 15000 x 102km 2 lost by then, or 12.5% of the 1980 amount.
TROPICAL FOREST AREAS AND DESTRUCTION RATES C O M P A R E D
Tables 2 and 3 show areas and deforestation rates of the individual countries included in Table 1 of Myers (1989). These 24 countries encompass 90% of the original tropical moist forest. In addition to Myers' figures for 1989, those of FAO for 1980 are shown, plus other recent estimates where these exist.
Areas
Myers (1989 pp. 5-6) claims his report is confined to tropical forest defined as 'evergreen or partly evergreen forest in areas receiving not less than 100 mm of precipitation in any month for two out of three years with mean annual temperature of 24-plus degrees C and essentially frost free; in these forests some trees may be deciduous; the forests usually occur at altitudes below 1300 m (though often in Amazonia up to 1800 m and generally in southeast Asia up to 750 m)... ' . This definition excludes all montane rain forests in Asia (which extend from 750 to 3000m) and only includes the lower montane rain forests of 'Amazonia ' (viz. the Andes), where the upper forest

TABLE 2 Forest Areas (rounded to four significant figures)
A ll Tropical closed moist
forests ~ forests b (10 2 km 2) (10 2 km 2)
Other authorities
Date Area Forest (102 km 2) type
(A) Countries where all or most forest is tropical Asia: continent
Burma 3 196 2450 Cambodia 1 265 670 Laos 1 364 688
Tha i land 1 579 740 Vietnam 1 031 600
Asia: insular Indonesia 11 880 8 600 Malaysia 2 102 1 570 Papua New Guinea 3 820 3 600 Philippines 981 500
moist sensu Sommer(1976)
c. 1980 2450
c. 1985 10510 c. 1985 2031
all c
all a all e
c. 1980 850 all y c. 1988 646 all y
Africa: west Ivory Coast 987"9 160
Africa: central Cameroon 1 640 2 564 c. 1987 Congo 2 136 900 Gabon 2059 2000 c. 1987 Zaire 17760 10000 c. 1987
(B) Countries where a substantial fraction of forest is not tropical moist
1 600 all °
1 000 all h 10 380 all j
New World Bolivia 6 679 700 Brazil ,51 830 22000 c. 1987 31 710 Amazon k Colombia 5 180 1 800 Ecuador 1 477 760 Mexico 4 851 1 660 Peru 7072 5 150 c. 1986 650 tmf 1 Venezula 3 399 3 500
Asia: continent India 5930 1 650 c. 1988 3580 all"
Africa: west Nigeria 1 491 280 c. 1986 275-7 tmf"
Africa: insular Madagascar 1 347 240 c. 1986 800-1 000 all p
a FAO (1988), Table 1. b Myers (1989), Table 1. c Allen (1984). d U S A I D (1987). " Thang (1987), Forest Department Peninsular Malaysia (1988), Forest Department Sarawak (1989). s Forest Management Bureau (1988) Fig. 6.
g F A O / U N D P (1988). h I U C N (1989a). J I U C N (1989b). k Fearnside (1990a,b). t Tropical moist forest, W C M C (1988a). " Government of India (1988). " W C M C (1988b). P World Bank (1988).

Tropical moist forest destruction 205
limit is also at c. 3000 m. It also excludes very nearly all the African rain forests and those of the lower half of the Amazon which all experience a 1-3 month annual dry season with only c. 60mm monthly rain. These are tropical semi-evergreen rain forests in the terminology used in Asia (Champion, 1936; Whitmore, 1984, 1990 Fig. 2.1). Myers' Table 1 refers to 'tropical moist forest', and the text makes clear that despite his narrow definition the report is in fact dealing with this much broader grouping (viz. all lowland and montane tropical rain and seasonal forests; see above).
Table 2 gives the forest areas in 1989 from Myers' report and the areas of closed forest in 1980 from the FAO report as corrected in 1988. For some countries (Table 2(A)) all or most of the closed forest s e n s u FAO is tropical moist forest. Other countries have substantial areas of closed forest out- side the humid tropics; in Table 2(B), Brazil is the main example.
Table 2(A) shows that for countries where all or most of the forest is of the tropical moist type the FAO estimated area for 1980 was greater than other more recent estimates. For Indonesia and Malaysia, the change is probably due to continuing destruction. For Burma, Gabon, Philippines and Zaire the more recent estimates are much more pessimistic than those of FAO. Myers consistently estimates less forest area than the other sources, except for Gabon for which IUCN made a field study which reported half the area of forest indicated by FAO and Myers.
For countries with a substantial area of their closed forest outside the humid tropics (Table 2(B)), Myers, who considers only tropical moist forests, consistently estimates much lower areas than FAO, which includes all closed forests. But for Brazil, Myers' estimate for tropical moist forest for 1989 of 2-2 x 10⁶km 2 is less by about twice the area of France than the extent of the remaining Brazilian Amazon forest of 3"171 × 106 km 2, as estimated by a resident expert (Fearnside, 1990a, b). For India and Madagascar FAO estimated much larger extents of closed forest than the other more recent surveys.
Rates of destruction
Table 3 shows that the rate of forest destruction predicted by FAO for 1981-85 has been exceeded in all countries for which there is a more recent estimate, in most cases by a great deal. Colombia is the sole exception, but here the other estimate is a mean figure for 1960-84 and the rate in the 1980s could well be that predicted by FAO.
As with forest areas lost, so with percentage rates of destruction: the estimates for 1989 by Myers exceed all others, except for Colombia, Ecuador, Gabon and Ivory Coast. In the last case the decrease is due to the imminent disappearance of moist forest (Lanly, 1990).

TABLE 3 Different Estimates of Recent Annua l Rates of Tropical Defores ta t ion
1981-85 rate 'Current rate' o f FAO (1988) o f Myers (1989) % 10 2 km 2 % 10 2 km 2
Other estimates
Year (10 2 km 2)
New World Bolivia 0.2 8'7 2.1 15 - - Brazil 0-4 136 2-3 500 1987 Colombia 1'8 82 2'3 65 1960-84 Ecuador 2'4 34 4-0 30 - - Mexico 1.8 47 4"2 70 - - Peru 0.4 26 0.7 35 1988 Venezuela 0.4 12.5 0.4 15 - -
Asia: cont inent Burma 0"3 10.15 3'3 80 c. 1980 C a m b o d i a 0"3 2"5 0'75 5 - - India 0"3 13"2 2'4 40 Laos 1.3 10 1"5 10 Thai land 3.0 24.4 8-4 60 - - Vietnam 0.8 6 5.8 35
Asia: insular Indonesia 0"5 60 1.4 120 c. 1985 Malaysia 1.2 25.5 3.1 48 c. 1985 Papua New Guinea 0.1 2.2 1.0 35 - - Philippines 1.0 9.1 5.4 27 1969-88
1988
Africa: west Ivory Coast 6-5 29 15.6 25 Nigeria 5-0 30 14.3 40
Africa: central Cameroon 0.4 8 1"2 20 Congo 0-1 2.2 0"8 7 G a b o n 0-1 1 "5 0.3 6 Zaire 0"2 18 0.4 40
Africa: insular Madagascar 1"5 15 8'3 20
350 ~ 60 b
30 ~
60 d
100 ~ 31 s
21 g 13 g
c. 1987 10 h
c. 1987 15 j
c. 1986 15-30 k
Sources: Myers (1989), Table 1, tropical moist forest; F A O (1988), Table 4, broadleaved closed forest. Percentages are of original cover. a A m a z o n on ly - -Fea r ns i de (1990a, b). b Unda ted Plan de Acci6n Forestal de Colombia , perfil de projectos. c Saavedra & Suarez de Frei tas (1989). a Allen (1984). e U S A I D (1987). "~ Thang (1987). 0 Forest M a n a g e m e n t Bureau (1988). h F A O / U N D P (1988). J I U C N (1989b). k World Bank (1988).

Tropical moist forest destruction 207
Myers' very high estimates for rate of forest destruction in Asia are probably due to his inclusion of logging, which he believes is the same as deforestation. In his view (Myers, 1989, p. 6), 'there are certain instances where the forest biomass is so heavily depleted--notably through the very heavy and unduly negligent logging of dipterocarp forests in southeast Asia, resulting in the removal of, or unsurvivable injury to, the great majority of trees--that the remnant ecosystem is a travesty of natural forest as properly understood. Decline of biomass and depletion of ecosystem services are so severe that the residual forest can no longer qualify as forest in any practical sense of the word. So this particular kind of overlogging is included in the term 'deforestation'. No-one who has either personally examined heavily logged rain forests or studied the research data on their recovery (e.g. Wyatt- Smith, 1963; Burgess, 1975) is likely to agree with Myers that they are destroyed by timber extraction alone. Forests are by nature highly dynamic with patches of decay and regrowth always present. In some forests big areas of destruction occur naturally. For example, parts of the global tropical moist forest experience natural destructive cataclysms by cyclones, whose consequences for structure and biomass are similar to heavy timber extraction. Regrowth is rapid. Hydrological and climatic functions soon recover. Relative proportions and patchiness of species are likely to change, but permanent loss is unlikely if areas of several square kilometres are considered. If the roads built to extract timber are used to give access for hunters or for farmers there may indeed be loss of animals or of the forests to agriculture. Logging may therefore catalyse destruction, but logging itself is not to be equated to destruction.
The figures in Table 3 need to be interpreted with care because of differences in the definitions employed by the various authors. As noted above, the comparison between the destruction rate for 1981-85 estimated by FAO and other later surveys shows an increase for all countries except Colombia. For most countries the magnitude of the difference is such that it probably represents a real increase, not just the result of different definitions. For both the FAO and Myers surveys the percentage rates of destruction shown in Table 3 demonstrate the well-known fact that West African forests are disappearing very fast.
The biggest increases in the amount of annual deforestation in Table 3 over the estimate made by FAO (1980) are in Indonesia and Brazil and are due to fire. Drought in 1982-83, followed in 1983 by the Great Fire of Borneo, destroyed 4 × 10⁴ km 2 (3 x 10⁴ in Kalimantan (Indonesia: Leighton & Wirawan, 1986), 1 x 10⁴ km 2 in Sabah (Malaysia: Beaman et al., 1985)). Droughts have been recorded previously, but not huge fires and, as Lanly (1990) points out, it is debatable whether this catastrophe is better called deforestation or is equated to a disturbance from which the forest will
208 J. A. Sayer, T. C. Whitmore
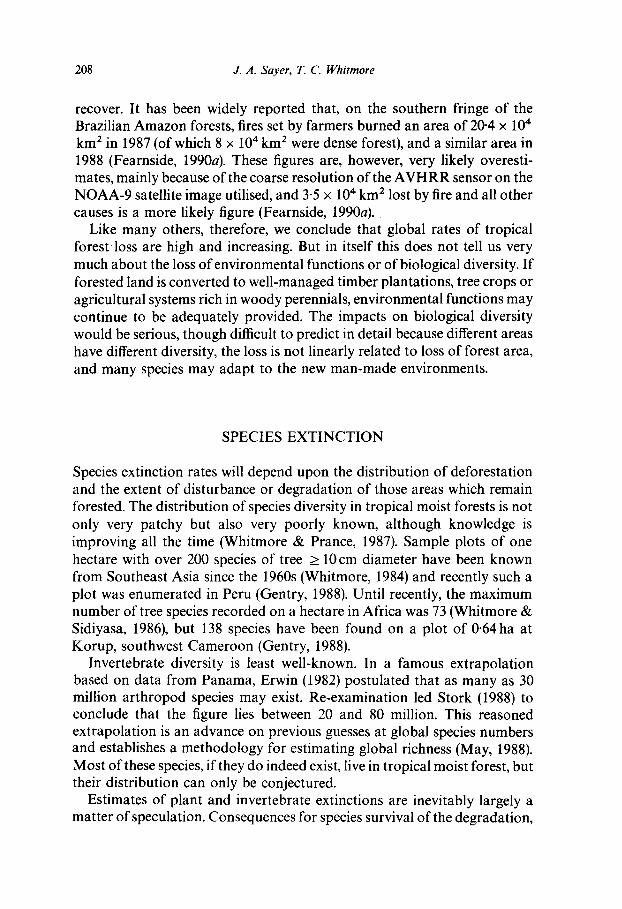
recover. It has been widely reported that, on the southern fringe of the Brazilian Amazon forests, fires set by farmers burned an area of 20.4 x 10⁴ km 2 in 1987 (of which 8 x 10⁴ km 2 were dense forest), and a similar area in 1988 (Fearnside, 1990a). These figures are, however, very likely overesti- mates, mainly because of the coarse resolution of the AVHRR sensor on the NOAA-9 satellite image utilised, and 3-5 x l04 km 2 lost by fire and all other causes is a more likely figure (Fearnside, 1990a).
Like many others, therefore, we conclude that global rates of tropical forest loss are high and increasing. But in itself this does not tell us very much about the loss of environmental functions or of biological diversity. If forested land is converted to well,managed timber plantations, tree crops or agricultural systems rich in woody perennials, environmental functions may continue to be adequately provided. The impacts on biological diversity would be serious, though difficult to predict in detail because different areas have different diversity, the loss is not linearly related to loss of forest area, and many species may adapt to the new man-made environments.
SPECIES EXTINCTION
Species extinction rates will depend upon the distribution of deforestation and the extent of disturbance or degradation of those areas which remain forested. The distribution of species diversity in tropical moist forests is not only very patchy but also very poorly known, although knowledge is improving all the time (Whitmore & Prance, 1987). Sample plots of one hectare with over 200 species of tree > 10cm diameter have been known from Southeast Asia since the 1960s (Whitmore, 1984) and recently such a plot was enumerated in Peru (Gentry, 1988). Until recently, the maximum number of tree species recorded on a hectare in Africa was 73 (Whitmore & Sidiyasa, 1986), but 138 species have been found on a plot of 0.64ha at Korup, southwest Cameroon (Gentry, 1988).
Invertebrate diversity is least well-known. In a famous extrapolation based on data from Panama, Erwin (1982) postulated that as many as 30 million arthropod species may exist. Re-examination led Stork (1988) to conclude that the figure lies between 20 and 80 million. This reasoned extrapolation is an advance on previous guesses at global species numbers and establishes a methodology for estimating global richness (May, 1988). Most of these species, if they do indeed exist, live in tropical moist forest, but their distribution can only be conjectured.
Estimates of plant and invertebrate extinctions are inevitably largely a matter of speculation. Consequences for species survival of the degradation,

Tropical moist Jbrest destruction 209
partial clearance and fragmentation of large forest areas are simply not known. By contrast it is highly likely that there will have been massive extinction of locally endemic plants and animals (amongst which invertebrates are especially numerous) in those places where large areas of tropical moist forest have been completely destroyed. The total clearance for pasture of 8 x 10⁴ km 2 of southeastern Brazilian Amazonia, the loss of over 95% of the Atlantic coastal rain forest of Brazil (Prance & Campbell, 1988), and the reduction (mainly over the last two decades) of the tropical moist forest cover of the once wholly forested Philippines to 22% (Forest Management Bureau, 1988) are three such areas, though even here we do not know to what extent species may persist in tiny patches of forest left along gullies and rocky ridges, etc. None of these regions had been well-explored by biologists before their forests were destroyed and there is no way of knowing how many species are likely to have become extinct. The figures sometimes published are wild guesses with little factual basis. But although we cannot put a finger on number of extinctions these three regions are a portent of things to come; there has undoubtedly been much loss, and other tropical moist forests are likely to go the same way with many further extinctions.
The only groups for which reasonably comprehensive information on extinction is available are the vertebrates, especially mammals and birds. Here, it is instructive to examine the occurrence of species in discrete areas of forest. Lists for national parks and other reserves provide such samples and can enable us to speculate on the implications for survival if all forest were to be cleared from all non-protected areas. The most comprehensive summary of vertebrate species occurrence in protected areas is given in the reviews of the International Union for Conservation of Nature for Africa and Indo- Malaya (MacKinnon & MacKinnon, 1986a,b), which demonstrate that existing protected areas, which cover 2-8% of the area of most tropical countries, include populations of nearly all bird and mammal species. In forested countries in Africa protected areas have been found to contain populations of 70-90% of the national bird faunas (Sayer & Stuart, 1989). These figures are an endorsement of the choice of areas for conservation, but their implications for long-term conservation of biological diversity need to be viewed with some caution. Small isolated populations are susceptible to extinction from inbreeding depression (though there is in fact little evidence for its actual importance (Simberloff, 1988)) and a variety of random causes. Area alone is a poor predictor of conservation value (Zimmermann & Bierregaard, 1986), and in at least some situations birds may persist for numerous generations at very low population levels (Dowsett-Lemaire, 1983). We interpret these data as demonstrating that massive extinction of vertebrates will not occur in the next few decades, but that the danger exists

210 J. A. Sayer, T. C. Whitmore
that many species which now only persist as isolated populations in rela- tively small protected areas are already prediposed to eventual extinction.
CONSERVATION PRIORITIES
The above arguments lead to the conclusion that, to optimise the application of resources, one should at least embark upon a 'minimum programme' to ensure the effective conservation management of those sites in the humid tropics that are known to support high levels of species richness and endemism. Many of these are already legally gazetted parks and reserves. The viability of this strategy clearly depends upon the maintenance of reasonable environmental stability. It in no way diminishes the imperative for non-protected forest lands to be brought under management systems that will provide other environmental services, such as regulation of climate and water supply. If forests surrounding protected areas approach the structure and species composition of the natural forest they allow extensions of the range and population size of many species, Such a scenario will favour the maintenance of more species than would survive if the protected areas were surrounded by less diverse systems. The optimal form of land use outside parks and reserves is near-natural forests under sustainable management for timber or non-timber products (Peters et al., 1989).
CONCLUSIONS
It is concluded that some of the more alarmist predictions of species extinction which will result from tropical deforestation are probably overstated. Information on the distribution of vertebrate diversity shows clearly that the relationship between forest loss and species loss is not arithmetic, and to extrapolate upon such a relationship presents an excessively pessimistic view.
It is also misleading to extrapolate forest loss towards a zero base. All countries have some permanent forest estate or inaccessible forests which are reasonably secure. In many cases these are part of a national protected area system and are located so as to cover a wide range of representative and biologically rich sites.
Studies of the flora and fauna of protected areas could enable us eventually to determine the number of species which are unlikely to become extinct and, in so far as the total number of species in a taxon is known, this would enable us to formulate some idea of global extinction rates. This approach is likely to provide a more useful management tool for

Tropical moist forest destruction 211
determining priorities for conservation than the present speculation over extinction rates based upon inadequate data.
The greatest cause for concern is that forest loss is in general greatest in those places where least forest remains, for example West Africa and Madagascar. The incremental extinction resulting from further forest loss in places where forest is already fragmented and of limited extent is likely to exceed that following the loss of an equivalent area in one of the major forest blocks.
A C K N O W L E D G E M E N T S
We received very helpful comments on an earlier draft of this paper from FAO, R. Persson and the participants at the I U C N Tropical Advisory Group Fifth Meeting and have also had assistance from J. McNeely, D. Simberloff and an anonymous referee. For help with data collection we thank A. J. Broekhoven.
R E F E R E N C E S
Allen, P. E. T. (1984). A quick new appraisal of forest cover of Burma using LANDSAT satellite imagery at 1:1 000000 scale. Technical Note 11 BUR/79/011 National Forest Survey and Inventory.
Beaman, R. S., Beaman, J. H., Marsh, C. W. & Woods, P. V. (1985). Drought and forest fires in Sabah in 1983. Sabah Soc. J., 8, 10-30.
Burgess, P. F. (1975). Silviculture in the hill forests of the Malay Peninsula. Malay. For. Dep. Res. Pamphlet, No. 66.
Champion, H. G. (1936). A preliminary survey of the forest types of India and Burma. Ind. For. Rec. (NS) Silvic., 1, 1-286.
Dowsett-Lemaire, F. (1983). Ecological and territorial requirements of montane forest birds on the Nyika plateau in south central Africa. Gerfaut, 73, 3345-78.
Ehrlich, P. R. & Ehrlich, A. H. (1981). Extinctions. Random House, New York. Erwin, T. L. (1982). Tropical forests: their richness in Coleoptera and other
arthropod species. Coleopt. Bull., 36, 74-5. FAO (1981). Tropical Forest Resources Assessment Project, 4 vols. FAO, Rome. FAO (1988). An interim report on the state of forest resources in the developing
countries. Forest Resources Division, Forest Department FO: MISC/88/7. FAO, Rome.
FAO/UNDP (1988). Cameroun Tropical Forestry Action Plan. Rapport du Mission, 2 vols. FAO/UNDP, Rome.
Fearnside, P. M. (1990a). Deforestation in Brazilian Amazonia. In The Earth in Transition: Patterns and Processes of Biotic Impoverishment, ed. G. M. Woodwell. Cambridge University Press, New York, in press.

212 J. A. Sayer, T. C. Whitmore
Fearnside, P. M. (1990b). In Extent and Causes of Tropical Forest Destruction: Amazon. Enquete-Kommission Vorsorge zum Schutz der Erdatmosphiire Schriftliche Stellungnahmen, 5, 20-5. Bundestag, Bonn.
Forestry Department, Peninsular Malaysia (1988). Forestry in Peninsular Malaysia Annual Report 1987. Kuala Lumpur.
Forest Department, Sarawak (1989). Annual Report 1987. Kuching. Forest Management Bureau Department of Environment & Natural Resources
(1988). Natural forest resources of the Philippines. Philippine-German Forest Resources Inventory Project (mimeographed).
Gentry, A. H. (1988). Tree species richness of upper Amazonian forests. Proc. Natn. Acad. Sci. USA, 85, 156-9.
Government of India (1988). Annual Report 198~88. Ministry of Environment, Delhi.
IUCN (1989a). La conservation des ecosyst6mes forestiers du Gabon. Gland (mimeographed).
IUCN (1989b). La conservation des ecosyst6mes forestiers de Zaire. Gland (mimeographed).
Lanly, J. P. (1982). Tropical forest resources. FAO For. Pap., No. 30. Lanly, J. P. (1990). The status of tropical forests. In TropicalForests, ed. A. E. Lugo.
Springer, New York, in press. Leighton, M. & Wirawan, N. (1986). Catastrophic drought and fire in Borneo
tropical rain forest associated with the 1982 83 El Nino southern oscillation event. In Tropical Rain Forests and the World Atmosphere, ed. G. T. Prance. Westview, Boulder, pp. 75-99.
Lugo, A. E. (1988). Estimating reductions in the diversity of tropical forest species. In Biodiversity, ed. E. O. Wilson. National Academy Press, Washington DC, pp. 58-70.
MacKinnon, J. & MacKinnon, K. S. (1986a). Review of the Protected Areas System in the Afrotropical Realm. IUCN, Gland, Cambridge.
MacKinnon, J. & MacKinnon, K. S. (1986b). Review of the Protected Areas System in the Indo-Malayan Realm. IUCN, Gland, Cambridge.
May, R. M. (1988). How many species are there on earth? Science, NY, 241, 1441-9. Myers, N. (1980). Conversion of Tropical Moist Forests. National Academy of
Sciences, Washington. Myers, N. (1983). A Wealth of Wild Species. Westview, Boulder. Myers, N. (1989). Deforestation Rates in Tropical Countries and their Climatic
Implications. Friends of the Earth, London. Peters, C. M., Gentry, A. H. & Mendelsohn, R. O. (1989). Valuation of an
Amazonian rain forest. Nature, Lond., 339, 655-6. Prance, G. T. & Campbell, D. G. (1988). The present state of tropical floristics. Taxon,
37, 519-48. Saavedra, C. & Suarez de Freitas, G. (1989). Manu--two decades later. WWF
Reports, June-July 1989. Sayer, J. A. & Stuart, S. N. (1989). Biological diversity and tropical forests. Environ.
Conserv., 15, 193-4. Schimper, A. F. W. (1903). Plant-geography upon a Physiological Basis (translated by
W. R. Fisher, P. Groom & I. B. Balfour). Oxford University Press, Oxford. Simberloff, D. (1986). Are we on the verge of mass extinction in tropical rain forests?
In Dynamics of Extinction, ed. D. K. Elliott. Wiley, New York, pp. 165-80.

Tropical moist forest destruction 213
Simberloff, D. (1988). The contribution of population and community biology to conservation science. Ann. Rev. Ecol. & Systemat., 19, 473-512.
Simon, J. L. (1986). Disappearing species, deforestation and data. New Scient., 110, 60-3.
Sommer, A. (1976). Attempt at an assessment of the world's tropical forests. Unasylva, 28(112/113), 5-25.
Stork, N. E. (1988). Insect diversity: facts, fiction and speculation. Biol. J. Linn. Soc., 35, 321-7.
Thang, H. C. (1987). Forest Resources Assessment in Malaysia. Forest Management Unit, Forestry Department, Kuala Lumpur.
USAID (1987). Natural resources and environmental management in Indonesia. Jakarta (mimeographed).
WCMC (1988a). Peru, Conservation of Biological Diversity. World Conservation Monitoring Centre, Cambridge.
WCMC (1989b). Nigeria, Conservation of Biological Diversity. World Conservation Monitoring Centre, Cambridge.
Whitmore, T. C. (1984). Tropical Rain Forests of the Far East, 2nd edn. Clarendon Press, Oxford.
Whitmore, T. C. (1990). An Introduction to Tropical Rain Forests. Clarendon Press, Oxford.
Whitmore, T. C. & Prance, G. T. (eds) (1987). Biogeography and Quaternary History in Tropical America. Clarendon Press, Oxford.
Whitmore, T. C. & Sidiyasa, K. (1986). Composition and structure of a lowland rain forest at Toraut, northern Sulawesi. Kew Bull., 41,747-56.
Williams, M. (1989). Deforestation: past and present. Progr. Human Geogr., 176-208.
Wolf, E. C. (1987). On the brink of extinction: conserving the diversity of life. Worldwatch Paper, No. 78.
World Bank (with USAID and others) (1988). Madagascar Environmental Action Plan, Vol. 1. General Synthesis and Proposed Actions. Washington DC.
Wyatt-Smith, J. (1963). Manual of Malayan silviculture for inland forests, 2 vols. Malay. For. Rec., No. 23.
Zimmermann, B. L. & Bierregaard, R. O. (1986). Relevance of the equilibrium theory of island biogegraphy and species-area relations to conservation with a case from Amazonia. J. Biogeogr., 13, 13343.
Copyright © 2022 FDOKUMEN