Measurements in the Troposphere Missing Gas-Phase Source of HONO Inferred from Zeppelin
6
DOI: 10.1126/science.1248999 , 292 (2014); 344 Science et al. Xin Li Measurements in the Troposphere Missing Gas-Phase Source of HONO Inferred from Zeppelin This copy is for your personal, non-commercial use only. clicking here. colleagues, clients, or customers by , you can order high-quality copies for your If you wish to distribute this article to others here. following the guidelines can be obtained by Permission to republish or repurpose articles or portions of articles ): April 17, 2014 www.sciencemag.org (this information is current as of The following resources related to this article are available online at http://www.sciencemag.org/content/344/6181/292.full.html version of this article at: including high-resolution figures, can be found in the online Updated information and services, http://www.sciencemag.org/content/suppl/2014/04/16/344.6181.292.DC1.html can be found at: Supporting Online Material http://www.sciencemag.org/content/344/6181/292.full.html#ref-list-1 , 4 of which can be accessed free: cites 48 articles This article http://www.sciencemag.org/cgi/collection/atmos Atmospheric Science subject collections: This article appears in the following registered trademark of AAAS. is a Science 2014 by the American Association for the Advancement of Science; all rights reserved. The title Copyright American Association for the Advancement of Science, 1200 New York Avenue NW, Washington, DC 20005. (print ISSN 0036-8075; online ISSN 1095-9203) is published weekly, except the last week in December, by the Science on April 17, 2014 www.sciencemag.org Downloaded from on April 17, 2014 www.sciencemag.org Downloaded from on April 17, 2014 www.sciencemag.org Downloaded from on April 17, 2014 www.sciencemag.org Downloaded from on April 17, 2014 www.sciencemag.org Downloaded from on April 17, 2014 www.sciencemag.org Downloaded from
-
Upload
fz-juelich -
Category
Documents
-
view
4 -
download
0
Transcript of Measurements in the Troposphere Missing Gas-Phase Source of HONO Inferred from Zeppelin

DOI: 10.1126/science.1248999, 292 (2014);344 Science
et al.Xin LiMeasurements in the TroposphereMissing Gas-Phase Source of HONO Inferred from Zeppelin
This copy is for your personal, non-commercial use only.
clicking here.colleagues, clients, or customers by , you can order high-quality copies for yourIf you wish to distribute this article to others
here.following the guidelines
can be obtained byPermission to republish or repurpose articles or portions of articles
): April 17, 2014 www.sciencemag.org (this information is current as of
The following resources related to this article are available online at
http://www.sciencemag.org/content/344/6181/292.full.htmlversion of this article at:
including high-resolution figures, can be found in the onlineUpdated information and services,
http://www.sciencemag.org/content/suppl/2014/04/16/344.6181.292.DC1.html can be found at: Supporting Online Material
http://www.sciencemag.org/content/344/6181/292.full.html#ref-list-1, 4 of which can be accessed free:cites 48 articlesThis article
http://www.sciencemag.org/cgi/collection/atmosAtmospheric Science
subject collections:This article appears in the following
registered trademark of AAAS. is aScience2014 by the American Association for the Advancement of Science; all rights reserved. The title
CopyrightAmerican Association for the Advancement of Science, 1200 New York Avenue NW, Washington, DC 20005. (print ISSN 0036-8075; online ISSN 1095-9203) is published weekly, except the last week in December, by theScience
on
Apr
il 17
, 201
4w
ww
.sci
ence
mag
.org
Dow
nloa
ded
from
o
n A
pril
17, 2
014
ww
w.s
cien
cem
ag.o
rgD
ownl
oade
d fr
om
on
Apr
il 17
, 201
4w
ww
.sci
ence
mag
.org
Dow
nloa
ded
from
o
n A
pril
17, 2
014
ww
w.s
cien
cem
ag.o
rgD
ownl
oade
d fr
om
on
Apr
il 17
, 201
4w
ww
.sci
ence
mag
.org
Dow
nloa
ded
from
o
n A
pril
17, 2
014
ww
w.s
cien
cem
ag.o
rgD
ownl
oade
d fr
om
from natural gas) (28, 29). Effusion-based selec-tivity is also important for separation of gaseswith large mass differences, such as removal ofhigh carbons from natural gas, flavor selection,and organic solvent separation (30).
Our porous graphene membranes also per-meate water several times faster than do ultra-filtration membranes such as acrylic (31, 32),cellulosics, and polysulfone (31, 33), reducing thepressure requirements proportionally (Fig. 4B).Despite this high water permeance, when air ispresent on the other side of the graphene wehave not observed any water flow, even up to afew bars of pressure difference. Our porousgraphene membrane thus might be an efficientwaterproof membrane material, while beinghighly breathable owing to observed ultrahighvapor permeances. Indeed, the comparison of thewater vapor transmission rate of our graphenemembranes with commercial waterproof mem-branes (18, 19) confirms up to 4 orders of en-hancement in breathability (Fig. 4C).
We have engineered large-scale physical per-foration of free-standing graphene having con-trolled pore sizes ranging from <10 nm to 1 mm.Such membranes enable quantitative analysis ofmass transport phenomena, such as atmosphericpressure effusion, through atomically thin apertures,revealing distinct effusive, transition, and collec-tive flow regimes. Orders-of-magnitude enhance-ments are observed for gas, water, andwater vaporpermeances, compared with the state-of-the-artmembranes.
References and Notes1. X. Li et al., Science 324, 1312–1314 (2009).2. K. S. Kim et al., Nature 457, 706–710 (2009).3. K. S. Novoselov et al., Science 306, 666–669 (2004).4. J. S. Bunch et al., Nano Lett. 8, 2458–2462 (2008).5. V. Berry, Carbon 62, 1–10 (2013).6. S. Garaj et al., Nature 467, 190–193 (2010).7. S. P. Koenig, L. Wang, J. Pellegrino, J. S. Bunch,
Nat. Nanotechnol. 7, 728–732 (2012).8. S. C. O’Hern et al., ACS Nano 6, 10130–10138 (2012).9. K. Celebi et al., Nano Lett. 13, 967–974 (2013).10. H. W. Kim et al., Science 342, 91–95 (2013).11. H. Li et al., Science 342, 95–98 (2013).12. R. A. Sampson, Philos. Trans. R. Soc. London A 182,
449–518 (1891).13. K.-K. Tio, S. S. Sadhal, Appl. Sci. Res. 52, 1–20 (1994).14. M. Knudsen, Ann. Phys. 333, 75–130 (1909).15. N. Dongari, A. Sharma, F. Durst, Microfluid. Nanofluid. 6,
679 (2009).16. L. Lund, A. Berman, J. Appl. Phys. 37, 2489 (1966).17. R. D. Present, A. J. Debethune, Phys. Rev. 75, 1050–1057
(1949).18. A. Gugliuzza, E. Drioli, J. Membr. Sci. 446, 350–375 (2013).19. S. A. Brewer, Rec. Pat. Mat. Sci. 4, 1 (2011).20. T. Yoon, J. H. Mun, B. J. Cho, T.-S. Kim, Nanoscale 6,
151–156 (2013).21. L. M. Robeson, J. Membr. Sci. 320, 390–400 (2008).22. Y. Li, F. Liang, H. Bux, W. Yang, J. Caro, J. Membr. Sci.
354, 48–54 (2010).23. Z. Tang, J. Dong, T. M. Nenoff, Langmuir 25, 4848–4852
(2009).24. R. M. de Vos, H. Verweij, Science 279, 1710–1711 (1998).25. K. Nagai, A. Higuchi, T. Nakagawa, J. Polym. Sci. B 33,
289–298 (1995).26. M. E. Rezac, B. Schöberl, J. Membr. Sci. 156, 211–222 (1999).27. D. Shekhawat, D. R. Luebke, H. W. Pennline, “A review of
carbon dioxide selective membranes: A topical report,”Report DOE/NETL 2003/1200 (U.S. Department ofEnergy, National Energy Technology Laboratory,Pittsburgh, PA, 2003).
28. W. J. Koros, R. Mahajan, J. Membr. Sci. 175, 181–196 (2000).
29. P. Bernardo, E. Drioli, G. Golemme, Ind. Eng. Chem. Res.48, 4638–4663 (2009).
30. B. Freeman, Y. Yampolskii, I. Pinnau, Materials Science ofMembranes for Gas and Vapor Separation (Wiley,New York, 2006).
31. A. Mehta, A. L. Zydney, J. Membr. Sci. 249, 245–249 (2005).32. R. Shukla, M. Balakrishnan, G. P. Agarwal, Bioseparation
9, 7–19 (2000).33. S. Nakatsuka, A. S. Michaels, J. Membr. Sci. 69, 189–211
(1992).34. H. Guo, G. Zhu, I. J. Hewitt, S. Qiu, J. Am. Chem. Soc.
131, 1646–1647 (2009).35. B. Elyassi, M. Sahimi, T. T. Tsotsis, J. Membr. Sci. 288,
290–297 (2007).
Acknowledgments: We appreciate the support from BinnigRohrer Nanotechnology Center of ETH Zurich and IBM Zurich.J.B. and H.G.P. thank Swiss National Science Foundation forfinancial support (200021–137964). This work was partiallysupported by LG Electronics Advanced Research Institute, forwhich K.C., R.M.W. and H.G.P. are grateful. I.S. is thankful toSwiss National Science Foundation for support in equipmentprocurement (REquip 206021_133823). H.G.P. appreciatesP. Jenny at ETH Zurich for his discussion on Knudsen’sminimum. J. Patscheider and L. Bernard at Laboratory forNanoscale Materials Science of EMPA (Swiss Federal Laboratoriesfor Materials Science and Technology), Switzerland, performedx-ray photoelectron spectroscopy and time-of-flight secondary ionmass spectrometry analyses, and C. Bae and H. Shin at theDepartment of Energy Science of Sungkyunkwan University,Korea, took high-resolution transmission electron microscopeimages, for which we are grateful.
Supplementary Materialswww.sciencemag.org/content/344/6181/289/suppl/DC1Materials and MethodsFigs. S1 to S11References (36–45)
28 November 2013; accepted 20 March 201410.1126/science.1249097
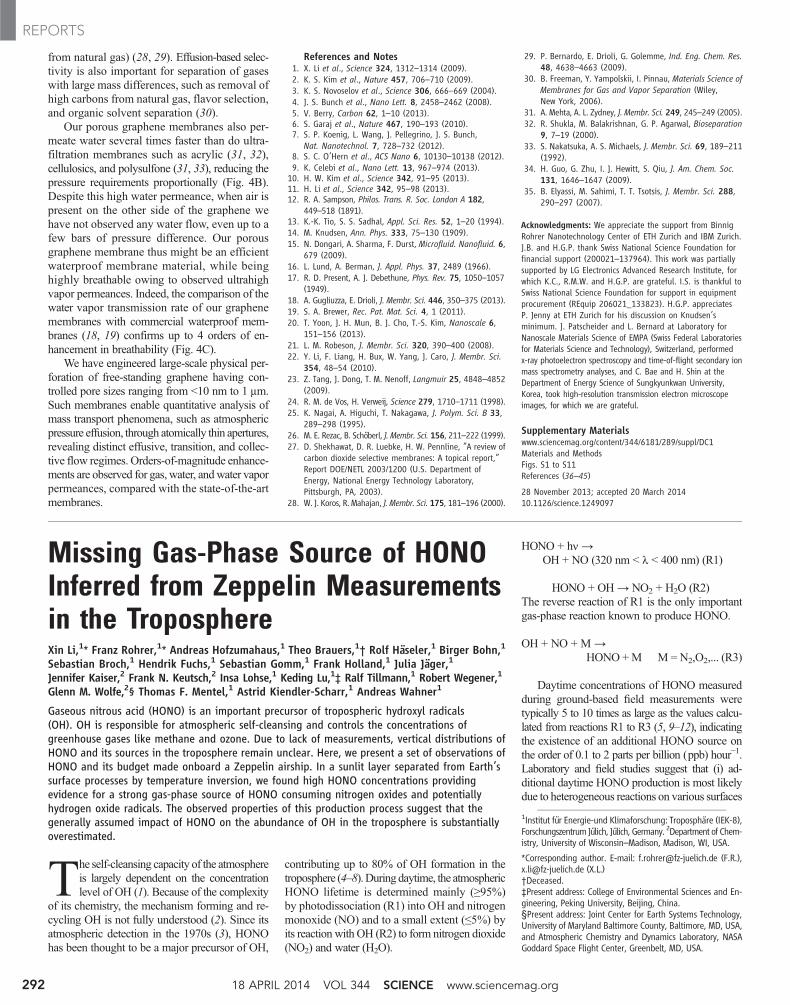
Missing Gas-Phase Source of HONOInferred from Zeppelin Measurementsin the TroposphereXin Li,1* Franz Rohrer,1* Andreas Hofzumahaus,1 Theo Brauers,1† Rolf Häseler,1 Birger Bohn,1Sebastian Broch,1 Hendrik Fuchs,1 Sebastian Gomm,1 Frank Holland,1 Julia Jäger,1Jennifer Kaiser,2 Frank N. Keutsch,2 Insa Lohse,1 Keding Lu,1‡ Ralf Tillmann,1 Robert Wegener,1Glenn M. Wolfe,2§ Thomas F. Mentel,1 Astrid Kiendler-Scharr,1 Andreas Wahner1
Gaseous nitrous acid (HONO) is an important precursor of tropospheric hydroxyl radicals(OH). OH is responsible for atmospheric self-cleansing and controls the concentrations ofgreenhouse gases like methane and ozone. Due to lack of measurements, vertical distributions ofHONO and its sources in the troposphere remain unclear. Here, we present a set of observations ofHONO and its budget made onboard a Zeppelin airship. In a sunlit layer separated from Earth’ssurface processes by temperature inversion, we found high HONO concentrations providingevidence for a strong gas-phase source of HONO consuming nitrogen oxides and potentiallyhydrogen oxide radicals. The observed properties of this production process suggest that thegenerally assumed impact of HONO on the abundance of OH in the troposphere is substantiallyoverestimated.
Theself-cleansing capacity of the atmosphereis largely dependent on the concentrationlevel of OH (1). Because of the complexity
of its chemistry, the mechanism forming and re-cycling OH is not fully understood (2). Since itsatmospheric detection in the 1970s (3), HONOhas been thought to be a major precursor of OH,
contributing up to 80% of OH formation in thetroposphere (4–8).During daytime, the atmosphericHONO lifetime is determined mainly (≥95%)by photodissociation (R1) into OH and nitrogenmonoxide (NO) and to a small extent (≤5%) byits reaction with OH (R2) to form nitrogen dioxide(NO2) and water (H2O).
HONO + hn →OH + NO (320 nm < l < 400 nm) (R1)
HONO + OH→ NO2 + H2O (R2)The reverse reaction of R1 is the only importantgas-phase reaction known to produce HONO.
OH + NO + M →HONO +M M=N2,O2,... (R3)
Daytime concentrations of HONO measuredduring ground-based field measurements weretypically 5 to 10 times as large as the values calcu-lated from reactions R1 to R3 (5, 9–12), indicatingthe existence of an additional HONO source onthe order of 0.1 to 2 parts per billion (ppb) hour−1.Laboratory and field studies suggest that (i) ad-ditional daytime HONO production is most likelydue to heterogeneous reactions on various surfaces
1Institut für Energie-und Klimaforschung: Troposphäre (IEK-8),Forschungszentrum Jülich, Jülich, Germany. 2Department of Chem-istry, University of Wisconsin–Madison, Madison, WI, USA.
*Corresponding author. E-mail: [email protected] (F.R.),[email protected] (X.L.)†Deceased.‡Present address: College of Environmental Sciences and En-gineering, Peking University, Beijing, China.§Present address: Joint Center for Earth Systems Technology,University of Maryland Baltimore County, Baltimore, MD, USA,and Atmospheric Chemistry and Dynamics Laboratory, NASAGoddard Space Flight Center, Greenbelt, MD, USA.
18 APRIL 2014 VOL 344 SCIENCE www.sciencemag.org292
REPORTS

close to the ground—e.g., on snowpacks (13),on soils (14–16), and on forest canopies (17)—whereas (ii) reactions of excited NO2 with H2O(18), photolysis of orthonitrophenols (19), andreactions on aerosol surfaces (20, 21) make onlymoderate contributions to daytime HONO for-mation. The overall affect of the proposed HONOsources in the troposphere remains widely un-known, however, due to the lack of measurementsof HONO and its sources and sinks at higher al-titudes above Earth’s surface. During recentHONOgradient studies, unexpected highHONO concen-trations [15 to 200 parts per trillion (ppt)] wereobserved for higher altitudes (300 to 1000 m)above ground (12, 22, 23). No strong HONO gra-dient was found for daytime periods when con-vective mixing in the atmosphere was maskingthe true point of origin of any HONO source.Therefore, the question arises whether the proposedHONO sources can explain the elevated HONOconcentrations at higher altitudes in the troposphere.
The vertical structure of the troposphere,which influences the HONO distribution, is de-termined by thermal processes and wind shear.(In the following, we discuss only thermal pro-cesses because the Zeppelin flights gave no in-dication of a substantial influence of wind shearon the observations of trace species. This findingis certainly biased by flight restrictions of theZeppelin at large wind speeds.) The lowest 1 to2 km of the atmosphere is called planetary bound-ary layer (PBL). During afternoon hours, the PBLis well mixed throughout by convective turbu-lence, which is driven by solar heating of Earth’ssurface. In the night, the PBL develops sublayers(24), as a result of cooling of the surface, thateven outlive for several hours the renewed sur-face heating after sunrise. The resulting evolutionof air temperatures duringmorning hours is shownin Fig. 1A. A temperature inversion separates the
Fig. 1. Break-up of thenocturnal boundary layerduring morning hours.(A) Conceptual representationof the vertical structure of tem-perature in the atmosphere upto 1 kmheight above ground.Blue, black, and red lines rep-resent the situation at sun-rise, during themorning, andaround noon, respectively.Each day after sunset, Earth’ssurface cools due to thermalradiative emission. Becauseair temperature does not coolas fast, a positive vertical tem-perature gradient evolves typ-ically in a 300-mheight range.This is called temperature in-version. As a result, the PBLis divided into two sublayers, i.e., the NBL and the RL. At sunrise, theseprocesses are reversed. The sun heats up the surface over the course of severalhours, leading to the formation of a turbulent ML. Shortly before noon, thisheating process has increased the surface temperature enough so that a negative
temperature gradient is preserved throughout the PBL. After that, the ML, NBL,and RL becomewell mixed. (B) HONO formation pathways in different sublayersof the PBL. (C) Observed O3 vertical profile around sunrise (i.e., 5:03 UTC) on 12July 2012 at San Pietro Capofiume, Italy.
0
200
400
600
800
Alti
tude
[m] A
0
20
40
60
80
O3
[ppb
] B
0.00.51.01.52.02.5
NO
[ppb
] C
02468
10
NO
2 [p
pb] D
04:00 06:00 08:00Time [UTC = Local − 2h]
0
200
400
600
800
HO
NO
[ppt
] Mixed Layer Nocturnal Boundary Layer Residual Layer
E
Fig. 2. Observations during profile flights on 12 July 2012 at San Pietro Capofiume, Italy. Theflight altitude is shown in (A). (B to E) display observed O3, NO, NO2, and HONO concentrations atdifferent altitudes. The data shown here are averaged or interpolated to the time step of the HONOmeasurements (30 s). The blue, gray, and red dots represent observations in the RL, NBL, and ML, re-spectively, as indicated by the measured O3 concentrations. The onset of the development of the ML above50 m is characterized by the steep drop of O3 concentration in the NBL around 5:00 UTC, which is causedby deposition and reaction with freshly emitted NO (Fig. 2C) at the surface.
www.sciencemag.org SCIENCE VOL 344 18 APRIL 2014 293
REPORTS
nocturnal boundary layer (NBL) from the residuallayer (RL) above almost until noon. This inversionrestricts vertical mixing of air constituents, as in-dicated by a measured O3 profile (Fig. 1C), andisolates the RL from influences of Earth’s surface(like deposition or titration by NO in case of O3)as long as the temperature inversion is maintained.Thus, for several hours during eachmorning, the RLoffers the unique opportunity to study photochem-ical processes—for example, those of HONO—undisturbed by emission or deposition processesnear the surface.
The airship Zeppelin “New Technology” (NT)is an ideal platform to investigate the chemistryand dynamics of the PBL. During the PEGASOS(Pan-European Gas Aerosol Climate InteractionStudy) 2012 field campaign in the Po Valley inNorthern Italy, we performed vertical-profile mea-surements of trace gases (including HONO, NO,OH, andO3), aerosols, photolysis frequencies, andmeteorological parameters in the lower tropo-sphere (see supplementarymaterials for details). Thelayered structure of the PBLwas always clearly seenin the vertical distributions of the observed tracegases and temperatures—for example, on 12 July2012 at San Pietro Capofiume (Fig. 2 and figs. S2and S3). In this case, the concentration of O3 re-mained essentially constant in the RL during thewhole morning flight, whereas in the mixed layer(ML) it was influenced by processes at the sur-face such as deposition or titration by NO emittedat ground. With increasing irradiation, the sur-face temperature and height of the ML increased.The incorporation of air from the NBL leads toa rise in O3 inside the ML. During the growth ofthe ML, the NBL acts as a buffer zone betweenML and RL. O3 concentrations in the RL remainstable and higher than in the NBL and ML. Thisimplies that the RL is decoupled from the MLand is not influenced by emissions or depositionat Earth’s surface. Complete mixing of the threelayers is indicated by the disappearance of thevertical O3 gradient (after 8:15 UTC).
During this flight, HONO concentrations inthe RL remained nearly constant (150 ppt) whilethe RL stayed decoupled from the ML (Fig. 2D).Higher HONO concentrations were observed inthe ML (200 to 600 ppt) due to the well-knownaccumulation of HONO via slow, nighttime NO2
conversion at the surface (3, 4). With increasingsolar radiation, HONO concentrations in the MLstarted to decrease, but they remained stable inthe RL. Analogous to O3, the concentration dif-ference of HONO between the three layers van-ished when the ML had fully developed. Thedecrease of HONO in theML after sunrise is wellknown (3) and caused by photolysis (R1). Theobservation that HONO in the RL was not de-pleted by photolysis, but rather stayed constant, isunexpected and implies the existence of a com-pensating HONO source after sunrise. HONOundepleted by photolysis was also found duringour former observations onboard Zeppelin (22)and during airborne measurements in the UnitedStates (23).
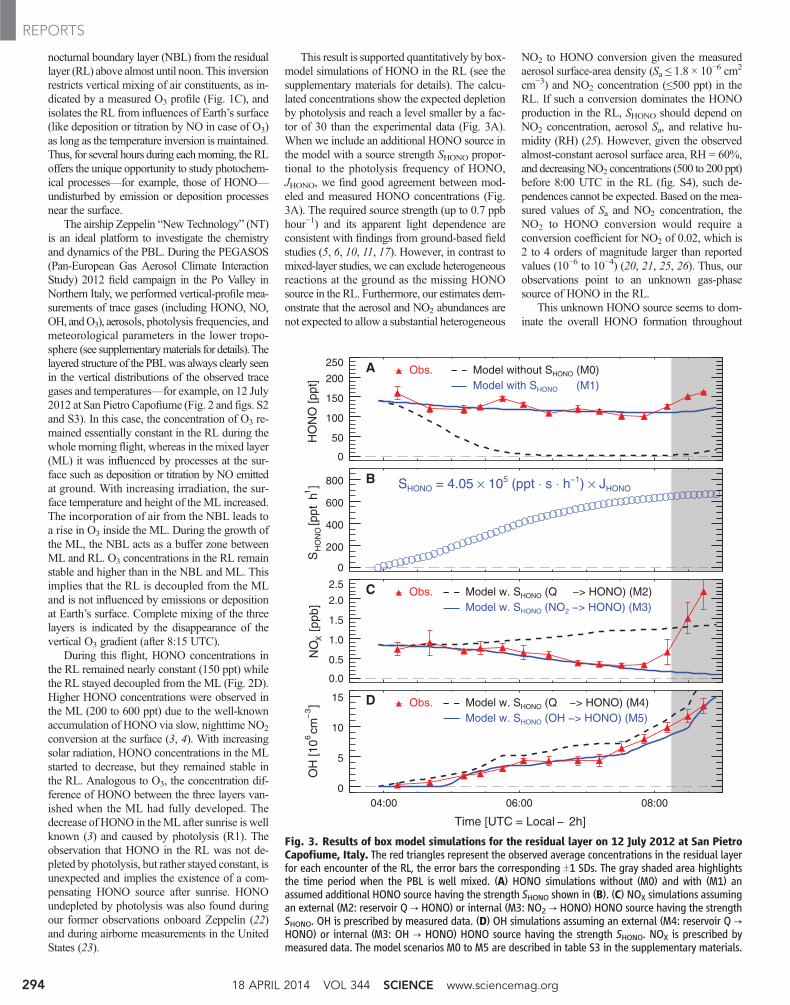
This result is supported quantitatively by box-model simulations of HONO in the RL (see thesupplementary materials for details). The calcu-lated concentrations show the expected depletionby photolysis and reach a level smaller by a fac-tor of 30 than the experimental data (Fig. 3A).When we include an additional HONO source inthe model with a source strength SHONO propor-tional to the photolysis frequency of HONO,JHONO, we find good agreement between mod-eled and measured HONO concentrations (Fig.3A). The required source strength (up to 0.7 ppbhour−1) and its apparent light dependence areconsistent with findings from ground-based fieldstudies (5, 6, 10, 11, 17). However, in contrast tomixed-layer studies, we can exclude heterogeneousreactions at the ground as the missing HONOsource in the RL. Furthermore, our estimates dem-onstrate that the aerosol and NO2 abundances arenot expected to allow a substantial heterogeneous
NO2 to HONO conversion given the measuredaerosol surface-area density (Sa ≤ 1.8 × 10⁻⁶ cm2
cm−3) and NO2 concentration (≤500 ppt) in theRL. If such a conversion dominates the HONOproduction in the RL, SHONO should depend onNO2 concentration, aerosol Sa, and relative hu-midity (RH) (25). However, given the observedalmost-constant aerosol surface area, RH = 60%,and decreasingNO2 concentrations (500 to 200 ppt)before 8:00 UTC in the RL (fig. S4), such de-pendences cannot be expected. Based on the mea-sured values of Sa and NO2 concentration, theNO2 to HONO conversion would require aconversion coefficient for NO2 of 0.02, which is2 to 4 orders of magnitude larger than reportedvalues (10−6 to 10−4) (20, 21, 25, 26). Thus, ourobservations point to an unknown gas-phasesource of HONO in the RL.
This unknown HONO source seems to dom-inate the overall HONO formation throughout
0
50
100
150
200
250
HO
NO
[ppt
]
Obs. Model without SHONO (M0) Model with SHONO (M1)
A
0
200
400
600
800
SH
ON
O [p
pt h
1] B SHONO = 4.05 × 10⁵ (ppt ⋅ s ⋅ h−1) × JHONO
0.0
0.5
1.0
1.5
2.0
2.5
NO
X [p
pb]
Obs. Model w. SHONO (Q −> HONO) (M2) Model w. SHONO (NO2 −> HONO) (M3)
C
04:00 06:00 08:00
Time [UTC = Local − 2h]
0
5
10
15
OH
[106 c
m−
3] Obs. Model w. SHONO (Q −> HONO) (M4)
Model w. SHONO (OH −> HONO) (M5)
D
Fig. 3. Results of box model simulations for the residual layer on 12 July 2012 at San PietroCapofiume, Italy. The red triangles represent the observed average concentrations in the residual layerfor each encounter of the RL, the error bars the corresponding T1 SDs. The gray shaded area highlightsthe time period when the PBL is well mixed. (A) HONO simulations without (M0) and with (M1) anassumed additional HONO source having the strength SHONO shown in (B). (C) NOX simulations assumingan external (M2: reservoir Q → HONO) or internal (M3: NO2 → HONO) HONO source having the strengthSHONO. OH is prescribed by measured data. (D) OH simulations assuming an external (M4: reservoir Q →HONO) or internal (M3: OH → HONO) HONO source having the strength SHONO. NOX is prescribed bymeasured data. The model scenarios M0 to M5 are described in table S3 in the supplementary materials.
18 APRIL 2014 VOL 344 SCIENCE www.sciencemag.org294
REPORTS

the PBL for daylight conditions. The measuredHONO data (Fig. 3A) at the altitude of the pre-viously existing RL show a slight increase of about25% after the PBL becomes completely mixed(after 8:15 UTC). The increase is most likelycaused by formation of HONO at the ground,which is vertically distributed by turbulence. Ac-cordingly, we estimate the contribution of surfaceprocesses to the HONO formation in the PBL inthis region to be around 25%; most HONO isproduced by the unknowngas-phase source. Basedon airborne HONO measurements in the PBLabove a forest in Michigan, USA, similar find-ings were reported (23) with an estimated contri-bution of surface sources between 16 and 27% tothe overall concentration of HONO.
The increase of SHONO after sunrise (Fig. 3B)could be caused by photolysis of a precursordirectly producing HONO, or it could indicate areaction of light-dependent precursors producingHONO with a rate scaling (accidentally) with
JHONO. Furthermore, the HONO source could beeither a process that consumes NOX and/or HOX
(internal source) or a reaction releasing HONOwithout consumption of NOX or HOX [externalsource, e.g., photolysis of nitrite/nitrate aerosols(17) or photolysis of orthonitrophenol (19)]. Fol-lowing reaction R1, an external HONO sourcewould lead to an increase of ambient NOX andOH under daylight conditions. If the observedHONO concentration is approximated by intro-ducing an appropriate external HONO source(Fig. 3B), the model significantly overestimatesthe observed NOX concentrations when HONOphotolysis becomes effective (Fig. 3C, M2, after06:00 UTC). The use of an internal source, how-ever, can consistently reproduce measured HONOand NOX as long as the RL remains isolated (Fig.3C, M3). For OH, an external source leads to asmall (30%) overprediction of the OH observa-tions (Fig. 3D, M4). This discrepancy is not sig-nificant, if the accuracy (14%) of themeasurement
and the estimatedmodel error (30%) are taken intoaccount. If we assume an internal source consum-ing OH (or HO2) for the production of HONO,the model result becomes almost equal to themeasurements (Fig. 3D, M5). Thus, the sensitiv-ity tests point to an internal source that requiresNOX and possibly HOX.
As a hypothesis, we assume that HONO isformed in the reaction between a HOX and a NOX
species without direct involvement of light. Forthis reason, we have calculated the rates of knownreactions of HOXwith NOX (fig. S12). The homo-geneous reaction between NO2, H2O, and NH3 isspeculated to be important for conditions withhigh NH3 concentration (30 ppb to 100 parts permillion) (27). Such high NH3 concentrations arenot likely for the investigated RL in this study, sothis process is not included in our considerations.Only the HO2 + NO and HO2 + NO2 reactionshave sufficiently fast turnover rates with the po-tential to balance the observed HONO loss rate(JHONO × [HONO]). The well-studied HO2 +NOreaction does not have a known pathway pro-ducing HONO. On the other hand, the reactionHO2 +NO2 has been postulated as aHONOsourcesince the 1970s (28). Only a few laboratory ex-periments were performed investigating the HO2 +NO2 reaction products (table S5). These studiesare conclusive in terms of negligible HONOyields under dry conditions which, however, cer-tainly does not represent the lower troposphere. Itis known that ~30% of HO2 is present as a HO2 ·H2O complex (29) in the lower troposphere,which has a different chemical behavior thanHO2. HO2 · H2O can react 3 to 4 times faster withNO2 than HO2 (30), but the products of thisreaction were not measured. If we add in themodel (i) the known equilibrium between HO2
and HO2 · H2O and (ii) the reaction of HO2 ·H2O with NO2 as measured (30), and furtherassume that the reaction converts NO2 to HONOwith a yield of 100%, then the model (M6)reproduces the observed HONO, NOX, OH, andHO2 within experimental uncertainties (Fig. 4).The assumed mechanism is therefore consistentwith the inferred daytime source of HONO.
Relatively high and constant HONO concen-trations in the sunlit RL were observed during allZeppelin flights of the PEGASOS 2012 field cam-paign in Italy (table S2 and figs. S13 to S15). Theinferred daytime gas-phase source of HONO inthe RL is of importance for the whole PBL andcomplicates the understanding of HONO chem-istry in the mixed layer. More field and labora-tory research is clearly required to understandall the relevant processes forming HONO in thetroposphere. Our study suggests that the tradi-tional understanding of the impact of HONO ontropospheric chemistry may need revision. If themissing gas-phase HONO source consumes HOX
in addition to the confirmed consumption of NOX,thenHONOphotolysis would result in a cycle withzero net production of these species. That wouldimply that the photolysis of HONO as a primarysource of tropospheric OH, which is thought
050
100
150
200
250300
HO
NO
[ppt
] Obs. Model w. SHONO (HO2⋅H2O + NO2 −> HONO) (M6)A
0.0
0.5
1.0
1.5
NO
X [p
pb]
B
0
5
10
15
OH
[106
cm
−3]
C
04:00 05:00 06:00 07:00 08:00
Time [UTC = Local − 2h]
0
2
4
6
8
10
HO
2 +
HO
2⋅H
2O
[108 c
m−
3]
D
Fig. 4. Observed and calculated concentrations in the residual layer for 12 July 2012 at SanPietro Capofiume, Italy. (A toD) The red triangles represent the observed average concentrations in theresidual layer for each encounter of the RL, the error bars the corresponding T1 SDs. Accuracies of theexperimental data are given in table S1. The constant difference between model and measurement resultsin (D) can be explained by the uncertainty of the offset correction of the measured HO2 data (seesupplementary materials). The blue line in each panel represents model results under the assumption ofadditional HONO production (SHONO) by the reaction between the HO2·H2O complex and NO2 (modelscenario M6).
www.sciencemag.org SCIENCE VOL 344 18 APRIL 2014 295
REPORTS
(4–6, 8) to contribute up to 80% to the primaryOH formation in the continental PBL, is general-ly overestimated.
References and Notes1. B. J. Finlayson-Pitts, J. N. Pitts, Chemistry of the Upper
and Lower Atmosphere: Theory, Experiments andApplications (Academic Press, San Diego, 2000), first ed.
2. A. Hofzumahaus et al., Science 324, 1702–1704 (2009).3. U. Platt, D. Perner, G. W. Harris, A. M. Winer,
J. N. Pitts Jr., Nature 285, 312–314 (1980).4. B. Alicke et al., J. Geophys. Res. 108, (D4), 8247
(2003).5. J. Kleffmann et al., Geophys. Res. Lett. 32, L05818 (2005).6. K. Acker et al., Geophys. Res. Lett. 33, L02809 (2006).7. P. S. Monks et al., Atmos. Environ. 43, 5268–5350 (2009).8. Y. F. Elshorbany et al., Atmos. Environ. 44, 5383–5394
(2010).9. A. Neftel, A. Blatter, R. Hesterberg, T. Staffelbach, Atmos.
Environ. 30, 3017–3025 (1996).10. M. Sörgel et al., Atmos. Chem. Phys. 11, 10433–10447
(2011).11. X. Li et al., Atmos. Chem. Phys. 12, 1497–1513 (2012).12. K. W. Wong et al., Atmos. Chem. Phys. 12, 635–652
(2012).
13. X. Zhou et al., Geophys. Res. Lett. 28, 4087–4090 (2001).14. K. Stemmler, M. Ammann, C. Donders, J. Kleffmann,
C. George, Nature 440, 195–198 (2006).15. H. Su et al., Science 333, 1616–1618 (2011).16. R. Oswald et al., Science 341, 1233–1235 (2013).17. X. Zhou et al., Nat. Geosci. 4, 440–443 (2011).18. S. Li, J. Matthews, A. Sinha, Science 319, 1657–1660 (2008).19. I. Bejan et al., Phys. Chem. Chem. Phys. 8, 2028–2035
(2006).20. M. Ammann et al., Nature 395, 157–160 (1998).21. K. Stemmler et al., Atmos. Chem. Phys. 7, 4237–4248
(2007).22. R. Häseler, T. Brauers, F. Holland, A. Wahner,
Atmos. Meas. Tech. Discuss. 2, 2027–2054 (2009).23. N. Zhang et al., Geophys. Res. Lett. 36, L15820 (2009).24. R. B. Stull, An Introduction to Boundary Layer
Meteorology (Kluwer Academic Publishers, 1988).25. R. Bröske, J. Kleffmann, P. Wiesen, Atmos. Chem. Phys. 3,
469–474 (2003).26. M. Ndour et al., Geophys. Res. Lett. 35, L05812 (2008).27. B. Zhang, F.-M. Tao, Chem. Phys. Lett. 489, 143–147 (2010).28. R. Simonaitis, J. Heicklen, J. Phys. Chem. 78, 653–657 (1974).29. S. Aloisio, J. S. Francisco, J. Phys. Chem. A 104,
6212–6217 (2000).30. S. P. Sander, M. E. Peterson, J. Phys. Chem. 88, 1566–1571
(1984).
Acknowledgments: This work is within the PEGASOS project,which is funded by the European Commission under theFramework Programme 7 (FP7-ENV-2010-265148). Wegratefully acknowledge the efforts that the Zeppelin NTpilots and ground crews made to this work. We alsoacknowledge Zeppelin Luftschifftechnik (ZLT) and DeutscheZeppelin Reederei (DZR) for their cooperation. J.J., R.W., I.L.,and B.B. thank Deutsche Forschungsgemeinschaft forfunding from the priority program HALO (WE-4384/2-2 andBO1580/4-1). J.K., G.M.W., and F.N.K. thank M. Cazorlafor helping with the calibration of the HCHO measurementsand NDF-AGS (1051338) and Forschungszentrum Jülichfor support. Our colleague Dr. Theo Brauers, sadly,passed away on 21 February 2014. We would like to takethis opportunity to express our sincere appreciation forhis excellent work.
Supplementary Materialswww.sciencemag.org/content/344/6181/292/suppl/DC1Materials and MethodsFigs. S1 to S13Tables S1 to S6References (31–53)26 November 2013; accepted 25 March 201410.1126/science.1248999
Assemblage Time Series RevealBiodiversity Change but NotSystematic LossMaria Dornelas,1* Nicholas J. Gotelli,2 Brian McGill,3 Hideyasu Shimadzu,1,4 Faye Moyes,1Caya Sievers,1 Anne E. Magurran1
The extent to which biodiversity change in local assemblages contributes to global biodiversityloss is poorly understood. We analyzed 100 time series from biomes across Earth to ask how diversitywithin assemblages is changing through time. We quantified patterns of temporal a diversity, measuredas change in local diversity, and temporal b diversity, measured as change in community composition.Contrary to our expectations, we did not detect systematic loss of a diversity. However, communitycomposition changed systematically through time, in excess of predictions from null models.Heterogeneous rates of environmental change, species range shifts associated with climate change,and biotic homogenization may explain the different patterns of temporal a and b diversity.Monitoring and understanding change in species composition should be a conservation priority.
Habitat destruction, pollution, and overhar-vesting, as well as climate change andinvasive species, have led to conspicuous
reductions in biological diversity (1). Globally,increasing numbers of species are under threat(2), populations of vulnerable taxa are declining(3), and ecosystem function is changing as a re-sult (4). Although these large-scale patterns emergefrom processes that are based on local commu-nity structure, as yet there is no comprehensiveanalysis of how temporal change in ecologicalassemblages contributes to this global picture.Because the implementation of conservation and
management decisions is typically at the scale oflocal to regional ecosystems (5, 6), knowledge ofbiodiversity change within assemblages is essen-tial to inform policy. A comparative analysis ofchange across taxa, biomes, and geographic re-gions also provides insights into the mechanismsinvolved. Here, we use a definition of biodiver-sity that includes components of species richness,composition, and relative abundance of species.We use standardized biodiversity monitoring ofassemblages over years and decades to assessglobal patterns of temporal change in speciesdiversity.
We quantified change in biodiversity throughtime by two measures: temporal trends in a di-versity and temporal b diversity (7). Temporal adiversity is a measure of diversity within a sam-ple. It can be measured as species richness or withrelated diversity metrics that take species abun-dances into account. To measure temporal changein a diversity, we calculated, for each time series,
the slope of the long-term relationship betweendiversity and time. Typically, b diversity is used tocompare the composition of different communitiesin space, but it can also be used to compare thecomposition of a single community through time.Temporal b diversity (temporal turnover) quanti-fies differences in species composition betweentwo (or more) samples separated in time. Tempo-ral turnover can be measured with metrics ofsimilarity to track changes in species identities(and sometimes their abundances) through time,either by comparing adjacent sampling periods orwith reference to a single baseline sample or timeperiod. Because turnover metrics incorporate shiftsin species composition, they potentially provide amore sensitive indicator of community change(8) than does a diversity.
Given widespread evidence of habitat change(9), abnormally high extinction rates (10), anddocumented declines of many species (2, 3), wepredicted that most assemblages would exhibit adecrease in a diversity through time, although thepattern and extent of change may differ amongtaxonomic groups, climatic regions, and marineor terrestrial realms and with spatial scale (11).For example, there is no evidence of consistentloss of biodiversity among terrestrial plants (12).Similarly, as a consequence of long-term changesin species composition, we expected increases intemporal b diversity measured relative to an earlybaseline sample.
To quantify biodiversity change, we gatheredall data sets we could find that met a priori qualitycriteria (13) for standardized, long-term quanti-tative sampling. This collection includes morethan 6.1 million species occurrence records from100 individual time series. There are 35,613 spe-cies represented, encompassing mammals, birds,fish, invertebrates, and plants. The geographicaldistribution of study locations is global, and in-cludes marine, freshwater, and terrestrial biomes,extending from the polar regions to the tropics in
1Centre for Biological Diversity and Scottish Oceans Insti-tute, School of Biology, University of St. Andrews, St. Andrews,Fife KY16 9TH, UK. 2Department of Biology, University ofVermont, Burlington, VT 05405, USA. 3School of Biology andEcology, Sustainability Solutions Initiative, University of Maine,Orono, ME 04469, USA. 4Department of Mathematics, Keio Uni-versity, 3-14-1 Hiyoshi Kohoku, Yokohama 223-8522, Japan.
*Corresponding author. E-mail: [email protected]
18 APRIL 2014 VOL 344 SCIENCE www.sciencemag.org296
REPORTS