Wiscombe Solar Radiation Calculations for Arctic Summer Stratus in Climate of the Arctic 1975
UNCORRECTED PROOF
Atmospheric Environment ] (]]]]) ]]]–]]]
Ozone in the Arctic lower troposphere during winter andspring 2000 (ALERT2000)
Jan W. Bottenheima,*, Jose D. Fuentesb, David W. Tarasicka, Kurt G. Anlaufa
aMeteorological Service of Canada, 4905 Dufferin Street, Toronto, Ont., Canada M3H 5TY4bDepartment of Environmental Sciences, University of Virginia, Charlottesville, VA, USA
Received 4 June 2001; received in revised form 28 September 2001; accepted 11 January 2002
Abstract
A summary of the temporal and vertical characteristics of ozone in the Arctic boundary layer as observed during
winter and spring 2000 near Alert, Nunavut, Canada (821N, 621W) is presented. The measurements were made during
the Polar Sunrise Experiments ALERT2000. Particular attention is given to identifying chemical and atmospheric
characteristics of short-lived (o2 days) ozone depletion events that occur during dark and sunlit periods in the Arcticboundary layer. During these events the atmospheric boundary layer becomes turbulent and as a result atmospheric
layers aloft, exceeding 100m in depth, can become fully devoid of ozone. It is shown that these depletion episodes are
often associated with air masses, whose origin is primarily in Eurasia, laden with chemical species of anthropogenic
origin. Nevertheless, it is postulated that ozone depletion is largely driven by halogen chemistry, in particular involving
bromine compounds, and this occurs during the transport of air masses across the Arctic Ocean. A detailed analysis of a
period in mid April suggests that, later in the season during 24-h sunlit periods, locally occurring ozone depletion
chemistry is an important process, and we speculate that photolysis of bromoform of marine origin is the fuse that starts
a local ‘‘bromine explosion’’. A severe ozone depletion episode occurred in late April. During this prolonged episode,
lasting 14 consecutive days, the atmospheric column extending from the surface to about 1400m remained almost
completely free of ozone. We present and discuss evidence that atmospheric thermodynamics and air mass transport
history explain the dynamics of ozone depletion episodes in the high Arctic.r 2002 Published by Elsevier Science Ltd.
Keywords: Ozone; Ozone depletion; Arctic boundary layer; Photochemistry; Air masses; Atmospheric static stability
1. Introduction
Tropospheric ozone (O3) is one of the most important
atmospheric constituents. It serves as a major green-
house gas (Mickley et al., 2001), thus playing a key role
in the energy balance of the atmosphere. Furthermore,
O3 represents the main source of hydroxyl radicals (OH)
through its photolysis, which produces electronically
excited oxygen atoms that rapidly combine with water
vapor molecules to form OH. O3 reacts with nitrogen
dioxide (NO2) to produce nitrate radicals (NO3). These
radical species in concert with O3 largely determine the
oxidative capacity of the atmosphere, keeping it clean of
harmful chemical species, and their absence could exert
dramatic and unpredictable consequences. The dramatic
O3 loss in the Arctic boundary layer during the polar
sunrise has therefore been of great interest since it was
first reported in the 1980s (Bottenheim et al., 1986;
Oltmans and Komhyr, 1986). Since that time, extensive
research has demonstrated that O3 depletion in the
Arctic boundary layer is a yearly phenomenon and
widely occurs throughout the Arctic (Mickle et al., 1989;
Oltmans et al., 1989; Anlauf et al., 1994; Leaitch et al.,
1994; Solberg et al., 1996; Rasmussen et al., 1997;
Hopper et al., 1998). Surface O3 depletion has also been
observed in coastal Antarctica (Wessel et al., 1998).
ARTICLE IN PRESS
1
3
5
7
9
11
13
15
17
19
21
23
25
27
29
31
33
35
37
39
41
43
45
47
49
51
53
55
57
59
61
63
65
67
69
71
3B2v7:51cGML4:3:1 AEA : 3825 Prod:Type:COM
pp:1210ðcol:fig::1;2ÞED:MaduraiDurai
PAGN: EVK SCAN: OLIVER
*Corresponding author.
E-mail address: [email protected] (J.W. Botten-
heim).
1352-2310/02/$ - see front matter r 2002 Published by Elsevier Science Ltd.
PII: S 1 3 5 2 - 2 3 1 0 ( 0 2 ) 0 0 1 2 1 - 8

UNCORRECTED PROOF
In the early years of this research it became apparent
that the O3 depletion process was related to the presence
of bromine (Barrie et al., 1988). These authors
postulated that photolysis of bromoform (CHBr3) of
oceanic origin would produce bromine atoms that would
then destroy O3 in a catalytic cycle
BrþO3-BrOþO2; ðR1Þ
2BrO-2BrþO2: ðR2Þ
However, subsequent determination of the absorption
spectrum of CHBr3 demonstrated that this process
would not be able to sustain a sufficient supply of Br
atoms to the observed rate of O3 destruction (Moortgat
et al., 1993). It is now generally accepted that in the
Arctic the reactive bromine originates from activation of
sea salt bromide, Br� (Platt and Moortgat, 1999).
Recent observations (Foster et al., 2001) of molecular
bromine (Br2) and bromine chloride (BrCl) in the
boundary layer air and snow pack at Alert support this
mechanism. In addition to reaction (R2), other recycling
mechanisms of bromine oxide (BrO) into Br have been
proposed, in particular, the oxidation of the bromide ion
(Br�) by such compounds as (hydroxyl bromide) HOBr
on aerosols (Fan and Jacob, 1992) and the snow pack
(Tang and McConnell, 1996) which would lead to a
‘‘bromine explosion’’ (Platt and Lehrer, 1997)
BrOþHO2-HOBrg; ðR3Þ
HOBrg-HOBraq; ðR4Þ
HOBraqþBr�þHþ-Br2aqþH2O; ðR5Þ
Br2aq-Br2g: ðR6Þ
While the basic features of the O3 destruction
mechanism seem well understood, several puzzling
questions remain unresolved. Firstly, while the bromine
explosion mechanism can explain the presence of
sufficient Br atoms to rapidly destroy O3, what starts
the process in the first place remains unclear. Tang and
McConnell (1996) showed that among other possibi-
lities, photolysis of CHBr3 could provide an adequate
bromine ‘‘seed’’. Michalowski et al. (2000) suggested
that the reaction O3+Br�-BrO�+O2 might be ade-
quate. Other possibilities have also been proposed
(Finlayson-Pitts et al., 1990; McConnell et al., 1992;
Mozurkewich, 1995). Secondly, it remains to be
answered why the O3 destruction is only observed in
the spring after the polar night, but not during the fall.
Thirdly, since sea-salt bromide should be abundantly
available all over the snow-covered Arctic, and yet O3 is
not ubiquitously absent throughout the atmospheric
boundary layer, the presence of sea-salt bromide
appears to be a necessary but not a sufficient condition
for O3 depletion to take place. It appears that the most
chemically severe and spatially extensive O3 depletion
episodes occur over the Arctic Ocean. In agreement with
this assertion, detailed meteorological analyses of O3depletion events at Alert suggest that air masses of
marine origin are the most likely to show reduced O3levels (Hopper and Hart, 1994; Hopper et al., 1998).
Questions also remain concerning the vertical extent of
the atmospheric layer impacted by O3 depletion.
Previous work (Mickle et al., 1989; Anlauf et al., 1994;
Gong et al., 1997) near Alert showed the O3 depletion to
occur in an atmospheric layer extending from the
surface to 300–400m. However, O3 depletion episodes,
reported for the Norwegian Arctic (Solberg et al., 1996),
impacted atmospheric columns reaching the 2-km level.
Specific to the conditions at Alert, earlier investigations
suggested that O3 depletion was largely controlled by a
meteorological modulation effect. Changing air masses
with or without O3 appeared to largely dictate the
observed O3 temporal patterns (Bottenheim et al., 1990;
Barrie and Platt, 1997). However, in a recent study by
Boudries and Bottenheim (2000), it was argued that
locally occurring O3 depletion (meaning over the snow-
covered land surface adjacent to the Arctic Ocean)
should not be precluded.
This paper presents new O3 data obtained at Alert
during the ALERT2000 field campaign to investigate the
vertical and temporal characteristics of ozone during the
winter and spring. One goal of this research is to
demonstrate that O3 removal processes in the Arctic
boundary layer can occur at regional and local scales.
We focus on O3 sonde measurements that were made
from early February to early May 2000. These data
allow us to obtain an overall assessment of the extent of
the O3 depletions in the boundary layer at Alert, before,
during, and after the change from the 24-h dark period
to 24-h sunlight interval. We combine the O3 sonde data
set with surface O3 data and other chemical observa-
tions, as well as upper-air and surface meteorological
observations to investigate the links between atmo-
spheric thermodynamics and the chemical characteristics
of O3 depletion at Alert.
2. Measurement protocols
The O3 profile data reported here were obtained by
the addition of an electrochemical cell (ECC) ozone-
sonde package to the regular meteorological radio-
sondes flown twice a day by the weather observer
stationed at Alert. Alert is one of several stations where
the Meteorological Service of Canada (MSC) carries out
weekly soundings of the atmosphere using balloon-
borne ECC ozonesondes. At Alert, sondes have been
flown since December 1987. The routine program has
frequently been intensified during the winter months to
study O3 loss in the stratosphere (e.g. Kerr et al., 1993;
Fioletov et al., 1997). For the period of interest here,
ARTICLE IN PRESS
1
3
5
7
9
11
13
15
17
19
21
23
25
27
29
31
33
35
37
39
41
43
45
47
49
51
53
55
57
59
61
63
65
67
69
71
73
75
77
79
81
83
85
87
89
91
93
95
97
99
101
103
105
107
109
111
J.W. Bottenheim et al. / Atmospheric Environment ] (]]]]) ]]]–]]]2
AEA : 3825

UNCORRECTED PROOF
data are available for a minimum of one flight every
other day during February and most of March, and two
flights a day for the 17 April–8 May period. Sondes were
prepared according to standard procedures (Komhyr,
1986) that are known to produce excellent results with
typical accuracy in the troposphere of75% (Smit et al.,1996). One addition to the routine procedure was the
attachment of an inverted parachute to the balloon
package in order to slow down the ascent rate of the
balloon over the first few kilometers and hence increase
the data density, a procedure developed by S. Oltmans
(personal communication to J. Davies, 2000). The
resulting ascent rate was on average 4m s�1 in the lower
troposphere, and the data were archived at 10 s intervals.
All ozonesonde data have been deposited in, and are
available from the World Ozone and Ultraviolet
Radiation Data Centre, Meteorological Service of
Canada, Environment Canada (http://www.msc-
smc.ec.gc.ca/woudc/). Further details on the Canadian
ozone sounding program can be found in Tarasick et al.
(1995).
The surface O3 data presented here are from the
ongoing measurement program at the Baseline station
Alert, which forms part of the Global Atmospheric
Watch (GAW) network of the World Meteorological
Organization (WMO) (AES, 1999). These data are
obtained from two parallel ozone monitors (model 49,
Thermo Environmental Instruments Inc., Franklin,
MA), which are based on UV absorption (Anlauf et al.,
1994). These instruments are calibrated twice yearly with
a standard traceable to the O3 standard maintained by
the National Institute of Standards and Technology
(NIST) in Washington, DC. Instrument zero and spans
are routinely determined on alternate days by auto-
mated procedures in the field. The data are archived as
5-min averages.
Surface meteorological data presented here are from
the routine measurement program at the GAW station
(AES, 1999) with the exception of the total global
radiation data, which were obtained from the Climate
Archives of the MSC. Further details about the
prevailing synoptic weather patters during ALERT2000
are provided elsewhere (Strong et al., 2001).
3. Results and discussion
Fig. 1 shows the temporal distribution (contours) for
the O3 vertical profile extending from the surface to
4000m. Also shown, for the same period, are the
surface-based O3 measurements from the GAW station.
In Fig. 2, for the corresponding period, we present the
ARTICLE IN PRESS
1
3
5
7
9
11
13
15
17
19
21
23
25
27
29
31
33
35
37
39
41
43
45
47
49
51
53
55
57
59
61
63
65
67
69
71
73
75
77
79
81
83
85
87
89
91
93
95
97
99
101
103
105
107
109
111
Panel A: Ozone contour plot from sonde data
Color code
nM.M-1
He
igh
t, m
0
1000
2000
3000
40000
5
10
15
20
25
30
35
40
45
50
55
60
Panel B: Surface ozone data from GAW station
01-Feb 15-Feb 29-Feb 14-Mar 28-Mar 11-Apr 25-Apr 09-May
Mo
le f
racti
on
, n
M.M
-1
0
10
20
30
40
50
Fig. 1. Ozone mole fractions during winter and spring 2000 at Alert. Panel A: ozone contours for the lower 4 km of the troposphere.
Color-coding as shown next to the figure (in nmolmol�1). The contours were drawn from one sonde per two days in February and
March, and two sondes per day from 17 April to 10 May. Panel B: surface ozone (in nmolmol�1) observed at the Alert Baseline
observatory. The time axis is identical for both panels, but due to the sparse sonde data set a perfect agreement between the lowest data
point in panel A, and the surface measurements in panel B should not be expected.
J.W. Bottenheim et al. / Atmospheric Environment ] (]]]]) ]]]–]]] 3
AEA : 3825
UNCORRECTED PROOF
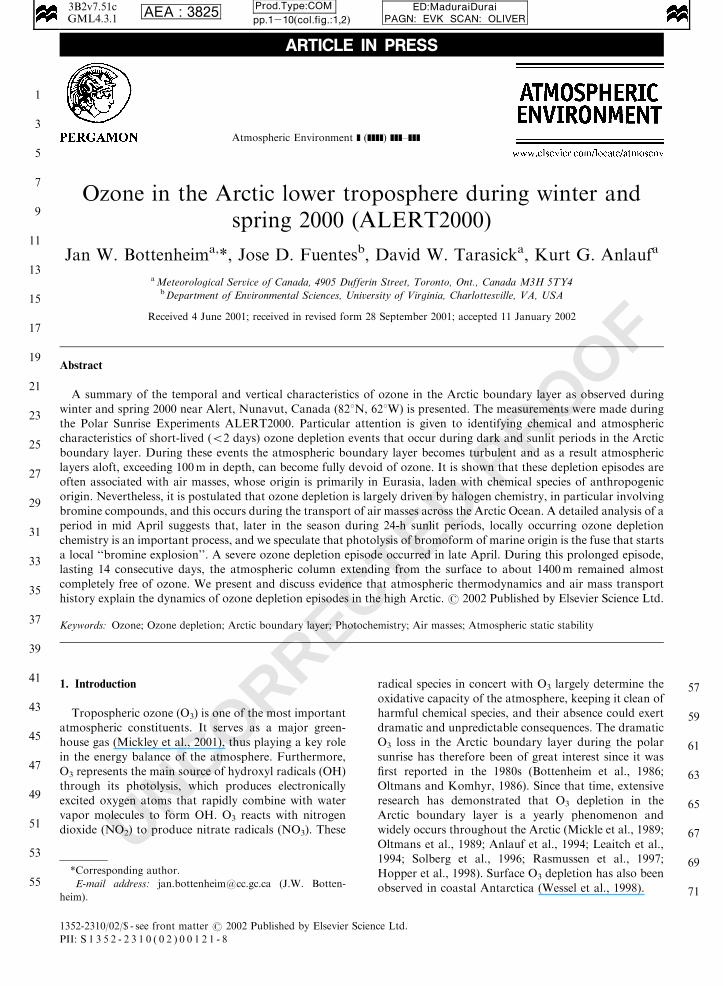
contours of potential temperature and the total, incom-
ing global radiation to indicate the availability of solar
radiation during the measurement period. Some features
are immediately apparent from these data.
For almost the whole period, the atmospheric layer
extending from the surface up to 1500m remained
largely statically stable as evidenced by the decline of the
potential temperature field with altitude (Fig. 2). These
strong stable atmospheric conditions were more pro-
nounced during the dark periods and resulted from the
more effective radiational cooling of the lower atmo-
sphere. The O3 signature showed complex features and
positive gradients (O3 increasing with altitude) in this
stable boundary layer, also for the periods before sunrise
as shown by the radiation data (Fig. 2). These positive
O3 gradients can be explained in terms of two key
processes. First, under strong atmospheric stable condi-
tions, very little vertical mixing occurred to transport O3from aloft to the surface. Second, increases of O3 with
altitude suggest a sink mechanism at the surface-
atmosphere interface, taking place during the dark
period. While such a profile would be expected over
most terrestrial surfaces, surface O3 loss over snow- and/
or ice-covered areas was until recently believed to be an
ineffective sink process (Landenberg and Schurath,
1999; Wesely and Hicks, 2000) and hence, if anything,
a slight negative gradient might be expected. However,
recent observations at Summit, Greenland (Peterson and
Honrath, 2001), and during ALERT2000 (Albert et al.,
2001) demand a reassessment of the assumption that O3is stable over snow. Hence, the observed gradient in the
lower boundary layer at Alert may reflect this efficient
surface loss of O3, occurring under the influence of
statically stable atmospheric conditions (see Fig. 2)
A second feature, best observed from the surface
record, but not limited to the surface, is the frequent
occurrence of pockets of air that appear to be partially
depleted of O3. During early spring, O3 levels mostly
exhibited an invariant temporal signature with average
O3 mole fractions between 30 and 45 nmolmol�1
(Fig. 1), but these nearly invariant O3 levels were
occasionally punctuated by sudden but short-lived
ARTICLE IN PRESS
1
3
5
7
9
11
13
15
17
19
21
23
25
27
29
31
33
35
37
39
41
43
45
47
49
51
53
55
57
59
61
63
65
67
69
71
73
75
77
79
81
83
85
87
89
91
93
95
97
99
101
103
105
107
109
111
Color code, K
He
igh
t, m
0
1000
2000
3000
4000
Panel A: Potential temperature contour plot from sonde data
240
245
250
255
260
265
270
275
280
01-Feb 15-Feb 29-Feb 14-Mar 28-Mar 11-Apr 25-Apr 09-May
Panel B: Incoming total solar radiation
W.m
-2
0
100
200
300
400
500
600
Color code, K
He
igh
t, m
0
1000
2000
3000
4000
Panel A: Potential temperature contour plot from sonde data
240
245
250
255
260
265
270
275
280
01-Feb 15-Feb 29-Feb 14-Mar 28-Mar 11-Apr 25-Apr 09-May
Panel B: Incoming total solar radiation
W.m
-2
0
100
200
300
400
500
600
Fig. 2. Panel A: contours of potential temperature (in K) during winter and spring 2000 at Alert for the lower 4 km of the troposphere.
Color coding as shown next to the figure (in K). The contours were drawn from one sonde per two days in February and March, and
two sondes per day from 17 April to 10 May. Panel B: total incoming global radiation (in kWm�2) measured at the climate station
Alert. As in Fig. 1 the time axis is identical for both panels.
J.W. Bottenheim et al. / Atmospheric Environment ] (]]]]) ]]]–]]]4
AEA : 3825
UNCORRECTED PROOF
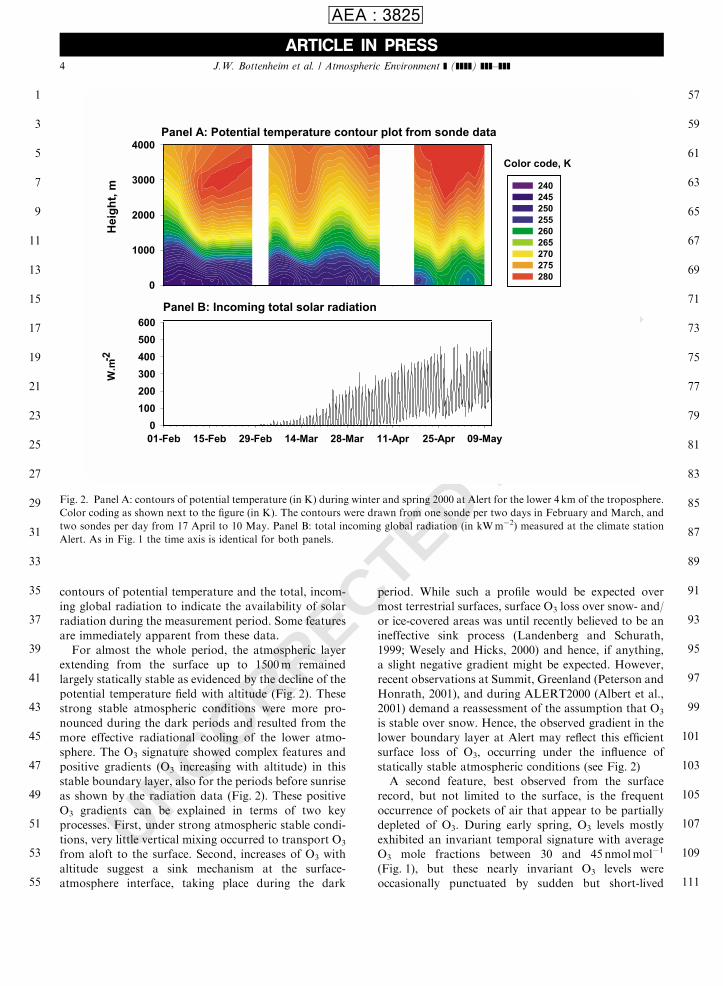
declines in the O3 signature. At Alert, it has been known
for some time that sudden surface O3 declines in the
magnitude of 10–20 nmolmol�1 could be observed as
early as mid to late February when no direct sunlight is
present (Barrie and Bottenheim, 1991). As an example,
Fig. 3 shows a case when little or no O3 variation is
expected a priori due to the absence of sunlight until
early March. The sudden and substantial O3 decrease
(Fig. 3) coincided with an increases in reactive nitrogen
(NOy), black carbon (BC), and carbon monoxide (CO),
thus providing evidence to support the notion that the
episode was the result of a polluted air mass transported
to the region from long distances. Worthy et al. (1994)
have shown that until about April, transport of air
masses that bear such an anthropogenic signature is
generally fast, and originates in Eurasia. One explana-
tion for the partial depletion could therefore be a
memory effect of O3 titration by NO at the source.
Similar observations and arguments have recently been
made concerning surface O3 data from Barrow, Alaska
(Oltmans et al., 2001). However, Fig. 3 also indicates
that the O3 depletion is well matched with a concurrent
loss in gaseous Hg and extensive loss of Hg is not
observed in anthropogenically polluted air. Schroeder
et al. (1998) proposed that the halogen chemistry, which
is usually held responsible for O3 depletion, concomi-
tantly causes Hg depletion. Hence, it seems more likely
that most O3 depletions early in the year are also the
result of bromine-induced reactions. One possible
scenario that emerges from the data in Fig. 3 is as
follows: Air polluted masses emanating in Eurasia are
rapidly transported to Alert. Before reaching the high
Arctic and ultimately Alert, these air masses traverse
Arctic Ocean regions, north of Siberia where sunlight is
available as well as sea salt to produce conditions
conducive to O3 and Hg depletion. We note that the
event described in Fig. 3 coincided with an increase in
molecular Br2, which led Spicer et al. (2001) to speculate
that local Br-driven chemistry cannot be excluded as
well. Sumner et al. (2001) present a similar case study
from observations made in March 1998 and derive
implications for the atmospheric formaldehyde abun-
dance in the Arctic.
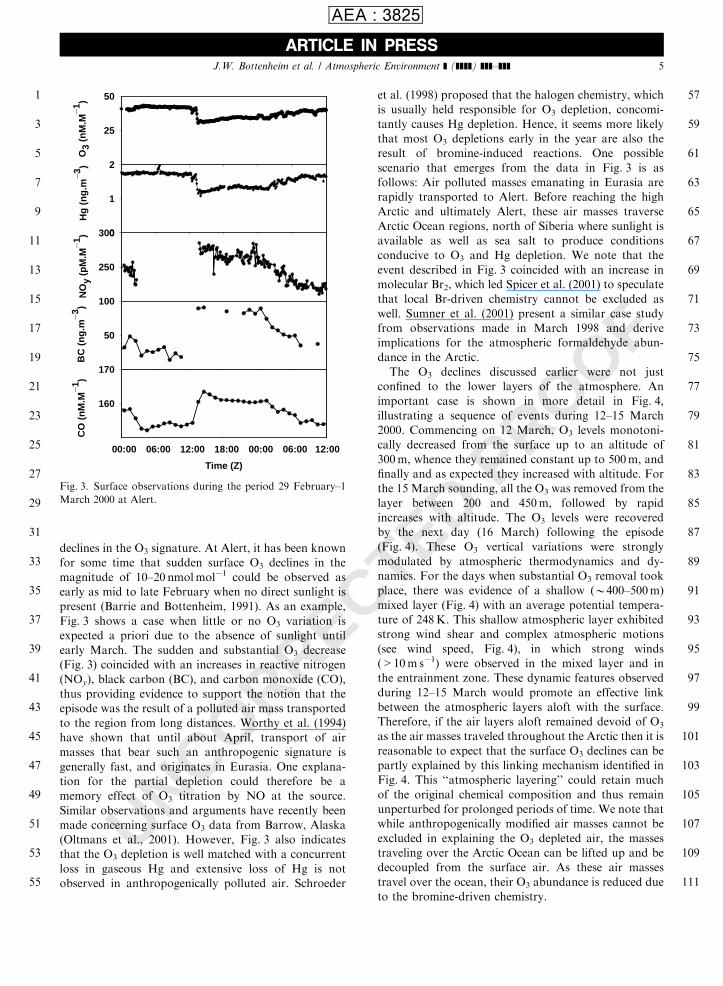
The O3 declines discussed earlier were not just
confined to the lower layers of the atmosphere. An
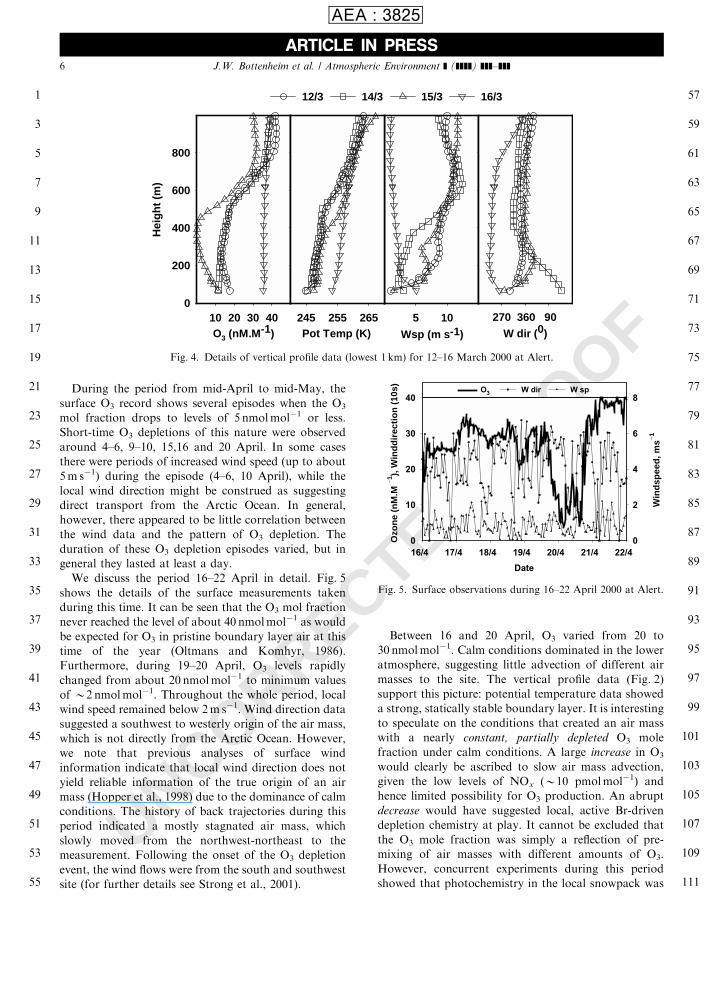
important case is shown in more detail in Fig. 4,
illustrating a sequence of events during 12–15 March
2000. Commencing on 12 March, O3 levels monotoni-
cally decreased from the surface up to an altitude of
300m, whence they remained constant up to 500m, and
finally and as expected they increased with altitude. For
the 15 March sounding, all the O3 was removed from the
layer between 200 and 450m, followed by rapid
increases with altitude. The O3 levels were recovered
by the next day (16 March) following the episode
(Fig. 4). These O3 vertical variations were strongly
modulated by atmospheric thermodynamics and dy-
namics. For the days when substantial O3 removal took
place, there was evidence of a shallow (B400–500m)mixed layer (Fig. 4) with an average potential tempera-
ture of 248K. This shallow atmospheric layer exhibited
strong wind shear and complex atmospheric motions
(see wind speed, Fig. 4), in which strong winds
(>10m s�1) were observed in the mixed layer and in
the entrainment zone. These dynamic features observed
during 12–15 March would promote an effective link
between the atmospheric layers aloft with the surface.
Therefore, if the air layers aloft remained devoid of O3as the air masses traveled throughout the Arctic then it is
reasonable to expect that the surface O3 declines can be
partly explained by this linking mechanism identified in
Fig. 4. This ‘‘atmospheric layering’’ could retain much
of the original chemical composition and thus remain
unperturbed for prolonged periods of time. We note that
while anthropogenically modified air masses cannot be
excluded in explaining the O3 depleted air, the masses
traveling over the Arctic Ocean can be lifted up and be
decoupled from the surface air. As these air masses
travel over the ocean, their O3 abundance is reduced due
to the bromine-driven chemistry.
ARTICLE IN PRESS
1
3
5
7
9
11
13
15
17
19
21
23
25
27
29
31
33
35
37
39
41
43
45
47
49
51
53
55
57
59
61
63
65
67
69
71
73
75
77
79
81
83
85
87
89
91
93
95
97
99
101
103
105
107
109
111
250
3000
1
2
Time (Z)
00:00 06:00 12:00 18:00 00:00 06:00 12:00
160
170
50
100
25
50
CO
(n
M.M
_ 1)
BC
(n
g.m
_ 3)
NO
y (p
M.M
_ 1)
Hg
(n
g.m
_ 3)
O3
(nM
.M_ 1
)
Fig. 3. Surface observations during the period 29 February–1
March 2000 at Alert.
J.W. Bottenheim et al. / Atmospheric Environment ] (]]]]) ]]]–]]] 5
AEA : 3825
UNCORRECTED PROOF
During the period from mid-April to mid-May, the
surface O3 record shows several episodes when the O3mol fraction drops to levels of 5 nmolmol�1 or less.
Short-time O3 depletions of this nature were observed
around 4–6, 9–10, 15,16 and 20 April. In some cases
there were periods of increased wind speed (up to about
5m s�1) during the episode (4–6, 10 April), while the
local wind direction might be construed as suggesting
direct transport from the Arctic Ocean. In general,
however, there appeared to be little correlation between
the wind data and the pattern of O3 depletion. The
duration of these O3 depletion episodes varied, but in
general they lasted at least a day.
We discuss the period 16–22 April in detail. Fig. 5
shows the details of the surface measurements taken
during this time. It can be seen that the O3 mol fraction
never reached the level of about 40 nmolmol�1 as would
be expected for O3 in pristine boundary layer air at this
time of the year (Oltmans and Komhyr, 1986).
Furthermore, during 19–20 April, O3 levels rapidly
changed from about 20 nmolmol�1 to minimum values
of B2 nmolmol�1. Throughout the whole period, localwind speed remained below 2m s�1. Wind direction data
suggested a southwest to westerly origin of the air mass,
which is not directly from the Arctic Ocean. However,
we note that previous analyses of surface wind
information indicate that local wind direction does not
yield reliable information of the true origin of an air
mass (Hopper et al., 1998) due to the dominance of calm
conditions. The history of back trajectories during this
period indicated a mostly stagnated air mass, which
slowly moved from the northwest-northeast to the
measurement. Following the onset of the O3 depletion
event, the wind flows were from the south and southwest
site (for further details see Strong et al., 2001).
Between 16 and 20 April, O3 varied from 20 to
30 nmolmol�1. Calm conditions dominated in the lower
atmosphere, suggesting little advection of different air
masses to the site. The vertical profile data (Fig. 2)
support this picture: potential temperature data showed
a strong, statically stable boundary layer. It is interesting
to speculate on the conditions that created an air mass
with a nearly constant, partially depleted O3 mole
fraction under calm conditions. A large increase in O3would clearly be ascribed to slow air mass advection,
given the low levels of NOx (B10 pmolmol�1) and
hence limited possibility for O3 production. An abrupt
decrease would have suggested local, active Br-driven
depletion chemistry at play. It cannot be excluded that
the O3 mole fraction was simply a reflection of pre-
mixing of air masses with different amounts of O3.
However, concurrent experiments during this period
showed that photochemistry in the local snowpack was
ARTICLE IN PRESS
1
3
5
7
9
11
13
15
17
19
21
23
25
27
29
31
33
35
37
39
41
43
45
47
49
51
53
55
57
59
61
63
65
67
69
71
73
75
77
79
81
83
85
87
89
91
93
95
97
99
101
103
105
107
109
111
Date
16/4 17/4 18/4 19/4 20/4 21/4 22/4
0
10
20
30
40
0
2
4
6
8W dir W spO3
Ozo
ne
(nM
.M _ 1 ),
Win
dd
irec
tio
n (
10s)
Win
dsp
eed
, ms_ 1
Fig. 5. Surface observations during 16–22 April 2000 at Alert.
O3 (nM.M-1)10 20 30 40
Hei
gh
t (m
)
0
200
400
600
800
Wsp (m s-1)
5 10Pot Temp (K)
245 255 265W dir (0)
270 360 450
12/3 14/3 15/3 16/3
90270 360 90
Fig. 4. Details of vertical profile data (lowest 1 km) for 12–16 March 2000 at Alert.
J.W. Bottenheim et al. / Atmospheric Environment ] (]]]]) ]]]–]]]6
AEA : 3825
UNCORRECTED PROOF
active and produced HOx radical precursors such as
HCHO and HONO that were observed in the air mass
from which the surface O3 measurements were made
(Sumner et al., 2001; Zhou et al., 2001). Hence, active
chemistry must have been taking place. We postulate
that the air was in a steady-state condition where the O3mole fraction was determined by slow advection of O3-
rich air (trajectory data suggest an origin to the
southwest as mentioned above, and such air is known
to be free tropospheric air descending to the surface due
to katabatic flow from the mountain ranges to the
southwest of the Alert site), offset by a combination of
ozone loss in the surface layer due to deposition to the
snow pack (Albert et al., 2001) and local BrOx-driven
depletion chemistry.
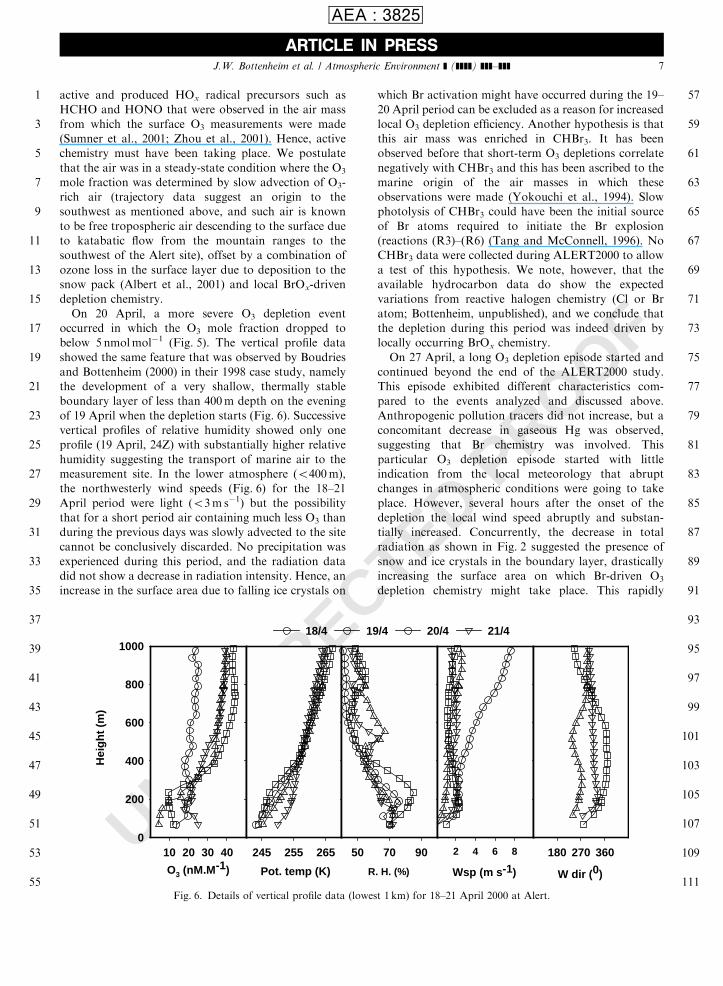
On 20 April, a more severe O3 depletion event
occurred in which the O3 mole fraction dropped to
below 5 nmolmol�1 (Fig. 5). The vertical profile data
showed the same feature that was observed by Boudries
and Bottenheim (2000) in their 1998 case study, namely
the development of a very shallow, thermally stable
boundary layer of less than 400m depth on the evening
of 19 April when the depletion starts (Fig. 6). Successive
vertical profiles of relative humidity showed only one
profile (19 April, 24Z) with substantially higher relative
humidity suggesting the transport of marine air to the
measurement site. In the lower atmosphere (o400m),the northwesterly wind speeds (Fig. 6) for the 18–21
April period were light (o3m s�1) but the possibilitythat for a short period air containing much less O3 than
during the previous days was slowly advected to the site
cannot be conclusively discarded. No precipitation was
experienced during this period, and the radiation data
did not show a decrease in radiation intensity. Hence, an
increase in the surface area due to falling ice crystals on
which Br activation might have occurred during the 19–
20 April period can be excluded as a reason for increased
local O3 depletion efficiency. Another hypothesis is that
this air mass was enriched in CHBr3. It has been
observed before that short-term O3 depletions correlate
negatively with CHBr3 and this has been ascribed to the
marine origin of the air masses in which these
observations were made (Yokouchi et al., 1994). Slow
photolysis of CHBr3 could have been the initial source
of Br atoms required to initiate the Br explosion
(reactions (R3)–(R6) (Tang and McConnell, 1996). No
CHBr3 data were collected during ALERT2000 to allow
a test of this hypothesis. We note, however, that the
available hydrocarbon data do show the expected
variations from reactive halogen chemistry (Cl or Br
atom; Bottenheim, unpublished), and we conclude that
the depletion during this period was indeed driven by
locally occurring BrOx chemistry.
On 27 April, a long O3 depletion episode started and
continued beyond the end of the ALERT2000 study.
This episode exhibited different characteristics com-
pared to the events analyzed and discussed above.
Anthropogenic pollution tracers did not increase, but a
concomitant decrease in gaseous Hg was observed,
suggesting that Br chemistry was involved. This
particular O3 depletion episode started with little
indication from the local meteorology that abrupt
changes in atmospheric conditions were going to take
place. However, several hours after the onset of the
depletion the local wind speed abruptly and substan-
tially increased. Concurrently, the decrease in total
radiation as shown in Fig. 2 suggested the presence of
snow and ice crystals in the boundary layer, drastically
increasing the surface area on which Br-driven O3depletion chemistry might take place. This rapidly
ARTICLE IN PRESS
1
3
5
7
9
11
13
15
17
19
21
23
25
27
29
31
33
35
37
39
41
43
45
47
49
51
53
55
57
59
61
63
65
67
69
71
73
75
77
79
81
83
85
87
89
91
93
95
97
99
101
103
105
107
109
111O3 (nM.M-1)
10 20 30 40
Hei
gh
t (m
)
0
200
400
600
800
1000
Pot. temp (K)
245 255 265
R. H. (%)
50 70 90
Wsp (m s-1)
2 4 6 8
W dir (0)
180 270 360
18/4 19/4 20/4 21/4
Fig. 6. Details of vertical profile data (lowest 1 km) for 18–21 April 2000 at Alert.
J.W. Bottenheim et al. / Atmospheric Environment ] (]]]]) ]]]–]]] 7
AEA : 3825

UNCORRECTED PROOF
moving air mass brought air from the northwest Arctic
Ocean to the experimental sites. Highly variable air
motions persisted at the study sites for the two days
following the onset of the O3 depletion episode. The
vertical profile data showed that the atmospheric layer
rapidly became impacted by almost complete O3removal extending from the surface to an altitude of
1400m. Before the O3 depletion event, this atmospheric
layer remained under the influence of strong static
stability regimes. Following the onset of the episode, this
atmospheric layer experienced adiabatic conditions
followed by strong stability regimes (Fig. 7). This
episode lasted a period of more than two weeks with
little to no O3 being observed at the surface (Fig. 1). We
consider this O3 depletion episode to be a typical case of
an O3–devoid air mass which was advected to the region,
exhibiting similar traits as the ones often observed at Ny(Alesund (Solberg et al., 1996). The O3 data obtained at
the Ice Camp on towers (Steffen et al., 2001) and at the
GAW site suggested that during the two days when wind
speed was high (>5m s�1) the whole Alert region
including the plateau right up to the mountain range
beyond the experimental sites (ca. 40 km from the coast)
became totally devoid of O3. After the passage of the
fast-moving air masses, the lower 1500m of the atmo-
sphere came under the influence of strong statically
stable conditions which effectively inhibited vertical
mixing and transport of O3 from aloft to the surface
(Fig. 7). Supporting evidence for this pattern can be seen
in the vertical profile data of Fig. 1: the depth of the
depleted layer decreased with time, but air with an O3mole fraction normal for this time of year
(B40 nmolmol�1 and up) never reached the surface
until after the termination of the O3 sonde program on 8
May.
4. Summary and conclusions
The vertical and temporal O3 distribution presented in
this study illustrates complex dynamics of O3 patterns in
the Arctic boundary layer at Alert. The results obtained
as part of the ALERT2000 field campaign showed that
the Arctic boundary layer is always partly depleted of
O3. The recent understanding of the effective O3chemical sink in the snowpack may partly explain this
feature. In addition, frequently more severe O3 depletion
events of short duration were observed. As other
investigations previously reported, these short-lived
episodes can occur as early as February when the Sun
does not rise above the horizon. The magnitude of O3depletion increases with season as mole fractions do not
reach the 5 nmolmol�1 level until April when sufficient
actinic irradiance levels exist to drive local photochem-
istry in both snow pack and overlying atmosphere.
Early spring episodes are associated with fast-moving
air masses whose origins are mostly in southern regions
such as the Eurasian continent. These air masses exhibit
elevated concentrations of anthropogenic compounds
that might suggest titration of O3 by NO in the source
regions. However, the concomitant depletion of gaseous
Hg with O3 provides evidence that Br chemistry may
play a significant role in the depletion process. Rapid
transport, followed by strong air mass stagnation in the
stably stratified lower troposphere, provides the ideal
conditions to keep such air masses coherent. Such a
scenario would also suggest that pockets of O3-depleted
air should be observed above the surface, and these have
indeed been identified.
The more severe episodes later in the season are
postulated to be due to a balancing of several factors.
Prolonged O3 depletion episodes are most likely due to
similar advection of air masses that have been exposed
to depleting conditions for much longer periods of time
and more active chemistry (24 h sunlight of much greater
intensity than earlier in the season). However, there are
numerous periods of moderate to severe O3 depletion
that are difficult to understand in this light since there is
no clear indication of rapid transport (wind speeds less
than 2m s�1 and no clear indication of change in
weather patterns). We postulate that these episodes
represent a steady-state condition where slow advection
of O3-rich air is concurrently depleted in O3 due to
surface loss and local Br-atom chemistry. This steady
state can be shifted to short periods of almost total O3depletion if the advected air has a more marine
signature. Even if this is the case, it is not clear what
specific feature of such air masses enhances the observed
O3 behavior (Hopper and Hart, 1994). We speculate that
ARTICLE IN PRESS
1
3
5
7
9
11
13
15
17
19
21
23
25
27
29
31
33
35
37
39
41
43
45
47
49
51
53
55
57
59
61
63
65
67
69
71
73
75
77
79
81
83
85
87
89
91
93
95
97
99
101
103
105
107
109
111
April 20, 23Z
O3 (nM.M-1)0 10 20 30 40 50
Hei
gh
t (m
)
250
500
750
1000
1250
1500
1750
Θ (K)
245 255 265 275
April 27, 23Z
O3 (nM.M-1)0 10 20 30 40 50
Θ (K)
245 255 265 275
ΘO3
ΘO3
Fig. 7. Comparison of ozone and potential temperature during
two ozone depletions at Alert.
J.W. Bottenheim et al. / Atmospheric Environment ] (]]]]) ]]]–]]]8
AEA : 3825

UNCORRECTED PROOF
the presence of CHBr3 may be the answer. While not
measured in 2000, it is known that an increase in CHBr3is normally observed during O3 depletions and its
photolysis might produce sufficient Br atoms to start
the bromine explosion mechanism. Interestingly, if this
mechanism is in fact active, then it may explain why O3depletions are only occurring in the spring and not in the
fall: the seasonal pattern of CHBr3 shows a maximum in
the winter (Cicerone et al., 1988).
5. Uncited References
Boudries, 2001; Grannas, 2001.
Acknowledgements
The authors wish to thank Paul Shepson (Purdue
University) for many stimulating discussions, John
McIver and John Kivisto (MSC-Alert) for their excellent
job in handling the ozone sonde flights, Jonathan Davies
for quality assurance and quality control of the sonde
data, Sandy Steffen (Hg), Doug Worthy (CO), Sangeeta
Sharma (black carbon), Lori Leeder (GAW station
meteorology), and Harold Beine (NOy) for providing us
with data used in Figs. 3 and 5, and the personnel at
CFS Alert for general logistical support. Above all, we
thank Alan Gallant without whose tireless efforts
ALERT2000 would never have taken place. JDF
acknowledges support from the National Science
Foundation (Grant No. OPP-0000173) to participate
in the ALERT2000 project.
References
AES, 1999. Canadian Baseline Program, Summary of Progress
to 1998. Atmospheric Environment Service, Toronto,
Environment Canada.
Albert, M., Shepson, P., Bottenheim, J., 2001. Atmospheric
Environment, this issue.
Anlauf, K.G., Mickle, R.E., Trivett, N.B.A., 1994. Measure-
ment of ozone during Polar Sunrise Experiment 1992.
Journal of Geophysical Research 99D (12), 25345–25354.
Barrie, L.A., Bottenheim, J.W., 1991. Sulphur and nitrogen
pollution in the Arctic atmosphere. In: Sturges, W.T. (Ed.),
Pollution of the Arctic Atmosphere. Elsevier Press, Am-
sterdam, pp. 155–184.
Barrie, L.A., Platt, U., 1997. Arctic tropospheric chemistry: an
overview. Tellus 49B, 450–454.
Barrie, L.A., Bottenheim, J.W., Rasmussen, R.A., Schnell,
R.C., Crutzen, P.J., 1988. Ozone destruction and photo-
chemical reactions at polar sunrise in the lower Arctic
troposphere. Nature 334, 138–141.
Bottenheim, J.W., Barrie, L.A., Atlas, E., Heidt, L.E., Niki, H.,
Rasmussen, R.A., Shepson, P.B., 1990. Depletion of lower
tropospheric ozone during Arctic spring: the polar sunrise
experiment 1988. Journal of Geophysical Research 95, 101–
127.
Bottenheim, J.W., Gallant, A.G., Brice, K.A., 1986. Measure-
ments of NOy species and O3 at 821 N latitude. Geophysical
Research Letters 13, 113–116.
Boudries, H., Bottenheim, J.W., 2000. Cl and Br atom
concentrations during a surface boundary layer ozone
depletion event in the Canadian high Arctic. Geophysical
Research Letters 27 (4), 517–520.
Boudries, H., et al., 2001. Distribution and trends of
oxygenated hydrocarbons in the high Arctic derived from
measurements in the atmospheric boundary layer and
interstitial snow air during he ALERT2000 field campaign.
Atmospheric Environment, this issue.
Cicerone, R.J., Heidt, L.E., Pollock, W.H., 1988. Measure-
ments of atmospheric methyl bromide (CH3Br) and bromo-
form (CHBr3). Journal of Geophysical Research 93, 3745–
3749.
Fan, S.-M., Jacob, D.J., 1992. Surface ozone depletion in the
Arctic spring sustained by bromine reactions on aerosols.
Nature 359, 522–524.
Finlayson-Pitts, B.J., Livingstone, F.E., Berko, H.N., 1990.
Ozone destruction and bromine photochemistry at ground
level in the arctic spring. Nature 343, 622–625.
Fioletov, V.E., Kerr, J.B., Wardle, D.I., Davies, J., Hare, E.W.,
McElroy, C.T., Tarasick, D.W., 1997. Long-term decline of
ozone over the Canadian Arctic to early 1997 from ground-
based and balloon sonde measurements. Geophysical
Research Letters (24), 2705–2708.
Foster, K.L., Plastridge, R.A., Bottenheim, J.W., Shepson,
P.B., Finlayson-Pitts, B.J., Spicer, C.W., 2001. The role of
Br2 and BrCl in surface ozone destruction at polar sunrise.
Science 291, 471–474.
Gong, S.L., Walmsley, J.L., Barrie, L.A., Hopper, J.F., 1997.
Mechanisms for surface ozone depletion and recovery
during polar sunrise. Atmospheric Environment 31 (7),
969–981.
Grannas, A.M., et al., 2001. Carbonyl compounds and surface
photochemistry in the Arctic marine boundary layer.
Atmospheric Environment, this issue.
Hopper, J.F., Hart, W., 1994. Meteorological aspects of the
1992 Polar Sunrise Experiment. Journal of Geophysical
Research 99D, 25315–25328.
Hopper, J.F., Barrie, L.A., Silis, A., Gallant, A.J., Hart, W.,
Dryfhout, H., 1998. Ozone and meteorology during the
1994 Polar Sunrise Experiment. Journal of Geophysical
Research 103D (1), 1481–1492.
Kerr, J.B., Wardle, D.I., Tarasick, D.W., 1993. Record low
ozone values over Canada in early 1993. Geophysical
Research Letters (20), 1979–1982.
Komhyr, W.D., 1986. Operations Handbook—Ozone Mea-
surements to 40-km Altitude with Model 4A Electrochemi-
cal Concentration Cell (ECC) Ozonesondes (Used with
1680-MHz Radiosondes). Technical Memorandum ERL
ARL-149, National Oceanic and Atmospheric Administra-
tion, Boulder, CO.
Landenberg, S., Schurath, U., 1999. Ozone destruction on ice.
Geophysical Research Letters 26, 1695–1698.
Leaitch, W.R., Barrie, L.A., Bottenheim, J.W., Li, S.M.,
Shepson, P.B., Muthuramu, P.B., Yokouchi, Y., 1994.
ARTICLE IN PRESS
1
3
5
7
9
11
13
15
17
19
21
23
25
27
29
31
33
35
37
39
41
43
45
47
49
51
53
55
57
59
61
63
65
67
69
71
73
75
77
79
81
83
85
87
89
91
93
95
97
99
101
103
105
107
109
111
J.W. Bottenheim et al. / Atmospheric Environment ] (]]]]) ]]]–]]] 9
AEA : 3825

UNCORRECTED PROOF
Airborne observations related to ozone depletion at polar
sunrise. Journal of Geophysical Research 99D, 25449–
25517.
McConnell, J.C., Henderson, G.S., Barrie, L.A., Bottenheim,
J.W., Niki, H., Langford, C.H., Templeton, E.M.J., 1992.
Photochemical bromine production implicated in Arctic
boundary-layer ozone depletion. Nature 355, 150–152.
Michalowski, B.A., Francisco, J.S., Li, S.M., Barrie, L.A.,
Bottenheim, J.W., Shepson, P.B., 2000. A computer model
study of multiphase chemistry in the Arctic boundary layer
during polar sunrise. Journal of Geophysical Research 105,
15131–15145.
Mickle, R.E., Bottenheim, J.W., Leaitch, W.R., Evans, W.,
1989. Boundary layer ozone depletion during AGASP-II.
Atmospheric Environment 23 (11), 2443–2449.
Mickley, L.J., Murti, P.P., Jacob, D.J., Logan, J.A., Koch,
D.M., Rind, D., 2001. Radiative forcing from tropospheric
ozone calculated with a unified chemistry-climate model.
Journal of Geophysical Research 104, 30153–30172.
Moortgat, G.K., Meller, R., Schneider, W., 1993. Temperature
dependence (256–296K) of the absorption cross sections of
bromoform in the wavelength range 285–360nm. In: Niki,
H., Becker, K.H. (Eds.), The Tropospheric Chemistry of
Ozone in the Polar Regions. Springer, New York, pp. 335–
369.
Mozurkewich, M., 1995. Mechanism for the release of halogens
from sea-salt particles by free radical reactions. Journal of
Geophysical Research 100, 14199–14207.
Oltmans, S.J., Komhyr, W.D.S, 1986. urface ozone distribu-
tions and variations from 1973–1984. Measurements at the
NOAA geophysical monitoring for climate change baseline
observatories. Journal of Geophysical Research 91, 5229–
5236.
Oltmans, S.J., et al., 1989. Seasonal surface ozone and filterable
bromine relationship in the high Arctic. Atmospheric
Environment 23 (11), 2431–2441.
Oltmans, S., et al., 2001. Evidence of O3 titration during BRW
winter dark periods. In: R.C. Schnell, D.B. King, R.M.
Rosson (Eds.), Climate Monitoring and Diagnostics La-
boratory Summary Report 25. US Department of Com-
merce, National Oceanic and Atmospheric Administration,
Boulder, CO, p. 86.
Peterson, M.C., Honrath, R.E., 2001. Observations of rapid
photochemical destruction of ozone in snowpack interstitial
air. Geophysical Research Letters 28, 511–514.
Platt, U., Lehrer, E., 1997. ARCTOC Tropospheric Ozone
Chemistry (ARCTOC). Final Report to the EU, Universit.at
Heidelberg.
Platt, U., Moortgat, G.K., 1999. Heterogeneous and homo-
genous chemistry of reactive halogen compounds in the
lower troposphere. Journal of Atmospheric Chemistry 34,
1–8.
Rasmussen, A., Kiilsholm, S., Sorensen, J.H., Mikkelsen, H.B.,
1997. Analysis of tropospheric ozone measurements in
Greenland. Tellus 49B, 510–521.
Schroeder, W.H., Anlauf, K.G., Barrie, L.A., Lu, J.Y., Steffen,
A., Schneeberger, D., Berg, T., 1998. Arctic springtime
depletion of mercury. Nature 394, 331–332.
Smit, H.G.J., et al., 1996. JOSIE: The 1996 WMO international
intercomparison of ozonesondes under quasi-flight condi-
tions in the environmental chamber at J .ulich. Atmospheric
Ozone: Quadrennial O3 Symp., lAquila, Italy.
Solberg, S., Schmidtbauer, N., Semb, A., Stordal, F., 1996.
Boundary-layer ozone depletion as seen in the Norwegian
Arctic in spring. Journal of Atmospheric Chemistry 23, 301–
332.
Spicer, C.W., Plastridge, R.A., Foster, K.L., Finlayson-Pitts,
B.J., Bottenheim, J.W., Grannas, A.M., Shepson, P.B.,
2001. Molecular halogens before and during ozone deple-
tion events in the Arctic at Polar Sunrise: concentrations
and sources. Atmospheric Environment, this issue.
Steffen, A., Schroeder, W., Bottenheim, J., Narayan, J.,
Fuentes, J.D., 2001. Atmospheric mercury concentrations:
measurements and profiles near snow and ice surfaces in the
Canadian Arctic during ALERT2000. Atmospheric Envir-
onment, this issue.
Strong, J.D., Fuentes, R.E.Davis, Bottenheim, J.W., 2001.
Atmospheric thermodynamics and circulation patterns
during the ALERT2000 field campaign. Atmospheric
Environment, this issue.
Sumner, A.L., et al., 2001. Atmospheric chemistry of for-
maldehyde in the Arctic troposphere at polar sunrise, and
the influence of the snowpack. Atmospheric Environment,
this issue.
Tang, T., McConnell, J.C., 1996. Autocatalytic release of
bromine from Arctic snowpack during Polar Sunrise.
Geophysical Research Letters 23, 2633–2636.
Tarasick, D.W., Kerr, J.B., Wardle, D.I., Bellefleur, J.J.,
Davies, J., 1995. Tropospheric ozone trends over Canada:
1980–1993. Geophysical Research Letters (22), 409–412.
Wesely, M.L., Hicks, B.B., 2000. A review of the current status
of knowledge on dry deposition. Atmospheric Environment
34, 2261–2282.
Wessel, S., Aoki, S., Winkler, P., Weller, R., Herber, A.,
Germandt, H., Schrems, O., 1998. Tropospheric ozone
depletion in polar regions: a domparison of observations in
the arctic and Antarctic. Tellus 50B, 34–50.
Worthy, D.E.J., Trivett, N.B.A., Hopper, J.F., Bottenheim,
J.W., Levin, I., 1994. Analysis of long-range transport
events at Alert, Northwest Territories, during the Polar
Sunrise Experiment. Journal of Geophysical Research 99D,
25329–25344.
Yokouchi, Y., Akimoto, H., Barrie, L.A., Bottenheim, J.W.,
Anlauf, K., Jobson, B.T., 1994. Serial gas chromatographic/
mass spectrometric measurements of some volatile organic
compounds in the Arctic atmosphere during the 1992 Polar
Sunrise Experiment. Journal of Geophysical Research 99,
25379–25390.
Zhou, X., Beine, H.J., Honrath, R.E., Fuentes, J.D., Simpson,
W., Shepson, P.B., Bottenheim, J. W., 2001. Snowpack
photochemical production of HONO: a major source of OH
in the Arctic boundary layer in spring time. Geophysical
Research Letters, in press.
ARTICLE IN PRESS
1
3
5
7
9
11
13
15
17
19
21
23
25
27
29
31
33
35
37
39
41
43
45
47
49
51
53
55
57
59
61
63
65
67
69
71
73
75
77
79
81
83
85
87
89
91
93
95
97
99
101
J.W. Bottenheim et al. / Atmospheric Environment ] (]]]]) ]]]–]]]10
AEA : 3825
Copyright © 2022 FDOKUMEN