Slow epidemic extinction in populations with heterogeneous infection rates
10
arXiv:1301.1645v1 [physics.soc-ph] 8 Jan 2013 Slow epidemic extinction in populations with heterogeneous infection rates C. Buono, 1 F. Vazquez, 2, 3 P. A. Macri, 1 and L. A. Braunstein 1, 4 1 Instituto de Investigaciones Físicas de Mar del Plata (IFIMAR)-Departamento de Física FCEyN-UNMDP-CONICET Funes 3350 (7600) Mar del Plata, Argentina. 2 Max-Planck-Institut für Physik Komplexer Systeme Nöthnitzer Str. 38, D-01187 Dresden, Germany. 3 Instituto de Física de Líquidos y Sistemas Biológicos UNLP-CONICET, Calle 59 Nro 789 (1900), La Plata Argentina. 4 Center for Polymer Studies, Boston University, Boston, Massachusetts 02215, USA. Abstract We explore how heterogeneity in the intensity of interactions between people affects epidemic spreading. For that, we study the susceptible-infected-susceptible model on a complex network, where a link connecting individuals i and j is endowed with an infection rate β ij = λw ij pro- portional to the intensity of their contact w ij , with a distribution P (w ij ) taken from face-to-face experiments analyzed in Cattuto et al. (PLoS ONE 5, e11596, 2010). We find an extremely slow decay of the fraction of infected individuals, for a wide range of the control parameter λ. Using a distribution of width a we identify two large regions in the a − λ space with anoma- lous behaviors, which are reminiscent of rare region effects (Griffiths phases) found in models with quenched disorder. We show that the slow approach to extinction is caused by isolated small groups of highly interacting individuals, which keep epidemic alive for very long times. A mean-field approximation and a percolation approach capture with very good accuracy the absorbing-active transition line for weak (small a) and strong (large a) disorder, respectively. PACS numbers: 89.75.Hc,05.40.-a,87.19.X-,02.50.Ey 1
-
Upload
independent -
Category
Documents
-
view
4 -
download
0
Transcript of Slow epidemic extinction in populations with heterogeneous infection rates
arX
iv:1
301.
1645
v1 [
phys
ics.
soc-
ph]
8 J
an 2
013
Slow epidemic extinction in populations with heterogeneous
infection rates
C. Buono,1 F. Vazquez,2, 3 P. A. Macri,1 and L. A. Braunstein1, 4
1Instituto de Investigaciones Físicas de Mar del Plata (IFIMAR)-Departamento de
Física FCEyN-UNMDP-CONICET Funes 3350 (7600) Mar del Plata, Argentina.
2Max-Planck-Institut für Physik Komplexer Systeme
Nöthnitzer Str. 38, D-01187 Dresden, Germany.
3Instituto de Física de Líquidos y Sistemas Biológicos UNLP-CONICET,
Calle 59 Nro 789 (1900), La Plata Argentina.
4Center for Polymer Studies, Boston University,
Boston, Massachusetts 02215, USA.
Abstract
We explore how heterogeneity in the intensity of interactions between people affects epidemic
spreading. For that, we study the susceptible-infected-susceptible model on a complex network,
where a link connecting individuals i and j is endowed with an infection rate βij = λwij pro-
portional to the intensity of their contact wij , with a distribution P (wij) taken from face-to-face
experiments analyzed in Cattuto et al. (PLoS ONE 5, e11596, 2010). We find an extremely
slow decay of the fraction of infected individuals, for a wide range of the control parameter λ.
Using a distribution of width a we identify two large regions in the a − λ space with anoma-
lous behaviors, which are reminiscent of rare region effects (Griffiths phases) found in models
with quenched disorder. We show that the slow approach to extinction is caused by isolated
small groups of highly interacting individuals, which keep epidemic alive for very long times.
A mean-field approximation and a percolation approach capture with very good accuracy the
absorbing-active transition line for weak (small a) and strong (large a) disorder, respectively.
PACS numbers: 89.75.Hc,05.40.-a,87.19.X-,02.50.Ey
1
Nowadays, much of the daily human activity is constantly being recorded by means
of modern technologies such as Internet, GPS, mobile phones, blue-tooth and other elec-
tronic devices. The gathering and analysis of large amount of activity data have allowed
to explore statistical features on people’s behavior. In particular, recent studies have
revealed interesting properties about how humans interact with each other, either by hav-
ing conversations [1], or sexual contacts [2], or by means of mobile devices [3] or wireless
communications [4]. Despite the fact that the type of interactions in these studies are
quite different, they all found a common interaction pattern, that is, human contacts are
very heterogeneous. This is consistent with a broad distribution of different magnitudes
that quantify the timing of contacts, such as their duration, frequency and gaps. This
diversity could eventually have an impact on propagation processes that involve human
contact, such as the spreading of rumors or diseases.
In this letter we explore epidemic spreading on a population with heterogeneous in-
teraction intensities. We use a distribution of intensities extracted from the pattern of
contacts between participants of a conference [5], obtained in recent face-to-face (F2F)
experiments [1]. For the spreading process we use the Susceptible-Infected-Susceptible
(SIS) [6] dynamics on Erdős-Rényi (ER) networks [7], with infection rates across links
that are proportional to the intensity of encounters.
As the infection rate increases, the SIS model [6] exhibits a transition, from an absorb-
ing (disease-free) phase where the infection dies exponentially fast to an active (endemic)
phase where the infection spreads over a large fraction of the population and becomes
persistent. We find that the heterogeneity in the intensity of contacts introduces an
intermediate absorbing region, in which the epidemic dies very slowly, as a stretched ex-
ponential or a power law in time. We experiment with other rate distributions and show
that this slow approach to epidemic extinction is caused by the presence of small clusters
composed by links with high interaction time, which remain infected for very long times.
We also discuss analogies with the effects observed in models with quenched disorder [8].
While our results are mainly concerned with the decay of the infection in the epidemic-
free phase, some related models [9–11] have focused, instead, on the disease prevalence
within the endemic phase. Other studies have introduced heterogeneity at the individual
level, by assigning power law intertime events [12, 13] or node-dependent infection rates
[14]. In our model heterogeneity is at the interaction level, by means of link-dependent
2
infection rates.
SIS dynamics with F2F disorder. In the SIS model [6], each individual of a population
can be either susceptible (healthy) or infected. Infected individuals transmit the disease to
its susceptible neighbors in the network at a rate ν and return to the susceptible state at
a rate γ. The dynamics is controlled by the rescaled infection rate λ = ν/γ. For λ above
a critical value λc, even a small initial fraction of infected nodes is able to propagate the
disease through the entire network (active phase), while for λ < λc the disease quickly dies
out (absorbing phase), following an exponential decay in the number of infected nodes.
This model describes disease spreading in an ideal population where transmission rates
between individuals are all the same. However, in real populations we expect interactions
to be heterogeneous, having a broad range of intensities, as recently measured by analyzing
mobiles phone data [3] and by means of person-to-person experiments [1]. In order to
explore how the behavior of the SIS model is affected by the heterogeneity of interactions,
we run simulations of the dynamics on ER networks with infection rates distributed
according to the weight distribution P (w) of F2F experiments [1, 5] (see Fig. 1). In these
experiments, participants of a three-day congress were asked to wear a Radio Frequency
Identification device on their chest, so that when two persons were close and facing each
other a relation of face-to-face proximity was registered. The weights w of Fig. 1 are
defined as the total number of packets exchanged (or total contact time) between pairs of
participants during the three days.
We are assuming that infection rates are proportional to the total time individuals are
in contact with each other, as the likelihood of transmission increases with exposure time
-longer contacts imply a higher risk of infection-. Therefore, we assign an effective rate
of infection βij = λwij between two individuals i and j that are connected by a link of
weight wij, where λ is a free parameter that acts as a transformation scale of contact
intensities into infection rates.
In Fig. 2 we show simulation results of the time evolution of the average density of
infected individuals ρ, over many realizations of the SIS dynamics, starting from a config-
uration where a small fraction of nodes have been randomly infected, and with infection
rates following the distribution of Fig. 1. All simulations in this article correspond, unless
noted, to ER networks of mean degree 〈k〉 = 4 and N = 105 nodes. We found that, be-
sides the typical behavior observed in the active and exponential phases of the clean SIS
3
10-3
10-2
10-1
100
ω10
-1
100
101
102
P10
-310
-210
-110
0
ω10
-1
100
101
102
P
slope = -1.6
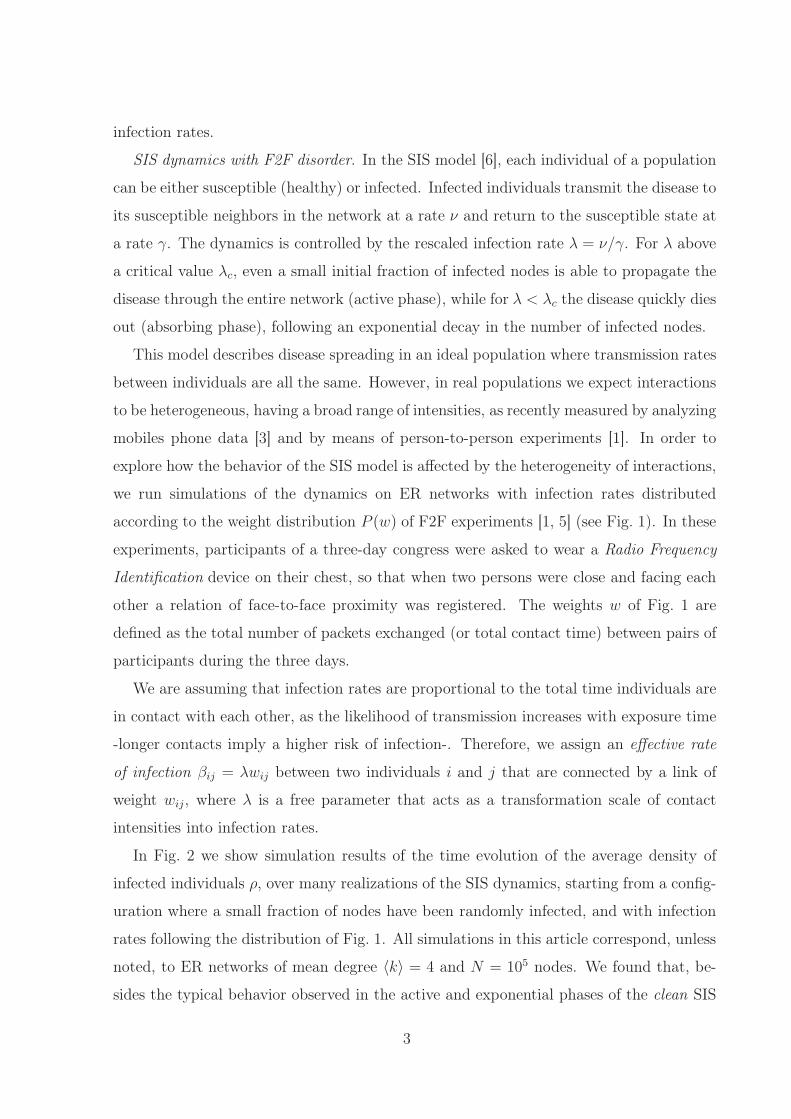
FIG. 1: Probability distribution of face-to-face contacts intensities (weights w) of the 25th Chaos
Communication Congress in Berlin, on a log-log scale. Intensity is defined as the total number
of packages exchanged between two attendees, which is proportional to the contact duration.
The large dispersion of the data reflects the large heterogeneity in the duration of contacts.
Weights are rescaled to the interval [0, 1] for a better comparison with the theoretical distribution
P (w) = 1/aw in the interval [e−a, 1], as shown in the inset for a = 6 (squares) and a = 3
(diamonds).
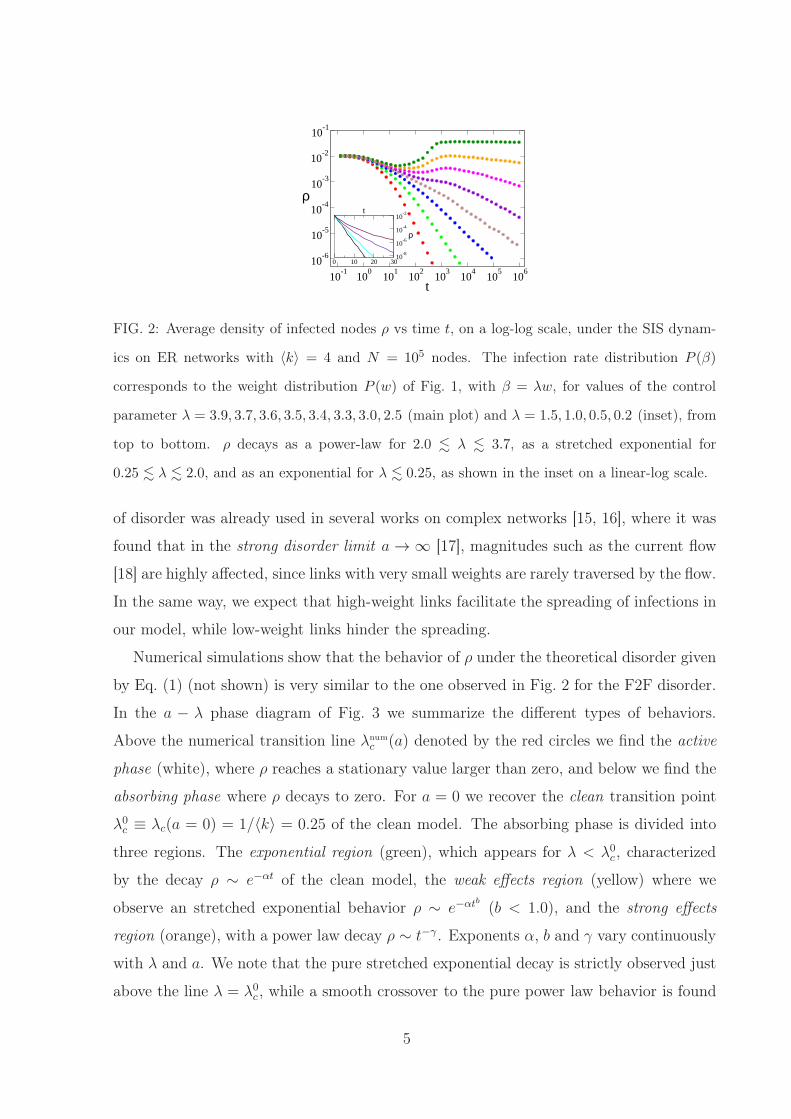
model (all infection rates are the same), there is an intermediate region between λ = 0.25
and 3.7 with very slow relaxation to the absorbing state. The region 2.0 . λ . 3.7 is
characterized by a power-law decay with a continuously varying exponent, while in the
region 0.25 . λ . 2.0 the decay is faster than a power law but slower than exponential
(see the inset of Fig. 2), and can be fitted by a stretched exponential.
SIS with variable disorder strength. In order to understand this phenomenon we explore
the dynamics for different distributions of weights. We assign to each link ij a weight
wij = e−arij , where rij is a random number taken from a uniform distribution in the
interval [0, 1], and a is a parameter that sets the range of wij in [e−a, 1]. This method
generates a power-law distribution P (w) = 1/aw. The parameter a controls the width of
the distribution, and measures the heterogeneity or strength of disorder. In the inset of
Fig. 1 we plot P (w) for a = 6 and a = 3, which is intended to mimic the broad distribution
of F2F contacts, even though the decay exponents are somewhat different.
The distribution of infection rates is given by
P (β) =1
aβ, with β in [λe−a, λ]. (1)
Notice that when a → 0 we recover the clean model where βij = λ for all ij. This kind
4
10-1
100
101
102
103
104
105
106
t
10-6
10-5
10-4
10-3
10-2
10-1
ρ
0 10 20 30
t
10-8
10-6
10-4
10-2
ρ
FIG. 2: Average density of infected nodes ρ vs time t, on a log-log scale, under the SIS dynam-
ics on ER networks with 〈k〉 = 4 and N = 105 nodes. The infection rate distribution P (β)
corresponds to the weight distribution P (w) of Fig. 1, with β = λw, for values of the control
parameter λ = 3.9, 3.7, 3.6, 3.5, 3.4, 3.3, 3.0, 2.5 (main plot) and λ = 1.5, 1.0, 0.5, 0.2 (inset), from
top to bottom. ρ decays as a power-law for 2.0 . λ . 3.7, as a stretched exponential for
0.25 . λ . 2.0, and as an exponential for λ . 0.25, as shown in the inset on a linear-log scale.
of disorder was already used in several works on complex networks [15, 16], where it was
found that in the strong disorder limit a → ∞ [17], magnitudes such as the current flow
[18] are highly affected, since links with very small weights are rarely traversed by the flow.
In the same way, we expect that high-weight links facilitate the spreading of infections in
our model, while low-weight links hinder the spreading.
Numerical simulations show that the behavior of ρ under the theoretical disorder given
by Eq. (1) (not shown) is very similar to the one observed in Fig. 2 for the F2F disorder.
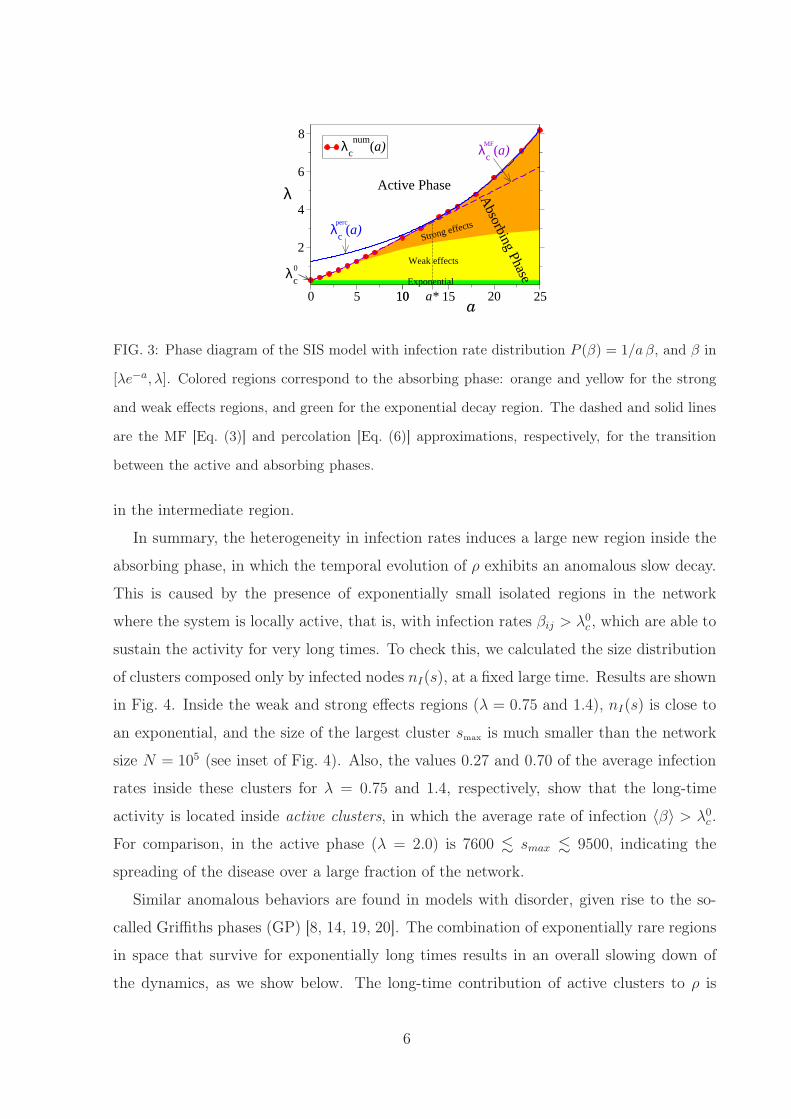
In the a − λ phase diagram of Fig. 3 we summarize the different types of behaviors.
Above the numerical transition line λnum
c (a) denoted by the red circles we find the active
phase (white), where ρ reaches a stationary value larger than zero, and below we find the
absorbing phase where ρ decays to zero. For a = 0 we recover the clean transition point
λ0c ≡ λc(a = 0) = 1/〈k〉 = 0.25 of the clean model. The absorbing phase is divided into
three regions. The exponential region (green), which appears for λ < λ0c , characterized
by the decay ρ ∼ e−αt of the clean model, the weak effects region (yellow) where we
observe an stretched exponential behavior ρ ∼ e−αtb (b < 1.0), and the strong effects
region (orange), with a power law decay ρ ∼ t−γ . Exponents α, b and γ vary continuously
with λ and a. We note that the pure stretched exponential decay is strictly observed just
above the line λ = λ0c , while a smooth crossover to the pure power law behavior is found
5
0 5 1010 15 20 25a*a
2
4
6
8
λ
λc
num(a)
Active Phase
Weak effects
Strong effects λc (a)
λc (a)
Exponentialλ
c0
perc
MF
Absorbing Phase
FIG. 3: Phase diagram of the SIS model with infection rate distribution P (β) = 1/a β, and β in
[λe−a, λ]. Colored regions correspond to the absorbing phase: orange and yellow for the strong
and weak effects regions, and green for the exponential decay region. The dashed and solid lines
are the MF [Eq. (3)] and percolation [Eq. (6)] approximations, respectively, for the transition
between the active and absorbing phases.
in the intermediate region.
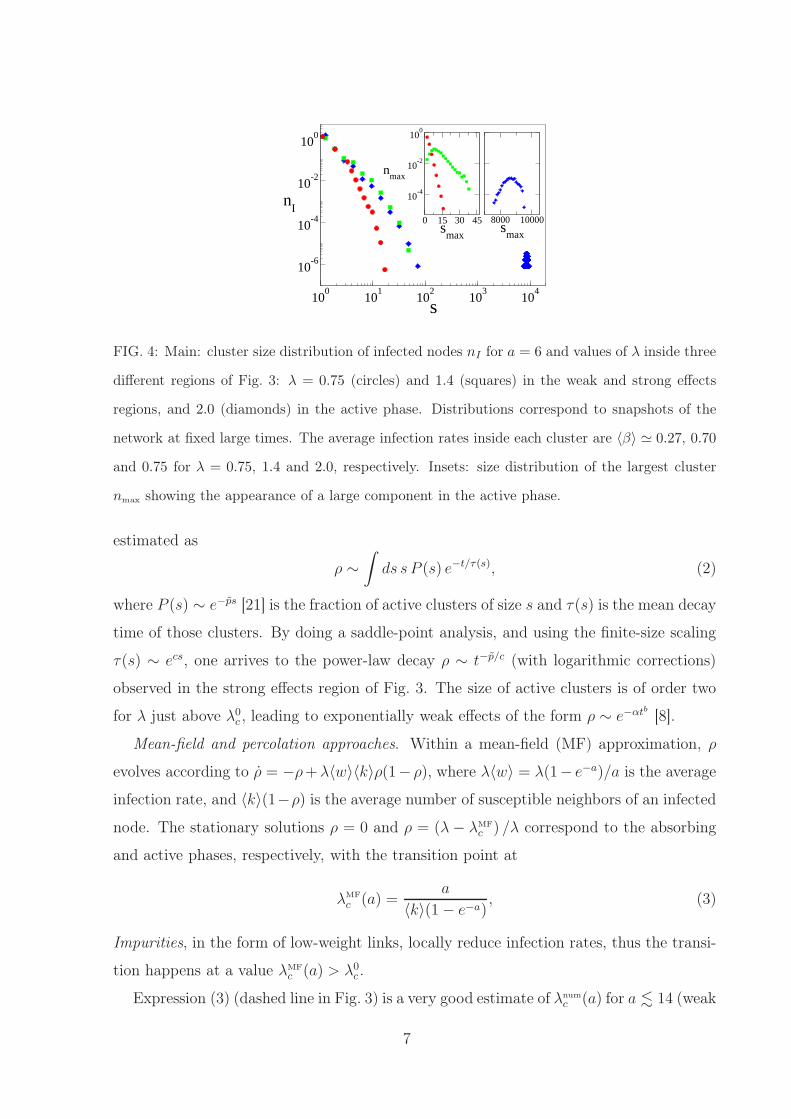
In summary, the heterogeneity in infection rates induces a large new region inside the
absorbing phase, in which the temporal evolution of ρ exhibits an anomalous slow decay.
This is caused by the presence of exponentially small isolated regions in the network
where the system is locally active, that is, with infection rates βij > λ0c , which are able to
sustain the activity for very long times. To check this, we calculated the size distribution
of clusters composed only by infected nodes nI(s), at a fixed large time. Results are shown
in Fig. 4. Inside the weak and strong effects regions (λ = 0.75 and 1.4), nI(s) is close to
an exponential, and the size of the largest cluster smax is much smaller than the network
size N = 105 (see inset of Fig. 4). Also, the values 0.27 and 0.70 of the average infection
rates inside these clusters for λ = 0.75 and 1.4, respectively, show that the long-time
activity is located inside active clusters, in which the average rate of infection 〈β〉 > λ0c .
For comparison, in the active phase (λ = 2.0) is 7600 . smax . 9500, indicating the
spreading of the disease over a large fraction of the network.
Similar anomalous behaviors are found in models with disorder, given rise to the so-
called Griffiths phases (GP) [8, 14, 19, 20]. The combination of exponentially rare regions
in space that survive for exponentially long times results in an overall slowing down of
the dynamics, as we show below. The long-time contribution of active clusters to ρ is
6
100
101
102
103
104
s
10-6
10-4
10-2
100
nI
0 15 30 45s
max
10-4
10-2
100
nmax
8000 10000s
max
FIG. 4: Main: cluster size distribution of infected nodes nI for a = 6 and values of λ inside three
different regions of Fig. 3: λ = 0.75 (circles) and 1.4 (squares) in the weak and strong effects
regions, and 2.0 (diamonds) in the active phase. Distributions correspond to snapshots of the
network at fixed large times. The average infection rates inside each cluster are 〈β〉 ≃ 0.27, 0.70
and 0.75 for λ = 0.75, 1.4 and 2.0, respectively. Insets: size distribution of the largest cluster
nmax showing the appearance of a large component in the active phase.
estimated as
ρ ∼
∫
ds s P (s) e−t/τ(s), (2)
where P (s) ∼ e−p̃s [21] is the fraction of active clusters of size s and τ(s) is the mean decay
time of those clusters. By doing a saddle-point analysis, and using the finite-size scaling
τ(s) ∼ ecs, one arrives to the power-law decay ρ ∼ t−p̃/c (with logarithmic corrections)
observed in the strong effects region of Fig. 3. The size of active clusters is of order two
for λ just above λ0c , leading to exponentially weak effects of the form ρ ∼ e−αtb [8].
Mean-field and percolation approaches. Within a mean-field (MF) approximation, ρ
evolves according to ρ̇ = −ρ+λ〈w〉〈k〉ρ(1− ρ), where λ〈w〉 = λ(1− e−a)/a is the average
infection rate, and 〈k〉(1−ρ) is the average number of susceptible neighbors of an infected
node. The stationary solutions ρ = 0 and ρ = (λ− λMF
c ) /λ correspond to the absorbing
and active phases, respectively, with the transition point at
λMF
c (a) =a
〈k〉(1− e−a), (3)
Impurities, in the form of low-weight links, locally reduce infection rates, thus the transi-
tion happens at a value λMF
c (a) > λ0c .
Expression (3) (dashed line in Fig. 3) is a very good estimate of λnum
c (a) for a . 14 (weak
7
disorder), but systematic deviations appear as a increases. Discrepancies arise because
MF assumes that all links can spread the disease but, when a is large, a fraction of links
have such small rates (inactive links) that infection never passes through them during the
epidemic’s life time, and thus the effective network for the spreading dynamics is diluted
respect to the original network. When dilution is large enough the effective network gets
fragmented into many small disconnected components and, as the disease cannot spread
out of these components the active state is never reached. Therefore, the active-absorbing
transition point for a large (strong disorder) corresponds to the percolation threshold. This
occurs when the fraction of inactive nodes q (nodes attached only to inactive links) exceeds
the critical value qc. For ER networks with Poissonian degree distribution Pk = e−〈k〉 〈k〉k
k!
is
q =∑
k
lkIPk = e−〈k〉(1−lI), where (4)
lI ≡
∫ βm
λe−a
P (β) dβ =1
aln
(
βmea
λ
)
(5)
is the fraction of inactive links, and βm is the largest infection rate that does not allow to
transmit the disease. At the percolation threshold 〈k〉 = (1− qc)−1 in the N → ∞ limit,
thus qc = exp [(1− qc)−1 ln (βm ea/λperc
c ) /a− 1], from where the percolation transition line
is
λperc
c (a) = βm q−a(1−qc)c . (6)
Using qc = 0.7443 for a network of size N = 105 [22], expression (6) with βm ≃ 1.2457
is in excellent agreement with λnum
c (a) for a & 14 (solid line in Fig. 3). The value of
βm is estimated from the crossover conditions λ MF
c (a) = λperc
c (a) and ∂λ MF
c (a)/∂a =
∂λ perc
c (a)/∂a between the MF and percolation lines at the weak-strong disorder crossing
point a = a∗. We obtain βm = −[e ln qc]−1 and a∗ = −[(1 − qc) ln qc]
−1 with a∗ ≃ 13.243
for the network used here.
Summary and Conclusions. In summary, the heterogeneity in the intensity of contacts
between individuals induces a regime with extremely slow (power-law or stretched expo-
nential) relaxation to epidemic extinction, akin to the slowing down found in systems with
quenched disorder. This effect is very robust, as it was observed using an empirical distri-
bution of contact durations in F2F experiments, as well as a theoretical distribution with
variable width. While temporal heterogeneity, causality and bursty activity was found
8
to hinder spreading [11, 13], we showed here that spatial heterogeneity has the counter-
balanced effect, making epidemic more persistence by slowing down its extinction. Once
a group of highly interacting individuals gets infected, is able to continuously reinfect
each other at a high rate, keeping the infection inside the group for very long times. Our
founding can be used to design efficient mitigation strategies for the disease. For instance,
moderating the activity of highly interacting people could dramatically speed up the final
stage of the epidemic.
This work was financially supported by UNMdP and FONCyT (Pict 0293/2008). The
authors thank Lucas D. Valdez for useful comments and discussions.
[1] C. Cattuto, W. V. den Broeck, A. Barrat, V. Colizza, J.-F. Pinton, and A. Vespignani,
PLoS ONE 5, e11596 (2010).
[2] B. Foxman, M. Newman, B. Percha, K. Holmes, and S. Aral, Sex Transm Dis 33, 209
(2006).
[3] T. Karagiannis, J.-Y. L. Boudec, and M. Vojnovic, Mobicom 07, 183 (2007).
[4] A. Scherrer, P. Borgnat, E. Fleury, J.-L. Guillaume, and C. Robardet, Computer Networks
52, 2842 (2008).
[5] Http://people.openbeacon.org/meri/openbeacon/
sputnik/data/25c3.
[6] N. T. J. Bailey, The Mathematical Theory of Infectious Diseases (Griffin, London, 1975).
[7] P. Erdős and A. Rényi, Publications Mathematicae 6, 290 (1959).
[8] T. Vojta, J. Phys. A: Math. Gen. 39, R143 (2006).
[9] J. Stehlé et al., BMC Medicine 9, 87 (2011).
[10] Z. Yang and T. Zhou, Phys. Rev. E 85, 056106 (2012).
[11] M. Karsai, M. Kivelä, R. K. Pan, K. Kaski, J. Kertész, A.-L. Barabási, and J. Saramäki,
Phys. Rev. E 83, 025102(R) (2011).
[12] A. Vazquez, B. Rácz, A. Lukács, and A.-L. Barabási, Phys Rev Lett 98, 158702 (2007).
[13] B. Min, K.-I. Goh, and A. Vazquez, Phys. Rev. E 83, 036102 (2011).
[14] M. A. Muñoz, R. Juhász, C. Castellano, and G. Odor, Phys. Rev. Lett. 105, 128701 (2010).
[15] L. A. Braunstein, S. V. Buldyrev, S. Havlin, and H. E. Stanley, Phys. Rev. E 65, 056128
9
(2002).
[16] C. Buono, C. Lagorio, P. A. Macri, and L. A. Braunstein, Physica A 391, 4181 (2012).
[17] M. Cieplak, A. Maritan, and J. R. Banavar, Phys. Rev. Lett. 76, 3754 (1996).
[18] Z. Wu, E. López, S. V. Buldyrev, L. A. Braunstein, S. Havlin, and H. E. Stanley, Phys.
Rev. E 71, 045101 (R) (2005).
[19] F. Vazquez, J. A. Bonachela, C. Lopez, and M. A. Muñoz, Phys. Rev. Lett. 106, 235702
(2011).
[20] R. Martínez-García, F. Vazquez, C. López, and M. A. Muñoz, Phys. Rev E 85, 051125
(2012).
[21] M. E. J. Newman, S. H. Strogatz, and D. J. Watts, Phys. Rev. E 64, 026118 (2001).
[22] Z. Wu, C. Lagorio, L. A. Braunstein, R. Cohen, S. Havlin, and H. E. Stanley, Phys. Rev. E
75, 066110 (2007).
10