Revisiting Kepler-444 - I. Seismic modeling and inversions of ...
East to west retardation in the onset of the recent warming
across Canada inferred from inversions of temperature logs
Jacek MajorowiczNorthern Geothermal, Edmonton, Alberta, Canada
Jan SafandaGeophysical Institute, Czech Academy of Sciences, Sporilov, Czech Republic
Walter SkinnerClimate Research Branch, Environment Canada, Downsview, Ontario, Canada
Received 12 March 2001; revised 8 January 2002; accepted 13 January 2002; published 15 October 2002.
[1] Canadian well temperature logs for 141 sites are analyzed and show evidence ofextensive ground surface temperature (GST) warming beginning in the eighteenth andnineteenth centuries following a lengthy period of cooling (the Little Ice Age) over mostof the past millennium. The method of functional space inversion (FSI) is applied to thecomplete set of 141 well precise temperature logs from wells located in low-conductivityclastic sediments of the western Canadian Sedimentary basin and higher thermalconductivity crystalline rocks of the Canadian Shield in central and eastern Canada.Marked regional differences in the onset of recent warming are evident (nineteenthcentury compared to the seventeenth to eighteenth centuries, respectively), following aprolonged cold period through earlier centuries. Analysis of spatial patterns of GSThistory changes across Canada based on the individual inversions of temperature logsshows a systematic east-to-west retardation in the onset of the recent warming yet a higheroverall warming magnitude in western Canada in the twentieth century. INDEX TERMS:
0915 Exploration Geophysics: Downhole methods; 1610 Global Change: Atmosphere (0315, 0325);
KEYWORDS: Canada climate warming, borehole temperature, geothermics
Citation: Majorowicz, J., J. Safanda, and W. Skinner, East to west retardation in the onset of the recent warming across Canada
inferred from inversions of temperature logs, J. Geophys. Res., 107(B10), 2227, doi:10.1029/2001JB000519, 2002.
1. Introduction
[2] A comparison of ground surface temperature (GST)histories across Canada from existing published reconstruc-tions for central and east central Canada [Beltrami et al.,1992, 1997, 2000; Guillou-Frottier et al., 1998] and westernCanada [Majorowicz and Safanda, 2001] show markeddifferences in both the magnitude of the recent twentiethcentury GST warming and in the timing of the onset of thewarming. Beltrami et al. [1992, 2000] and Beltrami andMareshal [1993] used 21 selected wells from central andeastern Canada and the method of simultaneous inversionbased on singular value decomposition (SVD) to reconstructGST histories for the last 1000 years. They show evidenceof large magnitude warming (1–3�C) over the past 200years. This was preceded by a lengthy cooling trend thatpersisted until the early 1800s in a region bounded by 80–96�W and 46–50�N. Beltrami et al. [1997] found similarGST histories from the simultaneous inversion of fourtemperature profiles logged by Pinet et al. [1991] nearBelleterre, Quebec, Canada (47.4�N, 78.7�W). The GST
history obtained by simultaneous inversion (SVD) identifiesan extended cold period, with the lowest temperaturesoccurring at approximately 1800, followed by 2–3�Cwarming. A GST history developed for the central CanadianShield by Guillou-Frottier et al. [1998] using simultaneousinversion (SVD) of 10 temperature logs shows the coldperiod reached its minimum about 1820 and was followedby a marked warming after 1820 of �1.5�C. In westernCanada,Majorowicz and Safanda [1998] andMajorowicz etal. [1999a, 1999b] used the method of functional spaceinversion (FSI) [Shen and Beck, 1991; Shen et al., 1995,1996; Pollack et al., 1996] to yield GST histories frominversion of deep wells in the western Canadian Sedimen-tary basin and identified a large warming magnitude of 2�Cbeginning �100 years ago.[3] There is also evidence of regional differences in the
magnitude of the recent GST warming between easternCanada and western Canada. Wang et al. [1994] used asimple ‘‘ramp’’ function to characterize recent warming atthe surface [Lachenbruch and Marshall, 1986] and showedthat the warming in the Cordillera region of western Canadahas been �0.8�C since the late nineteenth century and�1.5�C since the mid-nineteenth century in eastern Canada(east of the western Canadian Sedimentary basin). Regional
JOURNAL OF GEOPHYSICAL RESEARCH, VOL. 107, NO. B10, 2227, doi:10.1029/2001JB000519, 2002
Copyright 2002 by the American Geophysical Union.0148-0227/02/2001JB000519$09.00
ETG 6 - 1
differences in warming magnitude between northern andsouthern regions of the North American continent wereinvestigated by Pollack and Chapman [1993], Majorowiczand Skinner [1997a], and Skinner and Majorowicz [1999].A north to south decrease of the warming magnitude fromthe late nineteenth through the twentieth century was found.Comparison of inversion results from three published sour-ces for separate regions of Canada show a marked differ-ence, of up to 100 years, in the timing of the onset of therecent warming with earlier initiation in the east. Recon-struction of past climatic variations from proxy methods(tree rings, oxygen isotopes, lake sediments) for the pastfour to nine centuries, for the Arctic [Overpeck et al., 1997],the Northern Hemisphere [Mann et al., 1998], the Albertafoothills and lowlands [Luckman et al., 1997], and easternCanada [Beltrami and Taylor, 1995; Beltrami et al., 1995;Archambault and Bergeron, 1992] also clearly show varia-tions in surface temperature change from site to site andregion to region.[4] While the hemispheric and global warming trend of
the past century [Intergovernmental Panel on ClimateChange (IPCC), 2001] is clearly evident on a regionalbasis, there are distinct differences in the both the locationand magnitude of the warming signal. The variation inpatterns of warming and cooling is confirmed by theinstrumental records of the last century [Skinner and Major-owicz, 1999; Zhang et al., 2000]. The recent temperatureincrease has been neither spatially nor temporally uniform.Western and northwestern regions of Canada have shownamplified warming of annual temperature over the past 50years ranging from 1.0 to 2.5�C [Zhang et al., 2000].However, warming in central and eastern Canadian regionsover the same period has been much less (0–1.0�C) withcooling in northeastern Canada (�1.0 to �2.0�C).[5] The objective of this paper is to apply functional
space inversion (FSI) technique to the complete set ofexisting 141 well temperature logs. Western CanadianSedimentary basin data are included for the first time fora complete regional analysis across Canada and to allowmap construction of warming and cooling patterns on the
century scale over the past several centuries. Also, apparentchanges in the patterns of warming and cooling events inthe second half of the last millennium are analyzed.[6] Temperature logs from each of the 141 Canadian
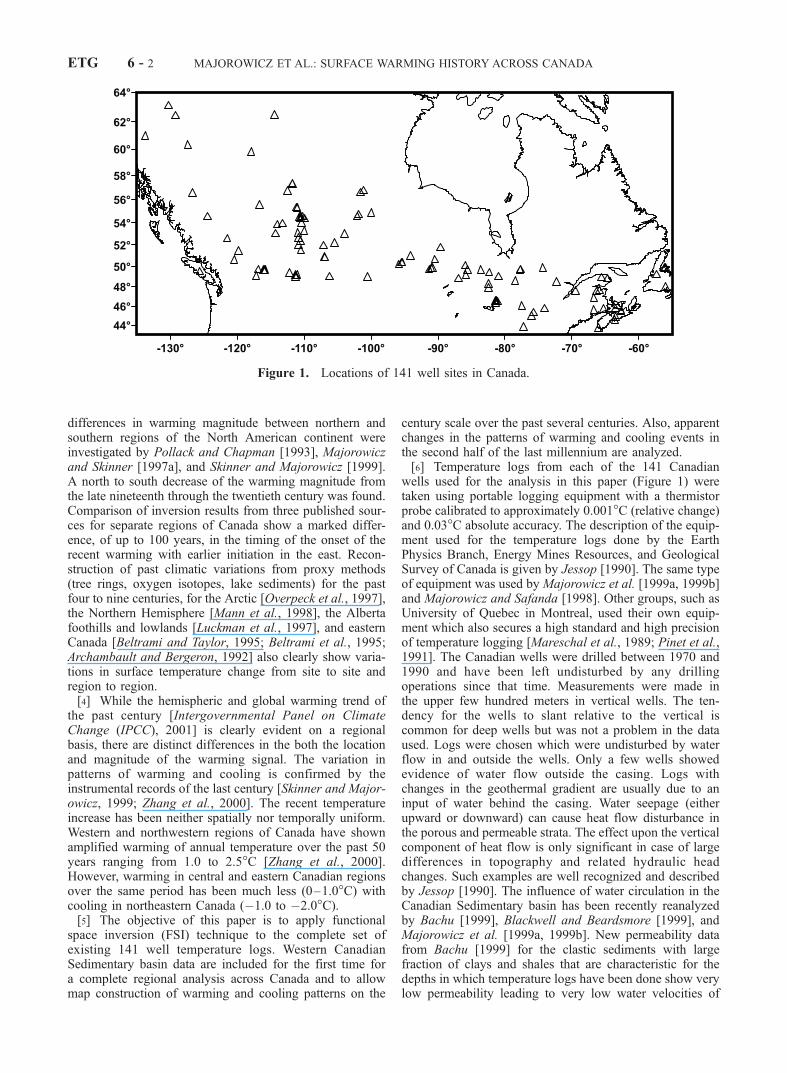
wells used for the analysis in this paper (Figure 1) weretaken using portable logging equipment with a thermistorprobe calibrated to approximately 0.001�C (relative change)and 0.03�C absolute accuracy. The description of the equip-ment used for the temperature logs done by the EarthPhysics Branch, Energy Mines Resources, and GeologicalSurvey of Canada is given by Jessop [1990]. The same typeof equipment was used by Majorowicz et al. [1999a, 1999b]and Majorowicz and Safanda [1998]. Other groups, such asUniversity of Quebec in Montreal, used their own equip-ment which also secures a high standard and high precisionof temperature logging [Mareschal et al., 1989; Pinet et al.,1991]. The Canadian wells were drilled between 1970 and1990 and have been left undisturbed by any drillingoperations since that time. Measurements were made inthe upper few hundred meters in vertical wells. The ten-dency for the wells to slant relative to the vertical iscommon for deep wells but was not a problem in the dataused. Logs were chosen which were undisturbed by waterflow in and outside the wells. Only a few wells showedevidence of water flow outside the casing. Logs withchanges in the geothermal gradient are usually due to aninput of water behind the casing. Water seepage (eitherupward or downward) can cause heat flow disturbance inthe porous and permeable strata. The effect upon the verticalcomponent of heat flow is only significant in case of largedifferences in topography and related hydraulic headchanges. Such examples are well recognized and describedby Jessop [1990]. The influence of water circulation in theCanadian Sedimentary basin has been recently reanalyzedby Bachu [1999], Blackwell and Beardsmore [1999], andMajorowicz et al. [1999a, 1999b]. New permeability datafrom Bachu [1999] for the clastic sediments with largefraction of clays and shales that are characteristic for thedepths in which temperature logs have been done show verylow permeability leading to very low water velocities of
Figure 1. Locations of 141 well sites in Canada.
ETG 6 - 2 MAJOROWICZ ET AL.: SURFACE WARMING HISTORY ACROSS CANADA
<10�2 m/yr. These are for the water moving along thebedding of the formations. The vertical component of suchflow is 10–100 times lower. It is therefore estimated that thechange in heat flow is smaller than the errors due totemperature gradient accuracy. Current consensus, basedon new data and modeling, is that the effects of watercirculation upon heat transfer in sedimentary basins havebeen overestimated in the past [Bachu, 1999; Blackwell andBeardsmore, 1999; Majorowicz et al., 1999a, 1999b].[7] Many cases of heat flow variation with depth can now
be explained by a better knowledge of the lower conduc-tivity of shales, which was overestimated in the past. It isonly in regions of high topographic relief with a highdensity of vertical conduits (Rocky Mountain foothills)where the effect can be a consideration [Majorowicz etal., 1999a, 1999b]. Wells from sedimentary basins arelocated mostly in the flat areas like those of the prairiesof western Canada. Unfortunately, no wells were availablefrom the higher topographic relief regions of the RockyMountain foothills. Repeated measurements in wells atdifferent times and measurements in wells in close prox-imity that are open to different aquifers at numerous sites inthe prairies of western Canada clearly show a conductivecharacter of the heat flow transfer. Also, the small diameterof the wells relative to their length disallows any convectionin the well bore significant enough to disturb the thermalregime [Jessop, 1990]. Repeated logs after the last disturb-ance in the well confirm a conduction thermal regime in thewells [Taylor et al., 1982; Jessop, 1990; Majorowicz et al.,1999a, 1999b].[8] Fifty-one precise (precision ±0.01�C) temperature
profiles logged in the western Canadian Plains east of theCordillera are used for the first time in conjunction with 90temperature well logs from eastern, central, and westernCanada [Jessop et al., 1984; Mareschal et al., 1989; Pinet etal., 1991]. Beltrami et al. [1992] and Wang et al. [1994]analyzed these data to reconstruct GST histories for the past1000 years. Most of the sites are located in the boreal forestecozone. Nineteen southern wells come from the southernprairie grasslands of Alberta and Saskatchewan [Majoro-wicz and Safanda, 1998; Majorowicz et al., 1999a, 1999b].In the majority of cases, temperature versus depth profilesare the result of a single log in one well over a depth rangefrom the static water level to the bottom of the well. In a fewcases, however, the temperature profile is a stack andconsists of the measurements in two to three wells at onesite (usually wells within a 100 m radius of each other). Thenorthern most five locations were logged in early 1980s[Taylor et al., 1982]. The above logs and their descriptionwere taken from the Global Borehole Temperature Database[Huang and Pollack, 1998].
2. Methodology
[9] GST histories were obtained by applying the func-tional space inversion (FSI) technique [Shen and Beck,1991; Shen et al., 1995; Pollack et al., 1996; Majorowiczand Safanda, 1998]. The FSI technique allows for uncer-tainties for both the measured temperatures and the thermo-physical parameters to be incorporated into the model in theform of a priori standard deviations. Because of the com-plexity of the problem, this technique, as well as all other
available techniques, assumes that heat transfer is by con-duction alone through a one-dimensional, possibly hetero-geneous medium. This assumption excludes the advectivecomponent of heat transfer due to subsurface fluids orconvective disturbances within the fluid-filled borehole, aswell as lateral heterogeneity in thermal conductivity anduneven surface relief [Shen et al., 1995]. The reconstructionof the GST history for time interval [to, t1] from thesubsurface temperature profile T(z, t1) measured betweenthe surface and depth zb at time t1 assumes that theperturbations in T(z,t) caused by the GST variation beforetime to, cannot be distinguished from the steady state fieldwithin the depth interval (0,zb) at time t1, when the subsur-face temperature is measured. This assumption can be metby considering to to be sufficiently far away from t1.[10] The assumption of heat transfer by conduction only
is well justified in areas with negligible vertical movementof the underground water. It is usually the case in terrainswith flat or subdued topography, typical for the regionsinvestigated in this study. Heat conduction is definitely notthe only heat transfer mechanism in soil [Kane et al., 2001].The reconstructed GST histories are therefore temporalchanges of the ground surface temperature on the upperboundary of the heat conduction domain, which begins onlyfew meters below the surface. The long-term relationshipbetween the ground surface and surface air temperatures istherefore the key issue in interpretation the GST histories interms of long-term climatic variability. The general belief isthat on the long-temporal scale, mean annual ground surfacetemperatures track the mean annual surface air temperaturestaken at screen height (1.5 m above the surface of theground). The results of recent studies [Putnam and Chap-man, 1996; Schmidt et al., 2001; Beltrami, 2001] indicatethat the dominating mechanism of heat transfer in the soil isheat conduction. However, the magnitude of the differencebetween the mean annual ground surface and surface airtemperatures at a given site varies according to the numberof days with snow cover or the content of soil moisture atthe beginning of the freezing season. The difference, how-ever, is relatively insensitive to the depth of the snow layer[Schmidt et al., 2001]. If these parameters change randomlyfrom year to year and their mean values do not change onthe timescale of the GST history reconstruction, then thepresent interpretation of the GST history as a first-orderestimate of the air temperature history is correct. Thisproblem is currently being studied in experimental air-ground climate stations located in different climatologicalsettings [Putnam and Chapman, 1996; Schmidt et al., 2001;Beltrami, 2001; Cermak et al., 2000].[11] The extraction of a signal from the measured T-z
profile is impeded by the presence of noise. As shown byShen et al. [1995], the noise in this system derives bothfrom errors in the measurements of temperatures, depths,and thermophysical properties of the Earth’s materials andfrom the ‘‘representational’’ errors, such as departures of themathematical representation of the problem (one-dimen-sional heat conduction) from the real world. The numericalexperiments [Shen et al., 1995] with synthetic T-z profilescontaining both the climatic signal of the last millennium,based on tree ring data, and the types of noise mentionedabove shown that the inverted GST history is most sensitiveto two parameters of the inversion, namely, to constraints
MAJOROWICZ ET AL.: SURFACE WARMING HISTORY ACROSS CANADA ETG 6 - 3
(standard deviation, SD) on a priori thermal conductivitymodel and measured temperature data. The final choice ofthese two parameters must be a compromise between thesuppression of the artifacts of noise, which can be achievedby choosing large SDs, and the recovery of the details of theGST history, which requires small a priori SDs.[12] Estimates of conductivity based on lithology and
measured rock samples from the western Canadian Sedi-mentary basin were used because of the lack of rock chipsamples and therefore a lack of direct conductivity data fromAlberta and Saskatchewan boreholes. Average conductivityvalues for the main rock types in the western CanadianSedimentary basin were based on thousands of measure-ments on available cores and rock chips [Beach et al., 1987]from other deep wells. The temperature profiles were sub-
jected to a ‘‘loose’’ inversion, in which the desired GSTsignal is attenuated, to ensure that the noise is not amplified.This suppression of noise was achieved by increasing thestandard deviation of the a priori thermal conductivity modeland the standard deviation of the measured temperatures. Forthis study, a priori conductivity and temperature standarddeviations are 0.5 W/m K and 0.05�C, respectively. Thesevalues are close to those suggested by Shen et al. [1995] as areasonable compromise in inverting realistic synthetic pro-files.[13] The null hypothesis for the inversion was conserva-
tively framed and assumes no climate changes prior to dataacquisition. The statistical properties of the GST variationswere constrained by a priori standard deviations, whichincrease linearly from 0.5�C at year 1000 to 2.0�C at year
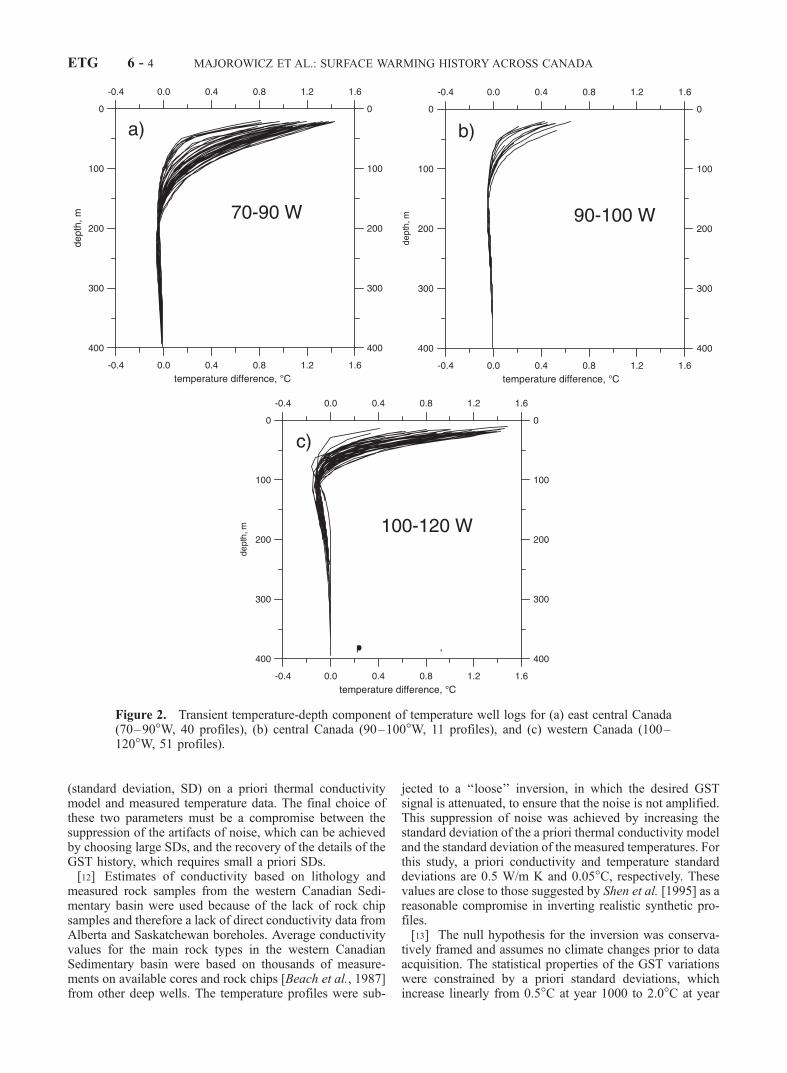
Figure 2. Transient temperature-depth component of temperature well logs for (a) east central Canada(70–90�W, 40 profiles), (b) central Canada (90–100�W, 11 profiles), and (c) western Canada (100–120�W, 51 profiles).
ETG 6 - 4 MAJOROWICZ ET AL.: SURFACE WARMING HISTORY ACROSS CANADA
1990, and by the characteristic time of correlation decreas-ing linearly from 500 years to 100 years since year 1000 toyear 1990 [Shen et al., 1995]. The a priori model is quitesimple. In west central and northern Canada, where wellsare within the foreland Sedimentary basin, the estimatedthermal conductivity of most clastics varies between 1.4 and1.6 W/m K (±0.5 W/m K), heat capacity/volume = 2 � 106
J/K m3, heat production 2 � 10�6 W/m3. A thermalconductivity of 1.4–1.6 W/m K is our estimate of averagethermal conductivity of the shallow highly saturated clasticsediments (clays, shales, shaly siltstones, high-porositysaturated sands). The lower thermal conductivity (1.2–1.4W/m K) is for the case of sediments with majority of shalesand clays. The model of heat production influences theresults very little and is practically unresolved by inversion.With assumed specific heat of 2.0 MJ/m3 K diffusivity willvary between 0.5 and 0.8 � 10�6 m2/s.[14] In eastern Canada, where most of the wells are in
crystalline rock, the thermal conductivity is much higher(2–5 W/m K) and in most cases it was measured on rockchips and core samples [Jessop et al., 1984; Jessop, 1990;Mareschal et al., 1989; Pinet et al., 1991]. Assumeddiffusivity varies between 1.0 and 1.5 � 10�6 m2/s whichis typical range of diffusivity values assumed for Precam-brian rocks of Canada [Jessop, 1990], Scandinavia [Kukko-nen et al., 1998], and Bohemia [Safanda et al., 1997].Diffusivity of 1.0–1.2 � 10�6 m2/s is most common forsuch rock types with 1.5 � 10�6 m2/s assumed to be themaximum limit.[15] Pollack et al. [1996], Shen et al. [1995], and Major-
owicz and Safanda [1998, 2001] have shown that there is arisk of misinterpreting the GST history by inversion ofsingle logs with tight constraints on the borehole data.Averaging and the simultaneous inversion were thereforeused as an attempt to characterize with higher fidelity GSThistory for the larger region [Pollack et al., 1996].
3. Regional Comparisons
[16] To minimize the effects of noise in individual logsand to improve the fidelity of regional GST histories, wehave performed both individual inversions with subsequentaveraging, and simultaneous inversions of the temperatureversus depth logs for three ensembles of wells for a total of102 profiles. These profiles were previously analyzed withtwo different methods (FSI and SVD) by several authors.We have grouped the data and calculated transient compo-nents of temperature-depth (Figures 2a–2c) for three majorgroups: east central Canada (70–90�N, 44–52�W) (Figure2a), central Canada (90–100�N, 49–58�W) (Figure 2b),and western Canada (49–63�N, 100–120�W east of theCordillera) (Figure 2c).[17] The calculated transient components of tempera-
ture–depth (Figure 2a) for east central Canada all showevidence of warming in the upper 200 m. The transientcomponents of temperature versus depth profiles fromcentral (Figure 2b) and western Canada (Figure 2c) showevidence of near-surface (100 m) climatic disturbance. Datafrom all of the deep logs, as well as data from shallowerlogs (<150 m but not used in this study for GST historyreconstruction because the shallow depth is insufficient toresolve signals before the nineteenth century) also show
evidence of extensive ground temperature warming in thetwentieth century. It is observed that the onset of warming atdepth is deeper in east central Canadian wells.[18] The GST history curves obtained by the simultane-
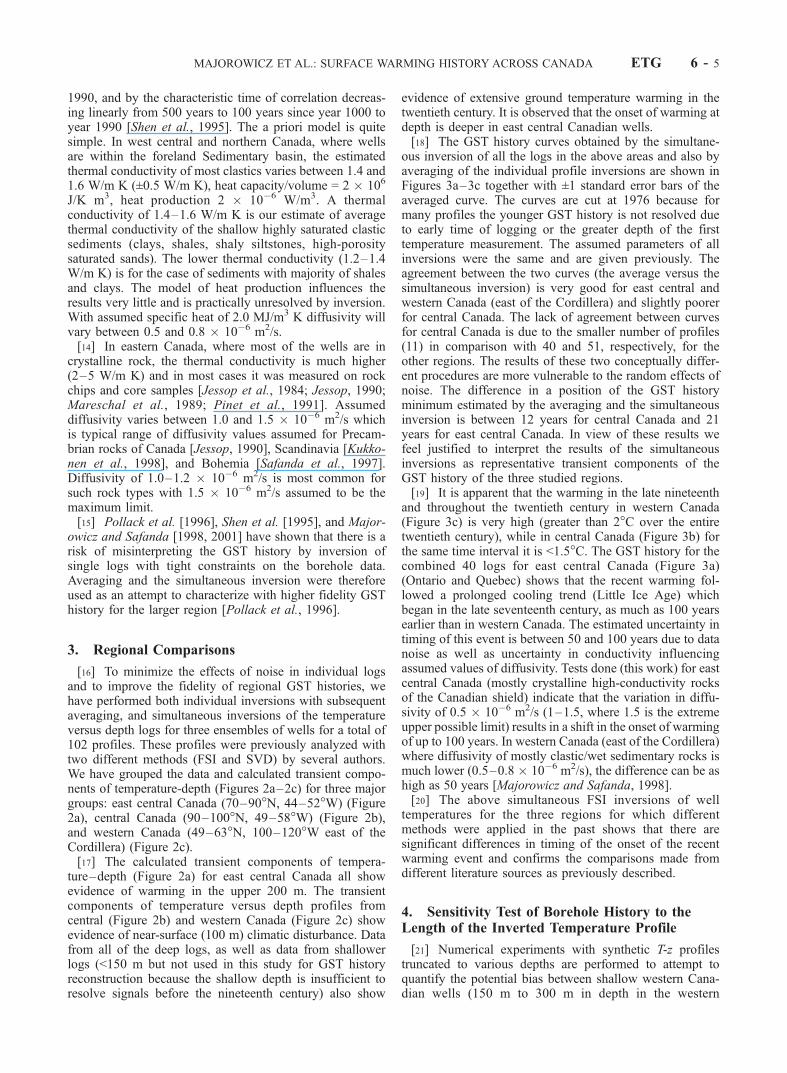
ous inversion of all the logs in the above areas and also byaveraging of the individual profile inversions are shown inFigures 3a–3c together with ±1 standard error bars of theaveraged curve. The curves are cut at 1976 because formany profiles the younger GST history is not resolved dueto early time of logging or the greater depth of the firsttemperature measurement. The assumed parameters of allinversions were the same and are given previously. Theagreement between the two curves (the average versus thesimultaneous inversion) is very good for east central andwestern Canada (east of the Cordillera) and slightly poorerfor central Canada. The lack of agreement between curvesfor central Canada is due to the smaller number of profiles(11) in comparison with 40 and 51, respectively, for theother regions. The results of these two conceptually differ-ent procedures are more vulnerable to the random effects ofnoise. The difference in a position of the GST historyminimum estimated by the averaging and the simultaneousinversion is between 12 years for central Canada and 21years for east central Canada. In view of these results wefeel justified to interpret the results of the simultaneousinversions as representative transient components of theGST history of the three studied regions.[19] It is apparent that the warming in the late nineteenth
and throughout the twentieth century in western Canada(Figure 3c) is very high (greater than 2�C over the entiretwentieth century), while in central Canada (Figure 3b) forthe same time interval it is <1.5�C. The GST history for thecombined 40 logs for east central Canada (Figure 3a)(Ontario and Quebec) shows that the recent warming fol-lowed a prolonged cooling trend (Little Ice Age) whichbegan in the late seventeenth century, as much as 100 yearsearlier than in western Canada. The estimated uncertainty intiming of this event is between 50 and 100 years due to datanoise as well as uncertainty in conductivity influencingassumed values of diffusivity. Tests done (this work) for eastcentral Canada (mostly crystalline high-conductivity rocksof the Canadian shield) indicate that the variation in diffu-sivity of 0.5 � 10�6 m2/s (1–1.5, where 1.5 is the extremeupper possible limit) results in a shift in the onset of warmingof up to 100 years. In western Canada (east of the Cordillera)where diffusivity of mostly clastic/wet sedimentary rocks ismuch lower (0.5–0.8 � 10�6 m2/s), the difference can be ashigh as 50 years [Majorowicz and Safanda, 1998].[20] The above simultaneous FSI inversions of well
temperatures for the three regions for which differentmethods were applied in the past shows that there aresignificant differences in timing of the onset of the recentwarming event and confirms the comparisons made fromdifferent literature sources as previously described.
4. Sensitivity Test of Borehole History to theLength of the Inverted Temperature Profile
[21] Numerical experiments with synthetic T-z profilestruncated to various depths are performed to attempt toquantify the potential bias between shallow western Cana-dian wells (150 m to 300 m in depth in the western
MAJOROWICZ ET AL.: SURFACE WARMING HISTORY ACROSS CANADA ETG 6 - 5
Canadian Sedimentary basin) and deeper eastern and centralCanadian wells (300–400 m in depth) (Figures 2a–2c).Data from shallow boreholes contain insufficient informa-tion to resolve the cooling trend that might have occurredduring the Little Ice Age. This implies that the estimates forboth the onset and the amplitude of the subsequent warmingmay also be biased.[22] The T-z profiles were calculated as a response to a
linear increase of the surface temperature of 1.5�C over theperiod 1850–2000 and preceded by a constant temperature.This is the period for which instrumental surface air temper-
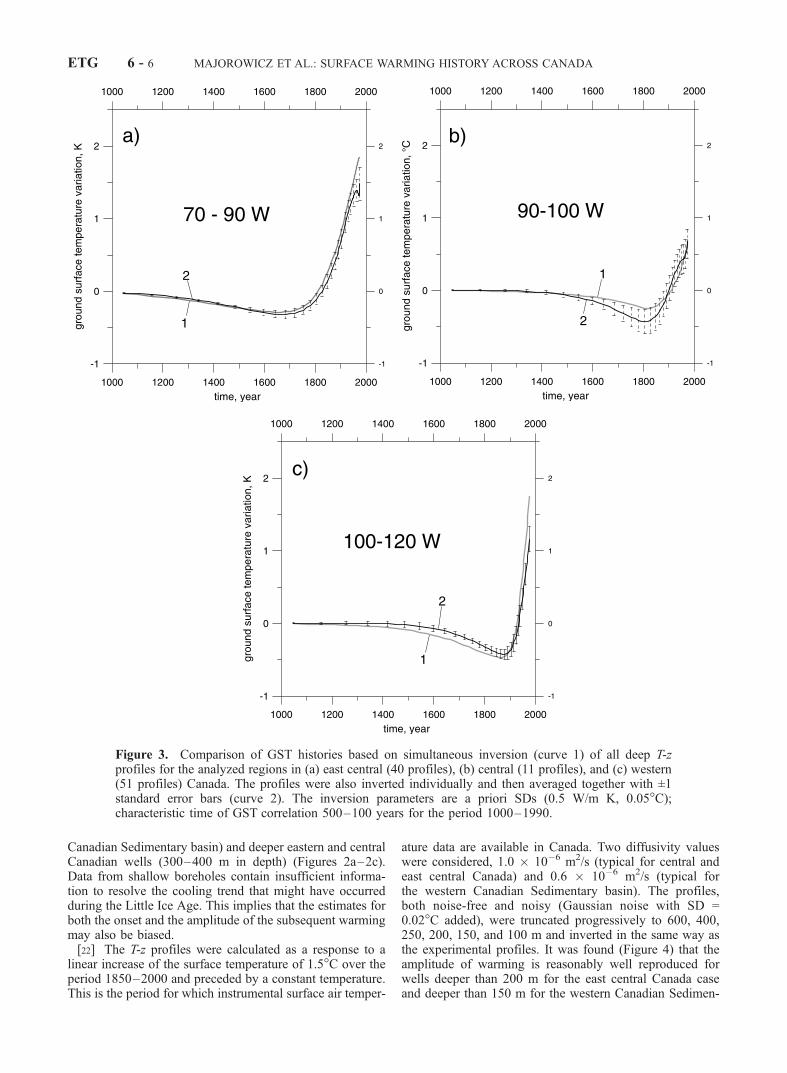
ature data are available in Canada. Two diffusivity valueswere considered, 1.0 � 10�6 m2/s (typical for central andeast central Canada) and 0.6 � 10�6 m2/s (typical forthe western Canadian Sedimentary basin). The profiles,both noise-free and noisy (Gaussian noise with SD =0.02�C added), were truncated progressively to 600, 400,250, 200, 150, and 100 m and inverted in the same way asthe experimental profiles. It was found (Figure 4) that theamplitude of warming is reasonably well reproduced forwells deeper than 200 m for the east central Canada caseand deeper than 150 m for the western Canadian Sedimen-
Figure 3. Comparison of GST histories based on simultaneous inversion (curve 1) of all deep T-zprofiles for the analyzed regions in (a) east central (40 profiles), (b) central (11 profiles), and (c) western(51 profiles) Canada. The profiles were also inverted individually and then averaged together with ±1standard error bars (curve 2). The inversion parameters are a priori SDs (0.5 W/m K, 0.05�C);characteristic time of GST correlation 500–100 years for the period 1000–1990.
ETG 6 - 6 MAJOROWICZ ET AL.: SURFACE WARMING HISTORY ACROSS CANADA
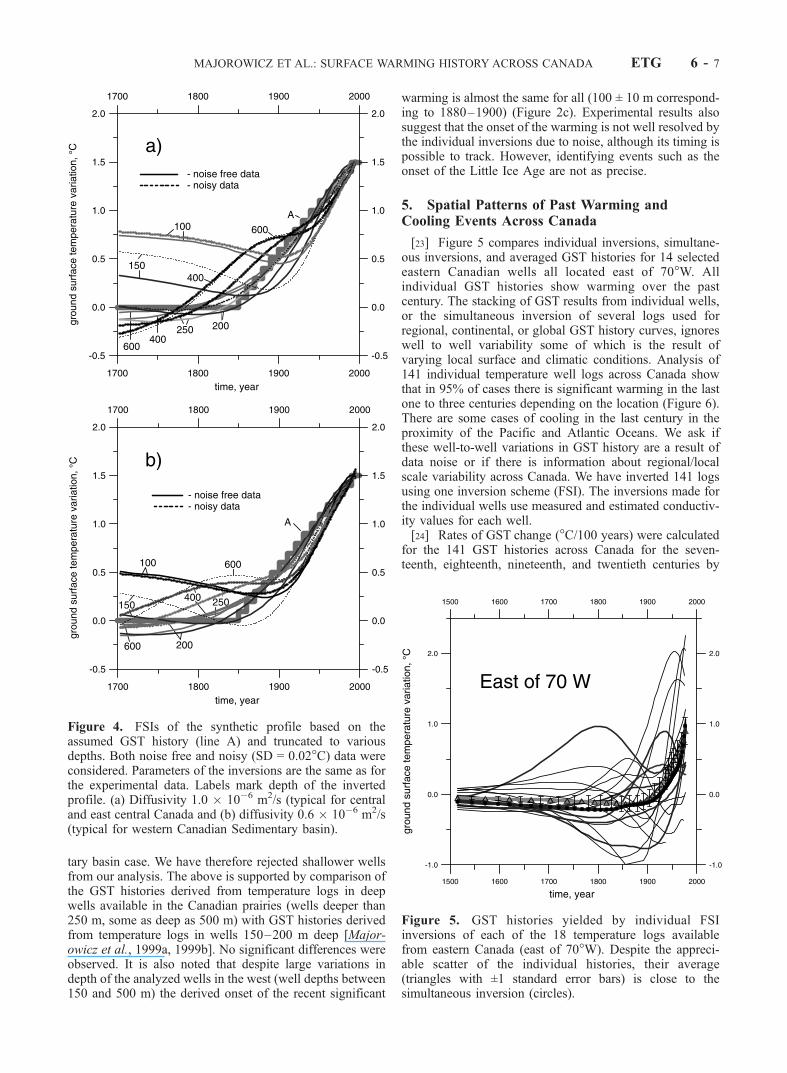
tary basin case. We have therefore rejected shallower wellsfrom our analysis. The above is supported by comparison ofthe GST histories derived from temperature logs in deepwells available in the Canadian prairies (wells deeper than250 m, some as deep as 500 m) with GST histories derivedfrom temperature logs in wells 150–200 m deep [Major-owicz et al., 1999a, 1999b]. No significant differences wereobserved. It is also noted that despite large variations indepth of the analyzed wells in the west (well depths between150 and 500 m) the derived onset of the recent significant
warming is almost the same for all (100 ± 10 m correspond-ing to 1880–1900) (Figure 2c). Experimental results alsosuggest that the onset of the warming is not well resolved bythe individual inversions due to noise, although its timing ispossible to track. However, identifying events such as theonset of the Little Ice Age are not as precise.
5. Spatial Patterns of Past Warming andCooling Events Across Canada
[23] Figure 5 compares individual inversions, simultane-ous inversions, and averaged GST histories for 14 selectedeastern Canadian wells all located east of 70�W. Allindividual GST histories show warming over the pastcentury. The stacking of GST results from individual wells,or the simultaneous inversion of several logs used forregional, continental, or global GST history curves, ignoreswell to well variability some of which is the result ofvarying local surface and climatic conditions. Analysis of141 individual temperature well logs across Canada showthat in 95% of cases there is significant warming in the lastone to three centuries depending on the location (Figure 6).There are some cases of cooling in the last century in theproximity of the Pacific and Atlantic Oceans. We ask ifthese well-to-well variations in GST history are a result ofdata noise or if there is information about regional/localscale variability across Canada. We have inverted 141 logsusing one inversion scheme (FSI). The inversions made forthe individual wells use measured and estimated conductiv-ity values for each well.[24] Rates of GST change (�C/100 years) were calculated
for the 141 GST histories across Canada for the seven-teenth, eighteenth, nineteenth, and twentieth centuries by
Figure 4. FSIs of the synthetic profile based on theassumed GST history (line A) and truncated to variousdepths. Both noise free and noisy (SD = 0.02�C) data wereconsidered. Parameters of the inversions are the same as forthe experimental data. Labels mark depth of the invertedprofile. (a) Diffusivity 1.0 � 10�6 m2/s (typical for centraland east central Canada and (b) diffusivity 0.6 � 10�6 m2/s(typical for western Canadian Sedimentary basin).
Figure 5. GST histories yielded by individual FSIinversions of each of the 18 temperature logs availablefrom eastern Canada (east of 70�W). Despite the appreci-able scatter of the individual histories, their average(triangles with ±1 standard error bars) is close to thesimultaneous inversion (circles).
MAJOROWICZ ET AL.: SURFACE WARMING HISTORY ACROSS CANADA ETG 6 - 7
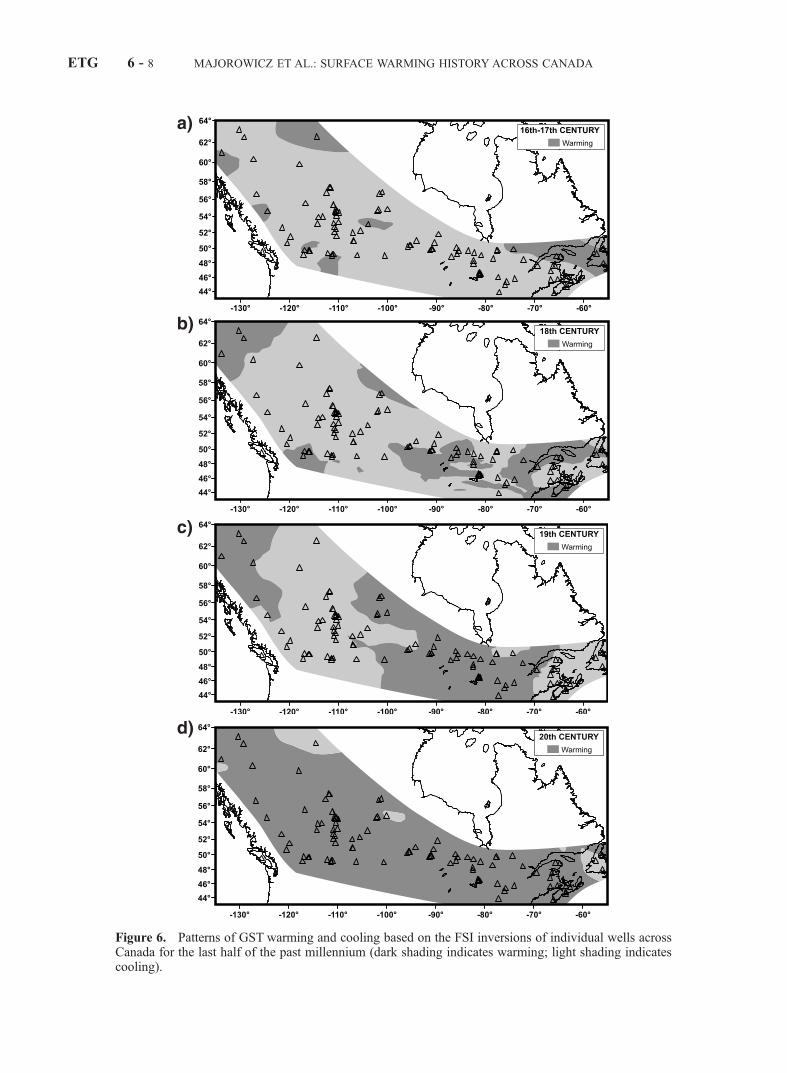
Figure 6. Patterns of GST warming and cooling based on the FSI inversions of individual wells acrossCanada for the last half of the past millennium (dark shading indicates warming; light shading indicatescooling).
ETG 6 - 8 MAJOROWICZ ET AL.: SURFACE WARMING HISTORY ACROSS CANADA
fitting a ramp function to the continuous GST historyobtained with FSI. In order to identify major spatial patternswe have examined warming events (positive rates of tem-perature change) and the cooling events (negative rates oftemperature change). Patterns of warming and coolingthrough the past five centuries across Canada are shownin Figure 6. Awestward retardation of the onset of warmingis identified. It is apparent from these general patterns thatthere are large regional differences in the timing of majorwarming events across Canada. Warming began in the eastin the late seventeenth and early eighteenth centuries andspread westward through the nineteenth and twentiethcenturies. While large areas of east central Canada werewarming in the nineteenth century, there were large areas ofwestern Canada that had no change and even cooled. Inaddition, the instrumental record identifies the greatestmagnitude of twentieth century warming to be in westernCanada (mostly east of the Cordillera) [Zhang et al., 2000].
6. Instrumental Record
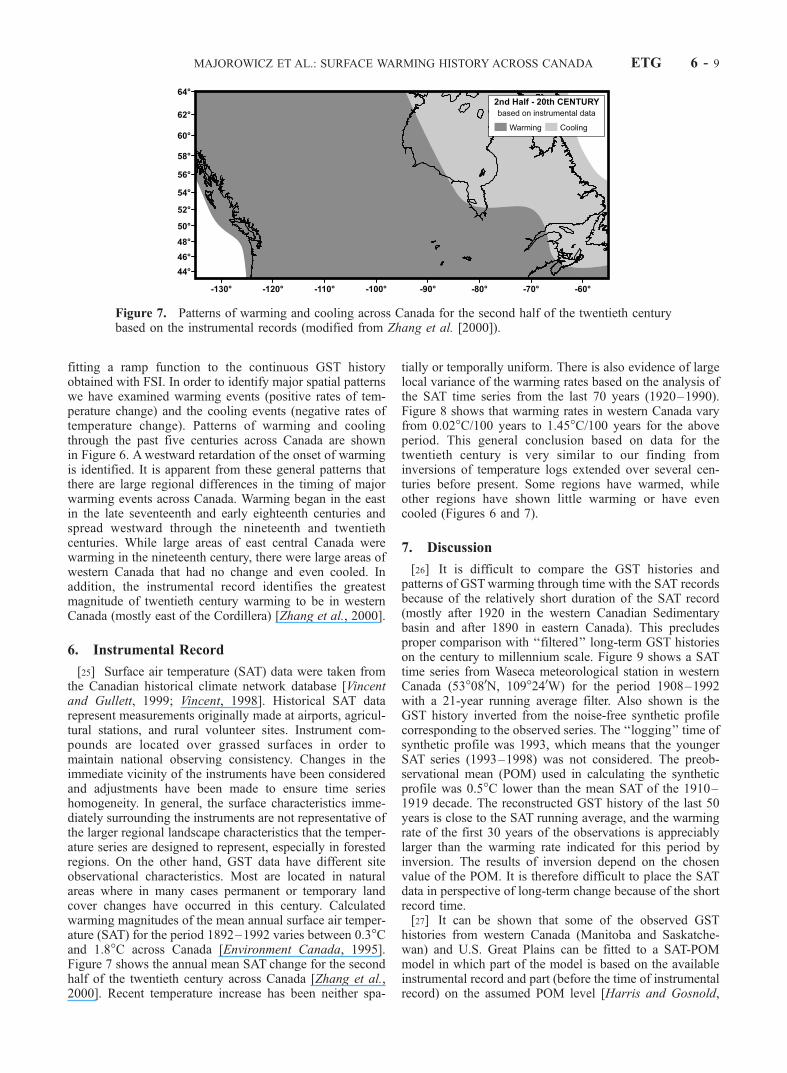
[25] Surface air temperature (SAT) data were taken fromthe Canadian historical climate network database [Vincentand Gullett, 1999; Vincent, 1998]. Historical SAT datarepresent measurements originally made at airports, agricul-tural stations, and rural volunteer sites. Instrument com-pounds are located over grassed surfaces in order tomaintain national observing consistency. Changes in theimmediate vicinity of the instruments have been consideredand adjustments have been made to ensure time serieshomogeneity. In general, the surface characteristics imme-diately surrounding the instruments are not representative ofthe larger regional landscape characteristics that the temper-ature series are designed to represent, especially in forestedregions. On the other hand, GST data have different siteobservational characteristics. Most are located in naturalareas where in many cases permanent or temporary landcover changes have occurred in this century. Calculatedwarming magnitudes of the mean annual surface air temper-ature (SAT) for the period 1892–1992 varies between 0.3�Cand 1.8�C across Canada [Environment Canada, 1995].Figure 7 shows the annual mean SAT change for the secondhalf of the twentieth century across Canada [Zhang et al.,2000]. Recent temperature increase has been neither spa-
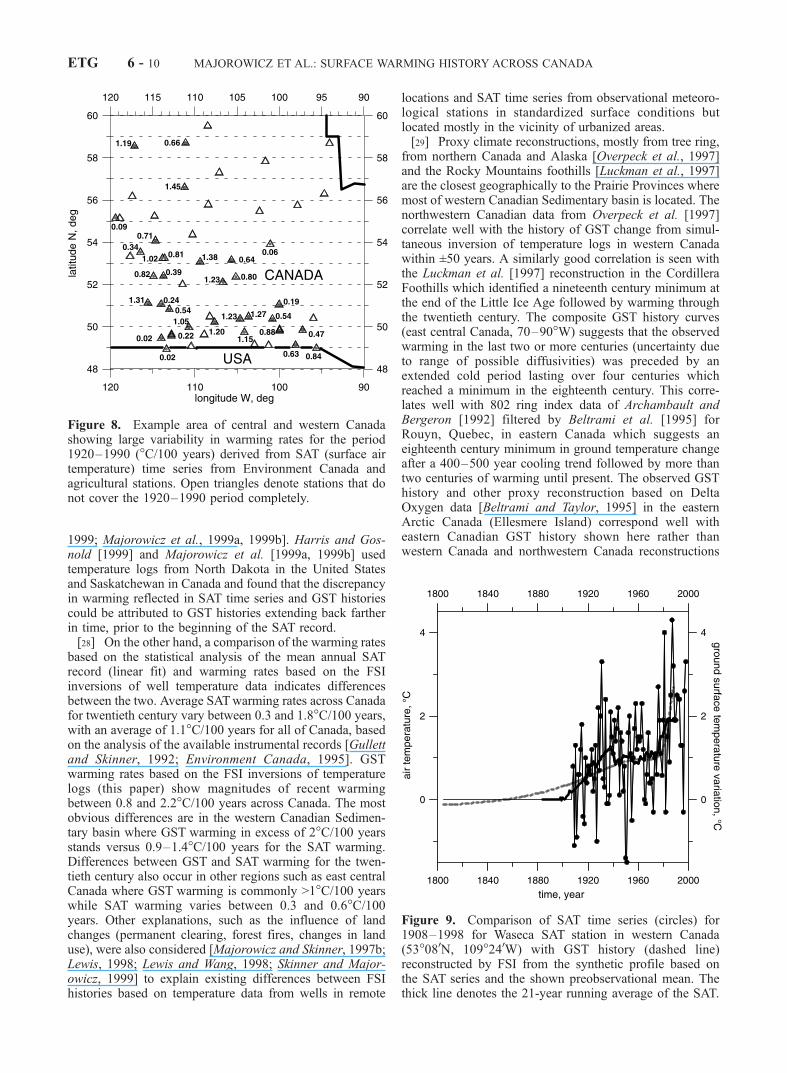
tially or temporally uniform. There is also evidence of largelocal variance of the warming rates based on the analysis ofthe SAT time series from the last 70 years (1920–1990).Figure 8 shows that warming rates in western Canada varyfrom 0.02�C/100 years to 1.45�C/100 years for the aboveperiod. This general conclusion based on data for thetwentieth century is very similar to our finding frominversions of temperature logs extended over several cen-turies before present. Some regions have warmed, whileother regions have shown little warming or have evencooled (Figures 6 and 7).
7. Discussion
[26] It is difficult to compare the GST histories andpatterns of GSTwarming through time with the SAT recordsbecause of the relatively short duration of the SAT record(mostly after 1920 in the western Canadian Sedimentarybasin and after 1890 in eastern Canada). This precludesproper comparison with ‘‘filtered’’ long-term GST historieson the century to millennium scale. Figure 9 shows a SATtime series from Waseca meteorological station in westernCanada (53�080N, 109�240W) for the period 1908–1992with a 21-year running average filter. Also shown is theGST history inverted from the noise-free synthetic profilecorresponding to the observed series. The ‘‘logging’’ time ofsynthetic profile was 1993, which means that the youngerSAT series (1993–1998) was not considered. The preob-servational mean (POM) used in calculating the syntheticprofile was 0.5�C lower than the mean SAT of the 1910–1919 decade. The reconstructed GST history of the last 50years is close to the SAT running average, and the warmingrate of the first 30 years of the observations is appreciablylarger than the warming rate indicated for this period byinversion. The results of inversion depend on the chosenvalue of the POM. It is therefore difficult to place the SATdata in perspective of long-term change because of the shortrecord time.[27] It can be shown that some of the observed GST
histories from western Canada (Manitoba and Saskatche-wan) and U.S. Great Plains can be fitted to a SAT-POMmodel in which part of the model is based on the availableinstrumental record and part (before the time of instrumentalrecord) on the assumed POM level [Harris and Gosnold,
Figure 7. Patterns of warming and cooling across Canada for the second half of the twentieth centurybased on the instrumental records (modified from Zhang et al. [2000]).
MAJOROWICZ ET AL.: SURFACE WARMING HISTORY ACROSS CANADA ETG 6 - 9
1999; Majorowicz et al., 1999a, 1999b]. Harris and Gos-nold [1999] and Majorowicz et al. [1999a, 1999b] usedtemperature logs from North Dakota in the United Statesand Saskatchewan in Canada and found that the discrepancyin warming reflected in SAT time series and GST historiescould be attributed to GST histories extending back fartherin time, prior to the beginning of the SAT record.[28] On the other hand, a comparison of the warming rates
based on the statistical analysis of the mean annual SATrecord (linear fit) and warming rates based on the FSIinversions of well temperature data indicates differencesbetween the two. Average SATwarming rates across Canadafor twentieth century vary between 0.3 and 1.8�C/100 years,with an average of 1.1�C/100 years for all of Canada, basedon the analysis of the available instrumental records [Gullettand Skinner, 1992; Environment Canada, 1995]. GSTwarming rates based on the FSI inversions of temperaturelogs (this paper) show magnitudes of recent warmingbetween 0.8 and 2.2�C/100 years across Canada. The mostobvious differences are in the western Canadian Sedimen-tary basin where GST warming in excess of 2�C/100 yearsstands versus 0.9–1.4�C/100 years for the SAT warming.Differences between GST and SAT warming for the twen-tieth century also occur in other regions such as east centralCanada where GST warming is commonly >1�C/100 yearswhile SAT warming varies between 0.3 and 0.6�C/100years. Other explanations, such as the influence of landchanges (permanent clearing, forest fires, changes in landuse), were also considered [Majorowicz and Skinner, 1997b;Lewis, 1998; Lewis and Wang, 1998; Skinner and Major-owicz, 1999] to explain existing differences between FSIhistories based on temperature data from wells in remote
locations and SAT time series from observational meteoro-logical stations in standardized surface conditions butlocated mostly in the vicinity of urbanized areas.[29] Proxy climate reconstructions, mostly from tree ring,
from northern Canada and Alaska [Overpeck et al., 1997]and the Rocky Mountains foothills [Luckman et al., 1997]are the closest geographically to the Prairie Provinces wheremost of western Canadian Sedimentary basin is located. Thenorthwestern Canadian data from Overpeck et al. [1997]correlate well with the history of GST change from simul-taneous inversion of temperature logs in western Canadawithin ±50 years. A similarly good correlation is seen withthe Luckman et al. [1997] reconstruction in the CordilleraFoothills which identified a nineteenth century minimum atthe end of the Little Ice Age followed by warming throughthe twentieth century. The composite GST history curves(east central Canada, 70–90�W) suggests that the observedwarming in the last two or more centuries (uncertainty dueto range of possible diffusivities) was preceded by anextended cold period lasting over four centuries whichreached a minimum in the eighteenth century. This corre-lates well with 802 ring index data of Archambault andBergeron [1992] filtered by Beltrami et al. [1995] forRouyn, Quebec, in eastern Canada which suggests aneighteenth century minimum in ground temperature changeafter a 400–500 year cooling trend followed by more thantwo centuries of warming until present. The observed GSThistory and other proxy reconstruction based on DeltaOxygen data [Beltrami and Taylor, 1995] in the easternArctic Canada (Ellesmere Island) correspond well witheastern Canadian GST history shown here rather thanwestern Canada and northwestern Canada reconstructions
Figure 8. Example area of central and western Canadashowing large variability in warming rates for the period1920–1990 (�C/100 years) derived from SAT (surface airtemperature) time series from Environment Canada andagricultural stations. Open triangles denote stations that donot cover the 1920–1990 period completely.
Figure 9. Comparison of SAT time series (circles) for1908–1998 for Waseca SAT station in western Canada(53�080N, 109�240W) with GST history (dashed line)reconstructed by FSI from the synthetic profile based onthe SAT series and the shown preobservational mean. Thethick line denotes the 21-year running average of the SAT.
ETG 6 - 10 MAJOROWICZ ET AL.: SURFACE WARMING HISTORY ACROSS CANADA
of past climate change by Overpeck et al. [1997] andMajorowicz and Skinner [2002].[30] Despite good correlation between SAT and FSI
series, there is a large difference in magnitude of warming.It is larger for the GST histories derived from well temper-ature data. This difference is also apparent from comparisonof global and continental GST histories from well temper-atures with relevant proxy reconstruction of SAT histories[Pollack et al., 1998; Huang et al., 2000]. Huang et al.[2000] attribute this difference partly to weaknesses of thetree ring method. While tree ring analyses are an importantsource of paleoclimatic reconstruction because of theirannual resolution and good spatial and temporal coverage,they generally involve some temporal detrending, a processthat is intended to mute long-term growth trends that may bepresent in the data. In addition, tree ring growth response isgenerally limited to the growing season. For this reason thedirect physical method of well temperatures may have a roleas a useful complement to other proxy methods.[31] The observed increase in globally averaged annual
surface air temperature (SAT) over the past century, asmeasured at screen level (1.5 m above the ground surface),has been estimated between 0.3 and 0.6�C [IPCC, 2001].The temperature increase has been neither spatially nortemporally uniform. Some regions have warmed, whileother regions have shown little change, or have even cooled.For example, annual SAT trends from 1950 to 1995 forCanada [Zhang et al., 2000] indicate that western andnorthwestern regions of the country show amplified warm-ing ranging from 0.5 to 2.0�C, while northeastern regionshave cooled by a similar magnitude. Lower latitude areas ofeastern Canada show warming; however, it is much lessthan in the west. Also, considerably less warming, and evencooling, has occurred over the North Atlantic and NorthPacific and along the oceanic margins of the North Amer-ican continent [Houghton, 1996]. Most of the SAT warminghas occurred during winter and spring in the continentalinterior.[32] The spatial variation in warming and cooling over
the instrumental record around the Northern Hemisphereand globally [IPCC, 2001] and across Canada [Gullett andSkinner, 1992; Zhang et al., 2000] is also evident inpreinstrumental times, as identified from inversions oftemperature logs from all continents [Pollack et al., 1998;Huang et al., 2000] and across Canada (this work). Thetiming of the onset of warming in east central Canada(eighteenth to nineteenth century) and in western Canada(nineteenth century), as well as the regional variations inwarming magnitudes, are recognizably different (Figure 3).The cooling trends of the ‘‘Little Ice Age’’ and subsequentwarming trends are common in all regions; however, theirtiming and magnitudes are significantly different. The onsetof earlier warming in east central Canada precedes that ofthe ‘‘industrial age’’ by century or more.[33] An explanation of these difference is not within the
scope of this paper; however, some suggestions explainingsuch differences can be made. The greater warming of thecontinental interiors in the past is confirmed here by theGST history for the central western Canadian Plains (east ofthe Cordillera) and also by the Ontario and western Quebecdata. This may be due both to the moderating effect of theoceans on the coastal margins and to positive feedback
related to the hydrologic cycle, including the timing offreezing and melting, and changes in the area distribution ofice and snow on land. In Canada, the greatest warming inthe last half of the twentieth century occurred in winter andspring the time of year when reductions in surface snow andice amounts can greatly affect regional climate.[34] Also, Canada is located entirely in mid to high
latitudes where interannual and longer-term variations inatmospheric circulation patterns can have considerableeffect on regional climate. A persistent change in the normaljet stream track will affect temperatures differently invarious regions of the country by changing the relativefrequency of their exposure to warm and cold air masses.An additional factor contributing to the observed differencescan be anthropogenic related to land use change. Settlementand land clearing began in western Canada in the earlytwentieth century and progressed northward throughout thecentury. Settlement in eastern Canada was much earlier, inthe mid to late nineteenth century. It is unlikely that thiseffect alone could explain east–west differences. The mainforcing is likely due to climatic warming [Skinner andMajorowicz, 1999]; however, land cover changes due todeforestation and conversion of grassland to agriculturalland can dramatically alter surface temperature and thesubsurface temperature field [Cermak et al., 1992; Major-owicz and Skinner, 1997a, 1997b; Skinner and Majorowicz,1999; Lewis and Wang, 1998; Lewis, 1998]. This influencein western central and northern Canada is limited to lastdecades of the twentieth century [Majorowicz and Skinner,1997a, 1997b; Skinner and Majorowicz, 1999].
8. Conclusion
[35] The analysis of the map patterns of the GST historyacross Canada based on inversions of temperature logsshows a systematic east-to-west retardation in the onset ofthe recent warming through eighteenth to the twentiethcenturies. The western Canadian region was the last towarm, beginning in the late nineteenth century. However,the western Canadian region has experienced the largestwarming magnitudes in Canada since that time. This isconfirmed both by the instrumental SAT records and by theFSI reconstruction of GST history from well temperaturedata. It is important to note that in eastern Canada thewarming began �100 years before the beginning of theindustrial age. In western Canada the onset of the latestwarming began with the industrial age.
[36] Acknowledgments. We would like to acknowledge P. Y. Shen ofthe University of Western Ontario, the anonymous reviewer, and theAssociate Editor (anonymous) for very helpful comments.
ReferencesArchambault, S., and Y. A. Bergeron, 802 year tree ring chronology fromQuebec boreal forest, Can. J. For. Res., 22, 674–682, 1992.
Bachu, S., Regional-scale geothermal and hydrodynamic regimes in theAlberta basin: A synthesis, in Geothermics in Basin Analysis, edited byA. Foerster and D. F. Merriam, pp. 81–90, Kluwer Acad., Norwell,Mass., 1999.
Beach, R. D. W., F. W. Jones, and J. A. Majorowicz, Heat flow and heatgeneration for the Churchill of western Canadian sedimentary basin,Geothermics, 16, 1–16, 1987.
Beltrami, H., On the relationship between ground temperature histories andmeteorological records: a report on the Pomquet station, Global Planet.Change, 29, 327–348, 2001.
MAJOROWICZ ET AL.: SURFACE WARMING HISTORY ACROSS CANADA ETG 6 - 11
Beltrami, H., and J.-C. Mareshal, Ground temperature changes in easternCanada: Borehole temperature evidence compared with proxy data, TerraNova, 5, 21–28, 1993.
Beltrami, H., and A. E. Taylor, Records of climatic change in the CanadianArctic: Towards calibrating oxygen isotope data with geothermal data,Global Planet. Change, 11, 127–138, 1995.
Beltrami, H., A. M. Jessop, and J.-C. Mareschal, Ground temperature his-tories in eastern and central Canada from geothermal measurements:Evidence of climatic change, Palaeogr. Palaeoclimatol. Palaeoecol.,98, 167–184, 1992.
Beltrami, H., D. S. Chapman, and Y. Bergeron, Reconstruction of highresolution ground temperature histories combining dendrochronologicaland geothermal data, Earth Planet. Sci. Lett., 136, 437–445, 1995.
Beltrami, H., L. Cheng, and J. C. Mareschal, Simultaneous inversion ofborehole temperature data for determination of ground surface tempera-ture history, Geophys. J. Int., 129, 311–318, 1997.
Blackwell, D. D., and G. R. Beardsmore, High-resolution temperature logsin a petroleum setting: Examples and applications, in Geothermics inBasin Analysis, edited by A. Foerster and D. F. Merriam, pp. 1–34,Kluwer Acad., Norwell, Mass., 1999.
Cermak, V., L. Bodri, and J. Safanda, Underground temperature fields andchanging climate: Evidence from Cuba, Palaeogr. Palaeoclimatol. Pa-laeoecol., 97, 325–337, 1992.
Cermak, V., J. Safanda, M. Kresl, P. Dedecek, and L. Bodri, Recent climatewarming: Surface air temperature series and geothermal evidence, Stud.Geophys. Geod., 44, 430–441, 2000.
Environment Canada, The state of Canada’s climate: Monitoring variabilityand change, State Environ. Rep. 95-1, 52 pp., Ottawa, 1995.
Guillou-Frottier, L., J.-C. Mareshal, and J. Musset, Ground surface tem-perature history in central Canada inferred from 10 selected boreholetemperature profiles, J. Geophys. Res., 103, 7385–7397, 1998.
Gullett, D. W., and W. R. Skinner, The state of Canada’s climate: Tempera-ture change in Canada 1895–1991, State Environ. Rep. 92-2, 36 pp.,Atmos. Environ. Serv., Environ. Can., Downsview, Ontario, 1992.
Harris, R. N., and W. D. Gosnold, Comparisons of borehole temperature-depth profiles and surface air temperatures in the northern plains of theUSA, Geophys. J. Int., 138, 541–548, 1999.
Houghton, R. A., Land use change and the carbon cycle, Global ChangeBiol., 2, 275–287, 1996.
Huang, S., and H. N. Pollack, Global borehole temperature database forclimate reconstruction, IGBP Pages/World Data Cent.–A for Paleocli-matol. Data Contrib. Ser. 1998-044, NOAA/NGDC Paleoclimatol. Pro-gram, Boulder, Colo., 1998.
Huang, S., H. N. Pollack, and P.-Y. Shen, Temperature trends over the pastfive centuries reconstructed from borehole temperatures, Nature, 403,756–758, 2000.
Intergovernmental Panel on Climate Change (IPCC), 2001: ClimateChange, Summary for Policymakers and Technical Summary of theWorking Group I Report of the IPCC, WMO, UNEP, 98 pp., CambridgeUniv. Press, New York, 2001.
Jessop, A. M., Thermal Geophysics, Dev. Solid Earth Geophys., vol. 17,306 pp., Elsevier Sci., New York, 1990.
Jessop, A. M., T. J. Lewis, A. S. Judge, A. E. Taylor, and M. J. Drury,Terrestrial heat flow in Canada, Tectonophysics, 103, 239–261, 1984.
Kane, D. L., K. M. Hinkel, D. J. Goering, L. D. Hinzman, and S. I. Outcalt,Non-conductive heat transfer associated with frozen soils, Global Planet.Change, 29, 275–292, 2001.
Kukkonen, I. T., W. D. Gosnold, and J. Safanda, Anomalously low heatflow density in eastern Karelia Baltic Shield: A possible paleoclimaticsignature, Tectonophysics, 291, 235–249, 1998.
Lachenbruch, A. H., and B. V. Marshall, Changing climate: Geothermalevidence from permafrost in the Alaskan Arctic, Science, 234, 689–696,1986.
Lewis, T. J., The effect of deforestation on ground surface temperatures,Global Planet. Change, 18, 1–13, 1998.
Lewis, T. J., and K. Wang, Geothermal evidence for deforestation inducedwarming: Implications for the climatic impact of land development, Geo-phys. Res. Lett., 25, 535–538, 1998.
Luckman, B. H., K. R. Briffa, P. D. Jones, and F. H. Schweingruber, Tree-ring based reconstruction of summer temperatures at the Columbia Ice-field, Alberta, Canada, AD 1073-1983, Holocene, 7(4), 375–389, 1997.
Majorowicz, J. A., and J. Safanda, GST history from inversions of under-ground temperatures—Case study, Tectonophysics, 291, 287–298, 1998.
Majorowicz, J. A., and J. Safanda, Composite surface temperature historyfrom simultaneous inversion of borehole temperatures in western Cana-dian plains, Global Planet. Change, 29, 231–239, 2001.
Majorowicz, J. A., and W. R. Skinner, Anomalous ground warming versussurface air warming in the Canadian Prairie provinces, Clim. Change, 35,485–500, 1997a.
Majorowicz, J. A., and W. R. Skinner, Potential causes of differencesbetween ground and surface air temperature warming across differentecozones in Alberta, Canada, Global Planet. Change, 15, 79–91, 1997b.
Majorowicz, J. A., and W. R. Skinner, Reconstruction of the surface warm-ing history of western interior Canada from borehole temperature profilesand other climatic information, Clim. Res., 16, 157–167, 2002.
Majorowicz, J. A., J. Safanda, R. Harris, and W. R. Skinner, Large groundsurface temperature changes of the last three centuries inferred fromborehole temperatures in the southern Canadian prairies-Saskatchewan,Global Planet. Change, 20, 227–241, 1999a.
Majorowicz, J. A., G. Garven, A. Jessop, and C. Jessop, Present heat flowalong a profile across the Western Canada Sedimentary Basin: The extentof hydrodynamic influence, in Geothermics in Basin Analysis, edited byA. Foerster and D. F. Merriam, pp. 61–80, Kluwer Acad., Norwell,Mass., 1999b.
Mann, M. E., R. S. Bradley, and M. Hughes, Global scale temperaturepatterns and climate forcing over the past six centuries, Science, 392,779–787, 1998.
Mareschal, J.-C., C. Pinet, C. Gariepy, C. Jaupart, G. Bienfait, G. DallaColetta, J. Joliet, and R. Lapointe, New heat flow density and radiogenicheat production data in the Canadian shield and Quebec Appalachians,Can. J. Earth Sci., 26, 845–852, 1989.
Overpeck, J., et al., Arctic environmental change of the last four centuries,Science, 278, 1251–1256, 1997.
Pinet, C., C. Jaupart, J.-C. Mareschal, C. Gariepy, G. Bienfait, and R.Lapointe, Heat flow and structure of the lithosphere in eastern Canada,J. Geophys. Res., 96, 19,941–19,963, 1991.
Pollack, H. N., and D. S. Chapman, Underground record of changingclimate, Sci. Am., 286(6), 44–50, 1993.
Pollack, H. N., P. Y. Shen, and S. Huang, Inference of ground surfacetemperature history from subsurface temperature data: Interpreting en-sembles of borehole logs, Pure Appl. Geophys., 147, 537–550, 1996.
Pollack, H. N., S. Huang, and P.-Y. Shen, Climate change record in subsur-face temperatures: A global perspective, Science, 282, 279–281, 1998.
Putnam, S. N., and D. S. Chapman, A geothermal climate change observa-tory: First year results from Emigrant Pass in northwest Utah, J. Geophys.Res., 101, 21,877–21,890, 1996.
Safanda, J., V. Cermak, and L. Bodri, Climate history inferred from bore-hole temperatures, data from Czech Republic, Surv. Geophys., 18, 197–212, 1997.
Schmidt, W. L., W. D. Gosnold, and J. W. Enz, A decade of air-groundtemperature exchange from Fargo, North Dakota, Global Planet. Change,29, 311–325, 2001.
Shen, P. Y., and A. E. Beck, Least squares inversion of borehole tempera-ture measurements in functional space, J. Geophys. Res., 96, 19,965–19,979, 1991.
Shen, P. Y., H. N. Pollack, S. Huang, and K. Wang, Effects of subsurfaceheterogeneity on the inference of climatic change from borehole tempera-ture data: Model studies and field examples from Canada, J. Geophys.Res., 100, 6383–6396, 1995.
Shen, P. Y., H. N. Pollack, and S. Huang, Inference of ground surfacetemperature history from borehole temperature data: A comparison oftwo inverse methods, Global Planet. Change, 14, 49–57, 1996.
Skinner, W. R., and J. A. Majorowicz, Regional climatic warming andassociated twentieth century land-cover changes in north-western NorthAmerica, Clim. Res., 12, 39–52, 1999.
Taylor, A. E., M. Burgess, A. Judge, and V. S. Allen, Canadian GeothermalData Collection—Northern Wells 1981, Geotherm. Ser., vol. 13, 153 pp.,Earth Phys. Branch, Energy, Mines, and Resour., Ottawa, Canada, 1982.
Vincent, L., A technique for the identification of inhomogeneities in Cana-dian temperature series, J. Clim., 11, 1094–1104, 1998.
Vincent, L., and D. W. Gullett, Creation of historic and homogeneousdatasets for climate change analyses in Canada, Int. J. Clim., 19,1375–1388, 1999.
Wang, K., D. S. Belton, P. Y. Shen, and T. J. Lewis, Differences in recentground surface surface warming in eastern and western Canada: Evidencefrom borehole temperatures, Geophys. Res. Lett., 21, 2689–2692, 1994.
Zhang, X., L. A. Vincent, W. D. Hogg, and A. Niitsoo, Temperature andprecipitation trends in Canada during the 20th century, Atmos. Ocean, 38,395–429, 2000.
�����������������������J. Majorowicz, Northern Geothermal Consultants, 105 Carlson Close,
Edmonton, Alberta, Canada T6R 2J8. ([email protected])J. Safanda, Geophysical Institute, Czech Academy of Sciences, Bocni II,
Sporilov, Czech Republic. ([email protected])W. Skinner, Climate Research Branch, Meteorological Service of Canada,
Environment Canada, 4905 Dufferin Street, Downsview, Ontario, CanadaM3H 5T4. ([email protected])
ETG 6 - 12 MAJOROWICZ ET AL.: SURFACE WARMING HISTORY ACROSS CANADA
Copyright © 2022 FDOKUMEN