Conservation implications of omitting narrow-ranging taxa from species distribution models, now and...
14
BIODIVERSITY RESEARCH Conservation implications of omitting narrow-ranging taxa from species distribution models, now and in the future Philip J. Platts 1† *, Raquel A. Garcia 2,3,4† , Christian Hof 5 , Wendy Foden 6,7 , Louis A. Hansen 2 , Carsten Rahbek 2,8 and Neil D. Burgess 2,9,10† 1 Environment Department, University of York, Heslington, YO10 5DD York, UK, 2 Center for Macroecology, Evolution and Climate, Natural History Museum of Denmark, University of Copenhagen, Copenhagen, Denmark, 3 Department of Biodiversity and Evolutionary Biology, National Museum of Natural Sciences, CSIC, Calle Jos e Gutierrez Abascal, 28006 Madrid, Spain, 4 Rui Nabeiro Biodiversity Chair, University of Evora, CIBIO, Largo dos Colegiais, 7000 Evora, Portugal, 5 Biodiversity and Climate Research Centre (BiK-F) & Senckenberg Gesellschaft f€ ur Naturforschung, Senckenberganlage 25, 60325 Frankfurt, Germany, 6 School of Animal, Plant and Environmental Sciences, University of the Witwatersrand, 2050 Johannesburg, South Africa, 7 Climate Change Specialist Group, IUCN Species Survival Commission, Gland, Switzerland, 8 Department of Life Sciences, Faculty of Natural Sciences, Imperial College London, Silwood Park, Buckhurst Road, Ascot, SL5 7PY Berkshire, UK, 9 United Nations Environment Programme World Conservation Monitoring Centre, 219 Huntingdon Road, CB3 0DL Cambridge, UK, 10 World Wildlife Fund–US, 1250 24th Street NW, Washington, 20037 DC, USA † Contributed equally. *Correspondence: Philip J. Platts, Environment Department, University of York, Heslington, York YO10 5DD, UK. E-mail: [email protected] ABSTRACT Aim Species distribution modelling (SDM) is commonly used to predict spatial patterns of biodiversity across sets of taxa with sufficient distributional records, while omitting narrow-ranging species due to statistical constraints. We investi- gate the implications of this dichotomy for conservation priority setting in Africa, now and in the future. Location Sub-Saharan Africa (excluding islands). Methods We use multivariate ordination to characterize climatic niches of 733 African amphibians, distinguishing between species eligible for large-scale cor- relative SDM (≥ 10 records at 1° resolution) and those omitted due to insuffi- cient records. Species distributions are projected under current and future climates using simple niche envelopes. Empirical priorities are derived sepa- rately on the eligible and omitted sets and compared with three existing large- scale conservation schemes. Results Of the 733 amphibian species, 400 have too few records for correlative SDM, including 92% of those threatened with extinction (VU/EN/CR). Omit- ted species typically occupy topographically complex areas with cooler, wetter and less seasonal climates, which are projected to experience lower rates of cli- matic change. Priorities derived from omitted species have greater congruence with existing conservation schemes. Under future climate, priorities for eligible species shift towards those for omitted species. Similarly, while omitted species often lose climate space at 1° resolution, persistent populations tend to coin- cide with existing conservation schemes. Main conclusions Under current climate, statistical restrictions on SDM sys- tematically downplay important sites for narrow-ranging and threatened spe- cies. This issue spans taxonomic groups and is only partially mitigated by modelling at finer scales. Effective biodiversity conservation, now and in the future, relies on our capacity to project geographic determinants of all species, and thus, a wider range of approaches is essential. We conclude, however, that future persistence among narrow- and wide-ranging species alike will be highest within sites already identified for conservation investment and that the focus on these sites ought to be maintained. Keywords Africa, amphibians, biodiversity, climate change, conservation priorities, threa- tened species. DOI: 10.1111/ddi.12244 ª 2014 John Wiley & Sons Ltd http://wileyonlinelibrary.com/journal/ddi 1307 Diversity and Distributions, (Diversity Distrib.) (2014) 20, 1307–1320 A Journal of Conservation Biogeography Diversity and Distributions
-
Upload
independent -
Category
Documents
-
view
3 -
download
0
Transcript of Conservation implications of omitting narrow-ranging taxa from species distribution models, now and...
BIODIVERSITYRESEARCH
Conservation implications of omittingnarrow-ranging taxa from speciesdistribution models, now and in thefuturePhilip J. Platts1†*, Raquel A. Garcia2,3,4†, Christian Hof5, Wendy Foden6,7,
Louis A. Hansen2, Carsten Rahbek2,8 and Neil D. Burgess2,9,10†
1Environment Department, University of
York, Heslington, YO10 5DD York, UK,2Center for Macroecology, Evolution and
Climate, Natural History Museum of
Denmark, University of Copenhagen,
Copenhagen, Denmark, 3Department of
Biodiversity and Evolutionary Biology,
National Museum of Natural Sciences,
CSIC, Calle Jos�e Gutierrez Abascal, 28006
Madrid, Spain, 4Rui Nabeiro Biodiversity
Chair, University of �Evora, CIBIO, Largo
dos Colegiais, 7000 �Evora, Portugal,5Biodiversity and Climate Research Centre
(BiK-F) & Senckenberg Gesellschaft f€ur
Naturforschung, Senckenberganlage 25,
60325 Frankfurt, Germany, 6School of
Animal, Plant and Environmental Sciences,
University of the Witwatersrand, 2050
Johannesburg, South Africa, 7Climate
Change Specialist Group, IUCN Species
Survival Commission, Gland, Switzerland,8Department of Life Sciences, Faculty of
Natural Sciences, Imperial College London,
Silwood Park, Buckhurst Road, Ascot, SL5
7PY Berkshire, UK, 9United Nations
Environment Programme World
Conservation Monitoring Centre, 219
Huntingdon Road, CB3 0DL Cambridge,
UK, 10World Wildlife Fund–US, 1250 24th
Street NW, Washington, 20037 DC, USA
†Contributed equally.
*Correspondence: Philip J. Platts,
Environment Department, University of York,
Heslington, York YO10 5DD, UK.
E-mail: [email protected]
ABSTRACT
Aim Species distribution modelling (SDM) is commonly used to predict spatial
patterns of biodiversity across sets of taxa with sufficient distributional records,
while omitting narrow-ranging species due to statistical constraints. We investi-
gate the implications of this dichotomy for conservation priority setting in
Africa, now and in the future.
Location Sub-Saharan Africa (excluding islands).
Methods We use multivariate ordination to characterize climatic niches of 733
African amphibians, distinguishing between species eligible for large-scale cor-
relative SDM (≥ 10 records at 1° resolution) and those omitted due to insuffi-
cient records. Species distributions are projected under current and future
climates using simple niche envelopes. Empirical priorities are derived sepa-
rately on the eligible and omitted sets and compared with three existing large-
scale conservation schemes.
Results Of the 733 amphibian species, 400 have too few records for correlative
SDM, including 92% of those threatened with extinction (VU/EN/CR). Omit-
ted species typically occupy topographically complex areas with cooler, wetter
and less seasonal climates, which are projected to experience lower rates of cli-
matic change. Priorities derived from omitted species have greater congruence
with existing conservation schemes. Under future climate, priorities for eligible
species shift towards those for omitted species. Similarly, while omitted species
often lose climate space at 1° resolution, persistent populations tend to coin-
cide with existing conservation schemes.
Main conclusions Under current climate, statistical restrictions on SDM sys-
tematically downplay important sites for narrow-ranging and threatened spe-
cies. This issue spans taxonomic groups and is only partially mitigated by
modelling at finer scales. Effective biodiversity conservation, now and in the
future, relies on our capacity to project geographic determinants of all species,
and thus, a wider range of approaches is essential. We conclude, however, that
future persistence among narrow- and wide-ranging species alike will be highest
within sites already identified for conservation investment and that the focus
on these sites ought to be maintained.
Keywords
Africa, amphibians, biodiversity, climate change, conservation priorities, threa-
tened species.
DOI: 10.1111/ddi.12244ª 2014 John Wiley & Sons Ltd http://wileyonlinelibrary.com/journal/ddi 1307
Diversity and Distributions, (Diversity Distrib.) (2014) 20, 1307–1320A
Jou
rnal
of
Cons
erva
tion
Bio
geog
raph
yD
iver
sity
and
Dis
trib
utio
ns
INTRODUCTION
Limited funds for tackling unprecedented rates of biodiver-
sity loss dictate that spatial priorities for conservation must
be identified and periodically revised (e.g. Margules & Pres-
sey, 2000; Butchart et al., 2010). In general, biologically rich
areas with high irreplaceability, which are also vulnerable to
degradation and loss, are given the highest ranks (e.g. Statt-
ersfield et al., 1998; Myers et al., 2000; Wilson et al., 2006).
In recent years, the predicted (modelled) impact of climate
change on species distributions has become an additional
consideration for conservation priority setting (Hannah
et al., 2002; Huntley et al., 2006; Dawson et al., 2011).
The collection of biological data is time-consuming and
expensive, particularly for rare species (Ahrends et al., 2011).
Despite its importance for conservation, such work is chroni-
cally underfunded (Balmford & Gaston, 1999; Da Fonseca
et al., 2000). In prioritizing sites for conservation, the near-
term solution is to project existing distributional data across
space and, increasingly, into the future, using environmental
correlates (Pressey et al., 2000). Correlative models that pre-
dict species distributions under climate change are frequently
applied in the scientific literature and are widely cited by
conservation planners, who seek to ensure that priorities
remain valid under future climates (Williams et al., 2005;
Hole et al., 2009; Shoo et al., 2011).
Considerable literature exists on species distribution mod-
elling (SDM), its strengths and limitations (e.g. Wiens et al.,
2009; Ara�ujo & Peterson, 2012; Franklin, 2013). For conserva-
tion prioritization, perhaps the most fundamental constraint
is that, for many SDM methods, only species with adequate
numbers of spatially distinct occurrence records can be mod-
elled (Stockwell & Peterson, 2002). In tropical regions, which
contain most of the world’s biodiversity, species are more
often narrow ranging than in temperate zones (Wiens et al.,
2006) and even common species’ distributions tend to be less
well documented (Da Fonseca et al., 2000; K€uper et al., 2006;
Feeley & Silman, 2011). Consequently, species that have tradi-
tionally been used to define conservation priorities are the
ones most likely to be omitted from correlative SDM. An
important question for conservation planning is whether this
omission of narrow-ranging species results in a systematic
bias, now or in the future, towards or away from sites priori-
tized under existing conservation schemes.
We address this question using African amphibians as an
exemplar group. Amphibians contain many narrow-ranging
and threatened species, but also wide-ranging species more
typical of higher latitudes. A further motivation for studying
amphibians is the high rates of threat they are predicted to
face from climate change, habitat loss and disease, especially
in Africa (Sodhi et al., 2008; Hof et al., 2011a; Foden et al.,
2013). Comparing species eligible for correlative SDM with
those most often omitted due to statistical constraints, we
aim to establish whether this dichotomy: (1) restricts SDM
to an unrepresentative sample of present-day conditions and/
or exposure to climate change and (2) has potential to
undermine or reinforce existing conservation priority
schemes, now or in the future. We consider three schemes
that have been widely used by international organizations to
allocate conservation funds: Conservation International’s
Hotspots, BirdLife International’s Endemic Bird Areas and
the World Wildlife Fund’s Global 200 set of ecoregions. The
extent to which our results generalize across spatial resolu-
tions and taxonomic groups is discussed, and avenues for
uniting established conservation prioritization procedures
with SDM projections under climate change are identified.
METHODS
Amphibian data
Distributional data were collated for 790 species of amphib-
ian found only on mainland Africa south of the Sahara (Hof
et al., 2011a, with database updated to February 2014). The
taxonomy of this database was matched to the IUCN list of
amphibians for the same region (www.iucnredlist.org,
accessed February 2014). The IUCN list includes 747
amphibian species, of which 733 were matched to our data-
base criteria (Table S1 in Supporting Information). The spe-
cies data are reliable to 1° resolution (111 km at the
equator), consistent with most studies of continental-scale
biodiversity pattern and prioritization under climate change
(e.g. McClean et al., 2005; Huntley et al., 2006; Hole et al.,
2009; Garcia et al., 2012).
Each amphibian was allocated to one of two species sets:
those that are eligible for correlative SDM at 1° resolution
(N = 333) and those that are not (N = 400), hereafter
referred to, respectively, as ‘eligible’ and ‘omitted’ amphibi-
ans (Fig. 1 and Table S1). We used a ten-record cut-off for
the minimum number of records required for SDM. Stricter
restrictions have been suggested, such as 50 records in total
or ten records per predictor variable in the model (Harrell
et al., 1984; Stockwell & Peterson, 2002; Wisz et al., 2008).
Depending on the threshold (10–50 records), 33–46% of
omitted amphibians would be regarded as ‘rare’ according to
standard definitions in conservation biology (i.e. lower quar-
tile of range sizes within the group; Gaston, 1994). For both
species sets, we identified the proportion of species listed as
Threatened on The IUCN Red List under different threat
categories (Tables S1 and S2).
Climate data
We selected four, weakly collinear (Pearson’s |r| < 0.7; Dor-
mann et al., 2013), climatic predictor variables, which pro-
vide an equal balance between temperature and rainfall and
between annual and seasonal conditions: mean annual tem-
perature, annual temperature range, annual rainfall and rain-
fall seasonality. The latter reflects rainfall contrasts across
seasons (Rs) in relation to the total annual rainfall (RT):
∑s = 1..4 |Rs – RT/4|/RT (Walsh & Lawler, 1981).
1308 Diversity and Distributions, 20, 1307–1320, ª 2014 John Wiley & Sons Ltd
P. J. Platts et al.
Climate grids for the baseline period (1950–2000) were
from WorldClim (Hijmans et al., 2005), using mean values
to resample from 30″ (1 km) to the 1° resolution of the
species data. For future climate (2071–2100), we used a
multimodel average over eight CMIP5 GCMs (CanESM2,
CNRM-CM5, EC-EARTH, GFDL-ESM2G, HadGEM2-ES,
MIROC5, MPI-ESM-LR and NorESM1-M). Each GCM was
dynamically downscaled to 0.44° (c. 50 km) using the
SMHI-RCA4 regional climate model, debiased against
WorldClim baselines (Platts et al., 2014) and then resam-
pled to the 1° resolution of the species data. Two represen-
tative concentration pathways of the IPCC-AR5 were
considered: RCP4.5 and RCP8.5, which here project mean
temperature anomalies across sub-Saharan Africa of, respec-
tively, 2.6 �C and 4.5 �C by 2071-2100 relative to the
WorldClim baseline.
Niche differences between species
Using multivariate ordination (Outlying Mean Index, OMI;
Dol�edec et al., 2000), we assessed differences between
observed distributions for eligible and omitted species in
terms of (1) climatic niche space and (2) projected exposure
to change (future climate anomalies). The OMI identifies
ordination axes that optimize separation between species
occurrences and quantifies niche position and niche breadth
for each species along those axes. Niche position, or margin-
ality, is measured as the deviation of the mean climatic con-
ditions – or future climate anomalies – occupied by a
species (its centroid) from the mean conditions/anomalies of
the study region (origin of the axes). The larger the devia-
tion, the more marginal the species’ niche position is in rela-
tion to the study region as a whole. Niche breadth, or
tolerance, is quantified as the dispersion of climatic condi-
tions/anomalies occupied by species, with larger dispersion
indicating higher tolerance or more variable exposure to
change.
Anomalies for temperature variables were computed by
subtracting the future from the present values; anomalies for
rainfall variables were given by the ratio of future to present
values (Fig. S2 in Supporting Information). For each OMI
analysis, we performed randomization tests (1000 permuta-
tions) to determine whether species’ niche positions or expo-
sure to change) differed significantly from random
expectations. Calculations were performed in R using the
ade4 package (Chessel et al., 2004; R-Core-Team, 2012).
(a)
(b)
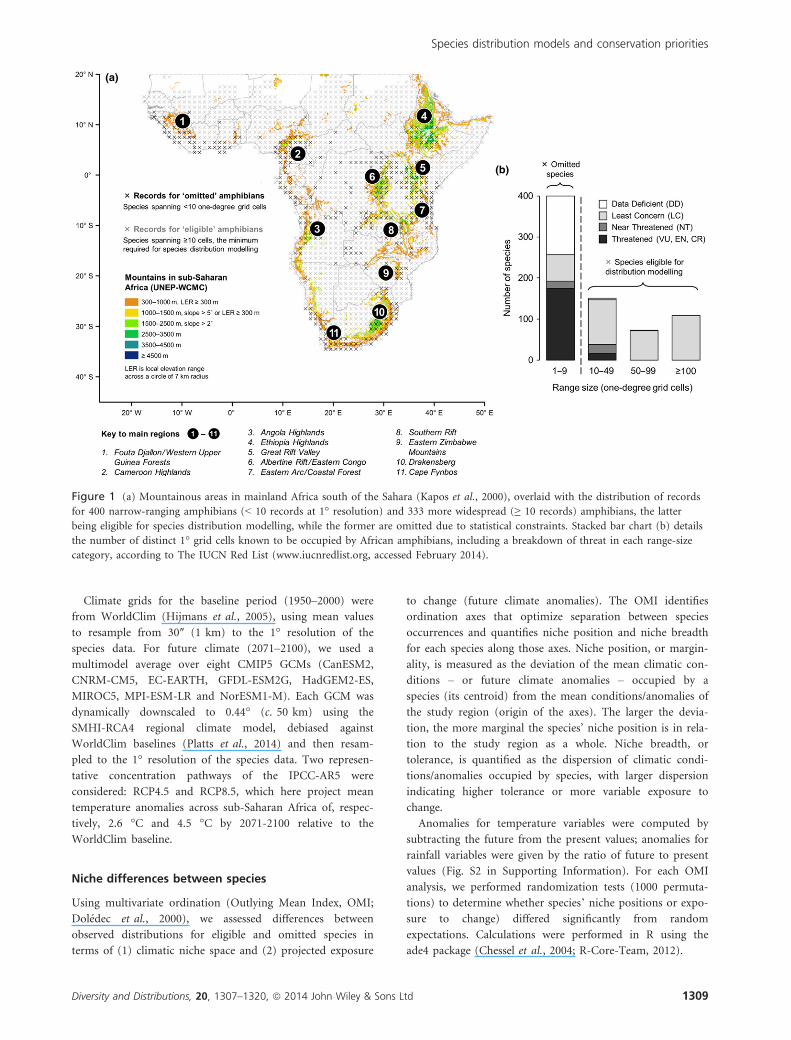
Figure 1 (a) Mountainous areas in mainland Africa south of the Sahara (Kapos et al., 2000), overlaid with the distribution of records
for 400 narrow-ranging amphibians (< 10 records at 1° resolution) and 333 more widespread (≥ 10 records) amphibians, the latter
being eligible for species distribution modelling, while the former are omitted due to statistical constraints. Stacked bar chart (b) details
the number of distinct 1° grid cells known to be occupied by African amphibians, including a breakdown of threat in each range-size
category, according to The IUCN Red List (www.iucnredlist.org, accessed February 2014).
Diversity and Distributions, 20, 1307–1320, ª 2014 John Wiley & Sons Ltd 1309
Species distribution models and conservation priorities
Constructing SDMs without occurrence thresholds
Amphibian distributions were projected in space and time
using multidimensional niche envelopes (MDNE). Popular
SDM methods, such as maximum entropy and statistical
regression, require sufficient occurrence records to paramete-
rise a species’ response to, and relative importance of, pre-
dictors in a model. The MDNE more simply classifies all
conditions within a species’ observed climatic range as uni-
formly viable, and conditions beyond as wholly unsuitable,
with all predictors given equal weight (Busby, 1991; Walker
& Cocks, 1991). This approach requires no occurrence
threshold and so can be applied consistently across the eligi-
ble and omitted species sets.
Rather than using mean predictor values at 1° resolution
to define the MDNE, we used the lower and upper quartiles
of climate conditions within 1° cells, resampled from 30″.
This definition reduced the number of type II errors (false
negatives) that would otherwise arise from topographic com-
plexity within 1° cells. It also has the advantage of being
defined for species having only one record of occurrence,
their MDNE being the interquartile range of conditions
within the documented 1° cell.MDNE projections could not be validated directly: by defi-
nition, there can be no errors of omission against the 1°training data, while specificity is unknown. We could, how-
ever, gauge comparability of MDNE projections for eligible
species with those obtained from MAXENT (ver. 3.3.3e; Phillips
& Dudik, 2008), using the latter as test data to validate the
MDNE results. MAXENT was chosen for its widespread appli-
cation and favourable performance in comparative studies
(e.g. Hernandez et al., 2006). Ten replicates were performed
for each eligible species, withholding distinct tenths of the
presence data for testing. The final prediction for a given
pixel was the mean value over this tenfold cross-validation.
Continuous occurrence probabilities were dichotomized into
presence–absence maps by maximizing the sum of sensitivity
and specificity (Liu et al., 2013).
Future predictions were constrained under a no-dispersal
scenario, which is justified by the coarse resolution of the
grid (Bateman et al., 2013). Climate change velocities at 1°resolution will likely outpace dispersal capabilities for most
African amphibians: to traverse a single pixel, the leading
edge of a population would need to migrate 1 km/y, subject
to continuous corridors for dispersal and a steady change in
climate. Yet, temporal climatic variability and, for all but the
most generalist of species, habitat fragmentation are likely to
curtail future rates and patterns of range shift relative to the
past (Early & Sax, 2011; Hof et al., 2011b; Bennie et al.,
2013; Pyron & Wiens, 2013).
Conservation priorities
Grouping predicted distributions by species set (eligible or
omitted) and time period (present or future), we derived
empirical priority metrics for spatial comparison with three
large-scale conservation priority schemes: Biodiversity Hot-
spots (Conservation International; Mittermeier et al., 2004),
Endemic Bird Areas (BirdLife International; Stattersfield
et al., 1998) and the Global 200 set of ecoregions (World
Wildlife Fund US; Olson & Dinerstein, 1998).
Empirical metrics were chosen to complement these
schemes, without confounding the intended comparison
between projections based on narrow- versus wide-ranging
species (e.g. by explicit inclusion of data on vulnerability
and habitat; Margules & Pressey, 2000; Williams et al.,
2005; Moilanen et al., 2009). The metrics were: (1) the 100
grid cells with the highest species richness; (2) the 100 grid
cells with the highest range-size rarity, defined as the sum
of inverse range sizes of all species in a grid cell; and (3)
minimum sets of grid cells that represent all species at
least once (greedy complementarity). To identify minimum
sets, we began with a full set of non-empty cells and
reduced it, one cell at a time, until no further reduction
was possible without excluding one or more species. The
procedure was randomized and repeated 1000 times. The
final priority metric was the union over all optimal solu-
tions. Congruence with existing schemes was defined by
the number (richness and rarity) or percentage (minimum
sets) of empirically prioritized cells that fell within existing
schemes.
RESULTS
Degree of (non-climatic) threat
Of the 733 amphibian species, 191 are designated Threatened
on The IUCN Red List: 57 (8%) are vulnerable, 96 (13%)
are endangered, 37 (5%) are critically endangered, and one
was extinct in the wild (Nectophrynoidesasperginis, now rein-
troduced to original locality). Of the remainder, 40 (5%) are
designated near threatened and 354 (48%) least concern,
while 148 (20%) are data deficient. Because restricted range
is one of the criteria for Red Listing species, the degree of
threat is highly skewed towards taxa with fewer occurrence
records at the 1° model resolution (Fig. 1b). Only 16 of the
191 threatened amphibian species are eligible for correlative
SDM, whereas the remaining 175 threatened species, includ-
ing nearly all of those in the highest threat categories
(endangered and critically endangered), are too narrow rang-
ing to model (Tables S1 and S2).
Niche differences between species
Omitted amphibians have been recorded predominantly in
tropical highlands (regions 1–9 in Fig. 1a), in grid cells with
significantly higher proportions of mountain area (as per
Fig. 1a, Wilcoxon signed-rank one-sided, P < 0.05) com-
pared with eligible species. Further hotspots for omitted spe-
cies include the Cape Fynbos and Drakensberg of South
Africa (regions 10–11). By contrast, at least one eligible
amphibian has been recorded in the majority of grid cells
across sub-Saharan mainland Africa (Fig. 1a).
1310 Diversity and Distributions, 20, 1307–1320, ª 2014 John Wiley & Sons Ltd
P. J. Platts et al.
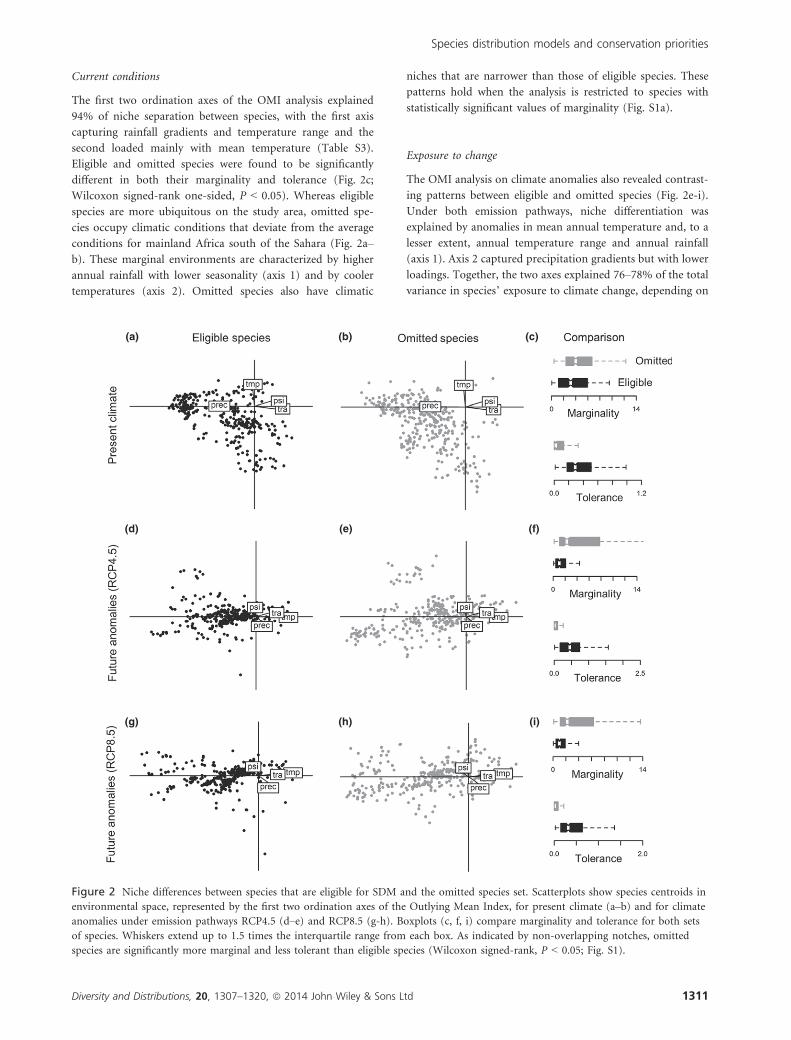
Current conditions
The first two ordination axes of the OMI analysis explained
94% of niche separation between species, with the first axis
capturing rainfall gradients and temperature range and the
second loaded mainly with mean temperature (Table S3).
Eligible and omitted species were found to be significantly
different in both their marginality and tolerance (Fig. 2c;
Wilcoxon signed-rank one-sided, P < 0.05). Whereas eligible
species are more ubiquitous on the study area, omitted spe-
cies occupy climatic conditions that deviate from the average
conditions for mainland Africa south of the Sahara (Fig. 2a–
b). These marginal environments are characterized by higher
annual rainfall with lower seasonality (axis 1) and by cooler
temperatures (axis 2). Omitted species also have climatic
niches that are narrower than those of eligible species. These
patterns hold when the analysis is restricted to species with
statistically significant values of marginality (Fig. S1a).
Exposure to change
The OMI analysis on climate anomalies also revealed contrast-
ing patterns between eligible and omitted species (Fig. 2e-i).
Under both emission pathways, niche differentiation was
explained by anomalies in mean annual temperature and, to a
lesser extent, annual temperature range and annual rainfall
(axis 1). Axis 2 captured precipitation gradients but with lower
loadings. Together, the two axes explained 76–78% of the total
variance in species’ exposure to climate change, depending on
(a) (b) (c)
(d) (e) (f)
(i)(h)(g)
Figure 2 Niche differences between species that are eligible for SDM and the omitted species set. Scatterplots show species centroids in
environmental space, represented by the first two ordination axes of the Outlying Mean Index, for present climate (a–b) and for climate
anomalies under emission pathways RCP4.5 (d–e) and RCP8.5 (g-h). Boxplots (c, f, i) compare marginality and tolerance for both sets
of species. Whiskers extend up to 1.5 times the interquartile range from each box. As indicated by non-overlapping notches, omitted
species are significantly more marginal and less tolerant than eligible species (Wilcoxon signed-rank, P < 0.05; Fig. S1).
Diversity and Distributions, 20, 1307–1320, ª 2014 John Wiley & Sons Ltd 1311
Species distribution models and conservation priorities
the emission pathway (Table S3). Omitted species were found
to be significantly more marginal and less tolerant than eligible
species (Fig. 2f,i; Wilcoxon signed-rank one-sided, P < 0.05),
occupying areas projected to be less exposed to warming
(Fig. 2d–e and 2g–h). The same patterns hold when the com-
parison on both OMI axes is restricted to species with signifi-
cant marginality (Fig. S1b–c).
Conservation priorities
Model performance
The predictive performance of MAXENT models for eligible
species was good, with median cross-validated AUC of 0.95
(interquartile range, IQR: [0.91, 0.97]). At the presence–
absence threshold, the median sensitivity was 0.94 [0.91,
0.96] and specificity was 0.91 [0.88, 0.94]. The degree to
which MAXENT extrapolated beyond the parameter range of
training data was minimal, except for novel high tempera-
tures in the Sahelian zone (Fig. S2). The most important pre-
dictor was annual rainfall (median contribution: 36%, IQR:
[20, 50]), followed by mean annual temperature (26%, [6,
42]), annual temperature range (23%, [6, 35]) and rainfall
seasonality (15%, [5, 19]; Fig. S3).
Using MAXENT predictions as test data, MDNE maps for
eligible species had median sensitivity of 0.92 (IQR: [0.78,
0.99]) and median specificity of 0.91 [0.79, 0.97]. For species
richness and range-size rarity, MDNE and MAXENT results
were highly correlated (Spearman’s q = 0.90 and q = 0.87;
Fig. S4).
Priority metrics for eligible versus omitted species
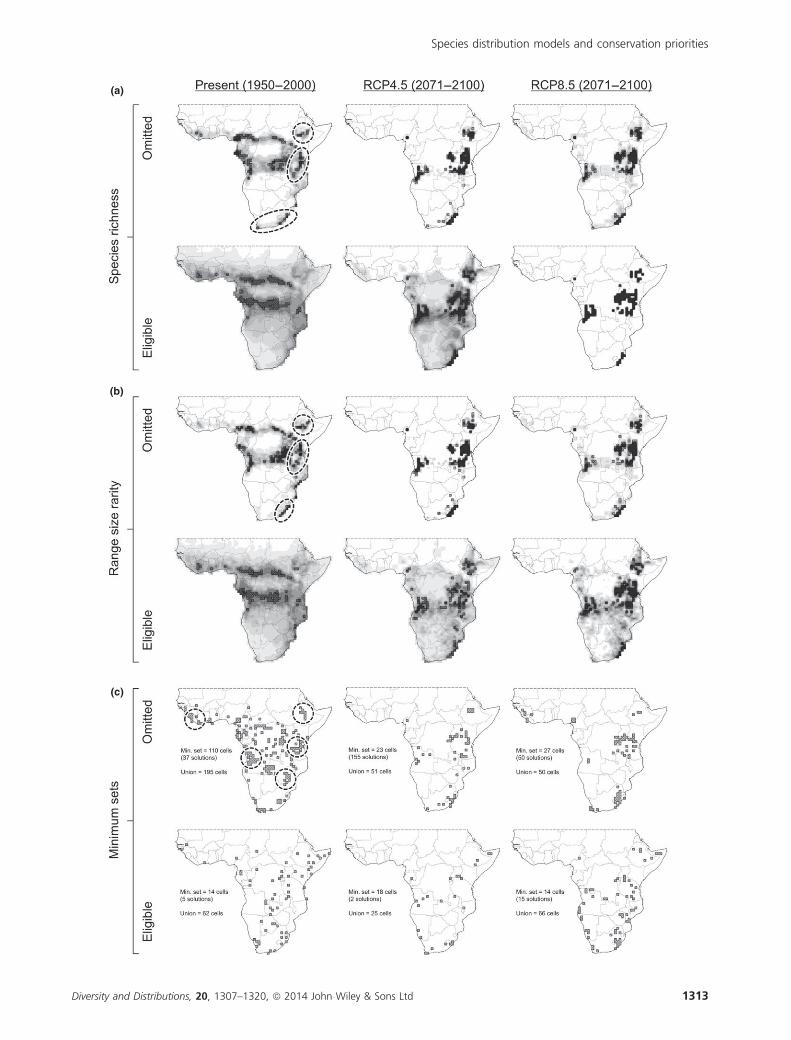
Under present climate, around a third of priority cells identi-
fied by the species richness and range-size rarity metrics were
common to both the eligible and omitted species sets
(Table 1). Discrepancies were highest in the Ethiopian
Highlands, Great Rift Valley, Eastern Arc Mountains and
Coastal Forests of East Africa, and in the Cape Fynbos and
Drakensberg of South Africa (Fig. 3a–b), which were all lar-
gely absent from eligible species’ priorities. In the future, pri-
orities for eligible and omitted species converged under both
metrics, increasing to 70–81 cells (of a possible 100) for spe-
cies richness, depending on the emission pathway, and to
55–72 cells for range-size rarity (Table 1).
The current agreement between the minimum set metric
for eligible (62 cells) and omitted (195 cells) species was low
(9 cells in common; Table 1). In particular, the Fouta Djal-
lon/Western Upper Guinea Forests, Angola Highlands, Ethio-
pian Highlands, Eastern Zimbabwe Mountains, Eastern Arc
and Coastal Forests were under-represented by the eligible
species set (Fig. 3c). In the future, the size of minimum sets
reduced for omitted species, due to many narrow-ranging
amphibians losing all suitable climate space at the 1° resolu-
tion (Fig. 4). Agreement between eligible and omitted species
reduced slightly under RCP4.5, but doubled to 18 cells under
RCP8.5 (Table 1).
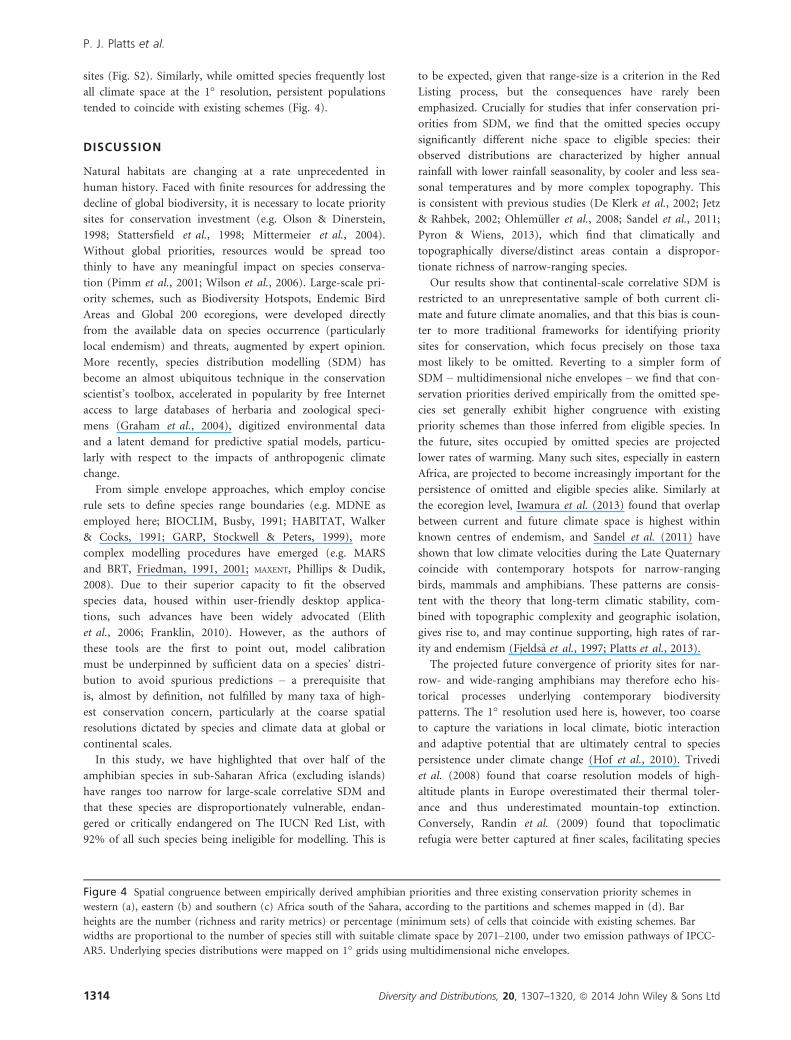
Comparison with existing conservation schemes
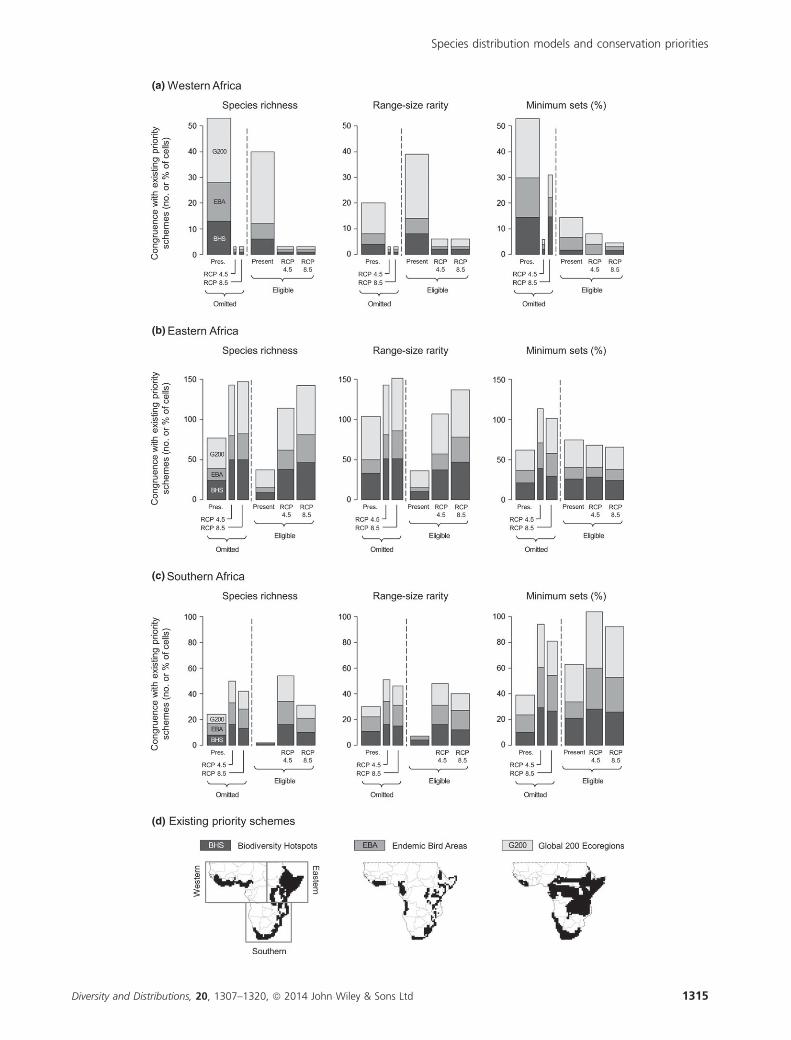
Congruence between empirical priority metrics and existing
schemes was generally higher on the omitted species set than
on the eligible species set, although this varied depending on
the region and metric considered (Fig. 4). For omitted
amphibians, 39–70 (richness) and 32–74 (range-size rarity)
of prioritized cells coincided with existing schemes, com-
pared with eligible species congruence of 13–50 and 14–46
cells, respectively. Congruence according to minimum sets
was more similar for omitted versus eligible species (44–64%
vs. 32–71%), suggesting that this metric may be more robust
to the omission of narrow-ranging species from priority
assessments (Figs. 3 & 4). For both species sets, the degree of
congruence with the Global 200 was often higher than with
Biodiversity Hotspots, which was higher than with Endemic
Bird Areas, due to differences in overall coverage between
these schemes (Fig. 4d).
Projecting empirical metrics under future climate, congru-
ence with existing schemes reduced in western Africa while
generally increasing in eastern and southern Africa. Overall,
priorities for eligible species were projected to shift towards
existing schemes, due to greater climatic stability at these
Table 1 Number of grid cells common to spatial priority
metrics for eligible and omitted amphibians, now and in the
future. Eligible species can be modelled using popular
methodologies for species distribution modelling (≥ 10 records),
while omitted species cannot. Congruence increases in the
future, especially under IPCC-AR5 emission pathway RCP8.5
Priority metric
Present
(1950–2000)
RCP4.5
(2071–2100)
RCP8.5
(2071–2100)
Species richness 35 70 81
Range-size rarity 33 55 72
Minimum sets 9 6 18
Figure 3 Conservation priorities derived empirically from data on amphibian distributions, separately for species typically omitted
from SDM (< 10 records) and those that are eligible (≥ 10 records). Spatial distributions were projected using multidimensional niche
envelopes. Future climate was simulated by a regional climate model (eight driving GCMs) under two representative concentration
pathways of IPCC-AR5. For species richness (a) and range-size rarity (b), the top 100 scoring cells are selected as priority sites.
Minimum sets (c) identify the smallest possible subsets of cells that represent all species at least once; where the solution is not unique,
the union across solutions is mapped. Ellipses highlight key sites under-represented on the eligible species set. For a key to regions, see
Fig. 1a.
1312 Diversity and Distributions, 20, 1307–1320, ª 2014 John Wiley & Sons Ltd
P. J. Platts et al.
(a)
(b)
(c)
Diversity and Distributions, 20, 1307–1320, ª 2014 John Wiley & Sons Ltd 1313
Species distribution models and conservation priorities
sites (Fig. S2). Similarly, while omitted species frequently lost
all climate space at the 1° resolution, persistent populations
tended to coincide with existing schemes (Fig. 4).
DISCUSSION
Natural habitats are changing at a rate unprecedented in
human history. Faced with finite resources for addressing the
decline of global biodiversity, it is necessary to locate priority
sites for conservation investment (e.g. Olson & Dinerstein,
1998; Stattersfield et al., 1998; Mittermeier et al., 2004).
Without global priorities, resources would be spread too
thinly to have any meaningful impact on species conserva-
tion (Pimm et al., 2001; Wilson et al., 2006). Large-scale pri-
ority schemes, such as Biodiversity Hotspots, Endemic Bird
Areas and Global 200 ecoregions, were developed directly
from the available data on species occurrence (particularly
local endemism) and threats, augmented by expert opinion.
More recently, species distribution modelling (SDM) has
become an almost ubiquitous technique in the conservation
scientist’s toolbox, accelerated in popularity by free Internet
access to large databases of herbaria and zoological speci-
mens (Graham et al., 2004), digitized environmental data
and a latent demand for predictive spatial models, particu-
larly with respect to the impacts of anthropogenic climate
change.
From simple envelope approaches, which employ concise
rule sets to define species range boundaries (e.g. MDNE as
employed here; BIOCLIM, Busby, 1991; HABITAT, Walker
& Cocks, 1991; GARP, Stockwell & Peters, 1999), more
complex modelling procedures have emerged (e.g. MARS
and BRT, Friedman, 1991, 2001; MAXENT, Phillips & Dudik,
2008). Due to their superior capacity to fit the observed
species data, housed within user-friendly desktop applica-
tions, such advances have been widely advocated (Elith
et al., 2006; Franklin, 2010). However, as the authors of
these tools are the first to point out, model calibration
must be underpinned by sufficient data on a species’ distri-
bution to avoid spurious predictions – a prerequisite that
is, almost by definition, not fulfilled by many taxa of high-
est conservation concern, particularly at the coarse spatial
resolutions dictated by species and climate data at global or
continental scales.
In this study, we have highlighted that over half of the
amphibian species in sub-Saharan Africa (excluding islands)
have ranges too narrow for large-scale correlative SDM and
that these species are disproportionately vulnerable, endan-
gered or critically endangered on The IUCN Red List, with
92% of all such species being ineligible for modelling. This is
to be expected, given that range-size is a criterion in the Red
Listing process, but the consequences have rarely been
emphasized. Crucially for studies that infer conservation pri-
orities from SDM, we find that the omitted species occupy
significantly different niche space to eligible species: their
observed distributions are characterized by higher annual
rainfall with lower rainfall seasonality, by cooler and less sea-
sonal temperatures and by more complex topography. This
is consistent with previous studies (De Klerk et al., 2002; Jetz
& Rahbek, 2002; Ohlem€uller et al., 2008; Sandel et al., 2011;
Pyron & Wiens, 2013), which find that climatically and
topographically diverse/distinct areas contain a dispropor-
tionate richness of narrow-ranging species.
Our results show that continental-scale correlative SDM is
restricted to an unrepresentative sample of both current cli-
mate and future climate anomalies, and that this bias is coun-
ter to more traditional frameworks for identifying priority
sites for conservation, which focus precisely on those taxa
most likely to be omitted. Reverting to a simpler form of
SDM – multidimensional niche envelopes – we find that con-
servation priorities derived empirically from the omitted spe-
cies set generally exhibit higher congruence with existing
priority schemes than those inferred from eligible species. In
the future, sites occupied by omitted species are projected
lower rates of warming. Many such sites, especially in eastern
Africa, are projected to become increasingly important for the
persistence of omitted and eligible species alike. Similarly at
the ecoregion level, Iwamura et al. (2013) found that overlap
between current and future climate space is highest within
known centres of endemism, and Sandel et al. (2011) have
shown that low climate velocities during the Late Quaternary
coincide with contemporary hotspots for narrow-ranging
birds, mammals and amphibians. These patterns are consis-
tent with the theory that long-term climatic stability, com-
bined with topographic complexity and geographic isolation,
gives rise to, and may continue supporting, high rates of rar-
ity and endemism (Fjelds�a et al., 1997; Platts et al., 2013).
The projected future convergence of priority sites for nar-
row- and wide-ranging amphibians may therefore echo his-
torical processes underlying contemporary biodiversity
patterns. The 1° resolution used here is, however, too coarse
to capture the variations in local climate, biotic interaction
and adaptive potential that are ultimately central to species
persistence under climate change (Hof et al., 2010). Trivedi
et al. (2008) found that coarse resolution models of high-
altitude plants in Europe overestimated their thermal toler-
ance and thus underestimated mountain-top extinction.
Conversely, Randin et al. (2009) found that topoclimatic
refugia were better captured at finer scales, facilitating species
Figure 4 Spatial congruence between empirically derived amphibian priorities and three existing conservation priority schemes in
western (a), eastern (b) and southern (c) Africa south of the Sahara, according to the partitions and schemes mapped in (d). Bar
heights are the number (richness and rarity metrics) or percentage (minimum sets) of cells that coincide with existing schemes. Bar
widths are proportional to the number of species still with suitable climate space by 2071–2100, under two emission pathways of IPCC-
AR5. Underlying species distributions were mapped on 1° grids using multidimensional niche envelopes.
1314 Diversity and Distributions, 20, 1307–1320, ª 2014 John Wiley & Sons Ltd
P. J. Platts et al.
(a)
(b)
(c)
(d)
Diversity and Distributions, 20, 1307–1320, ª 2014 John Wiley & Sons Ltd 1315
Species distribution models and conservation priorities
persistence (see also Franklin et al., 2013). Our assumption
of no intercell dispersal would need to be revised at finer
scales, because narrow isotherms along altitudinal gradients
facilitate species ability to track changing climates more
locally (Loarie et al., 2009), with the likely effect of further
emphasizing the importance of existing, topographically
complex, priority sites for conservation.
Most fundamentally for our analysis, a finer grid resolu-
tion would disaggregate spatially clustered occurrence
records, increasing the proportion of species eligible for cor-
relative SDM, albeit with increased spatial autocorrelation.
We suggest that the convergence of conservation priorities
for eligible versus omitted species under climate change is
unlikely to be scale dependent in this regard, because sites of
relative climatic stability would remain so, regardless of the
species dichotomy. The effect of spatial scale on present-day,
divergent priority metrics for omitted versus eligible species
is more uncertain and would depend on how the disaggrega-
tion of distributional records varied between the two groups.
A further consideration is that parameterizations for particu-
lar species models are also scale dependent, because the
observed niche is shaped increasingly by non-climatic factors
(e.g. biotic interactions, patch dynamics, habitat quality) at
finer scales (Pearson & Dawson, 2003).
Our ability to investigate these uncertainties is limited by
the fact that much of Earth’s biodiversity is poorly docu-
mented, both in the quantity and in the quality of distribu-
tional records. In Africa, as elsewhere in the tropics, 1° (or
at best 0.5°) grids are the operational default for continental-
scale SDM, because much of the available species data are
not reliably georeferenced at finer resolutions (Graham et al.,
2004; Wiens & Bachelet, 2010; Feeley & Silman, 2011). In
specific regions where high-resolution species data are avail-
able, the issue of threatened species being omitted from
modelling procedures remains pervasive. The Eastern Arc
Mountains, for example, are among the best-documented
sites in Africa (Feeley & Silman, 2011), yet two-thirds of
threatened amphibians have fewer than ten records on a 100
grid (Burgess et al., 2007). Moreover, of the c. 500 plant spe-
cies endemic to the Eastern Arc, none have sufficient herbar-
ium data for correlative SDM on a 1° grid and, even at 30″
resolution, 90% are too narrow ranging to model (Platts
et al., 2013), the majority of these species being assessed as
either threatened or scheduled for Red List assessment
(Gereau et al., 2010).
Novel approaches to address these challenges of spatial
scale and narrow ranges, both within and beyond the field of
SDM, are emerging. Current knowledge on species distribu-
tions can be systematically improved by iterative application
of simple models and targeted fieldwork (Williams et al.,
2009; Platts et al., 2010). Making the most of small sample
sizes, Lomba et al. (2010) combine large numbers of bivari-
ate models, built individually using all pairwise combinations
of predictors. In contrast to a species-level focus, hierarchical
approaches, combining species-specific and community mod-
els (Loarie et al., 2008; Ovaskainen & Soininen, 2011), or
spatial modelling of climatically associated (Golicher et al.,
2008) or community-level (Ferrier & Guisan, 2006) species
pools can help to detect shared patterns of response across
narrow-ranging taxa. Simple measures of site exposure to
different aspects of climate change, which do not rely on
SDM, also provide indications of potential threats and
opportunities for species present in such sites (Williams
et al., 2007; Ohlem€uller et al., 2008; Garcia et al., 2014b).
These methods can be combined with biological trait-
based assessments of species sensitivity (ability to cope in
situ) and adaptive capacity (ability to escape by dispersal or
evolution) to changing climatic conditions (Dawson et al.,
2011; Pearson et al., 2014). For example, SDMs are increas-
ingly complemented with trait-based vulnerability assess-
ments (Heikkinen et al., 2009; Garcia et al., 2014a), while
the IUCN is using physiological, ecological, genetic and func-
tional characteristics, combined with simple measures of
exposure to climate change (e.g. Garcia et al., 2014b), to
ascribe new measures of vulnerability to thousands of species
for eventual inclusion in the Red List Categories and Criteria
(IUCN, 2011; Foden et al., 2013).
Through methods such as these, conservation planners may
embrace valuable insights provided by popular SDM method-
ologies, while addressing their inherent limitations with
respect to narrow-ranging species that have traditionally un-
derpinned global allocation of conservation funds. Effective
biodiversity conservation relies on our capacity to predict cli-
mate change impacts on all species, and not just those that
fulfil biologically arbitrary occurrence thresholds required by
one tool in the box. Our results suggest, however, that while
current priorities can be highly sensitive to the exclusion of
narrow-ranging taxa from SDM, likely strongholds for both
narrow- and wide-ranging species under projected climate
change are consistent with existing priority schemes. We con-
clude that while methods to tackle the rare species conun-
drum continue to advance, the focus on conserving habitat
connectivity and ecological functioning at these sites ought to
be maintained (Ricketts et al., 2005; Hodgson et al., 2009;
Iwamura et al., 2013; Pearson et al., 2014).
ACKNOWLEDGEMENTS
We thank many experts who contributed to the African
amphibian database, in particular through the IUCN Species
Survival Commission Specialist Group on African Herpetol-
ogy, and contributors to the Global Amphibian Assessment.
Additional distribution maps were provided by A. Schiøtz
(tree frogs), J. Poynton (bufonids), A. Channing (southern
African), S. Loader (Caecilians), M. R€odel (West Africa), M.
Menegon, K.M. Howell, D. Broadley and N. Doggart (East-
ern Arc and Coastal Forests). For access to the database,
please contact L.H. or C.R. at the University of Copenhagen.
P.J.P. was funded by the Ministry for Foreign Affairs of Fin-
land and by the Leverhulme Trust, R.A.G. by the Portuguese
Foundation for Science and Technology and by the European
Social Fund, W.F. by the IUCN Global Species Programme,
1316 Diversity and Distributions, 20, 1307–1320, ª 2014 John Wiley & Sons Ltd
P. J. Platts et al.
C.H. by LOEWE and N.D.B. by Copenhagen University,
WWF-US Conservation Science Program and UNEP-
WCMC. N.D.B., R.A.G., C.H. and C.R. acknowledge the sup-
port of the Danish National Research Foundation. Thank
you to Richard Pearson, David Nogu�es-Bravo, Jane Hill,
Anni Arponen, Jake Overton and an anonymous reviewer for
insightful feedback on earlier versions of the manuscript.
REFERENCES
Ahrends, A., Rahbek, C., Bulling, M.T., Burgess, N.D., Platts,
P.J., Lovett, J.C., Kindemba, V.W., Owen, N., Sallu, A.N.,
Marshall, A.R., Mhoro, B.E., Fanning, E. & Marchant, R.
(2011) Conservation and the botanist effect. Biological Con-
servation, 144, 131–140.
Ara�ujo, M.B. & Peterson, A.T. (2012) Uses and misuses of
bioclimatic envelope modeling. Ecological Society of Amer-
ica, 93, 1527–1539.
Balmford, A. & Gaston, K.J. (1999) Why biodiversity surveys
are good value. Nature, 398, 204–205.
Bateman, B.L., Murphy, H.T., Reside, A.E., Mokany, K. &
VanDerWal, J. (2013) Appropriateness of full-, partial- and
no-dispersal scenarios in climate change impact modelling.
Diversity and Distributions, 19, 1224–1234.
Bennie, J., Hodgson, J.A., Lawson, C.R., Holloway, C.T.R.,
Roy, D.B., Brereton, T., Thomas, C.D. & Wilson, R.J.
(2013) Range expansion through fragmented landscapes
under a variable climate. Ecology Letters, 16, 921–929.
Burgess, N., Butynski, T., Cordeiro, N., Doggart, N., Fjeldsa,
J., Howell, K., Kilahama, F., Loader, S., Lovett, J. & Mbil-
inyi, B. (2007) The biological importance of the Eastern
Arc Mountains of Tanzania and Kenya. Biological Conser-
vation, 134, 209–231.
Busby, J.R. (1991) BIOCLIM – a bioclimatic analysis and
prediction system. Nature conservation: cost effective biologi-
cal surveys and data analysis (ed. by C.R. Margules and
M.P. Austin), pp. 64–68. CSIRO, East Melbourne, Vic.,
Australia.
Butchart, S.H.M., Walpole, M., Collen, B. et al. (2010) Glo-
bal biodiversity: indicators of recent declines. Science, 328,
1164–1168.
Chessel, D., Dufour, A.B. & Thioulouse, J. (2004) The ade4
package-I-One-table methods. R News, 4, 5–10.
Da Fonseca, G.A.B., Balmford, A., Bibby, C., Boitani, L.,
Corsi, F., Brooks, T., Gascon, C., Olivieri, S., Mittermeier,
R.A., Burgess, N., Dinerstein, E., Olson, D., Hannah, L.,
Lovett, J., Moyer, D., Rahbek, C., Stuart, S. & Williams, P.
(2000) . . . following Africa’s lead in setting priorities. Nat-
ure, 405, 393–394.
Dawson, T.P., Jackson, S.T., House, J.I., Prentice, I.C. &
Mace, G.M. (2011) Beyond predictions: biodiversity con-
servation in a changing climate. Science, 332, 53–58.
De Klerk, H.M., Crowe, T.M., Fjelds�a, J. & Burgess, N.D.
(2002) Patterns of species richness and narrow endemism
of terrestrial bird species in the Afrotropical region. Journal
of Zoology, 256, 327–342.
Dol�edec, S., Chesse, D. & Gimaret-Carpentier, C. (2000)
Niche separation in community analysis: a new method.
Ecology, 81, 2914–2927.
Dormann, C.F., Elith, J., Bacher, S., Buchmann, C., Carl, G.,
Carr�e, G., Marqu�ez, J.R.G., Gruber, B., Lafourcade, B.,
Leit~ao, P.J., M€unkem€uller, T., McClean, C., Osborne, P.E.,
Reineking, B., Schr€oder, B., Skidmore, A.K., Zurell, D. &
Lautenbach, S. (2013) Collinearity: a review of methods to
deal with it and a simulation study evaluating their perfor-
mance. Ecography, 36, 27–46.
Early, R. & Sax, D.F. (2011) Analysis of climate paths reveals
potential limitations on species range shifts. Ecology Letters,
14, 1125–1133.
Elith, J., Graham, C.H., Anderson, R.P. et al. (2006) Novel
methods improve prediction of species’ distributions from
occurrence data. Ecography, 29, 129–151.
Feeley, K.J. & Silman, M.R. (2011) The data void in model-
ing current and future distributions of tropical species.
Global Change Biology, 17, 626–630.
Ferrier, S. & Guisan, A. (2006) Spatial modelling of biodiver-
sity at the community level. Journal of Applied Ecology, 43,
393–404.
Fjelds�a, J., Ehrlich, D., Lambin, E. & Prins, E. (1997) Are
biodiversity “hotspots” correlated with current ecoclimatic
stability? A pilot study using the NOAA-AVHRR remote
sensing data. Biodiversity and Conservation, 6, 401–422.
Foden, W.B., Butchart, S.H.M., Stuart, S.N., Vi�e, J.-C.,
Akc�akaya, H.R., Angulo, A., DeVantier, L.M., Gutsche, A.,
Turak, E., Cao, L., Donner, S.D., Katariya, V., Bernard, R.,
Holland, R.A., Hughes, A.F., O’Hanlon, S.E., Garnett, S.T.,
S�ekercio�glu, C� .H. & Mace, G.M. (2013) Identifying the
world’s most climate change vulnerable species: a system-
atic trait-based assessment of all birds, amphibians and
corals. PLoS ONE, 8, e65427.
Franklin, J. (2010) Mapping species distributions. Cambridge
University Press, Cambridge, UK.
Franklin, J. (2013) Species distribution models in conserva-
tion biogeography: developments and challenges. Diversity
and Distributions, 19, 1217–1223.
Franklin, J., Davis, F.W., Ikegami, M., Syphard, A.D., Flint,
L.E., Flint, A.L. & Hannah, L. (2013) Modeling plant spe-
cies distributions under future climates: how fine scale do
climate projections need to be? Global Change Biology, 19,
473–483.
Friedman, J.H. (1991) Multivariate adaptive regression
splines. Annals of Statistics, 19, 1–67.
Friedman, J.H. (2001) Greedy function approximation: a gra-
dient boosting machine. Annals of Statistics, 29, 1189–1232.
Garcia, R.A., Burgess, N.D., Cabeza, M., Rahbek, C. & Ara-
�ujo, M.B. (2012) Exploring consensus in 21st century pro-
jections of climatically suitable areas for African
vertebrates. Global Change Biology, 18, 1253–1269.
Garcia, R.A., Ara�ujo, M.B., Burgess, N.D., Foden, W.B., Gut-
sche, A., Rahbek, C. & Cabeza, M. (2014a) Matching spe-
cies traits to projected threats and opportunities from
climate change. Journal of Biogeography, 41, 724–735.
Diversity and Distributions, 20, 1307–1320, ª 2014 John Wiley & Sons Ltd 1317
Species distribution models and conservation priorities
Garcia, R.A., Cabeza, M., Rahbek, C. & Araujo, M.B. (2014b)
Multiple dimensions of climate change and their implica-
tions for biodiversity. Science, 344, 1247579.
Gaston, K.J. (1994) Rarity. Chapman and Hall, London, UK.
Gereau, R.E., Taylor, C.M., Bodine, S. & Kindeketa, W.J.
(2010) Plant conservation assessment in the Eastern Arc
Mountains and coastal forests of Tanzania and Kenya. Avail-
able at: http://www.mobot.org/MOBOT/Research/tanzania/
cepf.shtml/ (accessed 1 April 2014).
Golicher, D.J., Cayuela, L., Alkemade, J.R.M., Gonz�alez-
Espinosa, M. & Ram�ırez-Marcial, N. (2008) Applying
climatically associated species pools to the modelling of
compositional change in tropical montane forests. Global
Ecology and Biogeography, 17, 262–273.
Graham, C.H., Ferrier, S., Huettman, F., Moritz, C. & Peter-
son, A.T. (2004) New developments in museum-based
informatics and applications in biodiversity analysis. Trends
in Ecology & Evolution, 19, 497–503.
Hannah, L., Midgley, G.F., Lovejoy, T., Bond, W.J., Bush,
M., Lovett, J.C., Scott, D. & Woodward, F.I. (2002) Con-
servation of biodiversity in a changing climate. Conserva-
tion Biology, 16, 264–268.
Harrell, F.E., Lee, K.L., Califf, R.M., Pryor, D.B. & Rosati,
R.A. (1984) Regression modelling strategies for improved
prognostic prediction. Statistics in Medicine, 3, 143–152.
Heikkinen, R.K., Luoto, M., Leikola, N., P€oyry, J., Settele, J.,
Kudrna, O., Marmion, M., Fronzek, S. & Thuiller, W.
(2009) Assessing the vulnerability of European butterflies
to climate change using multiple criteria. Biodiversity and
Conservation, 19, 695–723.
Hernandez, P.A., Graham, C.H., Master, L.L. & Albert, D.L.
(2006) The effect of sample size and species characteristics
on performance of different species distribution modeling
methods. Ecography, 29, 773–785.
Hijmans, R.J., Cameron, S.E., Parra, J.L., Jones, P.G. & Jarvis,
A. (2005) Very high resolution interpolated climate sur-
faces for global land areas. International Journal of Clima-
tology, 25, 1965–1978.
Hodgson, J.A., Thomas, C.D., Wintle, B.A. & Moilanen, A.
(2009) Climate change, connectivity and conservation deci-
sion making: back to basics. Journal of Applied Ecology, 46,
964–969.
Hof, C., Rahbek, C. & Ara�ujo, M.B. (2010) Phylogenetic sig-
nals in the climatic niches of the world’s amphibians. Ecog-
raphy, 33, 242–250.
Hof, C., Ara�ujo, M.B., Jetz, W. & Rahbek, C. (2011a)
Additive threats from pathogens, climate and land-use
change for global amphibian diversity. Nature, 480, 516–
519.
Hof, C., Levinsky, I., Ara�ujo, M.B. & Rahbek, C. (2011b)
Rethinking species’ ability to cope with rapid climate
change. Global Change Biology, 17, 2987–2990.
Hole, D.G., Willis, S.G., Pain, D.J., Fishpool, L.D., Butchart,
S.H.M., Collingham, Y.C., Rahbek, C. & Huntley, B. (2009)
Projected impacts of climate change on a continent-wide
protected area network. Ecology Letters, 12, 420–431.
Huntley, B., Collingham, Y.C., Green, R.E., Hilton, G.M.,
Rahbek, C. & Willis, S.G. (2006) Potential impacts of cli-
matic change upon geographical distributions of birds. Ibis,
148, 8–28.
IUCN (2011) Guidelines for Using The IUCN Red List Cate-
gories and Criteria. Version 9.0. Prepared by the IUCN
Standards and Petitions Subcommittee.
Iwamura, T., Guisan, A., Wilson, K.A. & Possingham, H.P.
(2013) How robust are global conservation priorities to cli-
mate change? Global Environmental Change, 23, 1277–1284.
Jetz, W. & Rahbek, C. (2002) Geographic range size and
determinants of avian species richness. Science, 297, 1548–
1551.
Kapos, V., Rhind, J., Edwards, M., Price, M.F. & Ravilious,
C. (2000) Developing a map of the world’s mountain for-
ests. Forests in sustainable mountain development: a state of
knowledge report for 2000 (ed. by M.F. Price and N. Butt),
pp. 4–9. CAB International, Wallingford.
K€uper, W., Sommer, J.H., Lovett, J.C. & Barthlott, W.
(2006) Deficiency in African plant distribution data – miss-
ing pieces of the puzzle. Botanical Journal of the Linnean
Society, 150, 355–368.
Liu, C., White, M. & Newell, G. (2013) Selecting thresholds
for the prediction of species occurrence with presence-only
data. Journal of Biogeography, 40, 778–789.
Loarie, S.R., Carter, B.E., Hayhoe, K., McMahon, S., Moe,
R., Knight, C.A. & Ackerly, D.D. (2008) Climate change
and the future of California’s endemic flora. PLoS ONE, 3,
e2502.
Loarie, S.R., Duffy, P.B., Hamilton, H., Asner, G.P., Field,
C.B. & Ackerly, D.D. (2009) The velocity of climate
change. Nature, 462, 1052–1055.
Lomba, A., Pellissier, L., Randin, C., Vicente, J., Moreira, F.,
Honrado, J. & Guisan, A. (2010) Overcoming the rare spe-
cies modelling paradox: a novel hierarchical framework
applied to an Iberian endemic plant. Biological Conserva-
tion, 143, 2647–2657.
Margules, C.R. & Pressey, R.L. (2000) Systematic conserva-
tion planning. Nature, 405, 243–253.
McClean, C.J., Lovett, J.C., K€uper, W., Hannah, L., Sommer,
J.H., Barthlott, W., Termansen, M., Smith, G.F., Tokumine,
S. & Taplin, J.R.D. (2005) African plant diversity and cli-
mate change. Annuals of the Missouri Botanical Garden, 92,
139–152.
Mittermeier, R.A., Gil, P.R., Hoffmann, M., Pilgrim, J., Brooks,
T., Mittermeier, C.G., Lamoreux, J. & da Fonseca, G.A.B.
(2004) Hotspots revisited: Earth’s biologically richest and most
endangered ecoregions. CEMEX, Mexico City, Mexico.
Moilanen, A., Wilson, K.A. & Possingham, H.P. (2009) Spa-
tial conservation prioritization. Oxford University Press,
Oxford.
Myers, N., Mittermeier, R.A., Mittermeier, C.G., Da Fonseca,
G.A. & Kent, J. (2000) Biodiversity hotspots for conserva-
tion priorities. Nature, 403, 853–858.
Ohlem€uller, R., Anderson, B.J., Ara�ujo, M.B., Butchart,
S.H.M., Kudrna, O., Ridgely, R.S. & Thomas, C.D. (2008)
1318 Diversity and Distributions, 20, 1307–1320, ª 2014 John Wiley & Sons Ltd
P. J. Platts et al.
The coincidence of climatic and species rarity: high risk to
small-range species from climate change. Biology Letters, 4,
568–572.
Olson, D.M. & Dinerstein, E. (1998) The Global 200: a rep-
resentation approach to conserving the Earth’ s most
biologically valuable ecoregions. Conservation Biology, 12,
502–515.
Ovaskainen, O. & Soininen, J. (2011) Making more out of
sparse data: hierarchical modeling of species communities.
Ecology, 92, 289–295.
Pearson, R.G. & Dawson, T.P. (2003) Predicting the impacts
of climate change on the distribution of species: are biocli-
mate envelope models useful? Global Ecology and Biogeog-
raphy, 12, 361–371.
Pearson, R.G., Stanton, J.C., Shoemaker, K.T., Aiello-lam-
mens, M.E., Ersts, P.J., Horning, N., Fordham, D.A., Rax-
worthy, C.J., Ryu, H.Y., Mcnees, J. & Akc�akaya, H.R.
(2014) Life history and spatial traits predict extinction
risk due to climate change. Nature Climate Change, 4,
217–221.
Phillips, S.J. & Dudik, M. (2008) Modeling of species distri-
butions with Maxent: new extensions and a comprehensive
evaluation. Ecography, 31, 161–175.
Pimm, S.L., Ayres, M., Balmford, A. et al. (2001) Can we
defy nature’s end? Science, 293, 2207–2208.
Platts, P.J., Ahrends, A., Gereau, R.E., McClean, C.J., Lov-
ett, J.C., Marshall, A.R., Pellikka, P.K.E., Mulligan, M.,
Fanning, E. & Marchant, R. (2010) Can distribution
models help refine inventory-based estimates of conserva-
tion priority? A case study in the Eastern Arc forests of
Tanzania and Kenya. Diversity and Distributions, 16, 628–
642.
Platts, P.J., Gereau, R.E., Burgess, N.D. & Marchant, R.
(2013) Spatial heterogeneity of climate change in an Afro-
montane centre of endemism. Ecography, 36, 518–530.
Platts, P.J., Omeny, P.A. & Marchant, R. (2014) AFRICLIM:
high-resolution climate projections for ecological applica-
tions in Africa. African Journal of Ecology. doi:10.1111/aje.
12180
Pressey, R.L., Hager, T.C., Ryan, K.M., Schwarz, J., Wall, S.,
Ferrier, S. & Creaser, P.M. (2000) Using abiotic data for
conservation assessments over extensive regions: quantita-
tive methods applied across New South Wales, Australia.
Biological Conservation, 96, 55–82.
Pyron, R.A. & Wiens, J.J. (2013) Large-scale phylogenetic
analyses reveal the causes of high tropical amphibian diver-
sity. Proceedings of the Royal Society B, 280, 1471–2954.
Randin, C.F., Engler, R., Normand, S., Zappa, M., Zimmer-
mann, N.E., Pearman, P.B., Vittoz, P., Thuiller, W. & Gui-
san, A. (2009) Climate change and plant distribution: local
models predict high-elevation persistence. Global Change
Biology, 15, 1557–1569.
R-Core-Team (2012) R: a language and environment for sta-
tistical computing. R Foundation for Statistical Computing,
Vienna. Available at: http://www.r-project.org/ (version
3.0.2).
Ricketts, T.H., Dinerstein, E., Boucher, T. et al. (2005) Pin-
pointing and preventing imminent extinctions. Proceedings
of the National Academy of Sciences USA, 102, 18497–18501.
Sandel, B., Arge, L., Dalsgaard, B., Davies, R.G., Gaston, K.J.,
Sutherland, W.J. & Svenning, J.-C. (2011) The influence of
late quaternary climate-change velocity on species ende-
mism. Science, 334, 660–664.
Shoo, L.P., Storlie, C., Vanderwal, J., Little, J. & Williams,
S.E. (2011) Targeted protection and restoration to conserve
tropical biodiversity in a warming world. Global Change
Biology, 17, 186–193.
Sodhi, N.S., Bickford, D., Diesmos, A.C., Lee, T.M., Koh,
L.P., Brook, B.W., Sekercioglu, C.H. & Bradshaw, C.J.A.
(2008) Measuring the meltdown: drivers of global amphib-
ian extinction and decline. PLoS ONE, 3, e1636.
Stattersfield, A., Crosby, M.J., Long, A.J. & Wege, D.C.
(1998) Endemic Bird Areas of the world: priorities for biodi-
versity conservation. BirdLife International, Cambridge, UK.
Stockwell, D. & Peters, D. (1999) The GARP modelling sys-
tem: problems and solutions to automated spatial predic-
tion. International Journal of Geographical Information
Science, 13, 143–158.
Stockwell, D.R. & Peterson, A.T. (2002) Effects of sample size
on accuracy of species distribution models. Ecological Mod-
elling, 148, 1–13.
Trivedi, M.R., Berry, P.M., Morecroft, M.D. & Dawson, T.P.
(2008) Spatial scale affects bioclimate model projections of
climate change impacts on mountain plants. Global Change
Biology, 14, 1089–1103.
Walker, P.A. & Cocks, K.D. (1991) HABITAT – a procedure
for modeling a disjoint environmental envelope for a plant
or animal species. Global Ecology and Biogeography Letters,
1, 108–118.
Walsh, R.P.D. & Lawler, D.M. (1981) Rainfall seasonality:
description, spatial patterns and change through time.
Weather, 36, 201–208.
Wiens, J.A. & Bachelet, D. (2010) Matching the multiple
scales of conservation with the multiple scales of climate
change. Conservation Biology, 24, 51–62.
Wiens, J.J., Graham, C.H., Moen, D.S., Smith, S.A. & Reeder,
T.W. (2006) Evolutionary and ecological causes of the lati-
tudinal diversity gradient in hylid frogs: treefrog trees
unearth the roots of high tropical diversity. The American
Naturalist, 168, 579–596.
Wiens, J.A., Stralberg, D., Jongsomjit, D., Howell, C.A. &
Snyder, M.A. (2009) Niches, models, and climate change:
assessing the assumptions and uncertainties. Proceedings of
the National Academy of Sciences USA, 106(Suppl), 19729–
19736.
Williams, P., Hannah, L., Andelman, S., Midgley, G., Ara�ujo,
M., Hughes, G., Manne, L., Martinez-Meyer, E. & Pearson,
R. (2005) Planning for climate change: identifying mini-
mum-dispersal corridors for the Cape Proteaceae. Conser-
vation Biology, 19, 1063–1074.
Williams, J.W., Jackson, S.T. & Kutzbach, J.E. (2007) Pro-
jected distributions of novel and disappearing climates by
Diversity and Distributions, 20, 1307–1320, ª 2014 John Wiley & Sons Ltd 1319
Species distribution models and conservation priorities
2100 AD. Proceedings of the National Academy of Sciences
USA, 104, 5738–5742.
Williams, J.N., Seo, C., Thorne, J., Nelson, J.K., Erwin, S.,
O’Brien, J.M. & Schwartz, M.W. (2009) Using species dis-
tribution models to predict new occurrences for rare
plants. Diversity and Distributions, 15, 565–576.
Wilson, K.A., McBride, M.F., Bode, M. & Possingham, H.P.
(2006) Prioritizing global conservation efforts. Nature, 440,
337–340.
Wisz, M.S., Hijmans, R.J., Li, J., Peterson, A.T., Graham,
C.H. & Guisan, A. (2008) Effects of sample size on the per-
formance of species distribution models. Diversity and Dis-
tributions, 14, 763–773.
SUPPORTING INFORMATION
Additional Supporting Information may be found in the
online version of this article:
Figure S1 Comparison of Outlying Mean Index results for
eligible versus omitted species.
Figure S2 Future climate anomalies and novel climates.
Figure S3 Variable contributions in MAXENT models.
Figure S4 Estimates of species richness and range-size rarity
based on the eligible species set, compared for MAXENT pre-
dictions versus multidimensional niche envelopes.
Table S1 African amphibians included in the study, includ-
ing range size and Red List status.
Table S2 Summary of IUCN Red List status for all amphib-
ian species included in the study, detailed separately for eligi-
ble and omitted species.
Table S3 Environmental variable loadings and variance
explained by the two-first axes of the Outlying Mean Index
Analysis, on present-day climate and on future climate
anomalies.
BIOSKETCH
Philip J. Platts is a Research Fellow at the University of
York, UK. His recent work has focused on mountain forests
in eastern Africa, their biological importance and the ecosys-
tem services they provide.
Author contributions: N.D.B. and C.H. conceived the idea;
P.J.P. and R.A.G. designed and implemented the analyses;
L.H. and W.F. worked on the amphibian database; P.J.P.,
R.A.G. and N.D.B. led the writing; and all authors inter-
preted the results and commented on the text.
Editor: Matt Fitzpatrick
1320 Diversity and Distributions, 20, 1307–1320, ª 2014 John Wiley & Sons Ltd
P. J. Platts et al.