Optimal dose of stereotactic radiosurgery for acoustic neuromas: a systematic review
Upload
independentCategory
view
2download
0
Int. J. Radiation Oncology Biol. Phys., Vol. 73, No. 2, pp. 562–570, 2009Copyright � 2009 Elsevier Inc.
Printed in the USA. All rights reserved0360-3016/09/$–see front matter
doi:10.1016/j.ijrobp.2008.04.026
PHYSICS CONTRIBUTION
CONFORMITY OF LINAC-BASED STEREOTACTIC RADIOSURGERY USINGDYNAMIC CONFORMAL ARCS AND MICRO-MULTILEAF COLLIMATOR
LISA J. HAZARD, M.D.,* BRIAN WANG, PH.D.,* THOMAS B. SKIDMORE, M.D.,* SHYH-SHI CHERN, PH.D.,y
BILL J. SALTER, PH.D.,* RANDY L. JENSEN, M.D., PH.D.,z AND DENNIS C. SHRIEVE, M.D., PH.D.*
Departments of *Radiation Oncology and zNeurosurgery, Huntsman Cancer Hospital, University of Utah School of Medicine,Salt Lake City, UT; and yDepartment of Radiation Oncology, St. Vincent’s Hospital, Worcester, MA
Purpose: To assess the conformity of dynamic conformal arc linear accelerator-based stereotactic radiosurgeryand to describe a standardized method of isodose surface (IDS) selection.Methods and Materials: In 174 targets, the conformity index (CI) at the prescription IDS used for treatment wascalculated as CI = (PIV/PVTV)/(PVTV/TV), where TV is the target volume, PIV (prescription isodose volume) isthe total volume encompassed by the prescription IDS, and PVTV is the TV encompassed by the IDS. In addition,a ‘‘standardized’’ prescription IDS (sIDS) was chosen according to the following criteria: 95% of the TV was en-compassed by the PIV and 99% of TV was covered by 95% of the prescription dose. The CIs at the sIDS were alsocalculated.Results: The median CI at the prescription IDS and sIDS was 1.63 and 1.47, respectively (p < 0.001). In 132 of 174cases, the volume of normal tissue in the PIV was reduced by the prescription to the sIDS compared with the pre-scription IDS, in 20 cases it remained unchanged, and in 22 cases it was increased.Conclusion: The CIs obtained with linear accelerator-based stereotactic radiosurgery are comparable to those pre-viously reported for gamma knife stereotactic radiosurgery. Using a uniform method to select the sIDS, adequatetarget coverage was usually achievable with prescription to an IDS greater than that chosen by the treating phy-sician (prescription IDS), providing sparing of normal tissue. Thus, the sIDS might aid physicians in identifyinga prescription IDS that balances coverage and conformity. � 2009 Elsevier Inc.
Stereotactic radiosurgery, Gamma knife, Conformity index, Dynamic conformal arc, Radiotherapy.
INTRODUCTION
A goal of stereotactic radiosurgery (SRS) is to achieve opti-
mal dose–volume conformity (i.e., to limit the prescription
dose to a volume closely coincident with the target volume),
thus excluding normal tissue (NT) from the high-dose region
(1). It has been shown that complications from SRS are
related to the volume of NT receiving a minimal dose (2–
4). Conversely, it is important to maintain a high degree of
coverage of the target volume (TV) by the prescription
dose, because a reduction in dose to spare normal structures
has been shown to lead to an unacceptable rate of tumor
recurrence (5, 6).
Historically, linear accelerator-based SRS has been con-
sidered less conformal than Gamma knife (GK) SRS (2, 7,
8). Since its inception, however, linear accelerator-based
SRS has increased in sophistication. The circular arc tech-
nique, more commonly used in the past, often required mul-
tiple isocenters to provide coverage of irregularly shaped
56
TVs (9). The advent of beam shaping using a micro-multileaf
collimator (mMLC) allowed the of use of single-isocenter
plans with multiple static fields or conformal arcs, with im-
proved homogeneity compared with multiple isocenters (9,
10) and a decreased dose to peripheral normal structures (9).
The dynamic conformal arc (DCA) technique is a method
of linear accelerator-based SRS that uses multiple arcs rotating
about a single isocenter (11, 12). Using mMLC to define its
shape, the beam conforms to the TV with every 10� of arc.
Nakamura et al. (2) reported on the conformity of GK
treatments for a large number of lesions treated at their insti-
tution. They concluded that ‘‘Gamma knife radiosurgery
achieves much more conformal dose distributions than those
reported for conventional linear accelerator radiosurgery and
a somewhat more conformal dose distribution than sophisti-
cated linear accelerator radiosurgery techniques.’’
We report on the conformity of DCA SRS as practiced at the
University of Utah for the purposes of comparison with the
Reprint requests to: Lisa J. Hazard, M.D., Department of Radia-tion Oncology, Huntsman Cancer Hospital, 1950 Circle of Hope,Salt Lake City, UT 84112-5560. Tel: (801) 581-2396; Fax: (801)585-3502; E-mail: [email protected]
Conflict of interest: none.Received Dec 11, 2007, and in revised form April 23, 2008.
Accepted for publication April 23, 2008.
2

Conformity of LINAC-based stereotactic radiosurgery d L. J. HAZARD et al. 563
conformity reported by Nakamura et al. (2) in their GK experi-
ence and other linear accelerator-based SRS series. In contrast to
the conclusions of Nakamura et al. (2), our results suggest that
improvements in the linear accelerator radiosurgery technique
have allowed comparable conformity to that with the GK.
In addition, we have proposed a uniform method for the se-
lection of the prescription isodose surface (IDS) selection.
Although the same treatment can be prescribed to various
IDSs (with the IDS representing a percentage of the isocenter
dose), conformity depends on the IDS selected. For example,
16 Gy prescribed to the 80% IDS will result in the same treat-
ment as 18 Gy prescribed to the 90% IDS; however, confor-
mity will be superior with the latter. We demonstrate that
prescription to the IDS associated with the lowest (best) con-
formity index (CI) does not necessarily provide adequate
coverage of the TV and that selection of the prescription
IDS should balance conformity and coverage.
Because conformity varies with the prescription IDS, the
method of prescription IDS selection is important when re-
porting conformity. In addition to its clinical utility, a uniform
method of prescription isodose selection would facilitate
comparisons of CIs among technologies and institutions.
METHODS AND MATERIALS
Target lesionsA series of 174 intracranial lesions in 163 patients treated consecu-
tively between 1998 and 2006 were chosen for analysis and were ret-
rospectively evaluated. The target diagnoses are described in Table 1.
Treatment planningAll evaluated plans were used for treatment. For purposes of uni-
formity and because detailed dose–volume data using previous plan-
ning software was not available from all patient charts, the
dosimetry for each plan was recalculated using the BrainScan, ver-
sion 5.31, stereotactic treatment planning software (BrainLAB,
Munich, Germany). The plans were designed for use with a mMLC
equipped with 26 leaf pairs, with 14 center leaf pairs having a width
of 3 mm, 6 leaf pairs of 4.5 mm, and 6 outer leaf pairs of 5.5 mm.
The DCA technique was used in all plans. In the DCA technique,
multiple arcs rotate about a single isocenter. The treatment planning soft-
ware creates a field shape using a mMLC that conforms to the outline of
the TV in the beam’s eye view in the starting position of the arc and for
each 10� of arc (Fig. 1). Each leaf moves linearly at 10� intervals inter-
polating from the initial position to the next calculated position.
The median number of arcs per plan was five (range, three to
seven). The median number of degrees of arc per plan was 500
(range, 235-770).
In 75 treatment plans, the collimator angle was set at 90�. In the
remaining 99 treatment plans, the collimator angle was optimized
using the planning software (the planning software determines a col-
limator angle for each arc that allows the mMLC to form a shape that
best conforms to the outline of the TV and maximally blocks non-
target tissue). Optimization of the collimator can improve confor-
mity (13), but this improvement might not have clinical
significance in an individual plan, and the decision to use or not
use collimator optimization was made by the treating physician.
A margin was added to the gross tumor/TV at the discretion of the
treating radiation oncologist to create a planning target volume
(PTV). For the purposes of this report, we evaluated the conformity
of the treatment plan with regard to the PTV.
The median prescribed dose was 1,800 cGy (range, 1,000–2,500).
The dose by diagnosis is described in Table 1. The treatment plans
were normalized to the 100% IDS.
Dose–volume histograms were generated for each lesion and for
the surrounding normal brain. The following were calculated for
each IDS: the total volume encompassed by the IDS (PIV); the vol-
ume of the NT encompassed by the IDS; the volume of target encom-
passed by the IDS (PVTV); and the percentage of the TV included
within the IDS (coverage). The NT plus the PVTV equals the PIV.
Prescription IDS selectionFor the 174 targets described, the treating physician chose the pre-
scription IDS actually used for treatment based on physician judg-
ment. A uniform method of prescription IDS selection was not
applied in all cases.
For the purposes of this study, a consistent method of IDS selec-
tion was used to identify the standardized IDS (sIDS). For each treat-
ment plan, the NT volume and TV encompassed by each IDS
(PVTV) was recorded (an example for a single target is presented
in Table 2 and Fig. 2). The sIDS was selected as the greatest IDS
covering 95% of the tumor and delivering 95% of the prescription
dose to 99% of the TV.
In the example (Table 2 and Fig. 2), the 84% IDS provided cov-
erage to 95% of the TV, thus satisfying our first criterion for sIDS
selection. To satisfy the second criterion, 95% of the prescription
dose must be delivered to 99% of the TV. If the dose were prescribed
to the 84% IDS, the 80% (84 � 0.95) IDS would need to receive
95% of the prescribed dose to satisfy the second criterion. As dem-
onstrated in Table 2, the 80% IDS would not cover 99% of the TV;
therefore, our second criterion for sIDS selection was not fulfilled.
The 82% IDS was the greatest IDS fulfilling both criteria and
was, thus, chosen as the sIDS.
For each of the 174 TVs, we evaluated the prescription IDS and sIDS.
PITV ratioThe PITV ratio, also referred to as the Radiation Therapy Oncol-
ogy Group (RTOG) index, was calculated (1): PITV ratio = PIV/TV.
Table 1. Conformity index by diagnosis
Diagnosis (n)Mean
dose (SD)Mean
CI (SD)
Acoustic schwannoma (17) 1,279 (36) 1.47 (0.21)Angioma (1) 1,200 1.30Arteriovenous
malformation (16)2,013 (263) 1.92* (0.48)
Chordoma (2) 2,000 1.46 (0.06)Hemangioblastoma (3) 1,800 (400) 1.35 (0.09)High-grade glioma (13) 1,819 (246) 1.53 (0.15)Low-grade glioma (2) 1,950 (636) 1.49 (0.44)Medulloblastoma (1) 1,800 1.51Meningioma (21) 1,509 (206) 1.64* (0.27)Metastases (94) 1,894 (258) 1.46 (0.28)Non-Hodgkin’s lymphoma (1) 1,500 1.29Pituitary adenoma (3) 1,623 (166) 1.90* (0.08)
Abbreviations: n = number; SD = standard deviation; CI = confor-mity index.
* p < 0.01 compared with metastases.

564 I. J. Radiation Oncology d Biology d Physics Volume 73, Number 2, 2009
Fig. 1. Beam’s eye view of single 120� dynamic arc for treatment of 9.36-cm3 tumor volume demonstrating micro-multi-leaf collimator leaf position for each 10� interval.
The PITV ratio describes the volume of tissue receiving the prescrip-
tion dose in relation to the TV.
Conformity indexThe CI, as described by van’t Riet and modified by Nakamura
et al. (2) to use the reciprocal of the van’t Riet definition, was calcu-
lated and tabulated for each isodose line (1, 2): CI = (PIV/PVTV)/
(PVTV/TV). The numerator of this expression measures the excess
volume within the IDS that does not include the TV, and the denom-
inator measures the fraction of TV included in the IDS (i.e., target
coverage) at the IDS. Each would have a value of 1.0 in the optimal
case. The CI, therefore, has a practical minimal value of 1.0, indicat-
ing perfect conformity. As the CI increases to >1, the conformity de-
creases, either because of an increase in the NT volume receiving the
prescription dose or because of a decrease in coverage of the TV by
the prescription dose.
Unlike the PITV ratio, the CI takes into account the location and
shape of the prescription volume with respect to the TV (2). If the
volume of tissue receiving the prescribed dose is equal to the TV,
the PITV ratio is 1. Even with a ‘‘perfect’’ PITV of 1, the volume
of tissue receiving the prescribed dose could be spatially separate
from the TV such that 0% of the TV received the prescribed dose.
The CI takes into account the coverage of the target and is, therefore,
more descriptive than the PITV ratio.
Comparison of amount of NT treated with prescription tosIDS and prescription IDS
The fraction of NT receiving the prescribed dose for the sIDS (de-
termined by the criteria outlined in the preceding section) compared
with the prescription IDS actually used for treatment was calculated
as NTsIDS/NTpIDS, where NTsIDS and NTpIDS are the volumes of NT
encompassed by the sIDS and prescription IDS, respectively.
Conformity of LINAC-based stereotactic radiosurgery d L. J. HAZARD et al. 565
Homogeneity indexThe homogeneity index was calculated at the prescription IDS and
sIDS and was defined as the maximal dose in the TV/prescription dose.
RESULTS
As described in Table 3, the mean sIDS was greater than
the mean prescription IDS. The mean PITV ratio, CI, and ho-
mogeneity index were lower with the sIDS than with prescrip-
tion IDS, indicating improved conformity and homogeneity.
As demonstrated in Fig. 3, an increased TV correlated with
improved conformity (p = 0.009). As demonstrated in Fig. 4,
larger lesions had a greater absolute volume of NT included
in the sIDS. However, the NT expressed as a percentage of
the TV (NT/TV) decreased with larger lesions (p < 0.0001
for each trend), likely as a result of improved conformity.
For purposes of comparison of our results with those from
the Joint Center Radiation Therapy (JCRT) series of linear
accelerator SRS reported by Nedzi et al. (14) and the Univer-
sity of California at San Francisco (UCSF) series of GK SRS
reported by Nakamura et al. (2), we selected 106 lesions with
TVs of 1.5–25.5 cm3. PITV ratios of 1.03–2.34 (median,
1.28) were obtained in this subgroup (Fig. 5).
The sIDS did not always result in the minimal CI achiev-
able with the plan (Tables 2 and 3 and Fig. 2). The minimal CI
was usually associated with an IDS that undertreated the TV
and therefore did not meet the designated selection criteria.
The CI at sIDS by diagnosis is described in Table 1. Me-
tastases had a superior mean CI compared with nonmetasta-
ses (p = 0.0003).
In 132 of the 174 target lesions, the sIDS chosen using the
criteria outlined in this study encompassed less NT compared
with the prescription IDS (Table 3). In 20 cases, the NT was
unchanged, and in 22 cases, it had increased.
We calculated the treatment delivery time for a subset of
66 patients from the electronic record and verify system IM-
PAC (IMPAC Medical Systems, Sunnyvale, CA). The average
treatment delivery time was 9.4 min (standard deviation, 1.3).
The minimal dose to the TV is listed in Table 3.
DISCUSSION
We report on the CIs for 174 target lesions treated with the
DCA technique to allow a comparison with published CIs
achieved with linear accelerator-based and GK SRS. In addi-
tion, we have applied a uniform method of choosing the pre-
scription IDS to balance conformity with adequate coverage
of the TV.
Conformity has been described using both the PITV ratio
and the CI (1, 15). Although the CI is the preferred descriptor
of conformity, it is not always reported. For the purposes of
comparison with published data, we have reported both the
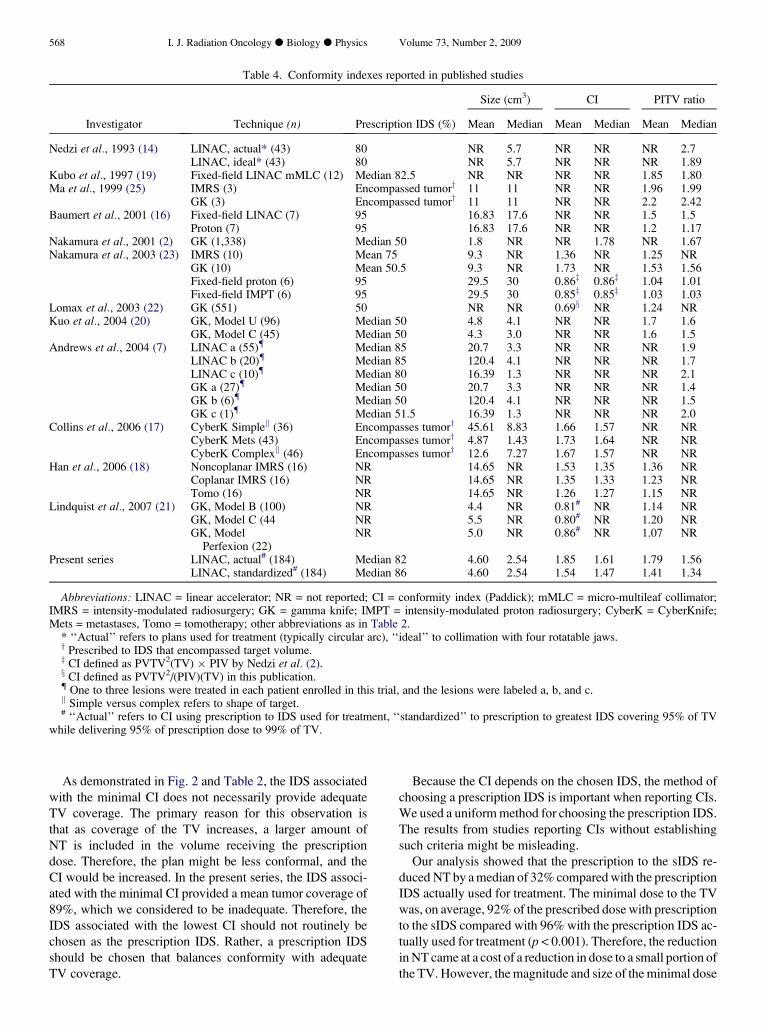
PITV ratio and the CI in the present study. Table 4 summa-
rizes CI and PITV ratios reported in the published data
(2, 7, 14, 16–25).
Linear accelerator-based SRS conformity has improved
over time. Collimation has evolved from circular to four in-
dependent jaws to mMLC. A reduction in the size of the
mMLC from 5–10-mm to 3-mm leaves has further improved
conformity (26).
Compared with multiple fixed fields, DCA improves con-
formity by shaping the mMLC pattern to that of the beam’s
eye view of the TV for each 10� of arc. Conformity in the
174 targets treated with the DCA technique in the present
study was superior to that reported by Kubo et al. (27) using
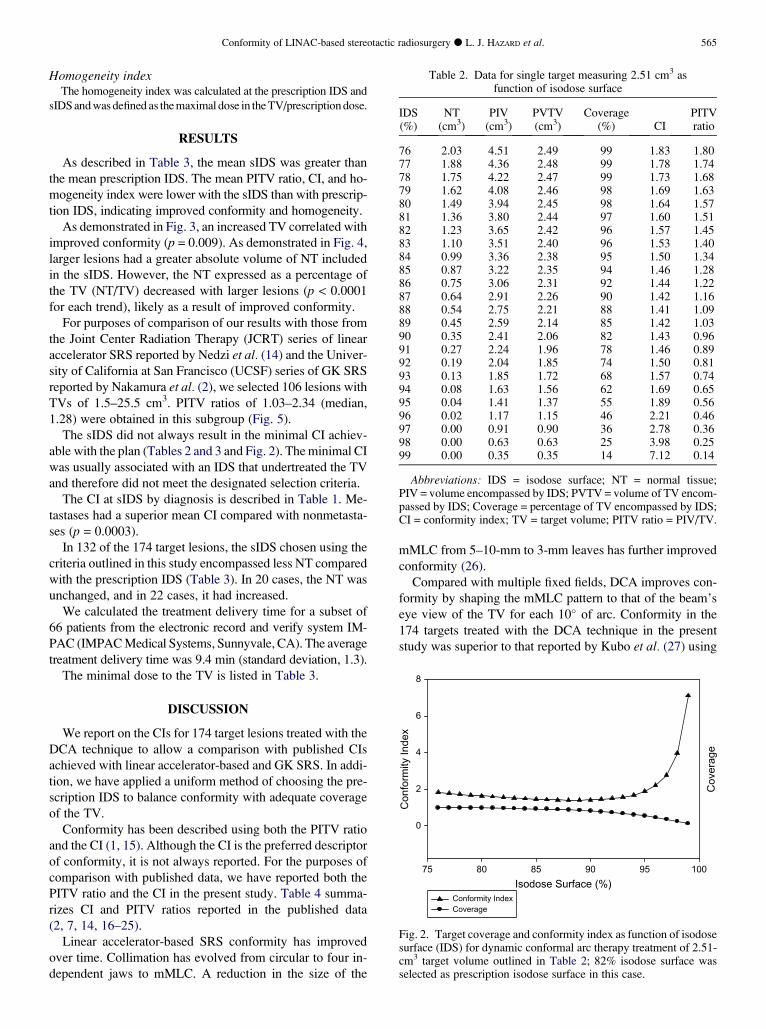
Table 2. Data for single target measuring 2.51 cm3 asfunction of isodose surface
IDS(%)
NT(cm3)
PIV(cm3)
PVTV(cm3)
Coverage(%) CI
PITVratio
76 2.03 4.51 2.49 99 1.83 1.8077 1.88 4.36 2.48 99 1.78 1.7478 1.75 4.22 2.47 99 1.73 1.6879 1.62 4.08 2.46 98 1.69 1.6380 1.49 3.94 2.45 98 1.64 1.5781 1.36 3.80 2.44 97 1.60 1.5182 1.23 3.65 2.42 96 1.57 1.4583 1.10 3.51 2.40 96 1.53 1.4084 0.99 3.36 2.38 95 1.50 1.3485 0.87 3.22 2.35 94 1.46 1.2886 0.75 3.06 2.31 92 1.44 1.2287 0.64 2.91 2.26 90 1.42 1.1688 0.54 2.75 2.21 88 1.41 1.0989 0.45 2.59 2.14 85 1.42 1.0390 0.35 2.41 2.06 82 1.43 0.9691 0.27 2.24 1.96 78 1.46 0.8992 0.19 2.04 1.85 74 1.50 0.8193 0.13 1.85 1.72 68 1.57 0.7494 0.08 1.63 1.56 62 1.69 0.6595 0.04 1.41 1.37 55 1.89 0.5696 0.02 1.17 1.15 46 2.21 0.4697 0.00 0.91 0.90 36 2.78 0.3698 0.00 0.63 0.63 25 3.98 0.2599 0.00 0.35 0.35 14 7.12 0.14
Abbreviations: IDS = isodose surface; NT = normal tissue;PIV = volume encompassed by IDS; PVTV = volume of TV encom-passed by IDS; Coverage = percentage of TV encompassed by IDS;CI = conformity index; TV = target volume; PITV ratio = PIV/TV.
Isodose Surface (%)75 80 85 90 95 100
Con
form
ity In
dex
0
2
4
6
8
Cov
erag
e
Conformity IndexCoverage
Fig. 2. Target coverage and conformity index as function of isodosesurface (IDS) for dynamic conformal arc therapy treatment of 2.51-cm3 target volume outlined in Table 2; 82% isodose surface wasselected as prescription isodose surface in this case.

566 I. J. Radiation Oncology d Biology d Physics Volume 73, Number 2, 2009
mMLC shaping and three to five static fields. The results
from the present study also compare favorably to the PITV
ratios achieved with linear accelerator-based SRS in the
RTOG protocols 90-05 (8) and 95-08 (7). Neither the
RTOG 90-05 nor the 95-08 trial reported details regarding
the technique of linear accelerator-based SRS, and less-
sophisticated techniques likely accounted for the inferior
conformity.
An improvement in conformity with the use of sophisti-
cated collimation is supported by the findings of the JCRT
group in the early 1990s. In their publication by Nedzi
et al. (14), they compared the conformity of linear accelera-
tor-based SRS using one of several collimation systems: cir-
cular collimators alone or with two parallel jaws, four
rectangular jaws, four rotatable jaws, or ‘‘ideal’’ collimation
(similar to dynamic arcs with mMLC). In the latter model, the
Table 3. Treatment parameters for prescription andstandardized isodose surfaces
Parameter Mean (SD) Median Range
Tumor volume (cm3) 4.60 (5.29) 2.54 0.08–36.32pIDS 82 (3.33) 80 80–90sIDS 86 (5.00) 86 59–96PIV (cm3)
pIDS 7.25 (7.76) 4.13 0.11–40.12sIDS 6.19 (6.88) 3.63 0.12–40.12
PVTV (cm3)pIDS 4.50 (5.15) 2.50 0.08–34.57sIDS 4.39 (5.05) 2.44 0.08–34.57
CIpIDS 1.85 (0.81) 1.63 1.20–7.13sIDS 1.54 (0.32)* 1.47 1.16–2.80
PITV ratiopIDS 1.79 (0.83) 1.56 1.05–7.13sIDS 1.41 (0.30)* 1.34 1.03–2.64
Normal tissue (cm3)pIDS 2.90 (3.30) 1.43 0.02–16.00sIDS 1.77 (2.22)* 0.77 0.02–13.44NTsIDS/NTpIDS 0.68 0.60 0.01–1.98
Target coverage (%)pIDS 0.98 (0.02) 0.99 0.90–1.0sIDS 0.96 (0.01)* 0.96 0.95–1.0
HIpIDS 1.25 (0.06) 1.25 1.11–1.48sIDS 1.18 (0.08)* 1.18 1.04–1.71
Dmin (%)pIDS 96 (8) 96 64–116sIDS 92 (5)* 92 62–102
TV receivingDmin (%)
1.25 (2.27) 0.3 0–12.5
Minimal CIy 1.45 (0.22) 1.40 1.15–2.51IDS with
minimal CI89 (3.54) 89 80–99
Target coverageat IDS withminimal CI (%)y
89 (4.82) 90 69–97
Abbreviations: SD = standard deviation; pIDS = prescription iso-dose surface used for actual treatment; sIDS = standardized isodosesurface (chosen by criteria outlined in text); HI = homogeneityindex; Dmin = minimal dose to tumor (expressed as percentage ofprescribed dose); other abbreviations as in Table 2.
* p < 0.0001.y p < 0.0001 compared with CI for sIDS.
‘‘ideal’’ mMLC position encompassed all points representing
the contour of the target lesion. Although conformity was im-
proved modestly with the simple collimator models, the
‘‘ideal’’ collimator improved conformity by a median value
of 49% compared with the circular collimators.
The results from the RTOG protocols 90-05 and 95-08
both suggested superior conformity as measured by the
PITV ratio with GK than with the linear accelerator (7, 8).
With the improvements in linear accelerator-based SRS tech-
niques, however, it is not clear that the GK continues to offer
an advantage. In 1,338 lesions treated with GK SRS at the
University of California, San Francisco (UCSF), the median
CI was 1.78 compared with 1.85 in the present series (2).
Nakamura et al. (2) found that the CI and PITV ratio were
highly dependent on the TV, a finding also observed in our
study. In an attempt to account for this potentially confound-
ing variable, we selected TVs from our database in a specific
size range (1.5–25.5 cm3) for the purposes of comparison
with the TVs in the same size range in the UCSF GK series
by Nakamura et al. (2) and the JCRT linear accelerator series
Target Volume (cc)0 10 20 30 40
Con
form
ity In
dex
1.0
1.2
1.4
1.6
1.8
2.0
2.2
2.4
2.6
2.8
3.0
Fig. 3. Conformity index as function of target volume.
Target Volume (cc)0 10 20 30 40
Nor
mal
Tis
sue
(cc)
0
2
4
6
8
10
12
14
Nor
mal
Tis
sue/
Targ
et V
olum
e
Normal Tissue (cc)Normal Tissue/Target Volume
Fig. 4. Normal tissue volume as fraction of target volume and abso-lute normal tissue volume at standardized prescription isodose sur-face in each of 174 cases analyzed as function of target volume.
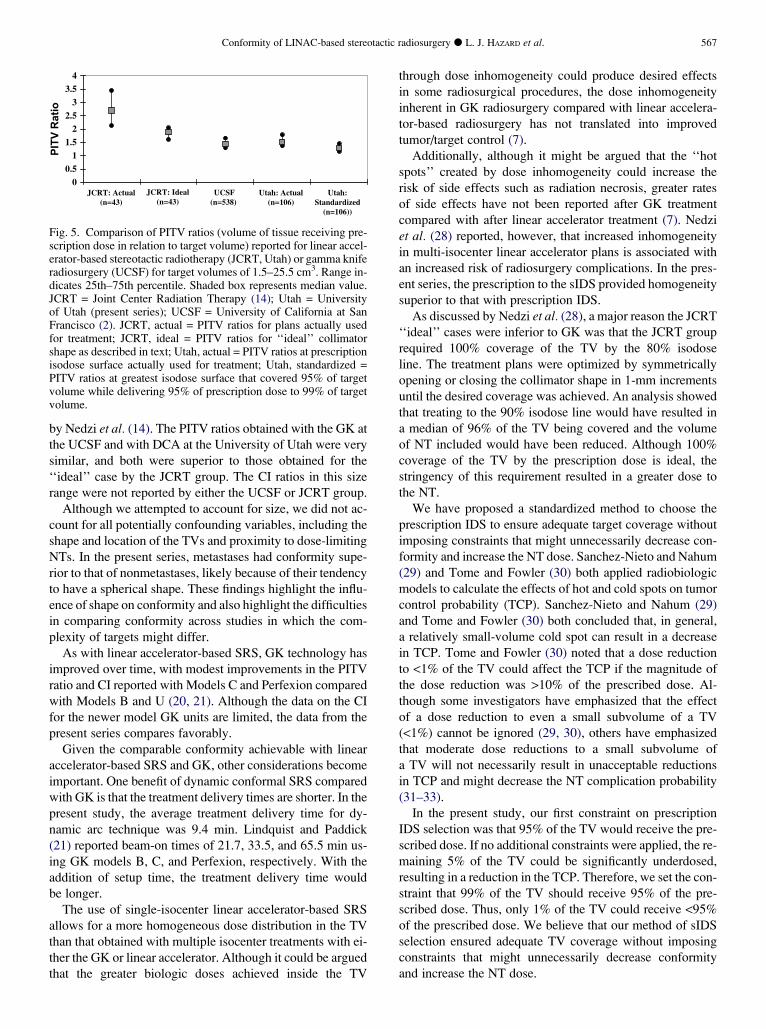
by Nedzi et al. (14). The PITV ratios obtained with the GK at
the UCSF and with DCA at the University of Utah were very
similar, and both were superior to those obtained for the
‘‘ideal’’ case by the JCRT group. The CI ratios in this size
range were not reported by either the UCSF or JCRT group.
Although we attempted to account for size, we did not ac-
count for all potentially confounding variables, including the
shape and location of the TVs and proximity to dose-limiting
NTs. In the present series, metastases had conformity supe-
rior to that of nonmetastases, likely because of their tendency
to have a spherical shape. These findings highlight the influ-
ence of shape on conformity and also highlight the difficulties
in comparing conformity across studies in which the com-
plexity of targets might differ.
As with linear accelerator-based SRS, GK technology has
improved over time, with modest improvements in the PITV
ratio and CI reported with Models C and Perfexion compared
with Models B and U (20, 21). Although the data on the CI
for the newer model GK units are limited, the data from the
present series compares favorably.
Given the comparable conformity achievable with linear
accelerator-based SRS and GK, other considerations become
important. One benefit of dynamic conformal SRS compared
with GK is that the treatment delivery times are shorter. In the
present study, the average treatment delivery time for dy-
namic arc technique was 9.4 min. Lindquist and Paddick
(21) reported beam-on times of 21.7, 33.5, and 65.5 min us-
ing GK models B, C, and Perfexion, respectively. With the
addition of setup time, the treatment delivery time would
be longer.
The use of single-isocenter linear accelerator-based SRS
allows for a more homogeneous dose distribution in the TV
than that obtained with multiple isocenter treatments with ei-
ther the GK or linear accelerator. Although it could be argued
that the greater biologic doses achieved inside the TV
00.5
11.5
22.5
33.5
4
JCRT: Actual(n=43)
JCRT: Ideal(n=43)
UCSF(n=538)
Utah: Actual(n=106)
Utah:Standardized
(n=106))
PIT
V R
atio
Fig. 5. Comparison of PITV ratios (volume of tissue receiving pre-scription dose in relation to target volume) reported for linear accel-erator-based stereotactic radiotherapy (JCRT, Utah) or gamma kniferadiosurgery (UCSF) for target volumes of 1.5–25.5 cm3. Range in-dicates 25th–75th percentile. Shaded box represents median value.JCRT = Joint Center Radiation Therapy (14); Utah = Universityof Utah (present series); UCSF = University of California at SanFrancisco (2). JCRT, actual = PITV ratios for plans actually usedfor treatment; JCRT, ideal = PITV ratios for ‘‘ideal’’ collimatorshape as described in text; Utah, actual = PITV ratios at prescriptionisodose surface actually used for treatment; Utah, standardized =PITV ratios at greatest isodose surface that covered 95% of targetvolume while delivering 95% of prescription dose to 99% of targetvolume.
Conformity of LINAC-based stereotacti
through dose inhomogeneity could produce desired effects
in some radiosurgical procedures, the dose inhomogeneity
inherent in GK radiosurgery compared with linear accelera-
tor-based radiosurgery has not translated into improved
tumor/target control (7).
Additionally, although it might be argued that the ‘‘hot
spots’’ created by dose inhomogeneity could increase the
risk of side effects such as radiation necrosis, greater rates
of side effects have not been reported after GK treatment
compared with after linear accelerator treatment (7). Nedzi
et al. (28) reported, however, that increased inhomogeneity
in multi-isocenter linear accelerator plans is associated with
an increased risk of radiosurgery complications. In the pres-
ent series, the prescription to the sIDS provided homogeneity
superior to that with prescription IDS.
As discussed by Nedzi et al. (28), a major reason the JCRT
‘‘ideal’’ cases were inferior to GK was that the JCRT group
required 100% coverage of the TV by the 80% isodose
line. The treatment plans were optimized by symmetrically
opening or closing the collimator shape in 1-mm increments
until the desired coverage was achieved. An analysis showed
that treating to the 90% isodose line would have resulted in
a median of 96% of the TV being covered and the volume
of NT included would have been reduced. Although 100%
coverage of the TV by the prescription dose is ideal, the
stringency of this requirement resulted in a greater dose to
the NT.
We have proposed a standardized method to choose the
prescription IDS to ensure adequate target coverage without
imposing constraints that might unnecessarily decrease con-
formity and increase the NT dose. Sanchez-Nieto and Nahum
(29) and Tome and Fowler (30) both applied radiobiologic
models to calculate the effects of hot and cold spots on tumor
control probability (TCP). Sanchez-Nieto and Nahum (29)
and Tome and Fowler (30) both concluded that, in general,
a relatively small-volume cold spot can result in a decrease
in TCP. Tome and Fowler (30) noted that a dose reduction
to <1% of the TV could affect the TCP if the magnitude of
the dose reduction was >10% of the prescribed dose. Al-
though some investigators have emphasized that the effect
of a dose reduction to even a small subvolume of a TV
(<1%) cannot be ignored (29, 30), others have emphasized
that moderate dose reductions to a small subvolume of
a TV will not necessarily result in unacceptable reductions
in TCP and might decrease the NT complication probability
(31–33).
In the present study, our first constraint on prescription
IDS selection was that 95% of the TV would receive the pre-
scribed dose. If no additional constraints were applied, the re-
maining 5% of the TV could be significantly underdosed,
resulting in a reduction in the TCP. Therefore, we set the con-
straint that 99% of the TV should receive 95% of the pre-
scribed dose. Thus, only 1% of the TV could receive <95%
of the prescribed dose. We believe that our method of sIDS
selection ensured adequate TV coverage without imposing
constraints that might unnecessarily decrease conformity
and increase the NT dose.
c radiosurgery d L. J. HAZARD et al. 567
568 I. J. Radiation Oncology d Biology d Physics Volume 73, Number 2, 2009
Table 4. Conformity indexes reported in published studies
Size (cm3) CI PITV ratio
Investigator Technique (n) Prescription IDS (%) Mean Median Mean Median Mean Median
Nedzi et al., 1993 (14) LINAC, actual* (43) 80 NR 5.7 NR NR NR 2.7LINAC, ideal* (43) 80 NR 5.7 NR NR NR 1.89
Kubo et al., 1997 (19) Fixed-field LINAC mMLC (12) Median 82.5 NR NR NR NR 1.85 1.80Ma et al., 1999 (25) IMRS (3) Encompassed tumory 11 11 NR NR 1.96 1.99
GK (3) Encompassed tumory 11 11 NR NR 2.2 2.42Baumert et al., 2001 (16) Fixed-field LINAC (7) 95 16.83 17.6 NR NR 1.5 1.5
Proton (7) 95 16.83 17.6 NR NR 1.2 1.17Nakamura et al., 2001 (2) GK (1,338) Median 50 1.8 NR NR 1.78 NR 1.67Nakamura et al., 2003 (23) IMRS (10) Mean 75 9.3 NR 1.36 NR 1.25 NR
GK (10) Mean 50.5 9.3 NR 1.73 NR 1.53 1.56Fixed-field proton (6) 95 29.5 30 0.86z 0.86z 1.04 1.01Fixed-field IMPT (6) 95 29.5 30 0.85z 0.85z 1.03 1.03
Lomax et al., 2003 (22) GK (551) 50 NR NR 0.69x NR 1.24 NRKuo et al., 2004 (20) GK, Model U (96) Median 50 4.8 4.1 NR NR 1.7 1.6
GK, Model C (45) Median 50 4.3 3.0 NR NR 1.6 1.5Andrews et al., 2004 (7) LINAC a (55){ Median 85 20.7 3.3 NR NR NR 1.9
LINAC b (20){ Median 85 120.4 4.1 NR NR NR 1.7LINAC c (10){ Median 80 16.39 1.3 NR NR NR 2.1GK a (27){ Median 50 20.7 3.3 NR NR NR 1.4GK b (6){ Median 50 120.4 4.1 NR NR NR 1.5GK c (1){ Median 51.5 16.39 1.3 NR NR NR 2.0
Collins et al., 2006 (17) CyberK Simplejj (36) Encompasses tumory 45.61 8.83 1.66 1.57 NR NRCyberK Mets (43) Encompasses tumory 4.87 1.43 1.73 1.64 NR NRCyberK Complexjj (46) Encompasses tumory 12.6 7.27 1.67 1.57 NR NR
Han et al., 2006 (18) Noncoplanar IMRS (16) NR 14.65 NR 1.53 1.35 1.36 NRCoplanar IMRS (16) NR 14.65 NR 1.35 1.33 1.23 NRTomo (16) NR 14.65 NR 1.26 1.27 1.15 NR
Lindquist et al., 2007 (21) GK, Model B (100) NR 4.4 NR 0.81# NR 1.14 NRGK, Model C (44 NR 5.5 NR 0.80# NR 1.20 NRGK, Model
Perfexion (22)NR 5.0 NR 0.86# NR 1.07 NR
Present series LINAC, actual# (184) Median 82 4.60 2.54 1.85 1.61 1.79 1.56LINAC, standardized# (184) Median 86 4.60 2.54 1.54 1.47 1.41 1.34
Abbreviations: LINAC = linear accelerator; NR = not reported; CI = conformity index (Paddick); mMLC = micro-multileaf collimator;IMRS = intensity-modulated radiosurgery; GK = gamma knife; IMPT = intensity-modulated proton radiosurgery; CyberK = CyberKnife;Mets = metastases, Tomo = tomotherapy; other abbreviations as in Table 2.
* ‘‘Actual’’ refers to plans used for treatment (typically circular arc), ‘‘ideal’’ to collimation with four rotatable jaws.y Prescribed to IDS that encompassed target volume.z CI defined as PVTV2(TV) � PIV by Nedzi et al. (2).x CI defined as PVTV2/(PIV)(TV) in this publication.{ One to three lesions were treated in each patient enrolled in this trial, and the lesions were labeled a, b, and c.jj Simple versus complex refers to shape of target.# ‘‘Actual’’ refers to CI using prescription to IDS used for treatment, ‘‘standardized’’ to prescription to greatest IDS covering 95% of TV
while delivering 95% of prescription dose to 99% of TV.
As demonstrated in Fig. 2 and Table 2, the IDS associated
with the minimal CI does not necessarily provide adequate
TV coverage. The primary reason for this observation is
that as coverage of the TV increases, a larger amount of
NT is included in the volume receiving the prescription
dose. Therefore, the plan might be less conformal, and the
CI would be increased. In the present series, the IDS associ-
ated with the minimal CI provided a mean tumor coverage of
89%, which we considered to be inadequate. Therefore, the
IDS associated with the lowest CI should not routinely be
chosen as the prescription IDS. Rather, a prescription IDS
should be chosen that balances conformity with adequate
TV coverage.
Because the CI depends on the chosen IDS, the method of
choosing a prescription IDS is important when reporting CIs.
We used a uniform method for choosing the prescription IDS.
The results from studies reporting CIs without establishing
such criteria might be misleading.
Our analysis showed that the prescription to the sIDS re-
duced NT by a median of 32% compared with the prescription
IDS actually used for treatment. The minimal dose to the TV
was, on average, 92% of the prescribed dose with prescription
to the sIDS compared with 96% with the prescription IDS ac-
tually used for treatment (p < 0.001). Therefore, the reduction
in NT came at a cost of a reduction in dose to a small portion of
the TV. However, the magnitude and size of the minimal dose
Conformity of LINAC-based stereotactic radiosurgery d L. J. HAZARD et al. 569
was, based on our earlier discussions, considered acceptable.
Although the value of physician experience and judgment ap-
plied to each SRS plan cannot be minimized, these findings
suggest that uniform criteria for prescription IDS selection
could allow physicians to more consistently choose a prescrip-
tion IDS that balances TV coverage with conformity.
The sIDS varied from 59% to 96%, and this range has clin-
ical implications. Most notably, the maximal target dose will
be greater with a prescription to a lower IDS, which increases
the risk of NT complications (28). However, adequate target
coverage is essential, and the increase in NT volume and dose
is often justified to ensure this coverage. Physician judgment
is critical; a plan that exceeds the tolerance dose to NT using
a prescription to the sIDS is unacceptable.
CONCLUSIONS
The results of our study have shown that linear accelerator-
based DCA SRS provides conformity equivalent to the
published results from GK SRS. The CI varies with the pre-
scription IDS, and, therefore, the method of prescription IDS
selection is important when reporting conformity. We pro-
pose the selection of the prescription IDS by uniform criteria
as follows: the greatest isodose line covering 95% of the TV
while delivering 95% of the prescription dose to 99% of the
TV should be chosen as the prescription IDS, which will en-
sure adequate target coverage while minimizing the dose to
the NT. Without such standardization, comparisons of CIs
among techniques will remain difficult.
REFERENCES
1. Feuvret L, Noel G, Mazeron JJ, et al. Conformity index: Areview. Int J Radiat Oncol Biol Phys 2006;64:333–342.
2. Nakamura J, Verhey LJ, Smith V, et al. Dose conformity ofgamma knife radiosurgery and risk factors for complications.Int J Radiat Oncol Biol Phys 2001;51:1313–1319.
3. Smith V, Verhey LJ, Serago CF. Comparison of radiosurgerytreatment modalities based on complication and control proba-bilities. Int J Radiat Oncol Biol Phys 1998;40:507–513.
4. Kijewski P. Three dimensional treatment planning. In:Mauch PM, Loefller JS, editors. Radiation oncology: biologyand technology. Philadelphia: WB Saunders; 1994. p. 10–33.
5. Ganz J, Backlund EO, Thorsen FA. The results of gamma knifesurgery of meningiomas, related to size of tumor and dose. Ster-eotact Funct Neurosurg 1993;61(Suppl. 1):23–29.
6. Kobayashi T, Kida Y, Mori Y, et al. Long-term results ofgamma knife surgery for the treatment of craniopharyngiomain 98 consecutive cases. J Neurosurg 2005;103(6 Suppl.):482–488.
7. Andrews D, Scott CB, Sperduto PW, et al. Whole brain radia-tion therapy with or without stereotactic radiosurgery boostfor patients with one to three brain metastases: Phase III resultsof the RTOG 9508 randomised trial. Lancet 2004;363:1665–1672.
8. Shaw E, Scott C, Souhami L, et al. Single dose radiosurgicaltreatment of recurrent previously irradiated primary brain tu-mors and brain metastases: Final report of RTOG protocol90-05. Int J Radiat Oncol Biol Phys 2000;47:291–298.
9. Solberg T, Boedeker KL, Fogg R, et al. Dynamic arc radiosur-gery field shaping: A comparison with static field conformal andnoncoplanar circular arcs. Int J Radiat Oncol Biol Phys 2001;49:1481–1491.
10. Luxton G, Jozsef G. Single isocenter treatment planning for ho-mogeneous dose delivery to nonspherical targets in multiarc lin-ear accelerator radiosurgery. Int J Radiat Oncol Biol Phys 1995;3:635–643.
11. Leavitt D, Tobler M, Gaffney D, et al. Comparison of interpo-lated vs. calculated micro-multileaf settings in dynamic confor-mal arc treatment. Med Dosim 2000;25:17–21.
12. Leavitt D. Beam shaping for SRT/SRS. Med Dosim 1998;23:229–236.
13. Lee CM, Watson GA, Leavitt DD. Dynamic collimator optimi-zation compared with fixed collimator angle in arc-based stereo-tactic radiotherapy: A dosimetric analysis. Neurosurg Focus2005;19:E12–E16.
14. Nedzi L, Kooy HM, Alexander E III, et al. Dynamic field shap-ing for stereotactic radiosurgery: A modeling study. Int J RadiatOncol Biol Phys 1993;25:859–869.
15. Paddick I. A simple scoring ratio to index the conformity of
radiosurgical treatment plans. J Neurosurg 2000;93:219–222.16. Baumert B, Lomax A, Miltchev M, et al. A comparison of dose
distributions of proton and photon beams in stereotactic confor-
mal radiotherapy of brain lesions. Int J Radiat Oncol Biol Phys2001;49:1439–1449.
17. Collins S, Coppa N, Zhang Y, et al. CyberKnife radiosurgery in
the treatment of complex skull base tumors: Analysis of treat-
ment planning parameters. Radiat Oncol 2006;1:46–56.18. Han C, Liu A, Schultheiss TE, et al. Dosimetric comparisons of
helical tomotherapy treatment plans and step-and-shoot inten-
sity-modulated radiosurgery treatment plans in intracranial ste-
reotactic radiosurgery. Int J Radiat Oncol Biol Phys 2006;65:
608–616.19. Kubo H, Pappas CT, Wilder RB. A comparison of arc-based
and static mini-multileaf collimator-based radiosurgery treat-
ment plans. Radiother Oncol 1997;45:89–93.20. Kuo J, Yu C, Giannotta S, et al. The Leksell Gamma Knife
model U versus model C: A quantitative comparison of radio-
surgical treatment parameters. Neurosurgery 2004;168–172.21. Lindquist C, Paddick I. The Leksell Gamma Knife Perfexion
and comparisons with its predecessors. Neurosurgery 2007;
61(3 Suppl.):130–140; discussion 140–131.22. Lomax NJ, Scheib SG. Quantifying the degree of conformity in
radiosurgery treatment planning. Int J Radiat Oncol Biol Phys2003;55:1409–1419.
23. Nakamura J, Pirzkall A, Carol MP, et al. Comparison of inten-
sity-modulated radiosurgery with gamma knife radiosurgery for
challenging skull base lesions. Int J Radiat Oncol Biol Phys2003;55:99–109.
24. Shaw E, Scott C, Souhami L, et al. Radiosurgery for the treat-
ment of previously irradiated recurrent primary brain tumors
and brain metastases: Initial report of the Radiation Therapy
Oncology Group protocol 90-05. Int J Radiat Oncol BiolPhys 1996;34:647–654.
25. Ma L, Xia P, Verhey L, et al. A dosimetric comparison of fan-
beam intensity modulated radiotherapy with gamma knife
stereotactic radiosurgery for treating intermediate intracranial
lesions. Int J Radiat Oncol Biol Phys 1999;45:1325–1330.26. Jin J, Fang-Fang Y, Ryu S, et al. Dosimetric study using differ-
ent leaf-width MLCs for treatment planning of dynamic confor-
mal arcs and intensity-modulated radiosurgery. Med Phys 2005;
32:405–411.27. Kubo Dh WR, Pappas CTE. Impact of collimator leaf width on
stereotactic radiosurgery and 3D conformal radiotherapy treat-
ment plans. Int J Radiat Oncol Biol Phys 1999;44:937–945.

570 I. J. Radiation Oncology d Biology d Physics Volume 73, Number 2, 2009
28. Nedzi L, Looy H, Alexander E, et al. Variables associated withthe development of complications from radiosurgery of intra-cranial tumors. Int J Radiat Oncol Biol Phys 1991;21:591–599.
29. Sanchez-Nieto B, Nahum AE. The delta-TCP concept: A clini-cally useful measure of tumor control probability. Int J RadiatOncol Biol Phys 1999;44:369–380.
30. Tome WA, Fowler JF. On cold spots in tumor subvolumes. MedPhys 2002;29:1590–1598.
31. Brahme A. Dosimetric precision requirements in radiation ther-apy. Acta Radiol Oncol 1984;23:379–391.
32. Goitein M. Causes and consequences of inhomogeneous dosedistributions in radiation therapy. Int J Radiat Oncol BiolPhys 1986;12:701–704.
33. Goitein M, Niemierko A. Intensity modulated therapy and inho-mogeneous dose to the tumor: A note of caution. Int J RadiatOncol Biol Phys 1996;36:519–522.
Copyright © 2022 FDOKUMEN