Conformational and physicochemical DNA features specific for transcription factor binding sites
15
Conformational and physicochemical DNA features specific for transcription factor binding sites Julia V. Ponomarenko 1 , Mikhail P. Ponomarenko 1 , Anatoly S. Frolov 1 , Denis G. Vorobyev 1 , G. Christian Overton 2 and Nikolay A. Kolchanov 1 1 Laboratory of Theoretical Genetics, Institute of Cytology & Genetics, 10 Lavrentyev Avenue, Novosibirsk, 630090, Russia and 2 Center for Bioinformatics, University of Pennsylvania, 1312 Blockley Hall (6021), 418 Guardian Drive, Philadelphia, PA 19104Ć6145, USA Received on November 27, 1998; revised on April 3, 1999; accepted on April 19, 1999 Abstract Motivation: A reliable recognition of transcription factor binding sites is essential for analysis of regulatory genomic sequences. The experimental data make evident an import- ant role of DNA conformational features for site functioning. However, Internet-available tools for revealing conforma- tional and physicochemical DNA features significant for the site functioning and subsequent use of these features for site recognition have not been developed up to now . Results: We suggest an approach for revealing significant conformational and physicochemical properties of func- tional sites implemented in the database B-DNA-VIDEO. This database is designed to study the sets of various transcription factor binding sites, providing evidence that transcription factor binding sites are characterized by specific sets of significant conformational and physico- chemical DNA properties. For a fixed site, by using the B-DNA features selected for this site recognition, the C-program recognizing this site may be generated, control tested and stored in the database B-DNA-VIDEO. Each B-DNA-VIDEO entry links to the Web-applet recognizing the site, whose significant B-DNA features are stored in this entry as the ‘site recognition programs’. The pairwise linked entry–applet pairs are compiled within the B-DNA-VIDEO system, which is simultaneously the database and the program tools package applicable immediately for recogniz- ing the sites stored in the database. Indeed, this is the novelty. Hence, B-DNA-VIDEO is the Web resource of both ‘search- ing for static data’ and ‘active computation’ type, that is why it was called an ‘activated database’. Availability: B-DNA-VIDEO is available at http://wwwmgs. bionet.nsc.ru/systems/BDNAVideo/ and the mirror site at http://www.cbil.upenn.edu/mgs/systems/consfreq/ . Contact: [email protected] Introduction Transcription is controlled by a set of functional DNA sites realizing specific functions through interaction with the relevant proteins: transcription factors (Latchman, 1995). The experimental data on DNA sequences and functions of thousands of transcription factor binding sites are currently accumulated within various databases. The best-known databases in this intensively developed area are EMBL Data Library (Stoesser et al., 1998), TRANSFAC (Heinemeyer et al., 1999), TRRD (Kolchanov et al., 1999), EpoDB (Stoeckert et al., 1999), EPD (Perier et al., 1999) and RegulonDB (Salgado et al., 1999). All of them are initial sources of information for developing the methods for transcription factor binding site recognition. Since the probabilistic information content was first applied to recognizing the functional DNA sites (Schneider et al., 1986), and then Berg and von Hippel (1987) developed the statistical-mechanical theory on the proteins binding DNA sites, the weight matrix-based approach remains dominant up to now. Hundreds of the weight matrix variants for transcription factor binding site recognition have been calculated and successfully applied. For example, the commonly accepted MatInspector (Quandt et al., 1995) is currently manipulating over 200 weight matrices of this type. Among the recently developed tools for transcription factor binding site recognition, Object-Oriented Transcription Factors Database OOTFD (Ghosh, 1998), Matrix Search (Chen et al., 1995), TESS (Stoeckert et al., 1999), the TRANSFAC-based expert system (Heinemeyer et al., 1999), DPInteract (Robison et al., 1998) and RegulonDB (Salgado et al., 1999) are widely used. Nevertheless, recent evaluation of computer tools for transcription factor binding site recognition within genomic DNA (Roulet et al., 1998) indicated that the current site recognition tools are typically Vol. 15 nos 7/8 1999 Pages 654-668 654 E Oxford University Press 1999 BIOINFORMATICS
-
Upload
independent -
Category
Documents
-
view
2 -
download
0
Transcript of Conformational and physicochemical DNA features specific for transcription factor binding sites
Conformational and physicochemical DNA featuresspecific for transcription factor binding sites
����� �� ���� ��� ������� �� ���� �������� �� ������ � �� �� ���� ��� �� �������� �� ��� � !����� �� "�#����
�$������� % &� � ��#�� � ��#�� '������ % ����(� ) � ��#�� �* $��� �� �
�� � � !��������� +,**-*� .����� � �� � � %� /��%�����#�� 0�� ����� %
� �������� �,�� /�#�� � 1��� 2+*��3� 4�5 ���� �� ���� � ����� �6����
�� �-�*47+�48� 0��
�������� �� ������ �� ����� ������� �� ����� �� ����� �������� �� ����� ��� ����
Abstract
Motivation: A reliable recognition of transcription factorbinding sites is essential for analysis of regulatory genomicsequences. The experimental data make evident an import-ant role of DNA conformational features for site functioning.However, Internet-available tools for revealing conforma-tional and physicochemical DNA features significant for thesite functioning and subsequent use of these features for siterecognition have not been developed up to now.Results: We suggest an approach for revealing significantconformational and physicochemical properties of func-tional sites implemented in the database B-DNA-VIDEO.This database is designed to study the sets of varioustranscription factor binding sites, providing evidence thattranscription factor binding sites are characterized byspecific sets of significant conformational and physico-chemical DNA properties. For a fixed site, by using theB-DNA features selected for this site recognition, theC-program recognizing this site may be generated, controltested and stored in the database B-DNA-VIDEO. EachB-DNA-VIDEO entry links to the Web-applet recognizing thesite, whose significant B-DNA features are stored in thisentry as the ‘site recognition programs’. The pairwise linkedentry–applet pairs are compiled within the B-DNA-VIDEOsystem, which is simultaneously the database and theprogram tools package applicable immediately for recogniz-ing the sites stored in the database. Indeed, this is the novelty.Hence, B-DNA-VIDEO is the Web resource of both ‘search-ing for static data’ and ‘active computation’ type, that is whyit was called an ‘activated database’.Availability: B-DNA-VIDEO is available at http://wwwmgs.bionet.nsc.ru/systems/BDNAVideo/ and the mirror site athttp://www.cbil.upenn.edu/mgs/systems/consfreq/ .Contact: [email protected]
Introduction
Transcription is controlled by a set of functional DNA sitesrealizing specific functions through interaction with therelevant proteins: transcription factors (Latchman, 1995). Theexperimental data on DNA sequences and functions ofthousands of transcription factor binding sites are currentlyaccumulated within various databases. The best-knowndatabases in this intensively developed area are EMBL DataLibrary (Stoesser et al., 1998), TRANSFAC (Heinemeyeret al., 1999), TRRD (Kolchanov et al., 1999), EpoDB(Stoeckert et al., 1999), EPD (Perier et al., 1999) andRegulonDB (Salgado et al., 1999). All of them are initialsources of information for developing the methods fortranscription factor binding site recognition.
Since the probabilistic information content was first appliedto recognizing the functional DNA sites (Schneider et al.,1986), and then Berg and von Hippel (1987) developed thestatistical-mechanical theory on the proteins binding DNAsites, the weight matrix-based approach remains dominant upto now. Hundreds of the weight matrix variants fortranscription factor binding site recognition have beencalculated and successfully applied. For example, thecommonly accepted MatInspector (Quandt et al., 1995) iscurrently manipulating over 200 weight matrices of this type.Among the recently developed tools for transcription factorbinding site recognition, Object-Oriented TranscriptionFactors Database OOTFD (Ghosh, 1998), Matrix Search(Chen et al., 1995), TESS (Stoeckert et al., 1999), theTRANSFAC-based expert system (Heinemeyer et al., 1999),DPInteract (Robison et al., 1998) and RegulonDB (Salgadoet al., 1999) are widely used. Nevertheless, recent evaluationof computer tools for transcription factor binding siterecognition within genomic DNA (Roulet et al., 1998)indicated that the current site recognition tools are typically
��� �8 � 9:5 �---
��( � +84;++5
654 � Oxford University Press 1999
BIOINFORMATICS

Properties of functional DNA sites
655
better correlated with each other rather than withDNA–protein affinity magnitudes. It follows that the problemof developing the methods for transcription factor binding siterecognition in DNA sequences coming from probabilistic andstatistical mechanics backgrounds based on the site evolutionorigin paradigm should deal with molecular mechanisms ofDNA–protein interaction too.
That is why we believe that the sequence-dependent,conformational and physicochemical properties of B-helicalDNA may be complementary to the probabilistic propertiespredominantly considered up to now. Essentially, theincreasing volume of experimental data supports the evidencethat transcription factor binding site functioning is to a largeextent determined by conformational features of DNA (Starret al., 1995; Meierhans et al., 1997).
Dickerson and Drew (1981) were the first to focus forsequence–conformation relationships in DNA and to obtainthe X-ray structures of dodecamers. These structures laidgrounds for Calladine’s rules for predicting the conformationof B-DNA on the basis of DNA sequence (Calladine andDrew, 1984). A growing number of crystallographic andphysicochemical studies during the last decade propose thelocal non-similarity of conformational and physicochemicalDNA properties, and their dependence on nucleotide context(Grzeskowiak, 1996; Frank et al., 1997; Suzuki et al., 1997).What are the relationships between sequence-dependent,conformational, physicochemical DNA properties andspecificity of site recognition?
Numerous experimental studies of B-DNA helix enable thedetermination of a considerable number of mean values ofconformational and physicochemical parameters of di- andtrinucleotides (Gotoh and Tagashira, 1981; Satchwell et al.,1986; Gartenberg and Crothers, 1988; Bolshoy et al., 1991;Sugimoto et al., 1996; Suzuki et al., 1996; Gorin et al., 1995).The methods based on dependence of DNA conformationalfeatures upon the local nucleotide context are applied both foranalysis of transcription factor binding sites (Karas et al.,1996) and extended promoter regions (Baldi et al., 1998).
It has been previously shown that conformational DNAfeatures may be significant for site functioning (Ponomarenkoet al., 1996, 1997a,b). A computer system ACTIVITY hasbeen developed for analysis of functional site activity(Ponomarenko et al., 1997c), demonstrating the application ofconformational and physicochemical parameters of B-DNAdinucleotides for site activity prediction based on the sequencecontent (Kolchanov et al., 1998).
Pursuing these studies, we suggest here an approach forrevealing significant conformational and physicochemicalfeatures of functional sites implemented in the activateddatabase B-DNA-VIDEO. Since a number of modulesdeveloped earlier for SITEVIDEO (Kel et al., 1993) andACTIVITY systems (Ponomarenko et al., 1997b) are alsoused in B-DNA-VIDEO, they are described briefly. All the
Fig. 1. The basic scheme of B-DNA-VIDEO. Box, database or tools;arrow, input/output data pathway; solid lines, ‘on-line’ mode(Web-available); broken lines, ‘off-line’ mode (encapsulated).
new modules of the system B-DNA-VIDEO are given indetail. We have applied B-DNA-VIDEO to study the sets ofvarious transcription factor binding sites and demonstratedthat the binding sites of all transcription factors analysed arecharacterized by a specific set of significant conformationaland physicochemical DNA features. In addition, we havedemonstrated how to apply these features to transcriptionfactor binding site recognition.
System and methods
The basic scheme of the system B-DNA-VIDEO is presentedin Figure 1. This system is of ‘distributed’ type because itconsists of the database server, URL = <http://sgi.sscc.ru/>,and the active application server, URL = <http://wwwmgs.bionet.nsc.ru/>.
The active application WWW server is IIS3.0. TheB-DNA-VIDEO applications have been implemented in theC language of the ANSI standard, and successfully compiledon the Intel PC platform using the Borland C compiler,Version 4.5, under Windows95.
The database server is NCSA/1.5. The B-DNA-VIDEOdatabases have been implemented by using the SequenceRetrieval System (SRS) Version 5.1 having the internal versionof the programming language ICARUS. These databases havebeen successfully compiled on the POWER CHALLENGE Mplatform (Silicon Graphics), under INIX64 Version 6.1.

J.V.Ponomarenko et al.
656
The major blocks of the B-DNA-VIDEO database part areas follows: the SRS-based user interface; the databaseSAMPLES on functional site sequences; the databasePROPERTY on sequence-dependent conformational andphysicochemical B-DNA parameters; the knowledge baseB-DNA-FEATURES on significant B-DNA features of thesites. Each B-DNA-FEATURES entry contains bothC-programs recognizing the sites within an arbitrary DNAsequence and the hyperlinks to the program executablesaddressed to the sequence input. For this reason,B-DNA-VIDEO is simultaneously the database system of‘searching for static data’ type and, herewith, theWWW-based applet package of ‘active computational’ type.That is why we have called this mixed ‘data/applet’ base an‘activated’ database. Indeed, this is the novelty. The activateddatabase is available on the WWW (Figure 1; solid-linedboxes and arrows).
As is shown in Figure 1 by broken lines, theB-DNA-VIDEO system also contains the knowledgediscovery module responsible for detecting significantconformational and physicochemical features of B-DNAfunctional sites and generation of C-codes for recognitionprograms. Thus, information extracted from two databases,SAMPLES and PROPERTY, serves as the inputs fitted intothe module, whereas the resulting outputs are stored within theB-DNA-FEATURES database. The knowledge discoverymodule is not WWW accessible because it takes ∼ 24 h toprocess an input data set.
SAMPLES, database on functional sites
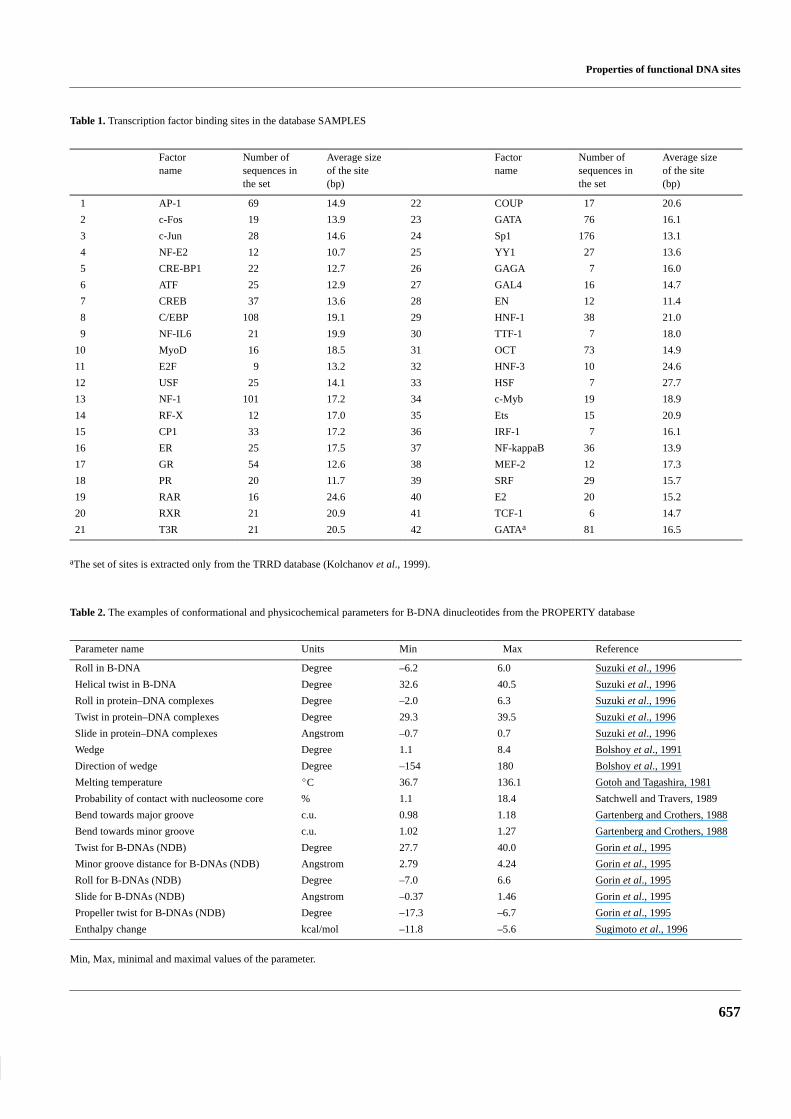
Nucleotide sequences of transcription factor binding sites areextracted from the EMBL database (Stoesser et al., 1998),their locations are taken from TRANSFAC (Version 3.2)(Wingender et al., 1997) and TRRD databases (Kolchanovet al., 1999). Only the sites with the experimentallydetermined locations within nucleotide sequences wereconsidered. The sequences of each site set were alignedrelative to the centre of the footprint or the centre of thesequences satisfying consensus experimentally confirmed bythe gel shift analysis, so that the total length of the sequenceequals 120 bp. The homologous sequences were excluded.The database of functional sites contains 42 sets of varioustranscription factor binding sites (Table 1), described inEMBL-like format compatible with the SRS language forautomated query retrieval (Etzold and Argos, 1993). A unitentry in the database is represented by an individual set. Anexample of transcription factor binding site description fromthe SAMPLES database is shown in Figure 2.
PROPERTY, database on conformational andphysicochemical B-DNA properties
Rapidly growing information on context-dependent con-
Fig. 2. An entry of the SAMPLES database by the example of HNF1transcription factor binding sites.
formational and physicochemical DNA properties needs itsaccumulation in a specialized database, systematization andanalysis. For this purpose, we have accumulated the valuesof conformational and physicochemical B-DNA propertiesin a PROPERTY database (Table 2). An example of thePROPERTY database entry is illustrated in Figure 3. Let usconsider several data fields of this entry. Each PROPERTYentry describes the only B-DNA property, either ‘conforma-tional’ or ‘physicochemical’. This property is entitled by thefield PN; its quantitative value assigned to each dsDNAdinucleotide step can be found in the field DINUCLEO-TIDE; the field PU contains the property unit. The field RNlinks to the database REFERENCE citing the literaturesources, from which the property values were taken. Amarked dependence of conformational and physicochemicalDNA parameters on the local nucleotide context suggests thepotential importance of these parameters for the functioningof DNA sites. To demonstrate the importance of B-DNAproperties, each PROPERTY entry contains the field WW ofthe ‘GALLERY’ type linking to the Web page with the prop-erty histograms comparing random DNA and transcriptionfactor binding site sequences.
Properties of functional DNA sites
657
Table 1. Transcription factor binding sites in the database SAMPLES
Factorname
Number ofsequences inthe set
Average sizeof the site(bp)
Factorname
Number ofsequences inthe set
Average sizeof the site(bp)
1 AP-1 69 14.9 22 COUP 17 20.6
2 c-Fos 19 13.9 23 GATA 76 16.1
3 c-Jun 28 14.6 24 Sp1 176 13.1
4 NF-E2 12 10.7 25 YY1 27 13.6
5 CRE-BP1 22 12.7 26 GAGA 7 16.0
6 ATF 25 12.9 27 GAL4 16 14.7
7 CREB 37 13.6 28 EN 12 11.4
8 C/EBP 108 19.1 29 HNF-1 38 21.0
9 NF-IL6 21 19.9 30 TTF-1 7 18.0
10 MyoD 16 18.5 31 OCT 73 14.9
11 E2F 9 13.2 32 HNF-3 10 24.6
12 USF 25 14.1 33 HSF 7 27.7
13 NF-1 101 17.2 34 c-Myb 19 18.9
14 RF-X 12 17.0 35 Ets 15 20.9
15 CP1 33 17.2 36 IRF-1 7 16.1
16 ER 25 17.5 37 NF-kappaB 36 13.9
17 GR 54 12.6 38 MEF-2 12 17.3
18 PR 20 11.7 39 SRF 29 15.7
19 RAR 16 24.6 40 E2 20 15.2
20 RXR 21 20.9 41 TCF-1 6 14.7
21 T3R 21 20.5 42 GATAa 81 16.5
aThe set of sites is extracted only from the TRRD database (Kolchanov et al., 1999).
Table 2. The examples of conformational and physicochemical parameters for B-DNA dinucleotides from the PROPERTY database
Parameter name Units Min Max Reference
Roll in B-DNA Degree –6.2 6.0 Suzuki et al., 1996
Helical twist in B-DNA Degree 32.6 40.5 Suzuki et al., 1996
Roll in protein–DNA complexes Degree –2.0 6.3 Suzuki et al., 1996
Twist in protein–DNA complexes Degree 29.3 39.5 Suzuki et al., 1996
Slide in protein–DNA complexes Angstrom –0.7 0.7 Suzuki et al., 1996
Wedge Degree 1.1 8.4 Bolshoy et al., 1991
Direction of wedge Degree –154 180 Bolshoy et al., 1991
Melting temperature �C 36.7 136.1 Gotoh and Tagashira, 1981
Probability of contact with nucleosome core % 1.1 18.4 Satchwell and Travers, 1989
Bend towards major groove c.u. 0.98 1.18 Gartenberg and Crothers, 1988
Bend towards minor groove c.u. 1.02 1.27 Gartenberg and Crothers, 1988
Twist for B-DNAs (NDB) Degree 27.7 40.0 Gorin et al., 1995
Minor groove distance for B-DNAs (NDB) Angstrom 2.79 4.24 Gorin et al., 1995
Roll for B-DNAs (NDB) Degree –7.0 6.6 Gorin et al., 1995
Slide for B-DNAs (NDB) Angstrom –0.37 1.46 Gorin et al., 1995
Propeller twist for B-DNAs (NDB) Degree –17.3 –6.7 Gorin et al., 1995
Enthalpy change kcal/mol –11.8 –5.6 Sugimoto et al., 1996
Min, Max, minimal and maximal values of the parameter.

J.V.Ponomarenko et al.
658
Fig. 3. An entry of the PROPERTY database by the example of‘Melting temperature’ parameter (Gotoh and Tagashira, 1981).
Analysis of conformational and physicochemicalproperties mean values
The algorithms used are similar to those developed previous-ly for analysis of DNA/RNA functional sites’ contextual fea-tures (Kel et al., 1993; Ponomarenko et al., 1997c).
Let us consider a nucleotide sequence S = {s1 … si … sL},of length L, containing dinucleotide sisi + 1 at the ith position.The mean value Xk of the kth parameter averaged over theregion [a; b] (1 ≤ a ≤ b ≤ L) of sequence S is calculated asfollows:
Xk,a,b(S) � 1b–a�b–1
i�a
Xk(SiSi�1) (1)
Applying equation (1) to the site sequence set {S} at fixedk, a and b yields the distribution Xk,a,b{S} for the sitesequences. Similarly, the distribution, Xk,a,b{R} is generatedfor random sequences {R} with the same nucleotidefrequencies as in the real sequences. The difference betweenthese distributions Xk,a,b{S} and Xk,a,b{R} is tested forsignificance using four statistical criteria (Lehman, 1959): (1)the difference between the means of Xk,a,b{S} and Xk,a,b{R};(2) the difference between the variances of Xk,a,b{S} andXk,a,b{R}; (3) the difference between the densities ofXk,a,b{S} and Xk,a,b{R}; (4) the difference between the rangesof Xk,a,b{S} and Xk,a,b{R}. As the criteria used imply that thetested distributions were Gaussian, two additional criteriawere used to confirm it: (5) for Xk,a,b{S} and (6) forXk,a,b{R}. To reduce the adverse effects of heterogeneity,
these criteria were tested on 100 subsets {Sn} and {Rn} (1 ≤n ≤ 100), each randomly retrieved from {S} and {R},respectively. In terms of fuzzy logic (Zadeh, 1965), if thedifference between the distributions Xk,a,b{Sn} andXk,a,b{Rn} is significant according to the mth criterion(1 ≤ m ≤ 6), then a positive between 0 and 1 is assigned to thepartial utility Umn(Xk,a,b); otherwise, a negative between –1and 0. Hence, the total number of partial utilities is6 × 100 = 600 {Umn(Xk,a,b)}. In terms of decision-makingtheory (Fishburn, 1970), the generalized difference betweenXk,a,b{S} and Xk,a,b{R} is the mean of the 600 partial utilities:
U(Xk,a,b) �
�6
m�1
�100
n�1
Umn(Xk,a,b)
600(2)
Thus, the calculated utility value U(Xk,a,b) is the integralcharacteristic of the discriminating ability of Xk,a,b. It hastwo important features (Fishburn, 1970):
U(Xk ,a ,b) < 0 implies that ‘Xk ,a ,b falls short of significance’;(3)
U(Xk ,a ,b) > U(Xq ,c ,d) ≥ 0 implies that ‘Xk ,a ,b is better discriminating between Site and no_Site Sequences than Xq ,c ,d’
(4)
Note that the highest value of U(Xk,a,b) pinpoints the best,in terms of utility, B-DNA feature Xk,a,b of the site. Eachconformational feature Xk,a,b with U(Xk,a,b) < 0 is discardedby decision (3). If any two features Xk,a,b and Xq,c,d correlate,the feature Xq,c,d with the lowest value of U(Xq,c,d) isdiscarded by decision (4).
The knowledge base B-DNA-FEATURES
The significant results obtained through the above procedureare stored in the knowledge base of functional sitesB-DNA-FEATURES. An entry of this database isexemplified by description of transcription factor HNF1binding site (Figure 4). The name of the site (HNF1) is givenin the field NM. The field DR indicates the link to theSAMPLES database, containing the sequences of the site(Figure 2). The field PV contains the name of the B-DNAproperty studied (‘Melting temperature’); the field DP links tothe B-DNA parameter database, where this property isdescribed and the values are given (Figure 3). In our example,the HNF1 binding sites on the region [–21; 4] relative to thecentre of the site differ significantly from the randomsequences by the mean values of ‘Melting temperature’.Utility of this feature is U = 0.867 (UT field). The averagedvalue of the parameter ‘Melting temperature’ over the region[–21; 4] is 70.68 ± 3.84�C for the control 50% subsets of thesite sequences randomly selected (ST field) and 73.55 ±4.61�C for the random sequences (NT field). The significanceof the difference between the site and random sequences

Properties of functional DNA sites
659
Fig. 4. An entry of the B-DNA-FEATURES database.
estimated by the χ2 criterion, comparing the empiricaldistribution (Site) with the theoretical one (Random), is α <0.005, as illustrated in Figure 5a by the ‘Site/Random’difference histogram. Each entry has the field WW of the
‘GALLERY’ type linking to the ‘Site/Random’ differencehistograms.
J.V.Ponomarenko et al.
660
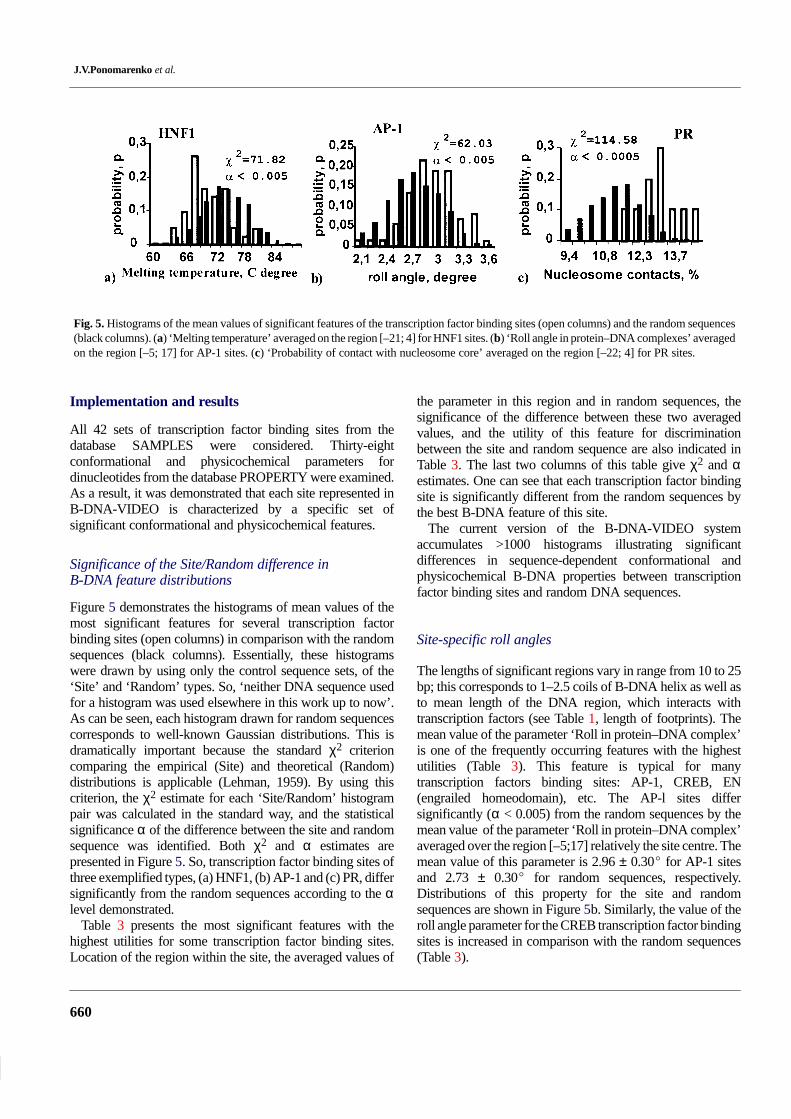
Fig. 5. Histograms of the mean values of significant features of the transcription factor binding sites (open columns) and the random sequences(black columns). (a) ‘Melting temperature’ averaged on the region [–21; 4] for HNF1 sites. (b) ‘Roll angle in protein–DNA complexes’ averagedon the region [–5; 17] for AP-1 sites. (c) ‘Probability of contact with nucleosome core’ averaged on the region [–22; 4] for PR sites.
Implementation and results
All 42 sets of transcription factor binding sites from thedatabase SAMPLES were considered. Thirty-eightconformational and physicochemical parameters fordinucleotides from the database PROPERTY were examined.As a result, it was demonstrated that each site represented inB-DNA-VIDEO is characterized by a specific set ofsignificant conformational and physicochemical features.
Significance of the Site/Random difference inB-DNA feature distributions
Figure 5 demonstrates the histograms of mean values of themost significant features for several transcription factorbinding sites (open columns) in comparison with the randomsequences (black columns). Essentially, these histogramswere drawn by using only the control sequence sets, of the‘Site’ and ‘Random’ types. So, ‘neither DNA sequence usedfor a histogram was used elsewhere in this work up to now’.As can be seen, each histogram drawn for random sequencescorresponds to well-known Gaussian distributions. This isdramatically important because the standard χ2 criterioncomparing the empirical (Site) and theoretical (Random)distributions is applicable (Lehman, 1959). By using thiscriterion, the χ2 estimate for each ‘Site/Random’ histogrampair was calculated in the standard way, and the statisticalsignificance α of the difference between the site and randomsequence was identified. Both χ2 and α estimates arepresented in Figure 5. So, transcription factor binding sites ofthree exemplified types, (a) HNF1, (b) AP-1 and (c) PR, differsignificantly from the random sequences according to the αlevel demonstrated.
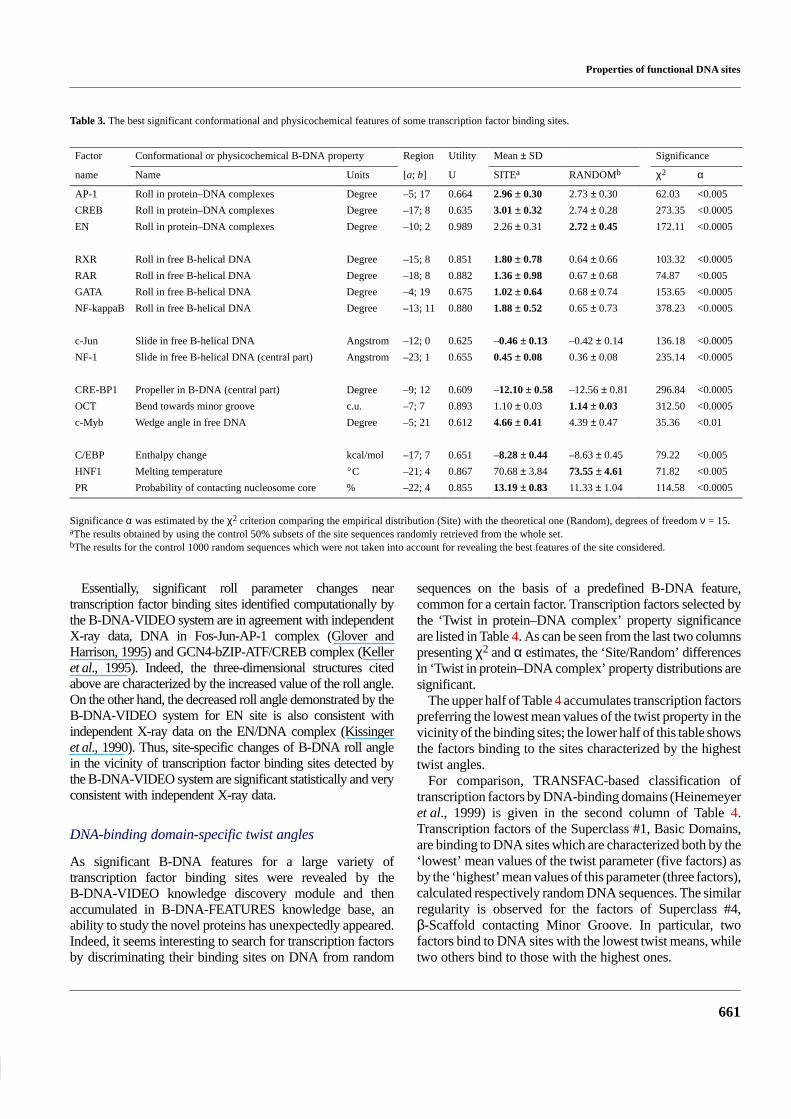
Table 3 presents the most significant features with thehighest utilities for some transcription factor binding sites.Location of the region within the site, the averaged values of
the parameter in this region and in random sequences, thesignificance of the difference between these two averagedvalues, and the utility of this feature for discriminationbetween the site and random sequence are also indicated inTable 3. The last two columns of this table give χ2 and αestimates. One can see that each transcription factor bindingsite is significantly different from the random sequences bythe best B-DNA feature of this site.
The current version of the B-DNA-VIDEO systemaccumulates >1000 histograms illustrating significantdifferences in sequence-dependent conformational andphysicochemical B-DNA properties between transcriptionfactor binding sites and random DNA sequences.
Site-specific roll angles
The lengths of significant regions vary in range from 10 to 25bp; this corresponds to 1–2.5 coils of B-DNA helix as well asto mean length of the DNA region, which interacts withtranscription factors (see Table 1, length of footprints). Themean value of the parameter ‘Roll in protein–DNA complex’is one of the frequently occurring features with the highestutilities (Table 3). This feature is typical for manytranscription factors binding sites: AP-1, CREB, EN(engrailed homeodomain), etc. The AP-l sites differsignificantly (α < 0.005) from the random sequences by themean value of the parameter ‘Roll in protein–DNA complex’averaged over the region [–5;17] relatively the site centre. Themean value of this parameter is 2.96 ± 0.30� for AP-1 sitesand 2.73 ± 0.30� for random sequences, respectively.Distributions of this property for the site and randomsequences are shown in Figure 5b. Similarly, the value of theroll angle parameter for the CREB transcription factor bindingsites is increased in comparison with the random sequences(Table 3).
Properties of functional DNA sites
661
Table 3. The best significant conformational and physicochemical features of some transcription factor binding sites.
Factor Conformational or physicochemical B-DNA property Region Utility Mean ± SD Significance
name Name Units [a; b] U SITEa RANDOMb χ2 α
AP-1 Roll in protein–DNA complexes Degree –5; 17 0.664 2.96 ± 0.30 2.73 ± 0.30 62.03 <0.005
CREB Roll in protein–DNA complexes Degree –17; 8 0.635 3.01 ± 0.32 2.74 ± 0.28 273.35 <0.0005
EN Roll in protein–DNA complexes Degree –10; 2 0.989 2.26 ± 0.31 2.72 ± 0.45 172.11 <0.0005
RXR Roll in free B-helical DNA Degree –15; 8 0.851 1.80 ± 0.78 0.64 ± 0.66 103.32 <0.0005
RAR Roll in free B-helical DNA Degree –18; 8 0.882 1.36 ± 0.98 0.67 ± 0.68 74.87 <0.005
GATA Roll in free B-helical DNA Degree –4; 19 0.675 1.02 ± 0.64 0.68 ± 0.74 153.65 <0.0005
NF-kappaB Roll in free B-helical DNA Degree –13; 11 0.880 1.88 ± 0.52 0.65 ± 0.73 378.23 <0.0005
c-Jun Slide in free B-helical DNA Angstrom –12; 0 0.625 –0.46 ± 0.13 –0.42 ± 0.14 136.18 <0.0005
NF-1 Slide in free B-helical DNA (central part) Angstrom –23; 1 0.655 0.45 ± 0.08 0.36 ± 0.08 235.14 <0.0005
CRE-BP1 Propeller in B-DNA (central part) Degree –9; 12 0.609 –12.10 ± 0.58 –12.56 ± 0.81 296.84 <0.0005
OCT Bend towards minor groove c.u. –7; 7 0.893 1.10 ± 0.03 1.14 ± 0.03 312.50 <0.0005
c-Myb Wedge angle in free DNA Degree –5; 21 0.612 4.66 ± 0.41 4.39 ± 0.47 35.36 <0.01
C/EBP Enthalpy change kcal/mol –17; 7 0.651 –8.28 ± 0.44 –8.63 ± 0.45 79.22 <0.005
HNF1 Melting temperature �C –21; 4 0.867 70.68 ± 3.84 73.55 ± 4.61 71.82 <0.005
PR Probability of contacting nucleosome core % –22; 4 0.855 13.19 ± 0.83 11.33 ± 1.04 114.58 <0.0005
Significance α was estimated by the χ2 criterion comparing the empirical distribution (Site) with the theoretical one (Random), degrees of freedom ν = 15.aThe results obtained by using the control 50% subsets of the site sequences randomly retrieved from the whole set.bThe results for the control 1000 random sequences which were not taken into account for revealing the best features of the site considered.
Essentially, significant roll parameter changes neartranscription factor binding sites identified computationally bythe B-DNA-VIDEO system are in agreement with independentX-ray data, DNA in Fos-Jun-AP-1 complex (Glover andHarrison, 1995) and GCN4-bZIP-ATF/CREB complex (Kelleret al., 1995). Indeed, the three-dimensional structures citedabove are characterized by the increased value of the roll angle.On the other hand, the decreased roll angle demonstrated by theB-DNA-VIDEO system for EN site is also consistent withindependent X-ray data on the EN/DNA complex (Kissingeret al., 1990). Thus, site-specific changes of B-DNA roll anglein the vicinity of transcription factor binding sites detected bythe B-DNA-VIDEO system are significant statistically and veryconsistent with independent X-ray data.
DNA-binding domain-specific twist angles
As significant B-DNA features for a large variety oftranscription factor binding sites were revealed by theB-DNA-VIDEO knowledge discovery module and thenaccumulated in B-DNA-FEATURES knowledge base, anability to study the novel proteins has unexpectedly appeared.Indeed, it seems interesting to search for transcription factorsby discriminating their binding sites on DNA from random
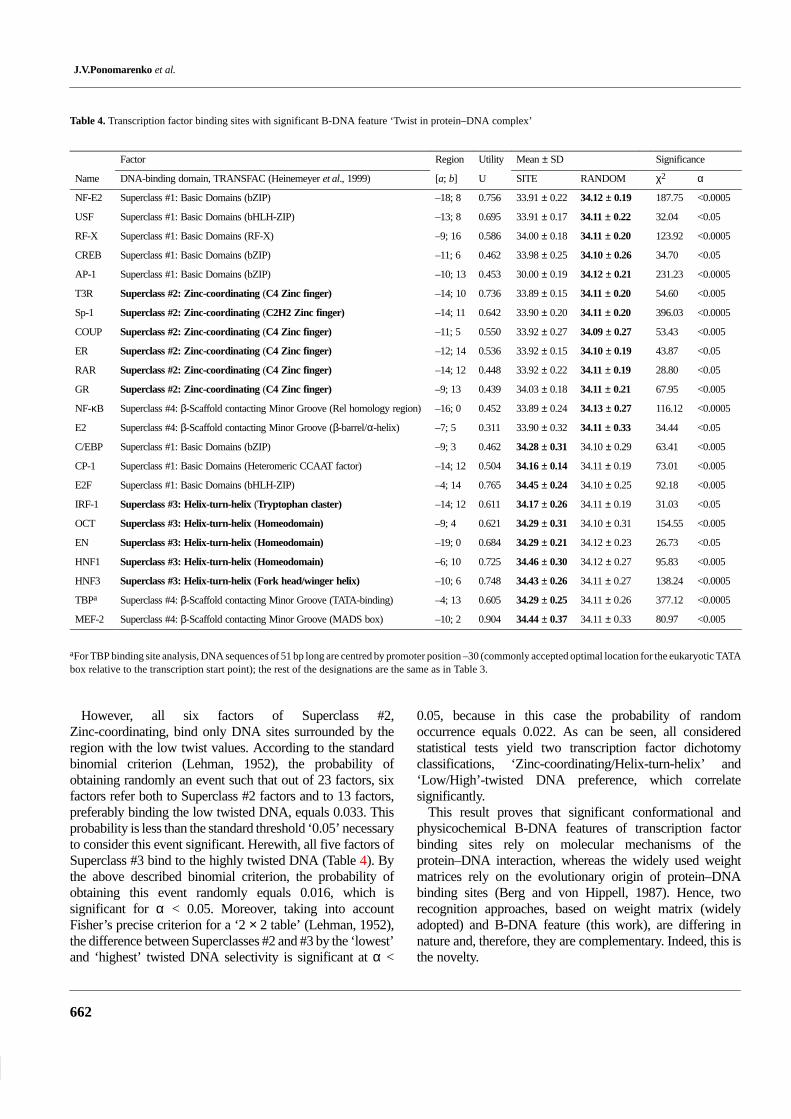
sequences on the basis of a predefined B-DNA feature,common for a certain factor. Transcription factors selected bythe ‘Twist in protein–DNA complex’ property significanceare listed in Table 4. As can be seen from the last two columnspresenting χ2 and α estimates, the ‘Site/Random’ differencesin ‘Twist in protein–DNA complex’ property distributions aresignificant.
The upper half of Table 4 accumulates transcription factorspreferring the lowest mean values of the twist property in thevicinity of the binding sites; the lower half of this table showsthe factors binding to the sites characterized by the highesttwist angles.
For comparison, TRANSFAC-based classification oftranscription factors by DNA-binding domains (Heinemeyeret al., 1999) is given in the second column of Table 4.Transcription factors of the Superclass #1, Basic Domains,are binding to DNA sites which are characterized both by the‘lowest’ mean values of the twist parameter (five factors) asby the ‘highest’ mean values of this parameter (three factors),calculated respectively random DNA sequences. The similarregularity is observed for the factors of Superclass #4,β-Scaffold contacting Minor Groove. In particular, twofactors bind to DNA sites with the lowest twist means, whiletwo others bind to those with the highest ones.
J.V.Ponomarenko et al.
662
Table 4. Transcription factor binding sites with significant B-DNA feature ‘Twist in protein–DNA complex’
Factor Region Utility Mean ± SD Significance
Name DNA-binding domain, TRANSFAC (Heinemeyer et al., 1999) [a; b] U SITE RANDOM χ2 α
NF-E2 Superclass #1: Basic Domains (bZIP) –18; 8 0.756 33.91 ± 0.22 34.12 ± 0.19 187.75 <0.0005
USF Superclass #1: Basic Domains (bHLH-ZIP) –13; 8 0.695 33.91 ± 0.17 34.11 ± 0.22 32.04 <0.05
RF-X Superclass #1: Basic Domains (RF-X) –9; 16 0.586 34.00 ± 0.18 34.11 ± 0.20 123.92 <0.0005
CREB Superclass #1: Basic Domains (bZIP) –11; 6 0.462 33.98 ± 0.25 34.10 ± 0.26 34.70 <0.05
AP-1 Superclass #1: Basic Domains (bZIP) –10; 13 0.453 30.00 ± 0.19 34.12 ± 0.21 231.23 <0.0005
T3R Superclass #2: Zinc-coordinating (C4 Zinc finger) –14; 10 0.736 33.89 ± 0.15 34.11 ± 0.20 54.60 <0.005
Sp-1 Superclass #2: Zinc-coordinating (C2H2 Zinc finger) –14; 11 0.642 33.90 ± 0.20 34.11 ± 0.20 396.03 <0.0005
COUP Superclass #2: Zinc-coordinating (C4 Zinc finger) –11; 5 0.550 33.92 ± 0.27 34.09 ± 0.27 53.43 <0.005
ER Superclass #2: Zinc-coordinating (C4 Zinc finger) –12; 14 0.536 33.92 ± 0.15 34.10 ± 0.19 43.87 <0.05
RAR Superclass #2: Zinc-coordinating (C4 Zinc finger) –14; 12 0.448 33.92 ± 0.22 34.11 ± 0.19 28.80 <0.05
GR Superclass #2: Zinc-coordinating (C4 Zinc finger) –9; 13 0.439 34.03 ± 0.18 34.11 ± 0.21 67.95 <0.005
NF-κB Superclass #4: β-Scaffold contacting Minor Groove (Rel homology region) –16; 0 0.452 33.89 ± 0.24 34.13 ± 0.27 116.12 <0.0005
E2 Superclass #4: β-Scaffold contacting Minor Groove (β-barrel/α-helix) –7; 5 0.311 33.90 ± 0.32 34.11 ± 0.33 34.44 <0.05
C/EBP Superclass #1: Basic Domains (bZIP) –9; 3 0.462 34.28 ± 0.31 34.10 ± 0.29 63.41 <0.005
CP-1 Superclass #1: Basic Domains (Heteromeric CCAAT factor) –14; 12 0.504 34.16 ± 0.14 34.11 ± 0.19 73.01 <0.005
E2F Superclass #1: Basic Domains (bHLH-ZIP) –4; 14 0.765 34.45 ± 0.24 34.10 ± 0.25 92.18 <0.005
IRF-1 Superclass #3: Helix-turn-helix (Tryptophan claster) –14; 12 0.611 34.17 ± 0.26 34.11 ± 0.19 31.03 <0.05
OCT Superclass #3: Helix-turn-helix (Homeodomain) –9; 4 0.621 34.29 ± 0.31 34.10 ± 0.31 154.55 <0.005
EN Superclass #3: Helix-turn-helix (Homeodomain) –19; 0 0.684 34.29 ± 0.21 34.12 ± 0.23 26.73 <0.05
HNF1 Superclass #3: Helix-turn-helix (Homeodomain) –6; 10 0.725 34.46 ± 0.30 34.12 ± 0.27 95.83 <0.005
HNF3 Superclass #3: Helix-turn-helix (Fork head/winger helix) –10; 6 0.748 34.43 ± 0.26 34.11 ± 0.27 138.24 <0.0005
TBPa Superclass #4: β-Scaffold contacting Minor Groove (TATA-binding) –4; 13 0.605 34.29 ± 0.25 34.11 ± 0.26 377.12 <0.0005
MEF-2 Superclass #4: β-Scaffold contacting Minor Groove (MADS box) –10; 2 0.904 34.44 ± 0.37 34.11 ± 0.33 80.97 <0.005
aFor TBP binding site analysis, DNA sequences of 51 bp long are centred by promoter position –30 (commonly accepted optimal location for the eukaryotic TATAbox relative to the transcription start point); the rest of the designations are the same as in Table 3.
However, all six factors of Superclass #2,Zinc-coordinating, bind only DNA sites surrounded by theregion with the low twist values. According to the standardbinomial criterion (Lehman, 1952), the probability ofobtaining randomly an event such that out of 23 factors, sixfactors refer both to Superclass #2 factors and to 13 factors,preferably binding the low twisted DNA, equals 0.033. Thisprobability is less than the standard threshold ‘0.05’ necessaryto consider this event significant. Herewith, all five factors ofSuperclass #3 bind to the highly twisted DNA (Table 4). Bythe above described binomial criterion, the probability ofobtaining this event randomly equals 0.016, which issignificant for α < 0.05. Moreover, taking into accountFisher’s precise criterion for a ‘2 × 2 table’ (Lehman, 1952),the difference between Superclasses #2 and #3 by the ‘lowest’and ‘highest’ twisted DNA selectivity is significant at α <
0.05, because in this case the probability of randomoccurrence equals 0.022. As can be seen, all consideredstatistical tests yield two transcription factor dichotomyclassifications, ‘Zinc-coordinating/Helix-turn-helix’ and‘Low/High’-twisted DNA preference, which correlatesignificantly.
This result proves that significant conformational andphysicochemical B-DNA features of transcription factorbinding sites rely on molecular mechanisms of theprotein–DNA interaction, whereas the widely used weightmatrices rely on the evolutionary origin of protein–DNAbinding sites (Berg and von Hippell, 1987). Hence, tworecognition approaches, based on weight matrix (widelyadopted) and B-DNA feature (this work), are differing innature and, therefore, they are complementary. Indeed, this isthe novelty.

Properties of functional DNA sites
663
Fig. 6. Histograms of significant B-DNA features for eukaryotic TATA box (open columns) and the random sequences (black columns). (a)‘Mobility bend towards Minor groove’ averaged on the region [–8; 6] relative to the TATA box start. (b) ‘Bend angle’ averaged on the region[–8; 4]. (c) ‘Tip angle’ averaged on the region [–10; 7]. (d) ‘Melting temperature’ averaged on the region [–10; 6].
TATA box-specific conformational andphysicochemical B-DNA features
For eukaryotic TATA box analysis, the promoter DNAsequences were retrieved from the EPD database (Perier et al.,1999). Afterwards, these sequences were centred by themaxima of the TATA box weight matrix Score (Bucher, 1990)obtained between positions –40 and –20 relative to thetranscription start. Next, the sequence positions wererenumbered so that position of the TATA box centre with themaximal Score was denoted as ‘position 0’. From these centredand repositioned sequences, 51-bp-long fragments betweenpositions –25 and +25 were considered. This data set of 100%size was randomly divided into 50% training and 50% controlsubsets. The 50% training subset was analysed byB-DNA-VIDEO knowledge discovery module and, finally,identified conformational and physicochemical features weretested for significance on the 50% control subset.
The results obtained are demonstrated in Figure 6. TheB-DNA feature ‘Mobility to bend towards Minor groove’averaged between positions –8 and +6 (Figure 6a; U = 0.924)was found to be the best for the TATA box. As can be seen, theTATA box is characterized by the lower values of this featurethan random DNA sequences. This result is consistent with theX-ray data on TBP/TATA complexes (Juo et al., 1996)identifying that the TBP binds the minor DNA groove andbends to the TATA box towards the major groove.
The bend (U = 0.874) and tip (U = 0.817) angles and, besides,Melting temperature (U = 0.766) properties were identified tobe significant conformational and physicochemical B-DNAfeatures in the vicinity of the TATA box (Figure 6b, c and d).The important role of these properties, high bend angle and lowmelting temperature, confirmed by B-DNA-VIDEO, in thecourse of TBP/TATA box binding is in agreement withmolecular dynamics computational results (Flatters and Lavery,1998). This theoretical comparison between two
J.V.Ponomarenko et al.
664
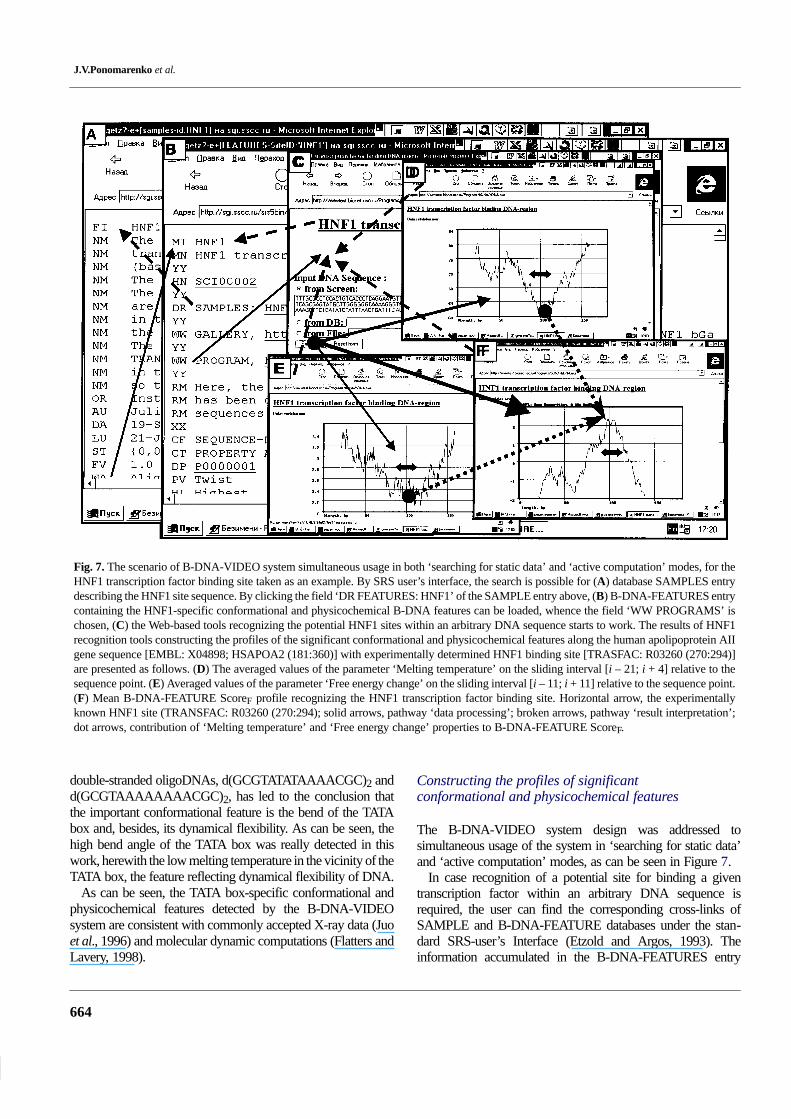
Fig. 7. The scenario of B-DNA-VIDEO system simultaneous usage in both ‘searching for static data’ and ‘active computation’ modes, for theHNF1 transcription factor binding site taken as an example. By SRS user’s interface, the search is possible for (A) database SAMPLES entrydescribing the HNF1 site sequence. By clicking the field ‘DR FEATURES: HNF1’ of the SAMPLE entry above, (B) B-DNA-FEATURES entrycontaining the HNF1-specific conformational and physicochemical B-DNA features can be loaded, whence the field ‘WW PROGRAMS’ ischosen, (C) the Web-based tools recognizing the potential HNF1 sites within an arbitrary DNA sequence starts to work. The results of HNF1recognition tools constructing the profiles of the significant conformational and physicochemical features along the human apolipoprotein AIIgene sequence [EMBL: X04898; HSAPOA2 (181:360)] with experimentally determined HNF1 binding site [TRASFAC: R03260 (270:294)]are presented as follows. (D) The averaged values of the parameter ‘Melting temperature’ on the sliding interval [i – 21; i + 4] relative to thesequence point. (E) Averaged values of the parameter ‘Free energy change’ on the sliding interval [i – 11; i + 11] relative to the sequence point.(F) Mean B-DNA-FEATURE ScoreF profile recognizing the HNF1 transcription factor binding site. Horizontal arrow, the experimentallyknown HNF1 site (TRANSFAC: R03260 (270:294); solid arrows, pathway ‘data processing’; broken arrows, pathway ‘result interpretation’;dot arrows, contribution of ‘Melting temperature’ and ‘Free energy change’ properties to B-DNA-FEATURE ScoreF.
double-stranded oligoDNAs, d(GCGTATATAAAACGC)2 andd(GCGTAAAAAAAACGC)2, has led to the conclusion thatthe important conformational feature is the bend of the TATAbox and, besides, its dynamical flexibility. As can be seen, thehigh bend angle of the TATA box was really detected in thiswork, herewith the low melting temperature in the vicinity of theTATA box, the feature reflecting dynamical flexibility of DNA.
As can be seen, the TATA box-specific conformational andphysicochemical features detected by the B-DNA-VIDEOsystem are consistent with commonly accepted X-ray data (Juoet al., 1996) and molecular dynamic computations (Flatters andLavery, 1998).
Constructing the profiles of significantconformational and physicochemical features
The B-DNA-VIDEO system design was addressed tosimultaneous usage of the system in ‘searching for static data’and ‘active computation’ modes, as can be seen in Figure 7.
In case recognition of a potential site for binding a giventranscription factor within an arbitrary DNA sequence isrequired, the user can find the corresponding cross-links ofSAMPLE and B-DNA-FEATURE databases under the stan-dard SRS-user’s Interface (Etzold and Argos, 1993). Theinformation accumulated in the B-DNA-FEATURES entry

Properties of functional DNA sites
665
may be directly applied for studying DNA sequences entered bya user. As demonstrated in Figure 4, B-DNA-FEATURES entryaddressed to transcription factor binding site recognitioncontains the fields C-CODE with the C-encoded programcalculating significant B-DNA feature values along thesequence given.
The input window of the executable applet presented inFigure 7c can be loaded by clicking the field WW of the‘PROGRAM’, as demonstrated in Figure 7b by a solid arrow.Thus, a user may enter a sequence into this applet through theinput form entitled ‘Input DNA sequence’ with three options:(i) ‘from Screen’, (ii) ‘from DB’ and (iii) ‘from File’. Forexample, the human apolipoprotein AII gene sequence (EMBL:X04898, HSAPOA2; fragment 180:360) with theexperimentally identified HNF1 site documented within thedatabase (Heinemeyer et al., 1999) as ‘TRANSFAC: R03260(270:294)’, was entered by using the ‘from Screen’ option.
The input window contains the list of checkable titles ofconformational and physicochemical B-DNA features that havebeen identified as significant for site recognition by theB-DNA-VIDEO knowledge discovery module. To receive theonly feature profile for a given DNA sequence, the user shouldselect the feature from the list and push the button ‘EXECUTE’,as shown in Figure 7c. As the B-DNA feature significant forHNF1 transcription factor binding site, the lowest ‘Meltingtemperature’ mean value averaged over the interval [–21; 4]relative to a potential site centre is illustrated by the profile givenin Figure 7d. This profile was plotted as follows: the value underthe ith position of the sequence equals the mean meltingtemperature value averaged over the region [i – 21; i + 4]. Onecan see that the sequence from the control example reallypossesses the lowest mean melting temperature just in the regionof the HNF1 binding site. Analogously, significant B-DNAfeature for the HNF1 transcription factor binding site along theexemplified sequence, i.e. the lowest ‘Roll in DNA–proteincomplex’ with the mean value averaged over the region [i – 21;i + 3] relative to the site centre, is illustrated in Figure 7e. As canbe seen, the profile for ‘Roll in protein–DNA complex’ featurereally has the minimum under the HNF1 site location in thesequence considered.
Notably, the list of significant B-DNA features is terminatedby the clickable title ‘Mean B-DNA-Score’ addressed tosimultaneous usage of all B-DNA features for site recognition.The generalized recognition profile is calculated as follows.First, all the property-specific profiles differing in units arelinearly transformed into the common scale denoted by themean values ‘1’ for all known sites and ‘–1’ for randomsequences; second, these re-scaled profiles are averaged into thegeneralized profile. We have called this generalized profile the‘Mean B-DNA-FEATURE ScoreF’. The mean B-DNA-FEATURE ScoreF profile recognizing the HNF1 transcriptionfactor binding site for the sequence from the control example isgiven in Figure 7f. In this figure, two dotted arrows pinpoint that
the maximum of this generalized recognition profile does,indeed, correspond to the known HNF1 site location.
Finally, the broken arrows in Figure 7 show the pathwayinterpreting from both property-specific and generalizedrecognition of the transcription factor binding site that is comingback from the outputted recognition profile to the relevantSAMPLE database entry describing the DNA sequences of thetranscription factor binding site under recognition.
As can be seen, the scenario of the B-DNA-VIDEO systemis simultaneous usage of both’ searching for static data’ and‘active computation’ modes. Indeed, this is the novelty.
Discussions and conclusions
Since the new investigation abilities supported by theB-DNA-VIDEO system were described above, below wewould like to compare the site recognition by the programs in-cluded into B-DNA-FEATURES database and some otherwidely used recognition tools.
Comparison between the B-DNA-FEATURES-basedand weight matrix recognition
The above described Figure 7 illustrates the detailed resultobtained by the B-DNA-VIDEO system recognizingsuccessfully the known HNF1 site, TRANSFAC: R03260(270:294), on a 180-bp-long fragment between positions 181and 360 of DNA sequence from human apolipoprotein AII gene(EMBL: X04898, HSAPOA2). This sequence was not involvedin developing B-DNA-FEATURES recognition tools, so it mayserve as a control. On complete sequence over 3 kbp long,B-DNA-VIDEO successfully recognized the second knownHNF1 site, TRANSFAC: R03253 (603:622), and six‘false-positive’ peaks at positions 130, 525, 700, 2000, 2900 and3200, respectively. Thus, no ‘false negatives’ and six ‘falsepositives’ were detected by B-DNA-VIDEO. This result wascompared to those obtained by the commonly accepted weightmatrix recognition tool MatInspector (Quandt et al., 1995),URL=<http://transfac.gbf.de/cgi-bin/matSearch/matsearch.pl>,with predefined thresholds.
On complete sequence of human apolipoprotein AII gene(EMBL: X04898, HSAPOA2), by MatInspector tools, only thesecond known HNF1 site, TRANSFAC: R03253 (603:622),was recognized, but not the first one, TRANSFAC: R03260(270:294), which is the ‘false-negative’ result. Moreover, one‘false-positive’ HNF1 in position 391 was recognized. At thisposition, the C/EBP site documented in the database TRRD(Kolchanov et al., 1999), accession number #1435, is located.Thus, one ‘false-negative’ and one ‘false-positive’ estimateswere obtained by MatInspector.
One more example of B-DNA-VIDEO system application isshown in Figure 8 by the example of the α-globin gene clustersequence (EMBL: S49899, fragment 1:356). The sequencecontains two experimentally determined AP-1 transcription
J.V.Ponomarenko et al.
666
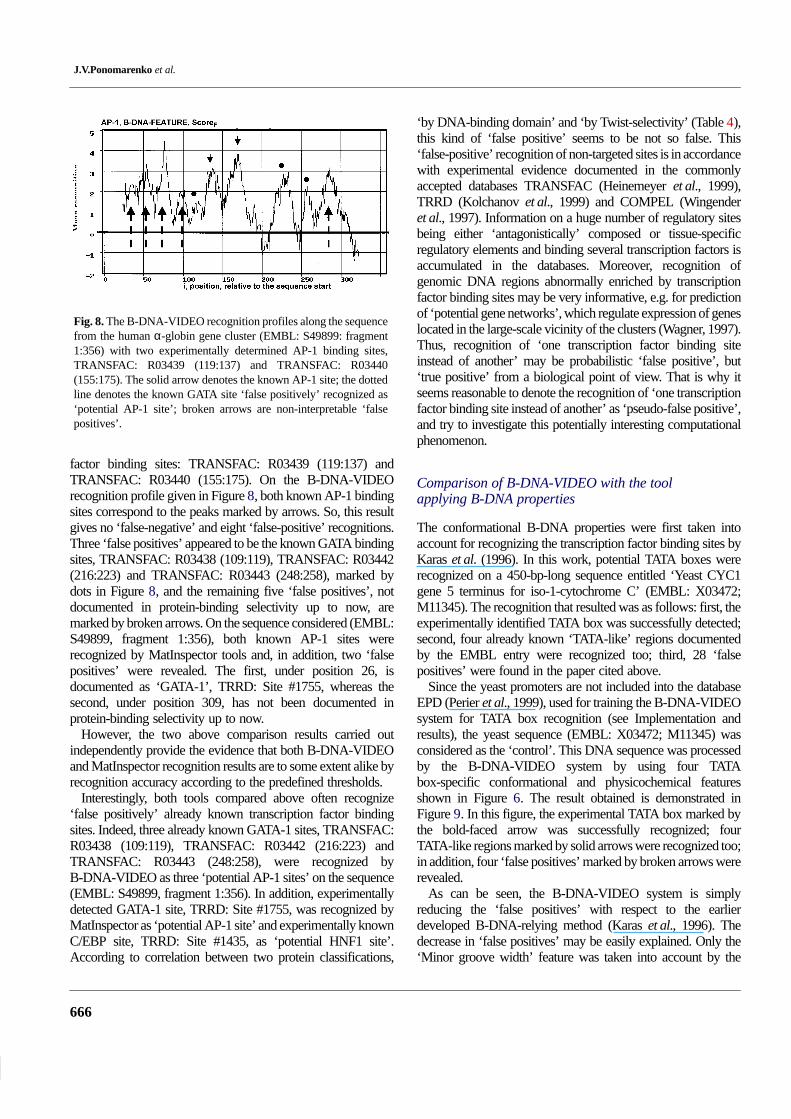
Fig. 8. The B-DNA-VIDEO recognition profiles along the sequencefrom the human α-globin gene cluster (EMBL: S49899: fragment1:356) with two experimentally determined AP-1 binding sites,TRANSFAC: R03439 (119:137) and TRANSFAC: R03440(155:175). The solid arrow denotes the known AP-1 site; the dottedline denotes the known GATA site ‘false positively’ recognized as‘potential AP-1 site’; broken arrows are non-interpretable ‘falsepositives’.
factor binding sites: TRANSFAC: R03439 (119:137) andTRANSFAC: R03440 (155:175). On the B-DNA-VIDEOrecognition profile given in Figure 8, both known AP-1 bindingsites correspond to the peaks marked by arrows. So, this resultgives no ‘false-negative’ and eight ‘false-positive’ recognitions.Three ‘false positives’ appeared to be the known GATA bindingsites, TRANSFAC: R03438 (109:119), TRANSFAC: R03442(216:223) and TRANSFAC: R03443 (248:258), marked bydots in Figure 8, and the remaining five ‘false positives’, notdocumented in protein-binding selectivity up to now, aremarked by broken arrows. On the sequence considered (EMBL:S49899, fragment 1:356), both known AP-1 sites wererecognized by MatInspector tools and, in addition, two ‘falsepositives’ were revealed. The first, under position 26, isdocumented as ‘GATA-1’, TRRD: Site #1755, whereas thesecond, under position 309, has not been documented inprotein-binding selectivity up to now.
However, the two above comparison results carried outindependently provide the evidence that both B-DNA-VIDEOand MatInspector recognition results are to some extent alike byrecognition accuracy according to the predefined thresholds.
Interestingly, both tools compared above often recognize‘false positively’ already known transcription factor bindingsites. Indeed, three already known GATA-1 sites, TRANSFAC:R03438 (109:119), TRANSFAC: R03442 (216:223) andTRANSFAC: R03443 (248:258), were recognized byB-DNA-VIDEO as three ‘potential AP-1 sites’ on the sequence(EMBL: S49899, fragment 1:356). In addition, experimentallydetected GATA-1 site, TRRD: Site #1755, was recognized byMatInspector as ‘potential AP-1 site’ and experimentally knownC/EBP site, TRRD: Site #1435, as ‘potential HNF1 site’.According to correlation between two protein classifications,
‘by DNA-binding domain’ and ‘by Twist-selectivity’ (Table 4),this kind of ‘false positive’ seems to be not so false. This‘false-positive’ recognition of non-targeted sites is in accordancewith experimental evidence documented in the commonlyaccepted databases TRANSFAC (Heinemeyer et al., 1999),TRRD (Kolchanov et al., 1999) and COMPEL (Wingenderet al., 1997). Information on a huge number of regulatory sitesbeing either ‘antagonistically’ composed or tissue-specificregulatory elements and binding several transcription factors isaccumulated in the databases. Moreover, recognition ofgenomic DNA regions abnormally enriched by transcriptionfactor binding sites may be very informative, e.g. for predictionof ‘potential gene networks’, which regulate expression of geneslocated in the large-scale vicinity of the clusters (Wagner, 1997).Thus, recognition of ‘one transcription factor binding siteinstead of another’ may be probabilistic ‘false positive’, but‘true positive’ from a biological point of view. That is why itseems reasonable to denote the recognition of ‘one transcriptionfactor binding site instead of another’ as ‘pseudo-false positive’,and try to investigate this potentially interesting computationalphenomenon.
Comparison of B-DNA-VIDEO with the toolapplying B-DNA properties
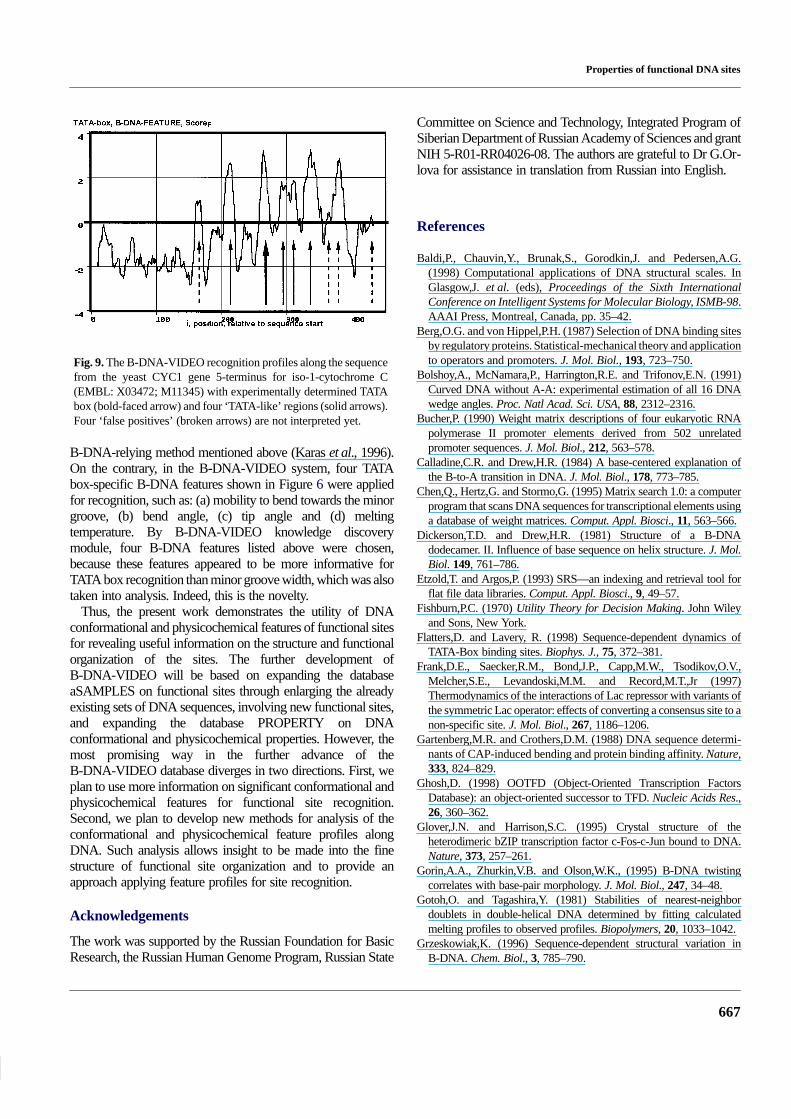
The conformational B-DNA properties were first taken intoaccount for recognizing the transcription factor binding sites byKaras et al. (1996). In this work, potential TATA boxes wererecognized on a 450-bp-long sequence entitled ‘Yeast CYC1gene 5 terminus for iso-1-cytochrome C’ (EMBL: X03472;M11345). The recognition that resulted was as follows: first, theexperimentally identified TATA box was successfully detected;second, four already known ‘TATA-like’ regions documentedby the EMBL entry were recognized too; third, 28 ‘falsepositives’ were found in the paper cited above.
Since the yeast promoters are not included into the databaseEPD (Perier et al., 1999), used for training the B-DNA-VIDEOsystem for TATA box recognition (see Implementation andresults), the yeast sequence (EMBL: X03472; M11345) wasconsidered as the ‘control’. This DNA sequence was processedby the B-DNA-VIDEO system by using four TATAbox-specific conformational and physicochemical featuresshown in Figure 6. The result obtained is demonstrated inFigure 9. In this figure, the experimental TATA box marked bythe bold-faced arrow was successfully recognized; fourTATA-like regions marked by solid arrows were recognized too;in addition, four ‘false positives’ marked by broken arrows wererevealed.
As can be seen, the B-DNA-VIDEO system is simplyreducing the ‘false positives’ with respect to the earlierdeveloped B-DNA-relying method (Karas et al., 1996). Thedecrease in ‘false positives’ may be easily explained. Only the‘Minor groove width’ feature was taken into account by the
Properties of functional DNA sites
667
Fig. 9. The B-DNA-VIDEO recognition profiles along the sequencefrom the yeast CYC1 gene 5-terminus for iso-1-cytochrome C(EMBL: X03472; M11345) with experimentally determined TATAbox (bold-faced arrow) and four ‘TATA-like’ regions (solid arrows).Four ‘false positives’ (broken arrows) are not interpreted yet.
B-DNA-relying method mentioned above (Karas et al., 1996).On the contrary, in the B-DNA-VIDEO system, four TATAbox-specific B-DNA features shown in Figure 6 were appliedfor recognition, such as: (a) mobility to bend towards the minorgroove, (b) bend angle, (c) tip angle and (d) meltingtemperature. By B-DNA-VIDEO knowledge discoverymodule, four B-DNA features listed above were chosen,because these features appeared to be more informative forTATA box recognition than minor groove width, which was alsotaken into analysis. Indeed, this is the novelty.
Thus, the present work demonstrates the utility of DNAconformational and physicochemical features of functional sitesfor revealing useful information on the structure and functionalorganization of the sites. The further development ofB-DNA-VIDEO will be based on expanding the databaseaSAMPLES on functional sites through enlarging the alreadyexisting sets of DNA sequences, involving new functional sites,and expanding the database PROPERTY on DNAconformational and physicochemical properties. However, themost promising way in the further advance of theB-DNA-VIDEO database diverges in two directions. First, weplan to use more information on significant conformational andphysicochemical features for functional site recognition.Second, we plan to develop new methods for analysis of theconformational and physicochemical feature profiles alongDNA. Such analysis allows insight to be made into the finestructure of functional site organization and to provide anapproach applying feature profiles for site recognition.
Acknowledgements
The work was supported by the Russian Foundation for BasicResearch, the Russian Human Genome Program, Russian State
Committee on Science and Technology, Integrated Program ofSiberian Department of Russian Academy of Sciences and grantNIH 5-R01-RR04026-08. The authors are grateful to Dr G.Or-lova for assistance in translation from Russian into English.
References
Baldi,P., Chauvin,Y., Brunak,S., Gorodkin,J. and Pedersen,A.G.(1998) Computational applications of DNA structural scales. InGlasgow,J. et al. (eds), Proceedings of the Sixth InternationalConference on Intelligent Systems for Molecular Biology, ISMB-98.AAAI Press, Montreal, Canada, pp. 35–42.
Berg,O.G. and von Hippel,P.H. (1987) Selection of DNA binding sitesby regulatory proteins. Statistical-mechanical theory and applicationto operators and promoters. J. Mol. Biol., 193, 723–750.
Bolshoy,A., McNamara,P., Harrington,R.E. and Trifonov,E.N. (1991)Curved DNA without A-A: experimental estimation of all 16 DNAwedge angles. Proc. Natl Acad. Sci. USA, 88, 2312–2316.
Bucher,P. (1990) Weight matrix descriptions of four eukaryotic RNApolymerase II promoter elements derived from 502 unrelatedpromoter sequences. J. Mol. Biol., 212, 563–578.
Calladine,C.R. and Drew,H.R. (1984) A base-centered explanation ofthe B-to-A transition in DNA. J. Mol. Biol., 178, 773–785.
Chen,Q., Hertz,G. and Stormo,G. (1995) Matrix search 1.0: a computerprogram that scans DNA sequences for transcriptional elements usinga database of weight matrices. Comput. Appl. Biosci., 11, 563–566.
Dickerson,T.D. and Drew,H.R. (1981) Structure of a B-DNAdodecamer. II. Influence of base sequence on helix structure. J. Mol.Biol. 149, 761–786.
Etzold,T. and Argos,P. (1993) SRS—an indexing and retrieval tool forflat file data libraries. Comput. Appl. Biosci., 9, 49–57.
Fishburn,P.C. (1970) Utility Theory for Decision Making. John Wileyand Sons, New York.
Flatters,D. and Lavery, R. (1998) Sequence-dependent dynamics ofTATA-Box binding sites. Biophys. J., 75, 372–381.
Frank,D.E., Saecker,R.M., Bond,J.P., Capp,M.W., Tsodikov,O.V.,Melcher,S.E., Levandoski,M.M. and Record,M.T.,Jr (1997)Thermodynamics of the interactions of Lac repressor with variants ofthe symmetric Lac operator: effects of converting a consensus site to anon-specific site. J. Mol. Biol., 267, 1186–1206.
Gartenberg,M.R. and Crothers,D.M. (1988) DNA sequence determi-nants of CAP-induced bending and protein binding affinity. Nature,333, 824–829.
Ghosh,D. (1998) OOTFD (Object-Oriented Transcription FactorsDatabase): an object-oriented successor to TFD. Nucleic Acids Res.,26, 360–362.
Glover,J.N. and Harrison,S.C. (1995) Crystal structure of theheterodimeric bZIP transcription factor c-Fos-c-Jun bound to DNA.Nature, 373, 257–261.
Gorin,A.A., Zhurkin,V.B. and Olson,W.K., (1995) B-DNA twistingcorrelates with base-pair morphology. J. Mol. Biol., 247, 34–48.
Gotoh,O. and Tagashira,Y. (1981) Stabilities of nearest-neighbordoublets in double-helical DNA determined by fitting calculatedmelting profiles to observed profiles. Biopolymers, 20, 1033–1042.
Grzeskowiak,K. (1996) Sequence-dependent structural variation inB-DNA. Chem. Biol., 3, 785–790.
J.V.Ponomarenko et al.
668
Haussler,D. (1998) Computational genefinding. Trends Guide Bioinf., 1,12–15.
Heinemeyer,T. et al. (1999) Expanding the TRANSFAC databasetowards an expert system of regulatory molecular mechanisms.Nucleic Acids Res., 27, 318–322.
Juo,Z.S., Chiu,T.K., Leiberman,P.M., Baikalov,I., Berk,A.J. andDickerson,R.E. (1996) How proteins recognize the TATA box. J. Mol.Biol., 261, 239–254.
Karas,H., Knuppel,R., Schulz,W., Sklenar,H. and Wingender,E., (1996)Combining structural analysis of DNA with search routines for thedetection of transcription regulatory elements. Comput. Appl. Biosci.,12, 441–446.
Kel,A.E., Ponomarenko,M.P., Likhachev,E.A., Orlov,Y.L.,Ischenko,I.V., Milanesi,L. and Kolchanov,N.A. (1993) SITEVIDEO:a computer system for functional site analysis and recognition.Investigation of the human splice sites. Comput. Appl. Biosci., 9,617–627.
Keller,W., Konig,P. and Richmond,T.J. (1995) Crystal structure of abZIP/DNA complex at 2.2 angstroms: determinants of DNA specificrecognition. J. Mol. Biol., 254, 657–667.
Kissinger,C.R., Liu,B., Martin-Blanco,E., Kornberg,T.B. and Pabo,C.O.(1990) Crystal structure of an engrailed homeodomain-DNA complexat 2.8 angstroms resolution: a framework for understandinghomeodomain-DNA interactions. Cell, 63, 579–590.
Kolchanov,N.A., Ponomarenko,M.P., Ponomarenko,J.V.,Podkolodny,N.L. and Frolov,A.S. (1998) Functional sites in pro- andeukaryotic genomes: computer models for predicting activity. Mol.Biol. (Mosk.), 32, 255–267.
Kolchanov,N.A. et al. (1999) Transcription Regulatory Regions Database(TRRD): its status in 1999. Nucleic Acids Res., 27, 303–306.
Latchman,D.S. (1995) Eukaryotic Transcription Factors. AcademicPress, London.
Lehman,E.L. (1959) Testing Statistical Hypotheses. John Wiley andSons, New York.
McDevitt,M.A., Hart,R.P., Wong,W.W. and Nevins,J.R. (1986)Sequences capable of restoring poly(A) site function define twodistinct downstream elements. EMBO J., 5, 2907–2913.
Meierhans,D., Sieber,M. and Allemann,R.K. (1997) High affinitybinding of MEF-2C correlates with DNA bending. Nucleic AcidsRes., 25, 4537–4544.
Perier,R.C., Junier,T., Bonnard,C. and Bucher,P. (1999) The EukaryoticPromoter Database (EPD): recent developments. Nucleic Acids Res.,27, 307–309.
Ponomarenko,M.P., Kel,A.E., Kolchanova,A.N. and Kolchanov,N.A.(1996) Contextual signals and antisignals of the intron td-homing site.Dokl. Akad. Nauk (Mosk.), 348, 424–427.
Ponomarenko,M.P., Ponomarenko,J.V., Kel,A.E. and Kolchanov,N.A.(1997a) Computer analysis of conformational features of theeukaryotic TATA-box DNA promotors. Mol. Biol. (Mosk.), 31,733–740.
Ponomarenko,M.P., Ponomarenko,J.V., Kel,A.E. and Kolchanov,N.A.(1997b) Search for DNA conformational features for functional sites.Investigation of the TATA box. In Altman,R. (ed.), Proceedings of the1997 Pacific Symposium. World Sci., Singapore, pp. 340–351.
Ponomarenko,M.P., Kolchanova,A.N. and Kolchanov,N.A. (1997c)Generating programs for predicting the activity of functional sites. J.Comput. Biol., 4, 83–90.
Quandt,K., Frech,K., Karas,H., Wingender,E. and Werner,T. (1995)MatInd and MatInspector: new fast and versatile tools for detection ofconsensus matches in nucleotide sequence data. Nucleic Acids Res.,23, 4878–4884.
Robison,K., McGuire,A.M. and Church,G.M. (1998) A comprehensivelibrary of DNA-binding site matrices for 55 proteins applied to thecomplete Escherichia coli K-12 genome. J. Mol. Biol., 284, 241–254.
Roulet,E., Fisch,I., Bucher,P. and Mermod,N. (1998) Evaluation ofcomputer tools for prediction of transcription factor binding sites ongenomic DNA. In Silico Biol., 1, 21–28.
Salgado,H., Santos,A., Garza-Ramos,U., van Helden,J., Diaz,E. andCollado-Vides,J. (1999) RegulonDB (version 2.0): a database ontranscriptional regulation in Escherichia coli. Nucleic Acids Res., 27,59–60.
Satchwell,S.C., Drew,H.R. and Travers,A.A. (1986) Sequenceperiodicities in chicken nucleosome core DNA. J. Mol. Biol., 191,659–675.
Schneider,T.D., Stormo,G.D., Gold,L. and Ehrenfeucht,A. (1986)Information content of binding sites on nucleotide sequences. J. Mol.Biol., 188, 415–431.
Starr,D.B., Hoopes,B.C. and Hawley,D.K. (1995) DNA bending is animportant component of site-specific recognition by the TATAbinding protein. J. Mol. Biol., 250, 434–446.
Stoeckert,C.J.,Jr, Salas,F., Brunk,B. and Overton,G.C. (1999) EpoDB: aprototype database for the analysis of genes expressed duringvertebrate erythropoiesis. Nucleic Acids Res., 27, 200–203.
Stoesser,G, Moseley,M.A., Sleep,J., McGowran,M., Garcia-Pastor,M.and Sterk,P. (1998) The EMBL nucleotide sequence database. NucleicAcids Res., 26, 8–15.
Sugimoto,N., Nakano,S., Yoneyama,M. and Honda,K. (1996) Improvedthermodynamic parameters and helix initiation factor to predictstability of DNA duplexes. Nucleic Acids Res., 24, 4501–4505.
Suzuki,M., Yagi,N. and Finch,J.T. (1996) Role of base-backbone andbase-base interactions in alternating DNA conformations. FEBS Lett.,379, 148–152.
Suzuki,M., Amano,N., Kakinuma,J. and Tateno,M. (1997) Use of a 3Dstructure data base for understanding sequence-dependent con-formational aspects of DNA. J. Mol. Biol., 274, 421–435.
Wagner,A. (1997) A computational genomics approach to theidentification of gene networks. Nucleic Acids Res., 25, 3594–3604.
Wingender,E., Kel,A.E., Kel,O.V., Karas,H., Heinemeyer,T., Dietze,P.,Knuppel,R., Romaschenko,A.G. and Kolchanov,N.A. (1997)TRANSFAC, TRRD and COMPEL: towards a federated databasesystem on transcriptional regulation. Nucleic Acids Res., 25, 265–268.
Zadeh,L.A. (1965) Fuzzi sets. Inf. Control, 8, 338–353.