Conformational heterogeneity in a fully-complementary DNA ...
32
This is a repository copy of Conformational heterogeneity in a fully-complementary DNA three-way junction with a GC-rich branchpoint . White Rose Research Online URL for this paper: https://eprints.whiterose.ac.uk/121888/ Version: Accepted Version Article: Toulmin, Anita, Baltierra-Jasso, Laura E, Morten, Michael J et al. (5 more authors) (2017) Conformational heterogeneity in a fully-complementary DNA three-way junction with a GC- rich branchpoint. Biochemistry. 4985–4991. ISSN 1520-4995 https://doi.org/10.1021/acs.biochem.7b00677 [email protected] https://eprints.whiterose.ac.uk/ Reuse Items deposited in White Rose Research Online are protected by copyright, with all rights reserved unless indicated otherwise. They may be downloaded and/or printed for private study, or other acts as permitted by national copyright laws. The publisher or other rights holders may allow further reproduction and re-use of the full text version. This is indicated by the licence information on the White Rose Research Online record for the item. Takedown If you consider content in White Rose Research Online to be in breach of UK law, please notify us by emailing [email protected] including the URL of the record and the reason for the withdrawal request.
-
Upload
khangminh22 -
Category
Documents
-
view
2 -
download
0
Transcript of Conformational heterogeneity in a fully-complementary DNA ...

This is a repository copy of Conformational heterogeneity in a fully-complementary DNA three-way junction with a GC-rich branchpoint.
White Rose Research Online URL for this paper:https://eprints.whiterose.ac.uk/121888/
Version: Accepted Version
Article:
Toulmin, Anita, Baltierra-Jasso, Laura E, Morten, Michael J et al. (5 more authors) (2017) Conformational heterogeneity in a fully-complementary DNA three-way junction with a GC-rich branchpoint. Biochemistry. 4985–4991. ISSN 1520-4995
https://doi.org/10.1021/acs.biochem.7b00677
[email protected]://eprints.whiterose.ac.uk/
Reuse
Items deposited in White Rose Research Online are protected by copyright, with all rights reserved unless indicated otherwise. They may be downloaded and/or printed for private study, or other acts as permitted by national copyright laws. The publisher or other rights holders may allow further reproduction and re-use of the full text version. This is indicated by the licence information on the White Rose Research Online record for the item.
Takedown
If you consider content in White Rose Research Online to be in breach of UK law, please notify us by emailing [email protected] including the URL of the record and the reason for the withdrawal request.

1
Conformational heterogeneity in a fully-complementary DNA three-way
junction with a GC-rich branchpoint
Anita Toulmin,1,2, Laura E. Baltierra-Jasso,1,2,3 Michael J. Morten,3 Tara Sabir,1,2,4 Peter
McGlynn,5 Gunnar F. Schröder,6,7 Brian O. Smith8 and Steven W. Magennis3*
1The School of Chemistry, The University of Manchester,
Oxford Road, Manchester, M13 9PL, UK
2The Photon Science Institute, The University of Manchester,
Alan Turing Building, Oxford Road, Manchester, M13 9PL, UK
3School of Chemistry, WestCHEM, University of Glasgow, Joseph Black Building, University
Avenue, Glasgow, G12 8QQ, UK,
4 Present Address: School of Clinical and Applied Sciences, Leeds Beckett University,
Portland Building, City Campus, Leeds, LS1 3HE, U.K
5Department of Biology, University of York, Wentworth Way, York, YO10 5DD, UK.
6Institute of Complex Systems (ICS-6), Forschungszentrum Jülich, 52425 Jülich, Germany
7Physics Department, Heinrich-Heine Universität Düsseldorf, Germany
8Institute of Molecular, Cell & Systems Biology, University of Glasgow, Glasgow G12 8QQ,
UK.
Corresponding Author
*E-mail: [email protected]

2
Abstract
DNA three-way junctions (3WJs) are branched structures that serve as important biological
intermediates and as components in DNA nanostructures. We recently derived the global
structure of a fully-complementary 3WJ and found that it contained unpaired bases at the
branchpoint, in support of previous observations of branch flexibility and branchpoint reactivity.
By combining high-resolution single-molecule FRET, molecular modeling, time-resolved
ensemble fluorescence spectroscopy and the first 19F NMR observations of fully complementary
3WJs, we now show that the 3WJ structure can adopt multiple distinct conformations depending
upon the sequence at the branchpoint. A 3WJ with a GC-rich branchpoint adopts an open
conformation with unpaired bases at the branch and at least one additional conformation with
increased base interactions at the branchpoint. This structural diversity has implications for
branch interactions and processing in vivo and for technological applications.
Introduction
Branched nucleic acid molecules are key intermediates and structural elements in vivo1, 2 and are
important components in structural and dynamic DNA nanoscience.3 Arguably the simplest
branched structure is the three-way junction (3WJ), formed from three single nucleic acid
strands. We recently used high-resolution single-molecule Förster resonance energy transfer
(SM-FRET4) to show that a DNA 3WJ with a branchpoint that is not GC-rich, does not adopt a
fully-paired conformation as expected, but instead has a nanoscale cavity at the branchpoint.5
The structures of fully complementary 3WJs have previously eluded structural characterization
at atomic resolution since their dynamic nature has precluded their crystallization and rendered
1H nuclear magnetic resonance (NMR) signals of the junction bases unobservable. Since then,
3WJs have continued to attract attention in a range of contexts including for controlled charge
transport,6-8 ion sensing,9 molecular recognition10 and as scaffolds for light harvesting.11, 12

3
In this work, we examine whether the expanded branchpoint described previously5 is a
general phenomenon for all fully-complementary 3WJs or if it is dependent on sequence. We
use SM-FRET and molecular dynamics (MD) simulations to study local and global 3WJ
structure. In addition, we report the first use of 19F NMR spectroscopy to study fully-
complementary 3WJs, by incorporating a 5-fluoro-cytosine near the branchpoint. We find that a
3WJ with a GC-rich branchpoint can adopt at least two conformations in solution. The major
conformation is similar to that previously observed, with unpaired bases at the branch and a Y-
shaped, pyramidal structure. There is also at least one minor conformation with an altered
branchpoint structure, which we attribute to increased base-pairing at the branch. These
structures are in exchange on the supra-millisecond timescale. The structural heterogeneity
observed upon changing the branch sequence will have consequences for the reactivity of fully-
complementary 3WJs and illustrates the conformational diversity that branched DNA molecules
may possess.
Materials and Methods
Preparation of three-way junctions
Oligonucleotides were synthesised and labeled by Purimex GmbH (Grebenstein, Germany). The
NHS-esters of Alexa488 (5’/6’ mixed isomer, Invitrogen) or Cy5 (GE-Healthcare) were
attached via a 5-C6-aminoallyl-deoxythymidine. Annealing of samples for branched DNA was
carried out in buffer (13 mM Tris, 65 mM NaCl, pH 7.5). Annealing buffer for duplexes
contained 16 mM Tris and 80 mM NaCl. For all structures the ratio of donor strand to other
strands was 1:3. Samples were heated to 90 °C in a water bath and left to cool slowly overnight.
For measurement, all samples were diluted into buffer containing 20 mM Tris, 15 mM NaCl and
1 mM ascorbic acid. Prior to sample addition, the buffer was stirred with activated charcoal to
remove fluorescent impurities. The measurement buffer contained either 0 mM or 1 mM MgCl2.

4
Sequences of oligonucleotides for FRET studies.
The sequences used to construct the 3WJs are shown below. For labeling positions see Fig. 1.
3WJa
5’ GTC GGA TCC TCT AGA TAT CTC CAT GCT CAC TGG TTA TAG GAG AAT CCG GG
5’ AAT CTC ACA GCT GAT CAC ATT GCT ACA TGG AGA TAT CTA GAG GAT CCG AC
5’ CCC GGA TTC TCC TAT AAC CAG TGA GTA GCA ATG TGA TCA GCT GTG AGA TT
3WJb
5’ GTC GGA TCC TCT AGA TAT CTC CAC GCG CAC TGG TTA TAG GAG AAT CCG GG
5’ AAT CTC ACA GCT GAT CAC ATT GCC GCG TGG AGA TAT CTA GAG GAT CCG AC
5’ CCC GGA TTC TCC TAT AAC CAG TGC GCG GCA ATG TGA TCA GCT GTG AGA TT
Multi-parameter fluorescence detection (MFD) MFD is based around burstwise detection of
fluorescence as single molecules diffuse through the focus of a confocal microcope. Photon
counting detection by multiple detectors allows simultaneous detection of the color, lifetime,
polarisation and intensity of fluorescence for each molecule.13 MFD measurements were
performed using a home-built system, which we described previously.14 The process for
calculating the FRET distances from the MFD data was described previously.5 The FRET
distances reported here were reproducible to £2 Å standard deviation.
19F NMR spectroscopy
Oligonucleotides were synthesized and labeled by Purimex GmbH (Grebenstein, Germany) and
were received lyophilized; the sequences are shown below. They were initially dissolved in
NMR buffer (20 mM phosphate buffer pH 7.5, 0.01% sodium azide and 50 mM NaCl) which
was prepared in ultrapure water (Direct Q3, Merck Millipore). Strands NMR_1, NMR_2 and
NMR_3 were annealed together to create the 3WJ in a 1:2:2 ratio, NMR_1 was used alone for
the ssDNA measurement, and NMR_1 and NMR_4 formed the dsDNA structure in a 1:2 ratio.
5
Samples were heated to 90 °C and left to cool overnight. D2O was then added to all samples
with a final concentration of 5%, with trimethylsilylpropionic acid (TSP) added to a final
concentration of 0.00025%. The 3WJ was also later re-lyophilized and re-dissolved in 100%
D2O.
NMR data were recorded on a Bruker AVIII 500 MHz spectrometer, fitted with a BBFO+
probe, where the operating temperatures of the spectrometer were calibrated using a sample of
D, 99.8% methanol-d4. The NMR spectra were processed using Topspin and all chemical shifts
are reported relative to the 1H resonance of TSP, using the position of the TSP signal in the
corresponding 1H 1D spectra, recorded across the temperature range for references.15
Sequences of oligonucleotides for NMR studies.
The sequences for the 3WJ, ssDNA and dsDNA that were studied using 19F NMR spectroscopy
are shown below. The position of the 5-fluoro-cytosine is underlined.
NMR_1 5’ TAT CTC CAC GCG CAC TGG TT
NMR_2 5’ AAC CAG TGC GCG GCA ATG TG
NMR_3 5’ CAC ATT GCC GCG TGG AGA TA
NMR_4 5’ AAC CAG TGC GCG TGG AGA TA
Ensemble optical spectroscopy.
Absorption spectra were measured on a Cary 50 (Agilent Technologies) spectrometer. Steady-
state and time-resolved fluorescence were measured, under magic angle conditions using a
fluorescence spectrometer (FluoTime 300, Picoquant GmbH) with a PMA hybrid detector. The
absorbance of the sample was low (< 0.05) so that inner-filter effects were negligible. Time-
resolved fluorescence spectroscopy was performed using the technique of time-correlated single

6
photon counting. The excitation source was a super continuum laser (WL-SC-400-4-PP,
Fianium) with tuneable wavelength filter and multimode fibre (Superchrome-Vis-FDS-MM,
Fianium) at a wavelength of 488 nm, bandpass of 10 nm and at a repetition rate of 10 MHz. The
instrument response function (IRF) was ca. 130 ps full width at half maximum; the time/channel
was 8 ps. Decay curves were analysed using a standard iterative reconvolution method (FluoFit,
Picoquant GmbH), assuming a multiexponential decay function. The quality of fit was judged
on the basis of the reduced chi-square statistic, c2, and the randomness of residuals.
Molecular Dynamics (MD) Simulations.
The procedure for deriving structures from FRET distance restraints was described previously
for 3WJa.5
For the starting model, the three DNA arms of the three-way junction were modeled as B-DNA
using the program Hyperchem (Version 8.0.8 for Windows, Molecular Modeling System,
Lightwave Scientific). The program CNS16 was then used for the simulated annealing molecular
dynamics calculation. During the simulation, FRET distance restraints were applied to model
the geometry of the DNA. We used the mean dye positions for Alexa488 and Cy5 obtained from
a MD simulation that has been published previously.17
In brief, the mean positions were fixed relative to the surface of the DNA by distance restraints.
The distance restraints were generated by the DEN (Deformable Elastic Network) feature18 in
CNS which selects random atom pairs that are within a specified distance range in the starting
structure. It should be noted that we did not actually use deformable restraints, but rather used
regular (non-deformable) harmonic distance restraints during the refinement.
7
Results
GC-rich 3WJ structure from single-molecule FRET and MD
In order to test whether the unpairing of bases at the branchpoint of fully-complementary 3WJs
is a general phenomenon, or is specific to the previously studied 3WJ (referred to here as 3WJa),
we modified the sequence so that the four nucleotides next to the branchpoint in each arm had
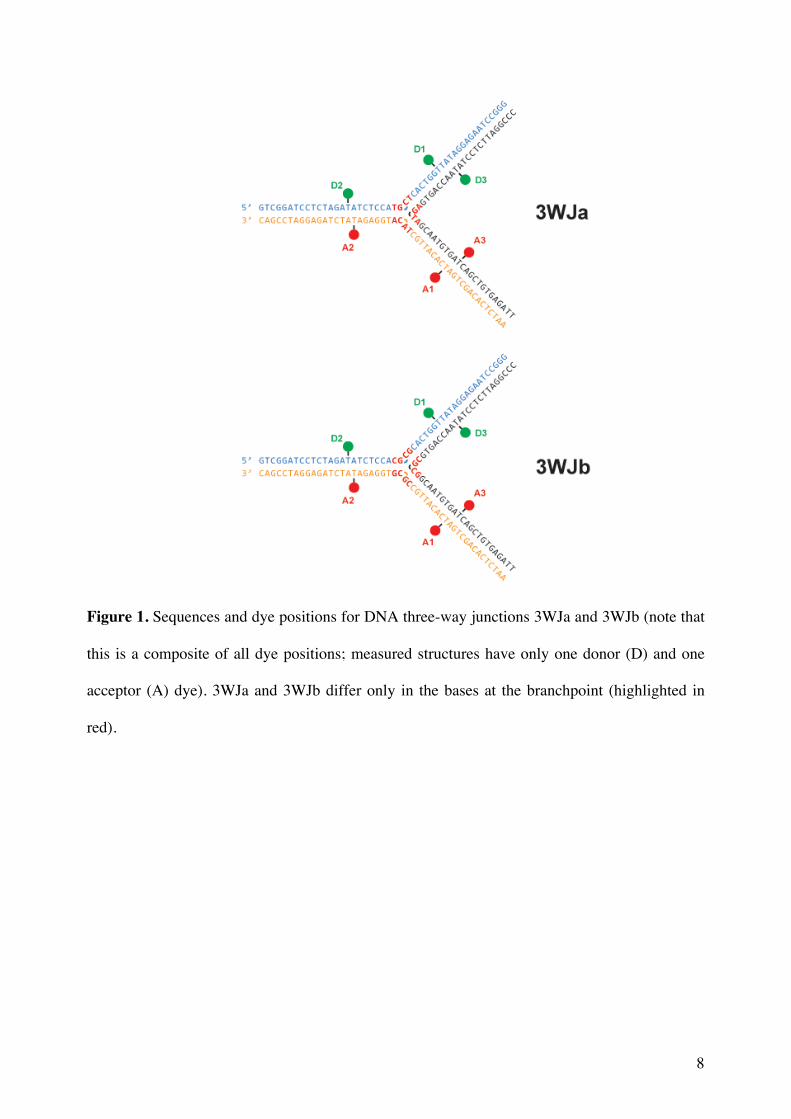
the potential to form two G:C Watson-Crick pairs (3WJb). The sequences of 3WJa and 3WJb
are shown in Fig. 1, together with the positions used for fluorescent dye labeling; the 12
nucleotides nearest the branchpoint are highlighted in red. We postulated that the GC-rich
branchpoint of 3WJb might make the formation of a fully-paired structure more likely.
We studied 3WJs labeled with one donor dye and one acceptor dye. The six dye
positions (Fig. 1) allowed seven different combinations of donor and acceptor dye to be used for
single-molecule FRET measurements using multi-parameter fluorescence detection (MFD).13
MFD is ideal for measuring accurate dye-dye distances for structural determination.19 For each
FRET pair, 3WJb was measured in buffer containing 0 mM or 1 mM of Mg2+, in order to check
for potential ion-induced effects. In each case, the data were qualitatively similar to those for
3WJa, showing a donor-only peak and a FRET population (Fig. 2a). MFD data for all the 3WJb
samples are given in the Supplementary Information (Figs S1 and S2).
8
Figure 1. Sequences and dye positions for DNA three-way junctions 3WJa and 3WJb (note that
this is a composite of all dye positions; measured structures have only one donor (D) and one
acceptor (A) dye). 3WJa and 3WJb differ only in the bases at the branchpoint (highlighted in
red).
9
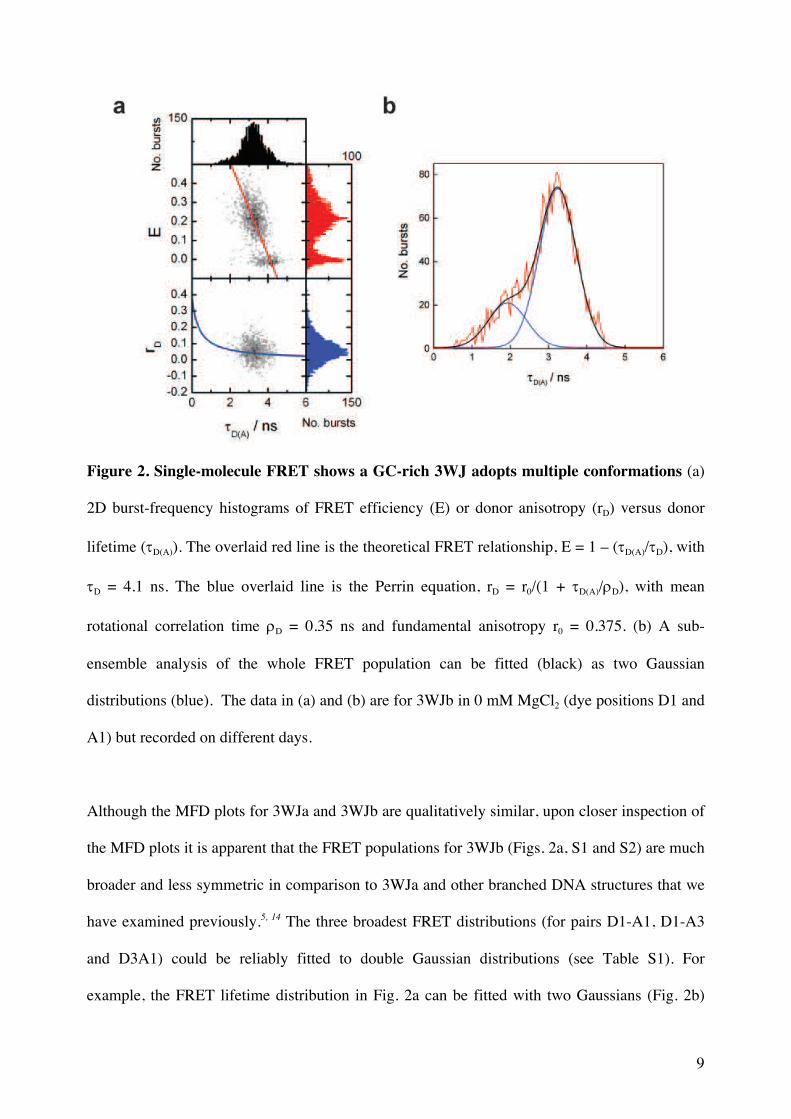
Figure 2. Single-molecule FRET shows a GC-rich 3WJ adopts multiple conformations (a)
2D burst-frequency histograms of FRET efficiency (E) or donor anisotropy (rD) versus donor
lifetime (tD(A)). The overlaid red line is the theoretical FRET relationship, E = 1 – (tD(A)/tD), with
tD = 4.1 ns. The blue overlaid line is the Perrin equation, rD = r0/(1 + tD(A)/rD), with mean
rotational correlation time rD = 0.35 ns and fundamental anisotropy r0 = 0.375. (b) A sub-
ensemble analysis of the whole FRET population can be fitted (black) as two Gaussian
distributions (blue). The data in (a) and (b) are for 3WJb in 0 mM MgCl2 (dye positions D1 and
A1) but recorded on different days.
Although the MFD plots for 3WJa and 3WJb are qualitatively similar, upon closer inspection of
the MFD plots it is apparent that the FRET populations for 3WJb (Figs. 2a, S1 and S2) are much
broader and less symmetric in comparison to 3WJa and other branched DNA structures that we
have examined previously.5, 14 The three broadest FRET distributions (for pairs D1-A1, D1-A3
and D3A1) could be reliably fitted to double Gaussian distributions (see Table S1). For
example, the FRET lifetime distribution in Fig. 2a can be fitted with two Gaussians (Fig. 2b)
10
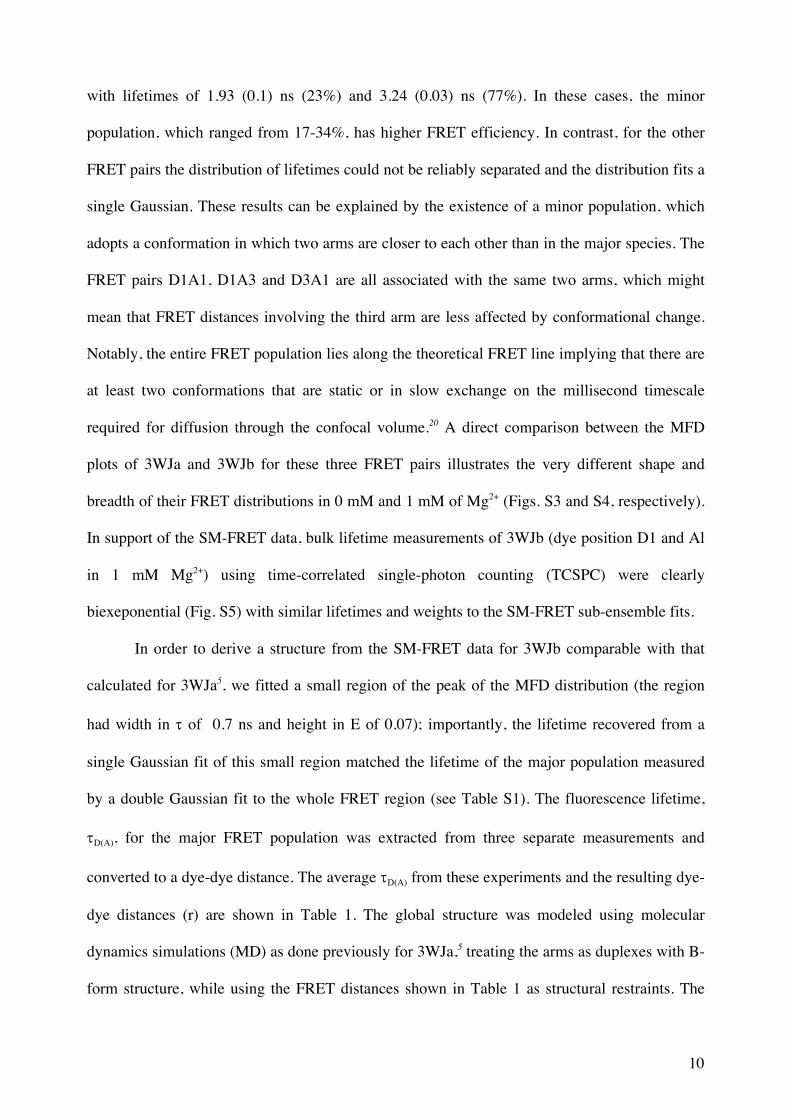
with lifetimes of 1.93 (0.1) ns (23%) and 3.24 (0.03) ns (77%). In these cases, the minor
population, which ranged from 17-34%, has higher FRET efficiency. In contrast, for the other
FRET pairs the distribution of lifetimes could not be reliably separated and the distribution fits a
single Gaussian. These results can be explained by the existence of a minor population, which
adopts a conformation in which two arms are closer to each other than in the major species. The
FRET pairs D1A1, D1A3 and D3A1 are all associated with the same two arms, which might
mean that FRET distances involving the third arm are less affected by conformational change.
Notably, the entire FRET population lies along the theoretical FRET line implying that there are
at least two conformations that are static or in slow exchange on the millisecond timescale
required for diffusion through the confocal volume.20 A direct comparison between the MFD
plots of 3WJa and 3WJb for these three FRET pairs illustrates the very different shape and
breadth of their FRET distributions in 0 mM and 1 mM of Mg2+ (Figs. S3 and S4, respectively).
In support of the SM-FRET data, bulk lifetime measurements of 3WJb (dye position D1 and Al
in 1 mM Mg2+) using time-correlated single-photon counting (TCSPC) were clearly
biexeponential (Fig. S5) with similar lifetimes and weights to the SM-FRET sub-ensemble fits.
In order to derive a structure from the SM-FRET data for 3WJb comparable with that
calculated for 3WJa5, we fitted a small region of the peak of the MFD distribution (the region
had width in t of 0.7 ns and height in E of 0.07); importantly, the lifetime recovered from a
single Gaussian fit of this small region matched the lifetime of the major population measured
by a double Gaussian fit to the whole FRET region (see Table S1). The fluorescence lifetime,
tD(A), for the major FRET population was extracted from three separate measurements and
converted to a dye-dye distance. The average tD(A) from these experiments and the resulting dye-
dye distances (r) are shown in Table 1. The global structure was modeled using molecular
dynamics simulations (MD) as done previously for 3WJa,5 treating the arms as duplexes with B-
form structure, while using the FRET distances shown in Table 1 as structural restraints. The

11
FRET distances were imposed as the distance ±0.5 Å using a harmonic square well
potential. Four different sets of restraints were applied, differing in the number of bases paired
at the junction (termed 0-free, 1-free, 2-free and 3-free). The distance root-mean-square
deviation (DRMSD) between the model generated and the experimental dye-dye distances are
shown in Table S2; these DRMSDs are a measure of how well the structures fit the FRET
restraints. As with 3WJa, the model with the lowest DRMSD, and therefore the model that most
closely matches the experimentally measured FRET distances, is the 2-free model. In other
words, the FRET restraints produce a structure with unpairing at the branchpoint. The five
lowest restraint-energy conformations with the 2-free restraint applied are shown in Fig. 3.
Table 1. FRET species lifetimes (ttD(A)) and calculated dye-dye distances (r) for the major
3WJb structure. Distances for 3WJa are also shown for comparison. Lifetimes were
recovered from a single Gaussian fit of a sub-ensemble region centered on the FRET
maximum of MFD data (the selected region had width in ttof 0.7 ns and height in E of
0.07). The standard deviation for r is indicated in parentheses.
0 mM Mg2+ 1 mM Mg2+
Structure ttD(A) (ns) r (Å) 3WJa r
(Å)
ttD(A) (ns) r (Å) 3WJa r
(Å)
D1A1 3.20 64 (0. 9) 69 3.10 63 (<0.1) 66
D1A2 3.15 63 (0.2) 64 2.99 61 (<0.1) 62
D1A3 3.13 63 (0.9) 68 3.09 62 (0.6) 67
D2A1 3.41 69 (0.7) 71 3.19 64 (0.4) 65
D2A3 3.69 76 (2.3) 81 3.49 70 (1.7) 78
D3A1 3.25 65 (1.5) 69 3.18 64 (0.7) 67
D3A2 3.28 66 (0.3) 66 3.07 62 (0.1) 64
12
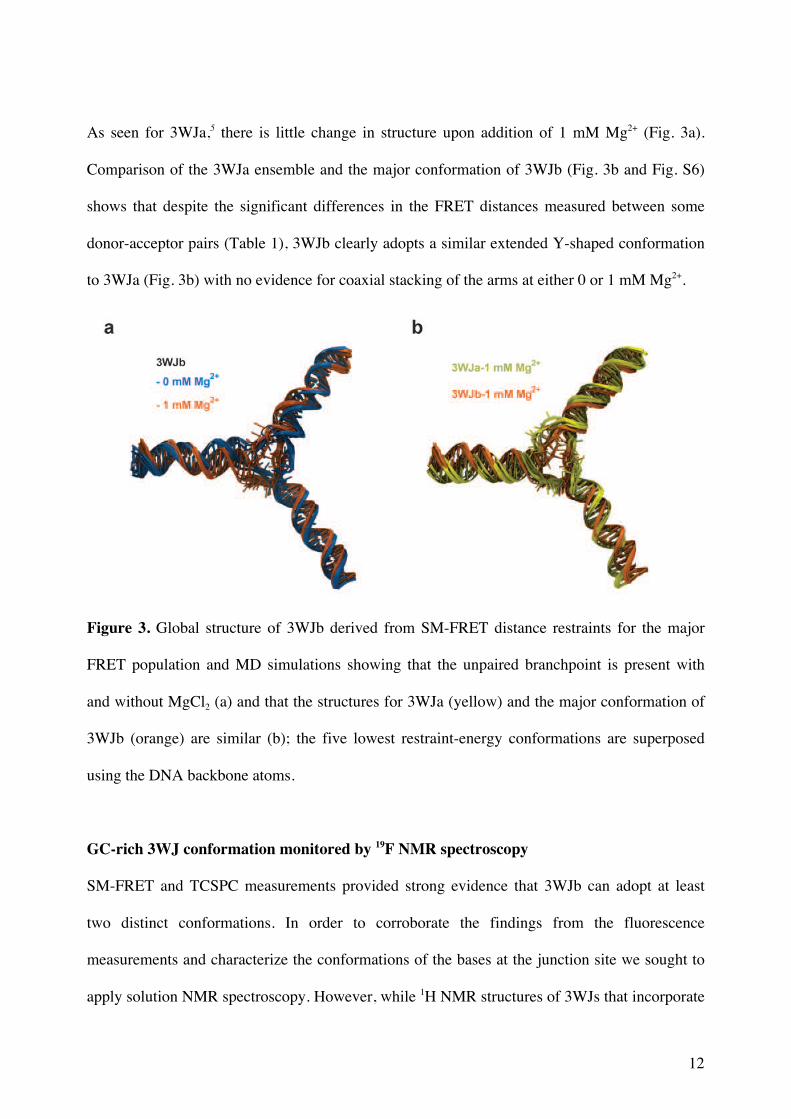
As seen for 3WJa,5 there is little change in structure upon addition of 1 mM Mg2+ (Fig. 3a).
Comparison of the 3WJa ensemble and the major conformation of 3WJb (Fig. 3b and Fig. S6)
shows that despite the significant differences in the FRET distances measured between some
donor-acceptor pairs (Table 1), 3WJb clearly adopts a similar extended Y-shaped conformation
to 3WJa (Fig. 3b) with no evidence for coaxial stacking of the arms at either 0 or 1 mM Mg2+.
Figure 3. Global structure of 3WJb derived from SM-FRET distance restraints for the major
FRET population and MD simulations showing that the unpaired branchpoint is present with
and without MgCl2 (a) and that the structures for 3WJa (yellow) and the major conformation of
3WJb (orange) are similar (b); the five lowest restraint-energy conformations are superposed
using the DNA backbone atoms.
GC-rich 3WJ conformation monitored by 19F NMR spectroscopy
SM-FRET and TCSPC measurements provided strong evidence that 3WJb can adopt at least
two distinct conformations. In order to corroborate the findings from the fluorescence
measurements and characterize the conformations of the bases at the junction site we sought to
apply solution NMR spectroscopy. However, while 1H NMR structures of 3WJs that incorporate
13
bulges in one strand have been determined,21, 22 previous attempts to characterize perfectly
complementary 3WJs reportedly failed.23 The most likely explanation for this is that the
particular dynamic nature of the systems studied resulted in the critical 1H signals being
broadened to an extent that they were either undetectable or could not be resolved, likely due to
intermediate exchange.
Since the effects of such exchange broadening depend on the difference in frequency
between the NMR signals of the exchanging species, we reasoned that the synthesis of
oligonucleotides that incorporated an NMR active nucleus with a much wider frequency range
than 1H could restore the ability to observe signals in the slow exchange regime. 19F has a much
wider chemical shift range than 1H, is highly sensitive to its chemical environment, and can be
stably incorporated into nucleotide analogues allowing the site specific labelling of synthetic
oligonucleotides.24, 25 Not only is fluorine's chemical shift range wider than that of 1H, but
because its gyromagnetic ratio is similar, its NMR signals are spread over a much wider range
of frequencies at a particular magnetic field strength. We therefore designed a 3WJ made from
three 20mers of identical sequence to the central 20 nucleotides used in 3WJb and labeled at the
branchpoint with 5-fluoro dC (Fig. 4a). Although the 19F 3WJ is a truncated version of 3WJb, it
should still be very stable, as there should be at least 8 base pairs in each arm.
We also recorded data from samples of the 19F-labeled oligonucleotide alone and of it
incorporated into a fully-complementary duplex structure, in order to establish reference
chemical shifts for single stranded and double stranded conformations. In 1D 19F spectra
measured at 470 MHz (11.4 T, 500 MHz for 1H), our single stranded 20mer with a 5F-dC at
position 11 contains two peaks at 30 °C indicating that it acts as a bi-stable oligonucleotide
exchanging between a single stranded conformation, and a second conformation that is most
likely a four base pair double stranded hairpin structure in which the 5F-dC is found at the 5'
position of the intervening four nucleotide loop (Fig. 4c). We can assign the downfield peak to
the single stranded conformation since it becomes more highly populated with increasing
14
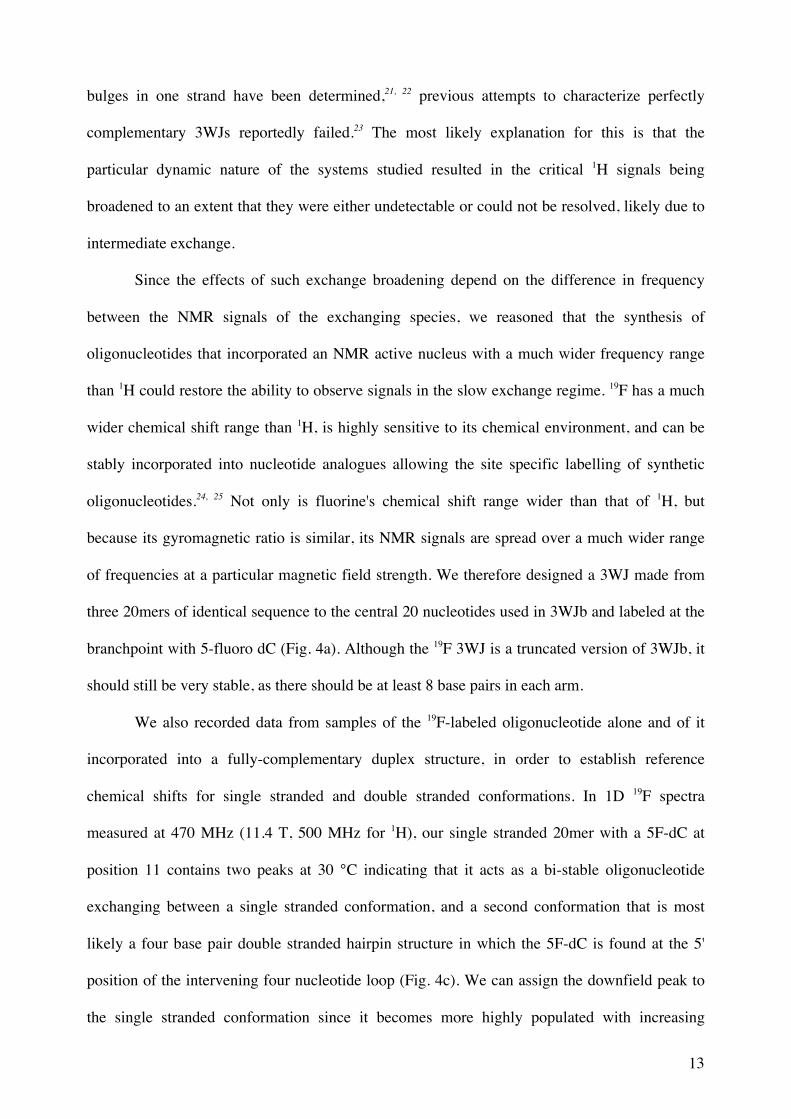
temperature (Fig. S5b). In contrast, in the double-stranded state, the 5F-dC gives rise to the
expected single, sharp peak at a chemical shift between the single stranded and loop chemical
shifts (Fig. 4c), whose position changes little at temperatures from 12 °C to 40 °C (Fig. S7).
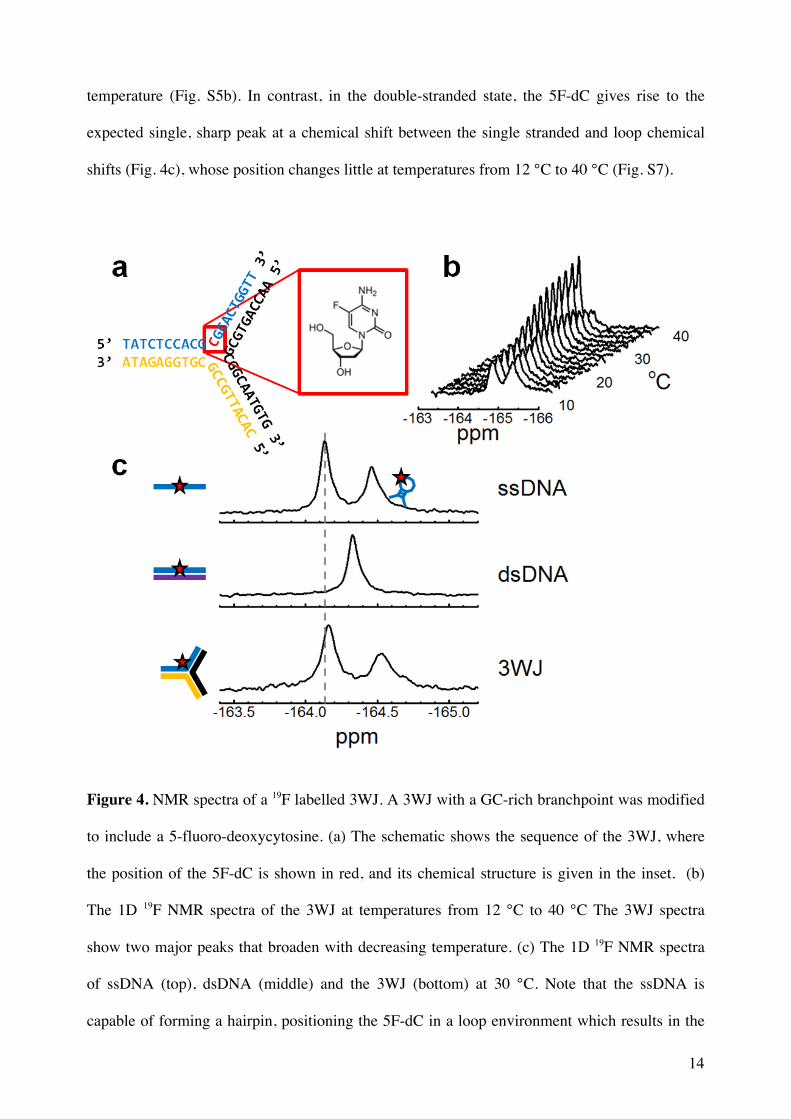
Figure 4. NMR spectra of a 19F labelled 3WJ. A 3WJ with a GC-rich branchpoint was modified
to include a 5-fluoro-deoxycytosine. (a) The schematic shows the sequence of the 3WJ, where
the position of the 5F-dC is shown in red, and its chemical structure is given in the inset. (b)
The 1D 19F NMR spectra of the 3WJ at temperatures from 12 °C to 40 °C The 3WJ spectra
show two major peaks that broaden with decreasing temperature. (c) The 1D 19F NMR spectra
of ssDNA (top), dsDNA (middle) and the 3WJ (bottom) at 30 °C. Note that the ssDNA is
capable of forming a hairpin, positioning the 5F-dC in a loop environment which results in the

15
more upfield peak. The more downfield peak represents a ssDNA conformation that has no
defined secondary structure. The vertical dashed line marks the position of the ssDNA peak.
A 5F-dC label has previously been used to study DNA secondary structure.25 This study
found that the thermodynamic stability labeled and unlabeled DNA and RNA molecules was
unaffected by labeling. The chemical shift of the 19F can be influenced by a number of factors,
including the identity of the bases stacked on either side of the GC base pair, whether the
labeled base is at the end of dsDNA, and whether the nucleic acid is an A or B form helix.
Similarly, non-canonical structures could result in different magnetic environments. Although
the dsDNA chemical shift we observe is not as upfield as previously reported (by ca. 0.5 ppm)
this is likely due to differences in sequence context (ACXTT in ref. 20 compared to CGXGC)
and also because our spectra were recorded in 95% H2O (the 5-19F-dC resonance shifts
progressively downfield as H2O is added to a D2O solution, which is attributed to a secondary
isotope effect caused by nearby imino hydrogens25).
The 1D 19F spectrum of the 5F-dC in the assembled 3WJ is characterized by the presence
of two distinct peaks at -164.16 and -164.52 ppm indicating that the 5F-dC is sampling (at least)
two distinct conformations (Fig. 4b). The relative intensities of these peaks change with
temperature, indicating that the states are in exchange. The downfield peak's chemical shift is
very close to the single stranded chemical shift, which we interpret to mean that the base spends
a significant proportion of the time in an unstacked, single-stranded conformation. The small
chemical shift difference with ssDNA could be due to the exchange process. Additionally, in
unstructured ssDNA the chemical shift is a product of rapid averaging between many different
environments. If the constrained 3WJ context changes the weighting of the populations sampled
that would also change the shift. The upfield peak matches neither the double stranded chemical
shift, nor the loop shift seen for the bi-stable oligonucleotide, and is further upfield than either
(Fig. 4c). There are a number of possible conformations that could give rise to such an upfield
shift including non-B-form double stranded structures or placement in the last base pair of a
16
double stranded region. The similar pattern of peaks seen for the 3WJ in 100% D2O (Fig. S5)
exclude the possibility that the spectral features seen in H2O arise from secondary isotope
effects.
Fitting the 3WJ spectrum at 30 °C with Dynamic NMR26, 27 (TEDDY DNMR) suggests
that the true chemical shifts of the exchanging species are very close to the shifts observed and
that the exchange rate between the states is around 15 Hz with a 60/40 population ratio. This
agrees with our interpretation of the SM-FRET data as representing two or more conformations
that are stable on the timescale of diffusion through the confocal volume (several ms).
Discussion
Pioneering ensemble studies had previously illustrated the power of FRET to probe the
conformation and heterogeneity of branched DNA molecules such as 3WJs.28, 29 The emergence
of SM-FRET as a powerful approach to structure determination17, 19, 30-32 has subsequently made
it possible to unambiguously probe the structure and heterogeneity of branched DNA in
unprecedented detail.5, 14 In an earlier report, SM-FRET, MD was combined with ensemble time-
resolved fluorescence of a nucleobase analogue (2-AP) to yield information on both global
structure (Y-shaped with pyramidal geometry) and local structure (observation of an unpaired
branchpoint) in a fully-complementary 3WJ.5 Although this work reconciled much of the
previous literature on this class of branched molecule, it was not known whether this was a
general result for all fully-complementary 3WJs.
In this work, we have attempted to address this issue by studying a 3WJ with a GC-rich
branchpoint, hypothesizing that this could provide the stability required for full Watson-Crick
pairing. Although the changes to the overall sequence were small, amounting to only four AT
pairs exchanged for GCs, the change was clearly manifested in the heterogeneous SM-FRET
data, which was interpreted as arising from at least two different conformations. The

17
combination of FRET restraints from the major conformation of 3WJb and MD produced a
global structure that was in excellent agreement with that derived for 3WJa, with an asymmetric
Y-shape and a shallow pyramidal geometry. This is also in agreement with recent small-angle
X-ray scattering (SAXS) experiments on a 3WJ, which confirmed that the arms are in a B-form
and that the global structure is asymmetric.33
The lack of an adenine at the branchpoint precluded us from utilizing 2-AP as a probe of
local branch structure, as was done for 3WJa.5 Instead we used 19F to label a cytosine at the
branch, thereby allowing us to report the first NMR spectra of a branchpoint base on a fully
complementary 3WJ. The two resonances observed for the 3WJ can be assigned as the cytosine
in different environments: one resonance resembles that of the same nucleotide in ssDNA, while
the other indicates that the base populates a distinct DNA secondary structure. The latter
conformation does not match either dsDNA or the hairpin structure formed for the labeled single
strand; therefore, it may be due to a distorted Watson-Crick pair, an underwound helical
conformation or alternative secondary structure.
We did not attempt to model the minor conformation(s) observed in SM-FRET as we did
for the major species. Even if we assume that there are only two conformations, we were only
able to reliably assign different FRET populations, and therefore derive distances, for the most
heterogeneous FRET distributions. The simplest model that is consistent with the SM-FRET and
NMR data is for a 3WJ that can adopt two conformations, which interconvert on a timescale of
tens of milliseconds (Figure 5). However, we note that we cannot rule out the possibility of
multiple secondary conformations.
18
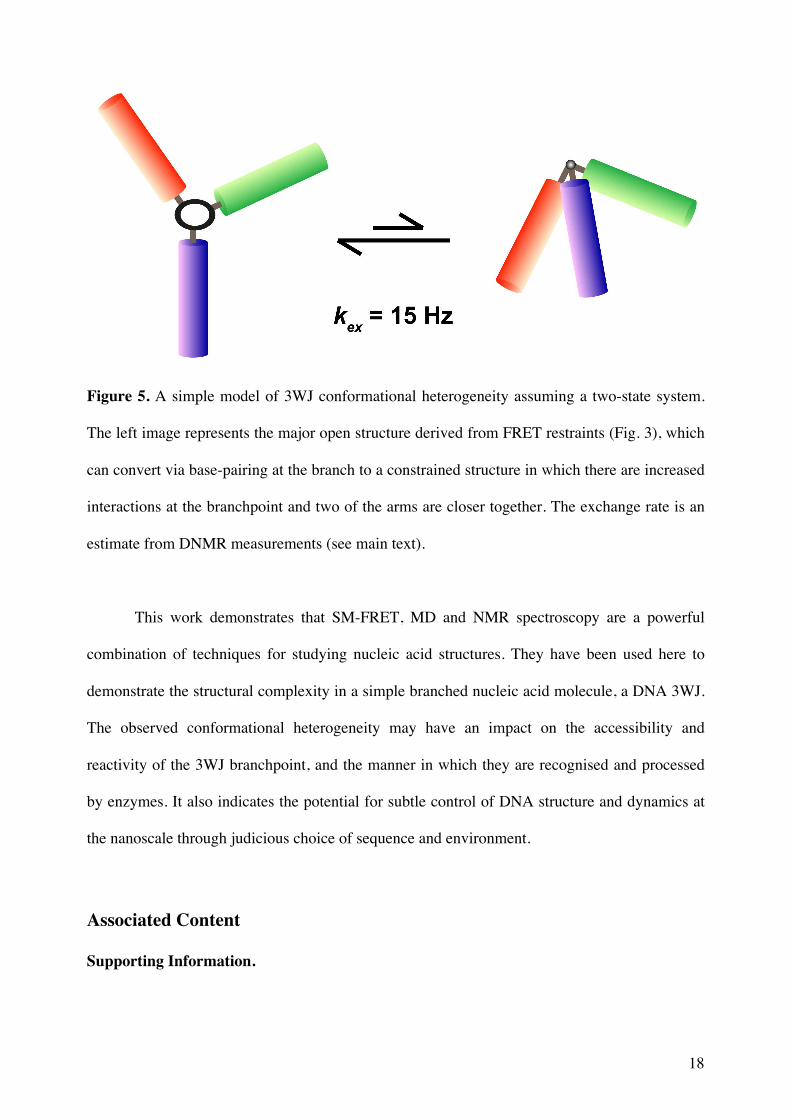
Figure 5. A simple model of 3WJ conformational heterogeneity assuming a two-state system.
The left image represents the major open structure derived from FRET restraints (Fig. 3), which
can convert via base-pairing at the branch to a constrained structure in which there are increased
interactions at the branchpoint and two of the arms are closer together. The exchange rate is an
estimate from DNMR measurements (see main text).
This work demonstrates that SM-FRET, MD and NMR spectroscopy are a powerful
combination of techniques for studying nucleic acid structures. They have been used here to
demonstrate the structural complexity in a simple branched nucleic acid molecule, a DNA 3WJ.
The observed conformational heterogeneity may have an impact on the accessibility and
reactivity of the 3WJ branchpoint, and the manner in which they are recognised and processed
by enzymes. It also indicates the potential for subtle control of DNA structure and dynamics at
the nanoscale through judicious choice of sequence and environment.
Associated Content
Supporting Information.

19
Single-molecule FRET plots for 3WJa and 3WJb; TCSPC data for 3WJb; overlaid molecular
models of the global structure of 3WJa and 3WJb in 0 mM Mg2+ buffer; 1D 19F NMR spectra of
a GC rich 3WJ in D2O from 12-40 °C, ssDNA in H2O from 21-30 °C and dsDNA in H2O from
12-38 °C; sub-ensemble analysis of 3WJb FRET data; and DRMSD to the FRET-based
restraints in 3WJb
AUTHOR INFORMATION
Corresponding Author
Funding
This work was supported by EPSRC grant EP/L027003/1 (MM) and BBSRC grant
BB/G00269X/1 (TS) and by a CONACyT scholarship (L.E.B.J.).
Notes
The authors declare no competing financial interests.
References
1. Lilley, D. M. J. (2000) Structures of helical junctions in nucleic acids, Q. Rev. Biophys. 33, 109-159.
2. Atkinson, J., and McGlynn, P. (2009) Replication fork reversal and the maintenance of genome stability, Nucleic Acids Res. 37, 3475-3492.
3. Seeman, N. C. (2010) Nanomaterials based on DNA, In Annual Review of Biochemistry, Vol
79, pp 65-87, Annual Reviews, Palo Alto. 4. Roy, R., Hohng, S., and Ha, T. (2008) A practical guide to single-molecule FRET, Nat.
Methods 5, 507-516. 5. Sabir, T., Toulmin, A., Ma, L., Jones, A. C., McGlynn, P., Schroeder, G. F., and Magennis, S.
W. (2012) Branchpoint Expansion in a Fully Complementary Three-Way DNA Junction, J. Am. Chem. Soc. 134, 6280-6285.
20
6. Young, R. M., Singh, A. P. N., Thazhathveetil, A. K., Cho, V. Y., Zhang, Y. Q., Renaud, N., Grozema, F. C., Beratan, D. N., Ratner, M. A., Schatz, G. C., Berlin, Y. A., Lewis, F. D., and Wasielewski, M. R. (2015) Charge Transport across DNA-Based Three-Way Junctions, J. Am. Chem. Soc. 137, 5113-5122.
7. Zhang, Y. Q., Young, R. M., Thazhathveetil, A. K., Singh, A. P. N., Liu, C. R., Berlin, Y. A., Grozema, F. C., Lewis, F. D., Ratner, M. A., Renaud, N., Siriwong, K., Voityuk, A. A., Wasielewski, M. R., and Beratan, D. N. (2015) Conformationally Gated Charge Transfer in DNA Three-Way Junctions, J. Phys. Chem. Lett. 6, 2434-2438.
8. Zhang, Y. Q., Zhang, W. B., Liu, C. R., Zhang, P., Balaeff, A., and Beratan, D. N. (2016) DNA charge transport: Moving beyond 1D, Surf. Sci. 652, 33-38.
9. Ma, L., Wu, G. R., Li, Y. F., Qin, P., Meng, L. P., Liu, H. Y., Li, Y. Y., and Diao, A. P. (2015) A reversible metal ion fueled DNA three-way junction molecular device for "turn-on and -off" fluorescence detection of mercury ions (II) and biothiols respectively with high selectivity and sensitivity, Nanoscale 7, 18044-18048.
10. Barros, S. A., and Chenoweth, D. M. (2014) Recognition of Nucleic Acid Junctions Using Triptycene-Based Molecules, Angew. Chem. Int. Ed. 53, 13746-13750.
11. Probst, M., Langenegger, S. M., and Haner, R. (2014) A modular LHC built on the DNA three-way junction, Chem. Commun. 50, 159-161.
12. Su, W., Bagshaw, C. R., and Burley, G. A. (2013) Addressable and unidirectional energy transfer along a DNA three-way junction programmed by pyrrole-imidazole polyamides, Sci. Rep. 3.
13. Kühnemuth, R., and Seidel, C. A. M. (2001) Principles of single molecule multiparameter fluorescence spectroscopy, Single Molecules 2, 251-254.
14. Sabir, T., Schröder, G. F., Toulmin, A., McGlynn, P., and Magennis, S. W. (2011) Global structure of forked DNA in solution revealed by high-resolution single-molecule FRET, J. Am. Chem. Soc. 133, 1188-1191.
15. Harris, R. K., Becker, E. D., De Menezes, S. M. C., Goodfellow, R., and Granger, P. (2001) NMR nomenclature. Nuclear spin properties and conventions for chemical shifts - (IUPAC recommendations 2001), Pure Appl. Chem. 73, 1795-1818.
16. Brunger, A. T. (2007) Version 1.2 of the Crystallography and NMR system, Nat. Protoc. 2, 2728-2733.
17. Woźniak, A. K., Schröder, G. F., Grubmüller, H., Seidel, C. A. M., and Oesterhelt, F. (2008) Single-molecule FRET measures bends and kinks in DNA, Proc. Natl. Acad. Sci. USA 105, 18337-18342.
18. Schröder, G. F., Brunger, A. T., and Levitt, M. (2007) Combining efficient conformational sampling with a deformable elastic network model facilitates structure refinement at low resolution, Structure 15, 1630-1641.
19. Kalinin, S., Peulen, T., Sindbert, S., Rothwell, P. J., Berger, S., Restle, T., Goody, R. S., Gohlke, H., and Seidel, C. A. M. (2012) A toolkit and benchmark study for FRET-restrained high-precision structural modeling, Nat. Methods 9, 1218-U1129.
20. Kalinin, S., Valeri, A., Antonik, M., Felekyan, S., and Seidel, C. A. M. (2010) Detection of structural dynamics by FRET: a photon distribution and fluorescence lifetime analysis of systems with multiple states, J. Phys. Chem. B 114, 7983-7995.
21. Leontis, N. B., Hills, M. T., Piotto, M., Malhotra, A., Nussbaum, J., and Gorenstein, D. G. (1993) A model for the solution structure of a branched, 3-strand DNA complex, J.
Biomol. Struct. Dyn. 11, 215-&. 22. Wu, B., Girard, F., van Buuren, B., Schleucher, J., Tessari, M., and Wijmenga, S. (2004)
Global structure of a DNA three-way junction by solution NMR: towards prediction of 3H fold, Nucleic Acids Res. 32, 3228-3239.
23. Ouporov, I. V., and Leontis, N. B. (1995) Refinement of the solution structure of a branched DNA 3-way junction, Biophys. J. 68, 266-274.

21
24. Seela, F., and Xu, K. (2008) DNA with stable fluorinated dA and dG substitutes: syntheses, base pairing and F-19-NMR spectra of 7-fluoro-7-deaza-2 '-deoxyadenosine and 7-fluoro-7-deaza-2 '-deoxyguanosine, Org. Biomol. Chem. 6, 3552-3560.
25. Puffer, B., Kreutz, C., Rieder, U., Ebert, M.-O., Konrat, R., and Micura, R. (2009) 5-Fluoro pyrimidines: labels to probe DNA and RNA secondary structures by 1D F-19 NMR spectroscopy, Nucleic Acids Res. 37, 7728-7740.
26. Rohonczy, J. (1992) Total lineshape analysis of DNMR spectra by IBM personal computer, Kém. Közl. 74, 161-200.
27. Rohonczy, J., DNMR Lineshape Analysis Software Manual, Version 1.1, Rev. 071103. (2007) DNMR Lineshape Analysis Software Manual, Version 1.1, Rev. 071103, Bruker BioSpin GmbH, Rheinstetten, Germany.
28. Yang, M. S., and Millar, D. P. (1996) Conformational flexibility of three-way DNA junctions containing unpaired nucleotides, Biochemistry 35, 7959-7967.
29. Stühmeier, F., Welch, J. B., Murchie, A. I. H., Lilley, D. M. J., and Clegg, R. M. (1997) Global structure of three-way DNA junctions with and without additional unpaired bases: A fluorescence resonance energy transfer analysis, Biochemistry 36, 13530-13538.
30. Sisamakis, E., Valeri, A., Kalinin, S., Rothwell, P. J., and Seidel, C. A. M. (2010) Accurate single-molecule FRET studies using multiparameter fluorescence detection, Methods
Enzymol. 475, 455-514. 31. Muschielok, A., Andrecka, J., Jawhari, A., Brueckner, F., Cramer, P., and Michaelis, J.
(2008) A nano-positioning system for macromolecular structural analysis, Nat. Methods 5, 965-971.
32. Brunger, A. T., Strop, P., Vrljic, M., Chu, S., and Weninger, K. R. (2011) Three-dimensional molecular modeling with single molecule FRET, J. Struct. Biol. 173, 497-505.
33. Im, K., Jeong, D., Hur, J., Kim, S. J., Hwang, S., Jin, K. S., Park, N., and Kim, K. (2013) Robust analysis of synthetic label-free DNA junctions in solution by X-ray scattering and molecular simulation, Sci. Rep. 3, 3226.
Table of Contents graphic
S1
Supporting Information
Conformational heterogeneity in a fully-complementary DNA three-way
junction with a GC-rich branchpoint
Anita Toulmin, Laura E. Baltierra-Jasso, Michael J. Morten, Tara Sabir,
Peter McGlynn, Gunnar F. Schröder,
Brian O. Smith and Steven W.
Magennis*
*E-mail: [email protected]
S2
SUPPLEMENTARY FIGURES
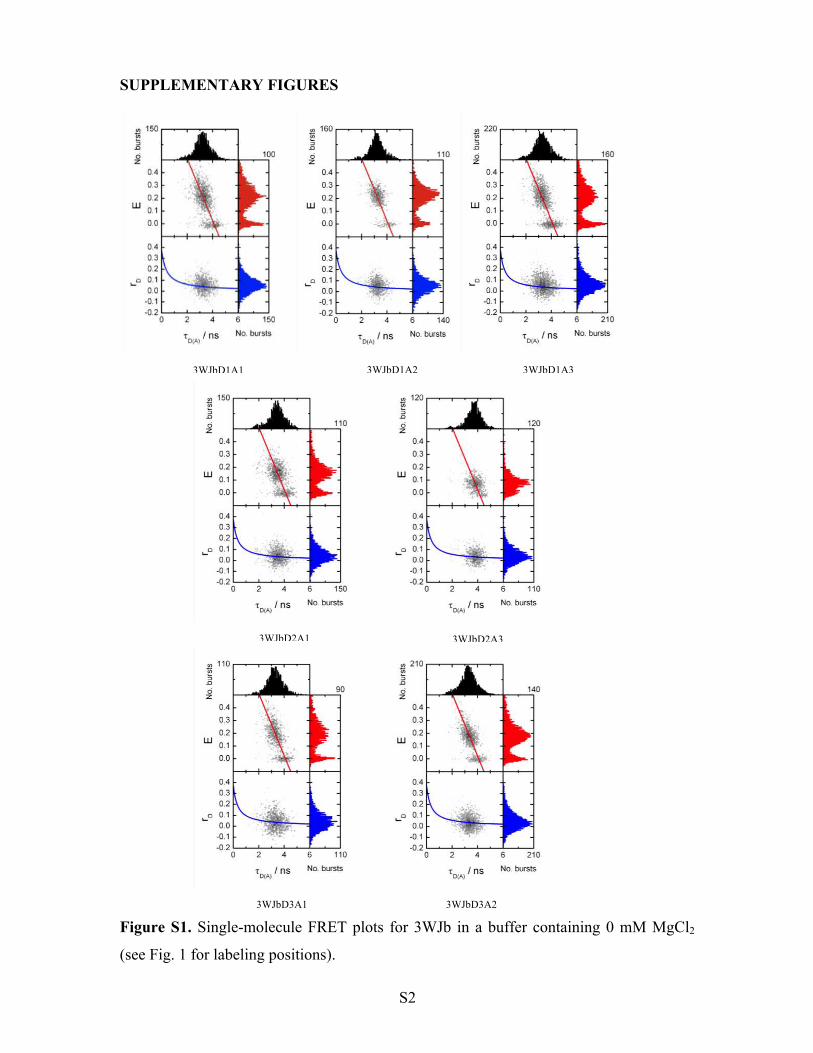
Figure S1. Single-molecule FRET plots for 3WJb in a buffer containing 0 mM MgCl2
(see Fig. 1 for labeling positions).
3WJbD1A1 3WJbD1A2 3WJbD1A3
3WJbD2A1 3WJbD2A3
3WJbD3A1 3WJbD3A2
S3
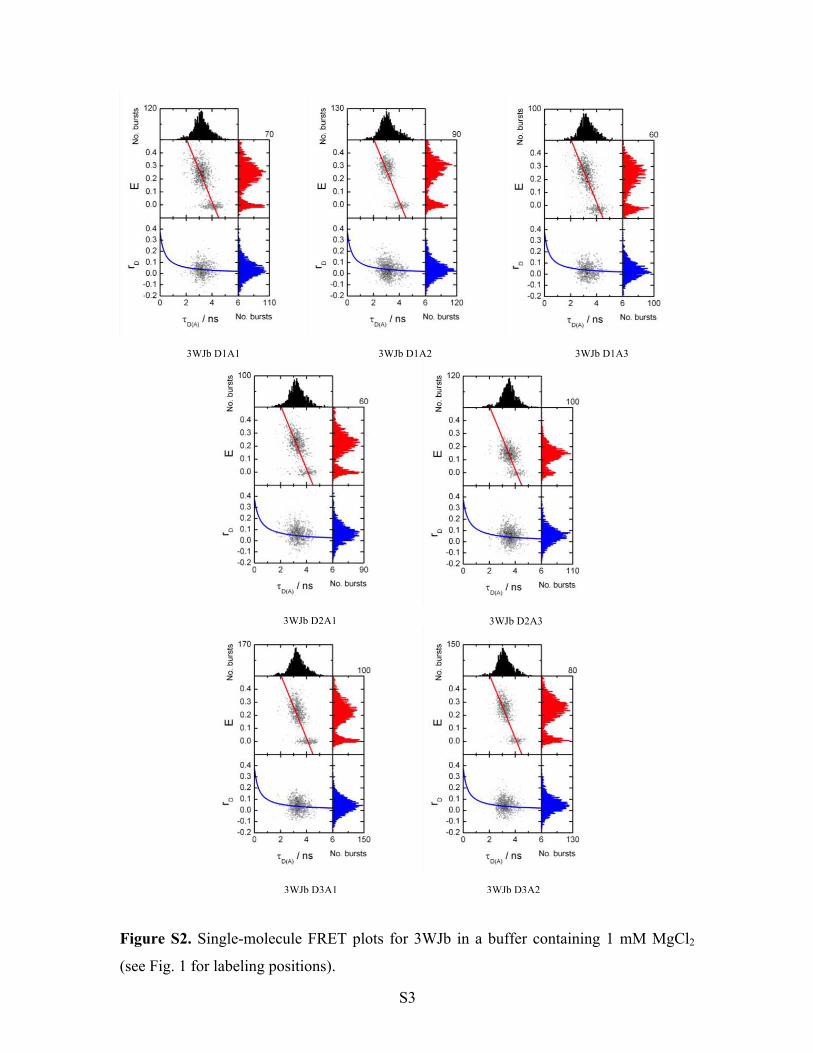
Figure S2. Single-molecule FRET plots for 3WJb in a buffer containing 1 mM MgCl2
(see Fig. 1 for labeling positions).
3WJb D1A1 3WJb D1A2 3WJb D1A3
3WJb D2A1 3WJb D2A3
3WJb D3A1 3WJb D3A2
S4
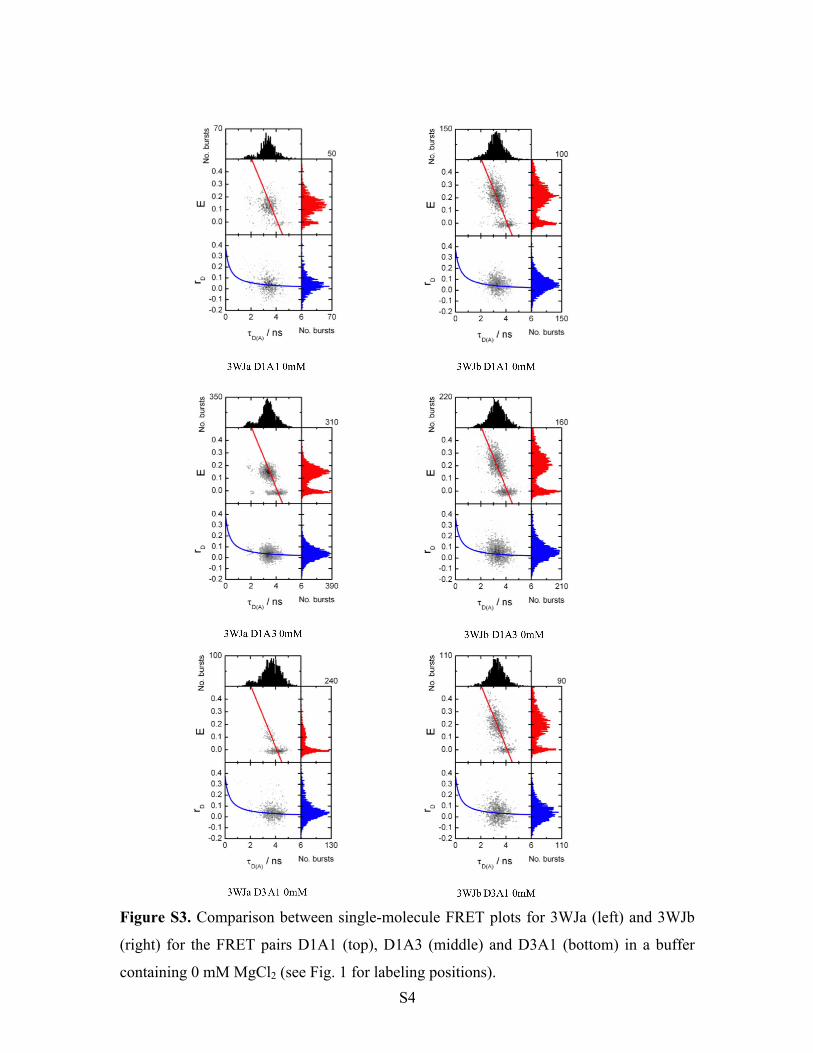
Figure S3. Comparison between single-molecule FRET plots for 3WJa (left) and 3WJb
(right) for the FRET pairs D1A1 (top), D1A3 (middle) and D3A1 (bottom) in a buffer
containing 0 mM MgCl2 (see Fig. 1 for labeling positions).

S5
Figure S4. Comparison between single-molecule FRET plots for 3WJa (left) and 3WJb
(right) for the FRET pairs D1A1 (top), D1A3 (middle) and D3A1 (bottom) in a buffer
containing 1 mM MgCl2 (see Fig. 1 for labeling positions).
S6
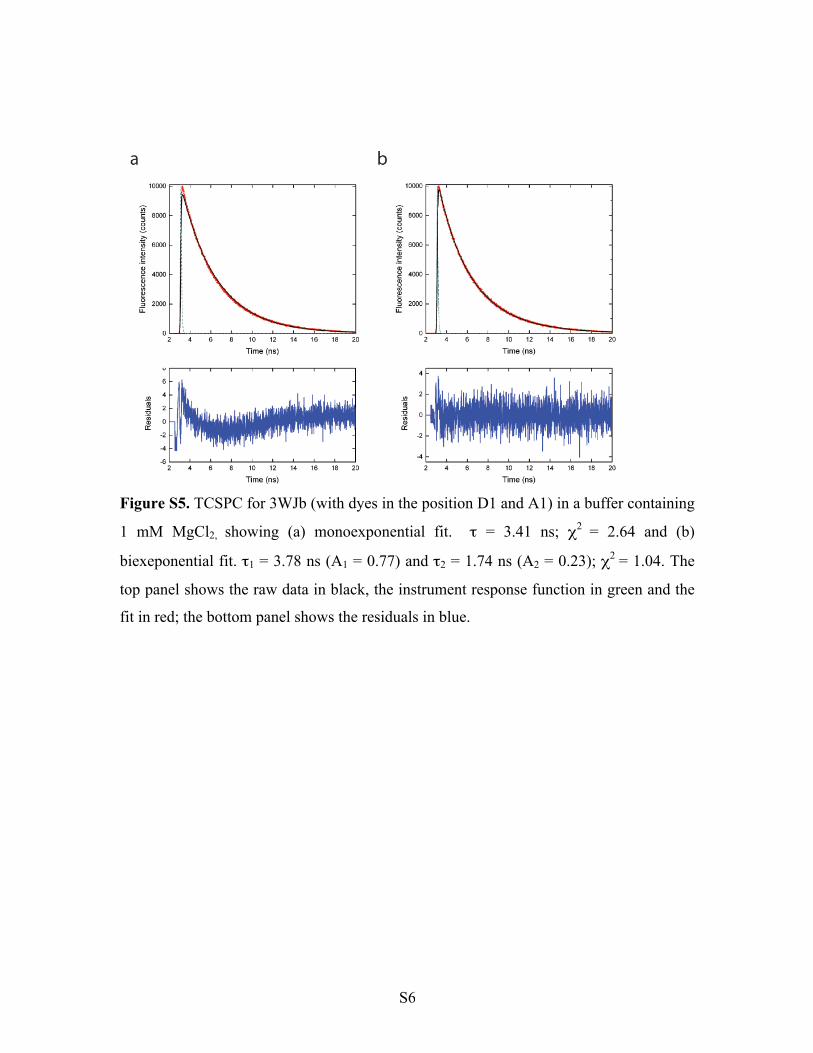
Figure S5. TCSPC for 3WJb (with dyes in the position D1 and A1) in a buffer containing
1 mM MgCl2, showing (a) monoexponential fit. τ = 3.41 ns; χ2 = 2.64 and (b)
biexeponential fit. τ1 = 3.78 ns (A1 = 0.77) and τ2 = 1.74 ns (A2 = 0.23); χ2 = 1.04. The
top panel shows the raw data in black, the instrument response function in green and the
fit in red; the bottom panel shows the residuals in blue.

S7
Fig. S6. Global structure of 3WJb derived from SM-FRET distance restraints for the
major FRET population and MD simulations showing that the global structures for 3WJa
(blue) and the major conformation of 3WJb (green) are similar in a buffer containing 0
mM MgCl2; the five lowest energy conformations are overlaid.
S8
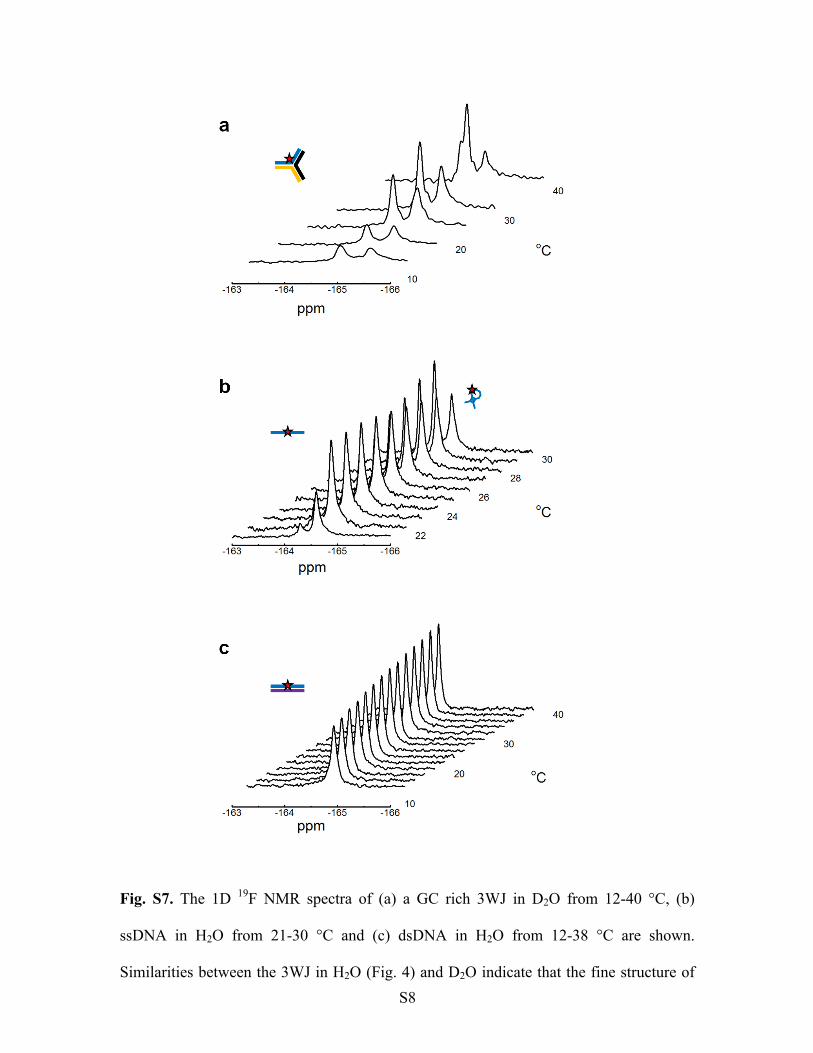
Fig. S7. The 1D 19
F NMR spectra of (a) a GC rich 3WJ in D2O from 12-40 °C, (b)
ssDNA in H2O from 21-30 °C and (c) dsDNA in H2O from 12-38 °C are shown.
Similarities between the 3WJ in H2O (Fig. 4) and D2O indicate that the fine structure of

S9
the peaks seen in H2O are due to the structure of the 3WJ rather than arising from
secondary isotope effects. The ssDNA 19
F NMR spectrum in (b) shows two peaks across
all temperatures that correspond to two distinct ssDNA conformations. The distributions
between these populations shift to favour the more downfield peak at higher
temperatures, indicating that this chemical shift originates from a ssDNA conformation
that has no defined secondary structure.

S10
Supplementary Tables
Table S1. Sub-ensemble analysis of MFD data for 3WJb in buffer containing 0 mM
MgCl2. The whole FRET population was analyzed.
FRET pair τ 1 / ns A1 τ 2 / ns A2 Fit to peak / ns*
DlA1 (0mM) 1.93 0.23 3.24 0.77 3.20
D1A3 (0mM) 2.23 0.34 3.26 0.66 3.13
D3A1 (0mM) 1.96 0.17 3.27 0.83 3.25
* Single Gaussian fit to a smaller sub-ensemble region from MFD data in Fig. S1
centered on the FRET maximum (the selected region of 0.7 ns vs. 0.07 E).
Table S2. DRMSD to the FRET based distance restraints for the calculated 3WJb
structures with different branchpoint base pairing restraints. The mean DRMSD and
standard deviations for each ensemble of 5 lowest energy structures to the FRET based
distance restraints are shown.
Ensemble DRMSD(SD) in 0 mM Mg2+
(Å)
DRMSD(SD) in 1 mM Mg2+
(Å)
0-free 1.27 (0.02) 0.94 (0.02)
1-free 0.74 (0.02) 0.54 (0.04)
2-free 0.36 (0.05) 0.51 (0.01)
3-free 0.47 (0.02) 0.21 (0.03)