Conformational and Spectroscopic Behaviors of 2,4-xylyl isothiocyanate
Upload
khangminh22Category
view
1download
0
Exploring Conformational Dynamics
of Flavoenzymes
with Flavin Fluorescence Relaxation Spectroscopy

Promotoren: Prof.dr. A.J.W.G. Visserhoogleraar Biologische MicrospectroscopieVrije Universiteit Amsterdam,universitair hoofddocentLaboratorium voor BiochemieWageningen Universiteit
Prof.dr. N.C.M. Laanevoormalig hoogleraar BiochemieWageningen Universiteit
Promotiecommissie: Prof.dr.ir. P.I.H. Bastiaens, European Molecular BiologyLaboratory, Heidelberg, Duitsland
Prof.dr. H.J.C. Berendsen, Rijksuniversiteit Groningen
Dr. W.J.H. van Berkel, Wageningen Universiteit
Prof.dr. M.A. Cohen Stuart, Wageningen Universiteit

Exploring Conformational Dynamics
of Flavoenzymes
with Flavin Fluorescence Relaxation Spectroscopy
Petra A.W. van den Berg
Proefschriftter verkrijging van de graad van doctor
op gezag van de rector magnificusvan Wageningen Universiteit
Prof.dr.ir. L. Speelmanin het openbaar te verdedigen
op woensdag 11 september 2002des namiddags om half twee in de Aula

ISBN: 90-5808-694-1

‘Time is just a restriction of physical presence’Richard P. Feynman


Contents
Abbreviations 9
1 Introduction 13
2 Flavin fluorescence dynamics and photoinduced electron transfer inEscherichia coli glutathione reductase
35
3 Time-resolved flavin fluorescence anisotropy in Escherichia coliglutathione reductase: evidence for a novel mechanism offluorescence depolarization
59
4 Exploring the conformational equilibrium of Escherichia colithioredoxin reductase: characterization of two catalytically importantstates by ultrafast flavin fluorescence spectroscopy
81
5 Time-resoled fluorescence analysis of the mobile flavin in p-hydroxy-benzoate hydroxylase
107
6 Dynamic conformations of flavin adenine dinucleotide: simulatedmolecular dynamics of the flavin cofactor related to the time-resolvedfluorescence characteristics
123
Appendix 6-I: Force field parameters of FAD 152
7 Fluorescence correlation spectroscopy of flavins and flavoenzymes:photochemical and photophysical aspects
159
8 Summarizing discussion 173
9 Bibliography 185
Nederlandse samenvatting 207
Curriculum vitae 217
Publicaties 219
Nawoord 221


Abbreviations
AAD+ 3-aminopyridine adenine dinucleotide
AADP+ 3-aminopyridine adenine dinucleotide phosphate
AMP adenosine monophosphate
ATP adenosine triphosphate
BIFL burst-integrated fluorescence lifetime
CT charge transfer
DAS decay-associated spectra
DTNB 5,5'-dithiobis(2-nitrobenzoic acid)
DTT 1,4-dithiothreitol
EDTA ethylenediaminetetraacetic acid
FAD flavin adenine dinucleotide
FCS fluorescence correlation spectroscopy
FIDA fluorescence intensity distribution analysis
FILDA fluorescence intensity lifetime distribution analysis
FMN riboflavin-5’-monophosphate (flavin mononucleotide)
FNR ferredoxin NADPH-reductase
FWHM full width at half maximum
GFP green fluorescent protein
GR glutathione reductase
GR Y177F glutathione reductase with Tyr 177 mutated to Phe
GR Y177G glutathione reductase with Tyr 177 mutated to Gly
IRF instrumental response function
LipDH lipoamide dehydrogenase
MCA multi channel analyzer
MD molecular dynamics
MEM maximum entropy method

Abbreviations
10
MOPS 3-morpholinopropane sulfonic acid
NAD+ oxidized nicotinamide adenine dinucleotide
NADH reduced nicotinamide adenine dinucleotide
NADP+ oxidized nicotinamide adenine dinucleotide phosphate
NADPH reduced nicotinamide adenine dinucleotide phosphate
OD optical density
2'P-5'ADP-ribose adenosine 2'-monophosphate 5'-diphosphate β-5'-ribosyl ester
PHBH p-hydroxybenzoate hydroxylase
PHBH Y222A p-hydroxybenzoate hydroxylase with Tyr 222 mutated to Ala
PHBH Y222V p-hydroxybenzoate hydroxylase with Tyr 222 mutated to Val
PMA phenylmercuric acetate
p-OHB 4-hydroxybenzoate
PPPM particle-particle particle-mesh
RMSD root-mean-square difference
SHE standard hydrogen electrode
SMD single-molecule detection
spFRET single-pair fluorescence resonance energy transfer
TCSPC time-correlated single-photon counting
TRIS 2-amino-2-(hydroxymethyl)-1,3-propanediol
TrxR thioredoxin reductase
TrxR C138S thioredoxin reductase with Cys 138 mutated to Ser
TrxR C138S-PMA thioredoxin reductase C138S treated with phenylmercuric acetate
TrxR wt-PMA wild-type thioredoxin reductase reduced with NADPH andtreated with phenylmercuric acetate and reoxidized
v/v% volume percentage
w/w% weight percentage
wt wild-type


1 Introduction
Parts of this Chapter have been published in:van den Berg, P.A.W., and A.J.W.G. Visser. 2001. In: B. Valeur & J.C. Brochon, (eds.),
New trends in fluorescence spectroscopy. Applications to chemical and life sciences,Springer, Berlin, pp. 457-485.
1.1 The intrinsic flexibility of proteins
In essence, life is based on the continuous action of a variety of proteinscontrolling (intracellular) chemical reactions. These proteins, better known as enzymes,act as biocatalysts to speed up chemical reactions which in most cases would not -or onlyvery slowly- occur spontaneously in nature. In the field of biochemistry, the progress ofsuch an enzymatic reaction is described by the transition-state theory in terms of freesubstrate, protein-bound substrate, a transition state, protein-bound product and freeproduct (Jencks, 1975; Kraut, 1988). Although the three-dimensional structure of theenzyme itself is not altered by the overall biochemical reaction, the conformation of theenzyme may be temporarily affected during part of the reaction pathway, e.g., by bindingof the substrate ('induced fit'). The transition-state theory, however, neglects the existenceof conformational dynamics of the enzyme molecules that may be involved in catalysis.
Since the mid-1970s, many experimental studies have suggested the existence of awhole landscape of conformational (sub)states within the protein native state, amongwhich transitions can occur through activated dynamics of the polypeptide chain (Karplus& McCammon, 1983; Frauenfelder et al., 1986, 1988, 1990, 1991). In this concept,conformational states are defined as regions in the configurational space surroundinglocal potential energy minima, each separated by potential energy barriers. In principle,these activation energies can vary from practically zero to values in the order of 100kJ/mol. An interesting point of this model is that protein substates that are nearlyisoenergetic may significantly vary in other properties such as substrate-binding constantsor catalytic rate constants. Conformational transitions of enzymes from (sub)states lessefficient in catalysis (at that particular point in the reaction pathway) to 'more efficient'substates can thus be regarded as 'functionally important motions'.
Dynamic processes in proteins occur on a wide range of time scales. Distinctionhas to be made, however, between vibrational motions (within a single conformational
Chapter 1
14
(sub)state) and motions that are actually related to a conformational transition.Vibrational dynamics are characterized by a spectrum of frequencies ranging from
1014
s-1
(Krimm & Bandekar, 1986) to 1010
s-1
(Gõ et al., 1983; Brooks & Karplus, 1983).Modes in the high-frequency range comprise mainly the stretching and bending of bonds,whereas those in the low-frequency range encompass mainly the collective vibrationaltorsional motions in dihedral angles about the bonds. Conformational transition dynamicsare characterized by a spectrum of relaxation times. Under physiological conditions, this
spectrum of relaxation times ranges from 10-11
s (local side chain rotations or hydrogen-bond rearrangements on the protein exterior) to hours or even years (Kurzyñski, 1998a).
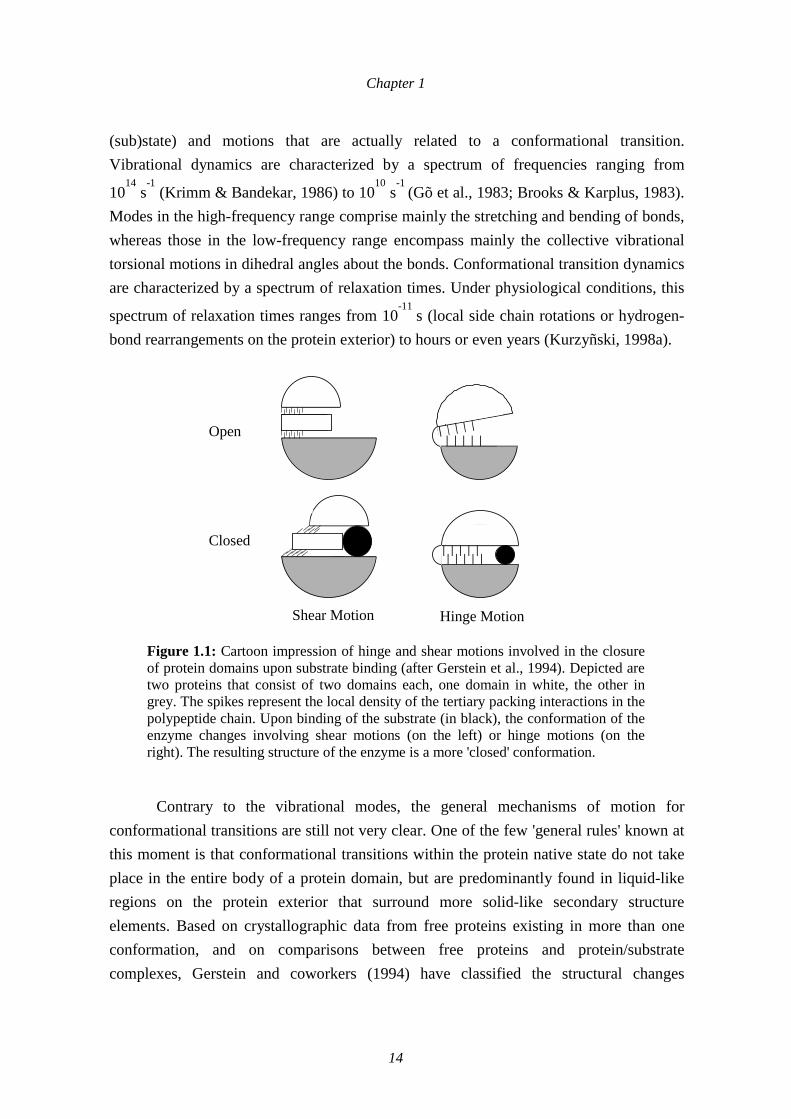
Figure 1.1: Cartoon impression of hinge and shear motions involved in the closureof protein domains upon substrate binding (after Gerstein et al., 1994). Depicted aretwo proteins that consist of two domains each, one domain in white, the other ingrey. The spikes represent the local density of the tertiary packing interactions in thepolypeptide chain. Upon binding of the substrate (in black), the conformation of theenzyme changes involving shear motions (on the left) or hinge motions (on theright). The resulting structure of the enzyme is a more 'closed' conformation.
Contrary to the vibrational modes, the general mechanisms of motion forconformational transitions are still not very clear. One of the few 'general rules' known atthis moment is that conformational transitions within the protein native state do not takeplace in the entire body of a protein domain, but are predominantly found in liquid-likeregions on the protein exterior that surround more solid-like secondary structureelements. Based on crystallographic data from free proteins existing in more than oneconformation, and on comparisons between free proteins and protein/substratecomplexes, Gerstein and coworkers (1994) have classified the structural changes
Open
Closed
Shear Motion Hinge Motion

Introduction
15
involved in conformational transitions into basically two types; hinge motions and shearmotions (Fig. 1.1). Hinge motions occur in strands as well as in β-sheets and α-helicesthat are not constrained by tertiary packing interactions. Shear motions are found in moreclosely packed segments of the polypeptide chain. Whereas hinge motions can generaterather large changes in the three-dimensional structure of the protein, shear motionsgenerally result in small structural changes only. By combination of the hinge and shearmechanisms, a multitude of different kinds of motions can be described. The principle ofhinge and shear motions was found to apply to both large interdomain motions ofproteins, as well as to motions of small protein fragments such as individual loops or α-helices. Gerstein et al. (1994) noted that proteins that have a predominantly hingeddomain motion usually possess two domains connected by linking regions that arerelatively unconstrained by packing. Proteins with two crystal conformations which showsuch a hinge motion are, e.g., lactoferrin (Anderson et al., 1990; Gerstein et al., 1993a),adenylate kinase (Schulz et al., 1990; Gerstein et al., 1993b) and glutamatedehydrogenase (Stillman et al., 1993). As with hinge motions, proteins with shearmotions also tend to have specific architectural features. One example is a layeredstructure in which one layer can slide over another. Although shear motions have beenfound for many different interfaces, a characteristic feature is a helix-helix interface inwhich the helices are crossed (interhelical angle between 60° and 90°). Well-knownexamples, for which two different conformations were found that can interconvert mainlyvia shear motions, are the enzymes citrate synthase (Remington et al., 1982; Lesk &Chothia, 1984), and alcohol dehydrogenase (Eklund et al., 1981; Colonna-Cesari et al.,1986).
Another general feature of conformational transitions is the impact of substratebinding: in many enzymes, the substrate-binding site is located at the interface ofdifferent domains. When the binding site is easily accessible for the substrate in solution-and in many cases it is-, the enzyme can be regarded as having an 'open' conformation.Often, the protein domains can close around such a binding site. In general, substratebinding stabilizes a 'closed' conformation of the enzyme. The opposite is true for enzymesin which the substrate-binding site is shielded from the solvent by part of the protein, forinstance via a loop region. The occurrence of thermal fluctuations, protein-proteininteractions, or the interaction with a second substrate are then required to 'open up' thisconformation so that the binding site becomes accessible to the substrate. Contrary to theclosed state, which usually yields a single crystal structure conformation, structural dataindicate that the open state can consist of a range of different open conformations. Forinstance, X-ray crystallographic studies revealed more than one open conformation for

Chapter 1
16
mutants of T4 lysozyme (Faber & Matthews, 1990; Dixon et al., 1992) and theleucine/isoleucine/valine-binding protein (Sharff et al., 1992). However, care should beexercised not to cling to the idea of 'open' and 'closed' conformations as single, discrete,rigid conformations: many other studies confirm the continuously dynamic character ofthe enzyme in both closed and open state, which is invisible with crystallography due tothe crystal-packing forces. The evidence presently available suggests that the open andclosed states of enzymes only differ slightly in energy; at room temperature they will bein dynamic equilibrium (Gerstein et al., 1994, and references therein).
The current models for describing conformational dynamics can be divided intotwo classes: the 'protein glass' and the 'protein machine' (Fig. 1.2; for a review, seeKurzyñski, 1998a). Both classes have in common that the spectrum of relaxation timesdescribing conformational transitions seems to be quasi-continuous in the range from10-11
s to 10-7 s. In the 'protein glass' model, the spectral density of relaxation times is
assumed to vary according to a power law, which causes the dynamics to be alike in alltime scales. This kind of time scaling can arise from a hierarchy of potential barriers
Figure 1.2: Cartoon representation of a cross-section of a protein domain. Dark greyregions represent the solid-like secondary structure elements (α-helices or β-sheets),which are surrounded by more flexible, liquid-like regions. The catalytic centre-usually located at two or more (spatially) neighbouring solid-like elements- isdepicted in black. In models of the protein machine type, the dynamics ofconformational transitions are treated as quasi-continuous diffusive motions of solid-like elements relative to each other. In models of the protein glass type, the dynamicsof conformational transitions are considered as diffusive motions of structuraldefects through the liquid-like regions. On the level of a complete enzyme, the solid-like elements may represent protein domains and the active site may be formed bystructural elements from different protein domains (Kurzyñski, 1998a).
Introduction
17
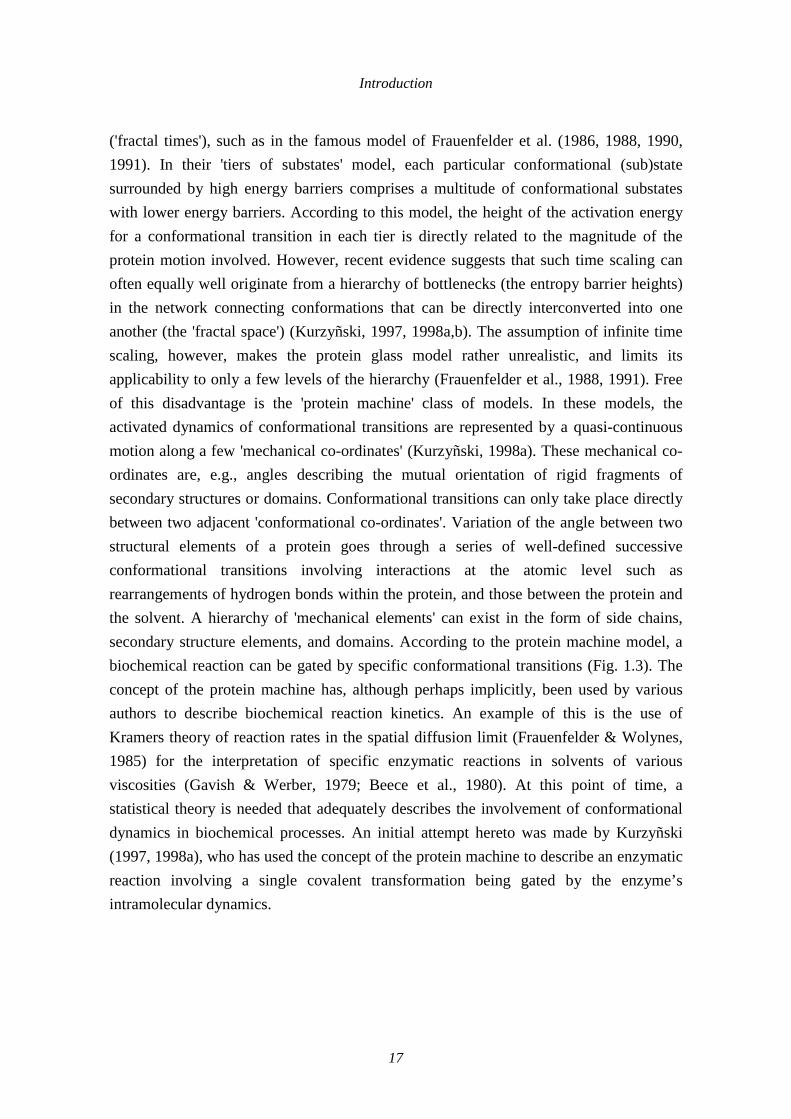
('fractal times'), such as in the famous model of Frauenfelder et al. (1986, 1988, 1990,1991). In their 'tiers of substates' model, each particular conformational (sub)statesurrounded by high energy barriers comprises a multitude of conformational substateswith lower energy barriers. According to this model, the height of the activation energyfor a conformational transition in each tier is directly related to the magnitude of theprotein motion involved. However, recent evidence suggests that such time scaling canoften equally well originate from a hierarchy of bottlenecks (the entropy barrier heights)in the network connecting conformations that can be directly interconverted into oneanother (the 'fractal space') (Kurzyñski, 1997, 1998a,b). The assumption of infinite timescaling, however, makes the protein glass model rather unrealistic, and limits itsapplicability to only a few levels of the hierarchy (Frauenfelder et al., 1988, 1991). Freeof this disadvantage is the 'protein machine' class of models. In these models, theactivated dynamics of conformational transitions are represented by a quasi-continuousmotion along a few 'mechanical co-ordinates' (Kurzyñski, 1998a). These mechanical co-ordinates are, e.g., angles describing the mutual orientation of rigid fragments ofsecondary structures or domains. Conformational transitions can only take place directlybetween two adjacent 'conformational co-ordinates'. Variation of the angle between twostructural elements of a protein goes through a series of well-defined successiveconformational transitions involving interactions at the atomic level such asrearrangements of hydrogen bonds within the protein, and those between the protein andthe solvent. A hierarchy of 'mechanical elements' can exist in the form of side chains,secondary structure elements, and domains. According to the protein machine model, abiochemical reaction can be gated by specific conformational transitions (Fig. 1.3). Theconcept of the protein machine has, although perhaps implicitly, been used by variousauthors to describe biochemical reaction kinetics. An example of this is the use ofKramers theory of reaction rates in the spatial diffusion limit (Frauenfelder & Wolynes,1985) for the interpretation of specific enzymatic reactions in solvents of variousviscosities (Gavish & Werber, 1979; Beece et al., 1980). At this point of time, astatistical theory is needed that adequately describes the involvement of conformationaldynamics in biochemical processes. An initial attempt hereto was made by Kurzyñski(1997, 1998a), who has used the concept of the protein machine to describe an enzymaticreaction involving a single covalent transformation being gated by the enzyme’sintramolecular dynamics.

Chapter 1
18
Figure 1.3: Protein machine model of a chemical reaction gated by the transitionbetween two conformational states of an enzyme (Kurzyñski, 1998a). In the upperpanel, the contour plot describes the potential profile as a function of the reaction co-ordinate q and the conformational co-ordinate x. Along the reaction co-ordinate, twominima, ES and EP, are separated by a high potential barrier. Transitions arepossible along the conformational co-ordinate, going from ES to ES' (opening thegate), through the much lower barrier from ES' to EP' (the gate) and, finally, alongthe conformational co-ordinate from EP' to EP (closing the gate). In the secondpanel, a one-dimensional profile of the reaction is presented. In the lower panel, theone-dimensional reaction profile is reduced to the minimum, replacing the chemicalreaction step by a finite transition probability through the border. This potentialprofile serves as a basis for the protein machine calculations by Kurzyñski (1998a).
ES
ES’
EP
EP’
EP’
EP
ES’
ES

Introduction
19
1.2 Exploring protein dynamics with intrinsic protein fluorescence
In experiments, the dynamic nature of proteins has been revealed with a variety oftechniques including NMR spectroscopy, X-ray diffraction, inelastic neutron scattering,Mössbauer spectroscopy, patch clamp techniques, molecular dynamics simulations andtime-resolved fluorescence spectroscopy, thereby covering different time scales (Fig.1.4). In fluorescence methodology, the most common approach for studying proteindynamics has been to use the intrinsic fluorescence of tryptophan residues (Beechem &Brand, 1985; Eftink, 1991; Demchenko, 1992; Millar, 1996; Lakowicz, 1999). Althoughtryptophan fluorescence experiments have provided detailed insight into many proteinsystems, the applicability of the technique is strongly dependent on the number andposition of the tryptophan residues, as well as on the specific research objective. Reasonfor this is the well-known complexity of the photophysical properties of the indole ring.Because of the degeneracy of energy levels in the excited state (1LA and 1LB), the
observed nonexponential fluorescence decays are rather rule than exception, even inproteins that contain only one tryptophan in a rigid protein environment. In addition, fastdepolarization of the fluorescence originating from interconversion between these twostates complicates the interpretation of time-resolved fluorescence anisotropymeasurements (Ruggiero et al., 1990). In particular for the investigation of dynamicevents such as protein motions, these fluorescence characteristics of the indole moietyprove a serious obstacle.
Figure 1.4: Overview of the time window of various experimental techniques forinvestigating conformational transitions. The boundary of 10-11 s on the left siderepresents local conformational transitions on the protein surface or liquid-likeregions. The boundary of 105 s on the right side represents the spontaneousunfolding of proteins under physiological conditions.
NMR: relaxation param., lineshape analysis, chem. exchange
patch clamp technique
fluorescence depolarization & quenching
Mössbauer spectroscopy
chemical kinetics
hydrogen exchangenumerical simulations
10-11 10-7 10-3 10 105 s

Chapter 1
20
A possible way to overcome these problems is to attach an external fluorescencelabel such as an artificial dye to the protein, or to fuse the protein of interest with thenatural fluorescent Green Fluorescent Protein (GFP) (Tsien, 1998). Fluorescenceresonance energy transfer measurements on biomacromolecules which contain both an(artificial) energy donating and an energy accepting moiety are now routinely performedto gain information on the geometric and dynamic properties of proteins, proteincomplexes, nucleic acids or mixtures of them (Clegg, 1996). For the investigation oflarge overall protein motions, fluorescence labelling has proven to be particularlysuitable. However, for the study of more subtle processes such as protein dynamics in theactive centre of enzymes, where protein packing obstructs the use of external labels, thenatural fluorescence of the protein is still the most appropriate tool.
1.3 Using the natural fluorescence of the flavin cofactor
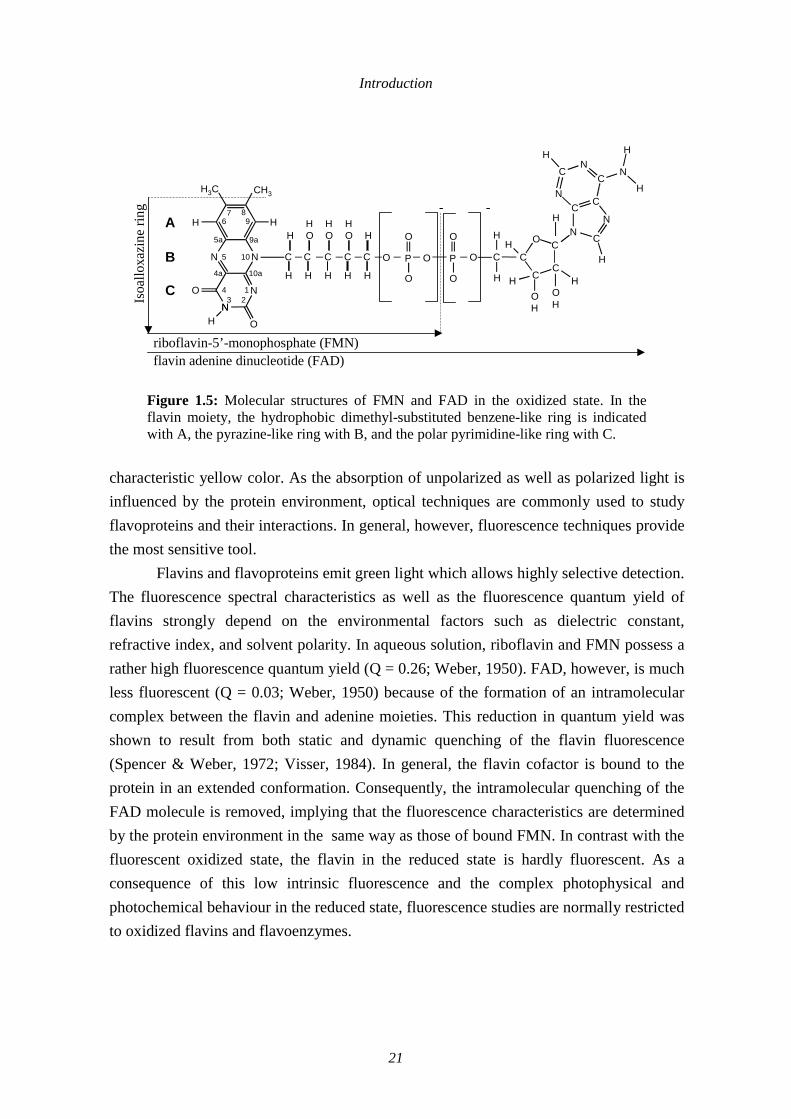
A particularly interesting class of enzymes for investigating the role ofconformational dynamics in catalysis, are the flavoenzymes. Flavoenzymes are involvedin numerous redox processes in metabolic oxidation-reduction, photobiology andbiological electron transport (for an overview, see Müller, 1991). Members of thiswidespread class of enzymes contain as redox-active prosthetic group the naturallyfluorescent flavin cofactor. Flavin cofactors are derivatives of riboflavin, a compoundbetter known as vitamin B2. Whereas bacteria and plants are able to synthesize vitaminB2, higher organisms are dependent on the uptake of riboflavin via nourishment. Theenzymes flavokinase and FAD synthase can subsequently convert riboflavin into flavinmononucleotide (FMN) and flavin adenine dinucleotide (FAD), the cofactors commonlyfound in flavoproteins (Fig. 1.5).
Both from the biochemical and the biophysical point of view, the essential part ofthe flavin cofactor is the isoalloxazine ring (Fig. 1.5). The cofactor is able to act as anredox-mediator through this three-membered ring system, which can exist in the oxidizedflavoquinone, one-electron reduced flavo-semiquinone, and two-electron reduced flavo-1,5-dihydroquinone states. In general, the atom N5 -and to a lesser extent C4a- of theisoalloxazine ring acts as electrophilic site during catalysis. The redox properties of theflavin are subtly modulated by the protein environment, which makes it a very versatilemolecule that is involved in a wide range of enzymatic reactions. The photophysicalproperties of the isoalloxazine ring have made the chromophore a rewarding tool for thespectrum of optical spectroscopic techniques currently available. Owing to the relativelyhigh extinction coefficient in the blue spectral region, oxidized flavins have a
Introduction
characinflueflavopthe mo
The flflavinrefracratherless flcomplshown(SpenproteiFAD mby thefluoreconseqphotocto oxid
N
O
O
N
H3C
N
N
C C C C C O
HH
H HHH
H
H
H
HA
B
C
-
Isoa
lloxa
zine
ring
riboflavin-5’-monophosphate (FMN)flavin adenine dinucleotide (FAD)
HO
HO
HO
-
OOP
O
O
C
CC
CO
H
NC
NC C
C
N
CN
N
H
H
H
H
H
H
H
C
H
H
OH
OH
P
O
O
5a 9a
67 8
9
4a 10a
5 10
N
12
43
CH3
Figure 1.5: Molecular structures of FMN and FAD in the oxidized state. In theflavin moiety, the hydrophobic dimethyl-substituted benzene-like ring is indicatedwith A, the pyrazine-like ring with B, and the polar pyrimidine-like ring with C.
21
teristic yellow color. As the absorption of unpolarized as well as polarized light isnced by the protein environment, optical techniques are commonly used to studyroteins and their interactions. In general, however, fluorescence techniques providest sensitive tool.Flavins and flavoproteins emit green light which allows highly selective detection.
uorescence spectral characteristics as well as the fluorescence quantum yield ofs strongly depend on the environmental factors such as dielectric constant,tive index, and solvent polarity. In aqueous solution, riboflavin and FMN possess a high fluorescence quantum yield (Q = 0.26; Weber, 1950). FAD, however, is muchuorescent (Q = 0.03; Weber, 1950) because of the formation of an intramolecularex between the flavin and adenine moieties. This reduction in quantum yield was to result from both static and dynamic quenching of the flavin fluorescence
cer & Weber, 1972; Visser, 1984). In general, the flavin cofactor is bound to then in an extended conformation. Consequently, the intramolecular quenching of the
olecule is removed, implying that the fluorescence characteristics are determined protein environment in the same way as those of bound FMN. In contrast with thescent oxidized state, the flavin in the reduced state is hardly fluorescent. As auence of this low intrinsic fluorescence and the complex photophysical andhemical behaviour in the reduced state, fluorescence studies are normally restrictedized flavins and flavoenzymes.

Chapter 1
22
The structural, electronic, and photophysical features of the flavin molecule havebeen studied extensively (Platenkamp et al., 1980, 1987; Hall et al., 1987a,b; Heelis,1991; Zheng & Ornstein, 1996). In the oxidized state, the isoalloxazine ring of the flavinis planar, irrespective of its protonation state or hydrogen-bonding environment, due toelectron delocalization among the three rings (Zheng & Ornstein, 1996). High-resolutioncrystal structures of many flavoenzymes in the oxidized state have shown either acompletely planar flavin ring, or one that only slightly deviates from planarity. Ab initiomolecular orbital calculations have revealed a (nearly) planar structure for the flavinsemiquinone radicals as well. In the reduced state, free flavins are most likely bentaround the N5-N10 axis with typical fold angles of ~27°, giving the reduced flavin a'butterfly' shape (Hall et al., 1987a; Zheng & Ornstein, 1996). A recent crystal structureof thioredoxin reductase in the reduced state indeed displayed a bent conformation for the1,5-dihydroflavin (Lennon et al., 1999). The dimethyl-substituted ring (ring A in Fig. 1.5)is relatively electron-rich, while ring B and C of the oxidized flavin are in increasingorder electron deficient, resulting in a permanent ground-state dipole moment of 7.8 D asdepicted in Figure 1.6 (Platenkamp et al., 1980). The direction of the optical transitionmoments from ground state to both the first and the second singlet excited states has beendetermined by Johansson et al. (1979). The angle between the absorption and emissiondipole moment of the first electronic transition is ~16°, as ascertained from thefundamental anisotropy of the flavin. The direction of the emission dipole moment wasdeduced from homoenergy transfer studies (Bastiaens et al., 1992a; Fig. 1.6). Free flavinshave a high triplet quantum yield (~0.6 for FMN, ~0.15 for FAD) and the intrinsic
Figure 1.6: Representation of the 7,8-dimethylisoalloxazine ring with the dipolemoments in ground state (D-S0) and lowest excited triplet state (D-T1), and thedirections of the absorption (µa) and emission (µe) transition moments.
D-S0D-T1 µa
µe
Introduction
23
lifetime of the triplet state of the isoalloxazine ring is rather long (5-50 µs for FMN,Heelis, 1991, and references therein). The transition to the first triplet excited state isaccompanied by a redistribution of charges towards the ring system so that the dipolemoment is reduced to 4.8 D (Platenkamp et al., 1980). Free flavin compounds areinvolved in various photochemical reactions. Well-known examples are the photolysis ofthe ribityl side chain and the photoreduction by electron-donating compounds such asamines and EDTA (for a review, see Heelis, 1991).
1.4 Flavin fluorescence as a probe for flavoprotein dynamics
Owing to their general occurrence and the wide range of biologically importantreactions that they catalyze, flavoenzymes have since long been subject of investigation.Based on the chemical reactivity, and the concomitant differences in the protein structure,flavoenzymes have been grouped in a variety of different flavoenzyme families. Asmentioned above, in nearly all flavoenzymes the FAD cofactor is bound in an extendedconformation. The fluorescence characteristics of protein-bound flavins are thereforedependent on the exact amino acid composition of the direct environment of theisoalloxazine ring as well as its solvent accessibility. The most fluorescent flavoprotein isthe yellow fluorescent protein from bioluminescent bacteria with the exceptionally highfluorescence quantum yield of ~0.6 (Visser et al., 1997). This flavoprotein, however, wasspecially designed for emitting light. The fluorescence quantum yield of theflavoenzymes involved in redox catalysis is considerably lower. With a quantum yield of~0.1, lipoamide dehydrogenase and thioredoxin reductase belong to the most fluorescentflavoenzymes known thus far. In many flavoproteins (e.g., in E. coli glutathionereductase), the flavin fluorescence is so heavily quenched (Q << 0.01) that they weretraditionally regarded as 'nonfluorescent'. However, recent studies with picosecond timeresolution (see also Chapters 2 and 4 of this thesis) have shown that the idea ofnonfluorescent flavoproteins should be abandoned.
An important aspect in studying flavoproteins by fluorescence methods is thebinding of the prosthetic group. In most flavoproteins, the flavin cofactor isnoncovalently bound. In a small number of flavoenzymes the flavin ring is covalentlylinked to a histidine, cysteine or tyrosine of the polypeptide chain (Singer & McIntire,1984; Decker, 1991). Well-known examples of covalent flavoproteins are, for instance,succinate dehydrogenase (Robinson et al., 1994; Krebbs cycle), monoamine oxidase(Zhou et al., 1995; inactivation of neurotransmitters) and vanillyl alcohol oxidase(Mattevi et al., 1997; vanillin production). The dissociability of the flavin cofactor can in
Chapter 1
24
principle seriously hamper fluorescence studies. Fortunately, in quite a lot offlavoproteins -among which are most of the disulfide-oxidoreductases from E. coli- theaffinity for the prosthetic group is quite high with equilibrium dissociation constants inthe (sub)nanomolar range. However, other flavoproteins such as yellow fluorescenceprotein loose their flavin cofactor relatively easily (40 nmol/l < Kd < 1 µmol/l). Although
the presence of free flavin should be avoided in all fluorescence experiments onflavoproteins, extreme care should be exercised in time-resolved fluorescenceinvestigations on conformational dynamics of proteins. For a proper interpretation offluorescence lifetime and anisotropy data in terms of different species or enzymeconformations, the absence of free flavin is essential, especially for enzymes with a lowflavin fluorescence quantum yield.
In addition to suitable characteristics of the chromophore, other prerequisites forinvestigating the role of active-site conformational dynamics in catalysis by fluorescencemethods are the availability of a high-resolution three-dimensional structure of theenzyme, and the availability of detailed information concerning its catalytic mechanism.Since the mid-1980s, crystallographic studies have rapidly increased the number offlavoproteins of which the three-dimensional structure is known in detail. In the sameperiod, the time resolution of fluorescence methods has improved to a level that dynamicevents on the (sub)nanosecond time scale can be detected. Time-resolved fluorescencedecay and anisotropy studies on lipoamide dehydrogenase (Visser et al., 1980; de Kok &Visser, 1987; Bastiaens et al., 1992a,b), NADPH-cytochrome P-450 reductase (Bastiaenset al., 1989), D-amino acid oxidase (Tanaka et al., 1989a,b), human glutathione reductase(Bastiaens et al., 1992b) and flavodoxin (Leenders et al., 1993a,b) have laid a basis forthe relation between flavin fluorescence characteristics and structure-functionrelationships in flavoenzymes. Fluorescence anisotropy analyses have yieldedinformation on energy transfer between flavin cofactors in (homo)dimeric enzymes, localmobility of the isoalloxazine ring, possible dissociation of the flavin cofactor, and –iffluorescence lifetime and molecular mass allowed it- overall protein tumbling (for moredetails, see van den Berg & Visser, 2001). As many flavoenzymes are dimers, tetramersor even octamers, homoenergy transfer between the flavins is often a source offluorescence depolarization to be considered. By calculating the time constant for energytransfer from the inter-flavin distance and orientation of the flavin rings in a high-resolution crystal structure, and testing the temperature invariance of the process,homoenergy transfer can be recognized rather easily (Bastiaens et al., 1992a,b; Visser etal., 1998). Fluorescence decay experiments on flavoproteins have in general yieldedheterogeneous flavin fluorescence decays. In the earliest studies, these have been

Introduction
25
explained in terms of protein dynamics (relaxation processes) and conformationaldifferences, in line with the interpretation of heterogeneous fluorescence quenching intryptophan-containing enzymes: whereas analysis of the fluorescence decay through aquasi-continuous distribution of time constants often resulted in interpretations in termsof relaxational processes, analysis by a sum of exponentials frequently led to thesuggestion of the existence of just as many protein conformational states. For manyprotein systems, either one or both of these explanations may indeed contribute to theheterogeneous fluorescence decays found. However, a theoretical paper of Bajzer andPrendergast (1993) opened up a new way to explain heterogeneous fluorescence decays.
The basic assumption in explaining fluorescence lifetime data in terms ofconformational substates is that in each protein conformation the interactions between thechromophore and its direct environment will result in a single fluorescence lifetime.Bajzer and Prendergast (1993) demonstrated that this assumption is not necessarilycorrect by showing that the nonexponential fluorescence decay of several tryptophan-containing proteins can be explained by energy transfer to different acceptor sites in theprotein, which all contribute with a certain probability to deexcitation of the donor. In thisso-called 'multiple quenching sites' model, the heterogeneity in fluorescence decay canarise from a multiplicity of competing interactions that involve transfer of energy in abroad sense between the light-excited chromophore and different sites in the molecule. Incontrast to the conformationally determined models of quenching, which all assumeenergy transfer via collisional quenching, the model of multiple quenching sites is notdependent on collisions, but includes other deexcitation processes such as fluorescenceresonance energy transfer and electron transfer. A heterogeneous fluorescence decay canthen be observed from a single protein conformation. In the research described in thisthesis, experimental evidence was obtained to support this model for multiexponentialfluorescence quenching.
In practice, it is often difficult to determine whether a heterogeneous fluorescencedecay originates from different protein conformations, relaxation processes, multiplequenching sites, or a combination of these. A major handicap for the interpretation is thatconventional fluorescence methods yield information on an ensemble of molecules, inwhich different quenching mechanisms may determine the fluorescence characteristics ofdifferent individual molecules.

Chapter 1
26
1.5 From ensembles to single molecules
A recent breakthrough for solving such dilemmas has been the development ofexperimental single-molecule (fluorescence) detection techniques. Until the mid-1990s, itwas only possible to perform measurements on ensembles of molecules, so that the dataobtained showed the average properties of the investigated systems. This imposes anintrinsic barrier to studying protein conformational dynamics, where the deviation fromaverage itself is the subject of investigation. Recent progress in the field of opto-electronics has made it possible to detect individual molecules. Single-molecule detection(SMD) allows one to examine the features of individual members of heterogeneouspopulations of molecules. In principle, by registering the physical and chemicalproperties of a large number of single molecules, and by analyzing the time trajectories ofthe observed properties, a full picture of the population including its subpopulations andof distributions of properties can be acquired. Static disorder, which is the intrinsicheterogeneity of a specific property of molecules of the same (genetic) populationirrespective of time, and dynamic disorder, which shows the time-dependent fluctuationsof this property of an individual molecule, can be detected and distinguished. SMD isespecially advantageous for investigating fluctuating systems under equilibriumconditions, but can also provide information on dynamic properties and reactionpathways of molecules in nonequilibrated systems.
Single-molecule experiments make use of various detection methods such aspatch clamp (for a review, see Sakmann & Neher, 1995), atomic force microscopy (Reeset al., 1993; Radmacher et al., 1994), scanning tunneling microscopy (Baro et al., 1985;Binnig et al., 1986), and enzymatic assays of highly diluted systems (Xue & Yeung,1995). Many of the current SMD methods are based on the fluorescence detection ofsingle molecules tagged with fluorescent labels (for reviews, see Weiss, 1999, 2000; Xie& Trautman, 1998; Nie & Zare, 1997). Although a wide range of fluorescence SMDtechniques has been developed for answering specific research questions, thesetechniques are based on similar principles. Upon selecting an extremely small volumeelement (femtoliter) with a focussed laser beam that repetitively excites the moleculewithin the confocal spot, a burst of fluorescence photons from a single molecule can begenerated. For each single molecule, this burst can be analysed for properties such as itsbrightness, duration, repetition frequency ('on' and 'off' times), anisotropy, and spectrum.The different analyses can provide information on a variety of molecular propertiesincluding size, fluorescence lifetime, constants of translational and rotational diffusion,and concentration. In addition, molecular interactions such as binding, co-localization,and even enzymatic turnover can be visualised.

Introduction
27
In the last years, various fluorescence SMD techniques have been developed forfreely diffusing molecules as well as for surface-bound systems. The main advantage ofthe latter approach is the increased time period for which one and the same molecule canbe investigated. Molecules, which are either attached to a surface via a noninvasive linker(Macklin et al., 1996; Ha et al., 1996, 1998; Wennmalm et al., 1997) or entrapped in a gelsystem (Lu et al., 1998), can be spotted with a fluorescence microscope and continuouslyobserved until photobleaching irreversibly destroys the molecules under study. For freelydiffusing molecules, fluorescence correlation spectroscopy (FCS) is an importantfluorescence SMD technique. In FCS, of which the theoretical concept dates back to the1970s (Magde et al., 1972; Elson & Magde, 1974; Ehrenberg & Rigler, 1974), thefluctuations in fluorescence intensity of single fluorophores in time are analyzed via theautocorrelation function (Rigler et al., 1993; Eigen & Rigler, 1994). FCS is particularlysuitable for retrieving information on diffusion properties and concentrations. By therecent development of two-color FCS, this technique is rapidly expanding as a tool formolecular interaction and co-localization studies (Schwille et al., 1997; Kettling et al.,1998)
In 1996, Edman et al. have been the first to report on a conformational transitionat the single-molecule level. Since then, sensitive techniques have been developed tostudy conformational fluctuations of biomolecules free in solution, including kinetics. Avery powerful approach particularly suited for retrieving distance information is single-pair fluorescence resonance energy transfer (spFRET; for excellent overviews, see Weiss,1999, 2000; Deniz et al., 2001). In spFRET, the resonance energy transfer efficiencyfrom the donor label to the acceptor label of a doubly labeled system can be used todistinguish subpopulations with different intramolecular distances or orientations (Denizet al., 1999; Ha et al., 1999). Another promising technique for single-molecule dynamicsis BIFL (Burst-Integrated Fluorescence Lifetime) spectroscopy, which allowssimultaneous registration of fluorescence intensity, lifetime and anisotropy for freelydiffusing molecules in a multi-dimensional way (Eggeling et al., 1998; Fries et al., 1998;Schaffer et al., 1999). This method combines the advantages of time-resolved andfluorescence correlation spectroscopy. Molecular conformations can then be monitoreddirectly through the fluorescence lifetimes, and concomitantly a statistical analysis of thekinetic and physical properties of the fluorophore can be performed. Similar histogram-based fluorescence fluctuation techniques based on the fluorescence intensity distributionanalysis method (FIDA) are now developed for addressing fluorescence lifetimes(FILDA) and anisotropy (2D-FIDA) at the single molecule level (Kask et al., 2002). Anexciting current development is the use of fluorescence polarization for detecting

Chapter 1
28
dynamic changes in orientation. Essential for single molecule fluorescence polarizationanisotropy (smFPA) is the rigid tethering of the fluorophore so that changes in theorientation of the emission dipole moment directly correspond to angular motions of thebiological system. Recent developments in ratiometric-diffusion methods, particularlysmFPA and spFRET, have been reviewed by Weiss (2000) and Deniz et al. (2001).
The development of SMD techniques opens up new ways for exploring the active-site dynamics of flavoenzymes through natural flavin fluorescence. Important in thisrespect is complete understanding of the fluorescence characteristics of the chromophoreunder the conditions used in single molecule spectroscopy. For the interpretation offluorescence characteristics in terms of conformational dynamics, profound insight in themolecular dynamics and transition pathways is required. Molecular dynamics simulationscan yield such information at the single-molecule level.
1.6 Functionally important motions in flavoenzymes; an introduction toglutathione reductase, thioredoxin reductase and p-hydroxybenzoatehydroxylase
For investigating functionally important motions in flavoenzymes, one has tomake a selection from the wealth of enzymes for which detailed structural and kineticinformation is available. An evident criterion for making this choice are indications thatthese motions may indeed play a role. Such indications often arise from the three-dimensional structure of the enzyme, e.g., when crystal structure data show more thanone conformation, or when the resolved structure does not provide a clear pathway for thecatalytic reaction. Kinetic and spectroscopic studies, however, can yield such signs aswell. Various flavoenzymes from different subclasses have been shown to satisfy thiscriterion. For research described in this thesis, three flavoenzymes were selected forwhich crystal structure data have suggested different types of functionally importantmotions; glutathione reductase, thioredoxin reductase, and p-hydroxybenzoatehydroxylase.
Glutathione reductase (GR) is an example of a flavoenzyme in which a smallmotion of an amino acid side chain plays an evident role in catalysis. The enzyme is oneof the best-studied flavoproteins arising from its crucial function in a variety of cellularprocesses; by catalyzing the NADPH-dependent reduction of oxidized glutathione(GSSG), the enzyme is responsible for maintaining a high GSH over GSSG ratio in cells(for a review, see Williams, 1992). Glutathione reductase belongs to the pyridinenucleotide disulfide-oxidoreductase family, which includes, among others, thioredoxin

Introduction
29
reductase (vide infra) and lipoamide dehydrogenase. The enzyme is a homodimer andcontains one redox-active disulfide bridge and one molecule of FAD per ~50 kDasubunit. High-resolution crystal structures have provided detailed structural informationon GR from various sources including human erythrocytes and E. coli (Thieme et al.,1981; Karplus & Schulz, 1987, 1989; Ermler & Schulz, 1991; Mittl & Schulz, 1994). Oneof the most compelling structural characteristics is the position of the tyrosine adjacent tothe flavin (Tyr177 in E. coli GR and Tyr197 in erythrocyte GR): this tyrosine residueblocks the active site thereby preventing the binding of NADPH. The catalyticmechanism, which was based on three-dimensional structures of free and substrate-boundforms of the human enzyme (Pai & Schulz, 1983), therefore includes a movement of thistyrosine away from the flavin (Fig. 1.7).
Figure 1.7: Representation of part of the active-site structure of glutathionereductase from crystallographic data. Shown are the relative positions of theisoalloxazine ring of FAD and Tyr177 in the free enzyme (top panel; Mittl &Schulz, 1994) and in the enzyme complexed with NADP+ (lower panel; Mittl et al.,1994). Note that in the latter case Tyr177 has moved away from the isoalloxazine.
Rotation of a complete protein domain is involved in the catalytic mechanism ofE. coli thioredoxin reductase (TrxR). This enzyme catalyzes the NADPH-dependentreduction of the protein substrate thioredoxin, which is involved in cellular processessuch as ribonucleotide reduction and protein folding (for a review, see Williams, 1992,1995). Whereas the human enzyme resembles glutathione reductase, the E. coli enzyme
Tyr177
Tyr177
FAD
FAD
NADP+

Chapter 1
30
shows a remarkably different crystal structure (Waksman et al., 1994; Kuryian et al.,1991), in which no obvious path for the flow of electrons from NADPH to thioredoxin isfound. The monomers (35 kDa) of the homodimeric enzyme consist of an NADPH-binding domain and an FAD-binding domain, connected by a double-stranded β-sheet. Inthe crystal structure, there is no binding site present for thioredoxin. Moreover, NADPHis bound far away from the flavin ring (17 Å), and its access to the isoalloxazine ring isblocked. By graphically rotating the NADPH domain over 66°, Waksman et al. (1994)showed that the above-mentioned problems could be overcome. In the rotated structure,the nicotinamide and isoalloxazine rings are in close contact with each other, and theredox-active disulfides move from the inside (near the flavin) to the surface of the proteinwhere they become accessible for the protein substrate. It was therefore proposed that E.coli thioredoxin reductase has two conformational states: a conformation in which the111
Figure 1.8: Cartoon representation of the mutant C138S of E. coli thioredoxinreductase (TrxR) in the FO and FR conformations. The FAD and pyridine nucleotidedomains are indicated as triangles and connected by lines depicting the double-stranded β-sheet. FAD is represented by three circles, PN indicates bound pyridinenucleotide. Although the rotation between the FO and FR is shown as a 180° in thisillustration, it is actually 67° (Lennon et al., 2000).
rings of NADPH and FAD are juxtaposed (FR), and the form corresponding to the crystalstructure (FO) (Fig. 1.8). Steady-state fluorescence studies on wild-type TrxR and mutantenzyme TrxR C138S provided strong indications for the existence of the FO and FRconformations in solution (Mulrooney & Williams, 1997). Only recently, crystal structureanalyses of the crosslinked enzyme/protein substrate complex have indeed revealed theFR conformation (Lennon et al., 2000).
OHSH138135
OHSH
138 135
FAD domain
pyridine nucleotidedomain
FAD domain
FO FR
pyridine nucleotidedomain
PN PN

Introduction
31
A different type of motion, namely that of the isoalloxazine ring of the flavincofactor itself, is found in the enzyme p-hydroxybenzoate hydroxylase (PHBH)(Schreuder et al., 1994; Gatti et al., 1994). This aromatic hydroxylase catalyses theconversion of p-hydroxybenzoate into 3,4-dihydroxybenzoate using NADPH andmolecular oxygen (for a review, see Entsch & van Berkel, 1995). Crystallographic studiesof binary enzyme/substrate complexes showed the isoalloxazine part of the FAD cofactorin two distinct conformations (Schreuder et al., 1994). The 'in' conformation, in which theflavin ring is located in the active site, was found for the enzyme saturated with p-hydroxybenzoate. Binding of substrates bearing a hydroxyl group at the 2-position (2,4-dihydroxybenzoate, 2-hydroxy-4-aminobenzoate) led to the 'out' conformation, in whichthe isoalloxazine ring has moved towards the surface of the protein (Fig. 1.9). 11111
Figure 1.9: Stereoview of the movement of the isoalloxazine ring in p-hydroxybenzoate hydroxylase (PHBH). Presented is the active-site region of PHBHin the complex with 2,4-dihydroxybenzoate (Schreuder et al., 1994). The flavinoccupies the 'out' conformation (open bonds). The 'in' conformation of the flavin inthe wild-type PHBH/p-hydroxybenzoate complex is shown in solid bonds(Schreuder et al., 1989).
Absorption difference spectra of the binary enzyme/substrate complexes were found toreflect these conformational differences. Crystallographic data Gatti et al., 1994) andspectral data (van der Bolt et al., 1996) on mutant enzymes, in which Tyr222 wasreplaced, demonstrated that this particular residue is involved in flavin motion. In PHBH,mobility of the flavin itself is essential for catalysis: whereas the flavin in the 'in' positionprovides a suitable environment for efficient hydroxylation of the substrate (shieldedfrom the solvent), the swinging 'out' of the flavin creates a pathway for substrate binding

Chapter 1
32
and product release. Recent crystallographic data of the substrate-free enzyme showedthat the isoalloxazine ring is indeed flexible, and on average located at a positionintermediate between the 'in' and 'out' conformation (Eppink et al., 1999).
The flavoenzymes introduced above are all large systems with complicateddynamic and kinetic features. In a first approach to investigate conformational dynamicsthrough single molecules flavin fluorescence detection, and to relate flavin fluorescencecharacteristics to dynamic properties as obtained from MD simulations, the flavincofactor FAD provides an elegant system.
1.7 Outline of this thesis
Research described in this thesis was aimed at gaining more insight into theactive-site dynamics of dimeric flavoproteins by means of fluorescence relaxationspectroscopy. Three flavoproteins for which crystallographic data have suggesteddifferent types of functionally important motions were chosen as central systems; E. coliglutathione reductase, which displays a local conformational change in the proteinenvironment; E. coli thioredoxin reductase, for which a major domain rotation wasproposed to be essential for catalysis; and P. fluorescens p-hydroxybenzoate hydroxylase,in which the isoalloxazine ring of the flavin cofactor itself is mobile during catalysis. Forinterpretation of fluorescence data in terms of dynamic events in the proteins, explicitattention was paid to the photophysical and dynamic characteristics of the flavin cofactor.
In Chapter 2, the dynamic properties of wild-type E. coli glutathione reductase(GR) are studied in comparison with those of the mutant enzymes GR Y177F and GRY177G. Emphasis is laid on the relations between fluorescence lifetime patterns, proteindynamics and the mechanisms for fluorescence quenching in proteins. Experimentalevidence is provided for the multiple quenching sites model.
The implications of the comparative study on the gluthatione reductase enzymesfor the interpretation of time-resolved fluorescence anisotropy decays are described inChapter 3, where a new mechanism for flavin fluorescence depolarization is proposed.
Chapter 4 focuses on the conformational dynamics of E. coli thioredoxinreductase (TrxR) and the mutant enzyme TrxR C138S. Two catalytically importantconformational states of the enzyme are detected and characterized by (sub)picosecondtime-resolved and spectrally resolved fluorescence techniques. Flavin fluorescencerelaxation experiments are combined with steady-state optical techniques to gain insightinto the dynamic properties of the enzyme and the conformational equilibrium. Theimportance of enlarging the time window for the fluorescence detection of dynamicevents is discussed.

Introduction
33
The mobile flavin in p-hydroxybenzoate hydroxylase (PHBH) is subject of a time-resolved fluorescence investigation in Chapter 5. Different binary (mutant)enzyme/substrate (analogue) complexes are used to direct the conformation of thecofactor. The chapter reflects on possibilities and limitations of ensemble fluorescencelifetime data for studying protein dynamics.
In Chapter 6, a link is created between time-resolved fluorescence data ofensembles of molecules and the molecular dynamics of single molecules as retrievedfrom molecular dynamics (MD) simulations. Hereto, the system of investigation issimplified to the FAD cofactor, which can exist in both 'open' and 'closed' conformations.MD simulations provide insight into the dynamic behaviour of the free cofactor and intopathways for conformational transitions.
Chapter 7 describes the first steps into the world of single-molecule detectionthrough natural flavin fluorescence. Fluorescence Correlation Spectroscopy studies onFAD, FMN and lipoamide dehydrogenase provide a first glance into the futureperspectives of detecting single flavoproteins and give an understanding of the specificobstacles that need to be overcome.
The thesis is concluded by a summarizing discussion reflecting on the researchdescribed in this thesis in relation to developments in the field.


2 Flavin fluorescence dynamics and photoinducedelectron transfer in Escherichia coli glutathionereductase
This Chapter has been published in: van den Berg, P.A.W., A. van Hoek, C.D. Walentas, R.N. Perham, and A.J.W.G. Visser. 1998.
Biophys. J. 74, 2046-2058.
Time-resolved polarized flavin fluorescence was used to study the active-sitedynamics of E. coli glutathione reductase (GR). Special consideration was given to therole of Tyr177 which blocks the access to the NADPH-binding site in the crystalstructure of the enzyme. By comparing wild-type GR with the mutant enzymes Y177Fand Y177G, a fluorescence lifetime of 7 ps that accounts for ~90% of the fluorescencedecay, could be attributed to quenching by Tyr177. Based on the temperature invariancefor this lifetime, and the very high quenching rate, electron transfer from Tyr177 to thelight-excited isoalloxazine part of flavin adenine dinucleotide (FAD) is proposed as themechanism of flavin fluorescence quenching. The temperature and viscositydependencies of the fluorescence lifetime distributions show that the mutants Y177F andY177G have a more flexible protein structure than wild-type GR: in the range of 223 K to277 K in 80% glycerol, both tyrosine mutants mimic the closely related enzymelipoamide dehydrogenase. The fluorescence intensity decays of the GR enzymes can onlybe explained by the existence of multiple quenching sites in the protein. Althoughstructural fluctuations are likely to contribute to the nonexponential decay and theprobability of quenching by a specific site, the concept of conformational substates neednot be invoked to explain the heterogeneous fluorescence dynamics.

Chapter 2
36
2.1 Introduction
Increasingly, protein flexibility and conformational dynamics are considered toplay a role in the catalytic mechanism of enzymes (Careri et al., 1979; Welch et al., 1982;Karplus & McCammon, 1983; Frauenfelder et al., 1988). Yet visualizing protein motionsby experimental methods is still a little-explored field. In enzymes containing an intrinsicfluorescent group like Trp, protein dynamics of the fluorophore environment can bemonitored by time-resolved fluorescence and fluorescence anisotropy detection (Millar,1996). Flavoproteins, which have either flavin adenine dinucleotide (FAD) or flavinmononucleotide (FMN) as a redox-active prosthetic group, offer the unique possibility ofprobing the dynamic behaviour of the active site via this specific cofactor. Thefluorescence characteristics of the isoalloxazine ring of the cofactor vary highly amongdifferent flavoproteins, thus reflecting structural and dynamic differences near the activesite. In this study, polarized time-resolved flavin fluorescence is used to monitor theactive-site dynamics of Escherichia coli glutathione reductase.
Glutathione reductase (GR, EC 1.6.4.2) belongs to the pyridine nucleotidedisulfide-oxidoreductase family, which includes, among others, lipoamide dehydrogenaseand thioredoxin reductase. The enzyme catalyzes the NADPH-dependent reduction ofoxidized glutathione (Williams, 1976). The primary function of glutathione reductase isto maintain a high GSH/GSSG ratio in cells, which is crucial for a variety of cellularfunctions, including the biosynthesis of DNA (Holmgren, 1985). Glutathione reductase isa homodimeric enzyme with a molecular mass of ~50 kDa per subunit. The enzymecontains one molecule of FAD per subunit. This flavin cofactor is noncovalently bound,and is trapped in a tight binding site between the two subunits. The kinetic mechanism ofglutathione reductase from various sources has been studied extensively. The nativeenzyme acts according to a ping-pong mechanism, but branched ping-pong and orderedsequential mechanisms have been suggested for specific mutants and for highconcentrations of GSSG (Williams, 1992). Extensive site-directed mutagenesisexperiments with E. coli GR have resulted in mutants that yield information on themechanism, and substrate and coenzyme specificity (Berry et al., 1989; Deonarain et al.,1989, 1990; Scrutton et al., 1990; Bashir et al., 1995).
Detailed structural information on glutathione reductase from both humanerythrocytes and E. coli is available from high resolution crystal structures (Thieme et al.,1981; Karplus & Schulz, 1987, 1989; Ermler & Schulz, 1991; Mittl & Schulz, 1994).Although the enzymes have only 52% sequence identity, and the 16 N-terminal residuesof erythrocyte glutathione reductase are missing in the E. coli enzyme (Greer & Perham,

Flavin fluorescence dynamics and photoinduced electron transfer in E. coli GR
37
1986), the tertiary structures reveal little significant difference. From a mechanistic pointof view, one of the most compelling structural characteristics is the position of thetyrosine adjacent to the flavin (Tyr177 in E. coli GR and Tyr197 in erythrocyte GR).From both crystal structures it is clear that this tyrosine residue blocks the active site,thereby preventing the binding of NADPH ('in' position). The catalytic mechanism,which was based on three-dimensional structures of free and substrate-bound forms of thehuman enzyme, therefore includes a movement of this tyrosine away from the flavin ('out'position) (Pai & Schulz, 1983).
To explore the role of this flavin-shielding tyrosine, Berry et al. (1989) used site-directed mutagenesis to change Tyr177 of the E. coli enzyme. Kinetic analysis of thesemutants showed that a Y177F mutation hardly affected the enzymatic activity. Theactivity of the Y177G mutant, however, was significantly diminished. For both mutantsan increase in fluorescence intensity of ~25-fold with respect to that of the wild-typeenzyme was observed. A previous time-resolved fluorescence study of wild-typeglutathione reductase from human erythrocytes showed considerable quenching of theflavin fluorescence, presumably caused by interaction with Tyr197 (Bastiaens et al.,1992b).
In that same study, the heterogeneous fluorescence decay of the flavin inerythrocyte glutathione reductase was explained by the existence of distinctconformational substates of the enzyme (Bastiaens et al., 1992b). The model ofconformational substates is based on the idea that a protein in a certain state has a widevariety of nearly isoenergetic conformational substates, which perform the same functionbut at different rates (Frauenfelder & Gratton, 1986; Frauenfelder et al., 1988, 1991).Between the different substates energy barriers prevail, the height of which is assumed tobe correlated with the extent of protein motion that is involved with interconversion. Ifdifferent conformational substates result in inhomogeneity of the chromophoreenvironment, excitation will lead to different excited-state processes and consequently tononexponential fluorescence decay (Beechem & Brand, 1985). Such a heterogeneousfluorescence decay can be described by a multiexponential model or a quasi-continuousdistribution of lifetimes (Alcala et al., 1987; Siemiarczuk et al., 1990; Ferreira et al.,1994; Bismuto et al., 1996). When conformational transitions take place during thelifetime of the excited state, the fluorophore will sample a variety of environments whichalso results in a distribution of fluorescence lifetimes (Alcala et al., 1987).
In explaining fluorescence decay in terms of conformational substates, however, itis assumed that in each substate the interactions between the chromophore and its directenvironment will result in a single fluorescence lifetime. This model has been challenged

Chapter 2
38
by Bajzer and Prendergast (1993), who have proposed that the heterogeneity influorescence decay can arise from a multiplicity of competing interactions that involvetransfer of energy in a broad sense from the light-excited chromophore to different sitesin the molecule (multiple quenching sites). They showed that the nonexponentialfluorescence decay of several tryptophan-containing proteins can be explained by energytransfer to different acceptor sites in the protein, which all contribute with a certainprobability to de-excitation of the donor. In contrast to the conformationally determinedmodels of quenching, which all assume energy transfer via collisional quenching, themodel of multiple quenching sites is not dependent on collisions, but includes other de-excitation processes such as fluorescence resonance energy transfer and electron transfer.A multiexponential model for the fluorescence decay can then be justified withoutinvoking multiple protein conformations.
This study focuses on the active-site dynamics of E. coli glutathione reductase,and the role of Tyr177 that shields the flavin part of the FAD. For this, comparison ofwild-type E. coli GR with site-directed mutants of Tyr177 (Y177F and Y177G) isindispensable. Variations in temperature and concentration of the cosolvent glycerol areused as complementary approaches to influence protein dynamics. Absorption spectraserve to visualize possible changes in the direct microenvironment of the flavin. Thefluorescence lifetime distributions are discussed in terms of the proposed models thataccount for multiexponential fluorescence decay kinetics. Results from time-resolvedfluorescence depolarization studies on the E. coli glutathione reductase enzymes arediscussed in Chapter 3.
2.2 Materials and Methods
Purification and preparation of wild-type and mutant glutathione reductase
Wild-type and mutant glutathione reductases were purified from the gor-deletedE. coli strains NS3 and SG5, respectively, which were transformed with the appropriateexpression plasmid (Scrutton et al., 1987). The purification was based on the methoddescribed by Berry et al. (1989) with a modification similar to that described by Bashir etal. (1995). Instead of the DE-52 column, Highload Q (Pharmacia) was used for ion-exchange, but the elution conditions were unaltered. Except for the preparation of the cellextract, no additional FAD or EDTA was used. GR activity was measured as describedby Scrutton et al. (1987). During the purification, fractions were also tested for lipoamidedehydrogenase activity (Benen et al., 1991) to ensure that no trace of this morefluorescent iso-molecular weight protein contaminated the samples. The enzyme

Flavin fluorescence dynamics and photoinduced electron transfer in E. coli GR
39
preparations were pure as judged by SDS-polyacrylamide gel electrophoresis andfluorescence detection of the proteins on a nondenaturing gel. Pure enzyme was stored in80% ammonium sulphate at 277 K. Before use, possible traces of free FAD wereremoved by chromatography on a Biogel PGD-6 column (Biorad) equilibrated withphosphate buffer. In all spectroscopic measurements the enzyme concentration was 10µM with respect to FAD. The final potassium phosphate concentration was kept at 50mM, and the pH at 7.6 (293 K). Buffers were made from nanopure-grade water(Millipore) and were filtered through a 0.22 µm filter (Millipore). All chemicals usedwere of the highest purity available. Samples containing glycerol were prepared by gentlymixing the eluted protein with fluorescent-grade glycerol (Merck). Before and after aseries of fluorescence experiments, flavin absorption spectra (Aminco DW2000spectrophotometer, SLM Instruments, Urbana, IL, USA) were measured at 298 K tocheck the quality of the samples.
Time-resolved fluorescence and fluorescence anisotropy measurements
Time-resolved polarized fluorescence experiments were carried out using thetime-correlated single-photon counting technique (TCSPC) (O’Connor & Phillips, 1984).The TCSPC setup used was basically as described in detail elsewhere (Bastiaens et al.,1992b), with a few modifications. A mode-locked CW Nd:YLF laser (model Antares 76-YLF, Coherent, Santa Clara, CA, USA) was used for the synchronously pumping of acavity-dumped (Coherent Radiation model CR590) dye laser with Stilbene 420 (ExcitonInc., Dayton, OH, USA) as a dye (van Hoek & Visser, 1992). The samples were excitedwith vertically polarized light of 450 nm, with an excitation frequency of 594 kHz, and aduration of 4 ps FWHM. Parallel and perpendicularly polarized fluorescence wasdetected using a 557.9 nm interference filter (Schott, Mainz, Germany, half-bandwidth of11.8 nm) in combination with a KV 520 cut-off filter. Time-resolved fluorescenceexperiments with sucrose were carried out at a later date, using Coumarin 460 (ExcitonInc.) as a dye, and an excitation wavelength of 460 nm. To avoid possible distortionscaused by Raman scattering of water, fluorescence here was detected using a 526.0 nminterference filter (Schott, half-bandwidth of 12.6 nm) in combination with a KV 520 cut-off filter. A turbid glycogen solution (OD 0.1 at 450 nm) was used to verify that the datawere free of scattered excitation light. Fluorescence was sampled in cycles of 10 s in eachpolarization direction. By adjusting the excitation energy, the detection frequency of theparallel polarized component was set to 30 kHz to prevent pile-up distortion. Detectionelectronics were standard time-correlated single-photon counting modules. The presenteddata were collected in a multichannel analyzer (MCA board from Nuclear Data model

Chapter 2
40
)(tI
AccuspecB, Schaumburg, IL, USA) with a time window of 1024 channels at 15.1 or 16.7ps/channel respectively. For better time resolution near the detection limit, data of wild-type GR were also collected at 5.0 ps/channel. Instrumental sources for distortion of datawere minimized to below the noise level of normal photon statistics (van Hoek & Visser,1985).
The dynamic instrumental response function of the setup is ~50 ps FWHM. Theinstrumental response was obtained at the emission wavelength by measuring a referencecompound with known single fluorescence lifetime (Vos et al., 1987). As a referencecompound in the range between 277 K and 313 K, erythrosine B in water (τ = 80 ps at293 K) was used. In the range between 293 K and 223 K, erythrosine B was dissolved inmethanol yielding a fluorescence lifetime of approximately ~500 ps (Bastiaens et al.,1992b). To correct for the small temperature-dependence of the reference lifetime, theexact value at a certain temperature was determined by iterative reconvolution with thereference compound at a temperature at which the lifetime was known. In eachexperiment, the parallel and perpendicular fluorescence decay components of thereference compound (3 cycles), the sample (10 or 15 cycles), the background (one-fifth ofthe sample acquisition time) and again the reference compound were determined. Thetemperature of the samples was controlled using a liquid nitrogen flow setup with atemperature controller (model ITC4, Oxford Instruments Inc., Oxford, United Kingdom).At temperatures below 273 K, the sample housing was flushed with argon to prevent dewand ice formation (Bastiaens et al., 1992a).
Data analysis
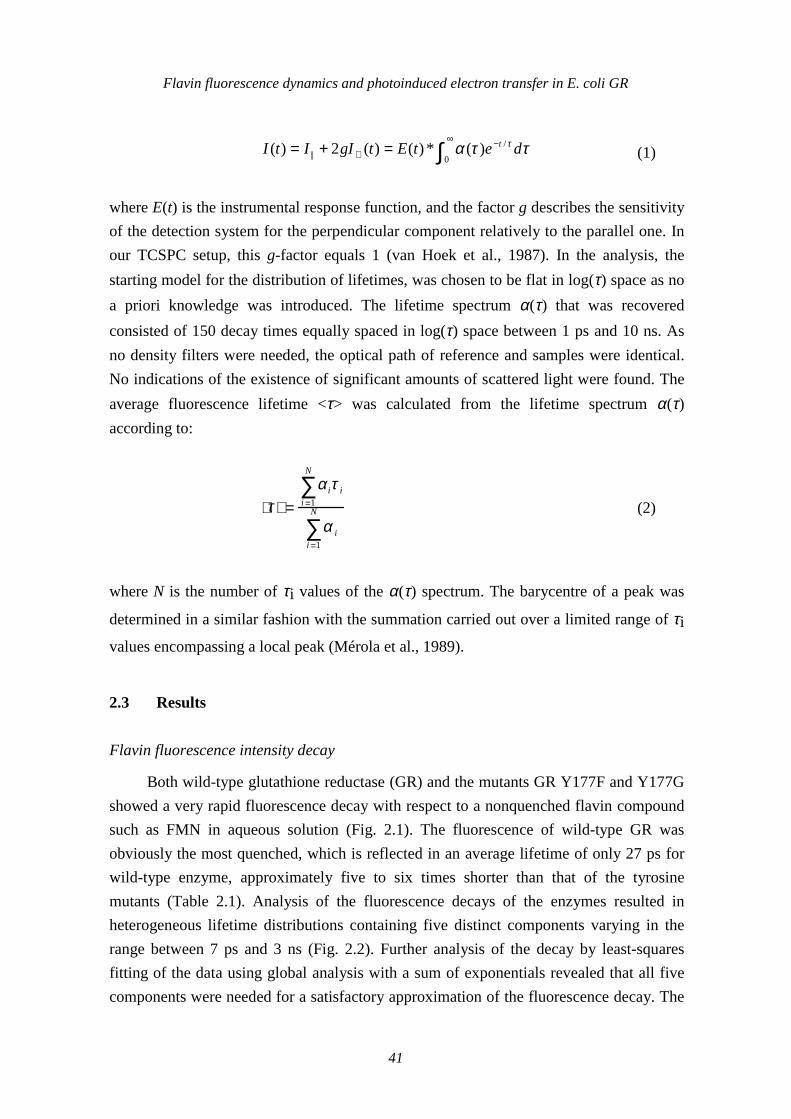
Analysis of the fluorescence intensity decay I(t) was performed using thecommercially available maximum entropy method (Maximum Entropy Data ConsultantsLtd, Cambridge, United Kingdom). With this method, the fluorescence intensity andanisotropy decays can be described in terms of a continuous distribution of decay times,for which no a priori knowledge of the system is required. A detailed description of theprinciples of MEM and analysis of the polarized fluorescence data can be foundelsewhere (Livesey & Brochon, 1987; Bastiaens et al., 1992b; Brochon, 1994), and willbe shortly outlined below. In the experiments, the parallel and perpendicular )(tI ⊥
fluorescence intensity components were acquired separately after excitation with avertically polarized light pulse. The lifetime spectrum α(τ) was obtained from the totalfluorescence I(t) via the inverse Laplace transform:
Flavin fluorescence dynamics and photoinduced electron transfer in E. coli GR
41
∫∞ −
⊥ =+=0
/|| )(*)()(2)( ττα τ detEtgIItI t
(1)
where E(t) is the instrumental response function, and the factor g describes the sensitivityof the detection system for the perpendicular component relatively to the parallel one. Inour TCSPC setup, this g-factor equals 1 (van Hoek et al., 1987). In the analysis, thestarting model for the distribution of lifetimes, was chosen to be flat in log(τ) space as noa priori knowledge was introduced. The lifetime spectrum α(τ) that was recoveredconsisted of 150 decay times equally spaced in log(τ) space between 1 ps and 10 ns. Asno density filters were needed, the optical path of reference and samples were identical.No indications of the existence of significant amounts of scattered light were found. Theaverage fluorescence lifetime <τ> was calculated from the lifetime spectrum α(τ)according to:
⟨τ ⟩ =α iτ i
i =1
N
∑α i
i =1
N
∑(2)
where N is the number of τi values of the α(τ) spectrum. The barycentre of a peak was
determined in a similar fashion with the summation carried out over a limited range of τivalues encompassing a local peak (Mérola et al., 1989).
2.3 Results
Flavin fluorescence intensity decay
Both wild-type glutathione reductase (GR) and the mutants GR Y177F and Y177Gshowed a very rapid fluorescence decay with respect to a nonquenched flavin compoundsuch as FMN in aqueous solution (Fig. 2.1). The fluorescence of wild-type GR wasobviously the most quenched, which is reflected in an average lifetime of only 27 ps forwild-type enzyme, approximately five to six times shorter than that of the tyrosinemutants (Table 2.1). Analysis of the fluorescence decays of the enzymes resulted inheterogeneous lifetime distributions containing five distinct components varying in therange between 7 ps and 3 ns (Fig. 2.2). Further analysis of the decay by least-squaresfitting of the data using global analysis with a sum of exponentials revealed that all fivecomponents were needed for a satisfactory approximation of the fluorescence decay. The

Chapter 2
42
positions of the four longer lifetimes were almost invariant for the different enzymes, butthe relative contributions differed highly (Table 2.2). In wild-type GR, the ultrafastcomponent of 7 ps was predominant (~90 %). The uncertainty in the position of thislifetime was only 1 ps. In the case of the mutants, a longer component of ~90 ps wasresponsible for ~40% to 50% of the fluorescence intensity decay. In these lifetimedistributions the 7 ps component disappeared. Tyr177 could thus be identified as theresidue responsible for the extremely efficient fluorescence quenching of the flavin inwild-type E. coli glutathione reductase.
Table 2.1: Average fluorescence lifetimes <τ> of wild-type GR and mutants Y177Fand Y177G in 50 mM potassium phosphate buffer pH 7.6 at 293 K with 0% or 80%(v/v) glycerol.
GR <<<<ττττ> > > > 0% (ns) < < < <ττττ> > > > 80% (ns)
wild-type 0.027 ± 0.003 0.38 ± 0.03
Y177F 0.18 ± 0.004 1.8 ± 0.08
Y177G 0.12 ± 0.017 1.3 ± 0.3
Figure 2.1: Experimental total fluorescence decay of wild-type GR and mutantsY177F and Y177G in 50 mM potassium phosphate buffer pH 7.6, and FMN in 50mM potassium phosphate buffer pH 7.0, at 293 K. Only the initial part of the 16 nsexperimental time window is shown.
80
60
40
20
00.0 1.41.21.00.80.60.40.2
100
FMN
GR wtGR Y177GGR Y177F
time (ns)
norm
aliz
ed fl
u. in
t.

Flavin fluorescence dynamics and photoinduced electron transfer in E. coli GR
43
Varying the temperature between 223 K (in 80 v/v% glycerol) and 313 K did notaffect the position of the 7 ps component in wild-type GR. Collisional quenching cantherefore be excluded. Based on this temperature invariance and the ultrafast lifetime, wepropose electron transfer as the mechanism of fluorescence quenching. In the excitedstate the flavin may abstract an electron from Tyr177; return to the ground state may thenoccur via a radiationless process. The edge-to-edge distance between FAD and theelectron-rich Tyr177, as found in the crystal structure of E. coli GR, is 3.1 Å, thusallowing fast electron transfer (Moser et al., 1992).
Figure 2.2: Fluorescence lifetime distribution of wild-type GR (A) and mutantsY177F (B) and Y177G (C) in 50 mM potassium phosphate buffer pH 7.6, 293 K.
0.001 0.01 0.1 1 10τ (ns)
A200
150
100
50
0
250
20
15
10
5
0
B
20
15
10
5
0
25 C
α (τ )
x 1
0-3α (
τ ) x
10-3
α (τ )
x 1
0-3
0.001 0.01 0.1 1 10τ (ns)
0.001 0.01 0.1 1 10τ (ns)

Chapter 2
44
Table 2.2: Barycentres and fractional contributions of the fluorescence lifetimecomponents of wild-type GR and mutants Y177F and Y177G in 50 mM potassiumphosphate buffer pH 7.6 at 293 K.
GR wild-type GR Y177F GRY177G
ττττi (ns) ααααi ττττi (ns) ααααi ττττi (ns) ααααi
0.007 ± 0.001 0.90 ± 0.01 0.020 ± 0.005 0.34 ± 0.01 0.023 ± 0.01 0.44 ± 0.1
0.090 ± 0.008 0.076 ± 0.005 0.087 ± 0.01 0.41 ± 0.05 0.10 ± 0.004 0.42 ± 0.09
0.29 ± 0.04 0.020 ± 0.005 0.24 ± 0.03 0.19 ± 0.03 0.26 ± 0.006 0.10 ± 0.02
1.0 ± 0.2 0.003 ± 0.001 0.8 ± 0.04 0.03 ± 0.004 0.79 ± 0.007 0.02 ± 0.005
2.6 ± 0.3 0.002 ± 0.0005 2.5 ± 0.1 0.02 ± 0.001 2.2 ± 0.05 0.02 ± 0.003
Supporting evidence for a strong interaction between FAD and Tyr177 was foundin the absorption spectra of the enzymes (Fig. 2.3A). In the absorption spectrum of wild-type GR, a pronounced shoulder was present at the red-edge side of the first absorptionband of FAD, near 490 nm. This shoulder reflects the 0,0 absorption transition (S0,0→ S1,0). Although the mutation from tyrosine to phenylalanine does not change the
aromatic character of residue 177, and even increases its hydrophobicity, this shoulderwas substantially decreased in the spectrum of Y177F. Mutation into a glycine residuealso gave rise to a diminished shoulder at 490 nm, and, in addition, to a blueshift of theabsorption maximum from 462 nm to 458 nm.
More evidence for this interaction was found upon addition of the cosolventglycerol. Contrary to the absorption spectrum of the tyrosine mutants, the shape of theabsorption spectrum of wild-type GR showed a clear dependence on the glycerolconcentration. An increase in the glycerol concentration up to 40% did not bring aboutany difference. However, at higher concentrations (≥60%), the shape of the absorptionspectrum was altered (Fig. 2.3B): in 80% glycerol the spectrum of wild-type GR showeda diminished shoulder at 490 nm, now more resembling that of GR Y177F in aqueoussolution. These results are in accord with time-resolved fluorescence measurements ofwild-type GR in 80% glycerol. The lifetime pattern of the wild-type enzyme againcontained the ultrashort component, but its contribution was substantially reduced (Fig.2.4).

Flavin fluorescence dynamics and photoinduced electron transfer in E. coli GR
45
The average lifetime increased by a factor of more than ten (Table 2.1). Usinghigh concentrations of sucrose (50%-60% w/w) to increase the solvent viscosity to thesame order of magnitude as 80% glycerol did not affect the absorption spectrum nor thefluorescence lifetime distribution of wild-type glutathione reductase. A minor shift in thelifetime contributions -favouring the 90 ps component over the 7 ps component- wasobserved, which may reflect the influence of the increase in internal friction of theenzyme (<τ> = 0.06 ns). The interaction between FAD and Tyr177 thus seemed to bespecifically perturbed in high concentrations of glycerol, leading to the presence ofunfavourable conformations for efficient electron transfer to the light-excited flavin.
Figure 2.3: Absorption spectra of wild-type GR and mutants Y177F and Y177G in50 mM potassium phosphate buffer pH 7.6, with 0% (A) and 80% (B) glycerol (v/v)at 293 K.
wavelength (nm)
wavelength (nm)
abso
rptio
nab
sorp
tion
0.10
0.08
0.06
0.04
0.02
0350 400 450 500 550 600
350 400 450 500 550 600
0.08
0.06
0.04
0.02
0
GR wtY177FY177G
GR wtY177FY177G
A
B

Chapter 2
46
Protein dynamics in E. coli glutathione reductase
The fluorescence lifetime spectrum of FAD in wild-type GR was almostindependent of temperature in the range between 277 K and 313 K (Fig. 2.5A). Using80% glycerol, the temperature of the samples could be varied over a wider temperaturerange (223-293 K). In this range, more significant differences in the contributions of thefive lifetimes were found (Fig. 2.5B). The largest effect on the fluorescence decaypatterns was caused by the addition of high concentrations of glycerol itself (Fig. 2.4). Upto a concentration of 40% glycerol the lifetime patterns remained identical. In 80%glycerol, however, the amplitude of the ultrashort component drastically decreased (to~55%), in favour of the contribution of the two longest lifetimes (Fig. 2.4). The lifetimecomponent at 0.3 ns was no longer resolved. Combined with the absorption spectradescribed, the decrease in the 7 ps component was interpreted as a perturbation of theinteraction between the light-excited flavin and Tyr177.
Figure 2.4: Normalized fluorescence lifetime distribution of wild-type GR in 50 mMpotassium phosphate pH 7.6 at 293 K as a function of glycerol concentration. Forclarity, a vertical offset has been applied.
τ (ns)
norm
aliz
ed α
300
250
200
150
100
50
0.001 0.01 0.1 1 10
0% glycerol
60% glycerol
80% glycerol
0

Flavin fluorescence dynamics and photoinduced electron transfer in E. coli GR
47
From the temperature independence it can be concluded that wild-type E. coliglutathione reductase has a very rigid structure in the immediate vicinity of the flavin. Incontrast with this is the dynamic behaviour of the tyrosine mutants GR Y177F andY177G. The lifetime spectra of these enzymes are much more dependent on bothtemperature and glycerol concentration. In aqueous solution, a rise in temperaturefavoured the fractional contribution of the shorter lifetimes, and the barycentres shifted tosomewhat shorter values. As the lifetime positions do not converge upon the rise intemperature, which would be typical for interconversion between different substates, wefind the results more indicative of an increased flexibility of the protein matrix of thesemutants. A drastic change in the lifetime profiles was found in high concentrations ofglycerol. In 80% glycerol, only three discrete lifetimes could be distinguished for both
Figure 2.5: Temperature dependence of the fractional contributions of the lifetimeclasses of wild-type GR in 50 mM potassium phosphate buffer pH 7.6 in the rangebetween 277 and 313 K (A), and with 80% (v/v) glycerol in the range between 223and 293 K (B). For reasons of clarity, the data presented are rounded off to the mostsignificant digit.
τ (ns)
277 K285 K293 K303 K313 K
1.0
0.8
0.6
0.4
0.2
0
α
0.01 0.1 30.3 1
0.01 0.1 1 53
293 K273 K253 K233 K223 K
1.0
0.8
0.6
0.4
0.2
0
α
τ (ns)
A
B
277 K285 K293 K303 K313 K
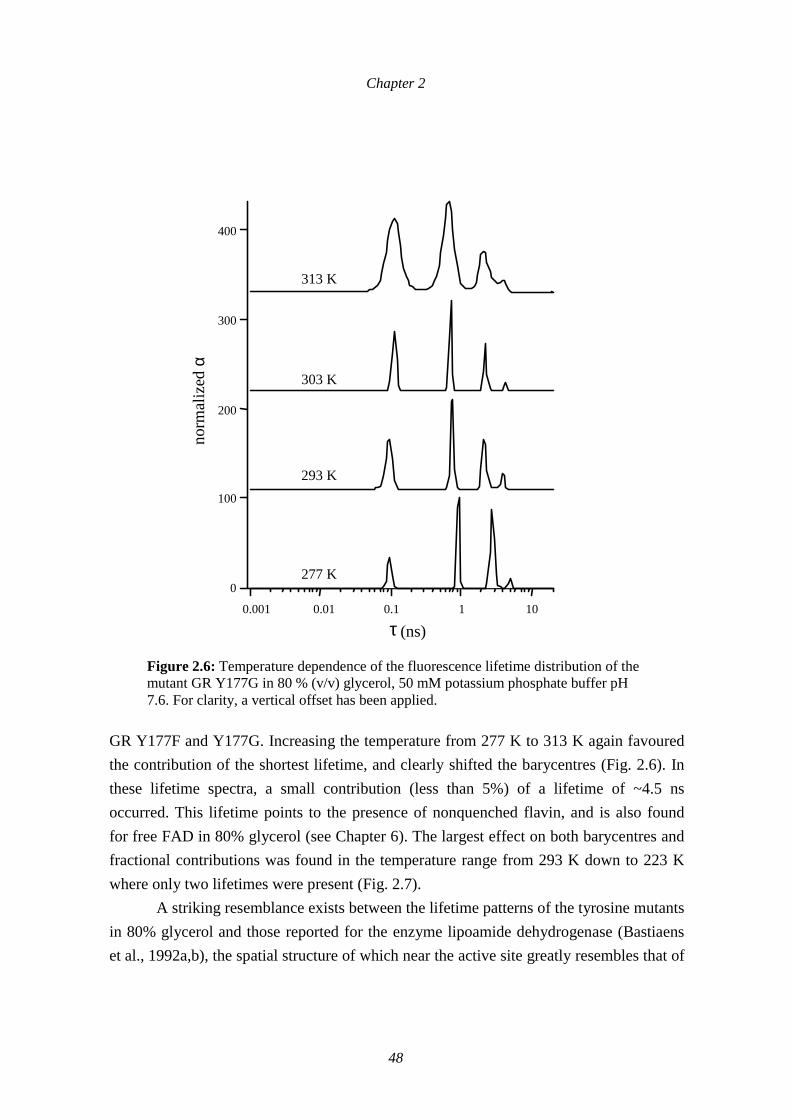
Chapter 2
48
GR Y177F and Y177G. Increasing the temperature from 277 K to 313 K again favouredthe contribution of the shortest lifetime, and clearly shifted the barycentres (Fig. 2.6). Inthese lifetime spectra, a small contribution (less than 5%) of a lifetime of ~4.5 nsoccurred. This lifetime points to the presence of nonquenched flavin, and is also foundfor free FAD in 80% glycerol (see Chapter 6). The largest effect on both barycentres andfractional contributions was found in the temperature range from 293 K down to 223 Kwhere only two lifetimes were present (Fig. 2.7).
A striking resemblance exists between the lifetime patterns of the tyrosine mutantsin 80% glycerol and those reported for the enzyme lipoamide dehydrogenase (Bastiaenset al., 1992a,b), the spatial structure of which near the active site greatly resembles that of 1 1
Figure 2.6: Temperature dependence of the fluorescence lifetime distribution of themutant GR Y177G in 80 % (v/v) glycerol, 50 mM potassium phosphate buffer pH7.6. For clarity, a vertical offset has been applied.
400
300
200
100
0
0.001 0.01 0.1 1 10
τ (ns)
norm
aliz
ed α
313 K
303 K
293 K
277 K

Flavin fluorescence dynamics and photoinduced electron transfer in E. coli GR
49
GR (Mattevi et al., 1991). For lipoamide dehydrogenase, a lifetime spectrum with threecomponents at ~0.17 ns, 1.3 ns and 2.5 ns was found in aqueous solution at pH 7, 293 K.In 80% glycerol the lifetime spectrum contained only two components, which show asimilar temperature dependence to that found for the E. coli GR mutants at lowtemperatures. The lifetime values found for the tyrosine mutants of E. coli GR in 80%glycerol are shorter than those reported for wild-type Azotobacter vinelandii lipoamidedehydrogenase, but do resemble those of the more solvent-accessible deletion mutant oflipoamide dehydrogenase, which lacks fourteen C-terminal amino acids (Bastiaens et al.,
Figure 2.7: Temperature dependence of the fluorescence lifetime distributions of themutants GR Y177F (A) and Y177G (B) in 80% (v/v) glycerol, 50 mM potassiumphosphate buffer pH 7.6. For clarity, a vertical offset has been applied.
223 K
253 K
273 K
293 K
τ (ns)
norm
aliz
ed α
τ (ns)
norm
aliz
ed α
223 K
253 K
293 K
A
B
273 K
200
150
100
50
00.01 0.1 1 10
0.01 0.1 1 10
200
150
100
50
0

Chapter 2
50
1992a). These results show that the large differences in the fluorescence lifetimebehaviour of these homologous enzymes in aqueous solution, are cancelled out to a largeextent by varying the experimental conditions. In our opinion, this strongly favours theidea of multiple quenching sites of which the contribution and rate of quenching stronglydepend on the exact microstructure of the enzyme.
2.4 Discussion
Comparison of wild-type E. coli glutathione reductase with the mutants Y177Fand Y177G by time-resolved polarized flavin fluorescence clearly identified Tyr177 asthe residue responsible for the ultrafast quenching of flavin fluorescence in this enzyme.In various flavoproteins that contain a tyrosine residue adjacent to the flavin, theextremely low flavin fluorescence intensity of these enzymes has been attributed to(static) quenching by this tyrosine (Maeda-Yorita et al., 1991; Karplus et al., 1991;Williams, 1992). The 7 ps fluorescence lifetime component observed in this studyexpresses the (pseudo)dynamic nature of quenching, thereby contradicting the concept ofa 'dark' complex that is formed in the ground state and remains dark in the excited state.In a similar study on human glutathione reductase, Bastiaens et al. (1992b) proposed thatthe observed ultrafast quenching resulted from exciplex formation between the flavin andTyr197. By comparing wild-type E. coli GR with mutants in which Tyr177 is replaced byeither Phe or Gly, we have proved that an excited state reaction takes place. Theultrashort fluorescence lifetime and the invariance of this component with respect totemperature and viscosity indicate that the mechanism of quenching is not collisionalquenching, but electron transfer from tyrosine to the light-excited flavin. Suchphotoinduced electron transfer could generate an extremely efficient pathway to return tothe singlet ground state in a nonradiative way.
Excited-state electron transfer is known to be relevant for a variety of chemicaland biological processes and has been studied extensively (for a selection, see Rehm &Weller, 1970; Marcus & Sutin, 1985; Barbara et al., 1996). An appropriate expression forthe free energy of photoinduced electron transfer between a donor molecule (D) andacceptor molecule (A) in solution is given by the Rehm-Weller equation:
R4e)/()(
0
2
0,0red
1/2ox1/2et επε
−∆−−=∆ •−•+ EAAED/DEG (3)

Flavin fluorescence dynamics and photoinduced electron transfer in E. coli GR
51
where )/(ox1/2
•+DDE and )/(red1/2 AAE •− refer to the half-wave oxidation potential of the
electron donor and the half-wave reduction potential of the electron acceptor,respectively. ∆E0,0 is the electronic excitation energy corresponding to the energy
distance between vibronic ground and first excited states (S0,0 → S1,0); ε is the dielectricconstant; ε0 is the permittivity of vacuum; and R is the distance between donor and
acceptor. For intramolecular photoinduced electron transfer in proteins the same equationholds, although the precise contribution of the Coulomb energy term is difficult tocalculate owing to uncertainties in donor-acceptor contact area and the local dielectricconstant. However, the Coulomb energy term will only contribute in favour of thethermodynamic probability of the electron transfer process. For free FMN the one-
electron reduction potential EFlox/EFlH· is -238 mV at pH 7, while that of the second
half-reaction is somewhat less negative (-172 mV vs SHE at pH 7) (Draper & Ingraham,1968). Although the precise redox properties of the flavin are controlled by the proteinenvironment, the midpoint redox potentials reported for free flavin and proteins of theoxidoreductase family are of the same order of magnitude (Williams, 1992): e.g., for E.coli lipoamide dehydrogenase the two-electron reduction potential is -264 mV at pH 7(Wilkinson & Williams, 1979). For glutathione reductase a midpoint potential of -235mV at pH 7, 293 K has been reported (Williams, 1992). The slope of a plot of thispotential as a function of pH changes from -52 to -39 mV/pH unit at pH 7.4, therebyindicating the presence of other dissociable groups, whose pKa values are linked to the
redox state of the enzyme (O'Donnell & Williams, 1983). A stable oxidized tyrosineradical is known to be involved in electron transfer processes in ribonucleotide reductaseand the photosynthetic water-splitting system (Reichard & Ehrenberg, 1983; Barry &
Babcock, 1987; Prince, 1988). The oxidation potential for the Tyr/Tyr· couple at pH 7 inaqueous solution determined by pulse radiolysis and cyclic voltammetry is +930 mV(Harriman, 1987). For photosystem II, an Em7 +760 mV has been reported for the tyrosine
D/D· couple, while that for the tyrosine Z/Z· has been estimated at Em7 +1000 mV(Boussac & Etienne, 1984). The oxidation potential of a tyrosine radical inside a proteinthus seems in line with the value found in aqueous solution. The redox potential of the
Tyr/Tyr· couple in aqueous solution becomes less positive at increasing pH, therebyfacilitating electron transfer (Harriman, 1987). Based on the redox potentials mentionedabove and R = 3.1 Å (edge to edge distance between Tyr177 and N10 of the flavin), theexcitation energy of 2.53 eV (490 nm) is more than sufficient to induce electron transferfrom Tyr177 to the isoalloxazine ring. The rate of electron transfer ket is determined by

Chapter 2
52
the free energy as well as the reorganisation energy λ and the distance R (for relevantequations see Marcus, 1956; Marcus & Sutin, 1985; Moser et al., 1992).
Comparison of the rates of electron transfer in a variety of biological and(semi)synthetical systems reveals typical rate constants of 1 ps-1 to 0.1 ps-1 for donor-acceptor distances of 5 Å, whereas distances of 10 Å generally result in rates between 10ns-1 and 1 ns-1 (Moser et al., 1992). The ultrafast fluorescence quenching in E. coliglutathione reductase corresponds to a rate constant of ~0.14 ps-1 and agrees thus wellwith the expected rate of electron transfer in this system. Based on the known redoxpotentials and the excitation energy of the flavin, electron transfer is likely to be thecommon mechanism for fluorescence quenching in flavoproteins that contain a tyrosineresidue juxtaposed to the flavin.
A similar mechanism of flavin fluorescence quenching has been reported for
tryptophan in Desulfovibrio vulgaris flavodoxin (Visser et al., 1987). For the Trp/Trp·
couple at pH 7 in aqueous solution, the oxidation potential is 1.015 V (Harriman, 1987).Picosecond absorption spectroscopy carried out with this enzyme revealed the existenceof a transient exciplex absorption band of ~30 ps lifetime, which could be attributed toelectron transfer from tryptophan to the excited flavin (Karen et al., 1987). A study on
pea ferredoxin-NADP+ reductase was also reported recently, in which replacement of thetyrosine adjacent to the flavin by tryptophan as well as by phenylalanine resulted in aminor increase in the flavin fluorescence quantum yield, whereas nonaromaticsubstitutions resulted in a large increase in fluorescence (Calcaterra et al., 1995).However, in our study electron transfer did not occur in the phenylalanine mutant of E.coli GR, and the average fluorescence lifetime was almost the same as for the glycinemutant. A plausible explanation for this is a different orientation of the Phe side chainthat is unfavourable for electron transfer to the light-excited isoalloxazine. In the crystalstructure of E. coli GR, the closest contacts between the flavin and Tyr177 occur via theN10 and C9a of the flavin and the hydroxyl moiety of the tyrosine (3.1 and 3.2 Årespectively, Table 2.3). The hydroxyl moiety is close to the N5 and C4a of theisoalloxazine ring, which can act as electrophilic sites. In those enzymes in solution, inwhich Tyr177 occupies the 'in' position, the exact site of the phenolic side chain withrespect to the isoalloxazine ring may differ from that found in the crystal structures, andsmall positional fluctuations are likely to occur. Upon movement of the phenolic sidechain towards the 'out' position, the distance will only increase and the hydroxyl moietyin particular will be turned away from the flavin.

Flavin fluorescence dynamics and photoinduced electron transfer in E. coli GR
53
Table 2.3: Distances between the hydroxyl oxygen atom of Y177 and theisoalloxazine ring of FAD in wild-type E. coli GR(1)
Atom Å Atom Å Atom Å
N1 4.1 C4a 3.7 C8 4.5
C2 5.0 N5 3.7 C8M 5.7
O2 5.9 C5a 3.5 C9 3.7
N3 5.3 C6 4.3 C9a 3.2
C4 4.8 C7 4.7 C10a 3.4
O4 5.7 C7M 5.9 N10 3.1
(1): Distances were retrieved from the crystal structure of E. coli GR at 1.86 Å resolutiondeposited by Mittl and Schulz (1994).
An alternative explanation for the absence of the ultrafast component in thelifetime pattern of GR Y177F is that a phenolic side chain itself is a more effectiveelectron donor. A recent study on ribonucleotide reductase, in which long-range electrontransfer occurs via a pathway that contains two tyrosine residues, showed thatpreservation of the aromatic character alone was not enough for electron transfer (Ekberget al., 1996). The latter study indicated that the efficiency of electron transfer via ahydrogen bond approaches that of a covalent bond. However, based on the distances inthe crystal structure and the direction of motion of the phenolic side chain upon cofactorbinding, the formation of a hydrogen bond between the tyrosine and the flavin inglutathione reductase seems unlikely.
The fact that the interaction between the flavin and Tyr177 is perturbed in highconcentrations of glycerol supports the concept that the exact position of the aromaticside chain is critical for electron transfer. Besides its function as a viscogen, glycerol isalso known to influence protein structure. The cosolvent glycerol is preferentiallyexcluded from the protein-solvent interface (Timasheff et al., 1976; Timasheff, 1993),and it can therefore induce a decrease in the volume and compressibility of the proteininterior (Priev et al., 1996). Consequently, protein fluctuations can be dampened as aresult of both increased friction between the peptide chain and the solvent molecules, andthe increased friction between the amino acid residues in the protein interior itself. Gekkoand Timasheff (1981a,b) have suggested that a balance between repulsion of glycerolfrom hydrophobic surfaces of the protein and interaction with the polar regions, is in factthe origin of the well known stabilising effect of glycerol (Jarabak et al., 1966; Bradbury& Jakoby, 1972; Ogle, 1983). Moreover, glycerol can also induce structural changes in a

Chapter 2
54
protein (Pourplanche et al., 1994; Raibekas & Massey, 1996). Raibekas and Massey(1996) suggested that these structural changes may originate from the same repulsionmechanism, assuming the protein has solvent-exposed nonpolar residues together withflexible regions, as is often the case in the active site. In E. coli GR, the NADPH-bindingpocket is accessible to the solvent. Although the crystal structure contains many watermolecules (Mittl & Schulz, 1994), none of them are positioned directly between Tyr177and the isoalloxazine ring. A large part of this binding pocket is, in principle, accessiblefor glycerol as well. Perturbation of the interaction between the isoalloxazine ring andTyr177 as indicated by the time-resolved fluorescence and absorbance data may originatefrom direct interaction of this residue with glycerol molecules, but more likely is anindirect effect of glycerol on the hydration layer and, consequently, the protein structure.The fact that the flavin-tyrosine interaction remained nearly intact when sucrose was usedas a cosolvent can be the result of the different interaction between sucrose molecules andthe solvated protein, but a decreased accessibility of the active site, resulting from thebigger size of the cosolvent, may also play a role (Yedgar et al., 1995).
Supporting evidence for a close interaction between flavin and Tyr177 in E. coliGR in solution, which is absent in GR Y177F, was found in the absorption spectra. Bothfluorescence and absorption data of wild-type E. coli GR and mutants Y177F and Y177Gare in perfect agreement with studies on E. coli lipoamide dehydrogenase. Maeda-Yoritaet al. (1991) reported that mutation of Ile184, which is at the position equivalent to that ofTyr177, into a tyrosine resulted in nearly complete quenching of the FAD fluorescence. Aredshift of the absorption maximum of 455 nm to 462 nm, mimicking the situation inglutathione reductase, was also found. Although the authors mentioned that the spectralshape of the spectrum did not change upon introduction of the I184Y mutation, thepublished spectra do reveal a more pronounced shoulder at the red edge of the spectrum,similar to that described here for wild-type E. coli glutathione reductase. It thus seemspossible to relate specific interactions between the flavin and its microenvironment, of anature other than the occurrence of a charge-transfer interaction with the redox-activethiolate, to particular properties of the flavin absorption spectrum.
Although the juxtapositioning of a tyrosine residue and the isoalloxazine ring is acommonly observed phenomenon in flavoproteins, the biological function of thisarchitecture is still not clear. Crystal structures of glutathione reductase as well as
ferredoxin-NADP+ reductase and Crithidia fasciculata trypanothione reductase whichwere complexed with their nicotinamide cofactor revealed a sandwich stacking of thiscofactor between the isoalloxazine ring and the tyrosyl moiety, thereby stabilisingbinding (Pai et al., 1988; Karplus & Schulz, 1989; Bailey et al., 1994; Serre et al., 1996).

Flavin fluorescence dynamics and photoinduced electron transfer in E. coli GR
55
A similar mode of cofactor binding with a phenylalanine instead of a tyrosine wasreported for NAD(P)H:quinone oxidoreductase (Li et al., 1995) and Trypanosoma cruzitrypanothione reductase (Zhang et al., 1996). Kinetic studies on E. coli GR mutantsY177F, Y177S and Y177G, however, showed that neither the hydroxyl group nor thearomaticity of Tyr177 is strictly necessary for binding of the nicotinamide cofactor(Berry et al., 1989). Earlier, Rice et al. (1984) proposed a lid function for the tyrosine inglutathione reductase, to protect the reduced flavin against oxidation. Berry et al. (1989)showed that reoxidation of the flavin in the GR Y177 mutants is still rather slow. Theyproposed that the position of the active site in a cleft buried in the enzyme itself, providessufficient protection against unwanted oxidation. In the present study, the fluorescencelifetime patterns of the enzymes as a function of both temperature and viscosity stronglysuggest that the tyrosine mutants are more sensitive to fluctuations and changes in theprotein structure. Although a crystal structure of a GR Y177 mutant is not available yet,we expect that the mutation of tyrosine into phenylalanine or glycine has no significanteffect on the active-site structure of the free enzyme. The fluorescence lifetime patternsof GR Y177F and GR Y177G were almost identical, and under mild conditions thepositions of the four longest lifetimes matched very well with those found for wild-typeGR. If the mutation itself causes structural rearrangements within the active site, wewould expect this to be reflected in changes in the flavin fluorescence lifetime patterns.Evidence for an increased flexibility of the protein structure of the mutant enzymes, inaddition to the studies presented in this Chapter, was also found in the fluorescencelifetime patterns of the enzymes complexed to substrate analogues (Chapter 3). Underextreme conditions, such as 80% glycerol, a very small fraction of FAD was liberatedfrom the free mutant enzymes. Upon long-term storage of these enzymes, a similartendency was found. These results all point to a diminished stability of the mutantenzymes with respect to wild-type GR. Thermal and urea-induced denaturation studies onpea ferredoxin-NADP+ reductase and mutants in which Y308 was replaced, indicated thatthe presence of an electron-rich aromatic side chain adjacent to the isoalloxazine ring isessential for stabilization of the holoenzyme (Calcaterra et al., 1995). Optimalstabilization, however, was found for the tyrosine containing wild-type enzyme. It ispossible that this contribution to the stability of the oxidized enzyme is a physiologicallyrelevant characteristic of flavoproteins which have a tyrosine adjacent to the isoalloxazinering.
The interpretation of the results in this study differs significantly from thatreported for human erythrocyte glutathione reductase (Bastiaens et al., 1992b). Studieswith human erythrocyte GR show that the differences in fluorescence lifetimes of the E.

Chapter 2
56
coli and human enzyme result merely from the improved time resolution of the currenttime-resolved fluorescence setup (data not shown). However, comparison of wild-type E.coli GR, with the site-directed mutants Y177F and Y177G in combination withtemperature and viscosity studies, reveal new insights into both the mechanism ofnonexponential fluorescence decay and the active-site dynamics of the glutathionereductase enzyme. In wild-type erythrocyte glutathione reductase, the heterogeneousfluorescence decay yielding five lifetime components has been explained by the existenceof (at least) five conformational substates of the enzyme, with different orientations oftyrosine residue 197 (Bastiaens et al., 1992b). It was proposed that interconversionbetween the assumed substates corresponded to gross structural changes in the protein.From both this study on E. coli GR, and the one on erythrocyte GR, it can be concludedthat in the majority of the enzyme molecules in solution the tyrosine residue is in closecontact with the flavin, thereby probably blocking the active site, as evident in the crystalstructures. However, in this study with the GR mutants we found no evidence to sustainthe model of conformational substates.
The fact that the mutant enzymes GR Y177F and GR Y177G still exhibit a rapidheterogeneous fluorescence decay, can only be explained by the existence of quenchingsites in the protein other than the juxtaposed tyrosine. The similarity of the longerfluorescence lifetimes of the mutant enzymes with those found for wild-type GR, stronglyindicates that these quenching sites also contribute to a minor extent to the fluorescencedecay of the wild-type enzyme. The ultrafast lifetime component originates from theinteraction with Tyr177, but the identity of the other quenching components is stillunknown. Residues that may also contribute to flavin fluorescence quenching arepossibly Phe161 and Phe344, which are at an edge-to-edge distance of 4.3 Å and 4.8 Årespectively of the isoalloxazine ring. However, the π-electron system of Phe alone maybe less suited for being an electron donor. Another residue that may be involved in flavinfluorescence quenching is Cys47. This residue, which is part of the redox-active disulfidebridge, is only at a distance of 3.5 Å of the C4a of the flavin, and forms a charge-transferinteraction with the flavin upon reduction of the enzyme. Indications that Cys47 indeedcontributes to flavin fluorescence are found in the study of Deonarain et al. (1990) inwhich a twelve-fold increase in flavin fluorescence was reported for glutathione reductaseC47S with respect to wild-type enzyme. Besides direct quenching of Cys47, the increasein fluorescence intensity may also be caused by a conformational change in the enzyme,resulting, for instance, in an unfavourable conformation of Tyr177 for electron transfer tothe light-excited flavin. Additional support for quenching by a redox-active cysteine isfound in a study on NADH peroxidase, in which mutation of Cys42 into an alanine or a

Flavin fluorescence dynamics and photoinduced electron transfer in E. coli GR
57
serine residue resulted in a ~four-fold and ~ten-fold increase in fluorescence quantumyield (Parsonage & Claiborne, 1995).
The model of multiple quenching sites is also in accord with the results of thetemperature and viscosity studies. The temperature invariance of the fluorescencelifetimes of wild-type glutathione reductase reflects the rigidity of the peptide chain nearthe active site. Perturbation of the interaction between Tyr177 and the flavin by glyceroldecreases the quenching efficiency by tyrosine, thereby increasing the probability offluorescence quenching caused by the other sites. The small changes in fluorescencelifetime pattern observed for the tyrosine mutants reflect the influence of small structuralrearrangements. Induction of these rearrangements by glycerol at low temperatures seemsto eliminate the differences in fluorescence lifetime distributions of the structurallyclosely related glutathione reductase and lipoamide dehydrogenase. Although this studyclearly reveals the existence of multiple quenching sites, the possibility of differentconformers is not ruled out. Small structural fluctuations such as the movement ofTyr177 are likely to contribute to the heterogeneous character of the flavin fluorescencedecay. Conformational fluctuations on the (sub)nanosecond time scale as well as onlonger time scales will create a heterogeneous ensemble in which the rate and probabilityof fluorescence quenching by a specific site is controlled by the precise microstructureand dynamics of the light-excited enzyme molecule.
Acknowledgements
We wish to thank Prof. Dr. R.H. Schirmer, Dr. K. Becker (Heidelberg University, Germany), Dr.P.R.E. Mittl (Novartis, Switzerland), Dr. A.A. Raibekas (University of Michigan, USA), Dr.W.J.H. van Berkel and Prof. Dr. C. Laane for helpful discussions and suggestions.
This work was supported by the Netherlands Foundation for Chemical Research (SON) withfinancial aid from the Netherlands Organisation for Scientific Research NWO and the E.C.Human Capital and Mobility Programme CHRX-CT93-0166: 'Flavoproteins, Structure andActivity'.


3Time-resolved flavin fluorescence depolarizationin Escherichia coli glutathione reductase:evidence for a novel mechanism of fluorescencedepolarization
Parts of this Chapter have been published in:van den Berg, P.A.W., A. van Hoek, C.D. Walentas, R.N. Perham, and A.J.W.G. Visser. 1998.
Biophys. J. 74, 2046-2058.
A modified version of this Chapter will be submitted as:van den Berg, P.A.W., A. van Hoek, and A.J.W.G. Visser.
Time-resolved flavin fluorescence depolarization in E. coli glutathione reductase:Evidence for a novel mechanism of fluorescence depolarization.
Time-resolved flavin fluorescence anisotropy studies on glutathione reductase(GR) have revealed a remarkable new phenomenon: wild-type GR displays a rapidprocess of fluorescence depolarization, that is absent in mutant enzymes lacking a nearbytyrosine residue that blocks the NADPH-binding cleft. Fluorescence lifetime data,however, have shown a more rigid active-site structure for wild-type GR than for thetyrosine mutants (Chapter 2). These results suggest that the rapid depolarization in wild-type GR originates from an interaction with the flavin-shielding tyrosine, and not from arestricted reorientational motion of the flavin as was previously suggested (Bastiaens etal., 1992b). A novel mechanism of fluorescence depolarization is proposed that involvesa transient charge-transfer complex between the tyrosine and the light-excited flavin, witha concomitant change in the direction of the emission dipole moment of the flavin. Thisinteraction is likely to result from side-chain relaxation of the tyrosine in the minorfraction of enzyme molecules in which this residue is in an unsuitable position forimmediate fluorescence quenching at the moment of excitation. Support for thismechanism is provided by binding studies with NADP+ and 2'P-5'ADP-ribose that canintercalate between the flavin and tyrosine and/or block the latter. Fluorescencedepolarization analyses as a function of temperature and viscosity confirm the dynamicnature of the process. A comparison with fluorescence depolarization effects in therelated enzyme NADH peroxidase (Visser et al., 1998), indicates that this mechanism offlavin fluorescence depolarization in which a charge-transfer interaction changes thedirection of the emission dipole moment may be more generally applicable.

Chapter 3
60
3.1 Introduction
Polarized time-resolved fluorescence is a well-established method to investigatethe dynamics of molecular systems (Lakowicz, 1999). Whereas fluorescence lifetimeexperiments yield information on the microenvironment of the fluorophore, fluorescencedepolarization studies are widely applied for investigating rotational diffusion andsegmental motions. For proteins, processes such as aggregation, dissociation,denaturation, and folding may be easily detected through fluorescence depolarization. Inaddition, the technique can be used to monitor the viscosity of the environment andchanges therein, such as in membranes or cell systems. Fluorescence labelling isgenerally used to attach suitable fluorophores to lipids, DNA and proteins. For the latter,one could in principle use the intrinsic fluorescence of tryptophan residues. In practice,using tryptophan fluorescence is complicated by interconversion between two electroniclevels in the first absorption band that are nearly degenerate (Creed, 1984), resulting infast fluorescence depolarization (Ruggiero et al., 1990). In addition, tryptophanfluorescence is often difficult to interpret owing to the presence of more than one Trpresidue. However, external fluorescence labelling is not suitable for all systems. Besidesinconvenient mobility of the label itself, which may be avoided by bimodal labellingtechniques, steric aspects may not always allow the introduction of a fluorescence label.The delicacy of the molecular structure and of the dynamics may also play a role.Intrinsic protein fluorescence is therefore preferable for studying processes such as theactive-site dynamics of enzymes. Pre-eminently suited for this are enzymes that contain asingle naturally fluorescent reporter group in the active-site region, such as flavoenzymes.
The characteristic green fluorescence of the flavin cofactor has provided detailedinformation on the active-site dynamics of a variety of enzymes that contain flavinadenine dinucleotide (FAD) or flavin mononucleotide (FMN) as a redox-active prostheticgroup (for an overview, see van den Berg & Visser, 2001). Flavin fluorescencedepolarization studies have shed light on possible dissociation of the cofactor, localmobility of the isoalloxazine ring, and –if fluorescence lifetime and molecular massallowed it- overall protein tumbling. In addition, structural information on multimericflavoproteins has been obtained from time-resolved anisotropy studies through(homo)energy transfer between the flavin cofactors (Bastiaens et al., 1992a,b; Visser etal., 1998). For the dimeric Azotobacter vinelandii lipoamide dehydrogenase, a smallrapidly depolarizing process was originally interpreted as local mobility of thefluorophore (de Kok & Visser, 1987). Later studies with more advanced techniques andcomparison of the results with the interflavin distance and orientation of the flavins as

Time-resolved flavin fluorescence depolarization in E. coli GR: …
61
became available from structural data of the enzyme (Mattevi et al., 1991), showed thatnot mobility but homoenergy transfer between the flavin cofactors from the two differentsubunits is the source of depolarization (Bastiaens et al. 1992a,b). Bastiaens et al.compared the active-site dynamics of A. vinelandii lipoamide dehydrogenase with thoseof glutathione reductase (GR) from human erythrocytes, an enzyme with a largely similaractive-site structure. Fluorescence depolarization studies on erythrocyte GR revealed inaddition to a small amount of homoenergy transfer as in lipoamide dehydrogenase, amore rapidly depolarizing process with a large amplitude that was assigned to restrictedreorientational mobility of the isoalloxazine ring (Bastiaens et al., 1992b).
In the active-site region, the most striking difference between glutathionereductase and lipoamide dehydrogenase is that GR contains a tyrosine residue adjacent tothe flavin (Tyr197 in human erythrocyte GR, Tyr177 in E. coli GR; Thieme et al., 1981;Karplus & Schulz, 1987; Mittl & Schulz, 1994). Whereas the active site of lipoamidedehydrogenase is easily accessible for the nicotinamide cofactor, the binding cleft forNADPH in GR is blocked by this tyrosine residue (Karplus & Schulz, 1987). Thecatalytic mechanism of GR therefore includes a movement of this tyrosine away from theflavin (Pai & Schulz, 1983). Crystallographic analysis of complexes of GR with NADPHand several analogues and fragments thereof, indeed showed a full or partial flip of thetyrosine side chain towards an 'out' position that allows flavin reduction (Pai et al., 1988;Karplus & Schulz, 1987, 1989; Mittl et al., 1994; Fig 3.1).
More recently, a detailed time-resolved fluorescence investigation was performedon the role of the flavin-shielding tyrosine residue in the active-site dynamics of E. coliGR (van den Berg et al., 1998, Chapter 2). The tertiary structure of E. coli GR is nearlyidentical to the enzyme from human erythrocytes (Mittl & Schulz, 1994), though only52% sequence homology exists (Greer & Perham, 1986), and the enzyme lacks the 16 N-terminal residues of erythrocyte GR. To reveal the role of the flavin-shielding Tyr177(equivalent to Tyr197 in erythrocyte GR), wild-type E. coli GR was compared withmutants in which this residue had been replaced by site-directed mutagenesis.Fluorescence lifetime data revealed that in ~90% of the free enzyme molecules, Tyr177directly interacts with the light-excited flavin resulting in flavin fluorescence quenchingwith a lifetime constant of only 7 ps (van den Berg et al, 1998; Chapter 2). Based on thetemperature invariance of this process and absorption spectra, and supported by redoxcalculations and observations of tyrosine radicals in other flavoenzymes, the ultrafastfluorescence quenching was explained by photoinduced electron transfer from thetyrosine to the adjacent flavin. The temperature and viscosity dependencies of the

Chapter 3
62
fluorescence lifetime data clearly showed that the mutants GR Y177F and GR Y177Ghave a more flexible protein structure than wild-type GR.
In this Chapter, a time-resolved fluorescence anisotropy investigation of wild-typeE. coli GR and the tyrosine mutants GR Y177F and GR Y177G is presented. To unravelthe nature of the processes inducing fluorescence depolarization, wild-type E. coli GR isstudied as a function of temperature and viscosity, and in complex with substrates andanalogues thereof. Based on the results, a novel mechanism of fluorescencedepolarization is proposed that involves a shift in the direction of the emission dipolemoment of the flavin resulting from a transient charge-transfer interaction with theadjacent tyrosine.
Figure 3.1: Representation of part of the active-site structure of E. coli glutathionereductase. Shown are the relative positions of the isoalloxazine ring of FAD andTyr177 in the free enzyme (top panel; Mittl & Schulz, 1994) and in the enzymecomplexed with NADP+ (lower panel; Mittl et al., 1994). Note that in the latter caseTyr177 has moved away from the isoalloxazine.
Tyr177
Tyr177
FAD
FAD
NADP+

Time-resolved flavin fluorescence depolarization in E. coli GR: …
63
3.2 Materials and Methods
Enzyme material and sample preparation
Wild-type and mutant E. coli glutathione reductases were purified from the gor-deleted E. coli strains NS3 and SG5, respectively, transformed with the appropriateexpression plasmid (Scrutton et al., 1987). The purification was based on the methoddescribed by Berry et al. (1989) and is in detail described elsewhere (van den Berg et al.,1998; Chapter 2). Wild-type and mutant glutathione reductase from human erythrocyteswere a kind gift from Prof. R.H. Schirmer, Heidelberg University, Germany. Pureenzymes were stored in 80% ammonium sulfate at 277 K. Before use, possible traces offree FAD were removed by chromatography on a Biogel PGD-6 column (Biorad)equilibrated with the appropriate measuring buffer. Measurements were carried out in 50mM potassium phosphate buffer pH 7.6, at 293 K, except for the titrations with 2'P-5'ADP-ribose for which 50 mM MOPS buffer pH 7.6, was used. The enzymeconcentration was kept between 9-11 µM with respect to FAD (maximum OD of 0.10 atthe excitation wavelength, with ε463 GR = 11.3 mM-1cm-1 (Williams, 1976). Buffers were
made from nanopure-grade water (Millipore) and were filtered through a 0.22 µm filter(Millipore). 2'P-5'ADP-ribose, and NADP+ were purchased from Sigma. All chemicalsused were of the highest purity available. Samples containing glycerol were prepared bygently mixing the eluted protein with fluorescent-grade glycerol (Merck). Before andafter a series of fluorescence experiments, flavin absorption spectra (Aminco DW2000spectrophotometer, SLM Instruments, Urbana, IL, USA) were measured at 298 K tocheck the quality of the samples.
Time-resolved fluorescence and fluorescence anisotropy measurements
Time-resolved polarized fluorescence experiments were carried out using thetime-correlated single-photon counting technique (TCSPC) (O’Connor & Phillips, 1984).The TCSPC setup and the measurement procedures used were described in detailelsewhere (van den Berg et al., 1998; Chapter 2), and will only shortly outlined below. Amode-locked CW Nd:YLF laser was used for the synchronously pumping of a cavity-dumped dye laser. Stilbene 420 and Coumarin 460 (Exciton Inc., Dayton, OH, USA)were used as dyes for excitation at 450 nm and 460 nm, respectively. The samples wereexcited with vertically polarized light with an excitation frequency of 594 kHz (duration4 ps FWHM) and both parallel and perpendicularly polarized fluorescence was detected.At 450 nm excitation, fluorescence was detected with a 557.9 nm interference filter(Schott, Mainz, Germany, half-bandwidth of 11.8 nm) in combination with a KV 520 cut-

Chapter 3
64
)(tI ⊥
off filter (Schott). At 460 nm excitation, fluorescence was detected with a 526.0 nminterference filter (Schott, half-bandwidth of 12.6 nm) in combination with a KV 520 cut-off filter (Schott), in order to avoid interference from Raman scattering of water (locatedat 551 nm at 460 nm excitation). The data were collected in a multichannel analyzer witha time window of 1024 channels at typically 15 ps/channel. For better time resolution inthe picosecond domain, additional data of wild-type GR were collected at 5.0 ps/channel.The dynamic instrumental response function of the setup is approximately 40-50 psFWHM, and was obtained at the emission wavelength using erythrosine B in water (τ =80 ps at 293 K) as a reference compound (Bastiaens et al., 1992b).
Data analysis
Data analysis was performed using two complementary methods. For analysis bydiscrete exponential terms, global and associative fitting the 'TRFA Data ProcessingPackage' of the Scientific Software Technologies Center (Belarusian State University,Belarus) was employed. Analysis in terms of a continuous distribution of decay times forwhich no a priori knowledge of the system is required, was performed using themaximum entropy method (MEM, Maximum Entropy Data Consultants Ltd., Cambridge,UK). Detailed descriptions of the models for analyzing polarized fluorescence data withMEM can be found elsewhere (Livesey & Brochon, 1987; Bastiaens et al., 1992b;Brochon, 1994; van den Berg et al., 1998; Chapter 2). Further description of the modelsfor analysis will here be limited to the approach using discrete exponentials.
The total fluorescence intensity decay I(t) and anisotropy decay r(t) are obtainedfrom the measured parallel and perpendicular fluorescence intensitycomponents through the relations:
)(2)()( || tgItItI ⊥+= (1)
)(2)()()(
)(||
||
tgItItgItI
tr⊥
⊥
+−
= (2)
in which the g-factor describes the sensitivity of the detection system for theperpendicular component with respect to the parallel one. For the setup used the g-factorequals unity (van Hoek et al., 1987). The fluorescence lifetime profile consisting of a sumof discrete exponentials with lifetime τi and amplitude αi can be retrieved from the totalfluorescence I(t) through:
)(|| tI

Time-resolved flavin fluorescence depolarization in E. coli GR: …
65
)(|| tI
itN
iietEtI τα /
1
)()( −
=∑∗= (3)
where E(t) is the instrumental response function. Fluorescence lifetime analysis of the GRenzymes was employed using a five-component model as confirmed by the fluorescencelifetime distributions obtained with MEM described in van den Berg et al. (1998, see alsoChapter 2).
In fluorescence anisotropy analysis, after deconvolution the time-dependentfluorescence anisotropy r(t) is calculated from the parallel and perpendicularcomponents through the relations (Lakowicz, 1999):
+= −
==
− ∑∑ ji tM
jj
N
i
ti eretI φτα /
10
1
/|| 21
31)( (4)
−= −
==
−⊥ ∑∑ ji t
M
jj
N
i
ti eretI φτα /
10
1
/ 131)( (5)
in which i = j for correlated systems in which particular lifetime components τi areassociated with particular correlation times φi (correlated or associative model), and i ≠ jfor systems in which all lifetimes equally contribute to the anisotropy (uncorrelated ornonassociative model). In the case of uncorrelated fluorescence lifetimes and rotationalcorrelation times the time dependence of the anisotropy after δ−pulse excitation can thusbe described as:
∑=
−=M
j
tj
jertr1
/0)( φ
(6)
where the sum of r0j is the fundamental initial anisotropy r0.In a first approach, the nonassociative model was assumed in analyzing the
anisotropy decay of the GR enzymes. In MEM analyses, 100 correlation times between0.01 and 100 ns and equally spaced in log(φ) space were introduced. The starting-modelfor the rotational correlation spectra in MEM analysis was chosen to be flat in order toavoid introducing a priori knowledge. MEM analysis was supported by nonassociative
)(tI ⊥

Chapter 3
66
fitting of the anisotropy decay with a sum of discrete exponentials with the TRFA DataProcessing Package. Global analysis (Beechem, 1992) in which data sets were fittedsimultaneously with a sum of discrete exponentials, were performed through linking thefluorescence lifetimes constants and/or the rotational correlation times for multiple datasets.
Further analysis of the anisotropy decay of wild-type GR was performed using theassociative fitting model. Hereto, each fluorescence lifetime was considered to be relatedto an independent quenching process with a potential process-specific anisotropybehaviour (5 models because of the presence of 5 lifetimes). First estimates of therotational correlation parameters were obtained using a model of a single rotationalcorrelation time per fluorescence lifetime, with fixed values for the lifetime parameters asobtained from the total decay analysis of the respective data set. To optimize the curvefitting at the very beginning of the anisotropy decay (including the leading edge in thefirst 150 ps), and in the region above ~3 ns, two rotational correlation times were allowedfor the fluorescence lifetime components of 7 ps and 2.6 ns. Theoretical rotationalcorrelation times calculated for overall protein tumbling and homoenergy transfer wereused to find proper starting conditions. In a final fitting procedure, freedom was allowedfor all parameters from both fluorescence intensity and anisotropy decays.
Theoretical models for fluorescence depolarization
The rotational correlation time data were evaluated according to the well-established relations for overall protein tumbling and homoenergy transfer (Lakowicz,1999). For a spherical protein, the correlation time for rotational diffusion φr is given bythe Stokes-Einstein relation:
kTVNr
ηφ = (7)
where V is the molecular volume (V = 4/3πRh3, Rh is the Stokes radius), η the viscosity, N
the Avogadro's number, k the Boltzmann's constant, and T the absolute temperature. For aglobular protein at 293 K, this relation is approximated by (Visser & Lee, 1980):
rr M41084.3 −×=φ (8)
in which Mr is the relative molecular mass of the protein in Da, and φr is in ns.
Time-resolved flavin fluorescence depolarization in E. coli GR: …
67
The correlation time for energy transfer φT between a donor and acceptor in ahomodimer is defined as:
TT k2
1=φ (9)
in which the rate constant for energy transfer kT is given by the Förster equation (Förster,1948):
642171071.8 −−−×= JRknk rT κ (10)
where κ2 is the orientation factor for the relevant transition dipole moments, n therefractive index, kr the radiative fluorescence rate constant (ns-1) of the flavin, J theintegrated spectral overlap of the flavin absorbance and fluorescence spectra (M-1cm3),and R is the distance (nm) between the donor and acceptor. The value for the radiativefluorescence rate of the flavin is kr = 0.056 ns-1 (Visser & Müller, 1979), the refractiveindex was estimated to be n = 1.4 (Steinberg, 1971; Bastiaens et al., 1992a). Theorientation factor κ2 was calculated from the orientation between the emission dipolemoment of the donor flavin (Bastiaens et al., 1992a) and the absorption dipole moment ofthe acceptor flavin (Johansson et al., 1979) appearing in the crystal structure of GR,according to the method described by Dale et al. (1979).
3.3 Results
Fluorescence anisotropy decay of glutathione reductase
Time-resolved flavin fluorescence anisotropy analysis of the E. coli GR enzymesshowed that the polarization behaviour of wild-type GR differs strongly from the tyrosinemutants GR Y177F and GR Y177G. For wild-type GR, a large depolarizing process wasobserved that is absent in the mutant enzymes where only little fluorescencedepolarization occurs (Fig. 3.2). In a first approach, the fluorescence anisotropy decayswere analyzed treating fluorescence lifetimes and rotational correlation times asuncorrelated parameters with the Maximum Entropy Method. Overall protein tumblingwas not observed due to highly efficient flavin fluorescence quenching in the E. coli GRenzymes. Lifetime analysis of the highly heterogeneous flavin fluorescence intensitydecays of these enzymes yields lifetime distributions with five components (van den Berg

Chapter 3
68
et al, 1998; Chapter 2): for the mutant enzymes, lifetime components in the rangebetween 0.2 and 2.5 ns yield an average fluorescence lifetime of 0.15 ns, whereaspredominant ultrarapid quenching with a timeconstant of 7 ps resulted in an averagefluorescence lifetime of only 27 ps for wild-type E. coli GR (see Tables 2.1 and 2.2). Theintensity of the fluorescence signal is therefore insufficient to clearly resolve a rotationalcorrelation time of 38 ns, as can be expected from the modified Stokes-Einstein relation(Eqn. 8) for a protein of 100 kDa at 293 K. For GR Y177F and GR Y177G, a correlationtime in the range between 2 and 7 ns was resolved, but this process only contributed witha very small amplitude (Fig. 3.3). In 80% v/v glycerol between 293 K and 223 K, thisdepolarizing effect was invariably described by a correlation time of 6 to 7 ns. This timeconstant agrees with the small depolarizing process reported for human erythrocyte GR,and can be assigned to intramolecular energy transfer between the two flavins (Bastiaenset al., 1992b; Eqns. 9 & 10).
In wild-type E. coli GR, the large fluorescence depolarization can be described bya rotational correlation time of ~2 ns at 293 K using the nonassociative model (Fig. 3.3).In the uncorrelated fitting approach, however, the first half nanosecond of the anisotropydecay of wild-type GR could not be described adequately (Fig. 3.4). For this reason,associative analysis of the fluorescence lifetimes and rotational correlation times was
0.4
0.3
0.2
0.1
0.01 2 3 4 5
time (ns)
anis
otro
py
GR Y177F
GR Y177G
GR wt
Figure 3.2: Experimental fluorescence anisotropy decay of wild-type E. coli GR andthe mutants GR Y177F and GR Y177G in 50 mM potassium phosphate buffer pH7.6, at 293 K. The initial anisotropy is ~0.38-0.39. Data were acquired at 15ps/channel. Only the initial part of the time window is shown. After 5 ns, the countrate had dropped from ~220000 counts in the peak channel to ~700 counts for wild-type GR, and from ~165000 and ~145000 to ~2200 and ~2100 for GR Y177G andGR Y177F, respectively.

Time-resolved flavin fluorescence depolarization in E. coli GR: …
69
performed to yield better insight in the fluorescence depolarization behaviour of wild-type GR. Associative analysis is, however, severely complicated by the large number ofpotential parameters resulting from the five lifetime components of GR that may inprinciple be correlated with one or more different depolarization processes. Moreover, asa consequence of the extremely short average fluorescence lifetime of GR, the anisotropysignal in the nanosecond region is carried by a very low number of photons yielding arather poor signal to noise ratio. Results of the associative analysis are therefore limitedto a more qualitative description of clear tendencies and potential correlations.
Associative analysis of the anisotropy decay of wild-type GR drastically improvedthe quality of the fits within the first 600 ps of the anisotropy decay (Fig. 3.4).Unambiguous associations between lifetime and correlation time constants were obtainedfor the fluorescence lifetime components of 0.1 ns and 0.3 ns (Table 3.1). The 0.1 nscomponent does not show any significant depolarization and may be connected withoverall protein tumbling. The 0.3 ns lifetime fully corresponds with a rapidlydepolarizing process with a time constant of ~2 ns at 293 K. Particularly this fluorescencelifetime seems responsible for the rapid depolarization that can easily be inspected in theexperimental data by eye. For the longer lifetime components, it was more difficult toobtain clear correlations. Although the 1.0 ns and 2.6 ns fluorescence lifetime components only contribute to the total fluorescence decay for less than 1% each, theyare the main carriers of the anisotropy signal in the nanosecond time region. Given the
Figure 3.3: Distribution of correlation times of wild-type GR (black line) andmutants GR Y177F (grey line) and GR Y177G (dotted line) in 50 mM potassiumphosphate buffer pH 7.6 at 293 K as obtained in MEM analysis with the uncorrelatedmodel for anisotropy decay.
0.10
0.08
0.06
0.02
0.04
0.00
β
0.1 1 10 100φ (ns)

Chapter 3
70
poor signal to noise ratio in this region, discrimination between a single or doubledepolarizing event, and an estimate of the time intervals for the corresponding correlationtimes could be made reasonably well. For the 1.0 ns lifetime component such analysisresulted in a single correlation time with a time constant between ~2-3.5 ns. For the 2.6ns component, two correlation times (φ1 ≈ 3-7 ns and φ2 > 30 ns) were fitted. For anadequate description of the ‘pseudo plateau’ between 150-300ps, and in particular, theslow ingrowth of anisotropy near 150 ps, also two rotational correlation times had to beallowed; one corresponding to the rotational diffusion of the protein, and a faster processwith an ill-defined time constant in the region between 0.1-5 ns. The effect of changes inrelative amplitude of the correlation times corresponding to the 7 ps lifetime wassurprisingly large: not only the anisotropy features of the leading edge were determinedby these amplitudes, but also proper fitting up to the first hundreds of picoseconds of theanisotropy decay. The presence of a rapidly depolarizing process connected with theultrashort lifetime can thus be firmly established, though the time constant cannot bedetermined accurately enough to discriminate between a protein relaxation-related11111
0.4
0.3
0.2
0.1
0.0543210
time (ns)
anis
otro
py
Figure 3.4: Experimental anisotropy decay of wild-type GR at 293 K (50 mMpotassium phosphate buffer pH 7.6, data acquired at 7.0 ps/channel), andcorresponding theoretical data as obtained from the nonassociative fitting with fivelifetime components and two rotational correlation times (⋅⋅⋅⋅⋅), and from theassociative fitting with five lifetime components and a model for anisotropy decay asdescribed in Table 3.1 ( ). Note the difference in the quality of the fits in the first600 ps of the anisotropy decay.

Time-resolved flavin fluorescence depolarization in E. coli GR: …
121
Table 3.1: Potential relations between the fluorescence lifetime parameters andfluorescence depolarization processes in wild-type E. coli GR in 50 mM potassiumphosphate buffer pH 7.6, 293 K as retrieved from associative fitting.
Lifetime parameters
(ττττi in ns, ααααi in %)
Correlation times
(order of magnitude in ns)
Relative contributions
(normalized per ττττi)
0.007 (~90%) >30 large (~75%)
~ 0.1 – 5 small (~25%)
0.09 (~8%) >30
0.3 (~2%) 1.8 - 2.2
1.0 (<1%) ~2 - 3.5
2.6 (<1%) ~3 – 7 large (~85%)
>30 small (~15%)
0.0
0.0
0.
1
2
Table 3.2: Fluorescence lifetime constants (τi) and fractional contributions (αi) ofwild-type E. coli GR at 293 K, pH 7.6 in: 50 mM potassium phosphate buffer,unliganded and saturated with NADP+; and 50 mM MOPS buffer, unliganded andsaturated with 2'P-5'ADP-ribose (ADPR).
Potassium Phosphate MOPS
wt GR wt GR + NADP+ wt GR wt GR + ADPR
ττττi (ns) ααααi ττττi (ns) ααααi ττττi (ns) ααααi ττττi (ns) α α α αi
07 ± 0.001 0.90 0.007 ± 0.002 0.76 0.007 ± 0.001 0.82 0.005 ± 0.001 0.67
90 ± 0.008 0.076 0.12 ± 0.01 0.18 0.061 ± 0.009 0.13 0.11 ± 0.03 0.15
29 ± 0.04 0.020 0.37 ± 0.04 0.04 0.22 ± 0.02 0.04 0.34 ± 0.02 0.10
.0 ± 0.2 0.003 0.76 ± 0.05 0.01 0.86 ± 0.2 0.004 0.73 ± 0.1 0.053
.6 ± 0.3 0.002 2.1 ± 0.2 0.01 2.4 ± 0.1 0.002 2.0 ± 0.4 0.013
71
Chapter 3
72
process or other sources of rapid depolarization. Although we cannot definitely excludethe presence of (sub)nanomolar traces of free FAD (φFAD = 0.2 ns and τ1−FAD (~80%) = 7ps at 293 K; Chapter 6), we have no indications for it from experiments, nor from theassociative analyses of the other fluorescence lifetime parameters: besides thepredominant ultrashort lifetime of the conformation in which the flavin and adeninemoieties are stacked, free FAD has a second lifetime component (τ = 2.7 ns) withconsiderable amplitude (~15%) related to the 'open' conformation (Chapter 6). The minor2.6 ns lifetime component obtained for E. coli GR, however, did not reveal fastdepolarization of the order of 0.2 ns.
The correlation time of 2 ns in E. coli GR is close to the time constant reported forthe dominating rapid anisotropy decay in human erythrocyte GR (φ ≈ 1.5 ns; Bastiaens etal., 1992b) which was explained by assuming a restricted reorientational motion of theflavin. The fact that no such rapid depolarization is observed in the tyrosine mutants of E.coli GR, renders the interpretation of internal mobility questionable, the more asfluorescence lifetime data earlier indicated a more mobile flexible structure for themutant enzymes than for wild-type GR (van den Berg et al., 1998; Chapter 2). To rule outthe possibility of species-specific effects, human erythrocyte GR was re-evaluated andcompared with its mutant enzyme GR Y197S, in which the equivalent flavin-shieldingtyrosine was replaced. Time-resolved fluorescence anisotropy experiments on theseenzymes revealed the same phenomenon: the large rapid depolarization found in wild-type erythrocyte GR is absent in the mutant Y197S lacking the juxtaposed tyrosine,indicating a role for this particular residue in the mechanism of fluorescencedepolarization (data not shown).
The role of Tyr177 in flavin fluorescence depolarization
To unravel the nature of rapid fluorescence depolarization in GR and to validatethe involvement of the flavin shielding tyrosine, wild-type E. coli GR was further testedby titration with substrate analogues that bind via the NADPH-binding cleft, but do notreduce the flavin. Crystal structures of the E. coli GR/NADP+ complex had shown that inthis complex, the oxidized nicotinamide cofactor intercalates between the tyrosine andthe flavin, so that the tyrosine side chain is shifted towards an 'out' position. (Fig. 3.1;Mittl et al., 1994). Titrations of wild-type GR with NADP+ showed that upon complexformation, the amplitude of the rapidly depolarizing process diminishes, until fullsaturation occurs (Fig. 3.5). A similar effect was obtained with the substrate analogue2'P-5'ADP-ribose (Fig. 3.6). Analysis of crystals of human erythrocyte GR soaked withthis analogue showed the tyrosine in the 'out' position for ~50% of the enzyme/substrate

Time-resolved flavin fluorescence depolarization in E. coli GR: …
73
complexes, whereas in the remaining ones the substrate analogue blocked the NADPHentrance with the tyrosine side chain in the 'in' position adjacent to the flavin (Pai et al.,1988). At full saturation with either NADP+ or 2'P-5'ADP-ribose, the anisotropy decay ofwild-type GR was identical to that of the tyrosine mutants in the unliganded state. Theseresults are consistent with the proposed interaction between the flavin and Tyr177causing rapid fluorescence depolarization. A prominent effect on the fluorescenceanisotropy was observed for concentrations of 1-10 µM 2'P-5'-ADP-ribose, and 0.1-3mM NADP+, in accordance with the lower binding affinity of the enzyme for the latter(Pai et al., 1988), in particular in the presence of free phosphate. Though beyond thescope of this investigation, accurate binding constants for the above-mentioned ligandscould in principle be determined from the (steady-state) anisotropy. In titrations, asignificant effect on the fluorescence lifetime patterns was observed (Table 3.2). NADP+-binding induced a decrease in amplitude of the ultrafast component and some shifts in thetime constants of the components. Experiments with 2'P-5'ADP-ribose were performed inMOPS buffer, which itself caused a slight shift of the 0.1 and 0.3 lifetime constants(Table 3.2). Binding of 2'P-5'ADP-ribose reduced the amplitude of the ultrafastcomponent with 20~25%, and changed the lifetime components towards time constantsas found for the enzyme/NADP+ complex. This decrease in amplitude is consistent withcrystallographic data on 2'P-5'ADP-ribose (see Discussion). In the complex with NADP+,the remaining ultrafast lifetime component may originate from an efficient quenchinginteraction with the bound nicotinamide cofactor.
0.20
GR wt
+0.2 mM NADP+
+1.2 mM NADP+
+8.9 mM NADP+
0.25
0.30
1 2 3
0.35
0.40
time (ns)
anis
otro
py
Figure 3.5: Fluorescence depolarization of wild-type E. coli GR at 293 K (in 50 mMpotassium phosphate buffer pH 7.6) as a function of the NADP+ concentration.

Chapter 3
74
ZZZZZZZ ZZZZZZZZ ZZZZZZZZ ZZZZZZz ZZZZZZZZZ ZZZZZZZZ ZZZ
Figure 3.6: Fluorescence depolarization of wild-type E. coli GR at 293 K (in 50 mMMOPS, pH 7.6) as a function of the concentration 2'P-5'ADP ribose (ADPR).
Figure 3.7: Temperature and viscosity dependencies of the fast correlation time ofwild-type E. coli GR. Measurements were performed in the range between 277 and303 K, in 50 mM potassium phosphate buffer, pH 7.6, with a percentage (w/w)sucrose varying from 0 to 60%.
1 2 3 4 5
time (ns)
0.20
0.25
0.30
0.35
0.40an
isot
ropy
GR wt
+ 2 µM ADPR
+ 5 µM ADPR
+ 59 µM ADPR
0 %20 %40 %60 %
310300290280
12
10
8
6
4
2
% (w/w) sucrose:
T (K)
φ (n
s)

Time-resolved flavin fluorescence depolarization in E. coli GR: …
75
The mechanism of interaction between the flavin and Tyr177 leading to rapidfluorescence depolarization was further investigated as a function of both temperatureand solvent viscosity, using sucrose as a cosolvent. The fast correlation time of E. coliGR appeared to be strongly dependent on viscosity and temperature (Fig. 3.7). Increasingtemperature from 277 K to 303 K caused a decrease in the fast correlation time by afactor 2 (irrespective of the sucrose concentration used), whereas increasing the sucroseconcentration from 0% to 60% resulted in a 2.5 to 3 times longer correlation time. Inaqueous solution, the change in rotational correlation time roughly corresponded with theviscosity effect of changing temperature. The bulk viscosity increase induced withsucrose was larger than the change in correlation time corresponding to the rapiddepolarization process. In high percentages of glycerol, no rapid fluorescencedepolarization was observed. These results clearly show the dynamic nature of theinteraction leading to rapid fluorescence depolarization.
3.4 Discussion
Time-resolved flavin fluorescence anisotropy studies on glutathione reductaserevealed a remarkable new phenomenon: wild-type GR exhibits rapid fluorescencedepolarization, that is absent in mutant enzymes lacking the flavin-shielding tyrosine. Inaccordance with the common interpretation of rapid fluorescence depolarization thatcannot be explained by rotational diffusion or energy transfer, restricted segmentalmobility was proposed for the isoalloxazine ring of the flavin cofactor in humanerythrocyte GR (Bastiaens et al., 1992b). Based on fluorescence lifetime experiments ofthe E. coli GR enzymes (van den Berg et al., 1998, Chapter 2), however, there is noreason to assume the flavin to be more mobile in wild-type GR than in the mutantslacking the tyrosine. In fact, temperature and viscosity dependencies of the fluorescencelifetime data indicated a more flexible protein structure for the GR Tyr177 mutantenzymes. The rigidity of the microenvironment of the isoalloxazine ring of the flavin thatwas observed in fluorescence lifetime data of wild-type GR is in agreement withcrystallographic studies revealing very low B-factors for the entire active centre of GR(<B> ≈ 10 Å2 in erythrocyte GR; Karplus & Schulz 1987; Mittl & Schulz, 1994). For E.coli GR as well as human erythrocyte GR, the isoalloxazine ring of FAD is very rigidlybound (<B> = 9.1/7.9 Å2 and <B> = 8.7 Å2, respectively), and cofactor mobilitygradually increases towards the adenine end (<B> = 22.9/17.1 Å2 and <B> = 16.2 Å2,respectively). On the basis of these data, the difference in fluorescence depolarizationbehaviour between wild-type GR and the tyrosine mutants has led us to propose a novelmechanism for fast anisotropy decay: flavin fluorescence depolarization may arise from

Chapter 3
76
the formation of a charge-transfer (CT) complex between the light-excited flavin and theadjacent tyrosine, under condition that the direction of the emission dipole moment in theCT complex is shifted (van den Berg et al., 1998).
Firm support for this depolarization mechanism has been obtained from studies onbinary complexes between wild-type E. coli GR and substrate analogues. The absence offast depolarization upon blocking the position of the flavin-shielding tyrosine in either the'out' or the 'in' conformation provides further evidence for the involvement of aninteraction with this particular tyrosine residue. In crystallographic studies on the E. coliGR/NADP+ complex, the displacement of Tyr177 to the 'out' position (Fig. 3.1) wasdirectly related to the degree of occupation of the nicotinamide binding site (Mittl et al.,1994). Crystals of human erythrocyte GR soaked with the analogue 2'P-5'ADP-riboselacking the nicotinamide moiety, showed Tyr197 in the 'out' conformation in ~30% of themolecules (Pai et al., 1988). As the pyrophosphate moiety of this analogue bound with anoccupancy of ~60%, it was concluded that the 'ribose-in/Tyr197-out' conformation andthe 'ribose-out/Tyr197-in' conformation of the complex with 2'P-5'ADP-ribose are closein energy under crystallization conditions. Based on the crystallographic analysis of aseries of fragments and analogues Pai et al. (1988) concluded that for movement of thetyrosine a ligand extending from adenine to at least the N-ribose was required. As thebinding affinity for the ligands decreased from the adenine end towards the nicotinamideend, they suggested that productive binding of NADPH starts with binding of the adeninemoiety to the preformed 2'-phosphate binding site, followed by an 'induced fit' movementof Tyr197 by the nicotinamide moiety. Important for the displacement of the flavin-shielding was the small rotation of the α-helical residues 196-201 observed: because ofsteric effects, the ribose cannot bind properly without a movement of the side chains ofTyr197 and in particular Ile198. Although for E. coli GR, no crystallographic data ofcomplexes with fragments of NADPH are available, similar effects and mechanisms areexpected on the basis of the very high similarity of the active site structures of the E. coliand human erythrocyte enzyme (Mittl & Schulz, 1994). The fact that human erythrocyteGR and its mutant Y197S behaved identical to the corresponding E. coli enzymes in bothfluorescence intensity decay and fluorescence depolarization (albeit with somewhatdifferent time constants and amplitudes) is in accordance with this.
The dynamic origin of the fluorescence depolarization process in GR is clearlyconfirmed by its strong temperature and viscosity dependencies. Whereas increasingtemperature accelerated fluorescence depolarization, increasing solvent viscosity slowedthe process down. The rapid fluorescence depolarization in GR may thus reflect arelaxational process during the lifetime of the excited state of the flavin involving the

Time-resolved flavin fluorescence depolarization in E. coli GR: …
77
flavin shielding tyrosine. Light excitation itself is known to induce rapid (vibrational)relaxation of the protein environment near the fluorophore. This effect, similar to solventrelaxation of chromophores free in solution, generally takes place on time scales offemtoseconds to several picoseconds and affects the direct environment of thechromophore. The nanosecond fluorescence depolarization reported in this study istherefore likely to originate from a process that is either not, or indirectly influenced (e.g.through dipolar effects or long-range interactions) by light excitation. As the fluorescencedepolarization signal in E. coli GR is only carried by photons from the minor fraction ofGR molecules in which flavin fluorescence is not quenched almost instantaneously (α ≈90% for τ = 7 ps), an explanation for the nanosecond time constant may be relaxationfrom Tyr177 from a more 'out' position at the moment of excitation, to the 'in' postion inwhich the flavin and tyrosine can interact. It may be that in a fraction of the enzymemolecules the Tyr177 remains in an 'out' position throughout the lifetime of the excitedstate. Although the results of the associative fitting are certainly not conclusive, the(partial) correlation of the longest lifetime with overall protein tumbling and homoenergytransfer may be indicative for this.
All together, the fluorescence lifetime and fluorescence depolarizationexperiments on wild-type GR and the tyrosine mutants, supported by the substrate-binding, temperature and viscosity experiments as well as crystallographic data, provideevidence for a novel mechanism of flavin fluorescence depolarization: during the lifetimeof the excited state the flavin interacts with the nearby tyrosine and a CT complex isgenerated in which the emission dipole moment of the flavin is shifted. The basis for acharge-transfer mechanism for ultrafast fluorescence quenching in E. coli GR wasdiscussed thoroughly in Chapter 2 (van den Berg et al., 1998, and references therein).Firm evidence for the formation of CT complexes between the light-excited isoalloxazinering and juxtaposed tyrosine and tryptophan residues through photoinduced electrontransfer was recently also provided in time-resolved fluorescence and absorption studieswith femtosecond resolution on the flavoproteins glucose oxidase and riboflavin-bindingprotein (Zhong & Zewail, 2001).
To observe fluorescence depolarization in a rigid CT complex, two prerequisitesshould be met: first, the direction of the emission dipole moment of the CT complexshould shift with respect to that of the fluorophore itself. The relation between thedirection of the emission dipole moment and the initial anisotropy r0, which is equivalentto the time-dependent anisotropy r(t) in a rigid system without further interactions, isgiven by (Lakowicz, 1999):

Chapter 3
78
−=2
1cos352 2
0θr (11)
where θ is the angle between the absorption and the emission dipole moments, and cos2 θdescribes the average value for the angular displacement. Under the assumption that theend value of the anisotropy decay only reflects the CT complex, a very crude estimationfor the angular displacement in wild-type GR (293 K) is ~36-48° (Fig. 3.8). Thisestimation almost certainly oversimplifies the system: it neglects the possibility ofmolecules with a long lifetime of the excited state, that do not form a CT complex, butshow (little) fluorescence depolarization through energy transfer or overall rotation.However, as the tyrosine mutants of E. coli GR point out, the depolarization throughhomoenergy transfer is only very small, and the decrease in anisotropy as a result ofoverall protein tumbling is low due to the much longer time constant (~38 ns). A similarshift in the direction of the emission dipole moment is likely to occur in the rapidlyformed CT complex that leads to the 7 ps fluorescence lifetime constant. Because of thevery short fluorescence lifetime, this major population hardly contributes to thefluorescence depolarization signal, but in principle, it may show up in a decreased valuefor r0, or in the leading edge of the depolarization curve. In the time-resolved fluorescencedata, the leading edge of the fluorescence decay shows an increase in anisotropy withincreasing fluorescence intensity, but significant differences between wild-type E. coliGR and the tyrosine mutants could not be resolved. A setup with a better time resolutionmay yield more insight into such effects.
A second prerequisite for observing fluorescence depolarization from a CTcomplex is that the complex is (partially) emissive. In Chapter 2, it was discussed that theformation of a CT complex may lead to very efficient nonradiative de-excitationpathways. This leaves unimpaired that for the nanosecond depolarization effect, at least afraction of molecules contributing to the phenomenon, must have emitted light. A recentabsorption and fluorescence study with femtosecond resolution on the flavoproteinsglucose oxidase and riboflavin-binding protein leaves such possibility open: for theenzyme glucose oxidase, in which the flavin is surrounded by two tyrosines and twotryptophans (Hecht et al., 1993), transient absorption spectra revealed a rise time for theCT complex comparable to the dominant fluorescence lifetime (τ = 1.8 ps, α = 75%;Zhong & Zewail, 2001). The absorption decay of the CT state showed two components;one of ~30 ps and one of nanoseconds or longer. Zhong & Zewail attributed the decaytimes of the FAD• -/Tyr•+/Trp•+ complexes to possible charge recombination of the FAD• -
/Trp•+ complex in ~30 ps, and that of the FAD• -/Tyr•+ complex to a time constant of more

Time-resolved flavin fluorescence depolarization in E. coli GR: …
79
than a nanosecond. As basis for the proposed slower charge recombination in theflavin/tyrosine CT complex, it was suggested that following photoinduced electrontransfer, proton transfer from the oxidized tyrosine radical to the FAD anion may occur,leading to much longer times necessary for recombination of both the electron and theproton. Although in our opinion, the experiments do certainly not rule out back-electrontransfer from the flavin to the tyrosine in ~30 ps, the existence of long-lived CTinteractions and the observation that CT complexes can also absorb light in the bluespectral region, are certainly interesting. In fluorescence, glucose oxidase showed besidesthe dominant fluorescence lifetime time of 1.8 ps, a second lifetime component of 10 ps,and minor components (1-3%) in the nanosecond region (Zhong & Zewail, 2001). Thelatter were attributed to the presence of free flavin in the samples. As the fluorescence up-conversion experiments did not yield anisotropy information, comparison with thefluorescence depolarization effects reported in this study is not possible.
Figure 3.8: Schematic representation of the interaction causing depolarization by achange in direction of the emission transition moment from the initial 'in-plane' (ofthe isoalloxazine ring) direction (µem) to an 'out-of-plane' direction corresponding tothe emission transition moment of the charge-transfer excited state (µct). The anglebetween the absorption and emission dipole moments in the CT complex is roughlyestimated between ~36-48°. The example is taken from the structure of E. coli GR.
Tyr 177 µct
µem

Chapter 3
80
Similar fluorescence depolarization phenomena as reported here have also beenobtained for NADH peroxidase (Visser et al., 1998). The active-site structure of thisrelated tetrameric peroxide reductase shows strong similarities with that of GR; on the re-side of the isoalloxazine ring, a nearby tyrosine residue (Tyr159) blocks the NADH-binding site (Stehle et al., 1991). As with GR, crystallographic analysis revealed thatbinding of the nicotinamide cofactor is coupled with a movement of this tyrosine awayfrom the flavin (Stehle et al., 1993). Time-resolved fluorescence anisotropy experimentson wild-type NADH peroxidase revealed a rapidly depolarizing process with a timeconstant similar to that of GR (Visser et al., 1998). In the mutant enzyme NADHperoxidase Y159A, this rapid depolarization no longer appeared and the remaining smallamount of depolarization was only determined by homoenergy transfer between the fourflavins in the tetramer. Besides a temperature dependence, the rapid depolarization inwild-type enzyme also showed a clear wavelength dependence. On the red side of theemission spectrum (567 nm), depolarization occurred faster than on main-band detection(526 nm), which confirms the relaxational character of the process: the formation of atransient complex between the light-excited flavin and the tyrosine results in a morestabilized charge-transfer excited state, that is hence redshifted compared to the first-excited singlet state. In analogy with GR, the rapid depolarization in NADH peroxidasewas attributed to a transient interaction between the tyrosine and the light-excited flavin.The similarity of the phenomena in both flavin proteins indicate that the formation of acharge-transfer complex, in which the emission dipole moment moves out of the plane ofthe isoalloxazine ring may well be a general mechanism of flavin fluorescencedepolarization in systems that allow relaxation of an aromatic amino acid positioned atVan der Waals distance of the isoalloxazine ring.
Acknowledgement
We are very much obliged to Prof. Dr. R.H. Schirmer and Dr. K. Becker (Heidelberg University,Germany), for the kind gift of the GR enzymes from human erythrocytes, and for stimulatingdiscussions and fruitful suggestions. We wish to thank Prof. Dr. R.N. Perham for the pleasant co-operation on the E. coli GR enzymes and the hospitality in his laboratory. We thank Dr. W.J.H.van Berkel and Prof. Dr. C. Laane for discussions and support.

4Exploring the conformational equilibrium ofEscherichia coli thioredoxin reductase:characterization of two catalytically importantstates by ultrafast flavin fluorescencespectroscopy
This Chapter has been published as:van den Berg, P.A.W., S.B. Mulrooney, B. Gobets, I.H.M. van Stokkum, A. van Hoek, C.H.
Williams Jr., and A.J.W.G. Visser. 2001. Protein Sci., 10, 2037-2049.
The conformational dynamics of wild-type Escherichia coli thioredoxin reductase(TrxR) and the mutant enzyme C138S were studied by ultrafast time-resolvedfluorescence of the flavin cofactor in combination with circular dichroism (both in theflavin fingerprint and far-UV regions) and steady-state fluorescence and absorptionspectroscopy. The spectroscopic data show two conformational states of the enzyme(named FO and FR), of which the physical characteristics differ considerably. Ultrafastfluorescence lifetime measurements make it possible to distinguish between the twodifferent populations: dominant picosecond lifetimes of ~1 ps (contribution 75%) and 7ps (8%) are associated with the FO species in TrxR C138S. Long-lived fluorescence withtwo time constants in the range of 0.2 to 1 ns (total contribution 17 %) originates fromenzyme molecules in the FR conformation. The near absence of fast lifetime componentsin oxidized wild-type TrxR supports the idea of this enzyme being predominantly in theFR conformation. The emission spectrum of the FO conformation is blueshifted withrespect to that of the FR conformation. Because of the large difference in fluorescencecharacteristics, fluorescence measurements on time scales longer than 100 ps are fullydetermined by the fraction of enzyme molecules in the FR conformation. Binding of thethiol-specific reagent phenyl mercuric acetate to both wild-type enzyme and TrxR C138Sstabilizes the enzymes in the FR conformation. Specific binding of the NADPH-analogueAADP+ to the FR conformation resulted in dynamic fluorescence quenching in support ofthe multiple quenching sites model. Raising the temperature from 277 K to 323 Kresulted in a moderate shift to the FR conformation for TrxR C138S. High concentrationsof the cosolvent glycerol triggered the domain rotation from the FO to the FRconformation.

Chapter 4
82
4.1 Introduction
Indications for the involvement of conformational dynamics in the catalyticmechanism of enzymes often arise from a conflict between structural and kinetic data.For many enzymes such as, e.g., alcohol dehydrogenase (Eklund et al., 1981) andglutathione reductase (Pai & Schulz, 1983), the resolution of the three-dimensionalsolution structure of the protein raised as many questions as it solved: prerequisites forcatalysis such as substrate binding, product release or interactions between differentcatalytic groups involved, could often not be clarified on the basis of the structural data.Mobility of the peptide chains then offers a likely explanation. For a number of enzymesincluding, e.g., citrate synthase (Remington et al., 1982; Lesk & Chotia, 1984) andadenylate kinase (Schulz et al., 1990; Gerstein et al., 1993b), the occurrence of largeconformational changes during catalysis has indeed been confirmed by X-ray structuresof free protein and protein/substrate (analogue) complexes. Movements of completeprotein domains can then play a prominent role (for review, see Gerstein et al., 1994).
From the point of view of domain motions, a particularly interesting enzyme is theflavoprotein thioredoxin reductase from Escherichia coli. Thioredoxin reductase (TrxR)is a member of the pyridine-nucleotide oxidoreductase family, which includes glutathionereductase, lipoamide dehydrogenase and NADH peroxidase (for reviews, see Williams,1992, 1995). The enzyme catalyses the NADPH-dependent reduction of the singledisulfide bridge in the protein substrate thioredoxin (Mr = 11,700) (Moore et al., 1964;
Holmgren, 1968). Thioredoxin is involved in a variety of cellular processes, includingribonucleotide reduction (Thelander, 1967; Holmgren, 1989), and protein folding(Yasukawa et al., 1995).
The features and redox properties of TrxR enzymes from various organisms havebeen studied extensively (Williams 1992, 1995; Arscott et al., 1997, and referencestherein; Wang et al., 1999; Williams et al., 2000). The enzymes can be divided into twoclasses, based on differences in molecular weight, amino acid sequence homology, andcatalytic mechanism. High-molecular weight thioredoxin reductases from highereukaryotes resemble other oxidoreductases like glutathione reductase and lipoamidedehydrogenase in both structure and mechanism (Arscott et al., 1997). However, low-molecular weight TrxRs occurring in prokaryotes, fungi and plants appear to be moredistinctly related (Kuriyan et al., 1991; Arscott et al., 1997; Williams et al., 2000).
E. coli thioredoxin reductase (EC 1.6.4.5) is a homodimeric enzyme that containsone redox-active disulfide bridge and one molecule of FAD per subunit of Mr = 35,300.

Exploring the conformational equilibrium of E. coli TrxR:…
83
The protein has a high affinity for the noncovalently bound flavin cofactor (Moore et al.,1964; Thelander, 1967; Williams et al., 1967). E. coli thioredoxin reductase uses aternary complex mechanism (Lennon & Williams, 1995). During catalysis, the enzymeshuttles between the two-electron-reduced and four-electron-reduced state (Lennon &Williams, 1996). From kinetic studies on the reductive half-reaction of the enzyme, athree-phase mechanism has been proposed in which the rate-limiting step is attributed toa gross conformational change of the protein (Lennon & Williams, 1997).
Indications for the requirement of a large conformational change first arose fromthe high-resolution crystal structure of the free enzyme (Kuriyan et al., 1991; Waksman etal., 1994). In these studies it was shown that each TrxR monomer consists of an NADPH-binding domain and an FAD-binding domain, connected by a double-stranded β-sheet.However, no obvious path for the flow of electrons from NADPH to the active-sitedisulfides via the flavin could be found. In the crystal structure, the active-site disulfidesare buried in the protein interior near the flavin ring. However, there is no binding sitepresent for thioredoxin, leaving dithiol-disulfide interchange with the protein substrateunexplained. Moreover, NADPH is bound 17 Å away from the flavin ring, with thenicotinamide ring positioned in a solvent-accessible area. Both NADPH and thedisulfides are located on the re-side of the flavin in such a way that access of the NADPHto the isoalloxazine ring is blocked. By graphically rotating the NADPH domain over
OHSH138135
OHSH
138 135
FAD domain
pyridine nucleotidedomain
FAD domain
FO FR
pyridine nucleotidedomain
PN PN
Figure 4.1: Cartoon representation of TrxR C138S in the FO and FR conformations.The FAD and pyridine nucleotide domains are indicated as triangles and connectedby lines depicting the double-stranded β-sheet. The three circles represent theisoalloxazine ring of FAD, and PN indicates the pyridinium ring of the boundpyridine nucleotide. In the FR conformation, the flavin is in contact with thenicotinamide of bound NADPH or the aminopyridine of bound AADP+; theremaining thiol is at the surface where it can react with thiol reagents stabilizing theFR conformation. In the FO conformation, Cys135 is buried close to the flavin andthe pyridine nucleotide-binding site is exposed. Free enzyme in the FR conformationis relatively fluorescent, whereas in the FO conformation, fluorescence is quenched.Although the rotation between the FO and FR is shown as a 180° in this illustration,it is actually 67°.
Chapter 4
84
66°, Waksman et al. (1994) showed that the problems of juxtaposition could beovercome. In the resulting model, the relative positioning of the FAD-binding andNADPH-binding domains is similar to that of other oxidoreductases such as glutathionereductase. Now, the nicotinamide C4 and the isoalloxazine N5 atoms are in close contactwith both rings parallel to each other, thus allowing efficient hydride transfer. In addition,the redox-active disulfides move to the surface of the protein where they becomeaccessible for the protein substrate. Based on these findings, it was proposed that E. colithioredoxin reductase has two conformational states: the form corresponding to theoriginal crystal structure, in which the disulfide can oxidize the flavin (FO), and aconformation in which the rings of NADPH and FAD are juxtaposed, suitable for dithiol-disulfide interchange with thioredoxin and reduction of the flavin (FR) (Fig. 4.1).
To trap the enzyme in the FR conformation, crosslinked complexes have beenconstructed from mutant forms of thioredoxin and thioredoxin reductase that all had oneof the two active-site cysteines mutated to serine. The remaining active-site cysteine inboth thioredoxin and TrxR was then used to form a covalent bond between the twoproteins. Kinetic studies of TrxR C135S linked to thioredoxin C32S showed that thiscomplex was locked in one conformation, in which indeed FAD could be reduced byNADPH, but the electrons could not be transferred to the active-site disulfide (Wang etal., 1996). Similar results were reported for TrxR C138S complexed with thioredoxinC35S (Veine et al., 1998a).
The properties of the mutant enzyme used in this study, TrxR C138S (Prongay etal., 1989) were recently re-evaluated (Veine et al., 1998a). In contrast to wild-type TrxR,which has a flavin fluorescence quantum yield (Q) comparable to that of lipoamidedehydrogenase (Q = 0.1), TrxR C138S is only slightly fluorescent (7% of that of wtTrxR). This flavin fluorescence quenching was postulated as due to the proximity ofSer138 to the isoalloxazine ring, which occurs in the FO conformation (Mulrooney &Williams, 1997). Steady-state flavin fluorescence studies on wt TrxR and TrxR C138Swere performed to find support for the existence of both FO and FR conformations insolution. It was proposed that in the mutant enzyme TrxR C138S, the FO conformation isstabilized by a hydrogen bond between the serine residue and the N5 atom of the flavinring system. Results from intrinsic fluorescence spectra, fluorescence titrations with thethiol-specific reagent phenylmercuric acetate (PMA) and the NADPH analogue 3-aminopyridine adenine dinucleotide (AADP+), as well as from absorption and limitedproteolysis experiments, agreed with the model that in solution, the FO and FRconformations are in equilibrium. Only recently, crystal structure analyses of thecrosslinked enzyme-protein substrate complex have indeed shown the existence of this

Exploring the conformational equilibrium of E. coli TrxR:…
85
FR conformation of E. coli thioredoxin reductase (Lennon et al., 2000): the structure ofthis complex resolved at 3.0 Å revealed a conformation in which the pyridine nucleotidedomain was rotated by 67° with respect to the structure of the free enzyme.
More details of the conformational dynamics can be revealed using high time-resolution spectroscopic techniques. Time-resolved flavin fluorescence detection offersthe unique possibility of probing the dynamic processes right on the site where catalysisoccurs. The flavin fluorescence lifetime spectrum is very sensitive to the specificenvironment of the isoalloxazine and amino acid motions that alter thismicroenvironment. In addition, mobility of the flavin cofactor during the lifetime of theexcited state can be visualized by time-resolved fluorescence anisotropy detection.Recent time-resolved flavin fluorescence studies on the oxidoreductases glutathionereductase and NADH peroxidase have yielded profound information on the proteindynamics, conformational stability, and mechanism of fluorescence quenching in theseenzymes (van den Berg et al., 1998; Visser et al., 1998).
In this study, time-resolved flavin fluorescence is used to monitor theconformational dynamics of E. coli thioredoxin reductase. Sub-picosecond resolutionfluorescence lifetime data in combination with fluorescence lifetime and fluorescenceanisotropy data on a picosecond-to-nanosecond time scale, show two different proteinconformational states and yield a picture of the dynamic behaviour of the active site.Binding of substrate (analogues) and a specific thiol reagent is used to trap the enzyme inone conformational state. Variations in temperature and concentration of the cosolventglycerol serve as complementary approaches to influence conformational dynamics.Time-resolved fluorescence data are supported by fluorescence and absorption spectraand circular dichroism (CD) spectra in the visible light region, which show cleartransitions in the direct microenvironment of the flavin.
4.2 Materials and Methods
Enzymes and sample preparation
Wild-type TrxR was purified from E. coli strain A326, which contains aninsertion in the genomic TrxR gene (Russel & Model, 1986), transformed with therecombinant plasmid pTrR310 (Mulrooney, 1997). TrxR C138S was expressed from therecombinant plasmid pTrR336 as described elsewhere (Mulrooney & Williams, 1997).Both enzymes were purified as described previously (Mulrooney, 1997). Pure enzymeswere stored in 80% ammonium sulfate at 277 K. All chemicals used were of the highestpurity available, and buffers were filtered through a 0.22 µm filter (Millipore).

Chapter 4
86
After centrifugation, 1 mM of DTT was added to the resuspended TrxR C138S toremove potential sulfenic acid adducts on Cys135. For both wild-type and mutant TrxR, aBiogel PGD-6 column (Biorad) equilibrated with the appropriate measuring buffer, wasused to remove undesired buffer contents and possible traces of free FAD. Standardspectroscopic measurements were carried out in 50 mM potassium phosphate buffer pH7.6 at 293 K. The enzyme concentration was based on the FAD content: ε456 wt TrxR = 11.3mM-1cm-1 (Williams et al., 1967), ε448 TrxR C138S = 11.8 mM-1cm-1 (Mulrooney &Williams, 1997). Preparation of TrxR C138S-PMA (ε455 = 12.3 mM-1cm-1) wasperformed by adding 3-5 equivalents of PMA to the protein after gel chromatography(Mulrooney & Williams, 1997). For time-resolved fluorescence measurements, excessPMA was removed by gel filtration over a Biogel PGD-6 column. Wt TrxR was firstanaerobically reduced by adding 5 equivalents of NADPH. After subsequent reactionwith 3 equivalents of PMA for 15 minutes, the sample was reoxidized by air. ExcessPMA and NADPH were removed from the enzyme preparations by a second gel filtrationover a Biogel PGD-6 column. Samples containing glycerol were prepared by gentlymixing the eluted protein with fluorescent-grade glycerol. As PMA-treatment did notinduce changes in the absorbance spectrum of wt TrxR, the extinction coefficient ofPMA-treated wild-type enzyme was assumed to be ε456 TrxR wt-PMA = ε456 wt TrxR = 11.3mM-1cm-1.
Steady-state spectroscopic measurements
Absorption spectra were obtained using a Hewlett-Packard 8453 UV-Vis diode-array spectrophotometer with a resolution of 1 nm and an integration time of 0.5 sec.Steady-state fluorescence emission spectra were recorded on a SPEX Fluorolog 3-2.2spectrofluorimeter with a slit width corresponding to a spectral resolution of 2 nm forboth excitation and emission, and an integration time of 1 sec. The spectra were correctedfor the wavelength dependency of the setup. The samples had a maximum OD of 0.10 atthe wavelength of excitation (450 or 456 nm). CD-spectra were obtained using a Jasco715 spectropolarimeter with a Jasco PTC 348 WI temperature controller. In the flavinfinger-print region (300-600 nm) 4 or 9 spectra with a resolution of 0.2 nm, a scan speedof 50 nm/min and a response time of 1 sec were accumulated. In the far-UV region,typically 9 or 16 spectra (resolution 0.1 nm, response time 1 sec, scan speed 20 nm/sec)were averaged. Secondary structure determination was performed via ridge regressionanalysis with the CONTIN programme based on a set of 16 protein structures(Provencher & Glöckner, 1981). All steady-state spectroscopic measurements wereperformed at 293 K and corrected for background contributions.

Exploring the conformational equilibrium of E. coli TrxR:…
87
Time-resolved fluorescence and fluorescence anisotropy measurements
Polarized time-resolved fluorescence experiments were carried out using the time-correlated single-photon counting technique (TCSPC). The complete TCSPC setup aswell as the measurement procedures used were recently described in detail (van den Berget al., 1998; Visser et al., 1998). A mode-locked CW Nd:YLF laser was used forsynchronously pumping a cavity-dumped Stilbene 420 dye laser. The samples wereexcited with vertically polarized light of 450 nm with an excitation frequency of 594 kHz(duration 4 ps FWHM). Both parallel and perpendicularly polarized fluorescence wasdetected through a 557.9 nm interference filter (Schott, Mainz, Germany, half-bandwidthof 11.8 nm) in combination with a KV 520 cut-off filter (Schott). The data were collectedin a multichannel analyzer with a time window of 1024 channels at a typical 7.0ps/channel. The dynamic instrumental response function of the setup is approximately 40ps FWHM, which makes registration of 5-10 ps lifetime components realistic. Theinstrumental response was obtained at the emission wavelength using erythrosine B inwater (τ = 80 ps at 293 K) as a reference compound (Bastiaens et al., 1992b). Thetemperature of the samples was controlled using a liquid nitrogen flow setup with atemperature controller (model ITC4, Oxford Instruments Inc., Oxford, UK).
Analysis of the fluorescence intensity decay I(t) and anisotropy decay r(t) wasperformed using the software package from Maximum Entropy Solutions Ltd. (Ely, UK).With the maximum entropy method, the fluorescence intensity and anisotropy decays aredescribed in terms of a continuous distribution of decay times, for which no a prioriknowledge of the system is required. A detailed description of the principles of MEM andanalysis of the polarized fluorescence data can be found elsewhere (Livesey & Brochon,1987; Bastiaens et al., 1992b; Brochon, 1994; van den Berg et al., 1998). The lifetimespectrum α(τ) is obtained from the total fluorescence I(t) via the inverse Laplacetransform:
∫∞ −=
0
/)(*)()( ττα τ detEtI t(1)
where E(t) is the instrumental response function. The lifetime spectrum recoveredconsisted of 150 decay times equally spaced in log(τ) space between 1 ps and 10 ns. Theaverage fluorescence lifetime <τ> was calculated from the lifetime spectrum α(τ), whereN is the number of τi values of the α(τ) spectrum:

Chapter 4
88
⟨τ ⟩ =α iτ i
i =1
N
∑α i
i =1
N
∑(2)
Streak camera measurements
The protein sample (30 µM) was mounted in a rotating optical cell with a lightpath of 3 mm. Measurements were performed at room temperature (298 K). Femtosecondlaser pulses were generated at a 100 kHz repetition rate using a titanium:sapphire-basedoscillator (Coherent MIRA), a regenerative amplifier (Coherent REGA), which pumpedan Optical Parametric Amplifier (Coherent OPA-9400), of which the 920 nm idler outputwas frequency doubled to create excitation light at 460 nm. The protein samples wereexcited with linearly polarized light with a wavelength of 460/462 nm, a pulse frequencyof 200/125 kHz and a pulse energy of ~5-10 nJ. The excitation light was put through a 15cm focal length lens, resulting in a focus of 150 µm in the sample. The optical cell wasrotating with 300 rpm, to minimize protein damage by light accumulation effects. Flavinfluorescence was collected using a Hamamatsu C5680 synchroscan streak camera with aChromex 250IS spectrograph with 8 nm resolution. Wild-type and C138S TrxRfluorescence was detected at right angle to avoid contamination by scattered excitationlight. The streak images were recorded on a Hamamatsu C4880 CCD camera which wascooled to 218 K. In order to optimise the accuracy of both short- and the long-livedcomponents, fluorescence data were recorded in two time windows of 200 ps and 2 ns,respectively. The FWHM of the time response of the system was 3-3.5 ps at the 200 pstime range and 15-20 ps at the 2 ns time range. The streak images were backgroundsubtracted and corrected for difference in sensitivity in the time domain by division by astreak image of a diffuse continuous white light source (shading correction). Wavelength-dependent temporal shifts of the time-zero point on the CCD image caused by the lightcollecting optics, the streak camera and the spectrograph were corrected using white lightpulses, for which the dispersion was calibrated using the optical Kerr signal in CS2(Greene & Farrow, 1983). The corrected and averaged images were reduced to a matrixof 950 points in time and 44 points in wavelength. Data of the 200 ps and 2 ns timewindow were evaluated simultaneously in a global analysis fitting procedure (vanStokkum et al., 1993), in which the data were deconvolved with the (Gaussian shaped)instrument response. The width of this Gaussian was a free parameter of the fit (typically,3 ps FWHM). All measurements were analyzed using a model with parallelly decayingcomponents, which yields Decay Associated Spectra (DAS).

Exploring the conformational equilibrium of E. coli TrxR:…
89
4.3 Results
Identification of the FO and FR conformation by ultrafast time-resolved fluorescencespectroscopy
To explore the conformational dynamics of E. coli thioredoxin reductase, a seriesof four different protein/inhibitor combinations was investigated. This set consisted ofwild-type (wt) TrxR, TrxR C138S, and both proteins complexed to the specific thiolreagent PMA, yielding a phenylmercuric adduct on the (remaining) active-centre cysteineresidue. The choice of this combination was based on an earlier study (Mulrooney &Williams, 1997), in which it was proposed that wt TrxR is mainly in the FRconformation, whereas in TrxR C138S, the equilibrium is shifted towards the FOconformation. PMA treatment would force the equilibrium to the FR conformer becauseof steric limitations of the phenylmercuric adduct. According to this model, the time-resolved fluorescence characteristics and the dynamic behaviour of both PMA-treatedproteins should be identical and should resemble those of wt TrxR, whereas TrxR C138Sis expected to display different features.
Despite the large difference in fluorescence quantum yield of wt TrxR and TrxRC138S (fourteen-fold), the flavin fluorescence intensity decays of all four proteinsshowed little difference when measured by (sub)nanosecond-resolved time-correlatedsingle-photon counting (Fig. 4.2A). Analysis of the fluorescence decay of wild-typeprotein at 293 K yielded a fluorescence lifetime distribution containing two well-separated components of ~0.4 ns and ~1.0 ns (Fig. 4.2B). These two lifetime componentswere found to be predominant in the lifetime spectra of TrxR C138S and the PMA-treated enzymes as well. The exact time constants of the components in the latter threeenzymes were slightly shorter than in wt TrxR (difference of ~0.02-0.05 ns and ~0.05-0.1ns, respectively), whereas the relative amplitude of the longest lifetime was somewhatsmaller (Table 4.1). These slight differences are indicative of a minor change in structureor dynamics of the microenvironment of the flavin. The lifetime spectra of both PMA-treated enzymes were identical. Besides the above-mentioned two predominantcomponents, a short lifetime of ~100 ps was found to contribute to the fluorescencedecay. The lifetime pattern of TrxR C138S contained an ultrafast component in mostmeasurements. This component was analyzed to be of the order of 5 ps, which is on theborder of the detection limit of the TCSPC setup used.

Chapter 4
90
Figure 4.2: The experimental total fluorescence decay (A) and fluorescence lifetimedistributions (B) of wild-type TrxR, TrxR C138S, TrxR wt-PMA and TrxR C138S-PMA in 50 mM potassium phosphate buffer pH 7.6, at 293 K. Experimental data(grey) and fitted data (black) overlie very well and can not be distinguished clearly.The experimental decay of the reference compound, erythrosine B (τ = 80 ps), is alsogiven. In the fluorescence lifetime spectra a vertical offset has been applied forclarity. Because of the resolution limitations of the TCSPC setup used, the amplitudeand time constant of the ultrafast component in TrxR C138S could not be determinedaccurately (see text).
A
time (ns)0 1 2 3 4
0
20
40
60
80
100
B
20
15
10
5
0
25
0.001 0.01 0.1 1 10τ (ns)
C138S-PMA
wt-PMA
wt
C138S
45
40
30
35
norm
aliz
ed fl
u. in
t.α(
τ) x
10-3
C138SC138S-PMA
wt-PMAwt
reference

Exploring the conformational equilibrium of E. coli TrxR:…
91
Table 4.1: Temperature dependence of the barycentres and fractional contributions of thethree longest fluorescence lifetime components of wt TrxR, TrxR C138S and the PMA-complexes of both enzymes as measured with TCSPC.(1)
277 K 285 K 293 K 303 K 313 K 323 K
τ1 - - - 0.090 ± 0.02 0.090 ± 0.01 0.085 ± 0.01
α1 - - - 0.050 ± 0.01 0.12 ± 0.03 0.19 ± 0.04
τ2 0.55 ± 0.03 0.44 ± 0.01 0.42 ± 0.03 0.41 ± 0.02 0.39 ± 0.02 0.38 ± 0.01
α2 0.55 ± 0.05 0.52 ± 0.11 0.47 ± 0.06 0.49 ± 0.09 0.43 ± 0.09 0.41 ± 0.07
τ3 1.35 ± 0.05 1.15 ± 0.04 0.99 ± 0.05 0.93 ± 0.03 0.83 ± 0.02 0.79 ± 0.03
wt
α3 0.44 ± 0.05 0.48 ± 0.11 0.51 ± 0.07 0.46 ± 0.09 0.44 ± 0.09 0.37 ± 0.06
τuf ++ ++ ++ ++ ++ ++
αuf ++ ++ ++ ++ ++ ++
τ1 - 0.11 ± 0.04 0.094 ± 0.02 0.089 ± 0.01 0.097 ± 0.01 0.092 ± 0.01
α1 - 0.06 ± 0.05 0.09 ± 0.02 0.12 ± 0.03 0.17 ± 0.03 0.22 ± 0.03
τ2 0.40 ± 0.01 0.39 ± 0.01 0.39 ± 0.01 0.36 ± 0.04 0.36 ± 0.01 0.35 ± 0.01
α2 0.62 ± 0.03 0.60 ± 0.09 0.56 ± 0.09 0.55 ± 0.09 0.54 ± 0.09 0.51 ± 0.06
τ3 1.04 ± 0.04 0.97 ± 0.03 0.92 ± 0.03 0.83 ± 0.03 0.78 ± 0.03 0.73 ± 0.02
C138S
α3 0.36 ± 0.02 0.35 ± 0.06 0.32 ± 0.05 0.30 ± 0.06 0.26 ± 0.05 0.27 ± 0.04
τ1 - 0.089 ± 0.01 0.093 ± 0.01 0.090 ± 0.01 0.089 ± 0.01 0.089 ± 0.01
α1 - 0.09 ± 0.02 0.14 ± 0.03 0.21 ± 0.04 0.24 ± 0.03 0.29 ± 0.02
τ2 0.42 ± 0.02 0.42 ± 0.02 0.40 ± 0.02 0.40 ± 0.02 0.38 ± 0.02 0.37 ± 0.01
α2 0.57 ± 0.11 0.50 ± 0.07 0.48 ± 0.09 0.47 ± 0.08 0.42 ± 0.06 0.44 ± 0.04
τ3 1.03 ± 0.04 0.97 ± 0.03 0.90 ± 0.03 0.84 ± 0.03 0.78 ± 0.02 0.78 ± 0.03
wt-PMA
α3 0.44 ± 0.08 0.40 ± 0.06 0.39 ± 0.07 0.33 ± 0.06 0.30 ± 0.04 0.26 ± 0.02
τ1 - 0.11 ± 0.02 0.11 ± 0.01 0.088 ± 0.01 0.086 ± 0.01 0.091 ± 0.01
α1 - 0.04 ± 0.02 0.13 ± 0.02 0.22 ± 0.02 0.29 ± 0.05 0.34 ± 0.04
τ2 0.41 ± 0.01 0.39 ± 0.01 0.39 ± 0.02 0.37 ± 0.01 0.36 ± 0.01 0.36 ± 0.01
α2 0.65 ± 0.12 0.60 ± 0.11 0.54 ± 0.06 0.48 ± 0.05 0.44 ± 0.07 0.43 ± 0.05
τ3 1.00 ± 0.03 0.91 ± 0.03 0.87 ± 0.04 0.82 ± 0.03 0.77 ± 0.02 0.76 ± 0.04
C138S-PMA
α3 0.35 ± 0.06 0.41 ± 0.07 0.31 ± 0.05 0.28 ± 0.04 0.26 ± 0.04 0.21 ± 0.04
(1): In TSCPC measurements, the time constant and amplitude of the ultrafast component could not beresolved accurately. The presence of this component in the lifetime spectra of TrxR C138S istherefore depicted with ++. Amplitudes were normalized excluding the amplitude of the ultrafastcomponent. The lifetime spectra of wild-type TrxR revealed a component of 90 ps at temperaturesof 303 K and higher, while the spectra of the TrxR C138S and the PMA/enzyme complexesrevealed this component at temperatures from 285 K.

Chapter 4
92
Figure 4.3: Absorption spectra (A) and flavin fingerprint CD spectra (B) of 20 µMwt TrxR, TrxR C138S, TrxR wt-PMA (ε456 estimated to be identical with wt TrxR)and TrxR C138S-PMA in 50 mM potassium phosphate buffer pH 7.6, at 293 K. Theellipticity is represented by θ.
The close resemblance of the fluorescence lifetime patterns of the four enzymeforms was difficult to reconcile with the clear differences found in absorptionspectroscopy (Fig. 4.3A) and steady-state fluorescence intensity. CD spectra in the visiblelight region, the so-called 'flavin fingerprint spectra', confirmed the dissimilarity in thephysical nature of the flavin microenvironment in TrxR C138S on the one hand, andthose in wt TrxR and the PMA-treated enzymes on the other (Fig. 4.3B). Close inspectionof the fitted fluorescence intensity decay of TrxR C138S revealed that the steep leading
A
wavelength (nm)
C138S
wt-PMA wt C138S-PMA
abso
rptio
n
C138S
wt-PMA wt C138S-PMA
B
0.25
0.20
0.15
0.05
0.00
0.10
600550500450400350
600550500450400350300
wavelength (nm)
0.3
0.2
0.1
0.0
-0.1
-0.2
[θ] (
deg
mM
-1 cm
-1)

Exploring the conformational equilibrium of E. coli TrxR:…
93
edge could not be fitted optimally with the lifetime component of ~5 ps. In addition, theamplitude of the ultrafast component as well as its precise time constant proved to behighly dependent on the exact analysis parameters. These features may suggest anextremely fast process on a (sub)picosecond time scale.
The possibility of such an ultrafast process was examined using subpicosecond-and wavelength-resolved fluorescence spectroscopy via a streak camera setup. With thismethod, the time resolution was increased up to 0.5-1 ps. The images, containingfluorescence intensity information in one dimension and spectral information in thesecond dimension, were analyzed through a global analysis procedure to yield theminimal number of spectral and temporal components needed to describe the data. Timetraces of images of the proteins at 500 nm, showing both the experimental fluorescenceintensity in the first 200 ps (partly logarithmic scale), and the corresponding fits, arepresented in Figure 4.4. Now, the enzymes show a clearly different picture: for TrxRC138S, the experimental time trace at 500 nm shows a predominant ultrafast decay,which is completely absent in that of wt TrxR.
For wt TrxR, analysis of the data again yielded two lifetime components, withtime constants of 0.25 and 0.93 ns, matching closely the TCSPC data. The DAS of thesetwo lifetime components are identical and agree with the steady-state fluorescencespectrum of wt TrxR (Fig. 4.5A). For TrxR C138S, however, more lifetime componentswere needed to describe the fluorescence decay (Fig. 4.5B). Two ultrashort lifetimes of1.2 ps and 7.3 ps determine the ultrafast fluorescence decay of the mutant enzyme with amain contribution of the 1.2 ps component (74.9% and 8.1%, respectively). The twolong-lived components found correspond to those observed for wt TrxR, having identicaldecay associated spectra and again, as in the TCSPC experiments, somewhat shorter timeconstants (0.18 ns (contribution 5.5%) and 0.74 ns (11.6%), respectively). The DAS ofthe ultrashort components, however, are ~8 nm blueshifted from these of the longercomponents and the spectra found for wild-type enzyme. In this case, it is legitimate tointerpret the DAS as species-associated spectra: the ultrashort components are thusrelated to a separate conformational state in which the flavin experiences a completelydifferent environment from the one in wild-type enzyme. Based on the resolvedamplitudes corresponding to the two enzyme species, 83% of the oxidized TrxR C138S isfound in the FO conformation. As the dominant lifetime component is still close to thedetection limit of the setup and any static fluorescence quenching occurring in the TrxRC138S enzyme is not taken into account, this percentage is expected to be anunderestimation. (From a 14-fold difference in fluorescence quantum yield between wt

Chapter 4
94
TrxR and C138S, one would expect a population of FO conformers of ~90%, given thelifetime constants and ratios of amplitudes resolved in the streak camera experiments.)
The structure of the FO conformation can well explain the ultrarapid processesobserved; in the crystal structure, the serine at 138 and the remaining active-site thiol atposition 135, which both act as quenching sites, are at Van der Waals distance of theflavin or closely to it (see Discussion). A charge-transfer reaction, such as a hydrogen orelectron transfer from the thiol group, or a transient hydrogen bond between the hydroxylgroup of the serine and the N5 atom of the flavin is likely to be the origin of the ultrafastprocesses observed. Wt TrxR in the FO conformation has the disulfide bridge juxtaposedto the flavin instead of the above-mentioned quenching sites. Disulfide bridges, however,have also been reported as fluorescence quenching sites (van den Berg et al., 1998, andreferences therein). The absence of short fluorescence lifetime components for wild-typeTrxR is consistent with the idea that oxidized wild-type enzyme predominantly has the
-20 0 20 200
-20 0 20 200
A
B
1.0
0.0-20 0 20 200
time (ps)
flu. C
138S
( λem
=500
nm
)C
138S
( λem
=50
0 nm
)flu
. wt (
λ em=5
00 n
m)
0.04
res
-0.0
4
-20 0 20 200
0.04
res
-0.0
4
1.0
0.0
Figure 4.4: (Sub)picosecond streak camera data of wt TrxR and TrxR C138S in 50mM potassium phosphate buffer pH 7.6, at 298 K. Experimental time trace at 500nm (solid) together with fit (dashed) of wt TrxR (A) and TrxR C138S (B). Insetsshow residuals. The time base from -20 to +20 ps (relative to the maximum of theinstrument response) is linear, and from 20 to 200 ps is logarithmic.

Exploring the conformational equilibrium of E. coli TrxR:…
95
FR conformation (Mulrooney & Williams, 1997). Although it could not clearly beresolved, a small population of FO conformers (estimated between 1 and 5%) might behidden in the residual 16 ps lifetime component with an extremely low amplitude foundin the fits of the wild-type enzyme (Fig. 4.5A). Experiments with the PMA-treatedenzymes confirmed the interpretation of two conformational states: TrxR C138S-PMAand TrxR wt-PMA gave identical results with similar decay-associated spectra andlifetime components as found for wild-type enzyme except for a minor contribution of alifetime component near 0.05 ns. The ultrashort lifetime components found for TrxRC138S were completely absent in both PMA-treated enzymes. From the ultrafast
Figure 4.5: Decay Associated Spectra of the individual lifetime components of wtTrxR (A) and TrxR C138S (B). Vertical lines indicate plus or minus standard errorin amplitude. Different DAS are depicted by different line types. Key A: 16 ps(solid), 0.25 ns (dotted), 0.93 ns (dashed), IRF follower (dot-dashed). Key B: 1.2 ps(chain-dashed), 7.3 ps (solid), 0.18 ns (dotted), 0.74 ns (dashed), IRF follower (dot-dashed). Raman scattering at ~555 nm is visible as a shoulder in the 1.2 ps DAS, andas a peak in the IRF follower.
DA
S w
tD
AS
C13
8SA1.0
1.0
-0.1
-0.1
B
480 500 520 540 560 580 600 620
480 500 520 540 560 580 600 620wavelength (nm)
0.93 ns0.25 ns16 pspf
0.74 ns0.18 ns7.3 ps
pf1.2 ps
1.2 ps
Chapter 4
96
fluorescence measurements, in combination with the other spectroscopic data presented,it can therefore be concluded that the PMA-treated enzymes are indeed fully restricted tothe FR conformation.
Substrate analogue binding and the conformational state
In the previous section, it was shown that E. coli TrxR is locked in the FRconformation by reaction with the thiol-specific reagent PMA. Binding of substrates andsubstrate analogues may also shift the dynamic equilibrium and induce conformationaltransitions. A suitable analogue for studying such an effect in TrxR is the oxidizedNADPH analogue AADP+, which binds to wild-type TrxR and the PMA-treated enzymes(Mulrooney & Williams, 1997). In time-correlated single-photon counting experiments,binding of the analogue resulted in an additional very short fluorescence lifetimecomponent of ~10-15 ps (Fig. 4.6). The contribution of the longest lifetime diminished,whereas the contribution of the 100 ps component, which was observed in the PMA-complexes but not previously in the free wt TrxR, was enlarged in all three enzymes.Even under saturating conditions (millimolar concentrations of AADP+), all fourfluorescence lifetime components remained present. These findings confirm the existenceof multiple quenching sites that together determine the heterogeneous fluorescence decayoriginating from a single conformational state (the multiple quenching sites model): bybinding AADP+ to the FR conformers, an additional quenching site is introduced near theflavin, causing rapid fluorescence quenching. The phosphate moiety of AADP+ appearsto be essential for the binding of the NADPH analogue. On titration with millimolarconcentrations of the analogue 3-aminopyridine adenine dinucleotide (AAD+) whichlacks the phosphate moiety, no quenching of the flavin fluorescence was observed.
In contrast to wild-type enzyme, titration of the mutant enzyme TrxR C138S withAADP+, did not lead to significant changes in the lifetime distribution. Because of thenature of free TrxR C138S, in which fluorescence is already strongly quenched,fluorescence quantum yields do not provide a very sensitive tool to observe AADP+-binding to this mutant enzyme. However, from the distinctive lifetime componentintroduced on AADP+-binding, a conformational transition resulting from binding of thisanalogue should have been easy to detect. This supports the earlier conclusion thatAADP+ cannot induce the conformational transition from FO to FR (Mulrooney &Williams, 1997).

Exploring the conformational equilibrium of E. coli TrxR:…
97
Probing the dynamic behaviour
The dynamic behaviour of the TrxR enzymes was examined from fluorescencelifetime data as well as time-resolved anisotropy data. The temperature and viscosity-dependencies of the lifetime spectra of the enzymes were determined in the rangebetween 277 K and 323 K, using glycerol or sucrose as a cosolvent. Fluorescenceanisotropy data were recorded to gain information on the mobility of the flavin cofactoritself. Given the extremely short fluorescence lifetime of the FO conformer, theanisotropy decay only provided information on the FR conformer. For all four enzymes,only fluorescence depolarization resulting from overall protein tumbling occurred,yielding a rotational correlation time of ~25 ns. The absence of any fast depolarizingprocesses demonstrates that the flavin itself is rigidly bound; no mobility of the flavincofactor occurs on the nanosecond time scale.
The effect of temperature on the fluorescence lifetime distributions was studied inthe range between 277 K and 323 K by TCSPC and relative fluorescence quantum yield.The ability to detect changes in the dynamic equilibrium was thereby limited to anindirect approach, because the ultrafast component could not be well resolved. Withincreasing temperatures, all fluorescence lifetimes shifted to somewhat shorter timeconstants (Table 4.1). At low temperatures, the lifetime of ~100 ps did not appear in any
C138S-PMA
wt-PMA
wt
τ (ns)0.001 0.01 0.1 1 10
20
15
10
5
0
25
TrxR + 0.38 mM AADP+
α(τ)
x 1
0-3
Figure 4.6: Fluorescence lifetime distributions of wt TrxR, TrxR wt-PMA andTrxR C138S-PMA complexed to 0.38 mM AADP+ in 50 mM potassium phosphatebuffer pH 7.6, at 293 K. For clarity, a vertical offset has been applied.

Chapter 4
98
of the lifetime spectra, whereas at high temperatures it was visible in all spectra,including that of wt TrxR. This points more to a slight difference in dynamic behaviourbetween wt TrxR and the other enzymes than to a static structural difference. Bycomparing the lifetime spectra with the one of free FAD at 323 K, it could be concludedthat at this high temperature still no traces of free FAD appeared. Wt TrxR and bothPMA-treated enzymes, over the range from 277 K - 323 K, showed a gradual decrease inrelative fluorescence intensity of ~50%, which corresponds with the changes observed inthe lifetime spectra. For TrxR C138S, the fluorescence intensity did not alter significantlyin the range between 277 K and 293 K. From 293 K - 323 K, however, the enzymeshowed a gradual increase in fluorescence intensity of ~50%. This effect can only beexplained by a change in the conformational equilibrium towards the FR conformer.Taking into account the decreasing fluorescence quantum yield of the other enzymescorresponding to the shift in lifetime constants, the increase in FR conformers can beestimated to be 100-150% (from 277 K to 323 K). Apparently the applied change inkinetic energy alone is not sufficient to induce major changes in the dynamic equilibrium.
A pronounced effect on the equilibrium was found using glycerol as a cosolvent:whereas the quantum yield of wt TrxR in 80% v/v glycerol was ~10% lower than in
Figure 4.7: Fluorescence spectra of 10 µM wt TrxR and TrxR C138S, as a functionof % (v/v) glycerol, 50 mM potassium phosphate buffer pH 7.6, at 293 K. The spectrawere corrected for the wavelength response of the setup.
800
600
400
200
0700650600550500
C138S
C138S/40% gly
C138S/60% gly
C138S/80% gly
wt
wt/80% gly
fluor
esce
nce
inte
nsity
(a.u
.)
wavelength (nm)

Exploring the conformational equilibrium of E. coli TrxR:…
99
buffer without glycerol, the fluorescence of the TrxR C138S enzyme increased to a levelidentical to that of wild-type enzyme in 80% glycerol (Fig. 4.7). The fluorescencelifetime patterns of the enzymes were only slightly influenced by the high concentrationsof glycerol: for all enzymes, including TrxR C138S, the ratio of the amplitudes of the twolongest lifetime components (~0.35 and ~0.9 ns) gradually changed with increasingglycerol concentration from 1:1 to 3:2 in favour of the shorter time constant. In addition,for wt TrxR a shift of the longest component to a time constant identical to that of theother enzymes was found. The glycerol effect on the fluorescence lifetime patternscorresponds with the small gradual decrease in fluorescence quantum yield of wt TrxRand the PMA-treated enzymes, but is in clear contradiction with the major increase influorescence for TrxR C138S in a high concentration of glycerol. This indicates stronglythat glycerol can trigger the conformational change from the FO to FR conformation.These findings were confirmed by light absorption spectra of TrxR C138S which clearlychanged from the characteristic FO spectrum (peaks at 380 nm and 456 nm) to the FRspectrum (peaks at 368 nm and 448 nm) in high concentrations of glycerol (Fig. 4.8A).At moderate levels of glycerol (up to 40%), no spectral changes occurred, and thefluorescence intensity was comparable to that in pure buffer. In absorption as well as influorescence, the behaviour of the PMA-treated enzymes was comparable to wild-typeenzyme in high concentrations of glycerol. When using sucrose as a cosolvent (up to 64%w/w, yielding a similar viscosity as the 80% glycerol mixtures) only a minor effect on thefluorescence intensity, and no effects on the absorption spectra and fluorescence lifetimepatterns were found.
CD experiments provided further support for the effect of glycerol on theconformational equilibrium. Flavin fingerprint CD spectra in the visible region from 300to 600 nm show a clear transition for C138S going from the FO spectrum in pure bufferto the FR spectrum in high glycerol concentrations (Fig. 4.8B). The slight effect of 80%glycerol on the photophysical properties of wt TrxR and the PMA-treated enzymes mayreflect a minor structural adjustment in the microenvironment of the flavin, but mightalso be explained by the effect of the altered solvent composition on the photophysics ofthe flavin itself; in the FR conformation, the flavin is to a large extent directly exposed tothe solvent. Far-UV CD spectra showed that glycerol does not affect the secondarystructure content of the TrxR enzymes: all four enzyme combinations have a virtuallyidentical far-UV CD-spectrum either with or without glycerol as a cosolvent (data notshown). Therefore, it can be concluded that glycerol indeed triggers the domain rotation,instead of just inducing a local conformational change.

Chapter 4
100
4.4 Discussion
E. coli TrxR is a beautiful example of nature’s ingenuity in using proteindynamics to catalyze reactions with large substrates. The catalytic cycle in whichelectrons flow from the substrate NADPH via the flavin cofactor and the disulfide bridgeto the protein substrate thioredoxin, requires a major domain rotation. Earlier results fromsteady-state spectroscopic experiments and kinetic data on crosslinked protein/substrate
Figure 4.8: Absorption spectra (A) and flavin fingerprint CD spectra (B) of 17.5 µMwt TrxR and TrxR C138S, as a function of % (v/v) glycerol, 50 mM potassiumphosphate buffer pH 7.6, at 293 K. The ellipticity is represented by θ.
abso
rptio
n
600550500450400350
wavelength (nm)
0.25
0.20
0.15
0.05
0.00
0.10
A
wt wt/80% gly
600550500450400350300
wavelength (nm)
0.3
0.2
0.1
0.0
-0.1
-0.2
[θ] (
deg
mM
-1 cm
-1)
wt
B
wt/80% gly
C138S C138S/80% gly
C138S C138S/60% gly C138S/80% gly

Exploring the conformational equilibrium of E. coli TrxR:…
101
complexes strongly suggested the existence of two separate states with both involved incatalysis (Lennon & Williams, 1995, 1996, 1997; Mulrooney & Williams, 1997; Veine etal., 1998a,b; Wang et al. 1996). The crystal structure of the FR conformation recentlyresolved for the TrxR/thioredoxin crosslinked complex (Lennon et al., 2000) clearlyshows the capacity of the protein to accommodate such large domain movements. Herewe were able to show the presence of both states of the free enzyme in solution and todetermine the specific photophysical characteristics of the FO and FR conformations. Todirectly detect the FO conformation and clearly distinguish between the two enzymespecies, advanced fluorescence equipment was required that allows accurate analysis ofstates with fluorescence lifetimes in the (sub)picosecond range. The approach to use suchultrarapid photophysical processes to characterize the conformational dynamics of(flavo)proteins is quite new. Because of the limited time resolution of equipmentregularly used in biochemical studies on protein fluorescence, such ultrarapid effects areeither not resolved, or ignored because of measurement inaccuracy. As a consequence,even in time-resolved fluorescence measurements it is possible that not all existingconformational states that have different fluorescence characteristics, are observed.Obviously, as steady-state fluorescence measurements mainly detect conformations witha high fluorescence quantum yield, care has to be taken when interpreting these data. Inthis study, it is evident that because of the large difference in fluorescence quantum yieldbetween the FO and FR conformation, measurements on time scales >100 ps are fullydetermined by the fraction of enzyme molecules in the FR conformation (vide infra).
Recently, Mataga et al. (1998, 2000) have been the first to report on femtosecondfluorescence quenching in flavoproteins. By means of fluorescence up-conversion theywere able to detect ultrarapid processes in the formerly so-called 'nonfluorescent'flavoproteins riboflavin-binding protein and glucose oxidase, and the D-amino acidoxidase/benzoate complex. Although the study presented here is one of the first to reportfluorescence quenching processes of the order of 1 ps, ultrarapid fluorescence quenchingof protein-bound flavins seems a rather common event. For E. coli glutathione reductaseand NADH peroxidase, we have shown earlier that a photoinduced electron-transferprocess from a juxtaposed tyrosine residue to the flavin causes rapid fluorescencequenching, with lifetime components of the order of 5-15 ps (van den Berg et al., 1998;Visser et al., 1998). Strong indications exist that a similar mechanism applies to manyother flavoproteins containing one or more tyrosine residues at Van der Waals distance ofthe flavin (van den Berg & Visser, 2001). It should be emphasized that the observation of(ultrashort) fluorescence lifetimes originates from dynamic quenching as opposed tostatic quenching, which by definition originates from a ground-state complex. However,

Chapter 4
dynamic quenching should be interpreted in a broad sense; not only collisionalquenching, but also interactions such as electron or energy transfer that take place in theexcited state, fall within this category. Therefore, the observation made in the previousstudy that fluorescence quenching in E. coli TrxR C138S has a static nature (Mulrooney& Williams, 1997) is not completely correct, but results from a lack of time resolution inthese experiments.
Based on the rapidity of the process, we expect that flavin fluorescence quenchingin the FO conformer of TrxR C138S originates from a charge-transfer interaction with aresidue located at Van der Waals distance from the flavin, resulting in a nearlyinstantaneous return to the ground state via a radiationless process. The only candidatesfor such a rapid charge-transfer interaction in TrxR C138S are Ser138 and the thiol groupat position 135. These residues are only in close proximity of the electrophilic site of theflavin (N5 and C4a atoms) in the FO conformation (Table 4.2). In the FR conformation,these residues are shifted further away towards the side of the methyl groups of theflavin, which appears less favourable for fluorescence quenching (vide infra). Earlier,residue Ser138 has been proposed to be the predominant source of quenching (Mulrooney
TqcM
(S
D((
((
able 4.2: Distances D between the isoalloxazine ring of E. coli TxrR and possibleuenching sites located within 10 Å, in the FO conformation and/or FRonformation. The expected efficiency of quenching Qef is expressed in H (high), (moderate) and L (low).
FO conformation(1) FR conformation(2)
Res.-Atom Flavin D (Å) Qef. Flavin D (Å) Qef.
Ser/Cys138(1,#) C4a 2.5/3.1 H C7M --/10.2 L
er-OH, Cys-SG) N5 2.8/3.3 H
Cys/Ser135 Ring B 4.2-4.9/-- H C7M --/6.7 L(3)
Tyr118-OH C7M 3.5 M/L C8M 11.4 L
N5 8.4 M/L N5 16.8 L
Tyr023-OH O2 3.6 (4M(4) O2 3.2 M(4)
Trp52-CE3 O2 5.7 M O2 5.8 M
Cys303-SH O2 7.0 M O2 6.9 M
Phe142 O4 6.2 L C7M 16.4 L
Phe240 C7M 8.5 L C7M 10.3 L
istances were retrieved from the crystal structures of:
102
1): E. coli TrxR and (#) TrxR C138S resolved at 2 Å resolution (Waksman et al., 1994).2): E. coli TrxR C135S-Trx C35S crosslinked complex resolved at 3 Å resolution
(Lennon et al., 2000).3): The hydroxyl/thiol group is directed away from the flavin ring.4): The tyrosyl group is located beside the flavin.

Exploring the conformational equilibrium of E. coli TrxR:…
103
& Williams, 1997). According to the crystal structure this residue can form a hydrogenbond with the N5 atom of the flavin. Such a hydrogen bond will not only stabilize the FOconformation, but it will also provide a highly efficient pathway for photoinducedhydrogen transfer or electron transfer to this electrophilic site of the flavin. However,thiol groups are also known to be efficient fluorescence quenchers. An indication thatboth Ser138 and Cys135 are involved in the process of quenching may be derived fromthe presence of two ultrafast fluorescence lifetimes in the FO conformer. Based on thedistance to the flavin, a logical assumption would be that Ser138 is responsible for the 1.2ps lifetime and Cys135 for the 7 ps component. The rate constants corresponding to thesefluorescence lifetimes (0.83 ps-1 and 0.14 ps-1) are in good agreement with the typical rateconstants for electron transfer found for a variety of biological and (semi)syntheticsystems with a donor-acceptor distance of 5 Å (1 ps-1 to 0.1 ps-1; Moser et al., 1992, andreferences therein).
The idea that multiple fluorescence lifetimes can originate from variousquenching processes that occur in a single protein conformation, the so-called multiplequenching sites model, was introduced by Bajzer and Prendergast (1993). By atheoretical description, they showed that the multiexponential fluorescence decay ofseveral tryptophan-containing proteins can be explained by energy or electron transfer todifferent acceptor sites in the protein. These different processes, which in principle do notrequire any collisional interaction, all contribute to the de-excitation of the donor with acertain probability, thereby giving rise to more than one fluorescence lifetime. Studies onglutathione reductase and NADH peroxidase in which by site-directed mutagenesistyrosine and cysteine residues were replaced by aliphatic amino acid residues, haveshown that this model is indeed valid; distinct fluorescence lifetimes could be attributedto quenching by a single amino acid residue (van den Berg et al., 1998; Visser et al.,1998). In the present study, clear evidence of the validity of the multiple quenching sitesmodel is found in the lifetime patterns of wt TrxR and the PMA-treated enzymessaturated with AADP+: binding of this nicotinamide cofactor analogue close to the flavinring introduced an additional fluorescence lifetime component without further affectingthe time constants of the protein (complexes) without AADP+.
The presence of two long-lived fluorescence lifetimes for the FR conformationfurther supports this model. These lifetimes may result from interactions with quenchingsites located further away, or less well positioned for a charge-transfer interaction withthe flavin. In general, electron-rich amino acid residues such as tryptophans, tyrosinesand thiols can be efficient quenching sites. Despite its aromatic character, phenylalanineappears to be a much less effective flavin fluorescence quencher (van den Berg et al.,

Chapter 4
104
1998). For intraprotein electron transfer, the rate of electron transfer has been shown todecay exponentially with the distance R between the donor and acceptor (Marcus & Sutin1985, and references therein). In general, proper orbital overlap between the donor andacceptor favours charge transfer. For the orientation dependency of electron transfer,however, no specific laws are available yet. Based on these general relations andexperimental evidence from various flavoenzymes, we can speculate on the efficiency offlavin fluorescence quenching in E. coli TrxR for possible quenching sites in both the FOand FR conformation (Table 4.2): the orientation of quenching sites towards the methylsubstituents and parallel to the xylene-like ring seems unfavourable. Highly efficientquenching rather seems to occur on interaction with the π-system of the polar pyrimidine-and pyrazine-like rings, especially near the electrophilic centre of the molecule located atC4a and N5.
It should be stressed that the fluorescence lifetime distribution is only arepresentation of the ensemble average of distinctly different fluorescent conformations.In a dynamic equilibrium in which the enzyme shuttles between two (extreme)conformations, intermediate states can only be detected by (conventional) fluorescencemethods, provided they have a significantly different fluorescence lifetime or correlationtime distribution, and that the lifetime of the intermediate state (and related to this theamplitude) is sufficiently large. These preconditions limit the chance of detectingintermediate states, especially when different sites contribute to fluorescence quenchingin a single conformation. Because of the asymmetrical distribution of the strongquenching sites in the rotating domain (all close to the flavin in the FO conformation,none in the FR conformation) the situation for detecting intermediate states is hererelatively favourable. The additional short lifetime emerging after PMA-treatment mightreflect the occurrence of such an intermediate state; it could, however, also originate fromsubtle structural changes in the microenvironment of the flavin.
Environmental factors such as temperature and solvent composition are known tohave a pronounced effect on protein dynamics and may thus influence the conformationalequilibrium. Whereas in this study the effect of temperature appeared to be limited, theimportance of solvent composition is clearly demonstrated by the effect of glycerol: highconcentrations of glycerol clearly triggered the domain rotation from the FO to FRconformation. Besides its function as a viscogen, glycerol is also known to affect thehydration layer and volume of proteins (Timasheff et al., 1976; Gekko & Timasheff,1981a,b; Timasheff, 1993; Priev et al., 1996) and to induce structural changes (Raibekas& Massey, 1996; van den Berg et al., 1998). The mechanism by which glycerol triggersthe domain rotation in E. coli TrxR C138S should be sought in the effect on the interface

Exploring the conformational equilibrium of E. coli TrxR:…
105
between the FAD domain and NADPH domain; the hydration layer and in particular theinteractions that stabilize the FO conformation. Although in the FO conformation theflavin ring is more shielded from the solvent, the interface region is fairly solventaccessible (Waksman et al., 1994). It is possible that glycerol perturbs the interfaceregion, so that stabilizing interactions such as the hydrogen bond between Ser138 and theflavin can no longer be formed. The FAD domain and NADPH domain were found tohave only two interdomain bonding interactions via hydrogen bonds, whereas five crystalwater molecules mediated interdomain interactions between charged and polar residueson the interface (Waksman et al., 1994). In particular, the interdomain ion pair betweenGlu48 and Arg130 which protrudes into solution, forms an excellent target for glycerol.A recent study, in which these residues were mutagenized to cysteines to form a stablecrosslink with N,N,1,2-phenylenedimaleimide, indicated that this ion pair is indeedimportant for stabilization of the FO conformation (Veine et al., 1998b). The presentstudy raises the question whether the cellular environment of the E. coli TrxR directlyinfluences the catalytic control of the enzyme.
Although as yet the cellular mechanism that triggers domain rotation in E. colithioredoxin reductase is still unknown, the approach of using ultrarapid fluorescencetechniques has shed new light on the conformational equilibrium and protein dynamics ofthe enzyme. The study presented here proves the important additional value of(sub)picosecond time-resolved and spectrally resolved fluorescence for detecting andcharacterizing distinct protein conformations and for exploring the conformational spaceof flavoenzymes.
Acknowledgement
We thank Willem van Berkel and Colja Laane for helpful discussions and suggestions. This workwas supported by the Chemical Council of the Netherlands Organisation for Scientific Research(NWO).


5 Time-resolved fluorescence analysis of themobile flavin in p-hydroxybenzoatehydroxylase
van den Berg, P.A.W., K. Grever, A. van Hoek, W.J.H. van Berkel, and A.J.W.G. Visser.
Parts of this Chapter have been published in:van den Berg, P.A.W., and A.J.W.G. Visser. 2001. In: B. Valeur & J.C. Brochon, (eds.),
New trends in fluorescence spectroscopy. Applications to chemical and life sciences,Springer, Berlin, pp. 457-485.
Conformational heterogeneity of the FAD cofactor in p-hydroxybenzoatehydroxylase (PHBH) was investigated with time-resolved polarized flavin fluorescence.For binary enzyme/substrate (analogue) complexes of wild-type PHBH and Y222mutants, crystallographic studies have revealed two distinct enzyme conformations; the'in' conformation with the isoalloxazine ring located in the active site, and the 'out'conformation with the flavin ring disposed towards the surface of the protein.Fluorescence lifetime analysis of these binary enzyme/substrate complexes revealedsimilar lifetime distributions for the 'in' and 'out' conformations. The reason for this istwofold. First, the active site of PHBH contains various potential fluorescence quenchingsites close to the flavin, as is reflected in the highly heterogeneous flavin fluorescencedecay with lifetime constants in the range from 10 ps to 3 ns. Fluorescence analysis ofuncomplexed PHBH Y222V and Y222A showed that Tyr222 is responsible forpicosecond fluorescence quenching occurring in a fraction of the free enzyme molecules.In addition, other potential quenching sites among which a tryptophan and two tyrosinesinvolved in substrate binding, are located within 10 Å of the flavin. As in the 'in' and 'out'conformations, the shortest distance between these quenching sites and the isoalloxazinering differs only little on average, they are likely to contribute to fluorescence quenchingin both conformations. Second, the effect of enzyme conformation on the fluorescencelifetime distribution is blurred by binding of the aromatic substrates: saturation witharomatic substrates induces highly efficient fluorescence quenching resulting in anadditional picosecond lifetime component largely dominating the lifetime spectrum. Theflavin conformation is therefore only reflected in the small relative contributions of thelonger lifetimes.

Chapter 5
108
5.1 Introduction
For most enzymes, conformational dynamics involves mobility of the polypeptidechain. In previous Chapters of this thesis, flavoenzymes in which functionally importantmotions entail either local conformational changes of the protein backbone (glutathionereductase, Chapters 2 & 3) or gross motions of protein domains (thioredoxin reductase,Chapter 4) have been subject of investigation. In enzymes that contain a prosthetic groupsuch as the flavoenzymes, mobility of the cofactor itself can in principle also play a rolein catalysis. A flavoenzyme for which mobility of the isoalloxazine ring of the flavincofactor has been shown to be essential for the biological function is p-hydroxybenzoatehydroxylase (Schreuder et al., 1994; Gatti et al., 1994).
p-Hydroxybenzoate hydroxylase (PHBH) (EC 1.14.13.2) belongs to the class offlavin-dependent monooxygenases (van Berkel & Müller, 1991). PHBH catalyses theNADPH- and O2-dependent conversion of 4-hydroxybenzoate (p-OHB) into 3,4-dihydroxybenzoate, a common intermediate step in the biodegradation of aromaticcompounds in soil bacteria, e.g. in the degradation pathway of lignin (Stanier & Ornston,1973). PHBH is a homodimeric protein containing one molecule of FAD per subunit of~45 kDa. The catalytic properties of the enzyme from Pseudomonas fluorescens andPseudomonas aeruginosa have been studied extensively with kinetic, spectroscopic andmutagenesis methods (for an overview see, Entsch & van Berkel, 1995).
The reaction cycle of PHBH consists of a reductive half-reaction in which theflavin is reduced by NADPH in the presence of bound substrate, and a complex oxidativehalf-reaction leading to hydroxylation of the substrate (Fig. 5.1). In the reductive half-reaction, efficient reduction of the flavin by NADPH requires a ternary complex in whichthe substrate p-OHB acts as an effector that increases the rate of reduction by about fiveorders of magnitude (Husain & Massey, 1979), irrespective of the actual order of binding.The substrate specificity of PHBH is rather narrow and limited by the poor capacity ofsubstrate analogues to stimulate flavin reduction. Site-directed mutagenesis studies haveshown that deprotonation of the substrate phenol facilitates reduction (Entsch et al., 1991;Eschrich et al., 1993; Palfey et al., 1999). After flavin reduction, NADP+ is released,while p-OHB remains tightly bound (Entsch et al., 1976). In the oxidative half reaction,molecular oxygen reacts with the reduced enzyme/substrate complex to form a flavin-C4a-hydroperoxide intermediate. Subsequently, in an electrophilic substitution reactionthe distal oxygen of the hydroperoxide intermediate is transferred to the substrateyielding the product 3,4-dihydroxybenzoate and a flavin-C4a-hydroxide species.Elimination of water from the flavin-C4a-hydroxide and product release completes the

Time-resolved fluorescence analysis of the mobile flavin in PHBH
109
catalytic cycle. NADPH oxidase activity is found in the absence of substrate, or in thepresence of nonsubstrate effectors, where the flavin-C4a-hydroperoxide intermediatedecomposes to yield hydrogen peroxide (Spector & Massey, 1972).
Since many years, detailed three-dimensional structural information on P.fluorescens PHBH has been available from crystallographic studies of the oxidized andreduced enzyme-substrate and enzyme/product complexes (Wierenga et al., 1979;Schreuder et al., 1988, 1989, 1992). In the absence of substrate or in the presence ofNADPH, however, PHBH was long found to have poor diffraction properties (van derLaan et al., 1989; Schreuder et al., 1991; Eppink et al., 1998a; Wang et al., 2002). Thehigh-resolution crystal structure of the enzyme revealed a specific folding pattern, whichwas later also found for several other enzymes (Mattevi et al., 1998) including theflavoproteins cholesterol oxidase (Vrielink et al., 1991), glucose oxidase (Hecht et al.,1993), D-amino acid oxidase (Mattevi et al., 1996), and phenol hydroxylase (Enroth etal., 1998). Although more recently a classification in two domains was proposed (Matteviet al., 1998), originally three separate domains were resolved: the FAD binding domain,
NNH
NN OH3C
H3C
O
R
N H
NH
NN OH3C
H3C
O
R
N H
NH
NN OH3C
H3C
O
R
N H
NH
NN OH3C
H3C
O
R
OHO
O
OHO
O
OHO
O
OHO
O
OH
OOH
OH
NADPHNADP+
O2
H2O2
BzOH
Bz(OH)2 H2O
k4
k1 k2
k5
k3
EFloxS
EFlredS
EFlHOOH-S
EFlHOH-P
Figure 5.1: Catalytic cycle of p-hydroxybenzoate hydroxylase. Rate constantsrepresent; k1, reduction of the enzyme-substrate (EFloxS) complex by NADPH; k2,formation of flavin (C4a)-hydroperoxide with molecular oxygen; k3, substratehydoxylation; k4, dehydration of flavin (C4a)-hydroxide and product (3,4-dihydroxybenzoate; Bz(OH)2) release, followed by substrate binding (p-OHB;BzOH); k5, uncoupling of hydroxylation through peroxide release.
Chapter 5
110
the substrate binding domain, and the interface domain. Residues from all three domainswere found to be involved in the catalytic reaction. The FAD binding domain contains aRossmann fold, responsible for binding the adenosine diphosphate moiety of FAD.Unlike many other flavoenzymes, the enzyme lacks a Rossmann fold for bindingNADPH. Kinetic studies on site-directed mutants have yielded detailed insight into theamino acid residues involved in NADPH binding (Eppink et al., 1995, 1998a,b), and amodel for NADPH binding was proposed (Eppink et al., 1998a). From recentcrystallographic studies it has been suggested that NADPH binding in theenzyme/substrate complex involves a remarkable conformation of the bound cofactor,with the nicotinamide moiety pointing away from the flavin (Wang et al., 2002). Suchbinding-mode would require major conformational rearrangements for flavin reduction,most likely both from the flavin and nicotinamide cofactors, as from the polypeptidechain (Wang et al., 2002). Crystallographic and site-directed mutagenesis studies haveyielded profound insight into the function of the active site residues. Binding of p-OHBinvolves interactions of the carboxyl group with Arg214 (salt bridge, van Berkel et al.,1992), Ser212 (hydrogen bonding, van Berkel et al., 1994a; Moran et al., 1999) andTyr222 (hydrogen bonding, Schreuder et al., 1994; Gatti et al., 1994; van der Bolt et al.,1996). The hydroxyl group of the substrate is at hydrogen-bonding distance of Tyr201and Tyr385. The latter residues have an important function in substrate activation byfacilitating substrate deprotonation, and in flavin reduction (Entsch et al., 1991; Eschrichet al., 1993).
The most compelling structural characteristic of PHBH, however, is the mobilityof the isoalloxazine ring. In 1994, crystallographic studies revealed two distinctconformations of the flavin cofactor (Fig. 5.2): complexes with the substrate p-OHBshowed the flavin ring buried in the active site of the enzyme ('in' conformation).However, complexes with substrate analogues bearing a hydroxyl group at the 2-position(2,4-dihydroxybenzoate, 2-hydroxy-4-aminobenzoate) revealed a conformation in whichthe flavin ring is located in the cleft that leads to the active site, more towards the surfaceof the protein ('out' conformation; Schreuder et al., 1994; see Table 5.1). This 'out'conformation was also found for PHBH Y222F in complex with the natural substrate(Gatti et al., 1994), and for the enzyme/substrate complex of wild-type PHBHreconstituted with arabino FAD (van Berkel et al., 1994b). The observation of twoconformations of the flavin explained the distinct differences in flavin absorptionperturbation spectra of various binary enzyme/substrate analogue complexes. Spectral

Time-resolved fluorescence analysis of the mobile flavin in PHBH
111
Figure 5.2: Stereoview of the active site of PHBH in the 'in' and 'out' conformations.In wild-type PHBH complexed with p-OHB, the isoalloxazine ring occupies the 'in'conformation (solid bonds; Schreuder et al., 1989). The 'out' conformation (openbonds) is found in the complex with 2,4-dihydroxybenzoate (Schreuder et al., 1994),and for several binary enzyme-substrate complexes with Y222 mutant enzymes(Schreuder et al., 1994; Gatti et al., 1994,). An overview of the conformations of theFAD as retrieved from different crystallographic studies is presented in Table 5.1.
Table 5.1: Overview of flavin conformations observed in crystals of uncomplexed PHBH,and in different enzyme/substrate (analogue) complexes.
Enzyme Redox state Substrate analogue ConformationPHBH ox -- (free enzyme) intermediate(1)
PHBH ox p-OHB in(2)
PHBH red p-OHB in(3)
PHBH ox p-aminobenzoate in(4)
PHBH ox 3,4-dihydroxybenzoate in(5)
PHBH ox 2,4-dihydroxybenzoate out(4)
PHBH ox 2-hydroxy-4-aminobenzoate out(4)
PHBH Y222F ox p-OHB out (70%)(6)
PHBH Y222A ox 2-hydroxy-4-aminobenzoate out(4)
(1) Eppink et al., 1999; (2) Schreuder et al., 1989; (3) Schreuder et al., 1992; (4) Schreuder et al., 1994;
(5) Schreuder et al., 1988; (6) Gatti et al., 1994.

Chapter 5
112
and kinetic data on the mutant enzymes PHBH Y222A and Y222V supported the role ofTyr222 in flavin mobility (van der Bolt et al., 1996). Based on the crystallographicstudies, it was proposed that flavin mobility plays a prominent role in catalysis: the 'in'position provides a suitable environment for efficient hydroxylation of the substrate(shielded from the solvent), and the swinging 'out' of the flavin creates a pathway forsubstrate binding and product release. The 'out' conformation is probably also necessaryfor efficient flavin reduction (van Berkel et al., 1994b; Palfey et al., 1997, 1999; Eppinket al., 1998a, 1999; Ortiz-Maldonado et al., 1999; Wang et al., 2002), although noconclusive evidence for this has been presented yet. Recently, the crystal structure ofsubstrate-free PHBH was resolved (Eppink et al., 1999). In the absence of aromaticligands, the flavin ring has increased flexibility and is on average found at a positionintermediate between the 'in' and 'out' conformation.
In this Chapter, time-resolved flavin fluorescence studies are discussed that wereperformed to obtain more insight into the mobility of the flavin in P. fluorescens PHBH.Polarized fluorescence decay analyses were focussed on the different microenvironmentsof the flavin in the 'in' and 'out' conformations. In order to sample different (known)conformations, binary enzyme/substrate analogue complexes of both wild-type PHBHand the mutant Y222V were studied in the oxidized state. The time-resolved fluorescencedata are discussed in relation to the mechanisms of fluorescence quenching as reported inprevious Chapters. The study exemplifies the limitations of time-resolved fluorescencelifetime analysis, and of ensemble detection in general.
5.2 Materials and Methods
Sample preparation
p-Hydroxybenzoate hydroxylase from Pseudomonas fluorescens was isolatedfrom E. coli TG2 cells transformed with the expression plasmid pAW45 (van Berkel etal., 1992). The microheterogeneity-resistant mutant PHBH C116S was used as pseudo-wild-type enzyme in order to prevent protein aggregation resulting from the oxidation ofthe cysteine at position 116 (van Berkel et al., 1987; Eschrich et al., 1990, 1993). ResidueCys116 is located far away from the active site, and its mutation does not influence anyof the catalytic properties of the enzyme. Mutant genes encoding for PHBH Y222A andY222V were constructed by van der Bolt et al. (1996). All enzymes were purifiedaccording to the method described by van Berkel et al. (1992), and stored in 80%ammonium sulphate at 277 K. Directly prior to use, traces of free FAD were removed bychromatography on a Biogel PGD-6 column (Biorad) equilibrated with measuring buffer.

Time-resolved fluorescence analysis of the mobile flavin in PHBH
113
All spectroscopic measurements were carried out in 50 mM potassium phosphate bufferpH 7.5 at 293 K. The enzyme concentration was kept at 10 µM with respect to FAD withε450 PHBH = 10.2 mM-1cm-1 for wild-type PHBH (van Berkel et al., 1992) as well as for the
mutant enzymes (van der Bolt et al., 1996). Buffers were made from nanopure-gradewater (Millipore) and were filtered through a 0.22 µm filter (Millipore). All chemicalsused were of the highest purity available.
Time-resolved fluorescence experiments
Polarized time-correlated single-photon counting (TCSPC) was used to detectpolarized time-resolved fluorescence on a (sub)nanosecond time scale. The dye lasersetup and measurement procedures are described in detail in Chapter 2. Verticallypolarized light of 450 nm (Stilbene 420) or 460 nm (Coumarine) was used to excite thesample with a frequency of 594 kHz and a duration of 4 ps FWHM. Parallel andperpendicularly polarized fluorescence was detected through resp. 557.9 nm (forexcitation at 450 nm) or 526.0 nm (for excitation at 460 nm) interference filters (Schott,Mainz, Germany) in combination with a KV 520 cut-off filter (Schott). Data werecollected in a multichannel analyzer with a time window of 1024 channels with channelwidths between 7-15 ps/channel.
Analysis of the fluorescence intensity decay I(t) and anisotropy decay r(t) wasperformed using the software package from Maximum Entropy Solutions Ltd. (Ely,United Kingdom), and the TRFA Data Processing package of the Scientific SoftwareTechnologies Center of Belarusian State University, Belarus. With the maximum entropymethod, the fluorescence intensity and anisotropy decays are described in terms ofdistributions of decay times, for which no a priori knowledge of the system is required(Livesey & Brochon, 1987; Brochon, 1994). A detailed description of the analysisprocedures is provided in Chapters 2 and 3.
5.3 Results
Fluorescence quenching in PHBH
The experimental total flavin fluorescence decay of uncomplexed wild-type PHBHexhibits a strongly heterogeneous character (Fig. 5.3). Although flavin fluorescence inPHBH is strongly quenched, the quenching is considerably less than in E. coli GR(QPHBH/QGR ≈ 15). Inverse Laplace transformation with the MEM analysis methodyielded for wild-type PHBH a lifetime spectrum with five distributions covering thezzzzz

Chapter 5
114
dynamic range from ~10 ps to 3 ns (Fig. 5.4). Predominant lifetime components werefound near 15 ps, 0.1 ns, and 0.6 ns, and minor lifetime contributions near 1.5 and 3 ns.Analysis with a sum of discrete exponentials confirmed the complex fluorescencelifetime behaviour of PHBH (Table 5.2). Flavin fluorescence in the mutant enzymesPHBH Y222V and Y222A was somewhat less quenched than in wild-type enzyme. Foranalysis of the flavin fluorescence decays of the PHBH Y222 mutants, only four lifetimecomponents were needed. The lifetime constants of PHBH Y222V were nearly identicalto the longer components observed for wild-type enzyme. For PHBH Y222A, thenanosecond component shifted to longer time constants and its relative amplitude
Figure 5.3: Experimental total fluorescence decays and corresponding theoreticaldata retrieved from the multiexponential fits of wild-type PHBH, and PHBH Y222Vin 50 mM potassium phosphate buffer, pH 7.5, at 298 K, both free and in complexwith p-OHB and 2,4-dihydroxybenzoate. Experimental data (grey) and theoreticaldata (black) overlay well. In order to clearly reveal the differences between the data,only the initial part of the time window is shown.
100
80
60
40
20
01.41.21.00.80.60.4
100
80
60
40
20
01.41.21.00.80.60.4
time (ns)
time (ns)
norm
aliz
ed fl
u. in
t.no
rmal
ized
flu.
int.
wt PHBH
PHBH Y222V
+ p-OHB
+ p-OHB
+ 2,4-diOHB
+ 2,4-diOHB

Time-resolved fluorescence analysis of the mobile flavin in PHBH
115
Table 5.2: Fluorescence lifetime parameters (τi, αi) of PHBH and its Y222 mutants, free andin complex with substrate analogues(1)
PHBH PHBH/p-OHB complex(2) PHBH/2,4-dihydroxy-benzoate complex(3)
ττττi ααααi ττττi ααααi ττττi ααααi
0.013 ± 0.007 0.40 ± 0.09 0.011 ± 0.002 0.84 ± 0.05 0.015 ± 0.005 0.83 ± 0.04
0.12 ± 0.03 0.27 ± 0.07 0.15 ± 0.07 0.09 ± 0.03 0.12 ± 0.05 0.13 ± 0.02
0.61 ± 0.05 0.24 ± 0.03 0.76 ± 0.10 0.04 ± 0.02 0.66 ± 0.12 0.03 ± 0.01
1.65 ± 0.06 0.07 ± 0.02 2.25 ± 0.11 0.03 ± 0.01 1.71 ± 0.24 0.01 ± 0.01
3.13 ± 0.07 0.02 ± 0.00 -- -- -- --
PHBH Y222V Y222V/p-OHB complex(4) Y222V/2,4-dihydroxy-benzoate complex(5)
ττττi ααααi ττττi ααααi ττττi ααααi
-- (6) -- 0.010 ± 0.003 0.73 ± 0.06 0.013 ± 0.005 0.75 ± 0.04
0.096 ± 0.010 0.34 ± 0.01 0.100 ± 0.010 0.15 ± 0.01 0.077 ± 0.010 0.21 ± 0.02
0.57 ± 0.01 0.48 ± 0.01 0.63 ± 0.03 0.07 ± 0.03 0.53 ± 0.07 0.03 ± 0.01
1.54 ± 0.01 0.15 ± 0.01 1.97 ± 0.14 0.04 ± 0.02 1.85 ± 0.17 0.01 ± 0.00
2.72 ± 0.13 0.03 ± 0.01 3.37 ± 0.16 0.01 ± 0.00 -- --
PHBH Y222A
ττττi ααααi
-- (6) --
0.094 ± 0.010 0.30 ± 0.02
0.67 ± 0.02 0.43 ± 0.01
2.28 ± 0.02 0.26 ± 0.02
4.95 ± 0.20 0.01 ± 0.01
(1): Presented are the fluorescence lifetime components (τi) and the corresponding fractionalcontributions (αi) (including standard deviations) as obtained from the analysis of experimentsperformed in 50 mM potassium phosphate buffer, pH 7.5, at 298 K.
(2): Saturation degree PHBH/p-OHB: 91%(3): Saturation degree PHBH/2,4-dihydroxybenzoate: 91%(4): Saturation degree PHBH Y222V/p-OHB: 84%(5): Saturation degree PHBH Y222V/2,4-dihydroxybenzoate: 94%(6): For the mutant enzymes PHBH Y222V and Y222A, a picosecond lifetime could not be resolved
unambiguously.

Chapter 5
116
increased. The picosecond lifetime component occurring in wild-type enzyme was notclearly resolved for both tyrosine mutants: a picosecond lifetime with a low amplitudecould be introduced, but did only occasionally improve the quality of the fit. Theseresults suggest that interaction with the Tyr222 causes the picosecond flavin fluorescencequenching process observed in wild-type enzyme. Fluorescence depolarization studies ofwild-type PHBH and the tyrosine mutants did not reveal flavin mobility on thenanosecond time scale. The anisotropy decay was determined by rotational diffusion ofthe enzyme.
Fluorescence lifetime patterns of binary enzyme/substrate complexes
In order to reveal possible specific fluorescence lifetime patterns for the 'in' and'out' conformation of the FAD in PHBH, fluorescence lifetime analysis was performed onbinary enzyme/substrate complexes. For this, wild-type and Y222V PHBH were titratedwith both p-OHB and 2,4-dihydroxybenzoate. As substrate binding in PHBH is known todepend on pH and solvent conditions (van Berkel & Müller, 1989), the dissociationequilibrium constants of the substrate analogues were determined from steady-statefluorescence quenching under the conditions used in time-resolved fluorescence analysis(Table 5.3). Upon titration with the substrate analogues, the fluorescence lifetime spectraof wild-type and Y222V PHBH showed gradual changes. The lifetime spectra at substrateconcentrations near saturation are presented in Figure 5.4. The most striking effect fromsubstrate binding is the emergence of an ultrashort fluorescence lifetime in all fourenzyme/substrate complexes. Under saturating conditions, this direct substrate quenchingdominates the lifetime patterns. Although in the titration experiments no full saturation
Table 5.3: Dissociation constants of complexes between PHBH (Y222V) and thesubstrates p-OHB and 2,4-dihydroxybenzoate. Dissociation constants weredetermined fluorimetrically in 50 mM potassium phosphate pH 7.5, at 298 K.Values are compared with dissociation constants in 100 mM Tris/SO4, pH 8.0,taken from van der Bolt et al., 1996.
Dissociation constant (mM)Enzyme Ligand
pH 7.5, 50 mM KPi pH 8.0, 100 mM Tris/SO4
PHBH p-hydroxybenzoate 0.05 0.04
2,4-dihydroxybenzoate 0.10 0.09
PHBH Y222V p-hydroxybenzoate 1.7 1.1
2,4-dihydroxybenzoate 0.06 0.07

Time-resolved fluorescence analysis of the mobile flavin in PHBH
was obtained, the sum of the amplitudes of the remaining longer lifetime components washigher than can be expected from the saturation degree if in every complex, fluorescencequenching occurs for 100% through ultrafast interaction with the bound substrate (Table5.2). If it is assumed that this effect is due to a small chance that flavin fluorescence isquenched through an interaction with other residues than the bound substrate, the longerlifetimes may reflect the 'in' or 'out' conformation of the flavin (depending on theenzyme-substrate combination used). All binary enzyme/substrate complexes studied,however, display contributions of longer lifetime components with time constants not farfrom the ones observed for the free enzymes (Table 5.2; Fig. 5.4). Yet, the amplitude ofthe longer lifetimes seems to differ significantly for the specific combinations. Under theabove-mentioned assumption, the 'in' and 'out' conformations of the flavin may thus bereflected in the ratios of the amplitude of the 0.1 ns component and that of the 0.6 ns (and1.8 ns) component: for complexes with the flavin in the 'out' conformation (wtPHBH/2,4-dihydroxybenzoate and PHBH Y222V/2,4-dihydroxy-benzoate), a relativelylarger contribution of the 0.1 ns component is observed, whereas in complexes in whichone may expect the 'in' conformation (wt PHBH/p-OHB), the amplitudes of the longerlifetime components are somewhat more equal. We shall further address this issue in thediscussion section.
wt
0
150
50
100
200
α(τ)
τ (ns)0.01 0.1 1 100.001
Y222V
0
150
50
100
200
α(τ)
τ (ns)0.01 0.1 1 100.001
+ 2,4-diOHB + 2,4-diOHB
+ p-OHB + p-OHB
Figure 5.4: Normalized fluorescence lifetime distributions of wild-type PHBH (left)and PHBH Y222V (right) uncomplexed and in complex with p-OHB and 2,4-dihydroxybenzoate in 50 mM potassium phosphate buffer, pH 7.5, at 298 K. Binaryenzyme-substrate complexes were formed under (nearly) saturating conditionsresulting in percentage of complex: PHBH/p-OHB: 91%; PHBH/2,4-dihydroxy-benzoate: 91%; PHBH Y222V/p-OHB: 84%; PHBH Y222V/2,4-dihydroxy-benzoate: 94%. For clarity, a vertical offset has been applied.
117

Chapter 5
118
5.4 Discussion
In contrast with glutathione reductase and thioredoxin reductase, PHBH has anactive-site region that can accommodate substantial movements of the flavin ring.Crystallographic and kinetic data have suggested that in PHBH this flavin mobility isessential for catalysis: whereas the flavin in the 'in' position provides a suitableenvironment for efficient hydroxylation of the substrate (shielded from the solvent), theswinging 'out' of the flavin creates a pathway for substrate binding and product release,and facilitates efficient flavin reduction. Recently, it has been suggested that mobility ofthe flavin ring also plays an important role in the catalysis of the related enzyme phenolhydroxylase (Enroth et al., 1998). Optimal regulation of catalysis in these redox enzymesrequires strict regulation of the cofactor mobility. Specific (transient) interactions withparticular amino acids as well as interactions with the substrate can contribute to thisregulation. These interactions, however, also determine the photophysical characteristicsof the flavin fluorophore.
For substrate-free PHBH, this is shown in the fluorescence lifetime data of theTyr222 mutants. Here, we have demonstrated that this residue involved in controllingflavin mobility, can efficiently quench flavin fluorescence. Both in the 'in' and 'out'conformation Tyr222 is located within 4 Å from the isoalloxazine ring (Table 5.4). Based
Table 5.4: Shortest distance between various potential quenching sites and theisoalloxazine ring of FAD in wild-type PHBH in the 'in' and 'out' conformations(1)
Residue Conformation Flavin atom ÅTrp185-CZ3 in C6 5.1
out O4 5.2
Tyr201-OH in O4 6.7
out O2 8.1
Tyr222-OH in C6 3.9
out O4 3.3
Tyr385-OH in O4 6.9
out O2 8.7
(1): Distances were retrieved from the PHBH-p-OHB complex resolved at 1.9 Å resolutionfor the 'in' conformation, and from the PHBH-2,4-dihydroxybenzoate complex resolvedat 2.5 Å resolution for the 'out' conformation (Schreuder et al., 1994).

Time-resolved fluorescence analysis of the mobile flavin in PHBH
119
on the similarity in structure and fluorescence characteristics between PHBH and othertyrosine-containing flavoproteins such as glutathione reductase (van den Berg et al.,1998, Chapter 2), riboflavin-binding protein and glucose oxidase (Mataga et al., 1998,2000; Zhong & Zewail, 2001), the mechanism of quenching most probably involvesphotoinduced electron transfer from this particular tyrosine to the light-excited flavin (seealso van den Berg & Visser, 2001). The considerably lower amplitude of ultrafastquenching of PHBH in comparison with the enzymes mentioned above may reflect theincreased freedom of the flavin cofactor: in the fraction of enzyme molecules in whichclose contact exists between the properly oriented flavin and tyrosine at the moment ofexcitation, ultrafast fluorescence quenching can occur. In the fraction of enzymemolecules responsible for the longer fluorescence lifetime components, quenching occursthrough interactions with other residues, in a similar manner as observed for the PHBHY222 mutants (multiple quenching sites model; Bajzer & Prendergast, 1993; Chapter 2).Based on the distance to the flavin, Trp185 as well as Tyr201 and Tyr385 (the latter twoare both involved in substrate binding) may also contribute to fluorescence quenching.From comparison with fluorescence quenching characteristics of other flavoenzymes, aposition adjacent to the more polar parts of the isoalloxazine ring, particularly near theelectrophilic sites at N4 and C4a, is expected to result in more efficient fluorescencequenching than location near the relatively apolar dimethylsubstituted ring (seeDiscussion Chapter 4). For Tyr222, it can thus be speculated that not only the distance,but also the relative position with respect to the flavin in the 'out' conformation is bettersuited for efficient fluorescence quenching than in the 'in' conformation (Table 5.4). Amore favourable orientation for quenching in the 'out' conformation may also be the casefor Trp185. For Tyr201 and Tyr385, however, the distance to the flavin is somewhatshorter in the 'in' conformation. On the whole, the quenching characteristics of the flavinmicroenvironment do not drastically change from the 'in' to the 'out' conformation, so thatthe above-mentioned sites may well contribute to fluorescence quenching in bothconformations, and no unique fluorescence lifetime pattern is observed.
For the isoalloxazine ring in the oxidized state, significant deviations fromplanarity are not expected to occur, irrespective of the protonation state or hydrogen-bonding environment of the flavin (Zheng & Ornstein, 1996). As this study is limited tothe oxidized state, distances and orientations should therefore not be influenced much bymobility within the flavin ring. It should be kept in mind, however, that distances andorientations were retrieved from crystal structures of enzyme/substrate complexes.Though crystallographic studies of the free enzyme show the isoalloxazine ring in anintermediate position (Eppink et al., 1999), it cannot be excluded that –in particular in the
Chapter 5
120
uncomplexed enzyme- the flavin ring adopts positions beyond the ones observed in theenzyme/substrate complexes, reducing the latter to only 'intermediate' conformations. Theconformations in crystal structures should therefore be regarded as snapshots, of whichthe observed extremes have been defined as 'in' and 'out'. Though fluorescence can(simultaneously) sample all 'real' conformations in solution, experiments on flavinsystems are in general limited to the oxidized state due to the low intrinsic fluorescenceand complex photophysical and photochemical behaviour of the flavin in the two-electronreduced state. Interpretation of fluorescence characteristics in terms of dynamics incomplex biological systems using two-electron reduced flavin is still a bridge too far.This reduces the window of the reaction pathway of PHBH accessible with ensemble-detected fluorescence spectroscopy to the very first step: substrate binding in the oxidizedstate. From the point of view of dynamics, however, this step is particularly interesting asit necessarily involves significant mobility of the flavin. In addition, other than a possiblebending of the isoalloxazine ring in the two-electron reduced state (Hall et al., 1987a;Zheng & Ornstein, 1996), no indications exist that for completing the reaction cycle,conformations are required that are not in between the 'in' and 'out' conformation(including intermediate ones) as can be sampled in titration studies with differentsubstrate analogues.
Aromatic substrate binding most efficiently induced flavin fluorescencequenching. As the substrates bind at Van der Waals distance of the redox-active flavin,quenching may here also occur through photoinduced electron transfer. The quenchingeffects of p-hydroxybenzoate derivatives on the fluorescence lifetime distribution ofPHBH also strengthen the multiple quenching sites model. Although saturation was notfully reached, the sum of amplitudes of the remaining longer lifetime components washigher than can be expected from the saturation degree (see Results section). It istherefore likely, that in the complex there is still a small chance that flavin fluorescencewill be quenched through an interaction with an active-site residue. A less likelyexplanation is that through insufficient time resolution, the amplitude of the ultrafastcomponent is underestimated and/or even faster fluorescence lifetimes were not resolved.Although our experiments with a lower time resolution of 5-10 ps do not rule out sucheffect, it does not explain the differences in amplitude of the resultant longer lifetimesbetween complexes in the 'in' conformation and those expected to have the 'out'conformation (see Results section). A good test model as to whether the relativeamplitudes of the resultant longer lifetimes indeed reflect the flavin conformation is thePHBH Y222V/p-OHB complex, for which on the basis of absorption difference spectra(van der Bolt et al., 1996) and similarity with mutant PHBH Y222F (Gatti et al., 1994), a

Time-resolved fluorescence analysis of the mobile flavin in PHBH
121
predominant 'out' conformation is expected. Taking into account that the saturationdegree obtained for this complex is lower than for the other enzyme/substrate complexesso that a larger contribution of the ligand-free enzyme (16%) shows up, a (partly) 'out'conformation of the flavin can indeed be deduced. The lifetime spectrum of this complexshowed a ratio for the amplitudes of the 0.1 and 0.6 ns components of α0.1/α0.6 ≈ 2. Asthe 0.6 ns component has the largest amplitude in the lifetime spectrum of free enzyme,the lifetime spectrum of 100% complex should therefore contain a significantly largeramplitude for the 0.1 ns component. It can thus be concluded that the relativecontributions of the longer lifetime components indeed correlate with the presence of theflavin conformation. Because of the predominant fluorescence quenching by aromaticsubstrates together with the combined geometrical and photophysical characteristics ofthe active-site, lifetime detection is not a very sensitive method to probe the flavinconformation in PHBH. (Sub)nanosecond resolved fluorescence anisotropy detectionfailed to reveal direct mobility of the flavin cofactor. A likely explanation for this is thatflavin mobility (from the 'in' to a more 'out' conformation and vice versa) occurs on amuch slower time scale e.g. of the order of microseconds.
A serious complication for monitoring the conformation and mobility of the flavincofactor in PHBH with ensemble-detecting techniques in general, is that it is impossibleto obtain data (free from direct influence of the substrate) solely from one conformation:as the flavin in the substrate-free PHBH is flexible (Eppink et al., 1999), ensemble data ofthe substrate-free enzyme shall contain a mixture of 'in', 'out' and/or 'intermediate'characteristics, dependent on the equilibrium conditions. Complex formation with asubstrate to trap the flavin in a single conformation is therefore a necessary but potentialrisky method that may have direct impact on the interpretation of ensemble data ofPHBH. This may also apply to other techniques such as Raman spectroscopy (Zheng etal., 1999). A way to overcome such complication is to monitor flavin mobility in a singlesubstrate-free PHBH molecule. By registering a sufficiently long time trace of a singleenzyme molecule, one expects to cover the conformational space of the flavin therebyacquiring specific characteristics of each of the conformational states encountered.
Acknowledgement
We thank Dr. F.J.T. van der Bolt and Dr. M.H.M. Eppink for the construction of the mutantenzymes and helpful practical suggestions.


6 Dynamic conformations of flavin adeninedinucleotide: simulated molecular dynamics ofthe flavin cofactor related to the time-resolvedfluorescence characteristics
This Chapter will be published as:van den Berg, P.A.W., K.A. Feenstra, A.E. Mark, H.J.C. Berendsen, and A.J.W.G. Visser.
2002. J. Phys. Chem. B, in press.
Molecular Dynamics (MD) simulations and polarized subnanosecond time-resolved flavin fluorescence spectroscopy have been used to study the conformationaldynamics of the flavin adenine dinucleotide (FAD) cofactor in aqueous solution. FADdisplays a highly heterogeneous fluorescence intensity decay, resulting in lifetimespectra with two major components: a dominant 7 ps contribution characteristic forultrafast fluorescence quenching, and a 2.7 ns contribution resulting from moderatequenching. MD simulations were performed in both the ground state and the first excitedstate. The simulations showed transitions from 'open' conformations to 'closed'conformations, in which the flavin and adenine ring systems stack coplanarly. Stackinggenerally occurred within the lifetime of the flavin excited state (4.7 ns in water), andyielded a simulated fluorescence lifetime of the order of the nanosecond lifetimeexperimentally observed. Hydrogen bonds in the ribityl-pyrophosphate-ribofuranosylchain connecting both ring systems form highly stable co-operative networks anddominate the conformational transitions of the molecule. Fluorescence quenching inFAD is mainly determined by the coplanar stacking of the flavin and adenine ringsystems, most likely through a mechanism of photoinduced electron transfer. Whereas instacked conformations fluorescence is quenched nearly instantaneously, open fluorescentconformations can stack during the lifetime of the flavin excited state, resulting inimmediate fluorescence quenching upon stacking.

Chapter 6
124
6.1 Introduction
Flavoproteins are an interesting class of enzymes for studying the dynamicbehaviour of biomacromolecules. One reason for this is the large amount of detailedinformation on both the catalytic mechanism and atomic structure that is available formany members of this wide-spread family of redox enzymes. The feature which makesthese enzymes particularly suitable for investigating the role of conformational dynamicsin catalysis is, however, the flavin cofactor itself: this prosthetic group is not only theredox-active group situated in the heart of the active site, but it is also a naturallyfluorescent group emitting green light. In the last decade, time-resolved fluorescence andfluorescence anisotropy studies have yielded information on the dynamics of the activesite of a variety of flavoproteins (for an overview, see van den Berg & Visser, 2001; vanden Berg et al., 2001).
A complicating factor in studying the fluorescence properties of these enzymes isthe fact that in most flavoproteins the flavin cofactor is noncovalently bound. It is thuspossible to detect fluorescence from the free cofactor as well as from the protein-boundone. In enzymes such as glutathione reductase (GR), lipoamide dehydrogenase, andthioredoxin reductase (TrxR), the dissociation constant for the flavin cofactor is very low(pM-nM range). For these enzymes, careful sample preparation is sufficient to avoidtraces of free flavin. However, in other flavoenzymes such as ferredoxin NADPH-reductase (FNR) and p-hydroxybenzoate hydroxylase, the flavin is less tightly bound. Inthese cases, the presence of free flavin has to be taken into account, especially when thefluorescence quantum yield of the free flavin cofactor is high compared to that of theprotein-bound cofactor. For this, knowledge of the fluorescence properties of free flavincofactors under the experimental conditions used, is required.
For several decades, the physical properties of the isoalloxazine ring and the twomost common flavin cofactors, flavin mononucleotide (FMN) and flavin adeninedinucleotide (FAD, Fig. 6.1) have been subject of investigation (for reviews onelectronic and structural properties of flavins, see Song, 1970; Leijonmarck, 1977; Hall,1987a,b; and references therein). The remarkably low fluorescence of FAD with respectto free riboflavin was first reported by Weber (1950). An intramolecular ground-statecomplex between the isoalloxazine ring and the adenine moiety was proposed to prevailin aqueous solution, resulting in the formation of a nonfluorescent complex. In steady-state fluorescence experiments, the fluorescence quantum yield of FAD was found to be9 times lower than that of FMN. By enzymatic digestion of the diphosphate bridge of thezzzzz

Dynamic conformations of FAD:…
125
Figure 6.1: Representation of the structures of FAD and FMN in the oxidized state,including atomic labeling. Atom labels for the AMP moiety begin with an A whenreferred to in the text. In the flavin moiety, the hydrophobic benzene-like ring isindicated as ring A, the pyrimidine-like ring particularly suitable for hydrogen-bonding interactions is indicated as ring C.
AC4*AC3*
AC2*AC1*
AO4*
HAN1
AC2AN3
AC4
AC5AC6
AN7
AC8
AN9
AN6HH
H
OH
H
H
H
H
N
O
ON
H3C
NH3C
N
C1*
C2*
C3*
C4*
C5*
O5*
HO
P1
OP3
OP1 OP2
APAOP1 AOP2
AO5*
H
H
H
H
H
HH
H
AC5* HH
HH
OH
4a
1
5a
9a 10a 2
34567
8 9 10
A B C
-
-
isoalloxazine ring
ribof
lavi
n-5�
-mon
opho
spha
te (F
MN
)
flavi
n ad
enin
e di
nucl
eotid
e (F
AD
)
HO
HO

Chapter 6
126
FAD molecule, the fluorescence intensity increased to equal that of free FMN. Fromthese experiments it was proposed that FAD exists in two conformations; a so-called'closed' conformation, in which the isoalloxazine and adenine rings interact through π-πinteractions in a stacked conformation resulting in very efficient fluorescence quenching,and an extended, 'open' conformation that is responsible for the (remaining) fluorescenceof FAD. In solution, the FAD molecule is considered to be predominantly in the stackedconformation. Under the assumption that the equilibrium of stacking and unstacking isthe same in the ground state and the first excited state, it can be reasoned that ~80% ofthe FAD molecules are in the closed conformation and that the lifetime of theintramolecular complex is 27 ns (Spencer & Weber, 1972). Dispersion forces areconsidered to be the principle factor favouring flavin-adenine stacking. Strong acidicconditions, nonpolar solvents, and even polar solvents such as formamide have beenreported to prevent complex formation in FAD (Penzer & Radda, 1967, and referencestherein).
Although the existence of an 'open' and 'closed' conformation of the FADmolecule is now generally accepted, little is known about the structural details andconformational dynamics in solution. Crystallographic studies on the complex betweenfree riboflavin and the adenosine derivative 5�-bromo-5�-deoxyadenosine (Voet & Rich,1971a,b) revealed an average structure of the π-π stacked isoalloxazine and adenine ringsystems under crystal packing forces. In aqueous media, support for a stackedconformation was obtained from ultraviolet resonance Raman spectroscopy, where bothchromophores showed Raman hypochromism (Copeland & Spiro, 1986). From NMRstudies, different models were proposed for the interaction between the flavin andadenine moieties, including both intramolecular stacking (Sarma et al., 1968; Kotowyczet al., 1969; Kainosho & Kyogoku, 1972), and parallel intramolecular hydrogen bondingbetween the pyrimidine-like ring of the flavin involving N3 and O4, and the adenineANH2 and AN7 (Raszka & Kaplan, 1974). All NMR studies, however, were complicatedby the tendency of flavins to form intermolecular complexes at millimolarconcentrations.
Early time-resolved fluorescence measurements have provided a pictureconsistent with the dynamic model proposed by Weber and co-workers. Decay analysisof FMN revealed a fluorescence lifetime of 4.7 ns, whereas FAD yielded two lifetimecomponents of 2.8 ns (72%) and 0.3 ns (28%), respectively (Visser, 1984). In the lastdecade, technical progress has provided a broader time window to sample the dynamicsof the excited state. Therefore, in this study, the flavin cofactors are re-examined using

Dynamic conformations of FAD:…
127
subnanosecond resolved time-correlated single-photon counting experiments.Fluorescence lifetime properties, however, relate to the ensemble of molecules, and donot yield information on the atomic level. For a proper understanding of the process ofstacking and the effect of dynamics on the lifetime of the excited state, a more detailedpicture is needed.
In this study, we have investigated the structural dynamics of FAD using acombination of time-resolved fluorescence and MD simulations. Polarizedsubnanosecond-resolved fluorescence experiments under various temperature andsolvent conditions yielded experimental data on the dynamic behaviour of the flavincofactor. Nanosecond molecular dynamics simulations in water gave insight into thedynamic behaviour of the FAD molecule. Changes in the charge distribution wereapplied to mimic the electronic effect of the transition from the ground state to theexcited state following light absorption and to investigate its effect on the dynamics ofthe molecule. Special attention was given to the interrelation between the MD data andfluorescence data in terms of fluorescence quenching and rotational behaviour.
6.2 Materials and Methods
6.2.1 Time-resolved fluorescence and fluorescence anisotropy measurements
Reagents and sample preparation
FAD and FMN of the highest purity available were purchased from Sigma. ABiogel P2 column (Biorad) equilibrated with the appropriate measuring buffer, was usedprior to the fluorescence experiments to remove possible traces of degradation productsof FAD. Chromatography experiments with FMN using fluorescence detection showedthat FMN did not contain any fluorescent impurities. All measurements were carried outin 50 mM potassium phosphate buffer pH 7.5, except for the control experimentsperformed in D2O. Buffers were made from nanopure-grade water (Millipore) and werefiltered through a 0.22 µm filter (Millipore). The samples had a maximum OD of 0.10 atthe wavelength of excitation. Concentrations were calculated from the molar extinctioncoefficient; resp. ε450 FAD = 11.3 mM-1cm-1 and ε445 FMN = 12.5 mM-1 m-1 (Whitby, 1953).
Fluorescent-grade glycerol was purchased from Merck. Sample preparations wereperformed at 277 K in the dark.

Chapter 6
128
Subnanosecond-resolved polarized fluorescence
Time-correlated single-photon counting (TCSPC) was used to detect polarizedtime-resolved fluorescence on a (sub)nanosecond time scale. Details of both the setupand measurement procedures are described elsewhere (van den Berg et al., 1998; Visseret al., 1998), and only a short outline will be given below. A mode-locked CW Nd:YLFlaser was used to synchronously pump a cavity-dumped dye laser. Vertically polarizedlight of 450 nm (Stilbene 420) or 460 nm (Coumarine) was used to excite the samplewith a frequency of 594 kHz and a duration of 4 ps FWHM. The excitation intensity wasadjusted to yield a detection frequency of 30 kHz in the parallel component. Parallel andperpendicularly polarized fluorescence was detected through a 557.9 nm interferencefilter (Schott, Mainz, Germany, half-bandwidth of 11.8 nm) in combination with a KV520 cut-off filter (Schott). FMN data and regular FAD data were collected in amultichannel analyzer with a time window of 1024 channels at typically 15-20ps/channel. For a better determination of the ultrashort fluorescence lifetime of FAD, atime window of 8000 channels at typically 3-4 ps/channel was used. The dynamicinstrumental response of the setup was obtained at the emission wavelength usingerythrosine B in water (τ = 80 ps at 293 K) as a reference compound (Vos et al., 1987).This instrumental response function is approximately 40 ps FWHM, which makesdetection of 5-10 ps lifetime components realistic. The temperature of the samples wascontrolled using a liquid nitrogen flow setup with a temperature controller (model ITC4,Oxford Instruments Inc., Oxford, United Kingdom).
Analysis of the fluorescence intensity decay I(t) and anisotropy decay r(t) wasperformed with a model of discrete exponentials using the 'TRFA Data Processingpackage' of the Scientific Software Technologies Center of Belarusian State University,Belarus. Global analysis of the total fluorescence decay was performed through linkingthe fluorescence lifetime constants for multiple data sets, and global analysis of theanisotropy decay was performed through linking the rotational correlation time constants(Beechem, 1992). In addition, data were analyzed through the maximum entropy method(software package from Maximum Entropy Solutions Ltd., Ely, United Kingdom), interms of distributions of decay times, for which no a priori knowledge of the system isrequired (Brochon, 1994). The average fluorescence lifetime <τ> was calculated fromthe lifetime spectrum α(τ) according to:

Dynamic conformations of FAD:…
129
⟨τ ⟩ =α iτ i
i =1
N
∑α i
i =1
N
∑(1)
where N is the number of τi values of the α(τ) spectrum. The relative fluorescence
quantum yield Q was determined from the TCSPC data as:
FMN
FAD
FMN
FAD
⟩⟨⟩⟨=
ττ (2)
A detailed description of the principles of the analysis of the polarized fluorescence datacan be found elsewhere (van den Berg et al., 1998; Visser et al., 1998; Digris et al. 1999;and references therein).
6.2.2 Molecular dynamics simulations
Force field description of FAD
The MD simulations were performed with the GROMACS 2.0 software(Berendsen et al., 1995). The parameter set for FAD was constructed from parameterstaken from the standard building blocks of the GROMOS96 force field for FMN andATP (van Gunsteren et al., 1996). Bond lengths, angles, and proper and improperdihedral definitions and parameters from the FMN and ATP building blocks were used.For the adenosine moiety and the ribityl chain (from C1* to C5*) partial charges weretaken from the GROMOS96 force field. Hydrogen atoms on the adenine andisoalloxazine rings were defined explicitly (van der Spoel et al., 1996a). Improperdihedrals were added to the bonds on N5 and N10 of flavin ring B (see Fig. 6.1), inaccordance with the planar structure observed in crystallographic data and moleculargeometry optimizations of flavin in the oxidized state (Zheng & Ornstein, 1996; Meyeret al., 1996). Partial charges on the flavin ring in the ground state and the first excitedsinglet state were derived from atomic charge densities ab initio molecular orbitalcalculations in vacuo on isoalloxazine (Platenkamp et al., 1980), and semi-empiricalMINDO-3 calculations on lumiflavin (7,8,10-trimethylisoalloxazine) (Teitell et al., 1981;Hall et al., 1987b) (see Table 6.1). The charge distribution in the first excited singletstate is similar to that of the first excited triplet state (Teitell et al., 1981). Partial chargesfor the pyrophosphate moiety were taken from ab initio molecular orbital calculations on

Chapter 6
130
Pi4 (H2P4O134-) as described in van der Spoel et al., 1996b. A full description of the force
field parameters, insofar not identical to the GROMOS96 standard building blocks forFMN and ATP, is given in Table 6.1. A complete description of all force fieldparameters used is available as appendix at the end of this Chapter.
Table 6.1: Partial charges on the isoalloxazine ring of FAD in the ground state (S0) andfirst excited singlet state (S1) and at other positions in FAD(1,2)
A. Partial charges on the isoalloxazine ring in the ground state and first excited singlet state
Atom S0 S1 Atom S0 S1 Atom S0 S1
N1 -0.43 -0.31 C4a 0.06 0.09 C8 0.00 -0.02
C2 0.51 0.48 N5 -0.19 -0.24 C8M 0.00 0.00
O2 -0.45 -0.37 C5a 0.06 0.09 C9 -0.18 -0.17
N3 -0.35 -0.35 C6 -0.12 -0.14 H9 0.19 0.17
H3 0.35 0.35 H6 0.19 0.18 C9a 0.14 0.09
C4 0.43 0.40 C7 0.00 0.00 N10 -0.05 -0.07
O4 -0.43 -0.40 C7M 0.00 0.00 C10a 0.27 0.22
B. Partial charges on the pyrophosphate moiety and surrounding atoms
Atom Charge Atom Charge Atom Charge
C5* 0.13 OP2 -1.00 AOP2 -1.00
O5* -0.52 OP1 -1.00 AO5* -0.52
P 1.85 AP 1.85 AC5* 0.13
OP3 -0.92 AOP1 -1.00
C. Partial charges on the adenine ring
Atom Charge Atom Charge Atom Charge Atom Charge
AC2 0.22 AHC2 0.14 AC8 0.22 AHC8 0.14
(1): Insofar as they are not identical to the GROMOS96 standard building blocks for FMN and ATP(van Gunsteren et al., 1996).
(2): A full description of the force field parameters is provided as appendix at the end of this Chapter.
Starting structures, solvation and water equilibration
Starting structures for the unstacked conformation were taken from high-resolution crystal structures of different flavoproteins that contain noncovalently boundFAD. In E. coli glutathione reductase (GR) (Mittl & Schulz, 1994) and E. colithioredoxin reductase (TrxR) (Waksman et al., 1994), the flavin cofactor is bound in an
Dynamic conformations of FAD:…
131
almost completely extended conformation. However, in ferredoxin NADPH-oxidoreductase (FNR) from the cyanobacterium Anabaena, the flavin cofactor is boundin a distinctly bent conformation (Serre et al., 1996). The co-ordinates of the FAD in theabove-mentioned crystal structures of GR, TrxR, and FNR were taken to yield threedifferent extended starting structures (FAD-ext1, FAD-ext2, and FADext-3,respectively). For the stacked conformation of FAD, starting structures were generatedfrom unrestrained MD simulations in vacuo of the extended conformation at 300 K usinga relative dielectric constant of 10 to mimic the charge-shielding effect of solvent. Thesein vacuo simulations yielded stacked conformations of the FAD molecule within tens ofpicoseconds. Two stacked conformations were selected (FAD-sta1, FAD-sta2), in whichthe adenine moiety stacks on opposite sites of the flavin ring). Care was taken to selectframes in which the conformation of the stacked FAD was relatively far away from itsenergy minimum. All five starting structures were solvated with the extended simplepoint-charge water model (SPC/E, Berendsen et al., 1987), which provides goodcorrespondence with experimental data for the dynamic behaviour of water. A box sizeof 4.5 nm was chosen to ensure that the minimum distance between the molecule and itsperiodic images was larger than the cut-off used for the Lennard-Jones interactions (1.0nm). Depending on the starting structure, the number of water molecules varied between2407 and 2415. In the next step, energy minimization was carried out using a steepestdescents algorithm. Two Na+ ions were added to the system to compensate for the twonegative charges on the phosphate groups, by replacing the two water molecules with thelowest electrostatic potential. The solvent was pre-equilibrated for 20-30 ps to yield apressure of 1 bar at 300 K, using weak coupling to both an external pressure andtemperature bath (Berendsen et al., 1984) with harmonic constraints on the atomic co-ordinates of the FAD molecule. A cut-off of 1.0 nm for Lennard-Jones interactions andshort-range electrostatic interactions was applied. During neighbourlist updates, every 20fs long-range electrostatics were calculated with a cut-off of 1.6 nm. After equilibration,the length of the box edges was between 4.16 and 4.18 nm.
Simulations of the molecular dynamics of FAD in the ground state and the excited state
MD simulations were carried out starting from each of the 5 different startingstructures -three in an extended conformation, and two in a stacked conformation- withground state charges at 300 K. Lennard-Jones and short-range electrostatic interactionswere calculated using a cut-off of 1.0 nm. Long-range electrostatic interactions werecalculated during the neighbourlist update, every 20 fs using the particle-particleparticle-mesh approach (PPPM, Hockney & Eastwood, 1988; Luty & van Gunsteren,

Chapter 6
132
1996). A time step of 2 fs was used. After 200 ps, each of the simulations was forked. Inone fork, the charges on the isoalloxazine ring were reassigned to correspond to the firstexcited singlet state (Table 6.1) to mimic the electronic effects of light absorption. In theother fork, the ground state charges were maintained. A summary of the simulationsperformed is presented in Table 6.2. An eleventh run (FAD-sta3) was generated usingthe conformation of FAD from the ground-state MD run of starting structure FAD-ext1S0 that had spontaneously stacked in water. In this simulation, the process of lightabsorption was simulated by again applying excited-state charges, using the time frameat 500 ps, where the molecule was in an equilibrated stacked state. To estimate therelative free-energy difference between the open and closed conformations in the groundand excited states, stable trajectories of several nanoseconds in which the moleculeremained in the open and closed conformation were required. To obtain more samplingin the open conformation, three additional runs (FAD-ext4S0, FAD-ext4S1, FAD-ext5S1) were performed starting from FAD-ext3S0 (200 ps frame), using differentstarting velocities. Two additional simulations in the stacked conformation (FAD-sta4S0and FAD-sta4S1) starting from trajectory FAD-sta3S1 (500 ps frame) were alsoperformed. Individual simulations were run for lengths from 2 to 8 ns, with a totalsimulation time of approximately 65 ns. An overview of the characteristic parameters ofthe runs is also presented in Table 6.2.
Analysis of the MD trajectories
Stacked conformations were defined as having an overlap of the atomic co-ordinates of the isoalloxazine and adenine ring in the longitudinal and transversedirections as seen from the plane of the isoalloxazine ring (Fig. 6.1), combined with amaximal distance of 6 Å between the centers of mass of both ring systems perpendicularto the flavin ring. Because the relation between the exact angle between both ringsystems and fluorescence quenching is still unclear, no angle criterion was used.Distances between the isoalloxazine and adenine rings were calculated using the centerof mass of the ring systems.
To calculate the planarity of the flavin ring, the angle between the benzene-likeand pyrimidine-like rings of the isoalloxazine ring (rings A and C, respectively, in Fig.6.1) was taken from the C8-C5a and C10a-N3 vectors. The angle between theisoalloxazine ring and adenine ring was taken from the angle between the planes definedby N5, C9a, and C10a from the flavin and AN1, AC2, and AC8 from the adenine,respectively. The rotational correlation time of the isoalloxazine ring was calculated

Dynamic conformations of FAD:…
133
Table 6.2: Overview of the molecular dynamics simulations of FAD in water
Run State Starting structure Simulation time
FAD-ext1S0 S0 1gre (glutathione reductase)(1) 0.0 - 2.5 ns
FAD-ext1S1 S1 FAD-ext1S0 at 200 ps(3) 0.2 - 3.0 ns
FAD-ext2S0 S0 1tde (thioredoxin reductase)(1) 0.0 - 3.7 ns
FAD-ext2S1 S1 FAD-ext2S0 at 200 ps(3) 0.2 - 3.7 ns
FAD-ext3S0 S0 1que (ferredoxin NADP+ reductase)(1) 0.0 - 3.7 ns
FAD-ext3S1 S1 FAD-ext3S0 at 200 ps(3) 0.2 - 4.2 ns
FAD-ext4S0 S0 FAD-ext3S0 at 200 ps(4) 0.2 - 8.2 ns
FAD-ext4S1 S1 FAD-ext3S0 at 200 ps(4) 0.2 - 4.2 ns
FAD-ext5S1 S1 FAD-ext3S0 at 200 ps(4) 0.2 - 4.2 ns
FAD-sta1S0 S0 In vacuo stacked FAD-1(2) 0.0 - 2.5 ns
FAD-sta1S1 S1 FAD-sta1S0 at 200 ps(3) 0.2 - 2.5 ns
FAD-sta2S0 S0 In vacuo stacked FAD-2(2) 0.0 - 2.2 ns
FAD-sta2S1 S1 FAD-sta2S0 at 200 ps(3) 0.2 - 2.2 ns
FAD-sta3S1 S1 FAD-ext1S0 at 500 ps(5) 0.5 - 2.5 ns
FAD-sta4S0 S0 FAD-ext1S0 at 200 ps(4) 0.2 - 8.2 ns
FAD-sta4S1 S1 FAD-ext1S0 at 200 ps(4) 0.2 - 8.2 ns
(1): Atomic co-ordinates for FAD in the open conformation were extracted from thehigh resolution crystal structures of three different flavoproteins. The relevantBrookhaven Protein Data Bank entries are given.
(2): From in vacuo simulations of FAD, the atomic co-ordinates of two differentstacked conformations were selected and subsequently solvated and treated in thesame way as other starting structures.
(3): After 200 ps the electronic effect of light absorption was mimicked byinstantaneously adjusting the partial charges appropriate to the first excited singletstate. All other parameters remained unaltered.
(4): Simulations were started from the time frame of the indicated trajectory, withstarting velocities differing from the original run. For FAD-ext4S0 and FAD-ext4S1 identical starting velocities were used.
(5): An additional excited-state simulation on FAD that had stacked spontaneously inwater was performed using the 500 ps timeframe of run FAD-ext1S0. All otherparameters remained unaltered.

Chapter 6
134
using the vector C8-N3, which is very close to the direction of the emission dipolemoment (Bastiaens et al., 1992a).
Hydrogen bonds were determined using a simple distance and angle cut-offcriterion (donor-acceptor distance ≤0.35 nm and hydrogen-donor-acceptor angle ≤60°,Kabsch & Sander, 1983). To refine the information on hydrogen-bonding, thetrajectories were analyzed for hydrogen bonds between the different regions of the FAD(flavin ring, ribityl chain, phosphodiester bond, ribofuranosyl, and adenine parts)separately. Cluster analysis of the ribityl-pyrophosphate-ribofuranosyl chain wasperformed on the atomic positional root-mean-square differences (RMSD) of differentbackbone conformations from the simulations. A cut-off for the RMSD of 0.1 nm wasused to determine neighbouring conformations. Cluster analysis was performedaccording to the following procedure: for each conformation, the number of neighboursis determined. The conformation with the largest number of neighbours is the centralstructure of the first cluster, and all its neighbours are members of that cluster. Theseconformations are removed from the pool of all conformations, and the procedure isrepeated to generate subsequent clusters until the pool is empty. A complete descriptionof this clustering algorithm is given by Daura et al. (1999).
The relative free-energy difference between the open and closed conformations
for the ground state and excited state ( 1/0/
SSclopG∆∆ ) was calculated using a free-energy
perturbation approach (Mark, 1998) in the thermodynamic cycle:
Scheme 1
Because the open/closed equilibrium (corresponding to ∆Gop→cl,S0 and ∆Gop→cl,S1) is
computationally inaccessible, the free-energy differences are instead calculated fromperturbing the electronic state in the open and closed ensembles, respectively (∆GS0→S1,op
and ∆GS0→S1,cl) in a single step:
∆Gop→cl,S1
Open-S1 Closed-S1
∆GS0→S1,op ∆GS0→S1,cl
Open-S0 Closed-S0
∆Gop→cl,S0

Dynamic conformations of FAD:…
135
clSSopSSSclopSclopSS
clop GGGGG ,10,101,0,1/0
/ →→→→ ∆−∆=∆−∆=∆∆ (3)
where ∆GS0→S1,op and ∆GS0→S1,cl are calculated from:
clS
RTSESE
clSclSclSS eRTGGG,0
01
,0,1,10 ln−
−
→ −=−=∆ (4)
where clS ,0
... denotes the average over the closed ensemble in the ground state (S0),
and ES0 and ES1 represent the energy of the conformations of the ensembles in the groundand the excited states, respectively. A total of four simulations were performed, both inopen and closed states and in ground and excited states, and all were perturbed to theopposite electronic state in an analogous manner. From these simulations, using Eqn. 4,four free-energy differences were calculated (vis. ∆GS0→S1,cl, ∆GS0→S1,op, ∆GS1→S0,cl,
and ∆GS1→S0,op). ∆GS0→S1,cl and ∆GS1→S0,cl should converge to the same value, and
likewise ∆GS0→S1,op and ∆GS1→S0,op should converge. From these converged values, the1/0
/SS
clopG∆∆ can be calculated, and the measure of convergence is a measure of the
accuracy.
6.3 Results
6.3.1 Fluorescence dynamics of the flavin cofactor
Polarized subnanosecond-resolved TCSPC data of FAD reveal excited-state dynamicsover a wider time range than earlier studies performed at a lower time resolution (Visser,1984). Whereas global analysis of the essentially nonquenched fluorescence decay ofFMN confirms a predominant lifetime component of 4.7 ns, global analysis of theextraordinarily heterogeneous fluorescence decay of FAD in terms of discreteexponentials yields a lifetime pattern with components covering the dynamic range frompicoseconds up to several nanoseconds (Table 6.3). A predominant lifetime componentwas found to be of the order of 5-10 ps, which is close to the detection limit of the setupused. This ultrafast fluorescence quenching is reflected in the steep leading edge of theexperimental fluorescence decay of the FAD samples (Fig. 6.2) rather than in aseparately visible fast decay due to convolution with the pulse (instrumental response of~40 ps FWHM) and the slower ingrowth of fluorescence resulting from the nanosecond
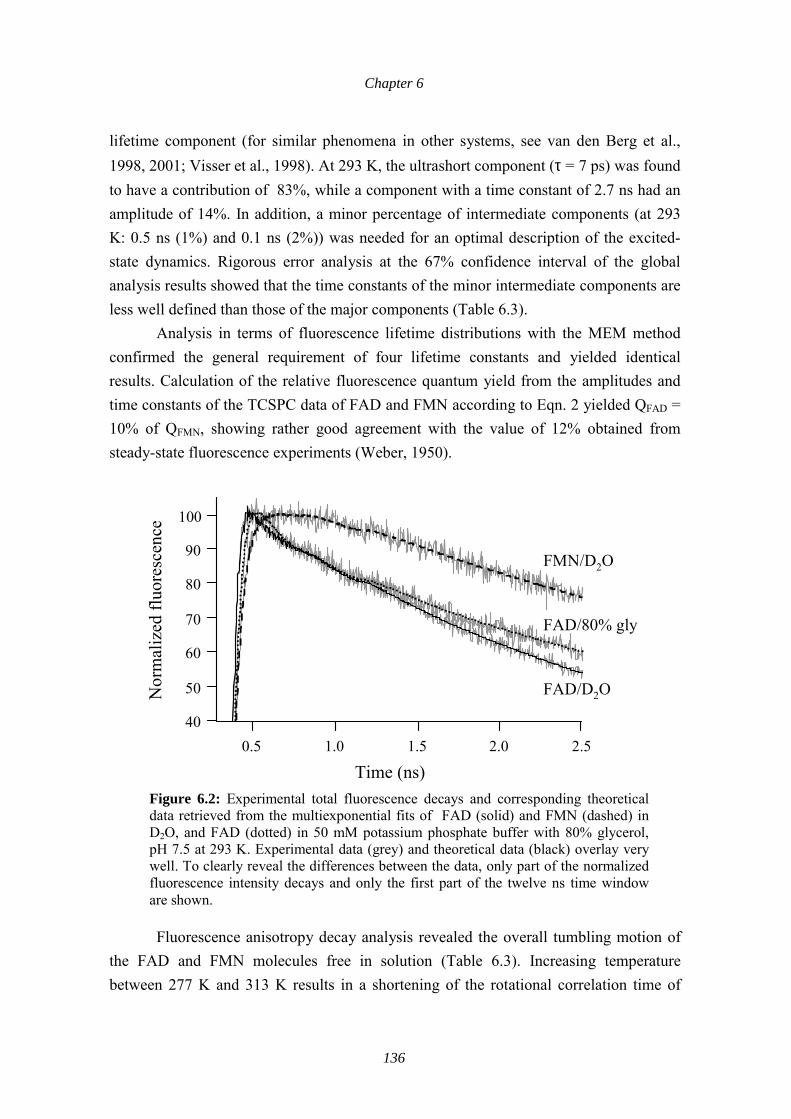
Chapter 6
136
lifetime component (for similar phenomena in other systems, see van den Berg et al.,1998, 2001; Visser et al., 1998). At 293 K, the ultrashort component (τ = 7 ps) was foundto have a contribution of 83%, while a component with a time constant of 2.7 ns had anamplitude of 14%. In addition, a minor percentage of intermediate components (at 293K: 0.5 ns (1%) and 0.1 ns (2%)) was needed for an optimal description of the excited-state dynamics. Rigorous error analysis at the 67% confidence interval of the globalanalysis results showed that the time constants of the minor intermediate components areless well defined than those of the major components (Table 6.3).
Analysis in terms of fluorescence lifetime distributions with the MEM methodconfirmed the general requirement of four lifetime constants and yielded identicalresults. Calculation of the relative fluorescence quantum yield from the amplitudes andtime constants of the TCSPC data of FAD and FMN according to Eqn. 2 yielded QFAD =10% of QFMN, showing rather good agreement with the value of 12% obtained fromsteady-state fluorescence experiments (Weber, 1950).
Fluorescence anisotropy decay analysis revealed the overall tumbling motion ofthe FAD and FMN molecules free in solution (Table 6.3). Increasing temperaturebetween 277 K and 313 K results in a shortening of the rotational correlation time of
100
90
80
70
60
50
40
Nor
mal
ized
fluo
resc
ence
FMN/D2O
FAD/D2O
FAD/80% gly
2.52.01.51.00.5
Time (ns)Figure 6.2: Experimental total fluorescence decays and corresponding theoreticaldata retrieved from the multiexponential fits of FAD (solid) and FMN (dashed) inD2O, and FAD (dotted) in 50 mM potassium phosphate buffer with 80% glycerol,pH 7.5 at 293 K. Experimental data (grey) and theoretical data (black) overlay verywell. To clearly reveal the differences between the data, only part of the normalizedfluorescence intensity decays and only the first part of the twelve ns time windoware shown.

Dynamic conformations of FAD:…
137
FAD corresponding with the concomitant change in solvent viscosity and kinetic energy(compare 0.20 ns at 293 K versus 0.16 at 300 K).
In the fluorescence lifetime data, increasing temperature between 277 K and 313K results in a shortening of the nanosecond decay time. From 293 K to 313 K a cleardecrease in the amplitude of the ultrashort lifetime is found in favour of the longerlifetime components. This can be explained by a shift in equilibrium towards the openconformation.
A larger shift towards an open, nonquenched conformation is obtained in 80%glycerol (Fig. 6.2 and Table 6.3), which is consistent with earlier steady-statespectroscopic studies showing that nonpolar solvents prevent stacking interactions(Penzer & Radda, 1967, and references therein). Measurements of FAD in deuteriumoxide revealed only a slight shift of the longest fluorescence lifetime component towards
Table 6.3: Fluorescence lifetime parameters (τi, αi) and rotational correlation times (φ)of FAD and FMN as a function of temperature and solvent composition(1,2)
Fluorescence lifetime parameters Sample Temp (K) Rot. cor. time φφφφ (ns)
ττττi (ns) αααα i
0.008 (0.004-0.008) 0.78 ± 4%0
0.075 (0.072-0.081) 0.11 ± 11%
0.90 (0.83-1.1) 0.02 ± 15%
FAD 277 0.35 (0.32-0.37)
3.6 (3.3-3.8) 0.09 ± 39%
0.007 (0.002-0.009) 0.83 ± 3%0
0.10 (0.03-) 0.01 ± 15%
0.54 (0.37-) 0.02 ± 3%0
FAD 293 0.20 (0.18-0.23)
2.7 (2.6-3.1) 0.14 ± 7%0
0.008 (0.003-0.012) 0.72 ± 12%
0.086 (0.019-) 0.04 ± 63%
0.55 (0.25-) 0.03 ± 17%
FAD 300 0.16 (0.14-0.19)
2.4 (1.9-2.6) 0.20 ± 21%
0.010 (0.007-0.011) 0.60 ± 10%
0.072 (0.052-0.079) 0.12 ± 32%
1.2 (1.1-1.4) 0.13 ± 36%
2.2 (1.9-2.8) 0.12 ± 32%
FAD 313 0.11 (0.10-0.12)
5.1 (4.6-) 0.02 ± 65%

Chapter 6
138
Fluorescence lifetime parametersSample Temp(K)
Rot. cor. time φφφφ (ns)
ττττi (ns) αααα i
0.012 (0.006-) 00.12 ± 140%
0.13 (0.090-) 0.12 ± 16%
0.81 (0.69-1.0) 0.22 ± 44%
4.8 (2.9-5.1) 0.48 ± 17%
FAD in
80% glycerol
293 15.1 (14.3-15.8)
7.1 (5.3-) 0.06 ± 14%
0.005 (0.002-) 0.81 ± 4%0
0.049 (0.013-) 0.05 ± 6%0
0.44 (0.16-) 0.02 ± 7%0
3.1 (3.0-3.8) 0.11 ± 11%
FAD in D2O 293 0.24 (0.20-0.27)
6.4 (3.2-) 0.01 ± 9%0
≤ 0.004 (3)
0.38 (0.077-) 0.04 ± 17%
FMN in D2O 293 0.21 (0.18-0.24)
5.3 (5.3-5.4) 0.96 ± 7%0
1.5 (1.3-1.7) 0.12 ± 2%0FMN 293 0.18 (0.16 -0.20)
4.7 (4.7-4.8) 0.88 ± 1%0
(1): Standard experiments were performed in 50 mM potassium phosphate buffer at pH 7.5.(2): Presented are time constants and fractional contributions (αi) of the fluorescence lifetime
components (τi) as obtained from global analysis of multiple experiments. The values in theparentheses are obtained from a rigorous error analysis at the 67% confidence level asdescribed by Beechem (1992). For components with low amplitudes upper confidencelimits were not always found. For the fractional contributions αi, the standard deviation isgiven.
(3): Data suggested the possibility of a third fluorescence lifetime component of a few ps at theborder of the detection limit that could not be resolved clearly. This possible componentwas not taken into account in the fractional contribution calculations.
longer time values, leaving the amplitudes virtually unaffected (Table 6.3). For FMN, asimilar effect on the predominant fluorescence lifetime was obtained. These results showthat deuterium oxide slightly influences the intrinsic fluorescence lifetime of theisoalloxazine ring, and that significant involvement of hydrogen-bonding interactions inthe fluorescence quenching mechanism should not be expected. Fluorescencedepolarization analysis of FMN and FAD in deuterium oxide revealed slightly reduceddynamics with respect to water (Table 6.3).

Dynamic conformations of FAD:…
139
6.3.2 MD simulations of the FAD cofactor and the process of light absorption
The process of stacking
To obtain more insight into the relation between the conformational dynamics ofthe FAD cofactor in solution and the fluorescence characteristics, molecular dynamicssimulations were executed. For this study, five different starting structures were used,three of which represent the FAD in an �open� conformation and two of which representthe flavin and adenine rings in a stacked (or �closed�) conformation. The electronic effectinduced by light absorption was simulated by instantaneously adjusting the partialcharges on the atoms of the flavin ring. An overview of the simulations performed isgiven in Table 6.2.
All MD trajectories, both in the ground state and the excited state, were analyzedfor the occurrence of flavin-adenine stacking (for the definition of stacking, see theMaterials and Methods section). The distance between the centers of mass of the flavinand adenine ring systems was used to monitor the process of stacking and unstacking,and to characterize the FAD conformations (Fig. 6.3). In one run, the FAD moleculeremained in the open conformation throughout the simulation (8 ns). In the other sevenruns started from 'open' conformations, the isoalloxazine and adenine rings becamestacked in the course of the simulation. Whereas in some cases a nearly instantaneouscollapse from a completely extended conformation to a highly stable stackedconformation occurred (e.g., complete stacking within a few hundred ps in FAD-ext1S0), other simulations were characterized by the presence of many differentintermediates, some of which were relatively long-lived (up to ~1 ns; e.g., FAD-ext2S1,FAD-ext3S1). The simulations revealed that the process of stacking proceeds through theadoption of a more compact but still open conformation in which the ribityl-pyrophosphate-ribofuranosyl chain is bent. The time necessary to reach thisconformation appears to be dependent on the presence of particular intramolecularhydrogen-bond networks. Subsequently, the isoalloxazine and adenine rings come intocontact.
The first intramolecular interactions observed between �nonneighbouring� partsof the molecule involved, in most cases, the hydrophilic ring of the flavin (particularlyO2 and N3, Fig. 6.1) and the six-membered ring of the adenine. This interaction issometimes preceded by a contact between the flavin and the (hydroxyl groups of the)sugar. An alternative pathway for stacking involves the disruption of a hydrogen-bondnetwork between the AMP-phosphate and the sugar. The adenine subsequently movesclose to the flavin via the ribityl chain (FAD-ext3S1). After the disruption of a second set

Chapter 6
140
11111

Dynamic conformations of FAD:…
141
Figure 6.3: Characteristics of the eight molecular dynamics simulations of FADstarting from the open, extended conformation. Shown in light grey are the distancesbetween the centers of mass of the flavin and adenine rings are depicted. Verticaldotted lines correspond to the snapshots shown in Figure 6.4. The distance plotsprovide a good qualitative overview of the changes in molecular conformationduring the runs. Conformations with distances ≤6 Å were regarded as stacked, andthese with distances >6 Å as unstacked. Note the regular unstacking in run ext3S0,and the absence of stacking in run ext4S0, which extends up to 8 ns (only the first 4ns are shown). In dark grey, the number of hydrogen bonds between resp. the flavinring and ribityl chain, the ribityl chain and itself, the ribityl chain and thepyrophosphate moiety, and the ribose moiety and the pyrophosphate moiety aregiven for each of the trajectories (from the upper sub-panel downward). Note thepresence of hydrogen-bonding networks between the ribose and pyrophoshatemoieties, and between the ribityl chain and the pyrophosphate moiety in theextended conformation in most of the trajectories. In the stacked conformations,hydrogen bonds between the flavin and ribityl chain can occur (ext1S0, ext1S1,ext4S1).
of hydrogen bonds (between the ribityl chain and the FMN-phosphate), the six-membered ring of the adenine and the hydrophobic ring of the flavin (ring A in Fig. 6.1)stack. It should be mentioned that different stacking routes result in different closedconformations (see the next section).
Once the flavin and adenine moieties were in a stacked conformation withconsiderable overlap of the ring systems, unstacking of the flavin and adenine ringsoccurred only occasionally and was brief (generally a few ps to 50 ps at most). Hardlyany complete unstacking of the flavin and adenine rings was observed in molecules withfull stacking between the rings (FAD-ext1, FAD-sta1, FAD-sta2, FAD-sta3; for the runsstarting from stacked conformations, data are not shown), irrespective of the electronicstate of the flavin. The less overlap between the ring systems in the stacked state, theeasier was the unstacking. In the run FAD-ext3S0, a closed conformation with properstacking was hampered (Fig. 6.4). Here, unstacking of the rings lasting up to severalhundreds of picoseconds was more common. However, the FAD remained in a compactstate with the adenosine and ribityl moieties in contact. In none of the simulations,'unfolding' of the molecule to a fully extended conformation was observed.

Chapter 6
142
Figure 6.4: Snapshots of stacked and open conformations observed in the moleculardynamics simulations. Shown are from left to right: FAD-ext1S0 at 2.00 ns, FAD-ext3S0 at 2.54 ns, FAD-ext3S1 at 1.49 ns, and FAD-ext4S0 at 1.3 ns. Hydrogenbonds are indicated with light-grey lines. Of special interest are the extensivehydrogen-bond networks involving the phosphate and sugar moieties. Note the strainin the configuration of the phosphate groups.
To determine whether the process of light absorption influences the equilibriumbetween the open and closed conformations of FAD, free-energy calculations wereperformed to determine ∆∆G of the stacking transition in the ground state and in theexcited state using the thermodynamic cycle as depicted in scheme 1 and using eqn 3.Free-energy calculations yielded similar time-averaged energy differences between thestacked and unstacked conformation for the ground state and for the excited state, inprinciple suggesting that in fluorescence the process of light absorption indeed does notinfluence the conformational equilibrium (Fig. 6.5). From Figure 6.5 it can be seen thatthe convergence between forward and backward perturbations is of the same size as theresulting ∆∆G, indicating that, due to the long-lived conformational states, statistics arethe limiting factor in obtaining an accurate estimate for ∆∆G.
ext1S0 2 ns ext3S0 2.54 ns ext3S1 1.49 ns ext4S1 1.3 ns

Dynamic conformations of FAD:…
143
Figure 6.5: Cumulative average of the relative free energy of stacking in the groundstate and the excited state. For the stacked conformations, two additional runsstarting from the conformation stacked in water (starting with the frame at 500 psfrom trajectory FAD-ext3S0) were performed to yield 8 ns of data for both theground state and the excited state. For the open conformations, the 8 ns trajectory ofFAD-ext4S0 and an additional run in the excited state yielding 4.2 ns of openconformations were used. Relative free energies for the ground state and the firstexcited state were calculated using both charge distributions for the same trajectory.For the stacking transition, no significant free-energy difference between the groundstate and the excited state was observed.
The conformational landscape: clusters of conformations
The range of conformations observed for the FAD molecule can be best describedby the relative positions and orientations of the flavin and adenine rings, and theconformation of the connecting ribityl-pyrophosphate-ribofuranosyl backbone. Thisinformation is summarized in Table 6.4. Note that the stacked starting structuresFAD-sta1 and FAD-sta2 were created in vacuo whereas the other stacked conformationswere produced in solution. It appears that in solution, the adenine ring can stack on eitherside of the flavin and there is no preferred orientation of the ribityl-pyrophosphate-ribofuranosyl backbone. In general, the isoalloxazine and adenine rings stack coplanarly.In water, FAD tends to adopt a fully parallel stacked conformation similar to thosecreated in vacuo (average angle between the flavin and adenine planes of 12.5°). In
ext5S1sta4S0sta4S1
ext4S0
∆∆G
60002000 4000 8000
Time (ps)
120
125
130
135
140
∆G (kJ/mol)
0

Chapter 6
144
several simulations, (intermediate) conformations were found in which the flavin andadenine rings were slightly tilted (~30°, see Table 6.4), but still had substantial contact.Occasionally, water molecules intercalated on one of the edges between the rings, and ahydrogen-bonded water bridge was formed between the rings, resulting in decreasedcoplanarity. Stacking also influenced the planarity of the flavin ring system. Whereas inthe open conformations an average angle of 15° was found between rings A and C of theisoalloxazine (Fig. 6.1), this angle was slightly, but systematically, smaller in the stackedconformations (13°, see Table 6.4). The largest deviations from planarity were foundduring conformational transitions involving intramolecular interactions with theisoalloxazine ring. After stacking, the flavin and adenine had some lateral freedom, butwere restricted by the conformation of the connecting chain. In general, this mobilitydecreased with increasing overlap of the rings. The average position of the stacked ringsystems was not influenced by the changed charge distribution from the ground state tothe excited state. In many of the stacked conformations, a high strain occurred on one orboth of the phosphate groups, resulting in a significant deviation from the tetrahedralconfiguration. This may be due to an overestimate of charge interactions in the forcefield of the phosphodiester bridge, as these charge interactions are abundant in thestacked conformation.
The conformations of the ribityl-pyrophosphate-ribofuranosyl backboneconnecting the flavin and adenine moieties were analyzed through the RMSD of theatomic positions, and were grouped in clusters of highly similar conformations. From thecluster analysis, it can be concluded that in runs from different starting structures,different conformations of the backbone chain were sampled, and that only a fewtransitions from one cluster to another occurred. Specific dihedral configurations of thebackbone chain stabilised by hydrogen bond networks, appear to have very longlifetimes, thereby restricting the rings to certain conformations. Conversely, in thestacked situation the strong interactions between the rings may restrict rearrangements ofthe backbone chain. Surprisingly, the starting structures stacked in vacuo have backboneconformations differing distinctly from the structures resulting from stacking in water.This is also reflected in the relative positions of the stacked rings, as shown in Table 6.4.
Conformational fluctuations and mobility: hydrogen bonding, solvent interactions androtational correlation
An important conclusion from the MD simulations is that in solution thebackbone of the FAD molecule behaves much more rigidly than we had expected. Togain insight into the effect of hydrogen bonds between the different building blocks of

Dynamic conformations of FAD:…
145
11111111 Table 6.4: Overview of parameters characterizing the dynamic behaviour and the stackedconformations in the molecular dynamics simulations(1)
Stacked conformations(3) Average θθθθ flavin(4) Rot. cor. time (ps)Run Stackingtime (ns)(2) Position Chain Plane θ θ θ θ fla-ade Open Stacked Open Stacked
FAD-ext1S0 0.26 C R Si 11.0 ± 6.5 16.0 ± 7.9 11.6 ± 6.4 -- 131.1
FAD-ext1S1 1.24 C/BC R Si 13.2 ± 8.2 18.2 ± 8.9 14.0 ± 8.4 116.9 146.6
FAD-ext2S0 1.86 C R Si 31.3 ± 18.3 15.5 ± 8.0 13.7 ± 7.5 149.5 194.6
FAD-ext2S1 1.87 C R Si 34.6 ± 9.4 13.8 ± 7.7 13.9 ± 7.3 131.1 234.7
FAD-ext3S0 0.62 A S Re 26.0 ± 14.8 13.9 ± 8.0 13.6 ± 7.5 115.5 144.1
FAD-ext3S1 3.28 B S Re 12.3 ± 8.5(5)
35.3 ± 13.714.4 ± 8.0 13.6 ± 7.5 118.6 146.2
FAD-ext4S0 >8.2 -- -- -- -- 14.9 ± 8.3 -- 121.9 --
FAD-ext4S1 2.63 BC S Si 30.3 ± 23.1 14.3 ± 8.2 17.3 ± 8.4 173.3 204.0
FAD-sta1S0 -- BC S Si 13.0 ± 8.2(5)
37.1 ± 11.4 - 12.9 ± 7.1 -- 176.7
FAD-sta1S1 -- BC S Si 13.1 ± 7.5 -- 12.3 ± 6.2 -- 132.8
FAD-sta2S0 -- BC S Re 12.2 ± 7.2 -- 10.9 ± 6.0 -- 127.4
FAD-sta2S1 -- BC S Re 11.8 ± 7.0 -- 11.6 ± 6.5 -- 143.9
FAD-sta3S1 -- C R Si 13.0 ± 9.1 -- 12.0 ± 6.7 -- 116.3
(1): Parameters that could not be retrieved due to the absence (or limited existence) of a particularconformation or transition are indicated by the sign --.
(2): Only the time interval for the first transition from an open to a stacked conformation is given.Unstacking (rapidly) followed by restacking was observed regularly. FAD-ext3S0 and FAD-ext1S1 (single event) showed long periods of unstacking (up to 250 ps). For further details seeResults and the Figures 6.3 and 6.4.
(3): The following characteristics of the stacked conformations are presented:1. Average relative positions of the adenine and isoalloxazine rings. The ring(s) that is (are)
closest to the center of mass of the adenine is (are) given. The labels of the rings (A =hydrophobic ring, B = middle ring, C = hydrophilic ring) are clarified in Figure 6.1.
2. Direction in which the ribityl-pyrophosphate ribofuranosyl chain is twisted (going from theflavin to the adenine) with R = clockwise, S = counterclockwise.
3. Side of the isoalloxazine plane on which the adenine stacks. Si = �on the front�, Re = �onthe back� of the isoalloxazine ring as depicted in Figure 6.1.
4. Average angle θ between the adenine and flavin rings in the stacked conformation.(4): Average angle θ between rings A and C of the isoalloxazine ring in the open and stacked
conformations.(5): Clear transitions to conformations in which the flavin and adenine rings are slightly tilted
(angle of ~35°) were found for FAD-sta1S0 (1.2-2.4 ns) and FAD-ext3S1 (3.3-3.7 ns).

Chapter 6
146
FAD, the trajectories were analyzed in terms of the number of hydrogen bonds betweentwo separate regions of the molecule (flavin ring, ribityl chain, pyrophosphate,ribofuranosyl, and adenine ring). The high density of hydrogen bonding-donors and-acceptors in the chain provides an excellent framework for intramolecular hydrogenbonding. Intramolecular hydrogen-bond networks between the sugar and thephosphodiester bond appear to have a prominent effect on the lifetime of the openconformation (Fig. 6.3). Hydrogen bonding between the ribityl chain and thephosphodiester bond contributes to this as well. For this network, the number ofhydrogen bonds may even temporarily increase just before stacking, as upon bending ofthe chain the distant phosphate comes within hydrogen-bonding distance of the ribitylchain as well (e.g., ext3S1). Both the formation of hydrogen bonds and the concomitantbreaking of the hydrogen bonds appeared to be highly co-operative. Breaking up a co-operative network involves a free-energy barrier that can �lock� the molecule into aparticular open conformation for long periods of time (up to hundreds of ps). Theinterplay between the energetically favourable stacking of the ring systems on one hand,and the co-operative hydrogen bond formation between the ribityl chain and the FMN-phosphate on the other hand, resulted in frequent stacking, unstacking and restacking inthe same conformation (FAD-ext3S0).
In some stacked conformations, especially in FAD-ext1, a hydrogen bond wasformed between the hydroxyl group attached to C4* or C3* of the ribityl chain and N1of the flavin. In the literature (Heelis, 1991), the interaction between a hydroxyl group ofthe ribityl chain and N1 of the flavin was proposed to be involved in the intramolecularphotoreduction of the flavin, resulting in subsequent photodegradation. As a candidatefor this, the hydroxyl group of C2* of the ribityl chain was proposed. This hydrogenbond was found in the MD simulations as well, but only on rare occasions.
In all MD runs, one Na+ ion was either initially positioned at 2 Å from the esteroxygen of the phosphodiester bond, or it migrated to this position during the run(between 0.1 and 2 ns). Sometimes, the second Na+ ion moved towards this position aswell. No interactions between Na+ ions and the flavin ring were found.
The rotational mobility of the FAD molecules was analyzed through a second-order Legendre polynomial of the autocorrelation function pertaining to the rotationalorientation of the flavin ring. For this analysis, the N3-C8 axis, whose direction is veryclose to that of the emission dipole moment (Bastiaens et al., 1992a), was used. Therotational correlation time of the flavin was 149 ± 33 ps. A small difference was foundbetween the rotational correlation time of the flavin in the stacked and the unstackedparts of the simulations. Analysis of the trajectories in which only the stacked

Dynamic conformations of FAD:…
147
conformations were taken into account resulted in a rotational correlation time of 162 ±35 ps, whereas for the unstacked conformations a time constant of 132 ± 22 ps wasfound. In every single run in which the molecule was in both an unstacked and a stackedconformation for a considerable period of time, the rotational correlation time for theunstacked situation was significantly smaller than that for the stacked (Table 6.4). Thismay be explained by additional mobility of the isoalloxazine ring in the planeperpendicular to the ribityl-pyrophosphate-ribofuranosyl backbone. As in time-resolvedfluorescence experiments the signal of the anisotropy decay is fully carried by thenanosecond lifetime component stemming from the �open� conformations, comparisonsbetween the rotational correlation times obtained from experiment and simulationsshould regard the unstacked conformations. Given the limited statistics of the unstackedconformations, these values are in good agreement (from simulations 132 ± 22 ps; fromexperiment 160 ps at 300 K; Tables 6.3 and 6.4).
6.4 Discussion
In this study we have demonstrated the combined use of molecular dynamicssimulations and subnanosecond-resolved fluorescence spectroscopy to obtain moredetailed insight into the dynamic structure of complex fluorophores such as the flavinadenine dinucleotide cofactor. Polarized fluorescence experiments with high timeresolution yield a broad picture of the dynamic landscape for the ensemble of moleculesin solution, whereas MD simulations provide a detailed view of the underlying molecularstructures and possible transition pathways. The limitation, however, is whether it ispossible to run simulations long enough to sufficiently sample the conformational space.
The molecular dynamics simulations confirm that the FAD molecule in aqueoussolution is predominantly in a compact conformation in which the flavin and adeninemoieties are stacked. Although unstacking of the flavin and adenine ring systems occurs,the molecule is mainly in a conformation in which the flavin and adenine rings can have(large) π-π overlap, occasionally alternated by conformations in which the ring systemsinteract via direct or water-mediated hydrogen bonds.
These simulations suggest against several potential mechanisms for ultrarapidfluorescence quenching in FAD. Although sampling of the open/closed equilibrium wasfar from complete in our simulations, extensive sampling of the closed state yieldedreasonable statistics on the propensity of hydrogen bond formation in the closed state. Inthe MD simulations, interactions between the flavin N5 and the amino group of theadenine ring were observed only rarely, and were mostly bridged through a watermolecule. A perpendicular orientation of the flavin and the adenine in which the lone

Chapter 6
148
electron pair of N5 could interact with the π-system of the adenine was not found at all.It is therefore improbable that a quenching mechanism based upon these interactionsgives rise to the predominant picosecond fluorescence lifetime component observed.Likewise, a quenching mechanism involving hydrogen bonding between the adenine andthe 2-keto function of the flavin, as proposed by Tsibris et al. (1965), is also unlikely onthe basis of the virtual absence of such interactions in the simulations. Fluorescenceexperiments in deuterium oxide did not give any evidence for the involvement ofhydrogen bonds in fluorescence quenching either. In addition, the absence of substantialhydrogen bonding between the flavin and adenine moieties renders a significantpopulation of molecules with parallel intramolecular hydrogen bonding between theflavin and adenine, as proposed by Raszka and Kaplan (1974) for the unstacked state,highly unlikely.
The stacked conformation of the flavin and adenine rings observed in the MDsimulations, however, can well explain the ultrarapid fluorescence quenching in FAD.The MD simulations reveal a large overlap of the coplanar flavin and adenine ringsystems indicating large π-π overlap. The interactions between the adenine andisoalloxazine rings may yield additional de-excitation routes through internal conversion.Most likely, however, the mechanism of flavin fluorescence quenching involves aphotoinduced charge-transfer interaction between the adenine (donor) and flavin(acceptor). Photoinduced electron (or hydrogen) transfer from electron-rich donors to theisoalloxazine is a well-known property of flavins (Karen et al., 1983 & 1987; van denBerg et al., 1998; Zhong & Zewail, 2001). In flavoproteins that contain a tyrosine ortryptophan residue adjacent to the flavin, photoinduced electron transfer to the flavin hasbeen shown to result in highly efficient flavin fluorescence quenching with timeconstants in the picosecond and subpicosecond ranges (van den Berg et al., 1998; Visseret al., 1998; Mataga et al., 1998, 2000; Zhong & Zewail, 2001). Although classicalcharge-transfer interactions between flavin and purines have been reported not tocontribute significantly in the ground state, photoinduced electron transfer should beconsidered for ultrafast excited-state quenching in the complex. For photoinducedelectron transfer, the relation between the free energy of the reaction, the reorganisationenergy and the distance between the donor and acceptor is expressed in the Rehm-Wellerequation (Rehm & Weller, 1970; Marcus & Sutin, 1985). On the basis of the redoxpotentials for adenine reported by Seidel et al. (1996) (~1.5 V at pH 7.5), and FMN (-0.24 V, Draper & Ingraham, 1968), photoinduced electron transfer is likely to occur atthe wavelength of excitation (energy for the S0→S1 transition (π-π* character) at 450 nmis 2.76 eV). In general, typical rate constants for electron transfer derived from a variety

Dynamic conformations of FAD:…
149
of biological and (semi)synthetical systems are of the order of 1 ps-1 to 0.1 ps-1 fordonor-acceptor distances of 5 Å, whereas distances of 10 Å generally result in ratesbetween 10 ns-1 and 1 ns-1 (Moser et al., 1992). The picosecond fluorescence quenchingobserved for FAD corresponds to a rate constant of ~0.15 ps-1 which lies in the expectedtime range for electron transfer. Because the time constant is close to the detection limitof the TCSPC setup used, the rate constant for quenching might be somewhatunderestimated. Recently, femtosecond fluorescence quenching was observed in theflavoproteins riboflavin-binding protein (Mataga et al., 2000; Zhong and Zewail, 2001)and the D-amino acid oxidase/benzoate complex (Mataga et al., 2000), which contain a(coplanarly) stacked complex between the isoalloxazine ring and an aromatic ring (trpand tyr, and benzoate, respectively). Such ultrafast processes would fall beyond thedetection limit of our experimental setup. The oxidation potentials of tryptophan andtyrosine, however, are somewhat lower than that of adenine, thus accelerating anelectron-transfer reaction. Recently reported transient absorption spectra of FAD(Stanley & MacFarlane, 2000) revealed a time constant for excited-state quenching of ~4ps, which is in close agreement with the results presented here. Although the study onthe transient absorption of FMN and FAD in water and formamide definitely confirmedthe rapid excited-state quenching of flavin/purine complexes in aqueous solution, themolecular mechanism of quenching was not discussed.
Besides the picosecond fluorescence lifetime component discussed above, thefluorescence lifetime patterns of FAD contained a nanosecond component and minor butdefinite contributions of intermediate time constants (100 ps�1 ns). In an extreme modelconsidering each component of the lifetime spectrum as a separate conformational statewith a conformational lifetime longer than the fluorescence lifetime of that particularstate ('conformational substates' model), these could be interpreted as separateconformations of the FAD molecule with a (very) small, but significant population. Inthe simulations, however, we observed the FAD molecule to experience conformationaltransitions during the lifetime of the excited state, on time scales ranging from severaltens of picoseconds to nanoseconds. In such a dynamic environment, the amplitude of aparticular fluorescence lifetime observed, reflects the total number of dynamic processesfor all conformations encountered that lead to fluorescence quenching with thatparticular time constant. In this situation, a direct link between the amplitudes offluorescence lifetime components and the population of certain conformational statescannot be made.
On the basis of the fluorescence characteristics of FMN together with the MDsimulations, however, we believe that for FAD in the stacked conformation only, the
Chapter 6
150
flavin fluorescence will be quenched immediately. When the picosecond fluorescencelifetime constants of FAD represents the 'closed' conformation, and the other lifetimesthe (various) 'open' conformations of the molecule, one can obtain estimates of thepopulations. Under the assumptions that only the observed ultrafast component reflectsthe stacked conformation, and that the equilibrium constant for the excited state isidentical to that for the ground state (which seems reasonable from the calculations of thefree-energy differences for the stacking equilibrium in the ground state and the excitedstate) the population of FAD molecules in the open conformations, as calculated fromthe weight of the amplitudes from the TCSPC data, is ~17% at 293 K.
The open, unstacked conformations of FAD are responsible for the significant 2.7ns fluorescence lifetime component. The MD simulations have shown that the FADmolecule can exist in an extended conformation for considerable periods of time, whichare longer than the intrinsic fluorescence lifetime of the flavin. However, if aconsiderable number of FAD molecules remain in an extended open conformation withno intramolecular interactions between the flavin and adenosine moieties during thelifetime of the excited state, a nanosecond fluorescence lifetime constant identical to thatof FMN (4.7 ns) would be expected. An explanation for the 2.7 ns lifetime component ofFAD that cannot be fully excluded is the existence of a particular compact conformationwith a long conformational lifetime (compared to the lifetime of the excited state) inwhich the flavin does not stack, but interacts with other parts of the molecule, resultingin less efficient flavin fluorescence quenching. It is interesting that in the FAD-ext3S0run, the long-lived conformation in which the flavin and adenine moieties are close toeach other, but do not stack (Fig. 6.4), resembles the X-ray structure of the FAD cofactorbound to DNA photolyase (Park et al., 1995), the only flavoprotein known thus far inwhich the cofactor is bound in a nonextended conformation. This particularconformation, however, occurred persistently in one run only, which is not sufficient toexplain the magnitude of the 2.7 ns fluorescence component.
A more likely hypothesis is therefore that the nanosecond fluorescence lifetimecomponent of FAD corresponds to the conformational lifetime of the open conformation.Support for this is found in the MD simulations, where except for one run, allsimulations starting from an extended conformation of the molecule stacked within 5 ns.From these simulations a hypothetical fluorescence decay curve can be constructed (Fig.6.6) under the assumptions that the limited ensemble of FAD starting structures in theextended conformation adequately represents the conformational ensemble of 'open'FAD molecules in solution, that the dynamics of the FAD are not significantlyinfluenced by light excitation, and that as soon as an FAD molecule stacks, quenching

Dynamic conformations of FAD:…
151
occurs. The theoretical fluorescence lifetime retrieved from this hypothetical curve is 1.7ns, which is not far from the nanosecond lifetime observed with time-resolvedfluorescence (2.4 ns at 300 K). Together, the time-resolved fluorescence data andmolecular dynamics simulations support the idea that the majority of FAD molecules arein a 'closed' conformation in which the adenine and flavin rings are stacked, and that asmall percentage of FAD molecules can remain in the �open� conformation fornanoseconds of time.
Acknowledgement
We thank B. Hess for adjustments of the software package, Dr. D. van der Spoel for assistance inearly MD pilot experiments, A. van Hoek for help with the fluorescence experiments, and Dr.W.J.H. van Berkel for valuable discussions and suggestions.
Figure 6.6: Hypothetical fluorescence decay curve calculated from the moleculardynamics simulations under the assumptions that (1) the limited number of FADstarting structures in the extended conformation adequately represents theconformational ensemble of 'open' FAD molecules in solution; (2) the dynamics ofthe molecule are not significantly influenced by light excitation; and (3) any stackedconformation will instantaneously quench. Both ground- and excited-state traceswere included to obtain better statistics because no significant difference between theground- an excited-state dynamics was detected (see also free-energy calculations,assumption 2). The intrinsic fluorescence decay of the flavin was taken into accountby multiplying the simulated curve with the fluorescence decay curve correspondingto the fluorescence lifetime of nonquenched flavin in water, such as in FMN (τ = 4.7ns). From curve-fitting with a monoexponential decay model, a theoreticalfluorescence lifetime of 1.7 ns was obtained.
01 23 45 67 8
theoreticalfit (τ = 1.7 ns)
fluor
esce
nce
inte
nsity
(arb
. uni
ts)
time (ns)0 1 2 3 4 5 6 7 8

Appendix 6-I:
Force field parameters of FAD
152152
Atoms# Type2 Name1 Cgnr3 Charge Mass
Moiety1 (e) (u)1 CB C9a 1 0.14 12.0112 NR6* N10 2 -0.05 14.00673 CB C10 3 0.27 12.0114 NR6 N1 4 -0.43 14.00675 CB C2 5 0.51 12.0116 O O2 6 -0.45 15.99947 NR6* N3 7 -0.35 14.00678 H H3 8 0.35 1.0089 CB C4 9 0.43 12.011
10 O O4 10 -0.43 15.999411 CB C4a 11 0.06 12.01112 NR6 N5 12 -0.19 14.006713 CB C5a 13 0.06 12.01114 CR6 C6 14 -0.12 12.01115 HCR H6 15 0.19 1.00816 CB C7 16 0 12.01117 CH3 C7M 17 0 15.03518 CB C8 18 0 12.01119 CH3 C8M 19 0 15.03520 CR6 C9 20 -0.18 12.011
Flav
in
21 HCR H9 21 0.19 1.00822 CH2 C1* 22 0 14.02723 CH1 C2* 23 0.15 13.01924 OA O2* 23 -0.548 15.999425 HO H2* 23 0.398 1.00826 CH1 C3* 24 0.15 13.01927 OA O3* 24 -0.548 15.999428 HO H3* 24 0.398 1.00829 CH1 C4* 25 0.15 13.01930 OA O4* 25 -0.548 15.999431 HO H4* 25 0.398 1.00832 CH2 C5* 26 0.13 14.027
Rib
ityl
33 OS O5* 27 -0.52 15.9994(continued . . .)
1 names and labels correspond to Figure 6.12 gromacs atom type label3 charge group number

Force field parameters of FAD
153
Atoms (. . . continued)# Type2 Name1 Cgnr3 Charge Mass
moiety1 (e) (u)34 P P 28 1.85 30.973835 OS OP3 29 -0.92 15.999436 OM OP1 30 -1 15.999437 OM OP2 31 -1 15.999438 P AP 32 1.85 30.973839 OM AOP1 33 -1 15.9994Ph
osph
o-di
este
r40 OM AOp2 34 -1 15.999441 OS AO5* 35 -0.52 15.999442 CS2 AC5* 36 0.13 14.02743 CS1 AC4* 37 0.16 13.01944 OS AO4* 37 -0.36 15.9994R
ibos
e
45 CS1 AC1* 37 0.2 13.01946 NR5* AN9 38 -0.2 14.006747 CB AC4 38 0.2 12.01148 NR6 AN3 39 -0.36 14.006749 CR6 AC2 39 0.22 12.01150 HCR HC2 39 0.14 1.00851 NR6 AN1 40 -0.36 14.006752 CB AC6 40 0.36 12.01153 NT AN6 41 -0.83 14.006754 H HN61 41 0.415 1.00855 H HN62 41 0.415 1.00856 CB AC5 42 0 12.01157 NR5 AN7 43 -0.36 14.006758 CR5 AC8 43 0.22 12.011
Ade
nine
59 HCR HC8 43 0.14 1.00860 CS1 AC2* 44 0.15 13.01961 OA AO2* 44 -0.548 15.999462 HO HO2* 44 0.398 1.00863 CS1 AC3* 45 0.15 13.01964 OA AO3* 45 -0.548 15.9994
Rib
ose
65 HO HO3* 45 0.398 1.008
Bondsr0 fc r0 fc
ai aj (nm) (kJ mol-1nm-1) ai aj (nm) (kJ mol-1nm-1)C9a N10 0.14 334720 C9a C5a 0.139 418400C9a C9 0.139 418400 N10 C10 0.14 334720N10 C1* 0.134 418400 C10 N1 0.134 418400C10 C4a 0.139 418400 N1 C2 0.134 418400C2 O2 0.123 502080 C2 N3 0.14 334720N3 H3 0.1 374468 N3 C4 0.14 334720C4 O4 0.123 502080 C4 C4a 0.139 418400C4a N5 0.134 418400 N5 C5a 0.134 418400C5a C6 0.139 418400 C6 H6 0.108 292880C6 C7 0.139 418400 C7 C7M 0.153 334720C7 C8 0.139 418400 C8 C8M 0.153 334720C8 C9 0.139 418400 C9 H9 0.108 292880C1* C2* 0.153 334720 C2* O2* 0.143 334720C2* C3* 0.153 334720 O2* H2* 0.1 313800C3* O3* 0.143 334720 C3* C4* 0.153 334720O3* H3* 0.1 313800 C4* O4* 0.143 334720
(continued . . .)

Appendix 6-I
154
Bonds (. . . continued)r0 fc r0 fc
ai aj (nm) (kJ mol-1nm-1) ai aj (nm) (kJ mol-1nm-1)C4* C5* 0.153 334720 O4* H4* 0.1 313800C5* O5* 0.143 251040 O5* P 0.161 251040P OP3 0.161 251040 P OP1 0.148 376560P OP2 0.148 376560 OP3
AP 0.161 251040AP AOP1 0.148 376560 AP AOP2 0.148 376560AP AO5* 0.161 251040 AO5*
AC5* 0.1435 251040AC5*
AC4* 0.152 251040 AC4*AO4* 0.1435 251040
AC4*AC3* 0.152 251040 AO4*
AC1* 0.1435 251040AC1*
AN9 0.148 251040 AC1*AC2* 0.152 251040
AN9AC4 0.133 418400 AN9
AC8 0.133 418400AC4
AN3 0.134 418400 AC4AC5 0.139 418400
AN3AC2 0.132 418400 AC2 HC2 0.108 292880
AC2AN1 0.132 418400 AN1
AC6 0.134 418400AC6
AN6 0.133 376560 AC6AC5 0.139 418400
AN6 HN61 0.1 374468 AN6 HN62 0.1 374468AC5
AN7 0.133 418400 AN7AC8 0.133 418400
AC8 HC8 0.108 292880 AC2*AO2* 0.143 251040
AC2*AC3* 0.152 251040 AO2* HO2* 0.1 313800
AC3*AO3* 0.143 251040 AO3* HO3* 0.1 313800
1-4 Lennard-Jonesc6 c12 c6 c12
ai aj (kJ mol-1 nm6) (kJ mol-1nm12) ai aj (kJ mol-1nm6) (kJ mol-1nm12)C9a N1 0.0023877 2.3896 ·10-6 C9a C4a 0.0023402 3.374 ·10-6
C9a H6 0.00044528 .22581 ·10-6 C9a C7 0.0023402 3.374 ·10-6
C9a C8M 0.0040046 6.3798 ·10-6 C9a C2* 0.0026103 3.5506 ·10-6
N10 C2 0.0023877 2.3896 ·10-6 N10 C4 0.0023877 2.3896 ·10-6
N10 N5 0.0024362 1.6924 ·10-6 N10 C6 0.0036699 3.7547 ·10-6
N10 C8 0.0023877 2.3896 ·10-6 N10 H9 0.00045432 .15993 ·10-6
N10 O2* 0.0023473 1.1203 ·10-6 N10 C3* 0.0026633 2.5147 ·10-6
C10 O2 0.0023006 1.5818 ·10-6 C10 N3 0.0023877 2.3896 ·10-6
C10 O4 0.0023006 1.5818 ·10-6 C10 C5a 0.0023402 3.374 ·10-6
C10 C9 0.0035969 5.3015 ·10-6 C10 C2* 0.0026103 3.5506 ·10-6
N1 H3 0 0 N1 C4 0.0023877 2.3896 ·10-6
N1 N5 0.0024362 1.6924 ·10-6 N1 C1* 0.0033923 3.47 ·10-6
C2 O4 0.0023006 1.5818 ·10-6 C2 C4a 0.0023402 3.374 ·10-6
O2 H3 0 0 O2 C4 0.0023006 1.5818 ·10-6
N3 N5 0.0024362 1.6924 ·10-6 H3 O4 0 0H3 C4a 0 0 C4 C5a 0.0023402 3.374 ·10-6
O4 N5 0.0023473 1.1203 ·10-6 C4a C6 0.0035969 5.3015 ·10-6
C4a C1* 0.0033248 4.8994 ·10-6 N5 H6 0.00045432 .15993 ·10-6
N5 C7 0.0023877 2.3896 ·10-6 N5 C9 0.0036699 3.7547 ·10-6
C5a C7M 0.0040046 6.3798 ·10-6 C5a C8 0.0023402 3.374 ·10-6
C5a H9 0.00044528 .22581 ·10-6 C5a C1* 0.0033248 4.8994 ·10-6
C6 C8M 0.006155 10.024 ·10-6 C6 C9 0.0055284 8.33 ·10-6
H6 C7M 0.00076197 .42698 ·10-6 H6 C8 0.00044528 .22581 ·10-6
C7 H9 0.00044528 .22581 ·10-6 C7M C8M 0.0068526 12.063 ·10-6
(continued . . .)

Force field parameters of FAD
155
1-4 Lennard-Jones (. . . continued)c6 c12 c6 c12
ai aj (kJ mol-1nm6) (kJ mol-1 nm12) ai aj (kJ mol-1nm6) (kJ mol-1 nm12)C7M C9 0.006155 10.024 ·10-6 C8M H9 0.00076197 .42698 ·10-6
C9 C1* 0.0051102 7.6983 ·10-6 C1* H2* 0 0C1* O3* 0.0032685 2.2969 ·10-6 C1* C4* 0.0037086 5.1559 ·10-6
C2* H3* 0 0 C2* O4* 0.0025662 1.6646 ·10-6
C2* C5* 0.0037086 5.1559 ·10-6 O2* O3* 0.0022617 .74158 ·10-6
O2* C4* 0.0025662 1.6646 ·10-6 H2* C3* 0 0C3* H4* 0 0 C3* O5* 0.0025662 1.6646 ·10-6
O3* O4* 0.0022617 .74158 ·10-6 O3* C5* 0.0032685 2.2969 ·10-6
H3* C4* 0 0 C4* P 0.0065507 9.1058 ·10-6
O4* O5* 0.0022617 .74158 ·10-6 H4* C5* 0 0C5* OP3 0.0032685 2.2969 ·10-6 C5* OP1 0.0032685 2.2969 ·10-6
C5* OP2 0.0032685 2.2969 ·10-6 O5*AP 0.0057734 4.0567 ·10-6
P AOP1 0.0057734 4.0567 ·10-6 P AOP2 0.0057734 4.0567 ·10-6
P AO5* 0.0057734 4.0567 ·10-6 OP3AC5* 0.0032685 2.2969 ·10-6
OP1AP 0.0057734 4.0567 ·10-6 OP2
AP 0.0057734 4.0567 ·10-6
AP AC4* 0.0065507 9.1058 ·10-6 AOP1AC5* 0.0032685 2.2969 ·10-6
AOP2AC5* 0.0032685 2.2969 ·10-6 AO5*
AO4* 0.0022617 .74158 ·10-6
AO5*AC3* 0.0025662 1.6646 ·10-6 AC5*
AC1* 0.0037086 5.1559 ·10-6
AC5*AC2* 0.0037086 5.1559 ·10-6 AC5*
AO3* 0.0032685 2.2969 ·10-6
AC4*AN9 0.0026633 2.5147 ·10-6 AC4*
AO2* 0.0025662 1.6646 ·10-6
AC4* HO3* 0 0 AO4*AC4 0.0023006 1.5818 ·10-6
AO4*AC8 0.0035361 2.4854 ·10-6 AO4*
AO2* 0.0022617 .74158 ·10-6
AO4*AO3* 0.0022617 .74158 ·10-6 AC1*
AN3 0.0026633 2.5147 ·10-6
AC1*AC5 0.0026103 3.5506 ·10-6 AC1*
AN7 0.0026633 2.5147 ·10-6
AC1* HC8 0.00049668 .23763 ·10-6 AC1* HO2* 0 0AC1*
AO3* 0.0025662 1.6646 ·10-6 AN9AC2 0.0036699 3.7547 ·10-6
AN9AC6 0.0023877 2.3896 ·10-6 AN9
AO2* 0.0023473 1.1203 ·10-6
AN9AC3* 0.0026633 2.5147 ·10-6 AC4 HC2 0.00044528 .22581 ·10-6
AC4AN1 0.0023877 2.3896 ·10-6 AC4
AN6 0.0023877 2.3896 ·10-6
AC4 HC8 0.00044528 .22581 ·10-6 AC4AC2* 0.0026103 3.5506 ·10-6
AN3AC6 0.0023877 2.3896 ·10-6 AN3
AN7 0.0024362 1.6924 ·10-6
AN3AC8 0.0036699 3.7547 ·10-6 AC2
AN6 0.0036699 3.7547 ·10-6
AC2AC5 0.0035969 5.3015 ·10-6 HC2
AC6 0.00044528 .22581 ·10-6
AN1 HN61 0 0 AN1 HN62 0 0AN1
AN7 0.0024362 1.6924 ·10-6 AC6AC8 0.0035969 5.3015 ·10-6
AN6AN7 0.0024362 1.6924 ·10-6 HN61
AC5 0 0HN62
AC5 0 0 AC5 HC8 0.00044528 .22581 ·10-6
AC8AC2* 0.0040121 5.5789 ·10-6 AC2* HO3* 0 0
AO2*AO3* 0.0022617 .74158 ·10-6 HO2*
AC3* 0 0
Angles
θ0 fc θ0 fc
ai aj ak (degr) (kJ mol-1rad-2) ai aj ak (degr) (kJ mol-1rad-2)N10 C9a C5a 120 418.4 N10 C9a C9 120 418.4C5a C9a Ca 120 418.4 C9a N10 C10 120 418.4C9a N10 C1* 120 418.4 C10 N10 C1* 120 418.4
(continued . . .)

Appendix 6-I
156
Angles (. . . continued)θ0 fc θ0 fc
ai aj ak (degr) (kJ mol-1rad-2) ai aj ak (degr) (kJ mol-1rad-2)N10 C10 N1 120 418.4 N10 C10 C4a 120 418.4N1 C10 C4a 120 418.4 C10 N1 C2 120 418.4N1 C2 O2 120 418.4 N1 C2 N3 120 418.4O2 C2 N3 120 418.4 C2 N3 H3 120 376.56C2 N3 C4 120 418.4 H3 N3 C4 120 376.56N3 C4 O4 120 418.4 N3 C4 C4a 120 418.4O4 C4 C4a 120 418.4 C10 C4a C4 120 418.4C10 C4a N5 120 418.4 C4 C4a N5 120 418.4C4a N5 C5a 120 418.4 C9a C5a N5 120 418.4C9a C5a C6 120 418.4 N5 C5a C6 120 418.4C5a C6 H6 120 376.56 C5a C6 C7 120 418.4H6 C6 C7 120 376.56 C6 C7 C7M 120 418.4C6 C7 C8 120 418.4 C7M C7 C8 120 418.4C7 C8 C8M 120 418.4 C7 C8 C9 120 418.4
C8M C8 C9 120 418.4 C9a C9 C8 120 418.4C9a C9 H9 120 376.56 C8 C9 H9 120 376.56N10 C1* C2* 111 460.24 C1* C2* O2* 109.5 460.24C1* C2* C3* 111 460.24 O2* C2* C3* 109.5 460.24C2* O2* H2* 109.5 397.48 C2* C3* O3* 109.5 460.24C2* C3* C4* 111 460.24 O3* C3* C4* 109.5 460.24C3* O3* H3* 109.5 397.48 C3* C4* O4* 109.5 460.24C3* C4* C5* 111 460.24 O4* C4* C5* 109.5 460.24C4* O4* H4* 109.5 397.48 C4* C5* O5* 111 460.24C5* O5* P 120 397.48 O5* P OP3 103 397.48O5* P OP1 109.6 397.48 O5* P OP2 109.6 397.48OP3 P OP1 109.6 397.48 OP3 P OP2 109.6 397.48OP1 P OP2 120 585.76 P OP3
AP 120 397.48OP3
AP AOP1 109.6 397.48 OP3AP AOP2 109.6 397.48
OP3AP AO5* 103 397.48 AOP1
AP AOP2 120 585.76AOP1
AP AO5* 109.6 397.48 AOP2AP AO5* 109.6 397.48
AP AO5*AC5* 120 397.48 AO5*
AC5*AC4* 109.5 284.512
AC5*AC4*
AO4* 109.5 284.512 AC5*AC4*
AC3* 109.5 251.04AO4*
AC4*AC3* 109.5 284.512 AC4*
AO4*AC1* 109.5 334.72
AO4*AC1*
AN9 109.5 284.512 AO4*AC1*
AC2* 109.5 284.512AN9
AC1*AC2* 109.5 284.512 AC1*
AN9AC4 126 418.4
AC1*AN9
AC8 126 418.4 AC4AN9
AC8 108 418.4AN9
AC4AN3 132 418.4 AN9
AC4AC5 108 418.4
AN3AC4
AC5 120 418.4 AC4AN3
AC2 120 418.4AN3
AC2 HC2 120 376.56 AN3AC2
AN1 120 418.4HC2
AC2AN1 120 376.56 AC2
AN1AC6 120 418.4
AN1AC6
AN6 120 418.4 AN1AC6
AC5 120 418.4AN6
AC6AC5 120 418.4 AC6
AN6 HN61 120 292.88AC6
AN6 HN62 120 292.88 HN61AN6 HN62 120 334.72
AC4AC5
AC6 120 418.4 AC4AC5
AN7 108 418.4AC6
AC5AN7 108 418.4 AC5
AN7AC8 108 418.4
AN9AC8
AN7 108 418.4 AN9AC8 HC8 120 376.56
AN7AC8 HC8 120 376.56 AC1*
AC2*AO2* 109.5 284.512
AC1*AC2*
AC3* 109.5 251.04 AO2*AC2*
AC3* 109.5 284.512AC2*
AO2* HO2* 109.5 397.48 AC4*AC3*
AC2* 109.5 251.04AC4*
AC3*AO3* 109.5 284.512 AC2*
AC3*AO3* 109.5 284.512
AC3*AO3* HO3* 109.5 397.48

Force field parameters of FAD
157
Proper Dihedrals
θmax4 fc mult5
ai aj ak al (degr) (kJ mol-1) (#)C9a N10 C1* C1* 0 0.418 6N10 C1* C2* C2* 0 5.858 3C1* C2* O2* O2* 0 1.255 3C1* C2* C3* C3* 0 5.858 3C2* C3* O3* O3* 0 1.255 3C2* C3* C4* C4* 0 5.858 3C3* C4* O4* O4* 0 1.255 3C3* C4* C5* C5* 0 5.858 3C4* C5* O5* O5* 0 3.766 3C5* O5* P P 0 3.138 2O5* P OP3 OP3 0 3.138 2P OP3
AP AP 0 3.138 2OP3
AP AO5*AO5* 0 3.138 2
AP AO5*AC5*
AC5* 0 3.766 3AO5*
AC5*AC4*
AC4* 0 2.092 2AC5*
AC4*AO4*
AO4* 0 3.766 3AC5*
AC4*AC3*
AC3* 0 2.092 2AC4*
AO4*AC1*
AC1* 0 3.766 3AO4*
AC1*AN9
AN9 0 0 2AO4*
AC1*AC2*
AC2* 0 2.092 2AN1
AC6AN6
AN6 180 33.472 2AC1*
AC2*AO2*
AO2* 0 1.255 3AC1*
AC2*AC3*
AC3* 0 2.092 2AC4*
AC3*AO3*
AO3* 0 1.255 3
Improper Dihedrals
θ06 fc θ0
6 fcai aj ak al (degr) (kJ mol-1rad-2) ai aj ak al (degr) (kJ mol-1rad-2)
C9a N10 C10 C10 0 167.36 C9a N10 C9 C9 0 167.36C9a C5a C6 C6 0 167.36 N10 C9a C5a C5a 0 167.36N10 C10 C4a C4a 0 167.36 N10 C10 C9a C9a 0 167.36C10 N1 C2 C2 0 167.36 C10 N1 N10 N10 0 167.36C10 C4a N5 N5 0 167.36 N1 C10 C4a C4a 0 167.36N1 C2 N3 N3 0 167.36 C2 N1 N3 N3 0 167.36C2 N3 C4 C4 0 167.36 N3 C4 C4a C4a 0 167.36N3 C2 C4 C4 0 167.36 C4 C4a C10 C10 0 167.36C4 N3 C4a C4a 0 167.36 C4a N5 C5a C5a 0 167.36C4A C4 N5 N5 0 167.36 C4a C10 N1 N1 0 167.36N5 C5a C9a C9a 0 167.36 C5a N5 C6 C6 0 167.36C5a C9a N10 N10 0 167.36 C5a C9a C9 C9 0 167.36C5A C6 C7 C7 0 167.36 C6 C5a C7 C7 0 167.36C6 C7 C8 C8 0 167.36 C7 C8 C9 C9 0 167.36C7 C6 C8 C8 0 167.36 C8 C9 C9a C9a 0 167.36C8 C7 C9 C9 0 167.36 C9 C9a C5a C5a 0 167.36C9 C9a H9 H9 0 167.36 C2* O2* C3* C3* 35.264 334.72C3* O3* C4* C4* 35.264 334.72 C4* O4* C5* C5* 35.264 334.72
AC4*AO4*
AC5*AC5* 35.264 334.72 AC1*
AN9AO4*
AO4* 35.264 334.72AN9
AC8AC4
AC4 0 167.36 AN9AC8
AN7AN7 0 167.36
(continued . . .)

Appendix 6-I
158
Improper Dihedrals (. . .continued)
ai aj ak al θ06 fc ai aj ak al θ0
6 fc(degr) (kJ mol-1rad-2) (degr) (kJ mol-1rad-2)
AN9AC4
AC5AC5 0 167.36 AC4
AN3AC2
AC2 0 167.36AC4
AC5AC6
AC6 0 167.36 AC4AN9
AN3AN3 0 167.36
AC4AN9
AC8AC8 0 167.36 AC4
AC5AN7
AN7 0 167.36AN3
AC4AC5
AC5 0 167.36 AN3AC2
AN1AN1 0 167.36
AC2AN1 HC2 HC2 0 167.36 AC2
AN1AC6
AC6 0 167.36AN1
AC6AC5
AC5 0 167.36 AC6AC5
AN1AN1 0 167.36
AN6 HN61 HN62 HN62 0 167.36 AC5AN7
AC8AC8 0 167.36
AC5AC6
AN7AN7 0 167.36 AC5
AC4AN3
AN3 0 167.36AC5
AC6AN1
AN1 0 167.36 AC8AN7
AC5AC5 0 167.36
AC8AN9
AC4AC4 0 167.36 AC8
AN9 HC8 HC8 0 167.36AC2*
AO2*AC3*
AC3* 35.264 334.72 AC3*AC2*
AO3*AO3* 35.264 334.72
4θ is the angle between the planes i-j-k and j-k-l; θ = 0 corresponds to the cis conformation with ai and al onthe same side
5 Potential multiplicity6 θ is the angle between the planes i-j-k and j-k-l

7 Fluorescence correlation spectroscopy of flavinsand flavoenzymes: photochemical andphotophysical aspects
This Chapter has been published as:van den Berg, P.A.W., J. Widengren, M.A. Hink, R. Rigler, and A.J.W.G. Visser. 2001.
Spectrochim. Acta A 57, 2135-2144.
Fluorescence correlation spectroscopy (FCS) was used to investigate the excited-state properties of flavins and flavoproteins in solution at the single-molecule level. Flavinmononucleotide (FMN), flavin adenine dinucleotide (FAD) and lipoamide dehydrogenase(LipDH) served as model systems in which the flavin cofactor is either free in solution(FMN, FAD) or enclosed in a protein environment as prosthetic group (LipDH).Parameters such as excitation light intensity, detection time and chromophoreconcentration were varied in order to optimize the autocorrelation traces. Only inexperiments with very low light intensity (<10 kW/cm2), FMN and FAD displayedfluorescence properties equivalent to those found with conventional fluorescence detectionmethods. Due to the high triplet quantum yield of FMN, the system very soon starts tobuild up a population of nonfluorescent molecules, which is reflected in an apparentparticle number far too low for the concentration used. Intramolecular photoreduction andsubsequent photobleaching may well explain these observations. The effect ofphotoreduction was clearly shown by titration of FMN with ascorbic acid. Whereastitration of FMN with the quenching agent potassium iodide at higher concentrations (>50mM I-) resulted in quenched flavin fluorescence as expected, low concentrations ofpotassium iodide led to a net enhancement of the de-excitation rate from the triplet state,thereby improving the fluorescence signal. FCS experiments on FAD exhibited animproved photostability of FAD as compared to FMN: as a result of stacking of theadenine and flavin moieties, FAD has a considerably lower triplet quantum yield.Correlation curves of LipDH yielded correct values for the diffusion time and number ofmolecules at low excitation intensities. However, experiments at higher light intensitiesrevealed a process which can be explained by photophysical relaxation or photochemicaldestruction of the enzyme. As the time constant of the process induced at higher lightintensities resembles the diffusion time constant of free flavin, photodestruction with theconcomitant release of the cofactor offers a reasonable explanation.

Chapter 7
160
7.1 Introduction
Flavoenzymes offer the unique possibility of probing the dynamic behaviour of theactive site via their naturally fluorescent flavin cofactor. Flavoenzymes are involved innumerous redox processes in metabolic oxidation-reduction or (photo)biological electrontransport (for an overview, see Müller, 1991). Both from biochemical and biophysicalviewpoints, the essential part of the flavin cofactor is the isoalloxazine ring. The cofactoris able to act as a redox-mediator through this three-membered ring system, which canexist in oxidized flavoquinone, one-electron reduced flavo-semiquinone, and two-electronreduced flavo-1,5-dihydroquinone states. The redox properties of the flavin are subtlymodulated by the protein environment, which makes it a very versatile molecule involvedin a wide range of enzymatic reactions. Flavins and flavoproteins exhibit fluorescence inthe green spectral region allowing highly selective excitation and detection. Contrary tothe oxidized state, the flavin in the reduced state is hardly fluorescent. Consequently,fluorescence studies are normally restricted to oxidized flavins and flavoenzymes. Inaqueous solution, riboflavin and FMN possess a rather high fluorescence quantum yield(Q = 0.26 (Weber, 1950)). FAD however, is much less fluorescent (Q = 0.03 (Weber,1950)) because of the formation of an intramolecular complex between the flavin andadenine moieties. This reduction in quantum yield was shown to result from both staticand dynamic quenching of the flavin fluorescence (Spencer & Weber, 1972; Visser,1984). In general, the flavin cofactor is bound to the protein in an extended conformation.The intramolecular quenching of the FAD molecule in flavoproteins is therefore removedimplying that the fluorescent features of flavoenzymes are controlled by the proteinenvironment in the very same way as those of bound FMN. The most fluorescentflavoprotein is undoubtedly the yellow fluorescent protein from bioluminescent bacteriawith the exceptionally high fluorescence quantum yield of ~0.6 (Visser et al., 1997). Wehave advantageously used this protein and related proteins in FCS studies of naturallyfluorescent markers (Visser et al., 2001). However, contrary to flavoenzymes whoseprimary function is redox catalysis, this flavoprotein was specially designed with thepurpose of emitting light. It is therefore not surprising that the fluorescence quantum yieldof regular flavoenzymes is considerably lower. With a quantum yield of ~0.1, lipoamidedehydrogenase and thioredoxin reductase belong to the most fluorescent flavoenzymesknown thus far. In many flavoproteins, however, the flavin fluorescence is so heavilyquenched (Q << 0.01) that they were traditionally regarded as 'nonfluorescent'. However,recent studies in which modern fluorescence methodologies with an ultrahigh timeresolution were applied, have shown that the idea of 'nonfluorescent flavoproteins' shouldbe abandoned (van den Berg et al., 1998, 2001; Visser et al., 1998).

Fluorescence correlation spectroscopy of flavins and flavoenzymes:…
161
The primary goal of this investigation was to study the structural dynamics ofsingle lipoamide dehydrogenase molecules using fluorescence correlation spectroscopy(FCS). Lipoamide dehydrogenase (LipDH) was initially chosen because of its relativelyhigh fluorescent yield, extensively studied kinetic and fluorescent properties and theavailability of a three-dimensional structure. FCS is probably the most famous single-molecule-fluorescence-detection technique for molecules freely diffusing in solution.While the theoretical concepts of FCS date back to the 1970s (Magde et al., 1972, 1974;Elson & Magde, 1974; Ehrenberg & Rigler, 1974), experimental methods became onlyfeasible in the last decade by progress in the field of opto-electronics. In FCS, thefluctuations in fluorescence intensity of single fluorophores in time are analyzed via theautocorrelation function (Rigler et al., 1993; Eigen & Rigler, 1994; Maiti et al., 1997). Thetechnique is particularly suitable for retrieving information on diffusion properties andconcentrations. In addition, FCS experiments can provide insight into molecularinteractions and photochemical events.
Initially, we have carried out FCS experiments on the free flavin cofactors FMNand FAD, as these would serve as a basis to understand the FCS results of LipDH.However, the results of these experiments did not agree with the known spectroscopicproperties of FMN and FAD. In order to clarify the fluorescence properties of free andenzyme-bound flavins upon confocal illumination using fluorescence correlationdetection, we report here on a systematic FCS investigation of FMN, FAD and LipDH. Inthe case of the free cofactor, addition of molecules such as potassium iodide (fluorescencequencher) and ascorbic acid (reducing agent) led to changes in FCS patterns which couldbe related tot the photophysical and photochemical properties of the flavin cofactor at thesingle-molecule level. Some complementary FCS results on FMN, FAD and riboflavin,free and bound to bioluminescent antenna proteins have been presented elsewhere (Visseret al., 2001).
7.2 Materials and Methods
Flavin and enzyme preparations
Azotobacter vinelandii LipDH was expressed in Escherichia coli TG2 and purifiedaccording to the method described earlier by Westphal and de Kok (Westphal & de Kok,1988). The enzyme was stored at –80 °C in 100 mM potassium phosphate buffercontaining 0.5 mM EDTA at pH 7.0. Before use, possible traces of free FAD wereremoved on a Biogel PGD-6 column (Biorad) equilibrated with 50 mM phosphate bufferpH 7.0. FMN and FAD were purchased from Sigma and were of the highest quality

Chapter 7
162
available. FAD preparations were put over a Biogel P2 column (Biorad) to remove minortraces of more fluorescent degradation products. Gelfiltration chromatography had noeffect on the properties of FMN in FCS. The concentrations were based on the followingextinction coefficients: LipDH: ε457 = 11.3 mM-1cm-1 (Westphal & de Kok, 1988); FAD:ε450 = 11.3 mM-1cm-1 (Whitby, 1953); FMN: ε450 = 12.5 mM-1cm-1 (Whitby, 1953). Allother chemicals were of the highest quality available.
Fluorescence correlation spectroscopy
The FCS setup was basically as described in detail elsewhere (Widengren &Rigler, 1998, and references cited therein) For excitation of the flavin molecules argon ionlaser lines of 488 and 458 nm (Spectra Physics Model 165 and Coherent Innova 200,respectively) were used. The light intensity was adjusted by using various neutral densityfilters. The laser beam was focussed by a lens in front of an epi-illuminated microscope,reflected by a dichroic mirror (Leitz TK580) and refocussed on the image plane of a waterimmersion objective (Zeiss Plan-Neofluar 63x NA 1.2). The laser beam waist in the focalplane ω1 was 0.26 µm ± 10%. The excitation intensity was measured by a siliconphotodiode. Fluorescence was detected via the same objective using a cross-correlationsetup of two avalanche photodiodes (EG&G Model SPCM-100). In detection, a 50-µmpinhole and a bandpass filter (Omega Optics 535DF45) was used. The fluorescenceintensity fluctuations were analysed in terms of a cross-correlation function over a timescale from 10 ns to 100 s by a PC-based correlator (ALV model 5000E). A detaileddescription of the theoretical background and the evaluation of the correlation functionsare given elsewhere (Widengren & Rigler, 1998). Briefly, the autocorrelation traces havebeen analyzed according to the following model:
+
+
+−+= ∑
−
ii
i
i
Tttriptrip
Tat
Tt
FN
eFFtG
trip
2
/
11'
)1(1)( (1)
in which the apparent number of molecules N'= N(1-Ftrip) with N the average number offluorescent molecules in the detection volume; Ftrip and Ttrip are, respectively, thefractional population and decay time of the triplet state (these parameters are, in firstapproximation, assumed equal for all components); Fi and Ti are, respectively, thecontribution and translational diffusion time of the i-th fluorescent component, with Ti =ω1
2/4Di, and a = ω2/ω1 is the ‘structural’ parameter of the instrumental setup (ω2 is thebeam waste in the axial plane). Except for FCS experiments on LipDH at high laser

Fluorescence correlation spectroscopy of flavins and flavoenzymes:…
163
intensities, a two-component analysis was performed. In all other cases we have assumedone diffusing component in which F1 = 1. When the triplet contribution is negligible,equation 1 is reduced to an equation describing diffusion only. The autocorrelation resultsobtained with FMN in the presence of ascorbic acid have been analysed using softwaresummarized recently (Digris et al., 2000).
The sample was mounted under the objective via a coverslip. For measurementsnot exceeding 5 min., a 50 or 100 µl hanging droplet of the sample was used. For longermeasurements a vessel containing 10 ml of sample was placed under the coverslip. Foranaerobic experiments an airtight vessel of 5 ml was used, in which the samples weredeaerated by flushing with argon for at least 30 min. In all series of experiments, thealignment and focussing of the setup was frequently checked by measuring the correlationfunction of 0.2 nM rhodamine green (Molecular Probes Inc., Leiden, The Netherlands) in20 mM sodium carbonate buffer pH 9.0.
7.3 Results and Discussion
General appearance of fluorescence correlation curves of FMN, FAD and LipDH
From initial FCS experiments on FMN, FAD and LipDH, it appeared that incontrast with the data of the flavoenzyme, the amplitude of the correlation curves of thefree flavins did not match with the concentrations applied. For FMN, the amplitude, whichis inversely related to the number of fluorophores in the confocal volume element throughN' = N(1-Ftrip), revealed only ~1/6 of the number of FMN molecules present. Thefluorescence count rate per molecule of FMN, which -rather than the total count rate-determines the signal to noise ratio in FCS experiments, was much lower than expectedfrom the excitation cross section and quantum yield. In addition, the count rate permolecule of FMN and FAD under similar experimental conditions differed only by afactor of two, whereas the fluorescence quantum yield difference is known to be aboutnine. Control experiments performed with highly fluorescent rhodamine green nicelyyielded correct concentrations. Typical examples of correlation traces of FMN and FAD inaqueous buffer solution (pH 7.0) are shown in Figure 7.1 (the experimental results havebeen analyzed using equation 1).
Possible explanations for the deviations found for the free flavins can be found inphotochemical reactions as well as in photophysical processes. Photoreduction of theflavin is a likely photochemical reaction which leads to a loss of fluorescence as thequantum yield of reduced flavin is very low, and reduced flavin does not absorb light atblue-light excitation (458 or 488 nm). Because of a continuous replacement of molecules

Chapter 7
164
in the confocal volume by Brownian motion, an equilibrium between photoreduction anddiffusion is established in which the volume element contains a fraction of non-fluorescentmolecules. Other reasons to detect too few molecules have a photophysical nature. Atransient dark state with a lifetime of the order of the diffusion time would render themolecule invisible. Based on the photophysical features of the molecule, the existence ofsuch dark state for FMN is highly unlikely. However, a photophysical characteristic ofFMN that does contribute to the observed effect is the exceptionally high triplet quantum
Obs
erve
d &
Cal
cula
ted
Res
idua
lsO
bser
ved
& C
alcu
late
dR
esid
uals
LOG (time [ms])
LOG (time [ms])
C D
A B
Figure 7.1: Panels showing experimental and fitted fluorescence autocorrelationtraces obtained under different conditions. All concentrations were 500 nM.A: FMN under anaerobic conditions excited with the 458 nm argon laser line at 190kW/cm2. The experimental data were analyzed using the model described by Eqn. 1resulting in the following parameters: T1 = 64 µs, Ttrip = 20 µs, Ftrip = 0.43 ± 0.08 andthe number of molecules N = 75. Note the long triplet lifetime owing to anaerobicconditions; aerobic experiments with similar high excitation intensities resulted invalues of Ttrip = 1-4 µs and Ftrip = 0.12 ± 0.05. B: FMN excited with the 488 nmargon laser line at 20 kW/cm2 (low excitation intensity) under aerobic conditions.Data were analyzed using diffusion only leading to T1 = 46 µs and N = 285. C: FADexcited with the 488 nm argon laser line at 20 kW/cm2 under aerobic conditions.Data were analyzed using diffusion only leading to T1 = 48 µs and N = 270.D: LipDH excited with the 488 nm argon laser line at 20 kW/cm2 under aerobicconditions. Data were analyzed using diffusion only leading to T1 = 379 µs andN = 59.
Fluorescence correlation spectroscopy of flavins and flavoenzymes:…
165
yield of ~0.6 (Heelis, 1991). The large build-up of molecules in the triplet state is nicelydemonstrated in anaerobic measurements of FMN (Fig. 7.1A). Under aerobic conditions,fast cross-correlation curves of FMN at high light intensities revealed a relaxation time of1-4 µs with a smaller amplitude (~0.12 ± 0.05) that likely corresponds to the lifetime ofthe FMN triplet state in the presence of oxygen (see also data presented elsewhere; Visseret al., 2001). The significant mismatch in the amplitude -only ~15% of the inputconcentration is determined- indicates the presence of an undetected, irreversible process.Once the flavin molecule is in the long-lived triplet state, an irreversible process such asphotobleaching or photodestruction can take place making these molecules permanentlyinvisible.
In order to solve the enigma of missing molecules, we decided to furtherinvestigate the photophysical and photochemical behaviour of flavins with FCS.Therefore, we have measured both the initial fluorescence intensities and cross-correlationcurves of FMN, FAD and LipDH as a function of excitation light intensity. Only atrelatively low light intensity, the amplitude of the correlation curves roughly correspondsto the input concentration of the flavins (see Fig. 7.1B-D). Especially for FMN and FAD,the correlation traces at early time became so noisy that no fast relaxation time arisingfrom the triplet state could be observed. The longer diffusion time (380 µs) of LipDH is incomplete agreement with a diffusing particle of 100 kDa mass. Only at very low excitationintensities (<10 kW/cm2), the relative difference in initial fluorescence intensity betweenFMN and FAD corresponded to the relative difference in fluorescence quantum yield (afactor of ten). In the case of FMN, the relation between initial fluorescence intensity andexcitation light power starts to deviate from linearity more rapidly than for FAD, resultingin an apparent quantum yield difference of about four times at higher light intensities (Fig.7.2). The different behaviour of FMN and FAD can be explained by the difference intriplet quantum yield of the flavin cofactors. The triplet quantum yield of FAD is muchlower (~0.15) than that of FMN (~0.6) (Heelis, 1991) due to the efficient radiationlessdecay to the ground state caused by stacking of the flavin and adenine moieties, aconformation which is predominant in solution (~80%) (Spencer & Weber, 1972). Thehigh rate of intersystem crossing in FMN leads to the formation of a population ofnonfluorescent molecules in the confocal volume element. Photodestruction of the flavindue to the relatively high excitation light intensities that are used in this confocaltechnique would explain the data. Flavins, and especially free FMN, are indeed known tobe rather photolabile: a well-known photochemical degradation pathway for riboflavincompounds is the intramolecular photoreduction via the ribityl chain (Heelis, 1991). Sucha one-electron transfer process would result in intermediates which are susceptible to

Chapter 7
166
further photolysis and hydrolysis. The fact that the contribution of the 1-4 µs process(triplet state lifetime under aerobic conditions) remains rather stable at high lightintensities also points to the presence of another process which provides an alternative de-excitation pathway besides the return to the singlet ground state. The observation that theinitial fluorescence intensity of an FMN sample which was illuminated for the second time(after a dark period that followed a reasonable exposure time), was always lower than theintensity obtained with a fresh sample, supports this idea as well.
Effect of addition of iodide and ascorbic acid on free flavin fluorescence correlationtraces
To study the triplet state build-up of the flavin compounds, free FMN was titratedwith potassium iodide in the range from 100 µM to 100 mM, while monitoring the initialfluorescence intensity (Fig. 7.3A). Iodide has been reported to increase the rate ofintersystem crossing, and is a well-known fluorescence quencher. At iodide concentrationsabove 50 mM, the fluorescence was indeed quenched. However, low iodide concentrationsstimulated FMN fluorescence to ~150% of the initial value. The apparent number ofmolecules calculated from the amplitude of the correlation curve increased to the expectednumber of molecules (Fig. 7.3B), but hardly any influence on the apparent diffusion timeof FMN was found (Fig. 7.3C). The iodide effect can be explained by a decrease of thetriplet population of FMN instead of the expected increase (Fig. 7.4). Except for an
Figure 7.2: Excitation intensity dependence of the initial fluorescence (in kHz) ofFMN (◆ ), FAD (■ ) and LipDH (▲), all at 500 nM. The excitation wavelength was488 nm.
050
100150200250300350
0 200 400 600Excitation intensity (kW/cm2)
Initi
al fl
uore
scen
ce (k
Hz)

Fluorescence correlation spectroscopy of flavins and flavoenzymes:…
increaexcitapopulhigh,
small
signalfluore
t
ve
100
80
60
40
20
0
App
. diff
usio
n tim
e (µ
s)
0.01 0.1 1 10 100[KI] (mM)
500
400
300
200
100
0
App
. num
ber o
f mol
ecul
es
0.01 0.1 1 10 100[KI] (mM)
400
300
200
100
0In
itial
fluo
resc
ence
(kH
z)
0.01 0.1 1 10 100[KI] (mM)
A
B
C
Figure 7.3: The effect of increasing concentrations of potassium iodide on thefluorescence properties of FMN. A: The initial fluorescence intensity (kHz) versushe potassium iodide concentration. B: The apparent number of FMN molecules N'
versus the potassium iodide concentration. C: The apparent diffusion time (T1)ersus the potassium iodide concentration. The FMN concentration was 500 nM, thexcitation wavelength was 458 nm with average intensity 190 kW/cm2. The
horizontal scale is logarithmic to emphasize the differences at low iodideconcentrations.
167
se of the rate of intersystem crossing (k23 in Fig. 7.4), iodide also accelerates the de-tion of the triplet population (k31 in Fig. 7.4), thereby increasing the ground-stateation. Since the rate constant for intersystem crossing in FMN itself is already verythe relative increase in k31 may be higher than that in k23 thus resulting in a relatively
er triplet population (see also Widengren et al., 1995).In the case of FAD, low iodide concentrations did not have any effect on the FCS
at an excitation intensity of 70 kW/cm2. However, a small increase in the initialscence intensity was visible at an excitation intensity of 190 kW/cm2 (data not

Chapter 7
168
shown). The decreased effect of iodide in the case of FAD is most likely the result fromefficient shielding of the isoalloxazine ring by the adenine part in the stackedconformation of FAD. In addition to the decreased contact area between iodide ions andthe fluorophore, quenching by the adenine part forms an efficient de-excitation pathwaythat competes with the intersystem crossing rate induced by iodide. A relaxational processconnected with the stacking/unstacking of FAD in aqueous solution, could not be resolvedin the FCS curves. A rough indication of a fast process has been obtained previously bytaking the ratio of FCS curves of FAD and FMN, but this process was shown to be at theshortest limit of detection (Visser et al., 2001).
The effect of photoinduced reduction of the flavin was investigated by titratingFMN with the reductive agent ascorbic acid. Addition of ascorbic acid did not influencethe absorption spectrum of FMN suggesting that reduction of the flavin did not occur inthe ground state. In an FCS experiment, however, the fluorescence intensity of FMNdecreased significantly upon titration with ascorbic acid under aerobic conditions. Theautocorrelation traces of FMN become faster with increasing ascorbic acid concentration.Six sets of curves, experimental and fitted ones, are presented in Fig. 7.5A. The apparentfaster diffusion time indicates the presence of a chemical process with a time constant ofthe same order of magnitude as the diffusion time. The experimental data were fitted toyield the apparent relaxation time Tapp and the contribution of triplet state kinetics. Thefractional population Ftrip decreases with increasing ascorbic acid concentration. Theamplitude of the correlation curve increases with increasing ascorbic acid concentrationreflecting the presence of fewer fluorescent molecules.
Figure 7.4: Scheme showing the singlet ground state (S0), the singlet excited state(S1), the triplet state (T1) and the rate constants connecting the different levels. Iodidequenching accelerates both the rate of intersystem crossing k23 and the triplet decayrate k31.
S1
S0
T1
k23
k12 k21
k31

Fluorescence correlation spectroscopy of flavins and flavoenzymes:…
169
Figure 7.5: The effect of ascorbic acid on the FCS traces of FMN. A: Shown fromright to left are six sets of traces (experimental and fitted) corresponding with 0,0.03, 0.1, 0.3, 0.5 and 1.0 mM ascorbic acid, respectively. The triplet lifetime Ttrip
was linked over all curves and its value was constrained between 0.5 and 5 µs. Thevalue determined was Ttrip = 0.9 µs. The triplet yield Ftrip was ~15% in the absence ofascorbic acid and decreased to ~6% in the presence of 0.3-1.0 mM ascorbic acid.B: The apparent number of FMN molecules as a function of ascorbic acidconcentration. C: Determination of the apparent second-order rate constant asdescribed in the text. The FMN concentration was 500 nM, the excitationwavelength was 458 nm with average intensity 190 kW/cm2.
60
50
40
30
20App
. num
ber o
f mol
ecul
es
1.00.80.60.40.20.0[Ascorbic acid] (mM)
2.5
2.0
1.5
1.0Nor
mal
ized
aut
ocor
rela
tion
10-4 10-3 10-2 10-1 100 101
Time (ms)
60
50
40
30
20
10
0Rat
e co
nsta
nt *
103 (
s-1)
1.00.80.60.40.20.0[Ascorbic acid] (mM)
A
B
C

Chapter 7
170
To illustrate this effect, the average number of molecules in the excitation volumeis plotted against the ascorbic acid concentration in Figure 7.5B. The relaxation timeconnected to the chemical process (Treact) was calculated from the apparent relaxation timeTapp using:
1 1 1T T Tapp dif react
= + (2)
where the translational diffusion time Tdif was obtained from the analysis of theautocorrelation curve of FMN without added ascorbic acid. The reciprocal value of thereaction time is plotted against the concentration of ascorbic acid in Figure 7.5C. Up to areductant concentration of 0.5 mM, a linear dependence between the concentration ofascorbic acid and the reaction velocity is observed. The second order rate constant for theobserved reaction has been determined to be 5.6 x 10⁷ M-1s-1 (Fig. 7.5C). The bimolecularrate constant for the reaction of the flavin triplet with ascorbic acid has been obtained withflash photolysis and amounted to 1.2 x 10⁹ M-1s-1 (Heelis et al., 1981). The explanation forthis apparent discrepancy is the fact that we monitor in this experiment the fluorescence ofoxidized flavin. After photoreduction the flavin has to be reoxidized again and this islikely the rate-limiting step in the reaction. The apparent rate constant therefore reflectsthe rate constant of reoxidation. In addition, molecular oxygen accelerates de-excitation ofthe triplet state population, thereby reducing the effective concentration of flavin triplets.Titration of FMN with ascorbic acid under anaerobic conditions led to an almost completeloss of both fluorescence intensity and correlation: the FMN in the confocal volumeelement was quickly reduced and no reoxidation by oxygen could take place. Addition ofoxidative agents such as dinitrobenzene and hydrogen peroxide at a broad range ofconcentrations did not have any effect on the FCS signal of free flavins and will not befurther discussed.
FCS experiments on lipoamide dehydrogenase
For LipDH, the initial fluorescence intensities and the values obtainable from thecorrelation curve matched quite well with the fluorescence quantum yield, the expecteddiffusion time and the concentration of the enzyme at low excitation light powers (<30kW/cm2, see also Fig. 7.1D). At higher excitation intensities, two components besides thediffusion time arise in the correlation curves of the enzyme (Fig. 7.6). The contribution ofthese additional components increases with the light intensity until the diffusion time of

Fluorescence correlation spectroscopy of flavins and flavoenzymes:…
the enzyme can no longer be resolved. The recovered time constants of the componentsare quite similar to those found for free FAD. Possibly, these time constants reflectphotodestruction of the flavoenzyme and concomitant release of the FAD. A similar effecthas been observed for the bioluminescent antenna proteins recombined with riboflavin(Visser et al., 2001). However, the time constants may also be related to a relaxationalprocess in the enzyme. Binding of the nonreducing substrate analogue 3-aminopyridineadenine dinucleotide to LipDH did not have any effect on the correlation curves.Reduction of the enzyme with dihydrolipoamide under aerobic conditions resulted in atotal loss of correlation.
0
0.2
0.4
0.6
0.8
1.0
1.2
23.7 47.4 119 237 474
Exc. Intensity (kW/cm2)
Am
plitu
de
0,006-0,002 ms
0,06-0,04 ms
0,34-0,1 ms
r5c
Figure 7.6: The effect of laser intensity on the FCS traces of lipDH. The lipDHconcentration was 500 nM, the excitation wavelength was 488 nm. The experimentaldata were fitted to the model described by Eqn. 1 using one-component diffusiononly at the lowest intensity and two-component diffusion with triplet kinetics at thehigher intensities. The relative amplitudes (Fi, Ftrip) are presented in a bar diagram.At excitation intensities lower than 30 kW/cm2, only the diffusion time can beesolved. At higher intensities additional components start to emerge (see text). Near0 kW/cm2, where the amplitude of these additional components is still low, theorresponding relaxation times are rather ill-defined and therefore not depicted.
171

Chapter 7
172
7.4 Conclusions
From this study it can be concluded that FCS is a very valuable technique forstudying the photophysical properties and the photochemical kinetics of flavins. However,due to these photophysical and photochemical properties of flavins, single-moleculedetection of flavoproteins in solution is a very difficult task. Recently, a spectacularbreakthrough was reported for molecules immobilized in a matrix (Lu et al., 1998): Lu andco-workers monitored enzymatic turnovers of the flavoenzyme cholesterol oxidasemolecules confined in an agarose gel, which prevented translational diffusion of theenzyme, but allowed free exchange of substrates and products. As in the reduced state, theflavin is nonfluorescent compared to the oxidized state, the successive 'on-times' and 'off-times' reflected the redox cycle of the enzyme and thus enzymatic turnover. However, forthe study of the dynamic behaviour of enzymes, considerably more detail is needed. Thiswill require extremely stable enzymes with a high fluorescence quantum yield. For single-molecule studies on flavoenzymes, however, the nature of the flavin molecule itself, beingdesigned as a redox intermediate, combined with the relatively high triplet quantum yieldwill remain the largest obstacle.
Acknowledgement
The receipt of a short-term EMBO fellowship (P.A.W. van den Berg) is gratefully acknowledged.

8 Summarizing discussion
Parts of this Chapter have been published in:van den Berg, P.A.W., and A.J.W.G. Visser. 2001. In: B. Valeur & J.C. Brochon, (eds.),
New trends in fluorescence spectroscopy. Applications to chemical and life sciences,Springer, Berlin, pp. 457-485.
8.1 Active-site dynamics and time-resolved flavin fluorescence
Dynamic processes in proteins occur on a wide range of time scales, ranging fromfemtoseconds for vibrational motions up to hours or longer for folding events. Forenzymes, this intrinsic flexibility poses an intriguing question as to the role ofconformational dynamics in the catalytic function. With the development of experimentaltechniques, a wealth of information on three-dimensional protein structures has becomeavailable, and real-time monitoring of dynamic events is now feasible for the entire timewindow. This has opened up the way for detailed investigations on the enzyme'sfunctionally important motions. An interesting class of enzymes for such research are theflavoenzymes. Flavoenzymes contain a naturally fluorescent flavin cofactor as redox-active prosthetic group. This allows direct monitoring of the active-site dynamics throughfluorescence relaxation spectroscopy, without the need for fluorescence labelling.Obtaining better insight into the active-site dynamics of dimeric flavoproteins by meansof fluorescence relaxation spectroscopy was the aim of research described in this thesis.For interpretation of fluorescence data in terms of dynamic events in the proteins, explicitattention was paid to the photophysical and dynamic characteristics of the flavin cofactor.As central systems, three flavoproteins were chosen for which crystallographic data havesuggested different types of functionally important motions; E. coli glutathione reductase,which displays a local conformational change in the active site; E. coli thioredoxinreductase, for which a major domain rotation was proposed to be essential for catalysis;and P. fluorescens p-hydroxybenzoate hydroxylase, in which the isoalloxazine ring of theflavin cofactor itself is mobile during catalysis. A general introduction on proteindynamics, flavoenzymes and the systems of choice, and (flavin) fluorescence as a methodfor probing protein dynamics is presented in Chapter 1.
Earlier time-resolved fluorescence decay and anisotropy studies have laid afoundation for using flavin fluorescence characteristics in resolving structure-function

Chapter 8
174
relationships in flavoenzymes. Fluorescence depolarization analyses have yieldedknowledge on energy transfer between flavin cofactors in (homo)dimeric or multimericenzymes, possible dissociation of the cofactor, local mobility of the isoalloxazine ring,and -if fluorescence lifetime and molecular mass allowed it- overall protein tumbling (formore details, see van den Berg & Visser, 2001). In many flavoenzymes that tightly bindthe flavin cofactor, however, local mobility of the flavin ring is absent on the nanosecondtime scale. In general, information on the active-site dynamics of flavoenzymes hasmainly been derived from fluorescence lifetime spectra. In previous studies,heterogeneous flavin fluorescence decays have been explained in terms of conformationaldifferences and protein relaxation, in line with the interpretation of heterogeneousfluorescence quenching in tryptophan-containing enzymes. Whereas analysis through aquasi-continuous distribution of time constants often resulted in interpretations in termsof relaxational processes, analysis by a sum of exponentials frequently led to thesuggestion of the existence of just as many protein conformational states. To manyproteins, conformational differences and dynamics on the time scale of fluorescence mayindeed apply. In a theoretical paper of Bajzer and Prendergast (1993), however, it wasshown that for several tryptophan-containing proteins heterogeneity in fluorescencedecay can be explained by energy transfer to different acceptor sites in the protein, whichall contribute with a certain probability to de-excitation of the donor. This so-called'multiple quenching sites model' opened up a new way for explaining heterogeneousfluorescence decays.
8.2 New mechanisms for flavin fluorescence quenching and fluorescencedepolarization
The first protein that was experimentally evaluated in the light of the multiplequenching sites model was E. coli glutathione reductase (Chapter 2). In the crystalstructure of this enzyme, tyrosine 177 blocks the access to the NAYYDPH binding site.During catalysis, this tyrosine is thought to move away from the flavin. Earlier time-resolved fluorescence studies on this hardly fluorescent enzyme from human erythrocyteshad yielded a fluorescence lifetime spectrum with five components, with a dominantultrashort lifetime component of ~30 ps (Bastiaens et al., 1992b). This ultrashortcomponent, which was near the detection limit of the setup used at that time, wasinterpreted as an excited-state interaction between the flavin and the juxtaposed tyrosineresidue that blocks the active site. The five lifetime components were explained by theexistence of (at least) five conformational substates of the enzyme, with differentpositions and/or orientations of this tyrosine residue (Bastiaens et al., 1992b), and it was

Summarizing discussion
175
proposed that interconversion between the substates corresponded to gross structuralchanges in the protein.
The study on E. coli glutathione reductase and mutants in which the flavin-shielding tyrosine was replaced by either a phenylalanine (GR Y177F) or a glycine (GRY177G), in Chapter 2 confirmed the presence of five lifetime components. Because of theenhanced time resolution of the equipment, the predominant ultrashort lifetimecomponent was found to be significantly shorter (7 ps), and again close to the detectionlimit. Although lacking the flavin-shielding tyrosine, the mutant enzymes still showed arapid fluorescence decay. Analysis again yielded five lifetime components, four of whichwere practically identical to that of wild-type enzyme, but the ultrafast 7 ps lifetimecomponent had disappeared. From the these lifetime data, three interesting issues couldbe derived. First, the data provide strong evidence for the multiple quenching sites model.Second, the molecular mechanism of ultrarapid fluorescence quenching in glutathionereductase was disclosed. Third, the study shows that ultrafast processes in the picoseconddomain are quite relevant to analyze dynamic processes in biological systems. The nextsections will deal with the first two topics in a more general context. The third issue willbe addressed in discussing the results on E. coli thioredoxin reductase (Chapter 4).
For the multiple quenching sites model, the E. coli glutathione reductase enzymesyielded convincing results. The fact that mutant enzymes which lack the tyrosine residuecausing the ultrashort fluorescence lifetime, still exhibited a rapid heterogeneousfluorescence decay could only be explained by the existence of quenching sites in theprotein other than the juxtaposed tyrosine. The similarity between the four longerfluorescence lifetimes found for both wild-type GR and the mutant enzymes stronglyindicated that these quenching sites also contribute, albeit to a minor extent, to the flavinfluorescence decay of the wild-type enzyme. The position of the specific site and itsdistance to the flavin, together with the nature of the quenching interaction, thendetermines the probability by which each site contributes to fluorescence quenching.Conformational fluctuations on the (sub)nanosecond time scale as well as on longer timescales will create a heterogeneous ensemble in which the rate and probability offluorescence quenching by a specific site is controlled by the precise nanostructure anddynamics of the light-excited enzyme. Fluorescence lifetime data of other flavoenzymessuch as thioredoxin reductase (Chapter 4), NADH peroxidase (Visser et al., 1998) and p-hydroxybenzoate hydroxylase (Chapter 5) have also confirmed the validity of themultiple quenching sites model.
The results on E. coli glutathione reductase, corroborated by investigations onNADH peroxidase (Visser et al., 1998), and riboflavin-binding protein and glucose

Chapter 8
176
oxidase (Mataga et al., 1998), put a new perspective to the concept of 'nonfluorescentflavoproteins'. A considerable number of flavoenzymes have such a low flavinfluorescence quantum yield that they were traditionally regarded as nonfluorescent. Whenhigh-resolution structures became available, it was noted that these enzymes generallycontained one or more aromatic residues, particularly tryptophans or tyrosines, in closeproximity to the flavin. The strong fluorescence quenching was then explained by theformation of a ground-state complex between the isoalloxazine ring and the aromaticamino acid leading to static quenching ('dark complex'). In the late 1980s, the firstpicosecond lifetime components were reported for flavoenzymes with a tryptophanjuxtaposed to the flavin, such as flavodoxin (Visser et al., 1987). The detection of suchshort fluorescence lifetimes, which are by definition reflecting dynamic quenching, led tothe proposal of a new mechanism of quenching. For flavodoxin from Desulfovibrio, itwas suggested that photoinduced electron transfer from the electron-rich aromatic sidechain of the tryptophan to the light-excited flavin was responsible for this ultrarapidprocess (Visser et al., 1987; Leenders et al., 1993a). Picosecond-absorptionmeasurements on this enzyme revealed a transient exciplex absorption band with anidentical lifetime proving electron transfer from tryptophan to the flavin in the excitedstate (Karen et al., 1987). In E. coli glutathione reductase, comparison of the temperature-invariant 7 ps lifetime component with the time constant expected for photoinducedelectron transfer calculated from the Rehm-Weller equation (Rehm & Weller, 1970)showed the likeliness of a highly efficient quenching route via electron transfer fromtyrosine to the light-excited flavin. Recently, this mechanism was also confirmed byfemtosecond transient absorption data on riboflavin-binding protein and glucose oxidase,where charge separation and recombination were monitored directly (Zhong & Zewail,2001). The fact that ultrashort flavin fluorescence lifetimes are also found in otherflavoproteins containing tyrosines at Van der Waals distance of the flavin, such as NADHperoxidase (Visser et al., 1998), riboflavin-binding protein and glucose oxidase (Matagaet al., 1998, 2000; Zhong & Zewail, 2001), medium-chain acyl-CoA dehydrogenase(Mataga et al., 2000), ferredoxin NADP+ reductase (unpublished results of A. Arakaki),and p-hydroxybenzoate hydroxylase (Chapter 5) demonstrates that this mechanism ofquenching is generally applicable.
Considering fluorescence anisotropy, the E. coli glutathione reductase enzymesrevealed a quite unexpected phenomenon which has led to the proposal of a newmechanism of flavin fluorescence depolarization in Chapter 3. Analysis of the time-resolved anisotropy decay of glutathione reductase revealed two processes of flavinfluorescence depolarization. A small process could be assigned to intramolecular

Summarizing discussion
177
homoenergy transfer between the two flavins (Bastiaens et al., 1992b). The dominantrapid process was in human erythrocyte glutathione reductase interpreted as localmobility of the isoalloxazine ring (Bastiaens et al., 1992b). However, the completeabsence of this rapid depolarization process in the anisotropy data of the E. coli mutantsGR Y177F and GR Y177G rendered this explanation highly unlikely. There was noreason to assume that the flavin would be mobile in wild-type enzyme and not in thetyrosine mutants; in fact, fluorescence lifetime data over a broad range of temperaturesindicated a more flexible structure for the mutant enzymes (Chapter 2). Based on theseresults, it was proposed that not internal mobility of the flavin itself, but a transientcharge-transfer complex between tyrosine 177 and the light-excited flavin, is the sourceof rapid depolarization. Excitation of the flavin induces a relaxation process in the proteinenvironment that leads to the formation of a transient charge-transfer complex betweenthe flavin and tyrosine in which the direction of the emission dipole moment of the flavinis changed. Binding studies of wild-type E. coli glutathione reductase with the substrateanalogues 2'P-5'ADP-ribose and NADP+ supported the direct involvement of Tyr177 inthe rapid depolarization process. The strong temperature dependency of the time constantfor fast depolarization confirmed the dynamic nature of the process.
Supporting evidence for this new mechanism of fluorescence depolarization wasfound in NADH peroxidase (Visser et al., 1998), an enzyme of which the active-sitestructure strongly resembles that of glutathione reductase: in the crystal structure, theNADH binding site is blocked by a tyrosine residue (Tyr159) that is juxtaposed to theflavin (Stehle et al., 1991). The fluorescence anisotropy decay of wild-type NADHperoxidase showed a rapidly depolarizing process that was absent in the mutant enzymeY159A. Besides a clear temperature dependence, the rapid depolarization in wild-typeenzyme also showed a clear wavelength dependence with faster depolarization on the redside of the emission spectrum than on main-band detection (Visser et al., 1998). Thesefindings indicate that the formation of a charge-transfer complex, in which the emissiondipole moment moves out of the plane of the isoalloxazine ring may well be a generalmechanism of flavin fluorescence depolarization in systems with aromatic amino acids atVan der Waals distance of the isoalloxazine ring.
8.3 Exploring the limits of time resolution and ensemble detection
The studies on the glutathione reductase enzymes show that not every visiblefluorescence lifetime corresponds to a single protein conformation. In fact, the oppositecan be true as well. Even in systems where clear evidence is available for the existence ofdifferent protein conformations, it can be difficult -if not impossible- to detect and

Chapter 8
178
identify these various conformations by means of fluorescence lifetime data. In Chapter4, this complication occurred for E. coli thioredoxin reductase (TrxR). For this enzyme,strong indications from structural and spectroscopic data were found for the involvementof a large domain rotation in catalysis yielding two conformations; one correspondingwith the crystal structure (named FO), and one in which the flavin and NADPH cofactorare juxtaposed (named FR). Key data had been acquired from the mutant enzyme TrxRC138S that displayed remarkably different absorption and fluorescence characteristics(QTrxR C138S = 0.07 QTrxR). It was then proposed that in TrxR C138S, the FO conformationis stabilized by a hydrogen bond between Ser138 and the flavin causing strongfluorescence quenching. Wild-type TrxR was postulated to be predominantly in the FRconformation. Steady-state fluorescence titrations of both enzymes with the thiol reagentphenylmercuric acetate and the NADPH analogue 3-aminopyridine adenine dinucleotidecorroborated this model (Mulrooney & Williams, 1997). Although the fluorescenceintensity of the different above-mentioned enzyme/substrate (analogue) complexes variedhighly, hardly any differences in the fluorescence lifetime spectra were found. Only byapplying state-of-the-art fluorescence methods with a time resolution up to severalhundreds of femtoseconds in combination with time-resolved spectral data, we were ableto demonstrate and characterize both the FO and FR conformation. As a fluorescencelifetime of one picosecond is dominant in the FO species of TrxR C138S, whereasfluorescence in the nanosecond region originates from enzyme molecules in the FRconformation, measurements on nanosecond time scales are fully determined by thefraction of enzyme molecules in the FR conformation. Flavin fluorescence relaxationexperiments combined with steady-state optical techniques provided insight into thedynamic properties of the enzyme and the conformational equilibrium. A remarkableeffect of the solvent composition was observed for high concentrations of glycerol whichtrigger the domain rotation from the FO to the FR conformation.
These TrxR studies show that fluorescence lifetimes of just a few picoseconds, oreven hundreds of femtoseconds, can disclose important information on theconformational dynamics of proteins. Mataga et al. (1998) have been the first to reportfemtosecond fluorescence quenching in flavoproteins. By means of fluorescence up-conversion techniques they were able to detect fluorescence quenching on time scalesbetween ~100 fs and ~10 ps in the formerly 'nonfluorescent' flavoproteins riboflavin-binding protein and glucose oxidase. Recently, more extensive studies on these enzymes(Mataga et al., 2000; Zhong & Zewail, 2001) and medium-chain acyl-CoAdehydrogenase (Mataga et al., 2000) were reported. The results on thioredoxin reductaseprove that an ultrahigh time resolution is not only a necessity to study such

Summarizing discussion
179
'nonfluorescent' flavoenzymes, but also an important tool to properly investigate everyprotein system irrespective of its quantum yield. Time has now come to no longer ignoreindications for the existence of rapid events, but to fully investigate them.
However, even fluorescence techniques with an ultrahigh time resolution cannotalways reveal the presence of different protein conformers. This is illustrated by the studyon p-hydroxybenzoate hydroxylase (PHBH) presented in Chapter 5. Crystallographicstudies of binary enzyme/substrate (analogue) complexes with wild-type PHBH andY222 mutants had revealed two distinct enzyme conformations; the 'in' conformation, inwhich the isoalloxazine ring of the FAD cofactor is located in the active site, and the 'out'conformation, in which the flavin ring has moved towards the surface of the protein.Time-resolved fluorescence analysis of these binary enzyme/substrate complexes,however, revealed similar fluorescence lifetime distributions for the 'in' and 'out'conformations. The main reason for this is found in the active-site structure of PHBHwhere various potential quenching sites are located close to the flavin (<10 Å). Amongthese are a tryptophan and three tyrosines, two of which are involved in substrateactivation (Tyr201 and Tyr385), and the third one (Tyr222) in controlling flavin mobility.As a consequence, the fluorescence decay of PHBH is rather complex and is bestdescribed by five lifetime components. In the 'in' and 'out' conformations, the shortestdistance between these quenching sites and the isoalloxazine ring differs only little onaverage, so that they are likely to contribute to fluorescence quenching in bothconformations. An additional complication is the fact that binding of the aromaticsubstrates itself causes efficient fluorescence quenching, most probably due to a similarelectron transfer mechanism as in the tyrosine-containing reductases. As a consequence,the 'in' or 'out' conformation is only reflected in the relative contributions of the longerlifetimes, which are small compared to the amplitude of the lifetime originating fromquenching by the substrate. Although in substrate-free PHBH, the flavin was shown to beflexible (Eppink et al., 1999), the different conformations cannot be separated in thefluorescence lifetime spectrum of this state either. As conventional time-resolvedfluorescence data are obtained from a large number of molecules, the fluorescencelifetime pattern of uncomplexed PHBH is an ensemble average in which the patternscorresponding to separate conformations are mixed. Such limitations can be overcome bythe recently developed single-molecule detection (SMD) techniques (for an introduction,see Chapter 1).

Chapter 8
180
8.4 From ensemble detection to single-molecule resolution
The transition from ensemble data to single-molecule experiments does not onlyrequire innovative technological adaptations, it also asks for new visions on datainterpretation. Instead of evaluating data in terms of equilibria, reaction rates and affinityconstants, understanding of experiments requires insight into individual processes,pathways and interactions. Not to mention that one has to consider the (statistical)relevance of the phenomena observed. The necessity of such detailed insight certainlyapplies to single-molecule conformational dynamics studies. Molecular dynamics (MD)simulations can help to explore the dynamics and transition pathways of single moleculesat atomic resolution. A link between time-resolved fluorescence data of ensembles ofmolecules and the molecular dynamics of single molecules was created in Chapter 6 ofthis thesis. Hereto, the system of investigation was simplified to the FAD cofactor, whichcan exist in both 'open' and 'closed' conformations. MD simulations were performed inthe ground state as well as in the first excited state. The highly heterogeneousfluorescence intensity decay of FAD yielding lifetime spectra with two majorcomponents, one ultrafast (<10 ps) and one in the nanosecond region, could be explainedby the simulations: coplanar stacking of the adenine and flavin rings provided a properstructural basis for immediate fluorescence quenching through photoinduced electrontransfer in the 'closed' state, and transitions from 'open' conformations to 'closed'conformations generally occurred within the lifetime of the flavin excited state. Thesesimulation results yielded a theoretical fluorescence lifetime of the order of thenanosecond lifetime experimentally observed. Conformational transitions of the moleculeappear to be dominated by highly cooperative networks of hydrogen-bonds in the ribityl-pyrophosphate-ribofuranosyl chain.
Another important aspect for understanding single-molecule fluorescence isthorough knowledge of the fluorescence characteristics of the chromophore under theconditions used in single-molecule spectroscopy. The fact that fluorescencecharacteristics and molecular properties at the high excitation light intensities used inSMD may deviate drastically from those in conventional ensemble methods using lowlight intensities, is illustrated in Chapter 7. Here, Fluorescence Correlation Spectroscopy(FCS) was used to investigate the excited-state properties of FMN, FAD and lipoamidedehydrogenase, the latter one serving as a model system for the flavin cofactor in aprotein environment. Because of the high triplet quantum yield of FMN (>0.5) and longlifetime of the triplet state, the system very soon starts to build up a population ofnonfluorescent molecules. This process was irreversible, most likely as a result fromintramolecular photoreduction of the flavin and (subsequent) photobleaching.

Summarizing discussion
181
Photoreduction was clearly shown in titrations of FMN with ascorbic acid. FAD has abetter photostability than FMN due to the considerably lower triplet quantum yieldresulting from stacking of the adenine and flavin moieties. Experiments on lipoamidedehydrogenase showed that at high excitation energies, dissociation of the flavin cofactormay occur.
The photophysical and photochemical limitations observed in the pilot study withFCS indicate that studying protein dynamics through single-molecule flavin fluorescencedetection will prove a challenging enterprise. The single-molecule study on theflavoenzyme cholesterol oxidase reported by Xie and co-workers (Lu et al., 1998; Xie &Lu, 1999) should therefore be considered as a spectacular and surprising breakthrough. Inthis study, the redox cycle of single cholesterol oxidase molecules was monitored throughthe successive 'on-times' and 'off-times' from the enzyme in the oxidized and reducedstate, respectively. An important aspect was the confinement of enzyme molecules in anagarose gel, which prevented translational diffusion of the enzyme, but allowed freeexchange of substrates and products. However, for the study of the active-site dynamicsconsiderably more detail is needed.
8.5 Prospects for studying conformational dynamics by flavin fluorescencedetection
The recent spectacular developments in single-molecule fluorescence detection(see Deniz et al., 2001, for an overview) shall undoubtedly lead to ubiquitous applicationof this approach in exploring conformational dynamics. Maturation of the currenttechniques and the development of new methods will result in a versatile toolbox forstudying dynamics in different biomolecular systems. A bright future may in particular beforeseen for techniques that combine ratiometric burst analyses with fluorescence lifetimeor time-resolved anisotropy detection. So far, investigations on protein conformationaldynamics have mainly been directed at protein folding issues (e.g., Ishii et al., 1999), andrelatively large motions such as in motor proteins (e.g., F1-ATPase, Adachi et al., 2000).Still many obstacles need to be overcome before single-molecule studies will routinelydisclose more subtle processes such as active-site dynamics at a detailed level. Furtherdevelopments in (rigid bimodal) labelling and immobilization techniques, as well as indetection and analysis methodologies shall be required to reveal the entire range ofdynamic processes in a single protein.
Although the emphasis may be put on single-molecule studies, a substantial rolewill remain for fluorescence techniques based on ensemble detection. In addition to beinga reliable source of information on average properties of biomolecules and a bench-mark

Chapter 8
182
for SMD studies, these methods continue to be indispensable in time domains that are not(yet) accessible to single-molecule detection. Particularly in the (sub)picosecond domain,ensemble detected time-resolved fluorescence techniques are just beginning to shed lighton dynamic, electronic, and physical events. In addition, it may prove difficult -if notimpossible- to extend the usage of SMD to all biomolecular systems. Externalfluorescence labelling can not be employed in all situations. Besides inconvenientmobility of the label itself -which may be avoided by bimodal labelling techniques-,steric aspects may not always allow the introduction of a fluorescent label. The delicacyof the molecular structure and of the dynamics may also play a role. Single-moleculestudies through natural fluorescence detection are still scarce. Unfavourablephotophysical characteristics such as a low fluorescence quantum yield or extinctioncoefficient, or susceptibility to photochemical processes are the reason that many systemsare still difficult to tackle. Retrieving information from an ensemble of molecules thatunderwent only few excitations may then be preferable to interpreting highly noisy SMDdata or to registering merely the photochemical death of a single molecule.
In this respect, flavoenzymes are not the easiest systems. Notwithstanding theimpressive results of Lu et al. (1998) described above, the photochemical andphotophysical features of the flavin cofactor will complicate the general usage of single-molecule flavin fluorescence detection. Besides the intrinsic high triplet quantum yield ofthe flavin, and the extremely low flavin fluorescence quantum yield of manyflavoproteins, the dissociability of the flavin cofactor can be a major obstacle. The furtherdevelopment of SMD techniques based on two-photon excitation will provide animportant tool to overcome the problem of rapid photodestruction of the flavin.Selectively focussing on a single immobilized flavoenzyme allows optimization of thesignal to noise ratio and registration of the single-molecule trajectory over a maximumperiod of time. Confinement of the protein in a gel as first used by Lu et al. (1998), seemsan elegant, noninvasive method for this. Dissociation of the chromophore may becircumvented by using flavoenzymes with a covalently attached flavin cofactor. Anexciting and challenging approach would be to try and use time-resolved single-moleculeflavin fluorescence anisotropy detection under such optimized conditions.
Another approach to overcome some of the above-mentioned problems is to use a(rigidly attached) second, external fluorescent label. Whereas direct excitation of the labelcan yield information on the overall or segmental dynamics of single flavoproteins,spFRET between the flavin and the label may provide more detailed insight in the proteindynamics. Though the flavin may in principle act as a donor as well as an acceptor inspFRET, the efficient flavin fluorescence quenching by aromatic amino acids will in most

Summarizing discussion
183
flavoenzymes limit its use to being an acceptor. Dynamic information can then beretrieved from the fluorescence decrease and lifetime-shortening of the donor. A suitableenergy donor for flavins is the now widely applied green fluorescent protein, particularlythe mutant BFP. Flavoenzyme-BFP adducts will be particularly interesting from a single-molecule enzymatics point of view: the fluorescence emission of BFP can be used as asensitive antenna for the redox state and thus the enzymatic activity, as only in theoxidized state of the flavin the spectral cross-sections overlap. The value of flavoenzyme-BFP adducts for investigating protein conformational dynamics may be restricted by thesize of BFP. Ideally, one would like to use site-specific rigid bimodal labelling with smallfluorophores for studying flavoprotein dynamics. Such systems not only enable well-controlled spFRET experiments, but also provide another site for smFPA studies. Aprime candidate for such single-molecule approach is E. coli thioredoxin reductase: real-time monitoring of the domain rotation in this enzyme during catalysis should be feasible.Advantageous is also the relatively high flavin fluorescence quantum yield of thisenzyme: through four-channel-detection, one could even monitor both the emission of theflavin and the external label, and simultaneously obtain dynamic information from time-resolved anisotropy or lifetime data. Highly promising four-channel-detection techniquesare currently developed in laboratories such as that of the Seidel group (MPI, Göttingen;Eggeling et al., 2001). Such single-molecule experiments shall provide a more detailedpicture of the conformational dynamics of flavoenzymes and its relation to the catalyticfunction.


9 Bibliography
Adachi, K., R. Yasuda, H. Noji, H. Itoh, Y. Harada, M. Yoshida, and K. Kinosita. 2000.Stepping rotation of F1-ATPase visualized through angle-resolved single-fluorophoreimaging. Proc. Natl. Acad. Sci. USA 97, 7243-7247.
Alcala, J.R., E. Gratton, and F.G. Prendergast. 1987. Interpretation of fluorescence decays inproteins using continuous lifetime distributions. Biophys. J. 51, 925-936.
Anderson, B.F., H.M. Baker, G.E. Norris, S.V. Rumball, and E.N. Baker. 1990. Apolactoferrinstructure demonstrates ligand-induced conformational change in transferrins. Nature344, 784-787.
Arscott, L.D., S. Gromer, R.H. Schirmer, K. Becker, and C.H. Williams, Jr. 1997. Themechanism of thioredoxin reductase from human placenta is similar to themechanisms of lipoamide dehydrogenase and glutathione reductase and is distinctfrom the mechanism of thioredoxin reductase from Escherichia coli. Proc. Natl. Acad.Sci. USA 94, 3621-3626.
Bailey, S., A.H. Fairlamb, and W.N. Hunter. 1994. Structure of trypanothione reductase fromCrithidia fasciculata at 2.6 Å resolution; enzyme-NADP interactions at 2.8 Åresolution. Acta Crystallogr. D 50, 139-154.
Bajzer, Z., and F.G. Prendergast. 1993. A model for multiexponential tryptophan fluorescenceintensity decay in proteins. Biophys. J. 65, 2313-2323.
Barbara, P.F., T.J. Meyer, and M.A. Ratner. 1996. Contemporary issues in electron transferresearch. J. Phys. Chem. 100, 13148-13168.
Baro, A.M., R. Miranda, J. Alaman, N. Garcia, G. Binnig, H. Röhrer, C. Gerber, and J.L.Carrascosa. 1985. Determination of surface topography of biological specimens athigh resolution by scanning tunneling microscopy. Nature 315, 253-254.
Barry, B.A., and G.T. Babcock. 1987. Tyrosine radicals are involved in the photosyntheticoxygen-evolving system. Proc. Natl. Acad. Sci. USA 84, 7099-7103.
Bashir, A., R.N. Perham, N.S. Scrutton, and A. Berry. 1995. Altering kinetic mechanism andenzyme stability by mutagenesis of the dimer interface of glutathione reductase.Biochem. J. 312, 527-533.
Bastiaens, P.I.H., P.J.M. Bonants, F. Müller, and A.J.W.G. Visser. 1989. Time-resolvedfluorescence spectroscopy of NADPH-cytochrome P-450 reductase: demonstration ofenergy transfer between the two prosthetic groups. Biochemistry 28, 8416-8425.
Bastiaens, P.I.H., A. van Hoek, J.A.E. Benen, J.C. Brochon, and A.J.W.G. Visser. 1992a.Conformational dynamics and intersubunit energy transfer in wild-type and mutantlipoamide dehydrogenase from Azotobacter vinelandii. Biophys. J. 63, 839-853.

Chapter 9
186
Bastiaens, P.I.H., A. van Hoek, W.F. Wolkers, J.C. Brochon, and A.J.W.G. Visser. 1992b.Comparison of the dynamical structures of lipoamide dehydrogenase and glutathionereductase by time-resolved polarized flavin fluorescence. Biochemistry 31, 7050-7060.
Beece, D., L. Eisenstein, H. Frauenfelder, D. Good, M.C. Marden, L. Reinisch, A.H. Reynolds,L.B. Sorensen, and K.T. Yue. 1980. Solvent viscosity and protein dynamics.Biochemistry 19, 5147-5157.
Beechem, J.M., and L. Brand. 1985. Time-resolved fluorescence of proteins. Annu. Rev.Biochem. 54, 43-71.
Beechem, J.M. 1992. Global analysis of biochemical and biophysical data. Methods Enzymol.210, 37-54.
Benen, J., W. van Berkel, Z. Zak, T. Visser, C. Veeger, and A. de Kok. 1991. Lipoamidedehydrogenase from Azotobacter vinelandii: site-directed mutagenesis of the His450-Glu455 diad. Spectral properties of wild type and mutated enzymes. Eur. J. Biochem.202, 863-872.
Berendsen H.J.C., J.P.M. Postma, W.F. van Gunsteren, A. DiNola, and J.R. Haak. 1984.Molecular dynamics with coupling to an external bath. J. Chem. Phys. 81, 3684-3690.
Berendsen, H.J.C., J.R. Grigera, and T.P. Straatsma. 1987. The missing term in effective pairpotentials. J. Phys. Chem. 91, 6269-6271.
Berendsen, H.J.C., D. van der Spoel, and R. van Drunen. 1995. GROMACS: a message-passingparallel molecular dynamics implementation. Comp. Phys. Comm. 91, 43-56.
Berry, A., N.S. Scrutton, and R.N. Perham. 1989. Switching kinetic mechanism and putativeproton donor by directed mutagenesis of glutathione reductase. Biochemistry 28,1264-1269.
Binnig G., C.F. Quate, and C. Gerber. 1986. Atomic force microscope. Phys. Rev. Lett. 56, 930-933.
Bismuto, E., G. Irace, I. Sirangelo, and E. Gratton. 1996. Pressure-induced perturbation ofANS-apomyoglobin complex: frequency domain fluorescence studies on native andacidic compact states. Protein Sci. 5, 121-126.
Boussac, A., and A.L. Etienne. 1984. Midpoint potential of signal II (slow) in tris-washedphotosystem-II particles. Biochim. Biophys. Acta 766, 576-581.
Bradbury, S.L., and W.B. Jakoby. 1972. Glycerol as an enzyme-stabilizing agent: effects onaldehyde dehydrogenase. Proc. Natl. Acad. Sci. USA 69, 2373-2376.
Brochon, J.C. 1994. Maximum entropy method of data analysis in time-resolved spectroscopy.Methods Enzymol. 240, 262-311.
Brooks, B., and M. Karplus. 1983. Harmonic dynamics of proteins: normal modes andfluctuations in bovine pancreatic trypsin inhibitor. Proc. Natl. Acad. Sci. USA 80,6571-6575.
Calcaterra, N.B., G.A. Picó, E.G. Orellano, J. Ottado, N. Carrillo, and E.A. Ceccarelli. 1995.Contribution of the FAD binding site residue tyrosine 308 to the stability of peaferredoxin-NADP+ oxidoreductase. Biochemistry 34, 12842-12848.
Careri, G., P. Fasella, and E. Gratton. 1979. Enzyme dynamics: the statistical physics approach.Annu. Rev. Biophys. Bioeng. 8, 69-97.

Bibliography
187
Clegg, R.M. 1996. Fluorescence resonance energy transfer. In: Fluorescence imagingspectroscopy and microscopy, X.F. Wang & B. Herman (Eds.), Wiley, New York, pp.179-252.
Colonna-Cesari, F., D. Perahia, M. Karplus, H. Eklund, C.I. Brãndén, and O. Tapia. 1986.Interdomain motion in liver alcohol dehydrogenase. Structural and energetic analysisof the hinge bending mode. J. Biol. Chem. 261, 15273-15280.
Copeland, R.A., and T.G. Spiro. 1986. Ultraviolet resonance Raman spectroscopy of flavinmononucleotide and flavin adenine dinucleotide. J. Phys. Chem. 90, 6648-6654.
Creed, D. 1984. The photophysics and photochemistry of near-UV absorbing amino acids-1.tryptophan and its simple derivatives. Photochem. Photobiol. 39, 537-562.
Dale, R.E., J. Eisinger and W.E. Blumberg. 1979. The orientational freedom of molecularprobes. The orientation factor in intramolecular energy transfer. Biophys. J. 26, 161-193.
Daura, X., K. Gademann, B. Jaun, D. Seebach, W.F. van Gunsteren, and A.E. Mark. 1999.Peptide folding: when simulation meets experiment. Angew. Chemie (Int. edn.) 38,236-240.
de Kok, A., and A.J.W.G. Visser. 1987. Flavin binding site differences between lipoamidedehydrogenase and glutathione reductase as revealed by static and time-resolvedflavin fluorescence. FEBS Lett. 218, 135-138.
Decker, K.F. 1991. Covalent flavoproteins. In: Chemistry and biochemistry of flavoenzymes,Vol. II, F. Müller (Ed.), CrC Press, Boca Raton, pp. 343-375.
Demchenko, A.P. 1992. Fluorescence and dynamics in proteins. In: Topics in fluorescencespectroscopy, Vol. III, J.R. Lakowicz (Ed.), Plenum Press, New York, pp. 65-111.
Deniz, A.A., M. Dahan, J.R. Grunwell, T. Ha, A.E. Faulhaber, D.S. Chemla, S. Weiss, and P.G.Schultz. 1999. Single-pair fluorescence energy transfer on freely diffusing molecules:observation of Förster distance dependence and subpopulations. Proc. Natl. Acad. Sci.USA 96, 3670-3675.
Deniz, A.A., T.A. Laurence, M. Dahan, D.S. Chemla, P.G. Schultz, and S. Weiss. 2001.Ratiometric single-molecule studies of freely diffusing biomolecules. Annu. Rev.Phys. Chem. 52, 233-253.
Deonarain, M.P., A. Berry, N.S. Scrutton, and R.N. Perham. 1989. Directed mutagenesis of theredox-active disulphide bridge in glutathione reductase from Escherichia coli.Biochemistry 28, 9602-9607.
Deonarain, M.P., N.S. Scrutton, A. Berry, and R.N. Perham. 1990. Alternative protondonors/acceptors in the catalytic mechanism of the glutathione reductase ofEscherichia coli: the role of histidine-439 and tyrosine-99. Proc. R. Soc. Lond. B. 241,179-186.
Digris, A.V., V.V. Skakoun, E.G. Novikov, A. van Hoek, A. Claiborne, and A.J.W.G. Visser.1999. Thermal stability of a flavoprotein assessed from associative analysis ofpolarized time-resolved fluorescence spectroscopy. Eur. Biophys. J. 28, 526-531.
Digris, A.V., V.V. Skakoun, E.G. Novikov, V.V. Apanasovich, M.A. Hink, and A.J.W.G.Visser. 2000. Global analysis of fluorescence fluctuation data. Biophys. J. 78, 440A.

Chapter 9
188
Dixon, M.M., H. Nicholson, L. Shewchuk, W.A. Baase, and B.W. Matthews. 1992. Structure ofa hinge-bending bacteriophage T4 lysozyme mutant, Ile3→ Pro. J. Mol. Biol. 227,917-933.
Draper, R.D., and L.L. Ingraham. 1968. A potentiometric study of the flavin semiquinoneequilibrium. Arch. Biochem. Biophys. 125, 802-808.
Edman, L., Ü. Mets, and R. Rigler. 1996. Conformational transitions monitored for singlemolecules in solution. Proc. Natl. Acad. Sci. USA 93, 6710-6715.
Eftink, M.R. 1991. Fluorescence techniques for studying protein structure. Meth. Biochem.Anal. 35, 127-205.
Eggeling, C., J.R. Fries, L. Brand, R. Günther, and C.A.M. Seidel. 1998. Monitoringconformational dynamics of a single molecule by selective fluorescence spectroscopy.Proc. Natl. Acad. Sci. USA 95, 1556-1561.
Eggeling, C., S. Berger, L. Brand, J.R. Fries, J. Schaffer, A. Volkmer, and C.A.M. Seidel. 2001.Data registration and selective single-molecule analysis using multi-parameterfluorescence detection. J. Biotechnol. 86, 163-180.
Ehrenberg, M., and R. Rigler. 1974. Rotational Brownian motion and fluorescence intensityfluctuation. Chem. Phys. 4, 390-401.
Eigen, M., and R. Rigler. 1994. Sorting single molecules: application to diagnostics andevolutionary biotechnology. Proc. Natl. Acad. Sci. USA 91, 5740-5747.
Ekberg, M., M. Sahlin, M. Eriksson, and B.M. Sjöberg. 1996. Two conserved tyrosine residuesin protein R1 participate in an intermolecular electron transfer in ribonucleotidereductase. J. Biol. Chem. 271, 20655-20659.
Eklund, H., J.P. Samama, L. Wallén, C.I. Brändén, Å. Åkeson, and T.A. Jones. 1981. Structureof a triclinic ternary complex of horse liver alcohol dehydrogenase at 2.9 Å resolution.J. Mol. Biol. 146, 561-587.
Elson, E.L., and D. Magde. 1974. Fluorescence correlation spectroscopy. I. Conceptual basisand theory. Biopolymers 13, 1-27.
Enroth, C., H. Neujahr, G. Schneider, and Y. Lindqvist. 1998. The crystal structure of phenolhydroxylase in complex with FAD and phenol provides evidence for a concertedconformational change in the enzyme and its cofactor during catalysis. Structure 6,605-617.
Entsch, B., D.P. Ballou, and V. Massey. 1976. Flavin-oxygen derivatives involved inhydroxylation by p-hydroxybenzoate hydroxylase. J. Biol. Chem. 251, 2550-2563.
Entsch, B., B.A. Palfey, D.P. Ballou, and V. Massey. 1991. Catalytic function of tyrosineresidues in para-hydroxybenzoate hydroxylase as determined by the study of site-directed mutants. J. Biol. Chem. 266, 17341-17349.
Entsch, B., and W.J.H. van Berkel. 1995. Structure and mechanism of para-hydroxybenzoatehydroxylase. FASEB J. 9 476-483.
Eppink, M.H.M., H.A. Schreuder, and W.J.H. van Berkel. 1995. Structure and function ofmutant Arg44Lys of 4-hydroxybenzoate hydroxylase. Implications for NADPHbinding. Eur. J. Biochem. 231, 157-165.

Bibliography
189
Eppink, M.H.M., H.A. Schreuder, and W.J.H. van Berkel. 1998a. Interdomain binding ofNADPH in p-hydroxybenzoate hydroxylase as suggested by kinetic, crystallographicand modeling studies of histidine 162 and arginine 269 variants. J. Biol. Chem. 273,21031-21039.
Eppink, M.H.M., H.A. Schreuder, and W.J.H. van Berkel. 1998b. Lys42 and Ser42 variants ofp-hydroxybenzoate hydroxylase from Pseudomonas fluorescens reveal that Arg42 isessential for NADPH binding. Eur. J. Biochem. 253, 194-201.
Eppink, M.H.M., W.J.H. van Berkel, A. Teplyakov, and H.A. Schreuder. 1999. Crystalstructures of ‘unactivated’ p-hydroxybenzoate hydroxylase. In: Flavins andflavoproteins, S. Ghisla, P. Kroneck, P. Macheroux, and H. Sund (Eds.), Agency forScientific Publications, Berlin, pp. 239-242.
Ermler, U., and G.E. Schulz. 1991. The three-dimensional structure of glutathione reductasefrom Escherichia coli at 3.0 Å resolution. Proteins: Struct. Funct. Genet. 9, 174-179.
Eschrich, K., W.J.H. van Berkel, A.H. Westphal, A. de Kok, A. Mattevi, G. Obmolova, K.H.Kalk, and W.G.J. Hol. 1990. Engineering of microheterogeneity-resistant p-hydroxybenzoate hydroxylase from Pseudomonas fluorescens. FEBS Lett. 277, 197-199.
Eschrich, K., F.J.T. van der Bolt, A. de Kok, and W.J.H. van Berkel. 1993. Role of Tyr201 andTyr385 in substrate activation by p-hydroxybenzoate hydroxylase from Pseudomonasfluorescens. Eur. J. Biochem 216, 137-146.
Faber, H.R., and B.W. Matthews. 1990. A mutant T4 lysozyme displays five different crystalconformations. Nature 348, 263-266.
Ferreira, S.T., L. Stella, and E. Gratton. 1994. Conformational dynamics of bovine Cu, Znsuperoxide dismutase revealed by time-resolved fluorescence spectroscopy of thesingle tyrosine residue. Biophys. J. 66, 1185-1196.
Frauenfelder, H., and P.G. Wolynes. 1985. Rate theories and puzzles of hemeprotein kinetics.Science 229, 337-345.
Frauenfelder, H., and E. Gratton. 1986. Protein dynamics and hydration. Methods Enzymol. 127,207-216.
Frauenfelder, H., F. Parak, and R.D. Young. 1988. Conformational substates in proteins. Annu.Rev. Biophys. Biophys. Chem. 17, 451-479.
Frauenfelder, H., N.A. Alberding, A. Ansari, D. Braunstein, B.R. Cowen, M.K. Hong, I.E.T.Iben, J.B. Johnson, S. Luck, M.C. Marden. J.R. Mourant, P. Ormos, L. Reinisch, R.Scholl, A. Schulte, E. Shyamsunder, L.B. Sorensen, P.J. Steinbach, A. Xie, R.D.Young, and K.T. Yue. 1990. Proteins and pressure. J. Phys. Chem. 94, 1024-1037.
Frauenfelder, H., S.G. Sligar, and P.G. Wolynes. 1991. The energy landscapes and motions ofproteins. Science 254, 1598-1603.
Fries, J.R., L. Brand, C. Eggeling, M. Köllner, and C.A.M. Seidel. 1998. Quantitativeidentification of different single molecules by selective time-resolved confocalfluorescence spectroscopy. J. Phys. Chem. A 102, 6601-6613.
Förster, T. 1948. Zwischenmolekulare Energiewanderung und Fluoreszenz. Ann. Physik. 2, 55-75.
Gatti, D.L., B.A. Palfey, M.S. Lah, B. Entsch, V. Massey, D.P. Ballou, and M.L. Ludwig. 1994.The mobile flavin of 4-OH benzoate hydroxylase. Science 266, 110-114.

Chapter 9
190
Gavish, B., and M.M. Werber. 1979. Viscosity-dependent structural fluctuations in enzymecatalysis. Biochemistry 18, 1269-1275.
Gekko, K., and S.N. Timasheff. 1981a. Mechanism of protein stabilization by glycerol:preferential hydration in glycerol-water mixtures. Biochemistry 20, 4667-4676.
Gekko, K., and S.N. Timasheff. 1981b. Thermodynamic and kinetic examination of proteinstabilization by glycerol. Biochemistry 20, 4677-4686.
Gerstein, M., B.F. Anderson, G.E. Norris, E.N. Baker, A.M. Lesk, and C. Chothia. 1993a.Domain closure in lactoferrin. Two hinges produce a see-saw motion betweenalternative close- packed interfaces. J. Mol. Biol. 234, 357-372.
Gerstein, M., G. Schulz, and C. Chothia. 1993b. Domain closure in adenylate kinase. Joints oneither side of two helices close like neighboring fingers. J. Mol. Biol. 229, 494-501.
Gerstein, M., A.M. Lesk, and C. Chothia. 1994. Structural mechanisms for domain movementsin proteins. Biochemistry 33, 6739-6749.
Gõ, N., T. Noguti, and T. Nishikawa. 1983. Dynamics of a small globular protein in terms oflow frequency vibrational modes. Proc. Natl. Acad. Sci. USA 80, 3696-3700.
Greene, B.J., and R.C. Farrow. 1983. The subpicosecond Kerr effect in CS2. Chem. Phys. Lett.98, 273-275.
Greer, S., and R.N. Perham. 1986. Glutathione reductase from Escherichia coli: cloning andsequence analysis of the gene and relationship to other flavoprotein disulfideoxidoreductases. Biochemistry 25, 2736-2742.
Ha, T., Th. Enderle, D.S. Chemla, P.R. Selvin, and S. Weiss. 1996. Single molecule dynamicsstudied by polarization modulation. Phys. Rev. Lett. 77, 3979-3982.
Ha, T., J. Glass, T. Enderle, D.S. Chemla, and S. Weiss. 1998. Hindered rotational diffusion androtational jumps of single molecules. Phys. Rev. Lett. 80, 2093-2096.
Ha, T., A.Y. Ting, J. Liang, W.B. Caldwell, A.A. Deniz, D.S. Chemla, P.G. Schultz, and S.Weiss. 1999. Single-molecule fluorescence spectroscopy of enzyme conformationaldynamics and cleavage mechanism. Proc. Natl. Acad. Sci. USA 96, 893-898.
Hall, L.H., B.J. Orchard, and S.K. Tripathy. 1987a. The structure and properties of flavins:molecular orbital study based on totally optimized geometries. I. Molecular geometryinvestigations. Int. J. Quantum Chem. 31, 195-216.
Hall, L.H., B.J. Orchard, and S.K. Tripathy. 1987b. The structure and properties of flavins:molecular orbital study based on totally optimized geometries. II. Molecular orbitalstructure and electron distribution. Int. J. Quantum Chem. 31, 217-242.
Harriman, A. 1987. Further comments on the redox potentials of tryptophan and tyrosine. J.Phys. Chem. 91, 6102-6104.
Hecht, H.J., H.M. Kalisz, J. Hendle, R.D. Schmid, and D. Schomburg. 1993. Crystal structureof glucose oxidase from Aspergillus niger refined at 2.3 Å resolution. J. Mol. Biol.229, 153-172.
Heelis, P.F., B.J. Parsons, G.O. Phillips, and J.F. McKellar. 1981. The flavin sensitisedphotooxidation of ascorbic acid: a continuous and flash photolysis study. Photochem.Photobiol. 33, 7-13.
Heelis, P.F. 1991. The photochemistry of flavins. In: Chemistry and biochemistry offlavoenzymes, F. Müller (Ed.), Vol. I, CRC Press, Boca Raton, pp. 171-193.

Bibliography
191
Hockney, R.W., and J.W. Eastwood. 1988. Computer simulation using particles. IOP PublishingLtd., Bristol, England.
Holmgren, A. 1968. Thioredoxin. 6. The amino acid sequence of the protein from Escherichiacoli B. Eur. J. Biochem. 6, 475-484.
Holmgren, A. 1985. Thioredoxin. Annu. Rev. Biochem 54, 237-271.
Holmgren, A. 1989. Minireview: thioredoxin and glutaredoxin systems. J. Biol. Chem. 264,13963-13966.
Husain, M., and V. Massey. 1979. Kinetic studies on the reaction of p-hydroxybenzoatehydroxylase. Agreement of steady state and rapid reaction data. J. Biol. Chem. 254,6657-6666.
Ishii, Y., T. Yoshida, T. Funatsu, T. Wazawa, and T. Yanagida. 1999. Fluorescence resonanceenergy transfer between single fluorophores attached to a coiled-coil protein inaqueous solution. Chem. Phys. 247, 163-173.
Jarabak, J., A.E. Seeds, Jr., and P. Talalay. 1966. Reversible cold inactivation of a17β−hydroxysteroid dehydrogenase of human placenta: protective effect of glycerolBiochemistry 5, 1269-1279.
Jencks, W.P. 1975. Binding energy, specificity and enzymic catalysis: the circe effect. Adv.Enzym. 43, 219-410.
Johansson, L.B.-Å., Å. Davidsson, G. Lindblom, and K. Razi Naqvi. 1979. Electronictransitions in the isoalloxazine ring and orientation of flavins in mode membranesstudied by polarized light spectroscopy. Biochemistry 18, 4249-4253.
Kabsch, W., and C. Sander. 1983. Dictionary of protein secondary structure: pattern recognitionof hydrogen-bonded and geometrical features. Biophys. J. 22, 2577-2637.
Kainosho, M., and Y. Kyogoku. 1972. High-resolution proton and phosphorus nuclear magneticresonance spectra of flavin-adenine dinucleotide and its conformations in aqueoussolutions. Biochemistry 11, 741-752.
Karen, A., N. Ikeda, N. Mataga, and F. Tanaka. 1983. Picosecond laser photolysis studies offluorescence quenching mechanisms of flavin: a direct observation of indole-flavinsinglet charge transfer state formation in solution and flavoenzymes. Photochem.Photobiol. 37, 495-502.
Karen, A., M.T. Sawada, F. Tanaka, and N. Mataga. 1987. Dynamics of excited flavoproteins-picosecond laser photolysis studies. Photochem. Photobiol. 45, 49-53.
Karplus, M., and J.A. McCammon. 1983. Dynamics of proteins: elements and function. Ann.Rev. Biochem. 53, 263-300.
Karplus, P.A., and G.E. Schulz. 1987. Refined structure of glutathione reductase at 1.54 Åresolution. J. Mol. Biol. 195, 701-729.
Karplus, P.A., and G.E. Schulz. 1989. Substrate binding and catalysis by glutathione reductaseas derived from refined enzyme: substrate crystal structures at 2 Å resolution. J. Mol.Biol. 210, 163-180.
Karplus, P.A., M.J. Daniels, and J.R. Herriott. 1991. Atomic structure of ferredoxin-NADP+-reductase: prototype for a structurally novel flavoenzyme family. Science 251, 60-66.

Chapter 9
192
Kask, P., C. Eggeling, K. Palo, Ü. Mets, M. Cole, and K. Gall. 2002. Fluorescence intensitydistributions analysis (FIDA) and related fluorescence fluctuation techniques: theoryand practice. In: Fluorescence spectroscopy, imaging and probes. New tools inchemical, physical and life sciences, R. Kraayenhof, A.J.W.G. Visser, and H.C.Gerritsen (Eds.), Vol. II, Springer, Heidelberg, in press.
Kettling, U., A. Koltermann, P. Schwille, and M. Eigen. 1998. Real-time enzyme kineticsmonitored by dual-color fluorescence cross-correlation spectroscopy. Proc. Natl.Acad. Sci. USA 95, 1416-1420.
Kotowycz, G., N. Teng, M.P. Klein, and M. Calvin. 1969. The 220 MHz nuclear magneticresonance study of a solvent-induced conformational change in flavin adeninedinucleotide. J. Biol. Chem. 244, 5656-5662.
Kraut, J. 1988. How do enzymes work? Science 242, 533-540.
Krimm S., and J. Bandekar. 1986. Vibrational spectroscopy and conformation of peptides,polypeptides, and proteins. Adv. Protein Chem. 38, 181-360.
Kuriyan, J., T.S.R. Krishna, L. Wong, B. Guenther, A. Pahler, C.H. Williams, Jr., and P. Model.1991. Convergent evolution of similar function in two structurally divergent enzymes.Nature 352, 172-174.
Kurzyñski, M. 1997. Protein machine model of enzymatic reactions gated by enzyme internaldynamics. Biophys. Chem. 65, 1-28.
Kurzyñski, M. 1998a. A synthetic picture of intramolecular dynamics of proteins. Towards acontemporary statistical theory of biochemical processes. Prog. Biophys. Mol. Biol.69, 23-82.
Kurzyñski, M. 1998b. Time course of reactions controlled and gated by intramoleculardynamics of proteins: predictions of the model of random walk on fractal lattices.Proc. Natl. Acad. Sci. USA 95, 11685-11690.
Lakowicz, J.R. 1999. Principles of fluorescence spectroscopy, 2nd edn, KluwerAcademic/Plenum Publishers, New York.
Leenders, R., A. van Hoek, M. van Iersel, C. Veeger, and A.J.W.G. Visser. 1993a. Flavindynamics in oxidized Clostridium beijerinckii flavodoxin as assessed by time-resolved polarized fluorescence. Eur. J. Biochem. 211, 977-984.
Leenders, R., M. Kooijman, A. van Hoek, C. Veeger, and A.J.W.G. Visser. 1993b. Flavindynamics in reduced flavodoxins: a time-resolved polarized fluorescence studie. Eur.J. Biochem. 211, 37-45.
Leijonmarck, M. 1977. On the structures of flavin derivatives. Crystallographic studies and areview. Chem. Commun. 8, 1-70.
Lennon, B.W., and C.H. Williams, Jr. 1995. Effect of pyridine nucleotide on the oxidative half-reaction of Escherichia coli thioredoxin reductase. Biochemistry 34, 3670-3677.
Lennon, B.W., and C.H. Williams, Jr. 1996. Enzyme-monitored turnover of Escherichia colithioredoxin reductase: insights for catalysis. Biochemistry 35, 4704-4712.
Lennon, B.W., and C.H. Williams, Jr. 1997. Reductive half-reaction of thioredoxin reductasefrom Escherichia coli. Biochemistry 36, 9464-9477.

Bibliography
193
Lennon, B.W., C.H. Williams, Jr., and M.L. Ludwig. 1999. Crystal structure of reducedthioredoxin reductase from Escherichia coli: structural flexibility in the isoalloxazinering of the flavin adenine dinucleotide cofactor. Protein Sci. 8, 2366-2379.
Lennon, B.W., C.H. Williams, Jr., and M.L. Ludwig. 2000. Twists in catalysis: alternatingconformations of Escherichia coli thioredoxin reductase. Science 289, 1190-1194.
Lesk, A.M., and C. Chothia. 1984. Mechanisms of domain closure in proteins. J. Mol. Biol. 174,175-191.
Li, R., M.A. Bianchet, P. Talalay, and L.M. Amzel. 1995. The three-dimensional structure ofNAD(P)H:quinone reductase, a flavoprotein involved in cancer chemoprotection andchemotherapy: mechanism of the two-electron reduction. Proc. Natl. Acad. Sci. USA92, 8846-8850.
Livesey, A.K., and J.C. Brochon. 1987. Analyzing the distribution of decay constants in pulse-fluorimetry using the maximum entropy method. Biophys. J. 52, 693-706.
Lu, H.P., L. Xun, and X.S. Xie. 1998. Single-molecule enzymatic dynamics. Science 282, 1877-1882.
Luty, B.A., and W.F. van Gunsteren. 1996. Calculating electrostatic interactions using theparticle-particle particle-mesh method with nonperiodic long-range interactions. J.Phys. Chem. 100, 2581-2587.
Macklin, J.J., J.K. Trautman, T.D. Harris, and L.E. Brus. 1996. Imaging and time-resolvedspectroscopy of single molecules at an interface. Science 272, 255-258.
Maeda-Yorita, K., G.C. Russell, J.R. Guest, V. Massey, and C.H. Williams, Jr. 1991. Propertiesof lipoamide dehydrogenase altered by site-directed mutagenesis at a key residue(I184Y) in the pyridine nucleotide binding domain. Biochemistry 30, 11788-11795.
Magde, D., E.L. Elson, and W.W. Webb. 1972. Thermodynamic fluctuations in a reactingsystem-measurement by fluorescence correlation spectroscopy. Phys. Rev. Lett. 29,705-711.
Magde, D., E.L. Elson, and W.W. Webb. 1974. Fluorescence correlation spectroscopy. 2. Anexperimental realization. Biopolymers 13, 29-61.
Maiti, S., U. Haupts, and W.W. Webb. 1997. Fluorescence correlation spectroscopy: diagnosticsfor sparse molecules. Proc. Natl. Acad. Sci. USA 94, 11753-11757.
Marcus, R.A. 1956. On the oxidation-reduction reactions involving electron transfer. I* J.Chem. Phys. 24, 966-978.
Marcus, R.A., and N. Sutin. 1985. Electron transfers in chemistry and biology. Biochim.Biophys. Acta 811, 265-322.
Mark, A.E. 1998. Free energy pertubation calculations. In: Encyclopaedia of computationalchemistry, P. von Rague Schleyer (Ed.), Vol. II, John Wiley & Sons Ltd, Chichester,pp. 1070-1083.
Mataga, N., H. Chrosrowjan, Y. Shibata, and F. Tanaka. 1998. Ultrafast fluorescence quenchingdynamics of flavin chromophores in protein nanospace. J. Phys. Chem. B 102, 7081-7084.
Mataga, N., H. Chrosrowjan, Y. Shibata, F. Tanaka, Y. Nishina, and K. Shiga. 2000. Dynamicsand mechanisms of ultrafast fluorescence quenching reactions of flavin chromophoresin protein nanospace. J. Phys. Chem. B 104, 10667-10677.
Chapter 9
194
Mattevi, A., A.J. Schierbeek, and W.G.J. Hol. 1991. Refined crystal structure of lipoamidedehydrogenase from Azotobacter vinelandii at 2.2 Å resolution. A comparison withthe structure of glutathione reductase. J. Mol. Biol. 220, 975-994.
Mattevi, A., M.A. Vanoni, F. Todoni, M. Rizzi, A. Teplyakov, A. Coda, M. Bolognesi, and B.Curti. 1996. Crystal structure of D-amino acid oxidase: a case of active site mirror-image convergent evolution with flavocytochrome b2. Proc. Natl. Acad. Sci. USA 93,7496-7501.
Mattevi, A., M.W. Fraaije, A. Mozarelli, L. Olivi, A. Coda, and W.J.H. van Berkel. 1997.Crystal structures and inhibitor binding in the octameric flavoenzyme vanillyl-alcoholoxidase: the shape of the active-site cavity controls substrate specificity. Structure 5,907-920.
Mattevi, A. 1998. The PHBH fold: not only flavoenzymes. Biophys. Chem. 70, 217-222.
Mérola, F., R. Rigler, A. Holmgren, and J.C. Brochon. 1989. Picosecond tryptophanfluorescence of thioredoxin: evidence for discrete species in slow exchange.Biochemistry 28, 3383-3398.
Meyer, M., H. Hartwig, and D. Schomburg. 1996. Semiempirical and ab initio study of closedand open shell derivatives of 10-methylisoalloxazine: a model for flavin redox states.J. Mol. Struct. 364, 139-149.
Millar, D.P. 1996. Time-resolved fluorescence spectroscopy. Current Opinion in Struct. Biol. 6,637-642.
Mittl, P.R.E., and G.E. Schulz. 1994. Structure of glutathione reductase from Escherichia coli at1.86 Å resolution: comparison with the enzyme from human erythrocytes. Protein Sci.3, 799-809.
Mittl, P.R.E., A. Berry, N.S. Scrutton, R.N. Perham, and G.E. Schulz. 1994. Anatomy of anengineered binding site. Protein Sci. 3, 1504-1514.
Moore, E.C., P. Reichard, and L. Thelander. 1964. Enzymatic synthesis ofdeoxyribonucleotides. V. Purification and properties of thioredoxin reductase fromEscherichia coli B. J. Biol. Chem. 239, 3445-3452.
Moran, G.R., B. Entsch, B.A. Palfey, and D.P. Ballou. 1999. Mechanistic insights intop-hydroxybenzoate hydroxylase from studies of the mutant Ser212Ala. Biochemistry38, 6292-6299.
Moser, C.C., J.M. Keske, K. Warncke, R.S. Farid, and P.L. Dutton. 1992. Nature of biologicalelectron transfer. Nature 355, 796-802.
Müller F. (Ed.). 1991. Chemistry and biochemistry of flavoenzymes, Vol. I, II, III, CRC Press,Boca Raton.
Mulrooney, S.B. 1997. Application of a single plasmid vector for mutagenesis and high levelexpression of thioredoxin reductase and its use to examine flavin cofactorincorporation. Prot. Exp. Purif. 9, 372-378.
Mulrooney, S.B., and C.H. Williams, Jr. 1997. Evidence for two conformational states ofthioredoxin reductase from Escherichia coli: use of intrinsic and extrinsic quenchersof flavin fluorescence as probes to observe domain rotation. Protein Sci. 6, 2188-2195.
Nie, S., and R.N. Zare. 1997. Optical detection of single molecules. Annu. Rev. Biophys.Biomol. Struct. 26, 567-596.

Bibliography
195
O'Connor, D.V., and D. Phillips. 1984. Time-correlated single-photon counting, AcademicPress, London.
O'Donnell, M.E., and C.H. Williams, Jr. 1983. Proton stoichiometry in the reduction of the FADand disulfide of Escherichia coli thioredoxin reductase. J. Biol. Chem. 258, 13795-13805.
Ogle, T.F. 1983. Action of glycerol and sodium molybdate in stabilization of the progesteronereceptor from rat trophoblast. J. Biol. Chem. 258, 4982-4988.
Ortiz-Maldonado, M., D. Gatti, D.P. Ballou, and V. Massey. 1999. Structure-functioncorrelations of the reaction of reduced nicotinamice analogues with p-hydroxybenzoate hydroxylase substituted with a series of 8-substituted flavins.Biochemistry 38, 16636-16647.
Pai, E.F., and G.E. Schulz. 1983. The catalytic mechanism of glutathione reductase as derivedfrom X-ray diffraction analyses of reaction intermediates. J. Biol. Chem. 258, 1752-1757.
Pai, E.F., P.A. Karplus, and G.E. Schulz. 1988. Crystallographic analysis of the binding ofNADPH, NADPH fragments, and NADPH analogues to glutathione reductase.Biochemistry 27, 4465-4474.
Palfey, B.A., D.P. Ballou, and V. Massey. 1997. Flavin conformational changes in the catalyticcycle of p-hydroxybenzoate hydroxylase substituted with 6-azido- and 6-aminoflavinadenine dinucleotide. Biochemistry 36, 15713-15723.
Palfey, B.A., G.R. Moran, B. Entsch, D.P. Ballou, and V. Massey. 1999. Substrate recognitionby "password" in p-hydroxybenzoate hydroxylase. Biochemistry 38, 1153-1158.
Park, H.W., S.T. Kim, A. Sancar, and J. Deisenhofer. 1995. Crystal structure of DNAphotolyase from Escherichia coli. Science 268, 1866-1872.
Parsonage, D., and A. Claiborne. 1995. Analysis of the kinetic and redox properties of NADHperoxidase C42S and C42A mutants lacking the cysteine-sulfenic acid redox center.Biochemistry 34, 435-441.
Penzer, G.R., and G.K. Radda. 1967. The chemistry and biological functions of isoalloxazines(flavines). Quart. Rev. (London) 21, 43-65.
Platenkamp, R.J., M.H. Palmer, and A.J.W.G. Visser. 1980. Ab initio molecular orbital studiesof flavin radicals and the lowest triplet state of isoalloxazine. J. Mol. Struct. 67, 45-64.
Platenkamp, R.J., M.H. Palmer, and A.J.W.G. Visser. 1987. Ab initio molecular orbital studiesof closed shell flavins. Eur. Biophys. J. 14, 393-402.
Pourplanche, C., C. Lambert, M. Berjot, J. Marx, C. Chopard, A.J.P. Alix, and V. Larreta-Garde. 1994. Conformational changes in lipoxygenase (LOX) in modifiedenvironments. J. Biol. Chem. 269, 31585-31591.
Priev, A., A. Almagor, S. Yedgar, and B. Gavish. 1996. Glycerol decreases the volume andcompressibility of protein interior. Biochemistry 35, 2061-2066.
Prince, R.C. 1988. Tyrosine radicals. Trends in Biochem. Sci. 13, 286-288.
Prongay, A.J., D.R. Engelke, and C.H. Williams, Jr. 1989. Characterization of two active sitemutants of thioredoxin reductase from Escherichia coli. J. Biol. Chem. 264, 2656-2664.

Chapter 9
196
Provencher, S.W., and J. Glöckner. 1981. Estimation of globular protein secondary structurefrom circular dichroism. Biochemistry 20, 33-37.
Radmacher, M., M. Fritz, H.G. Hansma, and P.K. Hansma. 1994. Direct observation of enzymeactivity with the atomic force microscope. Science 265, 1577-1579.
Raibekas, A.A., and V. Massey. 1996. Glycerol-induced development of catalytically activeconformation of Crotalus adamanteus L-amino acid oxidase in vitro. Proc. Natl.Acad. Sci. USA 93, 7546-7551.
Raszka, M., and N.O. Kaplan. 1974. Intramolecular hydrogen bonding in flavin adeninedinucleotide. Proc. Nat. Acad. Sci. USA 71, 4546-4550.
Rees, W.A., R.W. Keller, J.P. Vesenka, G. Yang, and C. Bustamante. 1993. Evidence of DNAbending in transcription complexes imaged by scanning force microscopy. Science260, 1646-1649.
Rehm, D., and A. Weller. 1970. Kinetics of fluorescence quenching by electron and H-atomtransfer. Israel J. Chem., 21st Farkas Memorial Symp. 8, 259-271.
Reichard, P., and A. Ehrenberg. 1983. Ribonucleotide reductase - a radical enzyme. Science221, 514-519.
Remington, S., G. Wiegand, and R. Huber. 1982. Crystallographic refinement and atomicmodels of two differrent forms of citrate synthase at 2.7 and 1.7 Å resolution. J. Mol.Biol. 158, 111-152.
Rice, D.W., G.E. Schulz, and J.R. Guest. 1984. Structural relationship between glutathionereductase and lipoamide dehydrogenase. J. Mol. Biol. 174, 483-496.
Rigler, R., Ü. Mets, J. Widengren, and P. Kask. 1993. Fluorescence correlation spectroscopywith high count rate and low background: analysis of translational diffusion. Eur.Biophys. J. 22, 169-175.
Robinson, K.M., R.A. Rothery, J.H. Weiner, and B.D. Lemire. 1994. The covalent attachmentof FAD to the flavoprotein of Saccharomyces cerevisae succinate dehydrogenase isnot necessary for import and assembly into mitochondria. Eur. J. Biochem. 222, 983-990.
Ruggiero, A.J., D.C. Todd, and G.R. Fleming. 1990. Subpicosecond anisotropy studies oftryptophan in water. J. Am. Chem. Soc. 112, 1003-1014.
Russel, M., and P. Model. 1986. The role of thioredoxin in filamentous phage assembly.Construction, isolation and characterization of mutant thioredoxins. J. Biol. Chem.261, 14997-15005.
Sakmann, B., and E. Neher (Eds.). 1995. Single-channel recording, 2nd edn, Plenum, NewYork.
Sarma, R.H., P. Dannies, and N.O. Kaplan. 1968. Investigations of inter- and intramolecularinteractions in flavin-adenine dinucleotide by proton magnetic resonance.Biochemistry 7, 4359-4367.
Schaffer, J., A. Volkmer, C. Eggeling, V. Subramaniam, G. Striker, and C.A.M. Seidel. 1999.Identification of single molecules in aqueous solution by time-resolved fluorescenceanisotropy. J. Phys. Chem. A 103, 331-336.
Bibliography
197
Schreuder, H.A., J.M. van der Laan, W.G.J. Hol, and J. Drenth. 1988. Crystal structure of p-hydroxybenzoate hydroxylase complexed with its reaction product 3,4-dihydroxybenzoate. J. Mol. Biol. 199, 637-648.
Schreuder, H.A., P. Prick, R.K. Wieringa, G. Vriend, K.S. Wilson, W.G.J. Hol, and J. Drenth.1989. Crystal structure of the p-hydroxybenzoate hydroxylase-substrate complexrefined at 1.9 Å resolution. J. Mol. Biol. 208, 679-696.
Schreuder, H.A., J.M. van der Laan, W.G.J. Hol, and J. Drenth. 1991. The structure of the p-hydroxybenzoate hydroxylase. In: Chemistry and biochemistry of flavoenzymes, F.Müller (Ed.), Vol. II, CRC Press, Boca Raton, Florida, pp. 31-64.
Schreuder, H.A., J.M. van der Laan, M.B.A. Swarte, K.H. Kalk, and W.G.J. Hol. 1992. Crystalstructure of the reduced form of p-hydroxybenozate hydroxylase refined at 2.3 Åresolution. Proteins: Struct. Funct. Genet. 141, 178-190.
Schreuder, H.A., A. Mattevi, G. Obmolova, K.H. Kalk, W.J.G. Hol, F.J.T. van der Bolt, andW.J.H. van Berkel. 1994. Crystal structures of wild-type p-hydroxybenzoatehydroxylase complexed with 4-aminobenzoate, 2,4-dihydroxybenzoate and 2-hydroxy-4-aminobenzoate and the Tyr222Ala mutant, complexed with 2-hydroxy-4-aminobenzoate. Evidence for a proton channel and a new binding mode of the flavinring. Biochemistry 33, 10161-10170.
Schulz, G.E., C.W. Muller, and K. Diederichs. 1990. Induced-fit movements in adenylate kinases. J. Mol. Biol. 213, 627-630.
Schwille, P., F.J. Meyer-Almes, and R. Rigler. 1997. Dual-color fluorescence cross-correlationspectroscopy for multicomponent diffusional analysis in solution. Biophys. J. 72,1878-1886.
Scrutton, N.S., A. Berry, and R.N. Perham. 1987. Purification and characterization ofglutathione reductase encoded by a cloned and over-expressed gene in Escherichiacoli. Biochem. J. 245, 875-880.
Scrutton, N.S., A. Berry, and R.N. Perham. 1990. Redesign of the coenzyme specificity of adehydrogenase by protein engineering. Nature 343, 38-43.
Seidel, C.A.M., A. Schulz, and M.H.M. Sauer. 1996. Nucleobase-specific quenching offluorescent dyes. 1. Nucleobase one-electron redox potentials and their correlationwith static and dynamic quenching efficiencies. J. Phys. Chem. 100, 5541-5553.
Serre L., F.M.D. Vellieux, M. Medina, C. Gomez-Moreno, J.C. Fontecilla-Camps, and M. Frey.1996. X-ray structure of the ferredoxin:NADP+ reductase from the cyanobacteriumAnabaena PCC 7119 at 1.8 Å resolution, and crystallographic studies of NADP+
binding at 2.25 Å resolution. J. Mol. Biol. 263, 20-39.
Sharff, A.J., L.E. Rodseth, J.C. Spurlino, and F.A. Quiocho. 1992. Crystallographic evidence ofa large ligand-induced hinge-twist motion between the two domains of themaltodextrin binding protein involved in active transport. Biochemistry 31, 10657-10663.
Siemiarczuk, A., B.D. Wagner, and W.R. Ware. 1990. Comparison of the maximum entropyand exponential series methods for the recovery of distributions of lifetimes fromfluorescence lifetime data. J. Phys. Chem. 94, 1661-1666.
Singer, T.P., and W.S. McIntire. 1984. Covalent attachment of flavin to flavoproteins:occurence, assay and synthesis. Methods Enzymol. 106, 369-378.
Chapter 9
198
Song, P.S. 1970. Molecular orbital treatment of the intramolecular complexing in flavin adeninedinucleotide (FAD). In: Quantum aspects of heterocyclic compounds, E.D. Bergmann& B. Pullman (Eds.), Israel Academy of Sciences, pp. 358-384.
Spector, T., and V. Massey. 1972. Studies on the effector specificity of p-hydroxybenzoatehydroxylase from Pseudomonas fluorescens. J. Biol. Chem. 247, 4679-4687.
Spencer, R.D., and G. Weber. 1972. Thermodynamics and kinetics of the intramolecularcomplex in flavin-adenine dinucleotide. In: Structure and function of oxidationreduction enzymes, Å. Åkeson & A. Ehrenberg (Eds.), Pergamom, Oxford, pp. 393-399.
Stanier, R.Y., and L.N. Ornston. 1973. The β-ketoadipate pathway. Adv. Microb. Physiol. 9, 89-151.
Stanley, R.J., and A.W. MacFarlane IV. 2000. Ultrafast excited state dynamics of oxidizedflavins: direct observation of quenching by purines. J. Phys. Chem. A 104, 6899-6906.
Stehle, T., S.A. Ahmed, A. Claiborne, and G.E. Schulz. 1991. Structure of NADH peroxidasefrom Streptococcus faecalis 10C1 refined at 2.16 Å resolution. J. Mol. Biol. 221,1325-1344.
Stehle, T., A. Claiborne, and G.E. Schulz. 1993. NADH binding site and catalysis of NADHperoxidase. Eur. J. Biochem. 211, 221-226.
Steinberg, I.Z. 1971. Long-range nonradiative transfer of electronic excitation energy inproteins and polypeptides. Annu. Rev. Biochem. 40, 83-114.
Stillman, T.J., P.J. Baker, K.L. Britton, and D.W. Rice. 1993. Conformational flexibility inglutamate dehydrogenase. Role of water in substrate recognition and catalysis. J. Mol.Biol. 234, 1131-1139.
Tanaka, F., N. Tamai, and I. Yamazaki. 1989a. Picosecond-resolved fluorescence spectra of D-amino-acid oxidase. A new fluorescent species of the coenzyme. Biochemistry 28,4259-4262.
Tanaka, F., N. Tamai, I. Yamazaki, N. Nakashima, and K. Yoshihara. 1989b. Temperature-induced changes in the coenzyme environment of D-amino acid oxidase revealed bythe multiple decays of FAD fluorescence. Biophys. J. 28, 901-909.
Teitell, M.F., S.H. Suck, and J.L. Fox. 1981. A MINDO/3 MO study of oxidized flavins. Theor.Chim. Acta 60, 127-141.
Thelander, L. 1967. Thioredoxin reductase: characterization of a homogeneous preparation fromEscherichia coli B. J. Biol. Chem. 242, 852-859.
Thieme, R., E.F. Pai, R.H. Schirmer, and G.E. Schulz. 1981. Three-dimensional structure ofglutathione reductase at 2 Å resolution. J. Mol. Biol. 152, 763-782.
Timasheff, S.N., J.C. Lee, E.P. Pittz, and N. Tweedy. 1976. The interaction of tubulin and otherproteins with structure-stabilizing solvents. J. Colloid Interface Sci. 55, 658-663.
Timasheff, S.N. 1993. The control of protein stability and association by weak interactions withwater: how do solvents affect these processes? Annu. Rev. Biophys. Biomol. Struct. 22,67-97.
Tsibris, J.C.M., D.B. McCormick, and L.D. Wright. 1965. Studies on donor-acceptor complexesrelating to the intramolecular association of the riboflavin and adenosine moieties offlavin-adenine dinucleotide. Biochemistry 4, 504-509.

Bibliography
199
Tsien, R.Y. 1998. The green fluorescent protein. Ann. Rev. Biochem. 67, 509-544.
van Berkel, W.J.H., and F. Müller. 1987. The elucidation of the microheterogeneity of highlypurified p-hydroxybenzoate hydroxylase from Pseudomonas fluorescens by variousbiochemical techniques. Eur. J. Biochem. 167, 35-46.
van Berkel, W.J.H., and F. Müller. 1989. The temperature and pH dependence of someproperties of p-hydroxybenzoate hydroxylase from Pseudomonas fluorescens. Eur. J.Biochem. 179, 307-314.
van Berkel, W.J.H., and F. Müller. 1991. Flavin-dependent monooxygenases with specialreference to 4-hydroxybenzoate hydroxylase. In: Chemistry and biochemistry offlavoenzymes, Vol. II, F. Müller (Ed.), CRC Press, Boca Raton, pp. 1-29.
van Berkel, W.J.H., A.H. Westphal, K. Eschrich, M.H.M. Eppink, and A. de Kok. 1992.Substitution of Arg214 at the substrate-binding site of p-hydroxybenzoate hydroxylasefrom Pseudomonas fluorescens. Eur. J. Biochem. 210, 411-419.
van Berkel, W.J.H., F.J.T. van der Bolt, M.H.M. Eppink, A. de Kok, I.M.C.M. Rietjens, C.Veeger, J. Vervoort, and H.A. Schreuder. 1994a. Substrate and effector specificity oftwo active-site mutants of p-hydroxybenzoate hydroxylase from Pseudomonasfluorescens. In: Flavins and flavoproteins XI, K. Yagi (Ed.), Walter de Gruyter,Berlin, pp. 231-234.
van Berkel, W.J.H., M.H.M. Eppink, and H.A. Schreuder. 1994b. Crystal structure of p-hydroxybenzoate hydroxylase reconstituted with the modified FAD present in alcoholoxidase from methylotrophic yeasts: evidence for an arabinoflavin. Protein Sci. 3,2245-2253.
van den Berg, P.A.W., A. van Hoek, C.D. Walentas, R.N. Perham, and A.J.W.G. Visser. 1998.Flavin fluorescence dynamics and photoinduced electron transfer in Escherichia coliglutathione reductase. Biophys. J. 74, 2046-2058.
van den Berg, P.A.W., and A.J.W.G. Visser. 2001. Tracking molecular dynamics offlavoproteins with time-resolved fluorescence spectroscopy. In: New trends influorescence spectroscopy. Applications to chemical and life sciences, B. Valeur &J.C. Brochon (Eds.), Springer, Berlin, pp. 457-485.
van den Berg, P.A.W., S.B. Mulrooney, B. Gobets, I.H.M. van Stokkum, A. van Hoek, C.H.Williams, Jr., and A.J.W.G. Visser. 2001. Exploring the conformational equilibrium ofE. coli thioredoxin reductase: characterization of two catalytically important states byultrafast flavin fluorescence spectroscopy. Protein Sci. 10, 2037-2049.
van der Bolt, F.J.T., J. Vervoort, and W.J.H. van Berkel. 1996. Flavin motion in p-hydroxybenzoate hydroxylase. Substrate and effector specificity of the Tyr222Alamutant. Eur. J. Biochem. 237, 592-600.
van der Laan, J.M., H.A. Schreuder, M.B.A. Swarte, R.K. Wierenga, K.H. Kalk, W.G.J. Hol,and J. Drenth. 1989. The coenzyme analogue adenosine 5-diphosphoribose displacesFAD in the active site of p-hydroxybenzoate hydroxylase. An X-ray crystallographicinvestigation. Biochemistry 28, 7199-7205.
van der Spoel, D., A.R. van Buuren, D.P. Tieleman, and H.J.C. Berendsen. 1996a. Moleculardynamics simulations of peptides from BPTI: a closer look at amide-aromaticinteractions. J. Biomol. NMR 8, 229-238.

Chapter 9
200
van der Spoel, D., K.A. Feenstra, M.A. Hemminga, and H.J.C. Berendsen. 1996b. Molecularmodeling of the RNA binding N-terminal part of cowpea chlorotic mottle virus coatprotein in solution with phosphate ions. Biophys. J. 71, 2920-2932.
van Gunsteren, W.F., S.R. Billeter, A.A. Eising, P.H. Hünenberger, P. Krüger, A.E. Mark,W.R.P. Scott, and I.G. Tironi. 1996. Biomolecular simulation: the GROMOS96manual and user guide, BIOMOS b.v., Zürich, Groningen.
van Hoek, A., and A.J.W.G. Visser. 1985. Artefact and distortion sources in time-correlatedsingle-photon counting. Anal. Instrum. 14, 359-378.
van Hoek, A., K. Vos, and A.J.W.G. Visser. 1987. Ultrasensitive time-resolved polarizedfluorescence spectroscopy as a tool in biology and medicine. IEEE J. QuantumElectron. QE-23, 1812-1820.
van Hoek, A., and A.J.W.G. Visser. 1992. Cw dye laser synchronously pumped by the thirdharmonic of a mode-locked cw Nd:YLF laser for tunable blue and green excitationand picosecond time-correlated photon counting detection. Proc. SPIE 1640, 325-329.
van Stokkum, I.H.M., A.M. Brouwer, H.J. van Ramesdonk, and T. Scherer. 1993.Multiresponse parameter estimation and compartmental analysis of time-resolvedfluorescence spectra. Proc. K. Ned. Akad. Wet. Ser. B. Phys. Sci. 96, 43-68.
Veine, D.M., S.B. Mulrooney, P.F. Wang, and C.H. Williams, Jr. 1998a. Formation andproperties of mixed disulfides between thioredoxin reductase from Escherichia coliand thioredoxin: evidence that cysteine-138 functions to initiate dithiol-disulfideinterchange and to accept the reducing equivalent from reduced flavin. Protein Sci. 7,1441-1450.
Veine, D.M., K. Ohnishi, and C.H. Williams, Jr. 1998b. Thioredoxin reductase fromEscherichia coli: evidence of restriction to a single conformation upon formation of acrosslink between engineered cysteines. Protein Sci. 7, 369-375.
Visser, A.J.W.G., and F. Müller. 1979. Absorption and fluorescence studies on neutral andcationic isoalloxazines. Helv. Chim. Acta 62, 593-608.
Visser, A.J.W.G., and J. Lee. 1980. Lumazine protein from the bioluminescent bacteriumPhotobacterium phosphoreum. A fluorescence study of the protein-ligand equilibrium.Biochemistry 19, 4366-4372.
Visser, A.J.W.G. 1984. Kinetics of stacking interactions in flavin adenine dinucleotide fromtime-resolved fluorescence. Photochem. Photobiol. 40, 703-706.
Visser, A.J.W.G., A. van Hoek, T. Kulinski, and J. Le Gall. 1987. Time-resolved fluorescencestudies of flavodoxin. Demonstration of picosecond fluorescence lifetimes of FMN inDesulfovibrio flavodoxins. FEBS Lett. 224, 406-410.
Visser, A.J.W.G., A. van Hoek, A., N.V. Visser, Y. Lee, and S. Ghisla. 1997. Time-resolvedfluorescence study of the photodissociation of FMN from the yellow fluorescenceprotein from Vibrio fischeri. Photochem. Photobiol. 65, 570-575.
Visser, A.J.W.G., P.A.W. van den Berg, N.V. Visser, A. van Hoek, H.A. van den Burg, D.Parsonage, and A. Claiborne. 1998. Time-resolved fluorescence of flavin adeninedinucleotide in wild-type and mutant NADH peroxidase. Elucidation of quenchingsites and discovery of a new fluorescence depolarization mechanism. J. Phys. Chem.102, 10431-10439.

Bibliography
201
Visser, A.J.W.G., P.A.W. van den Berg, M.A. Hink, and V.N. Petushkov. 2001. Fluorescencecorrelation spectroscopy of flavins and flavoproteins. In: Fluorescence correlationspectroscopy. Theory and application, R. Rigler & E.L. Elson, (Eds.), Springer,Heidelberg, pp. 9-24.
Voet, D., and A. Rich. 1971a. A hydrogen-bonded complex between riboflavin and anadenosine derivative, and its possible relation to FAD function. In: Flavins andflavoproteins, H. Kamin (Ed.), University Park Press, Baltimore, pp. 23-35.
Voet, D., and A. Rich. 1971b. The crystal and molecular structure of an intermolecular complexbetween riboflavin and an adenosine derivative. Proc. Natl. Acad. Sci. USA 68, 1151-1156.
Vos, K., A. van Hoek, and A.J.W.G. Visser. 1987. Application of a reference convolutionmethod to tryptophan fluorescence in proteins. A refined description of rotationaldynamics. Eur. J. Biochem. 165, 55-63.
Vrielink, A., L.F. Lloyd, and D.M. Blow. 1991. Crystal structure of cholesterol oxidase fromBrevibacterium sterolicum refined at 1.8 Å resolution. J. Mol. Biol. 219, 533-554.
Waksman, G., T.S.R. Krishna, C.H. Williams, Jr., and J. Kuriyan. 1994. Crystal structure ofEscherichia coli thioredoxin reductase refined at 2 Å resolution. Implications for alarge conformational change during catalysis. J. Mol. Biol. 236, 800-816.
Wang, J., M. Ortiz-Maldonado, B. Entsch, V. Massey, D. Ballou, and D.L. Gatti. 2002. Proteinand ligand dynamics in 4-hydroxybenzoate hydroxylase. Proc. Natl. Acad. Sci. USA99, 608-613.
Wang, P.F., D.M. Veine, S.H. Ahn, and C.H. Williams, Jr. 1996. A stable mixed disulfidebetween thioredoxin reductase and its substrate, thioredoxin: preparation andcharacterization. Biochemistry 35, 4812-4819.
Wang, P.F., L.D. Arscott, T.W. Gilberger, S. Müller, and C.H. Williams, Jr. 1999. Thioredoxinreductase from Plasmodium falciparum: evidence for interaction between the C-terminal cysteine residues and the active site disulfide-dithiol. Biochemistry 38, 3187-3196.
Weber, G. 1950. Fluorescence of riboflavin and flavin-adenine dinucleotide. Biochem. J. 47,114-121.
Weiss, S. 1999. Fluorescence spectroscopy of single biomolecules. Science 283, 1676-1683.
Weiss, S. 2000. Measuring conformational dynamics of biomolecules by single moleculefluorescence spectroscopy. Nat. Struc. Biol. 7, 724-729.
Welch, G.R., B. Somogyi, and S. Damjanovich. 1982. The role of protein fluctuations inenzyme action: a review. Prog. Biophys. Mol. Biol. 39, 109-146.
Wennmalm, S., L. Edman, and R. Rigler. 1997. Conformational fluctuations in single DNAmolecules. Proc. Natl. Acad. Sci. USA 94, 10641-10646.
Westphal, A.H. & de Kok, A. 1988. Lipoamide dehydrogenase from Azotobacter vinelandii.Molecular cloning, organization and sequence analysis of the gene. Eur. J. Biochem.172, 299-305.
Whitby, L.G. 1953. A new method for preparing flavin-adenine dinucleotide. Biochem J. 54,437-442.

Chapter 9
202
Widengren, J., Ü. Mets, and R. Rigler, 1995. Fluorescence correlation spectroscopy of tripletstates in solution. A theoretical and experimental study. J. Phys. Chem. 99, 13368-13379.
Widengren, J., and R. Rigler. 1998. Fluorescence correlation spectroscopy as a tool toinvestigate chemical reactions in solutions and on cell surfaces. Cell. Mol. Biol. 44,857-879.
Wierenga, R.K., R.J. de Jong, K.H. Kalk, W.G.J. Hol, and J. Drenth. 1979. Crystal structure ofp-hydroxybenzoate hydroxylase. J. Mol. Biol. 131, 55-73.
Wilkinson, K.D., and C.H. Williams, Jr. 1979. Evidence for multiple electronic forms of two-electron-reduced lipoamide dehydrogenase from Escherichia coli. J. Biol. Chem 254,852-862.
Williams, Jr., C.H., G. Zanetti, L.D. Arscott, and J.K. McAllister. 1967. Lipoamidedehydrogenase, glutathione reductase, thioredoxin reductase, and thioredoxin. Asimultaneous purification and characterization of the four proteins from Escherichiacoli B. J. Biol. Chem. 242, 5226-5231.
Williams, Jr., C.H. 1976. Flavin-containing dehydrogenases. In: The enzymes, 3rd edn., P.D.Boyer, (Ed.), Vol. XIII, pp. 89-173.
Williams, Jr., C.H. 1992. Lipoamide dehydrogenase, glutathione reductase, thioredoxinreductase, and mercuric ion reductase – a family of flavoenzyme transhydrogenases.In: Chemistry and biochemistry of flavoenzymes, F. Müller, (Ed.), Vol. III, CRCPress, Boca Raton, pp. 121-211.
Williams, Jr., C.H. 1995. Mechanism and structure of thioredoxin reductase from Escherichiacoli. FASEB J. 9, 1267-1276.
Williams, Jr., C.H., L.D. Arscott, S. Müller, B.W. Lennon, M.L. Ludwig, P-F. Wang, D.M.Veine, K. Becker, and R.H. Schirmer. 2000. Thioredoxin reductase – Two modes ofcatalysis have evolved. Eur. J. Biochem. 267, 6110-6117.
Xie, X.S., and J.K. Trautman. 1998. Optical studies of single molecules at room temperature.Annu. Rev. Phys. Chem. 49, 441-480.
Xie, X.S., and H.P. Lu. 1999. Single-molecule enzymology. J. Biol. Chem. 274, 15967-15970.
Xue, Q.F., and E.S. Yeung. 1995. Differences in the chemical reactivity of individual moleculesof an enzyme. Nature 373, 681-683.
Yasukawa, T., C. Kanei-Ishii, T. Maekawa, J. Fujimoto, T. Yamamoto, and S. Ishii. 1995.Increase of solubility of foreign proteins in Escherichia coli by coproduction of thebacterial thioredoxin. J. Biol. Chem. 270, 25328-25331.
Yedgar, S., C. Tetreau, B. Gavish, and D. Lavalette. 1995. Viscosity dependence of O2 escapefrom respiratory proteins as a function of cosolvent molecular weight. Biophys. J. 68,665-670.
Zhang, Y., C.S. Bond, S. Bailey, M.L. Cunningham, A.H. Fairlamb, and W.N. Hunter. 1996.The crystal structure of trypanothione reductase from the human pathogenTrypanosoma cruzi at 2.3 Å resolution. Protein Sci. 5, 52-61.
Zheng, Y.J., and R.L. Ornstein. 1996. A theoretical study of structures of flavin in differentoxidation and protonation states. J. Am. Chem. Soc. 118, 9402-9408.

Bibliography
203
Zheng, Y., J. Dong, B.A. Palfey, and P.R. Carey. 1999. Using Raman spectroscopy to monitorthe solvent-exposed and "buried" forms of flavin in p-hydroxybenzoate hydroxylase.Biochemistry 38, 16727-16732.
Zhong, D., and A.H. Zewail. 2001. Femtosecond dynamics of flavoproteins: charge separationand recombination in riboflavin (vitamin B2)-binding protein and in glucose oxidaseenzyme. Proc. Natl. Acad. Sci. USA 98, 11867-11872.
Zhou, B.P., D.A. Lewis, S.W. Kwan, and C.W. Abell. 1995. Flavinylation of monoamineoxidase B. J. Biol. Chem. 270, 23653-23660.


Nederlandse samenvatting-voor familie en vrienden-
Dynamische eiwitstructuren
Het leven is in essentie gebaseerd op de continue werking van eenverscheidenheid aan eiwitten die chemische reacties aansturen. Deze eiwitten, enzymengenaamd, kunnen chemische reacties versnellen (katalyseren) die normaliter niet, ofslechts heel langzaam, spontaan in de natuur verlopen. In de Biochemie wordt devoortgang van een chemische reactie beschreven in termen van 'vrij enzym en vrijsubstraat (uitgangsstof)', 'enzymgebonden substraat', 'de overgangstoestand','enzymgebonden product' en 'vrij enzym en vrij product'. Enzymatische reacties hebbenop zichzelf geen invloed op de globale structuur van enzymen: De eiwitketens,opgebouwd uit 20 verschillende soorten aminozuren, zijn en blijven opgevouwen in eenspecifieke drie-dimensionale structuur, die voor elk eiwit is geoptimaliseerd voor hetkatalyseren van een specifiek proces. In het klassieke biochemische model kunnen tijdensde reactie wel locale veranderingen in de eiwitstructuur optreden, b.v. als gevolg vaninteracties met het substraat, maar heeft het enzym in principe een starre structuur. In delaatste 25 jaar is echter uit experimenten een heel ander beeld ontstaan: Veel eiwittenbezitten een (deels) flexibele structuur waarbij bewegingen van kleinere of grotere delenvan het eiwit kunnen leiden tot verschillende eiwitconformaties. Een interessante vraagdie hieruit oprijst, is welke rol het dynamisch gedrag van enzymen speelt tijdens hetkatalytisch proces.
Fluorescente flavo-enzymen
Een interessante klasse van enzymen voor studies naar de rol vanconformatiedynamica in de katalytische functie, zijn de flavo-enzymen. Flavo-enzymenzijn betrokken bij tal van processen in de cel. Flavo-enzymen bevatten als hulpstof(cofactor) in het enzym een molecuul afgeleid van riboflavine, een stof beter bekend alsvitamine B2. De meest voorkomende vormen van dit molecuul zijn flavine-mononucleotide (FMN) en flavine-adenine-dinucleotide (FAD) (zie Figuur 1.5 inhoofdstuk 1). Zowel uit biochemisch als uit biofysisch oogpunt is het belangrijksteonderdeel van de flavinecofactoren de zogenaamde isoalloxazinering ofwel flavine-ring.

Nederlandse samenvatting
208
Flavo-enzymen kunnen chemische reacties katalyseren doordat zij hiermee tijdens dekatalyse elektronen kunnen opnemen van één substraat ('reductie van het geoxideerdeflavine') en deze vervolgens doorgeven ('oxidatie van het gereduceerde flavine') naar eentweede substraat, zodat er een product wordt gevormd. De flavine-ring bevindt zich danook in het hart van het zogenaamde 'actieve centrum' van het enzym, daar waar hetkatalytisch proces plaatsvindt.
Wat flavo-enzymen nu zo bijzonder interessant maakt, is dat de flavine-ring vannature fluorescent is. Fluorescentie kan ontstaan wanneer een daarvoor gevoelig molecuulwordt beschenen met licht, waarbij het molecuul lichtenergie opneemt (absorptie) zodathet in een 'aangeslagen toestand' terechtkomt. Moleculen in de aangeslagen toestandwillen het liefste snel terug naar hun uitgangstoestand, een proces dat relaxatie wordtgenoemd. Een van de manieren waarop dit kan plaatsvinden is door middel van hetuitzenden van lichtenergie, ofwel fluorescentie. Als één van de zeer weinige stoffen,kunnen flavines groen licht uitzenden. Dit maakt het mogelijk om met behulp vanfluorescentietechnieken heel specifiek processen in het actieve centrum van flavo-enzymen te bestuderen.
De dynamische flavo-enzymen in dit onderzoek
Het onderzoek beschreven in dit proefschrift was erop gericht om meer inzicht tekrijgen in de dynamica van het actieve centrum van flavo-enzymen door middel vanfluorescentietechnieken. Hierbij is veel aandacht geschonken aan de wijze waarop defluorescentie-eigenschappen van flavo-enzymen en flavines in verband kunnen wordengebracht met hun structuur en functie. In dit onderzoek staan drie flavo-enzymencentraal; glutathion-reductase, thioredoxine-reductase en parahydroxybenzoaat-hydroxylase.
Glutathion-reductase (GR) is een voorbeeld van een flavo-enzym waarbij eenrelatief kleine beweging van de eiwitketen belangrijk is voor de functie. Het enzymkatalyseert de omzetting van geoxideerd glutathion naar gereduceerd glutathion engebruikt hiervoor het hulpsubstraat NADPH. Gereduceerd glutathion heeft een zeerbelangrijke functie in b.v. tal van ontgiftingsprocessen in de cel. De structuur van hetenzym in kristalvorm, die werd opgehelderd met Röntgendiffractietechnieken, vertoontiets merkwaardigs: In GR wordt de toegang tot het actieve centrum geblokkeerd door eentyrosine-aminozuur, zodat de hulpstof NADPH niet in de buurt van de flavine-ring kankomen. Voor het optreden van de chemische reactie is het dus nodig dat dit tyrosine-residu opzij schuift, waardoor er een locale conformatieverandering optreedt.Kristalstructuren van het GR waaraan de hulpstof is gebonden, laten zien dat dit in de

Nederlandse samenvatting
209
praktijk ook kan gebeuren: Figuur 1.7 (hoofdstuk 1) toont een deel van de structuur vanhet actieve centrum van GR uit de bacterie Escherichia coli; nl. de FAD cofactor en detyrosine die op positie 177 in de eiwitketen zit (Tyr177), zowel in het vrije enzym(bovenste plaatje) als in het enzym in complex met de hulpstof (NADP+; ondersteplaatje).
Een veel grotere eiwitbeweging is cruciaal voor de functie van het enzymthioredoxine-reductase (TrxR) uit Escherichia coli. Dit enzym katalyseert de reductie vaneen klein eiwit, thioredoxine, met behulp van NADPH. Thioredoxine is o.a. betrokken bijde opbouw van DNA-componenten en eiwitvouwing. Merkwaardigerwijs, kan dekristalstructuur van TrxR maar een deel van het katalytisch proces verklaren. Door nu eenspecifiek gebied (domein) van het eiwit in computerbewerkingen te roteren, kon menechter precies een (theoretische) eiwitstructuur krijgen, die de rest van de reactie kanverklaren. Deze voorgestelde conformatieverandering is afgebeeld op de omslag van ditproefschrift: TrxR bestaat uit twee identieke eenheden (monomeren; in blauw enroodachtig, met de FAD-cofactoren in groen), die elk weer bestaan uit tweeeiwitdomeinen (lichtblauw met donkerblauw of rood met oranje). Op de achterzijde vanhet proefschrift is de kristalstructuur van het enzym afgebeeld (in iets vereenvoudigdevorm, en uitgaande van een variant van het enzym waarin aminozuur cysteine 138 isveranderd in een serine; TrxR C138S). Beide monomeren bevinden zich hier in dezogenaamde 'FO-conformatie'. De voorzijde toont TrxR C138S met één monomeeropnieuw in de FO-conformatie (de blauwe) en de andere in de FR-conformatie, waarbijhet rode eiwitdomein over 66° is geroteerd. De FR-conformatie bleek veel fluorescenterdan de FO-conformatie (zie hoofdstuk 4), wat op de kaft op een vrije wijze tot expressieis gebracht.
In het derde enzym, parahydroxybenzoaat hydroxylase (PHBH), speelt een heelander type beweging een rol. In PHBH kan de flavine-ring van het FAD zelf bewegen.Kristalstructuurbepalingen van enzym/substraat(analoog)-complexen met natuurlijkPHBH en mutanteiwitten waarin het residue tyrosine 222 werd vervangen, lieten tweeverschillende conformaties zien; de 'in'-conformatie, met de flavine-ring gelocaliseerd inhet actieve centrum van het enzym, en de 'uit'-conformatie, waarin de flavine-ringverschoven is naar een positie meer aan het oppervlak van het eiwit. Een illustratiehiervan is gegeven in Figuur 1.9 (hoofdstuk 1) waarin het flavine in de 'in'-conformatie isweergegeven in zwart, en in de 'uit'-conformatie in wit. PHBH speelt een rol bij deafbraak van houtcomponenten door bodembacteriën.

Nederlandse samenvatting
210
Nieuwe mechanismen voor fluorescentiequenching en -depolarisatie inflavo-enzymen
Het dynamisch gedrag van Escherichia coli GR is in hoofdstuk 2 bestudeerd metbehulp van fluorescentielevensduurmetingen. In deze experimenten wordt het flavine inhet enzym aangeslagen met een zeer korte lichtpuls (<10-11 s) waarna het fluorescentie-intensiteitsverval van het flavine wordt gevolgd in de tijd (~10-11 - ~10-8 s). Het natuurlijkenzym werd vergeleken met gemuteerde vormen van het enzym, waarin het aminozuurtyrosine 177 dat in de enzymstructuur de ingang van het actieve centrum blokkeert, werdvervangen door een fenylalanine (GR Y177F) of een glycine (GR Y177G).Fluorescentielevensduurmetingen aan het natuurlijk enzym lieten een extreem snelledoving ('quenching') van de fluorescentie zien. Hierbij konden maar liefst vijftijdconstanten voor quenching (fluorescentie-levensduren) worden onderscheiden,waarvan een extreem korte fluorescentieduur (7 x 10-12 s) sterk overheerste. Defluorescentie van de mutanten GR Y177F en GR Y177G vertoonde eveneens eencomplex intensiteitsverval, maar de extreem snelle fluorescentiequenching ontbrak. Opbasis van de fluorescentie-quenching in de mutantenzymen en het feit dat de langerefluorescentielevensduren sterk overeenkwamen met die in het natuurlijk GR, kon wordengeconcludeerd dat er, naast tyrosine 177, ook andere aminozuren in het enzym kunnenbijdragen aan fluorescentiequenching, zonder dat daarvoor verschillende conformatiesvan het enzym aanwezig hoeven te zijn (de tot dan toe algemeen gebruikte wetenschap-pelijke verklaring voor complexe fluorescentielevensduurverdelingen). Dit mechanismevoor fluorescentiequenching, het 'multiple quenching sites'-model genaamd, was eerdergepostuleerd op basis van theoretische studies, maar experimenteel bewijs hiervoor wasnog niet eerder geleverd. Ook de studies aan de enzymen TrxR (hoofdstuk 4) en PHBH(hoofdstuk 5) bevestigden de geldigheid van dit 'multiple quenching sites'-model.
De fluorescentielevensduurstudie aan GR bood tevens inzicht in het moleculairemechanisme van fluorescentiequenching, en wierp (tezamen met andere studies) eennieuw licht op het begrip 'niet-fluorescente flavo-enzymen'. Door het toegenomentijdoplossend vermogen van de fluorescentietechnieken kan nu fluorescentie gedetecteerdworden van enzymen waarvan de fluorescentie zo extreem snel gedoofd wordt, dat menvroeger aannam dat ze niet fluoresceerden. Uit vergelijking van de structuren vanvoorheen 'niet-fluorescente' enzymen bleek dat in veel van deze enzymen één ofmeerdere tryptofaan- en/of tyrosine-aminozuren in de directe nabijheid van het flavinezijn gepositioneerd. Eerder al werd aangetoond dat in een enzym waarin een tryptofaanvlakbij het flavine zit, flavinefluorescentiequenching kan optreden doorelektronoverdracht van die tryptofaan naar het flavine dat zich in de (door licht)

Nederlandse samenvatting
211
aangeslagen toestand bevindt. De studie aan natuurlijk GR heeft aangetoond dat deextreem snelle fluorescentiequenching hier waarschijnlijk wordt veroorzaakt doorelektron-overdracht van tyrosine 177 naar het flavine in de aangeslagen toestand. Zeerrecentelijk is in studies door andere onderzoekers dit fluorescentiequenching-mechanismevoor tyrosine-bevattende flavo-enzymen bevestigd met behulp van andere technieken.
Fluorescentiedepolarisatie-experimenten, waarin gekeken wordt naar deverandering van de polarisatierichting van het fluorescentielicht in de tijd, hebben voor E.coli GR tot opmerkelijke resultaten geleid op basis waarvan een nieuw mechanisme voorflavinefluorescentiedepolarisatie is voorgesteld (hoofdstuk 3). Fluorescentiedepolarisatiebleek plaats te vinden als gevolg van twee processen; intramoleculaire energieoverdrachttussen de beide flavines in het enzym (een proces met een kleine bijdrage), en eendominant proces dat leidt tot een snelle depolarisatie van het fluorescentielicht. Dit laatsteproces werd eerder bij het humaan enzym geïnterpreteerd als locale beweeglijkheid vande flavine-ring, geheel in lijn met de gangbare fluorescentietheorieën. Een dergelijke'beweeglijkheid van het flavine' kon echter niet worden opgemerkt in de gemuteerdeenzymen GR Y177F en GR Y177G, hoewel fluorescentielevensduur-metingen haddenaangetoond dat de structuur van het actieve centrum van beide mutantenzymen flexibeleris dan die van het natuurlijke enzym. Op basis van bindingsstudies van het natuurlijkeenzym met substraatanalogen en experimenten bij verschillende temperaturen en bijverschillende viscositeit, is een mechanisme voorgesteld waarbij fluorescentie-depolarisatie het gevolg is van een directe interactie tussen het flavine en de nabijgelegentyrosine: Na de opname van licht (absorptie) ontstaat er tijdelijk een interactie tussen hetflavine en de tyrosine, waarbij ladingsoverdracht plaatsvindt. Als gevolg van dezeinteractie verschuift de richting van het emissiedipoolmoment, waardoorfluorescentiedepolarisatie kan optreden. Vergelijking met de fluorescentie-eigenschappenvan een verwant flavo-enzym laat zien dat het voorgestelde mechanisme wellicht ook eenalgemenere geldigheid heeft.
Op zoek naar de grenzen van tijdresolutie en ensembledetectie
Het onderzoek aan GR toont aan dat niet iedere fluorescentielevensduur afkomstighoeft te zijn van één specifieke eiwitconformatie. Er kan zelfs sprake zijn van hettegendeel. Zelfs in eiwitten waar duidelijk bewijs is voor het bestaan van verschillendeconformaties, kan het moeilijk -zo niet onmogelijk- zijn deze met behulp vanfluorescentielevensduurmetingen te detecteren. Een dergelijke complicatie deed zich voorin hoofdstuk 4 bij E. coli TrxR. In aanvulling op de eerdergenoemde kristalstructuurwaren indicaties voor het bestaan van twee enzym-conformaties (FO (de kristalstructuur)

Nederlandse samenvatting
212
en FR (de ‘geroteerde’ structuur)) in oplossing verkregen uit vergelijking van absorptie-en fluorescentiespectra van natuurlijk TrxR en TrxR C138S, en uit fluorescentietitratiesvan beide enzymen met het thiolreagens fenylkwikacetaat en de cofactoranaloog3-aminopyridine-adenine-dinucleotide. Hoewel de fluorescentie-intensiteit van deverschillende enzym/substraat(analoog)-complexen sterk varieerde, bleken defluorescentielevensduur-verdelingen nagenoeg identiek. Alleen door het gebruik vangeavanceerde fluorescentiemethodieken met een zeer groot tijdoplossend vermogen(~10-13 s) in combinatie met tijdopgeloste spectrale data, konden zowel de FO- als de FR-conformatie aangetoond en gekarakteriseerd worden. Daar de langlevende fluorescentievolledig afkomstig is van enzymen in de FR-conformatie, blijven bij standaardtijdopgeloste fluorescentie-experimenten met een tijdoplossend vermogen van ~10-11 s -~10-9 s de moleculen in de FO-conformatie buiten beeld. Door tijdopgelosteflavinefluorescentiemetingen te combineren met absorptiespec-tra, fluorescentie-intensiteitsspectra en circulair-dichroïsme-spectra, werd inzicht verkregen in dedynamische eigenschappen van het enzym en het conformatie-evenwicht. Een opvallendoplosmiddeleffect werd waargenomen in hoge concentraties glycerol; dezeomstandigheden induceren voor TrxR C138S een domeinrotatie van de FO- naar de FR-conformatie. Het onderzoek aan TrxR toont aan dat een zeer hoge tijdresolutie niet alleeneen voorwaarde is voor het bestuderen van 'niet-fluorescente' eiwitten, maar ookbelangrijk is voor het volledig karakteriseren van meer fluorescente eiwitten. In hetfluorescentie-onderzoek is de tijd nu aangebroken om aanwijzingen voor zeer snelleprocessen niet langer te negeren, maar ze volledig the bestuderen.
Zelfs met fluorescentietechnieken met een zeer hoge tijdresolutie kan deaanwezigheid van verschillende eiwitconformaties echter niet altijd worden aangetoond.Een illustratie hiervan is het onderzoek aan PHBH in hoofdstuk 5.Kristalstructuurbepalingen aan verschillende enzym/substraat-complexen lieten tweeverschillende conformaties voor het flavine zien; de 'in'-coformatie en de 'out'-conformatie. Tijdopgeloste fluorescentiemetingen aan deze enzym/substraat-complexenleverden echter vergelijkbare fluorescentielevensduur-verdelingen op. De voornaamsteoorzaak hiervan ligt in de structuur van het actieve centrum van PHBH, waarinverschillende potentiële quenching sites (met name een tryptofaan residu en drietyrosines) zich dicht (< 10-9 m) bij het flavine bevinden. In de 'in'- en 'uit'-conformatiesverschilt de kortste afstand van deze residuen tot het flavine gemiddeld maar weinig,zodat de residuen bij kunnen dragen aan de fluorescentiedoving in beideenzymconformaties. Daar komt nog bij, dat binding van een aromatisch substraat zelf totzeer efficiënte fluorescentiedoving leidt. Als gevolg hiervan kan de 'in' of 'uit'-

Nederlandse samenvatting
213
conformatie in de enzym/substraat-complexen enkel afgeleid worden uit de langerefluorescentielevensduren, waarvan de relatieve bijdrage (t.o.v het snellefluorescentiedovingsproces) slechts gering is. Hoewel het flavine in het vrije enzymwaarschijnlijk flexibel kan bewegen, kunnen ook fluorescentielevensduurmetingen aanvrij enzym geen inzicht bieden in de verschillende conformaties. Aangezien metconventionele fluorescentietechnieken gemeten wordt aan een groot aantal moleculentegelijk, toont de fluorescentielevensduur-verdeling van het vrije enzym een gemiddeldbeeld van alle situaties in alle moleculen tezamen (ensemble gemiddelde).Levensduurpatronen behorende bij de 'in'- en de 'uit'-conformatie worden hieringemengd. Dergelijke beperkingen kunnen worden overwonnen met behulp van nieuwontwikkelde fluorescentiemethoden die de fluorescentie van één enkel molecuul kunnendetecteren.
Van metingen aan ensembles naar een enkel molecuul
De overgang van klassieke metingen aan een grote hoeveelheid moleculen naarmetingen op het niveau van een enkel molecuul vraagt niet alleen om nieuwetechnologieën, maar ook om begrip van de processen en interacties die zich op dat niveauafspelen. Met behulp van computersimulaties kan inzicht verkregen worden in dedynamica van een enkel molecuul op atomair niveau. In dit proefschrift wordt inhoofdstuk 6 een verband gelegd tussen de tijdopgeloste fluorescentie-eigenschappen vaneen verzameling moleculen en de moleculaire dynamica van een enkel molecuul. Hiertoewordt uitgegaan van een vereenvoudigd systeem; nl. de FAD cofactor, die zowel een'open' (gestrekte) als een 'gesloten' (dubbelgevouwen) conformatie kan aannemen. Defluorescentielevensduurverdeling van FAD met twee dominante componenten – één zeerkorte (~10-11 s) en een wat langere (~10-9 s) – kan worden verklaard op grond van desimulatieresultaten; conformaties waarin de flavine-ring en de adenine-ring van het FADmolecuul evenwijdig boven op elkaar liggen (coplanar stacking) bieden een goede basisvoor zeer snelle fluorescentiedoving (corresponderend met de zeer kortelevensduurcomponent) waarschijnlijk als gevolg van lichtgeïnduceerde elektronen-overdracht van het adenine naar het flavine in deze 'gesloten' toestand. Overgangen vande gestrekte 'open' toestand naar een 'gesloten' toestand vonden in vrijwel alle gevallenplaats op de tijdschaal van de levensduur van de aangeslagen toestand, en leverden eentheoretische fluorescentielevensduur op in de orde van grootte van de experimenteelwaargenomen lange fluorescentielevensduur. In het FAD blijken veel conformatie-overgangen te worden bepaald door sterk samenwerkende netwerken van

Nederlandse samenvatting
214
waterstofbruggen in de ribityl-pyrophosphate-ribofuranosylketen die de flavine- en deadenine-ring van het molecuul verbindt.
Een ander belangrijk aspect voor het begrip experimenten op het niveau van eenenkel molecuul is grondige kennis van de fluorescentie-eigenschappen van defluorescente groep onder de daar gangbare omstandigheden. Het feit dat bij de hogelichtintensiteit zoals gebruikt in dergelijke experimenten de fluorescentie-eigenschappensignificant kunnen afwijken van de normaliter gemeten waarden, wordt geïllustreerd inhoofdstuk 7. In deze verkennende studie wordt Fluorescentie Correlatie Spectroscopiegebruikt om de fluorescentie-eigenschappen van de flavinecofactoren FMN en FAD enhet enzym lipoamide-dehydrogenase op het niveau van een enkel molecuul te testen. Defotofysische eigenschappen van de flavine-ring blijken experimenten op het niveau vaneen enkel te bemoeilijken. Met name bij FMN resulteert de hoge triplet-kwantumopbrengst al snel in een onherstelbaar verlies van fluorescentie (photobleaching)voor veel van de moleculen. Waarschijnlijk speelt intramoleculaire fotoreductie gevolgddoor afbraak van de fluorescente groep, hierbij een rol. Voor het enzym lipoamide-dehydrogenase leidt het gebruik van hoge lichtintensiteiten waarschijnlijk tot het loslaten(dissociatie) van de flavinecofactor. De fotofysische en fotochemische beperkingen vanhet flavinemolecuul zoals waargenomen in deze verkennende studie doen vermoeden dathet onderzoeken van conformatiedynamica van eiwitten door middel van flavine-fluorescentie op het niveau van een enkel molecuul, een wetenschappelijk uitdagende,maar geen gemakkelijke onderneming zal zijn.
Een blik in de toekomst
De resultaten van het onderzoek zoals hier samengevat worden in hoofdstuk 8bediscussieerd in het licht van recente wetenschappelijke ontwikkelingen. Tevens wordthet blik gericht op de toekomst van het onderzoek naar conformatiedynamica vaneiwitten met behulp van fluorescentietechnieken. Zeker hierbij is dat de spectaculaireontwikkelingen van de afgelopen paar jaar op het gebied van fluorescentiedectectie vaneen enkel molecuul zullen leiden tot algemene toepassing van deze methoden bij hetonderzoek naar conformatiedynamica. Enkele van deze nieuwe technieken waarvan in detoekomst op het gebied van de conformatiedynamica veel verwacht kan worden, wordenbesproken in hoofdstuk 8. Hoewel de nadruk wellicht komt te liggen op studies op hetniveau van een enkel molecuul, zal er naar verwachting een belangrijke rol blijven voorfluorescentiemethoden op basis van ensembledetectie. Naast een betrouwbare bron voorinformatie over de gemiddelde eigenschappen van biomoleculen, zijn deze techniekenook onmisbaar voor onderzoek op tijdschalen die (nog) niet toegankelijk zijn voor de

Nederlandse samenvatting
215
detectie van een enkel molecuul. Met name op de zeer korte tijdschalen (~10-13 s – ~10-11
s) begint men nu pas inzicht te krijgen in fysische, elektronische en dynamischeprocessen in biomoleculen met conventionele methoden. Daarnaast is het waarschijnlijkniet mogelijk om enkel-molecuul-fluorescentie te gebruiken voor alle vraagstellingen. Zois het lastig om in een eiwit een additionele fluorescente groep in te bouwen vlak bij hetactieve centrum, zonder de structuur, dynamica en functie van het enzym zelf tebeïnvloeden. Voor dynamische processen in het actieve centrum van enzymen blijftdetectie via de natuurlijke eigenschappen derhalve te prefereren, zelfs wanneer dit niet ophet niveau van een enkel molecuul kan. De mogelijkheden voor experimenten op hetniveau van een enkel molecuul op basis van natuurlijke fluorescentiedetectie zijn beperkt.Vanuit deze optiek blijven flavo-enzymen een bijzonder interessant onderwerp vanonderzoek, ondanks de fotofysische en fotochemische beperkingen van het molecuul.Nieuwe enkel-molecuul-fluorescentietechnieken die de kans op photobleaching beperkenen simultaan verschillende fluorescentie-eigenschappen registreren, kunnen hierbij in detoekomst een meer gedetailleerd beeld opleveren van de conformatiedynamica van flavo-enzymen in relatie tot de katalytische functie.


Curriculum vitae
Petra Anna Wilhelmina van den Berg werd geboren op 31 Augustus 1970 teLeende. In 1988 behaalde zij het Gymnasium B-diploma aan het Lyceum Augustinianumte Eindhoven. In de herfst van dat jaar startte zij met de studie MoleculaireWetenschappen aan Wageningen Universiteit. De doctoraalfase bevatte alsafstudeervakken een hoofdvak in de Biochemie (prof.dr. A.J.W.G. Visser en prof.dr. C.Veeger) en een hoofdvak in de Fysische Chemie en Kolloïdkunde (dr. W. Norde enprof.dr. J. Lyklema). Als stage werd een onderzoeksproject uitgevoerd bij de vakgroepBiofysische Chemie van de Katholieke Universiteit Nijmegen (prof.dr. C.W. Hilbers). Injuni 1994 behaalde zij het doctoraaldiploma Moleculaire Wetenschappen met speciali-saties in de fysisch-chemische, chemische en chemisch-biologische oriëntaties, met lof.
Van juli 1994 tot januari 1999 was zij als onderzoeker-in-opleiding (OIO)werkzaam bij het Laboratorium voor Biochemie aan Wageningen Universiteit, onderbegeleiding van prof.dr. A.J.W.G. Visser en supervisie van prof.dr. N.C.M. Laane. Hetpromotieonderzoek werd gefinancierd door het gebied Chemische Wetenschappen vanNWO. Delen van het promotieonderzoek voerde ze uit in het Department ofBiochemistry van het Centre for Molecular Recognition van de University of Cambridgete Engeland (prof.dr. R.N. Perham; reisbeurs vanuit het EU-programma voor HumanCapital and Mobility: ‘Flavoproteins, Structure and Activity’), in het Department ofMedical Biophysics van het Karolinska Institute te Stockholm (prof.dr. R. Rigler;EMBO-beurs), en in de Moleculaire Dynamica groep van het Laboratorium voorBiofysische Chemie van de Rijksuniversiteit Groningen (prof.dr. H.J.C. Berendsen enprof.dr. A.E. Mark; NWO-beurs).
Naast haar promotieonderzoek was zij van medio 1995 tot medio 1998 actiefbinnen de Dienstcommissie Projectmedewerkers van NWO, waarvan lange tijd binnenhet bestuur. Sinds januari 1999 is zij werkzaam bij de Universiteit Leiden alsbeleidsmedewerker onderzoek & beheer voor het Leids Instituut voor Chemischonderzoek.


Publicaties
Pap, E.H.W., P.I.H. Bastiaens, J.W. Borst, P.A.W. van den Berg, A. van Hoek, G.T.Snoek, K.W.A. Wirtz, and A.J.W.G. Visser. 1993. Quantitation of theinteraction of protein kinase C with diacylglycerol and phosphoinositides bytime-resolved detection of resonance energy transfer. Biochemistry 32, 13310-13317.
Pap, E.H.W., P.A.W. van den Berg, J.W. Borst, and A.J.W.G. Visser. 1995. Theinteraction between protein kinase C and lipid cofactors studied bysimultaneous observation of lipid and protein fluorescence. J. Biol. Chem.270, 1254-1260.
Buijs, J., P.A.W. van den Berg, J.W.Th. Lichtenbelt, W. Norde, and J. Lyklema. 1996.Adsorption dynamics of IgG and its F(ab’)2 and Fc fragments studied byreflectometry. J. Colloid Interface Sci. 178, 594-605.
van den Berg, P.A.W., A. van Hoek, C.D. Walentas, R.N. Perham, and A.J.W.G.Visser. 1996. Time-resolved flavin fluorescence quenching in E. coliglutathione reductase. In: Flavins and flavoproteins 1996, K.J. Stevenson, V.Massey, and C.H. Williams, Jr., (Eds.), University of Calgary Press, Calgary,pp. 697-700.
van den Berg, P.A.W., A. van Hoek, C.D. Walentas, R.N. Perham, and A.J.W.G.Visser. 1998. Flavin fluorescence dynamics and photoinduced electrontransfer in Escherichia coli glutathione reductase. Biophys. J. 74, 2046-2058.
Visser, A.J.W.G., P.A.W. van den Berg, N.V. Visser, A. van Hoek, H.A. van denBurg, D. Parsonage, and A. Claiborne. 1998. Time-resolved fluorescence offlavin adenine dinucleotide in wild-type and mutant NADH peroxidase.Elucidation of quenching sites and discovery of a new fluorescencedepolarization mechanism. J. Phys. Chem. 102, 10431-10439.
van den Berg, P.A.W., J. Widengren, M.A. Hink, R. Rigler, and A.J.W.G. Visser.2001. Fluorescence correlation spectroscopy of flavins and flavoenzymes:photochemical and photophysical aspects. Spectrochim. Acta A 57, 2135-2144.

Publicaties
220
van den Berg, P.A.W., and A.J.W.G. Visser. 2001. Tracking molecular dynamics offlavoproteins with time-resolved fluorescence spectroscopy. In: New trends influorescence spectroscopy. Applications to chemical and life sciences, B.Valeur & J.C. Brochon (Eds.), Springer, Berlin, pp. 457-485.
van den Berg, P.A.W., S.B. Mulrooney, B. Gobets, I.H.M. van Stokkum, A. vanHoek, C.H. Williams, Jr., and A.J.W.G. Visser. 2001. Exploring theconformational equilibrium of E. coli thioredoxin reductase: characterizationof two catalytically important states by ultrafast flavin fluorescencespectroscopy. Protein Sci. 10, 2037-2049.
Visser, A.J.W.G., P.A.W. van den Berg, M.A. Hink, and V.N. Petushkov. 2001.Fluorescence correlation spectroscopy of flavins and flavoproteins. In:Fluorescence correlation spectroscopy. Theory and application, R. Rigler &E.L. Elson, (Eds.), Springer, Heidelberg, pp. 9-24.
van den Berg, P.A.W., K.A. Feenstra, A.E. Mark, H.J.C. Berendsen, and A.J.W.G.Visser. 2002. Dynamic conformations of flavin adenine dinucleotide:simulated molecular dynamics of the flavin cofactor related to the time-resolved fluorescence characteristics. J. Phys. Chem. B, in press.

Nawoord
‘Time is just a restriction of physical presence’, een citaat van de natuurkundigeFeynman dat ik, kort na het begin van mijn promotieproject, zomaar aantrof op het bordin de laserkelder. Het intrigeerde me direct; sloeg dit citaat niet prachtig op mijnonderzoek naar conformatiedynamica met behulp van tijdopgeloste fluorescentie, waarbijje functionele bewegingen in eiwitten kunt zien als een gerichte opeenvolging vanfysieke interacties tussen atomen en (delen van) moleculen, elk met hun eigenkarakteristieke tijdsduur.
Hoezeer het citaat uiteindelijk ook van toepassing zou zijn op het verloop van hetpromotietraject en het schrijven van dit boekje in het bijzonder, kon ik toen nog nietvermoeden. Pas nu, met het verschijnen van dit proefschrift komt mijn tijd alspromovendus aan de vakgroep Biochemie te Wageningen ten einde. Naast de 'physicalpresence' op de verschillende verdiepingen van het Transitorium, die ook de laatste jarennog geregeld kon worden opgemerkt, was daar met name de mentale verbondenheid.Misschien kan die nog het beste worden vervat in ‘Time is just a restriction of mentalpresence’.
Al met al is het een fantastische tijd geweest! Graag wil ik iedereen bedanken diehier op zijn of haar manier aan heeft bijgedragen. Allereerst en bovenal mijn begeleider,prof. Ton Visser. Ton, dank voor alles wat je me hebt geleerd. Je hebt me alle vrijheidgegeven om mijn eigen weg te gaan en ideeën uit te proberen, maar je wist op het juistemoment ook weer die suggestie aan te dragen of dat contact te leggen, waarmee ik verderkon komen. Ik hoop dat het Microspectroscopiecentrum in Wageningen en jedeeltijdhoogleraarschap in Amsterdam je nog veel vreugdevolle fluorescentie-avonturenzullen opleveren. Prof. Colja Laane wil ik hartelijk bedanken voor alle morele steun enhulp tijdens, en bij de afronding van dit onderzoek. Prof. Cees Veeger ben ik erkentelijkvoor de interesse in het onderwerp, en de mogelijkheid om het promotie-onderzoek in devakgroep Biochemie te starten.
Many collaborations in- and outside the Netherlands have contributed to theresearch described in this thesis. I'm glad that I now have the opportunity to thank allpeople involved. I am very much obliged to Prof. Charles Williams (University ofMichigan, USA). Dear Charles, thank you for your kind support in Cambridge, where we

Nawoord
222
first met during our stay in the laboratories of Prof. Perham. Once I found out aboutthioredoxin reductase, it seemed like the ideal research candidate. I am very happy thatthe study on your enzyme has indeed become an essential part of my thesis work. I wishyou all the best. The same applies to Scott Mulrooney, my American sparring-partner onthis project. Dear Scott, I think we have shown that an email collaboration can beproductive and enjoyable, even if you have met only once. Good Luck! Vital for thesuccessful outcome of this project was the use of the streak camera setup at the VrijeUniversiteit, Amsterdam. Ivo van Stokkum en Bas Gobets, hartelijk dank voor jullie hulpmet de analyses en apparatuur.
I would like to express my gratitude to Prof. Richard Perham, CambridgeUniversity UK, for the collaboration on E. coli glutathione reductase, and the hospitalityduring my more than pleasant 6 weeks stay in beautiful Cambridge. Trip, Iwan, Ashamand all others, thanks for advice on the protein purifications and the joint meetings fordinner and pub. Cambridge will remain a special place to me. Prof. Heiner Schirmer andKatja Becker (Heidelberg University, Germany) have provided me with fruitfulsuggestions and human erythrocyte glutathione reductase. Herzlichen Dank!
I thank Prof. Rudolf Rigler for the hospitality during the four months stay in totalat the Karolinkska Institute in Stockholm. Unfortunately, we could only set the very firststeps on the long road towards understanding conformational dynamics through single-molecule flavin fluorescence. Yet, I feel like I have learned for a lifetime. Jerker, Stefan,Per and others, thank you so much for your kind help and support. Kirsten, Victoria,Lucky and other room mates, I will never forget your pleasant company and our trips inthe Stockholm area. I can still see Skansen with the festivities around the may pole atmidsummer night, and the reindeers and candle-lit farms in the snow during theChristmas season.
Veel dank ben ik verschuldigd aan prof. Herman Berendsen, prof. Alan Mark enAnton Feenstra van de Moleculaire Dynamica groep van de Rijksuniversiteit Groningenvoor de plezierige samenwerking op het gebied van de simulaties aan FAD. Beste Anton,bijzonder dank voor het mij geduldig bijbrengen van alle grondbeginselen van deMoleculaire Dynamica en je onmisbare bijdrage aan de simulaties en analyses. Ik ben blijdat je het resultaat van onze spannende avonturen ook voor je eigen promotie hebtkunnen gebruiken. Succes bij de VU en met de tweeling!
De lange middagen in de laserkelder van het Transitorium heb ik met bijzonderveel plezier doorgebracht. Alleen in het donker, met de ‘groene en blauwe lijnen’ en demuziek; het schiep een sfeer van magie die me altijd bij zal blijven. Arie, bijzonder dankvoor je onmisbare hulp met de laseropstelling en je technische adviezen. Naast de

Nawoord
223
‘donkere kamer’ was daar ook de ‘koude kamer’, waarin ik maanden heb doorgebracht.Door al die zuiveringen van verschillende eiwitten ben ik me altijd een echtebiochemicus blijven voelen. Adrie, dank voor het mij bijbrengen van de fijne kneepjesder eiwitzuiveringen en enzymkinetiek! Willem, jouw ‘echt chemische’ kennis van al dieflavo-enzymen hield me op het rechte pad. Ik heb onze vele wetenschappelijke discussieszeer gewaardeerd. Vele collega AIO's, postdocs en analisten van 'Biochemie' hebbenbijgedragen aan een bijzonder plezierige AIO-tijd. Allen hiervoor dank! De AIO-weekenden en -etentjes, de pannekoeken en later pannenkoeken op dinsdag, en degezelligheid op het lab zal ik niet vergeten. In het bijzonder wil ik Annechien Hengeveld,Jan-Willem Borst en Mark Hink noemen, die respectievelijk als ‘labmaatjes’ en‘kamermaatje’ mijn wetenschappelijke en niet-wetenschappelijke belevenissen vandichtbij hebben meegemaakt. Koert en Liz, die als studenten hebben bijgedragen aan hetonderzoek, wil ik eveneens bedanken. Jullie hebben me zeker enige beginselen van deonderwijspsychologie bijgebracht. Last but not least gaat mijn dank uit naar Jan-Willem,Eward en Philippe die op mij als afstudeerstudent bij Biochemie, de vonk van defluorescentiespectroscopie ondoofbaar hebben laten overspringen.
In Leiden wil ik graag al mijn collega's hartelijk bedanken voor hun nimmeraflatende interesse en steun tijdens het afleggen van het ‘dubbeltraject’ in de laatste jaren.Een dubbeltraject, waarbij alle kameraadschap en steun van vrienden en familie vanonschatbare waarde is geweest Alle etentjes, uitjes, kroegbezoeken en ‘thee-avonden’met ‘therapeutische’ en andere gesprekken hebben zeker bijgedragen aan een goedeafloop. Alle vrienden bij wie het promotietraject ook wat langer duurde; door jullie wistik dat het mogelijk moest zijn! Pap, Mam, Leon, Iris, Frans en Tonny, voor jullie als‘buitenstaanders’ moeten de drijfveren van een wetenschapper af en toe wel heel curieusgeleken hebben. Vaak zagen jullie vooral ‘het afzien’, minder vaak alle pret envoldoening. Dank voor al jullie interesse en onvoorwaardelijke morele steun.
Lieve Peter, mijn wetenschappelijke avonturen hebben veel van ons gevraagd.Je weet dat ik het zonder je niet gered had. Ik hoop van ganser harte, dat we samen nogzeeën van tijd tegemoet gaan!
Petra A.W. van den BergExploring Conformational Dynamics of Flavoenzymes with Flavin FluorescenceRelaxation SpectroscopyThesis Wageningen University –With summary in DutchISBN: 90-5808-694-1
Cover: Free impression of the fluorescence characteristics of thioredoxin reductase(TrxR) in relation to the protein conformation. The back page presents the crystalstructure of TrxR C138S with both subunits in a hardly fluorescent conformation. Thefront page presents the structure of TrxR C138S with one subunit (orange/red one) in adomain-rotated fluorescent conformation (Chapter 4).
The research described in this thesis was carried out at the Laboratory of Biochemistry ofWageningen University, The Netherlands. The research was supported by theNetherlands Foundation for Chemical Research (CW) with financial aid from deNetherlands Organization for Scientific Research (NWO).
Copyright © 2002 by P.A.W. van den BergAll rights reserved
Copyright © 2022 FDOKUMEN