Concordant molecular and phenotypic data delineate new taxonomy and conservation priorities for the...
14
Concordant molecular and phenotypic data delineate new taxonomy and conservation priorities for the endangered mountain yellow-legged frog V. T. Vredenburg 1 , R. Bingham 1 , R. Knapp 2 , J. A. T. Morgan 3, , C. Moritz 1 & D. Wake 1 1 Department of Integrative Biology and Museum of Vertebrate Zoology, University of California, Berkeley, CA, USA 2 Sierra Nevada Aquatic Research Laboratory, University of California, Mammoth Lakes, CA, USA 3 Department of Plant and Microbial Biology, University of California, Berkeley, CA, USA Keywords amphibian decline; phylogeography; mitochondrial DNA; morphology; Rana muscosa; Rana sierrae. Correspondence V. T. Vredenburg, Department of Integrative Biology and Museum of Vertebrate Zoology, University of California, Berkeley, CA 94720, USA. Tel: +1 510 642 7960; Fax: +1 510 643 8238 Email: [email protected] Current address: Emerging Technologies, Department of Primary Industries and Fisheries, Animal Research Institute, LMB#4, Moorooka, Queensland, Australia 4105. Received 23 May 2006; accepted 3 August 2006 doi:10.1111/j.1469-7998.2006.00258.x Abstract The mountain yellow-legged frog Rana muscosa sensu lato, once abundant in the Sierra Nevada of California and Nevada, and the disjunct Transverse Ranges of southern California, has declined precipitously throughout its range, even though most of its habitat is protected. The species is now extinct in Nevada and reduced to tiny remnants in southern California, where as a distinct population segment, it is classified as Endangered. Introduced predators (trout), air pollution and an infectious disease (chytridiomycosis) threaten remaining populations. A Bayesian analysis of 1901 base pairs of mitochondrial DNA confirms the presence of two deeply divergent clades that come into near contact in the Sierra Nevada. Morphological studies of museum specimens and analysis of acoustic data show that the two major mtDNA clades are readily differentiated phenotypically. Accordingly, we recognize two species, Rana sierrae, in the northern and central Sierra Nevada, and R. muscosa, in the southern Sierra Nevada and southern California. Existing data indicate no range overlap. These results have important implications for the conservation of these two species as they illuminate a profound mismatch between the current delineation of the distinct population segments (southern California vs. Sierra Nevada) and actual species boundaries. For example, our study finds that remnant populations of R. muscosa exist in both the southern Sierra Nevada and the mountains of southern California, which may broaden options for management. In addition, despite the fact that only the southern California populations are listed as Endangered, surveys conducted since 1995 at 225 historic (1899–1994) localities from museum collections show that 93.3% (n =146) of R. sierrae populations and 95.2% (n =79) of R. muscosa populations are extinct. Evidence presented here underscores the need for revision of protected population status to include both species throughout their ranges. Introduction Amphibians are declining worldwide, and 32.5% of the world’s recognized amphibian species are classified as threa- tened (Stuart et al., 2004). These declines forecast the impending extinction of many species in the coming dec- ades. Many of these declines occur in protected areas and involve idiosyncratic causal agents and remain enigmatic. Causative factors include increased ultraviolet radiation (Blaustein et al., 1994), climate change (Pounds, Fogden & Campbell, 1999), introduction of non-native species (Kats & Ferrer, 2003), chemical contaminants (Boone & Bridges, 2003), emerging diseases (Daszak, Cunningham & Hyatt, 2003) and synergistic interactions among factors (Blaustein & Kiesecker, 2002; Pounds et al., 2006). With amphibian fauna in such peril, there is a new urgency to reverse declines. Both here and generally, for effective conservation, it is imperative that species and population boundaries are drawn correctly (Avise, 1989; Moritz, 1999, 2002). The mountain yellow-legged frog Rana muscosa was once abundant in the Sierra Nevada (California and Nevada, USA) and the disjunct Transverse Ranges in southern California (Grinnell & Storer, 1924; Stebbins & Cohen, 1995). Despite the fact that it occurs almost entirely on protected land, R. muscosa has declined precipitously, especially in the last three decades (Vredenburg, Fellers & Davidson, 2005). The geographically disjunct southern California populations have been delineated as a ‘distinct population segment’ and are federally listed as Endangered (Fish & Wildlife Service, 2002). In contrast, despite precipi- tous declines, Sierran populations are currently not classi- fied as protected. Factors implicated in these declines include introduced predators such as trout (Knapp & Matthews, 2000), disease (Rachowicz & Vredenburg, 2004) Journal of Zoology 271 (2007) 361–374 c 2007 The Authors. Journal compilation c 2007 The Zoological Society of London 361 Journal of Zoology. Print ISSN 0952-8369
-
Upload
independent -
Category
Documents
-
view
3 -
download
0
Transcript of Concordant molecular and phenotypic data delineate new taxonomy and conservation priorities for the...
Concordant molecular and phenotypic data delineate newtaxonomy and conservation priorities for the endangeredmountain yellow-legged frog
V. T. Vredenburg1, R. Bingham1, R. Knapp2, J. A. T. Morgan3,�, C. Moritz1 & D. Wake1
1 Department of Integrative Biology and Museum of Vertebrate Zoology, University of California, Berkeley, CA, USA
2 Sierra Nevada Aquatic Research Laboratory, University of California, Mammoth Lakes, CA, USA
3 Department of Plant and Microbial Biology, University of California, Berkeley, CA, USA
Keywords
amphibian decline; phylogeography;
mitochondrial DNA; morphology; Rana
muscosa; Rana sierrae.
Correspondence
V. T. Vredenburg, Department of Integrative
Biology and Museum of Vertebrate Zoology,
University of California, Berkeley, CA
94720, USA. Tel: +1 510 642 7960;
Fax: +1 510 643 8238
Email: [email protected]
�Current address: Emerging Technologies,
Department of Primary Industries and
Fisheries, Animal Research Institute,
LMB#4, Moorooka, Queensland, Australia
4105.
Received 23 May 2006; accepted
3 August 2006
doi:10.1111/j.1469-7998.2006.00258.x
Abstract
The mountain yellow-legged frog Rana muscosa sensu lato, once abundant in the
Sierra Nevada of California and Nevada, and the disjunct Transverse Ranges of
southern California, has declined precipitously throughout its range, even though
most of its habitat is protected. The species is now extinct in Nevada and reduced
to tiny remnants in southern California, where as a distinct population segment, it
is classified as Endangered. Introduced predators (trout), air pollution and an
infectious disease (chytridiomycosis) threaten remaining populations. A Bayesian
analysis of 1901 base pairs of mitochondrial DNA confirms the presence of two
deeply divergent clades that come into near contact in the Sierra Nevada.
Morphological studies of museum specimens and analysis of acoustic data show
that the two major mtDNA clades are readily differentiated phenotypically.
Accordingly, we recognize two species, Rana sierrae, in the northern and central
Sierra Nevada, and R. muscosa, in the southern Sierra Nevada and southern
California. Existing data indicate no range overlap. These results have important
implications for the conservation of these two species as they illuminate a
profound mismatch between the current delineation of the distinct population
segments (southern California vs. Sierra Nevada) and actual species boundaries.
For example, our study finds that remnant populations of R. muscosa exist in both
the southern Sierra Nevada and the mountains of southern California, which may
broaden options for management. In addition, despite the fact that only the
southern California populations are listed as Endangered, surveys conducted since
1995 at 225 historic (1899–1994) localities from museum collections show that
93.3% (n=146) of R. sierrae populations and 95.2% (n=79) of R. muscosa
populations are extinct. Evidence presented here underscores the need for revision
of protected population status to include both species throughout their ranges.
Introduction
Amphibians are declining worldwide, and 32.5% of the
world’s recognized amphibian species are classified as threa-
tened (Stuart et al., 2004). These declines forecast the
impending extinction of many species in the coming dec-
ades. Many of these declines occur in protected areas and
involve idiosyncratic causal agents and remain enigmatic.
Causative factors include increased ultraviolet radiation
(Blaustein et al., 1994), climate change (Pounds, Fogden &
Campbell, 1999), introduction of non-native species (Kats &
Ferrer, 2003), chemical contaminants (Boone & Bridges,
2003), emerging diseases (Daszak, Cunningham & Hyatt,
2003) and synergistic interactions among factors (Blaustein
& Kiesecker, 2002; Pounds et al., 2006). With amphibian
fauna in such peril, there is a new urgency to reverse
declines. Both here and generally, for effective conservation,
it is imperative that species and population boundaries are
drawn correctly (Avise, 1989; Moritz, 1999, 2002).
The mountain yellow-legged frog Rana muscosa was once
abundant in the Sierra Nevada (California and Nevada,
USA) and the disjunct Transverse Ranges in southern
California (Grinnell & Storer, 1924; Stebbins & Cohen,
1995). Despite the fact that it occurs almost entirely on
protected land, R. muscosa has declined precipitously,
especially in the last three decades (Vredenburg, Fellers &
Davidson, 2005). The geographically disjunct southern
California populations have been delineated as a ‘distinct
population segment’ and are federally listed as Endangered
(Fish & Wildlife Service, 2002). In contrast, despite precipi-
tous declines, Sierran populations are currently not classi-
fied as protected. Factors implicated in these declines
include introduced predators such as trout (Knapp &
Matthews, 2000), disease (Rachowicz & Vredenburg, 2004)
Journal of Zoology 271 (2007) 361–374 c� 2007 The Authors. Journal compilation c� 2007 The Zoological Society of London 361
Journal of Zoology. Print ISSN 0952-8369
and air pollution (Davidson, Shaffer & Jennings, 2002;
Davidson, 2004). In the absence of disease, extirpation of
introduced trout (which prey on frogs) leads to rapid
recovery of R. muscosa populations (Vredenburg, 2004).
Five species of trout (Salmonidae) have been widely intro-
duced into historically fishless habitats throughout the
entire range of the frog (Pister, 2001), and as a result
490% of historically fishless high Sierra habitats now
contain introduced, self-sustaining trout populations
(Knapp & Matthews, 2000). Although demographic effects
on population viability are already apparent, sound con-
servation efforts must also include an understanding of
species and population boundaries, as well as population
dynamics (Moritz et al., 2001; Moritz, 2002).
Rana muscosa is one of several western North American
frogs in the family Ranidae, subgenus Amerana (Dubois,
1992; Hillis & Wilcox, 2005; Frost et al., 2006). It is closely
related to several other species, known as the Rana boylii
group (R. boylii, Rana cascadae, Rana luteiventris, Rana
pretiosa, Rana aurora, Rana draytonii; Hillis & Wilcox,
2005). A wide range of data has been used to explore
relationships of this group, including morphometrics
(Camp, 1917; Zweifel, 1955), albumin immunology (Case,
1978), allozyme electrophoresis (Case, 1978; Green, 1986),
chromosomes (Green, 1986), restriction-enzyme cleavage
analysis of nuclear rRNA genes (Hillis & Davis, 1986), and
more recently mitochondrial DNA (Macey et al., 2001;
Hillis & Wilcox, 2005) and nuclear DNA (Frost et al.,
2006). Rana muscosa, the focus of this study, was originally
described as two subspecies of R. boylii based on morphol-
ogy (Rana boylii muscosa in the Transverse Ranges and
Rana boylii sierrae in the Sierra Nevada; Camp, 1917). On
the basis of additional morphological data, the two sub-
species were separated from R. boylii and raised to the
species level (R. muscosa; Zweifel, 1955), and the subspecies
were no longer recognized.
Evolutionary biologists typically use multiple datasets to
explore the evolutionary relationships and boundaries of
closely related species. In general, the case for delimiting
separate species is strongest when results from multiple sets
of independent classes of characters are concordant (Sites &
Marshall, 2003). Gene flow is expected to counter the
diversifying effects of genetic drift and local adaptation.
Thus, species containing non-contiguous ranges, such as
R. muscosa, are predicted to exhibit a higher degree of
population structure between non-contiguous areas than
within contiguous areas. In contrast to the current boundary
between southern California and Sierran populations, both
recent molecular (Macey et al., 2001) and largely ignored
morphological data (Camp, 1917; Zweifel, 1955) from
R. muscosa suggest discontinuity within the contiguous
range of the Sierra Nevada. To better understand the
evolutionary relationships of the remaining populations,
we (1) sequenced 1901 bp of mitochondrial DNA from
91 specimens (each representing a separate population)
collected throughout the entire range and used these
data to construct a molecular phylogenetic hypothesis
for R. muscosa across its historic range, (2) compared
16 morphological characteristics and four habitat-associated
characteristics from 232 museum specimens and (3) com-
pared male advertisement calls recorded in the Transverse
Ranges and the Sierra Nevada. On the basis of concordant
molecular, morphologic and acoustic results, we recognize
two diagnosable species-R. muscosa and Rana sierrae-and
for clarity we refer to them as such throughout this paper. To
ascertain the conservation status of these newly delineated
taxa, we quantify the extent of the decline in each species by
comparing recent (1995–2005) site occupancy to historic site
occupancy (1899–1994) at 225 sites distributed throughout
the Sierra Nevada and Transverse Ranges.
Materials and methods
Molecular phylogenetic analysis
For the molecular analysis, we obtained tissue samples
from one individual (adults and tadpoles) from each of
91 populations in California (Fig. 1; Table 1). Samples
included seven individuals from the Museum of Vertebrate
Zoology (MVZ) tissue bank (University of California Ber-
keley), eight from the California Academy of Sciences
(CAS) tissue bank and 76 collected as toes from live
individuals that were released after tissue collection; small
population sizes prevented voucher collections at all sites,
but tissues have been accessioned (MVZ accession #14139).
Of the 91 tissue samples used, sequences were obtained for
26 R. muscosa and 65 R. sierrae specimens from throughout
their historic ranges. In addition, sequences from single
specimens of three outgroup taxa were obtained from
Genbank (R. boylii, MVZ 148941, Genbank AF314019;
R. draytonii, MVZ 227645, Genbank AF314021; R. casca-
dae, MVZ 230719; Genbank AF314022).
Genomic DNA was extracted from frozen or ethanol-
preserved tissues (muscle, liver and tail fin from tadpoles)
using Qiagen DNeasy extraction kits (Qiagen Inc., Valencia,
CA, USA). The targeted mitochondrial DNA fragment
included the protein coding genes ND1 and ND2, interven-
ing tRNA genes and the tRNA genes flanking ND2 (Macey
et al., 2001). The entire DNA segment was amplified using
polymerase chain reaction (PCR) using primers designed for
this study (Table 2). PCRs were performed in a total volume
of 15 mL, including 0.38 mL Taq polymerase (5U mL�1),0.75 mL of each primer (10 mmolL�1), 0.28mL dNTPs
(40mM), 1.5mL of 10� buffer and 3.75mL of sample
DNA (3 ng mL�1). PCRs consisted of 29 cycles with a
denaturing temperature at 95 1C (30 s), annealing at 62 1C
(30 s) and extension at 72 1C (1min), and a final extension at
72 1C (10min). PCR products were purified using ExoSAP-
IT (USB Inc., Cleveland, OH, USA), and sequenced on an
ABI 3730 automated DNA sequencer with four overlapping
sets of internal primer pairs (Table 2). DNA sequences were
edited and aligned unambiguously using SequencherTM
version 4.2 (Gene Codes Corp., Ann Arbor, MI, USA).
Bayesian phylogenetic analyses were implemented using
MrBayes version 3.04b (Huelsenbeck & Ronquist, 2001).
Both partitioned and unpartitioned analyses were run
Journal of Zoology 271 (2007) 361–374 c� 2007 The Authors. Journal compilation c� 2007 The Zoological Society of London362
Phylogeography and decline of Rana muscosa and Rana sierrae V. T. Vredenburg et al.

because a single model of nucleotide substitution may not be
appropriate for the ND1 andND2 protein-coding genes and
flanking and intervening tRNA genes (Brandley, Schmitz &
Reeder, 2005). The appropriate model of sequence evolution
for each partition was selected using the Akaike information
criterion (AIC) implemented in MrModelTest (version 2.2)
[modified from Modeltest (Posada & Crandall, 1998) by
J. A. A. Nylander]. We ran the Bayesian analysis for
20 million generations and sampled every 1000 generations,
using four chains and default priors. Stationarity was
determined by plotting the likelihood values against genera-
tion time (Leache & Reeder, 2002), and a conservative
10 million generations were discarded as burn-in. The
remaining 10 million generations (10 000 samples) were
analyzed in PAUP� version 4.0b10 (Swofford, 1996) to
reconstruct the topology and calculate posterior probabil-
ities for each node. We used MEGA version 3.1 (Kumar,
Tamura & Nei, 2004) to calculate corrected pairwise
mtDNA sequence divergence.
To determine whether genetic variation among samples
was attributable to isolation by distance (IBD), among-
clade variation or a combination of the two, we estimated
the correlation between mtDNA sequence divergence and
geographical distance between samples with the program
IBD version 1.5 (Bohonak, 2002) using full and partial
Mantel tests (20 000 randomizations). We used uncorrected
50 miles
80 km
0
00.005 substitutions/site
(b)(a)
1
2
3
4
5
Rana sierrae
Rana muscosa
Rana boylii
Rana auroraRana cascadae
6
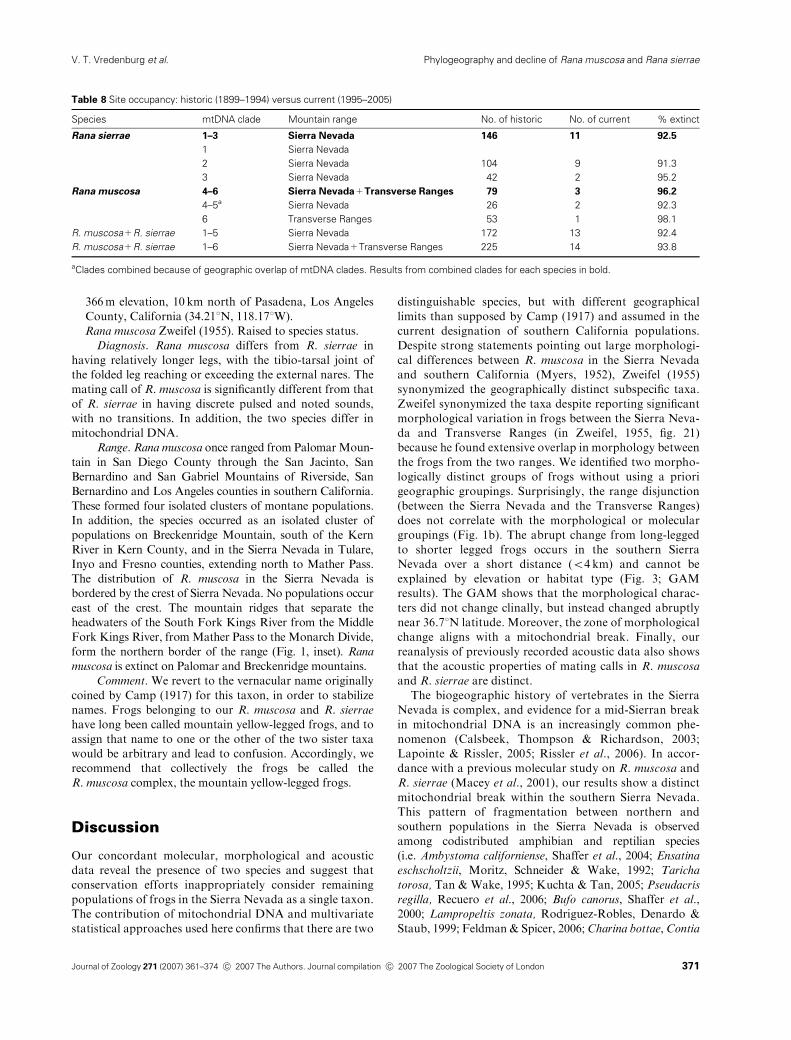
Figure 1 Collection locations of Rana muscosa and Rana sierrae used for genetic (a) and morphological (b) analyses. Bayes mtDNA phylogram,
nodes with & represent 495% posterior probabilities. Two major clades (R. muscosa, R. sierrae) and six minor clades (1–6) were identified from
the mtDNA analysis. The mtDNA contact zone (arrow) between the species is located between the Middle and South Forks of the Kings River
(inset). Morphological analysis identified two groups (b, green and red polygons) that are concordant with the major mtDNA clades, R. muscosa
and R. sierrae. Localities of type specimens are shown as stars and were included in the morphological analysis. The type for R. sierrae occurs
farther south than the others, and is separated from nearby R. muscosa by the crest of the Sierra Nevada (black line; inset).
Journal of Zoology 271 (2007) 361–374 c� 2007 The Authors. Journal compilation c� 2007 The Zoological Society of London 363
Phylogeography and decline of Rana muscosa and Rana sierraeV. T. Vredenburg et al.

Table 1 Populations sampled for the molecular phylogeny in this study
Specimen ID mtDNA clade Locality Latitude N Longitude W
VTV 075 1 Plumas County, Oliver Lake 39.98044 121.33
CAS 209386 1 Plumas County, Silver Lake 39.95894 121.1359
CAS 209404 1 Plumas County, Rock Lake 39.94134 121.1425
CAS 206093 1 Plumas County, Rock Creek 39.86452 121.0006
CAS 209370 1 Plumas County, Faggs Reservoir 39.84125 121.1868
CAS 209668 1 Plumas County, Pine Grove Cemetery 39.71904 120.8992
CAS 227640 2 Plumas County, Boulder Creek 40.25435 120.6028
CAS 227639 2 Plumas County, Lone Rock Creek 40.20039 120.6475
VTV 086 2 Sierra County, Haven Lake 39.6703 120.6329
CAS 203394 2 Sierra County, Independence Creek 39.48775 120.2842
VTV 062 2 Nevada County, Mossy Pond 39.3786 120.4692
VTV 999 2 Nevada County, Rattlesnake Creek 39.33535 120.4795
VTV 107 2 El Dorado County, Lake Zitella 38.9605 120.2254
VTV 139 2 El Dorado County, E of Pyramid Lake 38.8489 120.1390
VTV 152 2 El Dorado County, Middle Creek 38.7581 120.2496
VTV 061 2 El Dorado County, SF American River 38.6708 120.0337
VTV 060 2 El Dorado County, N of Granite Lake 38.6519 120.1103
VTV 110 2 Amador County, Tragedy Creek 38.6193 120.1674
VTV 065 2 Tuolumne County, near Tamarack Lake 38.6123 119.8913
VTV 114 2 Alpine County, Deadwood Creek 38.6004 119.9993
LJR 095 2 Alpine County, Little Indian Valley 38.59368 119.8854
MVZ 180163 2 Alpine County, Ebbetts Pass 38.52834 119.7757
MVZ 227662 2 Tuolumne County, Sonora Pass 38.33104 119.6547
MVZ 149008 2 Mono County, Leavitt Lake 38.26977 119.6172
VTV 1547 2 Mono County, Cascade Creek 38.19589 119.5798
VTV 1022 2 Tuolumne County, NE Long Lake 38.18231 119.7454
VTV 1550 2 Mono County, above Peeler Lake 38.1173 119.4614
LJR 1048 2 Tuolumne County, Conness Pond 37.9689 119.344
LJR 260 2 Tuolumne County, Mono Pass 37.8523 119.2195
Y-638 2 Tuolumne County, Kuna Basin 37.79426 119.2262
JAM 70 2 Mono County, Rodgers Lake 37.73335 119.2263
VTV 1552 2 Madera County, Thousand Island Lake 37.70423 119.2395
VTV 1560 2 Madera County, Minaret Creek 37.64667 119.1454
VTV 1938 3 Mono County, Dry Creek 37.882 118.8854
VTV 1101 3 Mono County, Thousand Island Lake Basin 37.7335 119.1931
RAK 4074 3 Madera County, Gray Peak Fork 37.68014 119.3994
RAK 294 3 Mariposa County, Lower Summit Meadow 37.6793 119.6477
Y-258 3 Madera County, Merced Pass 37.62278 119.4158
VTV 1100 3 Madera County, Gertrude Lake 37.6192 119.1468
RAK 4066 3 Tuolumne County, Saddle Horse Lake 37.61139 119.5767
VTV 1555 3 Inyo County, Birch Creek 37.52787 118.6765
VTV 1575 3 Fresno County, Mills Creek 37.40222 118.8235
RAK 2128 3 Fresno County, Big Bear Lake 37.33054 118.8014
RAK 1235 3 Inyo County, Gable Lakes 37.33035 118.7
VTV 1559 3 Inyo County, Horton Creek 37.31209 118.6745
VTV 979 3 Fresno County, Lake Camp Lake 37.25855 119.0544
RAK 123 3 Fresno County, Marmot Lake 37.25831 118.6829
VTV 987 3 Inyo County, Cow Creek 37.1759 118.4398
VTV 997 3 Inyo County, Baker Creek 37.1698 118.4691
VTV 2000 3 Fresno County, below Helen Lake 37.12197 118.642
VTV 2001 3 Fresno County, Wanda Lake 37.11941 118.6915
VTV 2002 3 Fresno County, Upper LeConte Lake 37.11428 118.6437
VTV 2003 3 Fresno County, Dusy Basin 37.09616 118.5535
RAK 2393 3 Fresno County, Upper Palisade Lake 37.03668 118.4728
RAK 100 3 Fresno County, below Upper Mills Creek Lake 37.03225 118.5957
RAK 2378 3 Fresno County, Observation Basin 37.02406 118.5426
RAK 3006 3 Fresno County, Amphitheater Basin 37.02305 118.5029
VTV 2004 3 Fresno County, Amphitheatre Basin 37.01347 118.4951
Journal of Zoology 271 (2007) 361–374 c� 2007 The Authors. Journal compilation c� 2007 The Zoological Society of London364
Phylogeography and decline of Rana muscosa and Rana sierrae V. T. Vredenburg et al.

pairwise genetic distances between samples (P), straightline
geographical distances between samples (G) and an indica-
tor (0,1) matrix (I) that identifies the minor genetic clade of
each sample (i.e. Spinks & Shaffer, 2005). To test for the
effect of IBD alone, we corrected the geographic genetic
matrix using the clade of origin (PG/I). To explore the
differentiation among drainages without the effects of IBD,
we corrected the genetic and indicator matrix by geographic
distance (PI/G).
Morphology
We made morphological measurements on 123 and 109
fluid-preserved specimens of R. muscosa and R. sierrae,
respectively, obtained from the MVZ collection (Supple-
mentary Material Appendix S1). All specimens were sexu-
ally mature (determination based on gonadal inspection
and/or development of secondary sexual characteristics).
The type specimens for R. muscosa (MVZ 771) and
R. sierrae (MVZ 3734) were included (Fig. 1b, stars). We
measured 16 morphometric characters for multivariate
analysis: snout-to-vent length (SVL), head length (HL),
head diameter (HD), snout length (SNL), internarial dis-
tance (IND), shortest eye-to-eye distance (IUE), longest eye-
to-eye distance (UEW), upper arm length (UAL), forearm
length (FAL), hand length (HaL), femur length (FL), tibia
length (TL), tarsus length (TaL), foot length (FoL), fourth
toe length (4thToe) and first toe length (1stToe). All mea-
surements were made to the nearest 0.1mm (with a digital
Table 1 Continued
Specimen ID mtDNA clade Locality Latitude N Longitude W
RAK 2695 3 Fresno County, Horseshoe Lakes 36.94396 118.572
RAK 3321 3 Fresno County, Slide Lakes 36.89487 118.6829
RAK 2737 3 Fresno County, Swamp Lakes 36.88851 118.7251
RAK 3489 3 Fresno County, above W Kennedy Lake 36.88753 118.6692
RAK 2727 3 Fresno County, near Granite Pass 36.8803 118.5997
RAK 2638 3 Fresno County, Granite Basin 36.86386 118.5989
VTV 1554 3 Inyo County, near Matlock Lake 36.76334 118.3551
RAK 2989 4 Fresno County, Upper Basin 37.02323 118.4561
RAK 2962 4 Fresno County, Upper Basin 37.02271 118.4589
RAK 1311 4 Fresno County, Upper Basin 37.01546 118.4729
RAK 1727 4 Fresno County, Upper Basin 37.0142 118.44
RAK 2162 4 Fresno County, N of Muro Blanco 36.93756 118.536
VTV 874 4 Fresno County, Pinchot Basin 36.9143 118.3964
RAK 671 4 Fresno County, Woods Lake Basin 36.8867 118.4002
MVZ 226112 4 Fresno County, Sixty Lake Basin 36.81409 118.4253
S 508 4 Tulare County, Golden Bear Lake 36.72808 118.36
RAK 606 4 Tulare County, Vidette Lakes 36.7244 118.4161
VTV 2005 4 Tulare County, NE of Mt Genevra 36.68959 118.4237
RAK 1776 4 Tulare County, SE of Mt Jordan 36.6759 118.4428
RAK 559 4 Tulare County, Wright Lakes Basin 36.62267 118.3473
RAK 3552 4 Tulare County, S of Milestone Basin 36.61524 118.4389
RAK 299 4 Tulare County, Hitchcock Lake Basin 36.56159 118.307
S 387 5 Tulare County, SE of Mt Genevra 36.67802 118.4244
S 376 5 Tulare County, SW of Lake South America 36.6627 118.4206
RAK 3924 5 Tulare County, Tyndall Creek 36.65296 118.3834
RAK 3584 5 Tulare County, Milestone Basin 36.64649 118.4501
VTV 1578 5 Tulare County, Mulkey Meadow 36.4024 118.2114
VTV 055 5 Tulare County, Bullfrog Lake 36.3982 118.5536
LJR 089 5 Tulare County, Laurel Basin 36.36813 118.4811
RAK 3713 5 Tulare County, Coyote Creek Basin 36.35824 118.4711
MVZ 230140 6 Los Angeles County, San Gabriel Mountains 34.3514 117.7101
MVZ 230142 6 San Bernardino County, San Bernardino Mountains 34.17718 117.1818
MVZ 230141 6 Riverside County, San Jacinto Mountains 33.77959 116.7746
Table 2 Primers used to amplify and sequence the mtDNA ND1,
ND2, tRNA1 and tRNA2 region in this study (see also Macey et al.,
2001)
Primer name Primer sequence (50 ! 30)
RanaF1 ATT TGT CTC CAC CCT CGC CGA
RanaF2 AAG CTA AAT AAG CTT TTG GGC C
RanaF3 CCC CAA TAA CAC TGC TTC TCC AA
RanaF4 CCC TTG AAT TAA TTA AAC AAA ACG C
RanaF1a GAA TCA GCG GGT GAA TAT CAC AG
RanaF2a GAG GGT TAT GGT AAT AAT GTA TGT
RanaF3a AAT TTT TCG AAG YTG TGT TTG GC
RanaF4a AGT AAA GGA AGG ATT TTA ACC AAC
aReverse primers.
Journal of Zoology 271 (2007) 361–374 c� 2007 The Authors. Journal compilation c� 2007 The Zoological Society of London 365
Phylogeography and decline of Rana muscosa and Rana sierraeV. T. Vredenburg et al.
calipers and, when necessary, a microscope) and were scored
by V. T. V. Symmetrical characters were scored on each
specimen’s left side.
To reduce the dimensionality of the set of morphological
measurements, we conducted principal components analysis
(PCA; JMP version 6, SAS Institute Inc.). Before analysis,
we evaluated assumptions of normality and homoscedasti-
city by examining the frequency distributions of each vari-
able (Sokal & Rohlf, 1981). To reduce the effects of body
size, we ran a regression for each morphological measure-
ment by SVL and then used the residuals in the PCA
analysis. We used multivariate discriminant function analy-
sis (JMP version 6, SAS Institute Inc.) to determine whether
morphological characteristics alone accurately differen-
tiated between specimens from the two major mtDNA
clades (as defined from the mtDNA phylogeny). As an
alternate comparison, we ran the same analysis using a
priori groupings based on mountain range (Sierra Nevada
vs. southern California). All analyses were conducted sepa-
rately for males and females.
Morphological variation is often a function of latitude
(Bergman’s rule: Walters & Hassall, 2006), but can also be
affected by other factors (e.g. sex, altitude). Therefore, we
described the change in morphological characters with
latitude after accounting for the effects of other significant
predictor variables. To do this we developed a generalized
additive model (GAM; i.e. Cleveland &Devlin, 1988; Hastie
& Tibshirani, 1991). On the basis of the results from the
PCA of morphological measurements, TL residuals had the
strongest effect on PCA eigenvalues. To make comparison
to previous work easier, we used the tibia: SVL ratio (TL/
SLV) used as the sole response variable to represent mor-
phology. This variable was also recognized by Camp (1917)
and Zweifel (1955) as important in distinguishing
R. muscosa populations from each other. The predictor
variables included latitude, elevation, habitat type (lotic or
lentic) and sex. We first built a full model containing all four
predictor variables, and then one by one removed variables
that did not significantly contribute to the model (P40.05,
based on a likelihood ratio test; Hosmer & Lemeshow, 1989)
to derive a final model containing only significant variables.
GAM analyses were conducted using S-Plus version 7.0
(Insightful Corp.).
Acoustics
Advertisement calls of R. muscosa and R. sierrae were
recorded in the field using a Sony WM-D6C stereo cassette
recorder (Sony., New York, NY, USA). Recordings were
made above and below water using a Deep Sea Power and
Light SM-1000 hydrophone (SM-1000., San Diego, CA,
USA). All frog calls were recorded in lentic habitats and
while calling frogs were either completely or partially sub-
merged. Calls were recorded fromR. muscosa populations in
Hall Canyon, Riverside County, CA (33.811N, 116.7781W;
recordings made on 23 May 1994). Calls for R. sierrae were
recorded at Summit Meadow, Yosemite National Park,
Mariposa County, CA (37.681N, 119.651W; recordings
made on 22 June 1993) and Ebbetts Pass, Alpine County,
CA (38.551N, 119.821W; recordings made on 1 July 1993).
To choose individual calls for analysis, we selected a
segment of each recording session that contained the entire
call repertoire present within that session. Calls were digi-
tized using a GWI-AMP analog-to-digital converter and
analyzed with MacSpeech Lab II (GW Instruments Inc.,
Cambridge, MA, USA).
Fourteen acoustic properties were measured: call rise
time, call duration, formant interval, loudest dominant
frequency, lowest dominant frequency, calculated pulse
rate, loudest five pulse rate, pulse rise time, total number of
pulses, tuning, note duration, note rise time, note rate and
pulses per note (as defined in MacTague & Northern, 1993;
Ziesmer, 1997). On the basis of spectrographic appearance,
we classified calls as having wave repetition patterns that
were ‘unpulsed,’ ‘semi-pulsed,’ ‘pulsed only’ or ‘noted.’
Unpulsed calls have a uniform waveform, while pulsed calls
contain several deamplified waves between the maximal
ones, and noted calls have pulses grouped into ‘notes’
(MacTague & Northern, 1993). Comparisons were made
between mean values of the acoustic properties for
R. muscosa and R. sierrae using a multivariate analysis of
variance (MANOVA; JMP version 5.1, SAS Institute). All
frog recordings and preliminary analysis were conducted as
part of a master’s thesis (Ziesmer, 1997) and were reana-
lyzed with the permission of the author.
Population decline
To describe the decline across the historic range of
R. muscosa, R. sierrae and the six minor clades discovered
in the mitochondrial phylogeny, we assessed the current
status of populations at historic localities identified using
museum collections (Shaffer, Fisher & Davidson, 1998). We
first mapped the collection locations for all specimens stored
at the MVZ and the CAS that were collected before 1995
(n=293 locations, collection year=1899–1994, med-
ian=1942). We then eliminated all historic localities that
represented the same water body or were separated from
other historic localities by o200m. This parsing procedure
reduced the number of historic locations to 274. Locality
information associated with each specimen was occasionally
insufficiently precise to identify the exact collection location.
Therefore, to ensure that each historic location included the
actual collection location, we took a conservative approach
and defined each historic locality as a circle centered on the
point representing our interpretation of the locality descrip-
tion and with a radius of 1 km.
For each historic locality, we determined whether frogs
were currently extant or extinct using data from extensive
surveys conducted between 1995 and 2004 at more than
14 000 water bodies within the historic range of R. muscosa
and R. sierrae. The surveys were coordinated by R. Knapp,
S. Lehr [California Department of Fish and Game (CDFG)
– region 2], J. Kleinfelter (CDFG – region 4), C. Milliron
(CDFG – region 6) and R. Fisher (US Geological Survey).
In order to make our extinction estimates conservative, we
Journal of Zoology 271 (2007) 361–374 c� 2007 The Authors. Journal compilation c� 2007 The Zoological Society of London366
Phylogeography and decline of Rana muscosa and Rana sierrae V. T. Vredenburg et al.

defined an extinct population as one where no individual
frog, tadpole or egg mass could be found within 1 km of the
actual historic locality. All suitable habitat at historic
localities (i.e. including all water bodies located within the
1 km radius circle) was searched for all life stages using
visual encounter surveys (Crump & Scott, 1994). Surveys
were conducted during the period of peak activity. Status at
a site was categorized as ‘extant’ if one or more egg masses,
tadpoles, subadults or adults were detected, and as ‘extinct’
if no life stages were found. We identified historic localities
for R. muscosa and R. sierrae within all six minor phyloge-
netic clades; however, due to lack of recent resurveys, we did
not include 22 sites representing Clade 1 and an additional
27 sites scattered throughout the rest of the range of both
species. Surveys of all suitable habitat within the 1 km radius
circle were completed for 225 historic localities, and these
225 localities (Supplementary Material Appendix S2) form
the basis of all subsequent analyses.
The majority of localities were surveyed only once, but
because R. muscosa and R. sierrae are easily detected using
visual encounter surveys, this survey effort was likely
sufficient to determine accurately presence/absence (Knapp
& Matthews, 2000). Detectability is high for at least two
reasons. First, during the day adults spend the majority of
their time on shore immediately adjacent to water and
tadpoles are found primarily in near-shore shallows (Storer,
1925; Vredenburg et al., 2005), making both life stages
highly visible during visual encounter surveys. Second,
larvae are present all year due to the unusual longevity
(1–4 years) of this life stage (Vredenburg et al., 2005).
Results
Molecular phylogeny
The final alignment of sequence data included 364 nucleotide
positions of the ND1 protein-coding gene, the entire set of
1031 nucleotides of the ND2 protein-coding gene and 506
nucleotides of the concatenated tRNA genes for a total of
1901 nucleotides. Of the 94 specimens analyzed, a subset of
14 specimens was sequenced for the ND2 gene only. Three
tRNA indels were observed to be unique to the outgroup
taxa, and were removed from subsequent analyses. The
model of evolution selected based on AIC in MrModelTest
(Nylander, 2004) varied by codon position in ND1 and ND2
and by flanking and intervening blocks of tRNA (ND1-first
position=K80; ND1-second position=F81; ND1-third po-
sition=GTR; ND2-first position=HKY+I; ND2-second
position=GTR+I; ND2-third position=GTR+G; tRNA
block between ND1 and ND2=HKY; tRNA block follow-
ing ND2=GTR+I). All partitioned Bayesian analyses re-
sulted in increased model likelihood scores relative to the
unpartitioned analysis, with the strategy partitioning the
protein-coding genes separately, and by codon, and concate-
nating tRNA genes together providing the best fit to the data.
Two major (R. muscosa and R. sierrae) and six minor
clades (clades 1–6) were identified with 495% posterior
probabilities (Fig. 1a). The Kimura-corrected mean pairwise
genetic distance between the two species was 4.6%, and the
mean distance within the species was 1.5% for R. muscosa
and 1.9% for R. sierrae. The between minor clade compar-
isons are shown in Table 3.
We assigned numbers to clades from north to south, with
R. sierrae being comprised of clades 1–3 and R. muscosa
being comprised of clades 4–6 (Fig. 1), with clades 1–5
occurring in the Sierra Nevada and clade 6 in southern
California. Clade 1 is restricted to the Feather River
(Plumas County) in the northern part of the Sierra Nevada.
Clade 2 has the broadest distribution and ranges from the
Diamond Mountains (Plumas County), south through the
northern and central Sierra Nevada (including the Yuba,
American, Mokelumne, Stanislaus and Tuolumne Rivers)
to the Ritter Range (Madera County), just south-east of
Yosemite National Park where it overlaps with clade
3. Clade 3 ranges from the Merced River (Mariposa
County) south through the San Joaquin River and east over
the Sierra Nevada crest to the Glass Mountains, south of
Mono Lake (Mono County). The southern part of clade 3 is
bounded by the Monarch Divide east to Mather Pass in the
Middle Fork of the Kings River (Fresno County). From
there south, the clade is restricted east of the Sierra crest
south to the type locality (R. sierrae, MVZ 3734; Inyo
County). Within R. muscosa, clade 4 ranges from south of
Mather Pass and west of the Sierra crest in the South Fork
of the Kings River, south through the headwaters of the
Kern River to Mount Whitney (Tulare County). Clade 5 is
restricted to the Kern River watershed. It overlaps with
clade 4 in the headwaters of the Kern River near Lake South
America and ranges south to Laurel Basin on the western
side of the Kern River (Tulare County). Clade 6 occurs in
the Transverse Ranges of southern California which are
disjunct from the Sierra Nevada, and includes the type
specimen for the species (R. muscosa, MVZ 771; Los
Angeles County).
Our isolation by distance analyses revealed a significant
association of genetic and geographical distance (Table 4),
although when corrected by indicator clade (GG/I), the
pattern was not significant for either species. In other words,
within clades, geographic distance and molecular variation
were correlated, but when multiple clades were included in
the analyses (and corrected for, i.e. GG/I) the relationship
was no longer significant.
Table 3 Mean pairwise genetic distance (mtDNA) between the six
clades in the mountain yellow-legged frog Rana sierrae and Rana
muscosa complex (mean distance between species=0.046)
R. sierrae R. muscosa
1 2 3 4 5 6
R. sierrae 1
2 0.018
3 0.028 0.030
R. muscosa 4 0.023 0.033 0.048
5 0.038 0.048 0.060 0.024
6 0.036 0.049 0.064 0.023 0.030
Journal of Zoology 271 (2007) 361–374 c� 2007 The Authors. Journal compilation c� 2007 The Zoological Society of London 367
Phylogeography and decline of Rana muscosa and Rana sierraeV. T. Vredenburg et al.

Morphology
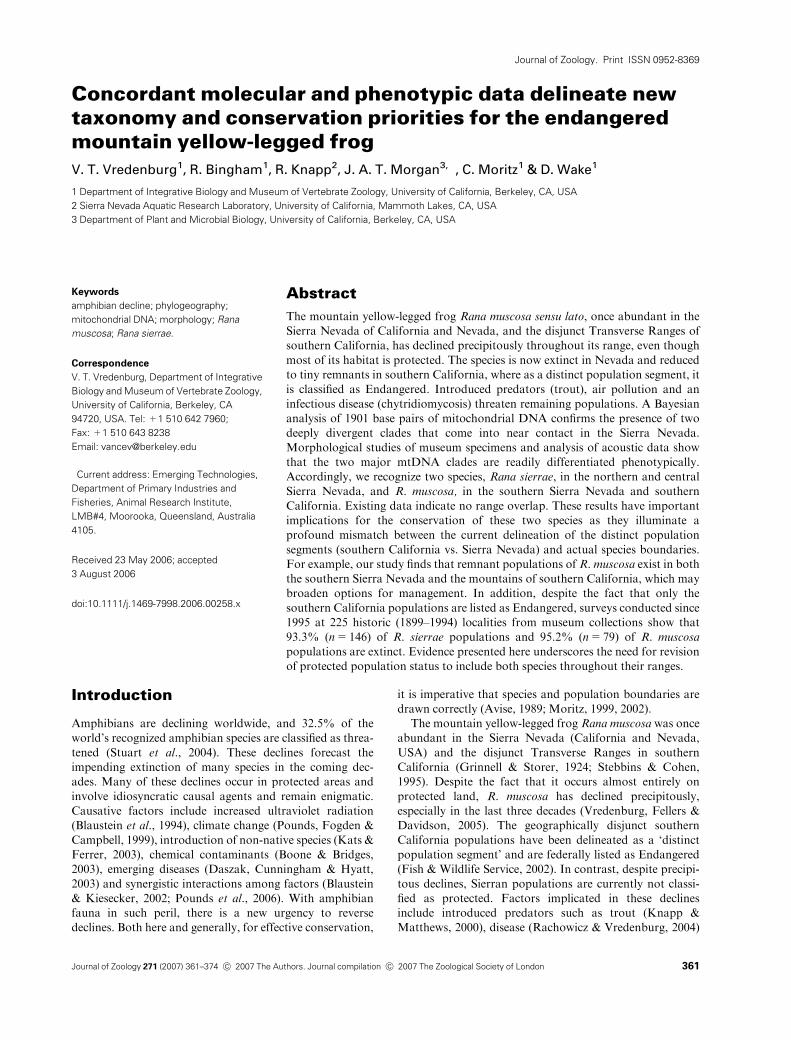
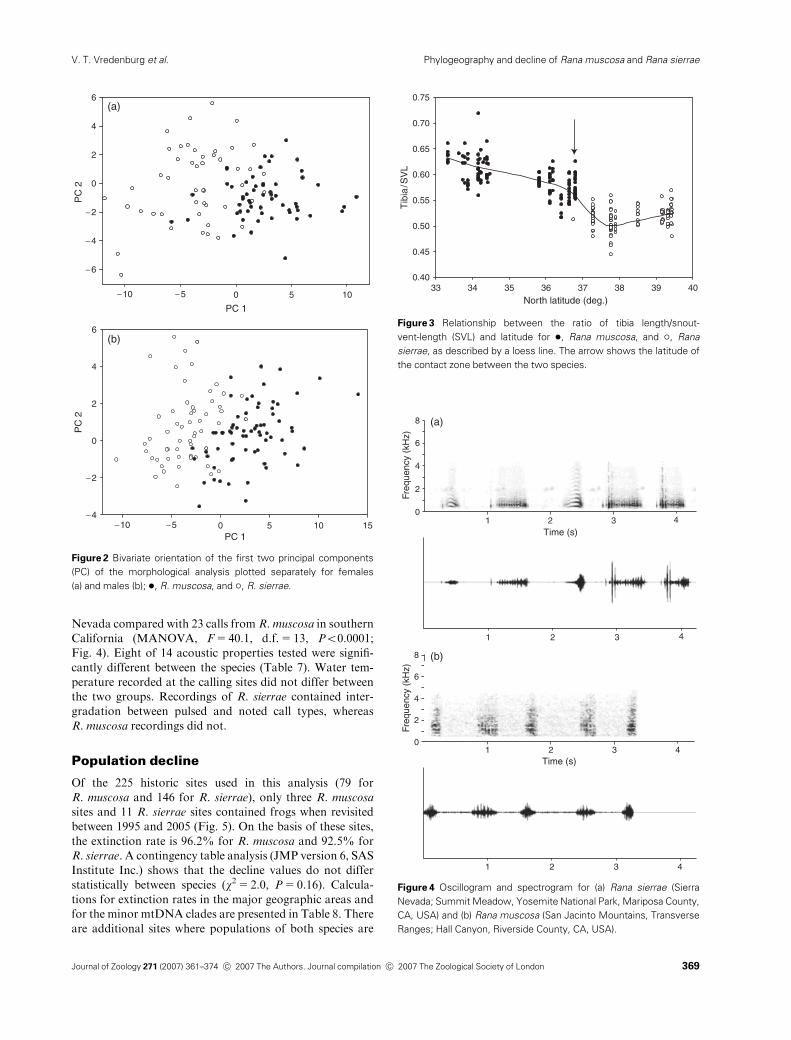
In females the first three principal components accounted
for 79.7% of the total variation, and in males they
accounted for 75.9% of the variation (Tables 5 and 6). The
most important factors, for both sexes, were those measure-
ments associated with limb lengths, especially femur and
tibia lengths (FL, TL), and these, when corrected for body
size, indicate two distinct groups of frogs (Fig. 2a and b).
Rana muscosa specimens had longer limbs relative to body
size than R. sierrae (Supplementary Material Appendix S3).
The discriminant function analysis correctly classified
94.8% of female specimens and 92.2% of male specimens
with a priori species grouping (major mtDNA groups),
indicating that the two morphological groups are concor-
dant with the two major mitochondrial groups that we
recognize as species (Fig. 1a and b). The alternative analysis
using a priori groupings by mountain range (Sierra Nevada
vs. Transverse Ranges) was not as accurate and correctly
classified 76 and 73% of female and male specimens,
respectively. Using this grouping, most specimens from
mtDNA clades 4 and 5 (Fig. 1) in the southern Sierra
Nevada were misclassified (22/25 and 30/34 for females and
males, respectively).
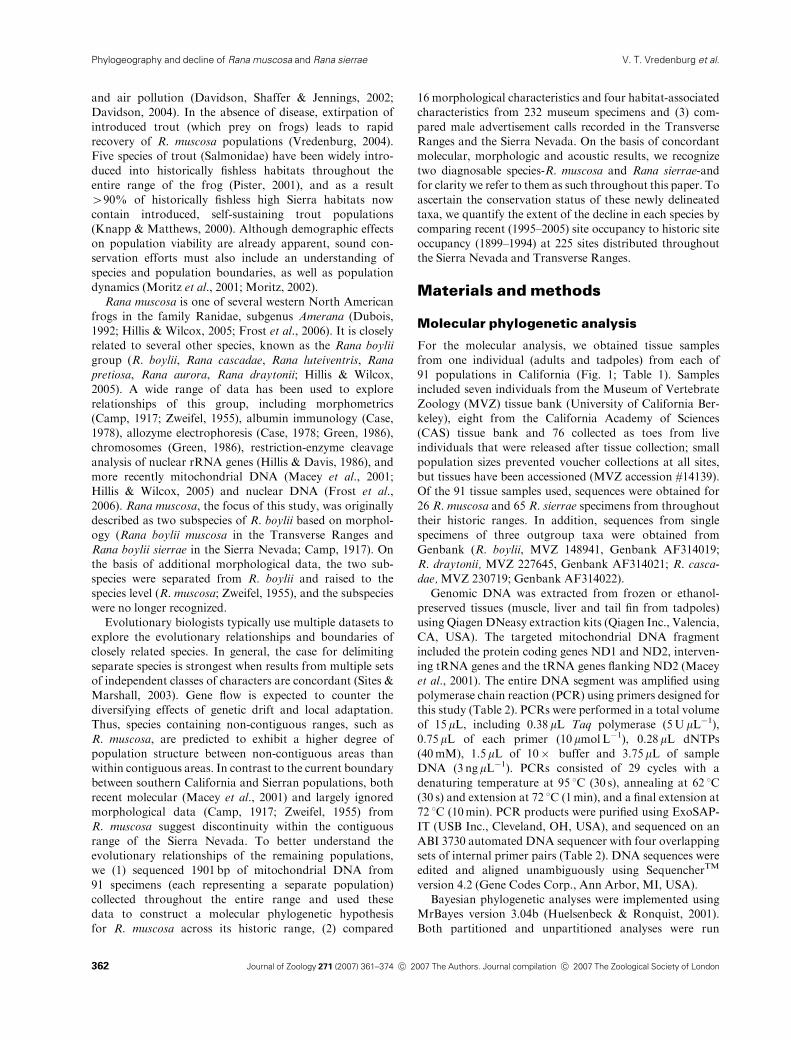
Results from the GAM indicated that latitude and sex
had significant influences on the TL/SVL (Po10�10 and
P=8.5� 10�4, respectively). Effects of elevation and habi-
tat type were not significant (P40.05). The shape of the
response curve describing the effect of latitude on TL/SVL
was not changed when sex was dropped from the model. To
visualize the relationship between TL/SVL and latitude, we
fit a loess line through the points describing this relationship
(Fig. 3). The two species had markedly different TL/SVL
results. The TL/SVL was highest for R. muscosa from
southern California (latitude=33–34.51) and slightly lower
for R. muscosa from the southern Sierra Nevada
(latitude=35.5–36.81). At the contact zone between the
two species (between latitudes of 36.8 and 37.81), the
TL/SVL declined sharply and then increased slightly
through the northern Sierra (latitude=37.8–39.61).
Acoustics
We found significant differences between the mean values of
acoustic properties of 34 calls from R. sierrae in the Sierra
Table 4 Partial Mantel test results for isolation by distance
Correlation
type Z r P
Rana sierrae GG 3843.29 0.565 o0.00005
GI 17.59 0.93 o0.00005
GG/I 0.067 0.069
GI/G 0.896 o0.00005
Rana muscosa GG 370.66 0.427 o0.00005
GI 2.579 0.980 o0.00005
GG/I �0.203 0.995
GI/G 0.977 o0.00005
Analyses performed include correlation of genetic and geographic
distance (GG), correlation of genetic distance and indicator clade variable
(GI), partial correlation of genetic and geographic distance correcting for
indicator clade variable (GG/I), and partial correlation of genetic distance
and indicator clade variable correcting for geography (GI/G).
Table 5 Results from principal component analysis of 15 morphologic
characters (female specimens), showing the first four principal
components (PC I–IV)
PC I PC II PC III PC IV
Eigenvalue 20.2450 4.7452 2.4591 1.3400
Per cent 58.8444 13.7925 7.1476 3.8948
Cum per cent 58.8444 72.6368 79.7844 83.6792
Eigenvectors
Residuals HL 0.07423 �0.00735 �0.08441 0.10388
Residuals HD 0.18986 �0.05296 0.00052 0.36270
Residuals SNL 0.05007 �0.01376 �0.10821 �0.03093
Residuals IND 0.02166 �0.00697 0.00239 �0.07577
Residuals IUE 0.10441 �0.01646 �0.00159 0.03144
Residuals UEW 0.11277 �0.00560 �0.08554 �0.00487
Residuals HL 2 0.20521 0.11719 �0.00998 0.35313
Residuals RL 0.21387 0.07108 0.53179 0.18550
Residuals HaL 0.12939 0.16284 �0.12478 �0.20769
Residuals FL 0.59736 �0.51848 �0.27184 �0.42964
Residuals TL 0.47424 �0.06241 �0.17881 0.53627
Residuals TaL 0.27982 �0.13243 0.74659 �0.21910
Residuals FoL 0.29372 0.59765 �0.02149 �0.19352
Residuals 4thToe 0.25906 0.53456 �0.10663 �0.23978
Residuals 1stToe 0.11756 0.13454 �0.01688 0.18049
HL, head length; HD, head diameter; SNL, snout length; IND,
internarial distance; IUE, shortest eye-to-eye distance; UEW, longest
eye-to-eye distance; HL2, humerus length; RL, radius length;
HaL, hand length; FL, femur length; TL, tibia length; TaL, tarsus length;
FoL, foot length; 4thToe, fourth toe length; 1stToe, first toe length.
Table 6 Results from principal component analysis of 15 morphologic
characters (male specimens), showing the first four principal compo-
nents (PC I–IV)
PC I PC II PC III PC IV
Eigenvalue 19.0478 3.7697 2.0191 1.7403
Per cent 58.2480 11.5278 6.1743 5.3217
Cum per cent 58.2480 69.7758 75.9501 81.2719
Eigenvectors
Residuals HL 0.08417 �0.08133 0.01633 �0.07729
Residuals HD 0.16889 �0.04768 �0.25434 �0.21466
Residuals SNL 0.05681 �0.01329 �0.00770 �0.02489
Residuals IND 0.01415 0.00348 �0.05301 0.01150
Residuals IUE 0.07849 �0.04696 �0.01519 �0.05147
Residuals UEW 0.09764 �0.04108 �0.07830 �0.10065
Residuals HL 2 0.23553 �0.10188 �0.15337 0.34569
Residuals RL 0.22448 �0.20186 0.24877 0.47037
Residuals HaL 0.10875 0.15410 �0.10563 0.17508
Residuals FL 0.52773 �0.28633 �0.62815 0.08002
Residuals TL 0.52150 �0.09979 0.34343 �0.66055
Residuals TaL 0.26091 �0.37104 0.54374 0.28602
Residuals FoL 0.33675 0.57059 0.07444 0.17630
Residuals 4thToe 0.28090 0.56688 0.05004 0.08255
Residuals 1stToe 0.12939 0.18872 0.11416 �0.02399
Journal of Zoology 271 (2007) 361–374 c� 2007 The Authors. Journal compilation c� 2007 The Zoological Society of London368
Phylogeography and decline of Rana muscosa and Rana sierrae V. T. Vredenburg et al.
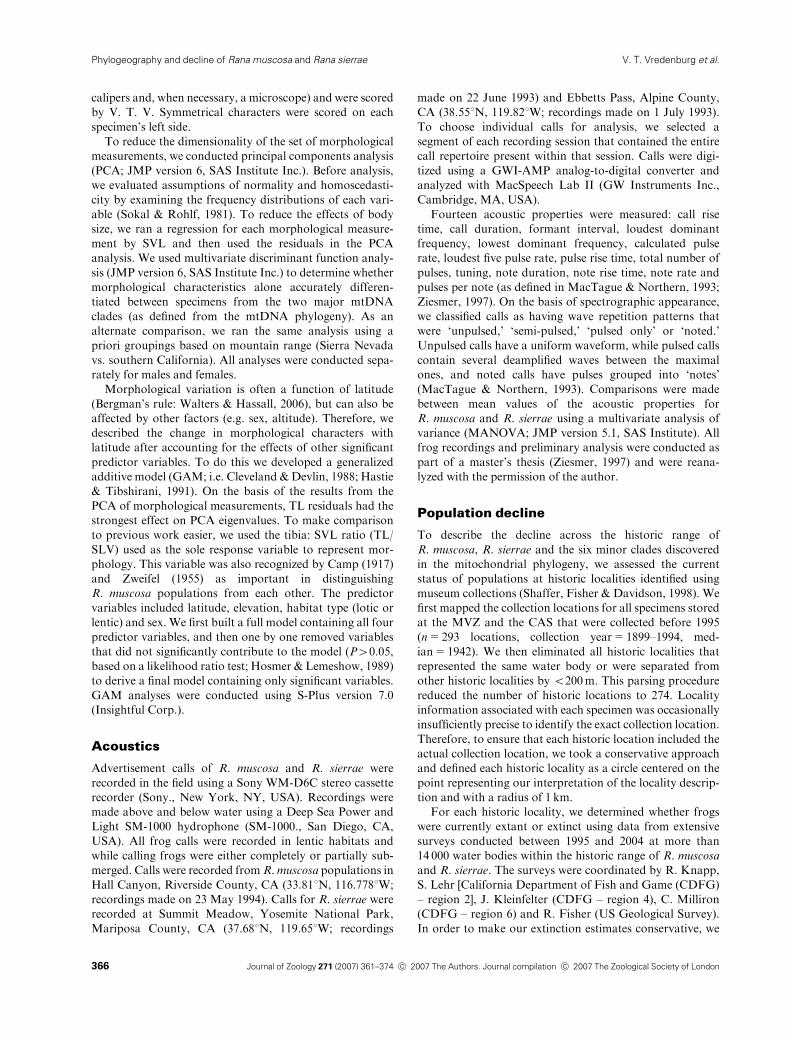
Nevada compared with 23 calls from R. muscosa in southern
California (MANOVA, F=40.1, d.f.=13, Po0.0001;
Fig. 4). Eight of 14 acoustic properties tested were signifi-
cantly different between the species (Table 7). Water tem-
perature recorded at the calling sites did not differ between
the two groups. Recordings of R. sierrae contained inter-
gradation between pulsed and noted call types, whereas
R. muscosa recordings did not.
Population decline
Of the 225 historic sites used in this analysis (79 for
R. muscosa and 146 for R. sierrae), only three R. muscosa
sites and 11 R. sierrae sites contained frogs when revisited
between 1995 and 2005 (Fig. 5). On the basis of these sites,
the extinction rate is 96.2% for R. muscosa and 92.5% for
R. sierrae. A contingency table analysis (JMP version 6, SAS
Institute Inc.) shows that the decline values do not differ
statistically between species (w2=2.0, P=0.16). Calcula-
tions for extinction rates in the major geographic areas and
for the minor mtDNA clades are presented in Table 8. There
are additional sites where populations of both species are
(a)
(b)
PC 1
−10 −5 5 10
PC 1−10 −5 0 5 10 15
PC
2
−6
−4
−2
0
2
4
6
PC
2
−4
−2
0
2
4
6
0
Figure 2 Bivariate orientation of the first two principal components
(PC) of the morphological analysis plotted separately for females
(a) and males (b); �, R. muscosa, and �, R. sierrae.
North latitude (deg.)33 34 35 36 37 38 39 40
Tib
ia/S
VL
0.40
0.45
0.50
0.55
0.60
0.65
0.70
0.75
Figure 3 Relationship between the ratio of tibia length/snout-
vent-length (SVL) and latitude for �, Rana muscosa, and �, Rana
sierrae, as described by a loess line. The arrow shows the latitude of
the contact zone between the two species.
8
6
4
2
01 2 3
Time (s)
Freq
uenc
y (k
Hz)
8
6
4
2
0
Freq
uenc
y (k
Hz)
4
1 2 3Time (s)
4
1 2 3 4
1 2 3 4
(a)
(b)
Figure 4 Oscillogram and spectrogram for (a) Rana sierrae (Sierra
Nevada; Summit Meadow, Yosemite National Park, Mariposa County,
CA, USA) and (b) Rana muscosa (San Jacinto Mountains, Transverse
Ranges; Hall Canyon, Riverside County, CA, USA).
Journal of Zoology 271 (2007) 361–374 c� 2007 The Authors. Journal compilation c� 2007 The Zoological Society of London 369
Phylogeography and decline of Rana muscosa and Rana sierraeV. T. Vredenburg et al.

known to exist; however, these were not included in this
analysis because no historical information is available at
those sites.
Taxonomy
Rana muscosa complex
Mountain yellow-legged frogs
Rana sierrae Camp (1917), new status.
Sierra Nevada yellow-legged frog
Rana boylii sierrae Camp (1917). Original description.
Type – MVZ 3734, an adult female collected by H.S.
Swarth on 26 July 1912. Type locality – Matlock Lake,
3200m elevation, Inyo County, California (36.761N,
118.361W).
Rana muscosa Zweifel (1955). This author considered the
then recognized two subspecies of R. boylii to constitute
separate species, and he selected the name muscosa for the
mountain yellow-legged frogs thereby reducing sierrae to
synonymy.
Diagnosis. Rana sierrae differs from R. muscosa in
having relatively shorter legs. When a leg is folded against
the body the tibio-tarsal joint typically falls short of the
external nares. The mating call of R. sierrae is significantly
different from that of R. muscosa in having transitions
between pulsed and noted sounds. In addition, the two
species differ in mitochondrial DNA. These datasets are
geographically concordant.
Range. Rana sierrae once ranged from the Diamond
Mountains north-east of the Sierra Nevada in Plumas
County, California, south through the Sierra Nevada to the
type locality, the southern-most locality (Inyo County). In
the extreme north-west region of the Sierra Nevada, several
populations occur just north of the Feather River, and to the
east, there was a population onMt Rose, north-east of Lake
Tahoe in Washoe County, Nevada, but it is now extinct.
West of the Sierra Nevada crest, the southern part of the
R. sierrae range is bordered by ridges that divide the Middle
and South Fork of the Kings River, ranging from Mather
Pass to the Monarch Divide. East of the Sierra Nevada
crest, R. sierrae occurs in the Glass Mountains just south of
Mono Lake (Mono County) and along the east slope of the
Sierra Nevada south to the type locality at Matlock Lake
(Inyo County).
Comment. This species is a member of the R. muscosa
complex, which in turn is part of the clade Amerana, which
also includesR. aurora, R. boylii,R. cascadae, R. draytonii, R.
luteiventris and R. pretiosa (Hillis & Wilcox, 2005). Relation-
ships within this clade are not fully resolved, but the follow-
ing does not conflict with analyses of Hillis & Wilcox (2005)
and Macey et al. (2001): (((pretiosa, luteiventris)boy-
lii)(((aurora, cascadae)muscosa, sierrae)draytonii)). See
further comments under R. muscosa account (below).
Rana muscosa Camp (1917).
Sierra Madre yellow-legged frog
Rana boylii muscosa Camp (1917). Original description.
Type –MVZ 771, adult female collected by J. Grinnell on
3 August 1903. Type locality – Arroyo Seco Canyon,
Table 7 Acoustic properties and MANOVA test results between Rana
muscosa and Rana sierrae
Acoustic property Definition F P
Whole model All variables tested 109.3 o0.0001
WaTemp Water temperature 0.40 0.52
CallRist Call rise time 0.38 0.54
Duration Duration of call 0.39 0.53
FrmntInt Formant interval 93.22 o0.0001
LdDF Loudest dominant Frequency 30.46 o0.0001
LwDF Lowest dominant frequency 7.74 0.0074
PlsRtCalcd Pulse rate, calculated 13.25 0.0006
PlsRtLd5 Pulse rate, loudest five 86.84 o0.0001
PlsRisT Pulse rise time 0.39 0.53
TotNrPls Total number of pulses 48.55 o0.0001
Tuning Tuning 10.03 0.0025
NtDur Note duration 0.40 0.53
NtRisT Note rise time 0.5 0.45
NtRt Note rate 15.39 0.009
PlsPerNt Pulse rate 1.73 0.19
0 200 400 km
Figure 5 Range (grey area) of Rana muscosa and Rana sierrae based
on all museum specimens at California Academy of Sciences and
Museum of Vetebrate Zoolgy. The boundary between the two
species is shown with a line. Two disjunct isolated localities are
shown separated from the range because they are isolated from all
other sites (Breckenridge Mountain, Kern County, and Palomar
Mountain, San Diego County). The circles show 225 historic collection
sites (1899–1994) that were resurveyed between 1995 and 2005
(�, extinct populations, n=211; �, extant populations, n=14).
Journal of Zoology 271 (2007) 361–374 c� 2007 The Authors. Journal compilation c� 2007 The Zoological Society of London370
Phylogeography and decline of Rana muscosa and Rana sierrae V. T. Vredenburg et al.
366m elevation, 10 km north of Pasadena, Los Angeles
County, California (34.211N, 118.171W).
Rana muscosa Zweifel (1955). Raised to species status.
Diagnosis. Rana muscosa differs from R. sierrae in
having relatively longer legs, with the tibio-tarsal joint of
the folded leg reaching or exceeding the external nares. The
mating call of R. muscosa is significantly different from that
of R. sierrae in having discrete pulsed and noted sounds,
with no transitions. In addition, the two species differ in
mitochondrial DNA.
Range. Rana muscosa once ranged from PalomarMoun-
tain in San Diego County through the San Jacinto, San
Bernardino and San Gabriel Mountains of Riverside, San
Bernardino and Los Angeles counties in southern California.
These formed four isolated clusters of montane populations.
In addition, the species occurred as an isolated cluster of
populations on Breckenridge Mountain, south of the Kern
River in Kern County, and in the Sierra Nevada in Tulare,
Inyo and Fresno counties, extending north to Mather Pass.
The distribution of R. muscosa in the Sierra Nevada is
bordered by the crest of Sierra Nevada. No populations occur
east of the crest. The mountain ridges that separate the
headwaters of the South Fork Kings River from the Middle
Fork Kings River, fromMather Pass to the Monarch Divide,
form the northern border of the range (Fig. 1, inset). Rana
muscosa is extinct on Palomar and Breckenridge mountains.
Comment. We revert to the vernacular name originally
coined by Camp (1917) for this taxon, in order to stabilize
names. Frogs belonging to our R. muscosa and R. sierrae
have long been called mountain yellow-legged frogs, and to
assign that name to one or the other of the two sister taxa
would be arbitrary and lead to confusion. Accordingly, we
recommend that collectively the frogs be called the
R. muscosa complex, the mountain yellow-legged frogs.
Discussion
Our concordant molecular, morphological and acoustic
data reveal the presence of two species and suggest that
conservation efforts inappropriately consider remaining
populations of frogs in the Sierra Nevada as a single taxon.
The contribution of mitochondrial DNA and multivariate
statistical approaches used here confirms that there are two
distinguishable species, but with different geographical
limits than supposed by Camp (1917) and assumed in the
current designation of southern California populations.
Despite strong statements pointing out large morphologi-
cal differences between R. muscosa in the Sierra Nevada
and southern California (Myers, 1952), Zweifel (1955)
synonymized the geographically distinct subspecific taxa.
Zweifel synonymized the taxa despite reporting significant
morphological variation in frogs between the Sierra Neva-
da and Transverse Ranges (in Zweifel, 1955, fig. 21)
because he found extensive overlap in morphology between
the frogs from the two ranges. We identified two morpho-
logically distinct groups of frogs without using a priori
geographic groupings. Surprisingly, the range disjunction
(between the Sierra Nevada and the Transverse Ranges)
does not correlate with the morphological or molecular
groupings (Fig. 1b). The abrupt change from long-legged
to shorter legged frogs occurs in the southern Sierra
Nevada over a short distance (o4 km) and cannot be
explained by elevation or habitat type (Fig. 3; GAM
results). The GAM shows that the morphological charac-
ters did not change clinally, but instead changed abruptly
near 36.71N latitude. Moreover, the zone of morphological
change aligns with a mitochondrial break. Finally, our
reanalysis of previously recorded acoustic data also shows
that the acoustic properties of mating calls in R. muscosa
and R. sierrae are distinct.
The biogeographic history of vertebrates in the Sierra
Nevada is complex, and evidence for a mid-Sierran break
in mitochondrial DNA is an increasingly common phe-
nomenon (Calsbeek, Thompson & Richardson, 2003;
Lapointe & Rissler, 2005; Rissler et al., 2006). In accor-
dance with a previous molecular study on R. muscosa and
R. sierrae (Macey et al., 2001), our results show a distinct
mitochondrial break within the southern Sierra Nevada.
This pattern of fragmentation between northern and
southern populations in the Sierra Nevada is observed
among codistributed amphibian and reptilian species
(i.e. Ambystoma californiense, Shaffer et al., 2004; Ensatina
eschscholtzii, Moritz, Schneider & Wake, 1992; Taricha
torosa, Tan & Wake, 1995; Kuchta & Tan, 2005; Pseudacris
regilla, Recuero et al., 2006; Bufo canorus, Shaffer et al.,
2000; Lampropeltis zonata, Rodriguez-Robles, Denardo &
Staub, 1999; Feldman & Spicer, 2006;Charina bottae,Contia
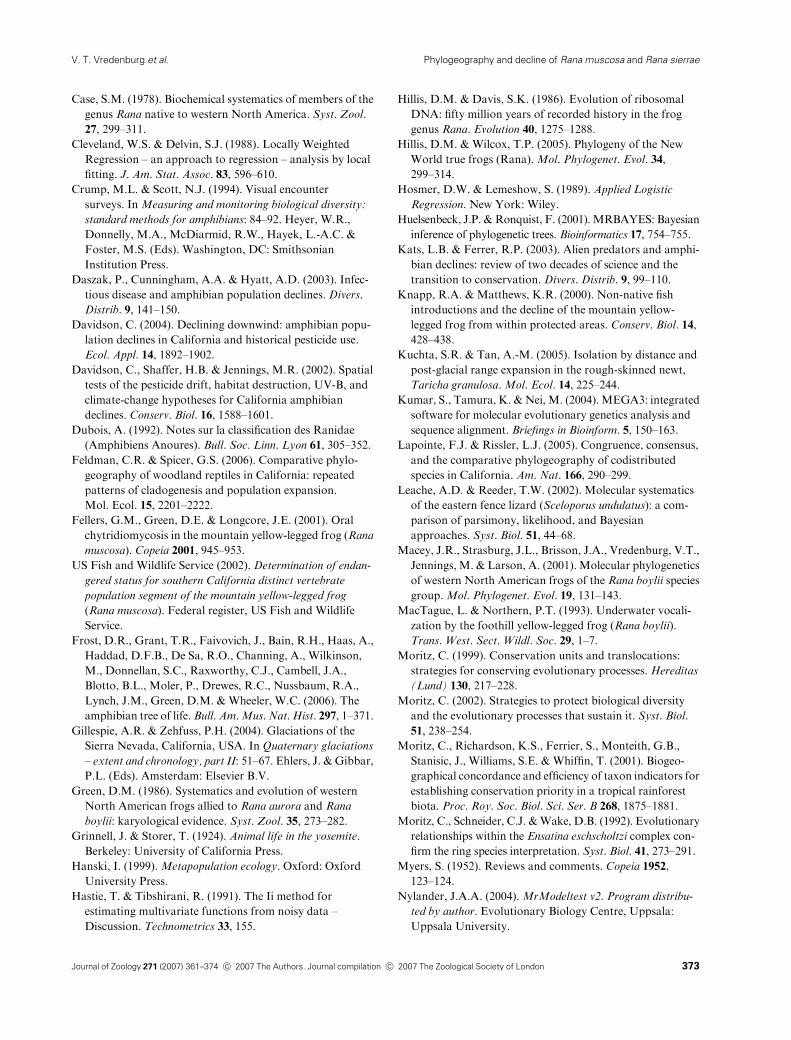
Table 8 Site occupancy: historic (1899–1994) versus current (1995–2005)
Species mtDNA clade Mountain range No. of historic No. of current % extinct
Rana sierrae 1–3 Sierra Nevada 146 11 92.5
1 Sierra Nevada
2 Sierra Nevada 104 9 91.3
3 Sierra Nevada 42 2 95.2
Rana muscosa 4–6 Sierra Nevada+Transverse Ranges 79 3 96.2
4–5a Sierra Nevada 26 2 92.3
6 Transverse Ranges 53 1 98.1
R. muscosa+R. sierrae 1–5 Sierra Nevada 172 13 92.4
R. muscosa+R. sierrae 1–6 Sierra Nevada+Transverse Ranges 225 14 93.8
aClades combined because of geographic overlap of mtDNA clades. Results from combined clades for each species in bold.
Journal of Zoology 271 (2007) 361–374 c� 2007 The Authors. Journal compilation c� 2007 The Zoological Society of London 371
Phylogeography and decline of Rana muscosa and Rana sierraeV. T. Vredenburg et al.
tenuis and Elgaria multicarinata, Feldman & Spicer, 2006;
Emys marmorata, Spinks & Shaffer, 2005). Although the
breaks between phylogeographic units do not always align,
the similar pattern of biogeographic fragmentation suggests
that these species were influenced by one or more vicariant
events. Although glaciation is often suggested as the vicar-
iant event, geologic models for the Sierra Nevada and the
Transverse Ranges are controversial (Gillespie & Zehfuss,
2004); thus, reconstructing the evolutionary history of
lineages in this region continues to be challenging.
Extensive biological surveys conducted over a century ago
concluded that R. sierrae and R. muscosa were the most
abundant vertebrates in the high-elevation habitats of the
Sierra Nevada (Grinnell & Storer, 1924) and the Transverse
Ranges (Storer, 1925). In this study we documented high
rates of extinction for both R. sierrae and R. muscosa. We
believe our extinction estimates are conservative because, if
even a single frog or tadpole was recently encountered within
a 1 km radius around a historic site, we would consider the
population to be extant in this study. In addition, while there
is always a possibility of a false negative, both frog species are
diurnal, occur mostly in simple habitats, and are closely
associated with lentic and lotic shorelines, and thus are easily
discovered in surveys (Knapp & Matthews, 2000; Vreden-
burg, 2004). It is possible that there is some colonization of
previously unoccupied sites to offset local extinctions (meta-
populations: Andrewertha & Birch, 1954; Hanski, 1999), but
recent and repeated large-scale surveys suggest that this is a
rare process and not sufficient to compensate for the high
extinction rate observed here. In the Sierra Nevada, recent
surveys report a number of widely scattered, mostly very
small populations (o20 adults) of R. muscosa and R. sierrae
remaining (Knapp &Matthews, 2000; R. A. Knapp, unpubl.
data). In southern California only eight small populations
(o20 adults) are known (Fish & Wildlife Service, 2002).
Clearly, the genetically distinct R. muscosa populations in
southern California should continue to be a target for
conservation; however, our study, concluding that popula-
tions of R. muscosa exist in the southern Sierra Nevada, may
broaden options for management. For example, if the re-
maining eight southern California populations become ex-
tinct, thenR.muscosa from the southern SierraNevada could
be used as source populations for future reintroductions.
Correct delineation of species boundaries is essential for
conservation (Avise, 1989; Moritz, 2002). Recognition of
R. sierrae and R. muscosa, together with evidence for high
extinction rates (93–95%), reveals both species to be endan-
gered under current IUCN criteria (Stuart et al., 2004) and
underscores the importance of managing frogs in the Sierra
Nevada as two distinct species. Fortunately, nearly all the
remaining populations ofR. sierrae andR. muscosa occur on
public lands, and previous work showed that in the absence
of disease, recovery of populations is possible (Vredenburg,
2004). Several agencies have begun and/or planned recovery
efforts based on these results (National Park Service, CDFG
and US Forest Service), and a number of both R. muscosa
and R. sierrae populations have recovered (Vredenburg,
2004). However, the discovery of an infectious disease
(chytridiomycosis: Fellers, Green & Longcore, 2001; Racho-
wicz & Vredenburg, 2004), and its association with collap-
singR. muscosa andR. sierrae populations (Rachowicz et al.,
2006), adds a new urgency to recovery efforts.
Acknowledgements
Financial support was provided by the National Institutes
of Health/National Science Foundation Ecology of Infec-
tious Disease Program (R01ES12067 to C. Briggs). We
thank the Museum of Vertebrate Zoology and the Califor-
nia Academy of Sciences for the use of specimens and frozen
tissues. Research was permitted by the California Depart-
ment of Fish and Game (Scientific Collecting Permit to
801241-02 V. T. V.), the US Forest Service, and Yosemite,
Sequoia and Kings Canyon National Parks. We thank the
following people for their invaluable assistance with this
research: C. Briggs, T. Papenfuss, S. Thomas, T. Tunstall,
S. Schoville, A. Swei, T. Devitt, I. Martinez-Solano, S. Lehr,
J. Kleinfelter, C. Milliron, J. Vindum, G. Fellers, R. Fisher,
D. Graber, H. Werner and T. Ziesmer for the use of his frog
recordings and initial analyses. We also thank two anon-
ymous reviewers for providing helpful comments that
improved this paper.
References
Andrewertha, H.G. & Birch, L.C. (1954). The distribution and
abundance of animals. Chicago: University of Chicago Press.
Avise, J.C. (1989). A role for molecular genetics in the
recognition and conservation of endangered species.
Trends Ecol. Evol. 4, 279–281.
Blaustein, A.R., Hoffman, P.D., Hokit, D.G., Kiesecker, J.M.,
Walls, S.C. & Hays, J.B. (1994). UV repair and resistance to
solar UV-B in amphibian eggs: a link to population
declines? Proc. Natl. Acad. Sci.USA 91, 1791–1795.
Blaustein, A.R. & Kiesecker, J.M. (2002). Complexity in
conservation: lessons from the global decline of amphibian
populations. Ecol. Lett. 5, 597–608.
Bohonak, A.J. (2002). IBD (isolation by distance): a program
for analyses of isolation by distance. J. Hered. 93, 153–154.
Boone, M.D. & Bridges, A.S. (2003). Effects of pesticides on
amphibian populations. In Amphibian conservation:
152–167. Semlitsch, R.D. (Ed.). Washington, DC: Smith-
sonian Books.
Brandley, M.C., Schmitz, A. & Reeder, T.W. (2005). Parti-
tioned Bayesian analyses, partition choice, and the phylo-
genetic relationships of scincid lizards. Syst. Biol. 54,
373–390.
Calsbeek, R., Thompson, J.N. & Richardson, J.E. (2003).
Patterns of molecular evolution and diversification in a
biodiversity hotspot: the California floristic province.
Mol. Ecol. 12, 1021–1029.
Camp, C.L. (1917). Notes on the systematic status of toads
and frogs of California. Univ. Calif. Publ. Zool. 17, 59–62.
Journal of Zoology 271 (2007) 361–374 c� 2007 The Authors. Journal compilation c� 2007 The Zoological Society of London372
Phylogeography and decline of Rana muscosa and Rana sierrae V. T. Vredenburg et al.
Case, S.M. (1978). Biochemical systematics of members of the
genus Rana native to western North America. Syst. Zool.
27, 299–311.
Cleveland, W.S. & Delvin, S.J. (1988). Locally Weighted
Regression – an approach to regression – analysis by local
fitting. J. Am. Stat. Assoc. 83, 596–610.
Crump, M.L. & Scott, N.J. (1994). Visual encounter
surveys. In Measuring and monitoring biological diversity:
standard methods for amphibians: 84–92. Heyer, W.R.,
Donnelly, M.A., McDiarmid, R.W., Hayek, L.-A.C. &
Foster, M.S. (Eds). Washington, DC: Smithsonian
Institution Press.
Daszak, P., Cunningham, A.A. & Hyatt, A.D. (2003). Infec-
tious disease and amphibian population declines. Divers.
Distrib. 9, 141–150.
Davidson, C. (2004). Declining downwind: amphibian popu-
lation declines in California and historical pesticide use.
Ecol. Appl. 14, 1892–1902.
Davidson, C., Shaffer, H.B. & Jennings, M.R. (2002). Spatial
tests of the pesticide drift, habitat destruction, UV-B, and
climate-change hypotheses for California amphibian
declines. Conserv. Biol. 16, 1588–1601.
Dubois, A. (1992). Notes sur la classification des Ranidae
(Amphibiens Anoures). Bull. Soc. Linn. Lyon 61, 305–352.
Feldman, C.R. & Spicer, G.S. (2006). Comparative phylo-
geography of woodland reptiles in California: repeated
patterns of cladogenesis and population expansion.
Mol. Ecol. 15, 2201–2222.
Fellers, G.M., Green, D.E. & Longcore, J.E. (2001). Oral
chytridiomycosis in the mountain yellow-legged frog (Rana
muscosa). Copeia 2001, 945–953.
US Fish and Wildlife Service (2002). Determination of endan-
gered status for southern California distinct vertebrate
population segment of the mountain yellow-legged frog
(Rana muscosa). Federal register, US Fish and Wildlife
Service.
Frost, D.R., Grant, T.R., Faivovich, J., Bain, R.H., Haas, A.,
Haddad, D.F.B., De Sa, R.O., Channing, A., Wilkinson,
M., Donnellan, S.C., Raxworthy, C.J., Cambell, J.A.,
Blotto, B.L., Moler, P., Drewes, R.C., Nussbaum, R.A.,
Lynch, J.M., Green, D.M. & Wheeler, W.C. (2006). The
amphibian tree of life. Bull. Am.Mus. Nat. Hist. 297, 1–371.
Gillespie, A.R. & Zehfuss, P.H. (2004). Glaciations of the
Sierra Nevada, California, USA. In Quaternary glaciations
– extent and chronology, part II: 51–67. Ehlers, J. & Gibbar,
P.L. (Eds). Amsterdam: Elsevier B.V.
Green, D.M. (1986). Systematics and evolution of western
North American frogs allied to Rana aurora and Rana
boylii: karyological evidence. Syst. Zool. 35, 273–282.
Grinnell, J. & Storer, T. (1924). Animal life in the yosemite.
Berkeley: University of California Press.
Hanski, I. (1999). Metapopulation ecology. Oxford: Oxford
University Press.
Hastie, T. & Tibshirani, R. (1991). The Ii method for
estimating multivariate functions from noisy data –
Discussion. Technometrics 33, 155.
Hillis, D.M. & Davis, S.K. (1986). Evolution of ribosomal
DNA: fifty million years of recorded history in the frog
genus Rana. Evolution 40, 1275–1288.
Hillis, D.M. & Wilcox, T.P. (2005). Phylogeny of the New
World true frogs (Rana). Mol. Phylogenet. Evol. 34,
299–314.
Hosmer, D.W. & Lemeshow, S. (1989). Applied Logistic
Regression. New York: Wiley.
Huelsenbeck, J.P. & Ronquist, F. (2001). MRBAYES: Bayesian
inference of phylogenetic trees. Bioinformatics 17, 754–755.
Kats, L.B. & Ferrer, R.P. (2003). Alien predators and amphi-
bian declines: review of two decades of science and the
transition to conservation. Divers. Distrib. 9, 99–110.
Knapp, R.A. & Matthews, K.R. (2000). Non-native fish
introductions and the decline of the mountain yellow-
legged frog from within protected areas. Conserv. Biol. 14,
428–438.
Kuchta, S.R. & Tan, A.-M. (2005). Isolation by distance and
post-glacial range expansion in the rough-skinned newt,
Taricha granulosa. Mol. Ecol. 14, 225–244.
Kumar, S., Tamura, K. & Nei, M. (2004). MEGA3: integrated
software for molecular evolutionary genetics analysis and
sequence alignment. Briefings in Bioinform. 5, 150–163.
Lapointe, F.J. & Rissler, L.J. (2005). Congruence, consensus,
and the comparative phylogeography of codistributed
species in California. Am. Nat. 166, 290–299.
Leache, A.D. & Reeder, T.W. (2002). Molecular systematics
of the eastern fence lizard (Sceloporus undulatus): a com-
parison of parsimony, likelihood, and Bayesian
approaches. Syst. Biol. 51, 44–68.
Macey, J.R., Strasburg, J.L., Brisson, J.A., Vredenburg, V.T.,
Jennings, M. & Larson, A. (2001). Molecular phylogenetics
of western North American frogs of the Rana boylii species
group. Mol. Phylogenet. Evol. 19, 131–143.
MacTague, L. & Northern, P.T. (1993). Underwater vocali-
zation by the foothill yellow-legged frog (Rana boylii).
Trans. West. Sect. Wildl. Soc. 29, 1–7.
Moritz, C. (1999). Conservation units and translocations:
strategies for conserving evolutionary processes. Hereditas
(Lund) 130, 217–228.
Moritz, C. (2002). Strategies to protect biological diversity
and the evolutionary processes that sustain it. Syst. Biol.
51, 238–254.
Moritz, C., Richardson, K.S., Ferrier, S., Monteith, G.B.,
Stanisic, J., Williams, S.E. & Whiffin, T. (2001). Biogeo-
graphical concordance and efficiency of taxon indicators for
establishing conservation priority in a tropical rainforest
biota. Proc. Roy. Soc. Biol. Sci. Ser. B 268, 1875–1881.
Moritz, C., Schneider, C.J. &Wake, D.B. (1992). Evolutionary
relationships within the Ensatina eschscholtzi complex con-
firm the ring species interpretation. Syst. Biol. 41, 273–291.
Myers, S. (1952). Reviews and comments. Copeia 1952,
123–124.
Nylander, J.A.A. (2004). MrModeltest v2. Program distribu-
ted by author. Evolutionary Biology Centre, Uppsala:
Uppsala University.
Journal of Zoology 271 (2007) 361–374 c� 2007 The Authors. Journal compilation c� 2007 The Zoological Society of London 373
Phylogeography and decline of Rana muscosa and Rana sierraeV. T. Vredenburg et al.

Pister, E.P. (2001). Wilderness fish stocking: history and
perspective. Ecosystems 4, 279–286.
Posada, D. & Crandall, K.A. (1998). MODELTEST: testing
the model of DNA substitution. Bioinformatics 14,
817–818.
Pounds, J.A., Bustamante, M.R., Coloma, L.A., Consuegra,
J.A., Fogden,M.P.L., Foster, P.N., LaMarca, E., Masters,
K.L., Merino-Viteri, A., Puschendorf, R., Ron, S.R.,
Sanchez-Azofeifa, G.A., Still, C.J. & Young, B.E. (2006).
Widespread amphibian extinctions from epidemic disease
driven by global warming. Nature 439, 161–167.
Pounds, J.A., Fogden, M.P.L. & Campbell, J.H. (1999).
Biological response to climate change on a tropical moun-
tain. Nature 398, 611–615.
Rachowicz, L. & Vredenburg, V.T. (2004). Transmission of
Batrachochytrium dendrobatidis within and between
amphibian life stages. Dis. Aquat. Organ. 61, 75–83.
Rachowicz, L.J., Knapp, R.A., Morgan, J.A.T., Stice, M.J.,
Vredenburg, V.T., Parker, J.M. & Briggs, C.J. (2006).
Emerging infectious disease as a proximate cause of am-
phibian mass mortality in Rana muscosa populations.
Ecology 87, 1671–1683.
Recuero, E., Martinez-Solano, I., Parra-Olea, G. & Garcia-
Paris, M. (2006). Phylogeography of Pseudacris regilla
(Anura: Hylidae) in western North America, with a pro-
posal for a new taxonomic rearrangement. Mol. Phylogen-
et. Evol. 39, 293–304.
Rissler, L.J., Hijmans, R.J., Graham, D.H., Moritz, C. &
Wake, D.B. (2006). Phylogeographic lineages and species
comparisons in conservation analyses: a case study of
California herpetofauna. Am. Nat. 167, 655–666.
Rodriguez-Robles, J.A., Denardo, D.F. & Staub, R.E. (1999).
Phylogeography of the California mountain kingsnake,
Lampropeltis zonata (Colubridae).Mol. Ecol. 8, 1923–1934.
Shaffer, H.B., Fellers, G.M., Magee, A. & Voss, S.R. (2000).
The genetics of amphibian declines: population substruc-
ture and molecular differentiation in the Yosemite toad,
Bufo canorus (Anura, Bufonidae) based on single-strand
conformation polymorphism analysis (SSCP) and mito-
chondrial DNA sequence data. Mol. Ecol. 9, 245–257.
Shaffer, H.B., Fisher, R.N. & Davidson, C. (1998). The role
of natural history collections in documenting species
declines. Trends Evol. Ecol. 13, 27–30.
Shaffer, H.B., Pauly, G.B., Oliver, J.C. & Trenham, P.C.
(2004). The molecular phylogenetics of endangerment:
cryptic variation and historical phylogeography of the
California tiger salamander, Ambystoma californiense.
Mol. Ecol. 13, 3033–3049.
Sites, J.W. Jr. & Marshall, J.C. (2003). Delimiting species: a
renaissance issue in systematic biology. Trends Ecol. Evol.
18, 462–470.
Sokal, R.R. & Rohlf, F.J. (1981). Biometry. 2nd edn. New
York, NY: W. H. Freeman.
Spinks, P.Q. & Shaffer, B. (2005). Range-wide molecular
analysis of the western pond turtle (Emys marmorata):
cryptic variation, isolation by distance, and their conserva-
tion implications. Mol. Ecol. 14, 2047–2064.
Stebbins, R.C. & Cohen, N.W. (1995). A natural history of
amphibians. Princeton, NJ: Princeton University Press.
Storer, T. (1925). A synopsis of the Amphibia of California.
Univ. Calif. Publ. Zool. 27, 1–342.
Stuart, S., Chanson, J.S., Cox, N.A., Young, B.E., Rodrigues,
A.S.L., Fishman, D.L. & Waller, R.W. (2004). Status and
trends of amphibian declines and extinctions worldwide.
Science 306, 1783–1786.
Swofford, D.L. (1996). PAUP�: phylogenetic analysis usingparsimony (and other methods), version 4.0. Sunderland,
MA: Sinauer Associates.
Tan, A.-M. & Wake, D.B. (1995). MtDNA phylogeography
of the California newt, Taricha torosa (Caudata, Salaman-
dridae). Mol. Phylogenet. Evol. 4, 383–394.
Vredenburg, V.T. (2004). Reversing introduced species ef-
fects: experimental removal of introduced fish leads to
rapid recovery of a declining frog. Proc. Nat. Acad. Sci.
USA 101, 7646–7650.
Vredenburg, V.T., Fellers, G. & Davidson, C. (2005). The
mountain yellow-legged frog Rana muscosa (Camp 1917).
In Status and conservation of US amphibians: 563–566.
Lanoo, M. (Ed.). Berkeley: University of California Press.
Walters, R.J. & Hassall, M. (2006). The temperature-size rule
in ectotherms: may a general explanation exist after all?
Am. Nat. 167, 510–523.
Ziesmer, T. (1997). Vocal behavior of foothill and mountain
yellow-legged frogs (Rana boylii and R. muscosa). Rohnert
Park: Department of Biology, Sonoma State University.
Zweifel, R.G. (1955). Ecology, distribution, and systematics
of frogs of the Rana boylei group. Univ. Calif. Publ. Zool.
54, 207–292.
Supplementary material
The following material is available for this article online:
Appendix S1 Specimens examined in morphological
analyses [MVZ specimens, plus VTV specimens currently
being added to the MVZ collection: MVZ accession
#14139]. Highlighted specimens represent type specimens.
Appendix S2 List of historic localities used in the
decline analysis.
Appendix S3 Morphometric variation (in mm) in adult
members of the R. muscosa and R. sierrae. Table entries
include mean� SD, range and sample size (n). See text for
character abbreviations.
This material is available as part of the online article
from http://www.blackwell-synergy.com/doi/abs/10.1111/
j.1469-7998.2006.00258.x
Please note: Blackwell Publishing are not responsible for the
content or functionality of any supplementary materials
supplied by the authors. Any queries (other than missing
material) should be directed to the corresponding author for
the article.
Journal of Zoology 271 (2007) 361–374 c� 2007 The Authors. Journal compilation c� 2007 The Zoological Society of London374
Phylogeography and decline of Rana muscosa and Rana sierrae V. T. Vredenburg et al.