Immune system resetting and long-term remission ... - Excemed

Concordance between clinician and patient ratings as predictorsof response, remission, and recurrence in major depressivedisorder
Boadie W. Dunlopa,*, Thomas Lib, Susan G. Kornsteind, Edward S. Friedmane, Anthony J.Rothschildf, Ron Pedersenb, Philip Ninanc, Martin Kellerg, and Madhukar H. TrivedihaDepartment of Psychiatry, Emory University School of Medicine, 1256 Briarcliff Road, Building A,3rd Floor, Atlanta, GA 30306, USAbGlobal Biostatistics and Programming, Wyeth Research, Collegeville, Pennsylvania, USAcGlobal Medical Affairs, Wyeth Research, Collegeville, Pennsylvania, USAdDepartment of Psychiatry, Virginia Commonwealth University, Richmond, Virginia, USAeDepartment of Psychiatry, University of Pittsburgh School of Medicine, Pittsburgh, Pennsylvania,USAfDepartment of Psychiatry, University of Massachusetts Medical School and UMass MemorialHealth Care, Worcester, Massachusetts, USA
© 2010 Elsevier Ltd. All rights reserved.*Corresponding author. Tel.: +1 404 727 8969; fax: +1 404 727 3700. [email protected] (B.W. Dunlop).
Conflicts of interestDr. Rothschild received grants or funding from the National Institute of Mental Health, Cyberonics, Takeda, and Wyeth. He is aconsultant for Pfizer, GlaxoSmithKline, Forest Laboratories, and Eli Lilly & Company. Royalties include the Rothschild Scale forAnti-depressant Tachyphylaxis (RSAT), Clinical Manual for the Diagnosis and Treatment of Psychotic Depression, AmericanPsychiatric Press, 2009.Dr. Dunlop has served as a consultant for Wyeth and Bristol-Myers Squibb and has served on the Speaker’s Bureau for Bristol-MyersSquibb. He has received research support from GlaxoSmithKline, Novartis, Takeda, the National Institute of Mental Health, OnoPharmaceuticals, and Wyeth.Dr. Friedman is a consultant for Pfizer. He has received grant/research support from Northstar, Sanofi Aventis, Novartis, Cyberonics,Medtronics, and the National Institute of Mental Health.Dr. Kornstein has received grants/research from the National Institute of Mental Health, Departments of Health and Human Services,Pfizer, Bristol-Myers Squibb, Eli Lilly & Company, Forest Laboratories, Wyeth, Novartis, Sepracor, Boehringer-Ingelheim, Sanofi-Synthelabo, AstraZeneca, and Takeda. She has served on advisory boards for Wyeth, Pfizer, Eli Lilly & Company, Bristol-MyersSquibb, Endo, Forest Laboratories, Sepracor, Neurocrine, and Takeda, and has received book royalties from Guilford Press.Dr. Trivedi has received grants/research from the Agency for Healthcare Research and Quality, Corcept Therapeutics, Cyberonics,Meade Johnson, National Alliance for Research in Schizophrenia and Depression, the National Institute of Mental Health, NIDA,Novartis, Pharmacia & Upjohn, Solvay, and Targacept. He is a consultant for Abbott, Abdi Brahim, Akso, AstraZeneca, Bristol-Myers Squibb, Cephalon, Fabre-Kramer, Forest Laboratories, GlaxoSmithKline, Janssen, Johnson & Johnson, Eli Lilly & Company,Meade Johnson, Neuronetics, Parke-Davis, Pfizer, Sepracor, and Vantage Point.Dr. Ninan is a Wyeth employee and stockholder.Dr. Li is a Wyeth employee and stockholder.Dr. Pedersen is a Wyeth employee and stockholder.Dr. Keller is a consultant for Abbott, CENEREX, Cephalon, Cupress Bioscience, Cyberonics, Forest Laboratories, Janssen, JDS,Medtronic, Organon, Novartis, Pfizer, Roche, Solvay, and Wyeth. He has received grants/research from Pfizer and is part of theadvisory board for Abbott, Bristol-Myers Squibb, CENEREX, Cyberonics, Cypress, Forest Laboratories, Janssen, Neurotics, Novartis,Organon, and Pfizer.
Contributors: Dr. Dunlop developed the first draft of the manuscript, contributed to the statistical analytic plan and performedliterature searches. Dr. Li and Mr. Pederson performed the statistical analyses and contributed to the manuscript. Drs. Kornstein,Friedman, Ninan, Rothschild, and Trivedi contributed to the conduct of the study and the development of the analytic plan, andprovided revisions to the first draft of the manuscript. Dr. Keller led the design of the protocol and contributed to the development ofthe statistical analytic plan and provided revisions to the manuscript. All authors contributed to approved the final manuscript.
NIH Public AccessAuthor ManuscriptJ Psychiatr Res. Author manuscript; available in PMC 2013 June 10.
Published in final edited form as:J Psychiatr Res. 2011 January ; 45(1): 96–103. doi:10.1016/j.jpsychires.2010.04.032.
NIH
-PA Author Manuscript
NIH
-PA Author Manuscript
NIH
-PA Author Manuscript

gDepartment of Psychiatry and Human Behavior, Brown University, Providence, Rhode Island,USAhUniversity of Texas Southwestern Medical School, Dallas, Texas, USA
AbstractWe conducted a secondary analysis of data from the Prevention of Recurrent Episodes ofDepression With Venlafaxine Extended Release (ER) for Two Years (PREVENT) trial to evaluatewhether discrepancies between clinician and patient ratings of depression severity were predictiveof response, remission, and recurrence during treatment for a depressive episode. Patients whoself-rated depression severity in concordance with the clinician (“concordant patients”) weredefined as having a standardized patient-rated Inventory of Depressive Symptoms-Self Report(IDS-SR30) score minus standardized clinician-rated Hamilton Rating Scale for Depression(HAM-D17) score <1 SD from mean. Non-concordant patients (“underrating patients” [−1 SD],“overrating patients” [+1 SD]) were identified. Cohorts were compared for remission and responseon the HAM-D17, Clinician Global Impression–Severity (CGI-S), and IDS-SR30 during acute andcontinuation therapy and time to recurrence during maintenance therapy. During acute treatmentfemale patients were more likely to overrate their depression severity compared to the clinician;older age predicted overrating during continuation treatment. Overrating patients had a sloweronset of response on the HAM-D17 during acute treatment (P = 0.004). There were no differencesbetween cohorts for remission or response on the HAM-D17 or CGI-S. Overrating patients at week10 had lower remission and response rates on the IDS-SR30 during continuation therapy (32% and50%, respectively; P ≤ 0.001) compared with underrating patients (76%, 77%) or concordantpatients (64%, 78%). Patient concordance at the end of continuation therapy did not predictrecurrence during maintenance therapy, indicating that patient rating scales may be useful intracking recurrence during maintenance therapy. Poor agreement between patient- and clinician-ratings of depression severity is primarily a state phenomenon, although it is trait-like for somepatients.
KeywordsDepression; Psychiatric status rating scales; Reliability and validity; Outcome assessment;Treatment outcome; Anxiety
1. IntroductionClinical research is a complex, time-consuming, and costly endeavor (Collier, 2009). Anymethod that increases the efficiency of the psychiatric research process while maintainingthe veracity of study results is of interest to clinical researchers and clinicians alike (Rush etal., 2006a). Patient factors, namely early clinical improvement, are one feature ofantidepressant trial design that has been scrutinized in this regard. Recently publishedreports of early improvement during antidepressant treatment predicting later clinicaloutcome are germane to both clinical trial design and patient care (Katz et al., 2009; Szegediet al., 2009).
Another feature of interest in antidepressant trial design is the method used to ratedepression severity. Clinician-administered symptom rating scales, such as the HamiltonRating Scale for Depression (HAM-D) (Hamilton, 1960) and the Montgomery ÅsbergDepression Rating Scale (MADRS) (Montgomery and Åsberg, 1979), are well-establishedinstruments used to document depression severity at baseline and track changes throughoutthe trial. However, these methods necessitate training and certification of experiencedpsychiatric clinicians (Rush et al., 2006a, 2003). The use of validated patient self-rating
Dunlop et al. Page 2
J Psychiatr Res. Author manuscript; available in PMC 2013 June 10.
NIH
-PA Author Manuscript
NIH
-PA Author Manuscript
NIH
-PA Author Manuscript
instruments in place of clinician rating scales is an attractive time- and cost-saving optionthat has gained momentum in the psychiatric research community (Bernstein et al., 2007;Rush et al., 2006a). The landmark Sequenced Treatment Alternatives to Relieve Depression(STAR*D) trial emphasized the patient-rated 16-item version of the Quick Inventory ofDepressive Symptomatology–Self-Report (QIDS-SR16) as a primary reported outcomemeasure of remission and response (Trivedi et al., 2006). Despite the attractiveness of self-reports, it has not been demonstrated conclusively that patient-rating instruments reliablyprovide assessments that are consistent with those of clinician-administered rating scales formeasuring the severity of depressive symptoms at baseline and throughout a clinical trial(Corruble et al., 1999; Dorz et al., 2004).
We compared clinician-rated and patient-rated measures of depression severity andtreatment response in a secondary analysis of data from the acute and continuation phases ofthe Prevention of Recurrent Episodes of Depression with Venlafaxine for Two Years(PREVENT) trial, a multiphase, multicenter, randomized, double-blind study that evaluatedthe efficacy of venlafaxine extended release (ER) as long-term therapy for recurrentdepression (Keller et al., 2007b). The analysis demonstrated that patient-rated measures ofdepression severity did not correspond well with clinician ratings. After 6 months ofcontinuation treatment, correlations between patient-rated scores on the 30-item Inventory ofDepressive Symptomatology–Self-Rated (IDS-SR30) and clinician ratings on the 17-itemHAM-D (HAM-D17) for remission and response were poor (κ values of 0.45 and 0.32,respectively) (Dunlop et al., 2010). These previous findings suggest that patient-rated scalescannot wholly substitute for clinician ratings when evaluating antidepressant treatmenteffects.
To better understand the factors contributing to the observed inconsistencies in clinician-rated and patient-rated measures of depressive symptom severity, we conducted furtheranalyses of data from the PREVENT trial. The objectives of the analyses reported here wereto identify factors contributing to differences between clinician- and patient-rated measuresof remission and response during acute and continuation therapy and to determine ifoutcomes varied as a function of clinician-patient rating discrepancies.
2. Methods2.1. The PREVENT trial
Details about the methods and results from the PREVENT trial are reported elsewhere(Keller et al., 2007a,b). In brief, eligible patients (n = 1,096) entered the trial and wererandomly assigned to receive a 10-week, acute treatment course with double-blindvenlafaxine ER or fluoxetine (Keller et al., 2007a). Patients achieving response or remissionduring the acute phase entered a 6-month, double-blind continuation phase on the sametreatment (n = 715) (Keller et al., 2007a). The continuation phase was followed by 2consecutive 12-month maintenance phases. At that start of each maintenance phase,responding or remitting patients in the venlafaxine ER group were randomly assigned totreatment with venlafaxine ER or placebo, and patients in the fluoxetine group continuedtaking fluoxetine (Keller et al., 2007a).
Patients were adults with at least a 1-month history of Diagnostic and Statistical Manual ofMental Disorders, Fourth Edition (DSM-IV) major depressive disorder (MDD) (AmericanPsychiatric Association, 1994) and recurrent depression (≥3 major depressive episodes, with≥2 episodes including the current episode occurring in the past 5 years, with ≥2 monthsbetween end of the previous episode and the beginning of the current episode). All patientshad a HAM-D17 total score of ≥20 at screening and ≥18 at randomization (Keller et al.,2007b). Certified raters administered the HAM-D17, the Hamilton Anxiety Rating Scale
Dunlop et al. Page 3
J Psychiatr Res. Author manuscript; available in PMC 2013 June 10.
NIH
-PA Author Manuscript
NIH
-PA Author Manuscript
NIH
-PA Author Manuscript

(HARS) (Hamilton, 1959), the Clinical Global Impressions–Severity (CGI-S), and theClinical Global Impressions–Change (CGI-C) rating scales (Keller et al., 2007b). Patientsrated the severity of their depression using the IDS-SR30 (Keller et al., 2007b). Data for theQIDS-SR16 was derived from the IDS-SR30.
There were no statistically significant differences at the end of the acute phase in rates ofresponse (79% for both groups; P = 0.719) or remission (venlafaxine ER 49%; fluoxetine50%; P = 0.719). After completion of the 6-month continuation phase, rates of response(venlafaxine ER 90%; fluoxetine 92%) and remission (venlafaxine ER 72%; fluoxetine69%) were similar for both groups (P = 0.696) (Keller et al., 2007b). The probability ofrecurrence after completing the first 12-month maintenance phase was 23.1% forvenlafaxine ER and 42.0% for placebo (P = 0.005). At the conclusion of the second 12-month maintenance phase, the probability of recurrence was 8.0% for venlafaxine ERcompared with 44.8% for placebo (P < 0.001) (Keller et al., 2007a).
2.2. Patient categories by discrepancies between patient- and clinician-rated scalesDifferences between clinician rating and patient rating scores were used to identify patientswho rated their depression as less severe (underrating patients) or more severe (overratingpatients) than their clinician rating. A discrepancy (D) score based on the HAM-D17 andIDS-SR30 scores for each patient was calculated according to the method reported by Dorzand colleagues (Dorz et al., 2004), in which the standardized score on the clinician-ratedHAM-D17 was subtracted from the standardized score on the patient-rated IDS-SR30.Negative D-scores indicated underrating, positive D-scores indicated overrating. Patientswhose D-scores were ±1 standard deviation (SD) from the mean were considered to benonconcordant patients (underrating patients [−1 SD] and overrating patients [+1 SD]), andall other patients were concordant patients. Fig. 1 displays the overall design of thePREVENT trial and the number of patients in each category through the study.
2.3. Predictors of nonconcordancePatient characteristics at baseline were evaluated to assess for predictors of discrepancybetween patient- and clinician-ratings. The effect of anxiety on the concordance betweenpatient and clinician ratings of depression severity was assessed by dividing the sample intohigh anxiety (HARS ≥18) or low anxiety (HARS < 18) at the baseline and again at week 10visits.
2.4. Acute phaseThree cohorts of patients (concordant, underrating, and overrating) were identified atbaseline, and outcomes for each cohort were compared at the conclusion of the acute phase.The acute-phase outcomes were rates of response and remission at week 10 (or last visit),time to response and remission, and within-patient effect sizes for HAM-D17, IDS-SR30, andQIDS-SR16 at week 10 (or last visit). Discontinuation rates were identified for each of thepatient categories. In addition, discontinuation rates were compared for nonconcordant raters(i.e., over- and underrating patients grouped together) and concordant raters.
2.5. Continuation phaseNew cohorts of concordant, underrating, and overrating patients were identified based onclinician and patient ratings after completing acute-phase treatment at week 10. Outcomesfor grouped nonconcordant vs concordant patients and the 3 cohorts were compared forresponse and remission rates and discontinuation rates.
Dunlop et al. Page 4
J Psychiatr Res. Author manuscript; available in PMC 2013 June 10.
NIH
-PA Author Manuscript
NIH
-PA Author Manuscript
NIH
-PA Author Manuscript

2.6. Change in patient category over timeIn order to evaluate whether the categorical assignment of patients to underrating,concordant, or overrating categories was stable over time, the patients’ individual ratingcategory was tracked through from baseline to the 10-week and 6-month end points. Therating status of the patients who withdrew from the study prior to the 10-week or 6-monthend points was not tracked.
2.7. Maintenance phaseAfter completing the 6-month continuation phase, new cohorts were identified forconcordant, underrating, and overrating patients. The probability of and time to protocol-defined recurrence and rates of discontinuation were compared for the 3 groups.
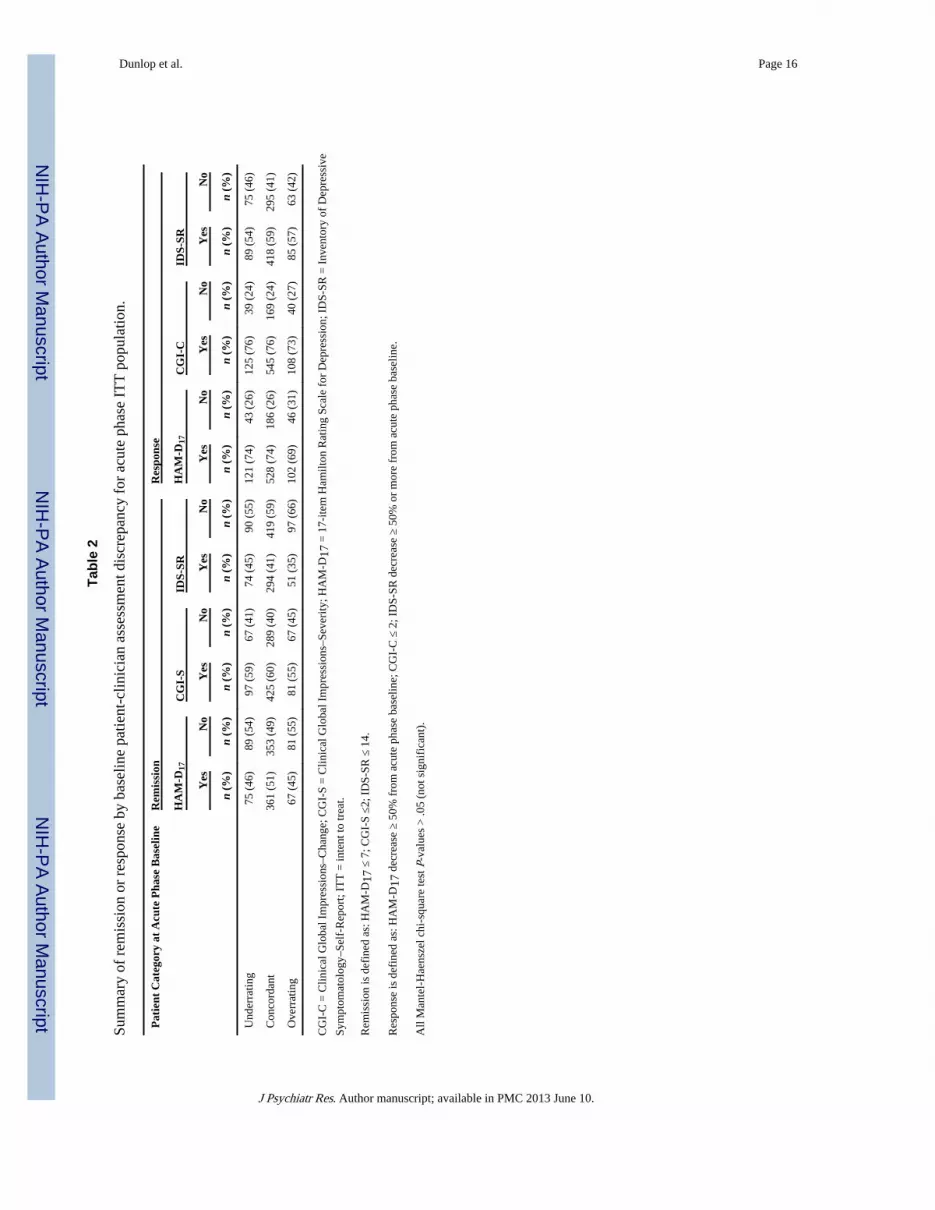
2.8. Statistical analysisStatistical analyses were performed on the intent-to-treat (ITT) population for the acute (N =1047) and continuation (N = 715) phases (Keller et al., 2007b). The ITT population includedall patients who had at least one dose of study medication and at least one postbaselineHAM-D17 evaluation (Keller et al., 2007b). In this secondary analysis, remission wasdefined as a HAM-D17 total score ≤7, CGI-S score ≤2, and IDS-SR30 total score ≤14.Response was defined as a ≥50% reduction from baseline on HAM-D17, IDS-SR30, andQIDS-SR16 total scores and a Clinical Global Impressions–Change (CGI-C) score ≤2.Recurrence during the maintenance phases was defined as a HAM-D17 total score ≥12 and areduction of ≤50% on the HAM-D17 total score from baseline at 2 consecutive visits or atthe last valid visit prior to study discontinuation.
Multiple logistic regression modeling identified baseline patient characteristics that weresignificant predictors of nonconcordance. The Mantel-Haenszel correlation chi-square wasused to compare rates of response and remission and rates of discontinuation among the 3cohorts during the acute and continuation phases. The time to response and remission duringthe acute phase and the time to recurrence in the maintenance phase were calculated anddescribed with Kaplan–Meier methods. Differences between cohorts were compared usinglog-rank tests.
Descriptive statistics were used to report within-patient effect sizes using standardizedresponse means (SRM) for each outcome measure during the acute phase. The SRM wascalculated as follows: (baseline score – end point score) / (standard deviation of baseline –end point difference). SRMs were calculated for concordant underrating, and overratingpatients. The distribution of the 3 cohorts in the venlafaxine ER, fluoxetine, and placeboarms at the beginning of the maintenance phase was compared using chi-square tests. Allstatistical analyses were conducted using the SAS analytic software (SAS Institute Inc,Cary, NC).
3. Results3.1. Predictors of nonconcordance
Several baseline features predicted differences between clinician and patient ratings (Table1). During the acute phase of treatment, men were significantly less likely than women toview their depression as more severe than the clinician (OR: 0.53,95% CI: 0.29–0.98;P<0.05 at week 10), but this difference was not apparent during the continuation phase.Younger age and greater body mass index (BMI) also predicted more severe rating scores bypatients compared with clinicians during the early weeks of the acute phase (P ≤ 0.01 forboth), but the magnitude of the odds ratios for these predictors was very small, indicatingthey are of little clinical importance. During the continuation phase, older age was
Dunlop et al. Page 5
J Psychiatr Res. Author manuscript; available in PMC 2013 June 10.
NIH
-PA Author Manuscript
NIH
-PA Author Manuscript
NIH
-PA Author Manuscript

associated with more severe patient- versus clinician-ratings at months 1 (P< 0.05), 5 (P<0.05), and 6 (P≤ 0.001). The number of lifetime depressive episodes, sex, and BMI did notpredict differences between patient- and clinician-rated depression severity duringcontinuation treatment.
At baseline, 66.9% of high anxiety patients (N = 486) were concordant with the clinicianrating of depression severity, versus 72.0% of the low anxiety patients (N = 542) (p = .08).Level of anxiety did not predict whether the patient would be classified into the under- over-or concordant category (p = .50).
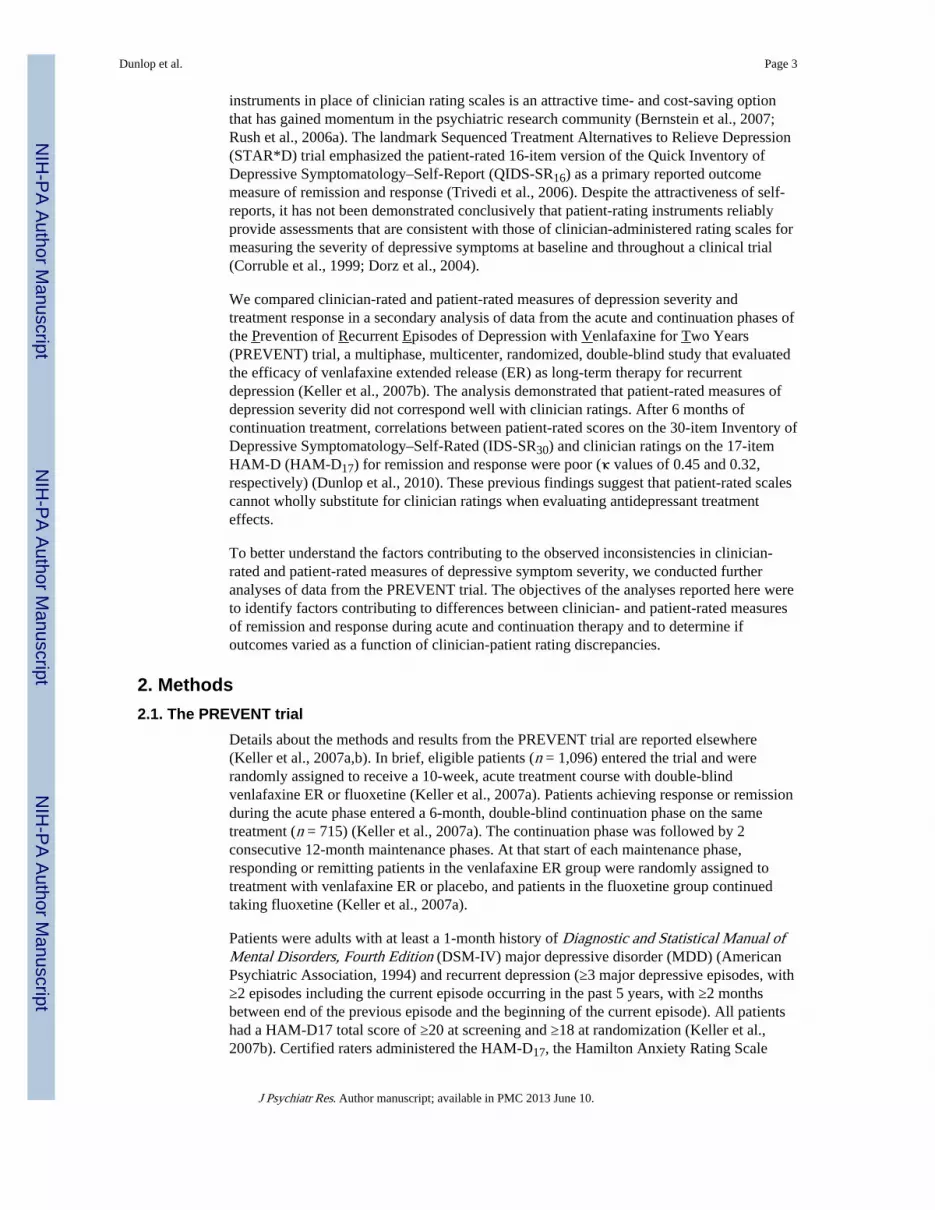
3.2. Acute phaseAfter the first 10 weeks of treatment, there were no statistically significant differences inrates of remission or response between the 3 cohorts on the HAM-D17, CGI-S, or IDS-SR30scales (Table 2). A trend for a lower remission rate on the IDS-SR30 score was apparent foroverrating patients (35%) compared with underrating patients (45%) and concordant patients(41%) at week 10, but these differences did not quite achieve statistical significance (P =0.058). Response rates on the HAM-D17, CGI-C, or IDS-SR30 during acute treatment weresimilar for the 3 cohorts (Table 2). There were no differences in time to onset of remissionduring the acute phase among the 3 cohorts (P = 0.949) (Fig. 2), but there was a significantdifference on time to response (P= 0.004), with overrating patients achieving response moreslowly on the HAM-D17 than underraters (Fig. 3).
Within group SRMs for change on the HAM-D17 (baseline to endpoint) during acutetreatment were larger (2.36) for underrating patients compared with concordant patients(1.99; P<0.001), but SRMs for overrating patients (1.72) were smaller than for concordantpatients (P = 0.002). Across the 3 categories of patients, the standardized scores for the IDS-SR30 and QIDS-SR16 were essentially identical, but within group SRMs for both patientrating scales were higher for overrating patients compared with concordant patients (P<0.001) and lower for underrating patients compared with concordant patients (P≤ 0.002).
At week 10, HARS scores identified 298 high anxiety and 522 low anxiety patients. Incontrast to the finding of no difference in rating category by anxiety level at baseline, atweek 10 the HAM-D17 versus IDS-SR30 correlations did find significant differencesbetween patients with and without high levels of anxiety. Among the high anxiety patients,65 (21.8%) were classed as underrating, 47 (15.8%) as over-rating, and 62.4% asconcordant. Among the 522 low anxiety patients, under-, over- and concordant ratingoccurred in 49 (9.4%), 70 (13.4%) and 403 (77.2%), respectively. These categoricaldifferences were statistically significant (p < .0001).
3.3. Continuation phaseNew cohorts were identified at the beginning of the continuation phase based on clinician-patient discrepancies at the end of the 10-week acute treatment phase. At the last visit of the6-month continuation treatment phase, week 10 nonconcordant patients had significantlylower rates of remission and response on the HAM-D17, CGI-S, and IDS-SR30 comparedwith concordant patients (Table 3). These findings were consistent in both the completer(Month 6) and intent-to-treat (Final Visit) samples, with the exception that the difference inresponse rates among the completer sample on the HAM-D17 outcome was not significant.The lower rate of response among nonconcordant patients was significant (p < .05) on theHAM-D17 and IDS-SR30 outcomes at every monthly rating visit during the continuationphase, with the exception of month 3. Remission rates were significantly lower (p < .05)among nonconcordant patients at every monthly visit on the IDS-SR30 (data not shown).
Dunlop et al. Page 6
J Psychiatr Res. Author manuscript; available in PMC 2013 June 10.
NIH
-PA Author Manuscript
NIH
-PA Author Manuscript
NIH
-PA Author Manuscript

When concordant, underrating, and overrating patients were assessed in a 3-way comparison(Table 4), final remission and response rates on the HAM-D17 and CGI-S for week 10overrating patients were lower than the 2 other groups (except for response rates on theHAM-D17, which were lowest for underrating patients), but these differences did not reachstatistical significance. The overrating patients at week 10 continued to overrate throughoutthe continuation phase, based on the lower rates of remission and response on the IDS-SR atevery visit of continuation compared with concordant patients (overall P ≤ 0.001).
3.4. Change in patient category over timeChanges in patient category for each of the 3 original cohorts were tracked from baseline toweek 10 of the acute phase and again from week 10 to the conclusion of the 6-monthcontinuation phase (Table 5). Of the patients who completed the 10-week acute treatmentphase, approximately 70% were categorized as concordant patients at week 10, regardless ofbaseline discrepancy rating (71.8% underrating, 73.6% concordant, 68.0% overrating). Only8% of baseline nonconcordant raters converted to the opposing non-concordant rating (e.g.,underrating patient converting to overrating patinet) at week 10. Similarly, 60% of week 10underrating patients, 76.5% of concordant patients, and 51.7% of overrating patients wereclassified as concordant patients at the conclusion of the continuation phase. However, asizable minority of week 10 underrating patients (37.8%) and overrating patients (43.1%)remained in their original category (Table 5). Only a small minority of nonconcordantpatients (≤5%) switched to the opposite rating category at 6 months.
3.5. Maintenance phaseNew cohorts were identified at the beginning of the first maintenance phase based onphysician-patient concordance at the conclusion of the continuation phase. There were nosignificant differences in the distribution of patient categories to the 3 treatment groups (datanot shown). There also were no statistically significant differences in time to recurrence forthe combined treatment groups of concordant vs nonconcordant patients (P = 0.40; data notshown) or concordant patients vs underrating or overrating patients (P = 0.68; data notshown).
3.6. DiscontinuationDiscontinuation rates during the acute treatment phase for underrating patients (34.1%) andoverrating patients (36.5%) were not significantly different than for concordant patients(30.1%; P = 0.24) or for concordant (30.1%) vs nonconcordant patients (35.3%; P= 0.10). A2-way comparison demonstrated that week 10 nonconcordant patients had significantlyhigher dropout rates during the continuation phase (43.2%) compared with concordant raters(32.2%; P = 0.009). Week-10 underrating patients (40.5%) and overrating patients (45.1%)had higher rates of discontinuation during the continuation phase compared with concordantpatients (32.2%), but these differences were not statistically significant. There were nostatistically significant differences among the 3 cohorts in rates of discontinuation during themaintenance phases.
4. DiscussionIn this analysis of data from the PREVENT trial, we found several baseline features thatpredicted which patients may rate their depression as more severe than clinicians. Womenwere significantly more likely than men to perceive their symptoms as more severe than theclinician during acute treatment. Younger patients and those with greater BMI were alsoslightly more likely to self-rate their symptoms as more severe than the clinician, but themagnitude of these differences was very small. These predictors of nonconcordance,particularly age, are consistent with some reports (Rush et al., 2006b; Paykel et al., 1973).
Dunlop et al. Page 7
J Psychiatr Res. Author manuscript; available in PMC 2013 June 10.
NIH
-PA Author Manuscript
NIH
-PA Author Manuscript
NIH
-PA Author Manuscript

However, other studies found that demographic or clinical features did not predict non-concordance (Corruble et al., 1999; Domken et al., 1994; Rush et al., 1987). Nevertheless,our findings suggest that reliance on patient self-rating instruments to screen patients foreligibility may result in selection bias, particularly favoring women.
We found no difference among the 3 cohorts in rates of remission or response or the time toreach remission on the HAM-D17 during acute therapy. In contrast, overrating patients atbaseline fulfilled clinician-rated response criteria significantly more slowly than underratingor concordant patients. During the continuation phase, rates of clinician-rated remission andresponse for overrating patients at week 10 vs the other 2 cohorts were numerically lower,but did not achieve statistical significance. However, self-rated measures of remission andresponse on the IDS-SR30 among the week 10 overrating patients were significantly lower(32%; 50%) compared with underrating (76%, 77%) or concordant patients (64%, 78%) (P <0.001, P < 0.001, respectively) during the 6 months of continuation therapy.
These findings can be interpreted to mean that nonremitting overrating patients emphasizetheir symptoms to such a degree as to impact clinician ratings on the HAM-D17 resulting inslower achievement of remission and response during acute treatment. The slowerimprovement among overrating patients corresponded with a nonsignificant, numerical trendtoward lower remission and response rates on the HAM-D17 and CGI-S scores duringcontinuation treatment. Use of self-rating instruments by such “high-distress expression”patients to track changes in symptom severity during treatment may result in less favorablestudy results. Interestingly, patients with high anxiety scores (HARS ≥ 18) after 10 weeks oftreatment were more than twice as likely to under-rate their depression severity as comparedto low anxiety patients. This finding suggests that high distress expression does not simplyreflect current anxiety, but rather stems from other factors.
The within group effect size of the clinician- and patient-rated scales varied between thecohorts, which may have relevance for power calculations used in study design, and formaking comparisons of benefits across studies, such as in meta-analyses. When depressionseverity was measured by clinicians using the HAM-D17, the effect size was larger forunderrating patients (2.36) than for concordant patients (1.99) or overrating patients (1.72).Therefore, the clinician’s ability to detect changes in depression severity over the course oftreatment may be greatest for patients who downplay their symptoms during an episode ofdepression. The opposite is true for self-reports. Patient ratings of symptom severity on theIDS-SR30 resulted in larger effect sizes for overrating patients (2.02) compared withconcordant patients (1.62) or underrating patients (1.31). These findings also raise questionsabout the value of self-report depression severity measures as criteria for entry into clinicaltrials. When a study’s primary outcome is a clinician-rated scale, but a score above a certainthreshold on a self-rated depression measure is required for study inclusion, the study maybe at risk for over-selecting for subjects least likely to show improvement on the primaryoutcome measure. This concern is even more relevant for trials examining speed ofresponse, given the significantly slower rate of response observed among overrating patientsin this analysis.
We followed the original cohorts from baseline through the completion of the 6-monthcontinuation phase and tracked the proportion of patients whose baseline discrepancy ratingchanged. Patients who were nonconcordant at baseline were of particular interest becausechanges in their discrepancy ratings over time, which presumably corresponded withimprovement in depression severity, might suggest that nonconcordant ratings represent astate, rather than trait characteristic. For example, finding that patients who downplayedpretreatment depression severity compared with the clinician (i.e., an underrating patient),but who agreed with the clinician after 6 months of treatment (i.e., switch from underrating
Dunlop et al. Page 8
J Psychiatr Res. Author manuscript; available in PMC 2013 June 10.
NIH
-PA Author Manuscript
NIH
-PA Author Manuscript
NIH
-PA Author Manuscript

to concordant patient) might be interpreted to mean that baseline underrating reflects a state-like phenomenon that changes with the resolution of the depressive episode. Our findingssuggest that the majority of under- and overrating patients become concordant during 10weeks of treatment, implying that patient-clinician rating discrepancies are largely a statephenomenon. Increased concordance during acute treatment may result from: 1) patientsdeveloping a greater shared understanding with the clinician regarding the meaning of thedescriptors used on rating scales to describe symptoms; 2) enhanced concentration andcognitive function due to improvement over time; 3) reduced patient mood bias in recall ofthe previous week’s symptom levels; or 4) increased disclosure to the clinician due toimproving rapport over time. During continuation, however, smaller proportions ofnonconcordant patients became concordant between week 10 and month 6, suggesting thatfor some patients, divergent self- and clinician ratings represents a trait-like characteristic.
Our finding that time to onset of a recurrent depressive episode during the maintenancephase was not different between non-concordant and concordant patients suggests that usingpatient-rating scales during the maintenance phase of antidepressant trials may permit someefficiencies in time and expense. This hypothesis could be replicated through secondaryanalyses of existing maintenance study data sets.
The finding of higher study discontinuation rates during the continuation phase hasrelevance for both clinical trials and clinical care of depressed patients. Nonconcordancemay represent a disjunction in understanding between the clinician and the patient.Underrating patients may perceive their clinician as making too much of their symptoms andconsequently “over-treating” them. Overrating patients may perceive their clinician as notfully understanding their distress and drop out of treatment to seek care elsewhere. Toreduce treatment drop out, highly discordant scores between clinicians and patients maywarrant an explicit conversation with the patient about these differences and the patient’sperception about the appropriateness of the care they are receiving.
Clinician-administered rating scales remain the standard by which depressive symptoms areevaluated in antidepressant drug trials. However, these scales are time-consuming andincrease the cost of trials, leading some clinical trial researchers to suggest that substitutingpatient ratings for clinician ratings of depression severity may be rational (Rush et al.,2006a, 2003). Our findings advise a more cautious approach. In an earlier analysis of datafrom the PREVENT trial, we found that correlations between clinician and patient ratingswere relatively poor (Dunlop et al., 2010). The data reported herein expand on thesefindings, demonstrating that discrepancies between patient and clinician ratings lead tomeaningful differences in outcome measurements. Certainly, our findings require replicationby other studies.
The value of the patient perspective on outcomes through using self-rated scales issignificant and should not be abandoned. Although the clinician’s rating historically hascarried the most significance for entry into depression trials, there is in fact no “goldstandard” to assess depression severity and thereby determine whether the clinician or thepatient is more accurately capturing the level of depression. There was no evidence that thepatient-clinician discrepancies arose from clinician-rater “inflation” of the baseline HAM-D17 scores to increase enrolment. The percentage decline in the HAM-D17 and IDS-SR30scores was identical at the first post-baseline assessment (week 1) (Dunlop et al., 2010).
More research is required to further understand why some patients report differing levels ofdepression severity on a questionnaire than are detected during a clinical interview. Possiblecontributors to these discrepancies include unmeasured factors such as physical pain orloneliness, the patient’s inability on a questionnaire to make distinctions between anxiety
Dunlop et al. Page 9
J Psychiatr Res. Author manuscript; available in PMC 2013 June 10.
NIH
-PA Author Manuscript
NIH
-PA Author Manuscript
NIH
-PA Author Manuscript

and depression, or a low literacy level or misinterpretation of the question’s focus. Anothercontributor that might be relevant for this sample is that patients with recurrent depressionmay be comparing their current symptom levels versus those of past episodes, and impartinga sense that the current episode is much worse (or not as bad) as the patient’s priorexperiences of depression, whereas the clinician is (ideally) rating symptoms withoutreference to past episode severity. It would also be of interest to conduct factor analyses toidentify the specific items on the HAM-D17 and IDS-SR30 that most contribute tononconcordance.
Differences between the findings of this study and other published data may be due in partto differences in characteristics of the study participants. In particular, the PREVENT studyenrolled patients with a history of recurrent depression, whereas other studies (e.g.,STAR*D) enrolled patients with more diverse psychiatric histories (Trivedi et al., 2006).Patients with recurrent depression may tend to view their symptoms within the context ofsymptoms experienced during previous episodes.
Future studies comparing concordance ratings between patients with recurrent depressionand patients with first-episode depression would be of interest. It may be possible to designand validate a mathematical correction factor to account for differences between clinician-and patient-ratings and thereby produce a more consistent measure of outcome.
AcknowledgmentsThis study was sponsored by Wyeth which was acquired by Pfizer Inc in October 2009. Medical writing support forthis manuscript was provided by Sally K. Laden, MS, of MSE Communications LLC, and medical editing supportwas provided by Nicole Hilberth, MS, of Advogent, and this support was funded by Pfizer, formerly WyethResearch, Collegeville, PA.
Role of funding source: Research supported by Pfizer Research.
ReferencesAmerican Psychiatric Association. Diagnostic and statistical manual of mental disorders. 4th ed..
Washington, DC: American Psychiatric Association;
Bernstein IH, Rush AJ, Carmody TJ, Woo A, Trivedi MH. Clinical vs. self-report versions of the quickinventory of depressive symptomatology in a public sector sample. Journal of Psychiatric Research.2007; 41:23–46.
Collier R. Drug development cost estimates hard to swallow. Canadian Medical Association Journal.2009; 180:279–280. [PubMed: 19188620]
Corruble E, Legrand JM, Zvenigorowski H, Duret C, Guelfi JD. Concordance between self-report andclinician’s assessment of depression. Journal of Psychiatric Research. 1999; 33:457–465. [PubMed:10504014]
Domken M, Scott J, Kelly P. What factors predict discrepancies between self and observer ratings ofdepression? Journal of Affective Disorders. 1994; 31:253–259. [PubMed: 7989640]
Dorz S, Borgherini G, Conforti D, Scarso C, Magni G. Comparison of self-rated and clinician-ratedmeasures of depressive symptoms: a naturalistic study. Psychology and Psychotherapy: Theory,Research and Practice. 2004; 77:353–361.
Dunlop BW, Li T, Kornstein SG, et al. Correlation between patient and clinician assessments ofdepression severity in the PREVENT study. Psychiatry Research. 2010; 177:177–183. [PubMed:20304503]
Hamilton M. The assessment of anxiety states by rating. British Journal of Medical Psychology. 1959;32:50–55. [PubMed: 13638508]
Hamilton M. A rating scale for depression. Journal of Neurology Neurosurgery and Psychiatry. 1960;23:56–62.
Dunlop et al. Page 10
J Psychiatr Res. Author manuscript; available in PMC 2013 June 10.
NIH
-PA Author Manuscript
NIH
-PA Author Manuscript
NIH
-PA Author Manuscript

Katz MM, Meyers AL, Prakash A, Gaynor PJ, Houston JP. Early symptom change prediction ofremission in depression treatment. Psychopharmacology Bulletin. 2009; 42:94–107. [PubMed:19204654]
Keller M, Trivedi MH, Thase ME, et al. The Prevention of Recurrent Episodes of Depression withVenlafaxine for Two Years (PREVENT) study: outcomes from the two-year and combinedmaintenance phases. Journal of Clinical Psychiatry. 2007a; 68:1246–1256. [PubMed: 17854250]
Keller MB, Trivedi MH, Thase ME, et al. The Prevention of Recurrent Episodes of Depression withVenlafaxine for Two Years (PREVENT) study: outcomes from the acute and continuation phases.Biological Psychiatry. 2007b; 62:1371–1379. [PubMed: 17825800]
Montgomery SA, Åsberg M. A new depression scale designed to be sensitive to change. BritishJournal of Psychiatry. 1979; 134:382–389. [PubMed: 444788]
Paykel ES, Prusoff BA, Klerman GL, DiMascio A. Self-report and clinical interview ratings indepression. Journal of Nervous and Mental Disease. 1973; 156:166–182. [PubMed: 4698664]
Rush AJ, Bernstein IH, Trivedi MH, et al. An evaluation of the quick inventory of depressivesymptomatology and the hamilton rating scale for depression: a sequenced treatment alternativesto relieve depression trial report. Biological Psychiatry. 2006a; 59:493–501. [PubMed: 16199008]
Rush AJ, Carmody TJ, Ibrahim HM, Trivedi MH, Biggs MM, Shores-Wilson K, Crismon ML, TopracMG, Kashner TM. Comparison of self-report and clinician ratings on two inventories ofdepressive symptomatology. Psychiatric Services. 2006b; 57:829–837. [PubMed: 16754760]
Rush AJ, Hiser W, Giles DE. A comparison of self-reported versus clinician-related symptoms indepression. Journal of Clinical Psychiatry. 1987; 48:246–248. [PubMed: 3584081]
Rush AJ, Trivedi MH, Ibrahim HM, et al. The 16-Item Quick Inventory of DepressiveSymptomatology (QIDS), clinician rating (QIDS-C), and self-report (QIDS-SR): a psychometricevaluation in patients with chronic major depression. Biological Psychiatry. 2003; 54:573–583.[PubMed: 12946886]
Szegedi A, Jansen WT, van Willigenburg AP, van der ME, Stassen HH, Thase ME. Earlyimprovement in the first 2 weeks as a predictor of treatment outcome in patients with majordepressive disorder: a meta-analysis including 6562 patients. Journal of Clinical Psychiatry. 2009;70:344–353. [PubMed: 19254516]
Trivedi MH, Rush AJ, Wisniewski SR, et al. Evaluation of outcomes with citalopram for depressionusing measurement-based care in STAR*D: implications for clinical practice. American Journal ofPsychiatry. 2006; 163:28–40. [PubMed: 16390886]
Dunlop et al. Page 11
J Psychiatr Res. Author manuscript; available in PMC 2013 June 10.
NIH
-PA Author Manuscript
NIH
-PA Author Manuscript
NIH
-PA Author Manuscript

Fig. 1.Flow chart of the PREVENT study and patient categories at each stage.
Dunlop et al. Page 12
J Psychiatr Res. Author manuscript; available in PMC 2013 June 10.
NIH
-PA Author Manuscript
NIH
-PA Author Manuscript
NIH
-PA Author Manuscript

Fig. 2.Time to HAM-D17 Remission During Acute Treatment for Concordance, Underrating, andOverrating Patients.
Dunlop et al. Page 13
J Psychiatr Res. Author manuscript; available in PMC 2013 June 10.
NIH
-PA Author Manuscript
NIH
-PA Author Manuscript
NIH
-PA Author Manuscript

Fig. 3.Time to HAM-D17 Response During Acute Treatment for Concordance, Underrating, andOverrating Patients.
Dunlop et al. Page 14
J Psychiatr Res. Author manuscript; available in PMC 2013 June 10.
NIH
-PA Author Manuscript
NIH
-PA Author Manuscript
NIH
-PA Author Manuscript

NIH
-PA Author Manuscript
NIH
-PA Author Manuscript
NIH
-PA Author Manuscript
Dunlop et al. Page 15
Table 1
Baseline predictors of more severe patient- vs clinician-rated depression severity during acute andcontinuation treatment.
Odds Ratio (95% CI)
Age Body mass index Male vs female Lifetime MDD episodes
Acute Phase
Baseline 0.96 (0.94–0.98) ‡ 1.09 (1.05–1.13)§ 0.54 (0.32–0.90)* 1.01 (1.00–1.02)*
Week 1 0.97 (0.95–0.99)† 1.06 (1.02–1.10)† 0.45 (0.27–0.76)† 1.00 (0.99–1.01)
Week 2 0.98 (0.96–1.00) 1.05 (1.02–1.09)† 0.47 (0.28–0.79)† 1.01 (1.00–1.02)*
Week 3 1.00 (0.98–1.02) 1.05 (1.01–1.09)† 0.76 (0.44–1.29) 1.00 (0.99–1.01)
Week 4 1.00 (0.98–1.03) 1.07 (1.03–1.11)‡ 0.42 (0.24–0.74)† 1.00 (1.00–1.01)
Week 6 1.01 (0.99–1.03) 1.06 (1.02–1.10)† 0.46 (0.25–0.82)† 1.00 (0.99–1.01)
Week 8 1.02 (1.00–1.04) 1.03 (0.99–1.07) 0.67 (0.38–1.17) 1.00 (0.99–1.01)
Week 10 1.02 (1.00–1.05) 1.02 (0.98–1.06) 0.53 (0.29–0.98)* 1.00 (0.99–1.01)
Continuation Phase
Month 1 1.03 (1.00–1.06)* 1.02 (0.98–1.07) 0.59 (0.29–1.20) 1.01 (1.00–1.02)
Month 2 1.02 (0.99–1.04) 0.99 (0.95–1.04) 0.67 (0.33–1.38) 1.01 (1.00–1.02)
Month 3 1.03 (1.00–1.06) 1.00 (0.95–1.05) 1.52 (0.71–3.29) 1.01 (0.99–1.02)
Month 4 1.02 (0.99–1.06) 1.02 (0.97–1.08) 1.16 (0.53–2.52) 1.01 (0.99–1.02)
Month 5 1.04 (1.00–1.07)* 1.00 (0.95–1.05) 0.98 (0.43–2.26) 1.00 (0.98–1.01)
Month 6 1.06 (1.02–1.09)‡ 1.02 (0.97–1.08) 0.99 (0.43–2.28) 1.01 (0.99–1.02)
CI = confidence interval; MDD = major depressive disorder.
*P<0.05;
†P≤ 0.01;
‡P< 0.001;
§P< 0.0001.
J Psychiatr Res. Author manuscript; available in PMC 2013 June 10.
NIH
-PA Author Manuscript
NIH
-PA Author Manuscript
NIH
-PA Author Manuscript
Dunlop et al. Page 16
Tabl
e 2
Sum
mar
y of
rem
issi
on o
r re
spon
se b
y ba
selin
e pa
tient
-clin
icia
n as
sess
men
t dis
crep
ancy
for
acu
te p
hase
IT
T p
opul
atio
n.
Pat
ient
Cat
egor
y at
Acu
te P
hase
Bas
elin
eR
emis
sion
Res
pons
e
HA
M-D
17C
GI-
SID
S-SR
HA
M-D
17C
GI-
CID
S-SR
Yes
No
Yes
No
Yes
No
Yes
No
Yes
No
Yes
No
n (%
)n
(%)
n (%
)n
(%)
n (%
)n
(%)
n (%
)n
(%)
n (%
)n
(%)
n (%
)n
(%)
Und
erra
ting
75 (
46)
89 (
54)
97 (
59)
67 (
41)
74 (
45)
90 (
55)
121
(74)
43 (
26)
125
(76)
39 (
24)
89 (
54)
75 (
46)
Con
cord
ant
361
(51)
353
(49)
425
(60)
289
(40)
294
(41)
419
(59)
528
(74)
186
(26)
545
(76)
169
(24)
418
(59)
295
(41)
Ove
rrat
ing
67 (
45)
81 (
55)
81 (
55)
67 (
45)
51 (
35)
97 (
66)
102
(69)
46 (
31)
108
(73)
40 (
27)
85 (
57)
63 (
42)
CG
I-C
= C
linic
al G
loba
l Im
pres
sion
s–C
hang
e; C
GI-
S =
Clin
ical
Glo
bal I
mpr
essi
ons–
Seve
rity
; HA
M-D
17 =
17-
item
Ham
ilton
Rat
ing
Scal
e fo
r D
epre
ssio
n; I
DS-
SR =
Inv
ento
ry o
f D
epre
ssiv
e
Sym
ptom
atol
ogy–
Self
-Rep
ort;
ITT
= in
tent
to tr
eat.
Rem
issi
on is
def
ined
as:
HA
M-D
17 ≤
7; C
GI-
S ≤2
; ID
S-SR
≤ 1
4.
Res
pons
e is
def
ined
as:
HA
M-D
17 d
ecre
ase
≥ 50
% f
rom
acu
te p
hase
bas
elin
e; C
GI-
C ≤
2; I
DS-
SR d
ecre
ase
≥ 50
% o
r m
ore
from
acu
te p
hase
bas
elin
e.
All
Man
tel-
Hae
nsze
l chi
-squ
are
test
P-v
alue
s >
.05
(not
sig
nifi
cant
).
J Psychiatr Res. Author manuscript; available in PMC 2013 June 10.

NIH
-PA Author Manuscript
NIH
-PA Author Manuscript
NIH
-PA Author Manuscript
Dunlop et al. Page 17
Tabl
e 3
Rem
issi
on o
r re
spon
se in
con
tinua
tion
phas
e by
wee
k 10
clin
icia
n-pa
tient
ass
essm
ent d
iscr
epan
cy.
Vis
itP
atie
nt C
ateg
ory
at W
eek
10R
emis
sion
Res
pons
e
HA
M-D
17C
GI-
SID
S-SR
HA
M-D
17C
GI-
CID
S-SR
Yes
No
Yes
No
Yes
No
Yes
No
Yes
No
Yes
No
n (%
)n
(%)
n (%
)n
(%)
n (%
)n
(%)
n (%
)n
(%)
n (%
)n
(%)
n (%
)n
(%)
Mon
th 6
Con
cord
ant
275
(83)
56†
(17)
299
(91)
31†
(9)
234
(71)
97†
(29)
314
(95)
17 (
5)29
9 (9
1)31
† (9
)27
7 (8
4)54
‡ (1
6)
Non
conc
orda
nt71
(68
)33
(32
)82
(79
)22
(21
)59
(57
)45
(43
)97
(93
)7
(7)
82 (
79)
22 (
21)
71 (
68)
33 (
32)
Fina
l Vis
itC
onco
rdan
t37
9 (7
6)12
3‡ (
24)
415
(83)
87‡
(17)
321
(64)
180†
(36
)45
1 (9
0)51
* (1
0)41
5 (8
3)87
† (1
7)38
9 (7
8)11
2‡ (
22)
Non
conc
orda
nt10
4 (5
9)72
(41
)12
4 (7
0)52
(30
)88
(50
)87
(50
)14
6 (8
3)30
(17
)12
4 (7
0)52
(30
)10
7 (6
1)68
(39
)
CG
I-S
= C
linic
al G
loba
l Im
pres
sion
—Se
veri
ty; H
AM
-D17
= 1
7-ite
m H
amilt
on R
atin
g Sc
ale
for
Dep
ress
ion;
ID
S-SR
= I
nven
tory
of
Dep
ress
ive
Sym
ptom
atol
ogy–
Self
-Rep
ort;
ITT
= in
tent
to tr
eat.
Rem
issi
on is
def
ined
as:
HA
M-D
17≤
7; C
GI-
S ≤2
; ID
S-SR
≤ 1
4.
Res
pons
e is
def
ined
as:
HA
M-D
17 d
ecre
ase
≥50%
fro
m a
cute
pha
se b
asel
ine;
CG
I-C
≤ 2
; ID
S-SR
dec
reas
e ≥5
0% o
r m
ore
from
acu
te p
hase
bas
elin
e.
* P≤ 0
.05
from
Man
tel-
Hae
nsze
l chi
-squ
are
test
con
cord
ance
-rat
er v
s no
ncon
cord
ance
.
† P≤ 0
.01
from
Man
tel-
Hae
nsze
l chi
-squ
are
test
con
cord
ance
-rat
er v
s no
ncon
cord
ance
.
‡ P< 0
.001
fro
m M
ante
l-H
aens
zel c
hi-s
quar
e te
st c
onco
rdan
ce-r
ater
vs
nonc
onco
rdan
ce.
J Psychiatr Res. Author manuscript; available in PMC 2013 June 10.

NIH
-PA Author Manuscript
NIH
-PA Author Manuscript
NIH
-PA Author Manuscript
Dunlop et al. Page 18
Tabl
e 4
Rem
issi
on o
r re
spon
se in
con
tinua
tion
phas
e by
Wee
k 10
clin
icia
n-pa
tient
ass
essm
ent d
iscr
epan
cy.
Vis
itP
atie
nt C
ateg
ory
at W
eek
10R
emis
sion
Res
pons
e
HA
M-D
17C
GI-
SID
S-SR
HA
M-D
17C
GI-
CID
S-SR
Yes
No
Yes
No
Yes
No
Yes
No
Yes
No
Yes
No
n (%
)n
(%)
n (%
)n
(%)
n (%
)n
(%)
n (%
)n
(%)
n (%
)n
(%)
n (%
)n
(%)
Mon
th 6
Und
erra
ting
34 (
74)
12 (
26)
38 (
83)
8 (1
7)39
(85
)7‡
(15
)40
(87
)6*
(13
)38
(83
)8
(17)
39 (
85)
7‡ (
15)
Con
cord
ant
275
(83)
56 (
17)
299
(91)
31 (
9)23
4 (7
1)97
(29
)31
4 (9
5)17
(5)
299
(91)
31 (
9)27
7 (8
4)54
(16
)
Ove
rrat
ing
37 (
64)
21 (
36)
44 (
76)
14 (
24)
20 (
34)
38 (
66)
57 (
98)
1 (2
)44
(76
)14
(24
)32
(55
)26
(45
)
Fina
l Vis
itU
nder
ratin
g44
(60
)30
(40
)55
(74
)19
(26
)56
(76
)18
‡ (2
4)58
(78
)16
(22
)55
(74
)19
(26
)57
(77
)17
‡ (2
3)
Con
cord
ant
379
(76)
123
(24)
415
(83)
87 (
17)
321
(64)
180
(36)
451
(90)
51 (
10)
415
(83)
87 (
17)
389
(78)
112
(22)
Ove
rrat
ing
60 (
59)
42 (
41)
69 (
68)
33 (
32)
32 (
32)
69 (
68)
88 (
86)
14 (
14)
69 (
68)
33 (
32)
50 (
50)
51 (
50)
CG
I-S
= C
linic
al G
loba
l Im
pres
sion
s–Se
veri
ty; H
AM
-D17
= 1
7-ite
m H
amilt
on R
atin
g Sc
ale
for
Dep
ress
ion;
ID
S-SR
= I
nven
tory
of
Dep
ress
ive
Sym
ptom
atol
ogy
– Se
lf-R
epor
t.
Rem
issi
on is
def
ined
as:
HA
M-D
17≤
7; C
GI-
S ≤2
; ID
S-SR
≤ 1
4.
Res
pons
e is
def
ined
as:
HA
M-D
17 d
ecre
ase
>50
% f
rom
acu
te p
hase
bas
elin
e; C
GI-
C ≤
2; I
DS-
SR d
ecre
ase
≥50%
or
mor
e fr
om a
cute
pha
se b
asel
ine.
* P≤ 0
.05
from
3-w
ay M
ante
l-H
aens
zel c
hi-s
quar
e te
st.
† P≤ 0
.01
from
3-w
ay M
ante
l-H
aens
zel c
hi-s
quar
e te
st.
‡ P≤ 0
.001
fro
m 3
-way
Man
tel-
Hae
nsze
l chi
-squ
are
test
.
J Psychiatr Res. Author manuscript; available in PMC 2013 June 10.

NIH
-PA Author Manuscript
NIH
-PA Author Manuscript
NIH
-PA Author Manuscript
Dunlop et al. Page 19
Table 5
Changes in patient-clinician assessment discrepancy from baseline through the completion of the 6-Monthcontinuation phase.
Time Point Baseline Patient Category
Underrating Concordant Overrating
Acute Phase (n, % of acute phase population)
Baseline 164 (100.0) 714 (100.0) 148 (100.0)
Discontinued during acute phase 47 (28.7) 162 (22.7) 48 (32.4)
Week 10 completers 117 (71.3) 552 (77.3) 100 (67.6)
Rater Category at Week 10 (n, % of week 10 completers)
Underraters 24 (20.5) 72 (13.0) 8 (8.0)
Concordance raters 84 (71.8) 406 (73.6) 68 (68.0)
Overraters 9 (7.7) 74 (13.4) 24 (24.0)
Continuation Phase (n, % of continuation phase population)
Entered continuation phase 72 (100.0) 517 (100.0) 104 (100.0)
Discontinued during continuation phase 27 (37.5) 194 (37.5) 46 (44.2)
Month 6 completers 45 (62.5) 323 (62.5) 58 (55.8)
Rater Category at Month 6 (n, % of month 6 completers)
Underraters 17 (37.8) 41 (12.7) 3 (5.2)
Concordance raters 27 (60.0) 247 (76.5) 30 (51.7)
Overraters 1 (2.2) 35 (10.8) 25 (43.1)
J Psychiatr Res. Author manuscript; available in PMC 2013 June 10.
Copyright © 2022 FDOKUMEN


![Polyclonal hematopoietic reconstitution in leukemia patients at remission after suppression of specific gene rearrangements [see comments]](https://static.fdokumen.com/doc/165x107/633576362532592417008ca6/polyclonal-hematopoietic-reconstitution-in-leukemia-patients-at-remission-after.jpg)