A revision of Oriental Teloganodidae (Insecta, Ephemeroptera, Ephemerelloidea)

Concordance between Ephemeroptera and Trichopteraassemblage in streams from Cerrado – Amazonia transition
Leandro Juen1*, Denis S. Nogueira2, Yulie Shimano3, Ludgero C. Galli Vieira4
and Helena S. R. Cabette5
1 Instituto de Ciencias Biologicas, Universidade Federal do Para, Rua Augusto Correia, no 1 Bairro Guama, 66.075-110 Belem,PA, Brazil
2 Programa de Pos-Graduacao em Ecologia e Evolucao, Universidade Federal de Goias, Caixa Postal 24.241, 74.690-970 Goiania,GO, Brazil
3 Programa de Pos-Graduacao em Zoologia, Universidade Federal do Para, Rua Augusto Correia, no 1 Bairro Guama, 66.075-110Belem, PA, Brazil
4 Universidade de Brasılia, Campus de Planaltina (FUP), Area Universitaria 1, Vila Nossa Senhora de Fatima, 73.340-710 Planaltina,DF, Brazil
5 Departamento de Ciencias Biologicas, Universidade do Estado de Mato Grosso, Caixa Postal 08, 78.690-000 Nova Xavantina,Mato Grosso, Brazil
Received 11 December 2012; Accepted 22 April 2013
Abstract – We evaluated the concordance between assemblages of Ephemeroptera and Trichoptera to verifyif they respond similarly to environmental gradients in the basin of Suia-Missu river in Mato Grosso, centralBrazil. We tested the predictions that: (i) the distributional pattern of mayfly and caddisfly larvae is
concordant along the spatial and (ii) environmental variation along the basin, and if (iii) taxa are concordantbetween themselves along the seasons and with the environmental gradients disregarding the seasons of theyear. We found a concordance between species composition of mayfly and caddisfly in fall-water and rainy
period, when analyzed separately by each season. The concordance between environmental variables andthe two taxa analyzed separately also was concordant, but only on the fall-water season. Finally, we foundcongruence when both analyzed groups disregarded the temporal effect, but it was less representative than
when we consider the seasons variation. Our results suggest that the hydrological cycle could be a driver ofchanges in species composition of mayflies and caddisflies.
Key words: Biotic patterns / macroinvertebrates / aquatic insects / temporal variations /environmental gradient
Introduction
The major goal in ecology is to understand how para-meters of biological communities (abundance, richness,and composition) respond to environmental variations(De Chaine andMartin, 2005; Bini et al., 2007). Studies onorganism’s distributions in nature have revealed recurringpatterns along environmental gradients, such as changes incommunity structures and species composition; latitudinalcongruence of diversity can arise even in unrelated groupsfrom all biogeographical regions around the world (Heino,2002; Bini et al., 2007).
Similar spatial and temporal pattern among twoor more taxa in relation to environmental gradient iscalled community concordance (Bowman et al., 2008).Concordant patterns may also represent common prefer-ences and adaptations, biotic interactions, covariance ofassemblage responses to determinant environmental prop-erties or even historical factors related to habitat coloniza-tion and evolution (Bini et al., 2008). Thus, studies ofcommunity concordance can be used to evaluate patternsin biological communities, biodiversity, as a measure ofresponses to environmental changes and the placementof different taxa in a single surrogate group (Cameronet al., 2008). Some authors found concordance betweenaquatic organisms with similar dispersal ability, similarsizes and habits requirements (Heino, 2010), among*Corresponding author: [email protected]
Article published by EDP Sciences
Ann. Limnol. - Int. J. Lim. 49 (2013) 129–138 Available online at:� EDP Sciences, 2013 www.limnology-journal.orgDOI: 10.1051/limn/2013048

macroinvertebrates, fish and algae (Monaghan andSoares, 2010), between fish and birds (Paszkowski andTonn, 2000) and among phytoplankton, zooplankton,macroinvertebrates, and fish (Bowman et al., 2008).
The most important theories about energetic dynamicsof rivers suggest that river sizes can produce concordanceamong several taxa, according to their functional adjustsalong the River Continuum (Vannote et al., 1980). Thisinformation increases the power of hypothesis general-ization and effectiveness in model building (Heino, 2010).In addition, certain groups may be surrogate for bio-diversity assessment when analyzing responses to environ-mental changes in local and landscape scale and they canbe used in monitoring programs to minimize costs whentwo or more groups respond similarly to environmentalchanges (Faith, 2003; Heino and Mykra, 2006). However,there is evidence suggesting that the choice of indicatorsor surrogate groups may have limited value for studies offreshwater biodiversity due to divergent patterns or lowconcordance between communities (Heino et al., 2005;Heino, 2010), which often reflects differences in evolutivehistory among clades of aquatic organisms.
The insect orders Ephemeroptera (mayflies) andTrichoptera (caddisflies) occupy a wide range of habitatsin lotic ecosystems, inhabiting several meso and micro-habitats from small streams to large rivers (Wiggins andMackay, 1978; Wiggins, 1996; Domınguez et al., 2006).The distribution of these insects is related to food avail-ability, environmental variables and energy input along awatershed continuum (Vannote et al., 1980). In freshwaterenvironments, mayflies and caddisflies are important linksin food webs, also have similar body size range, and showhigh local species richness and abundance. These groupsare widely studied and used in biomonitoring programsdue to high sensitivity to pollutants and other environ-mental disturbances (Rosenberg and Resh, 1993).
Our goal was to evaluate the concordance betweenmayflies and caddisflies assemblages along an environ-mental gradient in Suia-Missu river tributaries, MatoGrosso, Central Brazil. Specifically, following predictionsof similar traits among several groups of Ephemeropteraand Trichoptera on tropical ecosystems we tested if (i) dis-tributional pattern of mayfly and caddisfly larvae are con-cordant along the spatial and (ii) environmental variationalong the basin, and if (iii) taxa are concordant betweenthemselves and with the environmental variation along theseasons of the year.
Methods
Study site
Suia-Missu river is the main tributary of the Xinguriver, located in the transition zone between Cerrado andAmazon Forest, in Mato Grosso, central Brazil (between11x15' to 13x40'S and 53x15' to 51x15'W). Climate is sea-sonal tropical, with a dry (May–October) and rainy season(November–April). In Koppen climate classification, the
major part of the region is Savanna (Aw), with micro-regions with monsoon subtype (Am), and tropical rainy(A). The rainfall annual mean is 1.370 mm, and themonthly mean temperature varies between 32.7 and17.0 xC (Ratter et al., 1978).
The predominant economic activities are wood exploi-tation, rice and soybean monocultures, and extensivepasture for cattle (Riva et al., 2007). Recently, damsconstruction project to provide energy building havegenerated interest conflicts between conservationists andgovernment priorities in middle Xingu River, in ParaState, despite their low-energy supply potential andprobability of high sedimentation (Carvalho et al., 2004).The impact of dam construction on regional biodiversity isstill understudied, but it is especially dangerous for aquaticorganisms.
For evaluation of concordance among Ephemeropteraand Trichoptera, we selected 12 sampling sites encompass-ing several types of Cerrado vegetation in Suia-Missu riverand its tributaries (Fig. 1). The sampled streams rangedfrom 1st to 6th order, following Strahler (1957), and theyvaried in channel width, water flow, vegetation in riparianzone, and conservation status (see Fig. 1 for abbrevia-tions). The substrata found in the sampling sites rangedfrom roots on banks, submerged vegetation, leaves, stemsand twigs in pools and rapids, rocks, gravel and sand inlotic environments; and submerged macrophytes, rootsand fine particulate organic matter, and silt in marshyenvironments (for details see Shimano et al., 2010;Nogueira et al., 2011).
Data sampling
We sampled insect larvae in dry (September 2007),rainy (December 2007), and fall-water (May 2008)seasons. We established 100 m transects in each one of 12sampling sites, subdivided into 20 segments of 5 m follow-ing the methodology adapted from Juen and De Marco(2011). We sampled portions of substratum withineach segment with a dip netting of 18 cm diameter and0.025 mmmesh. By this method, the pseudo-sample unit iseach 5 m segments of the 100 m transect, which are usedto estimate species richness for each site. Taxonomiccompositions are assessed by sum of species abundance inall subsamples (see details below).
We identified specimens using genus keys forEphemeroptera (Domınguez et al., 2006) and Trichoptera(Angrisano and Korob, 2001; Pes et al., 2005). Afterwards,the species were morphospecied using phenotypic char-acteristics to distinguish the last larval stages within genus.The specimens were preserved in 85% alcohol and housedat the Colecao Zoobotanica “James Alexander Ratter”(CZNX), Universidade do Estado deMato Grosso, Brazil.
Physicochemical data were sampled in three seasons, inthe same transects used by insect larvae sampling. We re-corded water temperature, pH, turbidity, electrical con-ductivity, dissolved oxygen, depth, flow, total solublesolids, and redox potential using a multiparameter probe.
L. Juen et al.: Ann. Limnol. - Int. J. Lim. 49 (2013) 129–138130

We measured concentrations of ammonium nitrate,nitrite, and phosphate ions with a portable spectrophoto-meter, and total hardness, Ca++ and Mg++ with 0.0002M EDTA. Streams and rivers widths were measured witha tape-measure. We evaluated environmental integritywith Habitat Integrity Index-HII (Nessimian et al., 2008).This index is based on measurement of a series ofparameters visually assessed related to land use, riparianzone conservation, streambed characteristics, and streamchannel morphology related to margin and streamlet bedstructure.
Data analysis
We used eight variables that were selected after wetested multicolinearity by correlation matrix (water tem-perature, pH, turbidity, electrical conductivity, dissolvedoxygen, depth, width, and HII). To reduce dimensionalityin abiotic data, we used principal component analysis(PCA) based on the correlation matrix of environmentalvariables after log transformation (except for pH) andstandardization (Olden et al., 2001). Posteriorly, we usedthe Broken stick method (Jackson and Harvey, 1993) toselect the number of axes for interpretation. Analysis wasdesigned in R environment by using functions of veganpackage (Oksanen et al., 2011). To test the significance of
the groups (seasons) formed in PCA, we run an ANOVAfor the two first PCA axis.
We estimated species richness for each insect order andfor both orders combined with the nonparametric estima-tor first order jackknife by using EstimateS v.7.5.0(Colwell, 2005). Then, we have an estimative for speciesrichness for each order in studied seasons and for acombination of both orders, which were regressed againstenvironmental gradients summarized in PCA axes. Inaddition, we tested species richness and abundance alongseasons using non-parametric repeated measuresFriedman ANOVA and pairwise comparisons for signifi-cant results were evaluated by using Wilcoxon matchedpairs test for dependent samples (Zar, 1999).
We analyzed the structure of mayfly and caddisflyassemblages in relation to abiotic data using an indirectgradient analysis (Gauch, 1982). We used a detrendedcorrespondence analysis (DCA) to summarize speciescomposition (abundance) in different environments.Correspondence analysis was run with data of all streamssampled, after log transformation.
We evaluated the degree of concordance betweenspecies composition matrix and abiotic data using aProcrustean routine (Jackson, 1995). We performed thisanalysis with the scores of the first two axes of eachordination (DCA and PCA), since they contain most ofthe variability of original data. We perform this procedure
Fig. 1. Sampling sites of mayfly and caddisfly larvae in the Basin of Rio Suia-Missu, Mato Grosso (SR1=Suia-Missu River;
SR2=Suia-Missu River; SR3=Suia-Missu River; SS=Sucuri Stream; DR=Darro River; BR1=Betis River; BR2=Betis River;SZR=Suiazinho River; TS=Transicao Stream; PR=Piabanha River; LS=Lucio Stream; and BS=Brejao Stream).
L. Juen et al.: Ann. Limnol. - Int. J. Lim. 49 (2013) 129–138 131
in different ways to account for all environmentalvariability in our dataset. Firstly, we evaluated spatialconcordance of the order within each season (dry, rainy,and fall-water seasons). Afterwards, we analyzed theconcordance between a dataset composed by both ordersagainst environmental seasonality in three separate sea-sons. Finally, we analyzed the temporal concordance usingseasons as replicate. The test statistic (m2) measures howdivergent ordination patterns of the two datasets are, andthe significance is then tested after 10 000 permutations.The Procrustes analysis was performed in R software(version 2.10.1) (R Development Core Team, 2011).
Results
Environmental variables
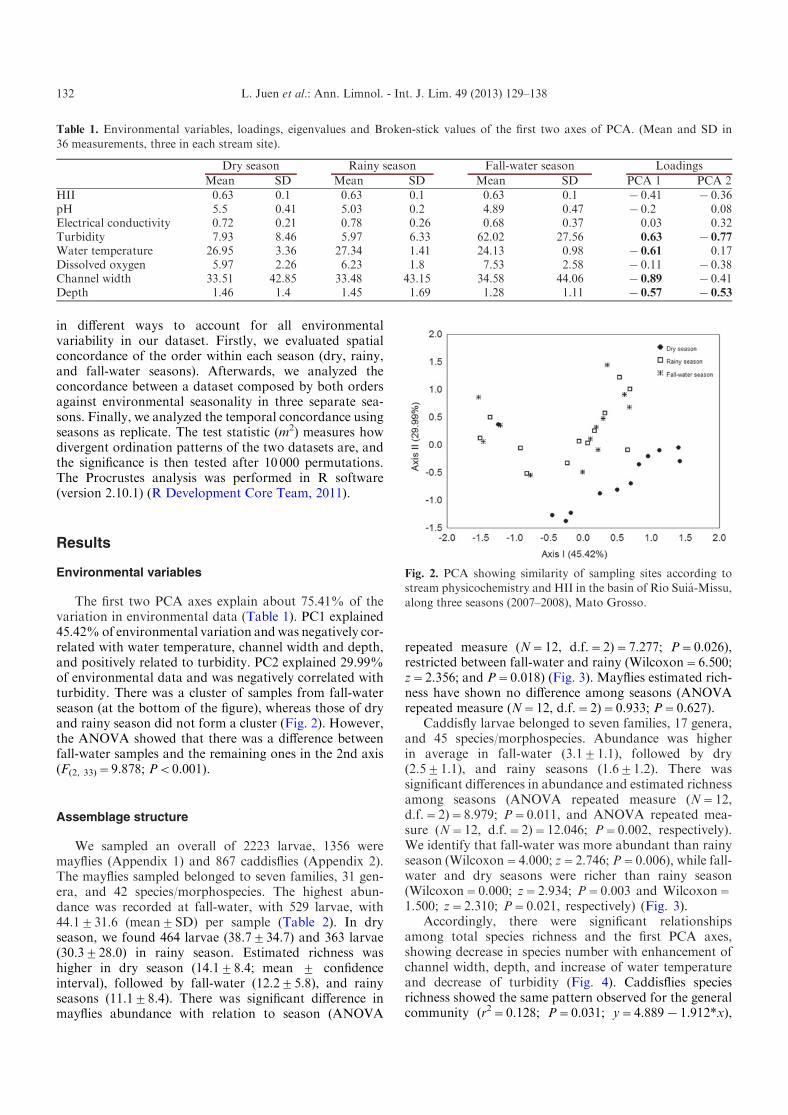
The first two PCA axes explain about 75.41% of thevariation in environmental data (Table 1). PC1 explained45.42%of environmental variation andwas negatively cor-related with water temperature, channel width and depth,and positively related to turbidity. PC2 explained 29.99%of environmental data and was negatively correlated withturbidity. There was a cluster of samples from fall-waterseason (at the bottom of the figure), whereas those of dryand rainy season did not form a cluster (Fig. 2). However,the ANOVA showed that there was a difference betweenfall-water samples and the remaining ones in the 2nd axis(F(2, 33)=9.878; P<0.001).
Assemblage structure
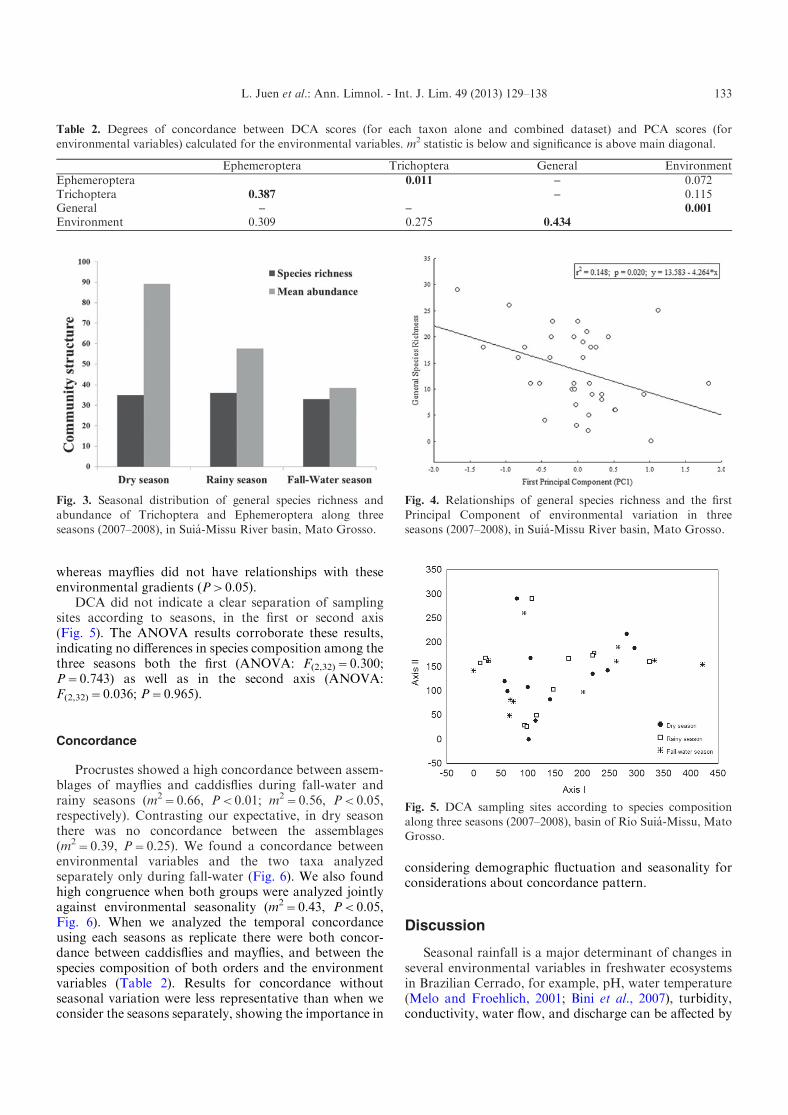
We sampled an overall of 2223 larvae, 1356 weremayflies (Appendix 1) and 867 caddisflies (Appendix 2).The mayflies sampled belonged to seven families, 31 gen-era, and 42 species/morphospecies. The highest abun-dance was recorded at fall-water, with 529 larvae, with44.1¡31.6 (mean¡SD) per sample (Table 2). In dryseason, we found 464 larvae (38.7¡34.7) and 363 larvae(30.3¡28.0) in rainy season. Estimated richness washigher in dry season (14.1¡8.4; mean ¡ confidenceinterval), followed by fall-water (12.2¡5.8), and rainyseasons (11.1¡8.4). There was significant difference inmayflies abundance with relation to season (ANOVA
repeated measure (N=12, d.f.=2)=7.277; P=0.026),restricted between fall-water and rainy (Wilcoxon=6.500;z=2.356; and P=0.018) (Fig. 3). Mayflies estimated rich-ness have shown no difference among seasons (ANOVArepeated measure (N=12, d.f.=2)=0.933; P=0.627).
Caddisfly larvae belonged to seven families, 17 genera,and 45 species/morphospecies. Abundance was higherin average in fall-water (3.1¡1.1), followed by dry(2.5¡1.1), and rainy seasons (1.6¡1.2). There wassignificant differences in abundance and estimated richnessamong seasons (ANOVA repeated measure (N=12,d.f.=2)=8.979; P=0.011, and ANOVA repeated mea-sure (N=12, d.f.=2)=12.046; P=0.002, respectively).We identify that fall-water was more abundant than rainyseason (Wilcoxon=4.000; z=2.746; P=0.006), while fall-water and dry seasons were richer than rainy season(Wilcoxon=0.000; z=2.934; P=0.003 and Wilcoxon=1.500; z=2.310; P=0.021, respectively) (Fig. 3).
Accordingly, there were significant relationshipsamong total species richness and the first PCA axes,showing decrease in species number with enhancement ofchannel width, depth, and increase of water temperatureand decrease of turbidity (Fig. 4). Caddisflies speciesrichness showed the same pattern observed for the generalcommunity (r2=0.128; P=0.031; y=4.889x1.912*x),
Table 1. Environmental variables, loadings, eigenvalues and Broken-stick values of the first two axes of PCA. (Mean and SD in
36 measurements, three in each stream site).
Dry season Rainy season Fall-water season Loadings
Mean SD Mean SD Mean SD PCA 1 PCA 2HII 0.63 0.1 0.63 0.1 0.63 0.1 x0.41 x0.36pH 5.5 0.41 5.03 0.2 4.89 0.47 x0.2 0.08Electrical conductivity 0.72 0.21 0.78 0.26 0.68 0.37 0.03 0.32Turbidity 7.93 8.46 5.97 6.33 62.02 27.56 0.63 x0.77
Water temperature 26.95 3.36 27.34 1.41 24.13 0.98 x0.61 0.17Dissolved oxygen 5.97 2.26 6.23 1.8 7.53 2.58 x0.11 x0.38Channel width 33.51 42.85 33.48 43.15 34.58 44.06 x0.89 x0.41Depth 1.46 1.4 1.45 1.69 1.28 1.11 x0.57 x0.53
Fig. 2. PCA showing similarity of sampling sites according tostream physicochemistry and HII in the basin of Rio Suia-Missu,
along three seasons (2007–2008), Mato Grosso.
L. Juen et al.: Ann. Limnol. - Int. J. Lim. 49 (2013) 129–138132
whereas mayflies did not have relationships with theseenvironmental gradients (P>0.05).
DCA did not indicate a clear separation of samplingsites according to seasons, in the first or second axis(Fig. 5). The ANOVA results corroborate these results,indicating no differences in species composition among thethree seasons both the first (ANOVA: F(2,32)=0.300;P=0.743) as well as in the second axis (ANOVA:F(2,32)=0.036; P=0.965).
Concordance
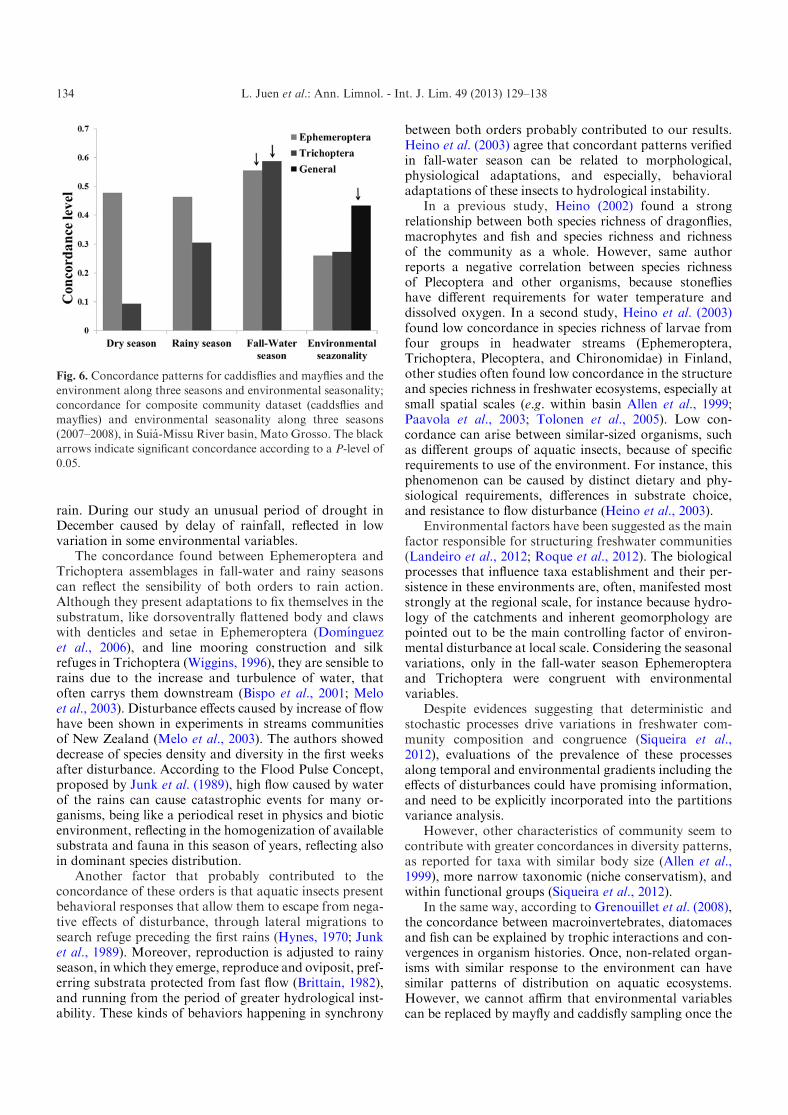
Procrustes showed a high concordance between assem-blages of mayflies and caddisflies during fall-water andrainy seasons (m2=0.66, P<0.01; m2=0.56, P<0.05,respectively). Contrasting our expectative, in dry seasonthere was no concordance between the assemblages(m2=0.39, P=0.25). We found a concordance betweenenvironmental variables and the two taxa analyzedseparately only during fall-water (Fig. 6). We also foundhigh congruence when both groups were analyzed jointlyagainst environmental seasonality (m2=0.43, P<0.05,Fig. 6). When we analyzed the temporal concordanceusing each seasons as replicate there were both concor-dance between caddisflies and mayflies, and between thespecies composition of both orders and the environmentvariables (Table 2). Results for concordance withoutseasonal variation were less representative than when weconsider the seasons separately, showing the importance in
considering demographic fluctuation and seasonality forconsiderations about concordance pattern.
Discussion
Seasonal rainfall is a major determinant of changes inseveral environmental variables in freshwater ecosystemsin Brazilian Cerrado, for example, pH, water temperature(Melo and Froehlich, 2001; Bini et al., 2007), turbidity,conductivity, water flow, and discharge can be affected by
Table 2. Degrees of concordance between DCA scores (for each taxon alone and combined dataset) and PCA scores (for
environmental variables) calculated for the environmental variables. m2 statistic is below and significance is above main diagonal.
Ephemeroptera Trichoptera General EnvironmentEphemeroptera 0.011 – 0.072Trichoptera 0.387 – 0.115General – – 0.001
Environment 0.309 0.275 0.434
Fig. 3. Seasonal distribution of general species richness and
abundance of Trichoptera and Ephemeroptera along threeseasons (2007–2008), in Suia-Missu River basin, Mato Grosso.
Fig. 4. Relationships of general species richness and the first
Principal Component of environmental variation in threeseasons (2007–2008), in Suia-Missu River basin, Mato Grosso.
Fig. 5. DCA sampling sites according to species composition
along three seasons (2007–2008), basin of Rio Suia-Missu, MatoGrosso.
L. Juen et al.: Ann. Limnol. - Int. J. Lim. 49 (2013) 129–138 133
rain. During our study an unusual period of drought inDecember caused by delay of rainfall, reflected in lowvariation in some environmental variables.
The concordance found between Ephemeroptera andTrichoptera assemblages in fall-water and rainy seasonscan reflect the sensibility of both orders to rain action.Although they present adaptations to fix themselves in thesubstratum, like dorsoventrally flattened body and clawswith denticles and setae in Ephemeroptera (Domınguezet al., 2006), and line mooring construction and silkrefuges in Trichoptera (Wiggins, 1996), they are sensible torains due to the increase and turbulence of water, thatoften carrys them downstream (Bispo et al., 2001; Meloet al., 2003). Disturbance effects caused by increase of flowhave been shown in experiments in streams communitiesof New Zealand (Melo et al., 2003). The authors showeddecrease of species density and diversity in the first weeksafter disturbance. According to the Flood Pulse Concept,proposed by Junk et al. (1989), high flow caused by waterof the rains can cause catastrophic events for many or-ganisms, being like a periodical reset in physics and bioticenvironment, reflecting in the homogenization of availablesubstrata and fauna in this season of years, reflecting alsoin dominant species distribution.
Another factor that probably contributed to theconcordance of these orders is that aquatic insects presentbehavioral responses that allow them to escape from nega-tive effects of disturbance, through lateral migrations tosearch refuge preceding the first rains (Hynes, 1970; Junket al., 1989). Moreover, reproduction is adjusted to rainyseason, in which they emerge, reproduce and oviposit, pref-erring substrata protected from fast flow (Brittain, 1982),and running from the period of greater hydrological inst-ability. These kinds of behaviors happening in synchrony
between both orders probably contributed to our results.Heino et al. (2003) agree that concordant patterns verifiedin fall-water season can be related to morphological,physiological adaptations, and especially, behavioraladaptations of these insects to hydrological instability.
In a previous study, Heino (2002) found a strongrelationship between both species richness of dragonflies,macrophytes and fish and species richness and richnessof the community as a whole. However, same authorreports a negative correlation between species richnessof Plecoptera and other organisms, because stoneflieshave different requirements for water temperature anddissolved oxygen. In a second study, Heino et al. (2003)found low concordance in species richness of larvae fromfour groups in headwater streams (Ephemeroptera,Trichoptera, Plecoptera, and Chironomidae) in Finland,other studies often found low concordance in the structureand species richness in freshwater ecosystems, especially atsmall spatial scales (e.g. within basin Allen et al., 1999;Paavola et al., 2003; Tolonen et al., 2005). Low con-cordance can arise between similar-sized organisms, suchas different groups of aquatic insects, because of specificrequirements to use of the environment. For instance, thisphenomenon can be caused by distinct dietary and phy-siological requirements, differences in substrate choice,and resistance to flow disturbance (Heino et al., 2003).
Environmental factors have been suggested as the mainfactor responsible for structuring freshwater communities(Landeiro et al., 2012; Roque et al., 2012). The biologicalprocesses that influence taxa establishment and their per-sistence in these environments are, often, manifested moststrongly at the regional scale, for instance because hydro-logy of the catchments and inherent geomorphology arepointed out to be the main controlling factor of environ-mental disturbance at local scale. Considering the seasonalvariations, only in the fall-water season Ephemeropteraand Trichoptera were congruent with environmentalvariables.
Despite evidences suggesting that deterministic andstochastic processes drive variations in freshwater com-munity composition and congruence (Siqueira et al.,2012), evaluations of the prevalence of these processesalong temporal and environmental gradients including theeffects of disturbances could have promising information,and need to be explicitly incorporated into the partitionsvariance analysis.
However, other characteristics of community seem tocontribute with greater concordances in diversity patterns,as reported for taxa with similar body size (Allen et al.,1999), more narrow taxonomic (niche conservatism), andwithin functional groups (Siqueira et al., 2012).
In the same way, according to Grenouillet et al. (2008),the concordance between macroinvertebrates, diatomacesand fish can be explained by trophic interactions and con-vergences in organism histories. Once, non-related organ-isms with similar response to the environment can havesimilar patterns of distribution on aquatic ecosystems.However, we cannot affirm that environmental variablescan be replaced by mayfly and caddisfly sampling once the
Fig. 6. Concordance patterns for caddisflies and mayflies and the
environment along three seasons and environmental seasonality;concordance for composite community dataset (caddsflies andmayflies) and environmental seasonality along three seasons(2007–2008), in Suia-Missu River basin, Mato Grosso. The black
arrows indicate significant concordance according to a P-level of0.05.
L. Juen et al.: Ann. Limnol. - Int. J. Lim. 49 (2013) 129–138134

correlation was low (r=0.434, strong correlations >0.70,obtained in Heino, 2010).
It shows one more time, that independently of eachother, both orders are sensible to changes in water qualityand highlight the importance of these groups to conserva-tion planning and water quality biomonitoring (Landeiroet al., 2012). Corroborating our result, Couceiro et al.(2010) analyzing indicator species, found that four taxa ofEphemeroptera and ten of Thichoptera were associatedwith non-impacted streams, and no taxa indicated the im-pacted ones. The greater concordance between both taxaand environmental variables may indicate that they arecomplementary and need to be sampled together if environ-mental changes have to be detected. Nevertheless, wecannot affirm that only one order could be sampled due tothe greater results found when we used both orders inanalysis. If indicator groups and surrogates are relevant tofreshwater biodiversity conservation more investments,deep and wide studies focusing on temporal and spatialvariation have to be made, mainly addressing reduction ofcosts by use of high-order taxonomic resolution and cross-taxon congruence (Heino, 2010).
We conclude that environmental variations in streamsresulted from temporal changes (season of the year)directly influence the patterns of mayflies and caddisfliesdistributions, though they have adaptations for rain effect.The differences in concordance between Ephemeropteraand Trichoptera found according to the seasons of theyears, the fact that both orders agree with environmentalvariables only in the fall-water season, and less represen-tativeness of our results when seasons were analyzedtogether make us support the fact that the hydrologicalcycle could be a driver of changes in species composition,as predicted by the Flood Pulse Concept.
Acknowledgements. We thank Frederico Falcao Salles and AnaMaria Oliveira Pes for identification of mayfly and caddisfly
larvae, respectively. UllyM. Pozobom Costa did the limnologicalanalysis. We thank all staff of Laboratorio de Entomologiaof Nova Xavantina, University of State of Mato Grosso –
UNEMAT, for laboratory and field help. We also thank supportfrom PROCAD/CAPES no. 109/2007 and Conselho Nacional dePesquisa e Desenvolvimento – CNPq (no. 520268/2005–9)
received by the project’s coordinator Ladislau A. Skorupa(EMBRAP-Meio Ambiente). DSN received a fellowship ofCoordenacao de Aperfeicoamento de Pessoa de Nıvel
Superior – CAPES and YS of Fundo de Amparo a Pesquisa doPara – FAPESPA. We also thank Dr. Frederico Falcao Sallesand anonymous referees for their helpful comments on an earlierversion of the manuscript.
References
Allen A.P., Whittier T.R., Kaufmann P.R., Larsen D.P.,O’Connor R.J., Hughes R.M., Stemberger R.S., Dixit S.S.,Brinkhurst R.O., Herlihy A.T. and Paulsen S.G., 1999.Concordance of taxonomic richness patterns across multipleassemblages in lakes of the northeastern United States. Can.J. Fish Aquat. Sci., 56, 739–747.
Angrisano E.B. and Korob P.G., 2001. Trichoptera. In:Fernandez H.R. and Domınguez E. (eds.), Guia para laidentificacion de los artropodos bentonicos sudamericanos,Editorial Universitaria de Tucumam, Tucamam, 55–92.
Bini L.M., Vieira L.C.G., Machado J. and Velho L.F.M., 2007.Concordance of species composition patterns among micro-crustaceans, rotifers and testate amoebae in a shallow pond.Int. Rev. Hydrobiol., 92, 9–22.
Bini L.M., Silva L.C.F., Velho L.F.M., Bonecker C.C. andLansac-Toha F.A., 2008. Zooplankton assemblage concor-dance patterns in Brazilian reservoirs. Hydrobiologia, 598,247–255.
Bispo P.C., Oliveira L.G., Crisci-Bispo V.L. and Silva M.M.,2001. A pluviosidade como fator de alteracao da entomo-fauna bentonica (Ephemeroptera, Plecoptera e Trichoptera)em corregos do Planalto Central do Brasil. Acta Limnol.Bras., 13, 1–9.
Bowman M.F., Ingram R., Reid R.A., Somers K.M., Yan N.D.,Paterson A.M., Morgan G.E. and Gunn J.M., 2008.Temporal and spacial concordance in community composi-tion of phytoplakton, zooplakton, macroinvertebrate, cray-fish, and fish on Precambrian Shield. Can. J. Fish Aquat. Sci.,65, 919–932.
Brittain J.E., 1982. Biology of mayflies. Annu. Rev. Entomol., 27,119–147.
Cameron S.E., Williams K.J. and Mitchell D.K., 2008. Efficiencyand concordance of alternative methods for minimizingopportunity costs in conservation planning. Conserv. Biol.,22, 886–896.
Carvalho N.D.O., Cafe F.A., Mota G.D.O., Franco H.C.D.B.and Braga A., 2004. Assessment of the sedimentation in thereservoirs of the Belo Monte hydroelectric complex, XinguRiver, Brazil. In: Proceedings of the Ninth InternationalSymposium on River Sedimentation, Vols 1–4, 233–242.
Colwell R.K., 2005. EstimateS: statistical estimation of speciesrichness and shared species from samples. Version 7.5.
Couceiro S.R.M., Hamada N., Forsberg B.R. and Padovesi-Fonseca C., 2010. Effects of anthropogenic silt on aquaticmacroinvertebrates and abiotic variables in streams in theBrazilian Amazon. J. Soils Sediments, 10, 89–103.
DeChaine E.G. and Martin A.P., 2005. Historical biogeographyof two alpine butterflies in the RockyMountains: broad-scaleconcordance and local-scale discordance. J. Biogeogr., 32,1943–1956.
Domınguez E., Molineri C., Pescador M.L., Hubbard M. andNieto C., 2006. Ephemeroptera of South America, PensoftPubl., Moscow, 646 p.
Faith D.P., 2003. Environmental diversity (ED) as surrogateinformation for species-level biodiversity. Ecography, 26,374–379.
Gauch H.G., 1982. Multivariate Analysis in CommunityEcology, Cambridge University Press, Cambridge, 312 p.
Grenouillet G., Brosse S., Tudesque L., Lek S., Baraille Y. andLoot G., 2008. Concordance among stream assemblages andspatial autocorrelation along a fragmented gradient. DiversDistrib., 14, 592–603.
Heino J., 2002. Concordance of species richness patterns amongmultiple freshwater taxa: a regional perspective. Biodivers.Conserv., 11, 137–147.
Heino J., 2010. Are indicator groups and cross-taxon congruenceuseful for predicting biodiversity in aquatic ecosystems?Ecol.Indic., 10, 112–117.
L. Juen et al.: Ann. Limnol. - Int. J. Lim. 49 (2013) 129–138 135

Heino J. and Mykra H., 2006. Assessing physical surrogates forbiodiversity: Do tributary and stream type classificationsreflect macroinvertebrate assemblage diversity in runningwaters?Biodivers. Conserv., 129, 418–426.
Heino J., Muotka T. and Paavola R., 2003. Determinants ofmacroinvertebrate diversity in headwater streams: regionaland local influences. J. Animal Ecol., 72, 425–434.
Heino J., Paavola R., Virtanen R. and Muotka T., 2005.Searching for biodiversity indicators in running waters: dobryophytes, macroinvertebrates, and fish show congruentdiversity patterns? Biodivers. Conserv., 14, 415–428.
Hynes H.B.N., 1970. The ecology of stream insects. Annu. Rev.Entomol., 15, 25–42.
Jackson D.A., 1995. Protest – a Procrustean randomization testof community environment concordance. Ecoscience, 2, 297–303.
Jackson D.A. and Harvey H.H., 1993. Fish and benthic inver-tebrates: community concordance and community-environ-ment relationships. Can. J. Fish Aquat. Sci., 50, 2641–2651.
Juen L. and De Marco P., 2011. Odonata biodiversity in terra-firme forest streamlets in Central Amazonia: on the relativeeffects of neutral and niche drivers at small geographicalextents. Insect. Conserv. Diver., 4, 265–274.
Junk W.J., Bayley P.B. and Sparks R.E., 1989. The flood pulseconcept in river-floodplain systems. In: Dodge D.P. (ed.),Proceedings of the International Large River Symposium,110–127.
Landeiro V.L., Bini L.M., Melo A.S., Pes A.M.O. andMagnusson W.E., 2012. The roles of dispersal limitationand environmental conditions in controlling caddisfly(Trichoptera) assemblages. Freshwater Biology, 57, 1554–1564.
Melo A.S. and Froehlich C.G., 2001. Macroinvertebrates inneotropical streams: richness patterns along a catchment andassemblage structure between 2 seasons. J. N. Am. Benthol.Soc., 20, 1–16.
Melo A.S., Niyogi D.K., Matthaei C.D. and Townsend C.R.,2003. Resistance, resilience, and patchiness of invertebrateassemblages in native tussock and pasture streams in NewZealand after a hydrological disturbance. Can. J. Fish Aquat.Sci., 60, 731–739.
Monaghan K.A. and Soares A.M.V.M., 2010. The bioassess-ment of fish and macroinvertebrates in a Mediterranean–Atlantic climate: habitat assessment and concordancebetween contrasting ecological samples. Ecol. Indic., 10,184–191.
Nessimian J.L., Venticinque E.M., Zuanon J., De Marco P. Jr.,Gordo M., Fidelis L., Batista J.D. and Juen L., 2008. Landuse, habitat integrity, and aquatic insect assemblages inCentral Amazonian streams. Hydrobiologia, 614, 117–131.
Nogueira D.S., Cabette H.S.R. and Juen L., 2011. Estrutura ecomposicao da comunidade de Trichoptera (Insecta) de rios eareas alagadas da Bacia do rio Suia-Missu, Mato Grosso,Brasil, Iheringia. Ser. Zool., 101, 173–180.
Oksanen J., Blanchet F.G., Kindt R., Legendre P., Minchin P.R.,O’Hara R.B., Simpson G.L., Solymos P., Stevens M.H.H.and Wagner H., 2011. Vegan: Community Ecology Package.R package version 2.0-2. http://CRAN.R-project.org/package=vegan.
Olden J.D., Jackson D.A. and Peres-Neto P.R., 2001. Spatialisolation and fish communities in drainage lakes. Oecologia,127, 572–585.
Paavola R., Muotka T., Virtanen R., Heino J. and Kreivi P.,2003. Are biological classifications of headwater streamsconcordant across multiple taxonomic groups?FreshwaterBiol., 48, 1912–1923.
Paszkowski C.A. and Tonn W.M., 2000. Community con-cordance between the fish and aquatic birds of lakes innorthern Alberta, Canada: the relative importance ofenvironmental and biotic factors. Freswater Biol., 43,421–437.
Pes A.M.O., Hamada N. and Nessimian J.L., 2005. Chaves deidentificacao de larvas para famılias e generos de Trichoptera(Insecta) da Amazonia Central, Brasil. Revta Bras. Ent., 49,181–204.
Ratter J.A., Askew G.P., Montgomery R.F. and Gifford D.R.,1978. Observations on the vegetation of northeastern MatoGrosso II. Forest and Soils of the Rio Suia-Missu area.R. Soc. Lond., 293, 191–208.
R Development Core Team, 2011. R: A Language andEnvironment for Statistical Computing, R Foundation forStatistical Computing, Vienna, Austria.
Riva A.L.M., Fonseca L.F.L. and Hasenclever L., 2007.Instrumentos economicos e financeiros para a conservacaoambiental no Brasil: Uma analise do estado da arte no Brasile no Mato Grosso, desafios e perspectivas, InstitutoSocioambiental – ISA, Sao Paulo, 138 p.
Roque F.O., Lima D.V.M., Siqueira T., Vieira L.J.S.,Stefanes M. and Trivino-Strixino S., 2012. Concordancebetween macroinvertebrates communities and the typo-logical classification of White and clear-water streamsin western Brazilian Amazonia. Biota Neotropical, 12,83–92.
Rosenberg D.M. and Resh V.H., 1993. Introduction to fresh-water biomonitoring and benthic macroinvertebrates. In:Rosenberg D.M. and Resh V.H. (eds.), FreshwaterBiomonitoring and Benthic Macroinvertebrates, Chapmanand Hall, New York, 1–9.
Shimano Y., Cabette H.S.R., Salles F.F. and Juen L., 2010.Composicao e distribuicao da fauna de Ephemeroptera(Insecta) em area de transicao Cerrado-Amazonia, Brasil.Iheringia, 100, 301–308.
Siqueira T., Bini L.M., Roque F.O. and Correnie K., 2012. Ametacommunity framework for enhancing the effectivenessof biological monitoring strategies. Plos One, 7, 1–12.
Strahler H.N., 1957. Quantitative analysis of watershed geomor-phology. Am. Geophys. Union Trans., 38, 913–920.
Tolonen K.T., Holopainen I.J., Hamalainen H., Rahkola-Sorsa M., Ylostalo P., Mikkonen K. and Karjalainen J.,2005. Littoral species diversity and biomass: concordanceamong organism groups and the effects of environmentalvariables. Biodivers. Conserv., 14, 961–980.
Vannote R.L., Minshall G.W., Cummins K.W., Sedell J.R. andCushing C.E., 1980. The river continuum concept. Can. J.Fish Aquat. Sci., 37, 130–137.
Wiggins G.B., 1996. Larvae of the North American CaddisflyGenera (Trichoptera), University of Toronto Press, Toronto,457 p.
Wiggins G.B. and Mackay R.J., 1978. Some relationshipsbetween systematics and trophic ecology in Neartic aquaticinsects, with special references to Trichoptera. Ecology, 59,1211–1220.
Zar J.H., 1999. Biostatistical Analysis, Prentice–Hall,Englewood Cliffs, NJ, 960 p.
L. Juen et al.: Ann. Limnol. - Int. J. Lim. 49 (2013) 129–138136

Appendix 1. Mean and standard deviation for species abundance of mayflies per stream site, during the sampling period (2007–2008)
in the basin of Rio Suia-Missu, Mato Grosso.[colcnt=7].
Especies
Fall-water season Dry season Rainy season
Mean SD Mean SD Mean SDAmanahyphes saguassu (Salles & Molineri, 2006) 1.583 2.539 0.417 0.669 0.417 1.443Americabaetis alphus (Lugo-Ortiz & McCafferty, 1995) 0.250 0.866 0.333 0.651 0.417 1.443Apobaetis fuizai (Salles & Lugo-Ortiz, 2002) 0.000 0.000 0.000 0.000 0.083 0.289Askola sp. 0.083 0.289 0.500 1.000 0.167 0.389Asthenopus cf. curtus (Hagen, 1861) 4.667 8.532 0.500 1.732 0.417 0.793Aturbina sp.n. 0.500 1.000 0.417 0.793 0.667 1.155Aturbina georgei (Lugo-Ortiz & McCafferty, 1996) 0.167 0.389 0.667 1.155 0.833 2.290Brasilocaenis irmeli (Puthz, 1975) 0.417 1.165 0.000 0.000 0.000 0.000Brasilocaenis sp. 1.833 4.840 0.083 0.289 0.167 0.577Caenis cuniana (Froehlich, 1969) 3.167 5.060 1.500 2.876 8.250 17.705Caenis fitkaui (Malzacher, 1986) 0.500 1.446 0.500 1.243 1.583 4.010Caenis pfluggelderi (Malzacher, 1990) 0.917 1.311 0.333 0.651 0.000 0.000Callibaetis sp. 1 3.750 6.468 1.667 2.640 3.167 4.648Callibaetis sp. 2 0.750 1.865 1.083 3.753 1.000 3.162Campsurus spp. 4.333 6.199 2.250 2.864 3.333 6.257Campylocia sp. 0.583 1.730 0.583 1.443 0.167 0.389Cloeodes auwe (Salles & Batista, 2004) 0.167 0.577 0.167 0.577 0.583 2.021Cloeodes sp. 0.000 0.000 0.083 0.289 0.000 0.000Coryphorus aquilus (Peters, 1981) 0.417 0.900 0.333 0.492 0.417 0.793Cryptonympha copiosa (Lugo-Ortiz & McCafferty, 1998) 1.750 3.441 0.667 1.231 1.333 1.923Farrodes sp. 0.750 2.301 1.417 2.906 0.167 0.389Fittkaulus sp. 4.250 7.829 3.500 4.442 1.167 2.329Hagenulopsis sp. 0.083 0.289 0.083 0.289 0.000 0.000Harpagobaetis gulosus (Mol, 1986) 0.083 0.289 0.000 0.000 0.000 0.000Hydrosmilodon gilliesae (Thomas & Peru, 2004) 0.167 0.389 1.000 2.296 0.083 0.289Michophebia surinamenses (Savage & Peters, 1983) 0.667 2.015 0.167 0.389 0.167 0.389Microphlebia sp. 1.917 3.528 3.250 6.538 0.167 0.577Miroculis sp. 1 0.917 2.875 2.417 5.931 0.500 1.168Miroculis sp. 2 0.917 1.379 2.667 4.638 0.417 0.900Paracloeodes binodulus (Lugo-Ortiz & McCafferty, 1996) 0.000 0.000 0.000 0.000 0.167 0.577Paramaka convexa (Spieth, 1943) 0.000 0.000 0.083 0.289 0.000 0.000Simothraulopsis sp. 3.500 4.719 3.667 5.466 1.583 2.429Thraulodes cochunaensis (Dominguez, 1987) 0.000 0.000 0.500 1.243 0.000 0.000Traverhyphes sp. 1 0.167 0.389 0.250 0.622 0.083 0.289Traverhyphes sp. 2 0.250 0.866 0.000 0.000 0.000 0.000Tricorythodes hiemalis (Molineri, 2001) 1.250 3.720 1.667 4.008 0.417 1.165Tricorythodes sp. 1 0.083 0.289 0.167 0.389 0.250 0.622Tricorythodes sp. 2 0.000 0.000 0.000 0.000 0.083 0.289Tricorythopsis sp. 0.083 0.289 0.083 0.289 0.000 0.000Ulmeritoides flavopedes (Spieth, 1943) 2.250 3.980 2.833 4.282 1.583 3.260Waltzoyphius roberti (Thomas & Peru, 2002) 0.917 1.564 0.500 1.000 0.333 0.492Zelusia principalis (Lugo-Ortiz & McCafferty, 1998) 0.000 0.000 2.333 7.463 0.083 0.289
L. Juen et al.: Ann. Limnol. - Int. J. Lim. 49 (2013) 129–138 137

Appendix 2. Mean and standard deviation for species abundance of caddisflies during the sampling period (2007–2008) in the basin
of Rio Suia-Missu, Mato Grosso.
Especies
Fall-water season Dry season Rainy season
Mean SD Mean SD Mean SDAmazonatolica hamadea (Holzenthal & Pes, 2004) 0.250 0.866 0.167 0.577 0.083 0.289Amphoropsyche sp.1 0.250 0.622 0.000 0.000 0.000 0.000Amphoropsyche sp.2 0.083 0.289 0.167 0.389 0.000 0.000Amphoropsyche sp.3 0.083 0.289 0.000 0.000 0.000 0.000Cernotina sp.1 0.000 0.000 0.083 0.289 0.000 0.000Cernotina sp.2 1.000 1.706 0.917 1.730 0.500 0.905Chimarra sp.1 0.083 0.289 1.083 2.021 0.000 0.000Chimarra sp.2 0.000 0.000 0.333 0.778 0.000 0.000Cyrnellus sp.1 0.250 0.622 0.333 0.651 0.000 0.000Cyrnellus sp.2 0.333 1.155 0.083 0.289 0.333 0.888Cyrnellus sp.3 0.000 0.000 0.083 0.289 0.000 0.000Leptonema amazonense (Flint, 1978) 0.083 0.289 0.000 0.000 0.000 0.000L. maculatum (Mosely, 1933) 1.000 2.486 3.583 8.372 0.000 0.000L. sparsum (Ulmer, 1905) 22.333 63.066 4.333 5.990 4.167 8.922Macronema spp. 4.083 4.358 2.500 2.844 1.083 2.109Macrostemum hyalinum (Pictet, 1836) 0.000 0.000 0.083 0.289 0.000 0.000Macrostemum sp.1 0.167 0.577 0.667 2.309 0.083 0.289Macrostemum sp.2 5.833 18.115 0.667 1.557 0.500 1.732Marilia sp.1 0.417 1.443 0.250 0.866 0.000 0.000Marilia sp.3 0.167 0.389 0.000 0.000 0.083 0.289Nectopsyche sp.1 0.000 0.000 0.083 0.289 0.000 0.000Nectopsyche sp.2 0.167 0.389 0.500 0.798 0.083 0.289Nectopsyche sp.3 0.083 0.289 0.167 0.389 0.000 0.000Nectopsyche sp.4 0.083 0.289 0.083 0.289 0.000 0.000Nectopsyche sp.5 0.083 0.289 0.000 0.000 0.000 0.000Nectopsyche sp.6 0.083 0.289 0.000 0.000 0.000 0.000Oecetis sp.1 0.417 0.669 0.000 0.000 0.083 0.289Oecetis sp.2 1.083 0.793 0.000 0.000 0.000 0.000Oecetis sp.3 1.417 2.503 0.167 0.389 0.083 0.289Oecetis sp.4 0.750 1.055 0.083 0.289 0.250 0.622Oecetis sp.5 1.583 5.178 0.000 0.000 0.000 0.000Oecetis sp.6 0.167 0.389 0.000 0.000 0.000 0.000Oxyethira sp.1 0.083 0.289 0.000 0.000 0.000 0.000Phylloicus sp.1 0.083 0.289 0.000 0.000 0.000 0.000Polyplectropus sp.1 0.833 2.887 0.167 0.577 0.000 0.000Polyplectropus sp.2 0.083 0.289 0.000 0.000 0.000 0.000Polyplectropus sp.3 0.083 0.289 0.000 0.000 0.083 0.289Smicridea (R.) sp.1 0.500 1.732 0.000 0.000 0.083 0.289Smicridea (R.) sp.2 0.083 0.289 0.000 0.000 0.000 0.000Smicridea (S.) truncate (Flint, 1974) 0.083 0.289 1.083 3.147 0.167 0.577Smicridea (S.) sp.2 0.667 1.775 0.583 1.730 0.000 0.000Smicridea (S.) sp.3 0.000 0.000 0.333 1.155 0.417 1.443Smicridea (S.) sp.4 0.083 0.289 0.000 0.000 0.000 0.000Smicridea (S.) sp.7 0.167 0.577 0.000 0.000 0.000 0.000Triplectides sp.1 0.000 0.000 0.167 0.577 0.167 0.577Wormaldia sp.1 0.000 0.000 0.083 0.289 0.000 0.000
L. Juen et al.: Ann. Limnol. - Int. J. Lim. 49 (2013) 129–138138
Copyright © 2022 FDOKUMEN