Concept Design of a Crew Transfer Vessel - TU Delft ...
99
Concept Design of a Crew Transfer Vessel Murat Almat Master of Science Project
-
Upload
khangminh22 -
Category
Documents
-
view
2 -
download
0
Transcript of Concept Design of a Crew Transfer Vessel - TU Delft ...

Concept Design of a Crew Transfer Vessel
Murat Almat
Mast
er
of
Sci
ence
Pro
ject

2

3
Thesis for the degree of MSc in Marine Technology in the specialization of Ship Design
Concept Design of a Crew Transfer Vessel
By
Murat Almat
Performed at
KNUD E. HANSEN A/S
This thesis SDPO.15.007.m is classified as confidential in accordance with the general conditions for projects performed by the TU Delft.
This thesis cannot be made public until 25.02.2020.
The appendices of this thesis cannot be made public.
25.02.2015
Company supervisors Responsible supervisor: T. Andrewartha Thesis exam committee Chair/Responsible Professor: J.J. Hopman Staff Member: R. Hekkenberg Staff Member: I. Akkerman Company Member: T. Andrewartha Author Details Murat Almat Student number: 4009568

4

5
ABSTRACT
Today’s increasing attention to offshore wind turbines as a renewable source of energy leads to new problems from the logistics point of view. As a consequence of new generation wind farms being built and planned to be built further offshore, as far as 150-200km from the shore, current transportation concepts that are used for wind turbine maintenance are considered to be less efficient. Among others, KNUD E. HANSEN A/S has developed a new transportation concept as a solution to this problem. This concept makes use of several vessels of which only one of them, namely the crew transfer vessel (CTV) with a length overall of 30 m is handled in this report. The CTV is to be docked onboard of a larger service operation vessel (SOV) with a length over 100m. The concept all together is expected to reduce the operational costs and increase the accessibility of wind farms for maintenance operations. As a part of the concept, design requirements are set for 3 operational conditions, where the first is calm water operations, prioritizing maximum design speed; the second is poor weather conditions up to 2 meter significant wave height prioritizing low level vertical motions, where the vessel is still operable for crew transferring; and bad weather conditions with sea states higher than 2 meter significant wave height, where the requirement for high range and reserve provisions for 1-2 days sailing is of high importance Hull form, general arrangement, propulsion system and onboard equipment are examined closely to provide a design that fulfills the requirements. Especially large waterplane area is found to be crucial to minimise the vertical motions. Furthermore a docking arrangement and crew transferring equipment are designed. Aside the shorter wave periods in the region of 3-4s, the vessel fulfills all the operability requirements in transit stages, which is set at 2 meter significant wave height, as demonstrated by the seakeeping analysis. As suggested in the report, the performance can be improved by following the recommendations of this report. Furthermore, proposed novel designs for launching and retrieving mechanism in the dock of the bigger vessel has been demonstrated to be operable up to sea conditions with significant wave heights of 2.5 m, as desired. The proposed wind turbine access system is expected to be operable up to sea conditions with significant wave heights of 2 m by further improving the design according to the design suggestions, which are made as a result of the time domain analysis. The concept design study demonstrates that it is feasible to improve the current design by following the work, results and recommendations that are described in this report, in the following design stages into a final product. This can be used successfully as a part of the transportation concept in order to improve the overall efficiency of the offshore wind farms, increasing the interest for energy companies.

6

7
Contents List of Figures ................................................................................................................................................................. 9
List of Tables ................................................................................................................................................................ 11
1 Introduction ......................................................................................................................................................... 13
2 Wind Energy & Offshore-Wind ............................................................................................................................ 14
2.1 Wind Energy ............................................................................................................................................... 14
2.2 Crew Transfer Vessels (CTV) ....................................................................................................................... 16
2.3 New Concepts ............................................................................................................................................ 21
2.3.1 Operational Conditions for the CTV ....................................................................................................... 22
3 Design of the Crew Transfer Vessel ...................................................................................................................... 23
3.1 Design Tasks, Requirements and Constraints ............................................................................................. 23
3.1.1 Launch and retrieving in the dock of the SOV ....................................................................................... 23
3.1.2 Transit Sailing ......................................................................................................................................... 24
3.1.3 Transferring PAX to the wind turbines ................................................................................................... 26
3.1.4 Lightweight and Material ....................................................................................................................... 26
3.1.5 Summarized main requirements............................................................................................................ 27
3.1.6 Design questions .................................................................................................................................... 27
3.2 Summarized Design Method ...................................................................................................................... 28
3.3 Design of the hull and GA ........................................................................................................................... 29
3.3.1 Defining the main dimensions, hull type and initial GA ......................................................................... 29
3.3.2 Defining the hull lines and parameters .................................................................................................. 31
3.3.3 General Arrangement ............................................................................................................................ 40
3.4 Wind Turbine Access System ...................................................................................................................... 45
3.5 E-Load Estimation....................................................................................................................................... 54
3.6 Weight Estimation ...................................................................................................................................... 56
3.6.1 Light weight ........................................................................................................................................... 56
3.6.2 Deadweight ............................................................................................................................................ 61
3.6.3 Total Displacement and CoG .................................................................................................................. 63
3.7 Intact & Damage Stability ........................................................................................................................... 63
3.7.1 Rules and Regulations / Method of Calculation ..................................................................................... 63
3.7.2 Intact Stability ........................................................................................................................................ 64
3.7.3 Damage Stability & Damage Cases ........................................................................................................ 65
3.8 Resistance Estimation ................................................................................................................................ 66
3.8.1 Choice of propulsion .............................................................................................................................. 66
3.8.2 Resistance & Powering Estimation ......................................................................................................... 68
3.8.3 Bollard-Push Capacity ............................................................................................................................ 72
3.8.4 Operational Powering Cases .................................................................................................................. 72

8
3.9 Docking Arrangement in the SOV ............................................................................................................... 74
4 Seakeeping and Validation ................................................................................................................................... 77
4.1 Simulation setup ........................................................................................................................................ 77
4.1.1 Calculation of Gyradius .......................................................................................................................... 77
4.1.2 Calculation of Damping Coefficients ...................................................................................................... 78
4.1.3 Transit Stage Seakeeping ....................................................................................................................... 79
4.1.4 Crew Transfer Operation ........................................................................................................................ 82
4.1.5 Docking .................................................................................................................................................. 85
4.2 Results ........................................................................................................................................................ 88
4.2.1 Transit .................................................................................................................................................... 88
4.2.2 Crew Transfer ......................................................................................................................................... 90
4.2.3 Docking .................................................................................................................................................. 92
5 Conclusions .......................................................................................................................................................... 93
6 Known Problems, Further Suggestion for Improvement ..................................................................................... 94
7 Visualisations ....................................................................................................................................................... 95
References ................................................................................................................................................................... 98
Appendices are confidential. Therefore, they are not presented publicly. .................................................................. 99

9
List of Figures Figure 1 - Global Cumulative Installed Wind Power by Global Wind Energy Council (GWEC), Annual Market Update 2013 [1] ........................................................................................................................................................................ 14 Figure 2 - Wind Energy Share on/off-shore, 2013 European statistics, by European Wind Energy Association (EWEA) [2]................................................................................................................................................................................. 14 Figure 3 - Estimated Cost of Energy by Siemens – GWEC on Global Wind Report, Annual Market Update 2013 [1] . 15 Figure 4 - Pacific Orca, designed by KNUD E. HANSEN A/S .......................................................................................... 15 Figure 5 - Catamaran Windcat Workboats by Morelli and Melvin on the left, SWATH by Hauschildt Marine on the right and monohull CTV by Hvide Sande Skibs & Baadebyggeri below. ...................................................................... 16 Figure 6 - Submersible SWATH/CAT by Danish Yachts on the left, TRIWIND by KNUD E. HANSEN A/S on the right, Fast Crew Supplier by DAMEN below left and WindServer by Fjellstrand below right ............................................... 17 Figure 7 – Crew transferring by pushing against the wind turbine .............................................................................. 18 Figure 8 – Maxccess by Osbit Power on the left, clamping device by Mobimar and turbine access system (TAS) by BMT & Houlder below ................................................................................................................................................. 19 Figure 9 - Active and planned Wind Farms Map, North Sea taken from 4C Offshore Database [4] ............................ 20 Figure 10 - Transportation Concepts ............................................................................................................................ 21 Figure 11 - Operation Limits of the new concept ........................................................................................................ 22 Figure 12 - Dimensions of the dock and estimate of CTV ............................................................................................ 23 Figure 13 - Wind turbine spacing ................................................................................................................................. 25 Figure 14 - Dimensions of the dock ............................................................................................................................. 29 Figure 15 - SWATH Designs: Beam-DWL relation, graph taken from ISPET Concept Design Presentation [8] ............. 30 Figure 16 – Initial GA Approximation ........................................................................................................................... 31 Figure 17 – Abs. Vert. Motions (significant amplitude) in relation with CWPA in Modal Periods of 4, 6 and 12 s ......... 33 Figure 18 – Abs. Vert. Motions (significant amplitude) in relation with CoF in Modal Periods of 4, 6 and 12 s .......... 34 Figure 19 - Hinge Assumption ...................................................................................................................................... 35 Figure 20 – Lines Plan .................................................................................................................................................. 39 Figure 21 – GA Plan ...................................................................................................................................................... 44 Figure 22 –WTAS .......................................................................................................................................................... 45 Figure 23 – Foundation ................................................................................................................................................ 46 Figure 24 – Slew bearing WTAS ................................................................................................................................... 47 Figure 25 – Roll offset .................................................................................................................................................. 48 Figure 26 – Tilting Platform WTAS ............................................................................................................................... 48 Figure 27 – Outer bridge WTAS .................................................................................................................................... 49 Figure 28 – Foundation WTAS ...................................................................................................................................... 50 Figure 29 – Acces platform WTAS ................................................................................................................................ 51 Figure 30 – Bow fender WTAS...................................................................................................................................... 52 Figure 31 – Approaching wind turbine ........................................................................................................................ 53 Figure 32 – Weight factor calculation of a component as t/m2 ................................................................................... 58 Figure 33 – Division of components ............................................................................................................................ 59 Figure 34 – Tank arrangement ..................................................................................................................................... 62 Figure 35 - Departure Condition Large Angle Stability Curve ...................................................................................... 64 Figure 36 – Watertight Zones and Damage Lengths .................................................................................................... 65 Figure 37 - Servogear Propeller. Image taken from Servogear AS website .................................................................. 67 Figure 38 – Power Estimation ...................................................................................................................................... 70 Figure 39 – Efficiencies: from the resistance to the installed power ........................................................................... 71 Figure 40 –Power distribution ..................................................................................................................................... 72 Figure 41 - Sloshing inside well deck ........................................................................................................................... 74 Figure 42 – 2 level fendering ....................................................................................................................................... 75 Figure 43 – Dock arrangement .................................................................................................................................... 76 Figure 44 - CTV Mesh ................................................................................................................................................... 79 Figure 45 – Motion Tracking Points ............................................................................................................................. 80

10
Figure 46 – CTV and Monopile Mesh ........................................................................................................................... 82 Figure 47 – Time domain simulation mooring arrangement ....................................................................................... 83 Figure 48 – Crew transfer motion tracking points ....................................................................................................... 84 Figure 49 – Docking operations mesh.......................................................................................................................... 85 Figure 50 – Motion tracking points docking ................................................................................................................ 85 Figure 51 – DNV Design Pressures for slamming on the bottom of the vessel ............................................................ 86 Figure 52 – Docking Problem Analysis ......................................................................................................................... 87 Figure 53 - Visualization docking ................................................................................................................................. 93 Figure 54 – CTV Render 1 ............................................................................................................................................. 95 Figure 55 – CTV Render 2 ............................................................................................................................................. 95 Figure 56 – CTV Render 3 ............................................................................................................................................. 96 Figure 57 – CTV Render 4 ............................................................................................................................................. 96 Figure 58 – CTV Render 5 ............................................................................................................................................. 97 Figure 59 - CTV Render 6 ............................................................................................................................................. 97
11
List of Tables Table 1- Main Particulars ............................................................................................................................................. 38 Table 2 - Total power demand ..................................................................................................................................... 55 Table 3 - E-load distribution ......................................................................................................................................... 55 Table 4 – Lightweight and COG .................................................................................................................................... 60 Table 5 – Total displacement in Departure Condition .................................................................................................. 63 Table 6 – Permeability ................................................................................................................................................. 65 Table 7 – HSC Code 2000 Damage Stability Criteria..................................................................................................... 66 Table 8 - Open Water Eff. Comparison ......................................................................................................................... 68 Table 9 – Parameters for Resistance Estimation (Fung) ............................................................................................... 69 Table 10 - Bollard Push Estimate .................................................................................................................................. 72 Table 11 – Operational Cases ....................................................................................................................................... 73 Table 12 – Gyradius ...................................................................................................................................................... 77 Table 13 - Gyradius Mother vessel ............................................................................................................................... 78 Table 14 - Damping Components CTV ......................................................................................................................... 79 Table 15 – General Operability for Nordforsk in red, additional limitation regarding MSI given in purple ................. 88 Table 16 - Natural Frequencies of ship motions .......................................................................................................... 88 Table 17 - Wave Period per heading for an encounter period of 3.2 s at a forward speed of 11 kts .......................... 89 Table 18 - Operability as probability per year (excluding additional MSI) ................................................................... 89 Table 19 – Crew Transferring Operability Results ........................................................................................................ 90 Table 20 – Docking Stage Operability Results .............................................................................................................. 92

12

13
1 Introduction As a graduation project for the study program Ship Design, MSc. Marine Technologies at the Delft University of Technology, a design project has been carried out for the company KNUD E. HANSEN A/S. The project is aimed to create a concept design for a Crew Transfer Vessel (CTV) to be used as part of a new transportation concept, which is developed for the maintenance operations of the future wind farms in the North Sea Area. With a number of wind farms planned to be built further offshore with distances of 150-200km from the shore, new challenges arise for the maintenance operations that are vital to keep the wind farms functioning and profitable. These challenges include increased transit sailing times, higher sea states and worse weather conditions, which at the end result as less working days per year and less efficient maintenance operations. Different ideologies and methods are being proposed as solutions to these new challenges, which include new hull forms, new equipment to be used for certain tasks such as crew transferring in high sea states and also new transportation concepts. KNUD E. HANSEN A/S, being one of the companies which are involved in this market, providing novel marine solutions, develops a new transportation concept which consists of two separate vessels, where one of them is to serve as an operations/hotel/mother vessel (SOV: Service Operation Vessel) and the other one as a daughter/transport vessel (CTV: Crew Transfer Vessel). The daughter vessel is to be docked in the aft part of the mother vessel when it is not operating and the mother vessel will be positioned near the offshore wind farms for several weeks with the maintenance crew accommodated onboard, which at the end will reduce the sailing distance for any operation drastically from hundreds of kilometers to just a couple of kilometers per day. Furthermore, making use of at least 2 vessels is to provide some freedom for all kind of operations. As an example: the CTV can be used for crew transport which will carry out smaller maintenance work, while the SOV can be used for bigger maintenance work at the same time. Although similar solutions from different companies involve hotel vessels being positioned near wind farms and even using smaller transport vessels, not many examples have been found that makes use of a second transport vessel of this size, capacity and level of operability, which brings new challenges to the design project with regard to launch and recovery systems to be used inside the dock of the mother vessel, crew transport method to the wind turbines and requirements for seakeeping abilities. Furthermore, due to the nature of the new transportation concept and various tasks to be fulfilled, new constraints and requirements are defined partly by the concept developer explicitly, KNUD E. HANSEN A/S in this case, and partly by the designer according to initial estimates. The whole concept design process of the CTV will be explained in this report, starting with an introduction to the offshore wind energy industry followed by a more detailed explanation of why such a new concept is needed. After introducing the new transportation concept, the requirements and constraints will be defined and it will be explained how these constraints and requirements affected the design solution. Further on, decisions that are taken during the design process will be explained in detail, including the procedures for defining the hull form, hydrostatic/dynamic calculations and other novel solution to the challenges that are encountered during the design process. As last, the final design will be presented and evaluated with regard to seakeeping and operability. Furthermore, it is to be stated explicitly, that this project involves only the concept design of the crew transfer vessel, the design of relevant equipment up to a certain level of detail in order to prove the functionality of the design and an evaluation of the performance of the design, which will be used to improve the design in later stages. It is not aimed to make an optimization of the whole transportation concept nor is it aimed to make a detailed design of equipment and other vessels, which are involved in the transportation system.

14
2 Wind Energy & Offshore-Wind
2.1 Wind Energy Today's rising concerns about the global environmental issues, believed to be caused by excessive consumption of fossil fuels, together with concerns about the diminishing supply of these fossil fuels lead governments all around the world to look for alternative sources of energy. Wind power as an alternative source of energy, being one of the most efficient and sustainable option among other kinds, promises to play a big role in the future energy market. As it can be seen on the graph below, the growth of the global installed wind capacity over the last years proves the confidence of the authorities around the world for the future of the wind power.
Figure 1 - Global Cumulative Installed Wind Power by Global Wind Energy Council (GWEC), Annual
Market Update 2013 [1]
Considering better wind conditions off-shore than disturbed wind conditions on land, it would not be wrong to assume that the off-shore wind market will have a big share in the future energy industry. The graph below, which shows the growth of the offshore wind installations in the EU over the last years, supports this claim strongly.
Figure 2 - Wind Energy Share on/off-shore, 2013 European statistics, by European Wind Energy Association
(EWEA) [2]

15
Estimations, presented by Siemens Energy on Global Wind Report Annual Market Update 2013 from Global Wind Energy Council (GWEC) [1], that are calculated by considering various aspects of the market: such as social impact, employment effects and geopolitical impact, reveal that the on/offshore wind energy will be one of the most competitive power sources in the UK by 2025 with an energy cost of 60 €/MWh.
Figure 3 - Estimated Cost of Energy by Siemens – GWEC on Global Wind Report, Annual Market Update
2013 [1]
Having seen that there are several aspects to be considered when dealing with new markets, it should be remembered that nuclear and renewable energy, particularly offshore wind energy, are among the most labor-intensive energy sources throughout all construction, installation and maintenance stages of its life cycle, with the maintenance costs forming 25-30% of total life-time costs for an off-shore wind turbine [3]. In order to make this intensive work more efficient, the offshore wind market generates a demand for new technologies and extra labor power to be used for installation and maintenance of the wind turbines. While specifically designed jack-up vessels such as Pacific Orca, designed by KNUD E. HANSEN A/S, handle the installation of offshore wind farms, small and fast crew transfer vessels (CTV) of various types handle the maintenance of the wind turbines.
Figure 4 - Pacific Orca, designed by KNUD E. HANSEN A/S

16
2.2 Crew Transfer Vessels (CTV) When a wind turbine is considered, high loads, dynamic variations and long operational hours, e.g. tip of a wind turbine blade moves around with a speed of 300 km an hour, together with the rough offshore conditions, it can be foreseen that a huge amount of maintenance work has to be carried out, in order to achieve the required operability of 80 % a year, approx. 7000 hours per year [3]. As a rough estimate, each wind turbine suffers one fault during each month. Also accounting for 2 planned maintenance operations per wind turbine per year, a number of 1400 maintenance operations per year can be predicted for a wind farm with 100 wind turbines. Despite the high demand for maintenance, due to weather and sea conditions, it is not always easy to carry out these maintenance operations. As it is the case at Horns Reef 2, where turbines are 40 km distanced from the shore of Esbjerg, Denmark, the turbines are not accessible almost half of the year, due to high waves and tough weather conditions. [3] Considering that no more than 4 out of 100 turbines can’t be inactive at the same time for a wind farm to be profitable. Current wind farms being 10 - 60 km distanced from the shore [4], there is a huge demand for fast and efficient method to carry out the maintenance operations on rough sea conditions. Considering the wide range of tasks to be fulfilled by these CTVs, it can be realized why there is such a wide range of different designs within this market. To be able to understand the different design ideologies, it is essential to analyze the required work that is demanded by these vessels. As the most common transportation concept of today, sailing from the shore base to the offshore wind farms on a daily basis, requires high transit speeds in order to have sufficient working time at the wind farm site. Further it is essential to have good seakeeping abilities in order to prevent the technicians to get sea sick during the transit time and to increase the amount of operable days per year. This is why the features such as good seakeeping, high transit speeds, fuel efficiency, increased roll stability and large deck space are some of the desired requirements for these vessels. In order to fulfill these requirements many various types of vessels are to be found on the market. Some of the examples can be seen below as a catamaran, a SWATH and a monohull.
Figure 5 - Catamaran Windcat Workboats by Morelli and Melvin on the left, SWATH by Hauschildt Marine
on the right and monohull CTV by Hvide Sande Skibs & Baadebyggeri below.

17
Naturally, each type of vessel has its advantages, disadvantages. In order to enlarge the margins of the vessels advantages, some novel solutions are also to be found in the market, such as the vessels that are shown below: a CAT/Swath, which is able to sail as a catamaran in transit stages and as a SWATH on lower speeds, a trimaran, the “AXE BOW” catamaran and another novel design from Fjellstrand.
Figure 6 - Submersible SWATH/CAT by Danish Yachts on the left, TRIWIND by KNUD E. HANSEN A/S on
the right, Fast Crew Supplier by DAMEN below left and WindServer by Fjellstrand below right
Since this chapter is only considered as an introduction to the crew transfer vessel market and designs, no theory will be handled nor will it be explained in detail how different hull shapes and vessel types result in different performance levels. Required theory and explanations will be handled in relevant chapters further in this report. On the other hand, it is important to realize that many different hull forms are tested in the market in order to find a solution for the problem of combining good seakeeping abilities with the ability of achieving high speeds in a fuel efficient manner. Another concern of these vessels is to provide a safe passage for the technicians between the CTV and the wind turbine boat landing. For this purpose the most common used way nowadays is pushing against the wind turbine boat landing with the bow fender of the vessel. By the friction force created between the bow fender of the vessel and the pillars of the boat landing, the motions of the vessel are reduced drastically, which makes it possible for the maintenance crew to step on the ladder of the wind turbine. As it can be imagined, this method is only possible to be carried out up to a certain level of sea state, where the friction forces remain greater than the vertical buoyancy and hydrodynamic forces, which are excited by the waves when the crest of the wave is stationed at the bow of the vessel. Similarly, when the wave pass by, the friction force has to remain greater than a percentage of the vessels weight, which is equal to the difference of the reduced buoyancy, due to dynamic waterline, and the weight of the vessel. A good visualization of this situation can be seen on figure 7.

18
Figure 7 – Crew transferring by pushing against the wind turbine
The limitations of this method make it clear, that besides a hull with good seakeeping performance, it is essential to develop a new method for crew transferring in order to widen the range of operability of these vessels. As expected, there are several solutions developed on the market. One solution is to provide some degree of freedom to the vessel during the crew transfer operations. This is mostly achieved by making use of an actively controlled bridge between the vessel and the boat landing of the wind turbine. The joint/hinge connections at the vessel end of the bridge make it possible for the vessel to move freely while the bridge is kept stationary. The compensation for the motions of the vessel is provided by hydraulic cylinders which are actively controlled with the help of motion sensors. The strategy of ‘providing some degrees of freedom in motions’ is a proven strategy by many products, which make it possible to achieve high levels of operability on high seas. Another type of solution regarding the crew transferring problem has the strategy to fix the vessel completely by using clamps, which are stationed at the bow of the vessel. By fixing these clamps around the pillars of the boat landing, the vessel is fixed in its position. As imagined, due to the high loads on the pillars and complexity in operating, this concept has also its own limitations. Some examples of these products can be seen below.

19
Figure 8 – Maxccess by Osbit Power on the left, clamping device by Mobimar and turbine access system
(TAS) by BMT & Houlder below
The downside to these solutions is as it can be foreseen, the high power dependency of these products, due to the active control and hydraulic systems, which will lead to a high demand in power and possible vulnerability to potential power loss, which as a result can endanger life of the technicians during transfer operations. Furthermore, because of the high levels of accelerations due to the forward position on the vessels, spray water and green water due to the high sea conditions, combined with the complexity of the system, it is also to be expected that high level of maintenance is required for these parts. It is also observed for some of the products that have to be aimed on the boat landing manually, where the operators frequently encounter problems with aiming the end of the bridge to the boat landing on rough sea conditions, which results as an increased operation time. Two examples can be found via the references on [5] and [6]. Depending on the type of the vessel and the transferring method, current solutions on accessibility very from approx. 55% to 80% of the year in the North Sea region, having a design limit of operability between 1m and 2.5m significant wave height respectively, with a limit of 1.5 m significant wave height for the most standard vessels. [7]

20
Although some crew transferring methods are considered effective at the moment, the trend of the wind farms, looking for better wind conditions and being built further and further away off the coast, require higher sailing speeds and better sea keeping abilities. This is in order to compensate for the longer sailing distances and higher sea conditions. This leads to questions about current concepts, doubting whether these will still be suitable for the future offshore wind farms. With new projects planned to be built more than 100 km away from the shore; such as H2-20, a project only at a very early stage, consisting of 80 turbines ca. 280 km away from the shore and Dogger Bank Teeside D (Tranche C), a project of 120-400 turbines with a distance of 190 km from the shore [4], average sailing time from the land base to the wind farms will exceed the acceptable limits for transit time, approx. 2 hours, making it impossible to carry out sailing back and forth on a daily basis. All together make it necessary to develop new solutions, in order to cope with the challenges of new generation wind farms.
Figure 9 - Active and planned Wind Farms Map, North Sea taken from 4C Offshore Database [4]
There are several novel solutions proposed for the increasing distance of the wind farms from the shores. The new trend to cope with this problem is to make use of hotel vessels which are to be positioned near wind farms, accommodating the maintenance crew onboard for several weeks. An improvement to this concept is to make use of daughter crafts to be used for crew transfer operations to the wind turbines, in order to increase the range of operability. Although there are several ideas being developed according to this ideology most of these projects are currently in development or concept stage such as the “Launch and Recovery System” from DIVEX. Analyzing the limited information about these concepts, it can be seen that most of the daughter crafts are relatively small and less versatile vessels compared to the daughter vessel that is to be used in the concept developed by KNUD E. HANSEN A/S. The challenges of designing this vessel will be explained from here on, starting with explaining the concept itself in more detail.

21
2.3 New Concepts As it is mentioned, one of the solutions for the transportation problem caused by the increased sailing distances and worse weather conditions, is being developed by KNUD E HANSEN A/S, which consists of a combination of several vessels:
- a multi-purpose Service Operation Vessel (SOV) with a LOA approx. 100 m, which will serve as a hotel, dock and operations vessel being positioned for a long period of ca. 30 days, in the close vicinity of the offshore wind farms;
- a 14 m fast rigid-inflatable boat (R.I.B.), which will be stored onboard the SOV; - And a CTV which will also be stored onboard the SOV to be used in crew transfer operations, as it will be
explained below. Positioning the SOV strategically near the wind farms will reduce the sailing distance for any maintenance operation from hundreds of km to only a few km, which will result as reduced operational costs, reduced operational time, hence possibility to visit more wind turbines on a working day and possibility to remain operable in bad weather conditions. The SOV is capable of carrying out various maintenance operations itself: such as underwater operations, lifting operations by using onboard cranes and also crew transfer operations by making use of a gangway. The vessel also serves as a floating hotel for the maintenance crew to accommodate on.
Figure 10 - Transportation Concepts
The other two vessels, R.I.B. and CTV, which are stored onboard the SOV, will be used to transfer wind turbine maintenance crew to the wind turbines, which will make it possible to cover a larger area within a certain amount of time. Further, this will enable to carry on crew transferring operations while the SOV is occupied by other tasks. Three vessels having different levels of operational limits, the operational area will reduce with increasing sea states. A visualization of the situation can be seen below. e.g. on fine sea conditions, with significant wave heights up to 1.5m, all three vessels will be operable. Between 1.5m and 2-2.5m only CTV and SOV will be operable. Above 2.5m up to 3-3.5m only the SOV will remain operable. Being able to use 2 vessels at a significant wave height of 2 m, together with short sailing distances, will guarantee fast and economic maintenance operations even for the wind farms that are located furthest offshore and with toughest environmental conditions, as desired by the energy supplier companies. As it is stated in the introduction of this report, the scope of this project does not involve any solution development for the general transportation concept or any design work for the SOV & R.I.B. Only the design process of the CTV and aspects/equipment related to the CTV will be handled further in this report.

22
Figure 11 - Operation Limits of the new concept
Looking from the CTV point of view, the vessel has to be able to fulfill certain tasks in order to guarantee the success and efficiency of the concept. As the main task of the vessel: “crew transferring to the wind turbines in a safe manner up to sea conditions with 2 meter significant wave heights”, is the prior aim to be provided by the designer. Further to understand the complementary design requirements and related design decisions, main operational concepts should be analyzed first.
2.3.1 Operational Conditions for the CTV In good weather conditions, the vessel is able to sail at high speeds up to 20-25 kts. This requirements is derived from the aim of visiting 30 wind turbines on a working day. As it will be explained in more detail later in this report, in average conditions visiting 30 wind turbines with a transit speed of 20 kts is estimated to have a duration of 6 hours. In the North Sea Area, with a daylight duration of 7 hours in the winter season, a margin of 1 hour is provided for any unknowns or possible longer-than-average operations. Considering that such unknowns and potential problems are unavoidable for such irregular operational tasks, which depend on hourly weather conditions, expected forecasts, actual wind turbines that have to be visited and actual specific operations that have to be carried out at each wind turbine, the desire for a capability to reach speeds in the range of 20-25 kts can be justified. As another operational condition, high sea conditions are considered. As it is explained above, it is desired that the vessel remains operable for crew transferring up to 2 meter significant wave height. Naturally, it is not expected that 20-25 kts is achieved in these weather conditions, which is also prevented by the classification society with regard to the assigned design accelerations. According to the given rules, a maximum allowable transit speed is assigned to each sea condition in order to maintain the accelerations below the design accelerations of the vessel, which in this case is estimated as approx. 15 kts for seas with 2 m significant wave height. Furthermore, in reality it is expected that the transit speed and course is to be adjusted by the captain for each specific condition according to the experienced accelerations. From the design point of view, this condition is accounted for by adjusting above and below water geometry of the vessel, as well as the general arrangement and the location of the wheel house, in order to reduce the peak and significant accelerations, which directly will lower the severity of the conditions that is experienced by the captain, allowing him to maintain higher speeds and to visit more wind turbines during a working day and the passengers, as well as reducing the seasickness percentage for the passengers, which is of high importance as it will be explained later on. Furthermore, the high sea conditions introduce another requirement other than the experienced accelerations on transit stages. This is the absolute vertical motions of the vessel, which is of high importance for crew transferring and docking operations. As it will be explained in more detail later in the report, the operational limit for crew transferring, which dictates the efficiency of the vessel, is directly related to the vertical motions of the vessel. This is why this criteria is considered a primary design criteria. By remaining operable, the vessel will still be able to visit several wind turbines, where in comparison other vessels, which operate on a daily basis sailing longer distances, will not be able to carry out any operations or will be too uncomfortable for the passengers to carry out maintenance work due to long sailing distances in rough sea conditions.

23
As the last operational condition, emergency states should be considered. This is when the sea state increases over the operational limits for crew transferring, which is desired to be around 2 m sig. wave height. The vessel is then required to dock at the SOV, for which this operation is desired to be limited at 2.5 m sig. wave height. In the worst case scenario, where the wave heights exceed the 2.5m docking limit, the vessel should be able to maintain its position for a duration of approx. 1-2 days or to be able to sail to the shore for safety, which will be decided for each specific case considering the actual weather and sea conditions. This implies that the vessel should have a reserve capacity for fuel and provisions with sufficient margins at all times.
3 Design of the Crew Transfer Vessel As it has been briefly explained in the last chapter, the tasks that are assigned to the vessel set a number of requirements, which have to be considered during the design process in order to achieve a successful design. In this chapter these requirements will be explained in detail and will be translated into concrete values which will affect the decisions along the design process and shape the final product, as it will be explained in later chapters. It should be noted, that some of the design requirements are derived from the desired tasks and estimated operational conditions such as the requirements derived in the last chapter, while others are set by the concept developer e.g. number of passengers to be accommodated on board.
3.1 Design Tasks, Requirements and Constraints
3.1.1 Launch and retrieving in the dock of the SOV To start off, the CTV should be able to be stored inside the dock of the SOV and should also be able to dock in /out under heavy weather conditions. The design limiting condition for launching and retrieving is set at 2.5 m significant wave height, as it is desired by the concept developer. Since the design of the SOV is not within the scope of this project, the dock dimensions will be used as they are delivered from the concept developer. On the other hand, it is believed that the manner of retrieving and launching the CTV is a key parameter in the design and operability of the CTV, which is why this procedure will be handled in this report as well. This implies that the main dimensions of the CTV are driven by the inner dimensions of the dock.
Figure 12 - Dimensions of the dock and estimate of CTV

24
As it can be realized in the first instance, in order to achieve the desired operability, good maneuverability and minimum wave induced motions in all directions at low or no speed are essential requirements for the design of the CTV. Since the SOV has a catamaran shaped body in the aft, there is no bottom existing in the dock, which will give some freedom in the design regarding the constraints in the vertical direction. Initially it is decided that launching and retrieving operations will be carried out only when SOV is in head seas conditions. It is believed that this will result as canceling out most of the lateral forces, which cause roll, yaw and sway motions, simplifying the situation. These motions are still to be expected though, due to the complexity of the hydrodynamic interactions between two vessels and natural spreading of the irregular waves. It is also expected that small forward speed will help reducing the risk of excessive collisions, providing a certain level of maneuverability to both vessels. Further effects of forward speed should be investigated regarding the motions of both vessels and hydrodynamic interactions inside the dock. Moreover, it is considered to be unavoidable, that these two vessels collide during the retrieving and launching operations. This fact suggests that it is necessary to make use of well-designed fenders and dampeners, which will absorb the impact forces and prevent any damages on both vessels. Furthermore, it is necessary to make an appropriate structural design of both the CTV and the launch/recovery mechanism on the SOV, which can withstand the maximum pressures which will be resulted due to these impact forces during docking procedures. Since these mentioned impact forces depend highly on the impact velocities of these vessels relative to each other, the driving parameters for limiting the safe operations in the dock should be determined accordingly. The relation between sea state, relative velocities and design pressures, as well as the proposed design for the dock arrangement will be handled in a further chapter in more detail. As last it is decided, that in case it is no longer possible to dock in the SOV due to extreme weather conditions, the CTV should have enough fuel capacity to maintain position until it is possible to dock or to sail together with the SOV to a location where it is possible to dock into the SOV. During the waiting or transit time, the SOV is to give shelter to the CTV on its lee side. Determining the appropriate fuel capacity will be handled in the deadweight calculation. The procedure for emergency cases during extreme weather conditions would depend on the specific information for each case such as significant wave height, wave period, direction and expected forecast. To summarize, the launching and retrieving operations will implement the following requirements and constraints:
- Maximum dimensions of the CTV are driven by the max inner dimensions of the SOV - Good maneuverability. - Minimum motions, especially at low or no speed in vertical direction is desired, since the operations are
mainly limited to headseas. - Structural design of the vessel should be made according to the max expected impact forces, as well as the
fender and dampener design should be made in such a way that the expected impact forces will allow a feasible structural design.
- Enough reserve fuel capacity to maintain position for a certain amount of time or to sail to a calmer location, during the emergency cases
3.1.2 Transit Sailing Once the CTV is successfully launched from the SOV, the CTV has to be able to maneuver quickly, reach the transit speed and keep the transit speed until the wind turbine is reached. It is desired, by the concept developer that the CTV vessel will reach a transit speed of 20-25 kts in calm water, as explained in the last chapter. Further, it is essential that the CTV proves high seakeeping abilities and high comfort for the passengers in order to minimize seasickness and maximize the operational envelope. As it can be imagined, the technicians should be healthy enough to be able to work once the wind turbines are reached. Also considering that the technicians are mostly not used to ship motions, attention should be paid to keep the MSI low, which directly relates to vertical accelerations on the vessel, especially on the passenger areas. [10]

25
Due to the nature of the concept, as explained in the earlier chapters, the distance to the wind turbines farm is minimized by strategic positioning of the SOV, which implies that the transit time is relatively short compared to other transportation concepts. This allows reducing speed on transit stages in order to maintain operability as the sea state increases, while keeping the transit times within acceptable margins. For an example, reducing speed from 25 kts to 15 kts increases the transit time between two wind turbines only by 2 mins. Although reducing speed will result as visiting less wind turbines a day, when compared to other concepts, where some of the vessels will not be able to visit any wind turbine due to long transit sailing times in high sea conditions, the benefit of the current concept can be visualized easily. Since in reality the speed reduction is done according to the “feelings of the captain”, as it will be explained later, it is not possible to determine the operational speed in high sea states. This is why the maximum allowed speed of 15 kts for 2m significant wave height as given by DNV HSLC Rules Pt.3 Ch.1 Sec.2, B205, is used for the calculations.
Figure 13 - Wind turbine spacing
Sailing distance is taken as 3 km according to reference wind farm dimensions [8] [21], where the turbine spacing has a 2 km diameter as it can be seen in figure 13. Since the vessel will not always sail to the next consecutive wind turbine, a 1 km extra distance is taken on average. Transit sailing time is estimated approx. as 8 minutes for rough sea conditions, accounting for 20% margin for each cycle of sailing from wind turbine to another. Accounting also for 7 minutes for crew transferring operations, as estimated by the concept developer, it can be concluded that the high speed operations are expected to form approx. 50% of the whole operational envelope in normal conditions. Considering also that most of the operations will be carried out in high sea states and as a consequence the speed will be reduced without having a big impact on the transit times, it is highly expected that the vessel will spend a bigger portion of its operational time at low speeds. This implies that the operability and comfort at lower speeds or at zero speed during the operations should be prioritized over features at high speeds. Furthermore, it is set by the concept developer that the CTV vessel should have enough capacity to visit 30 wind turbines and carry 24 technicians excluding own crew of the vessel. As explained earlier, in order to fulfill this requirement, the vessel needs to achieve high speeds of approx. 20 - 25 kts. To summarize, the transit sailing stage operations will implement the following requirements and constraints:
- 20-25 kts max speed in calm water - Good seakeeping and comfort in high sea states up to 2 meter significant wave height - Seakeeping performance at low speeds is prior to high speed performance, where low speeds implies the
motions to be within linear domain. - Low values of significant vertical accelerations in order to keep MSI low, especially in the passenger areas - Enough daily fuel capacity to visit 30 wind turbines - Capacity for daily accommodation of 24 PAX

26
3.1.3 Transferring PAX to the wind turbines As its main purpose, the vessel should make it possible to transfer the technicians to wind turbines in sea states up to 2 meter significant wave height. This implies in the first instance, that the motions of the vessel should be minimum and maneuverability maximum at low speeds. Further, during the design of the bow fender, attention should be paid to create a geometry which is easy to aim on the boat landing and doesn’t require any fine tuning, when approaching the wind turbines. Once the wind turbine is contacted, it is important to keep the bow stationary, in case the conventional method of thrusting against the wind turbine is used to transfer the passengers, as previously explained. In case a gangway installation is used for this purpose, it is important to have the motions on a minimum level in order to make passenger transfer possible. Design and further analysis of this operation will be handled in a later chapter. Furthermore, the forces that are applied on the pillars of the wind turbine boat landing should remain lower than the design loads of these pillars at all cases. To summarize, the operations for transferring passengers to the wind turbines will implement the following requirements and constraints:
- Good maneuverability - Minimum motions at low speeds - Requirements according to the chosen technician transfer method - Bow fender geometry to ease the approaching procedure - Good visibility from the wheelhouse - Impact forces should remain lower than design loads of relevant structures
3.1.4 Lightweight and Material As another requirement that is derived from the design tasks, the vessel needs to be light weight in order achieve high speeds. Further it is also important to keep the vessel light in order to keep the impact forces low during unavoidable collisions. As the impact forces are directly related to the kinetic energy during the impact, it is also directly related to the mass of the vessel. Considering these collisions, the material that is used on the vessel needs also to be appropriate for absorbing these impact forces. The shape of the hull, production process and cost are other important aspects of the material choice, which will be handled later in the report.

27
3.1.5 Summarized main requirements
o Operability, safety and comfort are the main priorities of the design. o Dimensions are to be decided according to the inner dimensions of the dock. o Design speed in flat water conditions - 20 - 25 kts o Acceptable operational limits for North Sea Area: Launch and Retrieve in the dock: - 2.5 m significant wave height Transferring to wind turbines: - 2.0 m significant wave height o Transit stage seakeeping criteria is chosen according to Nordforsk standards and Motion Sickness Index
criteria should also be considered additionally to Nordforsk. o Safe and practical manner to dock at the SOV within the desired operational limits. o Safe and practical manner to transfer passengers to wind turbines within the operational limits. o Priority on low speed performance. Especially vertical motions should be kept minimum. o Good maneuverability. o Operability criteria for crew transferring and docking operations are to be chosen according to the method
of docking and crew transferring. o Endurance: enough fuel capacity to visit 30 wind turbines and a reserve to be used in emergency cases.
(maintain position for approx. 1-2 days or to sail to the shore) o Provisions are to be supplied and unloaded at the SOV. Reserve provisions are to be kept for emergency
cases. (approx. 1-2 days) o Capacity to accommodate: - 24 passengers
- 3 crew members o 2 crew cabins for extended operations, so that the crew can work in shifts. o Changing room for the maintenance crew. o Practical and comfortable general arrangement/design. o Cargo capacity: - 10’ container, 5 t o Further attention should be paid to the requirements from class notation as “DNV Passenger Windfarm”
according to the HSLC Rules.
3.1.6 Design questions All the design requirements and constraints that are explained in the last chapter implement the following main design questions, which are to be answered in order to achieve a successful design.
- What are the maximum dimensions of the vessel, in order to fit in the dock and have enough deck space to fulfill the accommodation requirements?
- What kind of hull form/type is to be used in order to: minimize the wave induced motions at low speeds; maximize comfort at high speeds; and also be able to maintain high transit speeds?
- Which method should be used to transfer passengers to the wind turbines? - Which method should be used to launch and retrieve the vessel in the dock of the SOV? - What are the limiting values and sea states according to the chosen methods? - How does the vessel perform with regard to seakeeping and operability for crew transferring and docking?
Further more basic design questions should also be answered. Such as:
- Which materials should be used on the vessel? - What is the estimated weight of the vessel? - What is the estimated power requirement of the vessel? - What is an appropriate propulsion system? - Which equipment is to be used on the vessel? - What is a practical general arrangement?
All these questions will be handled separately in detail along the explanation of the design process in the following chapters.

28
3.2 Summarized Design Method As it is required for any creative endeavor, an iterative process is required to be followed in order to achieve an optimal solution to all of the design questions. This is caused by the sensitive relationship between different design aspects to each other. Naturally every decision that is taken during the process has an impact on other aspects of the design, which constantly makes it necessary to make corrections and adjustments on earlier decisions and assumptions along the design process. Due to the complex structure of the process, a summary of the whole project will be given first in order to provide a clear overview over the path that is followed during the design process. In later chapters, final decisions and main considerations for each aspect of the design will be handled in more detail. First off, possible concepts for the type of the vessel, propulsion system, lifting device in the dock of the SOV and crew transfer operations are considered. Initial decisions are taken considering similar vessels, equipment and relevant experience. The design process of the vessel is then proceeded by making an initial estimate for the main dimensions of the vessel. As it will be explained later, this estimate is based on the maximum inner dimensions of the dock, similar size vessels and the required area for a practical general arrangement. The initial hull lines are estimated according to basic knowledge of a seaworthy vessel, properties such as high freeboard especially in the bow area, high deadrise angle and little flare and other design recommendations from various sources with regard to seakeeping and resistance are considered. Waterlines are tried to be kept streamlined in order to have good properties from the resistance and propulsion point of view. The resulting waterlines are used to make a more precise general arrangement. Company standard weight factors and initially chosen equipment are used to make a preliminary weight estimate, where cross sectional areas are used to make an estimate of the displacement and intact stability of the vessel. As a result of several iterations, the required dimensions, such as beam and draft are determined in order to achieve a sufficient level of stability for the desired general arrangement and approximate hull shape. The sketches are then modeled in 3D to be used in basic ship design software. After validating the initial stability calculations, appropriate empirical formulas are used to make an estimate of the resistance curve. The engine model is then adjusted according to the required engine power, which has led to adjusting the weight and stability calculations. Although design recommendations are followed to determine the initial estimate of the hull lines, a study is done to find the relation between the hull parameters and seakeeping performance of the vessel, as it will be explained in more detail in the following chapters. It was not possible to carry out this study earlier in the design process, since several parameters of the hull are required to carry out this study, such as weight distribution, displacement, approximate hull lines and general arrangement. The hull lines are then adjusted to make sure that the seakeeping performance of the vessel is prioritized in order to minimize the vertical motions of the vessel, as desired by the design requirements. Following a cycle of adjusting hull lines, checking seakeeping performance, resistance estimation, adjusting general arrangement and checking intact and damage stability, the design is improved, providing a good level of seakeeping abilities, capability to reach high speeds, a practical general arrangement and sufficient level of stability. Relevant design considerations, together with the final decisions for every aspect will be discussed in more detail in the following chapters of this report. At the end of the process, a detailed seakeeping analysis has been carried out to evaluate the decisions that are taken during the design process and resulting performance of the vessel, from which the results will be used to evolve the design in the following stages.
29
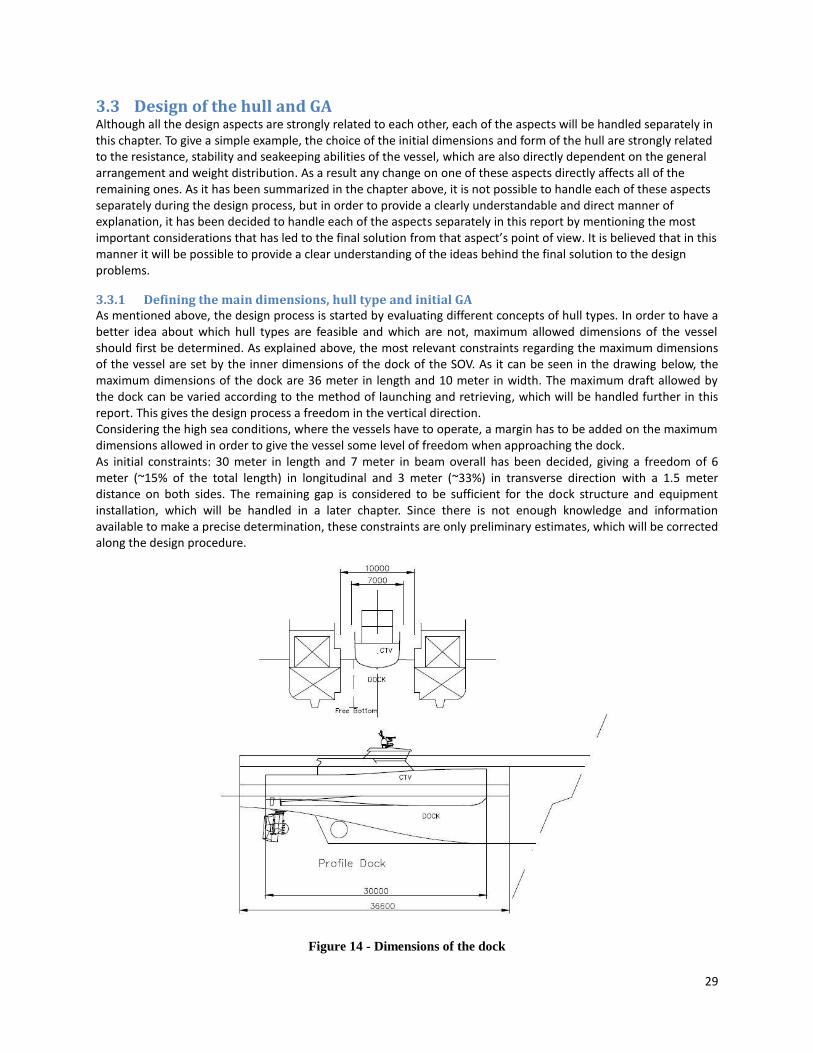
3.3 Design of the hull and GA Although all the design aspects are strongly related to each other, each of the aspects will be handled separately in this chapter. To give a simple example, the choice of the initial dimensions and form of the hull are strongly related to the resistance, stability and seakeeping abilities of the vessel, which are also directly dependent on the general arrangement and weight distribution. As a result any change on one of these aspects directly affects all of the remaining ones. As it has been summarized in the chapter above, it is not possible to handle each of these aspects separately during the design process, but in order to provide a clearly understandable and direct manner of explanation, it has been decided to handle each of the aspects separately in this report by mentioning the most important considerations that has led to the final solution from that aspect’s point of view. It is believed that in this manner it will be possible to provide a clear understanding of the ideas behind the final solution to the design problems.
3.3.1 Defining the main dimensions, hull type and initial GA As mentioned above, the design process is started by evaluating different concepts of hull types. In order to have a better idea about which hull types are feasible and which are not, maximum allowed dimensions of the vessel should first be determined. As explained above, the most relevant constraints regarding the maximum dimensions of the vessel are set by the inner dimensions of the dock of the SOV. As it can be seen in the drawing below, the maximum dimensions of the dock are 36 meter in length and 10 meter in width. The maximum draft allowed by the dock can be varied according to the method of launching and retrieving, which will be handled further in this report. This gives the design process a freedom in the vertical direction. Considering the high sea conditions, where the vessels have to operate, a margin has to be added on the maximum dimensions allowed in order to give the vessel some level of freedom when approaching the dock. As initial constraints: 30 meter in length and 7 meter in beam overall has been decided, giving a freedom of 6 meter (~15% of the total length) in longitudinal and 3 meter (~33%) in transverse direction with a 1.5 meter distance on both sides. The remaining gap is considered to be sufficient for the dock structure and equipment installation, which will be handled in a later chapter. Since there is not enough knowledge and information available to make a precise determination, these constraints are only preliminary estimates, which will be corrected along the design procedure.
Figure 14 - Dimensions of the dock

30
Having set the range of the main dimensions of the vessel and considering the tasks that have to be fulfilled, it is now possible to evaluate different types of vessels in order to find the most suitable one for this design. Considering multi-hulls briefly, it can be concluded that the limitation in the beam direction is decisively too small to allow accommodating any seaworthy multi-hull in the dock of the SOV with the given margins. An example can be given as the SWATH vessel given in figure 5, which has a beam of 13m for a design waterline of 24m. Further evaluating a database, it can be seen that at least a beam of 13-14 m would have been required, as it can be seen on figure 15. Similarly a catamaran or trimaran would suffer from the same limitation in beam direction. Due to this constraint, multi-hull vessels are not found to be practical and are excluded in this project.
Figure 15 - SWATH Designs: Beam-DWL relation, graph taken from ISPET Concept Design Presentation [8]
Further considering the specific design tasks such as regular collisions in the dock area, being lifted by the docking mechanism out of the water and thrusting against the wind turbines as a part of the ordinary design operations, make it necessary to use a simple and robust design, which can be used in a rough manner. Together with low costs in production, simplicity and ability to stay operational on high sea states make mono-hulls a good option over the multihulls. As literature suggests [9] [10], when mono-hulls are considered, size does matter for better seaworthiness. It is given by several sources, that for a given displacement higher water line length helps reducing the motions in general. Therefore 30 m has been chosen as the initial design length, which is the max limit in length direction, as it has been set by the dimensions of the dock. Further considerations about the type of the mono-hull lead to a choice of round bilge hull in the displacement – semi displacement region. The reason for this is the superiority of round bilge displacement vessels over the hard-chine planning vessels in their ability to maintain performance in high sea states. Also, it is to be reminded that high speed abilities are considered as secondary after the performance in seakeeping, which is why choosing a planning hard-chine type of hull is not considered suitable for the design. As it will be mentioned later, the material choice is also in compliance with the choice of the hull type. Having decided on the type of the hull and length of the vessel, other initial decisions should be taken as followed, in order to have a better idea of the desired outcome:
A high freeboard is required, especially near the bow of the vessel, in order to reduce the probability of green water
Open deck space is required to make a comfortable working space in the bow
An easy routing on the deck should be achieved by placing the seats and changing-room strategically on the main deck
The wheelhouse should have good visibility
The seating room and wheelhouse should be placed above or abaft of the COB and COF, in order to minimize the effect of the motions/accelerations on the passengers
Since it is a relative small ship, the position of the engine room will have a big effect on the position of the COG. So, the engine room should be placed near the COB

31
Two accommodation cabins for the crew should not be placed in extreme locations, such as in the bow of the vessel or next to the engine room, in order to keep the comfort level high.
Rules and regulations should also be considered in order to prevent any big changes in later stages of the design process. One of the most important aspects of the class regulations is the stability and damage stability calculations. Therefore the compartment division should be done strategically according to the necessary spacing required by the general arrangement and also satisfying the damage stability conditions from HSC CODE 2000, as desired by the DNV HSLC Rules.
Appropriate aft hull shape for the desired propulsion system.
A strong structure and a practical design to make the PAX transfer from the bow as easy as possible Considering above mentioned aspects, the initial GA, waterlines and cross-sections have been sketched, so that the requirements regarding the main dimensions and a rough weight estimate can be derived from the GA.
Figure 16 – Initial GA Approximation
The first analysis of the hulls reveal that a width around 5-6 m is necessary for a sufficient level of stability and a draft of around 1.2-1.5 m for the required displacement of (80-85 t), which are well within the margins that are set according to the dock dimensions.
3.3.2 Defining the hull lines and parameters The initial hull lines are revised along the design process in order to fulfill the design requirements. As it has been explained several times, the nature of the concept requires a good performance in different aspects and it is to be expected that the chosen hull will find the best compromise between the conflicting requirements. Different requirements that are mentioned earlier in the report will be handled separately in this chapter and explained how these affected the choice of hull form.
3.3.2.1 Motions at low speeds It is to be reminded that it is very difficult to make big changes in the seakeeping performance by making small changes in the hull shape. It is mostly necessary to make big changes in the form of the hull e.g. the waterplane area coefficient, beam or draft. Since beam and draft are mainly decided by the general arrangement and the stability of the vessel, relation of the waterplane area coefficient to the vertical motions is examined by making a comparison between different hulls that are derived from the same hull. Furthermore, although there are some recommendations available in the literature regarding the seakeeping performance of vessels at high speeds, it was not possible to find many recommendations regarding zero speed or low speed seakeeping performance. Because of this reason, it is decided to include also other parameters such as LCB, LCF, CWPA, CB, CP etc. in the comparison. In order to carry out this comparison, a 3D model of the initial 2D sketch has been made, which is afterwards used to create the variations of the initial hull. Since it is a very time consuming and difficult process to vary only one parameter while keeping others constant, these hulls are varied in a simple and fast manner, where several parameters are different in each hull. Attention has been paid though in order to keep the length of the waterlines and the displacement of the hulls constant, except for 2 vessels that have a smaller waterline. These vessels can easily be seen with the highest overall motions on figure 17 and 18. The procedure that is followed for this comparison makes it not possible to derive the effect of the change from a single parameter. It should be kept in mind that, this comparison has no scientific value and is only valid as an indication for this particular case. This procedure is found sufficient to get an idea about the relation between

32
some of the hull parameters and low speed seakeeping performance of this vessel. A hull-design software has been used for this procedure, from which trustworthiness is proved by its usage in the commercial projects over the years. This software makes use of strip theory in order to calculate the motions of a vessel for a given sea state. Strip theory can be summarized as a linear, slender body theory, which is based at the potential flow theory. The linearity implies that the motions have to remain relatively small. Considering low speeds or no speed conditions, this constraint is not expected to be a problem. Further, the length to breadth ratio of around 5 is also to fulfill the slender body theory requirements. As last, the potential flow theory implies that the calculations do not account for viscous effects. This means neglecting all the viscous damping effects, which normally can be included by empirical formulas. [11] Furthermore, strip theory calculates the motions of the hulls, by the dividing the hull into infinitely thin strips along the length and determining the loads induced by the waves, hydrodynamic coefficients and motions on each section satisfying the equilibrium of forces and moments, which are later on integrated over the whole length of the hull. It is also to be remembered, that strip theory only accounts for the geometry below the design waterline. During the calculations, physical properties that are unknown at this stage of the design are kept constant for all hulls. It should be reminded that roll gyradius and roll damping ratio are of little importance because the comparison is only made for head seas conditions. These parameters are given as:
- VCG: as concluded by a rough estimate at 2.7 m above base line - Pitch gyradius: 20% Loa - Roll gyradius: 30% Beam - Damping ratio: 7.5%
JONSWAP spectrum has been chosen for the analysis because of the defined operational zone of North Sea, with 5 different zero-crossing periods as 4, 6, 8 and 12 seconds. The significant wave height is set to 2.5m in head seas condition. The forward speed is set to 1 kts. The motions on the vessel are measured on three different locations. These correspond to one at the bow, one near the mid-ship location, where the seats are expected to be located and one in the aft of the vessel. All points are set on the same height as on approx. bulwark height. As a result, it is found that the water plane area coefficient is one of the most influential parameters and that the absolute vertical motions reduce with increasing water plane area and more forward CoF as shown on Figure 17 and 18. As it can be seen, the effect is more significant for shorter wave periods. This might be of importance for the natural period of pitch and heave motion, which should be expected on shorter periods. There is no big difference between different hulls experienced on longer wave periods, where the vessel is expected to follow the contour of the waves for all different vessels. The relation between the water plane area and the vertical motions can be explained, when the dynamic equilibrium of moments and forces are considered. As it is known, this equation has the form of:
a x’’ + b x’ + c x = FWAVE In this equation, coefficient c represents the hydromechanic spring coefficient of the hull, which corresponds to the buoyancy, hence the water plane area of the hull integrated over the draft. As it can be easily visualized in an analogy of mechanic springs, a more stiff spring with higher spring coefficient would result in smaller displacement for a given force. It has been concluded, that a big waterplane area, especially in the forward part of the vessel as much as it is practical with regard to other aspects, is desired in order to minimize the vertical motions of the vessel, which are of importance with regard to safety and operability when approaching the wind turbines and the SOV. On the other hand, this choice result as other conflicts in the design as it will be explained in the next chapter. Furthermore, the choice of the position of the seats on the vessel is justified by the overall lowest motions as it can be seen on the graphs below. Also the positive effect of increased waterline length can be seen, when considered that the two highest motions are resulted by the 24 meter DWL variations, which can be explicitly seen on the graphs with 4 s modal wave period.

33
Figure 17 – Abs. Vert. Motions (significant amplitude) in relation with CWPA in Modal Periods of 4, 6 and 12 s
0.000
0.500
1.000
1.500
2.000
2.500
3.000
0.000 0.200 0.400 0.600 0.800 1.000
m
Cwpa
T= 4s ABS Vert Motions
Bow
Seats
Aft
0
0.5
1
1.5
2
2.5
3
0.000 0.200 0.400 0.600 0.800 1.000
m
Cwpa
T= 6s ABS Vert Motions
Bow
Seats
Aft
0.000
0.500
1.000
1.500
2.000
2.500
3.000
0.000 0.200 0.400 0.600 0.800 1.000
m
Cwpa
T= 12s ABS Vert Motions
Bow
Seats
Aft

34
Figure 18 – Abs. Vert. Motions (significant amplitude) in relation with CoF in Modal Periods of 4, 6 and 12 s

35
3.3.2.2 Forces at the wind turbine contact As it has been mentioned before, another aspect to consider, which will have an impact on the choice of hull form, is the method of transferring passengers at the wind turbine. First question, regarding this problem is: which method to be used for the crew transferring? In order to make this decision, the magnitudes and limits of the forces that are relevant in this operation have to be analyzed. These can be listed as:
- Max allowed loading on the pillars are 20t (200 kN) - Max available bollard push according to an estimated available power of: 2386 kW is approx. 34 t (342 kN)
[12] - Friction coefficient is taken as µ = 1 as given by DNV HSLC Part 6 Chapter 30.
By neglecting the dynamic forces, an estimate can be made for the magnitude of the required friction forces that are required to keep the bow of the vessel stationary. Following assumptions and simplifications are taken into consideration, which is the reason that this estimation can only be regarded as an indication for the order of the magnitude of these expected forces.
- The wind turbine is stationary - The vessel is a free moving body in 2D plane, when closing to the wind turbine. - The vessel experiences a huge amount of damping on the bow in vertical direction when it contacts the
wind turbine. - The contact point becomes stationary and can be regarded as a hinge joint. - The waves are in head seas condition.
By using the simple equilibrium of forces and moments around a hinge connection, the friction force can be calculated that is required to be created between the bow fender and the wind turbine boat landing in order to keep the bow of the vessel stationary. A sketch of this situation can be seen on figure 19.
Figure 19 - Hinge Assumption
The equations to be fulfilled are:
∑M = [FW * xW ] – [FB * xB ] = 0 ∑Fz = - FFr + FB – FW = 0
xW and xB represent the weight and buoyancy arm as shown in the figure. This reveals that, in an equilibrium state, the required friction force (FFr) is equal to the difference between the buoyancy (FB) and weight (FW) of the vessel. Hulls from chapter 3.3.1 are analyzed by using a hydrostatics-software. A sinusoidal waterline with amplitude of around 2 m is introduced, as the theoretical highest waves that are expected in a spectrum with a significant wave height of 2m. Trim and sinkage of the vessels have been adjusted iteratively by keeping a reference point at the

36
bow constant until the equilibrium of the moments around the hinge connection is satisfied. After reaching the equilibrium position, the required friction force has been calculated by using the equations given above. The friction force is related to the normal force (FN) on the pillars by the simple equation: FN * µ = FFr , where the normal force is equal to the bollard push of the vessel. Results indicate, that these normal forces are expected to be around 600-700 kN, which are much higher than the allowed forces on the pillars (200 kN) and the available estimated bollard push. Further, it can easily be realized, that the required force is to be increased with increasing buoyancy. This fact conflicts directly with the design decision as set in chapter 3.3.1, which is to increase the waterplane area, especially in the bow. Because of all the aspects that are mentioned above, it is decided to make use of a gangway installation to be used for crew transferring operations, which does not require the bow of the vessel to be kept stationary. This will allow increasing the water plane area and minimizing the vertical motions of the vessel without worrying about the extra buoyancy forces. It is also to be expected, that minimizing motions will be beneficial when transferring the crew by using a gangway installation, controversial to the case of using conventional methods. The choice of the gangway installation will be handled in a later chapter.
3.3.2.3 Seakeeping and comfort at high speeds Although it has been mentioned that high speed operations are considered as secondary requirements due to the high speed/low speed ratio of the operational envelope, it is still essential to pay attention to the sea keeping abilities at high speeds in order to enlarge the operability and increase the comfort of the vessel. As the main objective of the vessel, the vessel should be able to transport maintenance crew to the wind turbines. This objective also implies that the crew should be in a state to work once the turbines are achieved. In order to fulfill this requirement, the MSI should be kept as low as possible. The first step to avoid the passengers getting sea sick is to provide a practical general arrangement considering especially big windows to maintain visual contact with the horizon/any other external reference point. Another important aspect is the location of the passenger seats on the vessel. The location should be chosen in such a way, so that the accelerations that the passengers experience are kept as low as possible. A mid-aft location on the lowest deck practically possible would be a favorable location. This location is justified by the analysis that is explained in chapter 3.3.1. Regarding the form of the hull, the vessel should keep the significant vertical accelerations as low as possible in order to keep the MSI low. Considering that the vessel is within the linear domain due to the reduced speed, some suggestions to achieve a good performance can be listed as [10]:
Large Length waterline
Shallow draft
Large waterplane area Furthermore, the performance of the vessel can be improved drastically by simply adjusting speed and heading. From the operations point of view, as explained earlier, this transportation concept has the advantage to reduce speed and still maintain acceptable durations of transit sailing time. Evaluating the operability of the vessel at higher speeds, different aspects should be considered since the hydrodynamics that are involved at higher speeds are different than at lower speeds. As explained by J.A. Keuning [13], non-linear wave exciting forces are the most influencing factor of the motions of a high speed vessel. Further, it is stated that, instead of the measured significant values of motions, the impression by the crew is decisive for the practical operability of a vessel. It is stated that a voluntary speed reduction in order to prevent “a single peak acceleration” from happening again is the main limiting factors at higher speeds. This means that although significant values are within the acceptable limits, the crew often decides to reduce speed just because once the vessel experienced one single peak acceleration. When these non-linear peak accelerations are considered, one of the main causes can be named as: large relative motions of the vessel in irregular seas. [14] From the design point of view, this aspect introduces new criteria in order to reduce the magnitude and occurrence of these peak accelerations.

37
Some of the new aspects can be listed as they are suggested in the literature [9], [13] and [15]:
Above and below water geometry of the hull and change of the geometry according to the dynamic waterline. This change should be kept minimal in order to reduce the peak forces. (prevent high flare above waterline)
Small submerged area of a section
Deep draft at the bow of the vessel in order reduce the probability of slamming, although it is normal that motions decrease with increasing Length/Draft ratio.
High deadrise angle is desired, since it is known that it helps to prevent high peaks in case of slamming
High freeboard is essential to prevent water coming on the deck. As it is the case for most of the design aspects, a balance is to be found between conflicting requirements and considering the practicality of the design with regard to the general arrangement.
3.3.2.4 Other aspects to be considered for hull form selection Apart from the aspects that are mentioned above, several other aspects should also be considered for the choice of the hull form. One of these is the choice of propulsion system. It is proposed to make use of a concept developed by a Norwegian company, with the name “SERVOGEAR AS”. The decision for the use of this type of propulsion system will be explained in more detail later in the report. It is important to mention in this chapter, that the propulsion system makes use of propeller tunnels, which imply 2 streamlined recesses with a circular cross section in the aft of the vessel, where the propeller and the propeller shaft are fitted. Although these tunnels are normally to be designed by the supplier, at this early concept stage of the design, it has been found sufficient to model only a representation of these recesses. Another aspect regarding the propulsor system is the spacing of the propellers. For good maneuverability it is important to make use of 2 propellers that are stationed as far away as possible from each other. Since the positions of the propellers affect directly the position of the tunnels and the main engine positions, this is also to be considered at this stage. It has also been decided to make use of a skeg in order to increase the directional stability of the vessel. Furthermore this decision is advantageous to increase the roll damping coefficient. As last and one of the most important aspects of the hull form determination, the production possibilities and costs should be named. It should be considered to have simple shapes along the hull, which can be produced easily. Naturally this aspect is closely related to the choice of material as well. It can easily be realized, that producing of certain shapes are more difficult to produce with steel and still problematic with aluminium, while they can easily be created by using FRP. Similarly, bondings with sharp edges are difficult to produce with composites. Regarding this issue, attention is to be paid during the hull form design, in order to avoid tight sections which might result in difficult zones to work on, later during the production process. Further, since preference for material is for FRP as it will be discussed later in more detail, round bilges and tunnel shaped recesses are not expected to generate any problems.

38
3.3.2.5 Summary of decisions taken for the hull form design and the resulting Lines Plan In order to make it clear why the following hull form is chosen, all the aspects that are considered in this chapter, are summarized below:
- As it is required to minimize the motions of the vessel at low speeds, especially in vertical direction, the waterplane area coefficient is maximized. Since it is also decided to make use of a wind turbine access system, minimizing the motions is also beneficial for this operation, as discussed earlier.
- Regarding the dynamic effects at forward speed vertical side walls are desired without much flare. - High deadrise angle especially in the forward end, in order to minimize the pressures and accelerations
during slamming. - High Deck and freeboard to prevent green water - Streamlined tunnels for propulsion system - Separation of the propellers as large as allowed by the positioning of the main engines - Avoid tight sections in order to ease the production
Since some of these requirements are conflicting with each other, such as high waterplane area and small deadrise angle on such a low draft, a balance had to be found between all the requirements. Furthermore, it can be seen that the bottom at the stem of the vessel is curved upwards. Although this is not preferable with regard to slamming, it is found to be required for docking purposes. It is also expected that this curvature will help reducing the spray water at high speeds. The resulting lines plan can be seen in figure 20.
Table 1- Main Particulars
Loa 30m
DWL 30m
Beam oa 5.87m
Draft 1.13m
Displacement 84.2t
Wetted Area 173m2
WPA 141m2
Cp 0.652
Cb 0.413
Cx 0.662
Cwp 0.803
LCB -1.25% DWL from midship
LCF -7.83% DWL from midship

39
Figure 20 – Lines Plan

40
3.3.3 General Arrangement As explained earlier, the general arrangement has also played a big role for developing the final design together with the hull lines and other aspects. The final general arrangement, which is in compliance with the hull lines will be summarized in this chapter. Some of the main considerations can be given as: determining the location of passenger area/wheel house in such a way that the experienced acceleration and motions remain low; setting the LCB is at the most favorable position with regard to the weight distribution, determining watertight compartments according to damage stability requirements and structural integrity. Considerations regarding the general arrangement are explained below in more detail, which are decisive for the entire design. The resulting general arrangement can be seen in the figure 21. Maindeck:
- The windturbine access system is situated on the maindeck, in the bow of the vessel. This will be used to transfer passengers to the wind turbines, as well as to the mother vessel in her dock. This position is chosen because the maximum bollard push and maximum maneuverability can be achieved in this longitudinal direction, which is of high importance for thrusting against the wind turbines. Further the impact loads on the bow fender can be distributed on the strong longitudinal members of the vessel.
- A hatch is implemented in the stairs of the wind turbine access system (WTAS), which can be used to reach the lower deck, where the mooring equipment will be stored. The main reason for this choice is that it is stated in the HSC CODE 2000 rules, a 250 mm coaming is desired around the hatchways. By integrating the hatch cover in the stairway, this coaming can be achieved without creating an obstacle in the foredeck, which is to be used frequently by the PAX and crew. Further, integrating the hatch in the stair will give extra shelter against the spray waters.
- Mooring bits are situated on frames 25 and 26 on both sides of the vessel. Although it is obvious that the placing is not the most appropriate location due to the lack of space around the mooring bits, the forward position was decisive to place them at these positions. Further it is believed that the spacing of 1 meter is sufficient to make use of them. In case it is decided otherwise, the bits can be moved further aft without making any other impact on other aspects. Also it has to be remembered that the bits are not to be used during daily operations.
- Another design challenge is the location of the windlass, which is situated below the gangway of the WTAS. For the use of the anchor this is not a problem since the remote control can be used without any problems. It would be difficult though, if it is desired to be used as a capstan for mooring purposes. Again, it should be reminded, that daily operations do not include mooring or the use of anchor.
- A windlass with a continuous capacity of around 3.6t would be appropriate for the anchor gear. o The equipment number for the vessel is calculated as 112 according to DNV HSLC rules. o For this equipment number, an anchor of 202 kg with super high holding power is required. o And stud-link chain (NV K2) with a diameter of 17.5mm and a length of 150m. o The total weight of the anchor gear is calculated as 3.6 t. o A chain stopper is situated in front of the windlass. o Relevant calculations for the determination of the equipment number can be found in the
appendix 1. - A chain locker is situated below the windlass with a volume of around 0.6 m3. Relevant calculations can be
found in the appendix 1. - The 10ft container is located between frames 19-23. Attention has been paid to give enough spacing
around the container in order to avoid any potential collision with the roof of the super structure during lifting operations. Forward position of the container makes it possible to lift equipment that is stored inside the container by using the crane, which is situated on the wind turbine.
- The weathertight door that leads to the changing room is placed in an angle, which will help reducing the spray water coming inside through the door. Further, it is aimed to create a direct routing between the working area and the changing room for any emergency cases, where the empty spacing in the middle of the changing room can be used a medical treatment area.
- For ordinary operations, the equipment cabinet is located on the port side and the changing benches and a rail for hanging the survival suits is located on the starboard side. This will allow the maintenance crew to take out the uncomfortable suit, in case a long sailing distance is expected.
- Two toilets are situated also in the changing room.

41
- The main trunk for ventilation and piping/exhaust is located next to the toilets, which extends into the upper deck to the ventilation room and lower deck into the engine room.
- Further the concentrated location of potable water sources reduces the piping distance, where the sink of the pantry and the toilets are situated just next to the piping trunk.
- By passing through the door on the starboard side, the main seating room can be reached. - 20 seats are located in this room, with a spacing of 600mm. The reason for the chosen seat spacing is to
allow the passengers to hold on the seat in front in case of unexpected accelerations, while keeping a comfortable distance.
- Further it is aimed to have as big windows as possible, in order to allow the passengers keep visual contact to the external environment. It is believed, that keeping visual contact with the horizon reduces the seasickness incidences. [16]
- As mentioned before, a small pantry is available on the port side of this room. This can be used by the crew as well as by the passengers.
- Some spacing is available for piping/exhaust is situated next to the stairs, which extends between the lower deck and the cabin top of the vessel.
- A casing is located on the port side of the vessel for the placing of the emergency generator with a capacity of 11kWe (a possible model is Caterpillar C1.5) and other relevant equipment. The location is above the design waterline and highly accessible even in emergency cases.
- Two stairs are located: one leading to upper deck, where the wheelhouse is located, and the other one is to the lower deck where the crew cabins are located. This creates also an easy routing between the crew cabins and the wheelhouse.
- Through a weathertight door, the aft deck can be reached. A capstan and mooring bits are located in this area. Further, a hatch with a coaming height of 250mm leads to the lower deck into the steering gear room.
- A stairway leads to the upperdeck from the aft maindeck. - The bulwark along the vessel has the minimum height of 1 meter, which rises to 1.3m in the fore deck.
Upperdeck: - Upperdeck can be reached through any stairway situated on the fore/aft deck or in the seating room.
These stairs also allow the crew to reach any of the mooring areas, the working area in the bow, crew cabins, emergency generator casing and the machinery room on the lower deck easily.
- In the aft part of the upperdeck, an open space is located where the life rafts are situated. The high location keeps the area emerged even in damaged cases and the ease of access makes a quick embarkation possible. Each life raft has the capacity for 35 persons and is a throw-overboard model. In this way, it will still be possible to evacuate all crew and passengers by using only 1 life raft, in case the other one is not operable, e.g. due to heeling.
- The HVAC room is situated in the aft of the superstructure. The position is chosen to make the air intake and outlet easier. After distributing the air throughout the vessel, it can be outlet through the same position. Although the air inlet and outlet are situated on opposite sides of the vessel in order to prevent taking in used air.
- The wheelhouse is separated from the seats by an interior wall and sliding doors. The sliding doors in this area have to have good holding clamps in order to prevent unintentional sliding of the doors with rolling motions. This separation is necessary for night operations, where the wheelhouse can be kept dark while in the seating room the lights can be kept on. Except for these cases the doors can be kept open, since it is stated that visual contact with the crew and captain usually has a calming effect on the passengers during bad weather conditions.
- Further, the roof above the wheel house is extended for 300 mm, which will give some protection for the wheel house windows during the lifting operations of the container in the fore deck. This window is also leaned forward in order to minimize the reflections on the glass.
Lowerdeck: - The lower deck can be reached by using the stairs in the seating area on the maindeck. These stairs lead
directly to the crew cabin area. - 2 crew cabins are situated here, which are not to be used during normal operations. These cabins are only
to be used during extended emergency operations, e.g. during extreme weather conditions, where the

42
vessel cannot dock the SOV and has to sail towards a calmer location or to keep position until the weather eases. In these cases, it will be possible to work on shifts. The mid- aft location of the cabins will help reducing the accelerations and motions in these area. Further, the separation from the engine room will help rising the comfort level.
- The hull is divided in 7 watertight compartments, which are dimensioned according to the damage cases. These considerations will be handled in more detail in a further chapter.
- Since all the compartments except the cabins are not to be manned during normal operations, it is avoided to make use of watertight doors, which are quite costly. Instead, watertight hatches have been used to make passage through the watertight bulkheads, if needed.
- The rudder gear room is located in the most aft zone. The hatchway in this room can be used as an escape route to the maindeck. A second escape route is through the bulkhead to the cabin area and through the stairs to the maindeck. The steering gear is to be supplied by the propulsion system manufacturer.
- There is a void area present between the cabins and the engine room. It is possible to be accessed through two hatches on both sides.
- The engine room can be accessed through the hatch in the changing room. o Here are 2 x MTU 10V 2000 M94 main engines situated. o Main engines are connected to the shafts through a horizontal offset gear box. An appropriate
gearbox has been found from Reintjes, which has been used for dimensioning in the drawing. Any other gearbox, with the appropriate speed ratio and power capacity, from different manufacturers would also be suitable. The choice has been made for a horizontal offset in order to maximize the separation between two propellers for maneuverability, while keeping a reasonable spacing (min 800mm) around the main engines for maintenance issues.
o 2 shaft generators have been situated on both gearboxes with a capacity of 42 kWe (a possible model is UCM22).
o Startup batteries are to be placed in close vicinity of the main engines. o The switchboard and other electric/machinery equipment is also to be placed in the main engine
room. o The exhaust and ventilation is to be connected in the trunks to reach the exhaust pipe and vent
room. - In the compartment between frames 18 and 22, a gyro stabilizer is located, in order to minimize the roll
motion of the vessel. “Seakeeper 26” from the manufacturer “SEAKEEPER” is an appropriate model for this purpose. It is also seen in the reference vessels of the product, that similar wind turbine service vessels have made use of this product successfully.
- In the zone between frames 22 and 27, the mooring equipment can be stored. - Further in this compartment the bow thruster is placed. “Sidepower SH-1000” is found to be sufficient as
a hydraulic bow thruster with a capacity of 1000kg thrust. - The bulkhead at frame 27 is the collision bulkhead as dimensioned from the bow according to the DNV
HSLC Rules. - A small recess has been made in this zone for placing the chain locker. This area is modeled as a non-
buoyant volume for the stability calculations. The deck height for all the manned compartments along the whole vessel has been chosen at 2.3 m, which is to be reduced with a false ceiling down to approx. 2.1 m. The volume in-between can be used for deck stiffening and piping/vent. The ceiling height above the lower fore and aft deck are less down to 2.1 m due to the raised tank top height. The tank top height has been chosen in order to satisfy the damage stability cases by making use of strategic separation of watertight zones. The doors, stairs and gangways that are to be used for escape routes along the whole vessel are chosen to have a width greater than 900mm. The sill height of the doors is also chosen according to the HSC CODE 2000 with 100 mm to weathertight spaces above the datum. Exhaust is to be placed on the roof of the superstructure. This will prevent the exhaust gasses to be taken in through the air inlet of the ventilation. Navigation equipment is also placed on the roof for a clean surrounding and short distance of cabling to the wheel house. A spot light is placed on the top of the wheel house as well, which can be used for night operations, if needed. Relevant pumps are placed below the tanktop and in the main engine room in the close vicinity of the relevant tanks. The tanks are placed also below the tank top deck.

43

44
Figure 21 – GA Plan

45
3.4 Wind Turbine Access System As it has been stated earlier, the decision is taken along the process to make use of a wind turbine access system to be used for transferring passengers to the wind turbines. When the existing products are analyzed, a few problems have been recognized: The first one is that all the existing equipment that has been found on the market, is controlled by active control systems. This is not a desired feature in order to decrease the complexity, increase the robustness of the system and reduce the power demand during the operations. Secondly, most of the systems require aiming the gangway manually to the right position on the boat landing. It is believed that by making use of a strategic design the process of setting up the gangway and transferring the crew can be accomplished in a shorter time interval and in an easier manner. As last, the operability of the gangway is highly related to the motions of the vessel. As it has been visualized in figure 22, one of the main limiting criteria is the vertical motion of the contact point at the bow of the vessel. It was mentioned earlier, that the bow of the vessel is not to be fixed by the friction forces, as it is the case in conventional methods. This implies that the gangway should keep a vertical clearance from the contact point of the bow in order to avoid any collisions between the gangway and the bow of the vessel. Considering the high sea states up to 2 meter significant wave height, the bow of the vessel is expected to move up to an amplitude of approx. 2 meter following the contour of the waves during long wave periods, hence a clearance of 2 meter is desired between the bow of the vessel and the contact point of the gangway.
Figure 22 –WTAS

46
Because of the reasons listed above, it has been decided to make a proposal for a new type of wind turbine access system, instead of choosing an existing product. It is not aimed to make a detailed structural design of the installation, but to prove that such a system is to improve the performance of the concept. The proposed concept for the WTAS to be used on the CTV can be summarized as:
- The access system consists of 6 main parts. It is tried to make use of standard off-the-shelf -parts during the design of the whole system, as it will be explained below. This is important to reduce the costs of the system and to ease the maintenance work.
- During the regular operations, the gangway does not make use of any active control system. In total only one active control system is installed in the current version of the concept for safety reasons in order to be used in emergency cases.
- The extension of the gangway has the capacity to cope with the vertical motions of the bow up to amplitude of 2 m.
- Due to the geometry of the system, when the vessel is in the ‘thrusting against the wind turbine’ position the gangway is also in position to be lifted immediately to the right height. So, the concept does not require any separate aiming for the gangway.
Each part of the installation and the working procedure of the whole concept will be explained below. It is to be reminded, that the drawings are only to visualize the concept and are not precise detailed drawings. Foundation: The equipment is installed on the vessel on a raised foundation, which is shown in the figure below. When making the structural design of the vessel, attention should be paid to align the foundation and the deck stiffening, in order to achieve a continuous structure as a whole. Further, extra stiffening is necessary on the foredeck in order to cope with the weight of the foundation and the container.
Figure 23 – Foundation

47
The foundation is raised by 1.3m above the deck for the base of the slew bearing and 2.3m for the platform at the gangway entrance. The reason for raising the gangway higher on the deck is to lower the steepness angle of the gangway. This is necessary, because it is desired to place the gangway high on the wind turbine end in order to allow the bow of the vessel to move in vertical directions with an amplitude of 2 meter. On the lower platform of the foundation, the lower part of a standard off-the-shelf slew bearing is stationed. The slew bearing will allow rotating the gangway connection in order to compensate for the roll and yaw motions, although yaw motions are expected to be relatively small. By installing a motor on the slew bearing, which can be placed in the casing below the slew bearing, the rotation angle can also be adjusted manually or locked to prevent any rotation. The entrance to the gangway is to be reached by stairs. The hatchway to lower deck is also integrated in this stairway. The volume within the foundation plating is to be used for the placing of motor of the slew bearing. Upper part of the slew bearing: The gangway is to be connected to the foundation via the slew bearing. The upper part of the slew bearing is extruded for 700 mm so that the gangway entrance is on the same height with the gangway. This height difference also allows placing the connection points for the hydraulic cylinders on the upper part of the slew bearing. This is necessary in order to cancel out the effect of rotation of the slew bearing. In this way it is provided that the cylinders rotate together with the gangway, which keeps the relative rotation of the gangway to the hydraulic cylinders at zero for all times. The only cylinder, which has the possibility to be controlled by an active control system, is the cylinder as shown in the figure below, which controls the roll motion of the gangway. It is required to keep control of the system in emergency cases as it will be explained later. Another proposal to control the roll motions of the gangway is to make use of the gravity by using a pendulum, which can be further investigated.
Figure 24 – Slew bearing WTAS
The slew bearing is required in order to compansate the offset, which results due to the radius of the roll motion at the height of the gangway entrance. By rotating the slew bearing the gangway entrance always faces towards the wind turbine, making it possible to keep connection between two foundations at all times.

48
Figure 25 – Roll offset
Tilting platform: The platform is connected to the rotating slew bearing by a hinge joint. The tilting platform compansates for the roll motions of the vessel, keeping the gangway horizontal at all times. The roll angle of the tilting platform is to be controlled by the active control system during emergency cases. During normal operations, the gangway is kept horizontal by the moment generated through the clamps of the access platform, which are fixed to the boat landing pillars. Further the tilting platform is connected by another hydraulic cylinder to the outer bridge of the gangway. This is to control the pitch angle of the gangway, which also can be set fre moving by simply opening the valves, as it will be explained later.
Figure 26 – Tilting Platform WTAS

49
Outer bridge: The outer bridge is to be connected by a simple hinge joint to the tilting platform. This joint compensates for the pitch and heave motions of the vessel. Further a strong railing is necessary for safety and structural issues. The bridge has also a tubular offset, which is to increase the strength of the bridge and will be used for hydraulic cylinder placing. This hydraulic is to be used for controlling the extension of the bridge.
Figure 27 – Outer bridge WTAS

50
Inner bridge: The inner bridge has a sliding connection to the outer bridge. The inner bridge should be fitted on the rail system inside the outer bridge. This allows to extend and shorten the length of the gangway in order to cope with the variations of distance between the fixed access platform on the wind tubine side and the gangway entrance on the vessel side.
Figure 28 – Foundation WTAS

51
Upper slew bearing and access platform: A slew bearing is connected to the inner bridge by making use of a hinge connection. The access platform is fixed to the upper part of the slew bearing. This connection allows the gangway to move with the vessel in all pitch, heave and roll motions, while the access platform is stationary and fixed at the wind turbine. By making use of a counterweight, the access platform is always kept horizontal, when it is not clamped to the wind turbine. This is a system that is used in different access systems on the market as well. The access platform is equipped with fenders and two clamps on both sides. This is where the access platform clamps on the wind turbine and fixes itself, making a safe ground for the technicians.
Figure 29 – Acces platform WTAS

52
Bow fender: For contacting and thrusting against the wind turbine, in order to keep the vessel in position while transferring passengers, the vessel will make us of the bow fender. The width of the bow fender is selected to be as large as possible in order make aiming the vessel easier to the wind turbine. Further, it is tried to create a practical geometry, which will constrain sideways motions as well, by using a concave shape, which will “hug” around both pillars. The fender thickness is highly related to the approach speed, vessel weight and design loads of the pillars. It is calculated, that a fender thickness around 30 cm with a stiffness of 470880 N/m should be sufficient to keep the impact forces on the pillars below the desired level of 20t for an approach speed of 2 kts. Relevant calculations can be found in the appendix 1.
Figure 30 – Bow fender WTAS
Working Procedure of the concept: When the vessel approaches the wind turbine with an approach speed of around 2 kts, the procedure is identical to all other concepts that are currently being used on the market. The fender at the bow of the vessel is to be aimed at the boat landing pillars of the wind turbine foundation. As the bow fender contacts the pillars of the wind turbine boat landing, the thrust is to be increased in order to maintain the contact with the wind turbine. Attention has to be paid at this stage, that the load on the pillars does not exceed 20t, which is the design load of the pillars as explained earlier. The load can be surveyed easily by using load pressure sensors on the fenders, which is a widely used method on the market.

53
Figure 31 – Approaching wind turbine
Since the gangway in its resting position is placed on the top of the bow fender, the gangway is already in position when the bow fender contacts the boat landing of the wind turbine. By simply sliding the clamps of the access platform inwards and keeping other hydraulic cylinders in free moving mode, the access platform is constrained to be kept horizontal at the boat landing, independently from the motions of the vessel. By manually controlling the pitch hydraulics, the access platform can be raised to a safe height above the bow fender and once this height is reached, the pressure on the clamps is to be increased in order to fix the access platform in that position. As soon as the access platform is fixed, all other hydraulics are to be set in free moving mode, by simply opening the valves for fluids to flow freely, which will allow the platform to be kept stationary independently from the vessel motions. From this moment on, the gangway can be used for passenger transferring. When the transfer operations are accomplished, the clamps are to be eased to a certain level which will allow the access platform to slide along the pillars, while still having enough pressure to keep its horizontal orientation. Using the pitching hydraulic, the platform should be lowered to contact the top of the bow fender. Afterwards, by releasing the clamps, the vessel can sail away off the wind turbine. For safety reasons, some of the failing modes should also be considered, before continuing with such a concept design, in order to make sure that the installation can cope with the main fail scenarios. As one of the most severe failing mode, it is plausible that the vessel loses contact with the wind turbine, e.g. by loss of thrust or encountering a peak wave. In such a case, the clamps that are used to fix the gangway on the boat landing, should slide off the wind turbine as the active control system for roll motions at the tilting platform has to kick in, which will keep the platform stable on horizontal plane. Simultaneously, other valves for lower slew bearing, the pitching hydraulic, extension hydraulic and higher slew bearing, which were kept open in order let the gangway move freely

54
during regular operation, should be closed. This step will fix the gangway in position, regarding its pitching and yawing motions. As summarized: the active control system keeps the gangway horizontal, other locked hydraulics will keep the gangway static as the vessel drifts away off the wind turbine. This will give a stable ground and time for the technicians to come off to a safe ground. Afterwards, by using the hydraulic cylinders manually, the gangway can be lowered down to its resting position.
3.5 E-Load Estimation The electric load requirement of the vessel has been decisive for the selection of the generator sets. Since there is too little information about the systems that are to be used onboard, similar designs by KNUD E. HANSEN A/S have been used as reference to make the power estimation. By comparing the required size of the equipment according to the size and type of both vessels, required power values have been altered from the reference vessel to the current design. At this stage, the experience of the company has been decisive for estimating the new values. The entire electric equipment is divided in 5 classes: machinery equipment, pumps & fans, accommodation & HVAC, Lighting & IT and other various equipment. Machinery equipment consists of units such as fuel filter separator, chiller unit, central hydraulic power unit, air compressor etc. As an extra, the power that is required by the central hydraulic unit is increased due to the demand by the WTAS. Pumps and fans include bilge pumps, fire/ballast pumps, cooling pumps, diesel transfer pumps, sewage vacuum pumps etc. The amount of the load required by the components is varied by comparing the size of the units to the reference vessel. For example the amount of toilets and sewage tanks on board on both vessels for sewage pumps or the size of the engines for the machinery pumps have been compared between both vessels, which was decisive to estimate the power demand for each component. As it has been stated above, experience of the company was decisive for estimating these new values. Accommodation and HVAC include the coils and fans for ventilation of the accommodation area and wheelhouse, as well as exhaust fans. Similarly, experience of the company has been decisive to estimate the end values. The lighting and IT include lighting for the accommodation, deck, emergency lighting, TV in seating room and general purpose outlets. Again the power demand of each component is estimated according to the company standards. As last, various equipment class includes deck machinery such as the windlass, the capstan and navigation equipment. As an extra the gyroscopic stabilizer is included in this class, with the power demand as given by the supplier. After having set how much power each equipment theoretically would require, the actual power demand is estimated by accounting for the efficiency of the electric motors involved in the components such as pumps, fans, chargers etc. The efficiency of such components are set around 0.9. On the other hand, the efficiency for direct users is set as 1, such as for GPOs and lights. Further a load factor is introduced for the components, which are not always loaded to the maximum power demand. This is set between 0.8 and 1. By using these two factors the actual load is estimated as:
P actual = Power demand equipment * load factor / efficiency of the electric motor Having set the actual power demand, operational conditions are set as: at sea max load, at sea cruise load, crew transferring operations, docked in the SOV and emergency.

55
For each operational condition, it is estimated how many of each component is in service and as last, a simultaneity factor is introduced. The simultaneity factor accounts for discontinuous power demand by the components. For example the rudder gear, bilge pumps etc. The end power demand in each case then calculated as:
P = P actual * simultaneity factor * number of components in service. Relevant factors and efficiency values are used as company standards. The detailed calculations can be seen in the appendix 2. After accounting for a 5% margin on the total power demand for each operational condition, it is obtained that the total power demand in different operational conditions is as follows:
Table 2 - Total power demand
According to the estimated power demand, it is decided to make use of 2 shaft generators with a capacity of 42kWe as main source of electrical power. Mentioned alternator is possibly UCM22, which is to be mounted on the gearbox power take-off shaft. The advantage of this decision is that there is no extra engine for running the alternators. This should result as a fuel saving decision. Further some level of redundancy is introduced by making use of 2 shaft generators, where each one of them has the capacity to provide enough power for cruising conditions. For crew transferring operations both alternators should be utilized, in order to cope with the high power demand which is a result of the demanding active hydraulic control system that has to be accounted for, during emergency cases as explained in the last chapter. For normal operations, the power demand is expected to be lower. A disadvantage of this set up is that when the main engines are not running, there is no electrical power supply available. But, since the vessel is to be docked whenever it is not sailing, there is also no requirement for a self-sufficient power supply in normal conditions. As the emergency generator a caterpillar C1.5 has been chosen with a capacity of 11kWe. A summary of the alternator installations can be found below:
Table 3 - E-load distribution
At sea At sea Crew Trans. Dock SOV Emergency
Max. Cruise
11 8 58 13.2 1.0
3.2 2.4 3.2 1.5 2.9
1.4 1.4 1.4 1.3 0.0
2.6 2.6 1.4 3.8 0.2
5.4 5.4 5.4 3.2 2.4
23 20 69 22.9 6.5
24 21 73 24 7
Load (kWe)
Systems
1. Machinery Equipment
2. Pumps & Fans
3. Accommodation HVAC
4. Lighting, AV & IT
5. Various Equipment
Total power demand :
Total power demand + 5%
Set Capacity Proposed Model
Shaft Gen (SG1) 42 kWe UCM22
Shaft Gen (SG2) 42 kWe UCM22
Emer. Diesel Gen (EDG) 11 kWe Caterpillar C1.5
Condition Alternator Employed Load
At sea - Max. 24 kWe SG1 58%
At sea - Cruise 21 kWe SG1 49%
Crew Trans. 73 kWe SG1+SG2 87%
Dock SOV 24 kWe SG1 57%
Emergency - Fire fighting 2 kWe EDG 18%
Emergency generator load 7 kWe EDG 66%
Required

56
3.6 Weight Estimation The weight estimate has been separated in two parts; light weight estimation and deadweight estimation. The lightweight estimation of the vessel is based on similar types of vessels that are designed by KNUD E. HANSEN A/S. The procedure will be explained in the following chapter. Deadweight estimation on the other hand is based on the calculations for the required fuel capacity, fresh water capacity, and other provisions. Naturally this estimation is highly related to the resistance of the vessel and power consumption of the propulsion system. These will be handled later in another chapter.
3.6.1 Light weight In order to explain the procedure for the light weight estimation, considerations for the choice of material should be clarified in the first place. The material choice has been done according to the requirements of the design and information collected from various sources [9], [22], [23]. More detail is given below.
3.6.1.1 Material Choice As it can be remembered, the requirements for the chosen material were listed as:
- Light weight, in order to reach high speeds and to be able to be lifted by another vessel. Light weight is also important to keep the impact forces low during regular collisions with the wind turbines.
- Low maintenance costs, in order to lower the operational costs. - Ease of production, in order to lower the capital costs. - High strength, in order to withstand the design pressures with regard to hydromechanics, collisions etc. - High elasticity, in order to absorb the regular impact forces from other vessel and wind turbines.
Conventional steel, due to its high weight relative to aluminium and composite materials is neglected in this comparison. Furthermore considering aluminium, the following advantages are to be stated as:
- High toughness and ductility, due to the low elasticity modulus make this material, very well suited for absorbing impact forces.
- It is lightweight compared to steel and almost similar weight with FRP construction. - It is easier to be formed than steel. More complex shapes can be produced. - Due to the high number of vessels built, the vessel can be designed with rule of thumb principal up to a
certain level of detail.
On the other hand, the following aspects can be considered as disadvantages of this material: - For small vessels, relatively thick plates are required to be used in order to avoid deflection, which
prevents exploiting the real strength of the material. - Due to same reasons, a relatively small frame spacing is required, which lengthens the welding length and
increases costs. - The welding procedure is complex and requires high attention and expertise. - The material will easily deform plastically. - Fatigue is a potential problem. - Needs good maintenance to avoid corrosion problems. - Low melting point in case of a fire.
As another option fiber reinforced plastics (FRP) are considered. Some advantages are listed as:
- The material can be engineered according to the requirements for specific parts of the vessel. - Practically, it is possible to create any shape by using molds during the production. This is of importance
especially in the tunnel area and at the rounded bilges. - The thickness of the material can be optimised against buckling and deflection problems by using thicker
core material without affecting the weight and cost very much. - Good properties can be achieved to absorb impact forces. - The material does not corrode and requires low maintenance. - The material is one of the cheapest options. [9] Of course the specific cost depends on many variables
such as laminate lay-up and resin type etc.

57
Some disadvantages on the other hand can be listed as:
- Although the fire resistance of FRP is good, the dense black smoke generally creates a big panic on passenger ships. Despite the CTV is classified as a passenger vessel, the passengers will be trained technicians, which will help to keep the panic level low and will provide that all the regulations regarding firefighting and control will be followed.
- Another problem of FRP is that it has no margins for plastic deformation. But because the material can be engineered with high safety factors according to the requirements, enough strength and margin for elastic deformation can be provided for a rough manner of usage, which involves collisions. FRP is also relatively easy to repair.
- Some kind of mechanical connections need to be used for areas where through-the-thickness loads have to be transmitted.
- One of the biggest problems of composite materials can be named as blistering and stress-corrosion which are believed to be related to each other. [9] This can be avoided by good quality production, maintenance and choice for type of resin.
Considering all the aspects mentioned above, it has been decided to make use of fiber reinforced plastics consisting of mainly glass fibers with a sandwich construction. Other sorts of fibers can also be used at particular locations, if it is proven that higher strength levels are required for operational reasons. As an example, aramid or Kevlar fibers can be used in particular areas which require higher strength and ability to absorb impact forces, such as at the bottom and on the sides of the vessel. As a result, providing the same strength levels, it is avoided to carry unnecessary material in the thickness as it is the case for small vessels with metallic materials. This is one of the main reasons for choosing this material. Other reasons for the choice of FRP are mainly the possibilities for production in many shapes without difficulties, including double curvature and the low costs for maintenance, due to its non-corrosivity.
3.6.1.2 Structure & Weight factors Since the weight estimation for composite structures depend on the choice of the laminate lay-up that are to be used in the design, there is not enough information available at this stage of the design to make a specific weight estimation. This is why a similar vessel that was designed by KNUD E. HANSEN A/S has been used to determine the weight factors per square meter plating. The relevant vessel is a patrol vessel with a length of 29 m. The vessel is built according to DNV standards, using glass reinforced sandwich construction, which are the reasons why it is believed that this vessel is a good reference for the weight estimation of the current design. Although the lay-up of the laminates vary according to the location in order to cope with the varying design pressures and the required minimum thickness of the plates, standard lay-ups can be summarized as: a mix of chopped strand mats with a density of 450 g/m2; 225g/m2 and quadraxial E-glass layers with 1200 g/m2; 850g/m2 with a core of 150 kg/m3 for the shell plating. The thickness of the core and the number of layers on the outer/inner skin vary according to the location, where they are used at. When considering the deck laminates and tank top laminates, it is to be seen that also biaxial 800g/m2 and unidirectional 900g/m2 layers are used with a smaller core thickness and density around 80-100 kg/m3. Since there is very little information available at this stage about the structure of the current design and a lot more changes are to be expected in the future iterations of the design, it is not quite efficient to account for layer by layer information of each laminate. Instead, it is decided to make a general estimation for main components as weight per unit area (t/m2), which can be later scaled for other components in different locations. For an example, when the weight of the deck plating is estimated at mid ship, it can be scaled to estimate the weight of the deck plating in the aft of the vessel. As it can be expected, the deck plating would have an increased thickness in the engine room etc. The experience of the company was decisive in determining the weight factors. The weight factors of components include the weight of the relevant stiffening per square meter, as shown in the figure below.

58
Figure 32 – Weight factor calculation of a component as t/m2
Estimate of the weight of a one square meter panel consists of components such as weight of sandwich plate, weight of stiffener and margins for resin, capping and bonding. Where the weight of the panel is calculated considering the thickness of the core and the weight of the stiffener is calculated considering the height of the stiffener. The components are divided as follows: Hull shell: Hull shell weight factor represents weight in ton per square meter of hull skin accounting for the transverse web frame stiffening along the hull. The web frame spacing is taken around 1 m along the hull, in order to have a reasonable panel area. The weight factor for the forward part of the vessel is increased slightly, in order to account for higher design pressures and the collision bow-laminate as the requirements of DNV. Tank top: The tank top component has been divided in 3 parts. The aft section; the middle section, where higher loads are expected due to the presence of the engine room on the tank top and due to the pressure concentrations caused by the longitudinal bending when being lifted at the SOV; and the forward section, where high loads are expected due to slamming. Tank top weight factor represents weight in ton per square meter of lower deck accounting for the longitudinal girders along the bottom of the vessel. Main deck: Main deck component represents ton per square meter of main deck accounting for the longitudinal stiffening below the main deck. Upper deck: Similarly to main deck, upper deck accounts for the longitudinal stiffening as it represents weight per square meter of upper deck. Bulwark: This component accounts for the weight of the bulwark per square meter. Superstructure walls: This component accounts for the weight per square meter of exterior walls of the super structure. Inner walls: This component accounts for the weight per square meter of interior walls. Bulkheads: This component accounts for the weight per square meter of bulkhead, including some reinforcement around the watertight hatchways.

59
Figure 33 – Division of components
3.6.1.3 Estimation The total light weight estimation has been divided in 8 groups. Structural weight estimation (Group 2) is one of them. This is done by multiplying the total area of each component with the weight factor as determined in the earlier chapter. Since the estimation is preliminary, a margin of 10% is added on the resulting weight of this group. Further as it will be seen at the end of this chapter, the results show that the weight of the structure is within the expected range as 25%-35% of the total weight of the vessel. [9] Other groups are as follows: Group 1: Cargo Handling and Access: The wind turbine access system has been accounted for in this part. The weight has been used as it is obtained from the 3D model by using aluminium material. Group 3: Outfit and Equipment: Deck equipment such as capstan, windlass, mooring bits anchor, chain etc. are accounted for in this group. Weight of each equipment is taken from the manufacturer according to the proposed model.
- Capstan is chosen as Maxwell 4000 and windlass is chosen as Maxwell 8000 according to the weight of the anchor and mooring line strength, determined by the equipment number of the vessel. Any other equivalent model would also be appropriate.
- Anchor, chain and mooring line weight are also determined according to the equipment number. - Window, paint antifoul and fairing weight are calculated by company standards, using the total area of
windows, est. total vessel surface area, est. total area of the hull and est. total surface of the underwater hull respectively.
- The liferafts are chosen as VIKING throw-overboard type with a capacity for 35 persons. Any other equivalent model would also be appropriate.
Group 4: Accommodation: Company standards as weight per volume (t/m3) accommodation have been used for this group.

60
Group 5: Hull Engineering: As there is too little information to make a specific estimation for this part, again company standards are used in this group.
- Weight for the bilge systems is calculated by using a weight factor per volume of the hull. - Weight for ballast systems is calculated by using a weight factor per volume of the estimated ballast water
volume. - Weight of piping is calculated according to the volume of the hull. - Weight of the drain piping is calculated according to the deck area. - Weight of the potable fresh water system is calculated according to the number of potable water points.
(sinks) - Weight of the sanitary waste system is calculated according to the waste points. - Fire deck wash system and vent system excl. engine room vent are calculated according to the total ship
volume. - The weight for chillers and air conditioning units are estimated according to the systems on similar vessels.
Group 6: Machinery Equipment: Where it was possible to make an estimate for the choice of the equipment to be used onboard, the weight of the equipment is taken as it is given by the manufacturer. Weight of the rest of the equipment is estimated according to reference vessel. Group 7: Machinery systems: Weight for the fuel oil system, sea water cooling system, fresh water cooling system, engine room ventilation system and exhaust system are calculated according to the amount of total installed power. Weight of the hydraulic system is calculated according to the total items powered by the hydraulic system. Weight of the engine room CO2 system is calculated according to the engine room volume and the weight of the engine room fire protection system is calculated according to the amount of total items protected by the system. Group 8: Electrical System: The weight of the equipment such as main switch board, startup batteries, navigation equipment, antennas etc. are estimated per piece. Weight for the cabling and lighting are determined according to the total ship volume. The calculations and details can be seen in the appendix 3. A 5% margin is accounted for the groups 3, 4, 5, 6, 7 and 8. Only the end result is given below:
Table 4 – Lightweight and COG
Notes Group weight Margin Weight
incl. LCG TCG VCG
margin SB (-) PS (+)
t of 1000 kg % t of 1000 kg X (m) Y (m) Z (m)
WTAS 3.0 3.0 28.5 0.0 4.8
E-Glass RP 23.1 10 25.4 13.9 0.0 2.7
6.3 5 6.6 15.2 0.0 2.3
9.1 5 9.6 11.8 0.0 3.8
3.3 5 3.4 13.3 0.0 3.5
10.9 5 11.5 11.9 0.1 1.3
5.4 5 5.7 15.2 0.0 1.4
1.5 5 1.6 15.0 0.0 4.5
66.8 14.1 0.0 2.6
Group 1000 - Cargo Handling and Access
Group 3000 - Outfit and Equipment
Group 4000 - Accommodation
Group 5000 - Hull Engineering
Group 8000 - Electrical Systems & Autom.
Total light weight
Center og gravity COGWeight groups
Group 6000 - Machinery Equipment
Group 7000 - Machinery Systems
Group 2000 - Hull Structure

61
3.6.2 Deadweight In order to make the deadweight estimation, several tank capacities are to be determined. As the biggest fraction of the total deadweight capacity, the fuel capacity is first to be determined. Naturally the required fuel capacity is directly related to the resistance and power estimation. The estimation of the resistance curve and required power is handled in a further chapter. In this chapter only the results are used to make the deadweight estimation.
3.6.2.1 Fuel capacity In order to estimate the required fuel capacity, the whole operation is divided in different stages as: sailing off or approaching the SOV, transit stage between wind turbines, maneuvering/docking at the wind turbines and emergency long range transit. Along the iterative process, it has been decided that MTU 10V 2000 M94 would be appropriate considering the power requirements, with a maximum installed power of 2 x 1193 k. The average fuel consumption is taken as 220g/kWh Due to the unknowns regarding the speed, weather and course of the operational profile of, certain assumptions had to be made:
- The average distance to be sailed is taken as 3 km between two wind turbines, - Although the transit speed in rough conditions is chosen as 15kts for calculations according to the
operational conditions, as explained earlier, the power requirement is taken as 90% instead of 70% in order to account for unknowns regarding the actual course and actual speed of the vessel. This will lead to a worst case scenario with high fuel consumption and increased sailing distance. Power requirements are set according to the resistance and powering estimates from chapter 3.9.
- A total duration of 8 mins is taken for approaching/sailing off the SOV and 7 mins for approaching or sailing off the wind turbines. The second also includes crew transferring operations. An average power consumption of 60% of total installed power has been taken for both operations, as approximated by the concept developer. Although to achieve the maximum bollard push full power is required, most of the time will be spent loitering near the wind turbines or near the SOV and maneuvering to correct the position of the vessel.
- For the emergency case reserve fuel capacity, capability for loitering a duration of 30 hrs is accounted for with a power consumption of 30% MCR. This also corresponds to a range of 25 hours sailing at 15kts, which is sufficient in the North Sea Area to reach the nearest shore from any location.
Since shaft generators are installed on the main engines, the chosen power requirements also include the electrical power requirements as it will be explained in chapter 3.9.
A total fuel capacity of 7.6 ton is estimated, where only 3 ton is only to be used on daily operations. The tank arrangement can be seen in the following chapters.
3.6.2.2 Other provisions Since the provisions will be supplied and unloaded on the SOV on a daily basis, the endurance of the vessel is not required to be very high. Although it is necessary to have the capacity to accommodate 24 PAX and 3 crew for approx. 1-2 days, accounting for emergency cases. Considering that only 5 liter is required for washing hands one time, a fresh water capacity is calculated as approx. 25 liter per person. Considering that there are no showers onboard and that there is no regular need to use fresh water during the short stay of each passenger onboard, the capacity of 0.68t should be sufficient for 27 persons over 1-1.5 days. Further in very extreme cases, for simple use also sea water can be used in case it is needed. Grey/Black water tank is calculated to have the same capacity as the fresh water tank.

62
Drink store capacity is calculated as approx. 9.5 liter per person. As it has been found that approx. 2-3 liter per person per day is recommended by health authorities, the total amount should be enough to last for around 3-4 days for 27 persons. The margins for drink water are taken larger than for fresh water due to the unknowns in the operational profile and importance of reserve drink water capacity for emergency cases. Lube oil, tech water and other hydraulic fluids for mechanic systems are also included in the deadweight estimation, although these are not considered as expendable provisions. Further, dirty oil and bilge waste tank and ballast water tanks should also be accounted for. The weight of technical fluids and capacity of the bilge waste tanks are set according to the recommendations from the company. Other deadweight components are passengers and crew with a weight of 100 kg for each person and a 10ft container on the main deck with a weight of 5 ton as desired by the concept developer. 5 ballast tanks are also present on the vessel, which are to be used for various load cases. Dead weight calculations fuel and water capacity can be seen in the appendix.
3.6.2.3 Tank Arrangement The tank arrangement has been achieved iteratively in order to guarantee a practical weight distribution. It has been provided that the vessel remains the minimum trim in different loading conditions. It is to be reminded that, the drink store and technical fluids are not to be stored in a built-in tank. The tank arrangement drawings can be seen below:
Figure 34 – Tank arrangement

63
3.6.3 Total Displacement and CoG Having determined the weight of all the components, the total displacement of the vessel can be summed up as:
Item Name Quantity Unit Mass
tonne Total Mass
tonne Unit Volume
m^3 Total Volume
m^3 Long. Arm m Trans. Arm m Vert. Arm m
Lightship 1 66,800 66,800 14,100 0,000 2,860
Fuel 1 100% 1,638 1,638 1,735 1,735 19,000 0,484 0,542
Fuel 2 100% 1,638 1,638 1,735 1,735 19,000 -0,484 0,542
Fuel 3 100% 1,138 1,138 1,206 1,206 18,985 1,446 0,671
Fuel 4 100% 1,138 1,138 1,206 1,206 18,985 -1,446 0,671
Fuel 5 100% 1,129 1,129 1,195 1,195 20,498 0,692 0,573
Fuel 6 100% 1,129 1,129 1,195 1,195 20,498 -0,692 0,573
Fresh Water 100% 0,680 0,680 0,680 0,680 22,499 0,341 0,588
Grey/Black Water 0% 0,680 0,000 0,680 0,000 22,021 0,000 0,001
BIlge Waste 5% 1,005 0,050 0,980 0,049 23,474 0,000 0,081
Ballast 1 0% 1,722 0,000 1,680 0,000 15,998 0,053 0,000
Ballast 2 0% 1,722 0,000 1,680 0,000 15,998 -0,053 0,000
Ballast 3 0% 1,289 0,000 1,257 0,000 16,989 1,000 0,188
Ballast 4 0% 1,289 0,000 1,257 0,000 16,989 -1,000 0,188
Ballast 5 0% 1,766 0,000 1,723 0,000 17,498 0,000 0,000
PAX 27 0,100 2,700 7,000 0,000 4,100
Container 100 0,050 5,000 20,000 0,000 4,100
Drink Store 100 0,003 0,250 8,000 0,000 1,500
Lube Oil 100 0,010 1,000 13,000 0,000 0,700
Total Loadcase 84,291 18,209 9,001 14,759 0,003 2,713
FS correction 0,001
VCG fluid 2,714
Table 5 – Total displacement in Departure Condition
3.7 Intact & Damage Stability
3.7.1 Rules and Regulations / Method of Calculation The stability of the vessel is to satisfy the requirements from HSLC Rules, which refers to the requirements of HSC CODE 2000, Chapter 2 and Annex 8 for monohulls. Number of passengers onboard makes it also necessary to satisfy passenger craft rules, which requires also deterministic damage stability calculations according to HSC CODE 2000. The damage stability analysis consists of hydrostatic calculations for each loading condition and damage cases. This procedure will be explained in the following chapters. In all stability calculations 10% margin on the VCG of lightweight has been included to account for the unknowns from the weight estimation. In order to proceed with the stability calculations, the loading conditions should be determined first. 6 loading conditions are defined for the intact stability analysis as follows:
- Departure conditions: Departure condition is defined as the full load condition. All the tanks are accounted to be full except grey water tank, bilge waste tanks and ballast water tanks. Bilge waste tank is accounted to be at 5% and the grey water completely empty. The weight list can be seen above on the table 5.
- 60% daily usage: This condition is defined as 40% spent of the provisions, setting the content of the daily
fuel and water tanks to 60% and 40% for the bilge waste and grey water. Number of the passengers and the loading of the container are also considered as in 60% remaining state.

64
- 60% daily usage full load: This condition is regarded as a worst case scenario for the previous case. This
can be the situation e.g. when returning to the SOV with full load on the deck, as 24 passengers and full container load, while the tanks are set as in the previous condition. In order to lower the center of gravity one of the ballast tanks has to be filled in this condition.
- 10% daily usage: This condition is similar to the 60% daily usage except the content is set to 10%
remaining and 90% full for the grey water and bilge waste tanks.
- 10% daily usage full load: This condition is comparable to 60% daily usage full load. A worst case scenario is achieved by setting the daily tank capacities to 10% and the deck loads (passengers, container) to 100%. 3 ballast tanks have to be filled in this condition.
- Emergency extended operation full: This condition is the overall worst case by having all the tanks,
including the reserve fuel tanks at 10% and the deck load at 100% content. This condition can be achieved at the end of an emergency cruise to the shore or holding position for a long duration approx. , where all the provisions are spent and having all the passengers and equipment onboard. All the ballast tanks have to be filled in this condition according to the stability calculations.
Loading conditions in tabular forms can be found in the appendix 4.
3.7.2 Intact Stability The intact stability analysis is made for each loading condition considering criteria from the HSC Code 2000, Annex 8. Results can be seen in the appendix 5. Below is given the GZ Curve in Departure Condition. It is found that the vessel satisfies all criteria in all loading conditions.
Figure 35 - Departure Condition Large Angle Stability Curve

65
3.7.3 Damage Stability & Damage Cases The damage cases are determined as defined by the HSC Code 2000, Chapter 2. For clarity of the defined damage cases, the compartment division, damage lengths and vulnerable area for raking damage can be seen below.
Figure 36 – Watertight Zones and Damage Lengths
According to the relevant requirements, the analysis is done for 2 main damage types:
- Raking damage: The vulnerable part of the vessel is given in the figure above. Longitudinal extent of a raking damage is set as 7.5m anywhere within the vulnerable part of the vessel and 16.5m from the most forward point of the vulnerable area. By using these lengths, every possible damage case can be determined. Attention should be paid to account for the tanks as well. If the raking damage is on the side shell of the vessel, the tanks at the center of the vessel should stay intact. On the other hand, if the raking damage is on the bottom of the hull, the tanks should also be damaged. All the raking damage cases are given as in the appendix 6. The damage cases are considered for each loading condition.
- Side damage: The extent of the side damage is set to 3.3m anywhere on the hull, with a full vertical
extent. Similarly to the raking damage, each possible damage case is determined for the side damage. These are analyzed for each loading condition. All side damage cases can be seen in the appendix 6.
Damaged compartments are accounted for as lost buoyancy volumes with the permeability as given in the rules:
Spaces Permeability
Occupied by accommodation 95%
Occupied by machinery 85%
Void Space 95%
Table 6 – Permeability
Because of the high number of combinations (6 loading conditions x 31 damage cases = 186 analysis cases), the results of the damage stability analysis are left out of this report. It can be stated that the vessel satisfies all criteria for each combination of damage case and loading condition. Considered criteria according to HSC Code 2000 can be listed as below.

66
Table 7 – HSC Code 2000 Damage Stability Criteria
3.8 Resistance Estimation
3.8.1 Choice of propulsion The varying requirements of the vessel, such as achieving high speeds, maneuverability at low speeds and high bollard push capacity make a controllable pitch type propeller (CPP) the most favorable option for the choice of propulsion system. Although water jets would provide good maneuverability and efficiency at high speeds, their performance on low speeds make them a less favorable option for this vessel, which is supposed to spend most of the operational time at low speeds. Further as it can be remembered, along the design process decision is taken to make use of shaft generators, which is made possible by the choice of the CP propellers. Otherwise it would not be practical to make use of shaft generators for such a varying operational envelope. As mentioned in the earlier stages, the choice is made finally for a concept developed by the Norwegian company SERVOGEAR. When the reference vessels are considered, it is possible to see that large numbers of wind farm crew transfer vessels make use of this concept as well. The main reason for the popularity of this concept is its advantages at high speeds and high bollard push capacity, together with good fuel efficiency maneuverability. Furthermore, one of the most distinctive features of the concept is its tunnel design, which guides the inflow to the propellers and allows a larger propeller diameter. According to the company’s statements by making use of the propeller tunnels, it is possible to maintain good hull-efficiency. As mentioned in an earlier chapter, the tunnel designs are normally finalized by the manufacturer, but since this project is on a quite early stage, the tunnel designs are approximately modelled in order to account for its hydrostatic effects during the stability and seakeeping calculations.
Code Criteria Value Units
HSC 2000 Annex 8
Monohull. Damage2.1.1 Range of positive stability 15 deg
HSC 2000 Annex 8
Monohull. Damage2.1.2 Area under GZ curve 0,859 m.deg
HSC 2000 Annex 8
Monohull. Damage2.1.3 Value of max. GZ 0,1 m
HSC 2000 Annex 8
Monohull. Damage
2.2 Value of max. GZ in
intermediate stages0,05 m
HSC 2000 Annex 8
Monohull. Damage
2.2 Range of positive stability in
intermediate stages7 deg
HSC2000 Ch2. All craft2.6.11.1 Min. freeboard at
damaged equilibrium0 m
HSC2000 Ch2. All craft2.6.11.3 Min. freeboard at
damaged equilibrium0 m
HSC2000 Ch2 Part B:
Passenger craft. Damaged
2.13.1.1 Maximium angle of
inclination10 deg
HSC2000 Ch2 Part B:
Passenger craft. Damaged2.13.1: Freeboard to DF points 0 m
HSC2000 Ch2 Part B:
Passenger craft. Damaged
2.13.1: Freeboard to Embarkation
points0 m

67
3.8.1.1 Servogear Propulsor The manufacturer has been contacted in order to gain more information about the concept and obtain more accurate values for further calculations. The manufacturer has provided an indicative propulsor design for the given dimensions and power requirements. The provided propeller had an optimum propeller diameter of 1.475 m. However, as practically it is desired to limit the propeller diameter to 1.1 m with regard to the available draft, which is determined according to the seakeeping and resistance considerations, an estimation had to be done at this stage using empirical methods in order to determine the reduction in efficiency of the smaller propeller compared to that proposed by Servogear. Considering a propeller clearance of 10% of the diameter of the propeller between the bottom of the hull and tip of the propeller blade, the bottom end of the propeller is to extend 0.19 m below the bottom line of the vessel. The height of the skeg can be adjusted in order to prevent any potential problems with regard to the safety of the propellers. Comparing the efficiency of both propellers makes it possible to evaluate the benefits and disadvantages of a smaller propeller. The estimate for the open water efficiency of the smaller propeller is based on the information obtained from Servogear. The procedure of this estimate and comparison is described in the following paragraph. Furthermore the chosen main engine properties by Servogear AS are in compliance with the initially chosen engines. 2 x 1029 kW at 2100 RPM is chosen by Servogear, where 2 x 1193 kW at 2450 RPM are chosen by the designer. [24] Higher RPM is also beneficial since a smaller diameter for the propeller is chosen. The similarity of the chosen enginesprovides some confidence with regard to the power estimation, for which the procedure will be explained in the next chapter.
Figure 37 - Servogear Propeller. Image taken from Servogear AS website
In order to determine the efficiency of the smaller propellers, the same propeller dimensions as the provided preliminary design from Servogear have been modelled using a software called NAVCAD. In order to demonstrate the validity of the series that is used to estimate the efficiency of the smaller propeller, the resulting predictions were compared with that from Servogear. The Gawn AEW series is used to make the propulsion calculations instead of B-Series, because the P/D margins are larger for Gawn AEW series (0.6 < P/D < 1.6). Calculated values for the open water efficiency are similar to the provided values from Servogear, with an estimated open water efficiency of 70%. These values give the confidence to make an estimate for a propeller with smaller diameter by using the same method. As a result an open water efficiency of 65% has been estimated for the propeller with a diameter of 1.1m. Hull efficiency is taken as 0.96 as suggested by Servogear and KNUD E. HANSEN A/S. Further efficiencies can be seen in the powering estimation in the next chapter.

68
Table 8 - Open Water Eff. Comparison
3.8.2 Resistance & Powering Estimation When the size, speed and type of the vessel are considered 2 resistance estimation methods come forward among others:
- Resistance of Transom-Stern Craft in the Pre-Planing Regime, by John A. Mercier from 1973 [17]: This prediction method is aimed for planning vessels with transom sterns in the non-planing speed range. This implies that, it is aimed for vessels, which are designed as planning hulls, but are not yet planning due to e.g. over-loading, pre-planing stage etc. Further it is aimed for volume Froude numbers less than 2. The statistically-based correlation equation takes slenderness ratio, beam loading, entrance angle, ratio of transom area to maximum section area and volume Froude number into account. It is mentioned in the paper, that the method is aimed for small high-speed craft, without skeg and large moderate speed ships are not considered.
- Revised Speed-Dependent Powering Predictions for High-Speed Transom Stern Hull Forms, by Siu C.Fung and Larry Leibman [18]: In contrast to Mercier’s and other’s methods, this method is more aimed for semi-planing, round-bilge, transom-stern, displacement hull forms, which are similar in size to the patrol vessels. It is mentioned in the paper, that earlier work from different authors such as Savitsky (1973), Jin (1980), have the limitation due to their database, which restricts the applicability of the methods to the vessels with a size similar to patrol vessels. Aiming bigger size vessels, the database of this study is increased in size.
Comparing both methods to the current design, it can be concluded that Fung’s method is more appropriate due to several reasons as: Mercier’s method is mainly aimed on vessels that are designed to plane but are in the non-planing zone due to operational reasons. This implies also that the database includes hard chine planning vessels. Although there are no explicit definitions of the small size vessels or patrol size vessels, it is understood that a vessel of 30 m length is to be considered more in the size range of a patrol vessel instead of a small planning vessel. Further, Fung’s method being aimed for round-bilge transom stern hulls that are designed as semi-displacement hulls, makes this method more favorable than other ones. When the parameters and limitations are considered, it can also be seen, that the current design is well within the limits of the regression.
Series ServogearComparison
Gawn AEW
Estimate
Gawn AEW
Diameter 1.475 m 1.475 m 1.1 m
Thrust p.p. 48.1 kN 40 kN 40 kN
Blade 4 4 4
RPM Prop 459 365 730
Ae/Ao 0.6 0.5 0.81
Shaft incl. 6 deg 7 deg 7 deg
Open
Water Eff.73.1% 70% 65%

69
Table 9 – Parameters for Resistance Estimation (Fung)
At, Bt, Tt represent the dimensions at the transom of the vessel and the angle of entrance (Ie) is calculated at 0.1 Bwl. Despite the ratio of transom of the beam to the max beam at waterline is slightly out of the range of the regression by 0.01, it is decided to use the regression for the resistance prediction. At this point it was decisive that all other parameters are within the margins of the regression and that the offset is very small. Further no other regression has been found which is more suitable than this one. Because of the reasons that are explained above, it is decided to proceed by using the Fung and Leibman’s regression, in order to make an estimate of the resistance curve of the vessel. It has to be remembered that the regression of course does not account for the propeller tunnels. Although the manufacturer claims that the tunnels lead to a resistance decrease, the actual effect of the tunnels has to remain unknown at this stage of the design. Propeller shafts, rudder, skeg and bow thruster are entered as dimensions and surface areas into the resistance prediction software, which are then translated into standard drag coefficients. These are considered as appendage resistance in the resistance calculation. To estimate the required power based on the calculated resistance, following efficiencies are taken into consideration:
- A total propulsive efficiency of 0.58 is estimated by considering an open water efficiency of 0.65, rel. rotative efficiency of 0.94 and hull efficiency of 0.96, which is rounded off to 0.55 for safety margins due to many unknowns of the system.
- A sea margin of 15% for calm seas and 30% for rough seas. - A shaft efficiency of 98% - Gear efficiency of 98% - The PTO for the shaft generator (incl. the efficiency of the shaft generator at 85%) - The main engine is considered to be operating at 90% MCR. - An extra margin is taken by reducing the corresponding speed by 0.25 kts per calculated resistance, due to
the uncertainty of the regression method applicability.
Lower limit Actual Upper Limit
Fn Lwl 0,15 0,75 0,90
Lwl/Vol^(1/3) 4,73 6,89 10,60
Lwl/Bwl 3,40 5,09 12,10
Cp (Lwl) 0,55 0,62 0,72
Ie @ 0,1 Bwl 3,70 24,00 26,00
LCB (Lwl) -6,00 -1,52 1,00
Cx 0,59 0,66 0,98
At/Ax 0,00 0,39 0,54
Bt/Bwl 0,00 0,96 0,95
Tt/T 0,00 0,39 0,59

70
By using above mentioned efficiencies, the total required power to reach the maximum achievable speed can be calculated, as well as the power required for 15kts in high sea states. Results can be seen as below and in the appendix 7:
Figure 38 – Power Estimation
Speed PD PD_SM PB_SM
kn kW kW kW
15,0 608 790 823
22,7 1717 1975 2056

71
Figure 39 – Efficiencies: from the resistance to the installed power
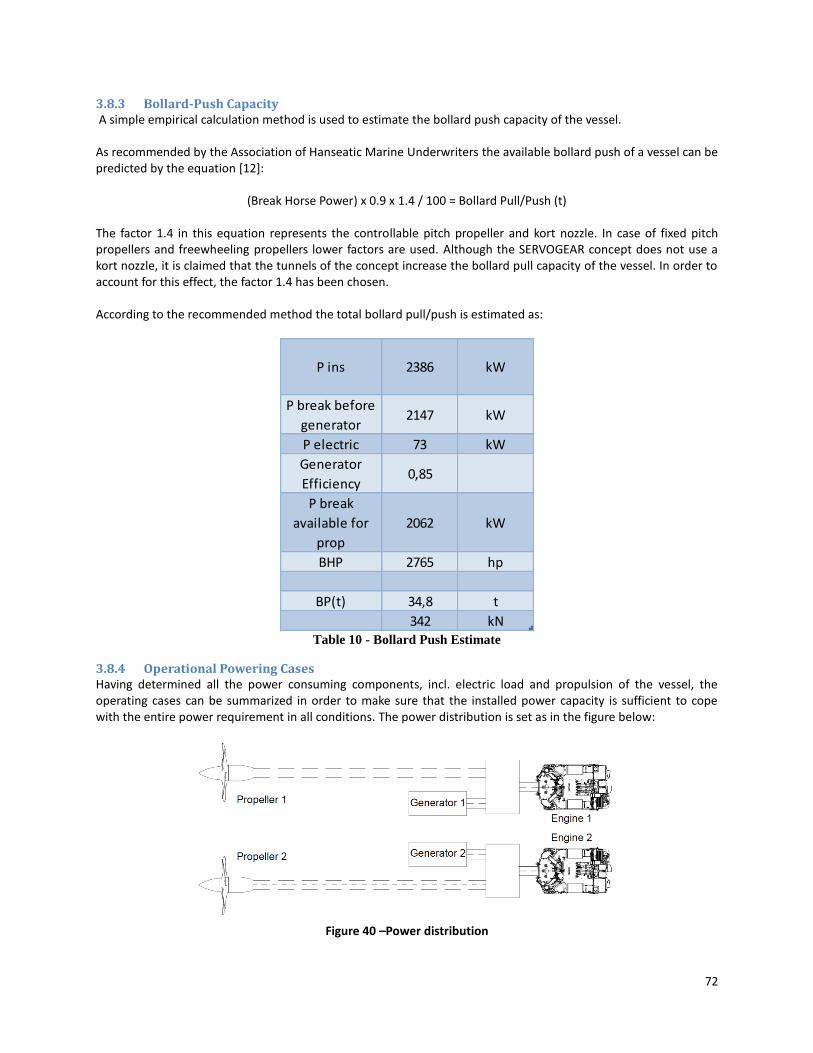
72
3.8.3 Bollard-Push Capacity A simple empirical calculation method is used to estimate the bollard push capacity of the vessel. As recommended by the Association of Hanseatic Marine Underwriters the available bollard push of a vessel can be predicted by the equation [12]:
(Break Horse Power) x 0.9 x 1.4 / 100 = Bollard Pull/Push (t) The factor 1.4 in this equation represents the controllable pitch propeller and kort nozzle. In case of fixed pitch propellers and freewheeling propellers lower factors are used. Although the SERVOGEAR concept does not use a kort nozzle, it is claimed that the tunnels of the concept increase the bollard pull capacity of the vessel. In order to account for this effect, the factor 1.4 has been chosen. According to the recommended method the total bollard pull/push is estimated as:
Table 10 - Bollard Push Estimate
3.8.4 Operational Powering Cases Having determined all the power consuming components, incl. electric load and propulsion of the vessel, the operating cases can be summarized in order to make sure that the installed power capacity is sufficient to cope with the entire power requirement in all conditions. The power distribution is set as in the figure below:
Figure 40 –Power distribution
P ins 2386 kW
P break before
generator2147 kW
P electric 73 kW
Generator
Efficiency0,85
P break
available for
prop
2062 kW
BHP 2765 hp
BP(t) 34,8 t
342 kN

73
Transit, max speed: To reach the maximum speed, the vessel makes use of both engines. Electric load is covered by one generator. Transit, reduced speed on high seas: For operations in high sea states, the transit speed is reduced in order to lower the wave induced accelerations of the vessel. In reality the speed will be adjusted irregularly according to the wave direction, wave period, wave height and most importantly according to the “feelings” of the captain. As the maximum speed allowed by DNV regulations, regarding design accelerations, 15 kts is taken as for the calculations. As it is mentioned earlier, by making use of the feathering position of propellers, it is possible to use only one propeller and engine at reduced speeds. This will lead to use the main engine at a more favorable rate than when 2 engines are used at reduced speeds. It would still be favorable to use both propellers and engines, if high maneuverability is desired. If more straight lines are to be sailed, usage of only 1 engine would be more sensible. Maneuvering and approaching wind turbine/SOV: As mentioned above, both engines and propellers will be used in order to achieve high maneuverability and maximum bollard push capacity.
Table 11 – Operational Cases
Speed Prop 1 Prop 2 Gen. 1 Gen. 2 Engine 1 Engine 2
V P D_SM P D_SM P Elec P Elec P USED P USED
Transit Max 22.7 kts 987kW 987kW 24 kW 0 kW 89% MCR 86% MCR
Transit
Reduced15.0 kts 790 kW 0 kW 21 kW 0 kW 71% MCR -
Max bollard
push
high
maneuvrability
and bollard
push
available
Bollard Push
171 kN
available
Bollard Push
171 kN
36.5 kW 36.5 kW 90% MCR 90%MCR

74
3.9 Docking Arrangement in the SOV Having considered all of the aspects of the crew transfer vessel, the docking arrangement on the SOV remains to be handled in order to guarantee the safety and operability of the whole concept. As mentioned earlier, the dock is situated in the aft of the SOV, where the vessel has a catamaran shaped body. The special shape of the dock is expected to provide a simplification for the operations. For an example, it can be visualized, that if there would have been a bottom in the dock area, such as in the naval well decks, the water volume inside the dock would behave in a more complex manner, by changing draft and introducing longitudinal sloshing during each pitching and heaving motion relative to the sea water surface. Although longitudinal and vertical effects are eliminated in this concept, transverse sloshing and possibly resonance inside the dock should be expected, which is why the operations for launching and retrieving the CTV should only be carried out on head seas. This limitation should minimize the transverse effects as well as minimize the roll motions of the vessels, decreasing the risk of a collision of the super structure and foundations around the dock. Further, it can be recommended to make use of small forward speed, which should increase the maneuverability. Its effect on the water surface inside the dock and on the motions of both vessels should further be analyzed.
Figure 41 - Sloshing inside well deck
Having limited the operations in head seas, a safe and practical manner of launching and retrieving the CTV should be designed, in order to guarantee the operability of the concept. Since there is no bottom below the dock, an option is to raise the vessel out of the water, by using lifting equipment. Several important aspects of such operations can be listed as follows:
- Lifting equipment has to be rigid. It can easily be imagined that a swinging vessel above the deck would compromise the safety and stability of the SOV.
- Should be easy to operate. Similarly as the designed wind turbine access system, the lifting equipment should be practical, should not require any kind of fine tuning or maneuvering, since such operations should be accomplished in a short time notice regarding the efficiency and safety of the concept. Further, for most of the cases, it can be imagined that fine maneuvering in high sea states will be very time consuming and mostly impossible.
- Should be robust. Due to the same reasons as the last point, it should be expected that the equipment will be handled in a rough manner. It should be assumed that collisions are unavoidable in such an operation. Necessary precautions should be taken in the design to prevent excessive damages, such as making use of dampeners.
Considering above mentioned aspects following design decisions are taken, which also can be seen in the figure below:
- The stern part of the dock is to be arranged so that entrance angle into the dock is enlarged. The limiting parameters for this purpose are the structural strength and stability of the SOV, which are outside the boundaries of this project.
- Thick side fenders are to be used around the dock, which will absorb the collisions in transverse directions. Initial absorption thickness of these fenders is set as 0.6m. It is important to have a large damping coefficient and have the spring coefficient low. This will prevent the vessel to be pushed away from the

75
fenders after the collisions and the motions of the vessel will be reduced significantly. - 0.6 m of fender thickness is chosen initially, in order to keep sufficient space for easy access during sailing
in and out - A similar arrangement to the wind turbine boat landings can be used at the end of the dock, which can be
pushed against once the CTV is in the dock, which will dampen the vertical motions of the CTV. In this way the motions of the CTV relative to the SOV should be reduced significantly. Although it is not known, how contacting the SOV would affect the motions of the CTV.
- Another advantage of this arrangement is that crew transfer can be done by using the WTAS similar to the procedure as used for crew transferring to the wind turbines, avoiding lifting the CTV during the mid-day operations. It can also be chosen to place a similar foundation on the outside of the dock in order to avoid maneuvering difficulties to sail in the dock.
- Once the crew transfer vessel is inside the dock, thrusting against the boat landing pillars, which reduces the vertical motions at the bow of the vessel at least, the rigid cradles can be lifted slowly. It is important that these cradles have good fendering similarly to the sides of the dock. It is again important to use high damping coefficient rather than high spring coefficient. This can be done by making use of a 2 level fendering as shown in the figure below:
Figure 42 – 2 level fendering
- Further, the connection points of the lifts can be connected to the foundation via a dampener. This will
enlarge the absorption distance and allow higher collision velocities, widening the range of operability. Initially, an absorption thickness of 1.5m has been considered for the lifting cradles. It is important for these cradles to have a contact area as large as possible, in order to reduce the collision pressure on the hull of the CTV. Also, it should be possible to lower the cradle as far as necessary, in order to avoid collisions during the CTV sails in.
- Additionally, inflatable air cushions might be considered in order limit and reduce the CTV motions inside the dock.
For the structure of the CTV, the expected pressures on the hull should be taken as design pressures. Although an extra margin has been accounted for the extra strengthening during the weight estimation, this topic will be handled in the seakeeping analysis of the docking arrangement.

76
A visualization of the concept can be seen here:
Figure 43 – Dock arrangement

77
4 Seakeeping and Validation Having covered all the aspects of the initial design of the concept, a preliminary seakeeping analysis can be done in order to evaluate the decisions taken during this design procedure. The results of the analysis can then be used to improve the performance of the vessel in further stages of the design. The software that has been used for the seakeeping calculations is ANSYS Aqwa, which makes use of the potential flow theory 3D panel method. Although the software has the advantage of accounting for 3D effects and more complicated geometries, the main reason to use the software is its ability to carry out multi-body calculation and time-domain simulations, which have been used for analyzing docking operations and crew transfer operations respectively. Furthermore, as mentioned earlier, potential flow theory neglects the viscous effects. This is why the damping coefficients had to be estimated according to the ITTC recommended procedure for numerical estimation of roll damping [19], which is mainly based on the widely known Yoshiho Ikeda’s method. Determining the damping coefficient, radius of gyration and other physical properties of the vessels is crucial for the accuracy of the results. Since the preliminary design of the vessel is already accomplished, it is possible to calculate these values with some certainty. Calculation of the damping coefficients and other required information such as radius of gyration of the vessel and the simulation conditions will be explained in the chapters below.
4.1 Simulation setup
4.1.1 Calculation of Gyradius In order to make a motions analysis of the vessel, its physical properties have to be determined. Since the accuracy of the calculations for the rotational motions are highly dependent on the estimated radius of gyration, it is important to make this estimation as accurate as possible, by using all of the available information. Therefore, equipment such as main engine, alternators, windlass, capstan, mooring bits, anchors, mast, life rafts, container, gyro stabilizer, rudders etc. are all translated in representative geometries as cylinders or rectangular prisms according to their real geometries. For an example windlass and capstans are represented as cylinders while main engine and rudders are represented as rectangular prisms, according to their respective dimensions. These simpler shapes with appropriate dimensions are used to calculate the moment of inertia of each component around their own respective centroid. These values are then translated to the global coordinate system of the vessel by using the parallel axis theorem. This method was used for determination of the moment of inertia around the global center of gravity for most of the components. For more complicated components such as the hull itself, the super structure and the wind turbine access system, their respective 3D model has been used to determine their volume moment of inertia around their local centroid, as calculated by the modeling softwares. Assigning the required density to the volumes, mass moment of inertia is determined for these components. The moment of inertia around their respective centroid is then translated to the global centroid of the vessel by using the parallel axis theorem. By taking the weighted average of the moment of inertia of each component, the total moment of inertia around the global centroid is determined for the whole vessel. The calculations can be seen in the appendix 8.
Ixx Iyy Izz
Moment of inertia [kgm2] 598649 2948835 4658451
Radii [m] 2.66 5.9 7.42
Radii as percentage 45% B 20% L 25% L Table 12 – Gyradius

78
As it can be seen on the table, the gyradius for pitching and yawing are in the same range as the standard expected values. On the other hand, gyradius of rolling is much higher than the conventional values. A value around 30% of the beam of the vessel is to be taken for more conventional vessels. This high value can be caused by the high super structure and full width along aft part, which causes a concentration of weight far from the x axis. A high radius of gyration around the x axis implies that the roll motions are to be expected to be more resistant to changes. It can be said that the vessel is slower to react in roll motions than it would have been for a vessel with small gyradius. Because there is not much information available about the mother vessel, its radius of gyration has been taken as standard values:
Ixx Iyy Izz
Radii as percentage 30 % 20 % 25 %
Reference dimension [m] B = 24 m Lpp = 95.5 m Lpp = 95.5 m
Radii [m] 7.2 m 19.1 m 23.9 m Table 13 - Gyradius Mother vessel
These values are implemented in the model for the seakeeping simulations, as it will be explained later on.
4.1.2 Calculation of Damping Coefficients As mentioned earlier, the damping coefficients are to be defined manually in the simulations, because the software neglects the viscous terms. Since, most of the roll damping is caused by the viscous effects, it is important to make a good estimate of roll damping. The recommended method by ITTC [19] has been considered for this purpose. The method is mainly based on the method of IKEDA. The total roll damping is divided in several independent parts which are then calculated according to the given empirical formulas, which are based on main dimensions of the vessels. By adding together all the components the total roll damping is determined as:
B44 = BFriction + BWave making + BEddy making + BSkeg + BGyro Stabilizer From the damping components which are considered for the CTV: damping due to friction, eddy making damping and skeg damping have been calculated according to the empirical formulas as given by Ikeda. Wave making damping has been used as it is calculated by the potential flow theory software. Damping component due to the gyro stabilizer has been approximated by making use of the conservation of energy theorem. The calculation is based on the energy dissipated by the up-righting moment during 1 roll cycle, which is exerted by the gyro stabilizer. This energy is converted into an equivalent roll damping component.[10] The total damping has been determined as 380604 Nm/rad/s. This forms 16% of the critical damping of the roll motion, which is considered to be on the higher end of the expected range. This very high damping coefficient is caused by the gyrostabilizer, which forms approx. 12% of the critical damping. This comes in accordance with the statements from the manufacturer as that the stabilizer is to reduce roll motions up to 70-90%.

79
Damping Nm/(rad/s) % Critical Damp.
Friction Component 648 0,03%
Eddy Component 7925 0,3%
Gyro Component 298365 12,8%
Skeg Component 4036 0,2%
Wave Making Component 69629 3%
Total 380604 16,3%
Critical Damping 2333178 Table 14 - Damping Components CTV
Same procedure is followed for the SOV and a total roll damping of 14279418 Nm/rad/s has been estimated as 1.5% of the total critical damping. This is considered to be a pessimistic estimation, because anti roll tanks are not considered in this estimation. This will give an extra safety factor for the seakeeping analysis of docking operations. Further, since docking operations and analysis for these operations are constrained to head seas conditions, roll damping of SOV plays a relatively small role in this analysis.
4.1.3 Transit Stage Seakeeping
4.1.3.1 Setup&Simulation Having calculated all the important parameters for calculation of the motions, it can be proceeded with the setting up of the model. In this chapter, this procedure will be explained for the transit stage analysis. In the following chapters docking and transferring operations will be handled. The vessel has been imported in the seakeeping software as a 3D model. A point mass has been assigned to the model with the appropriate mass, gyradius and roll damping. The model has been meshed with a max element size of 0.3 m. This resulted as 15281 elements with 5765 of them as diffracting elements.
Figure 44 - CTV Mesh

80
A forward speed of 11 kts has been chosen instead of 15 kts in order to carry out the simulations within the validated range of the software. It is stated that the calculations are expected not to be accurate for Fn > 0.3, because of the non-linearities involved at higher speeds. Since the transit speed is expected to be adjusted irregularly according to the experienced accelerations by the captain, an analysis at lower speeds, in this case at 11kts, is believed to represent a good indication for the upper limit of the operability of the crew transfer vessel. The motions of the vessel have been calculated for 50 frequencies between approx. 0.0063 rad/s and 1.69 rad/s corresponding to approx. 1000 s and 3.7 s wave periods for 7 different headings from 000 degrees to 180 degrees, where 180 degrees is taken as head seas and 000 degrees as following seas. As a result of this analysis, RAOs of the crew transfer vessel have been obtained for all 7 headings with a forward speed of 11 kts. Having obtained the RAOs of the CTV, the motions of the vessel can be estimated for any irregular seas spectrum and heading. This has been done in frequency domain for JONSWAP spectrum, since the vessel is to be operated on North Sea conditions. JONSWAP spectrums are defined with zero crossing periods between 3.5 s and 10.5 s increasing with a step of 1 s. Significant wave height of the spectrums are chosen between 0.5 m and 3.5 m increasing with a step of 0.5 m. The combination of these frequencies and wave heights are analyzed for 7 headings from 000 degrees to 180 degrees with a step distance of 30 degrees. This all resulted as a total of 392 different conditions. For every condition, the significant motions, velocities and accelerations are calculated at certain motion tracking points of the vessel. These are stationed at: 10% L aft of the bow on the bottom and on the bulwark height, at the wheel house, at the worst possible seat and best possible seat as shown on the figure below.
Figure 45 – Motion Tracking Points

81
4.1.3.2 Criteria The data obtained by the analysis explained above, has been used to evaluate the performance of the vessel according to the following criteria, which is in accordance to the NORDFORSK [20] standards:
- RMS vert. accelerations at the forward of the vessel is not to exceed 0.275 g - RMS vert. accelerations at the wheel house is not to exceed 0.2 g - RMS lat. accelerations at the wheel house is not to exceed 0.1 g - RMS roll angle is not to exceed 4 degrees
For the criteria that are stated above, the root mean square values from respective motion tracking points have been used to evaluate, whether the vessel fulfills the criteria for a given condition.
- Slamming probability is not to exceed 3% - Deck wetness probability is not to exceed 5%
For these criteria the probability for slamming and deck wetness are calculated according to the RMS vert. velocity and RMS vert. motions at the bow motion tracking point, at the bottom of the vessel for slamming and top of the bulwark for the deck wetness. These motions, velocities and accelerations are given as relative to the water surface. As last, motion sickness index and vert. accelerations at the seats have been calculated, in order to evaluate the comfort on the vessel. Since the motion tracking points for the seats are taken at 2 different locations as: worst possible and best possible locations, the evaluation has been done as an average of these two different locations in order to have a general idea about the general comfort performance of the whole vessel. Further the same is also calculated for the comfort at the wheelhouse.
- MSI is not to exceed 10% for 2 hours exposure time as given by McCauley - RMS vert. accelerations are not to exceed 0.1 g
Results of the transit seakeeping analysis can be seen in the chapter 4.2 and in the appendix 9.

82
4.1.4 Crew Transfer Operation
4.1.4.1 Setup&Simulation As first, similar to the previous analysis, after importing the geometries into the software, defining the mass properties and meshing the model, ROAs of the CTV have been calculated for 3 headings in the position as it is thrusting against the wind turbine foundation.
Figure 46 – CTV and Monopile Mesh
Unlike the previous analysis, a much smaller range of conditions have been accounted for this analysis since this analysis is much more time consuming. Only 2 meter significant wave height has been considered in order to prove that the vessel is operational at this condition, which is one of the design requirements. Three headings have been chosen as 180 degrees, 150 degrees and 120 degrees since these operations are mostly to be carried out at head seas. This is because the wind turbines are designed to have the boat landings on the leeward of the prevailing weather for most of the time. Furthermore, in order to make an accurate estimate of the performance of the vessel, the friction forces between the fender and the wind turbine have to be accounted for, which is expected to have a big impact on the motions of the vessel. As the only way for accounting for these forces, time domain simulations have been carried out for this analysis. Time domain simulations are carried out for the 3 heading on irregular seas with a 2 m significant wave height JONSWAP spectrum, for 6 different zero crossing frequencies between 4.5 and 10.5. In order to account for the friction forces a fender has been modeled between the CTV and the wind turbine, with a friction coefficient of 0.5 as the highest friction coefficient that can be defined in the software. This is half of the friction coefficient that is given in the rules, accounting for a safety factor of 2. Since the software is not capable of applying thruster and rudder forces, mooring lines had to be introduced in order to keep the vessel stationary, which in reality would have been achieved by making use of the rudder, bow thruster and friction forces at the contact point. The arrangement of the mooring lines can be seen in the figure below.

83
Figure 47 – Time domain simulation mooring arrangement
Lengths of the mooring lines have been chosen relatively very long as 500 m, in order to minimize their effect in the vertical direction of the vessel. Lateral mooring lines are set with a pre tension of 0.1 m * 150 000 N/m = 15 kN in the forward and 1 m * 150 000 N/m = 150 kN in the aft. The stiffness and tension of these mooring lines have been chosen in a manner, so that the system does not encounter any natural frequency in any simulation case. An iterative method has been followed until a stable system is achieved. Because of the assumptions and modelling this simulation is not found to be sufficient to make any conclusions about the capacity of maneuvering and compensation of the mentioned lateral forces, the results are to be used to evaluate the design of the wind turbine access system, regarding impact forces, required thrust force and vertical motions. The longitudinal mooring line has been set to a pre tension of 11m* 10 000N/m = 110 kN, in order to simulate the bollard push of the vessel. The time duration of the simulations are set to 1.5 hours according to the experience of the company in seakeeping studies, in order to have a statistically trustworthy data. It is suggested by Lloyd [10], that at least 100 peak measurements are required for a time domain measurement of irregular seas to be statistically trustworthy. Accounting for the longest peak period of approx. 13.5 seconds a time duration of Tmeasurement = 100 * 13.5 / 60 < 30 mins can be expected to be sufficient to experience 100 peak motions, proving that the measurement of 1.5 hours is well sufficient for a trustworthy analysis. A sensitivity experiment has also proven that there are no differences in statistical results between 1.5 hours and 3 hours measurements. Time step has been taken as 0.1 seconds as it is recommended by the software manual.

84
The results of the time domain measurements are given as motions at certain motion tracking points and also as forces at the mooring lines and on the fender. These are transformed into frequency domain by using the power spectral density of the time domain results. Root mean square and significant values of the motions, velocities, accelerations and forces are determined according to these spectral densities. These are used to evaluate the performance of the vessel, as the results will be displayed in the chapter 4.2. Motion tracking points can be seen as below.
Figure 48 – Crew transfer motion tracking points
4.1.4.2 Criteria For the evaluation of the operability of the crew transfer operations, novel criteria had to be set since there are no standard criteria defined for these operations. As main criteria, it has been checked whether the normal force on the fender exceeds 200 kN, which is the limit for the boat landing pillars of the wind turbine and that the tension in the forward mooring line remains below the estimated maximum bollard push. As second, the vertical motions at the contact point between the vessel and the wind turbine have been measured. The vertical motion of this point is not to exceed 2 meter amplitude, in order to avoid slamming on the bottom of the gangway of the wind turbine access system. Fulfilling these requirements would prove, that the vessel is capable of keeping contact with the wind turbine for the given bollard push capability without damaging the pillars. Furthermore, the gangway can be used safely, since the vert. motions at the bow of the vessel do not exceed the maximum range of 2 m, avoiding any contact with the gangway. Furthermore, the RMS vert. accelerations at the location of the WTAS foundation is not to exceed 0.15 g and the RMS roll is not to exceed 3 degrees, which are the limits for demanding manual work. The results can be seen in the respective chapter.

85
4.1.5 Docking
4.1.5.1 Setup&Simulation Docking operations are analyzed in frequency domain, similar to the analysis done for the transit stages. The CTV is modelled floating inside the dock of the SOV. Since this operation is expected to be performed in headseas, the motions of both vessels were determined for 180, 150 and 120 degrees, to allow for natural wave spreading and vessel controllability. The analysis is done for zero forward speed in order to ease the analysis procedure. A later analysis would be required for forward speed cases, as it will be mentioned in the suggestions.
Figure 49 – Docking operations mesh
After having calculated the RAOs of the vessels, irregular sea conditions are defined for all three headings as 2.5m significant wave height with a frequency range between 4.5 and 10.5 seconds zero crossing periods. Within the frequency domain significant amplitudes of the motions at certain motion tracking points have been determined.
Figure 50 – Motion tracking points docking

86
4.1.5.2 Criteria Similar to the analysis done for the crew transfer operations, novel criteria had to be set for evaluating the operability of docking in SOV. As it is stated earlier, it is unavoidable that two vessels collide with each other during this procedure. Furthermore, it is necessary that the CTV is lifted by the cradles inside the dock, which involves uncontrolled collisions between the cradles and the CTV at the first contact time point. Considering these unavoidable collisions, it is important that the dock and the CTV are of adequate strength to withstand the expected impact forces during these collisions. This is why; the results of this analysis are used to calculate these impact forces between the two vessels, which will be used in the next design stage to make a detailed structural design. At this stage of design, a comparison has been made between the calculated impact pressures and the given DNV design pressures. This allows to see in which range the expected impact forces are compared to the DNV design pressures and whether a structural design to withstand these expected pressures is realistic to expect or not. Design pressures are calculated as 45 kPa at the aft of the vessel and 55 kPa at the mid and forward of the vessel. Calculation can be seen in Appendix 1.
Figure 51 – DNV Design Pressures for slamming on the bottom of the vessel
Since it is stated in the design process that the dock is to be equipped with fenders, the vessel is to contact a fender and not the skin plating of the other vessel. This allows the impact to be absorbed by the fenders. Using this assumption, the estimated impact forces are calculated according to the conservation of energy. Significant velocities of two vessels relative to each other are determined by the seakeeping analysis. These values are then transformed into theoretical maximum values that can be encountered in the defined spectrum by multiplying the significant values by two. These values represent the maximum velocities at which two vessels can move against each other in the defined conditions. This velocity is taken as the impact velocity and transformed into the kinetic energy by:
Ek = 0.5* V^2 * mass
Since the impact is exerted on the fenders, the total amount of energy absorbed by the fenders can also be calculated as Eabsorbed = F * dabosrption, where d represents the absorption distance of the fenders as given in the figure. In a simplified case, all of the kinetic energy is to be transformed into mechanical energy during the collisions. By using the absorption distance of the fenders in sideways, as 0.6m, and combination of fenders and dampeners in vertical direction, as 1.5m, the theoretically possible maximum impact forces can be estimated for each spectrum.

87
Figure 52 – Docking Problem Analysis
These resulting impact forces can be divided by the expected contact area and translated into pressures, which can be used for the design purposes. As mentioned earlier, these values are to be compared to DNV pressures, in order to evaluate whether these pressures are too high or within normal limits. It should be mentioned that the contact areas for this calculation are taken as worst case scenarios, where the vessel is in heeled position during the first contact between the cradle and the vessel. Also it is assumed that only 1 cradle is contacted. This situation leads to the smallest possible contact areas allowing accounting for the highest possible impact pressures. Further it is to be expected that the longitudinal structure and bottom structures are of adequate strength to withstand bending stresses when the vessel is once lifted out of the water. Since the vessel is relatively short and light it is to be expected that required strength is possible to be achieved easily by a strategic structural design. Because the structural design is not handled in detail at this stage of the design, no further work is done in this aspect. It should be reminded, that bottom structure weight factors have been taken with a margin in order to account for the extra supporting structure. The composite material also allows using higher strength/light weight material in strategic positions.

88
4.2 Results
4.2.1 Transit As explained in the last chapter, the transit stage operations are evaluated for 392 different sea condition and heading combinations by using Nordforsk based operability criteria, including a MSI analysis. Results for conditions with a wave height between 0.5 and 2 are given in the appendix 9. For space considerations the rest of the results are left out of this report. In order to obtain a general idea about the total operability of the vessel, an average has been taken over all of the headings, since there is no explicit course definition of the vessel. This assumption implies that the probability of occurrence of each heading is the same. This is considered to be different in reality. Better results can be expected in practice since the course of the vessel will be corrected in order to avoid the worst headings. These averaged results can be seen below. First graph shows the operability of the vessel for the tested conditions averaged over different headings. The conditions are accounted as not operable, if any of the evaluated criteria is exceeded. Nordforsk criteria and MSI criteria are differentiated in the graph due to the fact that MSI represents the comfort level on the vessel and not the operability. It should also be reminded that the MSI is taken as an average of two locations on the vessel, where one of them is considered as the worst and the other one as the best location onboard regarding the level of accelerations and comfort. On the graph below, non-operable according to Nordforsk is given in red and additional non-operable zone according to MSI is given in purple.
Table 15 – General Operability for Nordforsk in red, additional limitation regarding MSI given in purple
It can be seen in the results as presented above, the vessel is operable almost in all conditions up to 2 meter significant wave height with a forward speed of 11 kts except for shorter wave periods. In general it is found that the short wave periods around zero crossing period of 3.5-4.5s are more problematic than longer wave periods. This might be related to the short natural periods of the ship motions as it can be seen below. Further analyzing this problem in detail, it can be revealed that for a JONSWAP spectrum zero crossing periods of 3.5 s and 4.5 s correspond to peak periods of 4.5 s and 5.7 s respectively. Peak period is calculated as 1.29 * TZ for a spectrum with gamma factor of 3.3. These result as an encounter frequency around 3 seconds, accounting for 120-180 deg headings and 11 kts forward speed. On the other hand, the vessel has no problems for zero crossing wave periods around 5-8 s, which represent the most common conditions for the North Sea.
Motion [s]
T heave 3,16
T roll 4,36
T pitch 3,36 Table 16 - Natural Frequencies of ship motions
Hs (m) \ Tz (s) 3,5 4,5 5,5 6,5 7,5 8,5 9,5 10,5
0,5
1
1,5 Operable
2
2,5 Not Operable
3
3,5

89
Heading Wave Period
180 5,4s
150 5,2s
120 4,5s
90 3,2s Table 17 - Wave Period per heading for an encounter period of 3.2 s at a forward speed of 11 kts
Furthermore, it can be seen that the averaged MSI does not cost any additional problems up to 2.5m significant wave height. This is considered positive, since an operability up to 2 meter significant wave height is desired by the concept. It is mentioned earlier, when sea conditions exceed 2 meter significant wave height, the vessel should return to the SOV. In this range less comfortable rides are considered acceptable. Considering the probability of occurrence of each sea condition an operability of 60% can be approximated.
Table 18 - Operability as probability per year (excluding additional MSI)
As it can be seen on the table, the vessel is not operable for a share of 5% per year within a range up to 2 meter significant wave height. It is believed that the operability might be improved by changing the encounter frequency and avoiding the natural frequencies of the vessel’s motions. This can be achieved by adjusting speed and heading of the vessel as well as utilizing other aids such as adjusting weight distribution by making use of ballast water as it will be explained in the suggestions later in this report.
North Sea Area Probability of occurance for each sea condition
Hs (m) \ Tz (s) <4 4 - 5 5 - 6 6 - 7 7 - 8 8 < 9 - 10
4 < 0,01% 0,29% 1,85% 3,55% 3,04% 2,19% 100,0%
3 - 4 0,02% 0,55% 2,67% 3,91% 2,59% 1,34% 89,1%
2 - 3 0,07% 1,67% 6,26% 7,30% 3,94% 1,63% 78,0%
1 - 2 0,32% 4,75% 11,97% 9,88% 3,94% 1,19% 57,1%
0 - 1 1,83% 8,51% 9,39% 4,15% 1,01% 0,19% 25,1%
59,0%Sum of operability:

90
4.2.2 Crew Transfer As explained earlier, the crew transfer operations are only evaluated for 2 meter significant wave height and 3 headings according to the given design requirements and assumptions. The results can be seen as below and in the appendix 10.
Table 19 – Crew Transferring Operability Results
Evaluating the results, it can be realized that the variations of the required thrust force has its theoretical maximum in a range between 0.7 and 1.3 kN. Accounting for a 110 kN pre-tension on the thrust force, theoretically highest bollard push that is required to maintain the vessel stationary in horizontal direction is approx. 111.3 kN, which is much lower than the maximum available bollard push at 340 kN. It is to be noticed that shorter wave periods lead to higher forces than longer wave periods. Although the vessel is relatively stationary, there are small variations in the horizontal position of the vessel on an order of 0.1 m. These variations are caused by the dynamics of the modeled simulation. Since the thrust force is modeled as a mooring line, it only starts compensating for horizontal displacement after the displacement is occurred according to the equation ‘Force = stiffness * displacement’. Similarly the fender acts in the same manner: increasing force with increasing displacement. Statistical results are taken out of the time domain simulation of this spring system, which results as a theoretical maximum displacement in horizontal direction of 0.2m. Since the horizontal displacement is less than the fender thickness, the vessel is considered to be in contact with the wind turbine for the whole simulation, where the continuity of the time domain results of the reaction forces on the bow fender proves this claim.
limit 0,3 200000 340000 2 0,15*g = 1,472 3
Theroretical maxTheoretical
max
Theoretical
max
Theoretical
maxRMS RMS
Hs Tz Heading
Horizontal
Displacement
(m)
Force on
Fender
(N)
Thrust
Required (N)
Vertical
Displacement
(m)
Vert
Accelerations
(m/s2)
Roll
(deg)
2 4,5 180 0,19 207652 111010 2,29 0,67 0
2 6,5 180 0,20 201826 111330 2,37 0,49 0
2 7,5 180 0,16 190100 110859 2,23 0,40 0
2 8,5 180 0,13 178235 110801 2,08 0,32 0
2 9,5 180 0,12 169733 110780 1,99 0,27 0
2 10,5 180 0,11 162612 110760 1,93 0,23 0
2 4,5 150 0,18 204995 110969 2,15 0,65 3
2 6,5 150 0,16 193042 110943 2,21 0,47 2
2 7,5 150 0,14 182333 110824 2,09 0,38 2
2 8,5 150 0,12 171057 110796 1,98 0,31 1
2 9,5 150 0,11 163666 110775 1,91 0,26 1
2 10,5 150 0,09 157329 110758 1,87 0,22 1
2 4,5 120 0,14 188486 111123 1,72 0,64 6
2 6,5 120 0,11 166851 110871 1,77 0,42 4
2 7,5 120 0,09 158497 110824 1,77 0,35 3
2 8,5 120 0,08 150792 110799 1,74 0,28 2
2 9,5 120 0,07 145755 110774 1,73 0,23 2
2 10,5 120 0,06 141061 110745 1,72 0,20 2

91
Considering these forces, there is a difference to be noticed between the modeled thrust force and the thrust force in reality, where the modeled one has a spring behavior and the real one is a constant force from which the magnitude can be adjusted by the captain. Due to this difference, the dynamic behavior of the system cannot be related directly to the reality. This implies also that the forces caused by this dynamic behavior should be approached with caution during the evaluation of the results. One example is the force that is exerted on the fenders, which is caused by the variations in horizontal position of the vessel, as explained below. Due to these small variations in the horizontal position of the vessel and high stiffness of the fender, which was mentioned in chapter 3.5, the forces on the bow fender, hence on the wind turbine pillars, result relatively high. Accounting for a stiffness of 470880 N/m and 0.2m maximum displacement, the variations of these fender forces should be expected on the order of 95 kN. Together with the initial load on the pillars at 110 kN, due to the pre-tension that was set on the thrust force, theoretically highest total force on the pillars are expected in the range of 205 kN. As it can be seen on table 19, this is exactly the range of the results of the simulations. This implies that for the given situation, theoretically possible highest forces on the pillars are slightly off the allowed range, which is limited with 200 kN, especially for shorter wave periods on head seas. Although it was mentioned that these forces cannot be related to reality, small variations can be expected in the horizontal position of the vessel due to other reasons, such as reaction time of the captain, very irregular hydrodynamic interactions or mechanical issues with the propulsion system etc. These considerations suggest that the issue stated above as high forces on the wind turbine pillars should also be considered further in this analysis. Furthermore, evaluating the vertical motions at the bow of the vessel, it can be seen from the table 19 that also these motions are slightly off the allowed range for head seas conditions and shorter wave periods. As last criteria regarding this operation, roll and vertical accelerations at the bow of the vessel are calculated. The limit for these criteria were set as 3 deg and 0.15g, which are standard for demanding manual work onboard. As it can be seen on the results, these criteria are met with confidence for head seas. It can be noticed that on 120 deg heading, roll motion of the vessel exceeds the criteria for shorter wave periods. The results suggest that for the given design and conditions, the WTAS is not operable for certain conditions, which are marked in red on table 19. It is believed though, that the performance of the system can be improved easily by making small adjustments in the design. Therefore some suggestions are given below:
- It is explained above that the forces on the pillars are related to the horizontal displacement of the vessel and stiffness of the bow fender. This obviously requires that the variations of horizontal position of the vessel should be minimized. This should be relatively easy to achieve by increasing the initial thrust. Another option to improve the situation is to adjust the fender design and make use of a lower stiffness on the fenders. This option, on the other hand would require a thicker fender to allow for the same speed limit for approaching the wind turbine. Although a better analysis is required to understand the situation in more detail and estimate the forces on the pillars.
- The geometry of the gangway should be adjusted in order to allow for a vertical clearance of 2.5m above
the bow of the vessel. This clearance is higher than the theoretically highest vertical motions that might be experienced at the bow of the vessel, which as a result highly increases the operability of the vessel.
- Further attention should be paid for roll motions during operations with short wave periods and beam seas.

92
4.2.3 Docking It was explained earlier, that the docking problem is considered as a design driving operation. In this chapter, the impact forces are derived from the results of the seakeeping simulation (rel. velocity of the vessels). These results can be seen below:
Table 20 – Docking Stage Operability Results
As it can be noticed, the expected impact forces are within the same range and mostly much lower than the DNV suggested design pressures for bottom and side wall structures. This implies that it is highly possible to make a robust structural design, which enables docking in the SOV by experiencing regular collisions between the fenders and the CTV up to 2.5 meter significant wave height in head seas. Furthermore, short wave periods on beam seas result on high reaction forces and roll motions. Although, it should also be noticed that these forces are highly related on the momentarily contact areas. It should be reminded that the contact areas should be as large as possible in all cases. This can be achieved by making use of very long cradles, similar to the drawings as shown in chapter 3.10. Another aspect to consider is, whether both fenders are contacted or only one fender is contacted. If both fenders are contacted at the same time, the load would decrease. In these calculations it is considered that only one of the fenders is contacted in each case. Also, the lateral clearance of the top of the superstructure from the foundation of the lifting device is considered. As it can be seen, the geometry of the lifting device should be adjusted so that this clearance is higher than 4 meters. It should also be considered that this is less of importance since these operations should be limited to head seas. Furthermore, it is not possible to make any conclusion for maneuverability of the vessel and similar more dynamic problems. It has been tried to consider these dynamic problems in the design of the dock geometry, which has a wide entrance and thick fenders, in order make the procedure as easy as possible and minimize the consequences of mistakes, which are considered as unpreventable.
absorb dist. (m) 1,5 absorb dist. (m) 1,5 absorb dist. (m) 0,6
Mass CTV 85 t Length cradle (m) 5,8 Length cradle (m) 5,6 Length fender (m) 2
Contact width CTV (m) 1,5 Contact width CTV (m) 1,2 Contact width CTV (m) 2,3
contact area (m2) 8,7 contact area (m2) 6,72 contact area (m2) 4,6
DNV Slam. Design
Pressure Plates (kPa)45
DNV Slam. Design
Pressure Plates (kPa)55
DNV Slam. Design
Pressure Plates (kPa)20
Hs Tz Heading
Theoretical max:
2*sig. vert vel aft
(m/s)
Resulting
Pressure on
Plating (kPa)
Theoretical max:
2*sig. vert vel bow
(m/s)
Resulting
Pressure on
Plating (kPa)
Theoretical max:
2*sig. trans vel aft
(m/s)
Resulting
Pressure on
Plating (kPa)
Theoretical max:
2*sig. trans mot
(m)
1 2,5 4,5 180 1,294 5 2,122 19 0,01 0 0,0
2 2,5 6,5 180 0,96 3 1,336 8 0,002 0 0,0
3 2,5 7,5 180 0,806 2 1,084 5 0,002 0 0,0
4 2,5 8,5 180 0,654 1 0,862 3 0,002 0 0,0
5 2,5 9,5 180 0,548 1 0,72 2 0,002 0 0,0
6 2,5 10,5 180 0,46 1 0,6 2 0 0 0,0
7 2,5 4,5 150 1,766 10 2,324 23 0,318 2 0,5
8 2,5 6,5 150 1,192 5 1,508 10 0,882 12 1,8
9 2,5 7,5 150 0,962 3 1,192 6 0,712 8 1,5
10 2,5 8,5 150 0,768 2 0,956 4 0,512 4 1,0
11 2,5 9,5 150 0,64 1 0,796 3 0,444 3 0,9
12 2,5 10,5 150 0,526 1 0,658 2 0,372 2 0,8
13 2,5 4,5 120 4,032 53 5,048 107 0,726 8 1,3
14 2,5 6,5 120 2,286 17 2,922 36 1,72 46 3,9
15 2,5 7,5 120 1,868 11 2,468 26 1,388 30 3,2
16 2,5 8,5 120 1,478 7 1,97 16 0,994 15 2,3
17 2,5 9,5 120 0,924 3 1,246 7 0,746 9 1,8
18 2,5 10,5 120 0,756 2 1,01 4 0,626 6 1,5
Max Pressure from fenders should
be compared to DNV design
pressure:
Pressure on bottom plating bowPressure on bottom plating aft Pressure on side plating aftLateral
displacement top
of the super
structure due to
roll

93
Figure 53 - Visualization docking
The results suggest, that the upper limit for launching and retrieving the CTV can be raised to a higher sea state regarding the impact pressures between the two vessels, although further investigation is needed regarding the dynamic effects and interactions between the vessels at small forward speed.
5 Conclusions It can be summarized that a concept for a crew transfer vessel has been designed, prioritizing comfort and practicality of the general arrangement together with the operability and safety during required operations. In order to achieve the desired operability, a novel docking concept has been proposed as well as a modified wind turbine access system, in order to make the whole concept as robust as possible, allowing for a rough manner of usage and enlarging the margins for operability. It is believed that accounting for the rough usage and providing large margins are crucial to create a practical design for such chaotic and irregular working conditions. Regarding seakeeping performance of the vessel in transit stages: the vessel is operable up to 2 meter significant wave heights according to Nordforsk criteria and acceptable MSI limits, with an exception for short wave periods. For longer wave periods, the vessel can remain operable up to 3.5 meter sig. wave heights for longer wave periods. A total of 60% operability is foreseen primarily for the CTV. It is believed that this can be increased by implementing various measures as suggested. Furthermore, changing course and speed should be considered as the most effective manner to improve the performance in reality. As a result, the vessel can provide a comfortable ride for the maintenance crew and avoid them from getting sea sick, increasing the number of healthy maintenance personnel on the site. As the results of the seakeeping analysis for crew transferring operations suggest, the WTAS can be made highly operable following small adjustments in the geometry of the gangway design. It is also to be concluded that the vessel has enough bollard push capacity to cope with the horizontal forces that are exerted by the incoming waves with a significant wave height of 2m in North Sea. Although attention should be paid for operations in beam seas, the system in general is expected to improve the operability and safety of the crew transfer operations at wind turbines. The results of the docking stage analysis suggest that an adequate structural design is possible to be achieved in order to allow launching and retrieving the CTV on sea conditions with a significant wave height of 2.5 meter. It is believed that by following the provided suggestions, the operability for launching and retrieving operations can be enlarged even further.

94
By considering the GA, hull form and design requirements as a whole during the entire design process, high practicality and performance are achieved for the end-product. Intact and damage stability calculations, together with electric loading and resistance/powering calculations demonstrate the functionality of the vessel. It is believed and supported by the calculations and analysis that are presented in this report, that the created concept design is to fulfill the design requirements and can be improved further by considering the presented suggestions. As a result the vessel can be used as a crucial part of a new transportation concept for offshore wind farm maintenance in the future, which will help improving the efficiency of wind farms by increasing accessibility for maintenance operations. In the bigger picture this can lead a higher level of interest for off-shore wind industry by energy companies, enlarging the share of renewable energy among other energy sources.
6 Known Problems, Further Suggestion for Improvement All the results of the preliminary seakeeping analysis should be considered in the following stages of the design process. Especially structural design of the bottom structure and sides of the CT vessel and the structure of the docking mechanism are to be made according to the expected pressures as calculated during the docking stage seakeeping analysis. A further analysis is required to reveal the effects of forward speed during docking operations. An organizational aspect to be considered and discussed with the class association is the limitation of Passenger Crafts to a service area restriction of highest R1. This implies that the vessel is to operate within a maximum distance to the closest shelter of 100 nm in winter and 300 nm in summer time. The uncertainty of the situation is whether the mother vessel should be considered as a shelter or not. Although upper limit of retrieving the CTV in the dock is unknown at this stage, an expected higher limit for these operations imply that in certain extreme cases, the CTV cannot be docked on the SOV. This would also imply that the CTV cannot be taken on to safety out of the water in these extreme cases. On the other hand, it is to be considered that the SOV can be used as a shelter for the CTV in order to sail towards a more suitable area or to proceed with rescue operations. Furthermore, the requirement of maximum 4 hours rescue time for ‘category A’ passenger craft is to be fulfilled by all times due to the presence of the SOV in close vicinity to the CTV. The fact that there are similar concepts being developed by several companies implies that the problem can be solved without compromising safety of the crew. Furthermore this is required to be clarified with the Class Society and is outside the bounds of the current project. As another point, introduction of water ballast tanks can be considered in order to adjust the behavior of the vessel at its natural frequency. As it has been seen on the results of the seakeeping analysis, the vessel operates around its natural frequency at 4.5 s zero crossing periods. By taking in water into well positioned water ballast tanks, the moment of inertia of the vessel can be adjusted and the behavior in these conditions can be influenced. A further analysis can be made to gain more information about the advantages and disadvantages of such a concept and its effects on stability and resistance of the vessel. Further the propulsion concept should be considered in more detail by contacting the manufacturer. Aspects such as definitive design of the propeller tunnels and diameter of the propellers can lead to changes in the design. It should also be considered to increase the distance of the propeller from the water surface, which would help decreasing the probability of propeller emergence. As last point it can be mentioned that instead of the suggested turbine access system other proven access system may be utilized on the design. When using similar access systems, it is important to pay attention to the allowed motions at the bow of the vessel. As it has been explained before, a minimum clearance around 2.5 m in vertical direction is required for sea states with 2 m significant wave height.
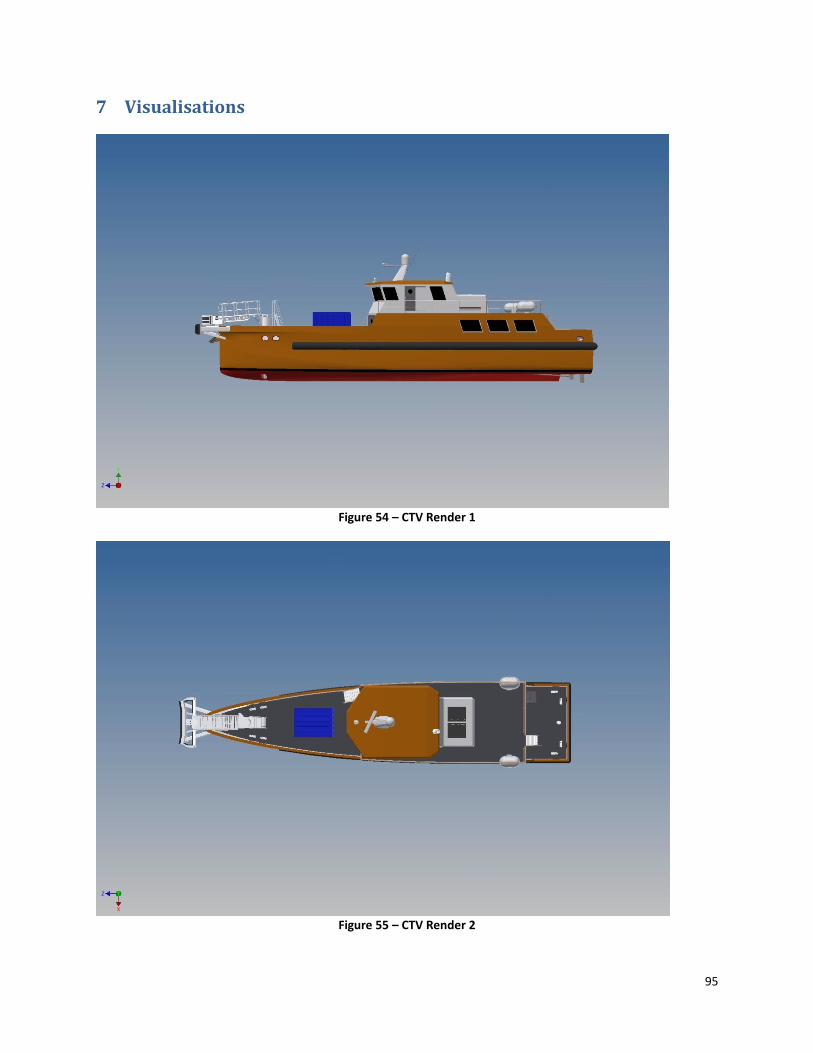
95
7 Visualisations
Figure 54 – CTV Render 1
Figure 55 – CTV Render 2

96
Figure 56 – CTV Render 3
Figure 57 – CTV Render 4

97
Figure 58 – CTV Render 5
Figure 59 - CTV Render 6

98
References [1] Global Wind Energy Council (GWEC), Global Wind Report: Annual Market Update 2013 [2] European Wind Energy Association (EWEA), Wind in power, 2013 European Statistic, February 2014 [3] Metha Loumann, The Art of Being an Operator, ON/OFFMagazines, Q2 2014, pp.12-13 [4] Database of 4C Offshore Limited, viewed on 03/07/2014. Available from: www.4coffshore.com [5] Uptime Undertun Prototype 8m Gangway for wind Turbine Access, available from https://www.youtube.com/watch?v=qo9sQ-laQ1s [6] MaXccess Offshore Access System, available from https://www.youtube.com/watch?v=Tu7qBSgKyBU [7] George Marsh, Wind Farm Service Vessels (WFSV): Hull form focus [online], www.renewableenergyfocus.com, January/February 2013 [8] Santos T.A., Carichas E., Fonseca N., Pessoa J., et al. Development of an Integrated System for Personnel and Equipment Transfer to Offshore Wind Turbines (ISPET), Offshore Wind Accelerator (OWA), Offshore Wind access Challenge (2010) [9] Prof. Dr. Ir. D. Stapersma, Ir. L. Keuning, Ir. J. W. Frouws, Ir. H. Grimmelius and others, TU Delft Reader: Design of Advanced Marine Vehicles, Delft, October 2000, revised August 2012
[10] A. R. J. M. Lloyd, Seakeeping: Ship Behaviour in Rough Weather, A.R.J.M Lloyd, Hampshire, UK, 1998 [11] J.M.J. Journée, Quick Strip Theory Calculations in Ship Design, Delft, the Netherlands, 1992 [12] Verein Hanseatischer Transportversicherer e.V. (Association of Hanseatic Marine Underwriters), VHT Training Camp 1 – Salvage assistance after accident, Bremen-Vegasack, Germany, 21.09.2007. Available from: http://www.vht-online.de/infoportal.html
[13] J.A. Keuning, “Grinding the Bow” or “How to improve the operability of fast monohulls”, IOS Press, International Shipbuilding Progress 53, 281-310, 2006 [14] J.A. Keuning, Seakeeping of High Speed Craft, WEGEMT Workshop on Small Craft Design, Athens, Greece, 1997 [15] Rameswar Bhattacharyya, Dynamics of Marine Vehicles, A volume in Ocean Engineering: A Wiley Series, November 1972 [16] Samson C. Stevens and Micheal G. Parsons, Effect of Motion at Sea on Crew Performance: A Survey, Marine Technology, Vol. 39, No.1, January 2002 [17] John A. Mercier and Daniel Savitsky, Resistance of Transom-Stern Craft In the Pre-Planing Regime, Stevens Institute of Technology, New Jersey ,USA, June 1973 [18] Siu C. Fung and Larry Leibman, Revised Speed-Dependent Powering Predictions for High-Speed Transom Stern Hull Forms, Fast ‘95 [19] 26th ITTC Specialist Committee on Stability in Waves, ITTC-Recommended Procedures: Numerical Estimation of Roll Damping, 2011 [20] Nordforsk, Assessment of Ship Performance in a Seaway, 1987 [21] DanTysk Offshore Wind, available at: http://www.dantysk.com/wind-farm.html [22] Robert J. Scott, Fiberglass Boat Design and Construction, The Society of Naval Architects and Marine Engineers, New Jersey, USA, 1996 [23] Dave Gerr, The Elemenths of Boat Strength, Adlard Coles Nautical, London, UK, 2000 [24] Servogear AS, personal communication.

99
Appendices are confidential. Therefore, they are not presented publicly.